TECHNICAL REPORT
ON THE
KAMISTIATUSSET PROPERTY,
NEWFOUNDLAND AND LABRADOR
FOR
0860132 B.C. LTD. AND ALDERON RESOURCE CORP.
prepared by
Richard W. Risto, M.Sc., P.Geo.,
Senior Associate Geologist
David Power-Fardy, M.Sc., P.Geo.,
Senior Geologist
and
G. Ross MacFarlane, P.Eng.,
Senior Associate Metallurgical Engineer
February 12, 2010 Toronto, Canada | 
|

TABLE OF CONTENTS
| | Page |
| | |
1. SUMMARY | 1 |
| |
2. INTRODUCTION AND TERMS OF REFERENCE | 10 |
2.1 | GENERAL | 10 |
2.2 | TERMS OF REFERENCE | 10 |
2.3 | SOURCES OF INFORMATION | 12 |
2.4 | UNITS AND CURRENCY | 12 |
| | |
3. RELIANCE ON OTHER EXPERTS | 15 |
| |
4. PROPERTY DESCRIPTION AND LOCATION | 16 |
4.1 | PROPERTY LOCATION | 16 |
4.2 | PROPERTY DESCRIPTION AND OWNERSHIP | 16 |
4.3 | PROPERTY AGREEMENTS | 20 |
4.4 | PERMITTING | 21 |
4.5 | ENVIRONMENTAL ISSUES | 21 |
4.6 | FIRST NATION ISSUES | 22 |
| | |
5. ACCESS, CLIMATE, LOCAL RESOURCES, INFRASTRUCTURE AND PHYSIOGRAPHY | 23 |
5.1 | ACCESS | 23 |
5.2 | CLIMATE | 23 |
5.3 | PHYSIOGRAPHY | 23 |
5.4 | LOCAL RESOURCES AND INFRASTRUCTURE | 23 |
| | |
6. HISTORY | 24 |
6.1 | GENERAL | 24 |
| | |
7. GEOLOGICAL SETTING | 29 |
7.1 | REGIONAL GEOLOGY | 29 |
7.2 | PROPERTY GEOLOGY | 31 |
| | |
8. DEPOSIT TYPES | 35 |
| |
9. MINERALIZATION | 37 |
| |
10. EXPLORATION | 53 |
ii
TABLE OF CONTENTS
(continued)
| | Page |
| | |
11. DRILLING | 55 |
11.1 | HISTORIC DRILLING | 55 |
11.2 | ALTIUS 2008 DRILLING PROGRAM | 55 |
11.3 | WGM COMMENT ON 2008 DRILLING | 57 |
| | |
12. SAMPLING METHOD AND APPROACH | 58 |
12.1 | GENERAL | 58 |
12.2 | 2006 AND 2007 SURFACE SAMPLING PROGRAMS | 58 |
12.3 | 2008 DRILL CORE HANDLING AND LOGGING | 58 |
12.4 | 2008 SAMPLING APPROACH | 59 |
12.5 | 2008 SAMPLING METHOD | 59 |
12.6 | CORE STORAGE | 60 |
12.7 | WGM COMMENT ON LOGGING AND SAMPLING | 60 |
| | |
13. SAMPLE PREPARATION, ASSAYING AND SECURITY | 61 |
13.1 | 2008 SAMPLE PREPARATION | 61 |
13.2 | 2008 SAMPLE ASSAYING | 61 |
13.3 | QUALITY ASSURANCE AND QUALITY CONTROL | 61 |
13.4 | WGM COMMENT ON ALTIUS’ SAMPLING AND ASSAYING | 68 |
| | |
14. DATA CORROBORATION | 69 |
| |
15. ADJACENT PROPERTIES | 74 |
| |
16. MINERAL PROCESSING AND METALLURGICAL TESTING | 77 |
| |
17. MINERAL RESOURCE AND MINERAL RESERVE ESTIMATES | 83 |
| |
18. OTHER RELEVANT DATA AND INFORMATION | 84 |
| |
19. INTERPRETATION AND CONCLUSIONS | 85 |
| |
20. RECOMMENDATIONS | 87 |
| | |
21. SIGNATURE PAGE | 89 |
| |
CERTIFICATES | 90 |
iii
TABLE OF CONTENTS
(continued)
| Page |
| |
REFERENCES | 96 |
| |
APPENDIX 1: WGM INDEPENDENT SAMPLING RESULTS | 101 |
LIST OF TABLES
1. | Summary of terms and abbreviations for units | 14 |
2. | Kamistiatusset property in Labrador | 16 |
3. | Kamistiatusset property in Québec | 16 |
4. | Minimum cost of work to be carried out on a Québec claim north of 52o latitude | 19 |
5. | Regional stratigraphic column, Western Labrador Trough | 31 |
6. | Rock/unit coding for Kami Property drill core logging | 33 |
7. | Deposit model for Lake Superior Type iron formation | 36 |
8. | Stratigraphy of mineralization at the Scully Mine | 37 |
9. | Stratigraphic column Wabush Lake area | 37 |
10. | Average composition of rock units from Altius 2008 drill core sample assays | 47 |
11. | Drilling summary — Altius 2008 program | 56 |
12. | Sampling and analysis summary, Altius 2008 drill program | 61 |
13. | Certified standard reference materials used for the in-field QA/QC program, Altius 2008 | 62 |
14. | Summary of WGM independent second half core sampling | 70 |
15. | Comparison of analytical results WGM independent quarter core sampling to original Altius results | 71 |
16. | Make-up of metallurgical sample | 77 |
17. | Ore characterization summary | 78 |
18. | Ore characterization details | 78 |
19. | Beneficiation characterization summary | 79 |
20. | Overall metallurgical summary | 81 |
21. | Wabush mines concentrate specifications | 82 |
22. | Proposed exploration program, Phase I Kamistiatusset Property | 88 |
| | |
LIST OF FIGURES |
| | |
1. | Property location | 11 |
2. | Land Status map | 18 |
3. | Regional geology | 30 |
4. | Property geology | 32 |
5. | Ground magnetic survey with 2008 drillhole locations | 39 |
iv
TABLE OF CONTENTS
(continued)
| | Page |
| | |
6. | Plan map showing drillholes | 40 |
7. | Mills Lake area cross section K-08-02 and K-08-03 | 41 |
8. | Rose Lake area cross section K-08-09 and K-08-18 | 44 |
9. | Rose Lake area cross section K-08-11A and K-08-12 | 46 |
10. | Histogram for %TFe in Altius drill core samples | 48 |
11. | Histogram for %Magnetic Fe in Altius drill core samples | 48 |
12. | Histogram for %Hematite (calculated) in Altius drill core samples | 49 |
13. | Histogram and cumulative frequency for %Mn in Altius drill core samples | 49 |
14. | Bulk density determined by Altius in the field vs. %TFe_H assays for routine samples | 52 |
15. | SG vs. %TFe_H for WGM independent samples | 52 |
16. | Results for in-field inserted certified reference materials and blanks | 62 |
17. | Results for duplicate ¼ split drill core samples - %TFe Head | 63 |
18. | Results for duplicate ¼ split drill core samples - %Fe3O4Sat Head | 63 |
19. | Results for duplicate ¼ split drill core samples - %FeO Head | 64 |
20. | Results for duplicate ¼ split drill core samples - %SiO2 Head | 64 |
21. | Results for duplicate ¼ split drill core samples - %Mn Head | 65 |
22. | Results for analytical duplicates at SGS-Lakefield for %TFe_H | 66 |
23. | Results for analytical duplicates at SGS-Lakefield for %Mn_H | 66 |
24. | Results for preparation duplicates at SGS-Lakefield for %TFe_H | 67 |
25. | Results for preparation duplicates at SGS-Lakefield for %SiO2_H | 67 |
26. | %TFe_H for WGM independent sampling vs. Altius original | 72 |
27. | %Fe3O4_H (Satmagan) for WGM independent sampling vs. Altius original | 72 |
28. | %SiO2_H for WGM independent sampling vs. Altius original | 73 |
29. | %MnO_H for WGM independent sampling vs. Altius original | 73 |
v

1. SUMMARY
General and Terms of Reference
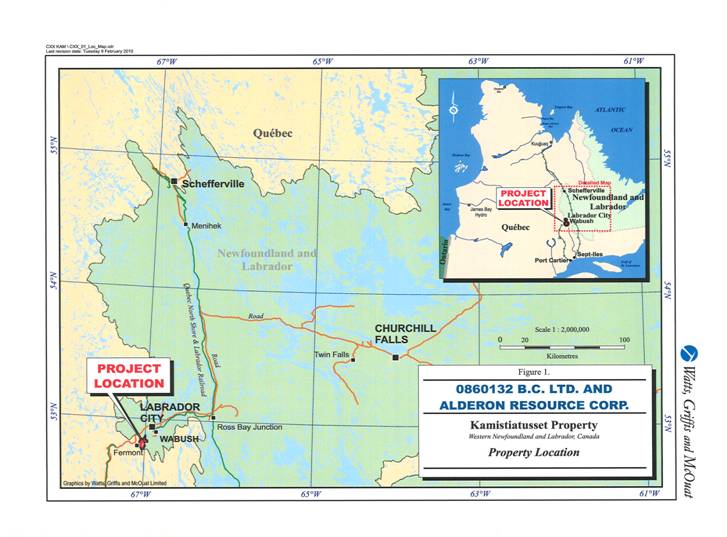
0860132 B.C. LTD. has recently completed an agreement with Altius Minerals Corporation (“Altius”) to acquire the iron ore Kamistiatusset Project (the “Kami Project”). 0860132 B.C. LTD. has assigned its rights to acquire the property to Alderon Resource Corp. (“Alderon”). In this report BCL refers to both 0860132 B.C. LTD. and Alderon (“BCL”). The Kamistiatusset property (the “Property”) is located approximately 10 km from the town of Wabush, Western Labrador and is approximately 6 km south from the Wabush Mines mining lease. The Property straddles the Québec-Labrador provincial border but the majority of it is in Labrador and is owned 100% by Altius. Altius initiated exploration of the Property in 2006 and has completed field work including prospecting, confirmatory geological mapping, gravity and airborne magnetic surveys and in 2008, a drilling program. Some historical exploration results are available, but these appear to be of limited value.
Watts, Griffis and McOuat Limited (“WGM”) was retained by BCL to complete a review of the Kami Project and document the results in an independent technical report prepared in compliance with Canadian National Instrument 43-101 (“NI 43-101”) standards and guidelines. The preparation of this report was authorized by Mr. Mark J. Morabito, President of 0860132 B.C. Ltd. on September 28, 2009.
Property
The Property in Labrador comprises one map-staked licence, of 191 claim units covering 4,775 hectares issued December 29, 2004. The Property in Québec, with registration date May 29, 2008, consists of five map-staked licenses covering a nominal area of 125.46 ha. Both Properties are currently in good standing. Alderon may acquire a 100% interest in the Property, subject to a 3% net sales royalty payable to Altius, by completing expenditures totalling $1 million on or before November 2, 2010, completing a total of $5 million on or before November 2, 2011 and issuing Altius sufficient shares so that Altius owns 50% of the outstanding shares of Alderon at the time of achieving a seed threshold financing of at least $5 million.
Previous Work
The earliest geological reconnaissance in the southern extension of the Labrador Trough within the Grenville Province was by prospectors in 1914 in search of gold. Several parties visited the area between 1914 and 1933. J.E. Gill, in 1933 first recognized the metamorphosed iron formation in the vicinity of Wabush Lake. In 1937, the first geological map and report was published for the area. A few years later, the Labrador Mining and Exploration Co. Ltd. (“LM&E”) evaluated the iron formation.
1
In 1949, interest in the Carol Lake area by LM&E was renewed and geological mapping was carried out in the Duley Lake - Wabush Lake area by H.E. Neal. Concentrations of magnetite and specularite were found in many places west of Duley Lake and Wabush Lake during the course of Neal’s geological mapping. The material was considered to be of economic significance, as the metallurgical tests indicated that it could be concentrated. In 1951, nearly all of the concession held by LM&E within the Labrador Trough was flown with an airborne magnetometer. This survey showed the known deposits to be more extensive than apparent from surface mapping and suggested further ore zones may be present in drift-covered areas. In 1953, a program of geological mapping in the Mills Lake - Dispute Lake area was conducted by R.A. Crouse of the Iron Ore Company of Canada (“IOCC”). In 1957, an area to the west of Duley Lake was remapped and test drilled by IOCC to determine areas for beneficiating ore. Dip needle surveying served as a guide in determining the locations of iron formation in drift-covered areas. The Mills No.1 Zone was outlined by six drillholes and found to have a maximum length of 3,048 m and a maximum width of 610 m. Mineralization is described s being composed of specularite with varying amounts of magnetite, grading on average 32.1% Fe. IOCC continued mapping and evaluation of the deposits lying west of Wabush Lake through 1959.
In 1972, an extensive helicopter magnetic and electromagnetic survey for LM&E covering the Labrador City area was carried out. In 1979, a ground magnetometer survey was conducted on Block No. 24 (part of the Property). Also in 1979, one diamond drillhole was drilled on the Property and in 1983, LM&E collared a diamond drillhole north of Elfie Lake. The drillhole encountered minor oxide facies metamorphosed iron formation.
In 1981 and 1982, an air photography and topographic mapping program was completed by IOCC to re-photograph the mining areas and the survey was extended to cover all the lease and licence blocks in the Labrador City area. In 2001, IOCC staked a considerable portion of the iron formation in the Labrador City area, with the Kamistiatusset area being the southern extent of the company’s focus. The Kamistiatusset area and the area north of the Property was recommended as a high priority target by SRK Consulting Ltd. as part of the 2001 IOCC work report, however, no work was reported for the area.
Geology and Mineralization
The Property is situated in the highly metamorphosed and deformed metasedimentary sequence Knob Lake Group of the Grenville Province, Gagnon terrane of the Labrador Trough (the “Trough”). The Trough is comprised of a sequence of Proterozoic sedimentary rocks, including iron formation, volcanic rocks and mafic intrusions. Trough rocks in the Grenville Province are highly metamorphosed and complexly folded. Iron deposits in the Gagnon terrane, Grenville part of the Trough, include those on the Property and Lac Jeannine,
2
Fire Lake, Mont-Wright, Mont-Reed, and Bloom Lake in the Manicouagan-Fermont area and the Luce, Humphrey and Scully deposits in the Wabush-Labrador City area. The high-grade metamorphism of the Grenville Province is responsible for recrystallization of both iron oxides and silica in primary iron formation, producing coarse-grained sugary quartz, magnetite, and specular hematite schist or gneiss (meta-taconites) that are of improved quality for concentration and processing.
The Property is underlain by folded sequences of the Knob Lake or Gagnon Group containing Wabush/Sokoman Formation iron formation and underlying and overlying units. The stratigraphic sequence varies in different parts of the Property. Altius’ exploration was focussed on three parts of the Property known as the Mills Lake, Rose Lake and the Mart Lake areas. On some parts of the Property, the Sokoman/Wabush is directly underlain by Denault/Duley Formation dolomite and the Wishart/Carol Formation quartzite is missing. In other places, both the dolomite and quartzite units are present.
The iron formation on the Property is the Lake Superior-type. Lake Superior-type iron formation consists of banded sedimentary rocks composed principally of bands of iron oxides, magnetite and hematite within quartz (chert)-rich rock with variable amounts of silicate, carbonate and sulphide lithofacies. Such iron formations have been the principal sources of iron throughout the world (Gross, 1996). Mineralization of economic interest on the Property is oxide facies iron formation. The oxide iron formation (“OIF”) consists mainly of semi-massive bands, or layers, and disseminations of magnetite and/or specular hematite (specularite) in recrystallized chert and interlayered with bands (beds) of chert with minor carbonate and iron silicates. Silicate iron formation (“SIF”) also is prevalent on the Property. SIF consists mainly of amphiboles and chert, often associated with carbonate and contains magnetite or specularite in minor amounts. The oxide iron formation on the Property is mostly magnetite-rich. Some sub-members contain increased amounts of hematite (specularite).
In The Mills Lake area, the iron formation is interpreted to be situated within a north-northwest trending, upright, gently south plunging syncline. The Rose and Mart Lakes area is characterized as a corrugated series of northeast-southwest oriented sub-parallel upright to gently overturned anticlines and synclines. Thickness of oxide and silicate iron formation varies widely but is indicated to be over 300 m in the hinge parts of folds and thinner on fold limbs.
3
Exploration and Drilling
BCL has completed no exploration or drilling of the Property. All recent exploration and drilling were completed by Altius. Reconnaissance mapping and rock sampling commenced during the summer of 2006 and was completed during the 2007 field season. Altius’ 2007 exploration program also included a high resolution helicopter airborne magnetic survey and linecutting. The results of the 2007 program were positive and the airborne magnetic survey effectively highlighted the extent of the iron formation. Following the 2007 program, Altius acquired additional property.
The Altius 2008 exploration program on the Property consisted of rock sampling for physical properties testing, linecutting, a ground gravity and magnetic survey, a high resolution satellite imagery survey, an integrated 3D geological and geophysical inversion model and 6,129.49 m of diamond drilling in 25 holes. The drilling program was designed to test three known iron ore occurrences that were targeted through geological mapping and geophysics on the Property, namely; Mills Lake, Mart Lake and Rose Lake. Drilling confirmed the presence of iron oxide-rich iron formation at the three iron occurrences and was successful in extending the occurrences along strike and at depth. Drilling was fundamental to help refine the geological and structural models for each area to aid in targeting and in positioning future drillholes.
Altius’ 2008 drilling program consisted of 27 holes totalling 6,129.5 m (two abandoned holes which were re-drilled) testing the three main iron occurrences or areas: Mills Lake (6 drillholes), Rose Lake (13 drillholes) and Mart Lake (7 drillholes). Drilling was carried out between June and October.
Logging, Sampling and Assaying
Core logging included descriptive logging and Rock quality designation (“RQD”), specific gravity, magnetic susceptibility measurements and core photography.
Sample intervals were determined on a geological basis, as selected by the drill geologist during logging, and marked out on the drill core. Core was first aligned and then sampled systematically at 5 m sample intervals where possible, except where lithological contacts are less than 5 m. All rock estimated to contain abundant iron oxide was sampled. In addition, two 3-m samples on either side of all iron formation were taken, where possible, to bracket all iron formation sequences. Three-part sample tickets, with unique sequential numbers, were used to number and label samples for assay. Core was sawn in half using a rock saw at Altius’ core facility by an Altius geotechnician.
4
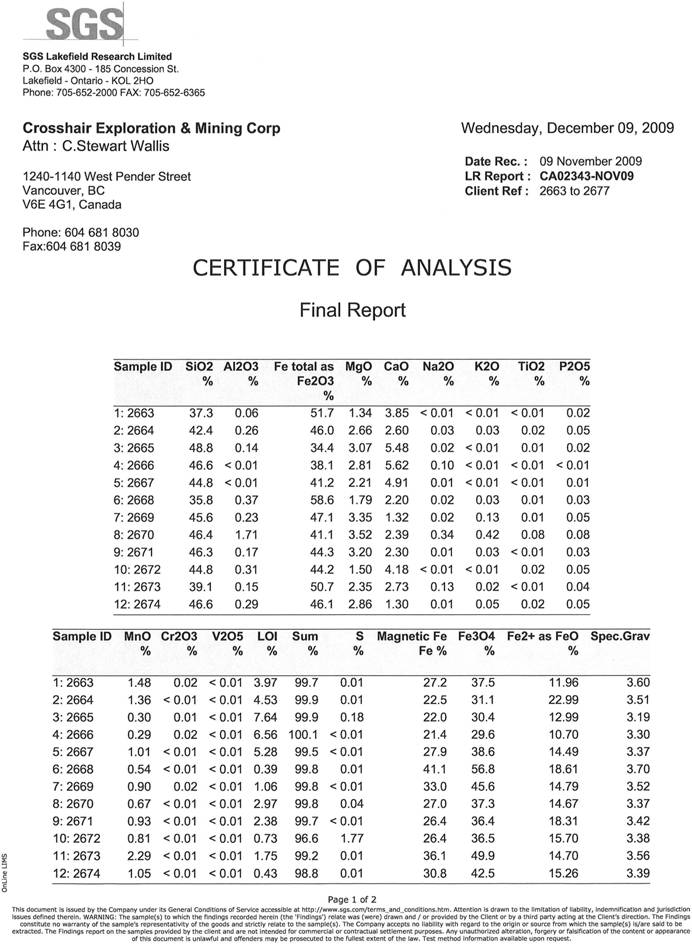
Samples were shipped to SGS-Lakefield Minerals Services’, Lakefield, Ontario facility for sample preparation and assay. Samples were crushed riffle split and a portion pulverized to 200 mesh.
Altius’ drill core samples were analyzed for whole rock analysis (“WR”), major element oxides including total Fe2O3 by lithium metaborate fusion XRF, FeO was determined by H2SO4/HF acid digest-potassium dichromate titration, and Fe3O4 by Satmagan. A group of 14 samples were also analysed for S. In-field QA/QC included the insertion into the sample stream of Blanks, quarter core Duplicates and two Certified Reference Standards. A total of 676 samples, including in-field QC materials, were sent for assay.
Data Corroboration
WGM Senior Geologist, David Power-Fardy, P.Geo., accompanied by BCL representative, Mr. Stewart Wallis, P.Geo., and Altius representative Ms. Carol Seymour, Geologist, completed a site visit to the project in October, 2009. Drill core was reviewed at Altius’ core storage facility in Wabush on October 6 and again on October 8. Facilitated by helicopter, Mr. Power-Fardy, Mr. Wallis and Ms. Seymour visited the Property on October 7. WGM independently collected 15 samples from 2008 drillholes and these samples were sent to SGS-Lakefield for analysis.
Adjacent Properties
The northern boundary of the Property is located approximately 6 km south of the Scully Mine of Wabush Mines, owned 100% by Arcelor-Mittal Steel’s Canadian subsidiary Dofasco. The Carol operations (Humphry Mine) owned by Rio Tinto Iron Ore subsidiary IOCC located north of Labrador City, is approximately 18 km north of the Property. QCM’s Mont-Wright Iron Mine, also owned by Arcelor-Mittal Steel is located 9 km west of the Property. The Property is also located approximately 10 km southeast of the Bloom Lake Iron Deposit that is undergoing advanced mine development by Consolidated Thompson Iron Mines Ltd. All of these iron mines in the area extract similar iron mineralization as found at the Property, although for each deposit, there are variations in geology and character of mineralization.
Mineral Processing and Metallurgical Testing
One testwork program completed in 2009 at SGS-Lakefield has been conducted on mineralization from the Property. The metallurgical sample was a composite made from routine sample intervals from drillholes K-08-01 and K-08-18. These intervals of magnetite-rich iron formation, with lower specularite, were selected by Altius as reasonably representative of the overall deposit mineralization. The sample was submitted for a detailed ore characterization including head assays, mineralogy, preliminary grindability and
5
beneficiation testwork including low-intensity magnetic separation (“LIMS”) and gravity separation.
The test combining LIMS and Mozley separations on the LIMS tailings achieved the best overall performance, with weight and TFe recoveries of 40.7% and 88.6%, respectively, at final TFe and SiO2 grades of 67.5% and 3.01%, respectively. This result was a slight improvement in weight yield and 5.3% increase in TFe recovery over the Mozley only result on material with a P80 of 200 microns (65 mesh) which would result in considerably less grinding energy and costs. The most optimal flowsheet may be governed by the need to control manganese levels in the concentrate to meet concentrate specifications.
Conclusions and Recommendations
· Mineralization on the Property comprising iron formation of the Sokoman/Wabush Formation is hosted in a series of upright to slightly overturned anticlines and synclines. Typical of the Wabush area oxide iron formation, it is overlain, and underlain respectively by an Upper Iron Formation (“UIF”) sequence and a Lower iron Formation (“LIF”) sequence, consisting mainly of silicate iron formation with carbonate. The UIF is in turn overlain by Menihek Formation argillaceous schist. The LIF is underlain by quartzites and dolomite formations and more argillaceous/mica schist formations; respectively the Wishart/Carol, Duley/Denault and Attikamagen/Katsao Formations;
· Although Altius’ drillhole collars require survey with DGPS, WGM’s check during its site visit on several collars showed that the collar locations are reasonably accurate. All assays from Altius’ drilling were performed at an accredited laboratory and both Altius and SGS-Lakefield inserted QA/QC materials to endure quality assay results. No samples were, however, re-assayed at a secondary laboratory and this should be standard practice. The drill core samples WGM collected during its site visit were collected independent of Altius and/or BCL and were submitted blind to the laboratory. These samples reported assays reasonably similar to those reported by Altius and thus indicate that Altius’s sample results are reliable;
· In the Mills Lake area, one main tight upright synclinal structure is indicated. This structure has an indicated strike length in the order of 4.3 km. The main zone oxide iron formation where it has been drill tested varies in thickness from less than 40 m to 100 m true thickness. More drilling is required to determine variations in thickness along the indicated structure.
The Mart and Rose Lake areas are characterized by a repetitive series of tight upright to slightly overturned parallel synclines and anticlines containing zones or stratigraphic units of iron formation. In the Rose Lake area, structures have indicated strike lengths in the order of 4.5 km. Drillhole intersections indicate the main zones of dominantly oxide iron
6
formation vary in true thickness from 70 m on fold limbs, to over 300 m in fold hinge areas. On some sections, OIF and SIF are interlayered with argillaceous/micaceous metasediments. In the Mart Lake area, iron formation is less well developed than in the Rose Lake area. Zones of oxide iron formation are thinner and SIF is more prevalent than in the Rose Lake or Mills Lake areas. More drilling is required in all areas to determine the extent and thicknesses of iron formation and confirm structural interpretation;
· Oxide iron formation on the Property consists dominantly of magnetite-rich material, but includes material that is dominantly magnetite and with lesser hematite, dominantly hematite with moderate magnetite, and for some discrete intervals, mainly hematite with very little magnetite. Three hundred and forty-seven of Altius’ 2008 drill core samples were oxide iron formation. These samples averaged 30.67% TFe, 44.40% SiO2 and 1.28% Mn, with an overall average magnetite content of 29.5% determined by Satmagan. Overall hematite content is calculated at nearly 11%. Hematite-rich members of the oxide iron formation sequence contain more manganese than magnetite-rich members;
· The limited metallurgical testwork to date indicates that concentrates with iron and silica grades that meet market specifications for manganese cannot be produced, i.e., in the range of 0.08 to 0.2% MnO, but manganese levels will be lower than those for Scully concentrates and pellets. The market limitations of manganese content will be a concern for portions of the deposit to ensure that the concentrate specifications for manganese can be maintained in a commercial operation; and
· The technology being considered by Wabush Mines to reduce the manganese content in concentrates should be investigated and tested as a possible way to achieve better quality concentrates, as well as increase the proportion of the deposit that can be included in the Mineral Resource.
WGM makes the following recommendations:
1. Contacts are required with government to determine implications of Duley Provincial Park to project development and discuss land use issues regarding existing cottages and recreational facilities and other land use issues south of the park within the Property.
2. Environmental studies should be initiated during the next exploration campaign to identify sensitive issues.
3. Drillhole collars should be DGPS surveyed.
4. External check assays by a secondary laboratory should be a routine part of a standard QA/QC protocol. The labs should be requested to include the results for their internal
7
Standards and Blanks on their certificates of Analysis. Project reports should include a analysis of QA/QC data.
5. Sample IDs through various data tables must be kept consistent in syntax.
6. A better approach to sample database structure than used by Altius would be to include the in-field quality control materials in the main assay table and then code them. This would allow for assay certificates to be directly imported into the table without having to partition out in-field quality control samples.
7. Conduct a metallurgical testwork program to further investigate the metallurgical characteristics and probable commercial flowsheet. This should be carried out on a composite sample from the most recent drill campaign. Then in conjunction with the next drilling campaign, a standard metallurgical concentration test should be carried out to metallurgically map the deposit to guide what areas of the mineralization constitute Mineral Resources. Special attention to the manganese distribution and concentrate specifications should be conducted.
8. Investigate and test the potential to reduce the manganese in the final concentration process as researched by Wabush Mines.
BCL has developed a Phase I program with a budget to advance the Kami Property. The proposed Phase I program consists of:
· Additional linecutting to enable further gravity and magnetic surveys on extension of Mills and Rose Lake grids. Linecutting to infill the Mills Lake grid to 200 m line spacing and to extend the Rose Lake grid to the southwest and northeast as far as Duley Lake; and
· Diamond drilling of approximately 20 drillholes aggregating 3,500 m. This is broken down into: a) seven holes totalling 1,000 m to infill the Mills Lake grid to 200 m spacing, b) four exploration drillholes totalling 600 m to test gravity anomalies or coincident magnetic/gravity anomalies north and southwest of Rose Lake along the strike of the iron formation, c) the remainder of the drilling, approximately nine holes totalling 1,900 m, to commence infilling the Rose Lake grid at 200 m spacing to further define the structure of the deposit.
BCL’s Phase I program totals approximately $1,000,000 and a budget outline is provided below.
8
Phase II work will be carried out contingent on results of Phase I. The purpose of Phase II is to obtain a sufficient density of drilling to enable the preparation of a NI 43-101 compliant Mineral Resources estimate and advance the project towards prefeasibility. Phase II includes expenditures for metallurgical testwork, a prefeasibility study and permitting. Phase II totals approximately $5.5 million.
WGM recommends that BCL incorporate WGM’s recommendations 1 to 8 listed above into their Phase 1 program. This will not add substantially to the current proposed budget and will ensure industry standard practices going forward.
BCL Proposed Exploration Program,
Phase I Kamistiatusset Property
Phase I | | Unit | | Unit Cost
(C$) | | Total Cost
(C$) | |
Linecutting (line km) | | 50 | | $ | 1,000 | | $ | 50,000 | |
Geophysics Surveys, Magnetics and gravity (line km) | | 50 | | $ | 1,300 | | $ | 65,000 | |
Diamond drilling (m) | | 3,500 | | $ | 175 | | $ | 612,500 | |
Diamond drilling support, geology, assays (m) | | 3,500 | | $ | 70 | | $ | 245,000 | |
Contingency, approximately | | | | | | $ | 27,500 | |
GRAND TOTAL PHASE I | | | | | | C$ | 1,000,000 | |
9

2. INTRODUCTION AND TERMS OF REFERENCE
2.1 GENERAL
Altius Minerals Corporation (“Altius”) owns a 100% interest in the iron ore Kamistiatusset Project (the “Kami Project”). 0860132 B.C. LTD. has recently completed an agreement with Altius to acquire theProject. 0860132 B.C. LTD. has assigned the option to Alderon Resource Corp. (Alderon). In this report BCL refers to 0860132 B.C. LTD. and Alderon (“BCL”). The Kamistiatusset property (the “Property”) as shown in Figure 1 is located approximately 10 km from the town of Wabush, Western Labrador and is approximately 6 km south from the Wabush Mines mining lease. The Property straddles the Québec-Labrador provincial border but the majority of it is in Labrador. Altius initiated exploration of the Property in 2006 and has completed field work including prospecting, confirmatory geological mapping, gravity and airborne magnetic surveys and in 2008, a drilling program aggregating 6,029.5 m in 27 drillholes. Some historical exploration results are available, but these appear to be of limited value. Much of the description and summary for the results of the surface exploration and drilling programs are contained in Section 9 of this report titled: Mineralization.
2.2 TERMS OF REFERENCE
Watts, Griffis and McOuat Limited (“WGM”) was retained by BCL to complete a review of the Kami Project and document the results in an independent technical report prepared in compliance with Canadian National Instrument (“NI 43-101”) standards and guidelines. WGM understands that the report will be used to satisfy certain TSX Venture exchange listing requirements per Alderon’s application.
This technical report is copyright protected; the copyright is vested in WGM, and this report or any part thereof may not be reproduced in any form or by any means whatsoever without the written permission of Watts, Griffis and McOuat Limited. Furthermore, WGM permits the report to be used as a basis for project financings and for filing on SEDAR. Part or all of the report may be reproduced by BCL in any subsequent reports, with the prior consent of WGM.
The preparation of this report was authorized by Mr. Mark J. Morabito, President of 0860132 B.C. Ltd. on September 28, 2009.
10
Figure 1. Property Location
11
2.3 SOURCES OF INFORMATION
Much of the material used to prepare this report has been provided by Altius. This data included assessment reports completed for Altius, and filed with the Department of Natural Resources Government of Newfoundland and Labrador to document its 2006, 2007 and 2008 exploration programs. These assessment filings often contain reports by several contractors including geophysical contractors. Other sources of historic exploration and generalgeological information include the Ministère des Resources Naturelle et Fauna du Québec (“MNRF”) and the Geological Survey of Canada. WGM reviewed the documents available, corroborated a number of details concerning the Property and deposit geology.
Additional information was sourced from WGM files. WGM had been auditing the Mont-Wright operation for Québec Cartier Mining Company (“QCM”) since 1994 on a biennial basis. WGM managed the exploration and analytical program for QCM on the Bloom Lake Project in 1998-99 and completed an internal Mineral Resource estimate. WGM was also retained by Consolidated Thompson-Lundmark Gold Mines Limited, now Consolidated Thompson Iron Mines Ltd. (“Consolidated Thompson”), to update the Bloom Lake Project report and complete a NI 43-101 compliant Mineral Resource estimate in 2005. These other deposits are in the vicinity of the Property and details of their geology and mineralization are relevant to the Property.
WGM Senior Geologist, Mr. David Power-Fardy, P.Geo., QP visited the Property in October 2009 and reviewed Altius’ program results with Carol Seymour, B.Sc., Project Geologist for Altius and Mr. C. Stewart Wallis, P.Geo., representing BCL. Mr. Power-Fardy also collected independent drill core samples during his site visit. Co-authors of this report, WGM Senior Associate Geologist, Mr. Richard Risto P.Geo., QP and WGM Senior Associate Metallurgical Engineer G. Ross MacFarlane, P.Eng., QP, have not visited the Property.
A complete list of the material reviewed is found in the “References” section of this report.
2.4 UNITS AND CURRENCY
Metric units are used throughout this report unless specified otherwise and all dollar amounts are quoted in Canadian currency (“C$”). Historical data and some government map data are generally in Imperial units. WGM has converted the necessary data for inclusion in this report, although Imperial units are often provided for clearer reference to historical data.
12
Altius’ 2006, 2007 and 2008 surface and drill core samples were analysed by X-Ray Florescence (“XRF”) methods on metaborate discs by SGS Minerals Services (“SGS-Lakefield”) at its Lakefield, Ontario facility. Iron results on SGS-Lakefield certificates of analysis are reported in the form of Fe2O3 and are total iron. Total Iron (“TFe”) refers to the total iron in a sample. TFe is calculated from Fe2O3 by dividing the Fe2O3 wt% value by 1.4295. TFe assays are often completed on both Head and Crude samples of rock and also on the concentrates produced from the rock. %TFe Head or %TFe_H refers to the percent total iron in a Head or Crude sample. %SiO2_H represents silica in the Head or Crude sample.
Altius’ 2008 drill program on the Property, in addition to using chemical assays, also included determining magnetic iron, or the magnetite content of samples using the Satmagan method (Satmagan is an acronym for Saturation Magnetization Analyzer). Satmagan refers to an electromagnetic method to estimate the magnetite content of a sample. These assays are expressed as %Fe3O4 or as %magnetite (“Mt”).
Altius also completed a bench scale metallurgical testwork program on one composite sample from the Property in 2009. This testwork included the preparation of Davis Tube concentrates (“DTCs”) for drillhole samples. The Davis Tube provides an alternative method to Satmagan for estimating the magnetic iron content of a sample. The Davis Tube refers to the equipment and a procedure that produces a mineral concentrate high in magnetic iron by separating that portion of the sample that is magnetic from the portion that is non-magnetic, following sample comminution. Percent Davis Tube Weight Recovery (“%DTWR”) refers to the weight percent of the sample concentrated in the magnetic fraction using the Davis Tube procedure. The result is approximately the same as percent magnetite in the crude sample, but degree of liberation of the magnetite is an issue. Davis Tube concentrates are also assayed for iron and other oxides expressed in weight percent. %Fe_DTC and %SiO2_DTC refer respectively to the iron and silica content in Davis Tube concentrates and a number of other elements are often expressed in this same way. The %magnetic iron in the Crude sample can be estimated by multiplying the %DTWR figure by the %Fe in the Davis Tube concentrate. Total Iron Recovery (“TFe Recovery” or Rec’y) is the %TFe units recovered in the concentrate compared to the TFe in the Crude sample.
Other whole rock analysis results for samples are expressed in weight percent (“Wt%”). Table 1 documents several of the commonly used abbreviations and acronyms in the text of this report.
13
TABLE 1.
SUMMARY OF TERMS AND ABBREVIATIONS FOR UNITS
Abbreviation | | Term |
% or Wt% | | Weight Percent |
Head or Crude or H | | Non-concentrated material |
TFe | | Total Iron |
SFe | | Soluble iron |
Fe | | Iron; SFe and TFe |
DT, DTC or C | | Davis Tube, Davis Tube Concentrate, Concentrate |
%DTWR | | % Davis Tube Weight Recovery |
%Wt Recovery | | General term for weight recovery |
TFe Recovery or Rec’y | | %TFe units recovered compared to TFe units in Head |
14
3. RELIANCE ON OTHER EXPERTS
WGM prepared this study using the resource materials, reports and documents as noted in the text and “References” at the end of this report.
WGM has not independently verified the legal title to the Property. We are relying on public documents and information provided by Altius and BCL for the descriptions of title and status of the Property agreements.
Drill core and surface rock samples collected by Altius were submitted by Altius to SGS-Lakefield which is an accredited laboratory. Although WGM has reviewed the assay results generated by SGS-Lakefield and believes they are accurate, WGM is relying on SGS-Lakefield.
We have also not carried out any independent geological surveys of the Property, but did complete a site visit in October 2009 to view first-hand the Property site, view 2008 drill core, collect samples from the drill core and to review historic exploration and development work. These samples were collected and assayed independently of BCL to validate Altius’ results. We have relied for our geological descriptions and program results solely on the basis of historic reports, notes and communications with BCL and Altius.
15
4. PROPERTY DESCRIPTION AND LOCATION
4.1 PROPERTY LOCATION
The Property is located in western Labrador and eastern Québec and straddles the interprovincial boundary. It is approximately 10 km southwest from the town of Wabush, Newfoundland and Labrador and immediately adjacent (east) of the town of Fermont in Québec. The Property perimeter is approximately 6 km southwest from the Wabush Mines mining lease. The Property spans an area that extends about 7 km east-west and 13 km north-south in NTS map areas 23B/14 and 15 and centred at approximately 52°49’N latitude and 67°02’W longitude.
4.2 PROPERTY DESCRIPTION AND OWNERSHIP
The Property is mainly located in Labrador but also a group of contiguous licences is held in Québec. The total area of the Property is nominally 4,900 ha but some of the claims in Labrador and Quebec overlap slightly. The Property in Labrador comprises one map-staked licence, 015980M, totalling 191 claim units covering 4,775 hectares issued December 29, 2004. This license, issued in 2009, replaced licenses 014957M, 014962M, 014967M, 014968M and 015037M. Surface rights on the acquired lands are held by the provincial governments but may be subject to First Nations Rights. Table 2 provides details of the current mineral land holdings in Labrador.
TABLE 2.
KAMISTIATUSSET PROPERTY IN LABRADOR
Licence | | Claims | | Area (ha) | | NTS Areas | | Issuance Date | | Renewal Date | | Report Date |
015980M | | 191 | | 4,775 | | 23B14 23B15 | | Dec 29, 2004 | | Dec 29, 2014 | | March 1, 2010 |
The Property in Québec consists of five map-staked licenses covering a nominal area of 125.46 ha. Table 3 provides details of the mineral land holdings in Québec.
TABLE 3.
KAMISTIATUSSET PROPERTY IN QUÉBEC
Licence | | Area
(ha) | | NTS
Areas | | Registration
Date | | Expiry
Date | | Designation
Date | | Work Necessary
for Renewal($) | | Required Fees
for Renewal($) | |
CDC2156611 | | 25.03 | | 23B14 | | May 29, 2008 | | May 28, 2010 | | Mar 27, 2008 | | 120.00 | | 96.00 | |
CDC2156609 | | 45.31 | | 23B14 | | May 29, 2008 | | May 28, 2010 | | Mar 27, 2008 | | 135.00 | | 107.00 | |
CDC2156607 | | 49.4 | | 23B14 | | May 29, 2008 | | May 28, 2010 | | Mar 27, 2008 | | 135.00 | | 107.00 | |
CDC2156610 | | 3.50 | | 23B14 | | May 29, 2008 | | May 28, 2010 | | Mar 27, 2008 | | 48.00 | | 26.00 | |
CDC2156608 | | 4.22 | | 23B14 | | May 29, 2008 | | May 28, 2010 | | Mar 27, 2008 | | 48.00 | | 26.00 | |
Total | | 125.46 | | | | | | | | | | | | | |
16
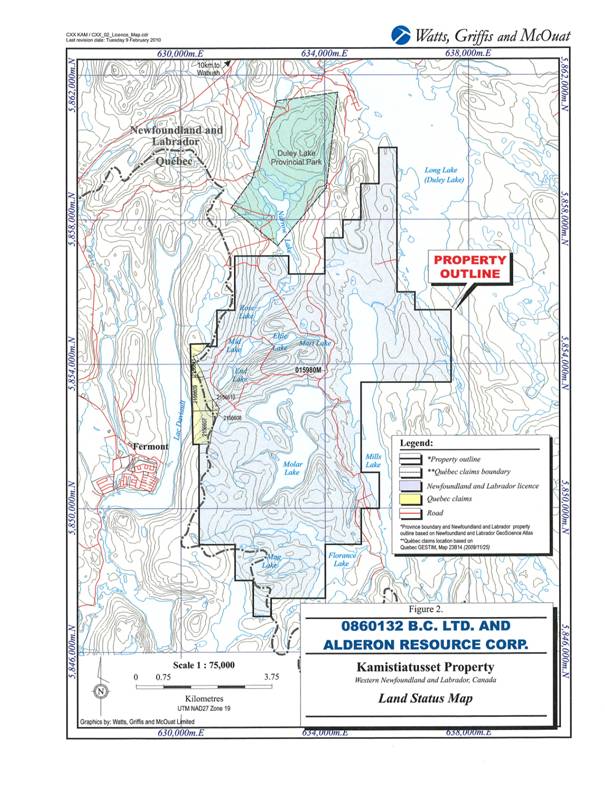
The Property land holdings are depicted on Figure 2.
The Property has not been legally surveyed, but the claims and licences both in Québec and Labrador were map-staked and are defined by UTM coordinates, so the Property location is accurate.
In Labrador, a mineral exploration licence is issued for a term of five years. However, a mineral exploration licence may be held for a maximum of twenty years provided the required annual assessment work is completed and reported upon and the mineral exploration licence is renewed every five years. The minimum annual assessment work required to be done on a licence are:
$200/claim in the first year
$250/claim in the second year
$300/claim in the third year
$350/claim in the fourth year
$400/claim in the fifth year
$600/claim/year for years six to ten, inclusive
$900/claim/year for years eleven to fifteen, inclusive
$1,200/claim/year for years sixteen to twenty, inclusive.
The renewal fees are:
for Year five $25/claim
for Year ten $50/claim
for Year fifteen $100/claim.
The minimum annual assessment work must be completed on or before the anniversary date. The assessment report must then be submitted within 60 days after the anniversary date.
The Property is now in its 5th year. Total expenditures on the 191 claims to date accepted by the Department of Mines and Energy total $2,423,380.05. Accepted expenditures in 2008 amounted to $1,855,089. Government claim records indicate that to maintain the Property in good standing, through December 29, 2018, a total of $171,900 of acceptable work expenditures are required.
In Québec, the term of a claim is two years from the day the claim is registered, and the claim can be renewed indefinitely providing the holder meets all the conditions set out in the Mining Act, including the obligation to invest a minimum amount required in exploration work
17
Figure 2. Land Status Map
18
determined by regulation. The Act includes provisions to allow any amount disbursed to perform work in excess of the prescribed requirements to be applied to subsequent terms of the claim.
The claim holder may renew title for a two year period by:
· submitting an application for renewal prior to the claim expiry date;
· paying the required fees, which vary according to the surface area of the claim, its location, and the date the application is received. If renewal application is received 60 days prior to the claim expiry date, the regular fees apply; if it is received within 60 days of the claim (prior to expiry date) expiry date, the fees are doubled; and submitting an assessment work report and the work declaration form at least 60 days before the claim expiry date. If the remittance of these documents is made during the 60 days prior to the expiry date, a penalty fee of $100 per claim is applied for the late submission.
BCL’s Québec claims range in size from approximately 3 ha to 50 ha and fees for renewal vary with claim size as listed in Table 3. If renewals are late, then late fees apply. If the required work was not performed or was insufficient to cover the minimums required, then the claim holder may pay a sum equivalent to the minimum cost of work that should have been performed. Assessment work requirements escalate with renewal term and all fees are subject to revision (Table 4). After a claim’s 6th term, which would be at the end of its 12th year of validity, assessment costs are static. None of BCL’s Québec claims have been renewed so all are in their first term. To renew these claims for their second term, exploration work ranging in value from $48 to $135 per claim will be required, depending on the claim concerned because the claim size varies.
TABLE 4.
MINIMUM COST OF WORK TO BE CARRIED OUT
ON A QUÉBEC CLAIM NORTH OF 52° LATITUDE
| | Area of Claim | |
Term | | Less than 25 ha | | 25 to 45 Ha | | Over 45 Ha | |
1 | | 48 | | $ | 120 | | $ | 135 | |
2 | | 160 | | $ | 400 | | $ | 450 | |
3 | | 320 | | $ | 800 | | $ | 900 | |
4 | | 480 | | $ | 1,200 | | $ | 1,350 | |
5 | | 640 | | $ | 1,600 | | $ | 1,800 | |
6 | | 750 | | $ | 1,800 | | $ | 1,800 | |
7 and over | | 1,000 | | $ | 2,500 | | $ | 2,500 | |
19

4.3 PROPERTY AGREEMENTS
According to the agreement of November 2, 2009 (the “Altius Option Agreement”), 0860132 B.C. LTD. acquired an option (the “Option”) to earn a 100% interest in the Property, from Altius, subject to certain royalties. The Option shall be exercisable by 0860132 B.C. LTD. for 24 months following November 2, 2009.
In order to exercise the Option 0860132 B.C. LTD. must:
· Assign the Option to a company (“Pubco”) acceptable to Altius; this condition has been met with the assignment of the Option to Alderon;
· Satisfy the exploration obligations, which include:
· incurring cumulative exploration expenditures of at least $1,000,000 within 12 months from the execution date of the agreement;
· incurring exploration expenditures of at least $5,000,000 or incurring exploration expenditures of $2,500,000 and paying Altius the difference between actual exploration expenditures and $5,000,000 within a period of 24 months from the execution date;
· Arrange for Pubco, before the closing, to conduct one or more equity financings for gross proceeds of at least $5,000,000 – the seed financing threshold;
· Arrange for Pubco, to issue to Altius, shares of Pubco equal to 50% of the issued and outstanding capital of Pubco on a fully diluted basis, calculated at the time the seed financing threshold is obtained; and
· Arrange for Pubco to complete subsequent to the closing date, an equity financing of at least $5,000,000 – the secondary financing.
Altius has the option to repurchase the entire 100% interest in the Property for $2,500,000 if the secondary financing is not completed within 12 months of the closing. Upon Pubco acquiring 100% interest in the Property, it shall grant Altius a 3% gross sales royalty. 0860132 B.C. LTD. also maintains a right of first refusal concerning other property in western Labrador iron ore mining district should Altius wish to sell or dispose of any property.
On December 15, 2009, 0860132 B.C. LTD., Mr. Mark Morabito and Alderon entered into a definitive Share Exchange Agreement (the “Share Exchange Agreement”) whereby Alderon will acquire all of the issued and outstanding shares of 0860132 B.C. LTD. from Mr. Morabito in consideration of issuing 5,000,000 shares of Alderon to Mr. Morabito. Also on December 15, 2009 Alderon, 0860132 B.C. LTD. and Altius entered into an assignment
20
agreement (the “Assignment Agreement”) pursuant to which Alderon assumed the obligations of Pubco under the Altius Option Agreement. The conditions of closing set out in the Share Exchange agreement include, among others, that:
· all necessary consents, approvals and other authorizations of any regulatory authorities, shareholders or third parties;
· Alderon shall have completed an equity financing to raise gross proceeds of not less than $1,500,000 by issuing 10,000,000 subscription receipts at a price of $0.15 per subscription receipt and upon satisfaction of certain conditions, each subscription receipt will automatically convert into one-post-consolidated common share of Alderon, for no additional consideration; (completed) and
· all terms and conditions of the Altius Option Agreement shall have been complied with.
As far as WGM is aware, except for the Alderon Share Exchange Agreement and the Assignment Agreement, 0860132 B.C. LTD. has completed no third party property agreements concerning the Property.
4.4 PERMITTING
No permits have so far been obtained for future exploration programs.
4.5 ENVIRONMENTAL ISSUES
The Property is located immediately to the south of Duley Lake Provincial Park. A part of the watershed on the Property drains into the Park. This may be a sensitive issue for any mine development and WGM urges BCL to discuss the implications with the Government of Newfoundland and Labrador. WGM is also aware that there are a number of cottages on the Property along various rivers and lakes. Any mining operation will impact these buildings and recreational facilities and will also have to be dealt with. Tailings disposal will also be an issue for the Ministry of Fisheries and Oceans, Government of Canada.
Neither BCL nor Altius have conducted any environmental studies to date on the Property. During the next phase of work, flora, fauna and baseline water quality surveys should be initiated.
21
4.6 FIRST NATION ISSUES
Three Aboriginal groups: the Labrador Innu Nation, the Innu Takuaikan Uashat Mak Mani-Utenam of Sept-Îles and the Matimeskush-Lac John of Schefferville have unresolved land claims in the area. WGM is not aware of any First Nation issues concerning the Property but recommends BCL contact and consult these groups.
22
5. ACCESS, CLIMATE, LOCAL RESOURCES, INFRASTRUCTURE
AND PHYSIOGRAPHY
5.1 ACCESS
The Property is accessible from Labrador City/Wabush, Newfoundland via 4x4 vehicle roads. All-Terrain Vehicle (“ATV”) trails enable access to the remainder of the Property. Wabush is serviced daily by commercial airline form Sept-Îles, Montreal and Québec City and also by flights from points east.
5.2 CLIMATE
The climate in the region is typical of north-central Québec/Western Labrador. Winters are harsh, lasting about six to seven months, with heavy snow from December through April. Summers are generally cool and wet; however, extended day-light enhances the summer work-day period. Early and late-winter conditions are acceptable for ground geophysical surveys and drilling operations.
5.3 PHYSIOGRAPHY
The Property is characterized by gently rolling hills and valleys that trend northeast-southwest to the north of Molar Lake and trend north-south to the west of Molar Lake reflecting the structure of the underlying geology. Elevations range from 1,950 ft to 2,300 ft.
The Property area drains east or north into Duley Lake. A part of the Property drains north into the Duley Lake Provincial Park before draining into Duley Lake.
In the central Property area, forest fires have helped to expose outcrops; the remainder of the Property has poor outcrop exposure (see Figure 1). The cover predominantly consists of various coniferous and deciduous trees with alder growth over burnt areas.
5.4 LOCAL RESOURCES AND INFRASTRUCTURE
The centre of the Property is within 16 km of the railroad and power lines located in the town of Wabush. Infrastructure near Wabush Mines perhaps provides an alternative closer source of power. A qualified work force is located within the general area due to the operating mines and long history of exploration in this region.
23
6. HISTORY
6.1 GENERAL
A summary of the historical work is presented below. WGM believes the historical descriptions presented are generally accurate but WGM has however not independently verified the data.
The earliest geological reconnaissance in the southern extension of the Labrador Trough within the Grenville Province was by prospectors who went there in 1914 in search of gold. Several parties visited the area between 1914 and 1933, but it was not until 1937 that the first geological map and report was published by Gill et al., 1937 (Rivers, 1980).
The metamorphosed iron formation in the vicinity of Wabush Lake was first recognized by Dr. J.E. Gill in 1933. A few years later, the Labrador Mining and Exploration Co. Ltd. (“LM&E”) evaluated the iron formation, but decided it was too lean for immediate consideration (Gross et al., 1972).
In 1949, interest in the Carol Lake area by LM&E was renewed and geological mapping was carried out in the Duley Lake - Wabush Lake area by H.E. Neal. The work was done on a scale of 1”= 1/2 mi. and covered an area approximately 8 km wide by 40 km long from Mills Lake northward to the middle of Wabush Lake. This work formed part of the systematic mapping and prospecting carried on by LM&E in their concession.
Concentrations of magnetite and specularite were found in many places west of Duley Lake and Wabush Lake during the course of Neal’s geological mapping. Broad exposures of this enrichment, up to 1.2 km long, assayed from 35 to 54% Fe and 17 to 45% SiO2. Ten enriched zones of major dimensions were located and six of these were roughly mapped on a scale of 1” = 200 ft. Seventy-four samples were sent to Burnt Creek for analysis. Two bulk samples, each about 68 kg, were taken for ore dressing tests. One was sent to the Hibbing Research Laboratory, the other to the Bureau of Mines, Ottawa. The material was considered to be of economic significance, as the metallurgical tests indicated that it could be concentrated.
Geological mapping on a scale of 1”= 1/2 mi was carried out by H.E. Neal in the Wabush Lake - Shabogamo Lake area in 1950. Neal (1951) also reported numerous occurrences of pyrolusite and psilomelane (botryoidal goethite being frequently associated with the manganese) within the iron formation and quartzite.
24
Mills No. 1 was one of the iron deposits discovered in 1950 and was sampled and described at that time. A narrow irregular band of pyrolusite was reported to extend for 457 m within a friable magnetite-hematite iron formation located 914 m southwest of the prominent point on the west side of Mills Lake (Neal, 1951).
In 1951, nearly all of the concession held by LM&E within the Labrador Trough was flown with an airborne magnetometer. This survey showed the known deposits to be more extensive than apparent from surface mapping and suggested further ore zones in drift-covered areas (Hird, 1960).
In 1953, a program of geological mapping in the Mills Lake - Dispute Lake area was conducted by R.A. Crouse of the Iron Ore Company of Canada (“IOCC”). Crouse (1954) considered the possibility of beneficiating ores within the iron formation and all high magnetic anomalies and bands of magnetite-specularite iron formation were mapped in considerable detail. Occurrences of friable magnetite-specularite gneiss, containing enough iron oxides to be considered as beneficiating ore, were found in several places west of Duley Lake and northwest of Canning Lake. Representative samples assayed 18.55 to 43.23% Fe and 26.66 to 71.78% SiO2 (Crouse, 1954). Seven zones of this material were located in the area. Three of these (one of which was Mills No. 1 Deposit) were mapped on a scale of 1”=200 ft. On two of these occurrences, dip needle lines were surveyed at 122 m (400 ft) intervals. Forty-two samples were sent to the Burnt Creek Laboratory for analysis. Three samples were sent to Hibbing, Minnesota for magnetic testing (Crouse, 1954). Crouse (1954) reported that at Mills No. 1 the ore was traced for a distance of 488 m along strike, with the minimum width being 107 m.
In 1957, an area of 86.2 km2 to the west of Duley Lake was remapped on a scale of 1”= 1,000 ft and test drilled by IOCC to determine areas for beneficiating ore. Dip needle surveying served as a guide in determining the locations of iron formation in drift-covered areas. According to Hird (1960), 272 holes for a total of 7,985 m (26,200 ft) were drilled during the 1957 program (approximately 66 holes are located on the Property). Mathieson (1957) reported that there were no new deposits found as a result of the drilling, however, definite limits were established for the iron formation found during previous geological mapping. Three zones of “ore” were outlined, which included Mills No. 1, and an area of 19.1 km2 was blocked out as the total area to be retained (Mathieson, 1957). According to Mathieson (1957), the Mills No.1 zone was outlined by six drillholes and found to have a maximum length of 3,048 m (10,000 ft) and a maximum width of 610 m (2,000 ft). Mathieson (1957) describes mineralization to be composed of specularite with varying amounts of magnetite grading on average 32.1% Fe. A search by Altius for the logs and/or
25
core from the 1957 LM&E drilling program has not been successful. From local sources, it is known that all holes drilled in this area were of small diameter and very shallow (~30 m).
Early in 1959, a decision was made by IOCC to proceed with a project designed to open up and produce from the ore bodies lying to the west of Wabush Lake and a major program of construction, development drilling and ore testing was started in the Wabush area (Macdonald, 1960). Geological mapping (1”=1,000 ft) and magnetic profiling were conducted by R. Nincheri of LM&E in the Duley - Mills Lake area that year. Zones of potential beneficiating ores were located to the southwest of Mills Lake (Nincheri, 1959).
In 1972, an extensive airborne electromagnetic survey covered 2,150 km2 of territory, and entailed 2,736 line km of flying in the Labrador City area. The area covered extended from the southern extremity of Kissing Lake to north of Sawbill Lake, and from approximately the Québec-Labrador border on the west to the major drainage system, through Duley, Wabush and Shabogamo Lakes on the east. The survey was done by Sander Geophysics Ltd. (for LM&E) using a helicopter equipped with a NPM-4 magnetometer, a fluxgate magnetometer, a modified Sander EM-3 electromagnetic system employing a single coil receiver, and a VLF unit (Stubbins, 1973).
In 1972 to 1973, an airborne magnetic survey was conducted over the area by Survair Ltd., Geoterrex Ltd., Lockwood Survey Corporation Ltd. for the Geological Survey of Canada (GSC, 1975).
In 1977, geological mapping was initiated by T. Rivers of the Newfoundland Department of Mines and Energy within the Grenville Province covering the Wabush-Labrador City area. This work was part of the program of 1:50,000 scale mapping and reassessment of the mineral potential of the Labrador Trough by the Newfoundland Department of Mines and Energy. Mapping was continued by Rivers in western Labrador in 1978 to 1980. As part of an experimental geochemical exploration program in Labrador by LM&E in 1978, many of the lakes in the Labrador City area were sampled both for lake-bottom sediments and for lake-water (Stubbins, 1978). Lake sediment samples were sent to Barringer Research Ltd., Toronto, Ontario, for a multi-element analysis (Stubbins, 1978). Water samples were tested at Labrador City for acidity before being acidified for shipment. Some samples were also shipped to Barringer analysis and some were analysed in the Sept-Îles laboratory of IOCC. A sample portion was also sent to the Hibbing Minnesota laboratory of Learch Brothers for additional analysis (Stubbins, 1978). On Block No. 24 (part of the Property), only one site was sampled. The sediment assay results indicated the sample to be statistically ‘anomalous’ in phosphorous. None of the water samples were defined as anomalous (Stubbins, 1978). Stubbins (1978) concluded that the samples as a group are widely scattered and it is difficult
26
to draw any firm conclusion from the results. He added that further study might indicate that it is worthwhile to take more samples.
In 1979, a ground magnetometer survey was conducted on Block No. 24 (part of the Property). A total of four lines having a combined length of 3,500 m were surveyed on this block (Price, 1979). The standard interval between successive magnetometer readings was 20 m. Occasionally, over magnetically ‘quiet’ terrain, this interval was increased. Whenever an abrupt change in magnetic intensity was encountered, intermediate stations were surveyed. According to Price (1979), the magnetometer profiles and observations of rare outcrops confirm that oxide facies iron formation occurs on Block No. 24 (in the Mills No. 1 area of the Property). Also in 1979, one diamond drillhole was drilled by LM&E near the north end of Elfie Lake on the Property. The hole (No. 57-1) was drilled vertically to a depth of 28 m (Grant, 1979) and did not encounter the iron oxide facies of interest. In 1983, LM&E collared a 51 m deep (168 ft) diamond drillhole 137 m north of Elfie Lake (DDH No. 57-83-1). The drillhole encountered metamorphosed iron formation from 17 m to a depth of 51 m; of this, only 2 m was oxide facies. Core recovery was very poor (20%) (Avison et al., 1984).
In 1981 and 1982, an air photography and topographic mapping program was completed by IOCC to re-photograph the mining areas as part of its program to convert to the metric system. Two scales of photography (1:10,000 and 1:20,000) were flown and new topographic maps (1:2,000 scale) were made from these photos. The photography was extended to cover all the lease and licence blocks in the Labrador City area (Smith et al. 1981; Kelly and Stubbins, 1983).
A lake sediment and water reconnaissance survey was undertaken by the GSC, in conjunction with the Newfoundland Department of Mines and Energy, over about one-half (134,000 km2) of Labrador during the summers of 1977 and 1978. The survey was designed to provide the exploration industry with data on bedrock composition and to identify metaliferous areas as large scale prospecting targets (McConnell, 1984). Sampling continued in 1982 in south-western Labrador. Waters and sediments from lakes over an area of about 50,000 km2 were sampled at an average density of one sample per 13 km2. Lake sediment samples were analysed for U, Cu, Pb, Zn, Co, Ni, Ag, Mo, Mn, Fe, F, As, Hg and L.O.I. In addition, U, F and pH were determined on the water samples (Davenport and Butler, 1983).
During 1985, field work by C. McLachlan of LM&E was concentrated on the northern part of Block No. 24. A pace and compass grid was established near Molar Lake. Cross lines were put in at 152 m (500 ft) intervals. The grid was used to tie in the sample sites and a systematic radiometric survey was performed. There were four soil samples and six rock samples (one analysed) collected (Simpson et al., 1985). A possible source of dolomite as an
27
additive for the IOCC’s pellet plant was examined near Molar Lake. Simpson concluded from visual examination that the dolomite was high in silica.
In 2001, IOCC staked a considerable portion of the iron formation in the Labrador City area, with the Kamistiatusset area being in the southern extent of the company’s focus. Extensive geophysical testing was conducted over the area using airborne methods. The Kamistiatusset area and the area north of the Property was recommended as a high priority target by SRK Consulting Ltd. as part of the 2001 IOCC work report (GSNL open file LAB1369), however, no work was reported for the area.
In 2004, Altius Resources staked 20 claims comprising licence 10501M, and in the spring of 2006 staked another 38 claims to the north comprising licence 11927M.
28
7. GEOLOGICAL SETTING
7.1 REGIONAL GEOLOGY
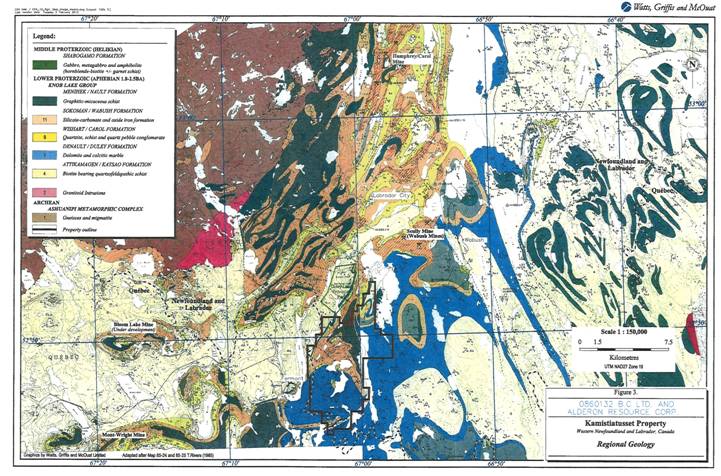
The Property is situated in the highly metamorphosed and deformed metasedimentary sequence Knob Lake Group of the Grenville Province, Gagnon terrane of the Labrador Trough (“Trough”), adjacent to and underlain by Archean basement gneiss (Grenville Front), (Figure 3).
The Trough, otherwise known as the Labrador-Québec Fold Belt, extends for more than 1,000 km along the eastern margin of the Superior Craton from Ungava Bay to Lake Pletipi, Québec. The belt is about 100 km wide in its central part and narrows considerably to the north and south.
The Trough is comprised of a sequence of Proterozoic sedimentary rocks, including iron formation, volcanic rocks and mafic intrusions. The southern part of the Trough is crossed by the Grenville Front representing a metamorphic fold-thrust belt in which Archean basement and Early Proterozoic platformal cover were thrust north-westwards across the southern portion of the southern margin of the North American Craton during the 1,000 Ma Grenvillian orogeny (Brown, Rivers, and Callon, 1992). Trough rocks in the Grenville Province are highly metamorphosed and complexly folded. Iron deposits in the Gagnon terrane, Grenville part of the Trough, include those on the Property and Lac Jeannine, Fire Lake, Mont-Wright, Mont-Reed, and Bloom Lake in the Manicouagan-Fermont area and the Luce, Humphrey and Scully deposits in the Wabush-Labrador City area. The high-grade metamorphism of the Grenville Province is responsible for recrystallization of both iron oxides and silica in primary iron formation, producing coarse-grained sugary quartz, magnetite, and specular hematite schist or gneiss (meta-taconites) that are of improved quality for concentration and processing.
North of the Grenville Front, the Trough rocks in the Churchill Province have been only subject to greenschist or sub-greenshist grade metamorphism and the principal iron formation unit is known as the Sokoman Formation. The Sokoman Formation is underlain by the Wishart Formation (quartzite), the Denault Formation (dolomite) and the Attikamagen Formation (shale). In the Grenville part of the Trough, where the Property is located, these same Proterozoic units can be identified, but are more metamorphosed and deformed. In the Grenville portion of the Trough, the Sokoman rocks are known as the Wabush Formation, the Wishart as the Carol Formation (Wabush area) or Wapusakatoo Formation (Gagnon area), the Denault as the Duley Formation and the Attikamagen as the Katsao Formation. In practice,
29

Figure 3. Regional Geology
30
both sets of nomenclature for the rock formations are often used. Altius has used the Menihek, Sokoman, Wishart, Denault, and Attikamagen nomenclature throughout their reports to name rock units on the Property, and WGM, to minimize confusion in this report, has elected to also use these same rock unit names but often gives reference to the other name. The regional stratigraphy is summarized in Table 5.
TABLE 5.
REGIONAL STRATIGRAPHIC COLUMN, WESTERN LABRADOR TROUGH
Description | | |
PROTEROZOIC – Helikian |
Shabogamo Group | | Gabbro, Diabase |
| | |
Intrusive Contact |
|
PROTEROZOIC – Aphebian |
|
| | |
Gagnon Group | | |
Nault Formation (Menihek Formation) | | Graphitic, chloritic and micaceous schist |
Wabush Formation (Sokoman iron formation) | | Quartz, magnetite-specularite-silicate-carbonate iron formation |
Carol Formation (Wishart Formation) | | Quartzite, quartz-muscovite-garnet schist |
Duley Formation (Denault Formation) | | Meta-dolomite and calcite marble |
Katsao Formation (Attikamagen Formation) | | Quartz-biotite-feldspar schist and gneiss |
Unconformity |
| | |
ARCHEAN |
Ashuanipi Complex | | Granitic and Granodioritic gneiss and mafic intrusives |
Note: The names in brackets provide reference to the equivalent units in the Churchill Province part of the Trough.
7.2 PROPERTY GEOLOGY
7.2.1 GENERAL
The most comprehensive mapping of this area was done by T. Rivers as part of his Labrador Trough mapping program of the mid-1980s. Several maps of the area were produced, with the most applicable to this area being Maps 85-25 and 85-24 (1:100,000) covering National Topographic System Sheet 23B/14. Figure 4, Property Geology, is based mainly on River’s work with modifications made by Altius through mapping and interpretation of the high resolution helicopter-borne magnetic survey completed in 2007. Lithological contacts have been further revised during Altius’ 2008 work program using information gathered from diamond drilling.
31
Figure 4. Property Geology

32
The Property is underlain by folded sequences of the Knob Lake Group containing Wabush/Sokoman Formation iron formation. The stratigraphic sequence varies in different parts of the Property. Altius’ exploration was focussed on three parts of the Property known as the Mills Lake, Rose Lake and the Mart Lake areas. On some parts of the Property, the Sokoman/Wabush is directly underlain by Denault/Duley Formation dolomite and the Wishart/Carol Formation quartzite is missing. In other places, both the dolomite and quartzite units are present.
Table 6 presents the lithological codes used by Altius for its drill core logging of 2008 program core.
TABLE 6.
ROCK/UNIT CODING FOR KAMI PROPERTY DRILL CORE LOGGING
Lithology Code | | Description | | Formal Unit Name |
OVB | | Overburden | | |
AMP | | Gabbro /metagabbro / amphibolite schist | | Shabogamo Intrusive Suite |
MSG | | Mica schist with graphite | | Menihek/Nault Formation |
MOIF | | Magnetite-rich oxide iron formation | | Sokoman/Wabush iron Formation |
SOIF | | Specularite-rich oxide iron formation | | Sokoman/Wabush iron Formation |
MSOIF | | Magnetite-specularite-rich oxide iron formation | | Sokoman/Wabush iron Formation |
SMOIF | | Specularite-magnetite-rich oxide iron formation | | Sokoman/Wabush iron Formation |
MGOIF | | Magnetite-rich oxide iron formation with grunerite | | Sokoman/Wabush iron Formation |
SIF | | Silicate iron formation | | Sokoman/Wabush iron Formation |
QRMS | | Quartzite - mica schist | | Wishart/Carol Formation |
QR | | Quartzite | | Wishart/Carol Formation |
Denault | | Calcite marble / dolomitic marble | | Denault/Duley Formation |
BMS | | Biotite - muscovite schist | | Attikamagen/Katsao Formation |
FZ | | Fault zone | | |
SZ | | Shear Zone | | |
Alteration Zone | | Alteration zone | | |
Notes: “M” in lithology codes for oxide iron formation (“OIF”) refers to magnetite; “S” for OIF refers to the presence of specularite. Accordingly MSOIF is nomenclature for Specularite-magnetite oxide iron formation.
Amphibolite dikes and sills cut through all other rock units and are a consideration as they may negatively impact the chemistry of iron concentrates made from mineralization containing these rocks that may be difficult to exclude during mining.
33
7.2.2 STRUCTURE
The structure of the project area is characterized by tight, west verging F1 folds and broad F2 folds, both of which are roughly north to northeast trending, with D1 and D2 thrusts which repeat the stratigraphy. The fold interference of the F1/F2 generations has produced a geometry that is similar to other structures in the district that host economic deposits, specifically, the doubly folded F1/F2 synforms. Significant shear zones were noted in drill core and interpreted on drill cross sections as thrust faults. Moreover, an interpretation of the magnetic survey data highlighted several discontinuities in lithology coinciding with interpreted faults.
34
8. DEPOSIT TYPES
The iron formation on the Property is iron formation of the Lake Superior-type. Lake Superior-type iron formation consists of banded sedimentary rocks composed principally of bands of iron oxides, magnetite and hematite within quartz (chert)-rich rock with variable amounts of silicate, carbonate and sulphide lithofacies. Such iron formations have been the principal sources of iron throughout the world (Gross, 1996). Table 7, after Eckstrand, editor (1984), presents the salient characteristics of the Lake Superior-type iron deposit model.
Lithofacies that are not highly metamorphosed or altered by weathering and are fine grained are referred to as taconite. The KéMag and LabMag deposits owned by New Millennium Capital Corp. located immediately north of Schefferville, Québec are magnetite-rich taconite containing lesser amounts of hematite. The deposits at Schefferville, which were mined by IOCC prior to the mine shutdown in 1982, are supergene residual deposits formed by the leaching of silica and the concentration of iron oxides from what was originally taconite (also called “protore”) resulting in high grade, “Direct Shipping” ores.
Strongly metamorphosed taconites are known as meta-taconite or itabirite (particularly if hematite-rich). The iron deposits in the Grenville part of the Labrador Trough in the vicinity of Wabush and Mont-Wright, operated by IOCC, QCM and Wabush Mines are meta-taconite. The Consolidated Thompson Bloom Lake iron deposit is also a meta-taconite. The iron formation on the Property is similarly Lake Superior-type meta-taconite.
For non-supergene-enriched iron formation to be mined economically, iron content must generally be 25% to 30%, but also the iron oxides must be amenable to concentration (beneficiation) and the concentrates produced must be low in deleterious elements such as silica, aluminium, phosphorus, manganese, sulphur and alkalis. For bulk mining, the silicate and carbonate lithofacies and other rock types interbedded within the iron formation must be sufficiently segregated from the iron oxides. Folding can be important for repeating iron formation and concentrating iron formation beds to create economic concentrations of iron.
35
TABLE 7.
DEPOSIT MODEL FOR LAKE SUPERIOR TYPE IRON FORMATION
AFTER ECKSTRAND (1984)
Commodities | | Fe (Mn) |
Examples:
Canadian - Foreign | | Knob Lake, Wabush Lake and Mont-Wright areas, Que. and Lab. - Mesabi Range, Minnesota; Marquette Range, Michigan; Minas Gerais area, Brazil. |
| | |
Importance | | Canada: the major source of iron.
World: the major source of iron. |
| | |
Typical Grade, Tonnage | | Up to billions of tonnes, at grades ranging from 15 to 45% Fe, averaging 30% Fe. |
| | |
Geological Setting | | Continental shelves and slopes possibly contemporaneous with offshore volcanic ridges. Principal development in middle Precambrian shelf sequences marginal to Archean cratons. |
| | |
Host Rocks or Mineralized Rocks | | Iron formations consist mainly of iron- and silica-rich beds; common varieties are taconite, itabirite, banded hematite quartzite, and jaspilite; composed of oxide, silicate and carbonate facies and may also include sulphide facies. Commonly intercalated with other shelf sediments: black |
| | |
Associated Rocks | | Bedded chert and chert breccia, dolomite, stromatolitic dolomite and chert, black shale, argillite, siltstone, quartzite, conglomerate, redbeds, tuff, lava, volcaniclastic rocks; metamorphic equivalents. |
| | |
Form of Deposit, Distribution of Ore Minerals | | Mineable deposits are sedimentary beds with cumulative thickness typically from 30 to 150 m and strike length of several kilometres. In many deposits, repetition of beds caused by isoclinal folding or thrust faulting has produced widths that are economically mineable. Ore mineral distribution is largely determined by primary sedimentary deposition. Granular and oolitic textures common. |
| | |
Minerals: Principal Ore Minerals - Associated Minerals | | Magnetite, hematite, goethite, pyrolusite, manganite, hollandite.
- Finely laminated chert, quartz, Fe-silicates, Fe-carbonates and Fe-sulphides; primary or. metamorphic derivatives |
| | |
Age, Host Rocks | | Precambrian, predominantly early Proterozoic (2.4 to 1.9 Ga). |
| | |
Age, Ore | | Syngenetic, same age as host rocks. In Canada, major deformation during Hudsonian and, in places, Grenvillian orogenies produced mineable thicknesses of iron formation. |
| | |
Genetic Model | | A preferred model invokes chemical, collodial and possibly biochemical precipitates of iron and silica in euxinic to oxidizing environments, derived from hydrothermal effusive sources related to fracture systems and offshore volcanic activity. Deposition may be distal from effusive centres and hot spring activity. Other models derive silica and iron from deeply weathered land masses, or by leaching from euxinic sediments. Sedimentary reworking of beds is common. The greater development of Lake Superior-type iron formation in early Proterozoic time has been considered by some to be related to increased atmospheric oxygen content, resulting from biological evolution. |
| | |
Ore Controls, Guides to Exploration | | 1. Distribution of iron formation is reasonably well known from aeromagnetic surveys. 2. Oxide facies is the most important, economically, of the iron formation facies. 3. Thick primary sections of iron formation are desirable. 4. Repetition of favourable beds by folding or faulting may be an essential factor in generating widths that are mineable (30 to 150 m). 5. Metamorphism increases grain size, improves metallurgical recovery. 6. Metamorphic mineral assemblages reflect the mineralogy of primary sedimentary facies. 7. Basin analysis and sedimentation modelling indicate controls for facies development, and help define location and distribution of different iron formation facies. |
| | |
Author | | G.A. Gross |
36
9. MINERALIZATION
Mineralization of economic interest on the Property is oxide facies iron formation. The oxide iron formation (“OIF”) consists mainly of semi-massive bands, or layers, and disseminations of magnetite and/or specular hematite (specularite) in recrystallized chert and interlayered with bands (beds) of chert with minor carbonate and iron silicates. Silicate iron formation (“SIF”) also is prevalent on the Property. SIF consists mainly of amphiboles and chert, often associated with carbonate and contains magnetite or specularite in minor amounts.
The oxide iron formation on the Property is mostly magnetite-rich. Some sub-members contain increased amounts of hematite (specularite). Several different stratigraphic columns have been used for interpreting and classifying the iron formation in the area. O’Leary et al., 1972 described a stratigraphy for the Scully Mine with five main members (Table 8). At Scully, ore is derived from Upper, Middle and Lower members and mainly is hematite. Upper member ore is preferred because it is lowest in manganese, which increases from Upper to Lower members.
TABLE 8.
STRATIGRAPHY OF MINERALIZATION AT THE SCULLY MINE
(after O’Leary et al., 1972
Member | | Thickness | | Description |
Upper Member | | 180 to 200 ft | | Quartz-specularite limonite with variable magnetite |
Middle Member | | 200 to 260 ft | | Specularite-quartz |
Middle Quartzite | | 40 to 60 ft | | Lean iron formation or quartzite |
Lower Member | | 180 to 260 ft | | Quartz-hematite with variable magnetite increasing towards base. |
Basal Silicate | | More than 70 ft | | Quartz-amphibole, biotite, chlorite and garnet |
The IOCC stratigraphic column for the Wabush Lake area contains three main divisions, with each of these further subdivided. Table 9 presents a summary of the main members.
TABLE 9.
STRATIGRAPHIC COLUMN WABUSH LAKE AREA
(modified after IOCC)
Name | | |
Upper Iron Formation (UIF) | | Quartz-grunerite-carbonate-magnetite |
Middle Iron Formation (MIF) | | Quartz-magnetite specularite |
Lower iron Formation (LIF) | | Quartz-carbonate grunerite (specularite and magnetite) |
The Middle member is the main unit of economic importance at IOCC’s Humphrey Mines – formerly known as the Carol deposits. The Middle member is the most important because it contains the most OIF and less SIF and carbonate.
37
For mapping, coding and interpreting the iron formation on the Property, Altius used a three sub-unit classification similar to that used by IOCC: Upper iron Formation (“UIF”), Middle Iron Formation (“MIF”) and Lower Iron Formation (“LIF”). Individual rock type or lithology codes (see Table 4) are based on ratio of magnetite and hematite with “M” in the prefix indicating magnetite and “S” specularite, example: SOIF = Specularite-rich oxide iron formation; MSOIF = Magnetite-Specularite-rich oxide iron formation. The UIF and the LIF members on the Property were found to be similar in composition and consisting of banded quartz-carbonate and iron-bearing-silicates, dominantly grunerite, with minor magnetite-rich bands and were mainly SIF. OIF is dominant in the MIF and consists of fine grained to medium grained, banded quartz-carbonate-magnetite-specularite and is mainly magnetite-rich with specularite-rich intervals. The specularite-rich intervals yielded increased manganese values which are attributed to the presence of minor rhodochrosite. The oxide iron formation overall averaged approximately 30% TFe with 30% magnetite as determined by Satmagan.
Altius’ work and drilling program was focussed in three main areas of the Property: Mills Lake, Rose Lake and Mart Lake as shown on Figure 5 and 6.
Mills Lake Area
This zone of mineralization was tested by six drillholes K-08-02, 03, 04, 05, 06, and 07 over a northwest trending strike length of 1.4 km. The two drillholes furthest to the southeast, K-08-04 and K-08-05, situated on the same cross section, failed to intersect mineralization and both terminated in a fault zone. The other four holes were successful in intersecting a significant zone of OIF interpreted as the MIF. The total strike length of the zone of mineralization tested was approximately 1 km. The total strike length of this zone on the Property may be 4.3 km based on gravity and magnetic survey results from ground and airborne surveys. The iron formation is interpreted to be situated within a north-northwest trending, upright, gently south plunging, west verging syncline. The drillholes started in silicate iron formation, interpreted to be UIF, crossed through a wide zone of OIF, interpreted to be in the MIF and then ended in a lower unit of silicate iron formation (“LIF”) underlain by dolomite (Denault/Duley Formation). No intervening quartzite was found between the dolomite and iron formation. The true thickness of the oxide iron formation was found to vary from approximately 100 m in the southern drillholes to 40 m in the northernmost hole (K-08-07).
Figure 7 is a cross section through the Mills zone containing drillholes K-08-02 and K-08-03. The OIF unit has a true width of approximately 70 m and is bounded in both drillholes by short intervals of SIF. The OIF unit is mainly magnetite, but contains a unit logged as SOIF that is dominantly specularite. This hematite dominate sub-unit, depending on how it is defined, is up to 10 m to 15 m wide. Altius’ drill core logging is validated by sample analyses
38

Figure 5. Ground Magnetic Survey with 2008 Drillhole Locations

39
Figure 6. Plan map showing drillholes
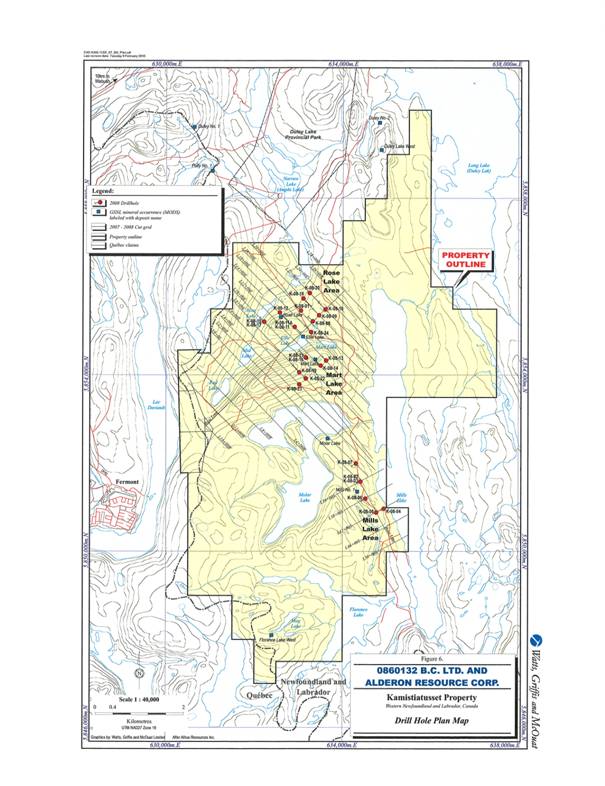
40
Figure 7. Mills Lake Area Cross Section K-08-02 and K-08-03
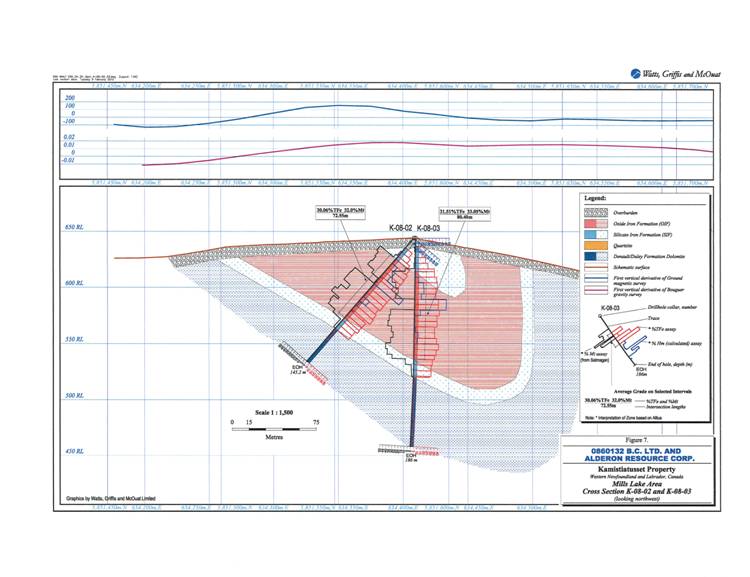
41
results that indicate that most of the iron in this band is in the form of hematite. The sample analyses also show that although the SIF units report 15% to 20% TFe, they contain only minor magnetite and practically no hematite. The OIF interval in K-08-02 averaged 30.06% TFe (32.0% Mt) over an intersection length of 72.55 m. In drillhole K-08-03, a similar zone was intersected averaging 31.51% TFe (33.05% Mt) over an intersection length of 80.40 m. Considerable sampling was completed in the dolomite (Denault/Duley) unit in drillhole K-08-03 in consideration of the potential value of this material for flux in an iron pellet plant. There is a narrow intersection of amphibolites in drillhole K-08-02 that has not been correlated with units in K-08-03. These amphibolites may not be concordant with iron formation/sedimentary stratigraphy.
Rose Lake and Mart Lake Areas
The Rose and Mart Lake iron occurrences consist of a repetitive series of NE-SW trending, gently plunging, upright to slightly overturned anticlines and synclines in the hinge of a broad anticline. Oxide iron formation thicknesses and continuity of mineralization are much better developed in the Rose Lake area, as compared to the Mart Lake area.
The Mart Lake area was tested by seven drillholes in 2008, K-08-13, 14, 16, 19, 21, 22 and 23, over a northeast-southwest strike length of approximately 1 km and an area 400 m to 500 m wide. Airborne magnetic survey results indicate the structure could have a potential strike length of 3.4 km. The stratigraphic sequence in this area consists of a thick upper SIF sequence, succeeded by a unit of OIF, followed by a lower SIF sequence, followed by quartzite (Wishart/Carol) underlain by dolomite (Denault/Duley). The OIF varies in width from approximately 10 m to a maximum true width of 50 m (in the hinge of a northeast trending fold), but is interpreted to generally be approximately 15 m to 25 m true thickness. Seymour et al., 2009 suggest that either the OIF in this area is highly attenuated or has been eroded due to uplift. WGM suggests primary sub-basin geometry is likely the control on thickness. The SIF consisted of abundant quartz-carbonate-grunerite with locally abundant fine grained magnetite. Locally narrow iron oxide-rich horizons occurred within the SIF and are interpreted as either narrow horizons within the SIF or MIF that has been refolded into the SIF. The minor OIF horizons within the SIF sequence consisted generally of fine to medium grained quartz —carbonate-magnetite ± grunerite, with lesser specularite.
The drill core samples from the main OIF sequence, MIF, returned grades that ranged generally from 25% to 35% TFe, with the majority of this iron as magnetite (27% to 45% magnetite from Satmagan).
The Rose Lake occurrence on extension approximately 700 m north of the Mart Lake occurrence, consists of a series of northeast-southwest trending upright anticlines and
42
synclines with an apparent strike length potential indicated by airborne magnetics of up to 4.5 km on the Property. There are two main iron formation anticline hinges. Thirteen drillholes, K-08-01, 08, 09, 10, 11 (abandoned), 11a, 12, 15, 17, 18, 20 tested the Rose Lake area over a east-west strike length of 1.4 km by 600 m to 800 m wide. True widths of OIF zones range from 60 m to over 300 m in the hinges of synforms.
The structure in parts of the Rose Lake area may be more complex than in the two other areas. At Rose Lake, the uppermost rock unit intersected in the drillholes was coded as graphitic metasediments. This presumably represents Menihek Formation rocks. This was succeeded by a SIF sequence, followed by the main OIF zone, presumably MIF. On some sections, the SIF sequence consists of an alternating sequence of SIF and graphitic/micaceous metasediments. The OIF unit on some sections also contains a number of interbands of SIF. On one section containing drillholes K-08-15 and K-08-17, the OIF is succeeded by another unit of graphitic metasediments. Generally, the OIF sequence is followed by a narrow unit of SIF which is succeeded by quartzite. The gross structure, Menihek to SIF to OIF to SIF to quartzite, is stratigraphically correct, but the multiple horizons of graphitic/micaceous metasediments alternating with SIF and OIF units possibly indicate a more complex structure.
Figure 8 containing drillholes K-08-09 and K-08-18 is a cross section through the Rose Lake area at the northeast end of the mineralized zone. These holes tested the southeast and northwest limbs of the south eastern antiform. In comparison to the Mills Lake area, the Rose Lake area appears to contain more widely distributed hematite. In both K-08-09 and K-08-18, towards the lower contact of the main OIF sequence, adjacent to quartzite and basal argillaceous/micaceous schist there is a sub-unit that consists mainly of hematite and only very minor accessory magnetite. Narrow SIF units within the main OIF sequence were logged in both drillholes, but assays indicate that these rocks logged as SIF contain appreciable magnetite and therefore perhaps should be more correctly coded as OIF. The main OIF unit in drillhole K-08-09 averaged 29.69% TFe (24.9% Mt) over an intersection length of 69.5 m. This appears to be close to true width. The OIF unit in drillhole K-08-18 was cut by a fault from which much of the iron was leached. The OIF above the fault returned 31.30% TFe (26.6% Mt) over an intersection length of 127.55 m. Below the fault, the OIF averaged 30.11% TFe (10.8% Mt). The magnetite grade for this deeper composite is low because much of this composite is specularite oxide iron formation (SOIF) containing only minor magnetite. True width of the entire OIF sequence in this area near the synform hinge is approximately 240 m.
Figure 9 is another drill cross section through the Rose Lake area approximately 600 m southwest of the K-08-09/K-08-18 (Figure 8) cross section. Two drillholes K-08-12 and K-08-11A perhaps tested the same stratigraphy as shown on Figure 8. Drillhole K-08-11A
43
Figure 8. Rose Lake Area Cross Section K-08-09 and K-08-18

44
intersected a series of relatively narrow OIF units interbanded with argillaceous/micaceous schist and SIF units and near its end another unit of graphitic metasediments. Most of the OIF was magnetite-rich and hematite-poor. As interpreted by Altius, the hole was not drilled perpendicular to the dip. One sample assay composite average for drillhole K-08-11A is shown on Figure 9. This interval averaging 22.81% TFe, (23.8% Mt) over an intersection length of 68.40 m includes an interval of SIF containing minimal magnetite. True width of the composite OIF sequence may be over 170 m. Drillhole K-08-12 intersected, near its collar, a narrow interval of OIF followed by argillaceous/micaceous schist and then the main OIF unit over a 281.17 m intersection length. Sample assays averaged 30.25% TFe (26.3% Mt). This interval also included several intervals coded as SIF, but some of these contained appreciable magnetite. The hole ended in OIF but should have been extended deeper. WGM understands that the drill had reached its maximum depth capacity but the casing was left in and capped so the drillhole can probably be extended if required. Altius has interpreted that the lower unit of graphitic metasediments intersected in drillhole K-08-11A is also below the end of drillhole K-08-12 and this unit is then followed by quartzite. WGM is not certain this interpretation is correct and whether the graphitic metasediments are Menihek/Nault or Attimagen/Katsao formation.
The entire dominantly OIF zone appears to have a true thickness over 300 m. Drillhole K-08-12 is interpreted also to have intersected the zone close to a synform’s hinge, so this true thickness of mineralization is greater than thickness on the fold limbs. There is one zone in the drillhole approximately 50 m thick, in the upper part of the OIF unit that is dominantly hematite with minimal magnetite. Altius logged these rocks as SOIF which is validated by the estimate of hematite from the assay data.
Rhodochrosite as reported in the drill logs was present within the MIF in most of the drillholes in both the Rose Lake and Mills Lake areas. Metamorphosed and deformed Shabogamo Formation amphibolite dikes are also present, predominantly within the Menihek Formation.
Table 10 provides a listing of the average sample assays by rock type. Figures 10 to 13 provide further detail for the distribution of TFe, magnetic iron, hematite and Mn in samples coded as OIF. In Table 10, the estimate of %hematite (%Hm) has been made by subtracting iron in magnetite (determined from Satmagan) and the iron from the FeO analysis in excess of what can be attributed to the iron in the magnetite from %TFe, and then restating this excess iron as hematite, or:
% of Fe in Hm = %TFe - (Fe+++ (computed from Satmagan) + Fe++ (computed from FeO))
45
Figure 9. Rose Lake Area Cross Section K-08-11A and K-08-12
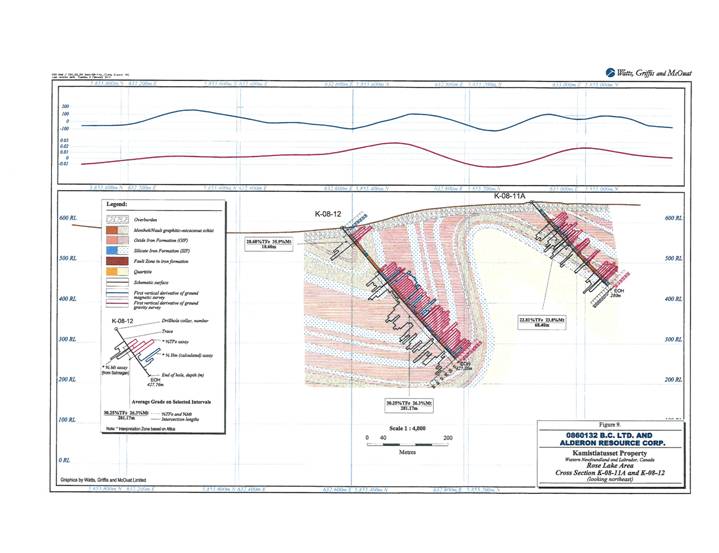
46

TABLE 10.
AVERAGE COMPOSITION OF ROCK UNITS FROM ALTIUS 2008 DRILL CORE SAMPLE ASSAYS
Lith_Code | | AMP | | Amp or
MSG | | MSG | | MGOIF | | MOIF | | SMOIF | | SOIF | | MSOIF | | OIF
Summary | | SIF | | QR | | QRMS | | Denault | | BMS | |
CountOf TFe | | 17 | | 1 | | 31 | | 30 | | 122 | | 30 | | 44 | | 121 | | 347 | | 181 | | 1 | | 3 | | 16 | | 3 | |
Avg of %TFe | | 14.05 | | 22.11 | | 6.68 | | 27.23 | | 30.73 | | 31.12 | | 31.72 | | 30.96 | | 30.67 | | 23.44 | | 3.72 | | 4.91 | | 2.29 | | 7.28 | |
Avg of %MagFe | | 3.0 | | 8.2 | | 0.6 | | 18.1 | | 27.2 | | 14.0 | | 3.8 | | 24.4 | | 21.32 | | 8.8 | | 0.6 | | 0.6 | | 0.3 | | 0.5 | |
Avg of %Fe3O4 | | 4.1 | | 11.4 | | 0.8 | | 25.0 | | 37.5 | | 19.3 | | 5.2 | | 33.8 | | 29.5 | | 12.1 | | 0.8 | | 0.9 | | 0.4 | | 0.7 | |
Avg of %Hm | | 2.6 | | 0.1 | | 0.7 | | 1.3 | | 2.2 | | 24.0 | | 39.0 | | 8.4 | | 10.84 | | 0.5 | | 0.6 | | 0.9 | | 0.0 | | 1.2 | |
Avg of %FeOther | | 71.6 | | 62.2 | | 84.4 | | 34.6 | | 9.0 | | 1.5 | | 2.2 | | 3.1 | | 7.66 | | 65.7 | | 72.7 | | 78.8 | | 100 | | 81.4 | |
Avg of FeO | | 13.63 | | 21.23 | | 7.54 | | 18.88 | | 15.21 | | 6.50 | | 2.29 | | 11.93 | | 11.96 | | 22.63 | | 3.73 | | 5.00 | | 3.45 | | 7.84 | |
Avg of SiO2 | | 50.74 | | 50.30 | | 59.61 | | 48.45 | | 44.57 | | 44.25 | | 41.46 | | 44.32 | | 44.40 | | 48.98 | | 85.10 | | 63.80 | | 22.26 | | 66.03 | |
Avg of Al2O3 | | 9.71 | | 3.97 | | 11.47 | | 0.71 | | 0.22 | | 0.10 | | 0.13 | | 0.18 | | 0.23 | | 0.74 | | 0.54 | | 9.76 | | 3.09 | | 6.95 | |
Avg of MgO | | 4.38 | | 3.56 | | 3.33 | | 2.87 | | 2.42 | | 1.70 | | 2.01 | | 2.16 | | 2.25 | | 3.97 | | 1.45 | | 3.20 | | 13.41 | | 3.46 | |
Avg of CaO | | 4.29 | | 4.53 | | 3.09 | | 3.65 | | 3.50 | | 3.14 | | 2.51 | | 3.37 | | 3.31 | | 4.90 | | 2.57 | | 3.83 | | 22.95 | | 3.61 | |
Avg of Na2O | | 1.09 | | 0.20 | | 1.02 | | 0.07 | | 0.08 | | 0.03 | | 0.26 | | 0.05 | | 0.09 | | 0.09 | | 0.01 | | 0.13 | | 0.16 | | 0.07 | |
Avg of K2O | | 1.37 | | 0.84 | | 2.89 | | 0.11 | | 0.04 | | 0.02 | | 0.04 | | 0.04 | | 0.04 | | 0.14 | | 0.23 | | 4.90 | | 1.38 | | 2.58 | |
Avg of TiO2 | | 1.30 | | 0.15 | | 0.58 | | 0.07 | | 0.02 | | 0.01 | | 0.01 | | 0.02 | | 0.02 | | 0.08 | | 0.08 | | 0.37 | | 0.11 | | 0.21 | |
Avg of P | | 0.151 | | 0.031 | | 0.087 | | 0.020 | | 0.015 | | 0.013 | | 0.010 | | 0.016 | | 0.02 | | 0.025 | | 0.022 | | 0.067 | | 0.030 | | 0.064 | |
Avg of Mn | | 0.267 | | 0.488 | | 0.172 | | 0.936 | | 0.846 | | 1.467 | | 3.017 | | 1.111 | | 1.28 | | 0.850 | | 0.163 | | 0.170 | | 0.130 | | 0.369 | |
Avg of Cr2O3 | | 0.035 | | 0.020 | | 0.036 | | 0.017 | | 0.015 | | 0.014 | | 0.014 | | 0.015 | | 0.01 | | 0.016 | | 0.060 | | 0.033 | | 0.012 | | 0.030 | |
Avg of V2O5 | | 0.039 | | 0.010 | | 0.045 | | 0.007 | | 0.006 | | 0.006 | | 0.006 | | 0.006 | | 0.01 | | 0.008 | | 0.005 | | 0.012 | | 0.005 | | 0.008 | |
Avg of LOI | | 5.51 | | 3.17 | | 6.60 | | 3.92 | | 3.86 | | 4.24 | | 3.76 | | 3.81 | | 3.87 | | 6.00 | | 3.35 | | 5.15 | | 32.40 | | 4.83 | |
Avg of Sum | | 99.24 | | 99.10 | | 98.63 | | 100.06 | | 99.77 | | 99.89 | | 99.45 | | 99.68 | | 99.73 | | 99.58 | | 99.00 | | 98.50 | | 99.26 | | 98.77 | |
Notes: | A number of samples (13) have been excluded from this calculation of average values. The samples excluded were logged as Fault Zone or a combination of fault zone and one of the other lithology codes. Assay values below detection limit have been adjusted to 0.5 x DL before averages calculated; Most Denault samples do not have Satmagan or FeO determinations. Fourteen samples of OIF were also analysed for sulphur based on presence of sulphide in drill core. Values ranged up to 4.03% but most samples reported less than 1 %.SOIF Avg lists average values for units coded as: MGOIF (magnetite-grunerite oxide iron formation), MSOIF (magnetite-specularite oxide iron formation), MOIF (magnetite oxide iron formation), SMOIF (specularite-magnetite oxide iron formation), and SOIF (specularite oxide iron formation). Hm (hematite) estimated using TFe, Satmagan and FeO as described in text of report and estimate is based on certain assumptions; Avg of %FeOther is the percentage of TFe that is estimated to not be in either Mt or Hm. This Fe would generally be in silicates, carbonates or sulphides. |
47

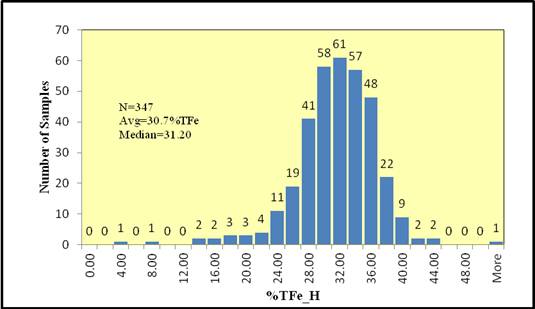
Figure 10. Histogram for %TFe in Altius drill core samples
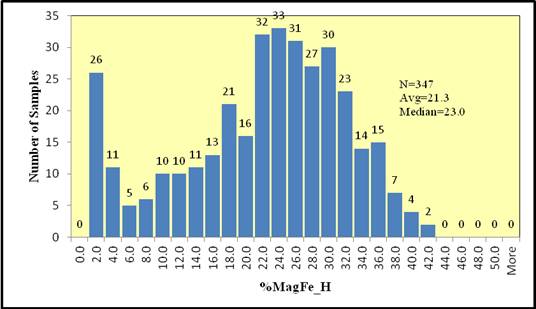
Figure 11. Histogram for %Magnetic Fe in Altius drill core samples
48

Figure 12. Histogram for %Hematite (calculated) in Altius drill core samples
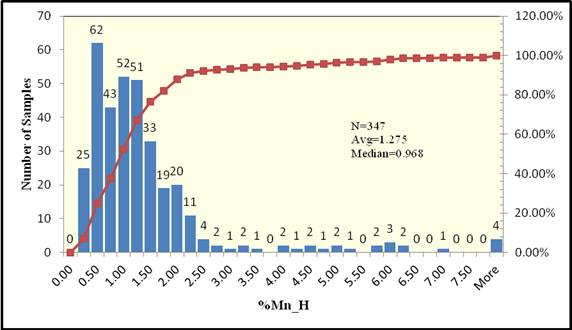
Figure 13. Histogram and cumulative frequency for %Mn in Altius drill core samples
49
The “%Fe_other” is the percentage of iron in the sample, indicated by the FeO results, that is in excess of what can be accommodated by the magnetite as determined from Satmagan results. It is considered to be the percentage of TFe that is in silicates or carbonates or sulphides.
For a few samples in the Altius drill core sample set, the iron components, (Fe+++ and Fe++) sum greater than TFe, so some amount of error in the method is indicated. Altius drill core sample 2044 is an example where magnetite determined by Satmagan, at 42%, is too high for the TFe reported at 20.7%. Also for several samples, the FeO values are too high for the TFe assays. Sample 2084 is a example of this problem. The method of estimation for %Hm and %Fe_other assumes that the iron silicates only contain Fe2+ and no Fe3+, and also that no other iron oxide species such as maghemite are present. This method also assumes that Satmagan results are reporting only magnetite and no magnetic sulphides.
Phosphorus content of OIF samples from the Property average 0.02%. Mn in OIF overall, averages 1.28%. The highest average manganese is in the hematite-rich unit SOIF, that averages just over 3% Mn. Overall in OIF, as indicated by the cumulative frequency curve, approximately 80% of all samples assayed less than 1.5% Mn. The concentration of manganese in hematite-rich rocks is an element of concern in the concentrates produced and will require careful consideration in inclusion in the reserves or in operation of the mine to control the manganese in the ore supply to the concentrator. If this rock type becomes a major portion of the reserves it will be a major concern. Any ore produced from the project will, of course, have a composition that is a blend of OIF material and of other rock types including SIF, amphibolites, BMS, MSG and QR that are not excluded during mining. In particular, the Shabogamo AMP unit rocks are high in titanium (TiO2) and alumina (Al2O3), which must be limited in concentrates
As indicated in Table 10 and on Figure 10, the OIF drilled on the Property in the Mills, Mart and Rose Lake areas from drillhole assays averages 30.7% TFe and 29.5% magnetite. Approximately 69% of the iron in the OIF is in magnetite, and about 24% of it is estimated to be in hematite. Logging of hematite-rich units by Altius geologists is shown by the assays to generally to be accurate. The highest percentages of estimated hematite are contained in the units SOIF and SMOIF. Approximately 7% of TFe is calculated to be in silicates, carbonates or sulphides. Silica in OIF samples averages 44.4%.
Morris Magnetics Inc. (“Morris”) of Wellandport, Ontario performed bulk density determination on 29 outcrop samples collected as part of Altius’ 2007 program and results are reported by Seymour, Churchill, Winter and O’Driscoll, 2009 - Appendix 3. This data was collected to support geophysical interpretation for the Property and is of limited value for
50
Mineral Resource estimation purposes. Bulk density measurements were also completed on selected drill core samples, 300 in total, as a component of the geotechnical drill core logging during Altius’ 2008 drilling program. These measurements were presumably done in the field by Altius’ field geotechnical crew, but details on approach and method are lacking. From details available, the measurements were completed by weighing samples, comprising a mixture of whole and split core samples, in water and weighing in air. The drill core samples were 0.2 to 0.4 m in length, so the samples do not closely match samples sent for WR assay, but do include a variety of rock types. Results for these measurements are contained in Seymour, Churchill, Winter and O’Driscoll, 2009 - Appendix 6.
One hundred and eighty-three of these bulk density samples appear to have been taken from assay-sample intervals. The remainder of the 300 were presumably from waste lithologies not sampled for assay. Figure 14 is a plot of bulk density vs. %TFe from regular sample assay for 103 of the bulk density samples taken from intervals of OIF and 63 taken from routine sample assay intervals classified as SIF. Evidently, either the bulk density methodology was insufficient or mineralization within assay sample intervals is too heterogeneous for assays and density readings to correlate. The results for the non-iron formation lithologies may be more meaningful and should be compiled by rock type.
Figure 15 is a plot of specific gravity (“SG”) determined by helium comparison pycnometer versus %TFe in Heads for samples that were collected by WGM from drill core during its site visit to the Property. These results, as expected, show SG or density correlates well with %TFe in Heads and results are similar to results for other properties and iron deposits that WGM is familiar with. The SG for the Head sample for the metallurgical testwork described in the section: Mineral Processing and Metallurgical Testing also fits well with the data provided on Figure 15.
Both SG and bulk density determination using entire samples was requested by WGM for its independent samples, but through an oversight, only SG by pycnometer results was reported. WGM recommends that BCL for its next program collect bulk density on entire assay samples and SG pycnometer data on the same samples for a selected set of samples throughout the Property. The samples selected should include all representative rock types.
51
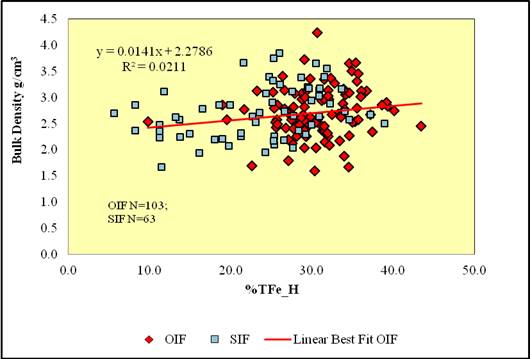
Figure 14. Bulk Density determined by Altius in the field vs. %TFe_H assays for routine samples
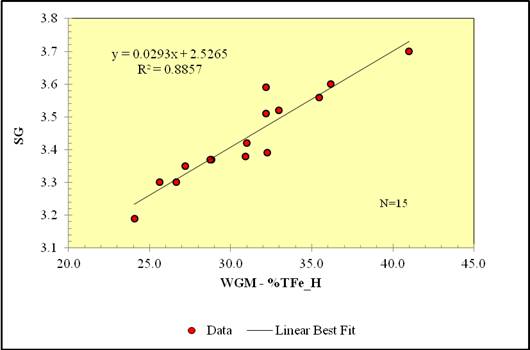
Figure 15. SG vs. %TFe_H for WGM Independent Samples
52
10. EXPLORATION
BCL has completed no exploration on the Property.
Reconnaissance mapping and rock sampling commenced during the summer of 2006 and was completed during the 2007 field season. Ten 2006 samples of outcrop and boulders were assayed at SGS-Lakefield for major elements. Grab samples yielded iron values typical of oxide facies iron formation. Further outcrop sampling was completed during the 2008 program. A total of 63 rock samples were collected, 29 of which were collected for chemical analysis while the remaining were collected for physical properties testing. The 2007 samples were sent to Activation Laboratories in Ancaster Ontario and assayed for major elements, FeO, and total sulphur. Nine rock samples from the Mills Lake area returned Fe values ranging from 9.7% Fe to 43.6% Fe and manganese values ranging from 0.43% Mn to 13.87% Mn. From the Molar Lake area five rock samples were collected yielding 13.7% Fe to 23.6% Fe and 0.1% to 0.69% Mn. From the Elfie Lake area two grab samples were collected that respectively returned assay results of 25.9% Fe and 0.95% Mn and 17.9% Fe and 1.07% Mn. From the Mart Lake area one sample was collected that yielded 16.3% Fe and 0.15% Mn. From the Rose Lake area a few outcrops over a strike length of approximately 430 m were grab sampled. Values ranged from 5.6% Fe with 9.73% Mn from a sample near the iron formation — Wishart Formation contact to 29.7% Fe with 1.05% Mn from a magnetite-specularite sample of iron formation.
Altius’ 2007 exploration program also included a high resolution helicopter airborne magnetic survey carried out by McPhar Geosurveys Ltd. and linecutting. The purpose of the airborne survey was to acquire high resolution magnetic data to map the magnetic anomalies and geophysical characteristics of the geology. The survey covered one block. Flight lines were oriented northwest-southeast at a spacing of 100 m. Tie-lines were oriented northeast-southwest at a spacing of 1,000 m. A total of 905 line km of data were acquired. Data acquisition utilized precision differential GPS positioning. The rock samples collected from the Property and sent for physical properties testing were to support interpretation of the airborne magnetic survey.
The results of the 2007 program were positive with rock samples returning favourable iron values and the airborne magnetic survey effectively highlighted the extent of the iron formation. Following the 2007 exploration program licences 013935M, 013937M, 010501M, 011927M, 012853M and 012854M were grouped to form licence 15037M and licenses 14957M, 14962M, 14967M and 14968M were staked.
53
The 2008 exploration program on the Property consisted of physical properties testing of the rock samples collected in 2007, linecutting, a ground gravity and magnetic survey carried out by Geosig of Saint Foy, Quebec, a high resolution satellite imagery survey (Quickbird), an integrated 3D geological and geophysical inversion model and 6,129.49 m of diamond drilling in 25 holes. The drilling program was designed to test three known iron ore occurrences on the property namely Mills Lake, Mart Lake and Rose Lake that were targeted through geological mapping and geophysics.
The ground gravity and total field magnetic survey were conducted along 69.8 km of cut grid lines spaced from 200 m to 400 m apart oriented northwest-southeast. Gravity surveying and high resolution positional data were collected at 25 m intervals. The magnetic survey stations were spaced at 12.5 m along the lines.
Mira Geoscence (“Mira”) was contracted to create a 3D geological and geophysical inversion model of the Property. Mira was provided with the geological cross sections, airborne and ground geophysics data and the physical rock properties from each of the different lithologies. The 3D geological and geophysical model was completed to help with target definition and drillhole planning.
Drilling confirmed the presence of iron oxide-rich iron formation at the three iron occurrences and was successful in extending the occurrences along strike and depth. Drilling was also fundamental in testing stratigraphy and structure to help refine the geological and structural models for each area which will aid in targeting and in positioning future drillholes.
54
11. DRILLING
11.1 HISTORIC DRILLING
In 1957, IOCC re-mapped an area of 86.2 km2 to the west of Duley Lake on a scale of 1”= 1,000 ft and test drilled shallow holes throughout the area through overburden cover to determine areas underlain by iron formation. Dip needle surveying served as a guide for determining the locations of iron formation in drift-covered areas.
According to Hird (1960), 272 holes aggregating a total of 7,985 m (26,200 ft) were drilled during IOCC’s 1957 program. Approximately 66 of these holes were located on the Property. Mathieson (1957) reported that there were no new deposits found as a result of the drilling, however, definite limits were established for the iron formation outcrops found during previous geological mapping.
In 1979, one diamond drill hole was drilled by LM&E near the north end of Elfie Lake. The hole (No. 57-1) was drilled vertically to a depth of 28 m (Grant, 1979) and did not encounter oxide iron formation. In 1983, as reported by Avison et al., 1984, LM&E collared a 51 m deep (168 ft) diamond drill hole 137 m north of Elfie lake (DDH No. 57-83-1). The hole encountered iron formation from 17 m to a depth of 51 m. Of this however, only 2 m was oxide facies. Core recovery was very poor, (20%).
11.2 ALTIUS 2008 DRILLING PROGRAM
11.2.1 GENERAL
Altius’ 2008 drilling program consisted of 27 holes totalling 6,129.5 m (two abandoned holes which were re-drilled) testing the three main iron occurrences. Assay results of the drilling, orientation of mineralization and estimated true widths are discussed under Mineralization Item 9. From south to north these three occurrences are the Mills Lake, Mart Lake and Rose Lake occurrences (see Figure 4). Drillhole locations and collar information are given in Table 11. Drilling was carried out between June and October by Lantech Drilling Services of Dieppe, New Brunswick using a Marooka mounted JKS300 drill rig. A second, larger drill rig was added to the program in September to help complete the program before freeze-up. The second rig was a skid mounted LDS1000 towed by a Caterpillar D6H dozer. Both drills were equipped for drilling BTW sized core. Drilling took place on a two shifts per day basis, 20 hours per day, 7 days per week. The remaining four hours was taken up with travel to and from the drill site and shift change.
55
TABLE 11.
DRILLING SUMMARY — ALTIUS 2008 PROGRAM
Hole_ID | | Easting | | Northing | | Elevation | | Azimuth | | Dip | | Depth(m) | | Start Date | | Finish Date | |
K-08-01 | | 633056 | | 5855455 | | 620 | | 315 | | -45 | | 273.30 | | 6-Jun-08 | | 16-Jun-08 | |
K-08-02 | | 634408 | | 5851586 | | 644 | | 240 | | -50 | | 145.20 | | 19-Jun-08 | | 25-Jun-08 | |
K-08-03 | | 634409 | | 5851587 | | 644 | | | | -90 | | 186.00 | | 24-Jun-08 | | 28-Jun-08 | |
K-08-04 | | 634942 | | 5850971 | | 586 | | 240 | | -50 | | 98.00 | | 30-Jun-08 | | 4-Jul-08 | |
K-08-05 | | 634770 | | 5850885 | | 599 | | 0 | | -90 | | 57.00 | | 5-Jul-08 | | 7-Jul-08 | |
K-08-06 | | 634522 | | 5851199 | | 633 | | 240 | | -50 | | 170.00 | | 8-Jul-08 | | 11-Jul-08 | |
K-08-07 | | 634307 | | 5851997 | | 625 | | 240 | | -50 | | 178.00 | | 12-Jul-08 | | 18-Jul-08 | |
K-08-08 | | 633326 | | 5855213 | | 635 | | 315 | | -50 | | 239.00 | | 20-Jul-08 | | 28-Jul-08 | |
K-08-09 | | 633468 | | 5855350 | | 635 | | 315 | | -50 | | 316.00 | | 28-Jul-08 | | 2-Aug-08 | |
K-08-10 | | 633612 | | 5855485 | | 640 | | 315 | | -50 | | 316.00 | | 2-Aug-08 | | 10-Aug-08 | |
K-08-11 | | 632914 | | 5855087 | | 650 | | 135 | | -50 | | 38.43 | | 11-Aug-08 | | 12-Aug-08 | |
K-08-11A | | 632914 | | 5855087 | | 650 | | 135 | | -50 | | 280.00 | | 12-Aug-08 | | 23-Aug-08 | |
K-08-12 | | 632576 | | 5855411 | | 585 | | 135 | | -50 | | 427.76 | | 28-Aug-08 | | 10-Sep-08 | |
K-08-13 | | 633628 | | 5854327 | | 690 | | 315 | | -50 | | 192.45 | | 4-Sep-08 | | 8-Sep-08 | |
K-08-14 | | 633505 | | 5854210 | | 685 | | 315 | | -50 | | 280.82 | | 8-Sep-08 | | 15-Sep-08 | |
K-08-15 | | 632219 | | 5855206 | | 574 | | 135 | | -50 | | 316.00 | | 10-Sep-08 | | 17-Sep-08 | |
K-08-16 | | 633174 | | 5854389 | | 682 | | 315 | | -90 | | 351.03 | | 16-Sep-08 | | 25-Sep-08 | |
K-08-17 | | 632222 | | 5855203 | | 575 | | 315 | | -50 | | 208.00 | | 16-Sep-08 | | 21-Sep-08 | |
K-08-18 | | 633112 | | 5855730 | | 590 | | 135 | | -50 | | 386.00 | | 22-Sep-08 | | 30-Sep-08 | |
K-08-19 | | 633020 | | 5854060 | | 685 | | 315 | | -50 | | 334.00 | | 24-Sep-08 | | 4-Oct-08 | |
K-08-20 | | 633256 | | 5855853 | | 610 | | 135 | | -50 | | 441.00 | | 30-Sep-08 | | 9-Oct-08 | |
K-08-21 | | 633165 | | 5854400 | | 682 | | 315 | | -50 | | 331.00 | | 4-Oct-08 | | 11-Oct-08 | |
K-08-22 | | 633169 | | 5853919 | | 662 | | 315 | | -50 | | 75.00 | | 11-Oct-08 | | 15-Oct-08 | |
K-08-23 | | 633020 | | 5853784 | | 644 | | 315 | | -50 | | 64.00 | | 15-Oct-08 | | 17-Oct-08 | |
K-08-24 | | 633287 | | 5854969 | | 661 | | 315 | | -50 | | 305.00 | | 1-Oct-18 | | 24-Oct-08 | |
Total 25 drillholes | | 6,009 | m | | | | |
Notes: | | Coordinates are NAD 27 Zone 19N.
Collar elevations are approximate.
List excludes two drillholes that were abandoned at shallow depth; Total contract drilling was 27 drillholes aggregating 6,129.5 m. |
11.2.2 DRILL HOLE COLLARS AND DOWN-HOLE SURVEYING
Drillhole collars were spotted prior to drilling by chaining in the locations from the closest grid line picket. Drilling azimuths were established by lining up the drill by sight on the cut grid lines. Drill inclinations were established using a compass on the drill head.
Once a drillhole was finished, the drill geologist placed a fluorescent orange picket next to the collar labelled with the collar information on an aluminum tag. The X, Y and Z co-ordinates for these collar markers were surveyed using hand-held GPS. Generally, casing has been left in the ground where holes were successful in reaching bedrock.
Down hole surveys were systematically performed by the driller every 50 m using a Flexit instrument. Azimuth, inclination and magnetic field data were recorded by the driller in a survey book kept at the drill. A copy of the page is taken from the book, placed in a plastic zip lock bag and placed in the core box and the test was recorded by the geologist.
56
11.3 WGM COMMENT ON 2008 DRILLING
Altius’ drilling program appears to have been well run. Drillhole collars were surveyed using hand-held GPS. Altius states the accuracy of the instrument was ±5 m. WGM believes that this is an overstatement. Certainly elevation accuracy is much poorer than ±5 m. In WGM’s opinion, collars should have been resurveyed using differential GPS after drill dismount or after the program was completed. WGM suggests that topographic elevations from the gravity survey could have been used to determine collar elevations. Fortunately, casings were left in the ground so collars can be picked up and surveyed as part of the next drilling program.
Downhole surveying was done using a Flexit instrument. This instrument determines azimuths based on a magnetic compass. Altius ignored azimuth readings from the instrument and utilized only the inclination information from the survey. WGM agrees that this was acceptable practice.
Drillhole orientation varies from nearly perpendicular to dip of iron formation to oblique and accordingly the relationship between true widths and intersection length also vary. Also the attitude of the iron formation is interpreted from geophysical surveys and sparse drilling and additional drilling will undoubtedly refine structural interpretation. Accordingly drill hole orientation with respect to iron formation orientation is not completely known at this time. Results of the drill program are described under Mineralization, Section: 9.
57

12. SAMPLING METHOD AND APPROACH
12.1 GENERAL
BCL has conducted no exploration on the Property. The description and discussions for sampling herein are for the historic programs conducted from 2006 to 2008 by Altius and are derived mostly from reports completed by or for Altius and filed for assessment with the government of Newfoundland and Labrador.
12.2 2006 AND 2007 SURFACE SAMPLING PROGRAMS
The 2006 program completed on the Property consisted of reconnaissance prospecting and sampling. Ten surface grab samples from outcrop were collected and sent to SGS-Lakefield for XRF WR analysis and determination of magnetite by Satmagan. Details of results are reported in Way, Churchill and Seymour, 2007.
Altius’ 2007 program also included a prospecting and sampling component. A total of 63 samples were collected. Twenty-nine of these were set to Activation Laboratories in Ancaster, Ontario for determination of major oxides, FeO, total S, LOI and H2O+. The others were collected for physical properties testing at Morris. Morris determined density and magnetic susceptibility (see Mineralization). Results for this program are reported Seymour, Churchill and Winter, 2008.
Sample and analysis results for the 2006 and 2007 programs were used only for geological mapping purposes.
12.3 2008 DRILL CORE HANDLING AND LOGGING
Core was removed from the core tube by the driller’s helper at the drill and placed into core trays labelled with hole and box number. Once the tray was filled (approximately 4 to 4.5 m per box) it was secured at both ends, labelled and set aside. Core was picked up at the drill site by Altius personal each day. Core was transported from the drill site to a truck road using all terrain vehicles and a trailer. Core was then transferred to an Altius truck and transported directly to Altius’ secure core facility in Labrador City. A geologist was always on site at the core facility to receive the core deliveries. Core boxes were then checked for proper labelling and correct positioning of tags. The end of box interval was measured and marked on the end of each tray with an orange china marker. Box numbers, intervals and Hole ID were recorded on a spreadsheet and recorded on aluminum tags which were subsequently stapled to the tray
58
ends for proper cataloguing. All core was photographed, both wet and dry, in groups of four trays by a geotechnician or geologist.
Rock quality designation (“RQD”), specific gravity and magnetic susceptibility measurements were completed for each drillhole and recorded on spreadsheets. A measurement of specific gravity was obtained from each lithological unit in each drillhole by selecting short pieces of whole or split core and weighing each in air and in water. Partial results for these bulk density determinations are contained in the Mineralization section of this report. Magnetic susceptibility was measured using a magnetic susceptibility KT-9 Kappameter distributed by Exploranium G.S. Limited by taking one measurement every metre as an approximation of magnetic susceptibility.
A geologist logs the core and records the data on logging sheets. All geological and geotechnical information was recorded digitally at the end of each day
12.4 2008 SAMPLING APPROACH
Sample intervals were determined on a geological basis, as selected by the drill geologist during logging, and marked out on the drill core with a china marker during descriptive logging.
Core was first aligned in a consistent foliation direction. Iron formation was sampled systematically at 5 m sample intervals where possible, except where lithological contacts are less than 5 m.
All rock estimated to contain abundant iron oxide was sampled. In addition, two 3-m samples on either side of all iron formation were taken, where possible, to bracket all iron formation sequences.
12.5 2008 SAMPLING METHOD
The geologist marked the sample intervals with a red china marker and placed lines perpendicular to the core axis at the beginning and end of sample intervals. The geologist also marked a line along the top of the core, parallel to the core axis, to indicate to the sampling geotechnician where the core should be sawn in half.
Three-part sample tickets, with unique sequential numbers, were used to number and label samples for assay. One tag contains information about the sample (such as date, hole ID, interval and description) and is kept in the sample log book. A second tag is stapled into the
59
core box at the beginning of the sample interval. The third tag is stapled into the in the plastic poly bags containing that sample for assay. Sample numbers and intervals were entered into a digital spreadsheet.
Core was sawn in half using a rock saw at the Altius core facility by an Altius geotechnician. One half of the core comprising the sample is placed into the labelled sample bags and stapled closed immediately after the sample is inserted. The remaining half of the split core is returned to the core tray and inserted in its original order and orientation and retained for future reference. Where duplicate samples were required, quarter samples were taken sawn. Each sample is then secured within plastic pails labelled with the sample number. Lids were secured on the pails and the pails were then taped closed for extra security. The buckets were placed onto pallets where they were subsequently shrink-wrapped and also secured with plastic straps for loading onto transport trucks for shipment to SGS-Lakefield.
12.6 CORE STORAGE
After core logging and sampling were completed, core trays containing the reference half or quarter-split core and the archive sections of whole core were stacked on timber and rebar core racks at the Altius Labrador City core facility.
12.7 WGM COMMENT ON LOGGING AND SAMPLING
WGM examined sections of Altius’ 2008 drill core during its October 2009 site visit and found the core in good order. The drill logs have also been reviewed and WGM agrees they are comprehensive and generally are of excellent quality. WGM, would however, prefer to see sample locations and some assays in the logs. Core descriptions in the logs were found to match the drill core.
During WGM’s site visit, sample tickets in the boxes were checked and confirmed that they were located as reported in the drill logs. WGM did not observe core logging or samples being prepared or shipped to the lab, so WGM cannot validate the method and procedures as described herein.
A drill core sampling approach using 5 m long samples respecting lithological contacts is acceptable practice. WGM is unaware of any drilling, sampling or recovery factors that could materially impact the accuracy and reliability of the results. The outcrop samples collected during 2006 and 2007 were grab samples. They cannot be relied upon to be representative of grade and have only been used for general geological mapping purposes which is appropriate.
60
13. SAMPLE PREPARATION, ASSAYING AND SECURITY
13.1 2008 SAMPLE PREPARATION
In-lab sample preparation was performed by SGS-Lakefield, Lakefield, Ontario. Samples were crushed to 9 mesh (2 mm) and 500 g of riffle split sample was pulverized to 200 mesh (75 µm).
13.2 2008 SAMPLE ASSAYING
Altius’ drill core samples were analyzed for whole rock analysis (“WR”), major element oxides including total Fe2O3 by lithium metaborate fusion XRF, FeO was determined by H2SO4/HF acid digest-potassium dichromate titration, and Fe3O4 by Satmagan. A group of 14 samples were also analysed for S determination based on visual observation of sulphides in the drill core. A total of 676 samples, including in-field QC materials, were sent for assay. Sample and analysis statistics are summarized in Table 12.
TABLE 12.
SAMPLING AND ANALYSIS SUMMARY, ALTIUS 2008 DRILL PROGRAM
Sample Classification | | Analysis | | Number | |
Routine | | XRF WR and Satmagan | | 613 | |
S | | S | | 14 | |
In-Field Blank | | XRF WR and Satmagan | | 19 | |
In-Field ¼ Core Duplicate | | XRF WR and Satmagan | | 24 | |
In-Field Standards (TBD-1, SCH-1) | | XRF WR and Satmagan | | 20 | |
SGS-Lakefield Preparation Duplicate | | | | 7 | |
SGS-Lakefield Replicates Analytical duplicates | | | | 22 | |
SGS-Lakefield Certified Standards and Blanks | | | | Not Available | |
13.3 QUALITY ASSURANCE AND QUALITY CONTROL
Altius conducted an in-field QA/QC program during initial core sampling. SGS-Lakefield also conducted its own in-lab internal QA/QC program. Samples and analysis for both these programs are summarized in Table 12.
In the field, Standard, Blanks and Duplicate samples were inserted alternately every 10th sample. The Certified Standard Reference materials used were CANMET’s TBD-1 and SCH-1. This material was pre-packaged in paper envelopes and, as required, a packet was placed in a regular sample bag and given a routine sequential project sample number.
61
Certified and provisional values for iron and selected other elements for these two standards are listed in Table 13. The Blank material was a relatively pure quartzite and was obtained from a quarry outside of Labrador City. Results for %Fe and selected elements for the field inserted Certified Standard Reference materials and the field-inserted Blanks are shown on Figure 16.
TABLE 13.
CERTIFIED STANDARD REFERENCE MATERIALS USED FOR
THE IN-FIELD QA/QC PROGRAM, ALTIUS 2008
| | | | | | | | Certified Values | |
Type | | StandardID | | Provider | | Material | | %Fe | | %SiO2 | | %Mn | | %P | | %S | |
STD | | SCH-1 | | Canmet | | Schefferville Hematite Ore | | 60.73 | | 8.087 | | 0.777 | | 0.054 | | 0.007 | |
STD | | TDB-1 | | Canmet | | Diabase - Saskatchewan | | 10.4 | | 50.2 | | 0.1577 | | 0.08 | | 0.03 | |

Figure 16. Results for in-field inserted Certified Reference materials and Blanks
Duplicate samples were collected by quarter sawing the predetermined sample intervals and using ¼ core for the Duplicate sample, ¼ for the regular samples, with the remaining half core returned to the core box for reference. Results for analysis of duplicate second ¼ drill core samples are shown on Figures 17 to 21.
62
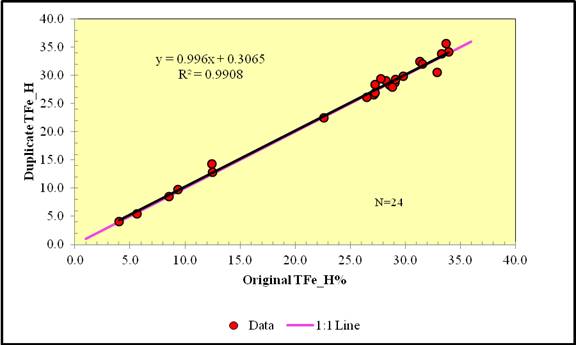
Figure 17. Results for Duplicate ¼ split drill core samples - %TFe Head
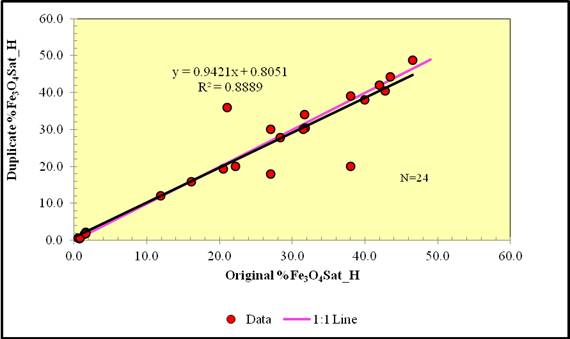
Figure 18. Results for Duplicate ¼ split drill core samples - %Fe3O4Sat Head
63
Figure 19. Results for Duplicate ¼ split drill core samples - %FeO Head

Figure 20. Results for Duplicate ¼ split drill core samples - %SiO2 Head
64
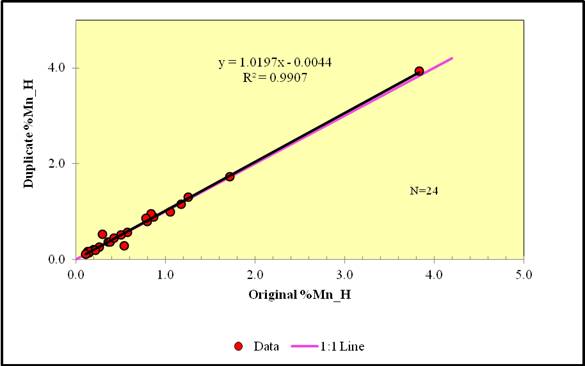
Figure 21. Results for Duplicate ¼ split drill core samples - %Mn Head
SGS is an accredited laboratory meeting the requirements of ISO 9001 and ISO 17025. SGS-Lakefield’s in-laboratory QA/QC program consisted of assays on Preparation Duplicates which it calls Replicates and Analytical Duplicates which are re-assays of same pulps. These re-assays, SGS-Lakefield refers to as Duplicates on its Certificates of Analysis. Preparation Duplicates are second pulps made by splitting off a second portion from a coarse reject, but laboratory protocols for sample preparation and QA/QC are not described in Altius’ reports. SGS-Lakefield prepared and assayed Preparation Duplicates at a rate of one every 60 to 70 routine samples. Analytical Duplicates, which involved a new fusion and disc, were prepared and assayed at a frequency of one sample every 20 to 25 routine samples.
Selected results for Analytical Duplicates at SGS-Lakefield are shown on Figures 22 and 23. Selected results for Preparation Duplicates at SGS-Lakefield are shown on Figures 24 and 25.
65
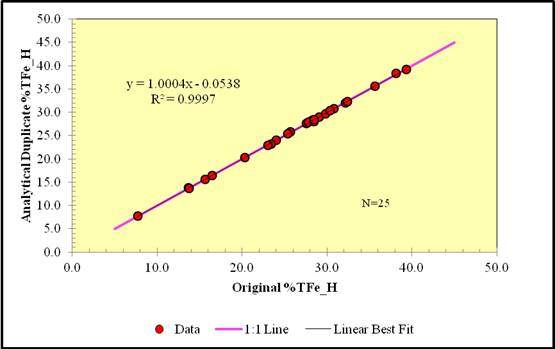
Figure 22. Results for Analytical Duplicates at SGS-Lakefield for %TFe_H
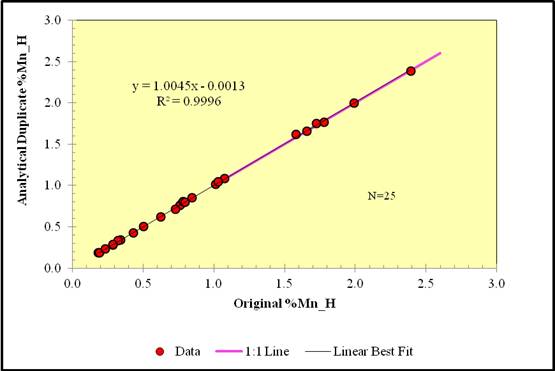
Figure 23. Results for Analytical Duplicates at SGS-Lakefield for %Mn_H
66
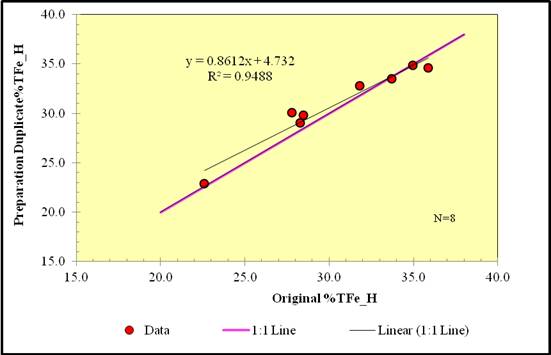
Figure 24. Results for Preparation Duplicates at SGS-Lakefield for %TFe_H
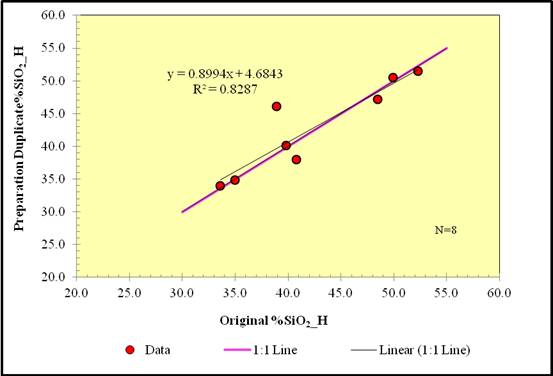
Figure 25. Results for Preparation Duplicates at SGS-Lakefield for %SiO2_H
67
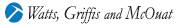
No results for Certified Reference Standards used by SGS-Lakefield as part of its internal QA/QC work are reported on the Certificates of Analysis provided for WGM’s review or attached to the drilling program report and filed for assessment. WGM knows that such Standards were undoubtedly analysed as a part of SGS-Lakefield’s analysis protocol. WGM recommends that these results be requested from SGS-Lakefield.
13.4 WGM COMMENT ON ALTIUS’ SAMPLING AND ASSAYING
For numerous drill core samples, sample limits do not respect lithological boundaries. WGM acknowledges that in some cases respecting lithological contacts is not practical or desirable when units are narrow. For many of these samples, proper sampling of narrow amphibolites units is not possible and samples including amphibolite units have to be grouped with iron formation. WGM believes more attention and flexibility in sample lengths should be made to make more of the sample limits respect contacts, where possible.
No interpretation or discussion of the QA/QC results for either the in-field or in-lab QA/QC programs are contained within Altius’ reports. WGM recommends that standard practice should include monitoring and review of QA/QC results. The field sampling practice employed by Altius entailed bracket sampling of “waste” units bounding “ore” units. WGM recognizes this as good practice and the best way of ascertaining samples and assays are in good order.
Certainly SGS-Lakefield results are generally good quality, but no Secondary laboratory/Check assaying program has been conducted. Review of analytical results by WGM shows that for a number of the routine samples, % magnetic Fe results completed by the Satmagan method significantly exceed %TFe results. In some cases, results for FeO are also out of balance with Fe2O3 results. A few values are therefore inaccurate. WGM recommends that SGS-Lakefield be queried about these questionable results.
Assay for the outcrop samples collected during the 2006 and 2007 programs are not critical because these samples were grab samples and therefore not representative of the underlying mineralization regardless of the accuracy of their assays.
WGM has not independently verified all sample preparation and assay results and is relying on SGS-Lakefield.
68
14. DATA CORROBORATION
WGM Senior Geologist, David Power-Fardy, P.Geo., accompanied by BCL representative, Mr. Stewart Wallis, P.Geo., and Altius representative Ms. Carol Seymour, Geologist, completed a site visit to the project in October, 2009. Drill core was reviewed at Altius’ core storage facility in Wabush on October 6 and again on October 8. Facilitated by helicopter, Mr. Power-Fardy, Mr. Wallis and Ms. Seymour visited the Property on October 7.
On the Property, Mr. Power-Fardy observed 2008 collars marked by casings and posts labelled with aluminum tags. GPS (handheld instrument) measurements of collar coordinates were made at four drillhole sites and WGM coordinates readings validated Altius’ work. Mr. Power-Fardy also checked azimuth and dip for several casings. Iron formation outcrop were observed to be widely distributed throughout the areas visited.
Mr. Power-Fardy examined core for holes drilled on the Property. WGM corroborated that observed rock units and sample locations in archived drill core corresponded to that described in the drill core logs.
WGM noted that drill core was securely stored and in excellent condition. Core trays were well labelled, and observation suggested that the core splitting was well done. Sample tags were observed in place in the trays and sample locations corresponded to those marked in the drill logs.
WGM independently collected 15 samples from 2008 drillholes and these samples were sent to SGS-Lakefield for analysis (Tables 14 and 15). The samples were analysed for major WR elements using XRF on fused discs similar to the original analytical work completed at SGS-Lakefield. Fe3O4 was determined by Satmagan. The SG (density) of the samples was determined by immersion in water and also on pulps using the helium comparison pycnometer method. The SG/density work is presented in Section 9. The Certificate of Analysis for WGM’s independently collected samples analysed by SGS-Lakefield is contained in Appendix 1.
Differences between Altius and WGM assay for most of the sample pairs are reasonable, but for several pairs differences are above expectations. Results for sample pair 2148/2664 in particular are poor. The fact that the samples were quarter core rather than half core likely explains the differing results, rather than a mix-up in samples.
69
Figures 26 to 29 graphically compare results for WGM’s independently collected and analysed samples versus Altius’s original results. Reasonable correlation and lack of bias between the two data sets indicates that assays are reliable and also that no sample sequencing errors are likely present. One sample pair, 2495/2677, was specularite-rich and magnetite poor. Analytical results confirm this composition with %Fe3O4 determined by Satmagan for both samples reporting very low magnetite values. One sample, WGM 2672, reports high S at 1.77%. The drill core log reports trace pyrite for this interval and this likely explains the sulphur value. WGM suggests that more sulphur determinations should probably be completed as part of the routine assay protocol. High sulphur values can affect the quality of other assays determined by XRF. Sulphur can also be a deleterious element for marketing iron concentrates and pellets, but to be a problem, sulphur would have to be at elevated levels in concentrates and pellets. WGM is recommending that the next stage of work for the Property include metallurgical mapping of the deposits. Sulphur may be of lesser concern than manganese, but distribution in the concentrates needs to be investigated.
TABLE 14.
SUMMARY OF WGM INDEPENDENT SECOND HALF CORE SAMPLING
WGM ID | | Altius_ID | | Drillhole_ID | | From (m) | | To (m) | | Lith Code |
2663 | | 2016 | | K-08-01 | | 74.40 | | 79.40 | | MSOIF |
2664 | | 2148 | | K-08-07 | | 33.00 | | 36.40 | | SIF |
2665 | | 2372 | | K-08-13 | | 75.10 | | 78.00 | | SIF |
2666 | | 4510 | | K-08-19 | | 69.23 | | 71.64 | | MOIF |
2667 | | 4592 | | K-08-21 | | 36.91 | | 39.60 | | MOIF |
2668 | | 2440 | | K-08-16 | | 306.75 | | 311.66 | | MOIF |
2669 | | 2121 | | K-08-06 | | 117.00 | | 122.00 | | MSOIF |
2670 | | 2078 | | K-08-02 | | 85.65 | | 90.65 | | MOIF |
2671 | | 2383 | | K-08-15 | | 115.23 | | 116.23 | | MOIF |
2672 | | 4614 | | K-08-24 | | 247.50 | | 249.62 | | MOIF |
2673 | | 4534 | | K-08-20 | | 216.95 | | 221.95 | | MOIF |
2674 | | 4580 | | K-08-20 | | 400.27 | | 402.89 | | MOIF |
2675 | | 2139 | | K-08-08 | | 88.95 | | 93.95 | | MSOIF |
2676 | | 2003 | | K-08-01 | | 14.20 | | 16.60 | | MSOIF |
2677 | | 2495 | | K-08-18 | | 286.32 | | 291.32 | | SOIF |
70

TABLE 15.
COMPARISON OF ANALYTICAL RESULTS
WGM INDEPENDENT QUARTER CORE SAMPLING TO ORIGINAL ALTIUS RESULTS
| | Sample | | TFE | | Fe3O4 | | FeO | | SiO2 | | Ti02 | | Al2O3 | | MgO | | CaO | | Na2O | | K2O | | MnO | | P2O5 | | S | |
| | ID | | % | | % | | % | | % | | % | | % | | % | | % | | % | | % | | % | | % | | % | |
Altius | | 2016 | | 36.94 | | 39.0 | | 11.90 | | 36.50 | | 0.01 | | 0.08 | | 1.35 | | 3.79 | | 0.005 | | 0.005 | | 1.54 | | 0.020 | | | |
WGM | | 2663 | | 36.17 | | 37.5 | | 11.96 | | 37.30 | | 0.01 | | 0.06 | | 1.34 | | 3.85 | | 0.005 | | 0.005 | | 1.48 | | 0.020 | | 0.010 | |
| | | | | | | | | | | | | | | | | | | | | | | | | | | | | |
Altius | | 2148 | | 29.10 | | 21.0 | | 25.30 | | 42.80 | | 0.03 | | 0.27 | | 4.00 | | 3.59 | | 0.030 | | 0.040 | | 1.45 | | 0.060 | | | |
WGM | | 2664 | | 32.18 | | 31.1 | | 22.99 | | 42.40 | | 0.02 | | 0.26 | | 2.66 | | 2.60 | | 0.030 | | 0.030 | | 1.36 | | 0.050 | | 0.010 | |
| | | | | | | | | | | | | | | | | | | | | | | | | | | | | |
Altius | | 2372 | | 24.27 | | 31.4 | | 13.05 | | 48.30 | | 0.01 | | 0.12 | | 2.98 | | 5.42 | | 0.100 | | 0.010 | | 0.33 | | 0.030 | | | |
WGM | | 2665 | | 24.06 | | 30.4 | | 12.99 | | 48.80 | | 0.01 | | 0.14 | | 3.07 | | 5.48 | | 0.020 | | 0.005 | | 0.30 | | 0.020 | | 0.180 | |
| | | | | | | | | | | | | | | | | | | | | | | | | | | | | |
Altius | | 4510 | | 25.81 | | 30.2 | | 10.48 | | 48.60 | | 0.01 | | 0.02 | | 2.81 | | 5.27 | | 0.005 | | 0.005 | | 0.29 | | 0.005 | | | |
WGM | | 2666 | | 26.65 | | 29.6 | | 10.70 | | 46.60 | | 0.01 | | 0.01 | | 2.81 | | 5.62 | | 0.100 | | 0.005 | | 0.29 | | 0.005 | | 0.005 | |
| | | | | | | | | | | | | | | | | | | | | | | | | | | | | |
Altius | | 4592 | | 28.26 | | 37.0 | | 14.53 | | 43.40 | | 0.01 | | 0.02 | | 2.35 | | 5.54 | | 0.005 | | 0.005 | | 1.13 | | 0.020 | | | |
WGM | | 2667 | | 28.82 | | 38.6 | | 14.49 | | 44.80 | | 0.01 | | 0.01 | | 2.21 | | 4.91 | | 0.010 | | 0.005 | | 1.01 | | 0.010 | | 0.005 | |
| | | | | | | | | | | | | | | | | | | | | | | | | | | | | |
Altius | | 2440 | | 40.15 | | 55.7 | | 17.73 | | 37.90 | | 0.01 | | 0.18 | | 1.63 | | 1.96 | | 0.070 | | 0.030 | | 0.50 | | 0.040 | | | |
WGM | | 2668 | | 40.99 | | 56.8 | | 18.61 | | 35.80 | | 0.01 | | 0.37 | | 1.79 | | 2.20 | | 0.020 | | 0.030 | | 0.54 | | 0.030 | | 0.010 | |
| | | | | | | | | | | | | | | | | | | | | | | | | | | | | |
Altius | | 2121 | | 32.04 | | 45.0 | | 12.13 | | 46.20 | | 0.02 | | 0.22 | | 3.37 | | 1.31 | | 0.010 | | 0.120 | | 0.95 | | 0.050 | | | |
WGM | | 2669 | | 32.95 | | 45.6 | | 14.79 | | 45.60 | | 0.01 | | 0.23 | | 3.35 | | 1.32 | | 0.020 | | 0.130 | | 0.90 | | 0.050 | | 0.005 | |
| | | | | | | | | | | | | | | | | | | | | | | | | | | | | |
Altius | | 2078 | | 28.40 | | 38.0 | | 14.58 | | 45.60 | | 0.10 | | 1.96 | | 3.61 | | 2.38 | | 0.430 | | 0.480 | | 0.69 | | 0.070 | | | |
WGM | | 2670 | | 28.75 | | 37.3 | | 14.67 | | 46.40 | | 0.08 | | 1.71 | | 3.52 | | 2.39 | | 0.340 | | 0.420 | | 0.67 | | 0.080 | | 0.040 | |
| | | | | | | | | | | | | | | | | | | | | | | | | | | | | |
Altius | | 2383 | | 33.09 | | 40.0 | | 19.23 | | 43.10 | | 0.01 | | 0.18 | | 3.16 | | 2.32 | | 0.070 | | 0.030 | | 0.96 | | 0.040 | | | |
WGM | | 2671 | | 30.99 | | 36.4 | | 18.31 | | 46.30 | | 0.01 | | 0.17 | | 3.20 | | 2.30 | | 0.010 | | 0.030 | | 0.93 | | 0.030 | | 0.005 | |
| | | | | | | | | | | | | | | | | | | | | | | | | | | | | |
Altius | | 4614 | | 32.32 | | 35.8 | | 17.64 | | 40.70 | | 0.06 | | 0.97 | | 1.61 | | 4.19 | | 0.005 | | 0.020 | | 0.93 | | 0.060 | | | |
WGM | | 2672 | | 30.92 | | 36.5 | | 15.70 | | 44.80 | | 0.02 | | 0.31 | | 1.50 | | 4.18 | | 0.005 | | 0.005 | | 0.81 | | 0.050 | | 1.77 | |
| | | | | | | | | | | | | | | | | | | | | | | | | | | | | |
Altius | | 4534 | | 36.31 | | 50.0 | | 15.24 | | 38.50 | | 0.02 | | 0.14 | | 2.34 | | 2.85 | | 0.005 | | 0.020 | | 2.40 | | 0.050 | | | |
WGM | | 2673 | | 35.47 | | 49.9 | | 14.70 | | 39.10 | | 0.01 | | 0.15 | | 2.35 | | 2.73 | | 0.130 | | 0.020 | | 2.29 | | 0.040 | | 0.010 | |
| | | | | | | | | | | | | | | | | | | | | | | | | | | | | |
Altius | | 4580 | | 33.58 | | 43.7 | | 15.87 | | 45.90 | | 0.02 | | 0.26 | | 2.85 | | 1.26 | | 0.005 | | 0.050 | | 1.12 | | 0.050 | | | |
WGM | | 2674 | | 32.25 | | 42.5 | | 15.26 | | 46.60 | | 0.02 | | 0.29 | | 2.86 | | 1.30 | | 0.010 | | 0.050 | | 1.05 | | 0.050 | | 0.010 | |
| | | | | | | | | | | | | | | | | | | | | | | | | | | | | |
Altius | | 2139 | | 21.76 | | 30.0 | | 10.78 | | 52.70 | | 0.01 | | 0.09 | | 2.59 | | 5.00 | | 0.005 | | 0.020 | | 2.03 | | 0.030 | | | |
WGM | | 2675 | | 25.60 | | 35.4 | | 11.95 | | 49.10 | | 0.01 | | 0.07 | | 2.29 | | 4.43 | | 0.005 | | 0.005 | | 2.01 | | 0.030 | | 0.005 | |
| | | | | | | | | | | | | | | | | | | | | | | | | | | | | |
Altius | | 2003 | | 31.41 | | 43.0 | | 15.02 | | 41.40 | | 0.01 | | 0.14 | | 3.40 | | 0.50 | | 0.005 | | 0.010 | | 6.32 | | 0.040 | | | |
WGM | | 2676 | | 32.18 | | 44.1 | | 15.42 | | 41.40 | | 0.01 | | 0.12 | | 3.33 | | 0.50 | | 0.010 | | 0.005 | | 5.90 | | 0.030 | | 0.020 | |
| | | | | | | | | | | | | | | | | | | | | | | | | | | | | |
Altius | | 2495 | | 27.42 | | 0.6 | | 0.76 | | 48.60 | | 0.03 | | 0.47 | | 3.08 | | 2.53 | | 0.005 | | 0.290 | | 1.24 | | 0.030 | | | |
WGM | | 2677 | | 27.21 | | 0.5 | | 0.62 | | 50.00 | | 0.02 | | 0.42 | | 2.98 | | 2.59 | | 0.070 | | 0.250 | | 1.24 | | 0.030 | | 0.020 | |
71

Figure 26. %TFe_H for WGM Independent Sampling vs. Altius Original
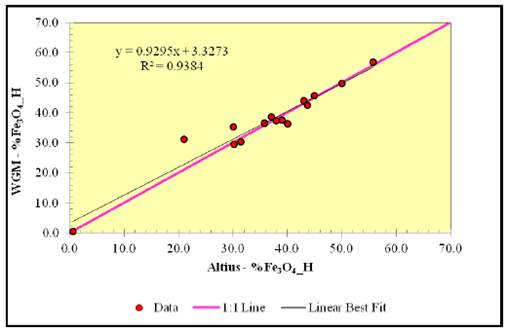
Figure 27. %Fe3O4_H (Satmagan) for WGM Independent Sampling vs. Altius Original
72

Figure 28. %SiO2_H for WGM independent Sampling vs. Altius Original
Figure 29. %MnO_H for WGM Independent Sampling vs. Altius Original
Results for SG are given in the Mineralization Section of this report.
73
15. ADJACENT PROPERTIES
The northern boundary of the Property is located approximately 6 km south of the Scully Mine of Wabush Mines, owned 100% by Arcelor-Mittal Steel’s Canadian subsidiary Dofasco. Dofasco purchased all outstanding interest in the operation from Stelco and Cleveland Cliffs Inc., now Cliffs Natural Resources Inc. (“Cliffs”), in September 2007. The Carol operations (Humphry Mine) owned by Rio Tinto Iron Ore subsidiary IOCC located north of Labrador City is approximately 18 km north of the Property. QCM’s Mont-Wright Iron Mine, also owned by Arcelor-Mittal Steel is located 9 km west of the Property. QCM has been renamed ArcelorMittal Mines of Canada (“AMMC”). The Property is also located approximately 10 km southeast of the Bloom Lake Iron Deposit that is undergoing advanced mine development by Consolidated Thompson. All of these iron mines in the area extract similar iron mineralization as found at the Property, although for each deposit there are variations in geology and character of mineralization.
The following is a brief description of the operations in the area:
Wabush Mines’ Scully Mine has been in operations since 1965. Mining and concentrating takes place in Wabush, while the subsequent stage of pelletizing is done at a plant at Pointe Noire on the St Lawrence River near Sept-Isles, Québec. Since 1967, annual capacity of the Wabush operation has been approximately six million long tons of pellets. Strathcona Mineral Services Limited (“Strathcona”) completed a review of the Scully operation in 2006 for the government of Newfoundland and Labrador and much of what is summarized below concerning the Scully operations is taken from Stathcona’s report. Wabush Mines is the smallest of the three operations in the Wabush area and has always been considered to have less favourable economics because of its lower production rate, quality issues because of the manganese content in the ore, large de-watering requirements in the mining operations, and the use of a competitor’s railroad for transporting ore to the pellet plant.
The Wabush Mine ore consists dominantly of hematite with minor magnetite. Ore with more than 15% magnetite is excluded from Mineral Reserves because the processing plant can’t handle it. This information has not been independently verified by the QP and the information is not necessarily indicative of mineralization on the Property. Manganese is the main non-iron element affecting the quality of the Wabush pellets, with all other elements generally meeting typical market specifications. O’Leary et al., (1979) has shown the manganese grade in the final concentrate closely matches the manganese grade in the crude ore, indicating that, on average, about two-thirds of the manganese is being rejected in the concentration process.
74
Pellets from Wabush Mines with high manganese have to be blended with low-manganese iron ore in order to meet the specifications generally established by the steel producers. Maintaining satisfactory manganese content is therefore the major technical challenge facing Wabush Mines in terms of product quality, which is a challenge not faced by the neighbouring operations at IOCC and Mont-Wright.
AMMC is a major North American producer and marketer of a variety of iron ore products consisting of concentrates and several types of pellets. AMMC owns and operates the Mont-Wright Mine and concentrator at Fermont, a pellet plant and adjacent port facilities on the Gulf of St. Lawrence at Port-Cartier, Québec and the railway, which transports iron ore concentrate to the pelletizing plant and for direct shipping.
The Mont-Wright operation consists of several open pit mines and a concentrator, which started production in 1975. The iron formation that is mined at Mont-Wright has an average iron content of approximately 30% TFe. The magnetite content is normally less than 5% by weight, however, it may be higher locally, and magnetite must be blended into the mill feed. The level of contaminants (predominantly TiO2, Al2O3, Mn, P, Na2O, K2O) in the iron ore is generally low, but is higher adjacent to the amphibolite-specular hematite contacts. The marketplace considers Mont-Wright concentrate purer than the fines being shipped from Australia and Brazil.
The mine has the capacity to produce some 38 million tonnes of feed for the concentrator and about 30 million tonnes of waste per year. The Mont-Wright concentrator has the capacity to produce 16 million tonnes of concentrate annually, assuming a Head grade of 30% Fe. Current production is approximately 13.5 million tonnes of iron ore concentrates per year, from crude ore with an average Head grade of 28% Fe. Crude Head grade averaged 28.2% Fe between 2001 and 2005 and is forecast to average 28.9% TFe for the 2006 to 2010-year period. The variation in the concentrate tonnage is directly related to yearly sales, which are dependent on market conditions. During the period from 1961 through 2005, a total of approximately 543 million tonnes of iron ore products was shipped from Port-Cartier. Prior to the start of the Mont-Wright mine, QCM production came from the operations in Gagnon and Fire Lake which used the southern portion of the rail and the Port-Cartier.
The Lac Hessé, Lac Moiré and Fire Lake deposits occur in this same immediate area and are held by AMMC. In addition, AMMC recently re-acquired the magnetite-rich Mont-Reed deposit near Lac Jeannine. Lac Jeannine, at Gagnon, was QCM’s first operation in the area, but by April 1977 it had been depleted following production of 130 million tonnes of iron ore concentrate over a 17-year period. The Fire Lake Deposit saw limited production from late-1974 into 1984, first by QCM, then by Sidbec-Normines Inc. Recent developments at Fire
75
Lake included the 2006 extraction of approximately 1.3 million tonnes of crude ore for metallurgical and concentrator testing. This program began in June 2006 and was to be completed before the end of the year.
Consolidated Thompson is in the stages of advanced mine development of the Bloom Lake Deposit. In 1998, WGM on behalf of QCM, designed and managed an exploration program on the Bloom Lake property. Breton, Banville and Associates (“BBA”) completed a Conceptual Study for the development of 5 million t/y mine and concentrator for the deposit in October 2005. In May 2006, BBA completed a feasibility study based on the same parameters. In May 2007, BBA presented an update of the mining plan, the mine and concentrator infrastructure, the capital and operating costs and a review of the financial analysis for the development of a 7 million t/y operation. In August 2007, Consolidated Thomson stated that almost half of its detailed engineering for mine development had been completed and work was proceeding. In November 2008 it filed a feasibility study available on SEDAR for the project based on 8 Mt/yr of iron concentrate, (Allaire, Palumbo, Live and Scherrer, 2008). This information has not been verified by the QP and the information is not necessarily indicative of mineralization on the Property.
IOCC operates a mine, concentrator and a pelletizing plant in Labrador City, as well as port facilities located in Sept-Îles. The company also operates a 420-kilometre railroad that links the mine to the port. IOCC is the largest iron ore and pellet producer in Canada. In 2005, it celebrated 50 years of operation. Its first operation, in Schefferville, Québec at Knob Lake started in 1954 and ceased production in 1982. IOCC’s Carol operations, initially in the Smallwood Mine, opened in 1962. IOCC recently announced its commitment to boost concentrate output from 17 to 18.4 million t/y. Additional projects are planned to increase pellet production from 13.0 to 14.5 million t/y.
76
16. MINERAL PROCESSING AND METALLURGICAL TESTING
One testwork program completed at SGS-Lakefield has been conducted on mineralization from the Property. This program was completed for Altius in 2009 based on a design prepared by Mrs. Stephanie m. Scott from Thibault and Associates Inc. (“Thibault”) for bench-scale testing of a single bulk sample. The test program was directed by Mrs. Scott. Mr. Richard Wagner, in his capacity as a qualified person, as defined by NI-43-101, reviewed the final report.
The metallurgical sample was a composite made from routine sample intervals from drill holes K-08-01 and K-08-18 (Table 16). These intervals of magnetite-rich iron formation, with lower specularite, were selected by Altius as reasonably representative of the overall deposit mineralization. Almost all of the routine assay sample intervals were 3.0 m. The assay rejects from the routine samples were combined providing a total composite mass of approximately 250 kg.
TABLE 16.
MAKE-UP OF METALLURGICAL SAMPLE
Hole_ID | | From (m) | | To (m) | | Width (m) | |
K-08-18 | | 161.0 | | 222.0 | | 61.0 | |
K-08-01 | | 99.4 | | 162.9 | | 63.5 | |
Total | | | | | | 124.5 | |
The sample was submitted for a detailed ore characterization including head assays, mineralogy, preliminary grindability and beneficiation testwork. A sample representing the magnetite-rich ore zone was subjected to low-intensity magnetic separation (“LIMS”) and gravity separation. SGS-Lakefield completed a report that presents the test results and provides a recommendation for a conceptual flowsheet.
The complete characterization and analysis for the sample are summarized in Tables 17 and 18.
The Head grade of the bulk sample at 44.3% Fe2O3 (30.98% TFe) compares closely with the average of all OIF classified drill core samples at 30.67%TFe. The Head of 1.60% MnO (1.25% Mn) is close to the average Mn content of OIF as calculated at 1.28% Mn based on all OIF classified Altius 2008 drillhole samples.
77
TABLE 17.
ORE CHARACTERIZATION SUMMARY
Head Assays | | % | | Mineral Abundance | | Head Assays |
Fe | | 31.0 | | Magnetite | | 26.4 |
SiO2 | | 43.0 | | Hematite | | 19.9 |
S | | 0.01 | | Quartz | | 37.6 |
Fe3O4 | | 26.4 | | Ankerite (Low Mn and Mg and Fe) | | 6.3 |
Mag Fe | | 19.1 | | Dolomite(Fe) | | 4.8 |
Mag Rec Fe | | 61.7 | | Amphibole/Pyroxene | | 2.4 |
Grindability | | kWh/t | | Mn-Fe-Ca Carbonates | | 1.6 |
RWI | | 5.75 | | Fe Deportment | | % |
BWI | | 18.5 | | Fe Oxides | | 96.7 |
TABLE 18.
ORE CHARACTERIZATION DETAILS
XRF Whole-Rock Analysis | | ICP-Scan | | Rare-Earth Scan | |
Element | | Unit | | Assay | | Element | | Unit | | Assay | | Element | | Unit | | Assay | |
SiO2 | | % | | 43.0 | | | Ag | | g/t | | | < 2 | | Ce | | g/t | | | | 9.5 | |
Al2O3 | | % | | 0.11 | | | As | | g/t | | | < 30 | | Dy | | g/t | | | < | 1 | |
Fe2O3 | | % | | 44.3 | | | Ba | | g/t | | | 59 | | Er | | g/t | | | < | 0.8 | |
MgO | | % | | 1.78 | | | Be | | g/t | | | 1 | | Eu | | g/t | | | < | 0.6 | |
CaO | | % | | 3.88 | | | Bi | | g/t | | | < 20 | | Gd | | g/t | | | | 1.0 | |
Na2O | | % | | < 0.01 | | | Ca | | g/t | | | 28000 | | Ho | | g/t | | | < | 0.4 | |
K2O | | % | | 0.01 | | | Cd | | g/t | | | < 2 | | La | | g/t | | | | 4.3 | |
TiO2 | | % | | < 0.01 | | | Co | | g/t | | | < 30 | | Lu | | g/t | | | < | 0.6 | |
P2O5 | | % | | 0.03 | | | Cr | | g/t | | | 73 | | Nd | | g/t | | | | 4 | |
MnO | | % | | 1.60 | | | Cu | | g/t | | | 13 | | Pr | | g/t | | | | 0.9 | |
Cr2O3 | | % | | 0.01 | | | K | | g/t | | | 150 | | Sc | | g/t | | | < | 2 | |
V2O5 | | % | | < 0.01 | | | Li | | g/t | | | < 10 | | Sm | | g/t | | | < | 0.8 | |
LOI | | % | | 5.15 | | | Mg | | g/t | | | 9700 | | Tb | | g/t | | | < | 0.6 | |
Sum | | % | | 99.9 | | | Mn | | g/t | | | 12000 | | Th | | g/t | | | < | 0.6 | |
Fe | | % | | 31.0 | | | Mo | | g/t | | | < 5 | | Tm | | g/t | | | < | 0.8 | |
| | | | | | | Na | | g/t | | | 59 | | U | | g/t | | | < | 0.4 | |
Satmagan | | | Ni | | g/t | | | < 20 | | Y | | g/t | | | | 6.7 | |
Element | | Unit | | Assay | | | Pb | | g/t | | | < 60 | | Yb | | g/t | | | | 0.5 | |
Fe3O4 | | % | | 26.4 | | | Sb | | g/t | | | < 10 | | | | | | | | | |
Mag Fe | | % | | 19.1 | | | Se | | g/t | | | < 30 | | Other Analyses | |
Rec Fe | | % | | 61.7 | | | Sn | | g/t | | | < 20 | | Element | | Unit | | Assay | |
| | | | | | | Sr | | g/t | | | 15 | | S | | % | | 0.01 | |
Moisture content | | | Ti | | g/t | | | 34 | | F | | % | | 0.005 | |
Wet | | Dry | | % | | | Tl | | g/t | | | < 30 | | Cl | | g/t | | 49 | |
9933.3 | | 9926.7 | | 0.1 | | | V | | g/t | | | 7 | | S.G. | | g/cm3 | | 3.49 | |
| | | | | | | Zn | | g/t | | | < 40 | | | | | | | |
78
The Head assayed 31% Fe and 43% SiO2. A very high proportion of the TFe (about 97%) in the sample was present in coarse-grained Fe-oxides (magnetite and hematite), which constitutes 46% of the total mineral assemblage, with the balance distributed into various non-opaque gangue minerals. The magnetite grade measured 26.4% (mineralogy and Satmagan), corresponding to a ‘magnetically recoverable Fe proportion of about 62%’. Hematite was also present in a slightly lower proportion (19.9%), which can be recovered through gravity separation given the relative coarse grained nature of the mineralization. Iron oxide liberation was good over the entire size range which facilitates the recovery of high grade concentrates.
The Bond rod mill and ball mill grindability tests measured 5.8 and 18.5 kWh/t, respectively. The large variation between the two indices is not common in ore testing, but is similar to the results on Bloom Lake results. This will not cause any particular problem in grinding, but primary grinding will require low energy and secondary grinding will require more.
The sample was submitted for a preliminary beneficiation program which included Davis Tube and Mozley testing on various sizes; followed by wet drum LIMS confirmation. The test results are summarized in Table 19. Mozley testing on various sizes was also performed on the tailings produced from the best LIMS test. The best results were produced on sample material with a P80 of 78 microns (200 Mesh) which achieved 61.7% Fe recovery at final LIMS concentrate grade of 69.0% TFe and 3.32% SiO2 with a weight recovery of 40.7%. Testing showed that size reduction below a P80 of 78 microns generally produced poorer results.
The Mozley results performed on a sample prepared at 65 mesh (P80 of 201 microns), achieved weight recoveries of 39.4% and TFe recoveries of 83.3%, with final TFe and SiO2 grades of 65.5% and 2.67%, respectively.
TABLE 19.
BENEFICIATION CHARACTERIZATION SUMMARY
| | Concentrate Grade (%) | | Recovery (%) | |
| | SiO2 | | TFe | | Sat | | Weight | | SiO2 | | TFe | | Sat | |
LIMS only | | 3.32 | | 69.0 | | 99.8 | | 28.5 | | 2.23 | | 61.7 | | 97.1 | |
Mozley only | | 2.67 | | 65.5 | | 59.2 | | 39.4 | | 2.49 | | 83.3 | | 86.8 | |
LIMS+Mozley | | 3.01 | | 67.5 | | 70.1 | | 40.7 | | 2.81 | | 88.6 | | 99.5 | |
The test combining LIMS and Mozley separations on the LIMS tailings achieved the best overall performance with weight and TFe recoveries of 40.7% and 88.6%, respectively, at final TFe and SiO2 grades of 67.5% and 3.01%, respectively. This result was a slight improvement in weight yield and 5.3% increase in TFe recovery over the Mozley only result on material
79
with a P80 of 200 microns (65 mesh) which would result in considerably less grinding energy and costs.
The concentrate specifications are shown in Table 20 where the level of manganese is shown with the concentration contributed by both magnetic and gravity concentration carried out at a P80 of 78 microns (200 mesh). The most optimal flowsheet may be governed by the need to control manganese levels in the concentrate to meet concentrate specifications.
The metallurgical testwork results performed on the one bulk sample from the Property indicates that manganese levels in concentrates from the Property are expected to be higher than normal for iron concentrate levels acceptable to the steel industry. However, the limited work done to date suggests manganese levels will be significantly lower than for concentrates and pellets produced from Scully ores at Wabush Mines.
The normal range for manganese in pellet and concentrates from North and South America is 0.08% to 0.20% MnO (0.06 to 0.16% Mn) making the concentrate produced in this test program higher than the “acceptable range”. Wabush Mines has historically marketed much higher manganese content as shown in Table 21.
Specifications by the steel industry on the maximum permissible manganese content in pellets have restricted mining to ore units that have less than 2% Mn, which after concentrating results in similar manganese content in the pellet product. As much as 60% of the production from Wabush Mines, with its high-manganese pellets, has recently been sold in China, as the traditional North American markets are no longer as receptive to this quality of product.
Cliffs, the operating partner of Wabush Mines, have previously examined the possibility of installing a manganese reduction plant that would reduce the manganese content of ore processed to allow production of the current pellet products to continue, with their manganese content of either 1.2% or 2.0% Mn, from ores that would contain up to 4.0% Mn.
With the indicated average manganese content of the mineralization on the Property being considerably lower than that of the Scully Mine, it may be possible to reduce the manganese in the product by selective mining and blending or inclusion of a manganese reduction plant.
80

TABLE 20.
OVERALL METALLURGICAL SUMMARY
Grind Time: | | 41 Minutes |
K80: | | 78 Microns |
| | Weight | | | | | | | | | | | | | | | | Grade Retained, % | | | | | | | | | | | | | | | | | |
Sample | | % | | SiO2 | | Al2O3 | | Fe2O3 | | MgO | | CaO | | Na2O | | K2O | | TiO2 | | P2O5 | | MnO | | Cr2O3 | | V2O5 | | LOI | | Sum | | S | | Fe | | Mn | | Sat | |
LIMS Conc | | 28.5 | | 3.32 | | 0.08 | | 98.6 | | 0.23 | | 0.17 | | 0.02 | | 0.01 | | 0.02 | | 0.01 | | 0.82 | | 0.02 | | <0.01 | | —2.86 | | 100.4 | | 0.01 | | 69.0 | | 0.635 | | 99.8 | |
Gravity Conc* | | 12.2 | | 2.29 | | 0.14 | | 91.8 | | 0.89 | | 1.54 | | 0.01 | | 0.01 | | 0.03 | | 0.05 | | 1.08 | | — | | — | | — | | — | | 0.06 | | 64.2 | | 0.836 | | 0.87 | |
Combined Fe Conc. | | 40.7 | | 3.01 | | 0.1 | | 96.6 | | 0.43 | | 0.58 | | 0.02 | | 0.01 | | 0.02 | | 0.02 | | 0.90 | | — | | — | | — | | — | | 0.02 | | 67.5 | | 0.697 | | 70.1 | |
Gravity Tailings | | 59.3 | | 71.6 | | 0.23 | | 8.53 | | 2.59 | | 5.91 | | 0.03 | | 0.04 | | 0.01 | | 0.03 | | 1.95 | | — | | — | | — | | — | | 0.02 | | 5.96 | | 1.510 | | 0.26 | |
Calc. Head | | 100 | | 43.6 | | 0.18 | | 44.4 | | 1.71 | | 3.74 | | 0.03 | | 0.03 | | 0.02 | | 0.03 | | 1.52 | | — | | — | | — | | — | | 0.02 | | 31.1 | | 1.177 | | 28.7 | |
Direct Head | | — | | 43 | | 0.11 | | 44.3 | | 1.78 | | 3.88 | | <0.01 | | 0.01 | | <0.01 | | 0.03 | | 1.60 | | 0.01 | | <0.01 | | 5.15 | | 99.9 | | 0.01 | | 31 | | 1.239 | | 26.4 | |
*Represent the concentrate point on the grade-recovery curve with less than 4% SiO2 and >63% Fe
| | Weight | | | | | | | | | | | | | | | | Distribution, % | | | | | | | | | | | | | | | |
Sample | | % | | SiO2 | | Al2O3 | | Fe2O3 | | MgO | | CaO | | Na2O | | K2O | | TiO2 | | P2O5 | | MnO | | Cr2O3 | | V2O5 | | LOI | | Sum | | S | | Fe | | Sat | |
LIMS Conc | | 28.5 | | 2.17 | | 13.0 | | 63.3 | | 3.84 | | 1.3 | | 20.7 | | 10.4 | | 37.3 | | 10.1 | | 15.4 | | — | | — | | — | | — | | 13 | | 63.3 | | 99.1 | |
Gravity Conc* | | 12.2 | | 0.64 | | 9.94 | | 25.3 | | 6.4 | | 5.05 | | 5.77 | | 5.81 | | 22.6 | | 20.6 | | 8.65 | | — | | — | | — | | — | | 33.1 | | 25.3 | | 0.37 | |
Combined Fe Conc. | | 40.7 | | 2.81 | | 22.9 | | 88.6 | | 10.2 | | 6.35 | | 26.4 | | 16.2 | | 59.9 | | 30.7 | | 24 | | — | | — | | — | | — | | 46.1 | | 88.6 | | 99.5 | |
Gravity Tailings | | 59.3 | | 97.2 | | 77.1 | | 11.4 | | 89.8 | | 93.7 | | 73.6 | | 83.8 | | 40.1 | | 69.3 | | 76 | | — | | — | | — | | — | | 53.9 | | 11.4 | | 0.54 | |
Calc. Head | | 100 | | 100 | | 100 | | 100 | | 100 | | 100 | | 100 | | 100 | | 100 | | 100 | | 100 | | — | | — | | — | | — | | 100 | | 100 | | 100 | |
*Represent the concentrate point on the grade-recovery curve with less than 4% SiO2 and >63% Fe
81

TABLE 21.
WABUSH MINES CONCENTRATE SPECIFICATIONS
Source | | Type | | Fe
% | | P
% | | SiO2
% | | MnO
% | | Al2O3
% | | CaO
% | | MgO
% | | S
% | | Na2O
% | | K2O
% | | CaO/SiO2 | | Basicity | | Moisture
% | |
| | Low Manganese | | | | | | | | | | | | | | | | | | | | | | | | | | | |
Pellets | | Standard, dried | | 65.80 | | 0.010 | | 3.50 | | 1.20 | | 0.40 | | 0.35 | | 0.10 | | 0.010 | | 0.025 | | 0.030 | | 0.10 | | 0.115 | | — | |
Wabush Mines, Labrador | | | | | | | | | | | | | | | | | | | | | | | | | | | | | |
| | Natural | | 64.48 | | 0.010 | | 3.43 | | 1.18 | | 0.39 | | 0.34 | | 0.10 | | 0.010 | | 0.025 | | 0.029 | | 0.10 | | 0.115 | | 2.00 | |
| | | | | | | | | | | | | | | | | | | | | | | | | | | | | |
| | Flux, dried | | 63.45 | | 0.010 | | 3.5 | | 1.15 | | 0.4 | | 2.93 | | 1.5 | | 0.010 | | 0.030 | | 0.047 | | 0.84 | | 1.136 | | — | |
| | Natural | | 62.31 | | 0.010 | | 3.43 | | 1.13 | | 0.39 | | 2.88 | | 1.47 | | 0.010 | | 0.029 | | 0.046 | | 0.84 | | 1.139 | | 1.80 | |
| | | | | | | | | | | | | | | | | | | | | | | | | | | | | |
| | High Manganese | | | | | | | | | | | | | | | | | | | | | | | | | | | |
| | Standard, dried | | 65.00 | | 0.010 | | 3.50 | | 2.00 | | n.a. | | 0.35 | | 0.10 | | 0.010 | | n.a. | | 0.030 | | 0.10 | | n.a. | | — | |
| | Natural | | 63.70 | | 0.010 | | 3.43 | | 1.96 | | n.a. | | 0.34 | | 0.10 | | 0.010 | | n.a. | | 0.029 | | 0.10 | | n.a. | | 2.00 | |
| | | | | | | | | | | | | | | | | | | | | | | | | | | | | |
| | Flux, dried | | 62.30 | | 0.010 | | 3.50 | | 1.95 | | 0.4 | | 2.93 | | 1.50 | | 0.010 | | 0.030 | | 0.060 | | 0.84 | | 0.102 | | — | |
| | Natural | | 60.74 | | 0.010 | | 3.41 | | 1.91 | | 0.39 | | 2.86 | | 1.46 | | 0.010 | | 0.029 | | 0.059 | | 0.84 | | 0.102 | | 2.50 | |
| | | | | | | | | | | | | | | | | | | | | | | | | | | | | |
Concentrates | | | | | | | | | | | | | | | | | | | | | | | | | | | | | |
Wabush Mines | | Low Manganese, dried | | 66.35 | | 0.010 | | 2.90 | | 1.20 | | 0.40 | | 0.10 | | 0.07 | | 0.010 | | 0.020 | | 0.300 | | 0.03 | | 0.052 | | — | |
| | Natural | | 65.02 | | 0.010 | | 2.84 | | 1.18 | | 0.39 | | 0.10 | | 0.07 | | 0.010 | | 0.020 | | 0.290 | | 0.04 | | 0.053 | | 2.00 | |
| | | | | | | | | | | | | | | | | | | | | | | | | | | | | |
| | High Manganese, dried | | 65.45 | | 0.010 | | 2.90 | | 2.00 | | 0.40 | | 0.10 | | 0.07 | | 0.010 | | 0.020 | | 0.400 | | 0.03 | | 0.052 | | — | |
| | Natural | | 64.14 | | 0.010 | | 2.84 | | 1.96 | | 0.39 | | 0.10 | | 0.07 | | 0.010 | | 0.020 | | 0.390 | | 0.04 | | 0.053 | | 2.00 | |
82

17. MINERAL RESOURCE AND MINERAL RESERVE ESTIMATES
No Mineral Resource or Mineral Reserve estimates, neither historic nor new, have been completed for the Property.
83
18. OTHER RELEVANT DATA AND INFORMATION
WGM is unaware of any other available pertinent technical information concerning the Property.
84
19. INTERPRETATION AND CONCLUSIONS
· A drilling program completed by Altius in 2008 consisted of 27 drillholes aggregating 6,129.5 m. This program was the first systematic diamond drilling of the area located immediately south of the Wabush Mine. Drillholes were completed in three areas of the Property, namely: Mills, Mart and Rose Lake areas to test magnetic and gravity anomalies. Drilling targeted various fold limb and fold hinge areas;
· Although Altius’ drillhole collars require survey with DGPS, WGM’s check during its site visit on several collars showed that the collar locations are reasonably accurate. All assays from Altius’ drilling were performed at an accredited laboratory and both Altius and SGS-Lakefield inserted QA/QC materials to endure quality assay results. No samples were, however, re-assayed at a secondary laboratory and this should be standard practice. The drill core samples WGM collected during its site visit were collected independent of Altius and/or BCL and were submitted blind to the laboratory. These samples reported assays reasonably similar to those reported by Altius and thus indicate that Altius’s sample results are reliable;
· Mineralization on the Property comprising iron formation of the Sokoman/Wabush Formation is hosted in a series of upright to slightly overturned anticlines and synclines. Typical of the Wabush area oxide iron formation, it is overlain, and underlain respectively by an Upper Iron Formation (UIF) sequence and a Lower iron Formation (LIF) sequence consisting mainly of silicate iron formation with carbonate. The UIF is in turn overlain by Menihek Formation argillaceous schist. The LIF is underlain by quartzites and dolomite formations and more argillaceous/mica schist formations; respectively the Wishart/Carol, Duley/Denault and Attikamagen Formations;
· In the Mills Lake area, one main tight upright synclinal structure is indicated. This structure has an indicated strike length in the order of perhaps 4.3 km. The main zone oxide iron formation varies in thickness in the areas drilled from less than 40 m to 100 m true thickness. More drilling is required to determine variations in thickness along the indicated structure and refine interpretation of structure.
The Mart and Rose Lake areas are characterized by a repetitive series of tight upright to slightly overturned parallel synclines and anticlines containing zones or stratigraphic units of iron formation. In the Rose Lake area, structures have indicated strike lengths in the order of 4.5 km. Drillhole intersections indicate the main zones of dominantly oxide iron formation vary in true thickness from 70 m on fold limbs, to over 300 m in fold hinge areas. On some sections, OIF and SIF are interlayered with argillaceous/micaceous metasediments. In the Mart Lake area, iron formation is less well developed than in the
85
Rose Lake area. Zones of oxide iron formation are thinner and SIF is more prevalent than in the Rose Lake or Mills Lake areas. More drilling is required in all areas to determine the extent and thicknesses of iron formation and confirm structural interpretation;
· Oxide iron formation on the Property consists dominantly of magnetite-rich material, but includes material that is dominantly magnetite and with lesser hematite, dominantly hematite with moderate magnetite and for some discrete intervals mainly hematite with very little magnetite. Three hundred and forty-seven of Altius’ 2008 drill core samples were oxide iron formation. These samples averaged 30.67% TFe, 44.40% SiO2 and 1.28% Mn, with an overall average magnetite content of 29.5% determined by Satmagan. Overall hematite content is calculated at nearly 11%. Hematite-rich members of the oxide iron formation sequence contain more manganese than magnetite-rich members;
· The limited metallurgical testwork to date indicates that concentrates with iron and silica grades that meet market specifications for manganese cannot be produced, i.e., in the range of 0.08 to 0.2% MnO. However, the limited work done to date suggests manganese levels will be significantly lower than for concentrates and pellets produced from Scully ores at Wabush Mines. The market limitations of manganese content will be a concern for portions of the deposit to ensure that the concentrate specifications for manganese can be maintained in a commercial operation; and
· The technology being considered by Wabush Mines to reduce the manganese content in concentrates should be investigated and tested as a possible way to achieve better quality concentrates, as well as increase the proportion of the deposit that can be included in the Mineral Resource.
86
20. RECOMMENDATIONS
WGM makes the following recommendations:
1. Contacts are required with government to determine implications of Duley Provincial Park to project development and discuss land use issues regarding existing cottages and recreational facilities and other land use issues south of the park within the Property.
2. Environmental studies should be initiated during the next exploration campaign to identify sensitive issues.
3. Drillhole collars should be DGPS surveyed.
4. External check assays by a secondary laboratory should be a routine part of a standard QA/QC protocol. The labs should be requested to include the results for their internal Standards and Blanks on their certificates of Analysis. Project reports should include an analysis of QA/QC data.
5. Sample IDs through various data tables must be kept consistent in syntax.
6. A better approach to sample database structure than used by Altius would be to include the in-field quality control materials in the main assay table and then code them. This would allow for assay certificates to be directly imported into the table without having to partition out in-field quality control samples.
7. Conduct a metallurgical testwork program to further investigate the metallurgical characteristics and probable commercial flowsheet should be carried out on a composite sample from the most recent drill campaign. Then in conjunction with the next drilling campaign, a standard metallurgical concentration test should be carried out to metallurgically map the deposit to guide what areas of the mineralization constitute Mineral Resources. Special attention to the manganese distribution and concentrate specifications should be conducted.
8. Investigate and test the potential to reduce the manganese in the final concentration process as researched by Wabush Mines.
BCL has developed a Phase I program with a budget to advance the Kami Property. The proposed Phase I program consists of:
· Additional linecutting to enable further gravity and magnetic surveys on extension of Mills and Rose Lake grids. Linecutting to infill the Mills Lake grid to 200 m line spacing and to extend the Rose Lake grid to the southwest and northeast as far as Duley Lake; and
87
· �� Diamond drilling of approximately 20 drillholes aggregating 3,500 m. This is broken down into: a) seven holes totalling 1,000 m to infill the Mills Lake grid to 200 m spacing, b) four exploration drillholes totalling 600 m to test gravity anomalies or coincident magnetic/gravity anomalies north and southwest of Rose Lake along the strike of the iron formation, c) the remainder of the drilling, approximately nine holes totalling 1,900 m, to commence infilling the Rose Lake grid at 200 m spacing to further define the structure of the deposit.
BCL’s Phase I program totals approximately $1,000,000 and a budget outline is provided in Table 22.
Phase II work will be carried out contingent on results of Phase I. The purpose of Phase II is to obtain a sufficient density of drilling to enable the preparation of a NI 43-101 compliant Mineral Resources estimate and advance the project towards prefeasibility. Phase II includes expenditures for metallurgical testwork, a prefeasibility study and permitting. Phase II totals approximately $5.5 million.
WGM recommends that BCL incorporate WGM’s recommendations 1 to 8 listed above into their Phase 1 program. This will not add substantially to the current proposed budget and will ensure industry standard practices going forward.
TABLE 22.
PROPOSED EXPLORATION PROGRAM, PHASE I KAMISTIATUSSET PROPERTY
Phase I | | Unit | | Unit Cost
(C$) | | Total Cost
(C$) | |
Linecutting (line km) | | 50 | | $ | 1,000 | | $ | 50,000 | |
Geophysics Surveys, Magnetics and gravity (line km) | | 50 | | $ | 1,300 | | $ | 65,000 | |
Diamond drilling (m) | | 3500 | | $ | 175 | | $ | 612,500 | |
Diamond drilling support, geology, assays (m) | | 3500 | | $ | 70 | | $ | 245,000 | |
Contingency, approximately | | | | | | $ | 27,500 | |
GRAND TOTAL PHASE I | | | | | | C$ | 1,000,000 | |
88
21. SIGNATURE PAGE
This report entitled “Technical Report On The Kamistiatusset Property Newfoundland And Labrador for 0860132 B.C. Ltd and Alderon Resource Corp.”, was prepared and signed by the following authors:
Dated effective as of February 12, 2010.
“Richard W. Risto” | | “G. Ross MacFarlane” |
Richard W. Risto, M.Sc., P.Geo., | | G. Ross MacFarlane, P.Eng., |
Senior Associate Geologist | | Senior Associate Metallurgical Engineer |
| | |
| | |
“David Power” | | |
David Power-Fardy, M.Sc., P.Geo., | | |
Senior Geologist | | |
89

CERTIFICATE
To Accompany the Report Entitled
“Technical Report On The Kamistiatusset Property Newfoundland And Labrador For 0860132 B.C. Ltd. and Alderon Resource Corp.” dated February 12, 2010
I, Richard W. Risto, do hereby certify that:
1. | I reside at 22 Northridge Ave, Toronto, Ontario, Canada, M4J 4P2. |
| |
2. | I am a graduate from the Brock University, St. Catherines, Ontario with an Honours B.Sc. Degree in Geology (1977), Queens University, Kingston, Ontario with a M.Sc. Degree in Mineral Exploration (1983), and I have practised my profession for over 20 years. |
| |
3. | I am a member of the Association of Professional Geoscientists of Ontario (Membership Number 276). |
| |
4. | I am a Senior Associate Geologist with Watts, Griffis and McOuat Limited, a firm of consulting engineers and geologists, which has been authorized to practice professional engineering by Professional Engineers Ontario since 1969, and professional geoscience by the Association of Professional Geoscientists of Ontario. |
| |
5. | I am an independent Qualified Person for the purposes of NI 43-101 and have extensive experience with iron deposits, a variety of other deposit types and the preparation of technical reports. |
| |
6. | I have not visited the Property. |
| |
7. | I have no personal knowledge as of the date of this certificate of any material fact or change, which is not reflected in this report. |
| |
8. | I am solely responsible for Sections 2 to 13, and 15. With co-author David Power-Fardy I am jointly responsible for Section 14 and jointly responsible with co-author G. Ross MacFarlane for Sections 1 and 18 to 20. |
| |
9. | This report was prepared for 0860132 B.C. Ltd. and Alderon Resource Corp., in part by Richard Risto, David Power-Fardy, Ross MacFarlane and WGM. It is based almost exclusively on data that were provided to the authors by Altius Minerals Corporation and 0860132 B.C. Ltd. |
| |
10. | Neither I, nor any affiliated entity of mine, is at present, under an agreement, arrangement or understanding or expects to become, an insider, associate, affiliated entity or employee of 0860132 B.C. Ltd., or Alderon Resource Corp., or any associated or affiliated entities. |
90
11. | Neither I, nor any affiliated entity of mine own, directly or indirectly, nor expect to receive, any interest in the properties or securities of 0860132 B.C. Ltd. or Alderon Resource Corp., or any associated or affiliated companies. |
| |
12. | Neither I, nor any affiliated entity of mine, have earned the majority of our income during the preceding three years from 0860132 B.C. Ltd. or Alderon Resource Corp., or any associated or affiliated companies. |
| |
13. | I have read NI 43-101 and Form 43-101F1 and have prepared the technical report in compliance with NI 43-101 and Form 43-101F1; and have prepared the report in conformity with generally accepted Canadian mining industry practice, and as of the date of the certificate, to the best of my knowledge, information and belief, the technical report contains all scientific and technical information that is required to be disclosed to make the technical report not misleading. |
| signed by |
| “ Richard W. Risto ” |
| |
| |
| Richard W. Risto, M.Sc., P.Geo. |
| February 12, 2010 |
91
CERTIFICATE
To Accompany the Report Entitled
“Technical Report On The Kamistiatusset Property Newfoundland And Labrador For 0860132 B.C. Ltd. and Alderon Resource Corp.” dated February 12, 2010
I, David Power-Fardy, do hereby certify that:
1. | I reside at 28 Tanglewood Drive, Nepean, Ontario, Canada K2H 6P3. |
| |
2. | I am a graduate from the Queen’s University, Kingston, Ontario with M.Sc. Degree in Mineral Exploration (1983), Carleton University, Ottawa, Ontario with an Honours B.Sc. Degree in Geology (1976), and I have practised my profession since that time. |
| |
3. | I am a member of the Association of Professional Geoscientists of Ontario (Membership Number 922). |
| |
4. | I am a Senior Geologist with Watts, Griffis and McOuat Limited, a firm of consulting engineers and geologists, which has been authorized to practice professional engineering by Professional Engineers Ontario since 1969, and professional geoscience by the Association of Professional Geoscientists of Ontario. |
| |
5. | I am an independent Qualified Person for the purposes of NI 43-101 and have extensive experience with iron deposits, a variety of other deposit types and the preparation of technical reports. |
| |
6. | I visited the Property on October 7 and reviewed drill core from the Property in storage in Wabush on October 6 and also on October 8, 2009. |
| |
7. | I have no personal knowledge as of the date of this certificate of any material fact or change, which is not reflected in this report. |
| |
8. | I am jointly responsible with co-author Rick Risto for Section 14. |
| |
9. | This report was prepared for 0860132 B.C. Ltd. and Alderon Resource Corp., in part by Richard Risto, David Power-Fardy, Ross MacFarlane and WGM. It is based almost exclusively on data that were provided to the authors by Altius Minerals Corporation and 0860132 B.C. Ltd. |
| |
10. | Neither I, nor any affiliated entity of mine, is at present, under an agreement, arrangement or understanding or expects to become, an insider, associate, affiliated entity or employee of 0860132 B.C. Ltd. or Alderon Resource Corp. or Altius Minerals Corporation, or any associated or affiliated entities. |
92
11. | Neither I, nor any affiliated entity of mine own, directly or indirectly, nor expect to receive, any interest in the properties or securities of 0860132 B.C. Ltd. or Alderon Resource Corp., or any associated or affiliated companies. |
| |
12. | Neither I, nor any affiliated entity of mine, have earned the majority of our income during the preceding three years from 0860132 B.C. Ltd. or Alderon Resource Corp., or any associated or affiliated companies. |
| |
13. | I have read NI 43-101 and Form 43-101F1 and have prepared the technical report in compliance with NI 43-101 and Form 43-101F1; and have prepared the report in conformity with generally accepted Canadian mining industry practice, and as of the date of the certificate, to the best of my knowledge, information and belief, the technical report contains all scientific and technical information that is required to be disclosed to make the technical report not misleading. |
| “ David Power-Fardy ” |
| |
| |
| David Power-Fardy, M.Sc., P.Geo. |
| February 12, 2010 |
93
CERTIFICATE
To Accompany the Report Entitled
“Technical Report On The Kamistiatusset Property Newfoundland And Labrador For 0860132 B.C. Ltd. and Alderon Resource Corp.” dated February 12, 2010
I, G. Ross MacFarlane, do hereby certify that:
1. | I reside at 1302 Woodgrove Place, Oakville, Ontario, Canada, L6M 1V5. |
| |
2. | I am a graduate of the Technical University of Nova Scotia, Halifax, Nova Scotia, with a Bachelor of Engineering, Mining with Metallurgy Option in 1973 and have practiced my profession since that time. |
| |
3. | I am a member of the Association of Professional Engineers Ontario (Registration Number 28062503). |
| |
4. | I am a Senior Associate Metallurgical Engineer with Watts, Griffis and McOuat Limited, a firm of consulting engineers and geologists, which has been authorized to practice professional engineering by Professional Engineers Ontario since 1969, and professional geoscience by the Association of Professional Geoscientists of Ontario. |
| |
5. | I have more than 35 years of experience in the operation, evaluation, and design of mining and milling operations. |
| |
6. | I am an independent Qualified Person for the purposes of NI 43-101 and have knowledge of and experience with iron ore operations including mining, concentrating, and pelletizing. I am responsible for Section 16 and share responsibility for Sections 1 and 18 to 20 with Richard Risto. |
| |
7. | I have not visited the Property. |
| |
8. | I have no personal knowledge as of the date of this certificate of any material fact or change, which is not reflected in this report. |
| |
9. | I am responsible for Section 16, and jointly responsible with co-author Richard Risto for Sections 1, 18 to 20. |
| |
10. | This report was prepared for 0860132 B.C. Ltd. and Alderon Resource Corp., in part by Richard Risto, David Power-Fardy, Ross MacFarlane and WGM. It is based almost exclusively on data that were provided to the authors by Altius Minerals Corporation and 0860132 B.C. Ltd. |
94
11. | Neither I, nor any affiliated entity of mine, is at present, under an agreement, arrangement or understanding or expects to become, an insider, associate, affiliated entity or employee of 0860132 B.C. Ltd., or Alderon Resource Corp.’s or Altius Minerals Corporation, or any associated or affiliated entities. |
| |
12. | Neither I, nor any affiliated entity of mine own, directly or indirectly, nor expect to receive, any interest in the properties or securities of 0860132 B.C. Ltd. or Alderon Resource Corp. or Altius Minerals Corporation, or any associated or affiliated companies. |
| |
13. | Neither I, nor any affiliated entity of mine, have earned the majority of our income during the preceding three years from 0860132 B.C. Ltd. or Alderon Resource Corp. or any associated or affiliated companies. |
| |
14. | I have read NI 43-101 and Form 43-101F1 and have prepared the technical report in compliance with NI 43-101 and Form 43-101F1; and have prepared the report in conformity with generally accepted Canadian mining industry practice, and as of the date of the certificate, to the best of my knowledge, information and belief, the technical report contains all scientific and technical information that is required to be disclosed to make the technical report not misleading. |
| “ Ross MacFarlane ” |
| |
| |
| Ross MacFarlane, B.Eng., P.Eng. |
| February 12, 2010 |
95
REFERENCES
Allaire, A., E. Palumbo, P. Live, and R. Scherrer
2008 Technical Report Bloom Lake Project Labrador Trough, Quebec Technical Report 43-101 on the feasibility Study for the Bloom Lake Project 8-million tones per year of Iron Concentrate prepared for Consolidated Thompson Iron Mines Ltd. and BBA Inc.
Avison, A. T., Alcock, P. W., Poisson, P. and Connell, E.
1984 Assessment report on geological, geochemical and geophysical exploration for 1983 submission on Labrador Mining and Exploration Company Limited blocks 4, 8 to 18, 20, 21, 26 to 31, 33, 43, 44, 45, 53, 55, 57, 63, 68, 78, 79, 80, 84 to 87, 92, 94, 95, 96, 100, 103 to 108, 110, 115 to 118, 120 to 125, 127 to 131, 134, 136, 138, 139, 140 and 142 in the Labrador City and Schefferville areas, Labrador, 4 reports. Newfoundland and Labrador Geological Survey, Assessment File LAB/0666, 1984, 520 p.
Brown, Dennis, Tom Rivers and Tom Calon
1992 A Structural analysis of a metamorphic fold-thrust belt, northeast Gagnon terrane, Grenville Province, Canadian Journal of Earth Science 29, pp. 1915-1927.
Cotnoir, Alain
2001 Exploration Assessment report of Sublicenced Blocks Licences 24 to 42; Mining Leases 10-B22-1, 12-B22-2, 13-B22-3, 14-B22-4, 16-B22-6, 17-B22-7, 18-B22-8, 19-B22-9, 20-B22-10, 22-B64-1, 22-B64-2, 114-224M, 116-224M, 125-223M, 132-223M, 6695M, 22-B64-1, 22-B64-2; and Map Staked Licence 7782M to 7803M. NAD 27; Zone 19; NTS: 22B/14, 22B/15, 22G/1-22G/3, 22G/7-22G/10 January-December 2001 Volume 1, Iron Ore Company of Canada Resource Assessment Program Labrador City, Newfoundland —Labrador.
Crouse, R.A.
1954 Report on the Mills Lake-Dispute Lake area, Labrador, Iron ore Company of Canada, Newfoundland and Labrador Geological Survey Assessment file 23B/0006, 22 p.
Davenport, P. H. and Butler, A. J.
1983 Regional geochemical surveys, In Current research, Edited by M. J. Murray, P. D. Saunders, W. D. Boyce and R. V. Gibbons, Newfoundland and Labrador Geological Survey, Report 83~01, pp. 121~125.
Farquharson, G., and Thalenhorst, H.
2006 Wabush Mines Review of Scully Mine Reserves fro Department of Natural Resources Government of Newfoundland and Labrador, Strathcona Mineral Services Limited, 23 p.
96
Geological Survey of Canada
1975 Lac Virot, Newfoundland — Quebec. Geophysical Series Map 6006G, 1975. Geolfile 023B/14/0056.
Grant, J. M.
1979 Drill report on block 57 in the Wabush area, Labrador. Labrador Mining and Exploration Company Limited Iron Ore Company of Canada. Newfoundland and Labrador Geological Survey, Assessment File 23B/14/0121, 1979, 6 p.
Gross, G.A.
1996 Lake Superior-type iron-formation: in Geology of Canadian Mineral Deposit Types, (ed.) O.R. Eckstrand, W.D. Sinclair, and R.I. Thorpe; Geological Survey of Canada, Geology of Canada, No. 8, pp. 54-66 (also Geological Society of America, the Geology of North America, v. P-1).
1996 Stratiform iron: in Geology of Canadian Mineral Deposit Types, (ed.) O.R. Eckstrand, W.D. Sinclair, and R.I. Thorpe; Geological Survey of Canada, Geology of Canada, No. 8, pp. 41-54 (also Geological Society of America, the Geology of North America, v. P-1).
1993 Industrial and Genetic Models for Iron Ore in Iron-Formations in Geological Survey of Canada, Special Paper 40, pp. 151-170.
Gross, G.A., Glazier, W., Kruechi, G., Nichols L., and O’Leary, J.
1972 Iron Ranges of the Labrador Trough and Northern Quebec, 24th International Geological Congress, Montreal Quebec Canada, Guidebook excursion A55, 66 p.
Hird, J.M.
1960 Report on the Wabush iron ore deposits, Michigan College of Mining Technology and Iron Ore Company of Canada, Newfoundland Labrador Geological Survey, Internal Report, 35 p [023B/0033].
James, H.L.
1954 Sedimentary Facies of Iron Formation; Economic Geology, v. 9, pp. 251-266.
Kelly, R. G. and Stubbins, J .B.
1983 Assessment report on topographic mapping program for the Carol project for 1982 submission on lease blocks 22, 22~5 and 22~6 and licence blocks 23, 24, 25, 32, 34 to 38, 41, 42, 60 and 61 in the Labrador City area, Labrador, Iron Ore Company of Canada and Labrador Mining and Exploration Company Limited, Newfoundland and Labrador Geological Survey, Assessment File LAB/0633, 27 p.
97
Klein, Cornelis, Jr.
1966 Mineralogy and Petrology of the Metamorphosed Wabush Iron Formation, Southwestern Labrador, Journal of Petrology 7, Part 2, pp. 246-305.
Macdonald, R. D.
1960 Report of operations for 1959 in Labrador, Iron Ore Company of Canada and Labrador Mining and Exploration Company Limited, Newfoundland and Labrador Geological Survey, Assessment File LAB/0263, 14 p.
McConnell, J.
1984 Reconnaissance and detailed geochemical surveys for base metals in Labrador, Government of Newfoundland and Labrador, Department of Mines and Energy, Mineral Development Division, Report 84~02, 122 p.
Mathieson, R.D.
1957 Report of exploratory drilling of the Wabush project in the Duley Lake-Mills Lake area, Labrador, iron Ore Company of Canada, Newforundland and Labrador Geological Survey Assessment file 23B/0011.
Neal, H.E.
1951 Exploration Report on the Wabush Lake-Shabogamo Lake area, Labrador Iron Ore Company of Canada, Newfoundland and Labrador Geological Survey Assessment File 23G/0004, 47 p.
Nincheri, R.
1959 Geological and geophysical report of the Duley Mills Lake area, Labrador, Labrador Mining and Exploration Company Limited, Newfoundland and Labrador Geological Survey, Assessment File 23G/0047, 28 p.
O’Leary, R. Cannell and D. Honsberger
1972 Geology of the Scully Mine, CIM Bulletin for January 1972, pp. 25-29.
Price, J. B.
1979 Report on a ground magnetometer survey on block 24, Labrador, Labrador Mining and Exploration Company Limited, Newfoundland and Labrador Geological Survey, Assessment File 23B/0107.
98
Ramsey Way, Rod Churchill and Carol Seymour
2007 First Year Assessment Report for map Staked Licences 11927M, 12853M, and 12854M and Second Year Assessment Report for 10501M covering Compilation and reconnaissance Geological Investigations (Mills Lake Property, Western Labrador) Newfoundland and Labrador, NTS 23B14 and 23B15 a report prepared for Altius Resources Inc.
Rivers, T.
1985 Geology Map of the Lac Virot Area, Labrador~Québec (parts of 23G and 23B) 1:100,000, Geological Survey of Canada under the Canada-Newfoundland cooperative mineral program (1982~1984), Department of Mines and Energy, Government of Newfoundland and Labrador, Map 85~25.
Rivers, T. and Clarke, M.
1980 Geological map of Flora Lake, Government of Newfoundland and Labrador, Department of Mines and Energy, Mineral Development Division, Map 80~282.
Seymour, Carol, Rod Churchill and Lawrence Winter
2008 First, Second and Third Year Assessment Report Covering Reconnaissance Geological Mapping, Prospecting, Airborne Geophysics, Line Cutting and Geochemistry for Map Staked Licences 10501M, 11927M, 12853M, 12854M, 13935M, and 13937M (Kamistiatusset Property, Western Labrador) Newfoundland and Labrador, NTS 23B14 and 23B15 prepared for Altius Resources Inc.
Seymour, Carol, Rod Churchill, Lawrence Winter and Jackie O’Driscoll
2009 First and Fourth Year Assessment Report covering Diamond Drilling, Line Cutting and Ground Geophysical Surveys (Gravity and Total Field Magnetic Field) for map Staked Licences 14957M (1st Yr), 14962M (1st Yr), 14967M (1st Yr), 14968M (1st Yr) and 15037M (4th Yr), Kamistiatusset Property, Western Labrador, NTS 23B14 and 23B15 prepared for Altius Resources Inc.
Simpson, H. J., Poisson, P. and McLachlan, C.
1985 Assessment report on geological, geochemical and geophysical exploration for 1985 submission on Labrador Mining and Exploration Company Limited blocks 1, 2, 3, 5, 6, 7, 15, 17, 19, 19~1, 19~ 2, 19~3, 20, 21, 22, 22~4, 22~5, 22~6, 22~9, 22~10, 23 to 38, 41, 42, 51 to 54, 57 to 68, 72 to 76, 82, 84, 85, 86, 88, 89, 90, 92, 99, 101, 102, 111, 112, 116, 118, 121 and 128 in the Labrador City and Schefferville areas, Labrador, 4 volumes, Labrador Mining and Exploration Company Limited, Newfoundland and Labrador Geological Survey, Assessment File LAB/0723, 900 p.
99
Smith, P. J. R., Stubbins, J. B., Avison, A. T., Grant, J .M. and Hallof, P. G.
1981 Assessment report on geological, geochemical, geophysical and diamond drilling exploration for the Carol project for 1981 submission on Labrador Mining and Exploration Company Limited blocks 22 to 42, 22~1 to 22~10, 64~1, 64~2, 51 to 101, 103 to 108, 110, 115 to 118, 120 to 125, 127 to 131 and 133 to 143 in the Wabush, Labrador City and Schefferville areas, western Labrador, 49 reports, Iron Ore Company of Canada (option holder) and Labrador Mining and Exploration Company Limited (owner of property), Newfoundland and Labrador Geological Survey, Assessment File LAB/0600, 777 p.
Stubbins, J. B.
1973 Report for the year ending 1972 for the Labrador City and Schefferville area, Labrador, Labrador Mining and Exploration Company Limited, Newfoundland and Labrador Geological Survey, Assessment File LAB/0180.
1978 Report on geochemical sampling and other work in the Wabush Lake area, Labrador, Iron Ore Company of Canada and Labrador Mining and Exploration Company Limited.
Way, Ramsey, Rod Churchill and Carol Seymour
2007 First year assessment report for map staked licences 11927M, 12853M and 12854M and Second year assessment report for 10501M covering compilation and reconnaissance geological investigations (Mills Lake Property, Western Labrador) Newfoundland and Labrador, NTS 23B14 and 23B15 prepared for Altius Resources Inc.
100

APPENDIX 1:
WGM INDEPENDENT SAMPLING RESULTS
101