UNITED STATES
SECURITIES AND EXCHANGE COMMISSION
Washington, D.C. 20549
FORM N-CSR
CERTIFIED SHAREHOLDER REPORT OF REGISTERED
MANAGEMENT INVESTMENT COMPANIES
Investment Company Act file number: 811-22903
J.P. Morgan Exchange-Traded Fund Trust
(Exact name of registrant as specified in charter)
270 Park Avenue
New York, NY 10017
(Address of principal executive offices) (Zip code)
Frank J. Nasta, Esq.
J.P. Morgan Investment Management Inc.
270 Park Avenue
New York, NY 10017
(Name and Address of Agent for Service)
With copies to:
| | |
| Elizabeth A. Davin, Esq. | | Jon S. Rand Esq. |
| JPMorgan Chase & Co. | | Dechert LLP |
| 1111 Polaris Parkway | | 1095 Avenue of the Americas |
| Columbus, OH 43240 | | New York, NY 10036 |
Registrant’s telephone number, including area code: (844) 457-6383
Date of fiscal year end: October 31
Date of reporting period: November 1, 2015 through October 31, 2016
Form N-CSR is to be used by management investment companies to file reports with the Commission not later than 10 days after the transmission to stockholders of any report that is required to be transmitted to stockholders under Rule 30e-1 under the Investment Company Act of 1940 (17 CFR 270.30e-1). The Commission may use the information provided on Form N-CSR in its regulatory, disclosure review, inspection, and policymaking roles.
A registrant is required to disclose the information specified by Form N-CSR, and the Commission will make this information public. A registrant is not required to respond to the collection of information contained in Form N-CSR unless the Form displays a currently valid Office of Management and Budget (“OMB”) control number. Please direct comments concerning the accuracy of the information collection burden estimate and any suggestions for reducing the burden to Secretary, Securities and Exchange Commission, 450 Fifth Street, NW, Washington, DC 20549-0609. The OMB has reviewed this collection of information under the clearance requirements of 44 U.S.C. Section 3507.
ITEM 1. REPORTS TO STOCKHOLDERS.
The following is a copy of the report transmitted to shareholders pursuant to Rule 30e-1 under the Investment Company Act of 1940 (17 CFR 270.30e-1).
Annual Report
JPMorgan Exchange-Traded Funds
October 31, 2016
JPMorgan Diversified Return Emerging Markets Equity ETF
JPMorgan Diversified Return Europe Currency Hedged ETF
JPMorgan Diversified Return Europe Equity ETF
JPMorgan Diversified Return Global Equity ETF
JPMorgan Diversified Return International Currency Hedged ETF
JPMorgan Diversified Return International Equity ETF
JPMorgan Diversified Return U.S. Equity ETF
JPMorgan Diversified Return U.S. Mid Cap Equity ETF
CONTENTS
Investments in a Fund are not bank deposits or obligations of, or guaranteed or endorsed by, any bank and are not insured or guaranteed by the FDIC, the Federal Reserve Board or any other government agency. You could lose money if you sell when the Fund’s share price is lower than when you invested.
Past performance is no guarantee of future performance. The general market views expressed in this report are opinions based on market and other conditions through the end of the reporting period and are subject to change without notice. These views are not intended to predict the future performance of a Fund or the securities markets. References to specific securities and their issuers are for illustrative purposes only and are not intended to be, and should not be interpreted as, recommendations to purchase or sell such securities. Such views are not meant as investment advice and may not be relied on as an indication of trading intent on behalf of any Fund.
Prospective investors should refer to the Funds’ prospectuses for a discussion of the Funds’ investment objectives, strategies and risks. Call J.P. Morgan Exchange-Traded Funds at (844) 457-6383 for a prospectus containing more complete information about a Fund, including management fees and other expenses. Please read it carefully before investing.
Shares are bought and sold throughout the day on an exchange at market price (not NAV) through a brokerage account, and are not individually redeemed from a Fund. Shares may only be redeemed directly from a Fund by Authorized Participants, in very large creation/redemption units. Brokerage commissions will reduce returns.
PRESIDENT’S LETTER
OCTOBER 31, 2016 (Unaudited)
Dear Shareholders,
I am pleased to report that all of our J.P. Morgan Exchange-Traded Funds met their objectives this past year, with returns closely corresponding to those of their diversified factor benchmarks, after fees and expenses. Three of the four funds with track records of one year or more — JPMorgan Diversified Return Global Equity (JPGE), JPMorgan Diversified Return International Equity (JPIN) and JPMorgan Diversified Return U.S. Equity (JPUS) — outperformed their corresponding capitalization-weighted indexes. The fourth, Diversified Return Emerging Markets Equity (JPEM), lagged behind its market capitalization-weighted index by less than 0.25% but still had double-digit returns. The potential benefits of our approach have gained industrywide recognition. Fund Action named our Diversified Return Global Equity ETF (JPGE) as the “Most Innovative Equity ETF.”1 Perhaps even more gratifying is the confidence ETF investors have placed in us. Cogent Reports’ 2016 Advisor Brandscape ranked us among the most trusted ETF providers.2 We believe the honor acknowledges an integrity that has endured since our firm’s founding, and it underscores our foremost commitment to our clients. In another confirmation of the appeal of our investment approach, our suite of ETFs reached a milestone of $1 billion in assets under management in early December.
| | |

| | “The potential benefits of our approach have gained industrywide recognition.” - Robert F. Deutsch |
Investment implications of an unprecedented election
Over the past year coming into the fall’s U.S. presidential election, many professional economists looked on the economy as a healthy tortoise — fundamentally sound despite its gradual pace — not the sickly hare that worried markets even as stock valuations climbed. The unexpected election result has upset the economists’ relatively confident calculations. Consensus has given way to uncertainty.
Will the fiscal stimulus and tax reform that the incoming administration has talked about become the law of the land? If so, will they revive the hare or induce inflationary fever in the tortoise? Questions so basic about the direction of policy and the economic shifts it might imply almost inevitably invite periods of market volatility.
A steady course for the road ahead
We have built our “smart beta” ETFs to provide a smoother ride during volatile periods and to diversify unrewarded risks. The multi-factor stock selection process for J.P. Morgan ETFs’ underlying indexes seeks to identify stocks that exhibit the factors that drive returns, such as momentum or mispriced valuation. We have combined these factors into our suite of ETFs which are geared to avoid cyclical movement in asset prices. To continue our example, if mispriced stocks underperform, we might expect the market to favor momentum exposures of the ETF’s underlying index.
The same kind of systematic diversification informs our technique for handling risk. By maintaining a neutral risk weighting across economic sectors. The ETF underlying indexes seek to avoid a concentration in overvalued segments of the market, which we believe is the primary flaw in traditional equity index funds.
We are grateful for your belief in our firm and its process. We have extended our range of factor-based ETF investments in recent months with the JPMorgan Diversified Return U.S. Mid Cap Equity ETF (JPME) and an active ETF, the JPMorgan Diversified Alternatives ETF (JPHF). We believe JPHF bears especially close watching.3 We feel this new ETF can take portfolio diversification, one of the most valued features of our ETFs, to the next level.
If you have any questions, please visit www.jpmorganetfs.com or call J.P. Morgan Exchange Traded Funds at 1-844-457-6383.
Sincerely yours,

Robert F. Deutsch
President, J.P. Morgan Exchange Traded Funds
J.P. Morgan Asset Management
| 1 | Fund Action ETF US Performance Awards 2016: The ETF awards are judged based on performance and/or asset flows over a 12 month period ending in September 2015. Data from earlier periods can be used to provide context, but will not be central to the judging decision. As well as performance data, judges will also consider the management firm’s and fund’s reputation in the market place — will give credit to managers who have shown innovation in new products and fee offerings, etc. Only Funds with their management/advisory company or team based in the U.S. or Canada are eligible for the awards. The awards will only be given to those firms who can demonstrate solid performance, positive asset flows and real credibility among advisors and investors. There is no minimum asset size required for any category. Past performance is not a guarantee of future performance. |
| 2 | Cogent Reports conducted an online survey with 1,460 financial advisors from January to March of 2016. In order to qualify, respondents were |
| | required to have an active book of business of at least $5 million and offer investment advice or planning services to individual investors on a fee or transactional basis. Cogent Reports set quota targets and weighted the data to be representative of the overall advisor universe using the Discovery Data Financial Services Industry database as a sample source. The survey results were published in June 2016. Past performance is not a guarantee of future performance. |
| 3 | Diversification does not guarantee returns or eliminate the risk of loss. There is no guarantee the Fund will meet its investment objective. JPMorgan Diversified Alternatives ETF is actively managed and will likely engage in active and frequent trading leading to increased portfolio turnover, higher transaction costs and the possibility of increased capital gains. Alternative investments and strategies involve higher risks than traditional investments and are not suitable for all investors. |
| | | | | | | | |
| | | |
| OCTOBER 31, 2016 | | JPMORGAN EXCHANGE-TRADED FUNDS | | | | | 1 | |
JPMorgan Diversified Return Emerging Markets Equity ETF
FUND COMMENTARY
FOR THE YEAR ENDED OCTOBER 31, 2016 (Unaudited)
| | | | |
| REPORTING PERIOD RETURN: | | | |
| JPMorgan Diversified Return Emerging Markets Equity ETF * | | | 11.02% | |
| Market Price** | | | 11.63% | |
| FTSE Emerging Diversified Factor Index (net of foreign withholding taxes) | | | 11.92% | |
| FTSE Emerging Index (net of foreign withholding taxes) | | | 11.25% | |
| Morgan Stanley Capital International (MSCI) Emerging Markets Index (net of foreign withholding taxes) | | | 9.27% | |
| |
| Net Assets as of 10/31/2016 | | $ | 43,809,461 | |
INVESTMENT OBJECTIVE***
The JPMorgan Diversified Return Emerging Markets Equity ETF (the “Fund”) seeks investment results that closely correspond, before fees and expenses, to the performance of the FTSE Emerging Diversified Factor Index (the “Underlying Index”).
INVESTMENT APPROACH
The Fund is passively managed to the Underlying Index, which provides emerging markets equity exposure, diversified across emerging market regions and super-sectors. The Underlying Index uses a proprietary multi-factor stock selection process that utilizes the following characteristics: value, momentum and quality. The Underlying Index methodology includes quarterly rebalancing.
HOW DID THE MARKET PERFORM?
During the reporting period, the recovery in emerging market equity prices this year was supported on many fronts: an improving growth outlook, a strong rebound in many emerging market currencies and the first signs of upgrades to corporate earnings estimates in years. For the twelve months ended October 31, 2016, the MSCI Emerging Markets Index returned 9.27%.
HOW DID THE FUND PERFORM?
The Fund posted a positive absolute return for the twelve months ended October 31, 2016, and had a performance deviation of -0.90% from the Underlying Index. Because the Fund’s holdings were closely aligned with those of the Underlying Index, variances in relative performance due to security selection and/or sector allocation were not significant. The majority of the Fund’s deviations from the Underlying Index were related to issues around local market access in certain countries, differences in the net asset value calculations and foreign exchange pricing between the Underlying Index and the Fund, and fees and operating expenses incurred by the Fund.
HOW WAS THE FUND POSITIONED?
At the end of the reporting period, the Fund’s and the Underlying Index’s largest allocations of assets were to China/India and North Asia (Taiwan) and the smallest allocations were to the Europe/Middle East and Africa and Latin America. In terms of sectors, the Fund’s and Underlying Index’s largest weightings were in the financials and industrials sectors, while the smallest weightings were in the defensives and commodities sectors.
| | | | | | |
| | | |
| 2 | | | | JPMORGAN EXCHANGE-TRADED FUNDS | | OCTOBER 31, 2016 |
| | | | | | | | |
| TOP TEN EQUITY HOLDINGS OF THE PORTFOLIO**** | |
| | 1. | | | iShares MSCI India ETF | | | 8.6 | % |
| | 2. | | | Taiwan Semiconductor Manufacturing Co., Ltd. | | | 3.2 | |
| | 3. | | | Tencent Holdings Ltd. | | | 3.0 | |
| | 4. | | | China Mobile Ltd. | | | 2.8 | |
| | 5. | | | Hon Hai Precision Industry Co., Ltd. | | | 2.0 | |
| | 6. | | | Ambev S.A. | | | 1.5 | |
| | 7. | | | China Construction Bank Corp. | | | 1.3 | |
| | 8. | | | Telekomunikasi Indonesia Persero Tbk PT | | | 1.3 | |
| | 9. | | | Itau Unibanco Holding S.A. | | | 1.1 | |
| | 10. | | | Banco Bradesco S.A. | | | 1.0 | |
| | | | |
PORTFOLIO COMPOSITION BY COUNTRY**** | |
| Taiwan | | | 19.9 | % |
| China | | | 19.0 | |
| Brazil | | | 12.2 | |
| India | | | 8.6 | |
| South Africa | | | 7.2 | |
| Indonesia | | | 5.8 | |
| Thailand | | | 5.7 | |
| Russia | | | 5.4 | |
| Malaysia | | | 4.5 | |
| Philippines | | | 2.2 | |
| Mexico | | | 2.2 | |
| Turkey | | | 1.5 | |
| United Arab Emirates | | | 1.5 | |
| Poland | | | 1.3 | |
| Chile | | | 1.2 | |
| Other (each less than 1%) | | | 1.8 | |
| * | | The return shown is based on net asset value calculated for shareholder transactions and may differ from the return shown in the financial highlights, which reflects adjustments made to the net asset value in accordance with accounting principles generally accepted in the United States of America. The net asset value was $48.68 as of October 31, 2016. |
| ** | | Market price cumulative return is calculated assuming an initial investment made at the market price at the beginning of the period, reinvestment of all dividends and distributions at market price during the period, and sale at the market price on the last day of the period. The price used to calculate the market price return is the midpoint of the bid/ask spread at the close of business on the NYSE Arca. The midpoint price was $48.98 as of October 31, 2016. |
| *** | | The adviser seeks to achieve the Fund’s objective. There can be no guarantee it will be achieved. |
| **** | | Percentages indicated are based on total investments as of October 31, 2016. The Fund’s composition is subject to change. |
| | | | | | | | |
| | | |
| OCTOBER 31, 2016 | | JPMORGAN EXCHANGE-TRADED FUNDS | | | | | 3 | |
JPMorgan Diversified Return Emerging Markets Equity ETF
FUND COMMENTARY
FOR THE YEAR ENDED OCTOBER 31, 2016 (Unaudited) (continued)
| | | | | | | | | | | | |
AVERAGE ANNUAL TOTAL RETURNS AS OF OCTOBER 31, 2016 | |
| | | |
| | | INCEPTION DATE | | | 1 YEAR | | | SINCE
INCEPTION | |
JPMorgan Diversified Return Emerging Markets Equity ETF | | | | | | | | | | | | |
Net Asset Value | | | 1/07/2015 | | | | 11.02 | % | | | 0.23 | % |
Market Price | | | | | | | 11.63 | % | | | 0.59 | % |
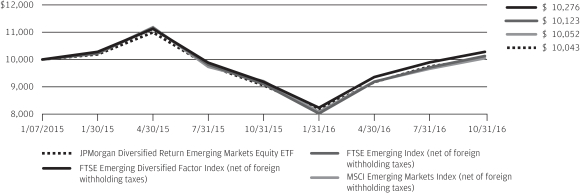
LIFE OF FUND PERFORMANCE (1/07/15 TO 10/31/16)
The performance quoted is past performance and is not a guarantee of future results. Exchange-traded funds are subject to certain market risks. Investment returns and principal value of an investment will fluctuate so that an investor’s shares, when sold or redeemed, may be worth more or less than their original cost. Current performance may be higher or lower than the performance data shown. For up-to-date, month-end performance information please call 1-844-457-6383.
Fund commenced operations on January 7, 2015.
The graph illustrates comparative performance for $10,000 invested in shares of the JPMorgan Diversified Return Emerging Markets Equity ETF, the FTSE Emerging Diversified Factor Index, the FTSE Emerging Index, and the MSCI Emerging Markets Index from January 7, 2015 to October 31, 2016. The performance of the Fund reflects the deduction of Fund expenses and assumes reinvestment of all dividends and capital gain distributions, if any. The performance of the FTSE Emerging Diversified Factor Index, the FTSE Emerging Index and the MSCI Emerging Markets Index does not reflect the deduction of expenses associated with an exchange-traded fund and has been adjusted to reflect reinvestment of all dividends and capital gain distributions of the securities included in the Index, if applicable. The FTSE Emerging Diversified Factor Index is an index comprised of equity securities from emerging markets selected to represent a diversified set of factor characteristics, originally developed by the adviser and its holdings are selected by the index provider primarily from the constituents of the FTSE Emerging Index. The FTSE Emerging Index is a market-capitalization weighted index and is part of the FTSE Global Equity
Index Series. The series includes large and mid cap securities from advanced and secondary emerging markets, classified in accordance with FTSE’s transparent Country Classification Review Process. The FTSE Emerging Index provides investors with a comprehensive means of measuring the performance of the most liquid companies in the emerging markets. FTSE International Limited is the index provider for the two FTSE indexes. The MSCI Emerging Markets Index is a free float-adjusted market capitalization weighted index that is designed to measure the equity market performance of emerging markets. Investors cannot invest directly in an index.
Fund performance reflects the waiver of the Fund’s fees and reimbursement of expenses for certain periods since the inception date. Without these waivers and reimbursements, performance would have been lower. Also, performance shown in this section does not reflect the deduction of taxes that a shareholder may pay on Fund distributions or redemption or sale of Fund shares.
International investing involves a greater degree of risk and increased volatility. Changes in currency exchange rates and differences in accounting and taxation policies outside the United States can raise or lower returns. Also, some overseas markets may not be as politically and economically stable as the United States and other nations.
The returns shown are based on net asset values calculated for shareholder transactions and may differ from the returns shown in the financial highlights, which reflect adjustments made to the net asset values in accordance with accounting principles generally accepted in the United States of America.
| | | | | | |
| | | |
| 4 | | | | JPMORGAN EXCHANGE-TRADED FUNDS | | OCTOBER 31, 2016 |
JPMorgan Diversified Return Europe Currency Hedged ETF
FUND COMMENTARY
FOR THE PERIOD APRIL 1, 2016 (FUND INCEPTION DATE) THROUGH OCTOBER 31, 2016 (Unaudited)
| | | | |
| REPORTING PERIOD RETURN: | | | |
| JPMorgan Diversified Return Europe Currency Hedged ETF* | | | 5.96% | |
| Market Price** | | | 6.08% | |
| FTSE Developed Europe Diversified Factor 100% Hedged to USD Index (net of foreign withholding taxes) | | | 6.89% | |
| FTSE Developed Europe Diversified Factor Index (net of foreign withholding taxes) | | | -0.73% | |
| FTSE Developed Europe Index (net of foreign withholding taxes) | | | 0.75% | |
| |
| Net Assets as of 10/31/2016 | | $ | 26,483,268 | |
INVESTMENT OBJECTIVE***
The JPMorgan Diversified Return Europe Currency Hedged ETF (the “Fund”) seeks investment results that closely correspond, before fees and expenses, to the performance of the FTSE Developed Europe Diversified Factor 100% Hedged to USD Index (the “Underlying Index”).
INVESTMENT APPROACH
The Fund is passively managed to the Underlying Index, which is composed of large and mid-cap equity securities in Europe, diversified across industries and international regions. The Underlying Index uses a proprietary multifactor selection process that measures the following characteristics: valuation, momentum and quality. The Underlying Index methodology includes quarterly rebalancing. In addition to reflecting European stock performance, the Underlying Index attempts to minimize the impact of exchange rate fluctuations by hedging out European currency exposure on a monthly basis.
HOW DID THE MARKET PERFORM?
Global financial markets generally weathered a sharp sell-off and rebounded to provide positive returns over the reporting period amid continued economic stimulus from leading central banks. Markets appeared to absorb the Federal Reserve’s December 2015 interest rate increase — the first in a decade — with little disruption. Investor concerns about the health of China’s economy sparked a sell-off in global financial markets and led to the worst start of any year on record for U.S. equity prices.
By the end of March 2016, global prices for both equities and crude oil had rebounded from mid-February lows and emerging market equities in particular experienced a brief but significant rise in prices. However, British voters confounded the expectations of some at the end of June 2016 and voted to exit the European Union. The unexpected result of the so-called Brexit referendum led to a sell-off in financial markets. Within days, financial markets recovered and volatility subsided. Notably, crude oil prices reached 15-month highs in October 2016 amid expectations that the Organization of Petroleum Exporting Countries would agree to production caps that would reduce global inventories.
HOW DID THE FUND PERFORM?
The Fund posted a positive absolute performance for the period from the Fund’s inception, April 1, 2016 to October 31, 2016.
During the period, the Fund’s performance deviated by -0.93% from the Underlying Index. The Fund and the Underlying Index outperformed the FTSE Developed Europe Diversified Factor Index, which is composed of large and mid-cap equity securities in Europe, diversified across industries and international regions and contains no currency hedge. The Fund also outperformed the FTSE Developed Europe Index, which is a more traditional market capitalization weighted index.
Because the Fund’s holdings were closely aligned with those of the Underlying Index, variances in performance relative to the Underlying Index were not significant. The majority of the Fund’s deviation against the Underlying Index was due to differences in valuations because of the timing of the local market closings and the net asset value calculations, the Fund’s small cash allocation, and fees and operating expenses incurred by the Fund.
HOW WAS THE FUND POSITIONED?
By seeking to track the Underlying Index, the Fund seeks to deliver risk-adjusted returns by avoiding undue concentrations of risk that tend to characterize more traditional market-capitalization weighted indexes. The Underlying Index’s weightings are structured to distribute risk evenly across 10 economic sectors. A multi-factor stock screen is then used to identify the most attractive stocks in each sector of the Underlying Index, while avoiding the least attractive stocks. During the reporting period, the Fund’s largest country weightings were in the U.K., France and Germany, while its smallest positions were in Ireland, Portugal and Austria. The Fund’s largest average sector weightings were in the consumer goods, health care and consumer services sectors, while its smallest average positions were in the oil & gas, financials and basic materials sectors.
| * | | The return shown is based on net asset value calculated for shareholder transactions and may differ from the return shown in the financial highlights, which reflects adjustments made to the net asset value in accordance with accounting principles generally accepted in the United States of America. The net asset value was $26.48 as of October 31, 2016. |
| ** | | Market price cumulative return is calculated assuming an initial investment made at the inception date net asset value, reinvestment of all dividends and distributions at market price during the period, and sale at the market price on the last day of the period. The price is used to calculate the market price return is the midpoint of the bid/ask spread at the close of business on the NYSE Arca. The midpoint price was $26.52 as of October 31, 2016. |
| *** | | The adviser seeks to achieve the Fund’s objective. There can be no guarantee it will be achieved. |
| | | | | | | | |
| | | |
| OCTOBER 31, 2016 | | JPMORGAN EXCHANGE-TRADED FUNDS | | | | | 5 | |
JPMorgan Diversified Return Europe Currency Hedged ETF
FUND COMMENTARY
FOR THE PERIOD APRIL 1, 2016 (FUND INCEPTION DATE) THROUGH OCTOBER 31, 2016 (Unaudited) (continued)
| | | | | | | | |
AVERAGE ANNUAL TOTAL RETURNS AS OF OCTOBER 31, 2016 | |
| | | INCEPTION DATE | | | CUMULATIVE
SINCE
INCEPTION | |
JPMorgan Diversified Return Europe Currency Hedged ETF | | | | | | | | |
Net Asset Value | | | 4/01/2016 | | | | 5.96 | % |
Market Price | | | | | | | 6.08 | % |
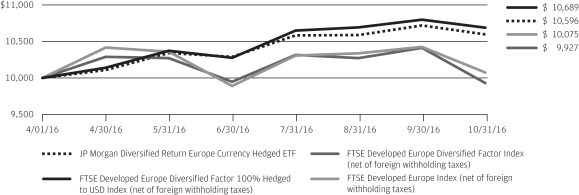
LIFE OF FUND PERFORMANCE (4/01/16 TO 10/31/16)
The performance quoted is past performance and is not a guarantee of future results. Exchange-traded funds are subject to certain market risks. Investment returns and principal value of an investment will fluctuate so that an investor’s shares, when sold or redeemed, may be worth more or less than their original cost. Current performance may be higher or lower than the performance data shown. For up-to-date, month-end performance information please call 1-844-457-6383.
Fund commenced operations on April 1, 2016.
The graph illustrates comparative performance for $10,000 invested in shares of the JPMorgan Diversified Return Europe Currency Hedged ETF, the FTSE Developed Europe Diversified Factor 100% Hedged to USD Index, the FTSE Developed Europe Diversified Factor Index, and the FTSE Developed Europe Index from April 1, 2016 to October 31, 2016. The performance of the Fund reflects the deduction of Fund expenses and assumes reinvestment of all dividends and capital gain distributions, if any. The performance of the FTSE Developed Europe Diversified Factor 100% Hedged to USD Index, the FTSE Developed Europe Diversified Factor Index, and the FTSE Developed Europe Index does not reflect the deduction of expenses associated with an exchange-traded fund and has been adjusted to reflect reinvestment of all dividends and capital gain distributions of the securities included in the Index, if applicable. The FTSE Developed Europe Diversified Factor 100% Hedged to USD Index and the FTSE Developed Europe Diversified Factor Index are indexes comprised of equity securities from developed Europe markets selected to represent a diversified set of factor characteristics, originally developed by the adviser, and
the equity holdings of both indexes are selected by the index provider primarily from the constituents of the FTSE Developed Europe Index. The FTSE Developed Europe Diversified Factor 100% Hedged to USD Index represents European stock performance with the foreign currency risk of the index securities hedged against the U.S. dollar on a monthly basis. These two indexes include large and mid cap stocks providing coverage of developed European markets. FTSE Developed Europe Index is a market-capitalization weighted index representing the performance of large and mid cap companies in developed European markets. FTSE International Limited is the index provider for the three indexes. Investors cannot invest directly in an index.
Fund performance reflects the waiver of the Fund’s fees and reimbursement of expenses for certain periods since the inception date. Without these waivers and reimbursements, performance would have been lower. Also, performance shown in this section does not reflect the deduction of taxes that a shareholder may pay on Fund distributions or redemption or sale of Fund shares.
International investing involves a greater degree of risk and increased volatility. Changes in currency exchange rates and differences in accounting and taxation policies outside the United States can raise or lower returns. Also, some overseas markets may not be as politically and economically stable as the United States and other nations.
The returns shown are based on net asset values calculated for shareholder transactions and may differ from the returns shown in the financial highlights, which reflect adjustments made to the net asset values in accordance with accounting principles generally accepted in the United States of America.
| | | | | | |
| | | |
| 6 | | | | JPMORGAN EXCHANGE-TRADED FUNDS | | OCTOBER 31, 2016 |
JPMorgan Diversified Return Europe Equity ETF
FUND COMMENTARY
FOR THE PERIOD DECEMBER 18, 2015 (FUND INCEPTION DATE) THROUGH OCTOBER 31, 2016 (Unaudited)
| | | | |
| REPORTING PERIOD RETURN: | | | |
| JPMorgan Diversified Return Europe Equity ETF * | | | -0.23% | |
| Market Price** | | | -0.09% | |
| FTSE Developed Europe Diversified Factor Index (net of foreign withholding taxes) | | | -0.38% | |
| FTSE Developed Europe Index (net of foreign withholding taxes) | | | -1.93% | |
| Morgan Stanley Capital International (MSCI) Europe Index (net of foreign withholding taxes) | | | -1.81% | |
| |
| Net Assets as of 10/31/2016 | | $ | 59,859,633 | |
INVESTMENT OBJECTIVE***
The JPMorgan Diversified Return Europe Equity ETF (the “Fund”) seeks investment results that closely correspond, before fees and expenses, to the performance of the FTSE Developed Europe Diversified Factor Index (the “Underlying Index”).
INVESTMENT APPROACH
The Fund is passively managed to the Underlying Index, which is composed of large-cap and mid-cap equity securities in Europe, diversified across industries. The Underlying Index uses a proprietary multifactor security selection process that measures the following characteristics: valuation, momentum and quality. The Underlying Index methodology includes quarterly rebalancing.
HOW DID THE MARKET PERFORM?
Global financial markets generally weathered two distinct sell-offs and rebounded to provide positive returns over the reporting period amid continued economic stimulus from leading central banks. Markets appeared to absorb the Federal Reserve’s December 2015 interest rate increase – the first in a decade – with little disruption. But investor concerns about the health of China’s economy sparked a sell-off in global financial markets.
By the end of March 2016, global prices for both equities and crude oil had rebounded from mid-February lows and emerging market equities in particular experienced a brief but significant rise in prices. However, British voters confounded the expectations of some at the end of June 2016 and voted to exit the European Union. The unexpected result of the so-called Brexit referendum led to a sell-off in financial markets. Within days, financial markets recovered and volatility subsided. Notably, crude oil prices reached 15-month highs in October 2016 amid expectations that the Organization of Petroleum Exporting Countries would agree to production caps that would reduce global inventories.
HOW DID THE FUND PERFORM?
The Fund posted a negative absolute performance for the period from the Fund’s inception, December 18, 2015 to
October 31, 2016. During the period, the Fund outperformed the Underlying Index. The Fund and the Underlying Index outperformed the FTSE Developed Europe Index and the MSCI Europe Index, which are more traditional market capitalization weighted indexes.
Because the Fund’s holdings were closely aligned with those of the Underlying Index, variances in performance relative to the Underlying Index were not significant and mostly attributable to differences in the end of the trading day for the Fund (New York City) and the Underlying Index (London). The majority of the Fund’s deviation against the Underlying Index was due to differences in valuations because of the timing of the local market closings and the net asset value calculations, the Fund’s small cash allocation, and fees and operating expenses incurred by the Fund.
Relative to market-cap weighted indexes, the Fund’s and Underlying Index’s sector allocations contributed to performance, most notably from an underweight position in the financials sector. The Fund and its Underlying Index also saw positive returns from the combination of the multi-factor screening and equal stock weighting approach, again most prominently in the financials sector.
HOW WAS THE FUND POSITIONED?
By seeking to track the Underlying Index, the Fund seeks to deliver superior risk-adjusted returns by avoiding undue concentrations of risk that tend to characterize more traditional market-cap weighted indexes. The Underlying Index’s weightings are structured to distribute risk evenly across 10 economic sectors. A multi-factor stock screen was then used to identify the most attractive stocks in each sector based on these factors, while avoiding the least attractive stocks. During the reporting period, the Fund’s largest country weightings were in the U.K., France and Germany, while its smallest positions were in Ireland, Portugal and Austria. The Fund’s largest average sector weightings were in the consumer goods, health care and consumer services sectors, while its smallest average positions were in the oil & gas, financials and basic materials sectors.
| | | | | | | | |
| | | |
| OCTOBER 31, 2016 | | JPMORGAN EXCHANGE-TRADED FUNDS | | | | | 7 | |
JPMorgan Diversified Return Europe Equity ETF
FUND COMMENTARY
FOR THE PERIOD DECEMBER 18, 2015 (FUND INCEPTION DATE) THROUGH OCTOBER 31, 2016 (Unaudited) (continued)
| | | | | | | | |
| TOP TEN EQUITY HOLDINGS OF THE PORTFOLIO**** | |
| | 1. | | | SAP SE | | | 2.6 | % |
| | 2. | | | Vodafone Group plc | | | 2.1 | |
| | 3. | | | Iberdrola S.A. | | | 2.1 | |
| | 4. | | | Novartis AG | | | 1.9 | |
| | 5. | | | GlaxoSmithKline plc | | | 1.9 | |
| | 6. | | | Swisscom AG | | | 1.7 | |
| | 7. | | | Roche Holding AG | | | 1.6 | |
| | 8. | | | TOTAL S.A. | | | 1.3 | |
| | 9. | | | British American Tobacco plc | | | 1.3 | |
| | 10. | | | Royal Dutch Shell plc | | | 1.3 | |
| | | | |
PORTFOLIO COMPOSITION BY COUNTRY**** | |
| United Kingdom | | | 25.5 | % |
| France | | | 14.0 | |
| Germany | | | 13.7 | |
| Switzerland | | | 11.4 | |
| Spain | | | 7.1 | |
| Sweden | | | 6.0 | |
| Finland | | | 5.0 | |
| Netherlands | | | 4.9 | |
| Denmark | | | 2.9 | |
| Norway | | | 2.7 | |
| Italy | | | 2.1 | |
| Belgium | | | 2.1 | |
| Other (each less than 1%) | | | 2.6 | |
| * | | The return shown is based on net asset value calculated for shareholder transactions and may differ from the return shown in the financial highlights, which reflects adjustments made to the net asset value in accordance with accounting principles generally accepted in the United States of America. The net asset value was $49.88 as of October 31, 2016. |
| ** | | Market price cumulative return is calculated assuming an initial investment made at the inception date net asset value, reinvestment of all dividends and distributions at market price during the period, and sale at the market price on the last day of the period. The price is used to calculate the market price return is the midpoint of the bid/ask spread at the close of business on the NYSE Arca. The midpoint price was $49.95 as of October 31, 2016. |
| *** | | The adviser seeks to achieve the Fund’s objective. There can be no guarantee it will be achieved. |
| **** | | Percentages indicated are based on total investments as of October 31, 2016. The Fund’s composition is subject to change. |
| | | | | | |
| | | |
| 8 | | | | JPMORGAN EXCHANGE-TRADED FUNDS | | OCTOBER 31, 2016 |
| | | | | | | | |
AVERAGE ANNUAL TOTAL RETURNS AS OF OCTOBER 31, 2016 | |
| | |
| | | INCEPTION
DATE | | | CUMULATIVE
SINCE
INCEPTION | |
JPMorgan Diversified Return Europe Equity ETF | | | | | | | | |
Net Asset Value | | | 12/18/2015 | | | | -0.23 | % |
Market Price | | | | | | | -0.09 | % |
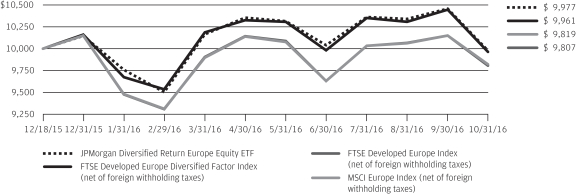
LIFE OF FUND PERFORMANCE (12/18/15 TO 10/31/16)
The performance quoted is past performance and is not a guarantee of future results. Exchange-traded funds are subject to certain market risks. Investment returns and principal value of an investment will fluctuate so that an investor’s shares, when sold or redeemed, may be worth more or less than their original cost. Current performance may be higher or lower than the performance data shown. For up-to-date, month-end performance information please call 1-844-457-6383.
Fund commenced operations on December 18, 2015.
The graph illustrates comparative performance for $10,000 invested in shares of the JPMorgan Diversified Return Europe Equity ETF, the FTSE Developed Europe Diversified Factor Index, the FTSE Developed Europe Index, and the MSCI Europe Index from December 18, 2015 to October 31, 2016. The performance of the Fund reflects the deduction of Fund expenses and assumes reinvestment of all dividends and capital gain distributions, if any. The performance of the FTSE Developed Europe Diversified Factor Index, the FTSE Developed Europe Index, and the MSCI Europe Index does not reflect the deduction of expenses associated with an exchange-traded fund and has been adjusted to reflect reinvestment of all dividends and capital gain distributions of the securities included in the Index, if applicable. The FTSE Developed Europe Diversified Factor Index is an index comprised of equity securities from the developed Europe market selected to represent a diversified set of factor characteristics, originally developed by the adviser, and its equity holdings are selected by the index provider primarily from the constituents of the FTSE Developed Europe Index. The FTSE Developed Europe Diversified Factor Index includes large and mid-cap stocks providing coverage of developed European
markets. The FTSE Developed Europe Index is a market-capitalization weighted index representing the performance of large and mid-cap companies in developed European markets. FTSE International Limited is the index provider for these two indexes. The MSCI Europe Index is a free float-adjusted market capitalization weighted index that is designed to measure the equity market performance of the developed markets in Europe. The MSCI Europe Index consists of the following 15 developed market country indices: Austria, Belgium, Denmark, Finland, France, Germany, Ireland, Italy, the Netherlands, Norway, Portugal, Spain, Sweden, Switzerland, and the United Kingdom. Investors cannot invest directly in an index.
Fund performance reflects the waiver of the Fund’s fees and reimbursement of expenses for certain periods since the inception date. Without these waivers and reimbursements, performance would have been lower. Also, performance shown in this section does not reflect the deduction of taxes that a shareholder may pay on Fund distributions or redemption or sale of Fund shares.
International investing involves a greater degree of risk and increased volatility. Changes in currency exchange rates and differences in accounting and taxation policies outside the United States can raise or lower returns. Also, some overseas markets may not be as politically and economically stable as the United States and other nations.
The returns shown are based on net asset values calculated for shareholder transactions and may differ from the returns shown in the financial highlights, which reflect adjustments made to the net asset values in accordance with accounting principles generally accepted in the United States of America.
| | | | | | | | |
| | | |
| OCTOBER 31, 2016 | | JPMORGAN EXCHANGE-TRADED FUNDS | | | | | 9 | |
JPMorgan Diversified Return Global Equity ETF
FUND COMMENTARY
FOR THE YEAR ENDED OCTOBER 31, 2016 (Unaudited)
| | | | |
| REPORTING PERIOD RETURN: | |
| JPMorgan Diversified Return Global Equity ETF* | | | 4.31% | |
| Market Price** | | | 4.44% | |
| FTSE Developed Diversified Factor Index (net of foreign withholding taxes) | | | 4.16% | |
| FTSE Developed Index (net of foreign withholding taxes) | | | 1.29% | |
| Morgan Stanley Capital International (MSCI) World Index (net of foreign withholding taxes) | | | 1.18% | |
| |
| Net Assets as of 10/31/2016 | | $ | 77,556,933 | |
INVESTMENT OBJECTIVE***
The JPMorgan Diversified Return Global Equity ETF (the “Fund”) seeks to achieve investment results that closely correspond, before fees and expenses, to the performance of the FTSE Developed Diversified Factor Index (the “Underlying Index”).
INVESTMENT APPROACH
The Fund is passively managed to the Underlying Index, which provides exposure to large and mid-cap equity securities in developed global markets, diversified across global regions and industries. The Underlying Index uses a proprietary multi-factor selection process that utilizes the following characteristics: valuation, momentum, volatility and market capitalization. The Underlying Index’s methodology includes quarterly rebalancing.
HOW DID THE MARKET PERFORM?
Global financial markets generally weathered two distinct sell-offs and rebounded to provide positive returns over the twelve month reporting period amid continued economic stimulus from leading central banks. Markets appeared to absorb the Federal Reserve’s December 2015 interest rate increase — the first in a decade — with little disruption. But investor concerns about the health of China’s economy sparked a sell-off in global financial markets and led to the worst start of any year on record for U.S. equity prices.
By the end of March 2016, global prices for both equities and crude oil had rebounded from mid-February lows and emerging market equities in particular experienced a brief but significant rise in prices. However, British voters confounded the expectations of some at the end of June 2016 and voted to exit the European Union. The unexpected result of the so-called Brexit referendum led to a sell-off in financial markets. Within days, financial markets recovered and volatility subsided and the S&P 500 Index reached three new closing highs in August 2016.
Notably, crude oil prices reached 15-month highs in October 2016 amid expectations that the Organization of Petroleum Exporting Countries would agree to production caps that would reduce global inventories.
HOW DID THE FUND PERFORM?
For the twelve months ended October 31, 2016, the Fund posted a positive absolute performance and experienced a performance deviation of 0.15% relative to the Underlying Index.
On an absolute basis, the Fund’s and the Underlying Index’s positions in the technology and industrials sectors were leading contributors to performance for the twelve month reporting period, while their positions in the consumer services and the financials sectors were the sole detractors from performance.
Because the Fund’s holdings were closely aligned with those of the Underlying Index, variances in relative performance due to security selection and/or sector allocation were not significant. The majority of the Fund’s deviation against the Underlying Index was due to specific trading limits, differences in valuations because of the timing of the local market closings and the net asset value calculations, the Fund’s small cash allocation, and fees and operating expenses incurred by the Fund.
HOW WAS THE FUND POSITIONED?
At the end of the reporting period, the Fund’s and the Underlying Index’s largest allocation of assets was to North American markets — particularly the U.S. — with smaller allocations to Asia, Europe and Japan. In terms of sectors, the Fund’s and the Underlying Index’s largest average weighting were in the consumer goods, consumer services and health care sectors, while the smallest weightings were in the oil & gas, basic materials and telecommunications sectors.
| | | | | | |
| | | |
| 10 | | | | JPMORGAN EXCHANGE-TRADED FUNDS | | OCTOBER 31, 2016 |
| | | | | | | | |
| TOP TEN EQUITY HOLDINGS OF THE PORTFOLIO**** | |
| | 1. | | | Samsung Electronics Co., Ltd. | | | 0.5 | % |
| | 2. | | | Toyota Motor Corp. | | | 0.5 | |
| | 3. | | | CK Hutchison Holdings Ltd. | | | 0.5 | |
| | 4. | | | CSL Ltd. | | | 0.5 | |
| | 5. | | | Wesfarmers Ltd. | | | 0.4 | |
| | 6. | | | SK Hynix, Inc. | | | 0.4 | |
| | 7. | | | NAVER Corp. | | | 0.4 | |
| | 8. | | | Hyundai Mobis Co., Ltd. | | | 0.4 | |
| | 9. | | | Singapore Telecommunications Ltd. | | | 0.4 | |
| | 10. | | | KDDI Corp. | | | 0.4 | |
| | | | |
PORTFOLIO COMPOSITION BY COUNTRY**** | |
| United States | | | 25.6 | % |
| Japan | | | 24.5 | |
| South Korea | | | 9.1 | |
| Australia | | | 8.4 | |
| France | | | 4.2 | |
| Hong Kong | | | 3.9 | |
| United Kingdom | | | 3.1 | |
| Germany | | | 3.0 | |
| Canada | | | 2.9 | |
| Sweden | | | 2.6 | |
| Singapore | | | 2.2 | |
| Switzerland | | | 2.0 | |
| Spain | | | 1.9 | |
| Netherlands | | | 1.4 | |
| Other (each less than 1.0%) | | | 5.2 | |
| * | | The return shown is based on net asset value calculated for shareholder transactions and may differ from the return shown in the financial highlights, which reflects adjustments made to the net asset value in accordance with accounting principles generally accepted in the United States of America. The net asset value was $51.70 as of October 31, 2016. |
| ** | | Market price cumulative return is calculated assuming an initial investment made at the market price at the beginning of the period, reinvestment of all dividends and distributions at market price during the period, and sale at the market price on the last day of the period. The price used to calculate the market price return is the midpoint of the bid/ask spread at the close of business on the NYSE Arca. The midpoint price was $51.91 as of October 31, 2016. |
| *** | | The adviser seeks to achieve the Fund’s objective. There can be no guarantee it will be achieved. |
| **** | | Percentages indicated are based on total investments as of October 31, 2016. The Fund’s composition is subject to change. |
| | | | | | | | |
| | | |
| OCTOBER 31, 2016 | | JPMORGAN EXCHANGE-TRADED FUNDS | | | | | 11 | |
JPMorgan Diversified Return Global Equity ETF
FUND COMMENTARY
FOR THE YEAR ENDED OCTOBER 31, 2016 (Unaudited) (continued)
| | | | | | | | | | | | |
AVERAGE ANNUAL TOTAL RETURNS AS OF OCTOBER 31, 2016 | |
| | | |
| | | INCEPTION DATE | | | 1 YEAR | | | SINCE
INCEPTION | |
JPMorgan Diversified Return Global Equity ETF | | | | | | | | | | | | |
Net Asset Value | | | 6/16/2014 | | | | 4.31 | % | | | 2.53 | % |
Market Price | | | | | | | 4.44 | % | | | 2.70 | % |
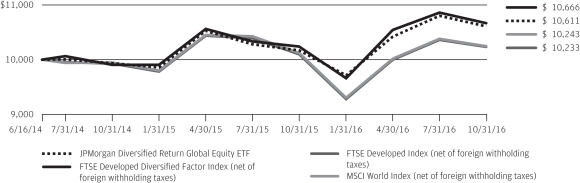
LIFE OF FUND PERFORMANCE (6/16/14 TO 10/31/16)
The performance quoted is past performance and is not a guarantee of future results. Exchange-traded funds are subject to certain market risks. Investment returns and principal value of an investment will fluctuate so that an investor’s shares, when sold or redeemed, may be worth more or less than their original cost. Current performance may be higher or lower than the performance data shown. For up-to-date, month-end performance information please call 1-844-457-6383.
Fund commenced operations on June 16, 2014.
The graph illustrates comparative performance for $10,000 invested in shares of the JPMorgan Diversified Return Global Equity ETF, the FTSE Developed Diversified Factor Index, the FTSE Developed Index, and the MSCI World Index from June 16, 2014 to October 31, 2016. The performance of the Fund reflects the deduction of Fund expenses and assumes reinvestment of all dividends and capital gain distributions, if any. The performance of the FTSE Developed Diversified Factor Index, the FTSE Developed Index and the MSCI World Index does not reflect the deduction of expenses associated with an exchange-traded fund and has been adjusted to reflect reinvestment of all dividends and capital gain distributions of the securities included in the Index, if applicable. The FTSE Developed Diversified Factor Index is an index comprised of equity securities from developed global markets selected to represent a diversified set of factor characteristics, originally developed by the adviser and its holdings are selected by the index provider primarily from the constituents of the FTSE Developed Index. The FTSE Developed Index is a market-capitalization weighted index
representing the performance of large and mid cap companies in developed markets. The index is derived from the FTSE Global Equity Index Series (GEIS), which covers 98% of the world’s investable market capitalization. FTSE International Limited is the index provider for the two indexes. The MSCI World Index is a free float-adjusted market capitalization weighted index that is designed to measure the equity market performance of developed markets. Investors cannot invest directly in an index.
Fund performance reflects the waiver of the Fund’s fees and reimbursement of expenses for certain periods since the inception date. Without these waivers and reimbursements, performance would have been lower. Also, performance shown in this section does not reflect the deduction of taxes that a shareholder may pay on Fund distributions or redemption or sale of Fund shares.
International investing involves a greater degree of risk and increased volatility. Changes in currency exchange rates and differences in accounting and taxation policies outside the United States can raise or lower returns. Also, some overseas markets may not be as politically and economically stable as the United States and other nations.
The returns shown are based on net asset values calculated for shareholder transactions and may differ from the returns shown in the financial highlights, which reflect adjustments made to the net asset values in accordance with accounting principles generally accepted in the United States of America.
| | | | | | |
| | | |
| 12 | | | | JPMORGAN EXCHANGE-TRADED FUNDS | | OCTOBER 31, 2016 |
JPMorgan Diversified Return International Currency Hedged ETF
FUND COMMENTARY
FOR THE PERIOD APRIL 1, 2016 (FUND INCEPTION DATE) THROUGH OCTOBER 31, 2016 (Unaudited)
| | | | |
| REPORTING PERIOD RETURN: | | | |
| JPMorgan Diversified Return International Currency Hedged ETF * | | | 5.28% | |
| Market Price** | | | 5.36% | |
| FTSE Developed ex North America Diversified Factor 100% Hedged to USD Index (net of foreign withholding taxes) | | | 6.21% | |
| FTSE Developed ex North America Diversified Factor Index (net of foreign withholding taxes) | | | 3.18% | |
| FTSE Developed ex North America Index (net of foreign withholding taxes) | | | 5.33% | |
| |
| Net Assets as of 10/31/2016 | | $ | 26,316,114 | |
INVESTMENT OBJECTIVE***
The JPMorgan Diversified Return International Currency Hedged ETF (the “Fund”) seeks investment results that closely correspond, before fees and expenses, to the performance of the FTSE Developed ex North America Diversified Factor 100% Hedged to USD Index (the “Underlying Index”).
INVESTMENT APPROACH
The Fund is passively managed to the Underlying Index, which is composed of large- and mid-cap equity securities in developed markets outside North America. The Underlying Index uses a proprietary multi-factor selection process that measures the following characteristics: valuation, momentum, volatility and market capitalization. In addition to reflecting international stock performance, the Underlying Index attempts to minimize the impact of exchange rate fluctuations by hedging currency exposure against the U.S. dollar on a monthly basis.
HOW DID THE MARKET PERFORM?
By the end of March 2016, global prices for both equities and crude oil had rebounded from mid-February lows and emerging market equities in particular experienced a brief but significant rise in prices. However, British voters confounded the expectations of some at the end of June 2016 and voted to exit the European Union. The unexpected result of the so-called Brexit referendum led to a sell-off in financial markets. Within days, financial markets recovered and volatility subsided. Notably, crude oil prices reached 15-month highs in October 2016 amid expectations that the Organization of Petroleum Exporting Countries would agree to production caps that would reduce global inventories.
HOW DID THE FUND PERFORM?
The Fund posted a positive absolute return for the period from Fund’s inception, April 1, 2016 to October 31, 2016. In terms of relative performance, the Fund’s performance deviated from the Underlying Index by -0.93%. While the Fund and the Underlying Index outperformed the FTSE Developed ex North America Diversified Factor Index. Relative to the FTSE Developed ex North America Index, the Fund underperformed and the Underlying Index outperformed.
Because the Fund’s holdings closely aligned with those of the Underlying Index, variances in relative performance to the Underlying Index were not significant. The majority of the Fund’s deviation against the Underlying Index was due to differences in valuations because of the timing of the local market closings and the net asset value calculations, the Fund’s small cash allocation, and fees and operating expenses incurred by the Fund.
HOW WAS THE FUND POSITIONED?
By seeking to track the Underlying Index, the Fund seeks to deliver superior risk-adjusted returns by avoiding undue concentrations of risk that tend to characterize more traditional market-capitalization weighted indexes. The Underlying Index’s weightings are structured to distribute risk evenly across ten economic sectors and four regional sectors. A multi-factor stock screen is then used to identify the most attractive stocks in each sector of the Underlying Index, while avoiding the least attractive stocks. The Fund’s largest average weighted positions were in the health care, consumer goods and consumer services sectors, while the smallest averaged weighted positions were in the oil & gas, basic materials and technology sectors.
| * | | The return shown is based on net asset value calculated for shareholder transactions and may differ from the return shown in the financial highlights, which reflects adjustments made to the net asset value in accordance with accounting principles generally accepted in the United States of America. The net asset value was $26.32 as of October 31, 2016. |
| ** | | Market price cumulative return is calculated assuming an initial investment made at the inception date net asset value, reinvestment of all dividends and distributions at market price during the period, and sale at the market price on the last day of the period. The price used to calculate the market price return is the midpoint of the bid/ask spread at the close of business on the NYSE Arca. The midpoint price was $26.34 as of October 31, 2016. |
| *** | | The adviser seeks to achieve the Fund’s objective. There can be no guarantee it will be achieved. |
| | | | | | | | |
| | | |
| OCTOBER 31, 2016 | | JPMORGAN EXCHANGE-TRADED FUNDS | | | | | 13 | |
JPMorgan Diversified Return International Currency Hedged ETF
FUND COMMENTARY
FOR THE PERIOD APRIL 1, 2016 (FUND INCEPTION DATE) THROUGH OCTOBER 31, 2016 (unaudited) (continued)
| | | | | | | | |
AVERAGE ANNUAL TOTAL RETURNS AS OF OCTOBER 31, 2016 | |
| | |
| | | INCEPTION DATE | | | CUMULATIVE
SINCE
INCEPTION | |
JPMorgan Diversified Return International Currency Hedged ETF | | | | | | | | |
Net Asset Value | | | 4/01/2016 | | | | 5.28 | % |
Market Price | | | | | | | 5.36 | % |
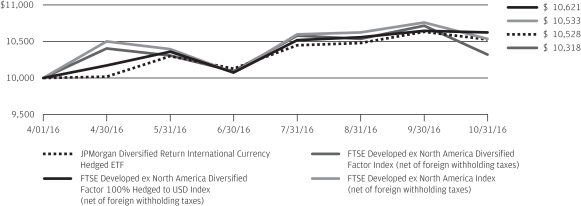
LIFE OF FUND PERFORMANCE (4/01/16 TO 10/31/16)
The performance quoted is past performance and is not a guarantee of future results. Exchange-traded funds are subject to certain market risks. Investment returns and principal value of an investment will fluctuate so that an investor’s shares, when sold or redeemed, may be worth more or less than their original cost. Current performance may be higher or lower than the performance data shown. For up-to-date, month-end performance information please call 1-844-457-6383.
Fund commenced operations on April 1, 2016.
The graph illustrates comparative performance for $10,000 invested in shares of the JPMorgan Diversified Return International Currency Hedged ETF, the FTSE Developed ex North America Diversified Factor 100% Hedged to USD Index, the FTSE Developed ex North America Diversified Factor Index, and the FTSE Developed ex North America Index from April 1, 2016 to October 31, 2016. The performance of the Fund reflects the deduction of Fund expenses and assumes reinvestment of all dividends and capital gain distributions, if any. The performance of the FTSE Developed ex North America Diversified Factor 100% Hedged to USD Index, the FTSE Developed ex North America Diversified Factor Index, and the FTSE Developed ex North America Index does not reflect the deduction of expenses associated with an exchange-traded fund and has been adjusted to reflect reinvestment of all dividends and capital gain distributions of the securities included in the Index, if applicable. The FTSE Developed ex North America Diversified Factor 100% Hedged to USD Index and the FTSE Developed ex North America Diversified Factor Index are indexes comprised of equity securities from developed global markets (excluding North America) selected to represent a diversified set of factor characteristics, originally developed by the adviser, and the equity holdings of both indexes are selected by the index provider primarily from the constituents of the FTSE Developed ex North America
Index. The FTSE Developed ex North America Diversified Factor 100% Hedged to USD Index represents international stock performance with the foreign currency risk of the index securities hedged against the U.S. dollar on a monthly basis. These two indexes include large and mid-cap stocks providing coverage of developed markets outside of North America. The FTSE Developed ex North America Index a market-capitalization weighted index representing the performance of large and mid-cap companies in developed markets, excluding the US and Canada. The index is derived from the FTSE Global Equity Index Series (GEIS), which covers 98% of the world’s investable market capitalization. FTSE International Limited is the index provider for the three indexes. Investors cannot invest directly in an index.
Fund performance reflects the waiver of the Fund’s fees and reimbursement of expenses for certain periods since the inception date. Without these waivers and reimbursements, performance would have been lower. Also, performance shown in this section does not reflect the deduction of taxes that a shareholder may pay on Fund distributions or redemption or sale of Fund shares.
International investing involves a greater degree of risk and increased volatility. Changes in currency exchange rates and differences in accounting and taxation policies outside the United States can raise or lower returns. Also, some overseas markets may not be as politically and economically stable as the United States and other nations.
The returns shown are based on net asset values calculated for shareholder transactions and may differ from the returns shown in the financial highlights, which reflect adjustments made to the net asset values in accordance with accounting principles generally accepted in the United States of America.
| | | | | | |
| | | |
| 14 | | | | JPMORGAN EXCHANGE-TRADED FUNDS | | OCTOBER 31, 2016 |
JPMorgan Diversified Return International Equity ETF
FUND COMMENTARY
FOR THE YEAR ENDED OCTOBER 31, 2016 (Unaudited)
| | | | |
| REPORTING PERIOD RETURN: | | | |
| JPMorgan Diversified Return International Equity ETF * | | | -0.15% | |
| Market Price** | | | 0.41% | |
| FTSE Developed ex North America Diversified Factor Index (net of foreign withholding taxes) | | | -0.15% | |
| FTSE Developed ex North America Index (net of foreign withholding taxes) | | | -2.55% | |
| Morgan Stanley Capital International (MSCI) EAFE Index (net of foreign withholding taxes) | | | -3.23% | |
| |
| Net Assets as of 10/31/2016 | | $ | 470,042,716 | |
INVESTMENT OBJECTIVE***
The JPMorgan Diversified Return International Equity ETF (the “Fund”) seeks investment results that closely correspond, before fees and expenses, to the performance of the FTSE Developed ex North America Diversified Factor Index (the “Underlying Index”).
INVESTMENT APPROACH
The Fund is passively managed to the Underlying Index, which is composed of large cap and mid cap equity securities in developed markets outside North America, diversified across sectors and international regions. The Underlying Index uses a proprietary multi-factor selection process that measures the following characteristics: valuation, momentum, volatility and specific market capitalization. The Underlying Index methodology includes quarterly rebalancing and liquidity screens.
HOW DID THE MARKET PERFORM?
Global financial markets generally weathered two distinct sell-offs and rebounded to provide positive returns over the twelve month reporting period amid continued economic stimulus from leading central banks. Markets appeared to absorb the Federal Reserve’s December 2015 interest rate increase — the first in a decade — with little disruption. However, investor concerns about the health of China’s economy sparked a sell-off in global financial markets and led to the worst start of any year on record for U.S. equity prices.
By the end of March 2016, global prices for both equities and crude oil had rebounded from mid-February lows and emerging market equities in particular experienced a brief but significant rise in prices. However, British voters confounded the expectations of some at the end of June 2016 and voted to exit the European Union. The unexpected result of the so-called Brexit referendum led to a sell-off in financial markets. Within days, financial markets recovered and volatility subsided. Notably, crude oil prices reached 15-month highs in October 2016 amid expectations that the Organization of Petroleum Exporting Countries would agree to production caps that would reduce global inventories.
HOW DID THE FUND PERFORM?
The Fund posted a negative absolute performance for the twelve months ended October 31, 2016. During the period, the Fund experienced no significant performance deviation from the performance of the Underlying Index. The Fund and the Underlying Index outperformed the MSCI EAFE Index and the FTSE Developed ex-North America Index, which are more traditional market capitalization weighted indexes.
The Fund’s and the Underlying Index’s positions in the financials and utilities sectors were leading detractors from absolute performance, while the Fund’s and the Underlying Index’s positions in the technology sector and the oil & gas sector were leading contributors to absolute performance.
Relative to FTSE Developed ex-North America (the “market-cap weighted index”), the Underlying Index’s multi-factor filter contributed to performance across most regions, especially continental Europe and Japan, as did the health care, telecommunications, and consumer services sectors. The Fund’s and Underlying Index’s risk weighting also contributed to performance relative to the market-cap weighted index, particularly driven by a structural underweight to the financials sector and an overweight to the oil & gas sector. Regionally, a significant underweight to continental Europe contributed to performance. Detractors during the same period include the multi-factor filter in the U.K. From a sector standpoint, the Fund’s and the Underlying Index’s overweight to the utilities sector and the multi-factor filter in the industrials sector detracted from performance.
HOW WAS THE FUND POSITIONED?
During the reporting period, the largest average sector weightings for the Fund and the Underlying Index were in the health care, consumer goods and consumer services sectors, while the smallest sector weightings were in the oil & gas, basic materials and technology sectors. The largest average regional weighting was in the Asia Pacific, excluding Japan, while the smallest weighting was in the U.K.
| | | | | | | | |
| | | |
| OCTOBER 31, 2016 | | JPMORGAN EXCHANGE-TRADED FUNDS | | | | | 15 | |
JPMorgan Diversified Return International Equity ETF
FUND COMMENTARY
FOR THE YEAR ENDED OCTOBER 31, 2016 (Unaudited) (continued)
| | | | | | | | |
| TOP TEN EQUITY HOLDINGS OF THE PORTFOLIO**** | |
| | 1. | | | BP plc | | | 0.8 | % |
| | 2. | | | Royal Dutch Shell plc, Class A | | | 0.8 | |
| | 3. | | | GlaxoSmithKline plc | | | 0.7 | |
| | 4. | | | Vodafone Group plc | | | 0.6 | |
| | 5. | | | Samsung Electronics Co., Ltd. | | | 0.6 | |
| | 6. | | | AstraZeneca plc | | | 0.6 | |
| | 7. | | | Reckitt Benckiser Group plc | | | 0.5 | |
| | 8. | | | Hitachi High-Technologies Corp. | | | 0.5 | |
| | 9. | | | Imperial Brands plc | | | 0.5 | |
| | 10. | | | National Grid plc | | | 0.5 | |
| | | | |
PORTFOLIO COMPOSITION BY COUNTRY**** | |
| Japan | | | 26.9 | % |
| United Kingdom | | | 19.3 | |
| South Korea | | | 9.4 | |
| Australia | | | 8.6 | |
| Hong Kong | | | 5.4 | |
| France | | | 5.0 | |
| Germany | | | 4.1 | |
| Singapore | | | 2.8 | |
| Sweden | | | 2.8 | |
| Netherlands | | | 2.4 | |
| Spain | | | 2.4 | |
| Switzerland | | | 2.0 | |
| Finland | | | 1.8 | |
| Denmark | | | 1.4 | |
| Italy | | | 1.1 | |
| Belgium | | | 1.1 | |
| Other (each less than 1%) | | | 3.5 | |
| * | | The return shown is based on net asset value calculated for shareholder transactions and may differ from the return shown in the financial highlights, which reflects adjustments made to the net asset value in accordance with accounting principles generally accepted in the United States of America. The net asset value was $50.00 as of October 31, 2016. |
| ** | | Market price cumulative return is calculated assuming an initial investment made at the market price at the beginning of the period, reinvestment of all dividends and distributions at market price during the period, and sale at the market price on the last day of the period. The price is used to calculate the market price return is the midpoint of the bid/ask spread at the close of business on the NYSE Arca. The midpoint price was $50.17 as of October 31, 2016. |
| *** | | The adviser seeks to achieve the Fund’s objective. There can be no guarantee it will be achieved. |
| **** | | Percentages indicated are based on total investments as of October 31, 2016. The Fund’s composition is subject to change. |
| | | | | | |
| | | |
| 16 | | | | JPMORGAN EXCHANGE-TRADED FUNDS | | OCTOBER 31, 2016 |
| | | | | | | | | | | | |
AVERAGE ANNUAL TOTAL RETURNS AS OF OCTOBER 31, 2016 | |
| | | |
| | | INCEPTION DATE | | | 1 YEAR | | | SINCE
INCEPTION | |
JPMorgan Diversified Return International Equity ETF | | | | | | | | | | | | |
Net Asset Value | | | 11/05/2014 | | | | -0.15 | % | | | 1.24 | % |
Market Price | | | | | | | 0.41 | % | | | 1.41 | % |
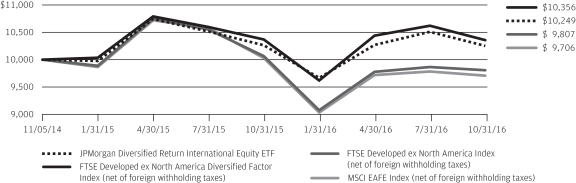
LIFE OF FUND PERFORMANCE (11/05/14 TO 10/31/16)
The performance quoted is past performance and is not a guarantee of future results. Exchange-traded funds are subject to certain market risks. Investment returns and principal value of an investment will fluctuate so that an investor’s shares, when sold or redeemed, may be worth more or less than their original cost. Current performance may be higher or lower than the performance data shown. For up-to-date, month-end performance information please call 1-844-457-6383.
Fund commenced operations on November 5, 2014.
The graph illustrates comparative performance for $10,000 invested in shares of the JPMorgan Diversified Return International Equity ETF, the FTSE Developed ex North America Diversified Factor Index, the FTSE Developed ex North America Index, and the MSCI EAFE Index from November 5, 2014 to October 31, 2016. The performance of the Fund reflects the deduction of Fund expenses and assumes reinvestment of all dividends and capital gain distributions, if any. The performance of the FTSE Developed ex North America Diversified Factor Index, the FTSE Developed ex North America Index and the MSCI EAFE Index does not reflect the deduction of expenses associated with an exchange-traded fund and has been adjusted to reflect reinvestment of all dividends and capital gain distributions of the securities included in the Index, if applicable. The FTSE Developed ex North America Diversified Factor Index is an index comprised of equity securities from developed global markets (excluding North America) selected to represent a diversified set of factor characteristics, originally developed by the adviser and its holdings are selected by the index provider primarily from the constituents of the FTSE Developed ex North American Index. The
FTSE Developed ex North America Index is a market-capitalization weighted index representing the performance of large and mid cap stocks in developed markets, excluding the U.S. and Canada. The index is derived from the FTSE Global Equity Index Series (GEIS), which covers 98% of the world’s investable market capitalization. FTSE International Limited is the index provider for the two indexes. The MSCI EAFE Index is a free float-adjusted market capitalization weighted index that is designed to measure the equity market performance of developed markets, excluding the U.S. and Canada. Investors cannot invest directly in an index.
Fund performance reflects the waiver of the Fund’s fees and reimbursement of expenses for certain periods since the inception date. Without these waivers and reimbursements, performance would have been lower. Also, performance shown in this section does not reflect the deduction of taxes that a shareholder may pay on Fund distributions or redemption or sale of Fund shares.
International investing involves a greater degree of risk and increased volatility. Changes in currency exchange rates and differences in accounting and taxation policies outside the United States can raise or lower returns. Also, some overseas markets may not be as politically and economically stable as the United States and other nations.
The returns shown are based on net asset values calculated for shareholder transactions and may differ from the returns shown in the financial highlights, which reflect adjustments made to the net asset values in accordance with accounting principles generally accepted in the United States of America.
| | | | | | | | |
| | | |
| OCTOBER 31, 2016 | | JPMORGAN EXCHANGE-TRADED FUNDS | | | | | 17 | |
JPMorgan Diversified Return U.S. Equity ETF
FUND COMMENTARY
FOR THE YEAR ENDED OCTOBER 31, 2016 (Unaudited)
| | | | |
| REPORTING PERIOD RETURN: | |
| JPMorgan Diversified Return U.S. Equity ETF* | | | 5.92% | |
| Market Price** | | | 5.90% | |
| Russell 1000 Diversified Factor Index | | | 6.32% | |
| Russell 1000 Index | | | 4.26% | |
| |
| Net Assets as of 10/31/2016 | | $ | 125,538,258 | |
INVESTMENT OBJECTIVE***
The JPMorgan Diversified Return U.S. Equity ETF (the “Fund”) seeks to achieve investment results that closely correspond, before fees and expenses, to the performance of the Russell 1000 Diversified Factor Index (the “Underlying Index”).
INVESTMENT APPROACH
The Fund is passively managed to the Underlying Index, which is composed of large cap and mid cap equity securities in the U.S. The Underlying Index uses a rules-based proprietary multi-factor selection process that utilizes the following characteristics: valuation, momentum and quality. The Underlying Index security selection process then seeks to exclude the least attractive stocks based on these characteristics. The Underlying Index’s methodology includes quarterly rebalancing.
HOW DID THE MARKET PERFORM?
U.S. financial markets generally weathered two distinct sell-offs and rebounded to provide positive returns over the twelve month reporting period amid continued economic stimulus from leading central banks. Markets appeared to absorb the Federal Reserve’s December 2015 interest rate increase — the first in a decade — with little disruption. However, investor concerns about the health of China’s economy sparked a sell-off in global financial markets and led to the worst start of any year on record for U.S. equity prices.
By the end of March 2016, global prices for both equities and crude oil had rebounded from mid-February lows and emerging market equities, in particular, experienced a brief but significant rise in prices. However, British voters confounded the expectations of some at the end of June 2016 and voted to exit the European Union. The unexpected result of the so-called Brexit referendum led to a sell-off in financial markets. Within days, financial markets recovered and volatility subsided and
the S&P 500 Index reached three new closing highs in August 2016. Notably, crude oil prices reached 15-month highs in October 2016 amid expectations that the Organization of Petroleum Exporting Countries would agree to production caps that would reduce global inventories. For the twelve months ended October 31, 2016, the Russell 1000 Index returned 4.26%.
HOW DID THE FUND PERFORM?
The Fund posted a positive absolute performance but experienced a performance deviation of -0.40% relative to the Underlying Index for the twelve months ended October 31, 2016.
On an absolute basis, the Fund’s and the Underlying Index’s positions in the telecommunications and utilities sector and in the oil and gas and basic materials sector were leading contributors to performance for the twelve month period, while the Fund’s and Underlying Index’s position in the consumer goods and financials sectors were leading detractors from absolute performance.
Because the Fund’s holdings were closely aligned with those of the Underlying Index, variances in relative performance due to security selection and/or sector allocation were not significant. The majority of the Fund’s deviation against the Underlying Index was due to the Fund’s small cash allocation, and fees and operating expenses incurred by the Fund.
HOW WAS THE FUND POSITIONED?
At the end of the reporting period, the Fund’s and the Underlying Index’s largest weightings were in the consumer goods sector and the telecommunications and utilities sector and the smallest weightings were in the oil, gas and basic materials sector and the financials sector.
| | | | | | |
| | | |
| 18 | | | | JPMORGAN EXCHANGE-TRADED FUNDS | | OCTOBER 31, 2016 |
| | | | | | | | |
| TOP TEN EQUITY HOLDINGS OF THE PORTFOLIO**** | |
| | 1. | | | DTE Energy Co. | | | 0.7 | % |
| | 2. | | | C.R. Bard, Inc. | | | 0.6 | |
| | 3. | | | NextEra Energy, Inc. | | | 0.6 | |
| | 4. | | | Exelon Corp. | | | 0.6 | |
| | 5. | | | SCANA Corp. | | | 0.6 | |
| | 6. | | | PPL Corp. | | | 0.6 | |
| | 7. | | | Southern Co. (The) | | | 0.6 | |
| | 8. | | | Duke Energy Corp. | | | 0.6 | |
| | 9. | | | Edison International, Inc. | | | 0.6 | |
| | 10. | | | WEC Energy Group, Inc. | | | 0.6 | |
| | | | |
PORTFOLIO COMPOSITION BY SECTOR**** | |
| Consumer Discretionary | | | 16.1 | % |
| Information Technology | | | 14.2 | |
| Health Care | | | 14.1 | |
| Utilities | | | 13.5 | |
| Consumer Staples | | | 12.1 | |
| Industrials | | | 8.5 | |
| Financials | | | 6.7 | |
| Materials | | | 5.3 | |
| Energy | | | 4.2 | |
| Real Estate | | | 2.7 | |
| Short-Term Investment | | | 1.3 | |
| Telecommunication Services | | | 1.3 | |
| * | | The return shown is based on net asset value calculated for shareholder transactions and may differ from the return shown in the financial highlights, which reflects adjustments made to the net asset value in accordance with accounting principles generally accepted in the United States of America. The net asset value was $57.06 as of October 31, 2016. |
| ** | | Market price cumulative return is calculated assuming an initial investment made at the market price at the beginning of the period, reinvestment of all dividends and distributions at market price during the period, and sale at the market price on the last day of the period. The price used to calculate the market price return is the midpoint of the bid/ask spread at the close of business on the NYSE Arca. The midpoint price was $57.08 as of October 31, 2016. |
| *** | | The adviser seeks to achieve the Fund’s objective. There can be no guarantee it will be achieved. |
| **** | | Percentages indicated are based on total investments as of October 31, 2016. The Fund’s composition is subject to change. |
| | | | | | | | |
| | | |
| OCTOBER 31, 2016 | | JPMORGAN EXCHANGE-TRADED FUNDS | | | | | 19 | |
JPMorgan Diversified Return U.S. Equity ETF
FUND COMMENTARY
FOR THE YEAR ENDED OCTOBER 31, 2016 (Unaudited) (continued)
| | | | | | | | | | | | |
AVERAGE ANNUAL RETURNS AS OF OCTOBER 31, 2016 | |
| | | |
| | | INCEPTION DATE | | | 1 Year | | | SINCE
INCEPTION | |
JPMorgan Diversified Return U.S. Equity ETF | | | | | | | | | | | | |
Net Asset Value | | | 9/29/2015 | | | | 5.92 | % | | | 13.44 | % |
Market Price | | | | | | | 5.90 | % | | | 13.47 | % |
LIFE OF FUND PERFORMANCE (9/29/15 TO 10/31/16)
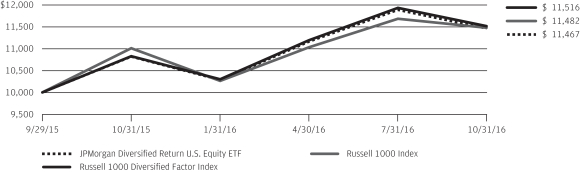
The performance quoted is past performance and is not a guarantee of future results. Exchange-traded funds are subject to certain market risks. Investment returns and principal value of an investment will fluctuate so that an investor’s shares, when redeemed, may be worth more or less than their original cost. Current performance may be higher or lower than the performance data shown. For up-to-date, month-end performance information please call 1-844-457-6383.
Fund commenced operations on September 29, 2015.
The graph illustrates comparative performance for $10,000 invested in shares of the JPMorgan Diversified Return U.S. Equity ETF, the Russell 1000 Diversified Factor Index, and the Russell 1000 Index from September 29, 2015 to October 31, 2016. The performance of the Fund reflects the deduction of Fund expenses and assumes reinvestment of all dividends and capital gain distributions, if any. The performance of the Russell 1000 Diversified Factor Index and Russell 1000 Index does not reflect the deduction of expenses associated with an exchange-traded fund and has been adjusted to reflect reinvestment of all dividends and capital gain distributions of the securities included in the
Index, if applicable. The Russell 1000 Diversified Factor Index is an index comprised of U.S. equity securities selected to represent a diversified set of factor characteristics, originally developed by the adviser and its holdings are selected by the index provider primarily from the constituents of the Russell 1000 Index. The Russell 1000 Index is a market-capitalization weighted index, which measures the performance of the 1,000 largest companies in the Russell 3000 Index. Investors cannot invest directly in an index.
Fund performance reflects the waiver of the Fund’s fees and reimbursement of expenses for certain periods since the inception date. Without these waivers and reimbursements, performance would have been lower. Also, performance shown in this section does not reflect the deduction of taxes that a shareholder may pay on Fund distributions or redemption or sale of Fund shares.
The returns shown are based on net asset values calculated for shareholder transactions and may differ from the returns shown in the financial highlights, which reflect adjustments made to the net asset values in accordance with accounting principles generally accepted in the United States of America.
| | | | | | |
| | | |
| 20 | | | | JPMORGAN EXCHANGE-TRADED FUNDS | | OCTOBER 31, 2016 |
JPMorgan Diversified Return U.S. Mid Cap Equity ETF
FUND COMMENTARY
FOR THE PERIOD MAY 11, 2016 (FUND INCEPTION DATE) THROUGH OCTOBER 31, 2016 (Unaudited)
| | | | |
| REPORTING PERIOD RETURN: | | | |
| JPMorgan Diversified Return U.S. Mid Cap Equity ETF * | | | 3.30% | |
| Market Price** | | | 3.28% | |
| Russell Midcap Diversified Factor Index | | | 3.50% | |
| Russell Midcap Index | | | 3.69% | |
| |
| Net Assets as of 10/31/2016 | | $ | 36,153,888 | |
INVESTMENT OBJECTIVE***
The JPMorgan Diversified Return U.S. Mid Cap Equity ETF (the “Fund”) seeks to achieve investment results that closely correspond, before fees and expenses, to the performance of the Russell MidCap Diversified Factor Index (the “Underlying Index”).
INVESTMENT APPROACH
The Fund is passively managed to the Underlying Index, which tracks mid cap equity securities in the U.S. The Underlying Index uses a proprietary multi-factor selection process that utilizes the following characteristics: relative valuation, momentum and quality. The Underlying Index security selection process then seeks to exclude the least attractive stocks based on these characteristics. The Underlying Index’s methodology includes quarterly rebalancing.
HOW DID THE MARKET PERFORM?
By the end of March 2016, global prices for both equities and crude oil had rebounded from mid-February lows and emerging market equities in particular experienced a brief but significant rise in prices. However, British voters confounded the expectations of some at the end of June 2016 and voted to exit the European Union. The unexpected result of the so-called Brexit referendum led to a sell-off in financial markets. Within days, financial markets recovered and volatility subsided and the S&P 500 Index reached three new closing highs in August 2016. Notably, crude oil prices reached 15-month highs in October
2016 amid expectations that the Organization of Petroleum Exporting Countries would agree to production caps that would reduce global inventories.
HOW DID THE FUND PERFORM?
The Fund posted a positive absolute performance and experienced a performance deviation of -0.20% relative to the Underlying Index for the period from the Fund’s inception, May 11, 2016 to October 31, 2016.
The Fund’s and the Underlying Index’s positions in the consumer goods and financials sectors were leading detractors from absolute performance. The Fund’s and the Underlying Index’s positions oil & gas & basic materials sector and in the technology sector were leading contributors to absolute performance during the reporting period.
Because the Fund’s holdings were closely aligned with those of the Underlying Index, variances in relative performance due to security selection and/or sector allocation were not significant. The majority of the Fund’s deviation against the Underlying Index was due to the Fund’s small cash allocation, and fees and operating expenses incurred by the Fund.
HOW WAS THE FUND POSITIONED?
At the end of the reporting period, the Fund’s and the Underlying Index’s largest weightings were in the consumer discretionary and information technologies sectors and the smallest weightings were in the energy and real estate sectors.
| | | | | | | | |
| | | |
| OCTOBER 31, 2016 | | JPMORGAN EXCHANGE-TRADED FUNDS | | | | | 21 | |
JPMorgan Diversified Return U.S. Mid Cap Equity ETF
FUND COMMENTARY
FOR THE PERIOD MAY 11, 2016 (FUND INCEPTION DATE) THROUGH OCTOBER 31, 2016 (Unaudited) (continued)
| | | | | | | | |
| TOP TEN EQUITY HOLDINGS OF THE PORTFOLIO**** | |
| | 1. | | | UGI Corp. | | | 0.6 | % |
| | 2. | | | Great Plains Energy, Inc. | | | 0.6 | |
| | 3. | | | Westar Energy, Inc. | | | 0.6 | |
| | 4. | | | Alliant Energy Corp. | | | 0.6 | |
| | 5. | | | ONEOK, Inc. | | | 0.6 | |
| | 6. | | | PPL Corp. | | | 0.6 | |
| | 7. | | | American Water Works Co., Inc. | | | 0.6 | |
| | 8. | | | NiSource, Inc. | | | 0.6 | |
| | 9. | | | Sempra Energy | | | 0.5 | |
| | 10. | | | Ameren Corp. | | | 0.5 | |
| | | | |
PORTFOLIO COMPOSITION BY SECTOR**** | |
| Consumer Discretionary | | | 16.1 | % |
| Information Technology | | | 14.5 | |
| Utilities | | | 12.9 | |
| Industrials | | | 11.6 | |
| Health Care | | | 11.6 | |
| Financials | | | 8.7 | |
| Consumer Staples | | | 7.2 | |
| Materials | | | 6.4 | |
| Real Estate | | | 5.5 | |
| Energy | | | 3.6 | |
| Short-Term Investment | | | 1.7 | |
| Telecommunication Services | | | 0.2 | |
| * | | The return shown is based on net asset value calculated for shareholder transactions and may differ from the return shown in the financial highlights, which reflects adjustments made to the net asset value in accordance with accounting principles generally accepted in the United States of America. The net asset value was $51.65 as of October 31, 2016. |
| ** | | Market price cumulative return is calculated assuming an initial investment made at the inception date net asset value, reinvestment of all dividends and distributions at market price during the period, and sale at the market price on the last day of the period. The price used to calculate the market price return is the midpoint of the bid/ask spread at the close of business on the NYSE Arca. The midpoint price was $51.64 as of October 31, 2016. |
| *** | | The adviser seeks to achieve the Fund’s objective. There can be no guarantee it will be achieved. |
| **** | | Percentages indicated are based on total investments as of October 31, 2016. The Fund’s composition is subject to change. |
| | | | | | |
| | | |
| 22 | | | | JPMORGAN EXCHANGE-TRADED FUNDS | | OCTOBER 31, 2016 |
| | | | | | | | |
AVERAGE ANNUAL TOTAL RETURNS AS OF OCTOBER 31, 2016 | |
| | | INCEPTION
DATE | | | CUMULATIVE
SINCE
INCEPTION | |
JPMorgan Diversified Return U.S. Mid Cap Equity ETF | | | | | | | | |
Net Asset Value | | | 5/11/2016 | | | | 3.30 | % |
Market Price | | | | | | | 3.28 | % |
LIFE OF FUND PERFORMANCE (5/11/16 TO 10/31/16)
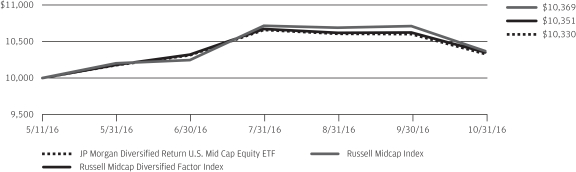
The performance quoted is past performance and is not a guarantee of future results. Exchange-traded funds are subject to certain market risks. Investment returns and principal value of an investment will fluctuate so that an investor’s shares, when redeemed, may be worth more or less than their original cost. Current performance may be higher or lower than the performance data shown. For up-to-date, month-end performance information please call 1-844-457-6383.
Fund commenced operations on May 11, 2016.
The graph illustrates comparative performance for $10,000 invested in shares of the JPMorgan Diversified Return U.S. Mid Cap Equity ETF, the Russell Midcap Diversified Factor Index, and the Russell Midcap Index from May 11, 2016 to October 31, 2016. The performance of the Fund reflects the deduction of Fund expenses and assumes reinvestment of all dividends and capital gain distributions, if any. The performance of the Russell Midcap Diversified Factor Index and Russell Midcap Index does not reflect the deduction of expenses associated with an exchange-traded fund and has been adjusted to reflect reinvestment of all dividends and capital gain distributions of the securities included in the Index, if applicable.
The Russell Midcap Diversified Factor Index is an index comprised of U.S. equity securities selected to represent a diversified set of factor characteristics, originally developed by the adviser and its holdings are selected by the index provider primarily from the constituents of the Russell Midcap Index. The Russell Midcap Index is a market-capitalization weighted index which measures the performance of the 800 smallest companies in the Russell 1000 Index. Investors cannot invest directly in an index.
Fund performance reflects the waiver of the Fund’s fees and reimbursement of expenses for certain periods since the inception date. Without these waivers and reimbursements, performance would have been lower. Also, performance shown in this section does not reflect the deduction of taxes that a shareholder may pay on Fund distributions or redemption or sale of Fund shares.
The returns shown are based on net asset values calculated for shareholder transactions and may differ from the returns shown in the financial highlights, which reflect adjustments made to the net asset values in accordance with accounting principles generally accepted in the United States of America.
| | | | | | | | |
| | | |
| OCTOBER 31, 2016 | | JPMORGAN EXCHANGE-TRADED FUNDS | | | | | 23 | |
JPMorgan Diversified Return Emerging Markets Equity ETF
SCHEDULE OF PORTFOLIO INVESTMENTS
AS OF OCTOBER 31, 2016
| | | | | | | | |
| SHARES | | | SECURITY DESCRIPTION | | VALUE($) | |
| | | | | | | | |
| Common Stocks — 86.1% | |
| | | | Brazil — 7.7% | | | | |
| | 4,009 | | | AES Tiete Energia S.A. | | | 20,836 | |
| | 107,824 | | | Ambev S.A. | | | 636,067 | |
| | 10,680 | | | Banco do Brasil S.A. | | | 98,168 | |
| | 6,490 | | | Banco Santander Brasil S.A. | | | 53,575 | |
| | 7,471 | | | BB Seguridade Participacoes S.A. | | | 74,897 | |
| | 21,502 | | | BM&F Bovespa S.A. — Bolsa de Valores Mercadorias e Futuros | | | 126,304 | |
| | 7,454 | | | BR Malls Participacoes S.A. | | | 29,797 | |
| | 15,434 | | | CCR S.A. | | | 84,036 | |
| | 3,133 | | | CETIP S.A. — Mercados Organizados | | | 44,041 | |
| | 8,499 | | | Cia de Saneamento Basico do Estado de Sao Paulo | | | 89,729 | |
| | 10,835 | | | Cia Siderurgica Nacional S.A. (a) | | | 36,456 | |
| | 13,684 | | | Cielo S.A. | | | 139,112 | |
| | 2,428 | | | Cosan S.A. Industria e Comercio | | | 32,488 | |
| | 7,778 | | | CPFL Energia S.A. | | | 59,017 | |
| | 7,541 | | | EDP — Energias do Brasil S.A. | | | 36,122 | |
| | 5,194 | | | Engie Brasil Energia S.A. | | | 66,536 | |
| | 4,843 | | | Equatorial Energia S.A. | | | 86,103 | |
| | 6,598 | | | Estacio Participacoes S.A. | | | 38,488 | |
| | 4,451 | | | Grupo BTG Pactual | | | 22,757 | |
| | 8,387 | | | Hypermarcas S.A. | | | 70,233 | |
| | 15,695 | | | JBS S.A. | | | 47,793 | |
| | 9,786 | | | Klabin S.A. | | | 50,402 | |
| | 35,372 | | | Kroton Educacional S.A. | | | 176,084 | |
| | 5,840 | | | Localiza Rent a Car S.A. | | | 72,799 | |
| | 1,208 | | | M Dias Branco S.A. | | | 51,537 | |
| | 900 | | | Multiplan Empreendimentos Imobiliarios S.A. | | | 18,104 | |
| | 1,071 | | | Multiplus S.A. | | | 14,575 | |
| | 3,778 | | | Natura Cosmeticos S.A. | | | 36,597 | |
| | 6,700 | | | Odontoprev S.A. | | | 25,188 | |
| | 58,855 | | | Petroleo Brasileiro S.A. (a) | | | 344,058 | |
| | 1,377 | | | Porto Seguro S.A. | | | 13,132 | |
| | 9,943 | | | Raia Drogasil S.A. | | | 221,319 | |
| | 1,037 | | | Sao Martinho S.A. | | | 20,730 | |
| | 1,162 | | | Smiles S.A. | | | 21,260 | |
| | 3,438 | | | Sul America S.A. | | | 20,981 | |
| | 2,355 | | | TOTVS S.A. | | | 21,396 | |
| | 2,358 | | | Transmissora Alianca de Energia Eletrica S.A. | | | 15,218 | |
| | 9,641 | | | Ultrapar Participacoes S.A. | | | 219,218 | |
| | 20,863 | | | Vale S.A. | | | 144,577 | |
| | | | | | | | |
| | | | | | | 3,379,730 | |
| | | | | | | | |
| | | | Chile — 1.1% | | | | |
| | 72,264 | | | Aguas Andinas S.A., Class A | | | 47,646 | |
| | 352,704 | | | Banco de Chile | | | 41,981 | |
| | | | | | | | |
| SHARES | | | SECURITY DESCRIPTION | | VALUE($) | |
| | | | | | | | |
| | | | Chile — continued | | | | |
| | 634 | | | Banco de Credito e Inversiones | | | 32,586 | |
| | 880,398 | | | Banco Santander Chile | | | 49,262 | |
| | 26,296 | | | Cencosud S.A. | | | 85,725 | |
| | 177,930 | | | Colbun S.A. | | | 38,764 | |
| | 506,063 | | | Enersis Americas S.A. | | | 85,715 | |
| | 2,264,697 | | | Itau CorpBanca | | | 20,587 | |
| | 11,315 | | | SACI Falabella | | | 88,847 | |
| | | | | | | | |
| | | | | | | 491,113 | |
| | | | | | | | |
| | | | China — 18.9% | | | | |
| | 6,000 | | | Agile Property Holdings Ltd. | | | 3,326 | |
| | 219,000 | | | Agricultural Bank of China Ltd., Class H | | | 92,127 | |
| | 32,000 | | | Air China Ltd., Class H | | | 21,025 | |
| | 50,000 | | | Aluminum Corp of China Ltd., Class H (a) | | | 18,571 | |
| | 14,500 | | | Anhui Conch Cement Co., Ltd., Class H | | | 40,077 | |
| | 16,000 | | | ANTA Sports Products Ltd. | | | 46,141 | |
| | 38,000 | | | AviChina Industry & Technology Co., Ltd., Class H | | | 25,788 | |
| | 23,000 | | | BAIC Motor Corp., Ltd., Class H (f) | | | 24,120 | |
| | 641,000 | | | Bank of China Ltd., Class H | | | 287,245 | |
| | 65,000 | | | Bank of Communications Co., Ltd., Class H | | | 49,405 | |
| | 36,000 | | | BBMG Corp., Class H | | | 13,140 | |
| | 20,000 | | | Beijing Capital International Airport Co., Ltd., Class H | | | 20,932 | |
| | 6,000 | | | Beijing Enterprises Holdings Ltd. | | | 29,987 | |
| | 78,000 | | | Beijing Enterprises Water Group Ltd. | | | 56,421 | |
| | 36,000 | | | Beijing Jingneng Clean Energy Co., Ltd., Class H | | | 10,919 | |
| | 116,000 | | | Belle International Holdings Ltd. | | | 70,050 | |
| | 1,500 | | | Biostime International Holdings Ltd. | | | 3,680 | |
| | 50,000 | | | Brilliance China Automotive Holdings Ltd. | | | 59,475 | |
| | 12,500 | | | BYD Co., Ltd., Class H (a) | | | 82,292 | |
| | 201,000 | | | CGN Power Co., Ltd., Class H (f) | | | 58,682 | |
| | 70,000 | | | China Cinda Asset Management Co., Ltd., Class H | | | 25,148 | |
| | 63,000 | | | China CITIC Bank Corp., Ltd., Class H | | | 40,631 | |
| | 25,000 | | | China Coal Energy Co., Ltd., Class H (a) | | | 14,153 | |
| | 57,000 | | | China Communications Construction Co., Ltd., Class H | | | 62,589 | |
| | 36,000 | | | China Communications Services Corp., Ltd., Class H | | | 21,360 | |
| | 17,000 | | | China Conch Venture Holdings Ltd. | | | 31,736 | |
| | 776,000 | | | China Construction Bank Corp., Class H | | | 566,672 | |
| | 48,000 | | | China Dongxiang Group Co., Ltd. | | | 9,333 | |
| | 32,000 | | | China Eastern Airlines Corp., Ltd., Class H (a) | | | 14,367 | |
| | 27,000 | | | China Everbright Bank Co., Ltd., Class H | | | 12,310 | |
| | 12,000 | | | China Everbright Ltd. | | | 23,467 | |
| | 30,000 | | | China Evergrande Group | | | 19,747 | |
SEE NOTES TO FINANCIAL STATEMENTS.
| | | | | | |
| | | |
| 24 | | | | JPMORGAN EXCHANGE-TRADED FUNDS | | OCTOBER 31, 2016 |
| | | | | | | | |
| SHARES | | | SECURITY DESCRIPTION | | VALUE($) | |
| Common Stocks — continued | |
| | | | China — continued | | | | |
| | 28,500 | | | China Galaxy Securities Co., Ltd., Class H | | | 27,057 | |
| | 18,000 | | | China Gas Holdings Ltd. | | | 27,398 | |
| | 13,500 | | | China Hongqiao Group Ltd. | | | 12,063 | |
| | 53,000 | | | China Huarong Asset Management Co., Ltd. (a) (f) | | | 20,262 | |
| | 36,000 | | | China Jinmao Holdings Group Ltd. | | | 9,927 | |
| | 44,000 | | | China Longyuan Power Group Corp., Ltd., Class H | | | 33,548 | |
| | 9,000 | | | China Machinery Engineering Corp., Class H | | | 5,370 | |
| | 25,000 | | | China Medical System Holdings Ltd. | | | 39,040 | |
| | 32,500 | | | China Merchants Bank Co., Ltd., Class H | | | 79,032 | |
| | 55,000 | | | China Minsheng Banking Corp., Ltd., Class H | | | 62,580 | |
| | 105,000 | | | China Mobile Ltd. | | | 1,202,921 | |
| | 54,000 | | | China Molybdenum Co., Ltd., Class H | | | 11,978 | |
| | 36,000 | | | China National Building Material Co., Ltd., Class H | | | 16,428 | |
| | 34,000 | | | China Overseas Land & Investment Ltd. | | | 104,376 | |
| | 304,000 | | | China Petroleum & Chemical Corp., Class H | | | 219,853 | |
| | 61,000 | | | China Power International Development Ltd. | | | 22,182 | |
| | 22,500 | | | China Railway Construction Corp., Ltd., Class H | | | 28,126 | |
| | 46,000 | | | China Railway Group Ltd., Class H | | | 35,459 | |
| | 22,000 | | | China Railway Signal & Communication Corp. Ltd., Class H (f) | | | 17,838 | |
| | 56,000 | | | China Reinsurance Group Corp., Class H | | | 13,330 | |
| | 18,000 | | | China Resources Gas Group Ltd. | | | 56,440 | |
| | 22,000 | | | China Resources Land Ltd. | | | 54,638 | |
| | 38,000 | | | China Resources Power Holdings Co., Ltd. | | | 64,386 | |
| | 44,500 | | | China Shenhua Energy Co., Ltd., Class H | | | 92,258 | |
| | 16,000 | | | China Shipping Development Co., Ltd., Class H | | | 8,828 | |
| | 36,000 | | | China South City Holdings Ltd. | | | 7,966 | |
| | 34,000 | | | China Southern Airlines Co., Ltd., Class H | | | 19,080 | |
| | 20,000 | | | China State Construction International Holdings Ltd. | | | 29,177 | |
| | 326,000 | | | China Telecom Corp., Ltd., Class H | | | 168,073 | |
| | 10,800 | | | China Vanke Co., Ltd., Class H | | | 28,189 | |
| | 18,000 | | | China Zhongwang Holdings Ltd. | | | 8,310 | |
| | 14,700 | | | Chongqing Changan Automobile Co., Ltd., Class B | | | 22,413 | |
| | 27,000 | | | Chongqing Rural Commercial Bank Co., Ltd., Class H | | | 16,159 | |
| | 65,000 | | | CITIC Ltd. | | | 93,273 | |
| | 20,000 | | | COSCO Shipping Ports Ltd. | | | 19,828 | |
| | 62,000 | | | Country Garden Holdings Co., Ltd. | | | 32,176 | |
| | 86,000 | | | CSPC Pharmaceutical Group Ltd. | | | 89,046 | |
| | 23,500 | | | Dali Foods Group Co., Ltd. (f) | | | 12,230 | |
| | 54,000 | | | Dongfeng Motor Group Co., Ltd., Class H | | | 56,283 | |
| | 16,000 | | | ENN Energy Holdings Ltd. | | | 75,221 | |
| | | | | | | | |
| SHARES | | | SECURITY DESCRIPTION | | VALUE($) | |
| | |
| | | | China — continued | | | | |
| | 21,000 | | | Far East Horizon Ltd. | | | 19,127 | |
| | 28,576 | | | Fosun International Ltd. | | | 41,380 | |
| | 90,000 | | | Fullshare Holdings Ltd. | | | 50,193 | |
| | 8,000 | | | Fuyao Glass Industry Group Co., Ltd., Class H (f) | | | 23,201 | |
| | 169,000 | | | GCL-Poly Energy Holdings Ltd. | | | 22,778 | |
| | 90,000 | | | Geely Automobile Holdings Ltd. | | | 92,606 | |
| | 12,400 | | | GF Securities Co., Ltd., Class H | | | 27,550 | |
| | 57,500 | | | Great Wall Motor Co., Ltd., Class H | | | 56,117 | |
| | 9,000 | | | Greentown China Holdings Ltd. (a) | | | 7,337 | |
| | 56,000 | | | Guangdong Investment Ltd. | | | 84,433 | |
| | 32,000 | | | Guangshen Railway Co., Ltd., Class H | | | 17,662 | |
| | 38,000 | | | Guangzhou Automobile Group Co., Ltd., Class H | | | 45,889 | |
| | 2,000 | | | Guangzhou Baiyunshan Pharmaceutical Holdings Co., Ltd., Class H | | | 4,725 | |
| | 7,200 | | | Guangzhou R&F Properties Co., Ltd. | | | 10,147 | |
| | 21,000 | | | Haier Electronics Group Co., Ltd. | | | 33,846 | |
| | 9,000 | | | Haitian International Holdings Ltd. | | | 18,553 | |
| | 28,000 | | | Haitong Securities Co., Ltd., Class H | | | 49,539 | |
| | 50,000 | | | Huadian Fuxin Energy Corp., Ltd., Class H | | | 11,578 | |
| | 34,000 | | | Huadian Power International Corp., Ltd., Class H | | | 14,572 | |
| | 78,000 | | | Huaneng Power International, Inc., Class H | | | 47,945 | |
| | 54,000 | | | Huaneng Renewables Corp., Ltd., Class H | | | 18,094 | |
| | 614,000 | | | Industrial & Commercial Bank of China Ltd., Class H | | | 368,547 | |
| | 18,000 | | | Jiangsu Expressway Co., Ltd., Class H | | | 24,473 | |
| | 9,000 | | | Kingboard Chemical Holdings Ltd. | | | 26,604 | |
| | 38,000 | | | Kunlun Energy Co., Ltd. | | | 28,632 | |
| | 10,236 | | | KWG Property Holding Ltd. | | | 5,923 | |
| | 18,000 | | | Lee & Man Paper Manufacturing Ltd. | | | 13,525 | |
| | 5,400 | | | Legend Holdings Corp., Class H (f) | | | 13,446 | |
| | 13,500 | | | Longfor Properties Co., Ltd. | | | 17,918 | |
| | 22,000 | | | Maanshan Iron & Steel Co., Ltd., Class H (a) | | | 5,012 | |
| | 35,000 | | | Metallurgical Corp of China Ltd., Class H | | | 11,380 | |
| | 18,000 | | | Nine Dragons Paper Holdings Ltd. | | | 14,634 | |
| | 52,000 | | | People’s Insurance Co., Group of China Ltd. (The), Class H | | | 20,661 | |
| | 38,000 | | | PICC Property & Casualty Co., Ltd., Class H | | | 61,336 | |
| | 42,000 | | | Ping An Insurance Group Company of China Ltd., Class H | | | 221,068 | |
| | 4,200 | | | Red Star Macalline Group Corp. Ltd., Class H (f) | | | 4,520 | |
| | 10,000 | | | Shandong Chenming Paper Holdings Ltd., Class H | | | 8,623 | |
| | 36,000 | | | Shandong Weigao Group Medical Polymer Co., Ltd., Class H | | | 23,438 | |
| | 6,000 | | | Shanghai Fosun Pharmaceutical Group Co., Ltd., Class H | | | 18,424 | |
SEE NOTES TO FINANCIAL STATEMENTS.
| | | | | | | | |
| | | |
| OCTOBER 31, 2016 | | JPMORGAN EXCHANGE-TRADED FUNDS | | | | | 25 | |
JPMorgan Diversified Return Emerging Markets Equity ETF
SCHEDULE OF PORTFOLIO INVESTMENTS
AS OF OCTOBER 31, 2016 (continued)
| | | | | | | | |
| SHARES | | | SECURITY DESCRIPTION | | VALUE($) | |
| Common Stocks — continued | |
| | | | China — continued | | | | |
| | 3,000 | | | Shanghai Industrial Holdings Ltd. | | | 9,171 | |
| | 14,300 | | | Shanghai Pharmaceuticals Holding Co., Ltd., Class H | | | 36,798 | |
| | 6,000 | | | Shenzhen Expressway Co., Ltd., Class H | | | 6,013 | |
| | 14,044 | | | Shenzhen International Holdings Ltd. | | | 21,687 | |
| | 18,519 | | | Shenzhen Investment Ltd. | | | 8,072 | |
| | 10,000 | | | Shenzhou International Group Holdings Ltd. | | | 66,236 | |
| | 9,000 | | | Shimao Property Holdings Ltd. | | | 12,005 | |
| | 84,000 | | | Sino Biopharmaceutical Ltd. | | | 58,712 | |
| | 31,500 | | | Sino-Ocean Land Holdings Ltd. | | | 13,083 | |
| | 13,500 | | | Sinopec Engineering Group Co., Ltd., Class H | | | 11,918 | |
| | 42,000 | | | Sinopec Shanghai Petrochemical Co., Ltd., Class H | | | 21,410 | |
| | 21,200 | | | Sinopharm Group Co., Ltd., Class H | | | 102,947 | |
| | 27,000 | | | Sinotrans Ltd., Class H | | | 12,714 | |
| | 14,500 | | | SOHO China Ltd. (a) | | | 7,477 | |
| | 16,000 | | | Sunac China Holdings Ltd. | | | 10,920 | |
| | 9,000 | | | Sunny Optical Technology Group Co., Ltd. | | | 43,892 | |
| | 49,800 | | | Tencent Holdings Ltd. | | | 1,319,816 | |
| | 20,000 | | | Tianhe Chemicals Group Ltd. (a) (f) | | | — | |
| | 12,000 | | | TravelSky Technology Ltd., Class H | | | 25,603 | |
| | 12,000 | | | Weichai Power Co., Ltd., Class H | | | 18,103 | |
| | 5,400 | | | Xinjiang Goldwind Science & Technology Co., Ltd., Class H | | | 7,445 | |
| | 22,000 | | | Yanzhou Coal Mining Co., Ltd., Class��H | | | 16,293 | |
| | 54,000 | | | Yuexiu Property Co., Ltd. | | | 7,911 | |
| | 13,500 | | | Zhaojin Mining Industry Co., Ltd. | | | 13,860 | |
| | 18,000 | | | Zhejiang Expressway Co., Ltd., Class H | | | 18,845 | |
| | 12,500 | | | Zhongsheng Group Holdings Ltd. | | | 12,480 | |
| | 6,000 | | | Zhuzhou CSR Times Electric Co., Ltd., Class H | | | 29,012 | |
| | | | | | | | |
| | | | | | | 8,295,517 | |
| | | | | | | | |
| | | | Colombia — 0.2% | | | | |
| | 4,948 | | | Almacenes Exito S.A. | | | 24,684 | |
| | 7,428 | | | Cementos Argos S.A. | | | 29,398 | |
| | 2,861 | | | Cemex Latam Holdings S.A. (a) | | | 10,638 | |
| | 78,040 | | | Ecopetrol S.A. (a) | | | 34,001 | |
| | | | | | | | |
| | | | | | | 98,721 | |
| | | | | | | | |
| | | | Czech Republic — 0.3% | | | | |
| | 4,133 | | | CEZ A/S | | | 77,953 | |
| | 990 | | | Komercni banka A/S | | | 36,224 | |
| | 3,400 | | | Moneta Money Bank AS (a) (f) | | | 11,857 | |
| | | | | | | | |
| | | | | | | 126,034 | |
| | | | | | | | |
| | | | Egypt — 0.3% | | | | |
| | 13,230 | | | Commercial International Bank Egypt SAE GDR | | | 76,970 | |
| | | | | | | | |
| SHARES | | | SECURITY DESCRIPTION | | VALUE($) | |
| | | | | | | | |
| | | | Egypt — continued | | | | |
| | 6,913 | | | Egyptian Financial Group-Hermes Holding Co. (a) | | | 12,192 | |
| | 13,501 | | | Talaat Moustafa Group | | | 8,621 | |
| | 8,566 | | | Telecom Egypt Co. | | | 8,450 | |
| | | | | | | | |
| | | | | | | 106,233 | |
| | | | | | | | |
| | | | Greece — 0.3% | | | | |
| | 17,845 | | | Alpha Bank AE (a) | | | 30,513 | |
| | 21,690 | | | Eurobank Ergasias S.A. (a) | | | 12,810 | |
| | 2,154 | | | JUMBO S.A. | | | 30,621 | |
| | 73,501 | | | National Bank of Greece S.A. (a) | | | 15,033 | |
| | 4,590 | | | OPAP S.A. | | | 39,148 | |
| | 76,022 | | | Piraeus Bank S.A. (a) | | | 12,572 | |
| | | | | | | | |
| | | | | | | 140,697 | |
| | | | | | | | |
| | | | Hungary — 0.3% | | | | |
| | 9,853 | | | Magyar Telekom Telecommunications plc | | | 16,290 | |
| | 793 | | | MOL Hungarian Oil & Gas plc | | | 50,863 | |
| | 2,394 | | | OTP Bank plc | | | 67,090 | |
| | | | | | | | |
| | | | | | | 134,243 | |
| | | | | | | | |
| | | | Indonesia — 5.8% | | | | |
| | 376,200 | | | Adaro Energy Tbk PT | | | 45,671 | |
| | 657,800 | | | Astra International Tbk PT | | | 415,011 | |
| | 271,900 | | | Bank Central Asia Tbk PT | | | 323,274 | |
| | 206,800 | | | Bank Mandiri Persero Tbk PT | | | 182,160 | |
| | 165,400 | | | Bank Negara Indonesia Persero Tbk PT | | | 70,611 | |
| | 238,500 | | | Bank Rakyat Indonesia Persero Tbk PT | | | 222,704 | |
| | 230,200 | | | Charoen Pokphand Indonesia Tbk PT | | | 65,148 | |
| | 13,700 | | | Gudang Garam Tbk PT | | | 71,281 | |
| | 67,400 | | | Indofood CBP Sukses Makmur Tbk PT | | | 48,550 | |
| | 136,200 | | | Indofood Sukses Makmur Tbk PT | | | 88,554 | |
| | 673,900 | | | Kalbe Farma Tbk PT | | | 89,798 | |
| | 144,300 | | | Media Nusantara Citra Tbk PT | | | 23,210 | |
| | 361,200 | | | Perusahaan Gas Negara Persero Tbk PT | | | 70,751 | |
| | 74,800 | | | Semen Indonesia Persero Tbk PT | | | 56,381 | |
| | 165,900 | | | Surya Citra Media Tbk PT | | | 33,693 | |
| | 23,400 | | | Tambang Batubara Bukit Asam Persero Tbk PT | | | 21,352 | |
| | 1,749,500 | | | Telekomunikasi Indonesia Persero Tbk PT | | | 564,868 | |
| | 35,800 | | | Unilever Indonesia Tbk PT | | | 121,998 | |
| | | | | | | | |
| | | | | | | 2,515,015 | |
| | | | | | | | |
| | | | Malaysia — 4.5% | | | | |
| | 36,700 | | | AirAsia Bhd | | | 24,230 | |
| | 43,000 | | | AMMB Holdings Bhd | | | 43,053 | |
| | 126,055 | | | CIMB Group Holdings Bhd | | | 151,010 | |
| | 57,600 | | | Gamuda Bhd | | | 67,418 | |
| | 69,100 | | | Genting Bhd | | | 129,126 | |
SEE NOTES TO FINANCIAL STATEMENTS.
| | | | | | |
| | | |
| 26 | | | | JPMORGAN EXCHANGE-TRADED FUNDS | | OCTOBER 31, 2016 |
| | | | | | | | |
| SHARES | | | SECURITY DESCRIPTION | | VALUE($) | |
| Common Stocks — continued | |
| | | | Malaysia — continued | | | | |
| | 88,300 | | | Genting Malaysia Bhd | | | 100,211 | |
| | 15,100 | | | HAP Seng Consolidated Bhd | | | 28,040 | |
| | 12,768 | | | Hong Leong Bank Bhd | | | 40,507 | |
| | 84,400 | | | IJM Corp. Bhd | | | 66,416 | |
| | 40,300 | | | IOI Properties Group Bhd | | | 23,536 | |
| | 9,400 | | | KLCCP Stapled Group | | | 17,886 | |
| | 16,500 | | | Kuala Lumpur Kepong Bhd | | | 94,206 | |
| | 121,308 | | | Malayan Banking Bhd | | | 228,402 | |
| | 39,600 | | | MISC Bhd | | | 70,987 | |
| | 69,100 | | | Public Bank Bhd | | | 327,134 | |
| | 23,561 | | | RHB Bank Bhd | | | 27,130 | |
| | 123,100 | | | Tenaga Nasional Bhd | | | 420,800 | |
| | 31,800 | | | Westports Holdings Bhd | | | 33,434 | |
| | 173,800 | | | YTL Corp. Bhd | | | 65,874 | |
| | | | | | | | |
| | | | | | | 1,959,400 | |
| | | | | | | | |
| | | | Mexico — 2.2% | | | | |
| | 6,643 | | | Alpek SAB de CV, Class A | | | 9,890 | |
| | 2,859 | | | Banregio Grupo Financiero SAB de CV | | | 18,740 | |
| | 2,248 | | | Concentradora Fibra Danhos S.A. de CV REIT | | | 4,115 | |
| | 7,761 | | | Controladora Vuela Cia de Aviacion SAB de CV, Class A (a) | | | 14,831 | |
| | 36,693 | | | Fibra Uno Administracion S.A. de CV REIT | | | 69,830 | |
| | 16,029 | | | Gentera SAB de CV | | | 31,615 | |
| | 3,869 | | | Gruma SAB de CV, Class B | | | 53,782 | |
| | 3,837 | | | Grupo Aeroportuario del Centro Norte SAB de CV, Class B | | | 22,392 | |
| | 6,525 | | | Grupo Aeroportuario del Pacifico SAB de CV, Class B | | | 63,037 | |
| | 3,850 | | | Grupo Aeroportuario del Sureste SAB de CV, Class B | | | 61,291 | |
| | 29,996 | | | Grupo Financiero Banorte SAB de CV, Class O | | | 176,951 | |
| | 1,029 | | | Grupo Financiero Interacciones S.A. de CV, Class O | | | 5,036 | |
| | 21,195 | | | Grupo Financiero Santander Mexico SAB de CV, Class B | | | 38,385 | |
| | 11,897 | | | Grupo Lala SAB de CV, Class B | | | 22,125 | |
| | 61,720 | | | Grupo Mexico SAB de CV | | | 151,516 | |
| | 3,861 | | | Industrias Bachoco SAB de CV | | | 17,061 | |
| | 2,011 | | | Industrias Penoles SAB de CV | | | 48,650 | |
| | 20,899 | | | Kimberly-Clark de Mexico SAB de CV, Class A | | | 45,036 | |
| | 7,481 | | | Megacable Holdings SAB de CV | | | 27,381 | |
| | 12,355 | | | Nemak SAB de CV (f) | | | 12,864 | |
| | 14,481 | | | OHL Mexico SAB de CV (a) | | | 16,993 | |
| | 4,177 | | | Promotora y Operadora de Infraestructura SAB de CV | | | 46,597 | |
| | | | | | | | |
| | | | | | | 958,118 | |
| | | | | | | | |
| | | | | | | | |
| SHARES | | | SECURITY DESCRIPTION | | VALUE($) | |
| | | | | | | | |
| | | | Pakistan — 0.1% | | | | |
| | 8,800 | | | Oil & Gas Development Co., Ltd. | | | 11,766 | |
| | 5,300 | | | Pakistan Petroleum Ltd. | | | 7,491 | |
| | | | | | | | |
| | | | | | | 19,257 | |
| | | | | | | | |
| | | | Philippines — 2.2% | | | | |
| | 59,340 | | | Aboitiz Equity Ventures, Inc. | | | 95,528 | |
| | 54,900 | | | Aboitiz Power Corp. | | | 52,001 | |
| | 101,900 | | | Alliance Global Group, Inc. | | | 29,997 | |
| | 6,510 | | | Ayala Corp. | | | 112,234 | |
| | 35,100 | | | Bank of the Philippine Islands | | | 73,284 | |
| | 32,340 | | | BDO Unibank, Inc. | | | 75,319 | |
| | 117,000 | | | DMCI Holdings, Inc. | | | 30,169 | |
| | 240,300 | | | Energy Development Corp. | | | 29,265 | |
| | 500 | | | Globe Telecom, Inc. | | | 18,390 | |
| | 1,185 | | | GT Capital Holdings, Inc. | | | 32,027 | |
| | 95,920 | | | JG Summit Holdings, Inc. | | | 150,271 | |
| | 10,330 | | | Manila Electric Co. | | | 58,923 | |
| | 290,600 | | | Megaworld Corp. | | | 24,088 | |
| | 28,236 | | | Metropolitan Bank & Trust Co. | | | 47,419 | |
| | 67,600 | | | Petron Corp. | | | 14,447 | |
| | 8,010 | | | Semirara Mining and Power Corp., Class A | | | 20,826 | |
| | 205,100 | | | SM Prime Holdings, Inc. | | | 113,887 | |
| | | | | | | | |
| | | | | | | 978,075 | |
| | | | | | | | |
| | | | Poland — 1.3% | | | | |
| | 1,287 | | | Asseco Poland S.A. | | | 17,202 | |
| | 7,392 | | | Bank Millennium S.A. (a) | | | 10,872 | |
| | 342 | | | Bank Zachodni WBK S.A. | | | 27,634 | |
| | 607 | | | CCC S.A. | | | 30,802 | |
| | 5,067 | | | Cyfrowy Polsat S.A. (a) | | | 31,315 | |
| | 5,166 | | | Enea S.A. | | | 13,233 | |
| | 6,769 | | | Energa S.A. | | | 13,881 | |
| | 1,611 | | | Grupa Lotos S.A. (a) | | | 13,968 | |
| | 2,263 | | | KGHM Polska Miedz S.A. | | | 41,074 | |
| | 152 | | | mBank S.A. (a) | | | 13,726 | |
| | 17,773 | | | PGE Polska Grupa Energetyczna S.A. | | | 46,567 | |
| | 5,885 | | | Polski Koncern Naftowy Orlen S.A. | | | 116,596 | |
| | 29,041 | | | Polskie Gornictwo Naftowe i Gazownictwo S.A. | | | 37,179 | |
| | 11,549 | | | Powszechna Kasa Oszczednosci Bank Polski S.A. | | | 80,903 | |
| | 7,516 | | | Powszechny Zaklad Ubezpieczen S.A. | | | 52,186 | |
| | 25,119 | | | Tauron Polska Energia S.A. | | | 16,974 | |
| | | | | | | | |
| | | | | | | 564,112 | |
| | | | | | | | |
| | | | Russia — 5.1% | | | | |
| | 10,089 | | | Aeroflot PJSC (a) | | | 20,669 | |
| | 41,086 | | | Alrosa PAO | | | 57,470 | |
SEE NOTES TO FINANCIAL STATEMENTS.
| | | | | | | | |
| | | |
| OCTOBER 31, 2016 | | JPMORGAN EXCHANGE-TRADED FUNDS | | | | | 27 | |
JPMorgan Diversified Return Emerging Markets Equity ETF
SCHEDULE OF PORTFOLIO INVESTMENTS
AS OF OCTOBER 31, 2016 (continued)
| | | | | | | | |
| SHARES | | | SECURITY DESCRIPTION | | VALUE($) | |
| Common Stocks — continued | |
| | | | Russia — continued | | | | |
| | 390 | | | Bashneft PJSC | | | 20,448 | |
| | 6,307,455 | | | Federal Grid Co., Unified Energy System PJSC | | | 17,024 | |
| | 180,624 | | | Gazprom OAO | | | 395,803 | |
| | 402,318 | | | Inter RAO UES PJSC | | | 21,584 | |
| | 7,487 | | | Lukoil PJSC | | | 365,349 | |
| | 26,182 | | | Magnitogorsk Iron & Steel Works OJSC | | | 13,155 | |
| | 2,277 | | | MegaFon PJSC GDR | | | 21,700 | |
| | 780 | | | MMC Norilsk Nickel PJSC | | | 115,011 | |
| | 24,948 | | | Mobile TeleSystems PJSC | | | 88,018 | |
| | 16,705 | | | Moscow Exchange MICEX-RTS PJSC | | | 30,771 | |
| | 18,433 | | | Novatek OJSC | | | 192,193 | |
| | 15,940 | | | Novolipetsk Steel PJSC | | | 25,799 | |
| | 1,305 | | | PhosAgro PJSC GDR | | | 16,182 | |
| | 19,128 | | | Rosneft PJSC | | | 104,932 | |
| | 605,729 | | | Rosseti PJSC | | | 9,329 | |
| | 23,853 | | | Rostelecom PJSC | | | 29,761 | |
| | 2,267,020 | | | RusHydro PJSC | | | 28,456 | |
| | 144,548 | | | Sberbank of Russia PJSC | | | 336,457 | |
| | 2,968 | | | Severstal PJSC | | | 41,485 | |
| | 68,149 | | | Sistema PJSC FC | | | 20,744 | |
| | 126,556 | | | Surgutneftegas OJSC | | | 53,938 | |
| | 23,340 | | | Tatneft PJSC, Class S | | | 130,747 | |
| | 6,203 | | | Uralkali PJSC (a) | | | 16,228 | |
| | 68,574,446 | | | VTB Bank PJSC | | | 73,306 | |
| | | | | | | | |
| | | | | | | 2,246,559 | |
| | | | | | | | |
| | | | South Africa — 7.1% | | | | |
| | 1,800 | | | African Rainbow Minerals Ltd. | | | 13,042 | |
| | 6,690 | | | AngloGold Ashanti Ltd. (a) | | | 91,089 | |
| | 8,577 | | | Aspen Pharmacare Holdings Ltd. | | | 186,847 | |
| | 6,714 | | | AVI Ltd. | | | 47,184 | |
| | 5,677 | | | Barclays Africa Group Ltd. | | | 65,878 | |
| | 3,942 | | | Barloworld Ltd. | | | 25,462 | |
| | 5,776 | | | Bidvest Group Ltd. (The) | | | 71,762 | |
| | 4,214 | | | Brait S.E. (a) | | | 27,968 | |
| | 657 | | | Capitec Bank Holdings Ltd. | | | 33,352 | |
| | 5,070 | | | Clicks Group Ltd. | | | 47,189 | |
| | 3,558 | | | Coronation Fund Managers Ltd. | | | 19,150 | |
| | 2,313 | | | Exxaro Resources Ltd. | | | 17,049 | |
| | 40,597 | | | FirstRand Ltd. | | | 145,571 | |
| | 4,875 | | | Foschini Group Ltd. (The) | | | 50,113 | |
| | 13,480 | | | Gold Fields Ltd. | | | 55,595 | |
| | 34,075 | | | Growthpoint Properties Ltd. REIT | | | 63,541 | |
| | 6,142 | | | Harmony Gold Mining Co., Ltd. | | | 19,068 | |
| | 3,126 | | | Hyprop Investments Ltd. REIT | | | 27,737 | |
| | 9,886 | | | Impala Platinum Holdings Ltd. (a) | | | 39,946 | |
| | | | | | | | |
| SHARES | | | SECURITY DESCRIPTION | | VALUE($) | |
| | | | | | | | |
| | | | South Africa — continued | | | | |
| | 3,024 | | | Imperial Holdings Ltd. | | | 38,195 | |
| | 1,285 | | | JSE Ltd. | | | 14,970 | |
| | 24,064 | | | KAP Industrial Holdings Ltd. | | | 13,831 | |
| | 1,035 | | | Kumba Iron Ore Ltd. (a) | | | 10,540 | |
| | 1,314 | | | Liberty Holdings Ltd. | | | 11,299 | |
| | 25,689 | | | Life Healthcare Group Holdings Ltd. | | | 68,631 | |
| | 2,532 | | | Massmart Holdings Ltd. | | | 21,944 | |
| | 13,050 | | | MMI Holdings Ltd. | | | 21,861 | |
| | 2,040 | | | Mondi Ltd. | | | 39,848 | |
| | 5,539 | | | Mr Price Group Ltd. | | | 63,103 | |
| | 10,440 | | | Nampak Ltd. | | | 14,560 | |
| | 2,874 | | | Nedbank Group Ltd. | | | 47,045 | |
| | 1,069 | | | Omnia Holdings Ltd. | | | 12,954 | |
| | 8,180 | | | Pick n Pay Stores Ltd. | | | 40,079 | |
| | 3,445 | | | Pioneer Foods Group Ltd. | | | 41,587 | |
| | 58,463 | | | Redefine Properties Ltd. REIT | | | 50,026 | |
| | 3,639 | | | Resilient Ltd. REIT | | | 30,105 | |
| | 8,487 | | | RMB Holdings Ltd. | | | 37,386 | |
| | 22,977 | | | Sanlam Ltd. | | | 111,294 | |
| | 9,027 | | | Sappi Ltd. (a) | | | 50,210 | |
| | 9,071 | | | Sasol Ltd. | | | 250,496 | |
| | 10,042 | | | Shoprite Holdings Ltd. | | | 148,194 | |
| | 13,104 | | | Sibanye Gold Ltd. | | | 36,452 | |
| | 4,138 | | | SPAR Group Ltd. (The) | | | 58,616 | |
| | 15,766 | | | Standard Bank Group Ltd. | | | 167,361 | |
| | 60,762 | | | Steinhoff International Holdings NV | | | 327,791 | |
| | 5,956 | | | Super Group Ltd. (a) | | | 17,580 | |
| | 7,416 | | | Telkom S.A. SOC Ltd. | | | 34,184 | |
| | 3,791 | | | Tiger Brands Ltd. | | | 107,954 | |
| | 2,574 | | | Tongaat Hulett Ltd. | | | 23,270 | |
| | 9,596 | | | Truworths International Ltd. | | | 50,913 | |
| | 12,094 | | | Tsogo Sun Holdings Ltd. | | | 27,498 | |
| | 7,878 | | | Vodacom Group Ltd. | | | 84,995 | |
| | | | | | | | |
| | | | | | | 3,122,315 | |
| | | | | | | | |
| | | | Taiwan — 19.9% | | | | |
| | 64,000 | | | Acer, Inc. | | | 29,327 | |
| | 145,000 | | | Advanced Semiconductor Engineering, Inc. | | | 170,372 | |
| | 8,000 | | | Advantech Co., Ltd. | | | 65,017 | |
| | 52,000 | | | Asia Cement Corp. | | | 45,336 | |
| | 17,000 | | | Asustek Computer, Inc. | | | 148,823 | |
| | 17,000 | | | Catcher Technology Co., Ltd. | | | 133,075 | |
| | 139,000 | | | Cathay Financial Holding Co., Ltd. | | | 179,891 | |
| | 101,513 | | | Chang Hwa Commercial Bank Ltd. | | | 51,869 | |
| | 48,000 | | | Cheng Shin Rubber Industry Co., Ltd. | | | 97,659 | |
| | 11,110 | | | Chicony Electronics Co., Ltd. | | | 28,386 | |
SEE NOTES TO FINANCIAL STATEMENTS.
| | | | | | |
| | | |
| 28 | | | | JPMORGAN EXCHANGE-TRADED FUNDS | | OCTOBER 31, 2016 |
| | | | | | | | |
| SHARES | | | SECURITY DESCRIPTION | | VALUE($) | |
| Common Stocks — continued | | | | |
| | | | Taiwan — continued | | | | |
| | 71,000 | | | China Airlines Ltd. | | | 21,480 | |
| | 259,000 | | | China Steel Corp. | | | 187,067 | |
| | 116,000 | | | Chunghwa Telecom Co., Ltd. | | | 397,203 | |
| | 99,000 | | | Compal Electronics, Inc. | | | 58,867 | |
| | 318,395 | | | CTBC Financial Holding Co., Ltd. | | | 171,231 | |
| | 48,000 | | | Delta Electronics, Inc. | | | 252,700 | |
| | 154,326 | | | E.Sun Financial Holding Co., Ltd. | | | 87,642 | |
| | 18,000 | | | Eternal Materials Co., Ltd. | | | 18,971 | |
| | 57,450 | | | Eva Airways Corp. | | | 27,657 | |
| | 47,000 | | | Far EasTone Telecommunications Co., Ltd. | | | 111,066 | |
| | 10,720 | | | Feng TAY Enterprise Co., Ltd. | | | 44,714 | |
| | 176,863 | | | First Financial Holding Co., Ltd. | | | 92,646 | |
| | 92,000 | | | Formosa Chemicals & Fibre Corp. | | | 273,149 | |
| | 30,000 | | | Formosa Petrochemical Corp. | | | 100,166 | |
| | 103,000 | | | Formosa Plastics Corp. | | | 278,343 | |
| | 26,533 | | | Foxconn Technology Co., Ltd. | | | 76,914 | |
| | 127,000 | | | Fubon Financial Holding Co., Ltd. | | | 179,693 | |
| | 331,490 | | | Hon Hai Precision Industry Co., Ltd. | | | 895,409 | |
| | 11,000 | | | Hotai Motor Co., Ltd. | | | 127,777 | |
| | 144,153 | | | Hua Nan Financial Holdings Co., Ltd. | | | 73,202 | |
| | 191,000 | | | Innolux Corp. | | | 64,296 | |
| | 72,000 | | | Inventec Corp. | | | 56,213 | |
| | 3,000 | | | Largan Precision Co., Ltd. | | | 353,926 | |
| | 47,496 | | | Lite-On Technology Corp. | | | 68,090 | |
| | 33,000 | | | MediaTek, Inc. | | | 250,137 | |
| | 200,233 | | | Mega Financial Holding Co., Ltd. | | | 136,896 | |
| | 119,000 | | | Nan Ya Plastics Corp. | | | 247,130 | |
| | 8,737 | | | Nanya Technology Corp. | | | 11,326 | |
| | 12,000 | | | Novatek Microelectronics Corp. | | | 44,930 | |
| | 45,000 | | | Pegatron Corp. | | | 121,175 | |
| | 73,000 | | | Pou Chen Corp. | | | 98,497 | |
| | 16,000 | | | President Chain Store Corp. | | | 119,546 | |
| | 61,000 | | | Quanta Computer, Inc. | | | 123,401 | |
| | 10,000 | | | Realtek Semiconductor Corp. | | | 33,871 | |
| | 129,287 | | | Shin Kong Financial Holding Co., Ltd. | | | 28,021 | |
| | 53,165 | | | Siliconware Precision Industries Co., Ltd. | | | 80,414 | |
| | 186,450 | | | SinoPac Financial Holdings Co., Ltd. | | | 53,739 | |
| | 28,200 | | | Synnex Technology International Corp. | | | 30,046 | |
| | 163,841 | | | Taishin Financial Holding Co., Ltd. | | | 59,896 | |
| | 72,702 | | | Taiwan Business Bank | | | 18,364 | |
| | 71,000 | | | Taiwan Cement Corp. | | | 85,042 | |
| | 151,820 | | | Taiwan Cooperative Financial Holding Co., Ltd. | | | 66,539 | |
| | 52,000 | | | Taiwan Mobile Co., Ltd. | | | 181,940 | |
| | 235,000 | | | Taiwan Semiconductor Manufacturing Co., Ltd. | | | 1,410,319 | |
| | 48,000 | | | Teco Electric and Machinery Co., Ltd. | | | 42,555 | |
| | | | | | | | |
| SHARES | | | SECURITY DESCRIPTION | | VALUE($) | |
| | | | | | | | |
| | | | Taiwan — continued | | | | |
| | 7,000 | | | Transcend Information, Inc. | | | 19,332 | |
| | 134,000 | | | Uni-President Enterprises Corp. | | | 258,894 | |
| | 19,000 | | | Vanguard International Semiconductor Corp. | | | 38,682 | |
| | 73,000 | | | Walsin Lihwa Corp. | | | 25,538 | |
| | 57,495 | | | Wistron Corp. | | | 43,322 | |
| | 214,665 | | | Yuanta Financial Holding Co., Ltd. | | | 80,125 | |
| | 25,000 | | | Yulon Motor Co., Ltd. | | | 21,875 | |
| | | | | | | | |
| | | | | | | 8,699,729 | |
| | | | | | | | |
| | | | Thailand — 5.7% | | | | |
| | 41,600 | | | Advanced Info Service PCL NVDR | | | 182,320 | |
| | 11,600 | | | Airports of Thailand PCL NVDR | | | 126,200 | |
| | 9,900 | | | Bangkok Bank PCL NVDR | | | 45,109 | |
| | 55,000 | | | Central Pattana PCL NVDR | | | 87,398 | |
| | 139,500 | | | Charoen Pokphand Foods PCL NVDR | | | 125,456 | |
| | 170,700 | | | CP ALL PCL NVDR | | | 295,891 | |
| | 12,600 | | | Delta Electronics Thailand PCL NVDR | | | 28,220 | |
| | 9,400 | | | Electricity Generating PCL NVDR | | | 52,317 | |
| | 13,300 | | | Glow Energy PCL NVDR | | | 29,210 | |
| | 185,100 | | | Home Product Center PCL NVDR | | | 53,301 | |
| | 39,400 | | | Indorama Ventures PCL NVDR | | | 32,867 | |
| | 51,000 | | | Intouch Holdings PCL NVDR | | | 77,254 | |
| | 251,300 | | | IRPC PCL NVDR | | | 34,301 | |
| | 26,100 | | | Kasikornbank PCL NVDR | | | 128,115 | |
| | 140,200 | | | Krung Thai Bank PCL NVDR | | | 68,855 | |
| | 138,100 | | | Land & Houses PCL NVDR | | | 36,198 | |
| | 111,000 | | | Minor International PCL NVDR | | | 121,948 | |
| | 35,700 | | | PTT Exploration & Production PCL NVDR | | | 84,464 | |
| | 51,500 | | | PTT Global Chemical PCL NVDR | | | 87,957 | |
| | 36,400 | | | PTT PCL NVDR | | | 358,405 | |
| | 27,400 | | | Ratchaburi Electricity Generating Holding PCL NVDR | | | 39,150 | |
| | 1,900 | | | Siam City Cement PCL NVDR | | | 15,684 | |
| | 53,700 | | | Siam Commercial Bank PCL (The) NVDR | | | 219,867 | |
| | 37,800 | | | Thai Airways International PCL NVDR | | | 30,201 | |
| | 21,600 | | | Thai Oil PCL NVDR | | | 43,152 | |
| | 92,100 | | | Thai Union Group PCL NVDR | | | 57,073 | |
| | 442,900 | | | TMB Bank PCL NVDR | | | 26,543 | |
| | | | | | | | |
| | | | | | | 2,487,456 | |
| | | | | | | | |
| | | | Turkey — 1.5% | | | | |
| | 26,710 | | | Akbank TAS | | | 71,480 | |
| | 3,763 | | | Arcelik A/S | | | 24,861 | |
| | 2,808 | | | Aselsan Elektronik Sanayi Ve Ticaret A/S | | | 8,539 | |
| | 1,709 | | | Aygaz A/S | | | 6,039 | |
| | 24,750 | | | Emlak Konut Gayrimenkul Yatirim Ortakligi A/S REIT | | | 25,289 | |
SEE NOTES TO FINANCIAL STATEMENTS.
| | | | | | | | |
| | | |
| OCTOBER 31, 2016 | | JPMORGAN EXCHANGE-TRADED FUNDS | | | | | 29 | |
JPMorgan Diversified Return Emerging Markets Equity ETF
SCHEDULE OF PORTFOLIO INVESTMENTS
AS OF OCTOBER 31, 2016 (continued)
| | | | | | | | |
| SHARES | | | SECURITY DESCRIPTION | | VALUE($) | |
| Common Stocks — continued | | | | |
| | | | Turkey — continued | | | | |
| | 9,595 | | | Enka Insaat ve Sanayi A/S | | | 14,655 | |
| | 22,896 | | | Eregli Demir ve Celik Fabrikalari TAS | | | 31,132 | |
| | 1,520 | | | Ford Otomotiv Sanayi A/S | | | 15,529 | |
| | 10,422 | | | Haci Omer Sabanci Holding A/S | | | 31,513 | |
| | 10,629 | | | KOC Holding A/S | | | 44,334 | |
| | 765 | | | Koza Altin Isletmeleri A/S (a) | | | 4,358 | |
| | 9,081 | | | Petkim Petrokimya Holding A/S | | | 12,339 | |
| | 2,619 | | | TAV Havalimanlari Holding A/S | | | 10,767 | |
| | 2,600 | | | Tofas Turk Otomobil Fabrikasi A/S | | | 19,592 | |
| | 2,061 | | | Tupras Turkiye Petrol Rafinerileri A/S | | | 42,032 | |
| | 11,640 | | | Turk Hava Yollari AO (a) | | | 20,477 | |
| | 12,546 | | | Turk Telekomunikasyon A/S | | | 23,212 | |
| | 237 | | | Turk Traktor ve Ziraat Makineleri A/S | | | 6,155 | |
| | 18,874 | | | Turkcell Iletisim Hizmetleri A/S (a) | | | 60,859 | |
| | 27,495 | | | Turkiye Garanti Bankasi A/S | | | 74,818 | |
| | 7,983 | | | Turkiye Halk Bankasi A/S | | | 24,279 | |
| | 17,235 | | | Turkiye Is Bankasi, Class C | | | 27,986 | |
| | 11,557 | | | Turkiye Sinai Kalkinma Bankasi A/S | | | 5,123 | |
| | 12,706 | | | Turkiye Sise ve Cam Fabrikalari A/S | | | 13,366 | |
| | 13,410 | | | Turkiye Vakiflar Bankasi Tao, Class D | | | 19,876 | |
| | 3,401 | | | Ulker Biskuvi Sanayi A/S | | | 21,118 | |
| | 11,106 | | | Yapi ve Kredi Bankasi A/S | | | 13,296 | |
| | | | | | | | |
| | | | | | | 673,024 | |
| | | | | | | | |
| | | | United Arab Emirates — 1.5% | | | | |
| | 51,319 | | | Abu Dhabi Commercial Bank PJSC | | | 85,646 | |
| | 48,618 | | | Air Arabia PJSC | | | 17,183 | |
| | 37,425 | | | Aldar Properties PJSC | | | 26,791 | |
| | 18,981 | | | Dubai Investments PJSC | | | 10,360 | |
| | 43,347 | | | Dubai Islamic Bank PJSC | | | 61,752 | |
| | 24,784 | | | Emaar Malls PJSC | | | 17,313 | |
| | 46,983 | | | Emaar Properties PJSC | | | 88,966 | |
| | 51,838 | | | Emirates Telecommunications Group Co., PJSC | | | 265,955 | |
| | 28,131 | | | First Gulf Bank PJSC | | | 87,964 | |
| | | | | | | | |
| | | | | | | 661,930 | |
| | | | | | | | |
| | | | United States — 0.1% | | | | |
| | 3,261 | | | Cia de Minas Buenaventura SAA ADR | | | 43,339 | |
| | | | | | | | |
| | | | Total Common Stocks
(Cost $37,859,060) | | | 37,700,617 | |
| | | | | | | | |
| Exchange Traded Fund — 8.5% | |
| | | | India— 8.5% | | | | |
| | 128,934 | | | iShares MSCI India ETF | | | 3,744,243 | |
| | | | | | | | |
| | | | Total Exchange Traded Fund (Cost $3,885,546) | | | 3,744,243 | |
| | | | | | | | |
| | | | | | | | |
| SHARES | | | SECURITY DESCRIPTION | | VALUE($) | |
| Preferred Stocks — 5.2% | |
| | | | Brazil — 4.6% | | | | |
| | 42,969 | | | Banco Bradesco S.A. | | | 450,555 | |
| | 2,718 | | | Braskem S.A. | | | 24,132 | |
| | 882 | | | Cia de Transmissao de Energia Eletrica Paulista | | | 19,146 | |
| | 18,747 | | | Cia Energetica de Minas Gerais | | | 57,263 | |
| | 2,565 | | | Cia Paranaense de Energia | | | 29,451 | |
| | 15,228 | | | Gerdau S.A. | | | 52,668 | |
| | 40,301 | | | Itau Unibanco Holding S.A. | | | 485,834 | |
| | 47,843 | | | Itausa — Investimentos Itau S.A. | | | 141,191 | |
| | 68,273 | | | Petroleo Brasileiro S.A. (a) | | | 378,367 | |
| | 5,741 | | | Suzano Papel e Celulose S.A., Class A | | | 20,234 | |
| | 9,757 | | | Telefonica Brasil S.A. | | | 140,639 | |
| | 30,781 | | | Vale S.A. (a) | | | 199,421 | |
| | | | | | | | |
| | | | | | | 1,998,901 | |
| | | | | | | | |
| | | | Chile — 0.1% | | | | |
| | 1,684 | | | Sociedad Quimica y Minera de Chile S.A., Class B | | | 49,954 | |
| | | | | | | | |
| | | | Colombia — 0.2% | | | | |
| | 5,957 | | | Bancolombia S.A. | | | 56,543 | |
| | 54,055 | | | Grupo Aval Acciones y Valores S.A. | | | 22,292 | |
| | | | | | | | |
| | | | | | | 78,835 | |
| | | | | | | | |
| | | | Russia — 0.3% | | | | |
| | 141,294 | | | Surgutneftegas OJSC | | | 64,066 | |
| | 27 | | | Transneft PJSC | | | 64,658 | |
| | | | | | | | |
| | | | | | | 128,724 | |
| | | | | | | | |
| | | | Total Preferred Stocks
(Cost $1,824,463) | | | 2,256,414 | |
| | | | | | | | |
| | | | Total Investments — 99.8%
(Cost $43,569,069) | | | 43,701,274 | |
| | | | Other Assets in Excess of
Liabilities — 0.2% | | | 108,187 | |
| | | | | | | | |
| | | | NET ASSETS — 100.0% | | $ | 43,809,461 | |
| | | | | | | | |
Percentages indicated are based on net assets.
SEE NOTES TO FINANCIAL STATEMENTS.
| | | | | | |
| | | |
| 30 | | | | JPMORGAN EXCHANGE-TRADED FUNDS | | OCTOBER 31, 2016 |
Summary of Investments by Industry, October 31, 2016
The following table represents the portfolio investments of the Fund by industry classifications as a percentage of total investments:
| | | | |
| INDUSTRY | | PERCENTAGE | |
Banks | | | 18.2 | % |
Oil, Gas & Consumable Fuels | | | 8.7 | |
Exchange Traded Fund | | | 8.6 | |
Semiconductors & Semiconductor Equipment | | | 5.3 | |
Wireless Telecommunication Services | | | 4.7 | |
Electronic Equipment, Instruments & Components | | | 3.9 | |
Diversified Telecommunication Services | | | 3.8 | |
Metals & Mining | | | 3.5 | |
Internet Software & Services | | | 3.0 | |
Food Products | | | 2.8 | |
Electric Utilities | | | 2.5 | |
Chemicals | | | 2.5 | |
Food & Staples Retailing | | | 2.4 | |
Technology Hardware, Storage & Peripherals | | | 2.3 | |
Automobiles | | | 2.1 | |
Real Estate Management & Development | | | 2.0 | |
Insurance | | | 1.9 | |
Industrial Conglomerates | | | 1.5 | |
Beverages | | | 1.5 | |
Transportation Infrastructure | | | 1.3 | |
Independent Power and Renewable Electricity Producers | | | 1.3 | |
Capital Markets | | | 1.3 | |
Diversified Financial Services | | | 1.3 | |
Pharmaceuticals | | | 1.1 | |
Others (each less than 1.0%) | | | 12.5 | |
SEE NOTES TO FINANCIAL STATEMENTS.
| | | | | | | | |
| | | |
| OCTOBER 31, 2016 | | JPMORGAN EXCHANGE-TRADED FUNDS | | | | | 31 | |
JPMorgan Diversified Return Europe Currency Hedged ETF
SCHEDULE OF PORTFOLIO INVESTMENTS
AS OF OCTOBER 31, 2016
| | | | | | | | |
| SHARES | | | SECURITY DESCRIPTION | | VALUE($) | |
| Investment Company — 100.2% | |
| | | | Exchange Traded Fund — 100.2% | | | | |
| | 531,225 | | | JPMorgan Diversified Return Europe Equity ETF (b) | | | 26,524,064 | |
| | | | | | | | |
| | | | Total Exchange Traded Fund
(Cost $27,642,151) | | | 26,524,064 | |
| | | | | | | | |
| | | | Total Investments — 100.2%
(Cost $27,642,151) | | | 26,524,064 | |
| | | | Liabilities in Excess of
Other Assets — (0.2)% | | | (40,796 | ) |
| | | | | | | | |
| | | | NET ASSETS — 100.0% | | $ | 26,483,268 | |
| | | | | | | | |
Percentages indicated are based on net assets.
| | | | | | | | | | | | | | | | | | | | | | |
| Forward Foreign Currency Exchange Contracts | |
CONTRACTS
TO BUY (c) | | | CURRENCY | | COUNTERPARTY | | SETTLEMENT
DATE | | | SETTLEMENT
VALUE | | | VALUE AT
OCTOBER 31, 2016 | | | NET
UNREALIZED
APPRECIATION
(DEPRECIATION) | |
| | 3,001,588 | | | CHF | | Goldman Sachs | | | 11/03/2016 | | | | 3,035,889 | | | | 3,033,747 | | | | (2,142 | ) |
| | 98,324 | | | CHF | | Goldman Sachs | | | 12/05/2016 | | | | 99,597 | | | | 99,550 | | | | (47 | ) |
| | 5,205,395 | | | DKK | | Goldman Sachs | | | 11/03/2016 | | | | 767,128 | | | | 768,331 | | | | 1,203 | |
| | 291,963 | | | DKK | | Goldman Sachs | | | 12/05/2016 | | | | 43,084 | | | | 43,156 | | | | 72 | |
| | 12,003,893 | | | EUR | | Goldman Sachs | | | 11/03/2016 | | | | 13,162,968 | | | | 13,178,913 | | | | 15,945 | |
| | 5,501,758 | | | GBP | | Goldman Sachs | | | 11/03/2016 | | | | 6,719,223 | | | | 6,734,568 | | | | 15,345 | |
| | 71,672 | | | GBP | | Goldman Sachs | | | 12/05/2016 | | | | 87,563 | | | | 87,792 | | | | 229 | |
| | 5,626,034 | | | NOK | | Goldman Sachs | | | 11/03/2016 | | | | 681,860 | | | | 680,927 | | | | (933 | ) |
| | 16,224,745 | | | SEK | | Goldman Sachs | | | 11/03/2016 | | | | 1,808,692 | | | | 1,796,573 | | | | (12,119 | ) |
| | 438,979 | | | SEK | | Goldman Sachs | | | 12/05/2016 | | | | 48,733 | | | | 48,682 | | | | (51 | ) |
| | | | | | | | | | | | | 26,454,737 | | | | 26,472,239 | | | | 17,502 | |
| | |
| | | | | | |
CONTRACTS
TO SELL (c) | | | CURRENCY | | COUNTERPARTY | | SETTLEMENT
DATE | | | SETTLEMENT
VALUE | | | VALUE AT
OCTOBER 31, 2016 | | | NET
UNREALIZED
APPRECIATION
(DEPRECIATION) | |
| | 3,001,588 | | | CHF | | Goldman Sachs | | | 11/03/2016 | | | | 3,101,711 | | | | 3,033,747 | | | | 67,964 | |
| | 3,092,590 | | | CHF | | Goldman Sachs | | | 12/05/2016 | | | | 3,132,479 | | | | 3,131,157 | | | | 1,322 | |
| | 5,205,395 | | | DKK | | Goldman Sachs | | | 11/03/2016 | | | | 786,718 | | | | 768,331 | | | | 18,387 | |
| | 5,386,299 | | | DKK | | Goldman Sachs | | | 12/05/2016 | | | | 794,846 | | | | 796,172 | | | | (1,326 | ) |
| | 12,003,893 | | | EUR | | Goldman Sachs | | | 11/03/2016 | | | | 13,509,152 | | | | 13,178,913 | | | | 330,239 | |
| | 12,349,680 | | | EUR | | Goldman Sachs | | | 12/05/2016 | | | | 13,556,236 | | | | 13,577,099 | | | | (20,863 | ) |
| | 5,501,758 | | | GBP | | Goldman Sachs | | | 11/03/2016 | | | | 7,151,185 | | | | 6,734,568 | | | | 416,617 | |
| | 5,680,981 | | | GBP | | Goldman Sachs | | | 12/05/2016 | | | | 6,940,785 | | | | 6,958,718 | | | | (17,933 | ) |
| | 5,626,034 | | | NOK | | Goldman Sachs | | | 11/03/2016 | | | | 703,999 | | | | 680,927 | | | | 23,072 | |
| | 5,972,982 | | | NOK | | Goldman Sachs | | | 12/05/2016 | | | | 723,888 | | | | 722,957 | | | | 931 | |
| | 16,224,745 | | | SEK | | Goldman Sachs | | | 11/03/2016 | | | | 1,896,630 | | | | 1,796,573 | | | | 100,057 | |
| | 15,080,571 | | | SEK | | Goldman Sachs | | | 12/05/2016 | | | | 1,674,113 | | | | 1,672,422 | | | | 1,691 | |
| | | | | | | | | | | | | 53,971,742 | | | | 53,051,584 | | | | 920,158 | |
| | |
SEE NOTES TO FINANCIAL STATEMENTS.
| | | | | | |
| | | |
| 32 | | | | JPMORGAN EXCHANGE-TRADED FUNDS | | OCTOBER 31, 2016 |
JPMorgan Diversified Return Europe Equity ETF
SCHEDULE OF PORTFOLIO INVESTMENTS
AS OF OCTOBER 31, 2016
| | | | | | | | |
| SHARES | | | SECURITY DESCRIPTION | | VALUE($) | |
| Common Stocks — 98.7% | |
| | | | Austria — 0.9% | |
| | 1,641 | | | ANDRITZ AG | | | 85,801 | |
| | 8,045 | | | OMV AG | | | 251,083 | |
| | 5,782 | | | voestalpine AG | | | 204,834 | |
| | | | | | | | |
| | | | | | | 541,718 | |
| | | | | | | | |
| | | | Belgium — 2.1% | |
| | 1,972 | | | Ageas | | | 72,044 | |
| | 3,668 | | | bpost S.A. | | | 97,586 | |
| | 3,460 | | | Colruyt S.A. | | | 185,969 | |
| | 985 | | | Groupe Bruxelles Lambert S.A. | | | 84,678 | |
| | 10,317 | | | Proximus SADP | | | 295,299 | |
| | 1,875 | | | Solvay S.A. | | | 215,089 | |
| | 4,756 | | | Umicore S.A. | | | 289,081 | |
| | | | | | | | |
| | | | | | | 1,239,746 | |
| | | | | | | | |
| | | | Denmark — 2.9% | |
| | 2,334 | | | Chr. Hansen Holding A/S | | | 139,778 | |
| | 2,955 | | | DSV A/S | | | 143,081 | |
| | 2,899 | | | ISS A/S | | | 113,802 | |
| | 14,469 | | | Novo Nordisk A/S, Class B | | | 515,465 | |
| | 695 | | | Pandora A | | | 90,389 | |
| | 3,814 | | | Tryg A/S | | | 74,377 | |
| | 7,162 | | | Vestas Wind Systems A/S | | | 573,790 | |
| | 3,265 | | | William Demant Holding A/S (a) | | | 60,752 | |
| | | | | | | | |
| | | | | | | 1,711,434 | |
| | | | | | | | |
| | | | Finland — 4.9% | |
| | 3,356 | | | Elisa OYJ | | | 113,068 | |
| | 19,322 | | | Fortum OYJ | | | 322,078 | |
| | 887 | | | Kesko OYJ, Class B | | | 44,075 | |
| | 4,781 | | | Kone OYJ, Class B | | | 219,983 | |
| | 4,111 | | | Metso OYJ | | | 107,790 | |
| | 13,781 | | | Neste OYJ | | | 594,544 | |
| | 84,107 | | | Nokia OYJ | | | 375,503 | |
| | 2,917 | | | Orion OYJ, Class B | | | 124,159 | |
| | 7,079 | | | Sampo OYJ, Class A | | | 324,319 | |
| | 20,976 | | | Stora Enso OYJ, Class R | | | 198,227 | |
| | 14,595 | | | UPM-Kymmene OYJ | | | 339,504 | |
| | 4,475 | | | Wartsila OYJ Abp | | | 193,385 | |
| | | | | | | | |
| | | | | | | 2,956,635 | |
| | | | | | | | |
| | | | France — 13.9% | |
| | 760 | | | Aeroports de Paris | | | 76,766 | |
| | 1,717 | | | Air Liquide S.A. | | | 174,470 | |
| | 1,808 | | | Arkema S.A. | | | 171,440 | |
| | 4,840 | | | Atos SE | | | 502,266 | |
| | 3,358 | | | AXA S.A. | | | 75,765 | |
| | | | | | | | |
| SHARES | | | SECURITY DESCRIPTION | | VALUE($) | |
| | | | | | | | |
| | | | France — continued | |
| | 1,496 | | | BNP Paribas S.A. | | | 86,743 | |
| | 2,603 | | | Bouygues S.A. | | | 84,852 | |
| | 2,331 | | | Bureau Veritas S.A. | | | 44,026 | |
| | 6,344 | | | Capital Gemini S.A. | | | 525,393 | |
| | 6,136 | | | Carrefour S.A. | | | 160,819 | |
| | 705 | | | Christian Dior SE | | | 135,971 | |
| | 1,716 | | | Cie Generale des Etablissements Michelin | | | 185,857 | |
| | 4,716 | | | CNP Assurances | | | 81,673 | |
| | 4,367 | | | Credit Agricole S.A. | | | 47,116 | |
| | 2,506 | | | Danone S.A. | | | 173,813 | |
| | 3,854 | | | Dassault Systemes | | | 305,056 | |
| | 1,623 | | | Eiffage S.A. | | | 120,159 | |
| | 17,824 | | | Engie S.A. | | | 257,054 | |
| | 1,750 | | | Essilor International S.A. | | | 196,654 | |
| | 951 | | | Fonciere Des Regions REIT | | | 83,114 | |
| | 532 | | | Gecina S.A. REIT | | | 77,566 | |
| | 140 | | | Hermes International | | | 56,715 | |
| | 1,205 | | | Imerys S.A. | | | 83,898 | |
| | 4,391 | | | Lagardere SCA | | | 111,825 | |
| | 2,590 | | | Legrand S.A. | | | 146,327 | |
| | 783 | | | L’Oreal S.A. | | | 140,282 | |
| | 1,001 | | | LVMH Moet Hennessy Louis Vuitton SE | | | 182,244 | |
| | 6,633 | | | Natixis S.A. | | | 33,560 | |
| | 33,981 | | | Orange S.A. | | | 534,648 | |
| | 3,873 | | | Publicis Groupe S.A. | | | 265,688 | |
| | 2,071 | | | Renault S.A. | | | 180,099 | |
| | 3,486 | | | Sanofi | | | 271,278 | |
| | 1,305 | | | Schneider Electric SE | | | 87,762 | |
| | 2,247 | | | SCOR SE | | | 72,766 | |
| | 890 | | | Societe BIC S.A. | | | 123,365 | |
| | 1,826 | | | Societe Generale S.A. | | | 71,228 | |
| | 2,423 | | | Sodexo S.A. | | | 281,362 | |
| | 7,387 | | | Technip S.A. | | | 490,277 | |
| | 1,598 | | | Thales S.A. | | | 150,348 | |
| | 16,688 | | | TOTAL S.A. | | | 799,441 | |
| | 309 | | | Unibail-Rodamco SE REIT | | | 73,346 | |
| | 5,833 | | | Valeo S.A. | | | 336,594 | |
| | 1,612 | | | Vinci S.A. | | | 116,741 | |
| | 7,981 | | | Vivendi S.A. | | | 161,540 | |
| | | | | | | | |
| | | | | | | 8,337,907 | |
| | | | | | | | |
| | | | Germany — 12.7% | |
| | 1,019 | | | adidas AG | | | 167,416 | |
| | 497 | | | Allianz SE | | | 77,584 | |
| | 1,536 | | | Axel Springer SE | | | 76,952 | |
| | 6,695 | | | BASF SE | | | 591,024 | |
SEE NOTES TO FINANCIAL STATEMENTS.
| | | | | | | | |
| | | |
| OCTOBER 31, 2016 | | JPMORGAN EXCHANGE-TRADED FUNDS | | | | | 33 | |
JPMorgan Diversified Return Europe Equity ETF
SCHEDULE OF PORTFOLIO INVESTMENTS
AS OF OCTOBER 31, 2016 (continued)
| | | | | | | | |
| SHARES | | | SECURITY DESCRIPTION | | VALUE($) | |
| Common Stocks — continued | |
| | | | Germany — continued | |
| | 1,743 | | | Bayer AG | | | 173,063 | |
| | 2,176 | | | Bayerische Motoren Werke AG | | | 189,847 | |
| | 751 | | | Beiersdorf AG | | | 66,208 | |
| | 808 | | | Continental AG | | | 155,210 | |
| | 911 | | | Covestro AG (f) | | | 53,947 | |
| | 2,848 | | | Daimler AG | | | 203,183 | |
| | 948 | | | Deutsche Boerse AG (a) | | | 74,028 | |
| | 13,709 | | | Deutsche Lufthansa AG | | | 175,464 | |
| | 3,555 | | | Deutsche Post AG | | | 110,244 | |
| | 29,458 | | | Deutsche Telekom AG | | | 480,616 | |
| | 3,118 | | | Deutsche Wohnen AG | | | 101,871 | |
| | 5,744 | | | Evonik Industries AG | | | 179,883 | |
| | 967 | | | Fielmann AG | | | 67,113 | |
| | 1,669 | | | Fraport AG Frankfurt Airport Services Worldwide | | | 99,073 | |
| | 4,384 | | | Fresenius Medical Care AG & Co., KGaA | | | 357,097 | |
| | 7,057 | | | Fresenius SE & Co., KGaA | | | 521,424 | |
| | 939 | | | Hannover Rueck SE | | | 104,757 | |
| | 1,048 | | | HOCHTIEF AG | | | 143,102 | |
| | 1,378 | | | HUGO BOSS AG | | | 86,650 | |
| | 37,954 | | | Infineon Technologies AG | | | 682,617 | |
| | 8,250 | | | K+S AG | | | 167,061 | |
| | 578 | | | MAN SE | | | 59,162 | |
| | 1,059 | | | MTU Aero Engines AG | | | 110,586 | |
| | 411 | | | Muenchener Rueckversicherungs-Gesellschaft AG in Muenchen | | | 79,800 | |
| | 820 | | | OSRAM Licht AG | | | 46,574 | |
| | 3,713 | | | ProSiebenSat.1 Media SE | | | 160,024 | |
| | 17,590 | | | SAP SE | | | 1,549,676 | |
| | 1,034 | | | Siemens AG | | | 117,481 | |
| | 3,346 | | | Symrise AG | | | 229,789 | |
| | 2,314 | | | Talanx AG | | | 71,824 | |
| | 14,787 | | | Telefonica Deutschland Holding AG | | | 57,349 | |
| | 84 | | | Vonovia SE | | | 2,961 | |
| | 283 | | | Wacker Chemie AG | | | 25,248 | |
| | | | | | | | |
| | | | | | | 7,615,908 | |
| | | | | | | | |
| | | | Ireland — 0.4% | |
| | 1,272 | | | DCC plc | | | 103,490 | |
| | 404 | | | Kerry Group plc, Class A | | | 29,332 | |
| | 1,200 | | | Ryanair Holdings plc ADR | | | 90,108 | |
| | | | | | | | |
| | | | | | | 222,930 | |
| | | | | | | | |
| | | | Italy — 2.1% | |
| | 4,414 | | | Atlantia SpA | | | 108,073 | |
| | 26,538 | | | Enel SpA | | | 114,096 | |
| | 8,403 | | | Mediobanca SpA | | | 61,555 | |
| | | | | | | | |
| SHARES | | | SECURITY DESCRIPTION | | VALUE($) | |
| | | | | | | | |
| | | | Italy — continued | |
| | 1,029 | | | Recordati SpA | | | 29,099 | |
| | 79,675 | | | Snam SpA | | | 419,795 | |
| | 93,052 | | | Terna Rete Elettrica Nazionale SpA | | | 455,484 | |
| | 37,573 | | | UnipolSai SpA | | | 71,803 | |
| | | | | | | | |
| | | | | | | 1,259,905 | |
| | | | | | | | |
| | | | Luxembourg — 0.4% | |
| | 1,232 | | | RTL Group S.A. | | | 96,553 | |
| | 6,734 | | | SES S.A. | | | 154,924 | |
| | | | | | | | |
| | | | | | | 251,477 | |
| | | | | | | | |
| | | | Netherlands — 4.8% | |
| | 2,946 | | | Akzo Nobel NV | | | 190,345 | |
| | 5,852 | | | ASML Holding NV | | | 619,109 | |
| | 2,213 | | | Boskalis Westminster | | | 71,373 | |
| | 1,659 | | | Heineken Holding NV | | | 127,647 | |
| | 1,505 | | | Heineken NV | | | 123,965 | |
| | 3,961 | | | ING Groep NV | | | 51,996 | |
| | 13,918 | | | Koninklijke Ahold Delhaize NV | | | 317,505 | |
| | 3,508 | | | Koninklijke DSM NV | | | 225,476 | |
| | 52,102 | | | Koninklijke KPN NV | | | 169,892 | |
| | 3,244 | | | Koninklijke Philips NV | | | 97,749 | |
| | 2,603 | | | NN Group NV | | | 78,410 | |
| | 206 | | | Randstad Holding NV | | | 10,595 | |
| | 18,961 | | | RELX NV | | | 319,732 | |
| | 5,352 | | | Unilever NV | | | 223,854 | |
| | 6,959 | | | Wolters Kluwer NV | | | 269,108 | |
| | | | | | | | |
| | | | | | | 2,896,756 | |
| | | | | | | | |
| | | | Norway — 2.7% | |
| | 9,953 | | | DNB ASA | | | 143,887 | |
| | 5,099 | | | Gjensidige Forsikring ASA | | | 91,359 | |
| | 12,543 | | | Marine Harvest ASA | | | 227,609 | |
| | 18,976 | | | Norsk Hydro ASA | | | 84,837 | |
| | 13,894 | | | Orkla ASA | | | 131,193 | |
| | 16,131 | | | Statoil ASA | | | 263,355 | |
| | 28,723 | | | Telenor ASA | | | 456,835 | |
| | 6,085 | | | Yara International ASA | | | 214,948 | |
| | | | | | | | |
| | | | | | | 1,614,023 | |
| | | | | | | | |
| | | | Portugal — 1.0% | |
| | 108,770 | | | EDP — Energias de Portugal S.A. | | | 359,515 | |
| | 15,174 | | | Galp Energia SGPS S.A. | | | 205,734 | |
| | | | | | | | |
| | | | | | | 565,249 | |
| | | | | | | | |
| | | | Spain — 7.1% | |
| | 7,474 | | | Abertis Infraestructuras S.A. | | | 110,785 | |
| | 1,226 | | | Acciona S.A. | | | 93,168 | |
SEE NOTES TO FINANCIAL STATEMENTS.
| | | | | | |
| | | |
| 34 | | | | JPMORGAN EXCHANGE-TRADED FUNDS | | OCTOBER 31, 2016 |
| | | | | | | | |
| SHARES | | | SECURITY DESCRIPTION | | VALUE($) | |
| Common Stocks — continued | |
| | | | Spain — continued | |
| | 1,110 | | | Acerinox S.A. | | | 13,660 | |
| | 3,130 | | | ACS Actividades de Construccion y Servicios S.A. | | | 95,743 | |
| | 573 | | | Aena S.A. (f) | | | 83,965 | |
| | 3,245 | | | Amadeus IT Group S.A., Class A | | | 152,723 | |
| | 7,619 | | | Banco Santander S.A. | | | 37,333 | |
| | 7,728 | | | Distribuidora Internacional de Alimentacion S.A. | | | 41,276 | |
| | 14,428 | | | Enagas S.A. | | | 413,580 | |
| | 21,105 | | | Endesa S.A. | | | 447,969 | |
| | 6,745 | | | Ferrovial S.A. | | | 131,041 | |
| | 12,421 | | | Gamesa Corp. Tecnologica S.A. | | | 286,783 | |
| | 18,420 | | | Gas Natural SDG S.A. | | | 362,587 | |
| | 10,069 | | | Grifols S.A. | | | 198,685 | |
| | 185,267 | | | Iberdrola S.A. | | | 1,260,832 | |
| | 14,160 | | | International Consolidated Airlines Group S.A. | | | 75,089 | |
| | 16,163 | | | Mapfre S.A. | | | 47,947 | |
| | 19,104 | | | Red Electrica Corp. S.A. | | | 397,985 | |
| | | | | | | | |
| | | | | | | 4,251,151 | |
| | | | | | | | |
| | | | Sweden — 6.0% | |
| | 4,494 | | | Alfa Laval AB | | | 64,474 | |
| | 9,602 | | | Assa Abloy AB, Class B | | | 174,501 | |
| | 6,012 | | | Atlas Copco AB, Class A | | | 176,122 | |
| | 11,696 | | | Boliden AB | | | 271,072 | |
| | 5,665 | | | Hennes & Mauritz AB, Class B | | | 159,315 | |
| | 4,723 | | | Hexagon AB, Class B | | | 165,268 | |
| | 2,599 | | | Husqvarna AB, Class B | | | 19,540 | |
| | 2,515 | | | Investor AB, Class B | | | 89,314 | |
| | 18,032 | | | Nordea Bank AB | | | 189,500 | |
| | 8,900 | | | Securitas AB, Class B | | | 137,361 | |
| | 7,961 | | | Skandinaviska Enskilda Banken AB, Class A | | | 80,298 | |
| | 6,915 | | | Skanska AB, Class B | | | 150,170 | |
| | 5,096 | | | SKF AB, Class B | | | 86,316 | |
| | 16,219 | | | Svenska Handelsbanken AB, Class A | | | 221,116 | |
| | 14,043 | | | Swedbank AB, Class A | | | 328,595 | |
| | 22,337 | | | Tele2 AB, Class B | | | 184,448 | |
| | 86,699 | | | Telefonaktiebolaget LM Ericsson, Class B | | | 420,565 | |
| | 141,787 | | | TeliaSonera AB | | | 566,418 | |
| | 5,952 | | | Trelleborg AB, Class B | | | 103,892 | |
| | | | | | | | |
| | | | | | | 3,588,285 | |
| | | | | | | | |
| | | | Switzerland — 11.4% | |
| | 5,254 | | | ABB Ltd. | | | 108,392 | |
| | 13 | | | Actelion Ltd. | | | 1,879 | |
| | 776 | | | Baloise Holding AG | | | 95,471 | |
| | 91 | | | Banque Cantonale Vaudoise | | | 57,170 | |
| | | | | | | | |
| SHARES | | | SECURITY DESCRIPTION | | VALUE($) | |
| | | | | | | | |
| | | | Switzerland — continued | |
| | 7 | | | Chocoladefabriken Lindt & Spruengli AG | | | 36,350 | |
| | 10,682 | | | Clariant AG | | | 176,888 | |
| | 377 | | | EMS-Chemie Holding AG | | | 189,233 | |
| | 664 | | | Geberit AG | | | 280,719 | |
| | 119 | | | Givaudan S.A. | | | 230,154 | |
| | 132 | | | Helvetia Holding AG | | | 68,675 | |
| | 754 | | | Kuehne & Nagel International AG | | | 102,199 | |
| | 1,297 | | | Lonza Group AG | | | 244,746 | |
| | 6,273 | | | Nestle S.A. | | | 454,880 | |
| | 16,196 | | | Novartis AG | | | 1,149,391 | |
| | 857 | | | Pargesa Holding S.A. | | | 57,528 | |
| | 192 | | | Partners Group Holding AG | | | 97,198 | |
| | 811 | | | PSP Swiss Property AG | | | 72,567 | |
| | 4,182 | | | Roche Holding AG | | | 960,529 | |
| | 933 | | | Schindler Holding AG | | | 173,330 | |
| | 84 | | | SGS S.A. | | | 170,024 | |
| | 23 | | | Sika AG | | | 110,549 | |
| | 1,828 | | | Sonova Holding AG | | | 245,158 | |
| | 643 | | | Swiss Life Holding AG | | | 170,159 | |
| | 1,076 | | | Swiss Prime Site AG | | | 89,243 | |
| | 909 | | | Swiss Re AG | | | 84,366 | |
| | 2,211 | | | Swisscom AG | | | 1,010,699 | |
| | 564 | | | Syngenta AG | | | 224,505 | |
| | 4,468 | | | UBS Group AG | | | 63,167 | |
| | 290 | | | Zurich Insurance Group AG | | | 75,909 | |
| | | | | | | | |
| | | | | | | 6,801,078 | |
| | | | | | | | |
| | | | United Kingdom — 25.4% | | | | |
| | 11,451 | | | 3i Group plc | | | 93,867 | |
| | 3,405 | | | Admiral Group plc | | | 79,777 | |
| | 5,220 | | | AstraZeneca plc | | | 292,295 | |
| | 13,952 | | | BAE Systems plc | | | 92,443 | |
| | 1,199 | | | Bellway plc | | | 34,697 | |
| | 4,830 | | | Berkeley Group Holdings plc | | | 139,305 | |
| | 85,832 | | | BP plc | | | 507,416 | |
| | 13,908 | | | British American Tobacco plc | | | 797,112 | |
| | 8,028 | | | British Land Co., plc (The) REIT | | | 57,476 | |
| | 73,088 | | | BT Group plc, Class A | | | 335,478 | |
| | 8,673 | | | Bunzl plc | | | 232,848 | |
| | 3,937 | | | Burberry Group plc | | | 71,004 | |
| | 26,720 | | | Compass Group plc | | | 483,481 | |
| | 3,240 | | | Croda International plc | | | 138,558 | |
| | 3,088 | | | Daily Mail & General Trust plc, Class A | | | 28,344 | |
| | 1,653 | | | Derwent London plc REIT | | | 48,885 | |
| | 6,121 | | | Diageo plc | | | 162,920 | |
| | 14,361 | | | Direct Line Insurance Group plc | | | 60,755 | |
SEE NOTES TO FINANCIAL STATEMENTS.
| | | | | | | | |
| | | |
| OCTOBER 31, 2016 | | JPMORGAN EXCHANGE-TRADED FUNDS | | | | | 35 | |
JPMorgan Diversified Return Europe Equity ETF
SCHEDULE OF PORTFOLIO INVESTMENTS
AS OF OCTOBER 31, 2016 (continued)
| | | | | | | | |
| SHARES | | | SECURITY DESCRIPTION | | VALUE($) | |
| Common Stocks — continued | |
| | | | United Kingdom — continued | | | | |
| | 16,340 | | | DS Smith plc | | | 79,677 | |
| | 7,254 | | | easyJet plc | | | 83,186 | |
| | 5,824 | | | Experian plc | | | 111,964 | |
| | 56,975 | | | GlaxoSmithKline plc | | | 1,125,507 | |
| | 10,098 | | | Hammerson plc REIT | | | 67,935 | |
| | 8,724 | | | Howden Joinery Group plc | | | 39,949 | |
| | 10,914 | | | HSBC Holdings plc | | | 82,195 | |
| | 6,166 | | | IMI plc | | | 74,896 | |
| | 3,653 | | | Imperial Brands plc | | | 176,703 | |
| | 6,742 | | | Inchcape plc | | | 53,604 | |
| | 8,023 | | | Informa plc | | | 66,006 | |
| | 7,280 | | | Inmarsat plc | | | 62,448 | |
| | 17,236 | | | Intu Properties plc REIT | | | 58,089 | |
| | 60,846 | | | ITV plc | | | 126,849 | |
| | 41,156 | | | J Sainsbury plc | | | 126,187 | |
| | 18,276 | | | John Wood Group plc | | | 171,780 | |
| | 4,898 | | | Johnson Matthey plc | | | 204,165 | |
| | 49,725 | | | Kingfisher plc | | | 219,657 | |
| | 6,884 | | | Land Securities Group plc REIT | | | 84,058 | |
| | 36,529 | | | Legal & General Group plc | | | 93,451 | |
| | 2,555 | | | London Stock Exchange Group plc | | | 87,761 | |
| | 49,154 | | | Marks & Spencer Group plc | | | 204,520 | |
| | 10,138 | | | Meggitt plc | | | 53,934 | |
| | 4,672 | | | Micro Focus International plc | | | 122,339 | |
| | 9,646 | | | Mondi plc | | | 188,248 | |
| | 60,160 | | | National Grid plc | | | 782,551 | |
| | 6,097 | | | Next plc | | | 358,711 | |
| | 57,251 | | | Old Mutual plc | | | 140,835 | |
| | 2,302 | | | Pennon Group plc | | | 23,494 | |
| | 1,548 | | | Polymetal International plc | | | 16,878 | |
| | 1,773 | | | Provident Financial plc | | | 63,918 | |
| | 6,387 | | | Reckitt Benckiser Group plc | | | 571,387 | |
| | 17,882 | | | RELX plc | | | 319,198 | |
| | 6,817 | | | Rentokil Initial plc | | | 19,015 | |
| | 392 | | | Rightmove plc | | | 17,894 | |
| | 30,388 | | | Royal Dutch Shell plc, Class B | | | 783,786 | |
| | 13,951 | | | Royal Mail plc | | | 83,699 | |
| | 48,154 | | | Sage Group plc (The) | | | 424,863 | |
| | 15,992 | | | Segro plc REIT | | | 85,654 | |
| | 5,298 | | | Severn Trent plc | | | 150,814 | |
| | 15,310 | | | Sky plc | | | 153,059 | |
| | 25,009 | | | Smith & Nephew plc | | | 361,541 | |
| | 6,453 | | | Smiths Group plc | | | 111,819 | |
| | 11,965 | | | SSE plc | | | 232,637 | |
| | 4,164 | | | Tate & Lyle plc | | | 39,712 | |
| | | | | | | | |
| SHARES | | | SECURITY DESCRIPTION | | VALUE($) | |
| | | | | | | | |
| | | | United Kingdom — continued | | | | |
| | 17,189 | | | Unilever plc | | | 717,630 | |
| | 19,956 | | | United Utilities Group plc | | | 229,393 | |
| | 463,888 | | | Vodafone Group plc | | | 1,273,993 | |
| | 5,133 | | | Whitbread plc | | | 226,752 | |
| | 48,758 | | | William Hill plc | | | 176,381 | |
| | 21,092 | | | Wm Morrison Supermarkets plc | | | 58,388 | |
| | 16,766 | | | WPP plc | | | 364,043 | |
| | | | | | | | |
| | | | | | | 15,209,814 | |
| | | | | | | | |
| | | | Total Common Stocks
(Cost $60,474,919) | | | 59,064,016 | |
| | | | | | | | |
| Preferred Stocks — 0.9% | |
| | | | Germany — 0.9% | | | | |
| | 2,790 | | | FUCHS PETROLUB SE | | | 124,878 | |
| | 3,285 | | | Henkel AG & Co., KGaA | | | 422,225 | |
| | | | | | | | |
| | | | Total Preferred Stocks
(Cost $491,249) | | | 547,103 | |
| | | | | | | | |
| | |
NUMBER OF
RIGHTS | | | | | | |
| Rights — 0.0% (e) | |
| | | | Spain — 0.0% (e) | | | | |
| | 6,745 | | | Ferrovial S.A. (a) | | | 2,888 | |
| | | | | | | | |
| | | | Sweden — 0.0% (e) | | | | |
| | 22,337 | | | Tele2 AB (a) | | | 6,693 | |
| | | | | | | | |
| | | | Total Rights
(Cost $—) | | | 9,581 | |
| | | | | | | | |
| | | | Total Investments — 99.6%
(Cost $60,966,168) | | | 59,620,700 | |
| | | | Other Assets in Excess of Liabilities — 0.4% | | | 238,933 | |
| | | | | | | | |
| | | | NET ASSETS — 100.0% | | $ | 59,859,633 | |
| | | | | | | | |
Percentages indicated are based on net assets.
SEE NOTES TO FINANCIAL STATEMENTS.
| | | | | | |
| | | |
| 36 | | | | JPMORGAN EXCHANGE-TRADED FUNDS | | OCTOBER 31, 2016 |
Summary of Investments by Industry, October 31, 2016
The following table represents the portfolio investments of the Fund by industry classifications as a percentage of total investments:
| | | | |
| INDUSTRY | | PERCENTAGE | |
Pharmaceuticals | | | 7.8 | % |
Diversified Telecommunication Services | | | 6.8 | |
Oil, Gas & Consumable Fuels | | | 6.2 | |
Electric Utilities | | | 6.2 | |
Chemicals | | | 6.2 | |
Software | | | 4.0 | |
Insurance | | | 3.7 | |
Media | | | 2.8 | |
Wireless Telecommunication Services | | | 2.5 | |
Banks | | | 2.3 | |
Capital Markets | | | 2.3 | |
Semiconductors & Semiconductor Equipment | | | 2.3 | |
Machinery | | | 2.1 | |
Energy Equipment & Services | | | 2.1 | |
Electrical Equipment | | | 2.1 | |
Gas Utilities | | | 2.0 | |
IT Services | | | 2.0 | |
Hotels, Restaurants & Leisure | | | 2.0 | |
Food Products | | | 1.8 | |
Multi-Utilities | | | 1.7 | |
Personal Products | | | 1.7 | |
Household Products | | | 1.7 | |
Food & Staples Retailing | | | 1.6 | |
Professional Services | | | 1.6 | |
Construction & Engineering | | | 1.5 | |
Health Care Providers & Services | | | 1.5 | |
Health Care Equipment & Supplies | | | 1.4 | |
Metals & Mining | | | 1.3 | |
Communications Equipment | | | 1.3 | |
Auto Components | | | 1.3 | |
Paper & Forest Products | | | 1.2 | |
Equity Real Estate Investment Trusts (REITs) | | | 1.1 | |
Textiles, Apparel & Luxury Goods | | | 1.0 | |
Others (each less than 1.0%) | | | 12.9 | |
SEE NOTES TO FINANCIAL STATEMENTS.
| | | | | | | | |
| | | |
| OCTOBER 31, 2016 | | JPMORGAN EXCHANGE-TRADED FUNDS | | | | | 37 | |
JPMorgan Diversified Return Global Equity ETF
SCHEDULE OF PORTFOLIO INVESTMENTS
AS OF OCTOBER 31, 2016
| | | | | | | | |
| SHARES | | | SECURITY DESCRIPTION | | VALUE($) | |
| Common Stocks — 99.1% | |
| | | | Australia — 8.3% | |
| | 19,472 | | | AGL Energy Ltd. | | | 283,659 | |
| | 21,204 | | | Amcor Ltd. | | | 236,672 | |
| | 9,732 | | | Ansell Ltd. | | | 160,335 | |
| | 32,700 | | | APA Group | | | 197,627 | |
| | 4,510 | | | ASX Ltd. | | | 161,328 | |
| | 55,342 | | | Aurizon Holdings Ltd. | | | 205,037 | |
| | 33,038 | | | Boral Ltd. | | | 157,848 | |
| | 31,208 | | | Brambles Ltd. | | | 273,235 | |
| | 9,370 | | | Caltex Australia Ltd. | | | 218,108 | |
| | 3,188 | | | CIMIC Group Ltd. | | | 71,542 | |
| | 2,214 | | | Cochlear Ltd. | | | 215,115 | |
| | 4,592 | | | CSL Ltd. | | | 350,395 | |
| | 38,479 | | | CSR Ltd. | | | 106,845 | |
| | 32,094 | | | Dexus Property Group REIT | | | 218,019 | |
| | 4,100 | | | Flight Centre Travel Group Ltd. | | | 105,343 | |
| | 58,527 | | | GPT Group (The) REIT | | | 206,915 | |
| | 32,906 | | | Harvey Norman Holdings Ltd. | | | 126,015 | |
| | 53,061 | | | Healthscope Ltd. | | | 89,009 | |
| | 61,426 | | | Incitec Pivot Ltd. | | | 137,383 | |
| | 98,929 | | | Mirvac Group REIT | | | 156,934 | |
| | 5,516 | | | Orica Ltd. | | | 68,147 | |
| | 57,261 | | | Origin Energy Ltd. | | | 230,795 | |
| | 40,527 | | | Qantas Airways Ltd. | | | 94,178 | |
| | 4,014 | | | Ramsay Health Care Ltd. | | | 223,519 | |
| | 80,664 | | | Scentre Group REIT | | | 258,168 | |
| | 13,563 | | | Sonic Healthcare Ltd. | | | 210,938 | |
| | 35,316 | | | Star Entertainment Grp Ltd. (The) | | | 133,634 | |
| | 42,851 | | | Sydney Airport | | | 203,704 | |
| | 56,181 | | | Tabcorp Holdings Ltd. | | | 206,408 | |
| | 59,186 | | | Tatts Group Ltd. | | | 182,444 | |
| | 75,372 | | | Telstra Corp., Ltd. | | | 285,052 | |
| | 34,836 | | | Transurban Group | | | 274,874 | |
| | 10,785 | | | Wesfarmers Ltd. | | | 335,833 | |
| | 12,190 | | | WorleyParsons Ltd. | | | 77,906 | |
| | | | | | | | |
| | | | | | | 6,462,964 | |
| | | | | | | | |
| | | | Austria — 0.2% | |
| | 5,400 | | | OMV AG | | | 168,533 | |
| | | | | | | | |
| | | | Belgium — 0.8% | |
| | 836 | | | Ageas | | | 30,542 | |
| | 2,670 | | | Colruyt S.A. | | | 143,508 | |
| | 1,421 | | | Groupe Bruxelles Lambert S.A. | | | 122,159 | |
| | 4,872 | | | Proximus SADP | | | 139,449 | |
| | 791 | | | Solvay S.A. | | | 90,739 | |
| | 1,269 | | | UCB S.A. | | | 85,876 | |
| | | | | | | | |
| | | | | | | 612,273 | |
| | | | | | | | |
| | | | | | | | |
| SHARES | | | SECURITY DESCRIPTION | | VALUE($) | |
| | | | | | | | |
| | | | Canada — 2.9% | |
| | 1,923 | | | Agrium, Inc. | | | 176,529 | |
| | 4,714 | | | BCE, Inc. | | | 214,174 | |
| | 1,728 | | | Canadian Tire Corp., Ltd., Class A | | | 167,969 | |
| | 5,633 | | | Fortis, Inc. | | | 185,415 | |
| | 7,954 | | | Husky Energy, Inc. | | | 85,571 | |
| | 4,666 | | | Imperial Oil Ltd. | | | 151,324 | |
| | 1,970 | | | Inter Pipeline Ltd. | | | 40,845 | |
| | 2,320 | | | Loblaw Cos., Ltd. | | | 114,469 | |
| | 6,775 | | | Metro, Inc., Class A | | | 209,417 | |
| | 5,445 | | | RioCan REIT | | | 105,872 | |
| | 4,908 | | | Rogers Communications, Inc., Class B | | | 197,447 | |
| | 7,975 | | | Shaw Communications, Inc., Class B | | | 158,037 | |
| | 5,970 | | | TELUS Corp. | | | 193,303 | |
| | 5,052 | | | TransCanada Corp. | | | 228,702 | |
| | | | | | | | |
| | | | | | | 2,229,074 | |
| | | | | | | | |
| | | | Denmark — 0.9% | |
| | 942 | | | Carlsberg A/S, Class B | | | 84,869 | |
| | 2,438 | | | Chr. Hansen Holding A/S | | | 146,007 | |
| | 2,325 | | | DSV A/S | | | 112,576 | |
| | 2,115 | | | H Lundbeck A/S (a) | | | 68,163 | |
| | 15,948 | | | TDC A/S (a) | | | 87,929 | |
| | 2,143 | | | Vestas Wind Systems A/S | | | 171,689 | |
| | | | | | | | |
| | | | | | | 671,233 | |
| | | | | | | | |
| | | | Finland — 0.9% | |
| | 6,934 | | | Fortum OYJ | | | 115,583 | |
| | 5,652 | | | Neste OYJ | | | 243,840 | |
| | 3,030 | | | Sampo OYJ, Class A | | | 138,817 | |
| | 8,262 | | | Stora Enso OYJ, Class R | | | 78,077 | |
| | 4,696 | | | UPM-Kymmene OYJ | | | 109,237 | |
| | | | | | | | |
| | | | | | | 685,554 | |
| | | | | | | | |
| | | | France — 4.2% | |
| | 1,293 | | | Arkema S.A. | | | 122,606 | |
| | 2,073 | | | Atos SE | | | 215,124 | |
| | 2,300 | | | Capital Gemini S.A. | | | 190,480 | |
| | 1,801 | | | Casino Guichard Perrachon S.A. | | | 89,656 | |
| | 705 | | | Christian Dior SE | | | 135,971 | |
| | 2,066 | | | Danone S.A. | | | 143,295 | |
| | 2,773 | | | Dassault Systemes | | | 219,491 | |
| | 1,048 | | | Essilor International S.A. | | | 117,768 | |
| | 4,677 | | | Eutelsat Communications S.A. | | | 98,006 | |
| | 1,002 | | | Faurecia | | | 36,935 | |
| | 261 | | | Iliad S.A. | | | 54,715 | |
| | 292 | | | Ingenico Group S.A. | | | 23,097 | |
| | 3,172 | | | Lagardere SCA | | | 80,781 | |
SEE NOTES TO FINANCIAL STATEMENTS.
| | | | | | |
| | | |
| 38 | | | | JPMORGAN EXCHANGE-TRADED FUNDS | | OCTOBER 31, 2016 |
| | | | | | | | |
| SHARES | | | SECURITY DESCRIPTION | | VALUE($) | |
| Common Stocks — continued | |
| | | | France — continued | |
| | 10,277 | | | Orange S.A. | | | 161,696 | |
| | 1,002 | | | Pernod Ricard S.A. | | | 119,162 | |
| | 1,763 | | | Publicis Groupe S.A. | | | 120,942 | |
| | 2,327 | | | SCOR SE | | | 75,357 | |
| | 1,524 | | | Sodexo S.A. | | | 176,969 | |
| | 5,809 | | | STMicroelectronics NV | | | 55,133 | |
| | 5,991 | | | Suez | | | 94,896 | |
| | 1,585 | | | Technip S.A. | | | 105,197 | |
| | 2,557 | | | Thales S.A. | | | 240,576 | |
| | 3,235 | | | TOTAL S.A. | | | 154,973 | |
| | 3,247 | | | Valeo S.A. | | | 187,368 | |
| | 247 | | | Veolia Environnement S.A. | | | 5,396 | |
| | 1,061 | | | Vinci S.A. | | | 76,837 | |
| | 6,254 | | | Vivendi S.A. | | | 126,585 | |
| | | | | | | | |
| | | | | | | 3,229,012 | |
| | | | | | | | |
| | | | Germany — 2.9% | |
| | 818 | | | BASF SE | | | 72,212 | |
| | 1,687 | | | Beiersdorf AG | | | 148,726 | |
| | 1,100 | | | Covestro AG (f) | | | 65,139 | |
| | 3,342 | | | Deutsche Lufthansa AG | | | 42,775 | |
| | 8,423 | | | Deutsche Telekom AG | | | 137,424 | |
| | 5,143 | | | Evonik Industries AG | | | 161,062 | |
| | 2,044 | | | Fraport AG Frankfurt Airport Services Worldwide | | | 121,333 | |
| | 2,315 | | | Fresenius Medical Care AG & Co., KGaA | | | 188,567 | |
| | 3,094 | | | Fresenius SE & Co., KGaA | | | 228,608 | |
| | 1,953 | | | Hannover Rueck SE | | | 217,880 | |
| | 13,980 | | | Infineon Technologies AG | | | 251,435 | |
| | 1,864 | | | Merck KGaA | | | 191,863 | |
| | 2,117 | | | SAP SE | | | 186,507 | |
| | 1,483 | | | Symrise AG | | | 101,846 | |
| | 2,479 | | | United Internet AG | | | 101,924 | |
| | | | | | | | |
| | | | | | | 2,217,301 | |
| | | | | | | | |
| | | | Hong Kong — 3.9% | |
| | 49,000 | | | Cathay Pacific Airways Ltd. | | | 64,496 | |
| | 22,000 | | | Cheung Kong Infrastructure Holdings Ltd. | | | 180,044 | |
| | 29,260 | | | CK Hutchison Holdings Ltd. | | | 361,303 | |
| | 24,500 | | | CLP Holdings Ltd. | | | 249,042 | |
| | 13,000 | | | Hang Seng Bank Ltd. | | | 234,446 | |
| | 123,770 | | | Hong Kong & China Gas Co., Ltd. | | | 241,780 | |
| | 10,500 | | | Johnson Electric Holdings Ltd. | | | 25,379 | |
| | 40,500 | | | Link REIT | | | 288,115 | |
| | 43,000 | | | MTR Corp., Ltd. | | | 237,965 | |
| | 95,000 | | | New World Development Co., Ltd. | | | 118,109 | |
| | 210,000 | | | PCCW Ltd. | | | 125,002 | |
| | | | | | | | |
| SHARES | | | SECURITY DESCRIPTION | | VALUE($) | |
| | | | | | | | |
| | | | Hong Kong — continued | |
| | 25,000 | | | Power Assets Holdings Ltd. | | | 234,643 | |
| | 2,241,000 | | | Semiconductor Manufacturing International Corp. (a) | | | 271,402 | |
| | 17,500 | | | Swire Pacific Ltd., Class A | | | 181,893 | |
| | 14,000 | | | Xinyi Automobile Glass Hong Kong Enterprises Ltd. (a) | | | 2,730 | |
| | 142,000 | | | Xinyi Glass Holdings Ltd. | | | 122,097 | |
| | 250,000 | | | Xinyi Solar Holdings Ltd. | | | 92,614 | |
| | | | | | | | |
| | | | | | | 3,031,060 | |
| | | | | | | | |
| | | | Israel — 0.3% | |
| | 2,490 | | | Check Point Software Technologies Ltd. (a) | | | 210,554 | |
| | | | | | | | |
| | | | Italy — 0.5% | |
| | 37,386 | | | Parmalat SpA | | | 98,744 | |
| | 28,307 | | | Snam SpA | | | 149,145 | |
| | 34,371 | | | Terna Rete Elettrica Nazionale SpA | | | 168,244 | |
| | | | | | | | |
| | | | | | | 416,133 | |
| | | | | | | | |
| | | | Japan — 24.3% | |
| | 4,700 | | | Advantest Corp. | | | 67,173 | |
| | 2,000 | | | Aisin Seiki Co., Ltd. | | | 87,855 | |
| | 5,000 | | | Ajinomoto Co., Inc. | | | 111,187 | |
| | 78,000 | | | ANA Holdings, Inc. | | | 219,085 | |
| | 63,000 | | | Aozora Bank Ltd. | | | 208,156 | |
| | 13,400 | | | Brother Industries Ltd. | | | 245,880 | |
| | 9,100 | | | Canon, Inc. | | | 261,425 | |
| | 7,000 | | | Capcom Co., Ltd. | | | 180,832 | |
| | 900 | | | Central Japan Railway Co. | | | 153,042 | |
| | 13,100 | | | Chubu Electric Power Co., Inc. | | | 192,850 | |
| | 11,300 | | | Chugoku Electric Power Co., Inc. (The) | | | 132,226 | |
| | 2,100 | | | COMSYS Holdings Corp. | | | 36,969 | |
| | 21,000 | | | Concordia Financial Group Ltd. | | | 97,371 | |
| | 8,100 | | | Cosmo Energy Holdings Co., Ltd. | | | 105,857 | |
| | 5,000 | | | Credit Saison Co., Ltd. | | | 86,435 | |
| | 6,000 | | | Dai Nippon Printing Co., Ltd. | | | 60,182 | |
| | 10,500 | | | Daicel Corp. | | | 138,066 | |
| | 10,800 | | | Daiichi Sankyo Co., Ltd. | | | 259,516 | |
| | 1,200 | | | Daito Trust Construction Co., Ltd. | | | 201,094 | |
| | 4,400 | | | DIC Corp. | | | 133,284 | |
| | 16,000 | | | Dowa Holdings Co., Ltd. | | | 118,829 | |
| | 4,600 | | | Ebara Corp. | | | 136,560 | |
| | 6,400 | | | Electric Power Development Co., Ltd. | | | 149,036 | |
| | 3,400 | | | FamilyMart UNY Holdings Co., Ltd. | | | 213,250 | |
| | 32,000 | | | Fuji Electric Co., Ltd. | | | 159,795 | |
| | 6,300 | | | FUJIFILM Holdings Corp. | | | 238,209 | |
| | 28,000 | | | Fujikura Ltd. | | | 164,514 | |
| | 19,000 | | | Fukuoka Financial Group, Inc. | | | 82,222 | |
SEE NOTES TO FINANCIAL STATEMENTS.
| | | | | | | | |
| | | |
| OCTOBER 31, 2016 | | JPMORGAN EXCHANGE-TRADED FUNDS | | | | | 39 | |
JPMorgan Diversified Return Global Equity ETF
SCHEDULE OF PORTFOLIO INVESTMENTS
AS OF OCTOBER 31, 2016 (continued)
| | | | | | | | |
| SHARES | | | SECURITY DESCRIPTION | | VALUE($) | |
| Common Stocks — continued | |
| | | | Japan — continued | |
| | 4,000 | | | Hankyu Hanshin Holdings, Inc. | | | 132,433 | |
| | 2,200 | | | Hikari Tsushin, Inc. | | | 201,950 | |
| | 1,400 | | | Hitachi High-Technologies Corp. | | | 58,388 | |
| | 10,300 | | | Hokkaido Electric Power Co., Inc. | | | 78,333 | |
| | 9,000 | | | Hokuriku Electric Power Co. | | | 102,227 | |
| | 4,100 | | | Ibiden Co., Ltd. | | | 59,520 | |
| | 9,600 | | | Idemitsu Kosan Co., Ltd. | | | 220,607 | |
| | 23,100 | | | Inpex Corp. | | | 215,495 | |
| | 20,500 | | | ITOCHU Corp. | | | 258,888 | |
| | 6,200 | | | Japan Airlines Co., Ltd. | | | 182,973 | |
| | 4,500 | | | Japan Petroleum Exploration Co., Ltd. | | | 98,460 | |
| | 60,900 | | | JX Holdings, Inc. | | | 240,626 | |
| | 24,000 | | | Kaneka Corp. | | | 198,568 | |
| | 13,000 | | | Kansai Electric Power Co., Inc. (The) (a) | | | 124,283 | |
| | 81,000 | | | Kawasaki Kisen Kaisha Ltd. | | | 200,386 | |
| | 9,600 | | | KDDI Corp. | | | 291,774 | |
| | 6,500 | | | Keisei Electric Railway Co., Ltd. | | | 156,715 | |
| | 4,000 | | | Konami Holdings Corp. | | | 157,970 | |
| | 12,900 | | | Konica Minolta, Inc. | | | 115,546 | |
| | 15,400 | | | Kuraray Co., Ltd. | | | 233,472 | |
| | 9,400 | | | Kyowa Hakko Kirin Co., Ltd. | | | 143,426 | |
| | 1,100 | | | Lawson, Inc. | | | 83,583 | |
| | 45,800 | | | Marubeni Corp. | | | 240,669 | |
| | 1,800 | | | Mitsubishi Corp. | | | 39,177 | |
| | 12,200 | | | Mitsubishi Tanabe Pharma Corp. | | | 237,467 | |
| | 135,400 | | | Mizuho Financial Group, Inc. | | | 227,980 | |
| | 2,500 | | | Mochida Pharmaceutical Co., Ltd. | | | 195,880 | |
| | 11,000 | | | NH Foods Ltd. | | | 263,600 | |
| | 2,200 | | | Nihon M&A Center, Inc. | | | 71,398 | |
| | 7,100 | | | Nikon Corp. | | | 107,302 | |
| | 12,000 | | | Nippon Kayaku Co., Ltd. | | | 138,276 | |
| | 8,700 | | | Nippon Paper Industries Co., Ltd. | | | 162,835 | |
| | 2,500 | | | Nippon Shokubai Co., Ltd. | | | 172,525 | |
| | 5,500 | | | Nippon Telegraph & Telephone Corp. | | | 243,853 | |
| | 13,500 | | | Nipro Corp. | | | 166,711 | |
| | 15,700 | | | Nissan Motor Co., Ltd. | | | 159,708 | |
| | 4,700 | | | Nisshin Steel Co., Ltd. | | | 62,520 | |
| | 2,100 | | | Nissin Foods Holdings Co., Ltd. | | | 121,546 | |
| | 8,000 | | | Nomura Real Estate Holdings, Inc. | | | 135,093 | |
| | 1,800 | | | Nomura Research Institute Ltd. | | | 62,432 | |
| | 4,600 | | | NTT Data Corp. | | | 237,384 | |
| | 10,500 | | | NTT DOCOMO, Inc. | | | 263,697 | |
| | 20,000 | | | Oji Holdings Corp. | | | 84,564 | |
| | 59,000 | | | Osaka Gas Co., Ltd. | | | 245,393 | |
| | 2,900 | | | Otsuka Corp. | | | 137,977 | |
| | | | | | | | |
| SHARES | | | SECURITY DESCRIPTION | | VALUE($) | |
| | | | | | | | |
| | | | Japan — continued | |
| | 5,800 | | | Otsuka Holdings Co., Ltd. | | | 253,842 | |
| | 3,800 | | | Park24 Co., Ltd. | | | 117,415 | |
| | 50,700 | | | Resona Holdings, Inc. | | | 224,727 | |
| | 18,200 | | | Ricoh Co., Ltd. | | | 148,334 | |
| | 3,000 | | | Sankyo Co., Ltd. | | | 105,687 | |
| | 2,300 | | | Sawai Pharmaceutical Co., Ltd. | | | 148,631 | |
| | 3,200 | | | SCREEN Holdings Co., Ltd. | | | 218,910 | |
| | 2,800 | | | SCSK Corp. | | | 104,448 | |
| | 3,700 | | | Sega Sammy Holdings, Inc. | | | 54,634 | |
| | 11,500 | | | Sekisui Chemical Co., Ltd. | | | 181,110 | |
| | 13,700 | | | Sekisui House Ltd. | | | 226,375 | |
| | 42,600 | | | Seven Bank Ltd. | | | 130,960 | |
| | 1,700 | | | Shimamura Co., Ltd. | | | 217,625 | |
| | 5,000 | | | Shimizu Corp. | | | 44,438 | |
| | 7,500 | | | Showa Denko K.K. | | | 99,100 | |
| | 21,000 | | | Showa Shell Sekiyu K.K. | | | 195,663 | |
| | 4,400 | | | SoftBank Group Corp. | | | 277,117 | |
| | 76,600 | | | Sojitz Corp. | | | 201,020 | |
| | 6,200 | | | Square Enix Holdings Co., Ltd. | | | 205,092 | |
| | 6,000 | | | Sumitomo Dainippon Pharma Co., Ltd. | | | 103,918 | |
| | 40,000 | | | Sumitomo Osaka Cement Co., Ltd. | | | 165,669 | |
| | 600 | | | Sundrug Co., Ltd. | | | 47,197 | |
| | 4,100 | | | Suzuken Co., Ltd. | | | 131,686 | |
| | 19,000 | | | Taisei Corp. | | | 142,406 | |
| | 1,400 | | | Taisho Pharmaceutical Holdings Co., Ltd. | | | 136,569 | |
| | 10,000 | | | Takashimaya Co., Ltd. | | | 81,560 | |
| | 3,000 | | | Takeda Pharmaceutical Co., Ltd. | | | 134,175 | |
| | 6,600 | | | Teijin Ltd. | | | 127,521 | |
| | 2,600 | | | Terumo Corp. | | | 100,547 | |
| | 16,500 | | | Tohoku Electric Power Co., Inc. | | | 202,156 | |
| | 9,300 | | | Tokyo Broadcasting System Holdings, Inc. | | | 146,137 | |
| | 40,100 | | | Tokyo Electric Power Holdings Co., Inc. (a) | | | 155,371 | |
| | 38,000 | | | Tokyo Gas Co., Ltd. | | | 172,424 | |
| | 5,000 | | | Tokyo Tatemono Co., Ltd. | | | 63,514 | |
| | 12,000 | | | Tokyu Corp. | | | 89,837 | |
| | 11,200 | | | Tokyu Fudosan Holdings Corp. | | | 63,127 | |
| | 20,000 | | | TonenGeneral Sekiyu K.K. | | | 196,931 | |
| | 21,000 | | | Toppan Printing Co., Ltd. | | | 197,484 | |
| | 13,000 | | | Tosoh Corp. | | | 84,897 | |
| | 5,800 | | | Toyo Suisan Kaisha Ltd. | | | 234,980 | |
| | 4,600 | | | Toyota Industries Corp. | | | 211,063 | |
| | 6,300 | | | Toyota Motor Corp. | | | 365,443 | |
| | 6,000 | | | Tsumura & Co. | | | 170,514 | |
| | 85,000 | | | Ube Industries Ltd. | | | 175,405 | |
| | 1,400 | | | West Japan Railway Co. | | | 86,207 | |
SEE NOTES TO FINANCIAL STATEMENTS.
| | | | | | |
| | | |
| 40 | | | | JPMORGAN EXCHANGE-TRADED FUNDS | | OCTOBER 31, 2016 |
| | | | | | | | |
| SHARES | | | SECURITY DESCRIPTION | | VALUE($) | |
| Common Stocks — continued | |
| | | | Japan — continued | |
| | 18,200 | | | Yahoo Japan Corp. | | | 69,815 | |
| | 26,100 | | | Yamada Denki Co., Ltd. | | | 134,910 | |
| | 7,200 | | | Yokohama Rubber Co., Ltd. (The) | | | 125,011 | |
| | | | | | | | |
| | | | | | | 18,846,112 | |
| | | | | | | | |
| | | | Netherlands — 1.3% | |
| | 748 | | | Boskalis Westminster | | | 24,124 | |
| | 915 | | | Gemalto NV | | | 49,714 | |
| | 1,563 | | | Heineken Holding NV | | | 120,260 | |
| | 9,832 | | | Koninklijke Ahold Delhaize NV | | | 224,293 | |
| | 48,065 | | | Koninklijke KPN NV | | | 156,729 | |
| | 3,635 | | | NN Group NV | | | 109,496 | |
| | 8,175 | | | RELX NV | | | 137,852 | |
| | 5,551 | | | Wolters Kluwer NV | | | 214,660 | |
| | | | | | | | |
| | | | | | | 1,037,128 | |
| | | | | | | | |
| | | | New Zealand — 0.4% | |
| | 20,294 | | | Contact Energy Ltd. | | | 69,005 | |
| | 84,928 | | | Spark New Zealand Ltd. | | | 222,119 | |
| | | | | | | | |
| | | | | | | 291,124 | |
| | | | | | | | |
| | | | Norway — 0.9% | |
| | 12,388 | | | Marine Harvest ASA | | | 224,796 | |
| | 17,492 | | | Orkla ASA | | | 165,167 | |
| | 1,291 | | | Statoil ASA | | | 21,077 | |
| | 9,214 | | | Telenor ASA | | | 146,547 | |
| | 4,205 | | | Yara International ASA | | | 148,539 | |
| | | | | | | | |
| | | | | | | 706,126 | |
| | | | | | | | |
| | | | Portugal — 0.3% | |
| | 46,877 | | | EDP — Energias de Portugal S.A. | | | 154,941 | |
| | 5,048 | | | Galp Energia SGPS S.A. | | | 68,443 | |
| | | | | | | | |
| | | | | | | 223,384 | |
| | | | | | | | |
| | | | Singapore — 2.2% | |
| | 35,500 | | | Ascendas Real Estate Investment Trust REIT | | | 60,497 | |
| | 104,700 | | | CapitaLand Mall Trust REIT | | | 156,018 | |
| | 57,700 | | | ComfortDelGro Corp., Ltd. | | | 105,200 | |
| | 346,500 | | | Golden Agri-Resources Ltd. | | | 95,679 | |
| | 201,500 | | | Hutchison Port Holdings Trust, Class U | | | 89,509 | |
| | 51,900 | | | Keppel Corp., Ltd. | | | 196,267 | |
| | 60,500 | | | Sembcorp Industries Ltd. | | | 109,554 | |
| | 17,900 | | | Singapore Airlines Ltd. | | | 130,257 | |
| | 63,600 | | | Singapore Press Holdings Ltd. | | | 169,964 | |
| | 106,800 | | | Singapore Telecommunications Ltd. | | | 297,644 | |
| | 11,100 | | | Venture Corp., Ltd. | | | 75,826 | |
| | 92,900 | | | Wilmar International Ltd. | | | 220,556 | |
| | | | | | | | |
| | | | | | | 1,706,971 | |
| | | | | | | | |
| | | | | | | | |
| SHARES | | | SECURITY DESCRIPTION | | VALUE($) | |
| | | | | | | | |
| | | | South Korea — 9.0% | |
| | 2,726 | | | Celltrion, Inc. (a) | | | 252,551 | |
| | 465 | | | CJ CheilJedang Corp. | | | 141,860 | |
| | 200 | | | CJ Corp. | | | 30,449 | |
| | 2,974 | | | GS Holdings Corp. | | | 132,309 | |
| | 3,867 | | | Hankook Tire Co., Ltd. | | | 185,698 | |
| | 433 | | | Hanmi Pharm Co., Ltd. | | | 136,716 | |
| | 1,297 | | | Hanmi Science Co., Ltd. | | | 86,034 | |
| | 14,780 | | | Hanon Systems | | | 138,197 | |
| | 8,041 | | | Hanwha Chemical Corp. | | | 189,322 | |
| | 908 | | | Hanwha Techwin Co., Ltd. | | | 50,436 | |
| | 1,177 | | | Hyundai Engineering & Construction Co., Ltd. | | | 42,514 | |
| | 1,250 | | | Hyundai Mobis Co., Ltd. | | | 298,136 | |
| | 3,987 | | | Hyundai Steel Co. | | | 171,799 | |
| | 10,350 | | | Industrial Bank of Korea | | | 119,140 | |
| | 2,402 | | | Kakao Corp. | | | 160,166 | |
| | 5,898 | | | Kia Motors Corp. | | | 209,430 | |
| | 5,475 | | | Korea Electric Power Corp. | | | 236,852 | |
| | 3,405 | | | Korea Gas Corp. | | | 137,626 | |
| | 343 | | | Korea Zinc Co., Ltd. | | | 136,195 | |
| | 2,013 | | | Korean Air Lines Co., Ltd. (a) | | | 56,270 | |
| | 8,294 | | | KT Corp. | | | 233,971 | |
| | 2,654 | | | KT&G Corp. | | | 261,765 | |
| | 9,564 | | | LG Display Co., Ltd. | | | 228,672 | |
| | 1,980 | | | LG Electronics, Inc. | | | 82,541 | |
| | 20,831 | | | LG Uplus Corp. | | | 214,689 | |
| | 894 | | | Lotte Chemical Corp. | | | 224,620 | |
| | 498 | | | Lotte Shopping Co., Ltd. | | | 99,363 | |
| | 410 | | | NAVER Corp. | | | 306,748 | |
| | 1,389 | | | POSCO | | | 289,013 | |
| | 270 | | | Samsung Electronics Co., Ltd. | | | 386,189 | |
| | 1,303 | | | Samsung Fine Chemicals Co., Ltd. | | | 32,993 | |
| | 530 | | | Samsung SDI Co., Ltd. | | | 43,622 | |
| | 1,213 | | | Samsung SDS Co., Ltd. | | | 163,572 | |
| | 306 | | | Shinsegae, Inc. | | | 49,702 | |
| | 1,182 | | | SK Holdings Co., Ltd. | | | 230,585 | |
| | 9,171 | | | SK Hynix, Inc. | | | 328,016 | |
| | 2,029 | | | SK Innovation Co., Ltd. | | | 267,086 | |
| | 1,200 | | | SK Telecom Co., Ltd. | | | 235,238 | |
| | 2,745 | | | SKC Co., Ltd. | | | 64,759 | |
| | 2,820 | | | S-Oil Corp. | | | 192,712 | |
| | 14,143 | | | Woori Bank | | | 154,132 | |
| | | | | | | | |
| | | | | | | 7,001,688 | |
| | | | | | | | |
| | | | Spain — 1.8% | |
| | 552 | | | Acciona S.A. | | | 41,948 | |
| | 1,842 | | | Acerinox S.A. | | | 22,667 | |
SEE NOTES TO FINANCIAL STATEMENTS.
| | | | | | | | |
| | | |
| OCTOBER 31, 2016 | | JPMORGAN EXCHANGE-TRADED FUNDS | | | | | 41 | |
JPMorgan Diversified Return Global Equity ETF
SCHEDULE OF PORTFOLIO INVESTMENTS
AS OF OCTOBER 31, 2016 (continued)
| | | | | | | | |
| SHARES | | | SECURITY DESCRIPTION | | VALUE($) | |
| Common Stocks — continued | |
| | | | Spain — continued | |
| | 1,410 | | | ACS Actividades de Construccion y Servicios S.A. | | | 43,130 | |
| | 381 | | | Aena S.A. (f) | | | 55,830 | |
| | 5,357 | | | Enagas S.A. | | | 153,559 | |
| | 7,907 | | | Endesa S.A. | | | 167,832 | |
| | 7,728 | | | Ferrovial S.A. | | | 150,139 | |
| | 7,611 | | | Gamesa Corp. Tecnologica S.A. | | | 175,727 | |
| | 8,129 | | | Gas Natural SDG S.A. | | | 160,015 | |
| | 6,775 | | | Grifols S.A. | | | 133,687 | |
| | 23,403 | | | Iberdrola S.A. | | | 159,269 | |
| | 7,623 | | | Red Electrica Corp. S.A. | | | 158,807 | |
| | | | | | | | |
| | | | | | | 1,422,610 | |
| | | | | | | | |
| | | | Sweden — 2.6% | |
| | 1,699 | | | Autoliv, Inc. | | | 164,429 | |
| | 9,800 | | | Boliden AB | | | 227,129 | |
| | 3,978 | | | Getinge AB, Class B | | | 65,142 | |
| | 4,236 | | | Hexagon AB, Class B | | | 148,226 | |
| | 2,697 | | | Investor AB, Class B | | | 95,777 | |
| | 2,480 | | | Lundin Petroleum AB (a) | | | 44,579 | |
| | 13,537 | | | Securitas AB, Class B | | | 208,928 | |
| | 9,380 | | | Skanska AB, Class B | | | 203,702 | |
| | 7,200 | | | Svenska Cellulosa AB SCA, Class B | | | 203,924 | |
| | 3,835 | | | Svenska Handelsbanken AB, Class A | | | 52,283 | |
| | 4,453 | | | Swedish Match AB | | | 154,965 | |
| | 17,313 | | | Tele2 AB, Class B | | | 142,963 | |
| | 3,062 | | | Telefonaktiebolaget LM Ericsson, Class B | | | 14,853 | |
| | 32,820 | | | TeliaSonera AB | | | 131,111 | |
| | 7,878 | | | Trelleborg AB, Class B | | | 137,510 | |
| | | | | | | | |
| | | | | | | 1,995,521 | |
| | | | | | | | |
| | | | Switzerland — 2.0% | |
| | 1,281 | | | Baloise Holding AG | | | 157,601 | |
| | 8,556 | | | Clariant AG | | | 141,683 | |
| | 3,843 | | | Garmin Ltd. | | | 185,848 | |
| | 105 | | | Givaudan S.A. | | | 203,077 | |
| | 317 | | | Kuehne & Nagel International AG | | | 42,967 | |
| | 1,239 | | | Lonza Group AG | | | 233,801 | |
| | 1,911 | | | Novartis AG | | | 135,619 | |
| | 1,137 | | | Sonova Holding AG | | | 152,486 | |
| | 411 | | | Swiss Life Holding AG | | | 108,764 | |
| | 522 | | | Swiss Prime Site AG | | | 43,294 | |
| | 359 | | | Swisscom AG | | | 164,107 | |
| | | | | | | | |
| | | | | | | 1,569,247 | |
| | | | | | | | |
| | | | United Kingdom — 3.1% | |
| | 5,677 | | | Barratt Developments plc | | | 31,482 | |
| | | | | | | | |
| SHARES | | | SECURITY DESCRIPTION | | VALUE($) | |
| | | | | | | | |
| | | | United Kingdom — continued | |
| | 994 | | | Berkeley Group Holdings plc | | | 28,668 | |
| | 18,187 | | | BP plc | | | 107,517 | |
| | 10,067 | | | British Land Co., plc (The) REIT | | | 72,074 | |
| | 30,966 | | | BT Group plc, Class A | | | 142,136 | |
| | 7,597 | | | Bunzl plc | | | 203,960 | |
| | 8,802 | | | Direct Line Insurance Group plc | | | 37,238 | |
| | 5,937 | | | easyJet plc | | | 68,083 | |
| | 7,072 | | | GlaxoSmithKline plc | | | 139,703 | |
| | 6,045 | | | Hammerson plc REIT | | | 40,668 | |
| | 7,925 | | | Inmarsat plc | | | 67,981 | |
| | 412 | | | Johnson Matthey plc | | | 17,174 | |
| | 8,611 | | | Land Securities Group plc REIT | | | 105,146 | |
| | 2,666 | | | Mondi plc | | | 52,029 | |
| | 11,432 | | | National Grid plc | | | 148,706 | |
| | 738 | | | Next plc | | | 43,420 | |
| | 1,617 | | | Persimmon plc | | | 33,472 | |
| | 13,798 | | | Royal Mail plc | | | 82,781 | |
| | 24,753 | | | Sage Group plc (The) | | | 218,396 | |
| | 3,026 | | | Severn Trent plc | | | 86,139 | |
| | 10,018 | | | Smith & Nephew plc | | | 144,824 | |
| | 770 | | | Travis Perkins plc | | | 12,527 | |
| | 11,801 | | | United Utilities Group plc | | | 135,651 | |
| | 52,050 | | | Vodafone Group plc | | | 142,947 | |
| | 11,955 | | | William Hill plc | | | 43,247 | |
| | 7,047 | | | WPP plc | | | 153,012 | |
| | | | | | | | |
| | | | | | | 2,358,981 | |
| | | | | | | | |
| | | | United States — 25.4% | |
| | 1,091 | | | Albemarle Corp. | | | 91,153 | |
| | 340 | | | Alleghany Corp. (a) | | | 175,511 | |
| | 6,119 | | | Alliant Energy Corp. | | | 232,828 | |
| | 1,913 | | | Allstate Corp. (The) | | | 129,893 | |
| | 3,841 | | | Amdocs Ltd. (Guernsey) | | | 224,506 | |
| | 3,518 | | | Ameren Corp. | | | 175,724 | |
| | 3,159 | | | American Water Works Co., Inc. | | | 233,892 | |
| | 12,830 | | | Annaly Capital Management, Inc. REIT | | | 132,919 | |
| | 1,617 | | | Anthem, Inc. | | | 197,048 | |
| | 1,634 | | | Ashland Global Holdings Inc. | | | 182,567 | |
| | 1,751 | | | Assurant, Inc. | | | 140,991 | |
| | 6,417 | | | AT&T, Inc. | | | 236,081 | |
| | 3,175 | | | AutoNation, Inc. (a) | | | 139,287 | |
| | 234 | | | AutoZone, Inc. (a) | | | 173,665 | |
| | 3,074 | | | Avery Dennison Corp. | | | 214,534 | |
| | 3,559 | | | Avnet, Inc. | | | 149,300 | |
| | 3,606 | | | Axis Capital Holdings Ltd. (Bermuda) | | | 205,434 | |
| | 1,350 | | | Becton, Dickinson & Co. | | | 226,679 | |
SEE NOTES TO FINANCIAL STATEMENTS.
| | | | | | |
| | | |
| 42 | | | | JPMORGAN EXCHANGE-TRADED FUNDS | | OCTOBER 31, 2016 |
| | | | | | | | |
| SHARES | | | SECURITY DESCRIPTION | | VALUE($) | |
| Common Stocks — continued | |
| | | | United States — continued | |
| | 4,090 | | | Bemis Co., Inc. | | | 199,265 | |
| | 3,405 | | | Broadridge Financial Solutions, Inc. | | | 220,167 | |
| | 795 | | | C.R. Bard, Inc. | | | 172,261 | |
| | 5,997 | | | CA Technologies, Inc. | | | 184,348 | |
| | 2,432 | | | Celanese Corp., Class A | | | 177,341 | |
| | 5,983 | | | CenturyLink, Inc. | | | 159,028 | |
| | 2,534 | | | Chevron Corp. | | | 265,437 | |
| | 4,751 | | | Church & Dwight Co., Inc. | | | 229,283 | |
| | 604 | | | Cigna Corp. | | | 71,773 | |
| | 3,064 | | | Cincinnati Financial Corp. | | | 216,870 | |
| | 2,010 | | | Cintas Corp. | | | 214,407 | |
| | 2,686 | | | CMS Energy Corp. | | | 113,215 | |
| | 2,205 | | | CNA Financial Corp. | | | 80,637 | |
| | 3,345 | | | Commerce Bancshares, Inc. | | | 166,648 | |
| | 2,752 | | | Computer Sciences Corp. | | | 149,846 | |
| | 2,177 | | | Consolidated Edison, Inc. | | | 164,472 | |
| | 1,451 | | | Constellation Brands, Inc., Class A | | | 242,491 | |
| | 2,773 | | | Darden Restaurants, Inc. | | | 179,663 | |
| | 731 | | | DaVita HealthCare Partners, Inc. (a) | | | 42,851 | |
| | 3,455 | | | DENTSPLY SIRONA, Inc. | | | 198,904 | |
| | 2,401 | | | Dr. Pepper Snapple Group, Inc. | | | 210,784 | |
| | 1,856 | | | DST Systems, Inc. | | | 178,473 | |
| | 2,537 | | | DTE Energy Co. | | | 243,577 | |
| | 2,290 | | | Eastman Chemical Co. | | | 164,674 | |
| | 1,454 | | | Edgewell Personal Care Co. (a) | | | 109,632 | |
| | 1,180 | | | Everest Re Group Ltd. (Bermuda) | | | 240,154 | |
| | 4,112 | | | Eversource Energy | | | 226,407 | |
| | 2,763 | | | Fidelity National Information Services, Inc. | | | 204,241 | |
| | 3,056 | | | First Solar, Inc. (a) | | | 123,737 | |
| | 3,227 | | | Foot Locker, Inc. | | | 215,467 | |
| | 34,189 | | | Frontier Communications Corp. | | | 137,440 | |
| | 1,540 | | | Genuine Parts Co. | | | 139,509 | |
| | 2,376 | | | Harris Corp. | | | 211,963 | |
| | 2,624 | | | Hasbro, Inc. | | | 218,868 | |
| | 1,729 | | | Helmerich & Payne, Inc. | | | 109,117 | |
| | 1,341 | | | Henry Schein, Inc. (a) | | | 200,077 | |
| | 1,483 | | | Hertz Global Holdings, Inc. (a) | | | 49,161 | |
| | 2,245 | | | Hess Corp. | | | 107,693 | |
| | 4,255 | | | HollyFrontier Corp. | | | 106,162 | |
| | 5,165 | | | Hormel Foods Corp. | | | 198,853 | |
| | 1,112 | | | IAC/Interactive Corp. | | | 71,657 | |
| | 2,740 | | | Ingevity Corp. (a) | | | 113,436 | |
| | 6,631 | | | Intel Corp. | | | 231,223 | |
| | 1,705 | | | International Flavors & Fragrances, Inc. | | | 222,980 | |
| | 2,510 | | | International Game Technology plc | | | 72,087 | |
| | | | | | | | |
| SHARES | | | SECURITY DESCRIPTION | | VALUE($) | |
| | | | | | | | |
| | | | United States — continued | |
| | 3,519 | | | Jabil Circuit, Inc. | | | 75,095 | |
| | 1,670 | | | JM Smucker Co. (The) | | | 219,288 | |
| | 2,141 | | | Johnson & Johnson | | | 248,335 | |
| | 1,588 | | | L-3 Communications Holdings, Inc., Class 3 | | | 217,461 | |
| | 1,696 | | | Laboratory Corp. of America Holdings (a) | | | 212,577 | |
| | 4,548 | | | Leggett & Platt, Inc. | | | 208,662 | |
| | 3,748 | | | Level 3 Communications, Inc. (a) | | | 210,450 | |
| | 6,480 | | | Liberty Interactive Corp. QVC Group, Class A (a) | | | 119,815 | |
| | 1,681 | | | McCormick & Co., Inc. (Non-Voting) | | | 161,157 | |
| | 2,315 | | | Molson Coors Brewing Co., Class B | | | 240,320 | |
| | 2,053 | | | Motorola Solutions, Inc. | | | 149,007 | |
| | 2,351 | | | Murphy Oil Corp. | | | 60,820 | |
| | 3,360 | | | Newfield Exploration Co. (a) | | | 136,382 | |
| | 6,580 | | | NiSource, Inc. | | | 153,051 | |
| | 1,128 | | | Northrop Grumman Corp. | | | 258,312 | |
| | 1,790 | | | NVIDIA Corp. | | | 127,376 | |
| | 120 | | | NVR, Inc. (a) | | | 182,760 | |
| | 4,258 | | | Old Republic International Corp. | | | 71,790 | |
| | 3,853 | | | Patterson Cos., Inc. | | | 164,562 | |
| | 3,022 | | | Pinnacle West Capital Corp. | | | 230,065 | |
| | 2,211 | | | PPG Industries, Inc. | | | 205,910 | |
| | 4,431 | | | PulteGroup, Inc. | | | 82,417 | |
| | 510 | | | Quest Diagnostics, Inc. | | | 41,534 | |
| | 1,710 | | | Raytheon Co. | | | 233,603 | |
| | 1,922 | | | RenaissanceRe Holdings Ltd. (Bermuda) | | | 238,885 | |
| | 4,260 | | | Republic Services, Inc., Class A | | | 224,204 | |
| | 3,184 | | | Reynolds American, Inc. | | | 175,375 | |
| | 1,944 | | | SBA Communications Corp., Class A (a) | | | 220,216 | |
| | 3,333 | | | SCANA Corp. | | | 244,509 | |
| | 1,406 | | | Scripps Networks Interactive, Inc., Class A | | | 90,490 | |
| | 4,336 | | | Southwest Airlines Co. | | | 173,657 | |
| | 38,122 | | | Sprint Corp. (a) | | | 234,832 | |
| | 3,981 | | | Synopsys, Inc. (a) | | | 236,113 | |
| | 3,656 | | | TEGNA, Inc. | | | 71,731 | |
| | 1,451 | | | Tesoro Corp. | | | 123,291 | |
| | 4,016 | | | Thomson Reuters Corp. | | | 158,269 | |
| | 5,101 | | | T-Mobile US, Inc. (a) | | | 253,673 | |
| | 3,231 | | | Torchmark Corp. | | | 204,878 | |
| | 2,893 | | | Total System Services, Inc. | | | 144,303 | |
| | 2,488 | | | Tyson Foods, Inc., Class A | | | 176,275 | |
| | 1,680 | | | Universal Health Services, Inc., Class B | | | 202,793 | |
| | 4,932 | | | Verizon Communications, Inc. | | | 237,229 | |
| | 3,717 | | | W.R. Berkley Corp. | | | 212,241 | |
| | 2,657 | | | Walt Disney Co. (The) | | | 246,277 | |
| | 1,237 | | | Waters Corp. (a) | | | 172,116 | |
SEE NOTES TO FINANCIAL STATEMENTS.
| | | | | | | | |
| | | |
| OCTOBER 31, 2016 | | JPMORGAN EXCHANGE-TRADED FUNDS | | | | | 43 | |
JPMorgan Diversified Return Global Equity ETF
SCHEDULE OF PORTFOLIO INVESTMENTS
AS OF OCTOBER 31, 2016 (continued)
| | | | | | | | |
| SHARES | | | SECURITY DESCRIPTION | | VALUE($) | |
| Common Stocks — continued | |
| | | | United States — continued | |
| | 3,444 | | | Westlake Chemical Corp. | | | 178,365 | |
| | 2,672 | | | Wyndham Worldwide Corp. | | | 175,924 | |
| | 5,612 | | | Xcel Energy, Inc. | | | 233,179 | |
| | 3,905 | | | Xylem, Inc. | | | 188,729 | |
| | 655 | | | Zimmer Biomet Holdings, Inc. | | | 69,037 | |
| | | | | | | | |
| | | | | | | 19,715,631 | |
| | | | | | | | |
| | | | Total Common Stocks
(Cost $73,473,170) | | | 76,808,214 | |
| | | | | | | | |
| Preferred Stock — 0.1% | |
| | | | Germany — 0.1% | |
| | 780 | | | Henkel AG & Co., KGaA | | | 100,254 | |
| | | | | | | | |
| | | | Total Preferred Stock
(Cost $103,360) | | | 100,254 | |
| | | | | | | | |
| | |
NUMBER
OF RIGHTS | | | | | | |
| Rights — 0.0% (e) | |
| | | | Spain — 0.0% (e) | |
| | 7,728 | | | Ferrovial S.A. (a) | | | 3,309 | |
| | | | | | | | |
| | | | Sweden — 0.0% (e) | |
| | 17,313 | | | Tele2 AB (a) | | | 5,187 | |
| | | | | | | | |
| | | | Total Rights
(Cost $—) | | | 8,496 | |
| | | | | | | | |
| | | | Total Investments — 99.2%
(Cost $73,576,530) | | | 76,916,964 | |
| | | | Other Assets in Excess of
Liabilities — 0.8% | | | 639,969 | |
| | | | | | | | |
| | | | NET ASSETS — 100.0% | | $ | 77,556,933 | |
| | | | | | | | |
Percentages indicated are based on net assets.
Summary of Investments by Industry, October 31, 2016
The following table represents the portfolio investments of the Fund by industry classifications as a percentage of total investments:
| | | | |
| INDUSTRY | | PERCENTAGE | |
Chemicals | | | 6.4 | % |
Oil, Gas & Consumable Fuels | | | 6.4 | |
Diversified Telecommunication Services | | | 5.9 | |
Electric Utilities | | | 5.2 | |
Insurance | | | 3.8 | |
Pharmaceuticals | | | 3.7 | |
Food Products | | | 3.4 | |
IT Services | | | 3.0 | |
Health Care Providers & Services | | | 3.0 | |
Wireless Telecommunication Services | | | 2.7 | |
Software | | | 2.4 | |
Health Care Equipment & Supplies | | | 2.3 | |
Semiconductors & Semiconductor Equipment | | | 2.3 | |
Real Estate Investment Trusts (REITs) | | | 2.3 | |
Media | | | 2.2 | |
Banks | | | 2.2 | |
Multi-Utilities | | | 2.1 | |
Auto Components | | | 2.0 | |
Gas Utilities | | | 1.9 | |
Technology Hardware, Storage & Peripherals | | | 1.8 | |
Household Durables | | | 1.8 | |
Road & Rail | | | 1.7 | |
Commercial Services & Supplies | | | 1.7 | |
Hotels, Restaurants & Leisure | | | 1.7 | |
Specialty Retail | | | 1.4 | |
Airlines | | | 1.3 | |
Metals & Mining | | | 1.3 | |
Beverages | | | 1.3 | |
Aerospace & Defense | | | 1.3 | |
Trading Companies & Distributors | | | 1.2 | |
Industrial Conglomerates | | | 1.2 | |
Food & Staples Retailing | | | 1.2 | |
Electronic Equipment, Instruments & Components | | | 1.1 | |
Real Estate Management & Development | | | 1.0 | |
Others (each less than 1.0%) | | | 15.8 | |
SEE NOTES TO FINANCIAL STATEMENTS.
| | | | | | |
| | | |
| 44 | | | | JPMORGAN EXCHANGE-TRADED FUNDS | | OCTOBER 31, 2016 |
JPMorgan Diversified Return International Currency Hedged ETF
SCHEDULE OF PORTFOLIO INVESTMENTS
AS OF OCTOBER 31, 2016
| | | | | | | | |
| SHARES | | | SECURITY DESCRIPTION | | VALUE($) | |
| Investment Company — 100.1% | | | | |
| | | | Exchange Traded Fund — 100.1% | |
| | 525,353 | | | JPMorgan Diversified Return International Equity ETF (b) | | | 26,351,706 | |
| | | | | | | | |
| | | | Total Exchange Traded Fund
(Cost $26,697,158) | | | 26,351,706 | |
| | | | | | | | |
| | | | Total Investments — 100.1%
(Cost $26,697,158) | | | 26,351,706 | |
| | | | Liabilities in Excess of
Other Assets — (0.1)% | | | (35,592 | ) |
| | | | | | | | |
| | | | NET ASSETS — 100.0% | | $ | 26,316,114 | |
| | | | | | | | |
Percentages indicated are based on net assets.
| | | | | | | | | | | | | | | | | | | | | | |
| Forward Foreign Currency Exchange Contracts | | | | | | | |
CONTRACTS
TO BUY (c) | | | CURRENCY | | COUNTERPARTY | | SETTLEMENT
DATE | | | SETTLEMENT
VALUE | | | VALUE AT
OCTOBER 31, 2016 | | | NET
UNREALIZED
APPRECIATION
(DEPRECIATION) | |
| | 3,092,546 | | | AUD | | Goldman Sachs | | | 11/03/2016 | | | | 2,353,632 | | | | 2,352,311 | | | | (1,321 | ) |
| | 192,077 | | | AUD | | Goldman Sachs | | | 12/05/2016 | | | | 146,043 | | | | 145,979 | | | | (64 | ) |
| | 442,676 | | | CHF | | Goldman Sachs | | | 11/03/2016 | | | | 447,446 | | | | 447,418 | | | | (28 | ) |
| | 2,593,002 | | | DKK | | Goldman Sachs | | | 11/03/2016 | | | | 382,334 | | | | 382,734 | | | | 400 | |
| | 119,735 | | | DKK | | Goldman Sachs | | | 12/05/2016 | | | | 17,669 | | | | 17,699 | | | | 30 | |
| | 4,502,622 | | | EUR | | Goldman Sachs | | | 11/03/2016 | | | | 4,936,595 | | | | 4,943,369 | | | | 6,774 | |
| | 104,300 | | | EUR | | Goldman Sachs | | | 12/05/2016 | | | | 114,490 | | | | 114,666 | | | | 176 | |
| | 4,421,582 | | | GBP | | Goldman Sachs | | | 11/03/2016 | | | | 5,405,035 | | | | 5,412,351 | | | | 7,316 | |
| | 10,919,454 | | | HKD | | Goldman Sachs | | | 11/03/2016 | | | | 1,408,162 | | | | 1,407,975 | | | | (187 | ) |
| | 153,322 | | | HKD | | Goldman Sachs | | | 12/05/2016 | | | | 19,775 | | | | 19,773 | | | | (2 | ) |
| | 703,461,821 | | | JPY | | Goldman Sachs | | | 11/03/2016 | | | | 6,699,640 | | | | 6,708,598 | | | | 8,958 | |
| | 2,879,504,003 | | | KRW | | Goldman Sachs | | | 11/03/2016 | | | | 2,515,040 | | | | 2,516,465 | | | | 1,425 | |
| | 59,321,756 | | | KRW | | Goldman Sachs | | | 12/05/2016 | | | | 51,742 | | | | 51,836 | | | | 94 | |
| | 3,010,236 | | | NOK | | Goldman Sachs | | | 11/03/2016 | | | | 364,873 | | | | 364,333 | | | | (540 | ) |
| | 385,839 | | | NOK | | Goldman Sachs | | | 12/05/2016 | | | | 46,765 | | | | 46,701 | | | | (64 | ) |
| | 261,050 | | | NZD | | Goldman Sachs | | | 11/03/2016 | | | | 186,757 | | | | 186,654 | | | | (103 | ) |
| | 13,158 | | | NZD | | Goldman Sachs | | | 12/05/2016 | | | | 9,402 | | | | 9,396 | | | | (6 | ) |
| | 6,408,471 | | | SEK | | Goldman Sachs | | | 11/03/2016 | | | | 710,424 | | | | 709,613 | | | | (811 | ) |
| | 947,360 | | | SGD | | Goldman Sachs | | | 11/03/2016 | | | | 680,627 | | | | 680,958 | | | | 331 | |
| | | | | | | | | | | | | 26,496,451 | | | | 26,518,829 | | | | 22,378 | |
| | |
| | | | | | |
CONTRACTS
TO SELL (c) | | | CURRENCY | | COUNTERPARTY | | SETTLEMENT
DATE | | | SETTLEMENT
VALUE | | | VALUE AT
OCTOBER 31, 2016 | | | NET
UNREALIZED
APPRECIATION
(DEPRECIATION) | |
| | 3,092,546 | | | AUD | | Goldman Sachs | | | 11/03/2016 | | | | 2,365,037 | | | | 2,352,311 | | | | 12,726 | |
| | 3,129,739 | | | AUD | | Goldman Sachs | | | 12/05/2016 | | | | 2,379,614 | | | | 2,378,607 | | | | 1,007 | |
| | 442,676 | | | CHF | | Goldman Sachs | | | 11/03/2016 | | | | 456,595 | | | | 447,419 | | | | 9,176 | |
| | 440,935 | | | CHF | | Goldman Sachs | | | 12/05/2016 | | | | 446,645 | | | | 446,434 | | | | 211 | |
SEE NOTES TO FINANCIAL STATEMENTS.
| | | | | | | | |
| | | |
| OCTOBER 31, 2016 | | JPMORGAN EXCHANGE-TRADED FUNDS | | | | | 45 | |
JPMorgan Diversified Return International Currency Hedged ETF
SCHEDULE OF PORTFOLIO INVESTMENTS
AS OF OCTOBER 31, 2016 (continued)
| | | | | | | | | | | | | | | | | | | | | | |
CONTRACTS
TO SELL (c) | | | CURRENCY | | COUNTERPARTY | | SETTLEMENT
DATE | | | SETTLEMENT
VALUE | | | VALUE AT
OCTOBER 31, 2016 | | | NET
UNREALIZED
APPRECIATION
(DEPRECIATION) | |
| | 2,593,002 | | | DKK | | Goldman Sachs | | | 11/03/2016 | | | | 391,894 | | | | 382,734 | | | | 9,160 | |
| | 2,540,347 | | | DKK | | Goldman Sachs | | | 12/05/2016 | | | | 374,872 | | | | 375,500 | | | | (628 | ) |
| | 4,502,622 | | | EUR | | Goldman Sachs | | | 11/03/2016 | | | | 5,063,635 | | | | 4,943,368 | | | | 120,267 | |
| | 4,553,774 | | | EUR | | Goldman Sachs | | | 12/05/2016 | | | | 4,998,673 | | | | 5,006,368 | | | | (7,695 | ) |
| | 4,421,582 | | | GBP | | Goldman Sachs | | | 11/03/2016 | | | | 5,734,127 | | | | 5,412,351 | | | | 321,776 | |
| | 4,387,734 | | | GBP | | Goldman Sachs | | | 12/05/2016 | | | | 5,360,744 | | | | 5,374,599 | | | | (13,855 | ) |
| | 10,919,454 | | | HKD | | Goldman Sachs | | | 11/03/2016 | | | | 1,408,230 | | | | 1,407,975 | | | | 255 | |
| | 11,098,363 | | | HKD | | Goldman Sachs | | | 12/05/2016 | | | | 1,431,424 | | | | 1,431,310 | | | | 114 | |
| | 703,461,821 | | | JPY | | Goldman Sachs | | | 11/03/2016 | | | | 6,954,983 | | | | 6,708,597 | | | | 246,386 | |
| | 746,885,663 | | | JPY | | Goldman Sachs | | | 12/05/2016 | | | | 7,114,425 | | | | 7,131,092 | | | | (16,667 | ) |
| | 2,879,504,002 | | | KRW | | Goldman Sachs | | | 11/03/2016 | | | | 2,620,973 | | | | 2,516,465 | | | | 104,508 | |
| | 2,912,859,277 | | | KRW | | Goldman Sachs | | | 12/05/2016 | | | | 2,540,657 | | | | 2,545,277 | | | | (4,620 | ) |
| | 3,010,236 | | | NOK | | Goldman Sachs | | | 11/03/2016 | | | | 374,544 | | | | 364,333 | | | | 10,211 | |
| | 2,551,913 | | | NOK | | Goldman Sachs | | | 12/05/2016 | | | | 309,300 | | | | 308,878 | | | | 422 | |
| | 261,050 | | | NZD | | Goldman Sachs | | | 11/03/2016 | | | | 189,599 | | | | 186,654 | | | | 2,945 | |
| | 261,050 | | | NZD | | Goldman Sachs | | | 12/05/2016 | | | | 186,526 | | | | 186,416 | | | | 110 | |
| | 6,408,471 | | | SEK | | Goldman Sachs | | | 11/03/2016 | | | | 749,134 | | | | 709,613 | | | | 39,521 | |
| | 6,408,471 | | | SEK | | Goldman Sachs | | | 12/05/2016 | | | | 711,430 | | | | 710,694 | | | | 736 | |
| | 947,360 | | | SGD | | Goldman Sachs | | | 11/03/2016 | | | | 694,914 | | | | 680,958 | | | | 13,956 | |
| | 947,360 | | | SGD | | Goldman Sachs | | | 12/05/2016 | | | | 680,692 | | | | 681,117 | | | | (425 | ) |
| | | | | | | | | | | | | 53,538,667 | | | | 52,689,070 | | | | 849,597 | |
| | |
SEE NOTES TO FINANCIAL STATEMENTS.
| | | | | | |
| | | |
| 46 | | | | JPMORGAN EXCHANGE-TRADED FUNDS | | OCTOBER 31, 2016 |
JPMorgan Diversified Return International Equity ETF
SCHEDULE OF PORTFOLIO INVESTMENTS
AS OF OCTOBER 31, 2016
| | | | | | | | |
| SHARES | | | SECURITY DESCRIPTION | | VALUE($) | |
| Common Stocks — 99.5% | |
| | | | Australia — 8.6% | |
| | 138,028 | | | AGL Energy Ltd. | | | 2,010,725 | |
| | 96,262 | | | Ansell Ltd. | | | 1,585,919 | |
| | 243,602 | | | APA Group | | | 1,472,241 | |
| | 67,957 | | | Bendigo & Adelaide Bank Ltd. | | | 573,888 | |
| | 66,548 | | | BlueScope Steel Ltd. | | | 394,804 | |
| | 148,872 | | | Boral Ltd. | | | 711,278 | |
| | 75,211 | | | Brambles Ltd. | | | 658,495 | |
| | 48,080 | | | Caltex Australia Ltd. | | | 1,119,169 | |
| | 18,359 | | | Cochlear Ltd. | | | 1,783,784 | |
| | 26,355 | | | CSL Ltd. | | | 2,011,033 | |
| | 290,895 | | | CSR Ltd. | | | 807,730 | |
| | 282,696 | | | Dexus Property Group REIT | | | 1,920,391 | |
| | 81,887 | | | Downer EDI Ltd. | | | 361,931 | |
| | 523,875 | | | DUET Group | | | 948,437 | |
| | 460,903 | | | GPT Group (The) REIT | | | 1,629,465 | |
| | 224,281 | | | Harvey Norman Holdings Ltd. | | | 858,897 | |
| | 704,101 | | | Healthscope Ltd. | | | 1,181,116 | |
| | 430,005 | | | Incitec Pivot Ltd. | | | 961,736 | |
| | 458,311 | | | Origin Energy Ltd. | | | 1,847,257 | |
| | 33,229 | | | Ramsay Health Care Ltd. | | | 1,850,352 | |
| | 116,637 | | | Sonic Healthcare Ltd. | | | 1,813,989 | |
| | 366,695 | | | Sydney Airport | | | 1,743,190 | |
| | 517,827 | | | Tabcorp Holdings Ltd. | | | 1,902,488 | |
| | 474,196 | | | Tatts Group Ltd. | | | 1,461,735 | |
| | 496,865 | | | Telstra Corp., Ltd. | | | 1,879,114 | |
| | 174,824 | | | TPG Telecom Ltd. | | | 1,002,451 | |
| | 230,717 | | | Transurban Group | | | 1,820,477 | |
| | 707,216 | | | Vicinity Centres REIT | | | 1,542,268 | |
| | 113,087 | | | Vocus Communications Ltd. | | | 490,295 | |
| | 63,991 | | | Wesfarmers Ltd. | | | 1,992,611 | |
| | | | | | | | |
| | | | | | | 40,337,266 | |
| | | | | | | | |
| | | | Austria — 0.6% | |
| | 45,055 | | | OMV AG | | | 1,406,156 | |
| | 33,551 | | | voestalpine AG | | | 1,188,586 | |
| | | | | | | | |
| | | | | | | 2,594,742 | |
| | | | | | | | |
| | | | Belgium — 1.1% | |
| | 27,641 | | | Colruyt S.A. | | | 1,485,654 | |
| | 9,501 | | | Groupe Bruxelles Lambert S.A. | | | 816,775 | |
| | 48,852 | | | Proximus SADP | | | 1,398,272 | |
| | 20,954 | | | Umicore S.A. | | | 1,273,634 | |
| | | | | | | | |
| | | | | | | 4,974,335 | |
| | | | | | | | |
| | | | Denmark — 1.4% | |
| | 21,717 | | | Chr. Hansen Holding A/S | | | 1,300,585 | |
| | 2,395 | | | DSV A/S | | | 115,965 | |
| | | | | | | | |
| SHARES | | | SECURITY DESCRIPTION | | VALUE($) | |
| | | | | | | | |
| | | | Denmark — continued | |
| | 29,697 | | | H Lundbeck A/S (a) | | | 957,090 | |
| | 6,875 | | | ISS A/S | | | 269,883 | |
| | 249,165 | | | TDC A/S (a) | | | 1,373,771 | |
| | 20,040 | | | Vestas Wind Systems A/S | | | 1,605,523 | |
| | 54,391 | | | William Demant Holding A/S (a) | | | 1,012,056 | |
| | | | | | | | |
| | | | | | | 6,634,873 | |
| | | | | | | | |
| | | | Finland — 1.8% | |
| | 33,553 | | | Elisa OYJ | | | 1,130,446 | |
| | 42,288 | | | Fortum OYJ | | | 704,898 | |
| | 28,893 | | | Kesko OYJ, Class B | | | 1,435,698 | |
| | 46,283 | | | Neste OYJ | | | 1,996,755 | |
| | 10,051 | | | Nokian Renkaat OYJ | | | 337,128 | |
| | 22,594 | | | Orion OYJ, Class B | | | 961,693 | |
| | 23,957 | | | Sampo OYJ, Class A | | | 1,097,572 | |
| | 43,423 | | | UPM-Kymmene OYJ | | | 1,010,090 | |
| | | | | | | | |
| | | | | | | 8,674,280 | |
| | | | | | | | |
| | | | France — 5.0% | |
| | 4,322 | | | Arkema S.A. | | | 409,824 | |
| | 18,309 | | | Atos SE | | | 1,899,999 | |
| | 20,215 | | | Capital Gemini S.A. | | | 1,674,151 | |
| | 7,689 | | | Christian Dior SE | | | 1,482,953 | |
| | 22,738 | | | Dassault Systemes | | | 1,799,781 | |
| | 11,346 | | | Eiffage S.A. | | | 840,000 | |
| | 13,036 | | | Essilor International S.A. | | | 1,464,907 | |
| | 28,103 | | | Eutelsat Communications S.A. | | | 588,896 | |
| | 346 | | | Iliad S.A. | | | 72,534 | |
| | 11,364 | | | Ingenico Group S.A. | | | 898,872 | |
| | 42,702 | | | Lagardere SCA | | | 1,087,484 | |
| | 94,546 | | | Orange S.A. | | | 1,487,562 | |
| | 18,525 | | | Publicis Groupe S.A. | | | 1,270,816 | |
| | 42,544 | | | SCOR SE | | | 1,377,735 | |
| | 5,352 | | | Sodexo S.A. | | | 621,482 | |
| | 21,540 | | | Thales S.A. | | | 2,026,600 | |
| | 30,664 | | | TOTAL S.A. | | | 1,468,963 | |
| | 11,059 | | | Valeo S.A. | | | 638,161 | |
| | 14,675 | | | Vinci S.A. | | | 1,062,761 | |
| | 61,819 | | | Vivendi S.A. | | | 1,251,256 | |
| | | | | | | | |
| | | | | | | 23,424,737 | |
| | | | | | | | |
| | | | Germany — 4.1% | |
| | 14,267 | | | Axel Springer SE | | | 714,766 | |
| | 16,861 | | | Beiersdorf AG | | | 1,486,467 | |
| | 18,072 | | | Brenntag AG | | | 966,137 | |
| | 42,354 | | | Evonik Industries AG | | | 1,326,385 | |
SEE NOTES TO FINANCIAL STATEMENTS.
| | | | | | | | |
| | | |
| OCTOBER 31, 2016 | | JPMORGAN EXCHANGE-TRADED FUNDS | | | | | 47 | |
JPMorgan Diversified Return International Equity ETF
SCHEDULE OF PORTFOLIO INVESTMENTS
AS OF OCTOBER 31, 2016 (continued)
| | | | | | | | |
| SHARES | | | SECURITY DESCRIPTION | | VALUE($) | |
| Common Stocks — continued | |
| | | | Germany — continued | |
| | 22,406 | | | Fraport AG Frankfurt Airport Services Worldwide | | | 1,330,037 | |
| | 21,242 | | | Fresenius Medical Care AG & Co., KGaA | | | 1,730,257 | |
| | 25,188 | | | Fresenius SE & Co., KGaA | | | 1,861,080 | |
| | 16,259 | | | Hannover Rueck SE | | | 1,813,884 | |
| | 110,579 | | | Infineon Technologies AG | | | 1,988,804 | |
| | 15,062 | | | Merck KGaA | | | 1,550,339 | |
| | 35,846 | | | QIAGEN NV (a) | | | 876,707 | |
| | 10,774 | | | SAP SE | | | 949,188 | |
| | 18,065 | | | Suedzucker AG | | | 463,415 | |
| | 5,269 | | | Symrise AG | | | 361,852 | |
| | 183,015 | | | Telefonica Deutschland Holding AG | | | 709,793 | |
| | 24,230 | | | United Internet AG | | | 996,213 | |
| | | | | | | | |
| | | | | | | 19,125,324 | |
| | | | | | | | |
| | | | Hong Kong — 5.4% | |
| | 520,000 | | | Cathay Pacific Airways Ltd. | | | 684,442 | |
| | 198,000 | | | Cheung Kong Infrastructure Holdings Ltd. | | | 1,620,396 | |
| | 170,042 | | | CK Hutchison Holdings Ltd. | | | 2,099,684 | |
| | 198,000 | | | CLP Holdings Ltd. | | | 2,012,669 | |
| | 1,301,000 | | | FIH Mobile Ltd. | | | 429,335 | |
| | 340,000 | | | First Pacific Co., Ltd. | | | 257,568 | |
| | 1,041,510 | | | Hong Kong & China Gas Co., Ltd. | | | 2,034,550 | |
| | 280,000 | | | Link REIT | | | 1,991,903 | |
| | 365,000 | | | MTR Corp., Ltd. | | | 2,019,939 | |
| | 227,000 | | | New World Development Co., Ltd. | | | 282,218 | |
| | 2,906,000 | | | PCCW Ltd. | | | 1,729,789 | |
| | 196,000 | | | Power Assets Holdings Ltd. | | | 1,839,597 | |
| | 17,802,000 | | | Semiconductor Manufacturing International Corp. (a) | | | 2,155,960 | |
| | 148,000 | | | Swire Pacific Ltd., Class A | | | 1,538,291 | |
| | 356,000 | | | Techtronic Industries Co., Ltd. | | | 1,337,545 | |
| | 143,000 | | | Wheelock & Co., Ltd. | | | 880,037 | |
| | 282,000 | | | Xinyi Glass Holdings Ltd. | | | 242,474 | |
| | 1,302,000 | | | Xinyi Solar Holdings Ltd. | | | 482,334 | |
| | 464,500 | | | Yue Yuen Industrial Holdings Ltd. | | | 1,768,925 | |
| | | | | | | | |
| | | | | | | 25,407,656 | |
| | | | | | | | |
| | | | Ireland — 0.3% | |
| | 17,301 | | | Kerry Group plc, Class A | | | 1,256,148 | |
| | | | | | | | |
| | | | Italy — 1.1% | |
| | 126,891 | | | Davide Campari-Milano SpA | | | 1,277,994 | |
| | 400,622 | | | Parmalat SpA | | | 1,058,123 | |
| | 266,815 | | | Snam SpA | | | 1,405,807 | |
| | 333,145 | | | Terna Rete Elettrica Nazionale SpA | | | 1,630,725 | |
| | | | | | | | |
| | | | | | | 5,372,649 | |
| | | | | | | | |
| | | | | | | | |
| SHARES | | | SECURITY DESCRIPTION | | VALUE($) | |
| | | | | | | | |
| | | | Japan — 26.8% | |
| | 87,800 | | | Alfresa Holdings Corp. | | | 1,855,564 | |
| | 294,000 | | | ANA Holdings, Inc. | | | 825,780 | |
| | 415,000 | | | Aozora Bank Ltd. | | | 1,371,185 | |
| | 65,400 | | | Brother Industries Ltd. | | | 1,200,042 | |
| | 27,000 | | | Calsonic Kansei Corp. | | | 338,380 | |
| | 50,600 | | | Canon Marketing Japan, Inc. | | | 873,901 | |
| | 59,900 | | | Canon, Inc. | | | 1,720,810 | |
| | 70,100 | | | Capcom Co., Ltd. | | | 1,810,904 | |
| | 7,500 | | | Central Japan Railway Co. | | | 1,275,346 | |
| | 100,300 | | | Chubu Electric Power Co., Inc. | | | 1,476,553 | |
| | 105,400 | | | Chugoku Electric Power Co., Inc. (The) | | | 1,233,330 | |
| | 82,200 | | | COMSYS Holdings Corp. | | | 1,447,090 | |
| | 194,900 | | | Concordia Financial Group Ltd. | | | 903,694 | |
| | 19,000 | | | Credit Saison Co., Ltd. | | | 328,455 | |
| | 98,500 | | | Daicel Corp. | | | 1,295,196 | |
| | 4,000 | | | Daito Trust Construction Co., Ltd. | | | 670,315 | |
| | 105,000 | | | Denka Co., Ltd. | | | 476,342 | |
| | 43,000 | | | DIC Corp. | | | 1,302,549 | |
| | 48,000 | | | Electric Power Development Co., Ltd. | | | 1,117,773 | |
| | 29,700 | | | FamilyMart UNY Holdings Co., Ltd. | | | 1,862,799 | |
| | 121,000 | | | Fuji Electric Co., Ltd. | | | 604,224 | |
| | 48,300 | | | FUJIFILM Holdings Corp. | | | 1,826,267 | |
| | 288,400 | | | Fujikura Ltd. | | | 1,694,496 | |
| | 29,000 | | | Fukuoka Financial Group, Inc. | | | 125,497 | |
| | 52,800 | | | Gree, Inc. (a) | | | 292,781 | |
| | 122,300 | | | Gunma Bank Ltd. (The) | | | 583,966 | |
| | 101,300 | | | Hachijuni Bank Ltd. (The) | | | 552,248 | |
| | 50,100 | | | Hankyu Hanshin Holdings, Inc. | | | 1,658,719 | |
| | 21,300 | | | Hikari Tsushin, Inc. | | | 1,955,245 | |
| | 12,300 | | | Hitachi Capital Corp. | | | 274,381 | |
| | 70,000 | | | Hitachi Chemical Co., Ltd. | | | 1,636,381 | |
| | 55,900 | | | Hitachi High-Technologies Corp. | | | 2,331,367 | |
| | 91,200 | | | Hokuriku Electric Power Co. | | | 1,035,896 | |
| | 81,100 | | | Idemitsu Kosan Co., Ltd. | | | 1,863,671 | |
| | 18,500 | | | Iida Group Holdings Co., Ltd. | | | 357,596 | |
| | 192,900 | | | Inpex Corp. | | | 1,799,519 | |
| | 43,900 | | | Itochu Techno-Solutions Corp. | | | 1,082,631 | |
| | 52,800 | | | Japan Airlines Co., Ltd. | | | 1,558,223 | |
| | 44,400 | | | Japan Petroleum Exploration Co., Ltd. | | | 971,471 | |
| | 473,900 | | | JX Holdings, Inc. | | | 1,872,456 | |
| | 16,000 | | | Kagome Co., Ltd. | | | 419,545 | |
| | 204,000 | | | Kaneka Corp. | | | 1,687,833 | |
| | 78,100 | | | Kansai Electric Power Co., Inc. (The) (a) | | | 746,657 | |
| | 729,000 | | | Kawasaki Kisen Kaisha Ltd. | | | 1,803,471 | |
| | 63,800 | | | KDDI Corp. | | | 1,939,085 | |
SEE NOTES TO FINANCIAL STATEMENTS.
| | | | | | |
| | | |
| 48 | | | | JPMORGAN EXCHANGE-TRADED FUNDS | | OCTOBER 31, 2016 |
| | | | | | | | |
| SHARES | | | SECURITY DESCRIPTION | | VALUE($) | |
| Common Stocks — continued | |
| | | | Japan — continued | |
| | 28,000 | | | Keio Corp. | | | 231,748 | |
| | 11,200 | | | Keisei Electric Railway Co., Ltd. | | | 270,032 | |
| | 120,800 | | | Konica Minolta, Inc. | | | 1,082,011 | |
| | 63,300 | | | Kuraray Co., Ltd. | | | 959,661 | |
| | 40,500 | | | Kyushu Electric Power Co., Inc. (a) | | | 368,006 | |
| | 50,300 | | | Leopalace21 Corp. | | | 327,040 | |
| | 35,800 | | | Lintec Corp. | | | 779,758 | |
| | 55,000 | | | Lion Corp. | | | 899,525 | |
| | 51,300 | | | Matsui Securities Co., Ltd. | | | 410,442 | |
| | 66,300 | | | Medipal Holdings Corp. | | | 1,132,816 | |
| | 25,600 | | | Miraca Holdings, Inc. | | | 1,235,870 | |
| | 76,700 | | | Mitsubishi Gas Chemical Co., Inc. | | | 1,180,469 | |
| | 93,100 | | | Mitsubishi Tanabe Pharma Corp. | | | 1,812,144 | |
| | 67,900 | | | Mitsubishi UFJ Lease & Finance Co., Ltd. | | | 328,716 | |
| | 677,800 | | | Mizuho Financial Group, Inc. | | | 1,141,248 | |
| | 25,200 | | | Mochida Pharmaceutical Co., Ltd. | | | 1,974,472 | |
| | 122,000 | | | Nagoya Railroad Co., Ltd. | | | 643,771 | |
| | 78,000 | | | NH Foods Ltd. | | | 1,869,162 | |
| | 4,600 | | | Nifco, Inc. | | | 264,922 | |
| | 71,000 | | | Nippo Corp. | | | 1,369,609 | |
| | 159,000 | | | Nippon Express Co., Ltd. | | | 785,372 | |
| | 68,800 | | | Nippon Paper Industries Co., Ltd. | | | 1,287,709 | |
| | 20,100 | | | Nippon Shokubai Co., Ltd. | | | 1,387,101 | |
| | 40,300 | | | Nippon Telegraph & Telephone Corp. | | | 1,786,775 | |
| | 149,000 | | | Nipro Corp. | | | 1,839,992 | |
| | 117,000 | | | Nisshin Seifun Group, Inc. | | | 1,723,438 | |
| | 22,400 | | | Nissin Foods Holdings Co., Ltd. | | | 1,296,489 | |
| | 39,800 | | | Nomura Real Estate Holdings, Inc. | | | 672,089 | |
| | 21,400 | | | Nomura Research Institute Ltd. | | | 742,247 | |
| | 70,600 | | | NTT DOCOMO, Inc. | | | 1,773,049 | |
| | 38,700 | | | NTT Urban Development Corp. | | | 355,776 | |
| | 8,200 | | | Oracle Corp. Japan | | | 446,267 | |
| | 491,000 | | | Osaka Gas Co., Ltd. | | | 2,042,168 | |
| | 7,100 | | | Otsuka Corp. | | | 337,805 | |
| | 387,800 | | | Resona Holdings, Inc. | | | 1,718,917 | |
| | 117,500 | | | Ricoh Co., Ltd. | | | 957,652 | |
| | 16,400 | | | Sankyo Co., Ltd. | | | 577,756 | |
| | 8,300 | | | Sapporo Holdings Ltd. | | | 234,481 | |
| | 9,900 | | | Sawai Pharmaceutical Co., Ltd. | | | 639,760 | |
| | 8,900 | | | SCSK Corp. | | | 331,996 | |
| | 108,300 | | | Sekisui House Ltd. | | | 1,789,519 | |
| | 18,300 | | | Seven Bank Ltd. | | | 56,258 | |
| | 17,900 | | | Shikoku Electric Power Co., Inc. | | | 168,324 | |
| | 43,400 | | | Shimachu Co., Ltd. | | | 1,164,547 | |
| | 12,500 | | | Shimamura Co., Ltd. | | | 1,600,181 | |
| | | | | | | | |
| SHARES | | | SECURITY DESCRIPTION | | VALUE($) | |
| | | | | | | | |
| | | | Japan — continued | |
| | 28,900 | | | Showa Denko K.K. | | | 381,864 | |
| | 179,500 | | | Showa Shell Sekiyu K.K. | | | 1,672,454 | |
| | 84,300 | | | SKY Perfect JSAT Holdings, Inc. | | | 417,752 | |
| | 31,500 | | | SoftBank Group Corp. | | | 1,983,905 | |
| | 705,600 | | | Sojitz Corp. | | | 1,851,689 | |
| | 16,700 | | | Square Enix Holdings Co., Ltd. | | | 552,425 | |
| | 366,000 | | | Sumitomo Osaka Cement Co., Ltd. | | | 1,515,868 | |
| | 22,200 | | | Suzuken Co., Ltd. | | | 713,032 | |
| | 219,000 | | | Taisei Corp. | | | 1,641,416 | |
| | 7,100 | | | Taisho Pharmaceutical Holdings Co., Ltd. | | | 692,600 | |
| | 36,000 | | | Takashimaya Co., Ltd. | | | 293,616 | |
| | 150,000 | | | Tobu Railway Co., Ltd. | | | 736,431 | |
| | 14,800 | | | Toho Co., Ltd. | | | 444,035 | |
| | 101,000 | | | Toho Gas Co., Ltd. | | | 936,608 | |
| | 114,400 | | | Tohoku Electric Power Co., Inc. | | | 1,401,613 | |
| | 252,600 | | | Tokyo Electric Power Holdings Co., Inc. (a) | | | 978,720 | |
| | 194,000 | | | TonenGeneral Sekiyu K.K. | | | 1,910,227 | |
| | 46,400 | | | Toyo Suisan Kaisha Ltd. | | | 1,879,841 | |
| | 36,800 | | | Toyota Industries Corp. | | | 1,688,508 | |
| | 54,600 | | | Tsumura & Co. | | | 1,551,677 | |
| | 784,000 | | | Ube Industries Ltd. | | | 1,617,854 | |
| | 83,700 | | | Yamada Denki Co., Ltd. | | | 432,644 | |
| | 47,000 | | | Yamaguchi Financial Group, Inc. | | | 518,143 | |
| | 29,300 | | | Yamaha Corp. | | | 1,046,872 | |
| | 68,300 | | | Yokohama Rubber Co., Ltd. (The) | | | 1,185,865 | |
| | | | | | | | |
| | | | | | | 126,102,383 | |
| | | | | | | | |
| | | | Luxembourg — 0.1% | |
| | 3,424 | | | RTL Group S.A. | | | 268,344 | |
| | | | | | | | |
| | | | Netherlands — 2.4% | | | | |
| | 20,452 | | | Boskalis Westminster | | | 659,612 | |
| | 20,294 | | | Heineken Holding NV | | | 1,561,464 | |
| | 60,062 | | | Koninklijke Ahold Delhaize NV | | | 1,370,166 | |
| | 30,379 | | | NN Group NV | | | 915,100 | |
| | 91,071 | | | RELX NV | | | 1,535,695 | |
| | 145,111 | | | Royal Dutch Shell plc, Class A | | | 3,614,300 | |
| | 42,026 | | | Wolters Kluwer NV | | | 1,625,164 | |
| | | | | | | | |
| | | | | | | 11,281,501 | |
| | | | | | | | |
| | | | New Zealand — 0.7% | |
| | 191,215 | | | Fletcher Building Ltd. | | | 1,416,530 | |
| | 740,245 | | | Spark New Zealand Ltd. | | | 1,936,021 | |
| | | | | | | | |
| | | | | | | 3,352,551 | |
| | | | | | | | |
| | | | Norway — 1.0% | |
| | 90,372 | | | Marine Harvest ASA | | | 1,639,916 | |
| | 111,147 | | | Norsk Hydro ASA | | | 496,909 | |
SEE NOTES TO FINANCIAL STATEMENTS.
| | | | | | | | |
| | | |
| OCTOBER 31, 2016 | | JPMORGAN EXCHANGE-TRADED FUNDS | | | | | 49 | |
JPMorgan Diversified Return International Equity ETF
SCHEDULE OF PORTFOLIO INVESTMENTS
AS OF OCTOBER 31, 2016 (continued)
| | | | | | | | |
| SHARES | | | SECURITY DESCRIPTION | | VALUE($) | |
| Common Stocks — continued | |
| | | | Norway — continued | |
| | 65,972 | | | Orkla ASA | | | 622,936 | |
| | 53,015 | | | Telenor ASA | | | 843,196 | |
| | 34,601 | | | Yara International ASA | | | 1,222,255 | |
| | | | | | | | |
| | | | | | | 4,825,212 | |
| | | | | | | | |
| | | | Portugal — 0.6% | |
| | 417,379 | | | EDP — Energias de Portugal S.A. | | | 1,379,553 | |
| | 94,800 | | | Galp Energia SGPS S.A. | | | 1,285,331 | |
| | | | | | | | |
| | | | | | | 2,664,884 | |
| | | | | | | | |
| | | | Singapore — 2.8% | |
| | 233,900 | | | Ascendas Real Estate Investment Trust REIT | | | 398,600 | |
| | 878,600 | | | CapitaLand Mall Trust REIT | | | 1,309,239 | |
| | 290,100 | | | ComfortDelGro Corp., Ltd. | | | 528,915 | |
| | 4,332,600 | | | Golden Agri-Resources Ltd. | | | 1,196,361 | |
| | 1,584,800 | | | Hutchison Port Holdings Trust, Class U | | | 703,985 | |
| | 348,100 | | | Keppel Corp., Ltd. | | | 1,316,391 | |
| | 419,800 | | | Sembcorp Industries Ltd. | | | 760,181 | |
| | 470,000 | | | Singapore Press Holdings Ltd. | | | 1,256,023 | |
| | 684,200 | | | Singapore Telecommunications Ltd. | | | 1,906,816 | |
| | 317,900 | | | StarHub Ltd. | | | 771,678 | |
| | 465,000 | | | Suntec REIT | | | 561,628 | |
| | 108,100 | | | Venture Corp., Ltd. | | | 738,452 | |
| | 722,700 | | | Wilmar International Ltd. | | | 1,715,774 | |
| | | | | | | | |
| | | | | | | 13,164,043 | |
| | | | | | | | |
| | | | South Korea — 9.4% | |
| | 4,085 | | | Celltrion, Inc. (a) | | | 378,456 | |
| | 3,189 | | | CJ CheilJedang Corp. | | | 972,887 | |
| | 5,655 | | | CJ Corp. | | | 860,942 | |
| | 29,505 | | | GS Holdings Corp. | | | 1,312,635 | |
| | 4,740 | | | Hankook Tire Co., Ltd. | | | 227,620 | |
| | 13,141 | | | Hanmi Science Co., Ltd. | | | 871,680 | |
| | 36,275 | | | Hanwha Chemical Corp. | | | 854,081 | |
| | 4,816 | | | Hanwha Techwin Co., Ltd. | | | 267,512 | |
| | 5,160 | | | Hyosung Corp. | | | 602,765 | |
| | 5,303 | | | Hyundai Department Store Co., Ltd. | | | 544,030 | |
| | 32,827 | | | Hyundai Steel Co. | | | 1,414,512 | |
| | 94,765 | | | Industrial Bank of Korea | | | 1,090,849 | |
| | 12,262 | | | Kakao Corp. | | | 817,636 | |
| | 34,131 | | | Kangwon Land, Inc. | | | 1,131,162 | |
| | 38,458 | | | Korea Electric Power Corp. | | | 1,663,719 | |
| | 32,001 | | | Korea Gas Corp. | | | 1,293,442 | |
| | 3,097 | | | Korea Zinc Co., Ltd. | | | 1,229,723 | |
| | 4,123 | | | Korean Air Lines Co., Ltd. (a) | | | 115,251 | |
| | 69,392 | | | KT Corp. | | | 1,957,528 | |
| | 16,996 | | | KT&G Corp. | | | 1,676,319 | |
| | | | | | | | |
| SHARES | | | SECURITY DESCRIPTION | | VALUE($) | |
| | | | | | | | |
| | | | South Korea — continued | |
| | 20,922 | | | LG Corp. | | | 1,118,829 | |
| | 68,241 | | | LG Display Co., Ltd. | | | 1,631,617 | |
| | 174,306 | | | LG Uplus Corp. | | | 1,796,434 | |
| | 2,969 | | | Lotte Chemical Corp. | | | 745,969 | |
| | 3,051 | | | Lotte Shopping Co., Ltd. | | | 608,750 | |
| | 2,380 | | | Mando Corp. | | | 556,462 | |
| | 2,594 | | | NAVER Corp. | | | 1,940,741 | |
| | 9,908 | | | POSCO | | | 2,061,583 | |
| | 1,860 | | | Samsung Electronics Co., Ltd. | | | 2,660,411 | |
| | 1,815 | | | Samsung SDS Co., Ltd. | | | 244,751 | |
| | 3,525 | | | Shinsegae, Inc. | | | 572,552 | |
| | 9,447 | | | SK Holdings Co., Ltd. | | | 1,842,922 | |
| | 56,677 | | | SK Hynix, Inc. | | | 2,027,145 | |
| | 11,703 | | | SK Innovation Co., Ltd. | | | 1,540,517 | |
| | 57,722 | | | SK Networks Co., Ltd. | | | 328,053 | |
| | 8,656 | | | SK Telecom Co., Ltd. | | | 1,696,852 | |
| | 28,661 | | | SKC Co., Ltd. | | | 676,155 | |
| | 21,264 | | | S-Oil Corp. | | | 1,453,133 | |
| | 75,974 | | | Woori Bank | | | 827,975 | |
| | 3,380 | | | Yuhan Corp. | | | 619,724 | |
| | | | | | | | |
| | | | | | | 44,233,324 | |
| | | | | | | | |
| | | | Spain — 2.3% | |
| | 5,550 | | | Acciona S.A. | | | 421,765 | |
| | 74,070 | | | Acerinox S.A. | | | 911,494 | |
| | 3,854 | | | Corp. Financiera Alba S.A. | | | 168,929 | |
| | 53,194 | | | Enagas S.A. | | | 1,524,811 | |
| | 79,942 | | | Endesa S.A. | | | 1,696,828 | |
| | 67,231 | | | Ferrovial S.A. | | | 1,306,160 | |
| | 61,786 | | | Gamesa Corp. Tecnologica S.A. | | | 1,426,548 | |
| | 71,988 | | | Gas Natural SDG S.A. | | | 1,417,041 | |
| | 225,142 | | | Iberdrola S.A. | | | 1,532,200 | |
| | 31,041 | | | Red Electrica Corp. S.A. | | | 646,664 | |
| | | | | | | | |
| | | | | | | 11,052,440 | |
| | | | | | | | |
| | | | Sweden — 2.7% | | | | |
| | 83,864 | | | Boliden AB | | | 1,943,671 | |
| | 29,351 | | | Hexagon AB, Class B | | | 1,027,053 | |
| | 48,028 | | | Investor AB, Class B | | | 1,705,588 | |
| | 106,815 | | | Securitas AB, Class B | | | 1,648,570 | |
| | 67,813 | | | Skanska AB, Class B | | | 1,472,666 | |
| | 30,936 | | | Svenska Cellulosa AB SCA, Class B | | | 876,195 | |
| | 13,540 | | | Swedish Match AB | | | 471,194 | |
| | 166,197 | | | Tele2 AB, Class B | | | 1,372,377 | |
| | 119,896 | | | Telefonaktiebolaget LM Ericsson, Class B | | | 581,599 | |
| | 286,792 | | | TeliaSonera AB | | | 1,145,691 | |
SEE NOTES TO FINANCIAL STATEMENTS.
| | | | | | |
| | | |
| 50 | | | | JPMORGAN EXCHANGE-TRADED FUNDS | | OCTOBER 31, 2016 |
| | | | | | | | |
| SHARES | | | SECURITY DESCRIPTION | | VALUE($) | |
| Common Stocks — continued | |
| | | | Sweden — continued | | | | |
| | 36,775 | | | Trelleborg AB, Class B | | | 641,904 | |
| | | | | | | | |
| | | | | | | 12,886,508 | |
| | | | | | | | |
| | | | Switzerland — 2.0% | | | | |
| | 12,434 | | | Baloise Holding AG | | | 1,529,749 | |
| | 1 | | | Chocoladefabriken Lindt & Spruengli AG | | | 62,048 | |
| | 58,755 | | | Clariant AG | | | 972,951 | |
| | 53,525 | | | Coca-Cola HBC AG | | | 1,155,069 | |
| | 481 | | | EMS-Chemie Holding AG | | | 241,436 | |
| | 2,811 | | | Kuehne & Nagel International AG | | | 381,009 | |
| | 8,254 | | | Lonza Group AG | | | 1,557,544 | |
| | 10,435 | | | Sonova Holding AG | | | 1,399,468 | |
| | 3,192 | | | Swiss Prime Site AG | | | 264,742 | |
| | 3,709 | | | Swiss Re AG | | | 344,239 | |
| | 3,226 | | | Swisscom AG | | | 1,474,679 | |
| | | | | | | | |
| | | | | | | 9,382,934 | |
| | | | | | | | |
| | | | United Kingdom — 19.3% | | | | |
| | 66,313 | | | Admiral Group plc | | | 1,553,665 | |
| | 221,791 | | | Antofagasta plc | | | 1,475,152 | |
| | 46,495 | | | AstraZeneca plc | | | 2,603,502 | |
| | 119,192 | | | Babcock International Group plc | | | 1,440,779 | |
| | 214,784 | | | BAE Systems plc | | | 1,423,112 | |
| | 109,687 | | | Barratt Developments plc | | | 608,264 | |
| | 9,285 | | | Bellway plc | | | 268,693 | |
| | 45,225 | | | Berkeley Group Holdings plc | | | 1,304,358 | |
| | 623,038 | | | BP plc | | | 3,683,233 | |
| | 32,718 | | | British American Tobacco plc | | | 1,875,173 | |
| | 82,093 | | | British Land Co., plc (The) REIT | | | 587,739 | |
| | 488,105 | | | BT Group plc, Class A | | | 2,240,431 | |
| | 63,962 | | | Bunzl plc | | | 1,717,216 | |
| | 43,089 | | | Carnival plc | | | 2,078,315 | |
| | 748,166 | | | Centrica plc | | | 1,959,646 | |
| | 27,507 | | | Croda International plc | | | 1,176,336 | |
| | 11,986 | | | Diageo plc | | | 319,027 | |
| | 170,616 | | | Direct Line Insurance Group plc | | | 721,806 | |
| | 60,982 | | | DS Smith plc | | | 297,361 | |
| | 84,395 | | | easyJet plc | | | 967,808 | |
| | 354,082 | | | GKN plc | | | 1,380,863 | |
| | 166,346 | | | GlaxoSmithKline plc | | | 3,286,066 | |
| | 32,676 | | | Halma plc | | | 418,317 | |
| | 231,208 | | | Hammerson plc REIT | | | 1,555,463 | |
| | 46,540 | | | Hikma Pharmaceuticals plc | | | 998,209 | |
| | 65,228 | | | IMI plc | | | 792,295 | |
| | 47,789 | | | Imperial Brands plc | | | 2,311,652 | |
| | 81,013 | | | Inchcape plc | | | 644,114 | |
| | | | | | | | |
| SHARES | | | SECURITY DESCRIPTION | | VALUE($) | |
| | | | | | | | |
| | | | United Kingdom — continued | | | | |
| | 86,497 | | | Informa plc | | | 711,622 | |
| | 168,422 | | | Inmarsat plc | | | 1,444,739 | |
| | 29,359 | | | InterContinental Hotels Group plc | | | 1,138,213 | |
| | 287,480 | | | Intu Properties plc REIT | | | 968,877 | |
| | 131,305 | | | John Wood Group plc | | | 1,234,163 | |
| | 49,061 | | | Johnson Matthey plc | | | 2,045,027 | |
| | 155,545 | | | Land Securities Group plc REIT | | | 1,899,306 | |
| | 35,994 | | | Mediclinic International plc | | | 399,110 | |
| | 198,921 | | | Meggitt plc | | | 1,058,255 | |
| | 160,844 | | | Merlin Entertainments plc (f) | | | 906,490 | |
| | 41,871 | | | Micro Focus International plc | | | 1,096,419 | |
| | 99,183 | | | Mondi plc | | | 1,935,617 | |
| | 173,898 | | | National Grid plc | | | 2,262,036 | |
| | 76,874 | | | Pennon Group plc | | | 784,558 | |
| | 42,875 | | | Persimmon plc | | | 887,510 | |
| | 145,506 | | | Petrofac Ltd. | | | 1,433,027 | |
| | 1,626 | | | Randgold Resources Ltd. | | | 144,400 | |
| | 26,138 | | | Reckitt Benckiser Group plc | | | 2,338,329 | |
| | 119,170 | | | RELX plc | | | 2,127,210 | |
| | 182,160 | | | Rentokil Initial plc | | | 508,105 | |
| | 187,917 | | | Royal Mail plc | | | 1,127,412 | |
| | 207,043 | | | Sage Group plc (The) | | | 1,826,741 | |
| | 204,455 | | | Segro plc REIT | | | 1,095,078 | |
| | 60,665 | | | Severn Trent plc | | | 1,726,907 | |
| | 37,994 | | | Shire plc | | | 2,145,253 | |
| | 103,058 | | | Sky plc | | | 1,030,301 | |
| | 135,745 | | | Smith & Nephew plc | | | 1,962,386 | |
| | 109,726 | | | Smiths Group plc | | | 1,901,359 | |
| | 112,175 | | | SSE plc | | | 2,181,033 | |
| | 72,195 | | | Tate & Lyle plc | | | 688,524 | |
| | 62,081 | | | Travis Perkins plc | | | 1,010,028 | |
| | 50,700 | | | Unilever plc | | | 2,116,693 | |
| | 155,576 | | | United Utilities Group plc | | | 1,788,333 | |
| | 978,761 | | | Vodafone Group plc | | | 2,688,009 | |
| | 3,192 | | | Whitbread plc | | | 141,008 | |
| | 103,440 | | | WPP plc | | | 2,246,008 | |
| | | | | | | | |
| | | | | | | 90,686,681 | |
| | | | | | | | |
| | | | Total Common Stocks
(Cost $462,333,365) | | | 467,702,815 | |
| | | | | | | | |
| | |
NUMBER OF
RIGHTS | | | | | | |
| Rights — 0.0% (e) | |
| | | | Spain — 0.0% (e) | | | | |
| | 67,231 | | | Ferrovial S.A. (a) | | | 28,783 | |
| | | | | | | | |
SEE NOTES TO FINANCIAL STATEMENTS.
| | | | | | | | |
| | | |
| OCTOBER 31, 2016 | | JPMORGAN EXCHANGE-TRADED FUNDS | | | | | 51 | |
JPMorgan Diversified Return International Equity ETF
SCHEDULE OF PORTFOLIO INVESTMENTS
AS OF OCTOBER 31, 2016 (continued)
| | | | | | | | |
NUMBER OF
RIGHTS | | | SECURITY DESCRIPTION | | VALUE($) | |
| Rights — continued | |
| | | | Sweden — 0.0% (e) | | | | |
| | 166,197 | | | Tele2 AB (a) | | | 49,797 | |
| | | | | | | | |
| | | | Total Rights (Cost $—) | | | 78,580 | |
| | | | | | | | |
| | |
| SHARES | | | | | | |
| Short-Term Investment — 0.3% | |
| | | | Investment Company — 0.3% | | | | |
| | 1,161,468 | | | JPMorgan U.S. Government Money Market Fund, Institutional Class Shares, 0.290% (b) (d) (Cost $1,161,468) | | | 1,161,468 | |
| | | | | | | | |
| | | | Total Investments — 99.8%
(Cost $463,494,833) | | | 468,942,863 | |
| | | | Other Assets in Excess of Liabilities — 0.2% | | | 1,099,853 | |
| | | | | | | | |
| | | | NET ASSETS — 100.0% | | $ | 470,042,716 | |
| | | | | | | | |
Percentages indicated are based on net assets.
Summary of Investments by Industry, October 31, 2016
The following table represents the portfolio investments of the Fund by industry classifications as a percentage of total investments:
| | | | |
| INDUSTRY | | PERCENTAGE | |
Oil, Gas & Consumable Fuels | | | 7.3 | % |
Chemicals | | | 5.8 | |
Diversified Telecommunication Services | | | 5.6 | |
Electric Utilities | | | 5.3 | |
Pharmaceuticals | | | 3.9 | |
Food Products | | | 3.6 | |
Real Estate Investment Trusts (REITs) | | | 3.3 | |
Health Care Providers & Services | | | 2.9 | |
Wireless Telecommunication Services | | | 2.6 | |
Gas Utilities | | | 2.6 | |
Metals & Mining | | | 2.4 | |
Health Care Equipment & Supplies | | | 2.4 | |
Media | | | 2.3 | |
Industrial Conglomerates | | | 2.1 | |
Construction & Engineering | | | 2.1 | |
Banks | | | 2.0 | |
Technology Hardware, Storage & Peripherals | | | 2.0 | |
Hotels, Restaurants & Leisure | | | 2.0 | |
Insurance | | | 2.0 | |
Software | | | 1.8 | |
Road & Rail | | | 1.8 | |
IT Services | | | 1.6 | |
Electronic Equipment, Instruments & Components | | | 1.6 | |
Semiconductors & Semiconductor Equipment | | | 1.6 | |
Multi-Utilities | | | 1.5 | |
Auto Components | | | 1.5 | |
Household Durables | | | 1.4 | |
Food & Staples Retailing | | | 1.3 | |
Trading Companies & Distributors | | | 1.3 | |
Transportation Infrastructure | | | 1.2 | |
Aerospace & Defense | | | 1.2 | |
Electrical Equipment | | | 1.1 | |
Specialty Retail | | | 1.1 | |
Real Estate Management & Development | | | 1.1 | |
Commercial Services & Supplies | | | 1.0 | |
Others (each less than 1.0%) | | | 15.7 | |
SEE NOTES TO FINANCIAL STATEMENTS.
| | | | | | |
| | | |
| 52 | | | | JPMORGAN EXCHANGE-TRADED FUNDS | | OCTOBER 31, 2016 |
JPMorgan Diversified Return U.S. Equity ETF
SCHEDULE OF PORTFOLIO INVESTMENTS
AS OF OCTOBER 31, 2016
| | | | | | | | |
| SHARES | | | SECURITY DESCRIPTION | | VALUE($) | |
| Common Stocks — 98.7% | |
| | | | Consumer Discretionary — 16.1% | |
| | | | Auto Components — 0.9% | | | | |
| | 351 | | | Adient plc (Ireland) (a) | | | 15,960 | |
| | 3,137 | | | Delphi Automotive plc (Jersey) | | | 204,125 | |
| | 22,020 | | | Gentex Corp. | | | 372,358 | |
| | 2,783 | | | Goodyear Tire & Rubber Co. (The) | | | 80,791 | |
| | 3,821 | | | Lear Corp. | | | 469,142 | |
| | | | | | | | |
| | | | | | | 1,142,376 | |
| | | | | | | | |
| | | | Automobiles — 0.6% | |
| | 17,277 | | | Ford Motor Co. | | | 202,832 | |
| | 6,546 | | | General Motors Co. | | | 206,854 | |
| | 6,413 | | | Harley-Davidson, Inc. | | | 365,669 | |
| | | | | | | | |
| | | | | | | 775,355 | |
| | | | | | | | |
| | | | Distributors — 0.5% | |
| | 7,371 | | | Genuine Parts Co. | | | 667,739 | |
| | | | | | | | |
| | | | Diversified Consumer Services — 0.1% | |
| | 19 | | | Graham Holdings Co., Class B | | | 9,025 | |
| | 6,326 | | | H&R Block, Inc. | | | 145,308 | |
| | | | | | | | |
| | | | | | | 154,333 | |
| | | | | | | | |
| | | | Hotels, Restaurants & Leisure — 2.5% | |
| | 5,365 | | | Carnival Corp. (Panama) | | | 263,421 | |
| | 2,681 | | | Darden Restaurants, Inc. | | | 173,702 | |
| | 1,432 | | | Domino’s Pizza, Inc. | | | 242,352 | |
| | 3,655 | | | Dunkin’ Brands Group, Inc. | | | 176,756 | |
| | 6,656 | | | Hilton Worldwide Holdings, Inc. | | | 150,426 | |
| | 6,788 | | | International Game Technology plc (United Kingdom) | | | 194,951 | |
| | 2,670 | | | Las Vegas Sands Corp. | | | 154,540 | |
| | 3,400 | | | McDonald’s Corp. | | | 382,738 | |
| | 3,866 | | | Norwegian Cruise Line Holdings Ltd. (Bermuda) (a) | | | 150,271 | |
| | 1,107 | | | Panera Bread Co., Class A (a) | | | 211,171 | |
| | 1,925 | | | Royal Caribbean Cruises Ltd. (Liberia) | | | 147,975 | |
| | 4,209 | | | Speedway Motorsports, Inc. | | | 79,171 | |
| | 6,719 | | | Starbucks Corp. | | | 356,577 | |
| | 2,832 | | | Wyndham Worldwide Corp. | | | 186,459 | |
| | 3,100 | | | Yum! Brands, Inc. | | | 267,468 | |
| | | | | | | | |
| | | | | | | 3,137,978 | |
| | | | | | | | |
| | | | Household Durables — 2.1% | |
| | 9,468 | | | DR Horton, Inc. | | | 272,962 | |
| | 4,032 | | | Garmin Ltd. (Switzerland) | | | 194,988 | |
| | 10,670 | | | Leggett & Platt, Inc. | | | 489,540 | |
| | 5,308 | | | Lennar Corp., Class A | | | 221,290 | |
| | 1,474 | | | Mohawk Industries, Inc. (a) | | | 271,658 | |
| | 7,234 | | | Newell Rubbermaid, Inc. | | | 347,377 | |
| | | | | | | | |
| SHARES | | | SECURITY DESCRIPTION | | VALUE($) | |
| | | | | | | | |
| | | | Household Durables — continued | |
| | 299 | | | NVR, Inc. (a) | | | 455,377 | |
| | 11,437 | | | PulteGroup, Inc. | | | 212,728 | |
| | 1,323 | | | Whirlpool Corp. | | | 198,212 | |
| | | | | | | | |
| | | | | | | 2,664,132 | |
| | | | | | | | |
| | | | Internet & Direct Marketing Retail — 0.6% | |
| | 280 | | | Amazon.com, Inc. (a) | | | 221,149 | |
| | 1,642 | | | Expedia, Inc. | | | 212,196 | |
| | 8,077 | | | Liberty Interactive Corp., Class A (a) | | | 149,344 | |
| | 136 | | | Priceline Group, Inc. (The) (a) | | | 200,495 | |
| | | | | | | | |
| | | | | | | 783,184 | |
| | | | | | | | |
| | | | Leisure Products — 0.8% | |
| | 6,899 | | | Hasbro, Inc. | | | 575,446 | |
| | 8,182 | | | Mattel, Inc. | | | 257,978 | |
| | 1,688 | | | Polaris Industries, Inc. | | | 129,318 | |
| | | | | | | | |
| | | | | | | 962,742 | |
| | | | | | | | |
| | | | Media — 3.0% | |
| | 19 | | | Cable One, Inc. | | | 10,958 | |
| | 3,106 | | | CBS Corp. (Non-Voting), Class B | | | 175,862 | |
| | 6,375 | | | Comcast Corp., Class A | | | 394,103 | |
| | 2,905 | | | Discovery Communications, Inc., Class A (a) | | | 75,850 | |
| | 6,012 | | | EW Scripps Co. (The), Class A (a) | | | 79,719 | |
| | 15,583 | | | Interpublic Group of Cos., Inc. (The) | | | 348,903 | |
| | 596 | | | John Wiley & Sons, Inc., Class A | | | 30,754 | |
| | 2,042 | | | Liberty SiriusXM Group, Class A (a) | | | 67,937 | |
| | 4,580 | | | Omnicom Group, Inc. | | | 365,576 | |
| | 2,093 | | | Scripps Networks Interactive, Inc., Class A | | | 134,706 | |
| | 87,526 | | | Sirius XM Holdings, Inc. | | | 364,983 | |
| | 12,081 | | | Starz (a) | | | 380,068 | |
| | 6,110 | | | TEGNA, Inc. | | | 119,878 | |
| | 2,298 | | | Time Warner, Inc. | | | 204,499 | |
| | 12,750 | | | Twenty-First Century Fox, Inc. | | | 336,473 | |
| | 7,401 | | | Twenty-First Century Fox, Inc., Class A | | | 194,424 | |
| | 2,427 | | | Viacom, Inc., Class B | | | 91,158 | |
| | 3,405 | | | Walt Disney Co. (The) | | | 315,609 | |
| | | | | | | | |
| | | | | | | 3,691,460 | |
| | | | | | | | |
| | | | Multiline Retail — 1.0% | |
| | 1,723 | | | Dillard’s, Inc., Class A | | | 105,620 | |
| | 3,209 | | | Dollar General Corp. | | | 221,710 | |
| | 2,419 | | | Dollar Tree, Inc. (a) | | | 182,755 | |
| | 2,969 | | | Kohl’s Corp. | | | 129,894 | |
| | 3,617 | | | Macy’s, Inc. | | | 131,984 | |
| | 2,575 | | | Nordstrom, Inc. | | | 133,900 | |
| | 4,294 | | | Target Corp. | | | 295,127 | |
| | | | | | | | |
| | | | | | | 1,200,990 | |
| | | | | | | | |
SEE NOTES TO FINANCIAL STATEMENTS.
| | | | | | | | |
| | | |
| OCTOBER 31, 2016 | | JPMORGAN EXCHANGE-TRADED FUNDS | | | | | 53 | |
JPMorgan Diversified Return U.S. Equity ETF
SCHEDULE OF PORTFOLIO INVESTMENTS
AS OF OCTOBER 31, 2016 (continued)
| | | | | | | | |
| SHARES | | | SECURITY DESCRIPTION | | VALUE($) | |
| Common Stocks — continued | |
| | | | Specialty Retail — 3.0% | |
| | 1,116 | | | Advance Auto Parts, Inc. | | | 156,329 | |
| | 3,335 | | | AutoNation, Inc. (a) | | | 146,306 | |
| | 216 | | | AutoZone, Inc. (a) | | | 160,307 | |
| | 2,670 | | | Best Buy Co., Inc. | | | 103,890 | |
| | 2,777 | | | Dick’s Sporting Goods, Inc. | | | 154,540 | |
| | 3,634 | | | Foot Locker, Inc. | | | 242,642 | |
| | 3,790 | | | Gap, Inc. (The) | | | 104,566 | |
| | 3,783 | | | Home Depot, Inc. (The) | | | 461,564 | |
| | 3,257 | | | L Brands, Inc. | | | 235,123 | |
| | 5,877 | | | Lowe’s Cos., Inc. | | | 391,702 | |
| | 1,213 | | | O’Reilly Automotive, Inc. (a) | | | 320,766 | |
| | 5,026 | | | Ross Stores, Inc. | | | 314,326 | |
| | 694 | | | Signet Jewelers Ltd. (Bermuda) | | | 56,394 | |
| | 1,897 | | | Tiffany & Co. | | | 139,278 | |
| | 5,679 | | | TJX Co., Inc. (The) | | | 418,826 | |
| | 759 | | | Ulta Salon Cosmetics & Fragrance, Inc. (a) | | | 184,695 | |
| | 1,460 | | | Urban Outfitters, Inc. (a) | | | 48,837 | |
| | 2,930 | | | Williams-Sonoma, Inc. | | | 135,425 | |
| | | | | | | | |
| | | | | | | 3,775,516 | |
| | | | | | | | |
| | | | Textiles, Apparel & Luxury Goods — 1.0% | |
| | 6,335 | | | Coach, Inc. | | | 227,363 | |
| | 6,040 | | | Hanesbrands, Inc. | | | 155,228 | |
| | 2,172 | | | lululemon athletica, Inc. (a) | | | 124,347 | |
| | 3,033 | | | Michael Kors Holdings Ltd. (British Virgin Islands) (a) | | | 154,016 | |
| | 6,576 | | | NIKE, Inc., Class B | | | 329,984 | |
| | 4,601 | | | V.F. Corp. | | | 249,420 | |
| | | | | | | | |
| | | | | | | 1,240,358 | |
| | | | | | | | |
| | | | Total Consumer Discretionary | | | 20,196,163 | |
| | | | | | | | |
| | | | Consumer Staples — 12.1% | |
| | | | Beverages — 2.5% | |
| | 9,006 | | | Brown-Forman Corp., Class B | | | 415,807 | |
| | 14,069 | | | Coca-Cola Co. (The) | | | 596,526 | |
| | 2,709 | | | Constellation Brands, Inc., Class A | | | 452,728 | |
| | 6,390 | | | Dr. Pepper Snapple Group, Inc. | | | 560,978 | |
| | 2,985 | | | Molson Coors Brewing Co., Class B | | | 309,873 | |
| | 1,463 | | | Monster Beverage Corp. (a) | | | 211,169 | |
| | 5,143 | | | PepsiCo, Inc. | | | 551,330 | |
| | | | | | | | |
| | | | | | | 3,098,411 | |
| | | | | | | | |
| | | | Food & Staples Retailing — 1.6% | |
| | 3,900 | | | Costco Wholesale Corp. | | | 576,693 | |
| | 4,089 | | | CVS Health Corp. | | | 343,885 | |
| | 5,284 | | | Kroger Co. (The) | | | 163,699 | |
| | 7,948 | | | Sysco Corp. | | | 382,458 | |
| | | | | | | | |
| SHARES | | | SECURITY DESCRIPTION | | VALUE($) | |
| | | | | | | | |
| | | | Food & Staples Retailing — continued | |
| | 2,151 | | | Walgreens Boots Alliance, Inc. | | | 177,952 | |
| | 4,464 | | | Wal-Mart Stores, Inc. | | | 312,569 | |
| | 1,478 | | | Weis Markets, Inc. | | | 82,221 | |
| | | | | | | | |
| | | | | | | 2,039,477 | |
| | | | | | | | |
| | | | Food Products — 4.3% | |
| | 419 | | | Bunge Ltd. (Bermuda) | | | 25,982 | |
| | 11,684 | | | Campbell Soup Co. | | | 634,909 | |
| | 2,658 | | | ConAgra Foods, Inc. | | | 128,062 | |
| | 8,735 | | | General Mills, Inc. | | | 541,395 | |
| | 6,659 | | | Hershey Co. (The) | | | 682,281 | |
| | 15,851 | | | Hormel Foods Corp. | | | 610,264 | |
| | 3,633 | | | JM Smucker Co. (The) | | | 477,049 | |
| | 6,355 | | | Kellogg Co. | | | 477,451 | |
| | 4,516 | | | Kraft Heinz Co. (The) | | | 401,698 | |
| | 7,133 | | | McCormick & Co., Inc. (Non-Voting) | | | 683,841 | |
| | 1,772 | | | Mead Johnson Nutrition Co., Class A | | | 132,493 | |
| | 7,660 | | | Mondelez International, Inc., Class A | | | 344,240 | |
| | 3,776 | | | Tyson Foods, Inc., Class A | | | 267,530 | |
| | | | | | | | |
| | | | | | | 5,407,195 | |
| | | | | | | | |
| | | | Household Products — 1.9% | |
| | 4,081 | | | Church & Dwight Co., Inc. | | | 196,949 | |
| | 5,623 | | | Clorox Co. (The) | | | 674,872 | |
| | 7,268 | | | Colgate-Palmolive Co. | | | 518,644 | |
| | 1,611 | | | Energizer Holdings, Inc. | | | 74,928 | |
| | 3,797 | | | Kimberly-Clark Corp. | | | 434,415 | |
| | 5,565 | | | Procter & Gamble Co. (The) | | | 483,042 | |
| | | | | | | | |
| | | | | | | 2,382,850 | |
| | | | | | | | |
| | | | Personal Products — 0.7% | |
| | 2,458 | | | Coty, Inc., Class A | | | 56,510 | |
| | 3,930 | | | Edgewell Personal Care Co. (a) | | | 296,322 | |
| | 4,585 | | | Estee Lauder Cos., Inc. (The), Class A | | | 399,491 | |
| | 2,659 | | | Nu Skin Enterprises, Inc., Class A | | | 163,927 | |
| | | | | | | | |
| | | | | | | 916,250 | |
| | | | | | | | |
| | | | Tobacco — 1.1% | |
| | 6,622 | | | Altria Group, Inc. | | | 437,847 | |
| | 4,349 | | | Philip Morris International, Inc. | | | 419,417 | |
| | 8,180 | | | Reynolds American, Inc. | | | 450,554 | |
| | | | | | | | |
| | | | | | | 1,307,818 | |
| | | | | | | | |
| | | | Total Consumer Staples | | | 15,152,001 | |
| | | | | | | | |
| | | | Energy — 4.2% | |
| | | | Energy Equipment & Services — 1.3% | |
| | 2,398 | | | Baker Hughes, Inc. | | | 132,849 | |
SEE NOTES TO FINANCIAL STATEMENTS.
| | | | | | |
| | | |
| 54 | | | | JPMORGAN EXCHANGE-TRADED FUNDS | | OCTOBER 31, 2016 |
| | | | | | | | |
| SHARES | | | SECURITY DESCRIPTION | | VALUE($) | |
| Common Stocks — continued | |
| | | | Energy Equipment & Services — continued | |
| | 3,350 | | | Diamond Offshore Drilling, Inc. | | | 55,242 | |
| | 3,997 | | | FMC Technologies, Inc. (a) | | | 128,983 | |
| | 2,708 | | | Halliburton Co. | | | 124,568 | |
| | 2,038 | | | Helmerich & Payne, Inc. | | | 128,618 | |
| | 12,035 | | | Nabors Industries Ltd. (Bermuda) | | | 143,217 | |
| | 7,135 | | | National Oilwell Varco, Inc. | | | 229,033 | |
| | 3,248 | | | Oceaneering International, Inc. | | | 77,302 | |
| | 3,882 | | | Patterson-UTI Energy, Inc. | | | 87,267 | |
| | 4,968 | | | Schlumberger Ltd. (Curacao) | | | 388,647 | |
| | 924 | | | Superior Energy Services, Inc. | | | 13,084 | |
| | 11,262 | | | Transocean Ltd. (Switzerland) | | | 108,228 | |
| | | | | | | | |
| | | | | | | 1,617,038 | |
| | | | | | | | |
| | | | Oil, Gas & Consumable Fuels — 2.9% | |
| | 7,400 | | | Chesapeake Energy Corp. (a) | | | 40,774 | |
| | 2,793 | | | Chevron Corp. | | | 292,567 | |
| | 3,099 | | | ConocoPhillips | | | 134,652 | |
| | 4,855 | | | Exxon Mobil Corp. | | | 404,519 | |
| | 1,132 | | | Gulfport Energy Corp. (a) | | | 27,292 | |
| | 3,168 | | | Hess Corp. | | | 151,969 | |
| | 5,393 | | | HollyFrontier Corp. | | | 134,555 | |
| | 6,286 | | | Kinder Morgan, Inc. | | | 128,423 | |
| | 5,053 | | | Marathon Oil Corp. | | | 66,599 | |
| | 4,010 | | | Marathon Petroleum Corp. | | | 174,796 | |
| | 3,907 | | | Murphy Oil Corp. | | | 101,074 | |
| | 3,060 | | | Noble Energy, Inc. | | | 105,478 | |
| | 5,521 | | | Occidental Petroleum Corp. | | | 402,536 | |
| | 6,823 | | | ONEOK, Inc. | | | 330,438 | |
| | 2,585 | | | Parsley Energy, Inc., Class A (a) | | | 85,046 | |
| | 1,798 | | | Phillips 66 | | | 145,908 | |
| | 4,263 | | | QEP Resources Inc. (a) | | | 68,506 | |
| | 2,604 | | | SM Energy Co. | | | 87,572 | |
| | 8,186 | | | Spectra Energy Corp. | | | 342,257 | |
| | 1,890 | | | Targa Resources Corp. | | | 82,971 | |
| | 2,091 | | | Tesoro Corp. | | | 177,672 | |
| | 2,474 | | | Valero Energy Corp. | | | 146,560 | |
| | 2,835 | | | Williams Cos., Inc. (The) | | | 82,782 | |
| | | | | | | | |
| | | | | | | 3,714,946 | |
| | | | | | | | |
| | | | Total Energy | | | 5,331,984 | |
| | | | | | | | |
| | | | Financials — 6.7% | |
| | | | Banks — 1.4% | |
| | 1,710 | | | Bank of Hawaii Corp. | | | 128,506 | |
| | 3,740 | | | BB&T Corp. | | | 146,608 | |
| | 29 | | | Comerica, Inc. | | | 1,511 | |
| | 742 | | | Cullen/Frost Bankers, Inc. | | | 56,385 | |
| | | | | | | | |
| SHARES | | | SECURITY DESCRIPTION | | VALUE($) | |
| | | | | | | | |
| | | | Banks — continued | |
| | 6,312 | | | Fifth Third Bancorp | | | 137,349 | |
| | 12,481 | | | Huntington Bancshares, Inc. | | | 132,299 | |
| | 1,333 | | | M&T Bank Corp. | | | 163,599 | |
| | 10,009 | | | People’s United Financial, Inc. | | | 162,546 | |
| | 2,158 | | | PNC Financial Services Group, Inc. (The) | | | 206,305 | |
| | 313 | | | Popular Inc. (Puerto Rico) | | | 11,362 | |
| | 2,841 | | | SunTrust Banks, Inc. | | | 128,498 | |
| | 805 | | | Synovus Financial Corp. | | | 26,621 | |
| | 5,308 | | | U.S. Bancorp | | | 237,586 | |
| | 3,150 | | | Wells Fargo & Co. | | | 144,932 | |
| | 272 | | | Zions Bancorporation | | | 8,761 | |
| | | | | | | | |
| | | | | | | 1,692,868 | |
| | | | | | | | |
| | | | Capital Markets — 1.7% | |
| | 897 | | | Ameriprise Financial, Inc. | | | 79,286 | |
| | 3,395 | | | Bank of New York Mellon Corp. (The) | | | 146,902 | |
| | 467 | | | BlackRock, Inc., Class A | | | 159,359 | |
| | 1,344 | | | CME Group, Inc., Class A | | | 134,534 | |
| | 1,221 | | | Eaton Vance Corp. | | | 42,808 | |
| | 2,403 | | | FactSet Research Systems, Inc. | | | 371,792 | |
| | 1,514 | | | Federated Investors, Inc., Class B | | | 40,878 | |
| | 559 | | | Intercontinental Exchange, Inc. | | | 151,148 | |
| | 3,586 | | | Invesco Ltd. (Bermuda) | | | 100,731 | |
| | 2,352 | | | Northern Trust Corp. | | | 170,332 | |
| | 1,527 | | | Raymond James Financial, Inc. | | | 91,803 | |
| | 1,143 | | | S&P Global, Inc. | | | 139,275 | |
| | 5,467 | | | SEI Investments Co. | | | 242,352 | |
| | 2,509 | | | T. Rowe Price Group, Inc. | | | 160,601 | |
| | 3,430 | | | TD Ameritrade Holding Corp. | | | 117,340 | |
| | | | | | | | |
| | | | | | | 2,149,141 | |
| | | | | | | | |
| | | | Consumer Finance — 0.5% | |
| | 1,678 | | | American Express Co. | | | 111,453 | |
| | 1,840 | | | Capital One Financial Corp. | | | 136,233 | |
| | 2,869 | | | Discover Financial Services | | | 161,611 | |
| | 13,555 | | | SLM Corp. (a) | | | 95,563 | |
| | 2,994 | | | Synchrony Financial | | | 85,598 | |
| | | | | | | | |
| | | | | | | 590,458 | |
| | | | | | | | |
| | | | Diversified Financial Services — 0.0% (e) | |
| | 1,740 | | | Voya Financial, Inc. | | | 53,157 | |
| | | | | | | | |
| | | | Insurance — 2.8% | |
| | 2,621 | | | Aflac, Inc. | | | 180,508 | |
| | 2,766 | | | Allstate Corp. (The) | | | 187,811 | |
| | 1,034 | | | American Financial Group, Inc. | | | 77,033 | |
| | 2,132 | | | Aon plc (United Kingdom) | | | 236,290 | |
| | 2,111 | | | Assurant, Inc. | | | 169,978 | |
SEE NOTES TO FINANCIAL STATEMENTS.
| | | | | | | | |
| | | |
| OCTOBER 31, 2016 | | JPMORGAN EXCHANGE-TRADED FUNDS | | | | | 55 | |
JPMorgan Diversified Return U.S. Equity ETF
SCHEDULE OF PORTFOLIO INVESTMENTS
AS OF OCTOBER 31, 2016 (continued)
| | | | | | | | |
| SHARES | | | SECURITY DESCRIPTION | | VALUE($) | |
| Common Stocks — continued | |
| | | | Insurance — continued | |
| | 1,620 | | | Chubb Ltd. (Switzerland) | | | 205,740 | |
| | 3,381 | | | Cincinnati Financial Corp. | | | 239,307 | |
| | 416 | | | Erie Indemnity Co., Class A | | | 42,594 | |
| | 1,006 | | | Everest Re Group Ltd. (Bermuda) | | | 204,741 | |
| | 3,645 | | | FNF Group | | | 130,892 | |
| | 871 | | | Genworth Financial, Inc., Class A (a) | | | 3,606 | |
| | 3,426 | | | Hartford Financial Services Group, Inc. (The) | | | 151,121 | |
| | 1,273 | | | Kemper Corp. | | | 47,801 | |
| | 3,119 | | | Marsh & McLennan Cos., Inc. | | | 197,714 | |
| | 128 | | | Mercury General Corp. | | | 6,972 | |
| | 2,093 | | | MetLife, Inc. | | | 98,287 | |
| | 2,632 | | | Principal Financial Group, Inc. | | | 143,707 | |
| | 6,616 | | | Progressive Corp. (The) | | | 208,470 | |
| | 2,134 | | | Prudential Financial, Inc. | | | 180,942 | |
| | 798 | | | Reinsurance Group of America, Inc., Class A | | | 86,072 | |
| | 3,998 | | | Torchmark Corp. | | | 253,513 | |
| | 1,522 | | | Travelers Cos., Inc. (The) | | | 164,650 | |
| | 2,908 | | | W.R. Berkley Corp. | | | 166,047 | |
| | 3,101 | | | XL Group Ltd. (Bermuda) | | | 107,605 | |
| | | | | | | | |
| | | | | | | 3,491,401 | |
| | | | | | | | |
| | | | Mortgage Real Estate Investment Trusts (REITs) — 0.2% | |
| | 16,801 | | | Annaly Capital Management, Inc. | | | 174,058 | |
| | 5,759 | | | Chimera Investment Corp. | | | 90,244 | |
| | | | | | | | |
| | | | | | | 264,302 | |
| | | | | | | | |
| | | | Thrifts & Mortgage Finance — 0.1% | |
| | 12,474 | | | New York Community Bancorp, Inc. | | | 179,127 | |
| | | | | | | | |
| | | | Total Financials | | | 8,420,454 | |
| | | | | | | | |
| | | | Health Care — 14.1% | |
| | | | Biotechnology — 1.3% | |
| | 4,503 | | | AbbVie, Inc. | | | 251,177 | |
| | 1,903 | | | Amgen, Inc. | | | 268,627 | |
| | 560 | | | Biogen, Inc. (a) | | | 156,901 | |
| | 2,385 | | | Celgene Corp. (a) | | | 243,699 | |
| | 3,962 | | | Gilead Sciences, Inc. | | | 291,722 | |
| | 1,247 | | | Incyte Corp. (a) | | | 108,452 | |
| | 485 | | | Regeneron Pharmaceuticals, Inc. (a) | | | 167,335 | |
| | 1,383 | | | United Therapeutics Corp. (a) | | | 166,057 | |
| | | | | | | | |
| | | | | | | 1,653,970 | |
| | | | | | | | |
| | | | Health Care Equipment & Supplies — 5.0% | |
| | 8,713 | | | Abbott Laboratories | | | 341,898 | |
| | 9,538 | | | Baxter International, Inc. | | | 453,913 | |
| | 2,917 | | | Becton, Dickinson & Co. | | | 489,793 | |
| | 3,689 | | | C.R. Bard, Inc. | | | 799,332 | |
| | 427 | | | Cooper Co., Inc. | | | 75,169 | |
| | | | | | | | |
| SHARES | | | SECURITY DESCRIPTION | | VALUE($) | |
| | | | | | | | |
| | | | Health Care Equipment & Supplies — continued | |
| | 3,848 | | | Danaher Corp. | | | 302,260 | |
| | 5,538 | | | DENTSPLY SIRONA, Inc. | | | 318,823 | |
| | 2,851 | | | Edwards Lifesciences Corp. (a) | | | 271,472 | |
| | 5,842 | | | Hill-Rom Holdings, Inc. | | | 323,705 | |
| | 8,679 | | | Hologic, Inc. (a) | | | 312,531 | |
| | 582 | | | Intuitive Surgical, Inc. (a) | | | 391,151 | |
| | 5,307 | | | Medtronic plc (Ireland) | | | 435,280 | |
| | 3,639 | | | St. Jude Medical, Inc. | | | 283,260 | |
| | 4,173 | | | Stryker Corp. | | | 481,356 | |
| | 37 | | | Teleflex, Inc. | | | 5,296 | |
| | 4,594 | | | Varian Medical Systems, Inc. (a) | | | 416,814 | |
| | 5,289 | | | Zimmer Biomet Holdings, Inc. | | | 557,461 | |
| | | | | | | | |
| | | | | | | 6,259,514 | |
| | | | | | | | |
| | | | Health Care Providers & Services — 4.5% | |
| | 2,894 | | | Aetna, Inc. | | | 310,671 | |
| | 2,329 | | | Anthem, Inc. | | | 283,812 | |
| | 2,356 | | | Cardinal Health, Inc. | | | 161,834 | |
| | 3,084 | | | Centene Corp. (a) | | | 192,688 | |
| | 2,453 | | | Cigna Corp. | | | 291,490 | |
| | 9,393 | | | DaVita HealthCare Partners, Inc. (a) | | | 550,618 | |
| | 4,915 | | | Express Scripts Holding Co. (a) | | | 331,271 | |
| | 3,894 | | | HCA Holdings, Inc. (a) | | | 298,008 | |
| | 4,073 | | | Henry Schein, Inc. (a) | | | 607,692 | |
| | 1,634 | | | Humana, Inc. | | | 280,280 | |
| | 5,237 | | | Laboratory Corp. of America Holdings (a) | | | 656,405 | |
| | 7,284 | | | Quest Diagnostics, Inc. | | | 593,209 | |
| | 427 | | | Tenet Healthcare Corp. (a) | | | 8,416 | |
| | 2,927 | | | UnitedHealth Group, Inc. | | | 413,673 | |
| | 5,213 | | | Universal Health Services, Inc., Class B | | | 629,261 | |
| | | | | | | | |
| | | | | | | 5,609,328 | |
| | | | | | | | |
| | | | Health Care Technology — 0.3% | |
| | 5,909 | | | Cerner Corp. (a) | | | 346,149 | |
| | | | | | | | |
| | | | Life Sciences Tools & Services — 1.1% | |
| | 1,060 | | | Illumina, Inc. (a) | | | 144,309 | |
| | 431 | | | Mettler-Toledo International, Inc. (a) | | | 174,159 | |
| | 2,939 | | | Thermo Fisher Scientific, Inc. | | | 432,121 | |
| | 4,695 | | | Waters Corp. (a) | | | 653,262 | |
| | | | | | | | |
| | | | | | | 1,403,851 | |
| | | | | | | | |
| | | | Pharmaceuticals — 1.9% | |
| | 985 | | | Allergan plc (Ireland) (a) | | | 205,806 | |
| | 4,662 | | | Eli Lilly & Co. | | | 344,242 | |
| | 5,440 | | | Johnson & Johnson | | | 630,986 | |
| | 6,778 | | | Merck & Co., Inc. | | | 398,004 | |
| | 4,017 | | | Mylan NV (Netherlands) (a) | | | 146,620 | |
SEE NOTES TO FINANCIAL STATEMENTS.
| | | | | | |
| | | |
| 56 | | | | JPMORGAN EXCHANGE-TRADED FUNDS | | OCTOBER 31, 2016 |
| | | | | | | | |
| SHARES | | | SECURITY DESCRIPTION | | VALUE($) | |
| Common Stocks — continued | |
| | | | Pharmaceuticals — continued | |
| | 12,226 | | | Pfizer, Inc. | | | 387,686 | |
| | 6,742 | | | Zoetis, Inc., Class A | | | 322,268 | |
| | | | | | | | |
| | | | | | | 2,435,612 | |
| | | | | | | | |
| | | | Total Health Care | | | 17,708,424 | |
| | | | | | | | |
| | | | Industrials — 8.5% | |
| | | | Aerospace & Defense — 1.6% | |
| | 4,166 | | | Alcoa Inc. | | | 119,648 | |
| | 1,324 | | | Boeing Co. (The) | | | 188,577 | |
| | 1,361 | | | General Dynamics Corp. | | | 205,157 | |
| | 1,534 | | | L-3 Communications Holdings, Inc., Class 3 | | | 210,066 | |
| | 1,559 | | | Lockheed Martin Corp. | | | 384,106 | |
| | 1,049 | | | Northrop Grumman Corp. | | | 240,221 | |
| | 1,794 | | | Raytheon Co. | | | 245,078 | |
| | 2,158 | | | Rockwell Collins, Inc. | | | 181,963 | |
| | 2,705 | | | Textron, Inc. | | | 108,416 | |
| | 1,534 | | | United Technologies Corp. | | | 156,775 | |
| | | | | | | | |
| | | | | | | 2,040,007 | |
| | | | | | | | |
| | | | Air Freight & Logistics — 0.4% | |
| | 2,572 | | | C.H. Robinson Worldwide, Inc. | | | 175,205 | |
| | 2,735 | | | United Parcel Service, Inc., Class B | | | 294,723 | |
| | | | | | | | |
| | | | | | | 469,928 | |
| | | | | | | | |
| | | | Airlines — 0.6% | |
| | 1,199 | | | Alaska Air Group, Inc. | | | 86,592 | |
| | 2,745 | | | American Airlines Group, Inc. | | | 111,447 | |
| | 4,014 | | | Delta Air Lines, Inc. | | | 167,665 | |
| | 6,809 | | | JetBlue Airways Corp. (a) | | | 119,021 | |
| | 4,249 | | | Southwest Airlines Co. | | | 170,173 | |
| | 2,306 | | | United Continental Holdings, Inc. (a) | | | 129,666 | |
| | | | | | | | |
| | | | | | | 784,564 | |
| | | | | | | | |
| | | | Building Products — 0.3% | |
| | 1,301 | | | Fortune Brands Home & Security, Inc. | | | 71,074 | |
| | 3,507 | | | Johnson Controls International plc (Ireland) | | | 141,402 | |
| | 3,421 | | | Masco Corp. | | | 105,640 | |
| | | | | | | | |
| | | | | | | 318,116 | |
| | | | | | | | |
| | | | Commercial Services & Supplies — 1.0% | |
| | 3,241 | | | Cintas Corp. | | | 345,718 | |
| | 5,543 | | | Herman Miller, Inc. | | | 154,095 | |
| | 7,533 | | | Pitney Bowes, Inc. | | | 134,389 | |
| | 6,688 | | | Republic Services, Inc., Class A | | | 351,989 | |
| | 4,528 | | | Waste Management, Inc. | | | 297,309 | |
| | | | | | | | |
| | | | | | | 1,283,500 | |
| | | | | | | | |
| | | | | | | | |
| SHARES | | | SECURITY DESCRIPTION | | VALUE($) | |
| | | | | | | | |
| | | | Construction & Engineering — 0.1% | | | | |
| | 1,167 | | | Chicago Bridge & Iron Co., N.V. (Netherlands) | | | 37,367 | |
| | 2,739 | | | Fluor Corp. | | | 142,401 | |
| | 228 | | | KBR, Inc. | | | 3,377 | |
| | | | | | | | |
| | | | | | | 183,145 | |
| | | | | | | | |
| | | | Electrical Equipment — 0.6% | |
| | 714 | | | Acuity Brands, Inc. | | | 159,629 | |
| | 1,727 | | | Eaton Corp. plc (Ireland) | | | 110,131 | |
| | 2,247 | | | Emerson Electric Co. | | | 113,878 | |
| | 1,377 | | | Hubbell, Inc., Class B | | | 143,924 | |
| | 1,463 | | | Rockwell Automation, Inc. | | | 175,150 | |
| | | | | | | | |
| | | | | | | 702,712 | |
| | | | | | | | |
| | | | Industrial Conglomerates — 0.6% | |
| | 1,491 | | | 3M Co. | | | 246,462 | |
| | 6,912 | | | General Electric Co. | | | 201,139 | |
| | 2,126 | | | Honeywell International, Inc. | | | 233,180 | |
| | 470 | | | Roper Technologies, Inc. | | | 81,456 | |
| | | | | | | | |
| | | | | | | 762,237 | |
| | | | | | | | |
| | | | Machinery — 1.9% | |
| | 2,835 | | | AGCO Corp. | | | 144,812 | |
| | 1,956 | | | Caterpillar, Inc. | | | 163,248 | |
| | 450 | | | Crane Co. | | | 30,604 | |
| | 1,889 | | | Cummins, Inc. | | | 241,452 | |
| | 2,284 | | | Deere & Co. | | | 201,677 | |
| | 2,503 | | | Dover Corp. | | | 167,426 | |
| | 1,823 | | | Flowserve Corp. | | | 77,204 | |
| | 1,103 | | | Fortive Corp. | | | 56,308 | |
| | 2,129 | | | Illinois Tool Works, Inc. | | | 241,791 | |
| | 2,409 | | | Ingersoll-Rand plc (Ireland) | | | 162,102 | |
| | 6,727 | | | ITT, Inc. | | | 236,925 | |
| | 2,245 | | | PACCAR, Inc. | | | 123,295 | |
| | 1,142 | | | Parker-Hannifin Corp. | | | 140,180 | |
| | 3,337 | | | Stanley Black & Decker, Inc. | | | 379,884 | |
| | 1,091 | | | Terex Corp. | | | 26,053 | |
| | 2,453 | | | Trinity Industries, Inc. | | | 52,372 | |
| | | | | | | | |
| | | | | | | 2,445,333 | |
| | | | | | | | |
| | | | Professional Services — 0.5% | |
| | 212 | | | Dun & Bradstreet Corp. (The) | | | 26,468 | |
| | 611 | | | Equifax, Inc. | | | 75,746 | |
| | 5,097 | | | Nielsen Holdings plc (United Kingdom) | | | 229,467 | |
| | 1,161 | | | Robert Half International, Inc. | | | 43,444 | |
| | 2,678 | | | Verisk Analytics, Inc., Class A (a) | | | 218,391 | |
| | | | | | | | |
| | | | | | | 593,516 | |
| | | | | | | | |
SEE NOTES TO FINANCIAL STATEMENTS.
| | | | | | | | |
| | | |
| OCTOBER 31, 2016 | | JPMORGAN EXCHANGE-TRADED FUNDS | | | | | 57 | |
JPMorgan Diversified Return U.S. Equity ETF
SCHEDULE OF PORTFOLIO INVESTMENTS
AS OF OCTOBER 31, 2016 (continued)
| | | | | | | | |
| SHARES | | | SECURITY DESCRIPTION | | VALUE($) | |
| Common Stocks — continued | |
| | | | Road & Rail — 0.6% | |
| | 1,474 | | | Avis Budget Group, Inc. (a) | | | 47,699 | |
| | 4,029 | | | CSX Corp. | | | 122,925 | |
| | 2,127 | | | J.B. Hunt Transport Services, Inc. | | | 173,584 | |
| | 1,518 | | | Norfolk Southern Corp. | | | 141,174 | |
| | 1,276 | | | Ryder System, Inc. | | | 88,542 | |
| | 1,947 | | | Union Pacific Corp. | | | 171,686 | |
| | | | | | | | |
| | | | | | | 745,610 | |
| | | | | | | | |
| | | | Trading Companies & Distributors — 0.3% | |
| | 3,522 | | | Fastenal Co. | | | 137,288 | |
| | 1,162 | | | United Rentals, Inc. (a) | | | 87,917 | |
| | 584 | | | W.W. Grainger, Inc. | | | 121,542 | |
| | | | | | | | |
| | | | | | | 346,747 | |
| | | | | | | | |
| | | | Total Industrials | | | 10,675,415 | |
| | | | | | | | |
| | | | Information Technology — 14.2% | |
| | | | Communications Equipment — 1.2% | |
| | 10,138 | | | Cisco Systems, Inc. | | | 311,034 | |
| | 3,015 | | | F5 Networks, Inc. (a) | | | 416,703 | |
| | 6,508 | | | Harris Corp. | | | 580,579 | |
| | 5,715 | | | Juniper Networks, Inc. | | | 150,533 | |
| | 1,478 | | | Motorola Solutions, Inc. | | | 107,273 | |
| | | | | | | | |
| | | | | | | 1,566,122 | |
| | | | | | | | |
| | | | Electronic Equipment, Instruments & Components — 0.5% | |
| | 4,721 | | | Amphenol Corp., Class A | | | 311,256 | |
| | 5,481 | | | AVX Corp. | | | 76,844 | |
| | 9,271 | | | Corning, Inc. | | | 210,544 | |
| | 1,439 | | | Ingram Micro, Inc., Class A | | | 53,531 | |
| | | | | | | | |
| | | | | | | 652,175 | |
| | | | | | | | |
| | | | Internet Software & Services — 2.1% | |
| | 2,563 | | | Akamai Technologies, Inc. (a) | | | 178,052 | |
| | 599 | | | Alphabet, Inc., Class A (a) | | | 485,130 | |
| | 609 | | | Alphabet, Inc., Class C (a) | | | 477,785 | |
| | 6,840 | | | eBay, Inc. (a) | | | 195,008 | |
| | 2,788 | | | Facebook, Inc., Class A (a) | | | 365,200 | |
| | 8,038 | | | IAC/Interactive Corp. | | | 517,969 | |
| | 4,907 | | | VeriSign, Inc. (a) | | | 412,286 | |
| | | | | | | | |
| | | | | | | 2,631,430 | |
| | | | | | | | |
| | | | IT Services — 2.9% | |
| | 1,846 | | | Accenture plc, Class A (Ireland) | | | 214,579 | |
| | 2,420 | | | Automatic Data Processing, Inc. | | | 210,685 | |
| | 7,795 | | | Cognizant Technology Solutions Corp., Class A (a) | | | 400,273 | |
| | 2,983 | | | Computer Sciences Corp. | | | 162,424 | |
| | 2,983 | | | CSRA, Inc. | | | 74,844 | |
| | | | | | | | |
| SHARES | | | SECURITY DESCRIPTION | | VALUE($) | |
| | | | | | | | |
| | | | IT Services — continued | |
| | 3,077 | | | DST Systems, Inc. | | | 295,884 | |
| | 3,642 | | | Fidelity National Information Services, Inc. | | | 269,217 | |
| | 2,773 | | | Fiserv, Inc. (a) | | | 273,085 | |
| | 1,554 | | | Gartner, Inc. (a) | | | 133,706 | |
| | 1,256 | | | Global Payments, Inc. | | | 91,085 | |
| | 2,820 | | | International Business Machines Corp. | | | 433,406 | |
| | 5,247 | | | Leidos Holdings, Inc. | | | 218,118 | |
| | 1,946 | | | MasterCard, Inc., Class A | | | 208,261 | |
| | 3,996 | | | Paychex, Inc. | | | 220,579 | |
| | 1,399 | | | Teradata Corp. (a) | | | 37,717 | |
| | 2,216 | | | Total System Services, Inc. | | | 110,534 | |
| | 1,443 | | | Vantiv, Inc., Class A (a) | | | 84,214 | |
| | 1,804 | | | Visa, Inc., Class A | | | 148,848 | |
| | 3,747 | | | Western Union Co. (The) | | | 75,202 | |
| | | | | | | | |
| | | | | | | 3,662,661 | |
| | | | | | | | |
| | | | Semiconductors & Semiconductor Equipment — 3.9% | |
| | 6,857 | | | Analog Devices, Inc. | | | 439,534 | |
| | 8,166 | | | Applied Materials, Inc. | | | 237,467 | |
| | 1,583 | | | Broadcom Ltd. (Singapore) | | | 269,553 | |
| | 1,884 | | | First Solar, Inc. (a) | | | 76,283 | |
| | 12,339 | | | Intel Corp. | | | 430,261 | |
| | 2,637 | | | KLA-Tencor Corp. | | | 198,065 | |
| | 3,589 | | | Lam Research Corp. | | | 347,631 | |
| | 7,524 | | | Linear Technology Corp. | | | 451,891 | |
| | 12,133 | | | Marvell Technology Group Ltd. (Bermuda) | | | 158,093 | |
| | 8,432 | | | Maxim Integrated Products, Inc. | | | 334,160 | |
| | 5,264 | | | Microchip Technology, Inc. | | | 318,735 | |
| | 5,093 | | | Micron Technology, Inc. (a) | | | 87,396 | |
| | 4,687 | | | NVIDIA Corp. | | | 333,527 | |
| | 3,087 | | | QUALCOMM, Inc. | | | 212,139 | |
| | 2,022 | | | Skyworks Solutions, Inc. | | | 155,573 | |
| | 4,855 | | | Teradyne, Inc. | | | 113,073 | |
| | 4,950 | | | Texas Instruments, Inc. | | | 350,707 | |
| | 7,947 | | | Xilinx, Inc. | | | 404,264 | |
| | | | | | | | |
| | | | | | | 4,918,352 | |
| | | | | | | | |
| | | | Software — 2.6% | |
| | 6,161 | | | Activision Blizzard, Inc. | | | 265,970 | |
| | 3,568 | | | Adobe Systems, Inc. (a) | | | 383,596 | |
| | 6,462 | | | CA, Inc. | | | 198,642 | |
| | 6,960 | | | Cadence Design Systems, Inc. (a) | | | 178,037 | |
| | 1,631 | | | Citrix Systems, Inc. (a) | | | 138,309 | |
| | 2,867 | | | Electronic Arts, Inc. (a) | | | 225,117 | |
| | 4,325 | | | Intuit, Inc. | | | 470,301 | |
| | 6,711 | | | Microsoft Corp. | | | 402,123 | |
SEE NOTES TO FINANCIAL STATEMENTS.
| | | | | | |
| | | |
| 58 | | | | JPMORGAN EXCHANGE-TRADED FUNDS | | OCTOBER 31, 2016 |
| | | | | | | | |
| SHARES | | | SECURITY DESCRIPTION | | VALUE($) | |
| Common Stocks — continued | |
| | | | Software — continued | |
| | 4,846 | | | Oracle Corp. | | | 186,183 | |
| | 7,152 | | | Red Hat, Inc. (a) | | | 553,922 | |
| | 8,863 | | | Symantec Corp. | | | 221,841 | |
| | | | | | | | |
| | | | | | | 3,224,041 | |
| | | | | | | | |
| | | | Technology Hardware, Storage & Peripherals — 1.0% | |
| | 3,791 | | | Apple, Inc. | | | 430,430 | |
| | 4,423 | | | Hewlett Packard Enterprise Co. | | | 99,385 | |
| | 16,559 | | | HP, Inc. | | | 239,940 | |
| | 2,330 | | | Lexmark International, Inc., Class A | | | 92,478 | |
| | 4,857 | | | NetApp, Inc. | | | 164,846 | |
| | 2,839 | | | Western Digital Corp. | | | 165,911 | |
| | | | | | | | |
| | | | | | | 1,192,990 | |
| | | | | | | | |
| | | | Total Information Technology | | | 17,847,771 | |
| | | | | | | | |
| | | | Materials — 5.3% | |
| | | | Chemicals — 3.9% | |
| | 1,335 | | | Air Products & Chemicals, Inc. | | | 178,116 | |
| | 2,912 | | | Albemarle Corp. | | | 243,298 | |
| | 5,058 | | | Ashland Global Holdings, Inc. | | | 565,130 | |
| | 2,388 | | | Cabot Corp. | | | 124,510 | |
| | 5,398 | | | Celanese Corp., Class A | | | 393,622 | |
| | 3,014 | | | CF Industries Holdings, Inc. | | | 72,366 | |
| | 4,273 | | | Dow Chemical Co. (The) | | | 229,930 | |
| | 3,192 | | | E.I. du Pont de Nemours & Co. | | | 219,578 | |
| | 1,713 | | | Eastman Chemical Co. | | | 123,182 | |
| | 3,280 | | | Ecolab, Inc. | | | 374,478 | |
| | 1,118 | | | FMC Corp. | | | 52,423 | |
| | 7,651 | | | Huntsman Corp. | | | 129,684 | |
| | 4,170 | | | International Flavors & Fragrances, Inc. | | | 545,353 | |
| | 1,803 | | | LyondellBasell Industries N.V., Class A (Netherlands) | | | 143,429 | |
| | 2,947 | | | Monsanto Co. | | | 296,969 | |
| | 5,922 | | | Mosaic Co. (The) | | | 139,345 | |
| | 3,400 | | | PPG Industries, Inc. | | | 316,642 | |
| | 3,686 | | | Praxair, Inc. | | | 431,483 | |
| | 104 | | | RPM International, Inc. | | | 4,944 | |
| | 699 | | | Sherwin-Williams Co. (The) | | | 171,157 | |
| | 1,219 | | | Valspar Corp. (The) | | | 121,412 | |
| | | | | | | | |
| | | | | | | 4,877,051 | |
| | | | | | | | |
| | | | Construction Materials — 0.2% | |
| | 675 | | | Martin Marietta Materials, Inc. | | | 125,132 | |
| | 917 | | | Vulcan Materials Co. | | | 103,804 | |
| | | | | | | | |
| | | | | | | 228,936 | |
| | | | | | | | |
| | | | | | | | |
| SHARES | | | SECURITY DESCRIPTION | | VALUE($) | |
| | | | | | | | |
| | | | Containers & Packaging — 0.6% | | | | |
| | 2,717 | | | Ball Corp. | | | 209,399 | |
| | 2,565 | | | Bemis Co., Inc. | | | 124,967 | |
| | 988 | | | Crown Holdings, Inc. (a) | | | 53,599 | |
| | 4,074 | | | International Paper Co. | | | 183,452 | |
| | 3,627 | | | Sealed Air Corp. | | | 165,500 | |
| | | | | | | | |
| | | | | | | 736,917 | |
| | | | | | | | |
| | | | Metals & Mining — 0.6% | | | | |
| | 697 | | | Compass Minerals International, Inc. | | | 50,080 | |
| | 5,173 | | | Freeport-McMoRan, Inc. (a) | | | 57,834 | |
| | 2,883 | | | Newmont Mining Corp. | | | 106,786 | |
| | 4,967 | | | Nucor Corp. | | | 242,638 | |
| | 940 | | | Reliance Steel & Aluminum Co. | | | 64,653 | |
| | 649 | | | Royal Gold, Inc. | | | 44,664 | |
| | 2,590 | | | Southern Copper Corp. | | | 73,530 | |
| | 6,262 | | | United States Steel Corp. | | | 121,107 | |
| | | | | | | | |
| | | | | | | 761,292 | |
| | | | | | | | |
| | | | Paper & Forest Products — 0.0% (e) | | | | |
| | 1,443 | | | Domtar Corp. | | | 51,876 | |
| | | | | | | | |
| | | | Total Materials | | | 6,656,072 | |
| | | | | | | | |
| | | | Real Estate — 2.7% | | | | |
| | | | Equity Real Estate Investment Trusts (REITs) — 2.6% | |
| | 637 | | | Alexandria Real Estate Equities, Inc. | | | 68,675 | |
| | 1,425 | | | American Tower Corp. | | | 166,996 | |
| | 1,239 | | | AvalonBay Communities, Inc. | | | 212,092 | |
| | 1,457 | | | Boston Properties, Inc. | | | 175,539 | |
| | 301 | | | Camden Property Trust | | | 24,513 | |
| | 444 | | | Care Capital Properties, Inc. | | | 11,797 | |
| | 1,092 | | | Corporate Office Properties Trust | | | 29,146 | |
| | 1,835 | | | Crown Castle International Corp. | | | 166,967 | |
| | 1,882 | | | Digital Realty Trust, Inc. | | | 175,835 | |
| | 768 | | | Duke Realty Corp. | | | 20,083 | |
| | 423 | | | Equinix Inc. | | | 151,129 | |
| | 1,679 | | | Equity Residential | | | 103,678 | |
| | 880 | | | Essex Property Trust, Inc. | | | 188,399 | |
| | 933 | | | Extra Space Storage, Inc. | | | 68,249 | |
| | 1,491 | | | Federal Realty Investment Trust | | | 216,538 | |
| | 3,565 | | | General Growth Properties, Inc. | | | 88,947 | |
| | 1,322 | | | Iron Mountain, Inc. | | | 44,591 | |
| | 4,723 | | | Kimco Realty Corp. | | | 125,679 | |
| | 238 | | | Liberty Property Trust | | | 9,622 | |
| | 1,223 | | | Macerich Co. (The) | | | 86,564 | |
| | 2,535 | | | NorthStar Realty Finance Corp. | | | 36,808 | |
| | 2,441 | | | Prologis, Inc. | | | 127,323 | |
| | 907 | | | Public Storage | | | 193,844 | |
SEE NOTES TO FINANCIAL STATEMENTS.
| | | | | | | | |
| | | |
| OCTOBER 31, 2016 | | JPMORGAN EXCHANGE-TRADED FUNDS | | | | | 59 | |
JPMorgan Diversified Return U.S. Equity ETF
SCHEDULE OF PORTFOLIO INVESTMENTS
AS OF OCTOBER 31, 2016 (continued)
| | | | | | | | |
| SHARES | | | SECURITY DESCRIPTION | | VALUE($) | |
| Common Stocks — continued | |
| Real Estate — continued | |
| | | | Equity Real Estate Investment Trusts (REITs) — continued | |
| | 2,558 | | | Rayonier, Inc. | | | 68,606 | |
| | 1,626 | | | Realty Income Corp. | | | 96,324 | |
| | 2,004 | | | Senior Housing Properties Trust | | | 42,625 | |
| | 939 | | | Simon Property Group, Inc. | | | 174,616 | |
| | 301 | | | Taubman Centers, Inc. | | | 21,811 | |
| | 1,778 | | | Ventas, Inc. | | | 120,460 | |
| | 581 | | | Vornado Realty Trust | | | 53,905 | |
| | 1,912 | | | Weingarten Realty Investors | | | 69,234 | |
| | 1,764 | | | Welltower, Inc. | | | 120,887 | |
| | 483 | | | Weyerhaeuser Co. | | | 14,456 | |
| | | | | | | | |
| | | | | | | 3,275,938 | |
| | | | | | | | |
| | | | Real Estate Management & Development — 0.1% | |
| | 1,625 | | | CBRE Group, Inc., Class A (a) | | | 41,860 | |
| | 113 | | | Jones Lang LaSalle, Inc. | | | 10,944 | |
| | | | | | | | |
| | | | | | | 52,804 | |
| | | | | | | | |
| | | | Total Real Estate | | | 3,328,742 | |
| | | | | | | | |
| | | | Telecommunication Services — 1.3% | |
| | | | Diversified Telecommunication Services — 1.2% | |
| | 17,705 | | | AT&T, Inc. | | | 651,367 | |
| | 1,063 | | | Frontier Communications Corp. | | | 4,273 | |
| | 12,219 | | | Verizon Communications, Inc. | | | 587,734 | |
| | 27,856 | | | Windstream Holdings, Inc. | | | 218,670 | |
| | | | | | | | |
| | | | | | | 1,462,044 | |
| | | | | | | | |
| | | | Wireless Telecommunication Services — 0.1% | |
| | 3,206 | | | Telephone & Data Systems, Inc. | | | 82,843 | |
| | 31 | | | T-Mobile US, Inc. (a) | | | 1,541 | |
| | 899 | | | United States Cellular Corp. (a) | | | 31,510 | |
| | | | | | | | |
| | | | | | | 115,894 | |
| | | | | | | | |
| | | | Total Telecommunication Services | | | 1,577,938 | |
| | | | | | | | |
| | | | Utilities — 13.5% | | | | |
| | | | Electric Utilities — 7.2% | | | | |
| | 14,343 | | | Alliant Energy Corp. | | | 545,751 | |
| | 9,620 | | | American Electric Power Co., Inc. | | | 623,761 | |
| | 9,292 | | | Duke Energy Corp. | | | 743,546 | |
| | 10,075 | | | Edison International, Inc. | | | 740,311 | |
| | 8,917 | | | Entergy Corp. | | | 657,005 | |
| | 12,545 | | | Eversource Energy | | | 690,728 | |
| | 22,407 | | | Exelon Corp. | | | 763,406 | |
| | 1,603 | | | FirstEnergy Corp. | | | 54,967 | |
| | 5,973 | | | NextEra Energy, Inc. | | | 764,544 | |
| | 9,750 | | | PG&E Corp. | | | 605,670 | |
| | | | | | | | |
| SHARES | | | SECURITY DESCRIPTION | | VALUE($) | |
| | | | | | | | |
| | | | Electric Utilities — continued | | | | |
| | 9,404 | | | Pinnacle West Capital Corp. | | | 715,926 | |
| | 21,904 | | | PPL Corp. | | | 752,183 | |
| | 14,430 | | | Southern Co. (The) | | | 744,155 | |
| | 17,042 | | | Xcel Energy, Inc. | | | 708,095 | |
| | | | | | | | |
| | | | | | | 9,110,048 | |
| | | | | | | | |
| | | | Multi-Utilities — 6.1% | | | | |
| | 14,011 | | | Ameren Corp. | | | 699,849 | |
| | 22,954 | | | CenterPoint Energy, Inc. | | | 523,351 | |
| | 17,033 | | | CMS Energy Corp. | | | 717,941 | |
| | 9,625 | | | Consolidated Edison, Inc. | | | 727,169 | |
| | 9,637 | | | Dominion Resources, Inc. | | | 724,702 | |
| | 8,494 | | | DTE Energy Co. | | | 815,509 | |
| | 25,450 | | | NiSource, Inc. | | | 591,967 | |
| | 16,322 | | | Public Service Enterprise Group, Inc. | | | 686,830 | |
| | 10,364 | | | SCANA Corp. | | | 760,303 | |
| | 6,509 | | | Sempra Energy | | | 697,114 | |
| | 12,272 | | | WEC Energy Group, Inc. | | | 732,884 | |
| | | | | | | | |
| | | | | | | 7,677,619 | |
| | | | | | | | |
| | | | Water Utilities — 0.2% | | | | |
| | 2,872 | | | American Water Works Co., Inc. | | | 212,643 | |
| | | | | | | | |
| | | | Total Utilities | | | 17,000,310 | |
| | | | | | | | |
| | | | Total Common Stocks
(Cost $124,204,996) | | | 123,895,274 | |
| | | | | | | | |
| Short-Term Investment — 1.3% | |
| | | | Investment Company — 1.3% | | | | |
| | 1,660,652 | | | JPMorgan U.S. Government Money Market Fund, Institutional Class Shares, 0.290% (b) (d) (Cost $1,660,652) | | | 1,660,652 | |
| | | | | | | | |
| | | | Total Investments — 100.0%
(Cost $125,865,648) | | | 125,555,926 | |
| | | | Liabilities in Excess of
Other Assets — 0.0% (e) | | | (17,668 | ) |
| | | | | | | | |
| | | | NET ASSETS — 100.0% | | $ | 125,538,258 | |
| | | | | | | | |
Percentages indicated are based on net assets.
SEE NOTES TO FINANCIAL STATEMENTS.
| | | | | | |
| | | |
| 60 | | | | JPMORGAN EXCHANGE-TRADED FUNDS | | OCTOBER 31, 2016 |
JPMorgan Diversified Return U.S. Mid Cap Equity ETF
SCHEDULE OF PORTFOLIO INVESTMENTS
AS OF OCTOBER 31, 2016
| | | | | | | | |
| SHARES | | | SECURITY DESCRIPTION | | VALUE($) | |
| Common Stocks — 98.4% | |
| | | | Consumer Discretionary — 16.1% | | | | |
| | | | Auto Components — 0.9% | | | | |
| | 123 | | | Adient plc (Ireland) (a) | | | 5,607 | |
| | 929 | | | Delphi Automotive plc (Jersey) | | | 60,450 | |
| | 6,119 | | | Gentex Corp. | | | 103,472 | |
| | 2,156 | | | Goodyear Tire & Rubber Co. (The) | | | 62,589 | |
| | 629 | | | Lear Corp. | | | 77,228 | |
| | | | | | | | |
| | | | | | | 309,346 | |
| | | | | | | | |
| | | | Automobiles — 0.6% | | | | |
| | 1,887 | | | Harley-Davidson, Inc. | | | 107,597 | |
| | 1,317 | | | Thor Industries, Inc. | | | 104,451 | |
| | | | | | | | |
| | | | | | | 212,048 | |
| | | | | | | | |
| | | | Distributors — 0.6% | | | | |
| | 1,271 | | | Genuine Parts Co. | | | 115,140 | |
| | 2,395 | | | LKQ Corp. (a) | | | 77,310 | |
| | 257 | | | Pool Corp. | | | 23,793 | |
| | | | | | | | |
| | | | | | | 216,243 | |
| | | | | | | | |
| | | | Diversified Consumer Services — 0.6% | |
| | 163 | | | Graham Holdings Co., Class B | | | 77,425 | |
| | 1,713 | | | H&R Block, Inc. | | | 39,348 | |
| | 1,909 | | | Service Corp. International | | | 48,870 | |
| | 1,257 | | | ServiceMaster Global Holdings, Inc. (a) | | | 44,988 | |
| | | | | | | | |
| | | | | | | 210,631 | |
| | | | | | | | |
| | | | Hotels, Restaurants & Leisure — 2.5% | |
| | 2,006 | | | Aramark | | | 74,683 | |
| | 1,230 | | | Brinker International, Inc. | | | 60,565 | |
| | 880 | | | Choice Hotels International, Inc. | | | 42,636 | |
| | 1,330 | | | Darden Restaurants, Inc. | | | 86,171 | |
| | 526 | | | Domino’s Pizza, Inc. | | | 89,020 | |
| | 981 | | | Dunkin’ Brands Group, Inc. | | | 47,441 | |
| | 2,169 | | | Hilton Worldwide Holdings, Inc. | | | 49,019 | |
| | 1,418 | | | International Game Technology plc (United Kingdom) | | | 40,725 | |
| | 734 | | | Norwegian Cruise Line Holdings Ltd. (Bermuda) (a) | | | 28,531 | |
| | 342 | | | Panera Bread Co., Class A (a) | | | 65,240 | |
| | 580 | | | Royal Caribbean Cruises Ltd. (Liberia) | | | 44,585 | |
| | 1,303 | | | Six Flags Entertainment Corp. | | | 72,512 | |
| | 474 | | | Vail Resorts, Inc. | | | 75,574 | |
| | 7,089 | | | Wendy’s Co. (The) | | | 76,845 | |
| | 863 | | | Wyndham Worldwide Corp. | | | 56,820 | |
| | | | | | | | |
| | | | | | | 910,367 | |
| | | | | | | | |
| | | | Household Durables — 2.6% | |
| | 2,391 | | | DR Horton, Inc. | | | 68,933 | |
| | | | | | | | |
| SHARES | | | SECURITY DESCRIPTION | | VALUE($) | |
| | | | | | | | |
| | | | Household Durables — continued | |
| | 1,597 | | | Garmin Ltd. (Switzerland) | | | 77,231 | |
| | 233 | | | Harman International Industries, Inc. | | | 18,573 | |
| | 3,475 | | | Leggett & Platt, Inc. | | | 159,433 | |
| | 1,612 | | | Lennar Corp., Class A | | | 67,204 | |
| | 435 | | | Mohawk Industries, Inc. (a) | | | 80,171 | |
| | 2,112 | | | Newell Rubbermaid, Inc. | | | 101,418 | |
| | 72 | | | NVR, Inc. (a) | | | 109,656 | |
| | 4,803 | | | PulteGroup, Inc. | | | 89,336 | |
| | 877 | | | Tempur Sealy International Inc. (a) | | | 47,419 | |
| | 1,164 | | | Tupperware Brands Corp. | | | 69,281 | |
| | 459 | | | Whirlpool Corp. | | | 68,767 | |
| | | | | | | | |
| | | | | | | 957,422 | |
| | | | | | | | |
| | | | Internet & Catalog Retail — 0.2% | |
| | 455 | | | Expedia, Inc. | | | 58,800 | |
| | | | | | | | |
| | | | Leisure Products — 0.9% | |
| | 1,861 | | | Brunswick Corp. | | | 80,954 | |
| | 1,245 | | | Hasbro, Inc. | | | 103,845 | |
| | 2,975 | | | Mattel, Inc. | | | 93,802 | |
| | 610 | | | Polaris Industries, Inc. | | | 46,732 | |
| | | | | | | | |
| | | | | | | 325,333 | |
| | | | | | | | |
| | | | Media — 2.3% | |
| | 1,892 | | | Cinemark Holdings, Inc. | | | 75,302 | |
| | 1,869 | | | Discovery Communications, Inc., Class A (a) | | | 48,800 | |
| | 1,526 | | | Discovery Communications, Inc., Class C (a) | | | 38,318 | |
| | 3,233 | | | Interpublic Group of Cos., Inc. (The) | | | 72,387 | |
| | 805 | | | Liberty SiriusXM Group, Class A (a) | | | 26,782 | |
| | 3,024 | | | MSG Networks, Inc. (a) | | | 57,758 | |
| | 1,177 | | | Omnicom Group, Inc. | | | 93,948 | |
| | 3,447 | | | Regal Entertainment Group, Class A | | | 74,145 | |
| | 1,134 | | | Scripps Networks Interactive, Inc., Class A | | | 72,984 | |
| | 18,747 | | | Sirius XM Holdings, Inc. | | | 78,175 | |
| | 4,169 | | | Starz (a) | | | 131,157 | |
| | 1,784 | | | TEGNA, Inc. | | | 35,002 | |
| | 998 | | | Viacom, Inc., Class B | | | 37,485 | |
| | | | | | | | |
| | | | | | | 842,243 | |
| | | | | | | | |
| | | | Multiline Retail — 0.9% | |
| | 798 | | | Dillard’s, Inc., Class A | | | 48,918 | |
| | 1,092 | | | Dollar General Corp. | | | 75,446 | |
| | 866 | | | Dollar Tree, Inc. (a) | | | 65,426 | |
| | 971 | | | Kohl’s Corp. | | | 42,481 | |
| | 1,112 | | | Macy’s, Inc. | | | 40,577 | |
| | 1,288 | | | Nordstrom, Inc. | | | 66,976 | |
| | | | | | | | |
| | | | | | | 339,824 | |
| | | | | | | | |
SEE NOTES TO FINANCIAL STATEMENTS.
| | | | | | | | |
| | | |
| OCTOBER 31, 2016 | | JPMORGAN EXCHANGE-TRADED FUNDS | | | | | 61 | |
JPMorgan Diversified Return U.S. Mid Cap Equity ETF
SCHEDULE OF PORTFOLIO INVESTMENTS
AS OF OCTOBER 31, 2016 (continued)
| | | | | | | | |
| SHARES | | | SECURITY DESCRIPTION | | VALUE($) | |
| Common Stocks — continued | |
| | | | Specialty Retail — 3.1% | |
| | 424 | | | Advance Auto Parts, Inc. | | | 59,394 | |
| | 1,062 | | | AutoNation, Inc. (a) | | | 46,590 | |
| | 121 | | | AutoZone, Inc. (a) | | | 89,801 | |
| | 232 | | | Bed Bath & Beyond, Inc. | | | 9,377 | |
| | 1,617 | | | Best Buy Co., Inc. | | | 62,918 | |
| | 813 | | | CarMax, Inc. (a) | | | 40,601 | |
| | 669 | | | CST Brands, Inc. | | | 32,125 | |
| | 912 | | | Dick’s Sporting Goods, Inc. | | | 50,753 | |
| | 1,255 | | | Foot Locker, Inc. | | | 83,796 | |
| | 1,189 | | | GameStop Corp., Class A | | | 28,596 | |
| | 1,909 | | | Gap, Inc. (The) | | | 52,669 | |
| | 723 | | | L Brands, Inc. | | | 52,193 | |
| | 807 | | | Murphy USA, Inc. (a) | | | 55,506 | |
| | 319 | | | O’Reilly Automotive, Inc. (a) | | | 84,356 | |
| | 478 | | | Penske Automotive Group, Inc. | | | 21,391 | |
| | 1,457 | | | Ross Stores, Inc. | | | 91,121 | |
| | 449 | | | Sally Beauty Holdings, Inc. (a) | | | 11,647 | |
| | 470 | | | Signet Jewelers Ltd. (Bermuda) | | | 38,192 | |
| | 4,378 | | | Staples, Inc. | | | 32,397 | |
| | 622 | | | Tiffany & Co. | | | 45,667 | |
| | 296 | | | Ulta Salon Cosmetics & Fragrance, Inc. (a) | | | 72,029 | |
| | 1,290 | | | Williams-Sonoma, Inc. | | | 59,624 | |
| | | | | | | | |
| | | | | | | 1,120,743 | |
| | | | | | | | |
| | | | Textiles, Apparel & Luxury Goods — 0.9% | |
| | 841 | | | Carter’s, Inc. | | | 72,612 | |
| | 1,864 | | | Coach, Inc. | | | 66,899 | |
| | 2,413 | | | Hanesbrands, Inc. | | | 62,014 | |
| | 1,032 | | | lululemon athletica, Inc. (a) | | | 59,082 | |
| | 1,094 | | | Michael Kors Holdings Ltd. (Virgin Islands (British)) (a) | | | 55,553 | |
| | 726 | | | Under Armour, Inc., Class C (a) | | | 18,775 | |
| | | | | | | | |
| | | | | | | 334,935 | |
| | | | | | | | |
| | | | Total Consumer Discretionary | | | 5,837,935 | |
| | | | | | | | |
| | | | Consumer Staples — 7.2% | | | | |
| | | | Beverages — 0.9% | | | | |
| | 2,703 | | | Brown-Forman Corp., Class B | | | 124,798 | |
| | 1,265 | | | Dr. Pepper Snapple Group, Inc. | | | 111,054 | |
| | 761 | | | Molson Coors Brewing Co., Class B | | | 78,999 | |
| | | | | | | | |
| | | | | | | 314,851 | |
| | | | | | | | |
| | | | Food & Staples Retailing — 0.2% | | | | |
| | 331 | | | Casey’s General Stores, Inc. | | | 37,400 | |
| | 6,803 | | | Rite Aid Corp. (a) | | | 45,648 | |
| | | | | | | | |
| | | | | | | 83,048 | |
| | | | | | | | |
| | | | | | | | |
| SHARES | | | SECURITY DESCRIPTION | | VALUE($) | |
| | | | | | | | |
| | | | Food Products — 4.4% | | | | |
| | 70 | | | Bunge Ltd. (Bermuda) | | | 4,341 | |
| | 2,270 | | | Campbell Soup Co. | | | 123,352 | |
| | 2,388 | | | ConAgra Foods, Inc. | | | 115,054 | |
| | 5,748 | | | Flowers Foods, Inc. | | | 89,209 | |
| | 1,290 | | | Hershey Co. (The) | | | 132,173 | |
| | 3,064 | | | Hormel Foods Corp. | | | 117,964 | |
| | 924 | | | Ingredion, Inc. | | | 121,201 | |
| | 1,035 | | | JM Smucker Co. (The) | | | 135,906 | |
| | 2,249 | | | Kellogg Co. | | | 168,967 | |
| | 1,706 | | | McCormick & Co., Inc. (Non-Voting) | | | 163,554 | |
| | 1,384 | | | Mead Johnson Nutrition Co., Class A | | | 103,482 | |
| | 3,225 | | | Pilgrim’s Pride Corp. | | | 70,434 | |
| | 2,303 | | | Pinnacle Foods, Inc. | | | 118,420 | |
| | 765 | | | Post Holdings, Inc. (a) | | | 58,316 | |
| | 1,111 | | | Tyson Foods, Inc., Class A | | | 78,714 | |
| | | | | | | | |
| | | | | | | 1,601,087 | |
| | | | | | | | |
| | | | Household Products — 1.1% | | | | |
| | 3,141 | | | Church & Dwight Co., Inc. | | | 151,585 | |
| | 1,327 | | | Clorox Co. (The) | | | 159,267 | |
| | 693 | | | Spectrum Brands Holdings, Inc. | | | 93,721 | |
| | | | | | | | |
| | | | | | | 404,573 | |
| | | | | | | | |
| | | | Personal Products — 0.6% | | | | |
| | 3,056 | | | Coty, Inc., Class A | | | 70,258 | |
| | 581 | | | Edgewell Personal Care Co. (a) | | | 43,807 | |
| | 1,266 | | | Nu Skin Enterprises, Inc., Class A | | | 78,049 | |
| | | | | | | | |
| | | | | | | 192,114 | |
| | | | | | | | |
| | | | Total Consumer Staples | | | 2,595,673 | |
| | | | | | | | |
| | | | Energy — 3.6% | | | | |
| | | | Energy Equipment & Services — 1.3% | | | | |
| | 823 | | | Dril-Quip, Inc. (a) | | | 39,093 | |
| | 4,121 | | | Ensco plc, Class A (United Kingdom) | | | 32,226 | |
| | 2,510 | | | FMC Technologies, Inc. (a) | | | 80,998 | |
| | 508 | | | Helmerich & Payne, Inc. | | | 32,060 | |
| | 4,656 | | | Nabors Industries Ltd. (Bermuda) | | | 55,406 | |
| | 1,428 | | | National Oilwell Varco, Inc. | | | 45,839 | |
| | 1,498 | | | Oceaneering International, Inc. | | | 35,652 | |
| | 1,226 | | | Patterson-UTI Energy, Inc. | | | 27,560 | |
| | 1,865 | | | Rowan Co. plc, Class A (United Kingdom) | | | 24,749 | |
| | 2,807 | | | RPC, Inc. | | | 48,477 | |
| | 3,737 | | | Transocean Ltd. (Switzerland) | | | 35,913 | |
| | | | | | | | |
| | | | | | | 457,973 | |
| | | | | | | | |
| | | | Oil, Gas & Consumable Fuels — 2.3% | | | | |
| | 1,230 | | | Antero Resources Corp. (a) | | | 32,558 | |
SEE NOTES TO FINANCIAL STATEMENTS.
| | | | | | |
| | | |
| 62 | | | | JPMORGAN EXCHANGE-TRADED FUNDS | | OCTOBER 31, 2016 |
| | | | | | | | |
| SHARES | | | SECURITY DESCRIPTION | | VALUE($) | |
| Common Stocks — continued | |
| | | | Oil, Gas & Consumable Fuels — continued | | | | |
| | 78 | | | Cheniere Energy, Inc. (a) | | | 2,941 | |
| | 2,739 | | | Chesapeake Energy Corp. (a) | | | 15,092 | |
| | 604 | | | Diamondback Energy, Inc. (a) | | | 55,139 | |
| | 119 | | | Energen Corp. | | | 5,965 | |
| | 850 | | | Hess Corp. | | | 40,774 | |
| | 1,831 | | | HollyFrontier Corp. | | | 45,683 | |
| | 468 | | | Laredo Petroleum, Inc. (a) | | | 5,578 | |
| | 2,354 | | | Marathon Oil Corp. | | | 31,026 | |
| | 1,693 | | | Marathon Petroleum Corp. | | | 73,798 | |
| | 1,240 | | | Murphy Oil Corp. | | | 32,079 | |
| | 1,383 | | | Noble Energy, Inc. | | | 47,672 | |
| | 4,398 | | | ONEOK, Inc. | | | 212,995 | |
| | 1,983 | | | Parsley Energy, Inc., Class A (a) | | | 65,241 | |
| | 1,488 | | | PBF Energy, Inc., Class A | | | 32,438 | |
| | 1,925 | | | QEP Resources, Inc. (a) | | | 30,935 | |
| | 493 | | | SM Energy Co. | | | 16,580 | |
| | 973 | | | Targa Resources Corp. | | | 42,715 | |
| | 548 | | | Tesoro Corp. | | | 46,564 | |
| | 489 | | | World Fuel Services Corp. | | | 19,682 | |
| | | | | | | | |
| | | | | | | 855,455 | |
| | | | | | | | |
| | | | Total Energy | | | 1,313,428 | |
| | | | | | | | |
| | | | Financials — 8.7% | | | | |
| | | | Banks — 1.6% | | | | |
| | 595 | | | Associated Banc-Corp | | | 12,079 | |
| | 416 | | | Bank of Hawaii Corp. | | | 31,262 | |
| | 701 | | | BankUnited, Inc. | | | 20,427 | |
| | 910 | | | Commerce Bancshares, Inc. | | | 45,336 | |
| | 567 | | | Cullen/Frost Bankers, Inc. | | | 43,086 | |
| | 1,018 | | | East West Bancorp, Inc. | | | 40,221 | |
| | 1,446 | | | Fifth Third Bancorp | | | 31,465 | |
| | 1,534 | | | First Horizon National Corp. | | | 23,639 | |
| | 683 | | | First Republic Bank | | | 50,836 | |
| | 3,732 | | | Huntington Bancshares, Inc. | | | 39,559 | |
| | 519 | | | PacWest Bancorp | | | 22,520 | |
| | 3,923 | | | People’s United Financial, Inc. | | | 63,710 | |
| | 597 | | | Popular, Inc. (Puerto Rico) | | | 21,671 | |
| | 4,302 | | | Regions Financial Corp. | | | 46,075 | |
| | 845 | | | SunTrust Banks, Inc. | | | 38,219 | |
| | 19 | | | SVB Financial Group (a) | | | 2,323 | |
| | 1,131 | | | Synovus Financial Corp. | | | 37,402 | |
| | 659 | | | Western Alliance Bancorp (a) | | | 24,620 | |
| | | | | | | | |
| | | | | | | 594,450 | |
| | | | | | | | |
| | | | Capital Markets — 1.7% | | | | |
| | 331 | | | Ameriprise Financial, Inc. | | | 29,257 | |
| | | | | | | | |
| SHARES | | | SECURITY DESCRIPTION | | VALUE($) | |
| | | | | | | | |
| | | | Capital Markets — continued | | | | |
| | 364 | | | CBOE Holdings, Inc. | | | 23,008 | |
| | 184 | | | Donnelley Financial Solutions, Inc. (a) | | | 3,947 | |
| | 744 | | | Eaton Vance Corp. | | | 26,085 | |
| | 597 | | | FactSet Research Systems, Inc. | | | 92,368 | |
| | 1,139 | | | Federated Investors, Inc., Class B | | | 30,753 | |
| | 653 | | | Invesco Ltd. (Bermuda) | | | 18,343 | |
| | 551 | | | Lazard Ltd., Class A (Bermuda) | | | 20,090 | |
| | 74 | | | Legg Mason, Inc. | | | 2,125 | |
| | 617 | | | LPL Financial Holdings, Inc. | | | 19,102 | |
| | 222 | | | MarketAxess Holdings, Inc. | | | 33,469 | |
| | 384 | | | MSCI, Inc., Class A | | | 30,793 | |
| | 938 | | | Nasdaq, Inc. | | | 60,004 | |
| | 572 | | | Northern Trust Corp. | | | 41,424 | |
| | 545 | | | Raymond James Financial, Inc. | | | 32,765 | |
| | 1,047 | | | SEI Investments Co. | | | 46,414 | |
| | 603 | | | T. Rowe Price Group, Inc. | | | 38,598 | |
| | 1,401 | | | TD Ameritrade Holding Corp. | | | 47,928 | |
| | | | | | | | |
| | | | | | | 596,473 | |
| | | | | | | | |
| | | | Consumer Finance — 0.2% | |
| | 1,575 | | | Navient Corp. | | | 20,129 | |
| | 1,105 | | | Santander Consumer USA Holdings, Inc. (a) | | | 13,481 | |
| | 4,883 | | | SLM Corp. (a) | | | 34,425 | |
| | 755 | | | Synchrony Financial | | | 21,585 | |
| | | | | | | | |
| | | | | | | 89,620 | |
| | | | | | | | |
| | | | Insurance — 4.4% | |
| | 103 | | | Alleghany Corp. (a) | | | 53,170 | |
| | 2,430 | | | Allied World Assurance Co. Holdings AG (Switzerland) | | | 104,441 | |
| | 960 | | | American Financial Group, Inc. | | | 71,520 | |
| | 854 | | | AmTrust Financial Services, Inc. | | | 22,537 | |
| | 1,154 | | | Arch Capital Group Ltd. (Bermuda) (a) | | | 89,977 | |
| | 1,323 | | | Arthur J Gallagher & Co. | | | 63,808 | |
| | 1,151 | | | Aspen Insurance Holdings Ltd. (Bermuda) | | | 55,536 | |
| | 617 | | | Assurant, Inc. | | | 49,681 | |
| | 826 | | | Assured Guaranty Ltd. (Bermuda) | | | 24,689 | |
| | 1,060 | | | Axis Capital Holdings Ltd. (Bermuda) | | | 60,388 | |
| | 1,468 | | | Brown & Brown, Inc. | | | 54,110 | |
| | 823 | | | Cincinnati Financial Corp. | | | 58,252 | |
| | 52 | | | CNA Financial Corp. | | | 1,902 | |
| | 697 | | | Endurance Specialty Holdings Ltd. (Bermuda) | | | 64,089 | |
| | 189 | | | Erie Indemnity Co., Class A | | | 19,352 | |
| | 285 | | | Everest Re Group Ltd. (Bermuda) | | | 58,003 | |
| | 626 | | | First American Financial Corp. | | | 24,452 | |
| | 1,211 | | | FNF Group | | | 43,487 | |
| | 308 | | | Hanover Insurance Group, Inc. | | | 23,467 | |
SEE NOTES TO FINANCIAL STATEMENTS.
| | | | | | | | |
| | | |
| OCTOBER 31, 2016 | | JPMORGAN EXCHANGE-TRADED FUNDS | | | | | 63 | |
JPMorgan Diversified Return U.S. Mid Cap Equity ETF
SCHEDULE OF PORTFOLIO INVESTMENTS
AS OF OCTOBER 31, 2016 (continued)
| | | | | | | | |
| SHARES | | | SECURITY DESCRIPTION | | VALUE($) | |
| Common Stocks — continued | | | | |
| | | | Insurance — continued | |
| | 1,046 | | | Hartford Financial Services Group, Inc. (The) | | | 46,139 | |
| | 58 | | | Markel Corp. (a) | | | 50,891 | |
| | 500 | | | Mercury General Corp. | | | 27,235 | |
| | 1,839 | | | Old Republic International Corp. | | | 31,006 | |
| | 847 | | | Principal Financial Group, Inc. | | | 46,246 | |
| | 1,601 | | | Progressive Corp. (The) | | | 50,447 | |
| | 724 | | | Reinsurance Group of America, Inc., Class A | | | 78,091 | |
| | 458 | | | RenaissanceRe Holdings Ltd. (Bermuda) | | | 56,925 | |
| | 1,065 | | | Torchmark Corp. | | | 67,532 | |
| | 1,305 | | | Unum Group | | | 46,197 | |
| | 1,052 | | | Validus Holdings Ltd. (Bermuda) | | | 53,757 | |
| | 1,043 | | | W.R. Berkley Corp. | | | 59,555 | |
| | 1,275 | | | XL Group Ltd. (Bermuda) | | | 44,242 | |
| | | | | | | | |
| | | | | | | 1,601,124 | |
| | | | | | | | |
| | | | Mortgage Real Estate Investment Trusts (REITs) — 0.8% | |
| | 2,901 | | | AGNC Investment Corp. | | | 58,194 | |
| | 4,686 | | | Annaly Capital Management, Inc. | | | 48,547 | |
| | 1,654 | | | Chimera Investment Corp. | | | 25,918 | |
| | 5,501 | | | MFA Financial, Inc. | | | 40,212 | |
| | 2,365 | | | Starwood Property Trust, Inc. | | | 52,598 | |
| | 5,826 | | | Two Harbors Investment Corp. | | | 48,531 | |
| | | | | | | | |
| | | | | | | 274,000 | |
| | | | | | | | |
| | | | Total Financials | | | 3,155,667 | |
| | | | | | | | |
| | | | Health Care — 11.6% | |
| | | | Biotechnology — 0.3% | |
| | 574 | | | Incyte Corp. (a) | | | 49,921 | |
| | 392 | | | United Therapeutics Corp. (a) | | | 47,067 | |
| | | | | | | | |
| | | | | | | 96,988 | |
| | | | | | | | |
| | | | Health Care Equipment & Supplies — 5.0% | |
| | 568 | | | ABIOMED, Inc. (a) | | | 59,635 | |
| | 735 | | | Alere, Inc. (a) | | | 32,840 | |
| | 1,336 | | | Align Technology, Inc. (a) | | | 114,789 | |
| | 820 | | | C.R. Bard, Inc. | | | 177,678 | |
| | 704 | | | Cooper Co., Inc. | | | 123,932 | |
| | 2,616 | | | DENTSPLY SIRONA, Inc. | | | 150,603 | |
| | 878 | | | Edwards Lifesciences Corp. (a) | | | 83,603 | |
| | 2,093 | | | Hill-Rom Holdings, Inc. | | | 115,973 | |
| | 2,728 | | | Hologic, Inc. (a) | | | 98,235 | |
| | 1,293 | | | IDEXX Laboratories, Inc. (a) | | | 138,532 | |
| | 129 | | | Intuitive Surgical, Inc. (a) | | | 86,698 | |
| | 1,803 | | | ResMed, Inc. | | | 107,765 | |
| | 1,532 | | | St. Jude Medical, Inc. | | | 119,251 | |
| | 967 | | | Teleflex, Inc. | | | 138,407 | |
| | 1,249 | | | Varian Medical Systems, Inc. (a) | | | 113,322 | |
| | | | | | | | |
| SHARES | | | SECURITY DESCRIPTION | | VALUE($) | |
| | | | | | | | |
| | | | Health Care Equipment & Supplies — continued | |
| | 266 | | | West Pharmaceutical Services, Inc. | | | 20,224 | |
| | 1,110 | | | Zimmer Biomet Holdings, Inc. | | | 116,994 | |
| | | | | | | | |
| | | | | | | 1,798,481 | |
| | | | | | | | |
| | | | Health Care Providers & Services — 3.5% | |
| | 1,291 | | | Amsurg Corp. (a) | | | 77,137 | |
| | 191 | | | Brookdale Senior Living, Inc. (a) | | | 2,756 | |
| | 1,555 | | | Centene Corp. (a) | | | 97,156 | |
| | 1,168 | | | Henry Schein, Inc. (a) | | | 174,266 | |
| | 1,197 | | | Laboratory Corp. of America Holdings (a) | | | 150,032 | |
| | 1,997 | | | LifePoint Health, Inc. (a) | | | 119,521 | |
| | 2,225 | | | MEDNAX, Inc. (a) | | | 136,281 | |
| | 3,028 | | | Patterson Cos., Inc. | | | 129,326 | |
| | 1,476 | | | Quest Diagnostics, Inc. | | | 120,205 | |
| | 768 | | | Universal Health Services, Inc., Class B | | | 92,705 | |
| | 1,251 | | | VCA, Inc. (a) | | | 76,887 | |
| | 865 | | | WellCare Health Plans, Inc. (a) | | | 98,186 | |
| | | | | | | | |
| | | | | | | 1,274,458 | |
| | | | | | | | |
| | | | Health Care Technology — 0.5% | |
| | 5,515 | | | Allscripts Healthcare Solutions, Inc. (a) | | | 66,235 | |
| | 1,325 | | | Cerner Corp. (a) | | | 77,619 | |
| | 998 | | | Veeva Systems, Inc., Class A (a) | | | 38,772 | |
| | | | | | | | |
| | | | | | | 182,626 | |
| | | | | | | | |
| | | | Life Sciences Tools & Services — 1.6% | |
| | 1,309 | | | Agilent Technologies, Inc. | | | 57,033 | |
| | 675 | | | Bio-Techne Corp. | | | 70,193 | |
| | 914 | | | Charles River Laboratories International, Inc. (a) | | | 69,354 | |
| | 410 | | | Illumina, Inc. (a) | | | 55,818 | |
| | 146 | | | Mettler-Toledo International, Inc. (a) | | | 58,996 | |
| | 507 | | | PerkinElmer, Inc. | | | 25,801 | |
| | 1,768 | | | Quintiles Transnational Holdings, Inc. (a) | | | 126,836 | |
| | 840 | | | Waters Corp. (a) | | | 116,878 | |
| | | | | | | | |
| | | | | | | 580,909 | |
| | | | | | | | |
| | | | Pharmaceuticals — 0.7% | |
| | 1,094 | | | Akorn, Inc. (a) | | | 26,201 | |
| | 635 | | | Mallinckrodt plc (Ireland) (a) | | | 37,630 | |
| | 608 | | | Perrigo Co. plc (Ireland) | | | 50,580 | |
| | 2,858 | | | Zoetis, Inc., Class A | | | 136,612 | |
| | | | | | | | |
| | | | | | | 251,023 | |
| | | | | | | | |
| | | | Total Health Care | | | 4,184,485 | |
| | | | | | | | |
| | | | Industrials — 11.6% | |
| | | | Aerospace & Defense — 1.1% | |
| | 1,459 | | | Alcoa, Inc. | | | 41,903 | |
SEE NOTES TO FINANCIAL STATEMENTS.
| | | | | | |
| | | |
| 64 | | | | JPMORGAN EXCHANGE-TRADED FUNDS | | OCTOBER 31, 2016 |
| | | | | | | | |
| SHARES | | | SECURITY DESCRIPTION | | VALUE($) | |
| Common Stocks — continued | | | | |
| | | | Aerospace & Defense — continued | |
| | 901 | | | B/E Aerospace, Inc. | | | 53,627 | |
| | 1,224 | | | Hexcel Corp. | | | 55,680 | |
| | 203 | | | Huntington Ingalls Industries, Inc. | | | 32,756 | |
| | 297 | | | L-3 Communications Holdings, Inc., Class 3 | | | 40,671 | |
| | 555 | | | Orbital ATK, Inc. | | | 41,270 | |
| | 584 | | | Rockwell Collins, Inc. | | | 49,243 | |
| | 892 | | | Spirit AeroSystems Holdings, Inc., Class A | | | 44,921 | |
| | 900 | | | Textron, Inc. | | | 36,072 | |
| | | | | | | | |
| | | | | | | 396,143 | |
| | | | | | | | |
| | | | Air Freight & Logistics — 0.2% | |
| | 547 | | | C.H. Robinson Worldwide, Inc. | | | 37,262 | |
| | 880 | | | Expeditors International of Washington, Inc. | | | 45,293 | |
| | | | | | | | |
| | | | | | | 82,555 | |
| | | | | | | | |
| | | | Airlines — 0.7% | |
| | 777 | | | Alaska Air Group, Inc. | | | 56,115 | |
| | 1,519 | | | American Airlines Group, Inc. | | | 61,671 | |
| | 358 | | | Copa Holdings S.A., Class A (Panama) | | | 33,018 | |
| | 2,670 | | | JetBlue Airways Corp. (a) | | | 46,672 | |
| | 589 | | | Spirit Airlines, Inc. (a) | | | 28,231 | |
| | 694 | | | United Continental Holdings, Inc. (a) | | | 39,024 | |
| | | | | | | | |
| | | | | | | 264,731 | |
| | | | | | | | |
| | | | Building Products — 1.0% | |
| | 426 | | | Allegion plc (Ireland) | | | 27,196 | |
| | 1,162 | | | AO Smith Corp. | | | 52,488 | |
| | 283 | | | Armstrong World Industries, Inc. (a) | | | 10,612 | |
| | 842 | | | Fortune Brands Home & Security, Inc. | | | 45,998 | |
| | 1,232 | | | Johnson Controls International plc (Ireland) | | | 49,674 | |
| | 425 | | | Lennox International, Inc. | | | 62,003 | |
| | 1,597 | | | Masco Corp. | | | 49,315 | |
| | 775 | | | Owens Corning | | | 37,805 | |
| | 1,271 | | | USG Corp. (a) | | | 32,004 | |
| | | | | | | | |
| | | | | | | 367,095 | |
| | | | | | | | |
| | | | Commercial Services & Supplies — 1.4% | |
| | 723 | | | Cintas Corp. | | | 77,123 | |
| | 2,551 | | | Copart, Inc. (a) | | | 133,851 | |
| | 1,261 | | | Covanta Holding Corp. | | | 18,915 | |
| | 2,558 | | | KAR Auction Services, Inc. | | | 108,920 | |
| | 184 | | | LSC Communications, Inc. | | | 4,460 | |
| | 4,100 | | | Pitney Bowes, Inc. | | | 73,144 | |
| | 1,891 | | | Republic Services, Inc., Class A | | | 99,523 | |
| | 491 | | | RR Donnelley & Sons Co. | | | 8,715 | |
| | | | | | | | |
| | | | | | | 524,651 | |
| | | | | | | | |
| | | | | | | | |
| SHARES | | | SECURITY DESCRIPTION | | VALUE($) | |
| | | | | | | | |
| | | | Construction & Engineering — 0.3% | |
| | 770 | | | Fluor Corp. | | | 40,032 | |
| | 23 | | | Jacobs Engineering Group, Inc. (a) | | | 1,187 | |
| | 403 | | | Valmont Industries, Inc. | | | 51,564 | |
| | | | | | | | |
| | | | | | | 92,783 | |
| | | | | | | | |
| | | | Electrical Equipment — 0.6% | |
| | 141 | | | Acuity Brands, Inc. | | | 31,523 | |
| | 1,058 | | | AMETEK, Inc. | | | 46,658 | |
| | 709 | | | Hubbell, Inc., Class B | | | 74,105 | |
| | 256 | | | Regal Beloit Corp. | | | 15,130 | |
| | 432 | | | Rockwell Automation, Inc. | | | 51,719 | |
| | | | | | | | |
| | | | | | | 219,135 | |
| | | | | | | | |
| | | | Industrial Conglomerates — 0.3% | |
| | 482 | | | Carlisle Co., Inc. | | | 50,538 | |
| | 275 | | | Roper Technologies, Inc. | | | 47,660 | |
| | | | | | | | |
| | | | | | | 98,198 | |
| | | | | | | | |
| | | | Machinery — 3.8% | |
| | 978 | | | AGCO Corp. | | | 49,956 | |
| | 1,829 | | | Allison Transmission Holdings, Inc. | | | 53,571 | |
| | 461 | | | Crane Co. | | | 31,353 | |
| | 537 | | | Cummins, Inc. | | | 68,639 | |
| | 741 | | | Donaldson Co., Inc. | | | 27,061 | |
| | 679 | | | Dover Corp. | | | 45,418 | |
| | 745 | | | Flowserve Corp. | | | 31,551 | |
| | 761 | | | Graco, Inc. | | | 56,999 | |
| | 716 | | | IDEX Corp. | | | 61,891 | |
| | 741 | | | Ingersoll-Rand plc (Ireland) | | | 49,862 | |
| | 491 | | | ITT, Inc. | | | 17,293 | |
| | 721 | | | Lincoln Electric Holdings, Inc. | | | 47,464 | |
| | 824 | | | Middleby Corp. (a) | | | 92,379 | |
| | 323 | | | Nordson Corp. | | | 32,342 | |
| | 606 | | | Oshkosh Corp. | | | 32,421 | |
| | 723 | | | PACCAR, Inc. | | | 39,707 | |
| | 334 | | | Parker-Hannifin Corp. | | | 40,999 | |
| | 893 | | | Snap-on, Inc. | | | 137,611 | |
| | 2,242 | | | SPX Corp. (a) | | | 42,621 | |
| | 1,113 | | | Stanley Black & Decker, Inc. | | | 126,704 | |
| | 373 | | | Terex Corp. | | | 8,907 | |
| | 759 | | | Timken Co. (The) | | | 25,085 | |
| | 2,391 | | | Toro Co. (The) | | | 114,481 | |
| | 595 | | | Trinity Industries, Inc. | | | 12,703 | |
| | 585 | | | WABCO Holdings, Inc. (a) | | | 57,599 | |
| | 1,422 | | | Xylem, Inc. | | | 68,725 | |
| | | | | | | | |
| | | | | | | 1,373,342 | |
| | | | | | | | |
SEE NOTES TO FINANCIAL STATEMENTS.
| | | | | | | | |
| | | |
| OCTOBER 31, 2016 | | JPMORGAN EXCHANGE-TRADED FUNDS | | | | | 65 | |
JPMorgan Diversified Return U.S. Mid Cap Equity ETF
SCHEDULE OF PORTFOLIO INVESTMENTS
AS OF OCTOBER 31, 2016 (continued)
| | | | | | | | |
| SHARES | | | SECURITY DESCRIPTION | | VALUE($) | |
| Common Stocks — continued | | | | |
| | | | Marine — 0.0% (e) | |
| | 218 | | | Kirby Corp. (a) | | | 12,851 | |
| | | | | | | | |
| | | | Professional Services — 0.9% | |
| | 491 | | | Dun & Bradstreet Corp. (The) | | | 61,301 | |
| | 451 | | | Equifax, Inc. | | | 55,910 | |
| | 437 | | | ManpowerGroup, Inc. | | | 33,562 | |
| | 1,536 | | | Nielsen Holdings plc (United Kingdom) | | | 69,151 | |
| | 994 | | | Robert Half International, Inc. | | | 37,195 | |
| | 750 | | | Verisk Analytics, Inc., Class A (a) | | | 61,163 | |
| | | | | | | | |
| | | | | | | 318,282 | |
| | | | | | | | |
| | | | Road & Rail — 0.6% | |
| | 749 | | | Avis Budget Group, Inc. (a) | | | 24,238 | |
| | 650 | | | J.B. Hunt Transport Services, Inc. | | | 53,046 | |
| | 440 | | | Kansas City Southern | | | 38,614 | |
| | 898 | | | Landstar System, Inc. | | | 63,893 | |
| | 394 | | | Ryder System, Inc. | | | 27,340 | |
| | | | | | | | |
| | | | | | | 207,131 | |
| | | | | | | | |
| | | | Trading Companies & Distributors — 0.6% | |
| | 792 | | | Air Lease Corp., Class A | | | 23,966 | |
| | 627 | | | Fastenal Co. | | | 24,440 | |
| | 519 | | | GATX Corp. | | | 22,717 | |
| | 438 | | | MSC Industrial Direct Co., Inc., Class A | | | 31,886 | |
| | 351 | | | United Rentals, Inc. (a) | | | 26,557 | |
| | 128 | | | W.W. Grainger, Inc. | | | 26,639 | |
| | 395 | | | Watsco, Inc. | | | 54,230 | |
| | | | | | | | |
| | | | | | | 210,435 | |
| | | | | | | | |
| | | | Transportation Infrastructure — 0.1% | |
| | 319 | | | Macquarie Infrastructure Corp. | | | 26,097 | |
| | | | | | | | |
| | | | Total Industrials | | | 4,193,429 | |
| | | | | | | | |
| | | | Information Technology — 14.5% | |
| | | | Communications Equipment — 1.7% | |
| | 735 | | | Arista Networks, Inc. (a) | | | 62,291 | |
| | 1,504 | | | ARRIS International plc (United Kingdom) (a) | | | 41,781 | |
| | 7,293 | | | Brocade Communications Systems, Inc. | | | 77,306 | |
| | 814 | | | CommScope Holding Co., Inc. (a) | | | 24,868 | |
| | 939 | | | F5 Networks, Inc. (a) | | | 129,779 | |
| | 1,064 | | | Harris Corp. | | | 94,919 | |
| | 2,726 | | | Juniper Networks, Inc. | | | 71,803 | |
| | 1,326 | | | Motorola Solutions, Inc. | | | 96,241 | |
| | | | | | | | |
| | | | | | | 598,988 | |
| | | | | | | | |
| | | | Electronic Equipment, Instruments & Components — 1.6% | |
| | 1,103 | | | Amphenol Corp., Class A | | | 72,721 | |
| | 638 | | | Arrow Electronics, Inc. (a) | | | 38,994 | |
| | 1,243 | | | Avnet, Inc. | | | 52,144 | |
| | | | | | | | |
| SHARES | | | SECURITY DESCRIPTION | | VALUE($) | |
| | | | | | | | |
| | | | Electronic Equipment, Instruments & Components — continued | |
| | 1,117 | | | AVX Corp. | | | 15,660 | |
| | 2,164 | | | CDW Corp. | | | 97,185 | |
| | 194 | | | Dolby Laboratories, Inc., Class A | | | 9,232 | |
| | 1,653 | | | FLIR Systems, Inc. | | | 54,417 | |
| | 2,159 | | | Ingram Micro, Inc., Class A | | | 80,315 | |
| | 265 | | | IPG Photonics Corp. (a) | | | 25,708 | |
| | 1,416 | | | Jabil Circuit, Inc. | | | 30,217 | |
| | 1,340 | | | National Instruments Corp. | | | 37,641 | |
| | 60 | | | Tech Data Corp. (a) | | | 4,621 | |
| | 902 | | | Zebra Technologies Corp., Class A (a) | | | 59,388 | |
| | | | | | | | |
| | | | | | | 578,243 | |
| | | | | | | | |
| | | | Internet Software & Services — 0.7% | |
| | 1,399 | | | Akamai Technologies, Inc. (a) | | | 97,189 | |
| | 1,107 | | | IAC/Interactive Corp. | | | 71,335 | |
| | 1,068 | | | VeriSign, Inc. (a) | | | 89,733 | |
| | | | | | | | |
| | | | | | | 258,257 | |
| | | | | | | | |
| | | | IT Services — 3.5% | |
| | 3,062 | | | Amdocs Ltd. (Guernsey) | | | 178,974 | |
| | 836 | | | Booz Allen Hamilton Holding Corp., Class A | | | 25,473 | |
| | 1,594 | | | Broadridge Financial Solutions, Inc. | | | 103,068 | |
| | 1,796 | | | Computer Sciences Corp. | | | 97,792 | |
| | 370 | | | CoreLogic, Inc. (a) | | | 15,747 | |
| | 1,180 | | | CSRA, Inc. | | | 29,606 | |
| | 1,110 | | | DST Systems, Inc. | | | 106,738 | |
| | 312 | | | Euronet Worldwide, Inc. (a) | | | 24,820 | |
| | 744 | | | Fidelity National Information Services, Inc. | | | 54,996 | |
| | 902 | | | Fiserv, Inc. (a) | | | 88,829 | |
| | 1,010 | | | Gartner, Inc. (a) | | | 86,900 | |
| | 786 | | | Global Payments, Inc. | | | 57,001 | |
| | 745 | | | Jack Henry & Associates, Inc. | | | 60,360 | |
| | 1,528 | | | Leidos Holdings, Inc. | | | 63,519 | |
| | 880 | | | Paychex, Inc. | | | 48,576 | |
| | 1,927 | | | Sabre Corp. | | | 49,774 | |
| | 347 | | | Teradata Corp. (a) | | | 9,355 | |
| | 1,072 | | | Total System Services, Inc. | | | 53,471 | |
| | 785 | | | Vantiv, Inc., Class A (a) | | | 45,813 | |
| | 1,311 | | | Western Union Co. (The) | | | 26,312 | |
| | 3,740 | | | Xerox Corp. | | | 36,540 | |
| | | | | | | | |
| | | | | | | 1,263,664 | |
| | | | | | | | |
| | | | Semiconductors & Semiconductor Equipment — 3.1% | |
| | 1,522 | | | Analog Devices, Inc. | | | 97,560 | |
| | 6,962 | | | Cypress Semiconductor Corp. | | | 69,411 | |
| | 776 | | | First Solar, Inc. (a) | | | 31,420 | |
SEE NOTES TO FINANCIAL STATEMENTS.
| | | | | | |
| | | |
| 66 | | | | JPMORGAN EXCHANGE-TRADED FUNDS | | OCTOBER 31, 2016 |
| | | | | | | | |
| SHARES | | | SECURITY DESCRIPTION | | VALUE($) | |
| Common Stocks — continued | | | | |
| | | | Semiconductors & Semiconductor Equipment — continued | |
| | 1,127 | | | KLA-Tencor Corp. | | | 84,649 | |
| | 921 | | | Lam Research Corp. | | | 89,208 | |
| | 1,902 | | | Linear Technology Corp. | | | 114,234 | |
| | 5,817 | | | Marvell Technology Group Ltd. (Bermuda) | | | 75,796 | |
| | 2,309 | | | Maxim Integrated Products, Inc. | | | 91,506 | |
| | 1,670 | | | Microchip Technology, Inc. | | | 101,119 | |
| | 1,179 | | | NVIDIA Corp. | | | 83,898 | |
| | 4,181 | | | ON Semiconductor Corp. (a) | | | 48,792 | |
| | 594 | | | Qorvo, Inc. (a) | | | 33,056 | |
| | 759 | | | Skyworks Solutions, Inc. | | | 58,397 | |
| | 3,630 | | | Teradyne, Inc. | | | 84,543 | |
| | 1,324 | | | Xilinx, Inc. | | | 67,352 | |
| | | | | | | | |
| | | | | | | 1,130,941 | |
| | | | | | | | |
| | | | Software — 3.4% | |
| | 1,183 | | | ANSYS, Inc. (a) | | | 108,067 | |
| | 3,736 | | | CA Technologies, Inc. | | | 114,845 | |
| | 4,287 | | | Cadence Design Systems, Inc. (a) | | | 109,661 | |
| | 1,351 | | | CDK Global, Inc. | | | 73,778 | |
| | 790 | | | Citrix Systems, Inc. (a) | | | 66,992 | |
| | 994 | | | Electronic Arts, Inc. (a) | | | 78,049 | |
| | 547 | | | Manhattan Associates, Inc. (a) | | | 27,700 | |
| | 4,121 | | | Nuance Communications, Inc. (a) | | | 57,776 | |
| | 1,943 | | | PTC, Inc. (a) | | | 92,176 | |
| | 1,040 | | | Red Hat, Inc. (a) | | | 80,548 | |
| | 1,461 | | | SS&C Technologies Holdings, Inc. | | | 46,650 | |
| | 4,367 | | | Symantec Corp. | | | 109,306 | |
| | 2,606 | | | Synopsys, Inc. (a) | | | 154,562 | |
| | 229 | | | Tyler Technologies, Inc. (a) | | | 36,732 | |
| | 384 | | | Ultimate Software Group, Inc. (a) | | | 81,020 | |
| | | | | | | | |
| | | | | | | 1,237,862 | |
| | | | | | | | |
| | | | Technology Hardware, Storage & Peripherals — 0.5% | |
| | 1,025 | | | Lexmark International, Inc., Class A | | | 40,682 | |
| | 2,058 | | | NetApp, Inc. | | | 69,849 | |
| | 1,009 | | | Western Digital Corp. | | | 58,966 | |
| | | | | | | | |
| | | | | | | 169,497 | |
| | | | | | | | |
| | | | Total Information Technology | | | 5,237,452 | |
| | | | | | | | |
| | | | Materials — 6.4% | |
| | | | Chemicals — 3.2% | |
| | 1,057 | | | Albemarle Corp. | | | 88,312 | |
| | 1,120 | | | Ashland Global Holdings, Inc. | | | 125,138 | |
| | 1,285 | | | Cabot Corp. | | | 67,000 | |
| | 971 | | | Celanese Corp., Class A | | | 70,805 | |
| | 1,147 | | | CF Industries Holdings, Inc. | | | 27,540 | |
| | 1,185 | | | Eastman Chemical Co. | | | 85,213 | |
| | | | | | | | |
| SHARES | | | SECURITY DESCRIPTION | | VALUE($) | |
| | | | | | | | |
| | | | Chemicals — continued | |
| | 270 | | | FMC Corp. | | | 12,660 | |
| | 2,072 | | | Huntsman Corp. | | | 35,120 | |
| | 946 | | | International Flavors & Fragrances, Inc. | | | 123,718 | |
| | 1,647 | | | Mosaic Co. (The) | | | 38,754 | |
| | 122 | | | NewMarket Corp. | | | 48,911 | |
| | 2,159 | | | RPM International, Inc. | | | 102,639 | |
| | 1,438 | | | Scotts Miracle-Gro Co. (The), Class A | | | 126,674 | |
| | 481 | | | Valspar Corp. (The) | | | 47,908 | |
| | 1,290 | | | Westlake Chemical Corp. | | | 66,809 | |
| | 1,465 | | | WR Grace & Co. | | | 98,096 | |
| | | | | | | | |
| | | | | | | 1,165,297 | |
| | | | | | | | |
| | | | Construction Materials — 0.3% | |
| | 327 | | | Eagle Materials, Inc. | | | 26,477 | |
| | 179 | | | Martin Marietta Materials, Inc. | | | 33,183 | |
| | 419 | | | Vulcan Materials Co. | | | 47,431 | |
| | | | | | | | |
| | | | | | | 107,091 | |
| | | | | | | | |
| | | | Containers & Packaging — 1.6% | |
| | 643 | | | AptarGroup, Inc. | | | 45,936 | |
| | 1,567 | | | Avery Dennison Corp. | | | 109,361 | |
| | 620 | | | Ball Corp. | | | 47,783 | |
| | 847 | | | Bemis Co., Inc. | | | 41,266 | |
| | 650 | | | Crown Holdings, Inc. (a) | | | 35,262 | |
| | 3,447 | | | Graphic Packaging Holding Co. | | | 43,088 | |
| | 1,813 | | | International Paper Co. | | | 81,639 | |
| | 568 | | | Packaging Corp of America | | | 46,860 | |
| | 982 | | | Sealed Air Corp. | | | 44,809 | |
| | 768 | | | Silgan Holdings, Inc. | | | 39,130 | |
| | 743 | | | Sonoco Products Co. | | | 37,365 | |
| | | | | | | | |
| | | | | | | 572,499 | |
| | | | | | | | |
| | | | Metals & Mining — 1.2% | |
| | 457 | | | Compass Minerals International, Inc. | | | 32,835 | |
| | 1,520 | | | Newmont Mining Corp. | | | 56,301 | |
| | 1,712 | | | Nucor Corp. | | | 83,631 | |
| | 988 | | | Reliance Steel & Aluminum Co. | | | 67,955 | |
| | 500 | | | Royal Gold, Inc. | | | 34,410 | |
| | 1,361 | | | Southern Copper Corp. | | | 38,639 | |
| | 2,294 | | | Steel Dynamics, Inc. | | | 62,993 | |
| | 2,078 | | | United States Steel Corp. | | | 40,189 | |
| | | | | | | | |
| | | | | | | 416,953 | |
| | | | | | | | |
| | | | Paper & Forest Products — 0.1% | |
| | 1,208 | | | Domtar Corp. | | | 43,427 | |
| | | | | | | | |
| | | | Total Materials | | | 2,305,267 | |
| | | | | | | | |
SEE NOTES TO FINANCIAL STATEMENTS.
| | | | | | | | |
| | | |
| OCTOBER 31, 2016 | | JPMORGAN EXCHANGE-TRADED FUNDS | | | | | 67 | |
JPMorgan Diversified Return U.S. Mid Cap Equity ETF
SCHEDULE OF PORTFOLIO INVESTMENTS
AS OF OCTOBER 31, 2016 (continued)
| | | | | | | | |
| SHARES | | | SECURITY DESCRIPTION | | VALUE($) | |
| Common Stocks — continued | | | | |
| | | | Real Estate — 5.6% | |
| | | | Equity Real Estate Investment Trusts (REITs) — 5.6% | |
| | 546 | | | Alexandria Real Estate Equities, Inc. | | | 58,864 | |
| | 630 | | | American Campus Communities, Inc. | | | 32,829 | |
| | 733 | | | Apartment Investment & Management Co., Class A | | | 32,303 | |
| | 358 | | | AvalonBay Communities, Inc. | | | 61,282 | |
| | 453 | | | Boston Properties, Inc. | | | 54,577 | |
| | 1,568 | | | Brandywine Realty Trust | | | 24,304 | |
| | 965 | | | Brixmor Property Group, Inc. | | | 24,530 | |
| | 446 | | | Camden Property Trust | | | 36,322 | |
| | 787 | | | Communications Sales & Leasing, Inc. | | | 22,374 | |
| | 1,189 | | | CubeSmart | | | 30,997 | |
| | 642 | | | CyrusOne, Inc. | | | 28,640 | |
| | 766 | | | DCT Industrial Trust, Inc. | | | 35,811 | |
| | 2,419 | | | DDR Corp. | | | 36,987 | |
| | 626 | | | Digital Realty Trust, Inc. | | | 58,487 | |
| | 1,312 | | | Douglas Emmett, Inc. | | | 47,888 | |
| | 1,848 | | | Duke Realty Corp. | | | 48,325 | |
| | 353 | | | EPR Properties | | | 25,670 | |
| | 994 | | | Equity Commonwealth (a) | | | 30,029 | |
| | 481 | | | Equity LifeStyle Properties, Inc. | | | 36,479 | |
| | 720 | | | Equity One, Inc. | | | 20,520 | |
| | 272 | | | Essex Property Trust, Inc. | | | 58,233 | |
| | 428 | | | Extra Space Storage, Inc. | | | 31,308 | |
| | 296 | | | Federal Realty Investment Trust | | | 42,988 | |
| | 1,120 | | | Forest City Realty Trust, Inc., Class A | | | 24,181 | |
| | 1,196 | | | General Growth Properties, Inc. | | | 29,840 | |
| | 659 | | | Healthcare Trust of America, Inc., Class A | | | 20,165 | |
| | 615 | | | Highwoods Properties, Inc. | | | 30,522 | |
| | 1,404 | | | Hospitality Properties Trust | | | 38,413 | |
| | 729 | | | Iron Mountain, Inc. | | | 24,589 | |
| | 172 | | | Kilroy Realty Corp. | | | 12,355 | |
| | 1,355 | | | Kimco Realty Corp. | | | 36,057 | |
| | 635 | | | Lamar Advertising Co., Class A | | | 40,291 | |
| | 493 | | | Liberty Property Trust | | | 19,932 | |
| | 287 | | | Life Storage, Inc. | | | 23,147 | |
| | 504 | | | Macerich Co. (The) | | | 35,673 | |
| | 305 | | | Mid-America Apartment Communities, Inc. | | | 28,289 | |
| | 1,068 | | | National Retail Properties, Inc. | | | 48,722 | |
| | 804 | | | Omega Healthcare Investors, Inc. | | | 25,591 | |
| | 1,208 | | | Outfront Media, Inc. | | | 25,984 | |
| | 1,741 | | | Piedmont Office Realty Trust, Inc., Class A | | | 35,656 | |
| | 452 | | | Post Properties, Inc. | | | 29,737 | |
| | 991 | | | Prologis, Inc. | | | 51,691 | |
| | 863 | | | Rayonier, Inc. | | | 23,146 | |
| | 871 | | | Realty Income Corp. | | | 51,598 | |
| | | | | | | | |
| SHARES | | | SECURITY DESCRIPTION | | VALUE($) | |
| | | | | | | | |
| | | | Equity Real Estate Investment Trusts (REITs) — continued | |
| | 509 | | | Regency Centers Corp. | | | 36,684 | |
| | 1,852 | | | Senior Housing Properties Trust | | | 39,392 | |
| | 3,332 | | | Spirit Realty Capital, Inc. | | | 39,684 | |
| | 969 | | | STORE Capital Corp. | | | 26,444 | |
| | 347 | | | Sun Communities, Inc. | | | 26,695 | |
| | 1,277 | | | Tanger Factory Outlet Centers, Inc. | | | 44,440 | |
| | 449 | | | Taubman Centers, Inc. | | | 32,535 | |
| | 913 | | | UDR, Inc. | | | 31,928 | |
| | 720 | | | Ventas, Inc. | | | 48,780 | |
| | 3,851 | | | VEREIT, Inc. | | | 36,199 | |
| | 116 | | | Vornado Realty Trust | | | 10,763 | |
| | 807 | | | Weingarten Realty Investors | | | 29,221 | |
| | 680 | | | Welltower, Inc. | | | 46,600 | |
| | 365 | | | WP Carey, Inc. | | | 22,170 | |
| | | | | | | | |
| | | | Total Real Estate | | | 2,006,861 | |
| | | | | | | | |
| | | | Telecommunication Services — 0.2% | |
| | | | Wireless Telecommunication Services — 0.2% | |
| | 1,802 | | | Telephone & Data Systems, Inc. | | | 46,563 | |
| | 476 | | | United States Cellular Corp. (a) | | | 16,684 | |
| | | | | | | | |
| | | | Total Telecommunication Services | | | 63,247 | |
| | | | | | | | |
| | | | Utilities — 12.9% | |
| | | | Electric Utilities — 5.1% | |
| | 5,635 | | | Alliant Energy Corp. | | | 214,412 | |
| | 2,591 | | | Edison International, Inc. | | | 190,387 | |
| | 3,028 | | | Eversource Energy | | | 166,722 | |
| | 3,105 | | | Fortis, Inc. (Canada) | | | 101,999 | |
| | 7,593 | | | Great Plains Energy, Inc. | | | 215,945 | |
| | 2,464 | | | Hawaiian Electric Industries, Inc. | | | 72,688 | |
| | 2,805 | | | OGE Energy Corp. | | | 87,067 | |
| | 2,396 | | | Pinnacle West Capital Corp. | | | 182,407 | |
| | 5,930 | | | PPL Corp. | | | 203,636 | |
| | 3,754 | | | Westar Energy, Inc., Class A | | | 215,179 | |
| | 4,381 | | | Xcel Energy, Inc. | | | 182,031 | |
| | | | | | | | |
| | | | | | | 1,832,473 | |
| | | | | | | | |
| | | | Gas Utilities — 1.5% | |
| | 2,582 | | | Atmos Energy Corp. | | | 192,075 | |
| | 2,262 | | | National Fuel Gas Co. | | | 118,483 | |
| | 4,768 | | | UGI Corp. | | | 220,711 | |
| | | | | | | | |
| | | | | | | 531,269 | |
| | | | | | | | |
| | | | Independent Power and Renewable Electricity Producers — 0.4% | |
| | 13,191 | | | AES Corp. | | | 155,258 | |
| | | | | | | | |
SEE NOTES TO FINANCIAL STATEMENTS.
| | | | | | |
| | | |
| 68 | | | | JPMORGAN EXCHANGE-TRADED FUNDS | | OCTOBER 31, 2016 |
| | | | | | | | |
| SHARES | | | SECURITY DESCRIPTION | | VALUE($) | |
| Common Stocks — continued | | | | |
| | | | Multi-Utilities — 5.0% | |
| | 3,854 | | | Ameren Corp. | | | 192,507 | |
| | 4,391 | | | CMS Energy Corp. | | | 185,081 | |
| | 2,517 | | | Consolidated Edison, Inc. | | | 190,159 | |
| | 1,845 | | | DTE Energy Co. | | | 177,138 | |
| | 1,493 | | | MDU Resources Group, Inc. | | | 39,132 | |
| | 8,614 | | | NiSource, Inc. | | | 200,362 | |
| | 4,298 | | | Public Service Enterprise Group, Inc. | | | 180,860 | |
| | 2,589 | | | SCANA Corp. | | | 189,929 | |
| | 1,826 | | | Sempra Energy | | | 195,565 | |
| | 1,833 | | | Vectren Corp. | | | 92,218 | |
| | 2,800 | | | WEC Energy Group, Inc. | | | 167,216 | |
| | | | | | | | |
| | | | | | | 1,810,167 | |
| | | | | | | | |
| | | | Water Utilities — 0.9% | |
| | 2,719 | | | American Water Works Co., Inc. | | | 201,315 | |
| | 4,423 | | | Aqua America, Inc. | | | 135,786 | |
| | | | | | | | |
| | | | | | | 337,101 | |
| | | | | | | | |
| | | | Total Utilities | | | 4,666,268 | |
| | | | | | | | |
| | | | Total Common Stocks
(Cost $34,781,291) | | | 35,559,712 | |
| | | | | | | | |
| Short-Term Investment — 1.7% | |
| | | | Investment Company — 1.7% | |
| | 621,429 | | | JPMorgan U.S. Government Money Market Fund, Institutional Class Shares, 0.290% (b) (d)
(Cost $621,429) | | | 621,429 | |
| | | | | | | | |
| | | | Total Investments — 100.1%
(Cost $35,402,720) | | | 36,181,141 | |
| | | | Liabilities in Excess of
Other Assets — (0.1)% | | | (27,253 | ) |
| | | | | | | | |
| | | | NET ASSETS — 100.0% | | $ | 36,153,888 | |
| | | | | | | | |
Percentages indicated are based on net assets.
SEE NOTES TO FINANCIAL STATEMENTS.
| | | | | | | | |
| | | |
| OCTOBER 31, 2016 | | JPMORGAN EXCHANGE-TRADED FUNDS | | | | | 69 | |
JPMorgan Exchange-Traded Funds
SCHEDULE OF PORTFOLIO INVESTMENTS
AS OF OCTOBER 31, 2016 (continued)
NOTES TO SCHEDULE OF PORTFOLIO INVESTMENTS
| | |
| ADR | | — American Depositary Receipt |
| AUD | | — Australian Dollar |
| CHF | | — Swiss Franc |
| DKK | | — Danish Krone |
| ETF | | — Exchange Traded Fund |
| EUR | | — Euro |
| GBP | | — British Pound |
| GDR | | — Global Depositary Receipt |
| HKD | | — Hong Kong Dollar |
| JPY | | — Japanese Yen |
| KRW | | — Korean Won |
| MSCI | | — Morgan Stanley Capital International |
| NOK | | — Norwegian Krone |
| NVDR | | — Non-Voting Depositary Receipt |
| NZD | | — New Zealand Dollar |
| REIT | | — Real Estate Investment Trust |
| SEK | | — Swedish Krona |
| SGD | | — Singapore Dollar |
| |
| (a) | | — Non-income producing security. |
| (b) | | — Investment in affiliate. Fund is registered under the Investment Company Act of 1940, as amended, and advised by J.P. Morgan Investment Management Inc. |
| (c) | | — Non-deliverable forwards. |
| (d) | | — The rate shown is the yield as of October 31, 2016. |
| (e) | | — Amounts rounds to less than 0.1%. |
| (f) | | — Security is exempt from registration under Rule 144A of the Securities Act of 1933, as amended. Unless otherwise indicated, this security has been determined to be liquid under procedures established by the Board of Trustees and may be resold in transactions exempt from registration, normally to qualified institutional buyers. |
SEE NOTES TO FINANCIAL STATEMENTS.
| | | | | | |
| | | |
| 70 | | | | JPMORGAN EXCHANGE-TRADED FUNDS | | OCTOBER 31, 2016 |
STATEMENTS OF ASSETS AND LIABILITIES
AS OF OCTOBER 31, 2016
| | | | | | | | | | | | |
| | | JPMorgan
Diversified
Return Emerging
Markets
Equity ETF | | | JPMorgan
Diversified
Return Europe
Currency
Hedged ETF | | | JPMorgan
Diversified
Return Europe
Equity ETF | |
ASSETS: | | | | | | | | | | | | |
Investments in non-affiliates, at value | | $ | 43,701,274 | | | $ | — | | | $ | 59,620,700 | |
Investment in affiliates, at value | | | — | | | | 26,524,064 | | | | — | |
| | | | | | | | | | | | |
Total Investment securities, at value | | | 43,701,274 | | | | 26,524,064 | | | | 59,620,700 | |
Cash | | | 130,845 | | | | 15,243 | | | | 208,537 | |
Restricted Cash | | | 29,400 | | | | — | | | | — | |
Foreign currency, at value | | | 86,698 | | | | — | | | | 27,473 | |
Receivables: | | | | | | | | | | | | |
Dividends from non-affiliates | | | 23,263 | | | | — | | | | 42,645 | |
Due from Adviser | | | 4,341 | | | | — | | | | 3,261 | |
Prepaid Expenses | | | 3,192 | | | | 2,872 | | | | 7,077 | |
Tax reclaims | | | — | | | | — | | | | 84,359 | |
Deferred offering costs | | | — | | | | 16,657 | | | | 692 | |
Unrealized appreciation on forward foreign currency exchange contracts | | | — | | | | 993,074 | | | | — | |
| | | | | | | | | | | | |
Total Assets | | | 43,979,013 | | | | 27,551,910 | | | | 59,994,744 | |
| | | | | | | | | | | | |
| | | |
LIABILITIES: | | | | | | | | | | | | |
Payables: | | | | | | | | | | | | |
Investments securities purchased | | | — | | | | 948,575 | | | | — | |
Unrealized depreciation on forward foreign currency exchange contracts | | | — | | | | 55,414 | | | | — | |
Accrued Liabilities: | | | | | | | | | | | | |
Professional fees | | | 83,171 | | | | 44,339 | | | | 93,013 | |
Custodian and Transfer Agent fees | | | 56,968 | | | | 291 | | | | 17,567 | |
Administration fees | | | 3,097 | | | | 1,922 | | | | 4,385 | |
Accounting fees | | | 14,795 | | | | 988 | | | | 8,295 | |
Trustees’ and Chief Compliance Officer’s fees | | | 793 | | | | 553 | | | | 1,299 | |
Advisory fees | | | — | | | | 11,989 | | | | — | |
Other | | | 10,728 | | | | 4,571 | | | | 10,552 | |
| | | | | | | | | | | | |
Total Liabilities | | | 169,552 | | | | 1,068,642 | | | | 135,111 | |
| | | | | | | | | | | | |
Net Assets | | $ | 43,809,461 | | | $ | 26,483,268 | | | $ | 59,859,633 | |
| | | | | | | | | | | | |
| | | |
NET ASSETS: | | | | | | | | | | | | |
Paid-in Capital | | $ | 49,685,108 | | | $ | 25,838,593 | | | $ | 60,205,089 | |
Accumulated undistributed (distributions in excess of) net investment income | | | 660,929 | | | | (59,634 | ) | | | 1,181,263 | |
Accumulated net realized gains (losses) | | | (6,670,815 | ) | | | 884,736 | | | | (179,013 | ) |
Net unrealized appreciation (depreciation) | | | 134,239 | | | | (180,427 | ) | | | (1,347,706 | ) |
| | | | | | | | | | | | |
Total Net Assets | | $ | 43,809,461 | | | $ | 26,483,268 | | | $ | 59,859,633 | |
| | | | | | | | | | | | |
| | | |
Outstanding number of shares
(unlimited number of shares authorized — par value $0.0001) | | | 900,000 | | | | 1,000,000 | | | | 1,200,000 | |
| | | | | | | | | | | | |
Net asset value, per share | | $ | 48.68 | | | $ | 26.48 | | | $ | 49.88 | |
| | | | | | | | | | | | |
| | | |
Cost of investments in non-affiliates | | $ | 43,569,069 | | | $ | — | | | $ | 60,966,168 | |
Cost of investments in affiliates | | | — | | | | 27,642,151 | | | | — | |
Cost of foreign currency | | | 84,918 | | | | — | | | | 27,519 | |
SEE NOTES TO FINANCIAL STATEMENTS.
| | | | | | | | |
| | | |
| OCTOBER 31, 2016 | | JPMORGAN EXCHANGE-TRADED FUNDS | | | | | 71 | |
STATEMENTS OF ASSETS AND LIABILITIES
AS OF OCTOBER 31, 2016 (continued)
| | | | | | | | | | | | |
| | | JPMorgan
Diversified
Return Global
Equity ETF | | | JPMorgan
Diversified
Return
International
Currency Hedged
ETF | | | JPMorgan
Diversified
Return
International
Equity ETF | |
ASSETS: | | | | | | | | | | | | |
Investments in non-affiliates, at value | | $ | 76,916,964 | | | $ | — | | | $ | 467,781,395 | |
Investment in affiliates, at value | | | — | | | | 26,351,706 | | | | 1,161,468 | |
| | | | | | | | | | | | |
Total Investment securities, at value | | | 76,916,964 | | | | 26,351,706 | | | | 468,942,863 | |
Cash | | | 373,136 | | | | 13,603 | | | | — | |
Restricted Cash | | | 7,700 | | | | — | | | | 14,400 | |
Foreign currency, at value | | | 177,238 | | | | — | | | | 85,656 | |
Receivables: | | | | | | | | | | | | |
Dividends from non-affiliates | | | 174,578 | | | | — | | | | 1,187,875 | |
Tax reclaims | | | 48,283 | | | | — | | | | 258,504 | |
Due from Adviser | | | 7,047 | | | | 226 | | | | 40,456 | |
Prepaid Expenses | | | 5,407 | | | | 2,826 | | | | 25,621 | |
Dividends from affiliates | | | — | | | | — | | | | 582 | |
Deferred offering costs | | | — | | | | 32,994 | | | | — | |
Unrealized appreciation on forward foreign currency exchange contracts | | | — | | | | 918,991 | | | | — | |
| | | | | | | | | | | | |
Total Assets | | | 77,710,353 | | | | 27,320,346 | | | | 470,555,957 | |
| | | | | | | | | | | | |
| | | |
LIABILITIES: | | | | | | | | | | | | |
Payables: | | | | | | | | | | | | |
Investments securities purchased | | | — | | | | 903,510 | | | | — | |
Unrealized depreciation on forward foreign currency exchange contracts | | | — | | | | 47,016 | | | | — | |
Accrued Liabilities: | | | | | | | | | | | | |
Professional fees | | | 106,654 | | | | 44,098 | | | | 344,631 | |
Custodian and Transfer Agent fees | | | 20,365 | | | | — | | | | 36,731 | |
Administration fees | | | 5,641 | | | | 1,905 | | | | 33,166 | |
Accounting fees | | | 11,640 | | | | 980 | | | | 21,388 | |
Trustees’ and Chief Compliance Officer’s fees | | | 1,631 | | | | 543 | | | | 9,589 | |
Other | | | 7,489 | | | | 6,180 | | | | 67,736 | |
| | | | | | | | | | | | |
Total Liabilities | | | 153,420 | | | | 1,004,232 | | | | 513,241 | |
| | | | | | | | | | | | |
Net Assets | | $ | 77,556,933 | | | $ | 26,316,114 | | | $ | 470,042,716 | |
| | | | | | | | | | | | |
| | | |
NET ASSETS: | | | | | | | | | | | | |
Paid-in Capital | | $ | 74,966,627 | | | $ | 25,790,524 | | | $ | 463,466,893 | |
Accumulated undistributed (distributions in excess of) net investment income | | | 1,249,069 | | | | (54,114 | ) | | | 6,655,210 | |
Accumulated net realized gains (losses) | | | (1,990,738 | ) | | | 53,181 | | | | (5,483,598 | ) |
Net unrealized appreciation (depreciation) | | | 3,331,975 | | | | 526,523 | | | | 5,404,211 | |
| | | | | | | | | | | | |
Total Net Assets | | $ | 77,556,933 | | | $ | 26,316,114 | | | $ | 470,042,716 | |
| | | | | | | | | | | | |
Outstanding number of shares
(unlimited number of shares authorized — par value $0.0001) | | | 1,500,000 | | | | 1,000,000 | | | | 9,400,000 | |
| | | | | | | | | | | | |
Net asset value, per share | | $ | 51.70 | | | $ | 26.32 | | | $ | 50.00 | |
| | | | | | | | | | | | |
Cost of investments in non-affiliates | | $ | 73,576,530 | | | $ | — | | | $ | 462,333,365 | |
Cost of investments in affiliates | | | — | | | | 26,697,158 | | | | 1,161,468 | |
Cost of foreign currency | | | 178,469 | | | | — | | | | 85,607 | |
SEE NOTES TO FINANCIAL STATEMENTS.
| | | | | | |
| | | |
| 72 | | | | JPMORGAN EXCHANGE-TRADED FUNDS | | OCTOBER 31, 2016 |
| | | | | | | | |
| | | JPMorgan
Diversified
Return U.S.
Equity ETF | | | JPMorgan
Diversified
Return U.S.
Mid Cap
Equity ETF | |
ASSETS: | | | | | | | | |
Investments in non-affiliates, at value | | $ | 123,895,274 | | | $ | 35,559,712 | |
Investment in affiliates, at value | | | 1,660,652 | | | | 621,429 | |
| | | | | | | | |
Total Investment securities, at value | | | 125,555,926 | | | | 36,181,141 | |
Cash | | | 16,483 | | | | 5,982 | |
Restricted Cash | | | 7,250 | | | | 1,500 | |
Receivables: | | | | | | | | |
Dividends from non-affiliates | | | 101,922 | | | | 23,088 | |
Due from Adviser | | | 7,223 | | | | 15,180 | |
Prepaid Expenses | | | 6,330 | | | | — | |
Dividends from affiliates | | | 199 | | | | 75 | |
Deferred offering costs | | | — | | | | 7,390 | |
| | | | | | | | |
Total Assets | | | 125,695,333 | | | | 36,234,356 | |
| | | | | | | | |
| | |
LIABILITIES: | | | | | | | | |
Payables: | | | | | | | | |
Investments securities purchased | | | 16,483 | | | | 5,790 | |
Accrued Liabilities: | | | | | | | | |
Professional fees | | | 94,662 | | | | 52,514 | |
Custodian and Transfer Agent fees | | | 10,612 | | | | 7,505 | |
Administration fees | | | 9,099 | | | | 2,626 | |
Accounting fees | | | 3,733 | | | | 1,465 | |
Trustees’ and Chief Compliance Officer’s fees | | | 1,684 | | | | 668 | |
Other | | | 20,802 | | | | 9,900 | |
| | | | | | | | |
Total Liabilities | | | 157,075 | | | | 80,468 | |
| | | | | | | | |
Net Assets | | $ | 125,538,258 | | | $ | 36,153,888 | |
| | | | | | | | |
| | |
NET ASSETS: | | | | | | | | |
Paid-in Capital | | $ | 125,309,738 | | | $ | 35,203,592 | |
Accumulated undistributed (distributions in excess of) net investment income | | | 775,559 | | | | 260,771 | |
Accumulated net realized gains (losses) | | | (237,317 | ) | | | (88,896 | ) |
Net unrealized appreciation (depreciation) | | | (309,722 | ) | | | 778,421 | |
| | | | | | | | |
Total Net Assets | | $ | 125,538,258 | | | $ | 36,153,888 | |
| | | | | | | | |
| | |
Outstanding number of shares
(unlimited number of shares authorized — par value $0.0001) | | | 2,200,000 | | | | 700,000 | |
| | | | | | | | |
Net asset value, per share | | $ | 57.06 | | | $ | 51.65 | |
| | | | | | | | |
| | |
Cost of investments in non-affiliates | | $ | 124,204,996 | | | $ | 34,781,291 | |
Cost of investments in affiliates | | | 1,660,652 | | | | 621,429 | |
SEE NOTES TO FINANCIAL STATEMENTS.
| | | | | | | | |
| | | |
| OCTOBER 31, 2016 | | JPMORGAN EXCHANGE-TRADED FUNDS | | | | | 73 | |
STATEMENTS OF OPERATIONS
FOR THE YEAR ENDED OCTOBER 31, 2016
| | | | | | | | | | | | |
| | | JPMorgan
Diversified
Return Emerging
Markets Equity
ETF | | | JPMorgan
Diversified
Return Europe
Currency Hedged
ETF (a) | | | JPMorgan
Diversified
Return
Europe
Equity ETF (b) | |
INVESTMENT INCOME: | | | | | | | | | | | | |
Dividend income from non-affiliates | | $ | 996,873 | | | $ | — | | | $ | 1,527,008 | |
Interest income from affiliates | | | 202 | | | | — | | | | 3 | |
Foreign taxes withheld | | | (123,152 | ) | | | — | | | | (162,835 | ) |
| | | | | | | | | | | | |
Total Investment Income | | | 873,923 | | | | — | | | | 1,364,176 | |
| | | | | | | | | | | | |
| | | |
EXPENSES: | | | | | | | | | | | | |
Investment advisory fees (Note 3.A) | | | 138,198 | | | | 45,710 | | | | 114,484 | |
Administration fees (Note 3.B) | | | 26,697 | | | | 11,774 | | | | 32,437 | |
Trustees’ and Chief Compliance Officer’s fees | | | 20,043 | | | | 4,160 | | | | 12,762 | |
Professional fees | | | 121,233 | | | | 48,927 | | | | 117,330 | |
Printing and mailing costs | | | 7,321 | | | | 2,977 | | | | 11,936 | |
Custodian and Transfer Agent fees | | | 171,769 | | | | 680 | | | | 83,516 | |
Registration and filing fees | | | 708 | | | | 15,662 | | | | 22,653 | |
Interest expense to affiliates | | | 164 | | | | — | | | | 99 | |
Insurance expense | | | 1,217 | | | | 4,056 | | | | 4,343 | |
Offering costs | | | 3,506 | | | | 22,825 | | | | 4,681 | |
Accounting fees | | | 80,636 | | | | 1,350 | | | | 28,896 | |
Other | | | 29,458 | | | | 1,010 | | | | 3,441 | |
| | | | | | | | | | | | |
Total expenses | | | 600,950 | | | | 159,131 | | | | 436,578 | |
| | | | | | | | | | | | |
Less fees waived (Note 3.D) | | | (164,895 | ) | | | (57,484 | ) | | | (146,921 | ) |
Less expense reimbursements from affiliates (Note 3.D) | | | (235,924 | ) | | | (33,742 | ) | | | (102,761 | ) |
Less expense reimbursements from non-affiliates (Note 3.C) | | | (58,800 | ) | | | — | | | | (22,800 | ) |
| | | | | | | | | | | | |
Net expenses | | | 141,331 | | | | 67,905 | | | | 164,096 | |
| | | | | | | | | | | | |
Net investment income (loss) | | | 732,592 | | | | (67,905 | ) | | | 1,200,080 | |
| | | | | | | | | | | | |
| | | |
REALIZED/UNREALIZED GAINS (LOSSES): | | | | | | | | | | | | |
Net realized gain (loss) on transactions from: | | | | | | | | | | | | |
Investments in non-affiliates | | | (5,364,653 | ) | | | — | | | | (178,137 | ) |
Investments in affiliates | | | — | | | | (2,253 | ) | | | — | |
Futures | | | 13,768 | | | | — | | | | — | |
Foreign currency transactions | | | 2,899 | | | | 895,260 | | | | (18,775 | ) |
| | | | | | | | | | | | |
Net realized gain (loss) | | | (5,347,986 | ) | | | 893,007 | | | | (196,912 | ) |
| | | | | | | | | | | | |
Change in net unrealized appreciation/depreciation on: | | | | | | | | | | | | |
Investments in non-affiliates | | | 6,258,629 | | | | — | | | | (1,345,468 | ) |
Investments in affiliates | | | — | | | | (1,118,087 | ) | | | — | |
Foreign currency translations | | | 3,999 | | | | 937,660 | | | | (2,238 | ) |
| | | | | | | | | | | | |
Change in net unrealized appreciation/depreciation | | | 6,262,628 | | | | (180,427 | ) | | | (1,347,706 | ) |
| | | | | | | | | | | | |
Net realized/unrealized gains (losses) | | | 914,642 | | | | 712,580 | | | | (1,544,618 | ) |
| | | | | | | | | | | | |
Change in net assets resulting from operations | | $ | 1,647,234 | | | $ | 644,675 | | | $ | (344,538 | ) |
| | | | | | | | | | | | |
| (a) | Commencement of operations was April 1, 2016. |
| (b) | Commencement of operations was December 18, 2015. |
SEE NOTES TO FINANCIAL STATEMENTS.
| | | | | | |
| | | |
| 74 | | | | JPMORGAN EXCHANGE-TRADED FUNDS | | OCTOBER 31, 2016 |
| | | | | | | | | | | | |
| | | JPMorgan
Diversified
Return Global
Equity ETF | | | JPMorgan
Diversified
Return
International
Currency
Hedged ETF (a) | | | JPMorgan
Diversified
Return
International
Equity ETF | |
INVESTMENT INCOME: | | | | | | | | | | | | |
Dividend income from non-affiliates | | $ | 1,860,289 | | | $ | — | | | $ | 8,733,229 | |
Dividend income from affiliates | | | — | | | | — | | | | 583 | |
Interest income from affiliates | | | 124 | | | | — | | | | 211 | |
Foreign taxes withheld | | | (147,340 | ) | | | — | | | | (610,511 | ) |
| | | | | | | | | | | | |
Total Investment Income | | | 1,713,073 | | | | — | | | | 8,123,512 | |
| | | | | | | | | | | | |
| | | |
EXPENSES: | | | | | | | | | | | | |
Investment advisory fees (Note 3.A) | | | 155,544 | | | | 37,065 | | | | 652,626 | |
Administration fees (Note 3.B) | | | 55,089 | | | | 11,669 | | | | 231,139 | |
Trustees’ and Chief Compliance Officer’s fees | | | 36,787 | | | | 4,127 | | | | 114,478 | |
Professional fees | | | 135,085 | | | | 46,252 | | | | 503,621 | |
Printing and mailing costs | | | 16,712 | | | | 2,376 | | | | 59,692 | |
Custodian and Transfer Agent fees | | | 75,725 | | | | 1,159 | | | | 225,179 | |
Registration and filing fees | | | 13,754 | | | | 16,817 | | | | 53,234 | |
Interest expense to affiliates | | | 235 | | | | — | | | | 363 | |
Insurance expense | | | 31,483 | | | | 4,074 | | | | 88,428 | |
Offering costs | | | — | | | | 46,246 | | | | 223 | |
Accounting fees | | | 74,110 | | | | 3,741 | | | | 121,421 | |
Other | | | 7,989 | | | | 1,618 | | | | — | |
| | | | | | | | | | | | |
Total expenses | | | 602,513 | | | | 175,144 | | | | 2,050,404 | |
| | | | | | | | | | | | |
Less fees waived (Note 3.D) | | | (210,633 | ) | | | (48,734 | ) | | | (722,724 | ) |
Less expense reimbursements from affiliates (Note 3.D) | | | (107,105 | ) | | | (59,146 | ) | | | — | |
Less expense reimbursements from non-affiliates (Note 3.C) | | | (38,500 | ) | | | — | | | | (158,400 | ) |
| | | | | | | | | | | | |
Net expenses | | | 246,275 | | | | 67,264 | | | | 1,169,280 | |
| | | | | | | | | | | | |
Net investment income (loss) | | | 1,466,798 | | | | (67,264 | ) | | | 6,954,232 | |
| | | | | | | | | | | | |
| | | |
REALIZED/UNREALIZED GAINS (LOSSES): | | | | | | | | | | | | |
Net realized gain (loss) on transactions from: | | | | | | | | | | | | |
Investments in non-affiliates | | | (1,605,783 | ) | | | — | | | | (5,264,973 | ) |
Investments in affiliates | | | — | | | | (11,021 | ) | | | — | |
Foreign currency transactions | | | 11,547 | | | | 77,352 | | | | (7,553 | ) |
| | | | | | | | | | | | |
Net realized gain (loss) | | | (1,594,236 | ) | | | 66,331 | | | | (5,272,526 | ) |
| | | | | | | | | | | | |
Change in net unrealized appreciation/depreciation on: | | | | | | | | | | | | |
Investments in non-affiliates | | | 3,460,088 | | | | — | | | | 5,756,090 | |
Investments in affiliates | | | — | | | | (345,452 | ) | | | — | |
Foreign currency translations | | | (7,433 | ) | | | 871,975 | | | | (39,381 | ) |
| | | | | | | | | | | | |
Change in net unrealized appreciation/depreciation | | | 3,452,655 | | | | 526,523 | | | | 5,716,709 | |
| | | | | | | | | | | | |
Net realized/unrealized gains (losses) | | | 1,858,419 | | | | 592,854 | | | | 444,183 | |
| | | | | | | | | | | | |
Change in net assets resulting from operations | | $ | 3,325,217 | | | $ | 525,590 | | | $ | 7,398,415 | |
| | | | | | | | | | | | |
| (a) | Commencement of operations was April 1, 2016. |
SEE NOTES TO FINANCIAL STATEMENTS.
| | | | | | | | |
| | | |
| OCTOBER 31, 2016 | | JPMORGAN EXCHANGE-TRADED FUNDS | | | | | 75 | |
STATEMENTS OF OPERATIONS
FOR THE YEAR ENDED OCTOBER 31, 2016 (continued)
| | | | | | | | |
| | | JPMorgan
Diversified
Return U.S.
Equity ETF | | | JPMorgan
Diversified
Return U.S. Mid
Cap Equity ETF (a) | |
INVESTMENT INCOME: | | | | | | | | |
Dividend income from non-affiliates | | $ | 1,023,630 | | | $ | 307,724 | |
Dividend income from affiliates | | | 277 | | | | 106 | |
Interest income from affiliates | | | 84 | | | | 22 | |
| | | | | | | | |
Total Investment Income | | | 1,023,991 | | | | 307,852 | |
| | | | | | | | |
| | |
EXPENSES: | | | | | | | | |
Investment advisory fees (Note 3.A) | | | 105,392 | | | | 36,378 | |
Administration fees (Note 3.B) | | | 38,949 | | | | 12,884 | |
Trustees’ and Chief Compliance Officer’s fees | | | 17,314 | | | | 3,292 | |
Professional fees | | | 128,719 | | | | 61,859 | |
Printing and mailing costs | | | 17,270 | | | | 2,315 | |
Custodian and Transfer Agent fees | | | 23,122 | | | | 16,533 | |
Registration and filing fees | | | 32,740 | | | | 10,955 | |
Insurance expense | | | 4,587 | | | | — | |
Offering costs | | | 24,157 | | | | 6,659 | |
Accounting fees | | | 15,479 | | | | 4,925 | |
Other | | | 5,052 | | | | 1,508 | |
| | | | | | | | |
Total expenses | | | 412,781 | | | | 157,308 | |
| | | | | | | | |
Less fees waived (Note 3.D) | | | (144,341 | ) | | | (49,262 | ) |
Less expense reimbursements from affiliates (Note 3.D) | | | (123,898 | ) | | | (52,000 | ) |
Less expense reimbursements from non-affiliates (Note 3.C) | | | (11,600 | ) | | | (4,500 | ) |
| | | | | | | | |
Net expenses | | | 132,942 | | | | 51,546 | |
| | | | | | | | |
Net investment income (loss) | | | 891,049 | | | | 256,306 | |
| | | | | | | | |
| | |
REALIZED/UNREALIZED GAINS (LOSSES): | | | | | | | | |
Net realized gain (loss) on transactions from: | | | | | | | | |
Investments in non-affiliates | | | (233,079 | ) | | | (84,431 | ) |
| | | | | | | | |
Net realized gain (loss) | | | (233,079 | ) | | | (84,431 | ) |
| | | | | | | | |
Change in net unrealized appreciation/depreciation on: | | | | | | | | |
Investments in non-affiliates | | | (1,126,048 | ) | | | 778,421 | |
| | | | | | | | |
Change in net unrealized appreciation/depreciation | | | (1,126,048 | ) | | | 778,421 | |
| | | | | | | | |
Net realized/unrealized gains (losses) | | | (1,359,127 | ) | | | 693,990 | |
| | | | | | | | |
Change in net assets resulting from operations | | $ | (468,078 | ) | | $ | 950,296 | |
| | | | | | | | |
| (a) | Commencement of operations was May 11, 2016. |
SEE NOTES TO FINANCIAL STATEMENTS.
| | | | | | |
| | | |
| 76 | | | | JPMORGAN EXCHANGE-TRADED FUNDS | | OCTOBER 31, 2016 |
STATEMENTS OF CHANGES IN NET ASSETS
FOR THE PERIODS INDICATED
| | | | | | | | | | | | | | | | |
| | | JPMorgan Diversified
Return Emerging Markets Equity ETF | | | JPMorgan
Diversified Return
Europe Currency
Hedged ETF | | | JPMorgan
Diversified
Return Europe
Equity ETF | |
| | | Year Ended
October 31, 2016 | | | Period Ended
October 31, 2015 (a) | | | Period Ended
October 31, 2016 (b) | | | Period Ended
October 31, 2016 (c) | |
CHANGE IN NET ASSETS RESULTING FROM OPERATIONS: | | | | | | | | | | | | | | | | |
Net investment income (loss) | | $ | 732,592 | | | $ | 980,553 | | | $ | (67,905 | ) | | $ | 1,200,080 | |
Net realized gain (loss) | | | (5,347,986 | ) | | | (3,629,485 | ) | | | 893,007 | | | | (196,912 | ) |
Change in net unrealized appreciation/depreciation | | | 6,262,628 | | | | (6,128,389 | ) | | | (180,427 | ) | | | (1,347,706 | ) |
| | | | | | | | | | | | | | | | |
Change in net assets resulting from operations | | | 1,647,234 | | | | (8,777,321 | ) | | | 644,675 | | | | (344,538 | ) |
| | | | | | | | | | | | | | | | |
| | | | |
DISTRIBUTIONS TO SHAREHOLDERS: | | | | | | | | | | | | | | | | |
From net investment income | | | (1,050,480 | ) | | | — | | | | — | | | | (918 | ) |
| | | | | | | | | | | | | | | | |
Total distributions to shareholders | | | (1,050,480 | ) | | | — | | | | — | | | | (918 | ) |
| | | | | | | | | | | | | | | | |
| | | | |
CAPITAL TRANSACTIONS: | | | | | | | | | | | | | | | | |
Change in net assets resulting from capital transactions | | | 7,027,033 | | | | 44,962,995 | | | | 25,838,593 | | | | 60,205,089 | |
| | | | | | | | | | | | | | | | |
| | | | |
NET ASSETS: | | | | | | | | | | | | | | | | |
Change in net assets | | | 7,623,787 | | | | 36,185,674 | | | | 26,483,268 | | | | 59,859,633 | |
Beginning of period | | | 36,185,674 | | | | — | | | | — | | | | — | |
| | | | | | | | | | | | | | | | |
End of period | | $ | 43,809,461 | | | $ | 36,185,674 | | | $ | 26,483,268 | | | $ | 59,859,633 | |
| | | | | | | | | | | | | | | | |
Accumulated undistributed (distributions in excess of) net investment income | | $ | 660,929 | | | $ | 964,675 | | | $ | (59,634 | ) | | $ | 1,181,263 | |
| | | | | | | | | | | | | | | | |
| | | | |
CAPITAL SHARE TRANSACTIONS: | | | | | | | | | | | | | | | | |
Proceeds from shares issued | | $ | 14,272,477 | | | $ | 58,386,392 | | | $ | 25,838,593 | | | $ | 60,205,089 | |
Redeemed | | | (7,245,444 | ) | | | (13,423,397 | ) | | | — | | | | — | |
| | | | | | | | | | | | | | | | |
Total change in net assets resulting from capital transactions | | $ | 7,027,033 | | | $ | 44,962,995 | | | $ | 25,838,593 | | | $ | 60,205,089 | |
| | | | | | | | | | | | | | | | |
| | | | |
SHARE TRANSACTIONS: | | | | | | | | | | | | | | | | |
Issued | | | 300,000 | | | | 1,100,000 | | | | 1,000,000 | | | | 1,200,000 | |
Redeemed | | | (200,000 | ) | | | (300,000 | ) | | | — | | | | — | |
| | | | | | | | | | | | | | | | |
Net Increase in shares from share transactions | | | 100,000 | | | | 800,000 | | | | 1,000,000 | | | | 1,200,000 | |
| | | | | | | | | | | | | | | | |
| (a) | Commencement of operations was January 7, 2015. |
| (b) | Commencement of operations was April 1, 2016. |
| (c) | Commencement of operations was December 18, 2015. |
SEE NOTES TO FINANCIAL STATEMENTS.
| | | | | | | | |
| | | |
| OCTOBER 31, 2016 | | JPMORGAN EXCHANGE-TRADED FUNDS | | | | | 77 | |
STATEMENTS OF CHANGES IN NET ASSETS
FOR THE PERIODS INDICATED (continued)
| | | | | | | | | | | | | | | | | | | | |
| | | JPMorgan Diversified Return
Global Equity ETF | | | JPMorgan
Diversified
Return
International
Currency
Hedged ETF | | | JPMorgan Diversified Return
International Equity ETF | |
| | | Year Ended
October 31, 2016 | | | Year Ended
October 31, 2015 | | | Period Ended
October 31,
2016 (a) | | | Year Ended
October 31,
2016 | | | Period Ended
October 31,
2015 (b) | |
CHANGE IN NET ASSETS RESULTING FROM OPERATIONS: | | | | | | | | | | | | | | | | | | | | |
Net investment income (loss) | | $ | 1,466,798 | | | $ | 964,790 | | | $ | (67,264 | ) | | $ | 6,954,232 | | | $ | 1,875,555 | |
Net realized gain (loss) | | | (1,594,236 | ) | | | (286,219 | ) | | | 66,331 | | | | (5,272,526 | ) | | | (187,378 | ) |
Change in net unrealized appreciation/depreciation | | | 3,452,655 | | | | 257,942 | | | | 526,523 | | | | 5,716,709 | | | | (312,498 | ) |
| | | | | | | | | | | | | | | | | | | | |
Change in net assets resulting from operations | | | 3,325,217 | | | | 936,513 | | | | 525,590 | | | | 7,398,415 | | | | 1,375,679 | |
| | | | | | | | | | | | | | | | | | | | |
| | | | | |
DISTRIBUTIONS TO SHAREHOLDERS: | | | | | | | | | | | | | | | | | | | | |
From net investment income | | | (1,057,127 | ) | | | (288,042 | ) | | | — | | | | (2,154,090 | ) | | | (44,215 | ) |
| | | | | | | | | | | | | | | | | | | | |
Total distributions to shareholders | | | (1,057,127 | ) | | | (288,042 | ) | | | — | | | | (2,154,090 | ) | | | (44,215 | ) |
| | | | | | | | | | | | | | | | | | | | |
| | | | | |
CAPITAL TRANSACTIONS: | | | | | | | | | | | | | | | | | | | | |
Change in net assets resulting from capital transactions | | | 24,758,809 | | | | 25,034,796 | | | | 25,790,524 | | | | 372,684,784 | | | | 90,782,143 | |
| | | | | | | | | | | | | | | | | | | | |
| | | | | |
NET ASSETS: | | | | | | | | | | | | | | | | | | | | |
Change in net assets | | | 27,026,899 | | | | 25,683,267 | | | | 26,316,114 | | | | 377,929,109 | | | | 92,113,607 | |
Beginning of period | | | 50,530,034 | | | | 24,846,767 | | | | — | | | | 92,113,607 | | | | — | |
| | | | | | | | | | | | | | | | | | | | |
End of period | | $ | 77,556,933 | | | $ | 50,530,034 | | | $ | 26,316,114 | | | $ | 470,042,716 | | | $ | 92,113,607 | |
| | | | | | | | | | | | | | | | | | | | |
Accumulated undistributed (distributions in excess of) net investment income | | $ | 1,249,069 | | | $ | 812,361 | | | $ | (54,114 | ) | | $ | 6,655,210 | | | $ | (1,836,680 | ) |
| | | | | | | | | | | | | | | | | | | | |
| | | | | |
CAPITAL SHARE TRANSACTIONS: | | | | | | | | | | | | | | | | | | | | |
Proceeds from shares issued | | $ | 24,758,809 | | | $ | 25,034,796 | | | $ | 25,790,524 | | | $ | 372,684,784 | | | $ | 90,782,143 | |
| | | | | | | | | | | | | | | | | | | | |
Total change in net assets resulting from capital transactions | | $ | 24,758,809 | | | $ | 25,034,796 | | | $ | 25,790,524 | | | $ | 372,684,784 | | | $ | 90,782,143 | |
| | | | | | | | | | | | | | | | | | | | |
| | | | | |
SHARE TRANSACTIONS: | | | | | | | | | | | | | | | | | | | | |
Issued | | | 500,000 | | | | 500,000 | | | | 1,000,000 | | | | 7,600,000 | | | | 1,800,000 | |
| | | | | | | | | | | | | | | | | | | | |
Net Increase in shares from share transactions | | | 500,000 | | | | 500,000 | | | | 1,000,000 | | | | 7,600,000 | | | | 1,800,000 | |
| | | | | | | | | | | | | | | | | | | | |
| (a) | Commencement of operations was April 1, 2016. |
| (b) | Commencement of operations was November 5, 2014. |
SEE NOTES TO FINANCIAL STATEMENTS.
| | | | | | |
| | | |
| 78 | | | | JPMORGAN EXCHANGE-TRADED FUNDS | | OCTOBER 31, 2016 |
| | | | | | | | | | | | |
| | | JPMorgan Diversified Return U.S.
Equity ETF | | | JPMorgan
Diversified
Return U.S. Mid
Cap Equity ETF | |
| | | Year Ended
October 31,
2016 | | | Period Ended
October 31,
2015 (a) | | | Period Ended
October 31,
2016 (b) | |
CHANGE IN NET ASSETS RESULTING FROM OPERATIONS: | | | | | | | | | | | | |
Net investment income (loss) | | $ | 891,049 | | | $ | 10,819 | | | $ | 256,306 | |
Net realized gain (loss) | | | (233,079 | ) | | | (522 | ) | | | (84,431 | ) |
Change in net unrealized appreciation/depreciation | | | (1,126,048 | ) | | | 816,326 | | | | 778,421 | |
| | | | | | | | | | | | |
Change in net assets resulting from operations | | | (468,078 | ) | | | 826,623 | | | | 950,296 | |
| | | | | | | | | | | | |
| | | |
DISTRIBUTIONS TO SHAREHOLDERS: | | | | | | | | | | | | |
From net investment income | | | (130,025 | ) | | | — | | | | — | |
| | | | | | | | | | | | |
Total distributions to shareholders | | | (130,025 | ) | | | — | | | | — | |
| | | | | | | | | | | | |
| | | |
CAPITAL TRANSACTIONS: | | | | | | | | | | | | |
Change in net assets resulting from capital transactions | | | 115,309,738 | | | | 10,000,000 | | | | 35,203,592 | |
| | | | | | | | | | | | |
| | | |
NET ASSETS: | | | | | | | | | | | | |
Change in net assets | | | 114,711,635 | | | | 10,826,623 | | | | 36,153,888 | |
Beginning of period | | | 10,826,623 | | | | — | | | | — | |
| | | | | | | | | | | | |
End of period | | $ | 125,538,258 | | | $ | 10,826,623 | | | $ | 36,153,888 | |
| | | | | | | | | | | | |
Accumulated undistributed (distributions in excess of) net investment income | | $ | 775,559 | | | $ | 10,819 | | | $ | 260,771 | |
| | | | | | | | | | | | |
| | | |
CAPITAL SHARE TRANSACTIONS: | | | | | | | | | | | | |
Proceeds from shares issued | | $ | 115,309,738 | | | $ | 10,000,000 | | | $ | 35,203,592 | |
| | | | | | | | | | | | |
Total change in net assets resulting from capital transactions | | $ | 115,309,738 | | | $ | 10,000,000 | | | $ | 35,203,592 | |
| | | | | | | | | | | | |
| | | |
SHARE TRANSACTIONS: | | | | | | | | | | | | |
Issued | | | 2,000,000 | | | | 200,000 | | | | 700,000 | |
| | | | | | | | | | | | |
Net Increase in shares from share transactions | | | 2,000,000 | | | | 200,000 | | | | 700,000 | |
| | | | | | | | | | | | |
| (a) | Commencement of operations was September 29, 2015. |
| (b) | Commencement of operations was May 11, 2016. |
SEE NOTES TO FINANCIAL STATEMENTS.
| | | | | | | | |
| | | |
| OCTOBER 31, 2016 | | JPMORGAN EXCHANGE-TRADED FUNDS | | | | | 79 | |
FINANCIAL HIGHLIGHTS
FOR THE PERIODS INDICATED
| | | | | | | | | | | | | | | | | | | | | | | | | | | | |
| | | Per share operating performance | |
| | | | | | Investment operations | | | Distributions | | | | | | | |
| | | Net asset
value,
beginning
of period | | | Net
investment
income
(loss) (b)(c) | | | Net realized
and unrealized
gains
(losses) on
investments | | | Total from
investment
operations | | | Net
investment
income | | | Net asset
value,
end of
period | | | Market
price,
end of
period | |
| | | | | | | |
JPMorgan Diversified Return Emerging Markets Equity ETF | | | | | | | | | | | | | | | | | | | | | | | | | | | | |
Year Ended October 31, 2016 | | $ | 45.23 | | | $ | 1.04 | | | $ | 3.72 | | | $ | 4.76 | | | $ | (1.31 | ) | | $ | 48.68 | | | $ | 48.98 | |
January 7, 2015 (a) through October 31, 2015 | | | 50.00 | | | | 1.29 | | | | (6.06 | ) | | | (4.77 | ) | | | — | | | | 45.23 | | | | 45.27 | |
| | | | | | | |
JPMorgan Diversified Return Europe Currency Hedged ETF | | | | | | | | | | | | | | | | | | | | | | | | | | | | |
April 1, 2016 (a) through October 31, 2016 | | | 25.00 | | | | (0.07 | ) | | | 1.55 | | | | 1.48 | | | | — | | | | 26.48 | | | | 26.52 | |
| | | | | | | |
JPMorgan Diversified Return Europe Equity ETF | | | | | | | | | | | | | | | | | | | | | | | | | | | | |
December 18, 2015 (a) through October 31, 2016 | | | 50.00 | | | | 1.39 | | | | (1.51 | ) | | | (0.12 | ) | | | — | (k) | | | 49.88 | | | | 49.95 | |
| | | | | | | |
JPMorgan Diversified Return Global Equity ETF | | | | | | | | | | | | | | | | | | | | | | | | | | | | |
Year Ended October 31, 2016 | | | 50.53 | | | | 1.14 | | | | 0.99 | | | | 2.13 | | | | (0.96 | ) | | | 51.70 | | | | 51.91 | |
Year Ended October 31, 2015 | | | 49.69 | | | | 1.08 | | | | 0.08 | | | | 1.16 | | | | (0.32 | ) | | | 50.53 | | | | 50.67 | |
June 16, 2014 (a) through October 31, 2014 | | | 50.00 | | | | 0.38 | | | | (0.69 | ) | | | (0.31 | ) | | | — | | | | 49.69 | | | | 50.09 | |
| (a) | Commencement of operations. |
| (b) | Calculated based upon average shares outstanding. |
| (c) | Net investment income (loss) is affected by the timing of distributions from underlying funds. |
| (d) | Not annualized for periods less than one year. |
| (e) | Includes adjustments in accordance with accounting principles generally accepted in the United States of America and as such, the net asset values for financial reporting purposes and the returns based upon those net asset values may differ from the net asset values and returns for shareholder transactions. |
| (f) | Market price total return is calculated assuming an initial investment made at the beginning of the period market price, reinvestment of all dividends and distributions at market price during the period, and sale at the market price on the last day of the period. The market price presented to calculate the market price total return is the mid-point of the bid/ask spread at the close of business on the NYSE Arca, Inc. |
| (g) | Annualized for periods less than one year, unless otherwise indicated. |
| (h) | Certain non-recurring expenses incurred by the Fund were not annualized for the periods indicated. |
| (i) | Does not include expenses of underlying funds. |
| (j) | Portfolio turnover is calculated by dividing the lesser of total purchases or sales of portfolio securities for the reporting period by the monthly average value of portfolio securities owned during the reporting period. Excluded from the numerator are amounts relating to derivatives and in-kind transactions. |
| (k) | Amount rounds to less than $0.01. |
SEE NOTES TO FINANCIAL STATEMENTS.
| | | | | | |
| | | |
| 80 | | | | JPMORGAN EXCHANGE-TRADED FUNDS | | OCTOBER 31, 2016 |
| | | | | | | | | | | | | | | | | | | | | | | | | | |
| Ratios/Supplemental data | |
| | | | | | | | | | Ratios to average net assets (g) | | | | |
| Total return (d)(e) | | |
Market
price
total
return (d)(f) | | | Net assets,
end of
period | | | Net
expenses (i) | | | Net
investment
income
(loss) (c) | | | Expenses
without waivers
and reimbursements (i) | | | Portfolio
turnover
rate (d)(j) | |
| | | | | | |
| | | | | | | | | | | | | | | | | | | | | | | | | | |
| | 11.02 | % | | | 11.63 | % | | $ | 43,809,461 | | | | 0.45 | % | | | 2.33 | % | | | 1.91 | % | | | 44 | % |
| | (9.54 | ) | | | (9.46 | ) | | | 36,185,674 | | | | 0.45 | (h) | | | 3.18 | | | | 2.07 | (h) | | | 46 | |
| | | | | | |
| | | | | | | | | | | | | | | | | | | | | | | | | | |
| | 5.96 | | | | 6.08 | | | | 26,483,268 | | | | 0.49 | (h) | | | (0.49 | ) | | | 1.08 | (h) | | | 1 | |
| | | | | | |
| | | | | | | | | | | | | | | | | | | | | | | | | | |
| | (0.23 | ) | | | (0.09 | ) | | | 59,859,633 | | | | 0.43 | (h) | | | 3.14 | | | | 1.14 | (h) | | | 15 | |
| | | | | | |
| | | | | | | | | | | | | | | | | | | | | | | | | | |
| | 4.31 | | | | 4.44 | | | | 77,556,933 | | | | 0.38 | | | | 2.26 | | | | 0.93 | | | | 22 | |
| | 2.36 | | | | 1.82 | | | | 50,530,034 | | | | 0.38 | | | | 2.16 | | | | 1.52 | | | | 18 | |
| | (0.62 | ) | | | 0.18 | | | | 24,846,767 | | | | 0.38 | (h) | | | 2.01 | | | | 5.19 | (h) | | | 14 | |
SEE NOTES TO FINANCIAL STATEMENTS.
| | | | | | | | |
| | | |
| OCTOBER 31, 2016 | | JPMORGAN EXCHANGE-TRADED FUNDS | | | | | 81 | |
FINANCIAL HIGHLIGHTS
FOR THE PERIODS INDICATED (continued)
| | | | | | | | | | | | | | | | | | | | | | | | | | | | |
| | | Per share operating performance | |
| | | | | | Investment operations | | | Distributions | | | | | | | |
| | | Net asset
value,
beginning
of period | | | Net
investment
income
(loss) (b)(c) | | | Net realized
and unrealized
gains
(losses) on
investments | | | Total from
investment
operations | | | Net
investment
income | | | Net asset
value,
end of
period | | | Market
price,
end of
period | |
JPMorgan Diversified Return International Currency Hedged ETF | | | | | | | | | | | | | | | | | | | | | | | | | | | | |
April 1, 2016 (a) through October 31, 2016 | | $ | 25.00 | | | $ | (0.07 | ) | | $ | 1.39 | | | $ | 1.32 | | | $ | — | | | $ | 26.32 | | | $ | 26.34 | |
| | | | | | | |
JPMorgan Diversified Return International Equity ETF | | | | | | | | | | | | | | | | | | | | | | | | | | | | |
Year Ended October 31, 2016 | | | 51.17 | | | | 1.28 | | | | (1.37 | )(d) | | | (0.09 | ) | | | (1.08 | ) | | | 50.00 | | | | 50.17 | |
November 5, 2014 (a) through October 31, 2015 | | | 50.00 | | | | 1.39 | | | | (0.07 | ) | | | 1.32 | | | | (0.15 | ) | | | 51.17 | | | | 51.05 | |
| | | | | | | |
JPMorgan Diversified Return U.S. Equity ETF | | | | | | | | | | | | | | | | | | | | | | | | | | | | |
Year Ended October 31, 2016 | | | 54.13 | | | | 1.10 | | | | 2.09 | (d) | | | 3.19 | | | | (0.26 | ) | | | 57.06 | | | | 57.08 | |
September 29, 2015 (a) through October 31, 2015 | | | 50.00 | | | | 0.06 | | | | 4.07 | | | | 4.13 | | | | — | | | | 54.13 | | | | 54.16 | |
| | | | | | | |
JPMorgan Diversified Return U.S. Mid Cap Equity ETF | | | | | | | | | | | | | | | | | | | | | | | | | | | | |
May 11, 2016 (a) through October 31, 2016 | | | 50.00 | | | | 0.42 | | | | 1.23 | | | | 1.65 | | | | — | | | | 51.65 | | | | 51.64 | |
| (a) | Commencement of operations. |
| (b) | Calculated based upon average shares outstanding. |
| (c) | Net investment income (loss) is affected by the timing of distributions from underlying funds. |
| (d) | Calculation of the net realized and unrealized gains (losses) per share do not correlate with the Fund’s net realized and unrealized gains (losses) presented on the Statement of Operations due to the timing of capital transactions in relation to the fluctuating market values of the Fund’s investments. |
| (e) | Not annualized for periods less than one year. |
| (f) | Includes adjustments in accordance with accounting principles generally accepted in the United States of America and as such, the net asset values for financial reporting purposes and the returns based upon those net asset values may differ from the net asset values and returns for shareholder transactions. |
| (g) | Market price total return is calculated assuming an initial investment made at the beginning of the period market price, reinvestment of all dividends and distributions at market price during the period, and sale at the market price on the last day of the period. The market price presented to calculate the market price total return is the mid-point of the bid/ask spread at the close of business on the NYSE Arca, Inc. |
| (h) | Annualized for periods less than one year, unless otherwise indicated. |
| (i) | Certain non-recurring expenses incurred by the Fund were not annualized for the periods indicated. |
| (j) | Does not include expenses of underlying funds. |
| (k) | Portfolio turnover is calculated by dividing the lesser of total purchases or sales of portfolio securities for the reporting period by the monthly average value of portfolio securities owned during the reporting period. Excluded from the numerator are amounts relating to derivatives and in-kind transactions. |
| (l) | Amount rounds to less than 0.1%. |
SEE NOTES TO FINANCIAL STATEMENTS.
| | | | | | |
| | | |
| 82 | | | | JPMORGAN EXCHANGE-TRADED FUNDS | | OCTOBER 31, 2016 |
| | | | | | | | | | | | | | | | | | | | | | | | | | |
| Ratios/Supplemental data | |
| | | | | | | | | | Ratios to average net assets (h) | | | | |
| Total return (e)(f) | | |
Market
price
total
return (e)(g) | | | Net assets,
end of
period | | | Net
expenses (j) | | | Net
investment
income
(loss) (c) | | | Expenses
without waivers
and reimbursements (j) | | | Portfolio
turnover
rate (e)(k) | |
| | | | | | | | | | | | | | | | | | | | | | | | | | |
| | 5.28 | % | | | 5.36 | % | | $ | 26,316,114 | | | | 0.49 | %(i) | | | (0.49 | )% | | | 1.14 | %(i) | | | 4 | % |
| | | | | | |
| | | | | | | | | | | | | | | | | | | | | | | | | | |
| | (0.15 | ) | | | 0.41 | | | | 470,042,716 | | | | 0.43 | | | | 2.56 | | | | 0.75 | | | | 27 | |
| | 2.65 | | | | 2.40 | | | | 92,113,607 | | | | 0.43 | (i) | | | 2.72 | | | | 1.33 | (i) | | | 20 | �� |
| | | | | | |
| | | | | | | | | | | | | | | | | | | | | | | | | | |
| | 5.92 | | | | 5.90 | | | | 125,538,258 | | | | 0.29 | | | | 1.95 | | | | 0.90 | | | | 22 | |
| | 8.26 | | | | 8.32 | | | | 10,826,623 | | | | 0.29 | (i) | | | 1.20 | | | | 5.75 | (i) | | | — | (l) |
| | | | | | |
| | | | | | | | | | | | | | | | | | | | | | | | | | |
| | 3.30 | | | | 3.28 | | | | 36,153,888 | | | | 0.34 | (i) | | | 1.69 | | | | 1.02 | (i) | | | 15 | |
SEE NOTES TO FINANCIAL STATEMENTS.
| | | | | | | | |
| | | |
| OCTOBER 31, 2016 | | JPMORGAN EXCHANGE-TRADED FUNDS | | | | | 83 | |
NOTES TO FINANCIAL STATEMENTS
AS OF OCTOBER 31, 2016
1. Organization
J.P. Morgan Exchange-Traded Fund Trust (the “Trust”) was formed on February 25, 2010, and is governed by a Declaration of Trust as amended and restated February 19, 2014, and is registered under the Investment Company Act of 1940, as amended (the “1940 Act”), as an open-ended management investment company.
The following are 8 separate funds of the Trust (collectively, the “Funds”) covered in this report:
| | |
| | | Diversified/Non-Diversified |
| JPMorgan Diversified Return Emerging Markets Equity ETF | | Diversified |
| JPMorgan Diversified Return Europe Currency Hedged ETF | | Diversified |
| JPMorgan Diversified Return Europe Equity ETF | | Diversified |
| JPMorgan Diversified Return Global Equity ETF | | Diversified |
| JPMorgan Diversified Return International Currency Hedged ETF | | Diversified |
| JPMorgan Diversified Return International Equity ETF | | Diversified |
| JPMorgan Diversified Return U.S. Equity ETF | | Diversified |
| JPMorgan Diversified Return U.S. Mid Cap Equity ETF | | Diversified |
The JPMorgan Diversified Return Emerging Markets Equity ETF (the “Emerging Markets Equity ETF”) commenced operations on January 7, 2015. The investment objective of the Fund is to seek investment results that closely correspond, before fees and expenses, to the performance of the FTSE Emerging Diversified Factor Index.
The JPMorgan Diversified Return Europe Currency Hedged ETF (the “Europe Currency Hedged ETF”) commenced operations on April 1, 2016. The investment objective of the Fund is to seek investment results that closely correspond, before fees and expenses, to the performance of the FTSE Developed Europe Diversified Factor 100% Hedged to USD Index.
The JPMorgan Diversified Return Europe Equity ETF (the “Europe Equity ETF”) commenced operations on December 18, 2015. The investment objective of the Fund is to seek investment results that closely correspond, before fees and expenses, to the performance of the FTSE Developed Europe Diversified Factor Index.
The JPMorgan Diversified Return Global Equity ETF (the “Global Equity ETF”) commenced operations on June 16, 2014. The investment objective of the Fund is to seek investment results that closely correspond, before fees and expenses, to the performance of the FTSE Developed Diversified Factor Index.
The JPMorgan Diversified Return International Currency Hedged ETF (the “International Currency Hedged ETF”) commenced operations on April 1, 2016. The investment objective of the Fund is to seek investment results that closely correspond, before fees and expenses, to the performance of the FTSE Developed ex North America Diversified Factor 100% Hedged to USD Index.
The JPMorgan Diversified Return International Equity ETF (the “International Equity ETF”) commenced operations on November 5, 2014. The investment objective of the Fund is to seek investment results that closely correspond, before fees and expenses, to the performance of the FTSE Developed ex North America Diversified Factor Index.
JPMorgan Diversified Return U.S. Equity ETF (the “U.S. Equity ETF”) commenced operations on September 29, 2015. The investment objective of the Fund is to seek investment results that closely correspond, before fees and expenses, to the performance of the Russell 1000 Diversified Factor Index.
JPMorgan Diversified Return U.S. Mid Cap Equity ETF (the “U.S. Mid Cap Equity ETF”) commenced operations on May 11, 2016. The investment objective of the Fund is to seek investment results that closely correspond, before fees and expenses, to the performance of the Russell Midcap Diversified Factor Index.
J.P. Morgan Investment Management Inc. (“JPMIM” or the “Adviser”) an indirect, wholly-owned subsidiary of JPMorgan Chase & Co. (“JPMorgan”) acts as the Adviser and Administrator (the “Administrator”) to the Funds. Prior to April 1, 2016, JPMorgan Funds Management, Inc. (“JPMFM”) served as the Funds’ administrator. Effective April 1, 2016, JPMFM merged into JPMIM, and JPMIM became the Funds’ administrator under the Administration Agreement.
Shares of each Fund are listed and traded on the NYSE Arca, Inc. Market prices for the Funds’ shares may be different from their net asset value (“NAV”). The Funds issue and redeem their shares on a continuous basis, through SEI Investments Distribution Co. (the “Distributor” or “SIDCO”), at NAV in large blocks of shares, typically 100,000 shares for all funds, except for the Europe Currency Hedged ETF and the International Currency Hedged ETF which trade in blocks of 50,000 shares, referred to as “Creation Units.” Creation Units are issued and redeemed principally in-kind for a basket of securities and a cash amount which may be substituted in Funds with sizeable exposure to market or sponsor restricted securities. Shares are generally traded in the secondary market in amounts less than a Creation Unit at market prices that change throughout the day. Only individuals or institutions that have entered into an authorized participant agreement with the Distributor may do business directly with the Funds (each, an “Authorized Participant”).
| | | | | | |
| | | |
| 84 | | | | JPMORGAN EXCHANGE-TRADED FUNDS | | OCTOBER 31, 2016 |
2. Significant Accounting Policies
The following is a summary of significant accounting policies followed by the Funds in the preparation of their financial statements. The Funds are investment companies and, accordingly, follow the investment company accounting and reporting guidance of the Financial Accounting Standards Board Accounting Standards Codification Topic 946 — Investment Companies, which is part of the U.S. generally accepted accounting principles (“GAAP”). The preparation of financial statements in conformity with GAAP requires management to make estimates and assumptions that affect the reported amounts of assets and liabilities and the disclosure of contingent assets and liabilities at the date of the financial statements and the reported amounts of increases and decreases in net assets from operations during the reporting period. Actual results could differ from those estimates.
A. Valuation of Investments — The valuation of the investments is in accordance with GAAP and the Funds’ valuation policies set forth by and under the supervision and responsibility of the Board of Trustees (the “Board”), which established the following approach to valuation, as described more fully below: (i) investments for which market quotations are readily available shall be valued at such unadjusted quoted prices, and (ii) all other investments for which market quotations are not readily available shall be valued at their fair value as determined in good faith by the Board.
The Administrator has established the J.P. Morgan Asset Management Americas Valuation Committee (“AVC”) to assist the Board with the oversight and monitoring of the valuation of the Funds’ investments. The Administrator implements the valuation policies of the Funds’ investments, as directed by the Board. The AVC oversees and carries out the policies for the valuation of investments held in the Funds. This includes monitoring the appropriateness of fair values based on results of ongoing valuation oversight, including but not limited to consideration of macro or security specific events, market events and pricing vendor and broker due diligence. The Administrator is responsible for discussing and assessing the potential impacts to the fair values on an ongoing basis, and at least on a quarterly basis with the AVC and the Board.
Equities and other exchange-traded instruments are valued at the last sale price or official market closing price on the primary exchange on which the instrument is traded before the NAVs of the Funds are calculated on a valuation date. Certain foreign equity instruments, including investments with equity reference obligations, are valued by applying an international fair value factor provided by an approved pricing vendors or third party broker-dealers (collectively referred to as “Pricing Services”). The factors seek to adjust the local closing price for movements of local markets post-closing, but prior to the time the NAVs are calculated.
Investments in mutual funds (the “Underlying Funds”) are valued at each Underlying Fund’s NAV per share as of report date.
Forward foreign currency exchange contracts are valued utilizing market quotations from approved Pricing Services.
Futures are generally valued on the basis of available market quotations.
Valuations reflected in this report are as of the report date. As a result, changes in valuation due to market events and/or issuer related events after the report date and prior to issuance of the report are not reflected herein.
The various inputs that are used in determining the valuation of the Funds’ investments are summarized into the three broad levels listed below.
| • | | Level 1 — Unadjusted inputs using quoted prices in active markets for identical investments. |
| • | | Level 2 — Other significant observable inputs including, but not limited to, quoted prices for similar investments, inputs other than quoted prices that are observable for investments (such as interest rates, prepayment speeds, credit risk, etc.) or other market corroborated inputs. |
| • | | Level 3 — Significant inputs based on the best information available in the circumstances, to the extent observable inputs are not available (including the Funds’ assumptions in determining the fair value of investments). |
A financial instrument’s level within the fair value hierarchy is based on the lowest level of any input, both individually and in the aggregate, that is significant to the fair value measurement. The inputs or methodology used for valuing instruments are not necessarily an indication of the risk associated with investing in those instruments.
The following tables represent each valuation input as presented on the Schedules of Portfolio Investments:
Emerging Markets Equity ETF
| | | | | | | | | | | | | | | | |
| | | Level 1
Quoted prices | | | Level 2
Other significant
observable inputs | | | Level 3
Significant
unobservable inputs | | | Total | |
Investments in Securities | | | | | | | | | | | | | | | | |
Common Stocks | | | | | | | | | | | | | | | | |
Brazil | | $ | 3,379,730 | | | $ | — | | | $ | — | | | $ | 3,379,730 | |
Chile | | | 491,113 | | | | — | | | | — | | | | 491,113 | |
China | | | — | | | | 8,295,517 | | | | — | | | | 8,295,517 | |
Colombia | | | 98,721 | | | | — | | | | — | | | | 98,721 | |
Czech Republic | | | — | | | | 126,034 | | | | — | | | | 126,034 | |
Egypt | | | 17,071 | | | | 89,162 | | | | — | | | | 106,233 | |
Greece | | | 30,621 | | | | 110,076 | | | | — | | | | 140,697 | |
Hungary | | | 16,290 | | | | 117,953 | | | | — | | | | 134,243 | |
Indonesia | | | — | | | | 2,515,015 | | | | — | | | | 2,515,015 | |
| | | | | | | | |
| | | |
| OCTOBER 31, 2016 | | JPMORGAN EXCHANGE-TRADED FUNDS | | | | | 85 | |
NOTES TO FINANCIAL STATEMENTS
AS OF OCTOBER 31, 2016 (continued)
Emerging Markets Equity ETF (continued)
| | | | | | | | | | | | | | | | |
| | | Level 1
Quoted prices | | | Level 2
Other significant
observable inputs | | | Level 3
Significant
unobservable inputs | | | Total | |
Malaysia | | $ | 1,003,790 | | | $ | 955,610 | | | $ | — | | | $ | 1,959,400 | |
Mexico | | | 958,118 | | | | — | | | | — | | | | 958,118 | |
Pakistan | | | — | | | | 19,257 | | | | — | | | | 19,257 | |
Philippines | | | 94,110 | | | | 883,965 | | | | — | | | | 978,075 | |
Poland | | | 10,872 | | | | 553,240 | | | | — | | | | 564,112 | |
Russia | | | 37,882 | | | | 2,208,677 | | | | — | | | | 2,246,559 | |
South Africa | | | 345,664 | | | | 2,776,651 | | | | — | | | | 3,122,315 | |
Taiwan | | | — | | | | 8,699,729 | | | | — | | | | 8,699,729 | |
Thailand | | | — | | | | 2,487,456 | | | | — | | | | 2,487,456 | |
Turkey | | | — | | | | 673,024 | | | | — | | | | 673,024 | |
United Arab Emirates | | | — | | | | 661,930 | | | | — | | | | 661,930 | |
United States | | | 43,339 | | | | — | | | | — | | | | 43,339 | |
| | | | | | | | | | | | | | | | |
Total Common Stocks | | | 6,527,321 | | | | 31,173,296 | | | | — | | | | 37,700,617 | |
| | | | | | | | | | | | | | | | |
Exchange Traded Fund | | | | | | | | | | | | | | | | |
India | | | 3,744,243 | | | | — | | | | — | | | | 3,744,243 | |
| | | | | | | | | | | | | | | | |
Total Exchange Traded Fund | | | 3,744,243 | | | | — | | | | — | | | | 3,744,243 | |
| | | | | | | | | | | | | | | | |
Preferred Stocks | | | | | | | | | | | | | | | | |
Brazil | | | 1,998,901 | | | | — | | | | — | | | | 1,998,901 | |
Chile | | | 49,954 | | | | — | | | | — | | | | 49,954 | |
Colombia | | | 78,835 | | | | — | | | | — | | | | 78,835 | |
Russia | | | — | | | | 128,724 | | | | — | | | | 128,724 | |
| | | | | | | | | | | | | | | | |
Total Preferred Stocks | | | 2,127,690 | | | | 128,724 | | | | — | | | | 2,256,414 | |
| | | | | | | | | | | | | | | | |
Total Investments in Securities | | $ | 12,399,254 | | | $ | 31,302,020 | | | $ | — | | | $ | 43,701,274 | |
| | | | | | | | | | | | | | | | |
Transfers from level 2 to level 1 in the amount of $1,004,443 are due to the non-application of fair value factors to certain securities as of October 31, 2016. Transfers from level 1 to level 2 in the amount of $264,682 due to the application of fair value factors to certain securities as of October 31, 2016. There were no significant transfers between Level 3 and Level 2 during the year ended October 31, 2016.
Europe Currency Hedged ETF
| | | | | | | | | | | | | | | | |
| | | Level 1
Quoted prices | | | Level 2
Other significant
observable inputs | | | Level 3
Significant
unobservable inputs | | | Total | |
Investments in Securities | | $ | 26,524,064 | | | $ | — | | | $ | — | | | $ | 26,524,064 | |
| | | | | | | | | | | | | | | | |
Appreciation in Other Financial Instruments | | | | | | | | | | | | | | | | |
Forward Foreign Currency Exchange Contracts | | $ | — | | | $ | 993,074 | | | $ | — | | | $ | 993,074 | |
| | | | | | | | | | | | | | | | |
Depreciation in Other Financial Instruments | | | | | | | | | | | | | | | | |
Forward Foreign Currency Exchange Contracts | | $ | — | | | $ | 55,414 | | | $ | — | | | $ | 55,414 | |
| | | | | | | | | | | | | | | | |
There were no transfers between level 1 and level 2 during the year ended October 31, 2016. Transfers between fair value levels are valued utilizing values as of the beginning of the period.
Europe Equity ETF
| | | | | | | | | | | | | | | | |
| | | Level 1
Quoted prices | | | Level 2
Other significant
observable inputs | | | Level 3
Significant
unobservable inputs | | | Total | |
Investments in Securities | | | | | | | | | | | | | | | | |
Common Stocks | | | | | | | | | | | | | | | | |
Austria | | $ | — | | | $ | 541,718 | | | $ | — | | | $ | 541,718 | |
Belgium | | | — | | | | 1,239,746 | | | | — | | | | 1,239,746 | |
Denmark | | | — | | | | 1,711,434 | | | | — | | | | 1,711,434 | |
Finland | | | — | | | | 2,956,635 | | | | — | | | | 2,956,635 | |
France | | | — | | | | 8,337,907 | | | | — | | | | 8,337,907 | |
| | | | | | |
| | | |
| 86 | | | | JPMORGAN EXCHANGE-TRADED FUNDS | | OCTOBER 31, 2016 |
Europe Equity ETF (continued)
| | | | | | | | | | | | | | | | |
| | | Level 1
Quoted prices | | | Level 2
Other significant
observable inputs | | | Level 3
Significant
unobservable inputs | | | Total | |
Germany | | $ | — | | | $ | 7,615,908 | | | $ | — | | | $ | 7,615,908 | |
Ireland | | | 119,441 | | | | 103,489 | | | | — | | | | 222,930 | |
Italy | | | — | | | | 1,259,905 | | | | — | | | | 1,259,905 | |
Luxembourg | | | — | | | | 251,477 | | | | — | | | | 251,477 | |
Netherlands | | | — | | | | 2,896,756 | | | | — | | | | 2,896,756 | |
Norway | | | — | | | | 1,614,023 | | | | — | | | | 1,614,023 | |
Portugal | | | — | | | | 565,249 | | | | — | | | | 565,249 | |
Spain | | | — | | | | 4,251,151 | | | | — | | | | 4,251,151 | |
Sweden | | | — | | | | 3,588,285 | | | | — | | | | 3,588,285 | |
Switzerland | | | — | | | | 6,801,078 | | | | — | | | | 6,801,078 | |
United Kingdom | | | — | | | | 15,209,814 | | | | — | | | | 15,209,814 | |
| | | | | | | | | | | | | | | | |
Total Common Stocks | | | 119,441 | | | | 58,944,575 | | | | — | | | | 59,064,016 | |
| | | | | | | | | | | | | | | | |
Preferred Stocks | | | | | | | | | | | | | | | | |
Germany | | | — | | | | 547,103 | | | | — | | | | 547,103 | |
| | | | | | | | | | | | | | | | |
Total Preferred Stocks | | | — | | | | 547,103 | | | | — | | | | 547,103 | |
| | | | | | | | | | | | | | | | |
Rights | | | | | | | | | | | | | | | | |
Spain | | | 2,888 | | | | — | | | | — | | | | 2,888 | |
Sweden | | | — | | | | 6,693 | | | | — | | | | 6,693 | |
| | | | | | | | | | | | | | | | |
Total Rights | | | 2,888 | | | | 6,693 | | | | — | | | | 9,581 | |
| | | | | | | | | | | | | | | | |
Total Investments in Securities | | $ | 122,329 | | | $ | 59,498,371 | | | $ | — | | | $ | 59,620,700 | |
| | | | | | | | | | | | | | | | |
There were no transfers between level 1 and level 2 during the year ended October 31, 2016. Transfers between fair value levels are valued utilizing values as of the beginning of the period.
Global Equity ETF
| | | | | | | | | | | | | | | | |
| | | Level 1
Quoted prices | | | Level 2
Other significant
observable inputs | | | Level 3
Significant
unobservable inputs | | | Total | |
Investments in Securities | | | | | | | | | | | | | | | | |
Common Stocks | | | | | | | | | | | | | | | | |
Australia | | $ | — | | | $ | 6,462,964 | | | $ | — | | | $ | 6,462,964 | |
Austria | | | — | | | | 168,533 | | | | — | | | | 168,533 | |
Belgium | | | — | | | | 612,273 | | | | — | | | | 612,273 | |
Canada | | | 2,229,074 | | | | — | | | | — | | | | 2,229,074 | |
Denmark | | | — | | | | 671,233 | | | | — | | | | 671,233 | |
Finland | | | — | | | | 685,554 | | | | — | | | | 685,554 | |
France | | | — | | | | 3,229,012 | | | | — | | | | 3,229,012 | |
Germany | | | — | | | | 2,217,301 | | | | — | | | | 2,217,301 | |
Hong Kong | | | — | | | | 3,031,060 | | | | — | | | | 3,031,060 | |
Israel | | | 210,554 | | | | — | | | | — | | | | 210,554 | |
Italy | | | 98,744 | | | | 317,389 | | | | — | | | | 416,133 | |
Japan | | | — | | | | 18,846,112 | | | | — | | | | 18,846,112 | |
Netherlands | | | — | | | | 1,037,128 | | | | — | | | | 1,037,128 | |
New Zealand | | | — | | | | 291,124 | | | | — | | | | 291,124 | |
Norway | | | — | | | | 706,126 | | | | — | | | | 706,126 | |
Portugal | | | — | | | | 223,384 | | | | — | | | | 223,384 | |
Singapore | | | — | | | | 1,706,971 | | | | — | | | | 1,706,971 | |
South Korea | | | — | | | | 7,001,688 | | | | — | | | | 7,001,688 | |
Spain | | | — | | | | 1,422,610 | | | | — | | | | 1,422,610 | |
Sweden | | | 164,429 | | | | 1,831,092 | | | | — | | | | 1,995,521 | |
Switzerland | | | 185,848 | | | | 1,383,399 | | | | — | | | | 1,569,247 | |
| | | | | | | | |
| | | |
| OCTOBER 31, 2016 | | JPMORGAN EXCHANGE-TRADED FUNDS | | | | | 87 | |
NOTES TO FINANCIAL STATEMENTS
AS OF OCTOBER 31, 2016 (continued)
Global Equity ETF (continued)
| | | | | | | | | | | | | | | | |
| | | Level 1
Quoted prices | | | Level 2
Other significant
observable inputs | | | Level 3
Significant
unobservable inputs | | | Total | |
United Kingdom | | $ | — | | | $ | 2,358,981 | | | $ | — | | | $ | 2,358,981 | |
United States | | | 19,715,631 | | | | — | | | | — | | | | 19,715,631 | |
| | | | | | | | | | | | | | | | |
Total Common Stocks | | | 22,604,280 | | | | 54,203,934 | | | | — | | | | 76,808,214 | |
| | | | | | | | | | | | | | | | |
Preferred Stock | | | | | | | | | | | | | | | | |
Germany | | | — | | | | 100,254 | | | | — | | | | 100,254 | |
| | | | | | | | | | | | | | | | |
Total Preferred Stock | | | — | | | | 100,254 | | | | — | | | | 100,254 | |
| | | | | | | | | | | | | | | | |
Rights | | | | | | | | | | | | | | | | |
Spain | | | 3,309 | | | | — | | | | — | | | | 3,309 | |
Sweden | | | — | | | | 5,187 | | | | — | | | | 5,187 | |
| | | | | | | | | | | | | | | | |
Total Rights | | | 3,309 | | | | 5,187 | | | | — | | | | 8,496 | |
| | | | | | | | | | | | | | | | |
Total Investments in Securities | | $ | 22,607,589 | | | $ | 54,309,375 | | | $ | — | | | $ | 76,916,964 | |
| | | | | | | | | | | | | | | | |
There were no significant transfers between level 1 and level 2 during the year ended October 31, 2016. Transfers between fair value levels are valued utilizing values as of the beginning of the period.
International Currency Hedged ETF
| | | | | | | | | | | | | | | | |
| | | Level 1
Quoted Prices | | | Level 2
Other significant
observable inputs | | | Level 3
Significant
unobservable inputs | | | Total | |
Investments in Securities | | $ | 26,351,706 | | | $ | — | | | $ | — | | | $ | 26,351,706 | |
| | | | | | | | | | | | | | | | |
Appreciation in Other Financial Instruments | | | | | | | | | | | | | | | | |
Forward Foreign Currency Exchange Contracts | | $ | — | | | $ | 918,991 | | | $ | — | | | $ | 918,991 | |
| | | | | | | | | | | | | | | | |
Depreciation in Other Financial Instruments | | | | | | | | | | | | | | | | |
Forward Foreign Currency Exchange Contracts | | $ | — | | | $ | 47,016 | | | $ | — | | | $ | 47,016 | |
| | | | | | | | | | | | | | | | |
There were no transfers between level 1 and level 2 during the year ended October 31, 2016. Transfers between fair value levels are valued utilizing values as of the beginning of the period.
International Equity ETF
| | | | | | | | | | | | | | | | |
| | | Level 1
Quoted prices | | | Level 2
Other significant
observable inputs | | | Level 3
Significant
unobservable inputs | | | Total | |
Investments in Securities | | | | | | | | | | | | | | | | |
Common Stocks | | | | | | | | | | | | | | | | |
Australia | | $ | — | | | $ | 40,337,266 | | | $ | — | | | $ | 40,337,266 | |
Austria | | | — | | | | 2,594,742 | | | | — | | | | 2,594,742 | |
Belgium | | | — | | | | 4,974,335 | | | | — | | | | 4,974,335 | |
Denmark | | | — | | | | 6,634,873 | | | | — | | | | 6,634,873 | |
Finland | | | — | | | | 8,674,280 | | | | — | | | | 8,674,280 | |
France | | | — | | | | 23,424,737 | | | | — | | | | 23,424,737 | |
Germany | | | — | | | | 19,125,324 | | | | — | | | | 19,125,324 | |
Hong Kong | | | — | | | | 25,407,656 | | | | — | | | | 25,407,656 | |
Ireland | | | 1,256,148 | | | | — | | | | — | | | | 1,256,148 | |
Italy | | | 1,058,123 | | | | 4,314,526 | | | | — | | | | 5,372,649 | |
Japan | | | — | | | | 126,102,383 | | | | — | | | | 126,102,383 | |
Luxembourg | | | — | | | | 268,344 | | | | — | | | | 268,344 | |
Netherlands | | | — | | | | 11,281,501 | | | | — | | | | 11,281,501 | |
New Zealand | | | — | | | | 3,352,551 | | | | — | | | | 3,352,551 | |
Norway | | | — | | | | 4,825,212 | | | | — | | | | 4,825,212 | |
Portugal | | | — | | | | 2,664,884 | | | | — | | | | 2,664,884 | |
Singapore | | | — | | | | 13,164,043 | | | | — | | | | 13,164,043 | |
South Korea | | | — | | | | 44,233,324 | | | | — | | | | 44,233,324 | |
| | | | | | |
| | | |
| 88 | | | | JPMORGAN EXCHANGE-TRADED FUNDS | | OCTOBER 31, 2016 |
| | | | | | | | | | | | | | | | |
| | | Level 1
Quoted prices | | | Level 2
Other significant
observable inputs | | | Level 3
Significant
unobservable inputs | | | Total | |
Spain | | $ | — | | | $ | 11,052,440 | | | $ | — | | | $ | 11,052,440 | |
Sweden | | | — | | | | 12,886,508 | | | | — | | | | 12,886,508 | |
Switzerland | | | 62,048 | | | | 9,320,886 | | | | — | | | | 9,382,934 | |
United Kingdom | | | — | | | | 90,686,681 | | | | — | | | | 90,686,681 | |
| | | | | | | | | | | | | | | | |
Total Common Stocks | | | 2,376,319 | | | | 465,326,496 | | | | — | | | | 467,702,815 | |
| | | | | | | | | | | | | | | | |
Rights | | | | | | | | | | | | | | | | |
Spain | | | 28,783 | | | | — | | | | — | | | | 28,783 | |
Sweden | | | — | | | | 49,797 | | | | — | | | | 49,797 | |
| | | | | | | | | | | | | | | | |
Total Rights | | | 28,783 | | | | 49,797 | | | | — | | | | 78,580 | |
| | | | | | | | | | | | | | | | |
Short-Term Investment | | | 1,161,468 | | | | — | | | | — | | | | 1,161,468 | |
| | | | | | | | | | | | | | | | |
Total Investments in Securities | | $ | 3,566,570 | | | $ | 465,376,293 | | | $ | — | | | $ | 468,942,863 | |
| | | | | | | | | | | | | | | | |
There were no significant transfers between level 1 and level 2 during the year ended October 31, 2016. Transfers between fair value levels are valued utilizing values as of the beginning of the period.
U.S. Equity ETF
| | | | | | | | | | | | | | | | |
| | | Level 1 Quoted prices | | | Level 2 Other significant
observable inputs | | | Level 3 Significant
unobservable inputs | | | Total | |
Investments in Securities | | | | | | | | | | | | | | | | |
Common Stocks | | | | | | | | | | | | | | | | |
Consumer Discretionary | | $ | 20,196,163 | | | $ | — | | | $ | — | | | $ | 20,196,163 | |
Consumer Staples | | | 15,152,001 | | | | — | | | | — | | | | 15,152,001 | |
Energy | | | 5,331,984 | | | | — | | | | — | | | | 5,331,984 | |
Financials | | | 8,420,454 | | | | — | | | | — | | | | 8,420,454 | |
Health Care | | | 17,708,424 | | | | — | | | | — | | | | 17,708,424 | |
Industrials | | | 10,675,415 | | | | — | | | | — | | | | 10,675,415 | |
Information Technology | | | 17,847,771 | | | | — | | | | — | | | | 17,847,771 | |
Materials | | | 6,656,072 | | | | — | | | | — | | | | 6,656,072 | |
Real Estate | | | 3,328,742 | | | | — | | | | — | | | | 3,328,742 | |
Telecommunication Services | | | 1,577,938 | | | | — | | | | — | | | | 1,577,938 | |
Utilities | | | 17,000,310 | | | | — | | | | — | | | | 17,000,310 | |
| | | | | | | | | | | | | | | | |
Total Common Stocks | | | 123,895,274 | | | | — | | | | — | | | | 123,895,274 | |
| | | | | | | | | | | | | | | | |
Short-Term Investment | | | 1,660,652 | | | | — | | | | — | | | | 1,660,652 | |
| | | | | | | | | | | | | | | | |
Total Investments in Securities | | $ | 125,555,926 | | | $ | — | | | $ | — | | | $ | 125,555,926 | |
| | | | | | | | | | | | | | | | |
There were no transfers between level 1 and level 2 during the year ended October 31, 2016. Transfers between fair value levels are valued utilizing values as of the beginning of the period.
U.S. Mid Cap Equity ETF
| | | | | | | | | | | | | | | | |
| | | Level 1 Quoted prices | | | Level 2
Other significant
observable inputs | | | Level 3 Significant
unobservable inputs | | | Total | |
Investments in Securities | | | | | | | | | | | | | | | | |
Common Stocks | | | | | | | | | | | | | | | | |
Consumer Discretionary | | $ | 5,837,935 | �� | | $ | — | | | $ | — | | | $ | 5,837,935 | |
Consumer Staples | | | 2,595,673 | | | | — | | | | — | | | | 2,595,673 | |
Energy | | | 1,313,428 | | | | — | | | | — | | | | 1,313,428 | |
Financials | | | 3,155,667 | | | | — | | | | — | | | | 3,155,667 | |
Health Care | | | 4,184,485 | | | | — | | | | — | | | | 4,184,485 | |
Industrials | | | 4,193,429 | | | | — | | | | — | | | | 4,193,429 | |
Information Technology | | | 5,237,452 | | | | — | | | | — | | | | 5,237,452 | |
Materials | | | 2,305,267 | | | | — | | | | — | | | | 2,305,267 | |
Real Estate | | | 2,006,861 | | | | — | | | | — | | | | 2,006,861 | |
| | | | | | | | |
| | | |
| OCTOBER 31, 2016 | | JPMORGAN EXCHANGE-TRADED FUNDS | | | | | 89 | |
NOTES TO FINANCIAL STATEMENTS
AS OF OCTOBER 31, 2016 (continued)
| | | | | | | | | | | | | | | | |
| | | Level 1 Quoted prices | | | Level 2
Other significant
observable inputs | | | Level 3 Significant
unobservable inputs | | | Total | |
Telecommunication Services | | $ | 63,247 | | | $ | — | | | $ | — | | | $ | 63,247 | |
Utilities | | | 4,666,268 | | | | — | | | | — | | | | 4,666,268 | |
| | | | | | | | | | | | | | | | |
Total Common Stocks | | | 35,559,712 | | | | — | | | | — | | | | 35,559,712 | |
| | | | | | | | | | | | | | | | |
Short-Term Investment | | | 621,429 | | | | — | | | | — | | | | 621,429 | |
| | | | | | | | | | | | | | | | |
Total Investments in Securities | | $ | 36,181,141 | | | $ | — | | | $ | — | | | $ | 36,181,141 | |
| | | | | | | | | | | | | | | | |
There were no transfers between level 1 and level 2 during the year ended October 31, 2016. Transfers between fair value levels are valued utilizing values as of the beginning of the period.
B. Restricted Securities — Certain securities held by the Funds may be subject to legal or contractual restrictions on resale. Restricted securities generally are resold in transactions exempt from registration under the Securities act of 1933 (the “Securities Act”). Disposal of these securities may involve time-consuming negotiations and expense. Prompt sale at the current valuation may be difficult and could adversely affect the net assets of the Funds. As of October 31, 2016, the Funds had no investments in restricted securities other than securities sold to the Fund under Rule 144A.
C. Derivatives — Certain Funds are party to various derivative contracts governed by International Swaps and Derivatives Association master agreements (“ISDA agreements”). Certain Funds’ ISDA agreements, which are separately negotiated with each dealer counterparty, may contain provisions allowing, absent other considerations, a counterparty to exercise rights, to the extent not otherwise waived, against the Funds in the event the Funds’ net assets decline over time by a pre-determined percentage or fall below a pre-determined floor. The ISDA agreements may also contain provisions allowing, absent other conditions, the Funds to exercise rights, to the extent not otherwise waived, against the counterparty (i.e., decline in a counterparty’s credit rating below a specified level). Such rights for both the counterparty and the Funds often include the ability to terminate (i.e., close out) open contracts at prices which may favor the counterparty, which could have an adverse effect on the Funds. The ISDA agreements give the Funds and counterparty the right, upon an event of default, to close out all transactions traded under such agreements and to net amounts owed or due across all transactions and offset such net payable or receivable with collateral posted to a segregated account by one party to the other.
(1). Forward Foreign Currency Exchange Contracts — The Europe Currency Hedged ETF and International Currency Hedged ETF may be exposed to foreign currency risks associated with portfolio investments and therefore used forward foreign currency exchange contracts to hedge or manage these exposures. The Funds also bought forward foreign currency exchange contracts to gain exposure to currencies. Forward foreign currency exchange contracts represent obligations to purchase or sell foreign currency on a specified future date at a price fixed at the time the contracts are entered into. Non-deliverable forward foreign currency exchange contracts are settled with the counterparty in U.S. Dollar without the delivery of foreign currency.
The values of the forward foreign currency exchange contracts are adjusted daily based on the applicable exchange rate of the underlying currency. Changes in the value of these contracts are recorded as unrealized appreciation or depreciation until the contract settlement date. When the forward foreign currency exchange contract is closed, the Fund records a realized gain or loss equal to the difference between the value at the time the contract was opened and the value at the time it was closed. The Fund also records a realized gain or loss when a forward foreign currency exchange contract offsets another forward foreign currency exchange contract with the same counterparty upon settlement.
The Funds’ forward foreign currency exchange contracts are subject to master netting arrangements (the right to close out all transactions with a counterparty and net amounts owed or due across transactions). As of October 31, 2016, the Funds did not receive or post collateral for forward foreign currency exchange contracts.
(2). Futures Contracts — The Emerging Markets Equity ETF used index futures to obtain long and short exposure to the underlying commodities markets. The purchase of futures contracts will tend to increase a Fund’s exposure to positive and negative price fluctuations in the underlying instrument. The sale of futures contracts will tend to offset both positive and negative market price changes. The Emerging Markets Equity ETF also used index or other financial futures contracts to manage and hedge interest rate risk associated with portfolio investments.
Futures contracts provide for the delayed delivery of the underlying instrument at a fixed price or are settled for a cash amount based on the change in the value of the underlying instrument at a specific date in the future. Upon entering into a futures contract, a Fund is required to deposit with the broker, cash or securities in an amount equal to a certain percentage of the contract amount, which is referred to as the initial margin deposit. Subsequent payments, referred to as variation margin, are made or received by the Fund periodically and are based on changes in the market value of open futures contracts. Changes in the market value of open futures contracts are recorded as Change in net unrealized appreciation/depreciation in the Statement of Operations. Realized gains or losses, representing the difference between the value of the contract at the time it was opened and the value at the time it was closed, are reported in the Statement of Operations at the closing or expiration of the futures contract. Securities deposited as initial margin are designated in the Schedule of Portfolio Investments and cash deposited is recorded on the Statement of Assets and Liabilities. A receivable from and/or a payable to brokers for the daily variation margin is also recorded on the Statement of Assets and Liabilities.
| | | | | | |
| | | |
| 90 | | | | JPMORGAN EXCHANGE-TRADED FUNDS | | OCTOBER 31, 2016 |
The use of futures contracts exposes the Fund to interest rate risk. The Fund may be subject to the risk that the change in the value of the futures contract may not correlate perfectly with the underlying instrument. Use of long futures contracts subjects the Fund to risk of loss in excess of the amounts shown on the Statement of Assets and Liabilities, up to the notional amount of the futures contracts. Use of short futures contracts subjects the Fund to unlimited risk of loss. The Fund may enter into futures contracts only on exchanges or boards of trade. The exchange or board of trade acts as the counterparty to each futures transaction; therefore, the Fund’s credit risk is limited to failure of the exchange or board of trade. Under some circumstances, futures exchanges may establish daily limits on the amount that the price of a futures contract can vary from the previous day’s settlement price, which could effectively prevent liquidation of positions.
The Fund’s futures contracts are not subject to master netting arrangements (the right to close out all transactions traded with a counterparty and net amounts owed or due across transactions).
(3). Summary of Derivatives Information
The following table presents the value of derivatives held as of October 31, 2016, by their primary underlying risk exposure and respective location on the Statements of Assets and Liabilities:
Europe Currency Hedged ETF
| | | | | | |
| Derivative Contracts | | Statements of Assets and Liabilities | | | |
| Gross Assets: | | | | Forward Foreign
Currency Exchange
Contracts | |
| Foreign exchange contracts | | Receivables | | $ | 993,074 | |
| | | | | | |
| | |
Gross Liabilities: | | | | | |
| Foreign exchange contracts | | Payables | | $ | (55,414 | ) |
| | | | | | |
The following table presents the Fund’s gross derivative assets and liabilities by counterparty net of amounts available for offset under netting arrangements and any related collateral received or posted by the Fund as of October 31, 2016.
| | | | | | | | | | | | | | | | |
| Counterparty | | Gross Amount of
Derivative Assets
Subject to Netting
Arrangements Presented in the
Statements of Assets
and Liabilities (a) | | | Derivatives
Available
for Offset | | | Collateral
Received | | | Net Amount Due
from Counterparty
(not less than zero) | |
Goldman Sachs | | $ | 993,074 | | | $ | (55,414 | ) | | $ | — | | | $ | 937,660 | |
| | | | |
| Counterparty | | Gross Amount of
Derivative Liabilities
Subject to Netting
Arrangements
Presented in the
Statements of Assets
and Liabilities (a) | | | Derivatives
Available
for Offset | | | Collateral
Pledged | | | Net Amount Due
to Counterparty
(not less than zero) | |
Goldman Sachs | | $ | 55,414 | | | $ | (55,414 | ) | | $ | — | | | | $— | |
| (a) | For financial reporting purposes, the Fund does not offset derivative assets and derivative liabilities subject to master netting arrangements on the Statements of Assets and Liabilities. |
The following table presents the value of derivatives held as of October 31, 2016, by their primary underlying risk exposure and respective location on the Statements of Assets and Liabilities:
International Currency Hedged ETF
| | | | | | |
| Derivative Contracts | | Statements of Assets and Liabilities | | | |
| Gross Assets: | | | | Forward Foreign
Currency Exchange
Contracts | |
| Foreign exchange contracts | | Receivables | | $ | 918,991 | |
| | | | | | |
| | |
Gross Liabilities: | | | | | |
| Foreign exchange contracts | | Payables | | $ | (47,016 | ) |
| | | | | | |
| | | | | | | | |
| | | |
| OCTOBER 31, 2016 | | JPMORGAN EXCHANGE-TRADED FUNDS | | | | | 91 | |
NOTES TO FINANCIAL STATEMENTS
AS OF OCTOBER 31, 2016 (continued)
The following table presents the Fund’s gross derivative assets and liabilities by counterparty net of amounts available for offset under netting arrangements and any related collateral received or posted by the Fund as of October 31, 2016.
| | | | | | | | | | | | | | | | |
| Counterparty | | Gross Amount of
Derivative Assets
Subject to Netting
Arrangements
Presented in the
Statements of Assets and Liabilities (a) | | | Derivatives
Available
for Offset | | | Collateral
Received | | | Net Amount Due
from Counterparty
(not less than zero) | |
Goldman Sachs | | $ | 918,991 | | | $ | (47,016 | ) | | $ | — | | | $ | 871,975 | |
| | | | |
| Counterparty | | Gross Amount of
Derivative Liabilities
Subject to Netting
Arrangements
Presented in the
Statements of Assets and Liabilities (a) | | | Derivatives
Available
for Offset | | | Collateral
Pledged | | | Net Amount Due to Counterparty
(not less than zero) | |
Goldman Sachs | | $ | 47,016 | | | $ | (47,016 | ) | | $ | — | | | | $— | |
| (a) | For financial reporting purposes, the Fund does not offset derivative assets and derivative liabilities subject to master netting arrangements on the Statements of Assets and Liabilities. |
The following tables present the effect of derivatives on the Statements of Operations for the period ended October 31, 2016, by primary underlying risk exposure:
Emerging Markets Equity ETF
| | | | |
| | | Amount of Realized Gain (Loss) on Derivatives Recognized on Statements of Operations | | |
| Derivative Contracts | | | | Futures
Contracts |
| Futures contracts | | | | $13,768 |
| | | | |
Europe Currency Hedged ETF
| | | | |
| | | Amount of Realized Gain (Loss) on Derivatives Recognized on Statements of Operations | | |
| Derivative Contracts | | | | Forward Foreign
Currency Exchange
Contracts |
| Foreign exchange contracts | | | | $895,260 |
| | | | |
| | | | |
| Amount of Change in Unrealized Appreciation (Depreciation) on Derivatives Recognized on Statements of Operations |
| Derivative Contracts | | | | Forward Foreign
Currency Exchange
Contracts |
| Foreign exchange contracts | | | | $937,660 |
| | | | |
International Currency Hedged ETF
| | | | |
| | | Amount of Realized Gain (Loss) on Derivatives Recognized on Statements of Operations | | |
| Derivative Contracts | | | | Forward Foreign
Currency Exchange
Contracts |
| Foreign exchange contracts | | | | $77,352 |
| | | | |
| | | | |
| Amount of Change in Unrealized Appreciation (Depreciation) on Derivatives Recognized on Statements of Operations |
| Derivative Contracts | | | | Forward Foreign
Currency Exchange
Contracts |
| Foreign exchange contracts | | | | $871,975 |
| | | | |
| | | | | | |
| | | |
| 92 | | | | JPMORGAN EXCHANGE-TRADED FUNDS | | OCTOBER 31, 2016 |
Derivatives Volume
The table below discloses the volume of the Fund’s forward foreign currency contracts activity for the period ended October 31, 2016. Please refer to the tables in the Summary of Derivatives Information for derivative-related gains and losses associated with volume activity.
| | | | | | | | | | | | |
| | | Emerging Markets
Equity ETF | | | Europe Currency
Hedged ETF (a) | | | International
Currency Hedged ETF (a) | |
Forward Foreign Currency Exchange Contracts: | | | | | | | | | | | | |
Average Settlement Value Purchased | | $ | — | | | $ | 11,432,467 | | | $ | 11,965,015 | |
Average Settlement Value Sold | | | — | | | | 37,503,613 | | | | 41,312,749 | |
Ending Settlement Value Purchased | | | — | | | | 26,454,737 | | | | 26,496,451 | |
Ending Settlement Value Sold | | | — | | | | 53,971,742 | | | | 53,538,667 | |
| | | |
Futures Contracts: | | | | | | | | | | | | |
Average Notional Balance Long | | | 157,868 | (b) | | | — | | | | — | |
Average Notional Balance Short | | | — | | | | — | | | | — | |
Ending Notional Balance Long | | | — | | | | — | | | | — | |
Ending Notional Balance Short | | | — | | | | — | | | | — | |
| (a) | For the period April 1, 2016 through October 31, 2016. |
| (b) | For the period December 18, 2015 through January 7, 2016. |
The Funds’ derivatives contracts held at October 31, 2016, are not accounted for as hedging instruments under GAAP.
E. Foreign Currency Translation — The books and records of the Funds are maintained in U.S. dollars. Foreign currency amounts are translated into U.S. dollars at the prevailing exchange rates of such currencies against the U.S. dollar. The market value of investment securities and other assets and liabilities are translated at the exchange rate as of the valuation date. Purchases and sales of investment securities, income and expenses are translated at the exchange rate prevailing on the respective dates of such transactions.
The Funds do not isolate the effect of changes in the foreign exchange rates from changes in the market prices of securities held. Accordingly, such changes are included within Change in net unrealized appreciation/depreciation on investments on the Statements of Operations.
Reported realized foreign currency gains and losses arise from the disposition of foreign currency, currency gains or losses realized between the trade and settlement dates on securities transactions, and the difference between the amounts of dividends, interest and withholding taxes recorded on the Funds’ books on the transaction date and the U.S. dollar equivalent of the amounts actually received or paid. The reported realized foreign currency gains and losses are included in Net realized gain (loss) on foreign currency transactions on the Statements of Operations. Unrealized foreign currency gains and losses arise from changes (due to changes in exchange rates) in the value of foreign currency and other assets and liabilities denominated in foreign currencies, which are held at year end and are included in Change in net unrealized appreciation/depreciation on foreign currency translations on the Statements of Operations.
F. Investment Transactions with Affiliates — Europe Currency Hedged ETF, International Currency Hedged ETF, International Equity ETF, U.S. Equity ETF and U.S. Mid Cap Equity ETF invest in Underlying Funds and other ETFs advised by the Adviser or its affiliates.
An issuer which is under common control with a Fund may be considered an affiliate. For the purposes of the financial statements, the Funds assume the following to be affiliated issuers. Included in the Realized Gain (Loss) amounts in the table below are distributions of realized capital gains, if any, received from the Underlying Funds and other ETFs advised by the Adviser or its affiliates:
| | | | | | | | | | | | | | | | | | | | | | | | | | | | | | | | |
| | | | | | For the year ended October 31, 2016 | | | | | | | | | | |
| Affiliate | | Value at
Beginning of
Period | | | Purchase
Cost | | | Sales
Proceeds | | | Realized
Gain(Loss) | | | Unrealized
Gain(Loss) | | | Shares at
October 31,
2016 | | | Value at
October 31,
2016 | | | Dividend
Income | |
Europe Currency Hedged ETF (a) | | | | | | | | | | | | | | | | | | | | | | | | | | | | | | | | |
JPMorgan Diversified Return Europe Equity ETF | | $ | — | | | $ | 27,984,487 | | | $ | 340,083 | | | $ | (2,253 | ) | | $ | (1,118,087 | ) | | | 531,225 | | | $ | 26,524,064 | | | $ | — | |
| | | | | | | | |
International Currency Hedged ETF (a) | | | | | | | | | | | | | | | | | | | | | | | | | | | | | | | | |
JPMorgan Diversified Return International Equity ETF | | | — | | | | 27,657,142 | | | | 948,963 | | | | (11,021 | ) | | | (345,452 | ) | | | 525,353 | | | | 26,351,076 | | | | — | |
| | | | | | | | |
International Equity ETF | | | | | | | | | | | | | | | | | | | | | | | | | | | | | | | | |
JPMorgan U.S. Government Money Market Fund, Institutional Class Shares | | | — | | | | 4,724,854 | | | | 3,563,386 | | | | — | | | | — | | | | 1,161,468 | | | | 1,161,468 | | | | 583 | |
JPMorgan Prime Money Market Fund, Institutional Class Shares | | | — | | | | 4,318,032 | | | | 4,318,032 | | | | — | | | | — | | | | — | | | | — | | | | — | |
| | | | | | | | |
| | | |
| OCTOBER 31, 2016 | | JPMORGAN EXCHANGE-TRADED FUNDS | | | | | 93 | |
NOTES TO FINANCIAL STATEMENTS
AS OF OCTOBER 31, 2016 (continued)
| | | | | | | | | | | | | | | | | | | | | | | | | | | | | | | | |
| | | | | | For the year ended October 31, 2016 | | | | | | | | | | |
| Affiliate | | Value at
Beginning of
Period | | | Purchase
Cost | | | Sales
Proceeds | | | Realized
Gain(Loss) | | | Unrealized
Gain(Loss) | | | Shares at
October 31,
2016 | | | Value at
October 31,
2016 | | | Dividend
Income | |
U.S. Equity ETF | | | | | | | | | | | | | | | | | | | | | | | | | | | | | | | | |
JPMorgan U.S. Government Money Market Fund, Institutional Class Shares | | $ | — | | | $ | 3,012,825 | | | $ | 1,352,173 | | | $ | — | | | $ | — | | | | 1,660,652 | | | $ | 1,660,652 | | | $ | 277 | |
| | | | | | | | |
U.S. Mid Cap Equity ETF (b) | | | | | | | | | | | | | | | | | | | | | | | | | | | | | | | | |
JPMorgan U.S. Government Money Market Fund, Institutional Class Shares | | | — | | | | 996,039 | | | | 374,610 | | | | — | | | | — | | | | 621,429 | | | | 621,429 | | | | 106 | |
| (a) | Commencement of operations was April 1, 2016. |
| (b) | Commencement of operations was May 11, 2016. |
G. Offering and Organizational Costs — Total offering costs incurred in connection with the offering of shares of each Fund are amortized on a straight line basis over 12 months from the date the Fund commenced operations. Costs paid in connection with the organization of the Trust, if any, were recorded as an expense at the time the Fund commenced operations. Approximate total offering costs incurred by the Funds were as follows:
| | | | |
Emerging Markets Equity ETF | | $ | 23,456 | |
Europe Currency Hedged ETF | | | 39,482 | |
Europe Equity ETF | | | 5,373 | |
International Currency Hedged ETF | | | 79,240 | |
International Equity ETF | | | 16,301 | |
U.S. Equity ETF | | | 26,249 | |
U.S. Mid Cap Equity ETF | | | 14,049 | |
H. Security Transactions and Investment Income — Investment transactions are accounted for on the trade date (the date the order to buy or sell is executed). Securities gains and losses are calculated on a specifically identified cost basis. Interest income is determined on the basis of coupon interest accrued using the effective interest method which adjusts for amortization of premiums and accretion of discounts. Dividend income net of foreign taxes withheld, if any, is recorded on the ex-dividend date or when a fund first learns of the dividend.
To the extent such information is publicly available, the Funds record distributions received in excess of income earned from underlying investments as a reduction of cost of investments and/or realized gain. Such amounts are based on estimates if actual amounts are not available and actual amounts of income, realized gain and return of capital may differ from the estimated amounts. The Funds adjust the estimated amounts of the components of distributions (and consequently their net investment income) as necessary once the issuers provide information about the actual composition of the distributions.
I. Allocation of Expenses — Expenses directly attributable to a fund are charged directly to that fund, while the expenses attributable to more than one fund of the Trust are allocated among the respective funds.
J. Federal Income Taxes — Each Fund is treated as a separate taxable entity for Federal income tax purposes. Each Fund’s policy is to comply with the provisions of the Internal Revenue Code of 1986, as amended (the “Code”), applicable to regulated investment companies and to distribute to shareholders all of its distributable net investment income and net realized gain on investments. Accordingly, no provision for Federal income tax is necessary. Management has reviewed the Funds’ tax positions for all open tax years and has determined as of October 31, 2016, no liability for income tax is required in the Funds’ financial statements for net unrecognized tax benefits. However, management’s conclusions may be subject to future review based on changes in, or the interpretation of, the accounting standards or tax laws and regulations. Each of the Funds’ Federal tax returns for the prior three fiscal years, or since inception if shorter, remains subject to examination by the Internal Revenue Service.
K. Foreign Taxes — The Funds may be subject to foreign taxes on income, gains on investments or currency purchases/repatriation, a portion of which may be recoverable. The Funds will accrue such taxes and recoveries as applicable, based upon their current interpretation of tax rules and regulations that exist in the markets in which they invest.
L. Distributions to Shareholders — Distributions from net investment income, if any, are generally declared and paid annually. Net realized capital gains, if any, are distributed by each Fund at least annually. The amount of distributions from net investment income and net realized capital gains is determined in accordance with Federal income tax regulations, which may differ from GAAP. To the extent these “book/tax” differences are permanent in nature (i.e., that they result from other than timing of recognition — “temporary differences”), such amounts are reclassified within the capital accounts based on their Federal tax-basis treatment.
| | | | | | |
| | | |
| 94 | | | | JPMORGAN EXCHANGE-TRADED FUNDS | | OCTOBER 31, 2016 |
The following amounts were reclassified within the capital accounts:
| | | | | | | | | | | | |
| | | Paid-in
Capital | | | Undistributed
Net Investment
Income (Loss) | | | Accumulated
Net Realized
Gain (Loss) | |
Emerging Markets Equity ETF | | $ | (1,383,421 | ) | | $ | 14,142 | | | $ | 1,369,279 | |
Europe Currency Hedged ETF | | | — | | | | 8,271 | | | | (8,271 | ) |
Europe Equity ETF | | | — | | | | (17,899 | ) | | | 17,899 | |
Global Equity ETF | | | — | | | | 27,037 | | | | (27,037 | ) |
International Currency Hedged ETF | | | — | | | | 13,150 | | | | (13,150 | ) |
International Equity ETF | | | — | | | | 18,388 | | | | (18,388 | ) |
U.S. Equity ETF | | | — | | | | 3,716 | | | | (3,716 | ) |
U.S. Mid Cap Equity ETF | | | — | | | | 4,465 | | | | (4,465 | ) |
The reclassifications for the Funds relate primarily to foreign currency gains or losses, investments in passive foreign investment companies, non-taxable dividends and redemptions in-kind.
3. Fees and Other Transactions with Affiliates
A. Investment Advisory Fee — Pursuant to the Investment Advisory Agreement, the Adviser supervises the investments of each Fund and is paid a fee. The fee is accrued daily and paid monthly based on each Fund’s respective average daily net assets. The annual rate for each Fund is as follows:
| | | | |
Emerging Markets Equity ETF | | | 0.44 | % |
Europe Currency Hedged ETF | | | 0.33 | % |
Europe Equity ETF | | | 0.30 | % |
Global Equity ETF | | | 0.24 | % |
International Currency Hedged ETF | | | 0.27 | % |
International Equity ETF | | | 0.24 | % |
U.S. Equity ETF | | | 0.23 | % |
U.S. Mid Cap Equity ETF | | | 0.24 | % |
The Adviser waived Investment Advisory fees and/or reimbursed expenses as outlined in Note 3.D.
B. Administration Fee — Pursuant to an Administration Agreement, the Administrator provides certain administration services to the Funds. In consideration of these services, the Administrator receives a fee accrued daily and paid monthly at an annual rate of 0.085% of the average daily net assets of each Fund in the Trust covered by the Administration Agreement.
The Administrator waived administration fees as outlined in Note 3.D.
C. Custodian and Transfer Agent Fees — JPMorgan Chase Bank, N.A. (“JPMCB”), a wholly-owned subsidiary of JPMorgan, provides portfolio custody and transfer agency services to the Funds. The amounts paid directly to JPMCB by the Funds for custody services are included in the Custodian and Transfer Agent fees on the Statements of Operations. With respect to the transfer agency services provided by JPMCB for each creation or redemption transaction, the Authorized Participant will generally be responsible for such associated expenses; during the period, the Funds paid no transfer agency fees to JPMCB.
Additionally, Authorized Participants generally pay transaction fees associated with the creation and redemption of Fund shares. These fees are used to offset certain custodian charges incurred by the Funds for these transactions.
For the period ended October 31, 2016, the transaction fees paid by the Authorized Participants that were used to reimburse custodian fees were as follows:
| | | | |
Emerging Markets Equity ETF | | $ | 58,800 | |
Europe Equity ETF | | | 22,800 | |
Global Equity ETF | | | 38,500 | |
International Equity ETF | | | 158,400 | |
U.S. Equity ETF | | | 11,600 | |
U.S. Mid Cap Equity ETF | | | 4,500 | |
Such amounts are included in expense reimbursements from non-affiliates in the Statement of Operations.
Restricted cash on the Statement of Assets and Liabilities is cash received from Authorized Participants for the reimbursement of creation and/or redemption of Fund shares.
Interest income earned on cash balances at the custodian, if any, is included in Interest income from affiliates on the Statements of Operations.
Interest expense paid to the custodian related to overdrafts, if any, is included in Interest expense to affiliates on the Statements of Operations.
| | | | | | | | |
| | | |
| OCTOBER 31, 2016 | | JPMORGAN EXCHANGE-TRADED FUNDS | | | | | 95 | |
NOTES TO FINANCIAL STATEMENTS
AS OF OCTOBER 31, 2016 (continued)
D. Waivers and Reimbursements — The Adviser has contractually agreed to waive fees and/or reimburse the Funds to the extent that total annual operating expenses (excluding acquired fund fees and expenses, dividend expenses related to short sales, interest, taxes, expenses related to litigation and potential litigation, and extraordinary expenses) exceed the percentages of the Funds’ respective average daily net assets as shown in the below table:
| | | | |
| | | Expense Cap | |
Emerging Markets Equity ETF | | | 0.45 | % |
Europe Currency Hedged ETF | | | 0.49 | % |
Europe Equity ETF | | | 0.43 | % |
Global Equity ETF | | | 0.38 | % |
International Currency Hedged ETF | | | 0.49 | % |
International Equity ETF | | | 0.43 | % |
U.S. Equity ETF | | | 0.29 | % |
U.S. Mid Cap Equity ETF | | | 0.34 | % |
The expense limitation agreements were in effect for the year ended October 31, 2016. The contractual expense limitation percentages in the table above are in place until at least February 28, 2019.
For the period ended October 31, 2016, the Funds’ service providers waived fees and/or reimbursed expenses for each Fund as follows. None of these parties expect the Funds to repay any such waived fees and/or reimbursed expenses in future years.
| | | | | | | | | | | | | | | | |
| | | Contractual Waivers | | | | |
| | | Investment
Advisory | | | Administration | | | Total | | | Contractual
Reimbursements | |
Emerging Markets Equity ETF | | $ | 138,198 | | | $ | 26,697 | | | $ | 164,895 | | | $ | 235,924 | |
Europe Currency Hedged ETF | | | 45,710 | | | | 11,774 | | | | 57,484 | | | | 33,742 | |
Europe Equity ETF | | | 114,484 | | | | 32,437 | | | | 146,921 | | | | 102,761 | |
Global Equity ETF | | | 155,544 | | | | 55,089 | | | | 210,633 | | | | 107,105 | |
International Currency Hedged ETF | | | 37,065 | | | | 11,669 | | | | 48,734 | | | | 59,146 | |
International Equity ETF | | | 652,626 | | | | 70,098 | | | | 722,724 | | | | — | |
U.S. Equity ETF | | | 105,392 | | | | 38,923 | | | | 144,315 | | | | 123,898 | |
U.S. Mid Cap Equity ETF | | | 36,378 | | | | 12,873 | | | | 49,251 | | | | 52,000 | |
Additionally, the Funds may invest in one or more money market funds advised by the Adviser or its affiliates (affiliated money market funds). The Adviser has agreed to waive the total expense ratio of the Underlying Funds.
The amount of the waivers resulting from investments in these money market funds as of October 31, 2016 were as follows:
| | | | |
U.S. Equity ETF | | $ | 26 | |
U.S. Mid Cap Equity ETF | | | 11 | |
E. Related Party Transactions
The Distributor or its agent distributes Creation Units for each Fund on an agency basis. The Distributor does not maintain a secondary market in shares of each Fund. The Distributor has no role in determining the investment policies of the Funds or the securities that are purchased or sold by the Funds. SIDCO receives no fee for its distribution services under the Distribution Agreement. Although the Distributor does not receive any fees under the Distribution Agreement with the Trust, JPMIM pays the Distributor for certain distribution related services.
F. Other — Certain officers of the Trust are affiliated with the Adviser. Such officers, with the exception of the Chief Compliance Officer, receive no compensation from the Funds for serving in their respective roles.
The Board of Trustees appointed a Chief Compliance Officer to the Funds in accordance with Federal securities regulations. The Funds, along with other affiliated funds, make reimbursement payments, on a pro-rata basis, to the Administrator for a portion of the fees associated with the Office of the Chief Compliance Officer. Such fees are included in Trustees’ and Chief Compliance Officer’s fees in the Funds’ Statements of Operations.
The Fund may use related party broker-dealers. For the year ended October 31, 2016, the Funds incurred brokerage commissions with broker-dealers affiliated with the Adviser as follows:
| | | | |
Emerging Markets Equity ETF | | $ | 12,973 | |
Europe Currency Hedged ETF | | | 1,206 | |
Europe Equity ETF | | | 6,122 | |
Global Equity ETF | | | 9,314 | |
International Currency Hedged ETF | | | 1,026 | |
International Equity ETF | | | 61,521 | |
U.S. Equity ETF | | | 6,434 | |
U.S. Mid Cap Equity ETF | | | 4,152 | |
| | | | | | |
| | | |
| 96 | | | | JPMORGAN EXCHANGE-TRADED FUNDS | | OCTOBER 31, 2016 |
The Securities and Exchange Commission (“SEC”) has granted an exemptive order permitting the Fund to engage in principal transactions with J.P. Morgan Securities, Inc., an affiliated broker, involving taxable money market instruments, subject to certain conditions.
4. Investment Transactions
During the period ended October 31, 2016, purchases and sales of investments (excluding short-term investments) were as follows:
| | | | | | | | |
| | | Purchases
(excluding U.S.
Government) | | | Sales
(excluding U.S.
Government) | |
Emerging Markets Equity ETF | | $ | 18,360,045 | | | $ | 13,970,440 | |
Europe Currency Hedged ETF | | | 2,336,893 | | | | 340,082 | |
Europe Equity ETF | | | 8,481,769 | | | | 6,793,291 | |
Global Equity ETF | | | 16,698,576 | | | | 13,938,998 | |
International Currency Hedged ETF | | | 1,810,205 | | | | 948,963 | |
International Equity ETF | | | 115,122,552 | | | | 72,593,075 | |
U.S. Equity ETF | | | 11,532,454 | | | | 10,519,425 | |
U.S. Mid Cap Equity ETF | | | 5,643,253 | | | | 4,928,628 | |
During the period ended October 31, 2016, there were no purchases or sales of U.S. Government securities.
For the period ended October 31, 2016, in-kind transactions associated with creations and redemptions were:
| | | | | | | | | | | | |
| | | In-Kind Purchases | | | In-Kind Sales | | | Realized
Gain (Loss) | |
Emerging Markets Equity ETF | | $ | 8,317,223 | | | $ | 5,821,977 | | | $ | (1,357,504 | ) |
Europe Currency Hedged ETF | | | 25,647,594 | | | | — | | | | — | |
Europe Equity ETF | | | 59,456,518 | | | | — | | | | — | |
Global Equity ETF | | | 22,099,829 | | | | — | | | | — | |
International Currency Hedged ETF | | | 25,846,937 | | | | — | | | | — | |
International Equity ETF | | | 333,168,580 | | | | — | | | | — | |
U.S. Equity ETF | | | 113,451,061 | | | | — | | | | — | |
U.S. Mid Cap Equity ETF | | | 34,155,561 | | | | — | | | | — | |
5. Federal Income Tax Matters
For Federal income tax purposes, the estimated cost and unrealized appreciation (depreciation) in value of investment securities held at October 31, 2016 were as follows:
| | | | | | | | | | | | | | | | |
| | | Aggregate
Cost | | | Gross
Unrealized
Appreciation | | | Gross
Unrealized
Depreciation | | | Net Unrealized
Appreciation
(Depreciation) | |
Emerging Markets Equity ETF | | $ | 43,832,329 | | | $ | 3,044,294 | | | $ | (3,175,349 | ) | | $ | (131,055 | ) |
Europe Currency Hedged ETF | | | 27,644,406 | | | | — | | | | (1,120,342 | ) | | | (1,120,342 | ) |
Europe Equity ETF | | | 61,000,392 | | | | 2,675,278 | | | | (4,054,970 | ) | | | (1,379,692 | ) |
Global Equity ETF | | | 73,799,201 | | | | 7,167,305 | | | | (4,049,542 | ) | | | 3,117,763 | |
International Currency Hedged ETF | | | 26,713,274 | | | | — | | | | (361,568 | ) | | | (361,568 | ) |
International Equity ETF | | | 466,442,278 | | | | 26,504,944 | | | | (24,004,359 | ) | | | 2,500,585 | |
U.S. Equity ETF | | | 125,973,809 | | | | 3,167,982 | | | | (3,585,865 | ) | | | (417,883 | ) |
U.S. Mid Cap Equity ETF | | | 35,404,526 | | | | 1,796,967 | | | | (1,020,352 | ) | | | 776,615 | |
The difference between book and tax basis appreciation (depreciation) on investments is primarily attributed to investments in passive foreign investment companies, wash sale loss deferrals and investments in real estate investment trusts.
The tax character of distributions paid during the years ended October 31, 2016 and October 31, 2015 was as follows:
| | | | | | | | |
| | | Ordinary
Income | | | Total Distributions
Paid | |
Emerging Markets Equity ETF | | | | | | | | |
2016 | | $ | 1,050,480 | | | $ | 1,050,480 | |
2015 | | | — | | | | — | |
Europe Equity ETF | | | | | | | | |
2016 | | | 918 | | | | 918 | |
Global Equity ETF | | | | | | | | |
2016 | | | 1,057,127 | | | | 1,057,127 | |
2015 | | | 288,042 | | | | 288,042 | |
| | | | | | | | |
| | | |
| OCTOBER 31, 2016 | | JPMORGAN EXCHANGE-TRADED FUNDS | | | | | 97 | |
NOTES TO FINANCIAL STATEMENTS
AS OF OCTOBER 31, 2016 (continued)
| | | | | | | | |
| | | Ordinary
Income | | | Total Distributions
Paid | |
International Equity ETF | | | | | | | | |
2016 | | $ | 2,154,090 | | | $ | 2,154,090 | |
2015 | | | 44,215 | | | | 44,215 | |
U.S. Equity ETF | | | | | | | | |
2016 | | | 130,025 | | | | 130,025 | |
2015 | | | — | | | | — | |
As of October 31, 2016, the estimated components of net assets (excluding paid-in-capital) on a tax basis were as follows:
| | | | | | | | | | | | | | | | | | | | | | | | | | | | |
| | | Undistributed
Ordinary Income | | | Undistributed
Long-Term
Capital Gain | | | Capital Loss
Carryforwards | | | Late Year
Deferral
Loss | | | Unrealized
Appreciation
(Depreciation) on
Investments and
Foreign Currency | | | Other Temporary
Differences (a) | | | Total Distributable
Earnings
(Accumulated
Losses) | |
Emerging Markets Equity ETF | | $ | 667,287 | | | $ | — | | | $ | (6,413,914 | ) | | | — | | | $ | (129,021 | ) | | $ | — | | | $ | (5,875,648 | ) |
Europe Currency Hedged ETF | | | 742,128 | | | | 1,083,788 | | | | — | | | | (67,904 | ) | | | (182,682 | ) | | | (930,655 | ) | | | 644,675 | |
Europe Equity ETF | | | 1,210,966 | | | | — | | | | (174,492 | ) | | | — | | | | (1,381,930 | ) | | | — | | | | (345,456 | ) |
Global Equity ETF | | | 1,421,014 | | | | — | | | | (1,940,009 | ) | | | — | | | | 3,109,301 | | | | — | | | | 2,590,306 | |
International Currency Hedged ETF | | | 403,711 | | | | 547,901 | | | | — | | | | (67,265 | ) | | | 510,407 | | | | (869,164 | ) | | | 525,590 | |
International Equity ETF | | | 7,437,438 | | | | — | | | | (3,318,381 | ) | | | — | | | | 2,456,766 | | | | — | | | | 6,575,823 | |
U.S. Equity ETF | | | 771,657 | | | | — | | | | (125,254 | ) | | | — | | | | (417,883 | ) | | | — | | | | 228,520 | |
U.S. Mid Cap Equity ETF | | | 260,771 | | | | — | | | | (87,090 | ) | | | — | | | | 776,615 | | | | — | | | | 950,296 | |
| (a) | Amounts primarily relate to mark-to-market on forward foreign currency exchange contracts. |
As of October 31, 2016, the Funds had net capital loss carryforwards, with no expiration dates, as follows:
| | | | | | | | |
| | | Capital Loss Carryforward Character | |
| | | Short Term | | | Long-Term | |
Emerging Markets Equity ETF | | $ | 5,289,224 | | | $ | 1,124,690 | |
Europe Equity ETF | | | 174,492 | | | | — | |
Global Equity ETF | | | 765,792 | | | | 1,174,217 | |
International Equity ETF | | | 1,833,345 | (b) | | | 1,485,036 | (b) |
U.S. Equity ETF | | | 92,850 | | | | 32,404 | |
U.S. Mid Cap Equity ETF | | | 87,090 | | | | — | |
| (b) | Subject to limitation under IRC section 382-384. |
6. Capital Share Transactions
The Trust issues and redeems shares of the Funds only in Creation Units through the Distributor at NAV. Capital shares transactions detail can be found in the Statements of Changes in Net Assets.
Shares of the Funds may only be purchased or redeemed by Authorized Participants. Such Authorized Participants may from time to time hold, of record or beneficially, a substantial percentage of the Funds’ shares outstanding, act as executing or clearing broker for investment transactions on behalf of the Funds. An Authorized Participant is either (1) a “Participating Party” or other participant in the clearing process through the Continuous Net Settlement System of the National Securities Clearing Corporation (“NSCC”); or (2) a DTC Participant; which, in either case, must have executed an agreement with the Distributor.
Creation Units of a Fund may be created in advance of receipt by the Trust of all or a portion of the applicable basket of equity securities and other instruments (“Deposit Instruments”) and cash as described in the Funds’ registration statement. In these instances, the initial Deposit Instruments and cash must be deposited in an amount equal to the sum of the cash amount, plus at least 105% of the market value of undelivered Deposit Instruments. A transaction fee may be imposed to offset transfer and other transaction costs associated with the purchase or redemption of Creation Units.
7. Risks, Concentrations and Indemnifications
In the normal course of business, the Funds enter into contracts that contain a variety of representations which provide general indemnifications. The Funds’ maximum exposure under these arrangements is unknown. The amount of exposure would depend on future claims that may be made against the Funds that have not yet occurred. However, based on experience, the Funds expect the risk of loss to be remote.
| | | | | | |
| | | |
| 98 | | | | JPMORGAN EXCHANGE-TRADED FUNDS | | OCTOBER 31, 2016 |
As of October 31, 2016, the Adviser owned shares representing more than 10% of net assets of the following Funds:
| | | | |
| | | %
Ownership | |
Emerging Markets Equity ETF | | | 53 | % |
Europe Currency Hedged ETF | | | 97 | % |
Europe Equity ETF | | | 43 | % |
Global Equity ETF | | | 33 | % |
International Currency Hedged ETF | | | 96 | % |
U.S. Equity ETF | | | 53 | % |
U.S. Mid Cap Equity ETF | | | 71 | % |
Furthermore, as of October 31, 2016, the Europe Currency Hedged ETF owned approximately 44% of the shares outstanding of the Europe Equity ETF.
Significant transactions by these shareholders may impact the Fund’s performance.
Each Fund may have elements of risk not typically associated with investment in the United States of America due to concentrated investments in a limited number of countries or regions, which may vary throughout the year depending on a Fund’s benchmark index (each an “underlying index”). Such concentrations may subject the Funds to additional risks resulting from political or economic conditions in such countries or regions and the possible imposition of adverse governmental laws or currency exchange restrictions could cause the securities and their markets to be less liquid and their prices to be more volatile than those of comparable U.S. securities.
As of October 31, 2016, the following Funds had non-U.S. country allocations representing greater than 10% of total investments as follows:
| | | | | | | | | | | | | | | | | | | | | | | | | | | | | | | | |
| | | Brazil | | | China | | | France | | | Germany | | | Japan | | | Switzerland | | | Taiwan | | | United
Kingdom | |
Emerging Markets Equity ETF | | | 12.2 | % | | | 19.0 | % | | | — | % | | | — | % | | | — | % | | | — | % | | | 19.9 | % | | | — | % |
Europe Equity ETF | | | — | | | | — | | | | 14.0 | | | | 13.7 | | | | — | | | | 11.4 | | | | — | | | | 24.7 | |
Global Equity ETF | | | — | | | | — | | | | — | | | | — | | | | 24.5 | | | | — | | | | — | | | | — | |
International Equity ETF | | | — | | | | — | | | | — | | | | — | | | | 26.9 | | | | — | | | | — | | | | 19.3 | |
With the exception of U.S. Equity ETF and U.S. Mid Cap Equity ETF, as of October 31, 2016, a significant portion of the net assets of the Funds noted in the table above consisted of securities that are denominated in foreign currencies. Changes in currency exchange rates will affect the value of, and investment income from, such securities.
Premium/Discount Risk — Disruptions to creations and redemptions, the existence of significant market volatility or potential lack of an active trading market for the Shares (including through a trading halt), as well as other factors, may result in Shares trading significantly above (at a premium) or below (at a discount) to the NAV or to the intraday value of the Fund’s holdings. During such periods, investors may incur significant losses if shares are sold.
Index Tracking Risk — A Fund may not track the return of the underlying index for a number of reasons and therefore may not achieve its investment objective. For example, each Fund incurs a number of operating expenses not applicable to its underlying index, and incurs costs in buying and selling securities, especially when rebalancing the Fund’s securities holdings to reflect changes in the composition of the underlying index. In addition, a Fund’s return may differ from the return of its underlying index as a result of, among other things, pricing differences and the inability to purchase certain securities included in the underlying index due to regulatory or other restrictions. To the extent of the previously outlined items, each Fund’s return differs from the return of the underlying index.
Counterparty Risk — The Funds are subject to counterparty risk, which is the risk that a counterparty will not fulfill its contractual obligations arising from agreements with the Funds such as forward foreign currency exchange contracts.
Derivatives Risk — Derivatives and futures may be riskier than other types of investments because they may be more sensitive to changes in economic or market conditions than other types of investments and could result in losses that significantly exceed the Fund’s original investment. Many derivatives create leverage thereby causing a Fund to be more volatile than it would be if it had not used derivatives. Derivatives also expose a Fund to counterparty risk including the credit risk of the derivative counterparty.
| | | | | | | | |
| | | |
| OCTOBER 31, 2016 | | JPMORGAN EXCHANGE-TRADED FUNDS | | | | | 99 | |
REPORT OF INDEPENDENT REGISTERED PUBLIC ACCOUNTING FIRM
To the Board of Trustees of J.P. Morgan Exchange-Traded Fund Trust and the Shareholders of JPMorgan Diversified Return Emerging
Markets Equity ETF, JPMorgan Diversified Return Europe Currency Hedged ETF, JPMorgan Diversified Return Europe Equity ETF,
JPMorgan Diversified Return Global Equity ETF, JPMorgan Diversified Return International Currency Hedged ETF, JPMorgan Diversified Return International Equity ETF, JPMorgan Diversified Return U.S. Equity ETF and JPMorgan Diversified Return U.S. Mid Cap Equity ETF:
In our opinion, the accompanying statements of assets and liabilities, including the schedules of portfolio investments, and the
related statements of operations and of changes in net assets and the financial highlights present fairly, in all material respects, the
financial position of JPMorgan Diversified Return Emerging Markets Equity ETF, JPMorgan Diversified Return Europe Currency Hedged ETF, JPMorgan Diversified Return Europe Equity ETF, JPMorgan Diversified Return Global Equity ETF, JPMorgan Diversified Return International Currency Hedged ETF, JPMorgan Diversified Return International Equity ETF, JPMorgan Diversified Return U.S. Equity ETF and JPMorgan Diversified Return U.S. Mid Cap Equity ETF (each a separate fund of J.P. Morgan Exchange-Traded Fund Trust) (the “Funds”) as of October 31, 2016, and the results of each of their operations, the changes in each of their net assets and the financial highlights for each of the periods presented, in conformity with accounting principles generally accepted in the United States of America. These financial statements and financial highlights (hereafter referred to as “financial statements”) are the responsibility of the Funds’ management. Our responsibility is to express an opinion on these financial statements based on our audits. We conducted our audits of these financial statements in accordance with the standards of the Public Company Accounting Oversight Board (United States). Those standards require that we plan and perform the audit to obtain reasonable assurance about whether the financial statements are free of material misstatement. An audit includes examining, on a test basis, evidence supporting the amounts and disclosures in the financial statements, assessing the accounting principles used and significant estimates made by management, and evaluating the overall financial statement presentation. We believe that our audits, which included confirmation of securities as of October 31, 2016 by correspondence with the transfer agent, custodian and brokers, provide a reasonable basis for our opinion.
PricewaterhouseCoopers LLP
New York, New York
December 21, 2016
| | | | | | |
| | | |
| 100 | | | | JPMORGAN EXCHANGE-TRADED FUNDS | | OCTOBER 31, 2016 |
SUPPLEMENTAL INFORMATION
FOR THE PERIODS INDICATED (Unaudited)
The table below indicates the number of trading days in which the Funds traded within the range of the premium/discount noted. The number of days in each range is also shown as a percentage of the total trading days for the period covered in the table. All information within the table is based on historical performance. Past performance cannot be used to predict future results. Shareholders may pay more than NAV when they buy fund shares and receive less than NAV when they sell those shares because shares are bought and sold at current market prices.
| | | | | | | | | | | | | | | | | | | | | | | | |
| | | Emerging Markets Equity ETF (a) | | | Europe Currency Hedged ETF (b) | | | Europe Equity ETF (c) | |
| Range of Premium/(Discount) | | Day Count | | | Percentage | | | Day Count | | | Percentage | | | Day Count | | | Percentage | |
Greater than 2.0% and Less than or equal to 2.5% | | | — | | | | — | % | | | 1 | | | | 0.68 | % | | | — | | | | — | % |
Greater than 1.5% and Less than or equal to 2.0% | | | 3 | | | | 0.65 | % | | | 2 | | | | 1.35 | % | | | — | | | | — | % |
Greater than 1.0% and Less than or equal to 1.5% | | | 21 | | | | 4.57 | % | | | 1 | | | | 0.68 | % | | | 1 | | | | 0.45 | % |
Greater than 0.5% and Less than or equal to 1.0% | | | 148 | | | | 32.17 | % | | | 2 | | | | 1.35 | % | | | 21 | | | | 9.55 | % |
Between 0.5% and –0.5% | | | 163 | | | | 35.44 | % | | | 137 | | | | 92.55 | % | | | 198 | | | | 90.00 | % |
Less than –0.5% and greater than or equal to –1.0% | | | 93 | | | | 20.22 | % | | | 2 | | | | 1.35 | % | | | — | | | | — | % |
Less than –1.0% and greater than or equal to –1.5% | | | 26 | | | | 5.65 | % | | | 1 | | | | 0.68 | % | | | — | | | | — | % |
Less than –1.5% and greater than or equal to –2.0% | | | 6 | | | | 1.30 | % | | | 1 | | | | 0.68 | % | | | — | | | | — | % |
Less than –4.0% and greater than or equal to –4.5% | | | — | | | | — | % | | | 1 | | | | 0.68 | % | | | — | | | | — | % |
| | | | | | | | | | | | | | | | | | | | | | | | |
| | | 460 | | | | 100.00 | % | | | 148 | | | | 100.00 | % | | | 220 | | | | 100.00 | % |
| | | | | | | | | | | | | | | | | | | | | | | | |
| | | |
| | | Global Equity ETF (d) | | | International Currency
Hedged ETF (b) | | | International Equity ETF (e) | |
| Range of Premium/(Discount) | | Day Count | | | Percentage | | | Day Count | | | Percentage | | | Day Count | | | Percentage | |
Greater than 1.0% and Less than or equal to 1.5% | | | — | | | | — | % | | | — | | | | — | % | | | 1 | | | | 0.20 | % |
Greater than 0.5% and Less than or equal to 1.0% | | | 39 | | | | 6.48 | % | | | — | | | | — | % | | | 130 | | | | 25.95 | % |
Between 0.5% and –0.5% | | | 560 | | | | 93.02 | % | | | 148 | | | | 100.00 | % | | | 367 | | | | 73.25 | % |
Less than –0.5% and greater than or equal to –1.0% | | | 2 | | | | 0.33 | % | | | — | | | | — | % | | | 3 | | | | 0.60 | % |
Less than –1.0% and greater than or equal to –1.5% | | | 1 | | | | 0.17 | % | | | — | | | | — | % | | | — | | | | — | % |
| | | | | | | | | | | | | | | | | | | | | | | | |
| | | 602 | | | | 100.00 | % | | | 148 | | | | 100.00 | % | | | 501 | | | | 100.00 | % |
| | | | | | | | | | | | | | | | | | | | | | | | |
| | | | | | | | | | | | | | | | |
| | | U.S. Equity ETF (f) | | | U.S. Mid Cap Equity ETF (g) | |
| Range of Premium/(Discount) | | Day Count | | | Percentage | | | Day Count | | | Percentage | |
Between 0.5% and –0.5% | | | 276 | | | | 100.00 | % | | | 118 | | | | 100.00 | % |
| | | | | | | | | | | | | | | �� | |
| | | 276 | | | | 100.00 | % | | | 118 | | | | 100.00 | % |
| | | | | | | | | | | | | | | | |
| (a) | For the period January 7, 2015 (fund inception date) to October 31, 2016. |
| (b) | For the period April 1, 2016 (fund inception date) to October 31, 2016. |
| (c) | For the period December 18, 2015 (fund inception date) to October 31, 2016. |
| (d) | For the period June 16, 2014 (fund inception date) to October 31, 2016. |
| (e) | For the period November 5, 2014 (fund inception date) to October 31, 2016. |
| (f) | For the period September 29, 2015 (fund inception date) to October 31, 2016. |
| (g) | For the period May 11, 2016 (fund inception date) to October 31, 2016. |
| | | | | | | | |
| | | |
| OCTOBER 31, 2016 | | JPMORGAN EXCHANGE-TRADED FUNDS | | | | | 101 | |
TRUSTEES
(Unaudited)
The Fund’s Statement of Additional Information includes additional information about the Funds Trustees and is available, without charge, upon request by calling 1-844-457-6383 or on the J.P. Morgan Funds’ website at www.jpmorganfunds.com.
| | | | | | | | |
Name (Year of Birth;
Positions With
the Funds since) | | Principal Occupation
During the Past 5 Years | | Number of
Funds in Fund
Complex Overseen
by Trustee (1) | | | Other Directorships Held
During the Past 5 Years |
Independent Trustees | | | | | | | | |
| | | |
Gary L. French (1951);
Trustee of the Trust since 2014 | | Real Estate Investor (2011-present); Senior Consultant for the Regulatory Fundamentals Group LLC (2011-present); Senior Vice President-Fund Administration, State Street Corporation (2002-2010). | | | 14 | | | Independent Trustee, The China Fund, Inc. (2013-present); Exchange Traded Concepts Trust II (2012-2014); Exchange Traded Concepts Trust I (2011-2014). |
| | | |
Robert J. Grassi (1957);
Trustee of the Trust since 2014 | | Sole Proprietor, Academy Hills Advisors LLC (2012-present); Pension Director, Coming Incorporated (2002-2012). | | | 14 | | | None. |
| | | |
Thomas P. Lemke (1954);
Trustee of the Trust since 2014 | | Retired; Executive Vice President and General Counsel, Legg Mason (2005-2013). | | | 14 | | | Independent Trustee of AXA Premier VIP Trust (2014-present); SEI family of funds, Independent Trustee of The Advisors’ Inner Circle III Funds (5 portfolios) (2014-present); Independent Trustee of O’Connor EQUUS (2014-present); Independent Trustee of Winton Series Trust (2014-present); Independent Director of The Victory Funds (or their predecessor funds) (35 portfolios) (2014-2015). |
| | | |
Lawrence R. Maffia (1950);
Trustee of the Trust since 2014 | | Retired; Director and President, ICI Mutual Insurance Company (2006-2013). | | | 14 | | | Director, ICI Mutual Insurance Company (1999-2013). |
| | | |
Emily A. Youssouf (1951);
Trustee of the Trust since 2014 | | Clinical Professor, NYU Schack Institute of Real Estate (2009-present); Board Member, NYC Health and Hospitals Corporation (2005-present); Board Member and Member of The Audit Committee and Related Parties Committee, PennyMac Financial Services, Inc. (2013-present) | | | 14 | | | Trustee, NYC School Construction Authority (2009-present); Board Member, NYS Job Development Authority (2008-present); Trustee (2015-present) and Chair of the Audit Committee (2015-present) of the Transit Center; Vice Chair (2011-2013) and Board Member (2013-present) of New York City Housing Authority. |
Interested Trustee | | | | | | | | |
| | | |
Robert Deutsch (2) (1957);
Trustee of the Trust since 2014 | | Head of the Global ETF Business for JPMorgan Asset Management (2013-present); Head of the Global Liquidity Business for JPMorgan Asset Management (2003-2013). | | | 14 | | | None |
| (1) | A Fund complex means two or more registered investment companies that hold themselves out to investors as related companies for purposes of investment and investor services or have a common investment adviser or have an investment adviser that is an affiliated person of the investment adviser of any of the other registered investment companies. Eleven Funds are currently operating and three additional series are in registration and three additional series have been created and will be registered in the future. |
| (2) | Mr. Deutsch is an interested trustee because he is an employee of the Adviser. |
| | | | | | |
| | | |
| 102 | | | | JPMORGAN EXCHANGE-TRADED FUNDS | | OCTOBER 31, 2016 |
OFFICERS
(Unaudited)
| | |
Name (Year of Birth),
Positions Held with
the Trusts (Since) | | Principal Occupations During Past 5 Years |
| |
Robert F. Deutsch (1957),
President and Principal Executive Officer (2014)* | | Managing Director, global head of J.P. Morgan Asset Management’s Exchange Traded Funds and a member of the J.P. Morgan Global Funds Operating Committee. Previously, head of the Global Liquidity Business from 2003 to 2013 and National Sales Manager for J.P. Morgan’s U.S. Mutual Funds Business prior to 2003. |
| |
Lauren A. Paino (1973),
Treasurer and Principal Financial Officer (2015)*** | | Executive Director, J.P. Morgan Investment Management Inc. (formerly JPMorgan Funds Management, Inc.) since August 2013; Director, Credit Suisse Asset Management (2000-2013); Manager, PricewaterhouseCoopers LLP (1995-2000). |
| |
Paul Shield (1960),
Vice President and Assistant Treasurer (2016) | | Managing Director and head of Business Management for JPMorgan Asset Management’s Exchange Traded Fund platform since 2013. Senior Global Product Manager of Alternative Investments for BNY Mellon from 2011 to 2013 and Global Product Head for Exchange Traded Funds at JPMorgan Chase Bank from 2008 to 2011. |
| |
Brian S. Shlissel (1964),
Vice President (2016) | | Managing Director and Chief Administrative Officer, leads the JPMorgan U.S. Platform Management Team for JPMorgan’s pooled vehicles, including ETFs and mutual funds since 2014. Prior to joining JPMorgan in 2014, President and Chief Executive Officer for Mutual Funds and Head of Mutual Fund Services for Allianz Global Investors. |
| |
Frank J. Nasta (1964),
Secretary (2014) | | Managing Director and Associate General Counsel, JPMorgan Chase since 2008. |
| |
Stephen M. Ungerman (1953),
Chief Compliance Officer (2014) | | Managing Director, JPMorgan Chase & Co.; Mr. Ungerman has been with JPMorgan Chase & Co. since 2000. |
| |
Elizabeth A. Davin (1964),
Assistant Secretary (2014)** | | Executive Director and Assistant General Counsel, JPMorgan Chase since February 2012; formerly Vice President and Assistant General Counsel, JPMorgan Chase from 2005 until February 2012; Senior Counsel, JPMorgan Chase (formerly Bank One Corporation) from 2004 to 2005. |
| |
Jessica K. Ditullio (1962),
Assistant Secretary (2014)** | | Executive Director and Assistant General Counsel, JPMorgan Chase since February 2011; Ms. Ditullio has served as an attorney with various titles for JPMorgan Chase (formerly Bank One Corporation) since 1990. |
| |
John T. Fitzgerald (1975),
Assistant Secretary (2014) | | Executive Director and Assistant General Counsel, JPMorgan Chase since February 2011; formerly, Vice President and Assistant General Counsel, JPMorgan Chase from 2005 until February 2011; Associate Skadden, Arps, Slate, Meagher & Flom LLP (law firm) from 2006-2011. |
| |
Carmine Lekstutis (1980),
Assistant Secretary (2014) | | Executive Director and Assistant General Counsel, JPMorgan Chase since February 2015; formerly Vice President and Assistant General Counsel, JPMorgan Chase from 2011 to February 2015; Associate, Skadden, Arps, Slate, Meagler & Flom LLP (law firm) from 2006 to 2011. |
| |
Gregory S. Samuels (1980),
Assistant Secretary (2014) | | Executive Director and Assistant General Counsel, JPMorgan Chase since February 2014; formerly Vice President and Assistant General Counsel, JPMorgan Chase from 2010 to February 2014; Associate, Ropes & Gray (law firm) from 2008 to 2010. |
| |
Pamela L. Woodley (1971),
Assistant Secretary (2014)*** | | Vice President and Assistant General Counsel, JPMorgan Chase since November 2004. |
| |
Frederick J. Cavaliere (1978),
Assistant Treasurer (2015)*** | | Executive Director, J.P. Morgan Investment Management Inc. (formerly JPMorgan Funds Management, Inc.) since February 2016; formerly Vice President, JPMorgan Investment Management Inc. (formerly JPMorgan Funds Management, Inc.) since September 2011; formerly Vice President of J.P. Morgan Investment Management Inc. 2010-2011. Mr. Cavaliere has been with JPMorgan since May 2006. |
| |
Michael M. D’Ambrosio (1969),
Assistant Treasurer (2014) | | Managing Director, J.P. Morgan Investment Management Inc. (formerly JPMorgan Funds Management, Inc.) since 2014; formerly Executive Director, J.P. Morgan Investment Management Inc. (formerly JPMorgan Funds Management, Inc.) from 2012 to 2014; prior to joining JPMorgan Chase, Mr. D’Ambrosio was a Tax Director at PricewaterhouseCoopers LLP since 2006. |
| |
Julie A. Roach (1971),
Assistant Treasurer (2014)** | | Vice President, J.P. Morgan Investment Management Inc. (formerly JPMorgan Funds Management, Inc.) from August 2012; prior to joining JPMorgan Chase, Ms. Roach was a Senior Manager with Deloitte since 2001. |
| |
Jason Ronca (1978),
Assistant Treasurer (2014)**** | | Vice President, Assistant Treasurer and ETF Platform Manager for J.P. Morgan Asset Management since 2014. ETF Product Manager for Corporate Investment Bank responsible for setting the strategy and control agenda for the ETF servicing business from 2010 to May 2014; Prior to 2010, a Vice President in Fund Accounting within J.P. Morgan Investor Services, supporting a series of U.S. registered mutual funds. |
| * | | The contact address for the officer is 500 Stanton Christiana Road, Newark, DE 19173. |
| ** | | The contact address for the officer is 1111 Polaris Parkway, Columbus, OH 43240. |
| *** | | The contact address for the officer is 4 New York Plaza, New York, NY 10004. |
| **** | | The contact address for the officer is One Beacon Street, Boston, MA 02108. |
| | | | | | | | |
| | | |
| OCTOBER 31, 2016 | | JPMORGAN EXCHANGE-TRADED FUNDS | | | | | 103 | |
SCHEDULE OF SHAREHOLDER EXPENSES
(Unaudited)
Hypothetical $1,000 Investment
As a shareholder of the Funds, you incur ongoing costs, including investment advisory fees, administration fees, distribution fees and other Fund expenses, in addition to brokerage commissions on your purchases and sales of Fund shares. The examples below are intended to help you understand your ongoing costs (in dollars) of investing in the Fund and to compare these ongoing costs with the ongoing costs of investing in other funds. The examples assume that you had a $1,000 investment at the beginning of the reporting period May 1, 2016 and continued to hold your shares at the end of the reporting period, October 31, 2016.
Actual Expenses
For the Fund in the table below, the first line provides information about actual account values and actual expenses. You may use the information in this line, together with the amount you invested, to estimate the expenses that you paid over the period. Simply divide your account value by $1,000 (for example, an $8,600 account value divided by $1,000 = 8.6), then multiply the result by the number under the heading
entitled “Expenses Paid During the Period” to estimate the expenses you paid on your account during this period.
Hypothetical Example for Comparison Purposes
The second line in the table below provides information about hypothetical account values and hypothetical expenses based on the Fund’s actual expense ratio and an assumed rate of return of 5% per year before expenses, which is not the Fund’s actual return. The hypothetical account values and expenses may not be used to estimate the actual ending account balance or expenses you paid for the period. You may use this information to compare the ongoing costs of investing in the Fund and other Funds. To do so, compare this 5% hypothetical example with the 5% hypothetical examples that appear in the shareholder reports of other funds. The examples also assume all dividends and distributions have been reinvested. The examples do not take into account brokerage commissions that you pay when purchasing or selling shares of a Fund.
| | | | | | | | | | | | | | | | |
| | | Beginning
Account Value
5/1/2016 | | | Ending
Account Value
10/31/2016 | | | Annualized
Expense
Ratios | | | Expenses
Paid During
Period | |
JPMorgan Diversified Return Emerging Markets Equity ETF | | | | | | | | | | | | | | | | |
Actual Fund Return | | $ | 1,000.00 | | | $ | 1,095.40 | | | | 0.45 | % | | $ | 2.37 | |
Hypothetical 5% Return (1) | | | 1,000.00 | | | | 1,022.87 | | | | 0.45 | | | | 2.29 | |
| | | | |
JPMorgan Diversified Return Europe Currency Hedged ETF | | | | | | | | | | | | | | | | |
Actual Fund Return | | $ | 1,000.00 | | | $ | 1,048.30 | | | | 0.49 | % | | $ | 2.50 | |
Hypothetical 5% Return (1) | | | 1,000.00 | | | | 1,022.67 | | | | 0.49 | | | | 2.46 | |
| | | | |
JPMorgan Diversified Return Europe Equity ETF | | | | | | | | | | | | | | | | |
Actual Fund Return | | $ | 1,000.00 | | | $ | 963.50 | | | | 0.43 | % | | $ | 2.12 | |
Hypothetical 5% Return (1) | | | 1,000.00 | | | | 1,022.97 | | | | 0.43 | | | | 2.19 | |
| | | | |
JPMorgan Diversified Return Global Equity ETF | | | | | | | | | | | | | | | | |
Actual Fund Return | | $ | 1,000.00 | | | $ | 1,018.10 | | | | 0.38 | % | | $ | 1.93 | |
Hypothetical 5% Return (1) | | | 1,000.00 | | | | 1,022.23 | | | | 0.38 | | | | 1.93 | |
| | | | |
JPMorgan Diversified Return International Currency Hedged ETF | | | | | | | | | | | | | | | | |
Actual Fund Return | | $ | 1,000.00 | | | $ | 1,051.10 | | | | 0.49 | % | | $ | 2.53 | |
Hypothetical 5% Return (1) | | | 1,000.00 | | | | 1,022.67 | | | | 0.49 | | | | 2.49 | |
| | | | |
JPMorgan Diversified Return International Equity ETF | | | | | | | | | | | | | | | | |
Actual Fund Return | | $ | 1,000.00 | | | $ | 998.00 | | | | 0.43 | % | | $ | 2.16 | |
Hypothetical 5% Return (1) | | | 1,000.00 | | | | 1,022.97 | | | | 0.43 | | | | 2.19 | |
| | | | |
JPMorgan Diversified Return U.S. Equity ETF | | | | | | | | | | | | | | | | |
Actual Fund Return | | $ | 1,000.00 | | | $ | 1,026.60 | | | | 0.29 | % | | $ | 1.48 | |
Hypothetical 5% Return (1) | | | 1,000.00 | | | | 1,023.68 | | | | 0.29 | | | | 1.48 | |
| | | | |
JPMorgan Diversified Return U.S. Mid Cap Equity ETF | | | | | | | | | | | | | | | | |
Actual Fund Return (2) | | $ | 1,000.00 | | | $ | 1,033.00 | | | | 0.34 | % | | $ | 1.63 | |
Hypothetical 5% Return (1) | | | 1,000.00 | | | | 1,023.43 | | | | 0.34 | | | | 1.73 | |
| (1) | Expenses are equal to the Fund’s annualized expense ratio, multiplied by the average account value over the period, multiplied by 184/366 (to reflect the one-half year period). |
| (2) | Expenses are equal to the Fund’s annualized expense ratio, multiplied by the average account value over the period, multiplied by 173/366 (to reflect the period since the commencement of operations). |
| | | | | | |
| | | |
| 104 | | | | JPMORGAN EXCHANGE-TRADED FUNDS | | OCTOBER 31, 2016 |
TAX LETTER
(Unaudited)
Certain tax information for the JPMorgan ETFs is required to be provided to shareholders based upon the Funds’ income and distributions for the taxable year ended October 31, 2016. The information and distributions reported in this letter may differ from the information and taxable distributions reported to the shareholders for the calendar year ending December 31, 2016. The information necessary to complete your income tax returns for the calendar year ending December 31, 2016 will be provided under separate cover.
Dividends Received deductions
Each Fund listed below had the following percentage, or maximum allowable percentage, of ordinary income distributions eligible for the 70% dividends received deductions for corporate shareholders for the fiscal year ended October 31, 2016.
| | | | |
| | | Dividends Received Deduction | |
Emerging Markets Equity ETF | | | 0.73 | % |
Europe Equity ETF | | | 0.00 | % |
Global Equity ETF | | | 20.71 | % |
International Equity ETF | | | 0.11 | % |
U.S. Equity ETF | | | 99.77 | % |
Foreign Source Income and Foreign Tax Credit Pass Through
For the fiscal year ended October 31, 2016, the following Funds intend to elect to pass through to shareholders taxes paid to foreign countries. Gross income and foreign tax expenses are as follows or amounts as finally determined:
| | | | | | | | |
| | | Gross Income | | | Foreign Tax Pass Through | |
Emerging Markets Equity ETF | | $ | 1,004,707 | | | $ | 119,244 | |
Europe Equity ETF | | | 1,527,700 | | | | 93,679 | |
Global Equity ETF | | | 1,859,668 | | | | 117,629 | |
International Equity ETF | | | 8,734,007 | | | | 405,257 | |
Qualified Dividend Income (QDI)
Each fund listed below had the following amount, or maximum allowable amount, of ordinary income distributions treated as qualified dividends for the fiscal year ended October 31, 2016:
| | | | |
| | | Qualified Dividend Income | |
Emerging Markets Equity ETF | | $ | 665,042 | |
Europe Equity ETF | | | 94,597 | |
Global Equity ETF | | | 1,135,562 | |
International Equity ETF | | | 2,498,023 | |
U.S. Equity ETF | | | 129,726 | |
| | | | | | | | |
| | | |
| OCTOBER 31, 2016 | | JPMORGAN EXCHANGE-TRADED FUNDS | | | | | 105 | |
BOARD APPROVAL OF INITIAL INVESTMENT ADVISORY AGREEMENT
(Unaudited)
For the JPMorgan Diversified Return U.S. Mid Cap Equity ETF
On March 23 – 24, 2016, the Board of the Trust, a statutory Trust organized under the laws of the State of Delaware, held an in-person meeting and approved the initial Investment Advisory Agreement (“Agreement”) for the JPMorgan Diversified Return U.S. Mid Cap Equity ETF (the “Fund”). The approval included the approval of a majority of Trustees who are not interested persons of the Trust or the Adviser. Such Trustees are considered Independent Trustees as defined by the 1940 Act. In connection with the approval of the Agreement for the Fund, the Trustees reviewed written materials prepared by the Adviser and received oral presentations from Adviser personnel. Before voting on the proposed Agreement, the Trustees reviewed the Agreement with representatives of the Adviser and with counsel to the Trust and independent legal counsel and received a memorandum from independent legal counsel to the Trustees discussing the legal standards for their consideration of the proposed Agreement. The Trustees also discussed the proposed Agreement in an executive session with independent legal counsel at which no representatives of the Adviser were present. Set forth below is a summary of the material factors evaluated by the Trustees in determining whether to approve the Agreement for the Fund.
The Trustees considered information provided with respect to the Fund and the approval of the Agreement. Each Trustee attributed different weights to the various factors, and no factor alone was considered determinative. The Trustees determined that the proposed compensation to be received by the Adviser from the Fund under the Agreement was fair and reasonable and that the initial approval of the Agreement was in the best interests of the Fund and its potential shareholders.
The factors summarized below were considered and discussed by the Trustees in reaching their conclusions:
Nature, Extent and Quality of Services Provided by the Adviser
In connection with the approval of the initial Agreement, the Trustees considered the materials furnished specifically in connection with the approval of the Agreement, as well as other relevant information furnished for the Trustees. The Trustees considered the background and experience of the Adviser’s senior management and investment personnel, as well as the qualifications, backgrounds and responsibilities of the portfolio management team primarily responsible for the day-to-day management of the Fund. The Trustees also considered the investment strategy and the underlying indices for the Fund, and the infrastructure supporting the portfolio management team. In addition, the Trustees considered information about the structure and distribution strategy of the Fund, how it fits within the Trust’s lineup, and how it will be positioned against identified peers.
The Trustees also considered their knowledge of the nature and quality of the services provided by the Adviser gained from
experience as Trustees of the Trust and in the financial industry. In addition, they considered the overall reputation and capabilities of the Adviser and its affiliates, the commitment of the Adviser to provide high quality service to the Trust, their overall confidence in the Adviser’s integrity and the Adviser’s responsiveness to questions or concerns raised by them.
Based upon these considerations and other factors, the Trustees concluded that they were satisfied with the nature, extent and quality of the investment advisory services to be provided to the Fund by the Adviser.
Fall-Out Benefits
The Trustees reviewed information regarding potential “fallout” or ancillary benefits received by the Adviser and its affiliates as a result of their relationship with the Trust.
The Trustees also considered that the fees that the Administrator, an affiliate of the Adviser, will earn from the Fund for providing administrative services. The Trustees also considered the fees paid to JPMCB, also an affiliate of the Adviser, for custody, transfer agency and other related services. The Trustees also considered that any fall-out or ancillary benefits would be comparable to those related to the other actively managed funds in the complex.
Economies of Scale
The Trustees considered the extent to which the Fund will benefit from economies of scale. The Trustees noted that neither the proposed investment advisory fee schedule nor the proposed administration agreement for the Fund contains breakpoints. The Trustees considered whether it would be appropriate to add advisory fee breakpoints. With respect to the administration agreement, the Trustees also considered the fact that the Fund would benefit from economies of scale for the broader J.P. Morgan mutual fund complex because the administration fee had been set at a level consistent with the lower effective rate of the mutual funds, which includes breakpoints. The Trustees also noted that the Adviser has implemented fee waivers and expense limitations. The Trustees concluded that shareholders of the Fund will generally benefit from the lower expense ratios that resulted from these factors.
Investment Performance
The Trustees considered the Fund’s investment strategy and processes, including the fact that the Fund seeks performance that closely corresponds to its Index, the portfolio management team and competitive positioning against identified peer funds, and concluded that the prospects for competitive future performance were acceptable.
| | | | | | |
| | | |
| 106 | | | | JPMORGAN EXCHANGE-TRADED FUNDS | | OCTOBER 31, 2016 |
BOARD APPROVAL OF INITIAL INVESTMENT ADVISORY AGREEMENT
(continued)
Advisory Fees and Expense Ratios
The Trustees considered the contractual advisory fee rate that will be paid by the Fund to the Adviser and compared that rate to the fees charged to mutual funds with similar investment objectives or in similar asset classes managed by the Adviser, as well as information prepared by Broadridge, using data from Lipper Inc., independent providers of investment company data, concerning management fee rates paid by other funds in the same Lipper category as the Fund. The Trustees also noted that the Adviser does not currently manage mutual funds or institutional accounts with the same or substantially similar strategies proposed for the Fund. The Trustees also reviewed information about other projected expenses and the expense
ratios for the Fund. The Trustees considered the projected fee waiver and/or expense reimbursement arrangements proposed for the Fund and considered the net advisory fee rate after taking into account any projected waivers and/or reimbursements.
The Trustees noted that the Fund’s estimated net advisory fees and total expenses were in line with identified peer funds. The Trustees also noted that because the Fund was not yet operational, no profitability information was available. After considering the factors identified above, in light of the information, the Trustees concluded that the advisory fees were reasonable.
| | | | | | | | |
| | | |
| OCTOBER 31, 2016 | | JPMORGAN EXCHANGE-TRADED FUNDS | | | | | 107 | |
J.P. Morgan Exchange-Traded Funds are distributed by SEI Investments Distribution Co. (One Freedom Valley Dr., Oaks, PA 19456), which is not affiliated with JPMorgan Chase & Co. or any of its affiliates.
Contact J.P. Morgan Exchange-Traded Funds at 1-844-457-6383 (844-4JPM ETF) for a fund prospectus. You can also visit us at www.jpmorganfunds.com. Investors should carefully consider the investment objectives and risks as well as charges and expenses of the fund before investing. The prospectus contains this and other information about the fund. Read the prospectus carefully before investing.
Investors may obtain information about the Securities Investor Protection Corporation (SIPC), including the SIPC brochure by visiting www.sipc.org or by calling SIPC at 202-371-8300.
The Fund files a complete schedule of its fund holdings for the first and third quarters of its fiscal year with the SEC on Form N-Q. The Fund’s Forms N-Q is available on the SEC’s website at http://www.sec.gov and may be reviewed and copied at the SEC’s Public Reference Room in Washington, DC. Information on the operation of the SEC’s Public Reference Room may be obtained by calling 1-800-SEC-0330. Shareholders may request the Form N-Q without charge by calling 1-844-457-6383 or by visiting the J.P. Morgan Funds’ website at www.jpmorganfunds.com.
A description of each Fund’s policies and procedures with respect to the disclosure of each Fund’s holdings is available in the prospectus and Statement of Additional Information.
A copy of proxy policies and procedures is available without charge upon request by calling 1-844-457-6383 and on the Fund’s website at www.jpmorganfunds.com. A description of such policies and procedures is on the SEC’s website at www.sec.gov. The Trustees have delegated the authority to vote proxies for securities owned by the Fund to the Adviser. A copy of the Fund’s voting record for the most recent 12-month period ended June 30 is available on the SEC’s website at www.sec.gov or at the Fund’s website at www.jpmorganfunds.com no later than August 31 of each year. The Fund’s proxy voting record will include, among other things, a brief description of the matter voted on for each fund security, and will state how each vote was cast, for example, for or against the proposal.


J.P. Morgan Asset Management is the marketing name for the asset management business of JPMorgan Chase & Co. Those businesses include, but are not limited to, J.P. Morgan Investment Management Inc., Security Capital Research & Management Incorporated and J.P. Morgan Alternative Asset Management, Inc.
| | | | |
| | © JPMorgan Chase & Co., 2016. All rights reserved. October 2016. | | AN-DAETF-1016 |
Annual Report
JPMorgan Exchange-Traded Funds
October 31, 2016
JPMorgan Diversified Alternatives ETF
CONTENTS
Investments in the Fund are not bank deposits or obligations of, or guaranteed or endorsed by, any bank and are not insured or guaranteed by the FDIC, the Federal Reserve Board or any other government agency. You could lose money if you sell when the Fund’s share price is lower than when you invested.
Past performance is no guarantee of future performance. The general market views expressed in this report are opinions based on market and other conditions through the end of the reporting period and are subject to change without notice. These views are not intended to predict the future performance of the Fund or the securities markets. References to specific securities and their issuers are for illustrative purposes only and are not intended to be, and should not be interpreted as, recommendations to purchase or sell such securities. Such views are not meant as investment advice and may not be relied on as an indication of trading intent on behalf of the Fund.
Prospective investors should refer to the Fund’s prospectus for a discussion of the Fund’s investment objective, strategies and risks. Call J.P. Morgan Exchange-Traded Funds at (844) 457-6383 for a prospectus containing more complete information about the Fund, including management fees and other expenses. Please read it carefully before investing.
Shares are bought and sold throughout the day on an exchange at market price (not NAV) through a brokerage account, and are not individually redeemed from the Fund. Shares may only be redeemed directly from the Fund by Authorized Participants, in very large creation/redemption units. Brokerage commissions will reduce returns.
PRESIDENT’S LETTER
OCTOBER 31, 2016 (Unaudited)
Dear Shareholder,
I am pleased to report that all of our J.P. Morgan Exchange-Traded Funds met their objectives this past year, with returns closely corresponding to those of their diversified factor benchmarks, after fees and expenses. Three of the four funds with track records of one year or more — JPMorgan Diversified Return Global Equity (JPGE), JPMorgan Diversified Return International Equity (JPIN) and JPMorgan Diversified Return U.S. Equity (JPUS) — outperformed their corresponding capitalization-weighted indexes. The fourth, Diversified Return Emerging Markets Equity (JPEM), lagged behind its market capitalization-weighted index by less than 0.25% but still had double-digit returns. The potential benefits of our approach have gained industrywide recognition. Fund Action named our Diversified Return Global Equity ETF (JPGE) as the “Most Innovative Equity ETF.”1 Perhaps even more gratifying is the confidence ETF investors have placed in us. Cogent Reports’ 2016 Advisor Brandscape ranked us among the most trusted ETF providers.2 We believe the honor acknowledges an integrity that has endured since our firm’s founding, and it underscores our foremost commitment to our clients. In another confirmation of the appeal of our investment approach, our suite of ETFs reached a milestone of $1 billion in assets under management in early December.
| | |

| | “The potential benefits of our approach have gained industrywide recognition.” - Robert F. Deutsch |
Investment implications of an unprecedented election
Over the past year coming into the fall’s U.S. presidential election, many professional economists looked on the economy as a healthy tortoise — fundamentally sound despite its gradual pace — not the sickly hare that worried markets even as stock valuations climbed. The unexpected election result has upset the economists’ relatively confident calculations. Consensus has given way to uncertainty.
Will the fiscal stimulus and tax reform that the incoming administration has talked about become the law of the land? If so, will they revive the hare or induce inflationary fever in the tortoise? Questions so basic about the direction of policy and the economic shifts it might imply almost inevitably invite periods of market volatility.
A steady course for the road ahead
We have built our “smart beta” ETFs to provide a smoother ride during volatile periods and to diversify unrewarded risks. The multi-factor stock selection process for J.P. Morgan ETFs’ underlying indexes seeks to identify stocks that exhibit the factors that drive returns, such as momentum or mispriced valuation. We have combined these factors into our suite of ETFs which are geared to avoid cyclical movement in asset prices. To continue our example, if mispriced stocks underperform, we might expect the market to favor momentum exposures of the ETF’s underlying index.
The same kind of systematic diversification informs our technique for handling risk. By maintaining a neutral risk weighting across economic sectors. The ETF underlying indexes seek to avoid a concentration in overvalued segments of the market, which we believe is the primary flaw in traditional equity index funds.
We are grateful for your belief in our firm and its process. We have extended our range of factor-based ETF investments in recent months with the JPMorgan Diversified Return U.S. Mid Cap Equity ETF (JPME) and an active ETF, the JPMorgan Diversified Alternatives ETF (JPHF). We believe JPHF bears especially close watching.3 We feel this new ETF can take portfolio diversification, one of the most valued features of our ETFs, to the next level.
If you have any questions, please visit www.jpmorganetfs.com or call J.P. Morgan Exchange Traded Funds at 1-844-457-6383.
Sincerely yours,

Robert F. Deutsch
President, J.P. Morgan Exchange Traded Funds
J.P. Morgan Asset Management
| 1 | Fund Action ETF US Performance Awards 2016: The ETF awards are judged based on performance and/or asset flows over a 12 month period ending in September 2015. Data from earlier periods can be used to provide context, but will not be central to the judging decision. As well as performance data, judges will also consider the management firm’s and fund’s reputation in the market place — will give credit to managers who have shown innovation in new products and fee offerings, etc. Only Funds with their management/advisory company or team based in the U.S. or Canada are eligible for the awards. The awards will only be given to those firms who can demonstrate solid performance, positive asset flows and real credibility among advisors and investors. There is no minimum asset size required for any category. Past performance is not a guarantee of future performance. |
| 2 | Cogent Reports conducted an online survey with 1,460 financial advisors from January to March of 2016. In order to qualify, respondents were |
| | required to have an active book of business of at least $5 million and offer investment advice or planning services to individual investors on a fee or transactional basis. Cogent Reports set quota targets and weighted the data to be representative of the overall advisor universe using the Discovery Data Financial Services Industry database as a sample source. The survey results were published in June 2016. Past performance is not a guarantee of future performance. |
| 3 | Diversification does not guarantee returns or eliminate the risk of loss. There is no guarantee the Fund will meet its investment objective. JPMorgan Diversified Alternatives ETF is actively managed and will likely engage in active and frequent trading leading to increased portfolio turnover, higher transaction costs and the possibility of increased capital gains. Alternative investments and strategies involve higher risks than traditional investments and are not suitable for all investors. |
| | | | | | | | |
| | | |
| OCTOBER 31, 2016 | | JPMORGAN EXCHANGE-TRADED FUNDS | | | | | 1 | |
JPMorgan Diversified Alternatives ETF
FUND COMMENTARY
FOR THE PERIOD SEPTEMBER 12, 2016 (FUND INCEPTION DATE) THROUGH OCTOBER 31, 2016 (Unaudited)
| | | | |
| REPORTING PERIOD RETURN: | |
| JPMorgan Diversified Alternatives ETF* | | | 1.44% | |
| Market Price** | | | 1.68% | |
| BofA Merrill Lynch 3-Month U.S. Treasury Bill Index | | | 0.07% | |
| |
| Net Assets as of 10/31/2016 | | $ | 51,977,433 | |
INVESTMENT OBJECTIVE***
The JPMorgan Diversified Alternatives ETF (the “Fund”) seeks to provide long-term total return.
INVESTMENT APPROACH
The Fund seeks to achieve its investment objective by allocating assets across a variety of strategies commonly employed by hedge funds, including Equity Long/Short, Event Driven and Global Macro Based strategies. The Fund seeks to achieve the efficiency of rules-based investing with the diversification benefits of alternative strategies without replicating an index.
HOW DID THE MARKET PERFORM?
During the reporting period, global prices for both equities and crude oil remained elevated from previous months and financial market volatility remained low. Notably, crude oil prices reached 15-month highs in October 2016 amid expectations that the Organization of Petroleum Exporting Countries would agree to production caps that would reduce global inventories.
HOW DID THE FUND PERFORM?
For the period September 12, 2016 to October 31, 2016, the Fund posted a positive absolute performance and experienced a deviation of 1.37% relative to its benchmark, the BofA Merrill Lynch 3-Month U.S. Treasury Bill Index (the “Index”). The Fund’s allocation to equities, which are not held in the Index, was a leading contributor to performance relative to the Index. References to the Index and to other indexes mentioned herein are for informational purposes and are not an indication of how the Fund is managed. The use of the Index does not imply the Fund is being managed like the Index and does not imply low risk or low volatility, but rather is disclosed, along with other indexes, to allow for comparison of the Fund’s performance to that of well-known and widely recognized indexes.
On an absolute basis, the Fund’s allocations to value and quality factors within the Equity Long/Short sub-strategy were leading contributors to performance for the reporting period, while the Fund’s allocations to fixed income and commodity factors within the Global Macro Based sub-strategy were leading detractors from performance.
HOW WAS THE FUND POSITIONED?
At the end of the reporting period, the Fund’s largest allocation was to the Equity Long/Short sub-strategy, while the smallest allocation was to the Event Driven sub-strategy.
| | | | | | |
| | | |
| 2 | | | | JPMORGAN EXCHANGE-TRADED FUNDS | | OCTOBER 31, 2016 |
| | | | |
RISK ALLOCATION AS OF OCTOBER 31, 2016 | |
| Strategy | | % of Risk
Allocation**** | |
| |
| Equity Long/Short (1) | | | 51 | % |
| Event Driven (2) | | | 20 | |
| Global Macro (3) | | | 29 | |
| | | | | | | | |
| TOP TEN LONG HOLDINGS OF THE PORTFOLIO (a) | |
| | |
| | 1. | | | Ingram Micro, Inc., Class A | | | 1.0 | % |
| | 2. | | | B/E Aerospace, Inc. | | | 1.0 | |
| | 3. | | | NXP Semiconductors NV (Netherlands) | | | 1.0 | |
| | 4. | | | Westar Energy, Inc. | | | 1.0 | |
| | 5. | | | Rackspace Hosting, Inc. | | | 0.9 | |
| | 6. | | | Joy Global, Inc. | | | 0.9 | |
| | 7. | | | CST Brands, Inc. | | | 0.9 | |
| | 8. | | | Talen Energy Corp. | | | 0.9 | |
| | 9. | | | Fleetmatics Group plc (Ireland) | | | 0.9 | |
| | 10. | | | WhiteWave Foods Co. (The), Class A | | | 0.9 | |
| | | | | | | | |
| TOP TEN SHORT HOLDINGS OF THE PORTFOLIO (a) | |
| | 1. | | | New York Community Bancorp, Inc. | | | 0.8 | % |
| | 2. | | | AT&T, Inc. | | | 0.6 | |
| | 3. | | | Canadian Imperial Bank of Commerce (Canada) | | | 0.5 | |
| | 4. | | | Tabcorp Holdings Ltd. (Australia) | | | 0.4 | |
| | 5. | | | Lions Gate Entertainment Corp. | | | 0.3 | |
| | 6. | | | Abbott Laboratories | | | 0.3 | |
| | 7. | | | British American Tobacco plc (United Kingdom) | | | 0.3 | |
| | 8. | | | FNB Corp. | | | 0.3 | |
| | 9. | | | Netflix, Inc. | | | 0.2 | |
| | 10. | | | STMicroelectronics NV (Netherlands) | | | 0.2 | |
| * | | The return shown is based on net asset value calculated for shareholder transactions and may differ from the return shown in the financial highlights, which reflects adjustments made to the net asset value in accordance with accounting principles generally accepted in the United States of America. The net asset value was $25.35 as of October 31, 2016. |
| ** | | Market price cumulative return is calculated assuming an initial investment made at the inception date net asset value, reinvestment of all dividends and distributions at market price during the period, and sale at the market price on the last day of the period. The price used to calculate the market price return is the midpoint of the bid/ask spread at the close of business on the NYSE Arca. The midpoint price was $25.42 as of October 31, 2016. |
| *** | | The adviser seeks to achieve the Fund’s objective. There can be no guarantee it will be achieved. |
| **** | | Risk allocations are calculated as the standard deviation (volatility of an asset class) divided by the overall volatility of the Fund. Risk, as measured by standard deviation, shows how widely a set of values varies from the mean. It is a historical measure of the volatility of returns earned by the Fund. The percentages above represent the current risk allocation based on the Fund’s holdings as of October 31, 2016 and are not representative of the targeted equal risk allocation across asset classes over the long term. Holdings and allocations may vary over time. |
| (1) | | Equity Long/Short strategies seek to profit by exploiting pricing inefficiencies between related equity securities by maintaining long and short positions. |
| (2) | | Event Driven strategies seek to profit from investing in securities of companies on the basis that a specific event or catalyst will affect future pricing. For example, merger arbitrage strategies seek to capitalize on price discrepancies and returns generated by a corporate transaction. |
| (3) | | Global Macro Based strategies aim to exploit macro-economic imbalances across the globe. These strategies may be implemented through a broad range of asset classes including, but not limited to, equities, fixed income, currency and commodities. |
| (a) | | Percentages indicated are based upon total investments plus the current value of the total net long and short positions within each Total Return Basket Swap as of October 31, 2016. The Fund’s portfolio composition is subject to change. |
| | | | | | | | |
| | | |
| OCTOBER 31, 2016 | | JPMORGAN EXCHANGE-TRADED FUNDS | | | | | 3 | |
JPMorgan Diversified Alternatives ETF
FUND COMMENTARY
FOR THE PERIOD SEPTEMBER 12, 2016 (FUND INCEPTION DATE) THROUGH OCTOBER 31, 2016 (Unaudited) (continued)
| | | | | | | | |
AVERAGE ANNUAL TOTAL RETURNS AS OF OCTOBER 31, 2016 | |
| | |
| | | INCEPTION
DATE | | | CUMULATIVE
SINCE INCEPTION | |
JPMorgan Diversified Alternatives ETF | | | | | | | | |
Net Asset Value | | | 9/12/2016 | | | | 1.44 | % |
Market Price | | | | | | | 1.68 | |
LIFE OF FUND PERFORMANCE (9/12/16 TO 10/31/16)
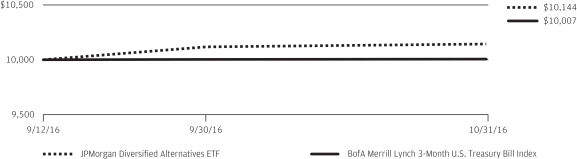
The performance quoted is past performance and is not a guarantee of future results. Exchange-traded funds are subject to certain market risks. Investment returns and principal value of an investment will fluctuate so that an investor’s shares, when sold or redeemed, may be worth more or less than their original cost. Current performance may be higher or lower than the performance data shown. For up-to-date, month-end performance information please call 1-844-457-6383.
Fund commenced operations on September 12, 2016.
The graph illustrates comparative performance for $10,000 invested in shares of the JPMorgan Diversified Alternatives ETF and the BofA Merrill Lynch 3-Month U.S. Treasury Bill Index from September 12, 2016 to October 31, 2016. The performance of the Fund assumes reinvestment of all dividends and capital gain distributions, if any. The performance of the BofA Merrill Lynch 3-Month U.S. Treasury Bill Index does not reflect the deduction of expenses and has been adjusted to reflect reinvestment of all dividends and capital gain distributions of the securities included in the benchmark, if applicable. The BofA Merrill Lynch 3-Month U.S. Treasury Bill Index is comprised of a single issue
purchased at the beginning of the month and held for a full month. Each month the index is rebalanced and the issue selected is the outstanding Treasury Bill that matures closest to, but not beyond, 3 months from the rebalancing date. Investors cannot invest directly in an index. The Fund is actively managed and does not seek to replicate the performance of a specified index.
The performance of the Fund reflects the deduction of Fund expenses and assumes reinvestment of all dividends and capital gain distributions, if any. Fund performance reflects the waiver of the Fund’s fees and reimbursement of expenses for certain periods since the inception date. Without these waivers and reimbursements, performance would have been lower. Also, performance shown in this section does not reflect the deduction of taxes that a shareholder may pay on Fund distributions or redemption or sale of Fund shares.
The returns shown are based on net asset values calculated for shareholder transactions and may differ from the returns shown in the financial highlights, which reflect adjustments made to the net asset values in accordance with accounting principles generally accepted in the United States of America.
| | | | | | |
| | | |
| 4 | | | | JPMORGAN EXCHANGE-TRADED FUNDS | | OCTOBER 31, 2016 |
JPMorgan Diversified Alternatives ETF
CONSOLIDATED SCHEDULE OF PORTFOLIO INVESTMENTS
AS OF OCTOBER 31, 2016
| | | | | | | | |
| SHARES | | | SECURITY DESCRIPTION | | VALUE($) | |
| Common Stocks — 47.3% | |
| | | | Consumer Discretionary — 8.0% | |
| | | | Auto Components — 0.3% | |
| | 858 | | | Lear Corp. | | | 105,345 | |
| | 700 | | | Visteon Corp. (a) | | | 49,427 | |
| | | | | | | | |
| | | | | | | 154,772 | |
| | | | | | | | |
| | | | Distributors — 0.2% | |
| | 1,022 | | | Genuine Parts Co. | | | 92,583 | |
| | | | | | | | |
| | | | Diversified Consumer Services — 0.1% | |
| | 1,400 | | | Sotheby’s (a) | | | 50,232 | |
| | | | | | | | |
| | | | Hotels, Restaurants & Leisure — 1.4% | |
| | 2,900 | | | Bloomin’ Brands, Inc. | | | 50,170 | |
| | 1,606 | | | Darden Restaurants, Inc. | | | 104,053 | |
| | 4,400 | | | Hilton Worldwide Holdings, Inc. | | | 99,440 | |
| | 1,000 | | | Hyatt Hotels Corp., Class A (a) | | | 50,790 | |
| | 500 | | | Jack in the Box, Inc. | | | 46,865 | |
| | 4,700 | | | La Quinta Holdings, Inc. (a) | | | 47,047 | |
| | 800 | | | Marriott Vacations Worldwide Corp. | | | 50,864 | |
| | 400 | | | McDonald’s Corp. | | | 45,028 | |
| | 1,800 | | | SeaWorld Entertainment, Inc. (a) | | | 25,218 | |
| | 1,486 | | | Wyndham Worldwide Corp. | | | 97,838 | |
| | 1,100 | | | Yum! Brands, Inc. | | | 94,908 | |
| | | | | | | | |
| | | | | | | 712,221 | |
| | | | | | | | |
| | | | Household Durables — 0.5% | |
| | 3,459 | | | DR Horton, Inc. | | | 99,723 | |
| | 1,200 | | | iRobot Corp. (a) | | | 60,840 | |
| | 621 | | | Whirlpool Corp. | | | 93,038 | |
| | | | | | | | |
| | | | | | | 253,601 | |
| | | | | | | | |
| | | | Media — 1.8% | |
| | 1,808 | | | CBS Corp. (Non-Voting), Class B | | | 102,369 | |
| | 1,534 | | | Comcast Corp., Class A | | | 94,832 | |
| | 5,992 | | | Discovery Communications, Inc., Class C (a) | | | 150,459 | |
| | 4,441 | | | Interpublic Group of Cos., Inc. (The) | | | 99,434 | |
| | 1,217 | | | Omnicom Group, Inc. | | | 97,141 | |
| | 1,617 | | | Scripps Networks Interactive, Inc., Class A | | | 104,070 | |
| | 5,000 | | | TEGNA, Inc. | | | 98,100 | |
| | 1,258 | | | Time Warner, Inc. | | | 111,949 | |
| | 2,789 | | | Viacom, Inc., Class B | | | 104,755 | |
| | | | | | | | |
| | | | | | | 963,109 | |
| | | | | | | | |
| | | | Multiline Retail — 0.3% | |
| | 1,100 | | | Big Lots, Inc. | | | 47,740 | |
| | 1,471 | | | Target Corp. | | | 101,102 | |
| | | | | | | | |
| | | | | | | 148,842 | |
| | | | | | | | |
| | | | | | | | |
| SHARES | | | SECURITY DESCRIPTION | | VALUE($) | |
| | | | | |
| | | | Specialty Retail — 3.0% | |
| | 2,900 | | | American Eagle Outfitters, Inc. | | | 49,416 | |
| | 900 | | | Asbury Automotive Group, Inc. (a) | | | 45,855 | |
| | 4,800 | | | Ascena Retail Group, Inc. (a) | | | 23,472 | |
| | 7,185 | | | Cabela’s, Inc. (a) | | | 442,668 | |
| | 700 | | | Children’s Place, Inc. (The) | | | 53,165 | |
| | 9,986 | | | CST Brands, Inc. | | | 479,528 | |
| | 1,778 | | | Dick’s Sporting Goods, Inc. | | | 98,946 | |
| | 2,400 | | | DSW, Inc., Class A | | | 49,848 | |
| | 900 | | | Genesco, Inc. (a) | | | 48,420 | |
| | 2,500 | | | GNC Holdings, Inc., Class A | | | 33,575 | |
| | 800 | | | Group 1 Automotive, Inc. | | | 48,216 | |
| | 1,405 | | | Lowe’s Cos., Inc. | | | 93,643 | |
| | 700 | | | Murphy USA, Inc. (a) | | | 48,146 | |
| | 1,800 | | | Vitamin Shoppe, Inc. (a) | | | 45,090 | |
| | | | | | | | |
| | | | | | | 1,559,988 | |
| | | | | | | | |
| | | | Textiles, Apparel & Luxury Goods — 0.4% | |
| | 2,142 | | | Michael Kors Holdings Ltd. (British Virgin Islands) (a) | | | 108,771 | |
| | 897 | | | PVH Corp. | | | 95,961 | |
| | | | | | | | |
| | | | | | | 204,732 | |
| | | | | | | | |
| | | | Total Consumer Discretionary | | | 4,140,080 | |
| | | | | | | | |
| | | | Consumer Staples — 4.5% | |
| | | | Beverages — 0.4% | |
| | 1,143 | | | Dr. Pepper Snapple Group, Inc. | | | 100,344 | |
| | 943 | | | PepsiCo, Inc. | | | 101,090 | |
| | | | | | | | |
| | | | | | | 201,434 | |
| | | | | | | | |
| | | | Food & Staples Retailing — 1.5% | |
| | 2,715 | | | Andersons, Inc. (The) | | | 103,306 | |
| | 58,494 | | | Rite Aid Corp. (a) | | | 392,495 | |
| | 19,400 | | | SUPERVALU, Inc. (a) | | | 83,226 | |
| | 2,044 | | | Sysco Corp. | | | 98,357 | |
| | 1,464 | | | Wal-Mart Stores, Inc. | | | 102,509 | |
| | | | | | | | |
| | | | | | | 779,893 | |
| | | | | | | | |
| | | | Food Products — 2.2% | |
| | 1,821 | | | Campbell Soup Co. | | | 98,953 | |
| | 4,229 | | | ConAgra Foods, Inc. | | | 203,753 | |
| | 1,605 | | | General Mills, Inc. | | | 99,478 | |
| | 748 | | | Ingredion, Inc. | | | 98,115 | |
| | 746 | | | JM Smucker Co. (The) | | | 97,957 | |
| | 1,387 | | | Tyson Foods, Inc., Class A | | | 98,269 | |
| | 8,565 | | | WhiteWave Foods Co. (The), Class A (a) | | | 466,707 | |
| | | | | | | | |
| | | | | | | 1,163,232 | |
| | | | | | | | |
SEE NOTES TO CONSOLIDATED FINANCIAL STATEMENTS.
| | | | | | | | |
| | | |
| OCTOBER 31, 2016 | | JPMORGAN EXCHANGE-TRADED FUNDS | | | | | 5 | |
JPMorgan Diversified Alternatives ETF
CONSOLIDATED SCHEDULE OF PORTFOLIO INVESTMENTS
AS OF OCTOBER 31, 2016 (continued)
| | | | | | | | |
| SHARES | | | SECURITY DESCRIPTION | | VALUE($) | |
| Common Stocks — continued | |
| | | | Household Products — 0.2% | |
| | 1,132 | | | Procter & Gamble Co. (The) | | | 98,258 | |
| | | | | | | | |
| | | | Tobacco — 0.2% | |
| | 1,603 | | | Altria Group, Inc. | | | 105,990 | |
| | | | | | | | |
| | | | Total Consumer Staples | | | 2,348,807 | |
| | | | | | | | |
| | | | Energy — 1.0% | |
| | | | Energy Equipment & Services — 0.4% | |
| | 1,438 | | | Helmerich & Payne, Inc. | | | 90,752 | |
| | 1,225 | | | Schlumberger Ltd. (Curacao) | | | 95,832 | |
| | | | | | | | |
| | | | | | | 186,584 | |
| | | | | | | | |
| | | | Oil, Gas & Consumable Fuels — 0.6% | |
| | 991 | | | Chevron Corp. | | | 103,807 | |
| | 1,154 | | | Exxon Mobil Corp. | | | 96,152 | |
| | 1,400 | | | Halcon Resources Corp. (a) | | | 12,530 | |
| | 600 | | | SandRidge Energy, Inc. (a) | | | 13,818 | |
| | 1,855 | | | Valero Energy Corp. | | | 109,890 | |
| | | | | | | | |
| | | | | | | 336,197 | |
| | | | | | | | |
| | | | Total Energy | | | 522,781 | |
| | | | | | | | |
| | | | Financials — 3.5% | |
| | | | Banks — 0.3% | |
| | 1,500 | | | Banc of California, Inc. | | | 19,950 | |
| | 2,800 | | | CIT Group, Inc. | | | 101,724 | |
| | 4,200 | | | Investors Bancorp, Inc. | | | 51,492 | |
| | | | | | | | |
| | | | | | | 173,166 | |
| | | | | | | | |
| | | | Consumer Finance — 0.5% | |
| | 10,786 | | | Navient Corp. | | | 137,845 | |
| | 2,542 | | | Nelnet, Inc., Class A | | | 99,595 | |
| | | | | | | | |
| | | | | | | 237,440 | |
| | | | | | | | |
| | | | Insurance — 2.2% | |
| | 1,415 | | | Aflac, Inc. | | | 97,451 | |
| | 800 | | | American International Group, Inc. | | | 49,360 | |
| | 600 | | | Assurant, Inc. | | | 48,312 | |
| | 40,805 | | | Delta Lloyd NV (Netherlands) | | | 246,518 | |
| | 3,902 | | | Endurance Specialty Holdings Ltd. (Bermuda) | | | 358,789 | |
| | 517 | | | Everest Re Group Ltd. (Bermuda) | | | 105,220 | |
| | 2,100 | | | MetLife, Inc. | | | 98,616 | |
| | 2,771 | | | Unum Group | | | 98,093 | |
| | 1,500 | | | XL Group Ltd. (Bermuda) | | | 52,050 | |
| | | | | | | | |
| | | | | | | 1,154,409 | |
| | | | | | | | |
| | | | Thrifts & Mortgage Finance — 0.5% | |
| | 9,906 | | | EverBank Financial Corp. | | | 191,285 | |
| | 3,500 | | | Nationstar Mortgage Holdings, Inc. (a) | | | 52,885 | |
| | | | | | | | |
| | | | | | | 244,170 | |
| | | | | | | | |
| | | | Total Financials | | | 1,809,185 | |
| | | | | | | | |
| | | | | | | | |
| SHARES | | | SECURITY DESCRIPTION | | VALUE($) | |
| | | | | |
| | | | Health Care — 4.1% | |
| | | | Health Care Equipment & Supplies — 1.5% | |
| | 6,974 | | | Alere, Inc. (a) | | | 311,598 | |
| | 457 | | | C.R. Bard, Inc. | | | 99,023 | |
| | 1,199 | | | Medtronic plc (Ireland) | | | 98,342 | |
| | 2,037 | | | Varian Medical Systems, Inc. (a) | | | 184,817 | |
| | 787 | | | Zimmer Biomet Holdings, Inc. | | | 82,950 | |
| | | | | | | | |
| | | | | | | 776,730 | |
| | | | | | | | |
| | | | Health Care Providers & Services — 1.5% | |
| | 910 | | | Aetna, Inc. | | | 97,688 | |
| | 2,147 | | | Express Scripts Holding Co. (a) | | | 144,708 | |
| | 732 | | | Laboratory Corp. of America Holdings (a) | | | 91,749 | |
| | 616 | | | McKesson Corp. | | | 78,337 | |
| | 1,199 | | | Quest Diagnostics, Inc. | | | 97,647 | |
| | 1,600 | | | Team Health Holdings, Inc. (a) | | | 68,560 | |
| | 744 | | | UnitedHealth Group, Inc. | | | 105,149 | |
| | 801 | | | Universal Health Services, Inc., Class B | | | 96,689 | |
| | | | | | | | |
| | | | | | | 780,527 | |
| | | | | | | | |
| | | | Life Sciences Tools & Services — 0.4% | |
| | 2,212 | | | Agilent Technologies, Inc. | | | 96,377 | |
| | 657 | | | Thermo Fisher Scientific, Inc. | | | 96,598 | |
| | | | | | | | |
| | | | | | | 192,975 | |
| | | | | | | | |
| | | | Pharmaceuticals — 0.7% | |
| | 845 | | | Johnson & Johnson | | | 98,011 | |
| | 1,590 | | | Merck & Co., Inc. | | | 93,365 | |
| | 3,049 | | | Pfizer, Inc. | | | 96,684 | |
| | 929 | | | Taro Pharmaceutical Industries Ltd. (Israel) (a) | | | 94,303 | |
| | | | | | | | |
| | | | | | | 382,363 | |
| | | | | | | | |
| | | | Total Health Care | | | 2,132,595 | |
| | | | | | | | |
| | | | Industrials — 6.2% | |
| | | | Aerospace & Defense — 1.4% | |
| | 8,413 | | | B/E Aerospace, Inc. | | | 500,741 | |
| | 400 | | | Boeing Co. (The) | | | 56,972 | |
| | 670 | | | L-3 Communications Holdings, Inc., Class 3 | | | 91,750 | |
| | 1,000 | | | United Technologies Corp. | | | 102,200 | |
| | | | | | | | |
| | | | | | | 751,663 | |
| | | | | | | | |
| | | | Airlines — 1.0% | |
| | 900 | | | United Continental Holdings, Inc. (a) | | | 50,607 | |
| | 8,484 | | | Virgin America, Inc. (a) | | | 461,105 | |
| | | | | | | | |
| | | | | | | 511,712 | |
| | | | | | | | |
| | | | Commercial Services & Supplies — 0.4% | |
| | 1,968 | | | G & K Services, Inc., Class A | | | 186,370 | |
| | | | | | | | |
SEE NOTES TO CONSOLIDATED FINANCIAL STATEMENTS.
| | | | | | |
| | | |
| 6 | | | | JPMORGAN EXCHANGE-TRADED FUNDS | | OCTOBER 31, 2016 |
| | | | | | | | |
| SHARES | | | SECURITY DESCRIPTION | | VALUE($) | |
| Common Stocks — continued | |
| | | | Construction & Engineering — 0.5% | |
| | 1,985 | | | Fluor Corp. | | | 103,200 | |
| | 1,990 | | | Jacobs Engineering Group, Inc. (a) | | | 102,644 | |
| | 1,800 | | | Quanta Services, Inc. (a) | | | 51,750 | |
| | | | | | | | |
| | | | | | | 257,594 | |
| | | | | | | | |
| | | | Electrical Equipment — 0.2% | |
| | 1,582 | | | Eaton Corp. plc (Ireland) | | | 100,884 | |
| | | | | | | | |
| | | | Industrial Conglomerates — 0.2% | |
| | 923 | | | Honeywell International, Inc. | | | 101,235 | |
| | | | | | | | |
| | | | Machinery — 2.0% | |
| | 1,948 | | | AGCO Corp. | | | 99,504 | |
| | 792 | | | Cummins, Inc. | | | 101,233 | |
| | 3,600 | | | Energy Recovery, Inc. (a) | | | 43,956 | |
| | 862 | | | Illinois Tool Works, Inc. | | | 97,897 | |
| | 17,244 | | | Joy Global, Inc. | | | 479,901 | |
| | 809 | | | Parker-Hannifin Corp. | | | 99,305 | |
| | 827 | | | Stanley Black & Decker, Inc. | | | 94,146 | |
| | 1,000 | | | Terex Corp. | | | 23,880 | |
| | 1,100 | | | Trinity Industries, Inc. | | | 23,485 | |
| | | | | | | | |
| | | | | | | 1,063,307 | |
| | | | | | | | |
| | | | Professional Services — 0.3% | |
| | 700 | | | ManpowerGroup, Inc. | | | 53,760 | |
| | 1,901 | | | Nielsen Holdings plc (United Kingdom) | | | 85,583 | |
| | | | | | | | |
| | | | | | | 139,343 | |
| | | | | | | | |
| | | | Trading Companies & Distributors — 0.2% | |
| | 3,100 | | | MRC Global, Inc. (a) | | | 45,694 | |
| | 600 | | | United Rentals, Inc. (a) | | | 45,396 | |
| | | | | | | | |
| | | | | | | 91,090 | |
| | | | | | | | |
| | | | Total Industrials | | | 3,203,198 | |
| | | | | | | | |
| | | | Information Technology — 14.1% | |
| | | | Communications Equipment — 0.5% | |
| | 3,311 | | | Cisco Systems, Inc. | | | 101,581 | |
| | 860 | | | F5 Networks, Inc. (a) | | | 118,861 | |
| | 1,800 | | | NetScout Systems, Inc. (a) | | | 49,410 | |
| | | | | | | | |
| | | | | | | 269,852 | |
| | | | | | | | |
| | | | Electronic Equipment, Instruments & Components — 2.3% | |
| | 1,578 | | | Amphenol Corp., Class A | | | 104,037 | |
| | 1,600 | | | Arrow Electronics, Inc. (a) | | | 97,792 | |
| | 6,505 | | | Corning, Inc. | | | 147,729 | |
| | 500 | | | ePlus, Inc. (a) | | | 45,775 | |
| | 7,328 | | | Flextronics International Ltd. (Singapore) (a) | | | 103,984 | |
| | 3,416 | | | FLIR Systems, Inc. | | | 112,455 | |
| | 13,570 | | | Ingram Micro, Inc., Class A (a) | | | 504,804 | |
| | | | | | | | |
| SHARES | | | SECURITY DESCRIPTION | | VALUE($) | |
| | | | | |
| | | | Electronic Equipment, Instruments & Components — continued | |
| | 2,189 | | | Rofin-Sinar Technologies, Inc. (a) | | | 71,252 | |
| | | | | | | | |
| | | | | | | 1,187,828 | |
| | | | | | | | |
| | | | Internet Software & Services — 2.6% | |
| | 128 | | | Alphabet, Inc., Class C (a) | | | 100,421 | |
| | 3,850 | | | Cvent, Inc. (a) | | | 120,197 | |
| | 600 | | | GrubHub, Inc. (a) | | | 22,866 | |
| | 10,161 | | | inContact, Inc. (a) | | | 141,340 | |
| | 2,460 | | | LinkedIn Corp., Class A (a) | | | 466,416 | |
| | 15,059 | | | Rackspace Hosting, Inc. (a) | | | 480,984 | |
| | | | | | | | |
| | | | | | | 1,332,224 | |
| | | | | | | | |
| | | | IT Services — 1.4% | |
| | 842 | | | Accenture plc, Class A (Ireland) | | | 97,874 | |
| | 100 | | | Alliance Data Systems Corp. | | | 20,447 | |
| | 700 | | | Blackhawk Network Holdings, Inc., Class A (a) | | | 24,115 | |
| | 650 | | | International Business Machines Corp. | | | 99,898 | |
| | 2,300 | | | NeuStar, Inc., Class A (a) | | | 51,635 | |
| | 2,136 | | | Total System Services, Inc. | | | 106,544 | |
| | 1,788 | | | Vantiv, Inc., Class A (a) | | | 104,348 | |
| | 5,014 | | | Western Union Co. (The) | | | 100,631 | |
| | 10,500 | | | Xerox Corp. | | | 102,585 | |
| | | | | | | | |
| | | | | | | 708,077 | |
| | | | | | | | |
| | | | Semiconductors & Semiconductor Equipment — 3.1% | |
| | 3,585 | | | Applied Materials, Inc. | | | 104,252 | |
| | 591 | | | Broadcom Ltd. (Singapore) | | | 100,635 | |
| | 2,300 | | | Cypress Semiconductor Corp. | | | 22,931 | |
| | 2,702 | | | Intel Corp. | | | 94,219 | |
| | 1,400 | | | KLA-Tencor Corp. | | | 105,154 | |
| | 1,022 | | | Lam Research Corp. | | | 98,991 | |
| | 7,567 | | | Marvell Technology Group Ltd. (Bermuda) | | | 98,598 | |
| | 2,658 | | | Maxim Integrated Products, Inc. | | | 105,337 | |
| | 1,710 | | | Microchip Technology, Inc. | | | 103,540 | |
| | 4,945 | | | NXP Semiconductors NV (Netherlands) (a) | | | 494,500 | |
| | 2,788 | | | Qorvo, Inc. (a) | | | 155,152 | |
| | 800 | | | Synaptics, Inc. (a) | | | 41,696 | |
| | 1,474 | | | Texas Instruments, Inc. | | | 104,433 | |
| | | | | | | | |
| | | | | | | 1,629,438 | |
| | | | | | | | |
| | | | Software — 2.9% | |
| | 3,110 | | | CA Technologies, Inc. | | | 95,601 | |
| | 1,198 | | | Citrix Systems, Inc. (a) | | | 101,590 | |
| | 500 | | | Ebix, Inc. | | | 28,000 | |
| | 7,923 | | | Fleetmatics Group plc (Ireland) (a) | | | 474,588 | |
| | 3,609 | | | Infoblox, Inc. (a) | | | 95,639 | |
| | 4,107 | | | Interactive Intelligence Group, Inc. (a) | | | 248,268 | |
SEE NOTES TO CONSOLIDATED FINANCIAL STATEMENTS.
| | | | | | | | |
| | | |
| OCTOBER 31, 2016 | | JPMORGAN EXCHANGE-TRADED FUNDS | | | | | 7 | |
JPMorgan Diversified Alternatives ETF
CONSOLIDATED SCHEDULE OF PORTFOLIO INVESTMENTS
AS OF OCTOBER 31, 2016 (continued)
| | | | | | | | |
| SHARES | | | SECURITY DESCRIPTION | | VALUE($) | |
| Common Stocks — continued | |
| | | | Software — continued | |
| | 2,700 | | | Mentor Graphics Corp. | | | 78,030 | |
| | 3,600 | | | Nuance Communications, Inc. (a) | | | 50,472 | |
| | 2,626 | | | Oracle Corp. | | | 100,891 | |
| | 2,100 | | | Symantec Corp. | | | 52,563 | |
| | 1,679 | | | Synopsys, Inc. (a) | | | 99,581 | |
| | 1,368 | | | VMware, Inc., Class A (a) | | | 107,525 | |
| | | | | | | | |
| | | | | | | 1,532,748 | |
| | | | | | | | |
| | | | Technology Hardware, Storage & Peripherals — 1.3% | |
| | 854 | | | Apple, Inc. | | | 96,963 | |
| | 4,600 | | | Hewlett Packard Enterprise Co. | | | 103,362 | |
| | 10,367 | | | Lexmark International, Inc., Class A | | | 411,467 | |
| | 1,700 | | | NCR Corp. (a) | | | 59,585 | |
| | | | | | | | |
| | | | | | | 671,377 | |
| | | | | | | | |
| | | | Total Information Technology | | | 7,331,544 | |
| | | | | | | | |
| | | | Materials — 3.2% | | | | |
| | | | Chemicals — 2.8% | | | | |
| | 7 | | | AdvanSix, Inc. (a) | | | 112 | |
| | 4,764 | | | Chemtura Corp. (a) | | | 156,259 | |
| | 1,888 | | | Dow Chemical Co. (The) | | | 101,593 | |
| | 1,581 | | | Eastman Chemical Co. | | | 113,690 | |
| | 6,200 | | | Huntsman Corp. | | | 105,090 | |
| | 1,250 | | | LyondellBasell Industries N.V., Class A (Netherlands) | | | 99,438 | |
| | 4,435 | | | Monsanto Co. | | | 446,915 | |
| | 4,484 | | | Valspar Corp. (The) | | | 446,606 | |
| | | | | | | | |
| | | | | | | 1,469,703 | |
| | | | | | | | |
| | | | Containers & Packaging — 0.2% | |
| | 1,319 | | | Avery Dennison Corp. | | | 92,053 | |
| | | | | | | | |
| | | | Metals & Mining — 0.2% | |
| | 2,146 | | | Nucor Corp. | | | 104,832 | |
| | | | | | | | |
| | | | Total Materials | | | 1,666,588 | |
| | | | | | | | |
| | | | | | | | |
| SHARES | | | SECURITY DESCRIPTION | | VALUE($) | |
| | |
| | | | Telecommunication Services — 0.3% | | | | |
| | | | Diversified Telecommunication Services — 0.3% | |
| | 1,647 | | | CenturyLink, Inc. | | | 43,777 | |
| | 1,986 | | | Verizon Communications, Inc. | | | 95,527 | |
| | | | | | | | |
| | | | Total Telecommunication Services | | | 139,304 | |
| | | | | | | | |
| | | | Utilities — 2.4% | | | | |
| | | | Electric Utilities — 1.3% | | | | |
| | 1,597 | | | American Electric Power Co., Inc. | | | 103,549 | |
| | 8,415 | | | Empire District Electric Co. (The) | | | 288,045 | |
| | 1,334 | | | Entergy Corp. | | | 98,289 | |
| | 3,041 | | | Exelon Corp. | | | 103,607 | |
| | 3,291 | | | OGE Energy Corp. | | | 102,153 | |
| | | | | | | | |
| | | | | | | 695,643 | |
| | | | | | | | |
| | | | Independent Power and Renewable Electricity Producers — 0.9% | |
| | 34,262 | | | Talen Energy Corp. (a) | | | 477,270 | |
| | | | | | | | |
| | | | Multi-Utilities — 0.2% | |
| | 4,471 | | | CenterPoint Energy, Inc. | | | 101,939 | |
| | | | | | | | |
| | | | Total Utilities | | | 1,274,852 | |
| | | | | | | | |
| | | | Total Common Stocks
(Cost $24,690,379) | | | 24,568,934 | |
| | | | | | | | |
| Short-Term Investment — 49.3% | |
| | | | Investment Company — 49.3% | | | | |
| | 25,631,779 | | | JPMorgan U.S. Government Money Market Fund, Institutional Class Shares, 0.290% (b) (c) ^^
(Cost $25,631,779) | | | 25,631,779 | |
| | | | | | | | |
| | | | Total Investments — 96.6%
(Cost $50,322,158) | | | 50,200,713 | |
| | | | Other Assets in Excess of
Liabilities — 3.4% | | | 1,776,720 | |
| | | | | | | | |
| | | | NET ASSETS — 100.0% | | $ | 51,977,433 | |
| | | | | | | | |
Percentages indicated are based on net assets.
| | | | | | | | | | | | | | | | | | | | |
| Futures Contracts | |
NUMBER OF
CONTRACTS | | | DESCRIPTION | | EXPIRATION
DATE | | | TRADING
CURRENCY | | | NOTIONAL VALUE AT
OCTOBER 31, 2016 | | | NET UNREALIZED
APPRECIATION
(DEPRECIATION) | |
| | | | Long Futures Outstanding | |
| | 3 | | | LME Zinc Futures ^ | | | 11/16/16 | | | | USD | | | | 183,975 | | | | 15,526 | |
| | 3 | | | CAC40 10 Euro | | | 11/21/16 | | | | EUR | | | | 148,411 | | | | (2,095 | ) |
| | 18 | | | Euro Bobl | | | 12/07/16 | | | | EUR | | | | 2,590,680 | | | | (8,603 | ) |
| | 1 | | | Euro Bund | | | 12/07/16 | | | | EUR | | | | 197,464 | | | | (3,960 | ) |
| | 3 | | | DJ Euro Stoxx | | | 12/15/16 | | | | EUR | | | | 100,543 | | | | 146 | |
| | 1 | | | SPI 200 Index | | | 12/16/16 | | | | AUD | | | | 100,602 | | | | (2,798 | ) |
| | 47 | | | 10 Year Australian Government Bond | | | 12/16/16 | | | | AUD | | | | 4,741,631 | | | | (42,878 | ) |
| | 3 | | | FTSE 100 Index | | | 12/19/16 | | | | GBP | | | | 254,434 | | | | (2,501 | ) |
SEE NOTES TO CONSOLIDATED FINANCIAL STATEMENTS.
| | | | | | |
| | | |
| 8 | | | | JPMORGAN EXCHANGE-TRADED FUNDS | | OCTOBER 31, 2016 |
| | | | | | | | | | | | | | | | | | | | |
NUMBER OF
CONTRACTS | | | DESCRIPTION | | EXPIRATION
DATE | | | TRADING
CURRENCY | | | NOTIONAL VALUE AT
OCTOBER 31, 2016 | | | NET UNREALIZED
APPRECIATION
(DEPRECIATION) | |
| | 2 | | | Coffee Futures ^ | | | 12/19/16 | | | | USD | | | | 123,112 | | | | 7,044 | |
| | 1 | | | U.S. Long Treasury Bond | | | 12/20/16 | | | | USD | | | | 162,719 | | | | (1,127 | ) |
| | 44 | | | 10 Year U.S. Treasury Note | | | 12/20/16 | | | | USD | | | | 5,703,500 | | | | (25,316 | ) |
| | 1 | | | LME Nickel Futures ^ | | | 12/21/16 | | | | USD | | | | 62,733 | | | | (60 | ) |
| | 6 | | | LME Zinc Futures ^ | | | 12/21/16 | | | | USD | | | | 368,700 | | | | 13,519 | |
| | 1 | | | Cotton No. 2 Futures ^ | | | 12/21/16 | | | | USD | | | | 34,430 | | | | 482 | |
| | 10 | | | LME Aluminum Futures ^ | | | 12/21/16 | | | | GBP | | | | 433,375 | | | | 2,950 | |
| | 1 | | | Gold Futures ^ | | | 12/30/16 | | | | USD | | | | 127,310 | | | | 2,007 | |
| | 1 | | | Silver Futures ^ | | | 12/30/16 | | | | USD | | | | 88,980 | | | | 1,627 | |
| | 4 | | | Long Gilt 10 Year Bond | | | 12/30/16 | | | | GBP | | | | 613,667 | | | | (5,631 | ) |
| | 4 | | | 5 Year U.S. Treasury Note | | | 01/05/17 | | | | USD | | | | 483,187 | | | | (258 | ) |
| | 4 | | | Soybean Futures ^ | | | 01/14/17 | | | | USD | | | | 202,350 | | | | (1,074 | ) |
| | 5 | | | LME Aluminum Futures ^ | | | 01/18/17 | | | | USD | | | | 216,906 | | | | (390 | ) |
| | 5 | | | Cocoa Futures ^ | | | 03/17/17 | | | | USD | | | | 132,150 | | | | (815 | ) |
| | 3 | | | Coffee Futures ^ | | | 03/20/17 | | | | USD | | | | 188,494 | | | | (1,246 | ) |
| | 3 | | | Feeder Cattle Futures ^ | | | 03/29/17 | | | | USD | | | | 168,412 | | | | (2,121 | ) |
| | 8 | | | Cocoa Futures ^ | | | 05/15/17 | | | | USD | | | | 209,920 | | | | (2,673 | ) |
| | 5 | | | Sugar No. 11 (World Markets) Futures ^ | | | 05/15/17 | | | | USD | | | | 120,792 | | | | (8,717 | ) |
| | 7 | | | Sugar No. 11 (World Markets) Futures ^ | | | 06/30/17 | | | | USD | | | | 161,190 | | | | (5,508 | ) |
| | 11 | | | Sugar No. 11 (World Markets) Futures ^ | | | 07/15/17 | | | | USD | | | | 260,075 | | | | (2,059 | ) |
| | | | | | | | | | | | | | | | | | | | |
| | | | Total Long Futures Outstanding | | | | (76,529 | ) |
| | | | | | | | | | | | | | | | | | | | |
| | | | Short Futures Outstanding | |
| | (3 | ) | | LME Zinc Futures ^ | | | 11/16/16 | | | | USD | | | | (183,975 | ) | | | 1,125 | |
| | (21 | ) | | Euro Bund | | | 12/11/16 | | | | EUR | | | | (3,738,482 | ) | | | 30,341 | |
| | (4 | ) | | 10 Year Japanese Government Bond | | | 12/12/16 | | | | JPY | | | | (578,583 | ) | | | 240 | |
| | (9 | ) | | Lean Hogs Futures ^ | | | 12/14/16 | | | | USD | | | | (172,620 | ) | | | (15,857 | ) |
| | (7 | ) | | CBOT Wheat Futures ^ | | | 12/15/16 | | | | USD | | | | (145,688 | ) | | | 1,567 | |
| | (5 | ) | | Corn Futures ^ | | | 12/15/16 | | | | USD | | | | (88,688 | ) | | | 48 | |
| | (1 | ) | | 3 Year Australian Government Bond | | | 12/16/16 | | | | AUD | | | | (85,621 | ) | | | 22 | |
| | (1 | ) | | S&P/MIB Index | | | 12/18/16 | | | | EUR | | | | (93,902 | ) | | | (2,940 | ) |
| | (35 | ) | | E-mini S&P 500 | | | 12/19/16 | | | | USD | | | | (3,710,175 | ) | | | 31,267 | |
| | (33 | ) | | 10 Year Canadian Government Bond | | | 12/26/16 | | | | CAD | | | | (3,558,085 | ) | | | (851 | ) |
| | (1 | ) | | LME Copper Futures ^ | | | 12/31/16 | | | | USD | | | | (55,125 | ) | | | (2,228 | ) |
| | (11 | ) | | Live Cattle Futures ^ | | | 12/31/16 | | | | USD | | | | (454,630 | ) | | | (12,082 | ) |
| | (3 | ) | | WTI Crude Oil Futures ^ | | | 01/20/17 | | | | USD | | | | (144,510 | ) | | | 1,312 | |
| | (2 | ) | | Feeder Cattle Futures ^ | | | 01/26/17 | | | | USD | | | | (116,000 | ) | | | 669 | |
| | (2 | ) | | Natural Gas Futures ^ | | | 01/27/17 | | | | USD | | | | (64,460 | ) | | | 1,055 | |
| | (5 | ) | | WTI Crude Oil Futures ^ | | | 01/31/17 | | | | USD | | | | (237,300 | ) | | | 11,547 | |
| | (5 | ) | | Natural Gas Futures ^ | | | 01/31/17 | | | | USD | | | | (159,750 | ) | | | 14,947 | |
| | (20 | ) | | Lean Hogs Futures ^ | | | 02/14/17 | | | | USD | | | | (437,000 | ) | | | (7,949 | ) |
| | (26 | ) | | CBOT Wheat Futures ^ | | | 03/16/17 | | | | USD | | | | (563,875 | ) | | | 4,261 | |
| | (7 | ) | | Lean Hogs Futures ^ | | | 04/17/17 | | | | USD | | | | (173,740 | ) | | | (581 | ) |
| | (6 | ) | | Corn Futures ^ | | | 05/16/17 | | | | USD | | | | (110,850 | ) | | | 57 | |
| | (10 | ) | | CBOT Wheat Futures ^ | | | 05/16/17 | | | | USD | | | | (224,125 | ) | | | 171 | |
| | | | | | | | | | | | | | | | | | | | |
| | | | Total Short Futures Outstanding | | | | 56,141 | |
| | | | | | | | | | | | | | | | | | | | |
| | | | | | | | (20,388 | ) |
| | | | | | | | | | | | | | | | | | | | |
SEE NOTES TO CONSOLIDATED FINANCIAL STATEMENTS.
| | | | | | | | |
| | | |
| OCTOBER 31, 2016 | | JPMORGAN EXCHANGE-TRADED FUNDS | | | | | 9 | |
JPMorgan Diversified Alternatives ETF
CONSOLIDATED SCHEDULE OF PORTFOLIO INVESTMENTS
AS OF OCTOBER 31, 2016 (continued)
| | | | | | | | | | | | | | | | | | | | | | |
| Forward Foreign Currency Exchange Contracts | |
CONTRACTS
TO BUY | | | CURRENCY | | COUNTERPARTY | | SETTLEMENT
DATE | | | SETTLEMENT
VALUE | | | VALUE AT
OCTOBER 31, 2016 | | | NET
UNREALIZED
APPRECIATION
(DEPRECIATION) | |
| | 106,473 | | | AUD | | Deutsche Bank | | | 11/10/2016 | | | | 81,403 | | | | 80,973 | | | | (430 | ) |
| | 1,636,841 | | | AUD | | Deutsche Bank | | | 11/22/2016 | | | | 1,246,134 | | | | 1,244,422 | | | | (1,712 | ) |
| | 418,967 | | | AUD | | Merrill Lynch | | | 11/22/2016 | | | | 321,506 | | | | 318,523 | | | | (2,983 | ) |
| | 1,197,401 | | | BRL | | Merrill Lynch (d) | | | 11/22/2016 | | | | 372,708 | | | | 372,564 | | | | (144 | ) |
| | 77,294 | | | CAD | | Royal Bank of Canada | | | 11/10/2016 | | | | 57,984 | | | | 57,629 | | | | (355 | ) |
| | 1,501 | | | CAD | | Merrill Lynch | | | 11/22/2016 | | | | 1,149 | | | | 1,119 | | | | (30 | ) |
| | 1,103,435,855 | | | COP | | Merrill Lynch (d) | | | 11/22/2016 | | | | 377,413 | | | | 365,641 | | | | (11,772 | ) |
| | 13,301 | | | EUR | | Royal Bank of Canada | | | 11/10/2016 | | | | 14,869 | | | | 14,607 | | | | (262 | ) |
| | 36,581 | | | EUR | | Goldman Sachs | | | 11/10/2016 | | | | 40,057 | | | | 40,173 | | | | 116 | |
| | 455,030 | | | EUR | | Royal Bank of Canada | | | 11/22/2016 | | | | 502,070 | | | | 499,950 | | | | (2,120 | ) |
| | 980 | | | GBP | | The Toronto Dominion Bank — London | | | 11/10/2016 | | | | 1,199 | | | | 1,200 | | | | 1 | |
| | 246,622 | | | JPY | | Royal Bank of Canada | | | 11/10/2016 | | | | 2,408 | | | | 2,352 | | | | (56 | ) |
| | 6,395,211 | | | NOK | | Deutsche Bank | | | 11/22/2016 | | | | 781,946 | | | | 774,041 | | | | (7,905 | ) |
| | 1,550,641 | | | NOK | | Merrill Lynch | | | 11/22/2016 | | | | 190,453 | | | | 187,681 | | | | (2,772 | ) |
| | 3,615,917 | | | NZD | | The Toronto Dominion Bank — London | | | 11/22/2016 | | | | 2,562,846 | | | | 2,583,405 | | | | 20,559 | |
| | 874,870 | | | NZD | | Merrill Lynch | | | 11/22/2016 | | | | 628,436 | | | | 625,054 | | | | (3,382 | ) |
| | 23,556,852 | | | RUB | | Merrill Lynch (d) | | | 11/22/2016 | | | | 370,921 | | | | 369,517 | | | | (1,404 | ) |
| | 218,000 | | | TRY | | Deutsche Bank | | | 11/22/2016 | | | | 69,885 | | | | 70,125 | | | | 240 | |
| | 940,484 | | | TRY | | Merrill Lynch | | | 11/22/2016 | | | | 302,689 | | | | 302,532 | | | | (157 | ) |
| | 4,246,294 | | | ZAR | | The Toronto Dominion Bank — London | | | 11/22/2016 | | | | 297,644 | | | | 313,551 | | | | 15,907 | |
| | 1,050,000 | | | ZAR | | Deutsche Bank | | | 11/22/2016 | | | | 74,168 | | | | 77,533 | | | | 3,365 | |
| | | | | | | | | | | | | 8,297,888 | | | | 8,302,592 | | | | 4,704 | |
| | |
| | | | | | |
CONTRACTS
TO SELL | | | CURRENCY | | COUNTERPARTY | | SETTLEMENT
DATE | | | SETTLEMENT
VALUE | | | VALUE AT
OCTOBER 31, 2016 | | | NET
UNREALIZED
APPRECIATION
(DEPRECIATION) | |
| | 106,473 | | | AUD | | The Toronto Dominion Bank — London | | | 11/10/2016 | | | | 80,992 | | | | 80,973 | | | | 19 | |
| | 56,183 | | | CAD | | Royal Bank of Canada | | | 11/10/2016 | | | | 42,069 | | | | 41,890 | | | | 179 | |
| | 21,111 | | | CAD | | The Toronto Dominion Bank — London | | | 11/10/2016 | | | | 15,991 | | | | 15,740 | | | | 251 | |
| | 702,301 | | | CHF | | Royal Bank of Canada | | | 11/22/2016 | | | | 712,075 | | | | 710,507 | | | | 1,568 | |
| | 2,863,680 | | | CHF | | The Toronto Dominion Bank — London | | | 11/22/2016 | | | | 2,900,766 | | | | 2,897,143 | | | | 3,623 | |
| | 117,913 | | | CHF | | Merrill Lynch | | | 11/22/2016 | | | | 119,408 | | | | 119,291 | | | | 117 | |
| | 9,174,882 | | | CZK | | Deutsche Bank | | | 11/22/2016 | | | | 374,574 | | | | 372,968 | | | | 1,606 | |
| | 13,301 | | | EUR | | Royal Bank of Canada | | | 11/10/2016 | | | | 14,940 | | | | 14,607 | | | | 333 | |
| | 36,581 | | | EUR | | The Toronto Dominion Bank — London | | | 11/10/2016 | | | | 39,817 | | | | 40,173 | | | | (356 | ) |
| | 171,309 | | | EUR | | Merrill Lynch | | | 11/22/2016 | | | | 188,646 | | | | 188,221 | | | | 425 | |
| | 980 | | | GBP | | Merrill Lynch | | | 11/10/2016 | | | | 1,191 | | | | 1,200 | | | | (9 | ) |
| | 160,159 | | | GBP | | Deutsche Bank | | | 11/22/2016 | | | | 196,272 | | | | 196,118 | | | | 154 | |
| | 691,042 | | | GBP | | Merrill Lynch | | | 11/22/2016 | | | | 845,883 | | | | 846,196 | | | | (313 | ) |
| | 104,037,536 | | | HUF | | Deutsche Bank | | | 11/22/2016 | | | | 374,949 | | | | 369,923 | | | | 5,026 | |
| | 1,430,694 | | | ILS | | Deutsche Bank | | | 11/22/2016 | | | | 374,825 | | | | 373,124 | | | | 1,701 | |
| | 246,622 | | | JPY | | Royal Bank of Canada | | | 11/10/2016 | | | | 2,395 | | | | 2,353 | | | | 42 | |
| | 79,383,726 | | | JPY | | Deutsche Bank | | | 11/22/2016 | | | | 761,766 | | | | 757,516 | | | | 4,250 | |
| | 19,254,806 | | | JPY | | Merrill Lynch | | | 11/22/2016 | | | | 185,320 | | | | 183,738 | | | | 1,582 | |
| | 1,526,266 | | | RON | | Deutsche Bank | | | 11/22/2016 | | | | 373,604 | | | | 371,951 | | | | 1,653 | |
SEE NOTES TO CONSOLIDATED FINANCIAL STATEMENTS.
| | | | | | |
| | | |
| 10 | | | | JPMORGAN EXCHANGE-TRADED FUNDS | | OCTOBER 31, 2016 |
| | | | | | | | | | | | | | | | | | | | | | |
CONTRACTS
TO SELL | | | CURRENCY | | COUNTERPARTY | | SETTLEMENT
DATE | | | SETTLEMENT
VALUE | | | VALUE AT
OCTOBER 31, 2016 | | | NET
UNREALIZED
APPRECIATION
(DEPRECIATION) | |
| | 2,343,863 | | | SEK | | Royal Bank of Canada | | | 11/22/2016 | | | | 266,820 | | | | 259,756 | | | | 7,064 | |
| | 9,664,174 | | | SEK | | Deutsche Bank | | | 11/22/2016 | | | | 1,099,769 | | | | 1,071,023 | | | | 28,746 | |
| | 11,934,602 | | | TWD | | Merrill Lynch (d) | | | 11/22/2016 | | | | 376,692 | | | | 378,353 | | | | (1,661 | ) |
| | | | | | | | | | | | | 9,348,764 | | | | 9,292,764 | | | | 56,000 | |
| | |
| | | | | | | | | | |
| Total Return Basket Swaps* | |
| COUNTERPARTY | | DESCRIPTION | | TERMINATION
DATE | | | VALUE** | |
| Bank of America | | The Fund receives the total return on a portfolio of long and short positions and pays one month LIBOR plus a spread for long positions, or one day Federal Funds floating rate for short positions, which is denominated in various foreign currencies based on the local currencies of the positions within the portfolio. | | | 3/16/2018 | | | $ | 264 | |
| Bank of America | | The Fund receives the total return on a portfolio of long and short positions and pays one month LIBOR plus a spread for long positions, or one day Federal Funds floating rate for short positions, which is denominated in various foreign currencies based on the local currencies of the positions within the portfolio. | | | 3/17/2018 | | | | 1,371 | |
| UBS | | The Fund receives the total return on a portfolio of long and short positions and pays one month LIBOR plus a spread for long positions, or one day Federal Funds floating rate for short positions, which is denominated in various foreign currencies based on the local currencies of the positions within the portfolio. | | | 9/12/2019 | | | | 19 | |
| UBS | | The Fund receives the total return on a portfolio of long and short positions and pays one month LIBOR plus a spread for long positions, or one day Federal Funds floating rate for short positions, which is denominated in various foreign currencies based on the local currencies of the positions within the portfolio. | | | 9/12/2019 | | | | (3,651 | ) |
| | | | | | | | | | |
| Total | | | | | | | | $ | (1,997 | ) |
| | | | | | | | | | |
| * | See the accompanying “Additional Information — Total Return Basket Swap” for further details |
| ** | This represents the value of the swap subsequent to reset. |
NOTES TO CONSOLIDATED SCHEDULE OF PORTFOLIO INVESTMENTS:
| | |
| AUD | | — Australian Dollar |
| BRL | | — Brazilian Real |
| CAD | | — Canadian Dollar |
| CBOT | | — Chicago Board of Trade |
| CHF | | — Swiss Franc |
| COP | | — Colombia Peso |
| CZK | | — Czech Republic Koruna |
| EUR | | — Euro |
| FTSE | | — Financial Times Stock Exchange |
| GBP | | — British Pound |
| HUF | | — Hungary Forint |
| ILS | | — Israeli Shekel |
| JPY | | — Japanese Yen |
| LME | | — London Metal Exchange |
| MIB | | — Italian Stock Exchange |
| NOK | | — Norwegian Krone |
| NZD | | — New Zealand Dollar |
| PLC | | — Public Limited Company |
| | |
| RON | | — Romania New Leu |
| RUB | | — Russia Ruble |
| S&P | | — Standard & Poor’s |
| SEK | | — Swedish Krona |
| SPI | | — Share Price Index |
| TRY | | — Turkey Lira |
| TWD | | — Taiwan New Dollar |
| USD | | — United States Dollar |
| WTI | | — West Texas Intermediate |
| ZAR | | — South Africa Rand |
| |
| (a) | | — Non-income producing security. |
| (b) | | — Investment in affiliate. Money market fund is registered under the Investment Company Act of 1940, as amended, and advised by J.P. Morgan Investment Management Inc. |
| (c) | | — The rate shown is the current yield as of October 31, 2016. |
| (d) | | — Non-deliverable forwards. |
| ^ | | — Represents positions held by the Subsidiary. |
| ^^ | | — A portion of the position is held by the Subsidiary. |
SEE NOTES TO CONSOLIDATED FINANCIAL STATEMENTS.
| | | | | | | | |
| | | |
| OCTOBER 31, 2016 | | JPMORGAN EXCHANGE-TRADED FUNDS | | | | | 11 | |
JPMorgan Diversified Alternatives ETF
CONSOLIDATED SCHEDULE OF PORTFOLIO INVESTMENTS
ADDITIONAL INFORMATION-TOTAL RETURN BASKET SWAPS
AS OF OCTOBER 31, 2016
| | | | | | | | | | | | | | | | |
TOTAL RETURN BASKET
SWAP POSITIONS | | SHARES | | | NOTIONAL
VALUE($) (1) | | | CURRENT
VALUE($) (2) | | | VALUE($) (3) | |
Long Positions | | | | | | | | | | | | | | | | |
| | | | |
Common Stocks | | | | | | | | | | | | | | | | |
Consumer Discretionary — 0.8% | | | | | | | | | | | | | | | | |
Media — 0.8% | | | | | | | | | | | | | | | | |
Media General, Inc. (a) | | | 1,329 | | | | 22,394 | | | | 22,394 | | | | — | |
Time Warner, Inc. | | | 4,385 | | | | 390,221 | | | | 390,221 | | | | — | |
| | | | | | | | | | | | | | | | |
| | | 5,714 | | | | 412,615 | | | | 412,615 | | | | — | |
| | | | | | | | | | | | | | | | |
Total Consumer Discretionary | | | 5,714 | | | | 412,615 | | | | 412,615 | | | | — | |
| | | | | | | | | | | | | | | | |
Consumer Staples — 0.5% | | | | | | | | | | | | | | | | |
Tobacco — 0.5% | | | | | | | | | | | | | | | | |
Reynolds American, Inc. | | | 4,509 | | | | 248,356 | | | | 248,356 | | | | — | |
| | | | | | | | | | | | | | | | |
Total Consumer Staples | | | 4,509 | | | | 248,356 | | | | 248,356 | | | | — | |
| | | | | | | | | | | | | | | | |
Financials — 2.0% | | | | | | | | | | | | | | | | |
Banks — 1.1% | | | | | | | | | | | | | | | | |
PrivateBancorp, Inc. | | | 10,295 | | | | 465,746 | | | | 465,746 | | | | — | |
Yadkin Financial Corp. | | | 5,033 | | | | 139,615 | | | | 139,615 | | | | — | |
| | | | | | | | | | | | | | | | |
| | | 15,328 | | | | 605,361 | | | | 605,361 | | | | — | |
| | | | | | | | | | | | | | | | |
Capital Markets — 0.1% | | | | | | | | | | | | | | | | |
Bats Global Markets, Inc. | | | 1,636 | | | | 48,115 | | | | 48,115 | | | | — | |
SVG Capital plc (United Kingdom) (a) | | | 462 | | | | 3,972 | | | | 3,970 | | | | (2 | ) |
| | | | | | | | | | | | | | | | |
| | | 2,098 | | | | 52,087 | | | | 52,085 | | | | (2 | ) |
| | | | | | | | | | | | | | | | |
Thrifts & Mortgage Finance — 0.8% | | | | | | | | | | | | | | | | |
Astoria Financial Corp. | | | 30,194 | | | | 441,738 | | | | 441,738 | | | | — | |
| | | | | | | | | | | | | | | | |
Total Financials | | | 47,620 | | | | 1,099,186 | | | | 1,099,184 | | | | (2 | ) |
| | | | | | | | | | | | | | | | |
Health Care — 0.9% | | | | | | | | | | | | | | | | |
Health Care Equipment & Supplies — 0.7% | | | | | | | | | | | | | | | | |
St. Jude Medical, Inc. | | | 4,435 | | | | 345,220 | | | | 345,220 | | | | — | |
| | | | | | | | | | | | | | | | |
Health Care Providers & Services — 0.2% | | | | | | | | | | | | | | | | |
Cigna Corp. | | | 735 | | | | 87,340 | | | | 87,340 | | | | — | |
| | | | | | | | | | | | | | | | |
Total Health Care | | | 5,170 | | | | 432,560 | | | | 432,560 | | | | — | |
| | | | | | | | | | | | | | | | |
Industrials — 0.0% (b) | | | | | | | | | | | | | | | | |
Professional Services — 0.0% (b) | | | | | | | | | | | | | | | | |
SAI Global Ltd. (Australia) | | | 1,708 | | | | 6,080 | | | | 6,073 | | | | (7 | ) |
| | | | | | | | | | | | | | | | |
Total Industrials | | | 1,708 | | | | 6,080 | | | | 6,073 | | | | (7 | ) |
| | | | | | | | | | | | | | | | |
Utilities — 0.9% | | | | | | | | | | | | | | | | |
Electric Utilities — 0.9% | | | | | | | | | | | | | | | | |
Fortis, Inc. (Canada) | | | 16 | | | | 527 | | | | 527 | | | | — | |
Westar Energy, Inc. | | | 8,574 | | | | 491,462 | | | | 491,462 | | | | — | |
| | | | | | | | | | | | | | | | |
| | | 8,590 | | | | 491,989 | | | | 491,989 | | | | — | |
| | | | | | | | | | | | | | | | |
Total Utilities | | | 8,590 | | | | 491,989 | | | | 491,989 | | | | — | |
| | | | | | | | | | | | | | | | |
Total Long Positions of Total Return Basket Swap | | | 73,311 | | | | 2,690,786 | | | | 2,690,777 | | | | (9 | ) |
| | | | | | | | | | | | | | | | |
SEE NOTES TO CONSOLIDATED FINANCIAL STATEMENTS.
| | | | | | |
| | | |
| 12 | | | | JPMORGAN EXCHANGE-TRADED FUNDS | | OCTOBER 31, 2016 |
| | | | | | | | | | | | | | | | |
TOTAL RETURN BASKET
SWAP POSITIONS | | SHARES | | | NOTIONAL
VALUE($) (1) | | | CURRENT
VALUE($) (2) | | | VALUE($) (3) | |
Short Positions | | | | | | | | | | | | | | | | |
| | | | |
Common Stocks | | | | | | | | | | | | | | | | |
Consumer Discretionary — (0.0)% (b) | | | | | | | | | | | | | | | | |
Media — (0.0)% (b) | | | | | | | | | | | | | | | | |
Nexstar Broadcasting Group, Inc. | | | 163 | | | | 7,954 | | | | 7,954 | | | | — | |
| | | | | | | | | | | | | | | | |
Total Consumer Discretionary | | | 163 | | | | 7,954 | | | | 7,954 | | | | — | |
| | | | | | | | | | | | | | | | |
Financials — (2.0)% | | | | | | | | | | | | | | | | |
Banks — (0.8)% | | | | | | | | | | | | | | | | |
Canadian Imperial Bank of Commerce (Canada) | | | 3,726 | | | | 279,179 | | | | 279,179 | | | | — | |
FNB Corp. | | | 10,762 | | | | 140,659 | | | | 140,659 | | | | — | |
| | | | | | | | | | | | | | | | |
| | | 14,488 | | | | 419,838 | | | | 419,838 | | | | — | |
| | | | | | | | | | | | | | | | |
Capital Markets — (0.4)% | | | | | | | | | | | | | | | | |
British American Tobacco plc (United Kingdom) | | | 2,455 | | | | 140,977 | | | | 140,704 | | | | 273 | |
CBOE Holdings, Inc. | | | 518 | | | | 32,743 | | | | 32,743 | | | | — | |
| | | | | | | | | | | | | | | | |
| | | 2,973 | | | | 173,720 | | | | 173,447 | | | | 273 | |
| | | | | | | | | | | | | | | | |
Thrifts & Mortgage Finance — (0.8)% | | | | | | | | | | | | | | | | |
New York Community Bancorp, Inc. | | | 29,892 | | | | 429,249 | | | | 429,249 | | | | — | |
| | | | | | | | | | | | | | | | |
Total Financials | | | 47,353 | | | | 1,022,807 | | | | 1,022,534 | | | | 273 | |
| | | | | | | | | | | | | | | | |
Health Care — (0.4)% | | | | | | | | | | | | | | | | |
Health Care Equipment & Supplies — (0.3)% | | | | | | | | | | | | | | | | |
Abbott Laboratories | | | 3,822 | | | | 149,975 | | | | 149,975 | | | | — | |
| | | | | | | | | | | | | | | | |
Health Care Providers & Services — (0.1)% | | | | | | | | | | | | | | | | |
Anthem, Inc. | | | 374 | | | | 45,576 | | | | 45,576 | | | | — | |
| | | | | | | | | | | | | | | | |
Total Health Care | | | 4,196 | | | | 195,551 | | | | 195,551 | | | | — | |
| | | | | | | | | | | | | | | | |
Telecommunication — (0.6)% | | | | | | | | | | | | | | | | |
Diversified Telecommunication Services — (0.6)% | | | | | | | | | | | | | | | | |
AT&T, Inc. | | | 8,027 | | | | 295,313 | | | | 295,313 | | | | — | |
| | | | | | | | | | | | | | | | |
Total Telecommunication | | | 8,027 | | | | 295,313 | | | | 295,313 | | | | — | |
| | | | | | | | | | | | | | | | |
Total Short Positions of Total Return Basket Swap | | | 59,739 | | | | 1,521,625 | | | | 1,521,352 | | | | 273 | |
| | | | | | | | | | | | | | | | |
Total of Long and Short Positions of Total Return Basket Swap | | | 13,572 | | | | 1,169,161 | | | | 1,169,425 | | | | 264 | |
| | | | | | | | | | | | | | | | |
Outstanding Swap Contract, at value | | | | | | | | | | | | | | $ | 264 | |
| | | | | | | | | | | | | | | | |
| | | | |
TOTAL RETURN BASKET
SWAP POSITIONS | | SHARES | | | NOTIONAL
VALUE($) (1) | | | CURRENT
VALUE($) (2) | | | VALUE($) (3) | |
| Long Positions | | | | | | | | | | | | |
| | | | |
| Common Stocks | | | | | | | | | | | | |
Consumer Discretionary — 2.1% | | | | | | | | | | | | | | | | |
Auto Components — 0.6% | | | | | | | | | | | | | | | | |
Bridgestone Corp. (Japan) | | | 2,700 | | | | 100,796 | | | | 100,774 | | | | (22 | ) |
GKN plc (United Kingdom) | | | 5,015 | | | | 19,594 | | | | 19,558 | | | | (36 | ) |
Sumitomo Electric Industries Ltd. (Japan) | | | 6,800 | | | | 100,797 | | | | 100,460 | | | | (337 | ) |
Sumitomo Rubber Industries Ltd. (Japan) | | | 6,500 | | | | 108,964 | | | | 109,046 | | | | 82 | |
| | | | | | | | | | | | | | | | |
| | | 21,015 | | | | 330,151 | | | | 329,838 | | | | (313 | ) |
| | | | | | | | | | | | | | | | |
Automobiles — 0.4% | | | | | | | | | | | | | | | | |
Fuji Heavy Industries Ltd. (Japan) | | | 2,600 | | | | 101,501 | | | | 101,599 | | | | 98 | |
Mazda Motor Corp. (Japan) | | | 6,300 | | | | 103,779 | | | | 104,478 | | | | 699 | |
| | | | | | | | | | | | | | | | |
| | | 8,900 | | | | 205,280 | | | | 206,077 | | | | 797 | |
| | | | | | | | | | | | | | | | |
SEE NOTES TO CONSOLIDATED FINANCIAL STATEMENTS.
| | | | | | | | |
| | | |
| OCTOBER 31, 2016 | | JPMORGAN EXCHANGE-TRADED FUNDS | | | | | 13 | |
JPMorgan Diversified Alternatives ETF
CONSOLIDATED SCHEDULE OF PORTFOLIO INVESTMENTS
ADDITIONAL INFORMATION-TOTAL RETURN BASKET SWAPS
AS OF OCTOBER 31, 2016 (continued)
| | | | | | | | | | | | | | | | |
TOTAL RETURN BASKET SWAP POSITIONS | | SHARES | | | NOTIONAL
VALUE($) (1) | | | CURRENT
VALUE($) (2) | | | VALUE($) (3) | |
| Long Positions — continued | | | | | | | | | | | | |
| | | | |
| Common Stocks — continued | | | | | | | | | | | | |
Hotels, Restaurants & Leisure — 0.0% (b) | | | | | | | | | | | | | | | | |
Carnival plc (United Kingdom) | | | 453 | | | | 21,824 | | | | 21,850 | | | | 26 | |
William Hill plc (United Kingdom) | | | 5,283 | | | | 19,128 | | | | 19,111 | | | | (17 | ) |
| | | | | | | | | | | | | | | | |
| | | 5,736 | | | | 40,952 | | | | 40,961 | | | | 9 | |
| | | | | | | | | | | | | | | | |
Household Durables — 0.6% | | | | | | | | | | | | | | | | |
Iida Group Holdings Co. Ltd. (Japan) | | | 5,400 | | | | 104,478 | | | | 104,380 | | | | (98 | ) |
Nikon Corp. (Japan) | | | 6,600 | | | | 99,878 | | | | 99,745 | | | | (133 | ) |
Sekisui Chemical Co. Ltd. (Japan) | | | 6,900 | | | | 108,892 | | | | 108,666 | | | | (226 | ) |
| | | | | | | | | | | | | | | | |
| | | 18,900 | | | | 313,248 | | | | 312,791 | | | | (457 | ) |
| | | | | | | | | | | | | | | | |
Leisure Products — 0.2% | | | | | | | | | | | | | | | | |
Bandai Namco Holdings, Inc. (Japan) | | | 3,300 | | | | 99,123 | | | | 98,855 | | | | (268 | ) |
| | | | | | | | | | | | | | | | |
Media — 0.0% (b) | | | | | | | | | | | | | | | | |
Pearson plc (United Kingdom) | | | 2,005 | | | | 18,590 | | | | 18,549 | | | | (41 | ) |
| | | | | | | | | | | | | | | | |
Multiline Retail — 0.2% | | | | | | | | | | | | | | | | |
Harvey Norman Holdings Ltd. (Australia) | | | 25,239 | | | | 96,956 | | | | 96,654 | | | | (302 | ) |
| | | | | | | | | | | | | | | | |
Specialty Retail — 0.0% (b) | | | | | | | | | | | | | | | | |
Kingfisher plc (United Kingdom) | | | 4,297 | | | | 19,003 | | | | 18,982 | | | | (21 | ) |
| | | | | | | | | | | | | | | | |
Textiles, Apparel & Luxury Goods — 0.1% | | | | | | | | | | | | | | | | |
Swatch Group AG (Switzerland) | | | 373 | | | | 21,505 | | | | 21,503 | | | | (2 | ) |
| | | | | | | | | | | | | | | | |
Total Consumer Discretionary | | | 89,765 | | | | 1,144,808 | | | | 1,144,210 | | | | (598 | ) |
| | | | | | | | | | | | | | | | |
Consumer Staples — 0.2% | | | | | | | | | | | | | | | | |
Food & Staples Retailing — 0.2% | | | | | | | | | | | | | | | | |
Tsuruha Holdings, Inc. (Japan) | | | 900 | | | | 104,014 | | | | 103,844 | | | | (170 | ) |
Wm Morrison Supermarkets plc (United Kingdom) | | | 8,155 | | | | 22,609 | | | | 22,575 | | | | (34 | ) |
| | | | | | | | | | | | | | | | |
| | | 9,055 | | | | 126,623 | | | | 126,419 | | | | (204 | ) |
| | | | | | | | | | | | | | | | |
Personal Products — 0.0% (b) | | | | | | | | | | | | | | | | |
Unilever plc (United Kingdom) | | | 446 | | | | 18,659 | | | | 18,620 | | | | (39 | ) |
| | | | | | | | | | | | | | | | |
Tobacco — 0.0% (b) | | | | | | | | | | | | | | | | |
Imperial Brands plc (United Kingdom) | | | 397 | | | | 19,221 | | | | 19,204 | | | | (17 | ) |
| | | | | | | | | | | | | | | | |
Total Consumer Staples | | | 9,898 | | | | 164,503 | | | | 164,243 | | | | (260 | ) |
| | | | | | | | | | | | | | | | |
Energy — 0.8% | | | | | | | | | | | | | | | | |
Energy Equipment & Services — 0.0% (b) | | | | | | | | | | | | | | | | |
Petrofac Ltd. (Jersey) | | | 1,945 | | | | 19,200 | | | | 19,155 | | | | (45 | ) |
| | | | | | | | | | | | | | | | |
Oil, Gas & Consumable Fuels — 0.8% | | | | | | | | | | | | | | | | |
BP plc (United Kingdom) | | | 3,727 | | | | 22,066 | | | | 22,033 | | | | (33 | ) |
Idemitsu Kosan Co. Ltd. (Japan) | | | 4,400 | | | | 101,578 | | | | 101,112 | | | | (466 | ) |
JX Holdings, Inc. (Japan) | | | 25,000 | | | | 99,147 | | | | 98,779 | | | | (368 | ) |
Royal Dutch Shell plc (United Kingdom) | | | 822 | | | | 21,279 | | | | 21,201 | | | | (78 | ) |
Showa Shell Sekiyu KK (Japan) | | | 10,700 | | | | 100,092 | | | | 99,695 | | | | (397 | ) |
TonenGeneral Sekiyu KK (Japan) | | | 10,000 | | | | 98,789 | | | | 98,465 | | | | (324 | ) |
| | | | | | | | | | | | | | | | |
| | | 54,649 | | | | 442,951 | | | | 441,285 | | | | (1,666 | ) |
| | | | | | | | | | | | | | | | |
Total Energy | | | 56,594 | | | | 462,151 | | | | 460,440 | | | | (1,711 | ) |
| | | | | | | | | | | | | | | | |
Financials — 0.0% (b) | | | | | | | | | | | | | | | | |
Capital Markets — 0.0% (b) | | | | | | | | | | | | | | | | |
3i Group plc (United Kingdom) | | | 2,539 | | | | 20,853 | | | | 20,813 | | | | (40 | ) |
Investec plc (United Kingdom) | | | 3,375 | | | | 20,985 | | | | 20,946 | | | | (39 | ) |
| | | | | | | | | | | | | | | | |
| | | 5,914 | | | | 41,838 | | | | 41,759 | | | | (79 | ) |
| | | | | | | | | | | | | | | | |
Insurance — 0.0% (b) | | | | | | | | | | | | | | | | |
Swiss Life Holding AG (Switzerland) | | | 82 | | | | 21,711 | | | | 21,700 | | | | (11 | ) |
SEE NOTES TO CONSOLIDATED FINANCIAL STATEMENTS.
| | | | | | |
| | | |
| 14 | | | | JPMORGAN EXCHANGE-TRADED FUNDS | | OCTOBER 31, 2016 |
| | | | | | | | | | | | | | | | |
TOTAL RETURN BASKET
SWAP POSITIONS | | SHARES | | | NOTIONAL
VALUE($) (1) | | | CURRENT
VALUE($) (2) | | | VALUE($) (3) | |
| Long Positions — continued | | | | | | | | | | | | |
| | | | |
| Common Stocks — continued | | | | | | | | | | | | |
Insurance — continued | | | | | | | | | | | | | | | | |
Swiss Re AG (Switzerland) | | | 237 | | | | 22,011 | | | | 21,997 | | | | (14 | ) |
| | | | | | | | | | | | | | | | |
| | | 319 | | | | 43,722 | | | | 43,697 | | | | (25 | ) |
| | | | | | | | | | | | | | | | |
Total Financials | | | 6,233 | | | | 85,560 | | | | 85,456 | | | | (104 | ) |
| | | | | | | | | | | | | | | | |
Health Care — 1.7% | | | | | | | | | | | | | | | | |
Health Care Equipment & Supplies — 0.0% (b) | | | | | | | | | | | | | | | | |
Smith & Nephew plc (United Kingdom) | | | 1,289 | | | | 18,664 | | | | 18,634 | | | | (30 | ) |
| | | | | | | | | | | | | | | | |
Health Care Providers & Services — 0.4% | | | | | | | | | | | | | | | | |
Alfresa Holdings Corp. (Japan) | | | 4,800 | | | | 101,703 | | | | 101,443 | | | | (260 | ) |
Miraca Holdings, Inc. (Japan) | | | 2,200 | | | | 106,570 | | | | 106,208 | | | | (362 | ) |
| | | | | | | | | | | | | | | | |
| | | 7,000 | | | | 208,273 | | | | 207,651 | | | | (622 | ) |
| | | | | | | | | | | | | | | | |
Life Sciences Tools & Services — 0.0% (b) | | | | | | | | | | | | | | | | |
Lonza Group AG (Switzerland) | | | 111 | | | | 20,954 | | | | 20,946 | | | | (8 | ) |
| | | | | | | | | | | | | | | | |
Pharmaceuticals — 1.3% | | | | | | | | | | | | | | | | |
Astellas Pharma, Inc. (Japan) | | | 6,800 | | | | 101,122 | | | | 100,925 | | | | (197 | ) |
Daiichi Sankyo Co. Ltd. (Japan) | | | 4,300 | | | | 103,574 | | | | 103,326 | | | | (248 | ) |
Hisamitsu Pharmaceutical Co., Inc. (Japan) | | | 2,000 | | | | 106,989 | | | | 106,684 | | | | (305 | ) |
Jazz Pharmaceuticals plc (Ireland) | | | 172 | | | | 18,829 | | | | 18,829 | | | | — | |
Otsuka Holdings Co. Ltd. (Japan) | | | 2,300 | | | | 100,820 | | | | 100,661 | | | | (159 | ) |
Shionogi & Co. Ltd. (Japan) | | | 2,000 | | | | 98,751 | | | | 98,496 | | | | (255 | ) |
Sumitomo Dainippon Pharma Co. Ltd. (Japan) | | | 5,500 | | | | 95,504 | | | | 95,258 | | | | (246 | ) |
Taisho Pharmaceutical Holdings Co. Ltd. (Japan) | | | 1,000 | | | | 97,740 | | | | 97,549 | | | | (191 | ) |
| | | | | | | | | | | | | | | | |
| | | 24,072 | | | | 723,329 | | | | 721,728 | | | | (1,601 | ) |
| | | | | | | | | | | | | | | | |
Total Health Care | | | 32,472 | | | | 971,220 | | | | 968,959 | | | | (2,261 | ) |
| | | | | | | | | | | | | | | | |
Industrials — 2.0% | | | | | | | | | | | | | | | | |
Aerospace & Defense — 0.0% (b) | | | | | | | | | | | | | | | | |
Meggitt plc (United Kingdom) | | | 3,327 | | | | 17,726 | | | | 17,699 | | | | (27 | ) |
| | | | | | | | | | | | | | | | |
Air Freight & Logistics — 0.0% (b) | | | | | | | | | | | | | | | | |
Royal Mail plc (United Kingdom) | | | 3,074 | | | | 18,474 | | | | 18,442 | | | | (32 | ) |
| | | | | | | | | | | | | | | | |
Construction & Engineering — 0.6% | | | | | | | | | | | | | | | | |
CIMIC Group Ltd. (Australia) | | | 4,659 | | | | 104,870 | | | | 104,553 | | | | (317 | ) |
Obayashi Corp. (Japan) | | | 10,600 | | | | 102,391 | | | | 102,112 | | | | (279 | ) |
Taisei Corp. (Japan) | | | 14,000 | | | | 105,197 | | | | 104,931 | | | | (266 | ) |
| | | | | | | | | | | | | | | | |
| | | 29,259 | | | | 312,458 | | | | 311,596 | | | | (862 | ) |
| | | | | | | | | | | | | | | | |
Electrical Equipment — 0.2% | | | | | | | | | | | | | | | | |
ABB Ltd. (Switzerland) | | | 926 | | | | 19,090 | | | | 19,104 | | | | 14 | |
Fuji Electric Co. Ltd. (Japan) | | | 21,000 | | | | 105,130 | | | | 104,865 | | | | (265 | ) |
| | | | | | | | | | | | | | | | |
| | | 21,926 | | | | 124,220 | | | | 123,969 | | | | (251 | ) |
| | | | | | | | | | | | | | | | |
Machinery — 0.2% | | | | | | | | | | | | | | | | |
Amada Holdings Co. Ltd. (Japan) | | | 9,500 | | | | 108,524 | | | | 108,215 | | | | (309 | ) |
| | | | | | | | | | | | | | | | |
Professional Services — 0.0% (b) | | | | | | | | | | | | | | | | |
RELX plc (United Kingdom) | | | 1,104 | | | | 19,743 | | | | 19,707 | | | | (36 | ) |
| | | | | | | | | | | | | | | | |
Road & Rail — 0.2% | | | | | | | | | | | | | | | | |
Central Japan Railway Co. (Japan) | | | 600 | | | | 102,213 | | | | 102,028 | | | | (185 | ) |
| | | | | | | | | | | | | | | | |
Trading Companies & Distributors — 0.8% | | | | | | | | | | | | | | | | |
ITOCHU Corp. (Japan) | | | 8,200 | | | | 103,878 | | | | 103,555 | | | | (323 | ) |
Mitsubishi Corp. (Japan) | | | 4,400 | | | | 96,123 | | | | 95,766 | | | | (357 | ) |
Mitsui & Co. Ltd. (Japan) | | | 7,400 | | | | 102,882 | | | | 102,527 | | | | (355 | ) |
Sumitomo Corp. (Japan) | | | 8,700 | | | | 100,340 | | | | 100,021 | | | | (319 | ) |
| | | | | | | | | | | | | | | | |
| | | 28,700 | | | | 403,223 | | | | 401,869 | | | | (1,354 | ) |
| | | | | | | | | | | | | | | | |
Total Industrials | | | 97,490 | | | | 1,106,581 | | | | 1,103,525 | | | | (3,056 | ) |
| | | | | | | | | | | | | | | | |
SEE NOTES TO CONSOLIDATED FINANCIAL STATEMENTS.
| | | | | | | | |
| | | |
| OCTOBER 31, 2016 | | JPMORGAN EXCHANGE-TRADED FUNDS | | | | | 15 | |
JPMorgan Diversified Alternatives ETF
CONSOLIDATED SCHEDULE OF PORTFOLIO INVESTMENTS
ADDITIONAL INFORMATION-TOTAL RETURN BASKET SWAPS
AS OF OCTOBER 31, 2016 (continued)
| | | | | | | | | | | | | | | | |
TOTAL RETURN BASKET
SWAP POSITIONS | | SHARES | | | NOTIONAL
VALUE($) (1) | | | CURRENT
VALUE($) (2) | | | VALUE($) (3) | |
| Long Positions — continued | | | | | | | | | | | | |
| | | | |
| Common Stocks — continued | | | | | | | | | | | | |
Information Technology — 0.8% | | | | | | | | | | | | | | | | |
Internet Software & Services — 0.2% | | | | | | | | | | | | | | | | |
Mixi, Inc. (Japan) | | | 2,800 | | | | 103,195 | | | | 102,867 | | | | (328 | ) |
| | | | | | | | | | | | | | | | |
Software — 0.4% | | | | | | | | | | | | | | | | |
Konami Holdings Corp. (Japan) | | | 2,600 | | | | 102,765 | | | | 102,680 | | | | (85 | ) |
Nexon Co. Ltd. (Japan) | | | 6,400 | | | | 109,240 | | | | 108,947 | | | | (293 | ) |
| | | | | | | | | | | | | | | | |
| | | 9,000 | | | | 212,005 | | | | 211,627 | | | | (378 | ) |
| | | | | | | | | | | | | | | | |
Technology Hardware, Storage & Peripherals — 0.2% | | | | | | | | | | | | | | | | |
Seiko Epson Corp. (Japan) | | | 5,200 | | | | 105,766 | | | | 105,393 | | | | (373 | ) |
| | | | | | | | | | | | | | | | |
Total Information Technology | | | 17,000 | | | | 420,966 | | | | 419,887 | | | | (1,079 | ) |
| | | | | | | | | | | | | | | | |
Materials — 1.4% | | | | | | | | | | | | | | | | |
Chemicals — 1.0% | | | | | | | | | | | | | | | | |
Hitachi Chemical Co. Ltd. (Japan) | | | 4,300 | | | | 100,868 | | | | 100,521 | | | | (347 | ) |
Kuraray Co. Ltd. (Japan) | | | 6,900 | | | | 104,879 | | | | 104,608 | | | | (271 | ) |
Mitsubishi Chemical Holdings Corp. (Japan) | | | 16,200 | | | | 106,744 | | | | 106,368 | | | | (376 | ) |
Mitsubishi Gas Chemical Co., Inc. (Japan) | | | 6,900 | | | | 106,457 | | | | 106,196 | | | | (261 | ) |
Mitsui Chemicals, Inc. (Japan) | | | 21,000 | | | | 103,729 | | | | 103,418 | | | | (311 | ) |
Teijin Ltd. (Japan) | | | 1,000 | | | | 19,386 | | | | 19,321 | | | | (65 | ) |
| | | | | | | | | | | | | | | | |
| | | 56,300 | | | | 542,063 | | | | 540,432 | | | | (1,631 | ) |
| | | | | | | | | | | | | | | | |
Metals & Mining — 0.4% | | | | | | | | | | | | | | | | |
Fortescue Metals Group Ltd. (Australia) | | | 26,791 | | | | 112,090 | | | | 112,432 | | | | 342 | |
Glencore plc (Jersey) | | | 7,370 | | | | 22,552 | | | | 22,560 | | | | 8 | |
Rio Tinto Ltd. (Australia) | | | 2,561 | | | | 105,551 | | | | 105,960 | | | | 409 | |
Rio Tinto plc (United Kingdom) | | | 694 | | | | 24,120 | | | | 24,134 | | | | 14 | |
| | | | | | | | | | | | | | | | |
| | | 37,416 | | | | 264,313 | | | | 265,086 | | | | 773 | |
| | | | | | | | | | | | | | | | |
Total Materials | | | 93,716 | | | | 806,376 | | | | 805,518 | | | | (858 | ) |
| | | | | | | | | | | | | | | | |
Real Estate — 0.0% (b) | | | | | | | | | | | | | | | | |
Industrial Real Estate Investment Trusts — 0.0% (b) | | | | | | | | | | | | | | | | |
Swiss Prime Site AG (Switzerland) | | | 235 | | | | 19,486 | | | | 19,491 | | | | 5 | |
| | | | | | | | | | | | | | | | |
Total Real Estate | | | 235 | | | | 19,486 | | | | 19,491 | | | | 5 | |
| | | | | | | | | | | | | | | | |
Telecommunication Services — 0.4% | | | | | | | | | | | | | | | | |
Wireless Telecommunication Services — 0.4% | | | | | | | | | | | | | | | | |
KDDI Corp. (Japan) | | | 3,300 | | | | 100,445 | | | | 100,298 | | | | (147 | ) |
NTT DOCOMO, Inc. (Japan) | | | 4,100 | | | | 103,232 | | | | 102,967 | | | | (265 | ) |
| | | | | | | | | | | | | | | | |
| | | 7,400 | | | | 203,677 | | | | 203,265 | | | | (412 | ) |
| | | | | | | | | | | | | | | | |
Total Telecommunication Services | | | 7,400 | | | | 203,677 | | | | 203,265 | | | | (412 | ) |
| | | | | | | | | | | | | | | | |
Utilities — 0.4% | | | | | | | | | | | | | | | | |
Electric Utilities — 0.2% | | | | | | | | | | | | | | | | |
Chubu Electric Power Co., Inc. (Japan) | | | 7,200 | | | | 106,040 | | | | 105,994 | | | | (46 | ) |
SSE plc (United Kingdom) | | | 1,030 | | | | 20,059 | | | | 20,027 | | | | (32 | ) |
| | | | | | | | | | | | | | | | |
| | | 8,230 | | | | 126,099 | | | | 126,021 | | | | (78 | ) |
| | | | | | | | | | | | | | | | |
Multi-Utilities — 0.2% | | | | | | | | | | | | | | | | |
AGL Energy Ltd. (Australia) | | | 6,802 | | | | 99,242 | | | | 99,088 | | | | (154 | ) |
Centrica plc (United Kingdom) | | | 6,876 | | | | 18,028 | | | | 18,010 | | | | (18 | ) |
| | | | | | | | | | | | | | | | |
| | | 13,678 | | | | 117,270 | | | | 117,098 | | | | (172 | ) |
| | | | | | | | | | | | | | | | |
Total Utilities | | | 21,908 | | | | 243,369 | | | | 243,119 | | | | (250 | ) |
| | | | | | | | | | | | | | | | |
Total Long Positions of Total Return Basket Swap | | | 432,711 | | | | 5,628,697 | | | | 5,618,113 | | | | (10,584 | ) |
| | | | | | | | | | | | | | | | |
SEE NOTES TO CONSOLIDATED FINANCIAL STATEMENTS.
| | | | | | |
| | | |
| 16 | | | | JPMORGAN EXCHANGE-TRADED FUNDS | | OCTOBER 31, 2016 |
| | | | | | | | | | | | | | | | |
TOTAL RETURN BASKET
SWAP POSITIONS | | SHARES | | | NOTIONAL
VALUE($) (1) | | | CURRENT
VALUE($) (2) | | | VALUE($) (3) | |
Short Positions | | | | | | | | | | | | | | | | |
| | | | |
Common Stocks | | | | | | | | | | | | | | | | |
Consumer Discretionary — (6.5)% | | | | | | | | | | | | | | | | |
Auto Components — (0.1)% | | | | | | | | | | | | | | | | |
NGK Spark Plug Co. Ltd. (Japan) | | | 3,600 | | | | 71,265 | | | | 71,443 | | | | (178 | ) |
| | | | | | | | | | | | | | | | |
Automobiles — (0.1)% | | | | | | | | | | | | | | | | |
Yamaha Motor Co. Ltd. (Japan) | | | 3,200 | | | | 71,250 | | | | 71,088 | | | | 162 | |
| | | | | | | | | | | | | | | | |
Hotels, Restaurants & Leisure — (1.3)% | | | | | | | | | | | | | | | | |
Accor S.A. (France) | | | 1,816 | | | | 68,946 | | | | 68,911 | | | | 35 | |
Chipotle Mexican Grill, Inc. (a) | | | 161 | | | | 58,082 | | | | 58,082 | | | | — | |
Domino’s Pizza Enterprises Ltd. (Australia) | | | 1,259 | | | | 61,533 | | | | 61,333 | | | | 200 | |
Las Vegas Sands Corp. | | | 1,138 | | | | 65,867 | | | | 65,867 | | | | — | |
Merlin Entertainments plc (United Kingdom) (c) | | | 11,914 | | | | 67,198 | | | | 67,146 | | | | 52 | |
MGM Resorts International (a) | | | 2,536 | | | | 66,367 | | | | 66,367 | | | | — | |
Norwegian Cruise Line Holdings Ltd. (Bermuda) (a) | | | 1,749 | | | | 67,984 | | | | 67,984 | | | | — | |
Starbucks Corp. | | | 1,248 | | | | 66,231 | | | | 66,231 | | | | — | |
TUI AG (Germany) | | | 5,061 | | | | 64,239 | | | | 64,152 | | | | 87 | |
Whitbread plc (United Kingdom) | | | 1,395 | | | | 61,726 | | | | 61,625 | | | | 101 | |
Wynn Resorts Ltd. | | | 570 | | | | 53,894 | | | | 53,894 | | | | — | |
| | | | | | | | | | | | | | | | |
| | | 28,847 | | | | 702,067 | | | | 701,592 | | | | 475 | |
| | | | | | | | | | | | | | | | |
Internet & Catalog Retail — (0.7)% | | | | | | | | | | | | | | | | |
Expedia, Inc. | | | 557 | | | | 71,981 | | | | 71,981 | | | | — | |
Netflix, Inc. (a) | | | 659 | | | | 82,289 | | | | 82,289 | | | | — | |
Rakuten, Inc. (Japan) | | | 5,200 | | | | 60,122 | | | | 59,949 | | | | 173 | |
TripAdvisor, Inc. (a) | | | 1,064 | | | | 68,607 | | | | 68,607 | | | | — | |
Zalando SE (Germany) (a) (c) | | | 1,584 | | | | 69,536 | | | | 69,656 | | | | (120 | ) |
| | | | | | | | | | | | | | | | |
| | | 9,064 | | | | 352,535 | | | | 352,482 | | | | 53 | |
| | | | | | | | | | | | | | | | |
Leisure Products — (0.3)% | | | | | | | | | | | | | | | | |
Polaris Industries, Inc. | | | 876 | | | | 67,110 | | | | 67,110 | | | | — | |
Shimano, Inc. (Japan) | | | 400 | | | | 68,504 | | | | 68,392 | | | | 112 | |
| | | | | | | | | | | | | | | | |
| | | 1,276 | | | | 135,614 | | | | 135,502 | | | | 112 | |
| | | | | | | | | | | | | | | | |
Media — (0.9)% | | | | | | | | | | | | | | | | |
Charter Communications, Inc. (a) | | | 258 | | | | 64,472 | | | | 64,472 | | | | — | |
Dentsu, Inc. (Japan) | | | 1,300 | | | | 64,957 | | | | 64,804 | | | | 153 | |
DISH Network Corp. (a) | | | 1,160 | | | | 67,930 | | | | 67,930 | | | | — | |
JCDecaux S.A. (France) | | | 2,139 | | | | 65,406 | | | | 65,415 | | | | (9 | ) |
Liberty Broadband Corp. (a) | | | 979 | | | | 65,250 | | | | 65,250 | | | | — | |
Telenet Group Holding NV (Belgium) (a) | | | 1,271 | | | | 68,040 | | | | 68,052 | | | | (12 | ) |
Vivendi S.A. (France) | | | 3,282 | | | | 66,364 | | | | 66,430 | | | | (66 | ) |
| | | | | | | | | | | | | | | | |
| | | 10,389 | | | | 462,419 | | | | 462,353 | | | | 66 | |
| | | | | | | | | | | | | | | | |
Multiline Retail — (0.9)% | | | | | | | | | | | | | | | | |
Dollar Tree, Inc. (a) | | | 845 | | | | 63,840 | | | | 63,840 | | | | — | |
Don Quijote Holdings Co. Ltd. (Japan) | | | 1,700 | | | | 64,762 | | | | 64,617 | | | | 145 | |
Isetan Mitsukoshi Holdings Ltd. (Japan) | | | 6,600 | | | | 66,837 | | | | 66,703 | | | | 134 | |
J Front Retailing Co. Ltd. (Japan) | | | 5,100 | | | | 70,370 | | | | 70,208 | | | | 162 | |
Marui Group Co. Ltd. (Japan) | | | 5,000 | | | | 70,325 | | | | 70,143 | | | | 182 | |
Next plc (United Kingdom) | | | 1,167 | | | | 68,792 | | | | 68,659 | | | | 133 | |
Takashimaya Co. Ltd. (Japan) | | | 8,000 | | | | 65,376 | | | | 65,248 | | | | 128 | |
| | | | | | | | | | | | | | | | |
| | | 28,412 | | | | 470,302 | | | | 469,418 | | | | 884 | |
| | | | | | | | | | | | | | | | |
Specialty Retail — (0.9)% | | | | | | | | | | | | | | | | |
Advance Auto Parts, Inc. | | | 450 | | | | 63,036 | | | | 63,036 | | | | — | |
CarMax, Inc. (a) | | | 1,283 | | | | 64,073 | | | | 64,073 | | | | — | |
Dufry AG (Switzerland) (a) | | | 532 | | | | 64,729 | | | | 64,722 | | | | 7 | |
SEE NOTES TO CONSOLIDATED FINANCIAL STATEMENTS.
| | | | | | | | |
| | | |
| OCTOBER 31, 2016 | | JPMORGAN EXCHANGE-TRADED FUNDS | | | | | 17 | |
JPMorgan Diversified Alternatives ETF
CONSOLIDATED SCHEDULE OF PORTFOLIO INVESTMENTS
ADDITIONAL INFORMATION-TOTAL RETURN BASKET SWAPS
AS OF OCTOBER 31, 2016 (continued)
| | | | | | | | | | | | | | | | |
TOTAL RETURN BASKET
SWAP POSITIONS | | SHARES | | | NOTIONAL
VALUE($) (1) | | | CURRENT
VALUE($) (2) | | | VALUE($) (3) | |
Short Positions — continued | | | | | | | | | | | | | | | | |
| | | | |
Common Stocks — continued | | | | | | | | | | | | | | | | |
Specialty Retail — continued | | | | | | | | | | | | | | | | |
L Brands, Inc. | | | 909 | | | | 65,621 | | | | 65,621 | | | | — | |
Tractor Supply Co. | | | 981 | | | | 61,440 | | | | 61,440 | | | | — | |
Ulta Salon Cosmetics & Fragrance, Inc. (a) | | | 248 | | | | 60,348 | | | | 60,348 | | | | — | |
USS Co. Ltd. (Japan) | | | 4,000 | | | | 67,818 | | | | 67,650 | | | | 168 | |
| | | | | | | | | | | | | | | | |
| | | 8,403 | | | | 447,065 | | | | 446,890 | | | | 175 | |
| | | | | | | | | | | | | | | | |
Textiles, Apparel & Luxury Goods — (1.3)% | | | | | | | | | | | | | | | | |
Asics Corp. (Japan) | | | 3,300 | | | | 70,549 | | | | 70,419 | | | | 130 | |
Cie Financiere Richemont S.A. (Switzerland) | | | 980 | | | | 63,036 | | | | 63,004 | | | | 32 | |
Crocs, Inc. (a) | | | 7,952 | | | | 61,151 | | | | 61,151 | | | | — | |
Gildan Activewear, Inc. (Canada) | | | 2,415 | | | | 62,027 | | | | 62,027 | | | | — | |
Hanesbrands, Inc. | | | 2,676 | | | | 68,773 | | | | 68,773 | | | | — | |
HUGO BOSS AG (Germany) | | | 1,132 | | | | 71,093 | | | | 71,181 | | | | (88 | ) |
Luxottica Group SpA (Italy) | | | 1,441 | | | | 71,737 | | | | 71,751 | | | | (14 | ) |
NIKE, Inc. | | | 1,270 | | | | 63,729 | | | | 63,729 | | | | — | |
Ted Baker plc (United Kingdom) | | | 2,110 | | | | 63,921 | | | | 63,921 | | | | — | |
Under Armour, Inc. (a) | | | 1,731 | | | | 53,834 | | | | 53,834 | | | | — | |
| | | | | | | | | | | | | | | | |
| | | 25,007 | | | | 649,850 | | | | 649,790 | | | | 60 | |
| | | | | | | | | | | | | | | | |
Total Consumer Discretionary | | | 118,198 | | | | 3,362,367 | | | | 3,360,558 | | | | 1,809 | |
| | | | | | | | | | | | | | | | |
Consumer Staples — (1.8)% | | | | | | | | | | | | | | | | |
Beverages — (0.1)% | | | | | | | | | | | | | | | | |
Brown-Forman Corp. | | | 1,440 | | | | 66,485 | | | | 66,485 | | | | — | |
| | | | | | | | | | | | | | | | |
Food & Staples Retailing — (0.5)% | | | | | | | | | | | | | | | | |
Aeon Co. Ltd. (Japan) | | | 4,800 | | | | 66,505 | | | | 66,334 | | | | 171 | |
Costco Wholesale Corp. | | | 440 | | | | 65,063 | | | | 65,063 | | | | — | |
Distribuidora Internacional de Alimentacion S.A. (Spain) | | | 10,999 | | | | 58,886 | | | | 58,747 | | | | 139 | |
Woolworths Ltd. (Australia) | | | 3,563 | | | | 64,100 | | | | 63,942 | | | | 158 | |
| | | | | | | | | | | | | | | | |
| | | 19,802 | | | | 254,554 | | | | 254,086 | | | | 468 | |
| | | | | | | | | | | | | | | | |
Food Products — (0.7)% | | | | | | | | | | | | | | | | |
Associated British Foods plc (United Kingdom) | | | 2,191 | | | | 66,027 | | | | 65,904 | | | | 123 | |
Barry Callebaut AG (Switzerland) (a) | | | 51 | | | | 63,495 | | | | 63,511 | | | | (16 | ) |
Calbee, Inc. (Japan) | | | 1,900 | | | | 69,028 | | | | 68,935 | | | | 93 | |
Nissin Foods Holdings Co. Ltd. (Japan) | | | 1,100 | | | | 63,774 | | | | 63,667 | | | | 107 | |
Yakult Honsha Co. Ltd. (Japan) | | | 1,500 | | | | 70,087 | | | | 69,935 | | | | 152 | |
| | | | | | | | | | | | | | | | |
| | | 6,742 | | | | 332,411 | | | | 331,952 | | | | 459 | |
| | | | | | | | | | | | | | | | |
Household Products — (0.1)% | | | | | | | | | | | | | | | | |
Unicharm Corp. (Japan) | | | 2,800 | | | | 66,709 | | | | 66,582 | | | | 127 | |
| | | | | | | | | | | | | | | | |
Personal Products — (0.4)% | | | | | | | | | | | | | | | | |
Beiersdorf AG (Germany) | | | 735 | | | | 64,709 | | | | 64,797 | | | | (88 | ) |
Edgewell Personal Care Co. | | | 860 | | | | 64,844 | | | | 64,844 | | | | — | |
Kose Corp. (Japan) | | | 700 | | | | 64,013 | | | | 63,862 | | | | 151 | |
| | | | | | | | | | | | | | | | |
| | | 2,295 | | | | 193,566 | | | | 193,503 | | | | 63 | |
| | | | | | | | | | | | | | | | |
Total Consumer Staples | | | 33,079 | | | | 913,725 | | | | 912,608 | | | | 1,117 | |
| | | | | | | | | | | | | | | | |
Energy — (2.0)% | | | | | | | | | | | | | | | | |
Energy Equipment & Services — (0.2)% | | | | | | | | | | | | | | | | |
Saipem SpA (Italy) | | | 144,965 | | | | 59,676 | | | | 59,612 | | | | 64 | |
Weatherford International plc (Ireland) (a) | | | 10,754 | | | | 51,834 | | | | 51,834 | | | | — | |
| | | | | | | | | | | | | | | | |
| | | 155,719 | | | | 111,510 | | | | 111,446 | | | | 64 | |
| | | | | | | | | | | | | | | | |
SEE NOTES TO CONSOLIDATED FINANCIAL STATEMENTS.
| | | | | | |
| | | |
| 18 | | | | JPMORGAN EXCHANGE-TRADED FUNDS | | OCTOBER 31, 2016 |
| | | | | | | | | | | | | | | | |
TOTAL RETURN BASKET
SWAP POSITIONS | | SHARES | | | NOTIONAL
VALUE($) (1) | | | CURRENT
VALUE($) (2) | | | VALUE($) (3) | |
Short Positions — continued | | | | | | | | | | | | | | | | |
| | | | |
Common Stocks — continued | | | | | | | | | | | | | | | | |
Oil, Gas & Consumable Fuels — (1.8)% | | | | | | | | | | | | | | | | |
Anadarko Petroleum Corp. | | | 1,031 | | | | 61,283 | | | | 61,283 | | | | — | |
Antero Resources Corp. (a) | | | 2,375 | | | | 62,866 | | | | 62,866 | | | | — | |
Apache Corp. | | | 1,065 | | | | 63,346 | | | | 63,346 | | | | — | |
Cheniere Energy, Inc. (a) | | | 1,593 | | | | 60,056 | | | | 60,056 | | | | — | |
Concho Resources, Inc. (a) | | | 478 | | | | 60,677 | | | | 60,677 | | | | — | |
ConocoPhillips | | | 1,568 | | | | 68,130 | | | | 68,130 | | | | — | |
Continental Resources, Inc. (a) | | | 1,258 | | | | 61,529 | | | | 61,529 | | | | — | |
Enbridge, Inc. (Canada) | | | 1,494 | | | | 64,514 | | | | 64,514 | | | | — | |
Equities Corp. | | | 939 | | | | 61,974 | | | | 61,974 | | | | — | |
Hess Corp. | | | 1,271 | | | | 60,970 | | | | 60,970 | | | | — | |
Inpex Corp. (Japan) | | | 6,700 | | | | 62,968 | | | | 62,502 | | | | 466 | |
Kinder Morgan, Inc. | | | 3,216 | | | | 65,703 | | | | 65,703 | | | | — | |
Marathon Oil Corp. | | | 4,471 | | | | 58,928 | | | | 58,928 | | | | — | |
Noble Energy, Inc. | | | 1,864 | | | | 64,252 | | | | 64,252 | | | | — | |
Prairiesky Royalty Ltd. (Canada) | | | 3,052 | | | | 66,374 | | | | 66,374 | | | | — | |
| | | | | | | | | | | | | | | | |
| | | 32,375 | | | | 943,570 | | | | 943,104 | | | | 466 | |
| | | | | | | | | | | | | | | | |
Total Energy | | | 188,094 | | | | 1,055,080 | | | | 1,054,550 | | | | 530 | |
| | | | | | | | | | | | | | | | |
Financials — (2.0)% | | | | | | | | | | | | | | | | |
Banks — (0.5)% | | | | | | | | | | | | | | | | |
Banco Popular Espanol S.A. (Spain) | | | 57,860 | | | | 63,453 | | | | 63,307 | | | | 146 | |
Royal Bank of Scotland Group plc (United Kingdom) (a) | | | 31,111 | | | | 72,009 | | | | 71,895 | | | | 114 | |
Seven Bank Ltd. (Japan) | | | 21,800 | | | | 67,145 | | | | 67,018 | | | | 127 | |
Signature Bank NY (a) | | | 563 | | | | 67,875 | | | | 67,875 | | | | — | |
| | | | | | | | | | | | | | | | |
| | | 111,334 | | | | 270,482 | | | | 270,095 | | | | 387 | |
| | | | | | | | | | | | | | | | |
Capital Markets — (1.0)% | | | | | | | | | | | | | | | | |
Affiliated Managers Group, Inc. (a) | | | 454 | | | | 60,228 | | | | 60,228 | | | | — | |
Charles Schwab Corp. | | | 2,103 | | | | 66,665 | | | | 66,665 | | | | — | |
Deutsche Bank AG (Germany) | | | 4,849 | | | | 70,024 | | | | 70,125 | | | | (101 | ) |
Hargreaves Lansdown plc (United Kingdom) | | | 4,512 | | | | 64,063 | | | | 63,965 | | | | 98 | |
Julius Baer Group Ltd. (Switzerland) | | | 1,629 | | | | 66,029 | | | | 65,944 | | | | 85 | |
Moody’s Corp. | | | 620 | | | | 62,322 | | | | 62,322 | | | | — | |
Platinum Asset Management Ltd. (Australia) | | | 17,300 | | | | 65,669 | | | | 65,519 | | | | 150 | |
TD Ameritrade Holding Corp. | | | 1,852 | | | | 63,357 | | | | 63,357 | | | | — | |
| | | | | | | | | | | | | | | | |
| | | 33,319 | | | | 518,357 | | | | 518,125 | | | | 232 | |
| | | | | | | | | | | | | | | | |
Consumer Finance — (0.3)% | | | | | | | | | | | | | | | | |
Acom Co. Ltd. (Japan) (a) | | | 14,800 | | | | 68,306 | | | | 68,103 | | | | 203 | |
Provident Financial plc (United Kingdom) | | | 1,777 | | | | 64,164 | | | | 64,062 | | | | 102 | |
| | | | | | | | | | | | | | | | |
| | | 16,577 | | | | 132,470 | | | | 132,165 | | | | 305 | |
| | | | | | | | | | | | | | | | |
Diversified Financial Services — (0.1)% | | | | | | | | | | | | | | | | |
ONEX Corp. (Canada) | | | 1,047 | | | | 67,724 | | | | 67,724 | | | | — | |
| | | | | | | | | | | | | | | | |
Insurance — (0.1)% | | | | | | | | | | | | | | | | |
St. James’s Place plc (United Kingdom) | | | 5,789 | | | | 66,960 | | | | 66,856 | | | | 104 | |
| | | | | | | | | | | | | | | | |
Total Financials | | | 168,066 | | | | 1,055,993 | | | | 1,054,965 | | | | 1,028 | |
| | | | | | | | | | | | | | | | |
Health Care — (1.9)% | | | | | | | | | | | | | | | | |
Health Care Equipment & Services — (0.1)% | | | | | | | | | | | | | | | | |
Insulet Corp. (a) | | | 1,710 | | | | 63,475 | | | | 63,475 | | | | — | |
| | | | | | | | | | | | | | | | |
Health Care Equipment & Supplies — (0.4)% | | | | | | | | | | | | | | | | |
AtriCure, Inc. (a) | | | 4,005 | | | | 73,051 | | | | 73,051 | | | | — | |
Olympus Corp. (Japan) | | | 1,900 | | | | 67,942 | | | | 67,727 | | | | 215 | |
SEE NOTES TO CONSOLIDATED FINANCIAL STATEMENTS.
| | | | | | | | |
| | | |
| OCTOBER 31, 2016 | | JPMORGAN EXCHANGE-TRADED FUNDS | | | | | 19 | |
JPMorgan Diversified Alternatives ETF
CONSOLIDATED SCHEDULE OF PORTFOLIO INVESTMENTS
ADDITIONAL INFORMATION-TOTAL RETURN BASKET SWAPS
AS OF OCTOBER 31, 2016 (continued)
| | | | | | | | | | | | | | | | |
TOTAL RETURN BASKET
SWAP POSITIONS | | SHARES | | | NOTIONAL
VALUE($) (1) | | | CURRENT
VALUE($) (2) | | | VALUE($) (3) | |
Short Positions — continued | | | | | | | | | | | | | | | | |
| | | | |
Common Stocks — continued | | | | | | | | | | | | | | | | |
Health Care Equipment & Supplies — continued | | | | | | | | | | | | | | | | |
Sysmex Corp. (Japan) | | | 900 | | | | 62,563 | | | | 62,372 | | | | 191 | |
| | | | | | | | | | | | | | | | |
| | | 6,805 | | | | 203,556 | | | | 203,150 | | | | 406 | |
| | | | | | | | | | | | | | | | |
Health Care Providers & Services — (0.2)% | | | | | | | | | | | | | | | | |
Healthscope Ltd. (Australia) | | | 29,322 | | | | 49,294 | | | | 49,187 | | | | 107 | |
Korian S.A. (France) | | | 2,098 | | | | 64,268 | | | | 64,260 | | | | 8 | |
| | | | | | | | | | | | | | | | |
| | | 31,420 | | | | 113,562 | | | | 113,447 | | | | 115 | |
| | | | | | | | | | | | | | | | |
Life Sciences Tools & Services — (0.1)% | | | | | | | | | | | | | | | | |
Quintiles Transnational Holdings, Inc. (a) | | | 873 | | | | 62,629 | | | | 62,629 | | | | — | |
| | | | | | | | | | | | | | | | |
Pharmaceuticals — (1.1)% | | | | | | | | | | | | | | | | |
Aerie Pharmaceuticals, Inc. (a) | | | 1,693 | | | | 56,292 | | | | 56,292 | | | | — | |
Dermira, Inc. (a) | | | 1,981 | | | | 62,104 | | | | 62,104 | | | | — | |
Eisai Co. Ltd. (Japan) | | | 1,100 | | | | 70,257 | | | | 70,101 | | | | 156 | |
Endo International plc (Ireland) (a) | | | 3,336 | | | | 62,550 | | | | 62,550 | | | | — | |
Nektar Therapeutics (a) | | | 4,110 | | | | 50,964 | | | | 50,964 | | | | — | |
Takeda Pharmaceutical Co. Ltd. (Japan) | | | 1,400 | | | | 62,744 | | | | 62,615 | | | | 129 | |
Therapeutics MD, Inc. (a) | | | 10,407 | | | | 59,736 | | | | 59,736 | | | | — | |
UCB S.A. (Belgium) | | | 904 | | | | 61,220 | | | | 61,176 | | | | 44 | |
Zoetis, Inc. | | | 1,295 | | | | 61,901 | | | | 61,901 | | | | — | |
| | | | | | | | | | | | | | | | |
| | | 26,226 | | | | 547,768 | | | | 547,439 | | | | 329 | |
| | | | | | | | | | | | | | | | |
Total Health Care | | | 67,034 | | | | 990,990 | | | | 990,140 | | | | 850 | |
| | | | | | | | | | | | | | | | |
Industrials — (4.6)% | | | | | | | | | | | | | | | | |
Aerospace & Defense — (0.6)% | | | | | | | | | | | | | | | | |
Airbus Group SE (Netherlands) | | | 1,144 | | | | 68,003 | | | | 67,931 | | | | 72 | |
Cobham plc (United Kingdom) | | | 32,416 | | | | 56,699 | | | | 56,558 | | | | 141 | |
Leonardo-Finmeccanica SpA (Italy) (a) | | | 5,906 | | | | 71,965 | | | | 71,914 | | | | 51 | |
Rolls-Royce Holdings plc (United Kingdom) | | | 7,114 | | | | 63,261 | | | | 63,149 | | | | 112 | |
TransDigm Group, Inc. | | | 237 | | | | 64,573 | | | | 64,573 | | | | — | |
| | | | | | | | | | | | | | | | |
| | | 46,817 | | | | 324,501 | | | | 324,125 | | | | 376 | |
| | | | | | | | | | | | | | | | |
Air Freight & Logistics — (0.1)% | | | | | | | | | | | | | | | | |
Yamato Holdings Co. Ltd. (Japan) | | | 2,900 | | | | 66,230 | | | | 66,071 | | | | 159 | |
| | | | | | | | | | | | | | | | |
Airlines — (0.1)% | | | | | | | | | | | | | | | | |
American Airlines Group, Inc. | | | 1,684 | | | | 68,370 | | | | 68,370 | | | | — | |
| | | | | | | | | | | | | | | | |
Commercial Services & Supplies — (0.4)% | | | | | | | | | | | | | | | | |
G4S plc (United Kingdom) | | | 22,542 | | | | 60,702 | | | | 60,551 | | | | 151 | |
Sohgo Security Services Co. Ltd. (Japan) | | | 1,300 | | | | 59,378 | | | | 59,206 | | | | 172 | |
Stericycle, Inc. (a) | | | 888 | | | | 71,120 | | | | 71,120 | | | | — | |
| | | | | | | | | | | | | | | | |
| | | 24,730 | | | | 191,200 | | | | 190,877 | | | | 323 | |
| | | | | | | | | | | | | | | | |
Construction & Engineering — (0.3)% | | | | | | | | | | | | | | | | |
Ferrovial S.A. (Spain) | | | 3,259 | | | | 63,413 | | | | 63,316 | | | | 97 | |
JGC Corp. (Japan) | | | 3,800 | | | | 67,361 | | | | 67,175 | | | | 186 | |
| | | | | | | | | | | | | | | | |
| | | 7,059 | | | | 130,774 | | | | 130,491 | | | | 283 | |
| | | | | | | | | | | | | | | | |
Electrical Equipment — (0.4)% | | | | | | | | | | | | | | | | |
AMETEK, Inc. | | | 1,446 | | | | 63,769 | | | | 63,769 | | | | — | |
Mabuchi Motor Co. Ltd. (Japan) | | | 1,200 | | | | 69,915 | | | | 69,757 | | | | 158 | |
Nidec Corp. (Japan) | | | 700 | | | | 67,884 | | | | 67,732 | | | | 152 | |
| | | | | | | | | | | | | | | | |
| | | 3,346 | | | | 201,568 | | | | 201,258 | | | | 310 | |
| | | | | | | | | | | | | | | | |
Industrial Conglomerates — (0.2)% | | | | | | | | | | | | | | | | |
Keihan Holdings Co. Ltd. (Japan) | | | 8,000 | | | | 54,086 | | | | 54,013 | | | | 73 | |
SEE NOTES TO CONSOLIDATED FINANCIAL STATEMENTS.
| | | | | | |
| | | |
| 20 | | | | JPMORGAN EXCHANGE-TRADED FUNDS | | OCTOBER 31, 2016 |
| | | | | | | | | | | | | | | | |
TOTAL RETURN BASKET
SWAP POSITIONS | | SHARES | | | NOTIONAL
VALUE($) (1) | | | CURRENT
VALUE($) (2) | | | VALUE($) (3) | |
Short Positions — continued | | | | | | | | | | | | | | | | |
| | | | |
Common Stocks — continued | | | | | | | | | | | | | | | | |
Industrial Conglomerates — continued | | | | | | | | | | | | | | | | |
Roper Technologies, Inc. | | | 380 | | | | 65,858 | | | | 65,858 | | | | — | |
| | | | | | | | | | | | | | | | |
| | | 8,380 | | | | 119,944 | | | | 119,871 | | | | 73 | |
| | | | | | | | | | | | | | | | |
Machinery — (0.9)% | | | | | | | | | | | | | | | | |
Alstom S.A. (France) | | | 2,478 | | | | 66,564 | | | | 66,588 | | | | (24 | ) |
Andritz AG (Austria) | | | 1,279 | | | | 66,902 | | | | 66,873 | | | | 29 | |
FANUC Corp. (Japan) | | | 400 | | | | 75,064 | | | | 73,235 | | | | 1,829 | |
Flowserve Corp. | | | 1,513 | | | | 64,076 | | | | 64,076 | | | | — | |
Meritor, Inc. (a) | | | 6,102 | | | | 62,729 | | | | 62,729 | | | | — | |
Minebea Co. Ltd. (Japan) | | | 6,800 | | | | 69,640 | | | | 69,390 | | | | 250 | |
Wartsila OYJ Abp (Finland) | | | 1,481 | | | | 64,056 | | | | 64,001 | | | | 55 | |
| | | | | | | | | | | | | | | | |
| | | 20,053 | | | | 469,031 | | | | 466,892 | | | | 2,139 | |
| | | | | | | | | | | | | | | | |
Marine — (0.1)% | | | | | | | | | | | | | | | | |
Nippon Yusen KK (Japan) | | | 34,000 | | | | 69,705 | | | | 69,581 | | | | 124 | |
| | | | | | | | | | | | | | | | |
Professional Services — (0.3)% | | | | | | | | | | | | | | | | |
Capita plc (United Kingdom) | | | 9,100 | | | | 65,271 | | | | 65,137 | | | | 134 | |
Verisk Analytics, Inc. (a) | | | 833 | | | | 67,931 | | | | 67,931 | | | | — | |
| | | | | | | | | | | | | | | | |
| | | 9,933 | | | | 133,202 | | | | 133,068 | | | | 134 | |
| | | | | | | | | | | | | | | | |
Road & Rail — (0.8)% | | | | | | | | | | | | | | | | |
AMERCO | | | 199 | | | | 64,156 | | | | 64,156 | | | | — | |
Europcar Groupe S.A. (France) (a) (c) | | | 7,037 | | | | 65,399 | | | | 65,416 | | | | (17 | ) |
Keio Corp. (Japan) | | | 8,000 | | | | 66,367 | | | | 66,213 | | | | 154 | |
Kintetsu Group Holdings Co. Ltd. (Japan) | | | 17,000 | | | | 68,733 | | | | 68,621 | | | | 112 | |
Odakyu Electric Railway Co. Ltd. (Japan) | | | 3,100 | | | | 63,407 | | | | 63,252 | | | | 155 | |
Tokyu Corp. (Japan) | | | 9,000 | | | | 67,541 | | | | 67,378 | | | | 163 | |
| | | | | | | | | | | | | | | | |
| | | 44,336 | | | | 395,603 | | | | 395,036 | | | | 567 | |
| | | | | | | | | | | | | | | | |
Trading Companies & Distributors — (0.1)% | | | | | | | | | | | | | | | | |
Rush Enterprises, Inc. (a) | | | 2,932 | | | | 76,965 | | | | 76,965 | | | | — | |
| | | | | | | | | | | | | | | | |
Transportation Infrastructure — (0.3)% | | | | | | | | | | | | | | | | |
Groupe Eurotunnel SE (France) | | | 7,157 | | | | 67,025 | | | | 66,985 | | | | 40 | |
Mitsubishi Logistics Corp. (Japan) | | | 5,000 | | | | 67,894 | | | | 67,683 | | | | 211 | |
| | | | | | | | | | | | | | | | |
| | | 12,157 | | | | 134,919 | | | | 134,668 | | | | 251 | |
| | | | | | | | | | | | | | | | |
Total Industrials | | | 218,327 | | | | 2,382,012 | | | | 2,377,273 | | | | 4,739 | |
| | | | | | | | | | | | | | | | |
Information Technology — (4.6)% | | | | | | | | | | | | | | | | |
Communications Equipment — (0.3)% | | | | | | | | | | | | | | | | |
Nokia OYJ (Finland) | | | 13,292 | | | | 59,357 | | | | 59,343 | | | | 14 | |
Palo Alto Networks, Inc. (a) | | | 437 | | | | 67,224 | | | | 67,224 | | | | — | |
| | | | | | | | | | | | | | | | |
| | | 13,729 | | | | 126,581 | | | | 126,567 | | | | 14 | |
| | | | | | | | | | | | | | | | |
Electronic Equipment, Instruments & Components — (0.9)% | | | | | | | | | | | | | | | | |
Hamamatsu Photonics KK (Japan) | | | 2,200 | | | | 66,711 | | | | 66,569 | | | | 142 | |
Hitachi Ltd. (Japan) | | | 13,000 | | | | 69,321 | | | | 69,302 | | | | 19 | |
Murata Manufacturing Co. Ltd. (Japan) | | | 500 | | | | 69,944 | | | | 69,821 | | | | 123 | |
Nippon Electric Glass Co. Ltd. (Japan) | | | 13,000 | | | | 70,783 | | | | 70,720 | | | | 63 | |
Taiyo Yuden Co. Ltd. (Japan) | | | 6,600 | | | | 70,613 | | | | 70,509 | | | | 104 | |
TDK Corp. (Japan) | | | 1,000 | | | | 69,228 | | | | 69,045 | | | | 183 | |
Yaskawa Electric Corp. (Japan) | | | 4,400 | | | | 70,361 | | | | 70,197 | | | | 164 | |
| | | | | | | | | | | | | | | | |
| | | 40,700 | | | | 486,961 | | | | 486,163 | | | | 798 | |
| | | | | | | | | | | | | | | | |
SEE NOTES TO CONSOLIDATED FINANCIAL STATEMENTS.
| | | | | | | | |
| | | |
| OCTOBER 31, 2016 | | JPMORGAN EXCHANGE-TRADED FUNDS | | | | | 21 | |
JPMorgan Diversified Alternatives ETF
CONSOLIDATED SCHEDULE OF PORTFOLIO INVESTMENTS
ADDITIONAL INFORMATION-TOTAL RETURN BASKET SWAPS
AS OF OCTOBER 31, 2016 (continued)
| | | | | | | | | | | | | | | | |
TOTAL RETURN BASKET
SWAP POSITIONS | | SHARES | | | NOTIONAL
VALUE($) (1) | | | CURRENT
VALUE($) (2) | | | VALUE($) (3) | |
Short Positions — continued | | | | | | | | | | | | | | | | |
| | | | |
Common Stocks — continued | | | | | | | | | | | | | | | | |
Internet Software & Services — (0.5)% | | | | | | | | | | | | | | | | |
SPS Commerce, Inc. (a) | | | 932 | | | | 58,138 | | | | 58,138 | | | | — | |
Yahoo Japan Corp. (Japan) | | | 17,100 | | | | 65,713 | | | | 65,596 | | | | 117 | |
Yahoo!, Inc. (a) | | | 1,588 | | | | 65,981 | | | | 65,981 | | | | — | |
Zillow Group, Inc. (a) | | | 2,061 | | | | 68,755 | | | | 68,755 | | | | — | |
| | | | | | | | | | | | | | | | |
| | | 21,681 | | | | 258,587 | | | | 258,470 | | | | 117 | |
| | | | | | | | | | | | | | | | |
IT Services — (0.4)% | | | | | | | | | | | | | | | | |
Sabre Corp. | | | 2,524 | | | | 65,195 | | | | 65,195 | | | | — | |
Wirecard AG (Germany) | | | 1,365 | | | | 64,755 | | | | 64,795 | | | | (40 | ) |
Worldpay Group plc (United Kingdom) (c) | | | 18,433 | | | | 64,257 | | | | 64,063 | | | | 194 | |
| | | | | | | | | | | | | | | | |
| | | 22,322 | | | | 194,207 | | | | 194,053 | | | | 154 | |
| | | | | | | | | | | | | | | | |
Semiconductors & Semiconductor Equipment — (0.4)% | | | | | | | | | | | | | | | | |
Cavium, Inc. (a) | | | 1,236 | | | | 69,772 | | | | 69,772 | | | | — | |
Infineon Technologies AG (Germany) | | | 3,811 | | | | 68,422 | | | | 68,542 | | | | (120 | ) |
STMicroelectronics NV (Netherlands) | | | 8,305 | | | | 79,317 | | | | 79,093 | | | | 224 | |
| | | | | | | | | | | | | | | | |
| | | 13,352 | | | | 217,511 | | | | 217,407 | | | | 104 | |
| | | | | | | | | | | | | | | | |
Software — (1.7)% | | | | | | | | | | | | | | | | |
Autodesk, Inc. (a) | | | 954 | | | | 68,955 | | | | 68,955 | | | | — | |
Constellation Software, Inc. (Canada) | | | 148 | | | | 69,333 | | | | 69,333 | | | | — | |
FireEye, Inc. (a) | | | 5,135 | | | | 59,669 | | | | 59,669 | | | | — | |
Fortinet, Inc. (a) | | | 2,119 | | | | 67,935 | | | | 67,935 | | | | — | |
HubSpot, Inc. (a) | | | 1,232 | | | | 64,618 | | | | 64,618 | | | | — | |
Mobileye NV (Netherlands) (a) | | | 1,767 | | | | 65,697 | | | | 65,697 | | | | — | |
Proofpoint, Inc. (a) | | | 943 | | | | 73,912 | | | | 73,912 | | | | — | |
PROS Holdings, Inc. (a) | | | 3,183 | | | | 69,771 | | | | 69,771 | | | | — | |
salesforce.com, Inc. (a) | | | 936 | | | | 70,350 | | | | 70,350 | | | | — | |
ServiceNow, Inc. (a) | | | 877 | | | | 77,097 | | | | 77,097 | | | | — | |
Splunk, Inc. (a) | | | 1,152 | | | | 69,339 | | | | 69,339 | | | | — | |
Trend Micro, Inc. (Japan) | | | 2,000 | | | | 70,565 | | | | 70,430 | | | | 135 | |
Workday, Inc. (a) | | | 758 | | | | 65,703 | | | | 65,703 | | | | — | |
| | | | | | | | | | | | | | | | |
| | | 21,204 | | | | 892,944 | | | | 892,809 | | | | 135 | |
| | | | | | | | | | | | | | | | |
Technology Hardware, Storage & Peripherals — (0.4)% | | | | | | | | | | | | | | | | |
Blackberry Ltd. (Canada) (a) | | | 8,819 | | | | 62,265 | | | | 62,265 | | | | — | |
Canon, Inc. (Japan) | | | 2,300 | | | | 66,168 | | | | 66,074 | | | | 94 | |
Ricoh Co. Ltd. (Japan) | | | 7,500 | | | | 61,219 | | | | 61,127 | | | | 92 | |
| | | | | | | | | | | | | | | | |
| | | 18,619 | | | | 189,652 | | | | 189,466 | | | | 186 | |
| | | | | | | | | | | | | | | | |
Total Information Technology | | | 151,607 | | | | 2,366,443 | | | | 2,364,935 | | | | 1,508 | |
| | | | | | | | | | | | | | | | |
Materials — (1.7)% | | | | | | | | | | | | | | | | |
Chemicals — (0.8)% | | | | | | | | | | | | | | | | |
Ashland Global Holdings, Inc. | | | 111 | | | | 12,402 | | | | 12,402 | | | | — | |
Axalta Coating Systems LT (Bermuda) (a) | | | 2,502 | | | | 62,850 | | | | 62,850 | | | | — | |
CF Industries Holdings, Inc. | | | 2,868 | | | | 68,861 | | | | 68,861 | | | | — | |
Methanex Corp. (Canada) | | | 1,793 | | | | 65,167 | | | | 65,167 | | | | — | |
OCI NV (Netherlands) (a) | | | 839 | | | | 11,651 | | | | 11,646 | | | | 5 | |
Potash Corp. of Saskatchewan (Canada) | | | 4,102 | | | | 66,700 | | | | 66,700 | | | | — | |
Symrise AG (Germany) | | | 945 | | | | 64,846 | | | | 64,898 | | | | (52 | ) |
WR Grace & Co. | | | 950 | | | | 63,612 | | | | 63,612 | | | | — | |
| | | | | | | | | | | | | | | | |
| | | 14,110 | | | | 416,089 | | | | 416,136 | | | | (47 | ) |
| | | | | | | | | | | | | | | | |
Containers & Packaging — (0.1)% | | | | | | | | | | | | | | | | |
Ball Corp. | | | 841 | | | | 64,816 | | | | 64,816 | | | | — | |
| | | | | | | | | | | | | | | | |
SEE NOTES TO CONSOLIDATED FINANCIAL STATEMENTS.
| | | | | | |
| | | |
| 22 | | | | JPMORGAN EXCHANGE-TRADED FUNDS | | OCTOBER 31, 2016 |
| | | | | | | | | | | | | | | | |
TOTAL RETURN BASKET
SWAP POSITIONS | | SHARES | | | NOTIONAL
VALUE($) (1) | | | CURRENT
VALUE($) (2) | | | VALUE($) (3) | |
Short Positions — continued | | | | | | | | | | | | | | | | |
| | | | |
Common Stocks — continued | | | | | | | | | | | | | | | | |
Metals & Mining — (0.8)% | | | | | | | | | | | | | | | | |
Alumina Ltd. (Australia) | | | 56,720 | | | | 68,172 | | | | 68,170 | | | | 2 | |
Antofagasta plc (United Kingdom) | | | 10,344 | | | | 68,750 | | | | 68,799 | | | | (49 | ) |
First Quantum Minerals Ltd. (Canada) | | | 6,524 | | | | 61,966 | | | | 61,966 | | | | — | |
Kobe Steel Ltd. (Japan) | | | 8,200 | | | | 67,871 | | | | 67,669 | | | | 202 | |
Silver Wheaton Corp. (Canada) | | | 2,871 | | | | 69,180 | | | | 69,180 | | | | — | |
thyssenkrupp AG (Germany) | | | 2,725 | | | | 63,088 | | | | 63,229 | | | | (141 | ) |
| | | | | | | | | | | | | | | | |
| | | 87,384 | | | | 399,027 | | | | 399,013 | | | | 14 | |
| | | | | | | | | | | | | | | | |
Total Materials | | | 102,335 | | | | 879,932 | | | | 879,965 | | | | (33 | ) |
| | | | | | | | | | | | | | | | |
Real Estate — (0.2)% | | | | | | | | | | | | | | | | |
Industrial Real Estate Investment Trusts — (0.2)% | | | | | | | | | | | | | | | | |
CBRE Group, Inc. (a) | | | 2,484 | | | | 63,988 | | | | 63,988 | | | | — | |
Realogy Holdings Corp. | | | 2,668 | | | | 61,070 | | | | 61,070 | | | | — | |
| | | | | | | | | | | | | | | | |
| | | 5,152 | | | | 125,058 | | | | 125,058 | | | | — | |
| | | | | | | | | | | | | | | | |
Total Real Estate | | | 5,152 | | | | 125,058 | | | | 125,058 | | | | — | |
| | | | | | | | | | | | | | | | |
Telecommunication Services — (0.5)% | | | | | | | | | | | | | | | | |
Diversified Telecommunication Services — (0.3)% | | | | | | | | | | | | | | | | |
Iliad S.A. (France) | | | 331 | | | | 69,438 | | | | 69,390 | | | | 48 | |
Inmarsat plc (United Kingdom) | | | 7,567 | | | | 64,973 | | | | 64,910 | | | | 63 | |
Telecom Italia SpA (Italy) | | | 15,291 | | | | 13,269 | | | | 13,292 | | | | (23 | ) |
| | | | | | | | | | | | | | | | |
| | | 23,189 | | | | 147,680 | | | | 147,592 | | | | 88 | |
| | | | | | | | | | | | | | | | |
Wireless Telecommunication Services — (0.2)% | | | | | | | | | | | | | | | | |
SoftBank Group Corp. (Japan) | | | 1,000 | | | | 62,954 | | | | 62,981 | | | | (27 | ) |
Sprint Corp. (a) | | | 9,761 | | | | 60,128 | | | | 60,128 | | | | — | |
| | | | | | | | | | | | | | | | |
| | | 10,761 | | | | 123,082 | | | | 123,109 | | | | (27 | ) |
| | | | | | | | | | | | | | | | |
Total Telecommunication Services | | | 33,950 | | | | 270,762 | | | | 270,701 | | | | 61 | |
| | | | | | | | | | | | | | | | |
Utilities — (1.9)% | | | | | | | | | | | | | | | | |
Electric Utilities — (0.6)% | | | | | | | | | | | | | | | | |
AusNet Services (Australia) | | | 57,284 | | | | 65,364 | | | | 65,250 | | | | 114 | |
Chugoku Electric Power Co., Inc. (Japan) | | | 5,600 | | | | 65,574 | | | | 65,528 | | | | 46 | |
Hokuriku Electric Power Co. (Japan) | | | 5,800 | | | | 65,980 | | | | 65,879 | | | | 101 | |
Hydro One Ltd. (Canada) (c) | | | 3,571 | | | | 65,148 | | | | 65,148 | | | | — | |
Shikoku Electric Power Co., Inc. (Japan) | | | 7,300 | | | | 68,775 | | | | 68,646 | | | | 129 | |
| | | | | | | | | | | | | | | | |
| | | 79,555 | | | | 330,841 | | | | 330,451 | | | | 390 | |
| | | | | | | | | | | | | | | | |
Independent Power and Renewable Electricity Producers — (0.2)% | | | | | | | | | | | | | | | | |
Calpine Corp. (a) | | | 5,076 | | | | 60,405 | | | | 60,405 | | | | — | |
NRG Energy, Inc. | | | 5,864 | | | | 62,334 | | | | 62,334 | | | | — | |
| | | | | | | | | | | | | | | | |
| | | 10,940 | | | | 122,739 | | | | 122,739 | | | | — | |
| | | | | | | | | | | | | | | | |
Multi-Utilities — (0.7)% | | | | | | | | | | | | | | | | |
Canadian Utilities Ltd. (Canada) | | | 2,357 | | | | 67,355 | | | | 67,355 | | | | — | |
Dominion Resources, Inc. | | | 901 | | | | 67,755 | | | | 67,755 | | | | — | |
RWE AG (Germany) | | | 4,242 | | | | 67,337 | | | | 67,488 | | | | (151 | ) |
Sempra Energy | | | 632 | | | | 67,687 | | | | 67,687 | | | | — | |
Suez (France) | | | 4,298 | | | | 68,059 | | | | 68,079 | | | | (20 | ) |
| | | | | | | | | | | | | | | | |
| | | 12,430 | | | | 338,193 | | | | 338,364 | | | | (171 | ) |
| | | | | | | | | | | | | | | | |
Water Utilities — (0.4)% | | | | | | | | | | | | | | | | |
American Water Works Co., Inc. | | | 921 | | | | 68,191 | | | | 68,191 | | | | — | |
Severn Trent plc (United Kingdom) | | | 2,303 | | | | 65,623 | | | | 65,557 | | | | 66 | |
SEE NOTES TO CONSOLIDATED FINANCIAL STATEMENTS.
| | | | | | | | |
| | | |
| OCTOBER 31, 2016 | | JPMORGAN EXCHANGE-TRADED FUNDS | | | | | 23 | |
JPMorgan Diversified Alternatives ETF
CONSOLIDATED SCHEDULE OF PORTFOLIO INVESTMENTS
ADDITIONAL INFORMATION-TOTAL RETURN BASKET SWAPS
AS OF OCTOBER 31, 2016 (continued)
| | | | | | | | | | | | | | | | |
TOTAL RETURN BASKET
SWAP POSITIONS | | SHARES | | | NOTIONAL
VALUE($) (1) | | | CURRENT
VALUE($) (2) | | | VALUE($) (3) | |
Short Positions — continued | | | | | | | | | | | | | | | | |
| | | | |
Common Stocks — continued | | | | | | | | | | | | | | | | |
Water Utilities — continued | | | | | | | | | | | | | | | | |
United Utilities Group plc (United Kingdom) | | | 5,716 | | | | 65,766 | | | | 65,705 | | | | 61 | |
| | | | | | | | | | | | | | | | |
| | | 8,940 | | | | 199,580 | | | | 199,453 | | | | 127 | |
| | | | | | | | | | | | | | | | |
Total Utilities | | | 111,865 | | | | 991,353 | | | | 991,007 | | | | 346 | |
| | | | | | | | | | | | | | | | |
Rights | | | | | | | | | | | | | | | | |
Industrials — 0.0% (b) | | | | | | | | | | | | | | | | |
Construction & Engineering — 0.0% (b) | | | | | | | | | | | | | | | | |
Ferrovail S.A. Rights (Spain) (a) | | | 3,259 | | | | 1,395 | | | | 1,395 | | | | — | |
| | | | | | | | | | | | | | | | |
Total Industrials | | | 3,259 | | | | 1,395 | | | | 1,395 | | | | — | |
| | | | | | | | | | | | | | | | |
Total Short Positions of Total Return Basket Swap | | | 1,200,966 | | | | 14,395,110 | | | | 14,383,155 | | | | 11,955 | |
| | | | | | | | | | | | | | | | |
Total of Long and Short Positions of Total Return Basket Swap | | | (768,255 | ) | | | (8,766,413 | ) | | | (8,765,042 | ) | | | 1,371 | |
| | | | | | | | | | | | | | | | |
Outstanding Swap Contract, at value | | | | | | | | | | | | | | $ | 1,371 | |
| | | | | | | | | | | | | | | | |
| | | | |
TOTAL RETURN BASKET
SWAP POSITIONS | | SHARES | | | NOTIONAL
VALUE($) (1) | | | CURRENT
VALUE($) (2) | | | VALUE($) (3) | |
Long Positions | | | | | | | | | | | | | | | | |
| | | | |
Common Stocks | | | | | | | | | | | | | | | | |
Consumer Discretionary — 1.3% | | | | | | | | | | | | | | | | |
Hotels, Restaurants & Leisure — 0.5% | | | | | | | | | | | | | | | | |
Tatts Group Ltd. (Australia) | | | 78,276 | | | | 241,751 | | | | 241,290 | | | | (461 | ) |
| | | | | | | | | | | | | | | | |
Media — 0.8% | | | | | | | | | | | | | | | | |
Starz (a) | | | 13,036 | | | | 410,113 | | | | 410,113 | | | | — | |
| | | | | | | | | | | | | | | | |
Total Consumer Discretionary | | | 91,312 | | | | 651,864 | | | | 651,403 | | | | (461 | ) |
| | | | | | | | | | | | | | | | |
Consumer Staples — 0.3% | | | | | | | | | | | | | | | | |
Food & Staples Retailing — 0.1% | | | | | | | | | | | | | | | | |
Metro AG (Germany) | | | 3,354 | | | | 100,478 | | | | 100,467 | | | | (11 | ) |
| | | | | | | | | | | | | | | | |
Household Products — 0.2% | | | | | | | | | | | | | | | | |
Svenska Cellulosa AB SCA (Sweden) | | | 3,484 | | | | 98,709 | | | | 98,677 | | | | (32 | ) |
| | | | | | | | | | | | | | | | |
Total Consumer Staples | | | 6,838 | | | | 199,187 | | | | 199,144 | | | | (43 | ) |
| | | | | | | | | | | | | | | | |
Financials — 0.1% | | | | | | | | | | | | | | | | |
Capital Markets — 0.1% | | | | | | | | | | | | | | | | |
Bats Global Markets, Inc. | | | 394 | | | | 11,587 | | | | 11,587 | | | | — | |
SVG Capital plc (United Kingdom) (a) | | | 1,935 | | | | 16,639 | | | | 16,630 | | | | (9 | ) |
| | | | | | | | | | | | | | | | |
| | | 2,329 | | | | 28,226 | | | | 28,217 | | | | (9 | ) |
| | | | | | | | | | | | | | | | |
Insurance — 0.0% (b) | | | | | | | | | | | | | | | | |
esure Group plc (United Kingdom) | | | 3,820 | | | | 12,713 | | | | 12,713 | | | | — | |
| | | | | | | | | | | | | | | | |
Total Financials | | | 6,149 | | | | 40,939 | | | | 40,930 | | | | (9 | ) |
| | | | | | | | | | | | | | | | |
Industrials — 0.0% (b) | | | | | | | | | | | | | | | | |
Professional Services — 0.0% (b) | | | | | | | | | | | | | | | | |
SAI Global Ltd. (Australia) | | | 6,797 | | | | 24,198 | | | | 24,170 | | | | (28 | ) |
| | | | | | | | | | | | | | | | |
Total Industrials | | | 6,797 | | | | 24,198 | | | | 24,170 | | | | (28 | ) |
| | | | | | | | | | | | | | | | |
Information Technology — 0.0% (b) | | | | | | | | | | | | | | | | |
Semiconductors & Semiconductor Equipment — 0.0% (b) | | | | | | | | | | | | | | | | |
Aixtron S.E. (Germany) (a) | | | 1,622 | | | | 7,715 | | | | 7,840 | | | | 125 | |
| | | | | | | | | | | | | | | | |
Total Information Technology | | | 1,622 | | | | 7,715 | | | | 7,840 | | | | 125 | |
| | | | | | | | | | | | | | | | |
SEE NOTES TO CONSOLIDATED FINANCIAL STATEMENTS.
| | | | | | |
| | | |
| 24 | | | | JPMORGAN EXCHANGE-TRADED FUNDS | | OCTOBER 31, 2016 |
| | | | | | | | | | | | | | | | |
TOTAL RETURN BASKET
SWAP POSITIONS | | SHARES | | | NOTIONAL
VALUE($) (1) | | | CURRENT
VALUE($) (2) | | | VALUE($) (3) | |
Long Positions — continued | | | | | | | | | | | | | | | | |
| | | | |
Common Stocks — continued | | | | | | | | | | | | | | | | |
Materials — 0.1% | | | | | | | | | | | | | | | | |
Metals & Mining — 0.1% | | | | | | | | | | | | | | | | |
Newmarket, Inc. (Canada) (a) | | | 9,117 | | | | 26,917 | | | | 26,917 | | | | — | |
| | | | | | | | | | | | | | | | |
Total Materials | | | 9,117 | | | | 26,917 | | | | 26,917 | | | | — | |
| | | | | | | | | | | | | | | | |
Telecommunication Services — 0.2% | | | | | | | | | | | | | | | | |
Diversified Telecommunication Services — 0.2% | | | | | | | | | | | | | | | | |
Manitoba Telecom Services, Inc. (Canada) | | | 3,390 | | | | 94,752 | | | | 94,752 | | | | — | |
| | | | | | | | | | | | | | | | |
Total Telecommunication Services | | | 3,390 | | | | 94,752 | | | | 94,752 | | | | — | |
| | | | | | | | | | | | | | | | |
Utilities — 0.2% | | | | | | | | | | | | | | | | |
Gas Utilities — 0.2% | | | | | | | | | | | | | | | | |
Snam SpA (Italy) | | | 19,150 | | | | 100,948 | | | | 100,899 | | | | (49 | ) |
| | | | | | | | | | | | | | | | |
Total Utilities | | | 19,150 | | | | 100,948 | | | | 100,899 | | | | (49 | ) |
| | | | | | | | | | | | | | | | |
Total Long Positions of Total Return Basket Swap | | | 144,375 | | | | 1,146,520 | | | | 1,146,055 | | | | (465 | ) |
| | | | | | | | | | | | | | | | |
Short Positions | | | | | | | | | | | | | | | | |
| | | | |
Common Stocks | | | | | | | | | | | | | | | | |
Consumer Discretionary — (0.8)% | | | | | | | | | | | | | | | | |
Hotels, Restaurants & Leisure — (0.5)% | | | | | | | | | | | | | | | | |
Tabcorp Holdings Ltd. (Australia) | | | 61,994 | | | | 228,249 | | | | 227,765 | | | | 484 | |
Media — (0.3)% | | | | | | | | | | | | | | | | |
Lions Gate Entertainment Corp. (Canada) | | | 8,755 | | | | 178,252 | | | | 178,252 | | | | — | |
| | | | | | | | | | | | | | | | |
Total Consumer Discretionary | | | 70,749 | | | | 406,501 | | | | 406,017 | | | | 484 | |
| | | | | | | | | | | | | | | | |
Financials — (0.0)% (b) | | | | | | | | | | | | | | | | |
Capital Markets — (0.0)% (b) | | | | | | | | | | | | | | | | |
CBOE Holdings, Inc. | | | 125 | | | | 7,901 | | | | 7,901 | | | | — | |
| | | | | | | | | | | | | | | | |
Total Financials | | | 125 | | | | 7,901 | | | | 7,901 | | | | — | |
| | | | | | | | | | | | | | | | |
Materials — (0.1)% | | | | | | | | | | | | | | | | |
Metals & Mining — (0.1)% | | | | | | | | | | | | | | | | |
Kirkland Lake Gold, Inc. (Canada) (a) | | | 4,287 | | | | 29,724 | | | | 29,724 | | | | — | |
| | | | | | | | | | | | | | | | |
Total Materials | | | 4,287 | | | | 29,724 | | | | 29,724 | | | | — | |
| | | | | | | | | | | | | | | | |
Telecommunication Services — (0.1)% | | | | | | | | | | | | | | | | |
Diversified Telecommunication Services — (0.1)% | | | | | | | | | | | | | | | | |
BCE, Inc. (Canada) | | | 1,246 | | | | 56,610 | | | | 56,610 | | | | — | |
| | | | | | | | | | | | | | | | |
Total Telecommunication Services | | | 1,246 | | | | 56,610 | | | | 56,610 | | | | — | |
| | | | | | | | | | | | | | | | |
Total Short Positions of Total Return Basket Swap | | | 76,407 | | | | 500,736 | | | | 500,252 | | | | 484 | |
| | | | | | | | | | | | | | | | |
Total of Long and Short Positions of Total Return Basket Swap | | | 67,968 | | | | 645,784 | | | | 645,803 | | | | 19 | |
| | | | | | | | | | | | | | | | |
Outstanding Swap Contract, at value | | | | | | | | | | | | | | $ | 19 | |
| | | | | | | | | | | | | | | | |
SEE NOTES TO CONSOLIDATED FINANCIAL STATEMENTS.
| | | | | | | | |
| | | |
| OCTOBER 31, 2016 | | JPMORGAN EXCHANGE-TRADED FUNDS | | | | | 25 | |
JPMorgan Diversified Alternatives ETF
CONSOLIDATED SCHEDULE OF PORTFOLIO INVESTMENTS
ADDITIONAL INFORMATION-TOTAL RETURN BASKET SWAPS
AS OF OCTOBER 31, 2016 (continued)
| | | | | | | | | | | | | | | | |
TOTAL RETURN BASKET
SWAP POSITIONS | | SHARES | | | NOTIONAL
VALUE($) (1) | | | CURRENT
VALUE($) (2) | | | VALUE($) (3) | |
Long Positions | | | | | | | | | | | | | | | | |
| | | | |
Common Stocks | | | | | | | | | | | | | | | | |
Consumer Discretionary — 2.5% | | | | | | | | | | | | | | | | |
Auto Components — 0.9% | | | | | | | | | | | | | | | | |
Cie Generale des Etablissements Michelin (France) | | | 929 | | | | 100,585 | | | | 100,619 | | | | 34 | |
GKN plc (United Kingdom) | | | 19,742 | | | | 77,132 | | | | 76,990 | | | | (142 | ) |
Linamar Corp. (Canada) | | | 2,360 | | | | 95,980 | | | | 95,980 | | | | — | |
Magna International, Inc. (Canada) | | | 2,362 | | | | 96,977 | | | | 96,977 | | | | — | |
Valeo S.A. (France) | | | 1,739 | | | | 100,222 | | | | 100,349 | | | | 127 | |
| | | | | | | | | | | | | | | | |
| | | 27,132 | | | | 470,896 | | | | 470,915 | | | | 19 | |
| | | | | | | | | | | | | | | | |
Automobiles — 0.4% | | | | | | | | | | | | | | | | |
Peugeot S.A. (France) (a) | | | 7,000 | | | | 104,851 | | | | 104,825 | | | | (26 | ) |
Renault S.A. (France) | | | 1,190 | | | | 103,344 | | | | 103,485 | | | | 141 | |
| | | | | | | | | | | | | | | | |
| | | 8,190 | | | | 208,195 | | | | 208,310 | | | | 115 | |
| | | | | | | | | | | | | | | | |
Hotels, Restaurants & Leisure — 0.4% | | | | | | | | | | | | | | | | |
Carnival plc (United Kingdom) | | | 1,708 | | | | 82,286 | | | | 82,382 | | | | 96 | |
William Hill plc (United Kingdom) | | | 20,876 | | | | 75,583 | | | | 75,518 | | | | (65 | ) |
| | | | | | | | | | | | | | | | |
| | | 22,584 | | | | 157,869 | | | | 157,900 | | | | 31 | |
| | | | | | | | | | | | | | | | |
Media — 0.3% | | | | | | | | | | | | | | | | |
Pearson plc (United Kingdom) | | | 7,788 | | | | 72,209 | | | | 72,050 | | | | (159 | ) |
Publicis Groupe S.A. (France) | | | 1,384 | | | | 94,956 | | | | 94,942 | | | | (14 | ) |
| | | | | | | | | | | | | | | | |
| | | 9,172 | | | | 167,165 | | | | 166,992 | | | | (173 | ) |
| | | | | | | | | | | | | | | | |
Multiline Retail — 0.2% | | | | | | | | | | | | | | | | |
Canadian Tire Corp. (Canada) | | | 1,004 | | | | 97,593 | | | | 97,593 | | | | — | |
| | | | | | | | | | | | | | | | |
Specialty Retail — 0.2% | | | | | | | | | | | | | | | | |
Kingfisher plc (United Kingdom) | | | 18,131 | | | | 80,181 | | | | 80,092 | | | | (89 | ) |
| | | | | | | | | | | | | | | | |
Textiles, Apparel & Luxury Goods — 0.1% | | | | | | | | | | | | | | | | |
Swatch Group AG (Switzerland) | | | 1,253 | | | | 72,238 | | | | 72,233 | | | | (5 | ) |
| | | | | | | | | | | | | | | | |
Total Consumer Discretionary | | | 87,466 | | | | 1,254,137 | | | | 1,254,035 | | | | (102 | ) |
| | | | | | | | | | | | | | | | |
Consumer Staples — 1.4% | | | | | | | | | | | | | | | | |
Food & Staples Retailing — 0.8% | | | | | | | | | | | | | | | | |
Loblaw Companies Ltd. (Canada) | | | 1,980 | | | | 97,694 | | | | 97,694 | | | | — | |
Metro, Inc. (Canada) | | | 3,170 | | | | 97,986 | | | | 97,986 | | | | — | |
Weston (George) Ltd. (Canada) | | | 1,214 | | | | 98,927 | | | | 98,927 | | | | — | |
Wm Morrison Supermarkets plc (United Kingdom) | | | 28,829 | | | | 79,924 | | | | 79,806 | | | | (118 | ) |
| | | | | | | | | | | | | | | | |
| | | 35,193 | | | | 374,531 | | | | 374,413 | | | | (118 | ) |
| | | | | | | | | | | | | | | | |
Household Products — 0.2% | | | | | | | | | | | | | | | | |
Henkel AG & Co. KGaA (Germany) | | | 875 | | | | 96,342 | | | | 96,410 | | | | 68 | |
| | | | | | | | | | | | | | | | |
Personal Products — 0.2% | | | | | | | | | | | | | | | | |
Unilever plc (United Kingdom) | | | 1,859 | | | | 77,774 | | | | 77,612 | | | | (162 | ) |
| | | | | | | | | | | | | | | | |
Tobacco — 0.2% | | | | | | | | | | | | | | | | |
Imperial Brands plc (United Kingdom) | | | 1,697 | | | | 82,161 | | | | 82,087 | | | | (74 | ) |
| | | | | | | | | | | | | | | | |
Total Consumer Staples | | | 39,624 | | | | 630,808 | | | | 630,522 | | | | (286 | ) |
| | | | | | | | | | | | | | | | |
Energy — 2.7% | | | | | | | | | | | | | | | | |
Energy Equipment & Services — 0.5% | | | | | | | | | | | | | | | | |
Petrofac Ltd. (Jersey) | | | 6,763 | | | | 66,761 | | | | 66,606 | | | | (155 | ) |
Technip S.A. (France) | | | 1,526 | | | | 101,214 | | | | 101,281 | | | | 67 | |
Tenaris S.A. (Luxembourg) | | | 6,819 | | | | 96,415 | | | | 96,447 | | | | 32 | |
| | | | | | | | | | | | | | | | |
| | | 15,108 | | | | 264,390 | | | | 264,334 | | | | (56 | ) |
| | | | | | | | | | | | | | | | |
Oil, Gas & Consumable Fuels — 2.2% | | | | | | | | | | | | | | | | |
BP plc (United Kingdom) | | | 12,937 | | | | 76,593 | | | | 76,480 | | | | (113 | ) |
Canadian Natural Resources Ltd. (Canada) | | | 3,070 | | | | 97,435 | | | | 97,435 | | | | — | |
SEE NOTES TO CONSOLIDATED FINANCIAL STATEMENTS.
| | | | | | |
| | | |
| 26 | | | | JPMORGAN EXCHANGE-TRADED FUNDS | | OCTOBER 31, 2016 |
| | | | | | | | | | | | | | | | |
TOTAL RETURN BASKET
SWAP POSITIONS | | SHARES | | | NOTIONAL
VALUE($) (1) | | | CURRENT
VALUE($) (2) | | | VALUE($) (3) | |
Long Positions — continued | | | | | | | | | | | | | | | | |
| | | | |
Common Stocks — continued | | | | | | | | | | | | | | | | |
Oil, Gas & Consumable Fuels — continued | | | | | | | | | | | | | | | | |
Eni SpA (Italy) | | | 6,718 | | | | 97,420 | | | | 97,494 | | | | 74 | |
Galp Energia SGPS S.A. (Portugal) | | | 7,238 | | | | 98,127 | | | | 98,135 | | | | 8 | |
Husky Energy, Inc. (Canada) | | | 8,281 | | | | 89,089 | | | | 89,089 | | | | — | |
Koninklijke Vopak NV (Netherlands) | | | 1,911 | | | | 96,509 | | | | 96,453 | | | | (56 | ) |
Neste OYJ (Finland) | | | 2,307 | | | | 99,604 | | | | 99,529 | | | | (75 | ) |
OMV AG (Austria) | | | 3,292 | | | | 102,904 | | | | 102,743 | | | | (161 | ) |
Repsol S.A. (Spain) | | | 7,107 | | | | 99,589 | | | | 99,232 | | | | (357 | ) |
Royal Dutch Shell plc (United Kingdom) | | | 2,885 | | | | 74,687 | | | | 74,412 | | | | (275 | ) |
TOTAL S.A. (France) | | | 2,044 | | | | 98,099 | | | | 97,918 | | | | (181 | ) |
Veresen, Inc. (Canada) | | | 9,671 | | | | 87,604 | | | | 87,604 | | | | — | |
| | | | | | | | | | | | | | | | |
| | | 67,461 | | | | 1,117,660 | | | | 1,116,524 | | | | (1,136 | ) |
| | | | | | | | | | | | | | | | |
Total Energy | | | 82,569 | | | | 1,382,050 | | | | 1,380,858 | | | | (1,192 | ) |
| | | | | | | | | | | | | | | | |
Financials — 2.8% | | | | | | | | | | | | | | | | |
Banks — 1.0% | | | | | | | | | | | | | | | | |
Bank of Montreal (Canada) | | | 1,555 | | | | 98,960 | | | | 98,960 | | | | — | |
Bank of Nova Scotia (The) (Canada) | | | 1,871 | | | | 100,545 | | | | 100,545 | | | | — | |
National Bank of Canada (Canada) | | | 2,880 | | | | 102,807 | | | | 102,807 | | | | — | |
Royal Bank of Canada (Canada) | | | 1,591 | | | | 99,400 | | | | 99,400 | | | | — | |
Toronto-Dominion Bank (The) (Canada) | | | 2,257 | | | | 102,409 | | | | 102,409 | | | | — | |
| | | | | | | | | | | | | | | | |
| | | 10,154 | | | | 504,121 | | | | 504,121 | | | | — | |
| | | | | | | | | | | | | | | | |
Capital Markets — 0.4% | | | | | | | | | | | | | | | | |
3i Group plc (United Kingdom) | | | 9,813 | | | | 80,595 | | | | 80,439 | | | | (156 | ) |
Investec plc (United Kingdom) | | | 13,866 | | | | 86,219 | | | | 86,056 | | | | (163 | ) |
| | | | | | | | | | | | | | | | |
| | | 23,679 | | | | 166,814 | | | | 166,495 | | | | (319 | ) |
| | | | | | | | | | | | | | | | |
Insurance — 1.4% | | | | | | | | | | | | | | | | |
CNP Assurances (France) | | | 6,099 | | | | 105,683 | | | | 105,624 | | | | (59 | ) |
Industrial Alliance Insurance and Financial Services, Inc. (Canada) | | | 2,670 | | | | 103,392 | | | | 103,392 | | | | — | |
Mapfre S.A. (Spain) | | | 35,123 | | | | 104,372 | | | | 104,190 | | | | (182 | ) |
NN Group NV (Netherlands) | | | 3,283 | | | | 98,928 | | | | 98,893 | | | | (35 | ) |
Poste Italiane SpA (Italy) (c) | | | 15,077 | | | | 100,381 | | | | 100,364 | | | | (17 | ) |
Swiss Life Holding AG (Switzerland) | | | 303 | | | | 80,225 | | | | 80,184 | | | | (41 | ) |
Swiss Re AG (Switzerland) | | | 876 | | | | 81,354 | | | | 81,303 | | | | (51 | ) |
| | | | | | | | | | | | | | | | |
| | | 63,431 | | | | 674,335 | | | | 673,950 | | | | (385 | ) |
| | | | | | | | | | | | | | | | |
Total Financials | | | 97,264 | | | | 1,345,270 | | | | 1,344,566 | | | | (704 | ) |
| | | | | | | | | | | | | | | | |
Health Care — 0.7% | | | | | | | | | | | | | | | | |
Health Care Equipment & Supplies — 0.1% | | | | | | | | | | | | | | | | |
Smith & Nephew plc (United Kingdom) | | | 5,321 | | | | 77,049 | | | | 76,923 | | | | (126 | ) |
| | | | | | | | | | | | | | | | |
Life Sciences Tools & Services — 0.2% | | | | | | | | | | | | | | | | |
Lonza Group AG (Switzerland) | | | 429 | | | | 80,983 | | | | 80,953 | | | | (30 | ) |
| | | | | | | | | | | | | | | | |
Pharmaceuticals — 0.4% | | | | | | | | | | | | | | | | |
Jazz Pharmaceuticals plc (Ireland) (a) | | | 653 | | | | 71,484 | | | | 71,484 | | | | — | |
Merck KGaA (Germany) | | | 926 | | | | 95,208 | | | | 95,314 | | | | 106 | |
| | | | | | | | | | | | | | | | |
| | | 1,579 | | | | 166,692 | | | | 166,798 | | | | 106 | |
| | | | | | | | | | | | | | | | |
Total Health Care | | | 7,329 | | | | 324,724 | | | | 324,674 | | | | (50 | ) |
| | | | | | | | | | | | | | | | |
Industrials — 2.5% | | | | | | | | | | | | | | | | |
Aerospace & Defense — 0.6% | | | | | | | | | | | | | | | | |
CAE, Inc. (Canada) | | | 7,002 | | | | 98,351 | | | | 98,351 | | | | — | |
Meggitt plc (United Kingdom) | | | 14,760 | | | | 78,643 | | | | 78,523 | | | | (120 | ) |
Thales S.A. (France) | | | 1,101 | | | | 103,664 | | | | 103,588 | | | | (76 | ) |
| | | | | | | | | | | | | | | | |
| | | 22,863 | | | | 280,658 | | | | 280,462 | | | | (196 | ) |
| | | | | | | | | | | | | | | | |
SEE NOTES TO CONSOLIDATED FINANCIAL STATEMENTS.
| | | | | | | | |
| | | |
| OCTOBER 31, 2016 | | JPMORGAN EXCHANGE-TRADED FUNDS | | | | | 27 | |
JPMorgan Diversified Alternatives ETF
CONSOLIDATED SCHEDULE OF PORTFOLIO INVESTMENTS
ADDITIONAL INFORMATION-TOTAL RETURN BASKET SWAPS
AS OF OCTOBER 31, 2016 (continued)
| | | | | | | | | | | | | | | | |
TOTAL RETURN BASKET
SWAP POSITIONS | | SHARES | | | NOTIONAL
VALUE($) (1) | | | CURRENT
VALUE($) (2) | | | VALUE($) (3) | |
Long Positions — continued | | | | | | | | | | | | | | | | |
| | | | |
Common Stocks — continued | | | | | | | | | | | | | | | | |
Air Freight & Logistics — 0.2% | | | | | | | | | | | | | | | | |
Royal Mail plc (United Kingdom) | | | 13,402 | | | | 80,544 | | | | 80,406 | | | | (138 | ) |
| | | | | | | | | | | | | | | | |
Construction & Engineering — 0.6% | | | | | | | | | | | | | | | | |
ACS Actividades de Construccion y Servicios S.A. (Spain) | | | 3,385 | | | | 103,785 | | | | 103,543 | | | | (242 | ) |
Eiffage S.A. (France) | | | 1,362 | | | | 100,832 | | | | 100,835 | | | | 3 | |
Vinci S.A. (France) | | | 1,348 | | | | 97,636 | | | | 97,622 | | | | (14 | ) |
| | | | | | | | | | | | | | | | |
| | | 6,095 | | | | 302,253 | | | | 302,000 | | | | (253 | ) |
| | | | | | | | | | | | | | | | |
Electrical Equipment — 0.5% | | | | | | | | | | | | | | | | |
ABB Ltd. (Switzerland) | | | 3,521 | | | | 72,587 | | | | 72,640 | | | | 53 | |
Prysmian SpA (Italy) | | | 3,946 | | | | 98,200 | | | | 98,128 | | | | (72 | ) |
Schneider Electric SE (France) | | | 1,461 | | | | 98,058 | | | | 98,253 | | | | 195 | |
| | | | | | | | | | | | | | | | |
| | | 8,928 | | | | 268,845 | | | | 269,021 | | | | 176 | |
| | | | | | | | | | | | | | | | |
Professional Services — 0.2% | | | | | | | | | | | | | | | | |
RELX plc (United Kingdom) | | | 4,497 | | | | 80,418 | | | | 80,272 | | | | (146 | ) |
| | | | | | | | | | | | | | | | |
Trading Companies & Distributors — 0.2% | | | | | | | | | | | | | | | | |
Rexel S.A. (France) | | | 7,152 | | | | 99,199 | | | | 99,193 | | | | (6 | ) |
| | | | | | | | | | | | | | | | |
Transportation Infrastructure — 0.2% | | | | | | | | | | | | | | | | |
Aena S.A. (Spain) (c) | | | 702 | | | | 103,072 | | | | 102,869 | | | | (203 | ) |
| | | | | | | | | | | | | | | | |
Total Industrials | | | 63,639 | | | | 1,214,989 | | | | 1,214,223 | | | | (766 | ) |
| | | | | | | | | | | | | | | | |
Information Technology — 0.6% | | | | | | | | | | | | | | | | |
IT Services — 0.4% | | | | | | | | | | | | | | | | |
Atos SE (France) | | | 957 | | | | 99,402 | | | | 99,311 | | | | (91 | ) |
CGI Group, Inc. (Canada) (a) | | | 2,133 | | | | 101,315 | | | | 101,315 | | | | — | |
| | | | | | | | | | | | | | | | |
| | | 3,090 | | | | 200,717 | | | | 200,626 | | | | (91 | ) |
| | | | | | | | | | | | | | | | |
Software — 0.2% | | | | | | | | | | | | | | | | |
Open Text Corp. (Canada) | | | 1,561 | | | | 96,921 | | | | 96,921 | | | | — | |
| | | | | | | | | | | | | | | | |
Total Information Technology | | | 4,651 | | | | 297,638 | | | | 297,547 | | | | (91 | ) |
| | | | | | | | | | | | | | | | |
Materials — 1.2% | | | | | | | | | | | | | | | | |
Chemicals — 0.4% | | | | | | | | | | | | | | | | |
Covestro AG (Germany) (c) | | | 1,673 | | | | 98,879 | | | | 99,071 | | | | 192 | |
Evonik Industries AG (Germany) | | | 3,067 | | | | 95,819 | | | | 96,048 | | | | 229 | |
| | | | | | | | | | | | | | | | |
| | | 4,740 | | | | 194,698 | | | | 195,119 | | | | 421 | |
| | | | | | | | | | | | | | | | |
Metals & Mining — 0.6% | | | | | | | | | | | | | | | | |
Aichi Steel Corp. (Japan) | | | 2,100 | | | | 101,325 | | | | 101,115 | | | | (210 | ) |
Glencore plc (Jersey) | | | 27,808 | | | | 85,093 | | | | 85,124 | | | | 31 | |
Rio Tinto plc (United Kingdom) | | | 2,434 | | | | 84,595 | | | | 84,643 | | | | 48 | |
| | | | | | | | | | | | | | | | |
| | | 32,342 | | | | 271,013 | | | | 270,882 | | | | (131 | ) |
| | | | | | | | | | | | | | | | |
Paper & Forest Products — 0.2% | | | | | | | | | | | | | | | | |
UPM-Kymmene OYJ (Finland) | | | 4,783 | | | | 111,312 | | | | 111,260 | | | | (52 | ) |
| | | | | | | | | | | | | | | | |
Total Materials | | | 41,865 | | | | 577,023 | | | | 577,261 | | | | 238 | |
| | | | | | | | | | | | | | | | |
Real Estate — 1.0% | | | | | | | | | | | | | | | | |
Industrial Real Estate Investment Trusts — 0.2% | | | | | | | | | | | | | | | | |
Swiss Prime Site AG (Switzerland) | | | 969 | | | | 80,346 | | | | 80,368 | | | | 22 | |
| | | | | | | | | | | | | | | | |
Real Estate Management & Development — 0.8% | | | | | | | | | | | | | | | | |
Deutsche EuroShop AG (Germany) | | | 2,319 | | | | 100,173 | | | | 100,228 | | | | 55 | |
Nexity S.A. (France) | | | 1,952 | | | | 98,023 | | | | 98,007 | | | | (16 | ) |
PSP Swiss Property AG (Switzerland) | | | 1,105 | | | | 98,825 | | | | 98,874 | | | | 49 | |
Sponda OYJ (Finland) | | | 21,288 | | | | 100,767 | | | | 100,788 | | | | 21 | |
| | | | | | | | | | | | | | | | |
| | | 26,664 | | | | 397,788 | | | | 397,897 | | | | 109 | |
| | | | | | | | | | | | | | | | |
Total Real Estate | | | 27,633 | | | | 478,134 | | | | 478,265 | | | | 131 | |
| | | | | | | | | | | | | | | | |
SEE NOTES TO CONSOLIDATED FINANCIAL STATEMENTS.
| | | | | | |
| | | |
| 28 | | | | JPMORGAN EXCHANGE-TRADED FUNDS | | OCTOBER 31, 2016 |
| | | | | | | | | | | | | | | | |
TOTAL RETURN BASKET
SWAP POSITIONS | | SHARES | | | NOTIONAL
VALUE($) (1) | | | CURRENT
VALUE($) (2) | | | VALUE($) (3) | |
Long Positions — continued | | | | | | | | | | | | | | | | |
| | | | |
Common Stocks — continued | | | | | | | | | | | | | | | | |
Telecommunication Services — 0.2% | | | | | | | | | | | | | | | | |
Diversified Telecommunication Services — 0.2% | | | | | | | | | | | | | | | | |
Telefonica SA (Spain) | | | 10,237 | | | | 104,062 | | | | 104,015 | | | | (47 | ) |
| | | | | | | | | | | | | | | | |
Total Telecommunication Services | | | 10,237 | | | | 104,062 | | | | 104,015 | | | | (47 | ) |
| | | | | | | | | | | | | | | | |
Utilities — 2.2% | | | | | | | | | | | | | | | | |
Electric Utilities — 1.0% | | | | | | | | | | | | | | | | |
EDP — Energias de Portugal S.A. (Portugal) | | | 30,679 | | | | 101,404 | | | | 101,402 | | | | (2 | ) |
Endesa S.A. (Spain) | | | 4,789 | | | | 101,805 | | | | 101,650 | | | | (155 | ) |
Enel SpA (Italy) | | | 23,654 | | | | 101,788 | | | | 101,697 | | | | (91 | ) |
Iberdrola S.A. (Spain) | | | 15,105 | | | | 102,955 | | | | 102,797 | | | | (158 | ) |
SSE plc (United Kingdom) | | | 4,259 | | | | 82,939 | | | | 82,808 | | | | (131 | ) |
| | | | | | | | | | | | | | | | |
| | | 78,486 | | | | 490,891 | | | | 490,354 | | | | (537 | ) |
| | | | | | | | | | | | | | | | |
Gas Utilities — 0.6% | | | | | | | | | | | | | | | | |
Enagas S.A. (Spain) | | | 3,483 | | | | 99,983 | | | | 99,840 | | | | (143 | ) |
Gas Natural SDG S.A. (Spain) | | | 5,086 | | | | 100,358 | | | | 100,115 | | | | (243 | ) |
Snam SpA (Italy) | | | 19,157 | | | | 100,985 | | | | 100,935 | | | | (50 | ) |
| | | | | | | | | | | | | | | | |
| | | 27,726 | | | | 301,326 | | | | 300,890 | | | | (436 | ) |
| | | | | | | | | | | | | | | | |
Multi-Utilities — 0.6% | | | | | | | | | | | | | | | | |
Centrica plc (United Kingdom) | | | 31,696 | | | | 83,101 | | | | 83,020 | | | | (81 | ) |
E.ON SE (Germany) | | | 13,233 | | | | 96,921 | | | | 96,983 | | | | 62 | |
Engie S.A. (France) | | | 6,855 | | | | 98,843 | | | | 98,862 | | | | 19 | |
| | | | | | | | | | | | | | | | |
| | | 51,784 | | | | 278,865 | | | | 278,865 | | | | — | |
| | | | | | | | | | | | | | | | |
Total Utilities | | | 157,996 | | | | 1,071,082 | | | | 1,070,109 | | | | (973 | ) |
| | | | | | | | | | | | | | | | |
Total Long Positions of Total Return Basket Swap | | | 620,273 | | | | 8,679,917 | | | | 8,676,075 | | | | (3,842 | ) |
| | | | | | | | | | | | | | | | |
Short Positions | | | | | | | | | | | | | | | | |
| | | | |
Common Stocks | | | | | | | | | | | | | | | | |
Consumer Discretionary — (0.1)% | | | | | | | | | | | | | | | | |
Hotels, Restaurants & Leisure — (0.1)% | | | | | | | | | | | | | | | | |
McDonald’s Holdings Co. Japan Ltd. (Japan) | | | 2,300 | | | | 66,234 | | | | 66,177 | | | | 57 | |
Wynn Resorts Ltd. | | | 126 | | | | 11,913 | | | | 11,913 | | | | — | |
| | | | | | | | | | | | | | | | |
| | | 2,426 | | | | 78,147 | | | | 78,090 | | | | 57 | |
| | | | | | | | | | | | | | | | |
Total Consumer Discretionary | | | 2,426 | | | | 78,147 | | | | 78,090 | | | | 57 | |
| | | | | | | | | | | | | | | | |
Industrials — (0.3)% | | | | | | | | | | | | | | | | |
Aerospace & Defense — (0.1)% | | | | | | | | | | | | | | | | |
Bombardier, Inc. (Canada) (a) | | | 49,688 | | | | 65,939 | | | | 65,939 | | | | — | |
| | | | | | | | | | | | | | | | |
Industrial Conglomerates — (0.2)% | | | | | | | | | | | | | | | | |
Keihan Holdings Co. Ltd. (Japan) | | | 2,000 | | | | 13,522 | | | | 13,503 | | | | 19 | |
Toshiba Corp. (Japan) | | | 18,000 | | | | 65,395 | | | | 65,175 | | | | 220 | |
| | | | | | | | | | | | | | | | |
| | | 20,000 | | | | 78,917 | | | | 78,678 | | | | 239 | |
| | | | | | | | | | | | | | | | |
Total Industrials | | | 69,688 | | | | 144,856 | | | | 144,617 | | | | 239 | |
| | | | | | | | | | | | | | | | |
Materials — (0.0)% (b) | | | | | | | | | | | | | | | | |
Metals & Mining — (0.0)% (b) | | | | | | | | | | | | | | | | |
First Quantum Minerals Ltd. (Canada) | | | 1,671 | | | | 15,872 | | | | 15,872 | | | | — | |
| | | | | | | | | | | | | | | | |
Total Materials | | | 1,671 | | | | 15,872 | | | | 15,872 | | | | — | |
| | | | | | | | | | | | | | | | |
SEE NOTES TO CONSOLIDATED FINANCIAL STATEMENTS.
| | | | | | | | |
| | | |
| OCTOBER 31, 2016 | | JPMORGAN EXCHANGE-TRADED FUNDS | | | | | 29 | |
JPMorgan Diversified Alternatives ETF
CONSOLIDATED SCHEDULE OF PORTFOLIO INVESTMENTS
ADDITIONAL INFORMATION-TOTAL RETURN BASKET SWAPS
AS OF OCTOBER 31, 2016 (continued)
| | | | | | | | | | | | | | | | |
TOTAL RETURN BASKET
SWAP POSITIONS | | SHARES | | | NOTIONAL
VALUE($) (1) | | | CURRENT
VALUE($) (2) | | | VALUE($) (3) | |
Short Positions — continued | | | | | | | | | | | | | | | | |
| | | | |
Common Stocks — continued | | | | | | | | | | | | | | | | |
Telecommunication Services — (0.1)% | | | | | | | | | | | | | | | | |
Diversified Telecommunication Services — (0.1)% | | | | | | | | | | | | | | | | |
Telecom Italia SpA (Italy) | | | 68,626 | | | | 59,552 | | | | 59,657 | | | | (105 | ) |
| | | | | | | | | | | | | | | | |
Total Telecommunication Services | | | 68,626 | | | | 59,552 | | | | 59,657 | | | | (105 | ) |
| | | | | | | | | | | | | | | | |
Total Short Positions of Total Return Basket Swap | | | 142,411 | | | | 298,427 | | | | 298,236 | | | | 191 | |
| | | | | | | | | | | | | | | | |
Total of Long and Short Positions of Total Return Basket Swap | | | 477,862 | | | | 8,381,490 | | | | 8,377,839 | | | | (3,651 | ) |
| | | | | | | | | | | | | | | | |
Outstanding Swap Contract, at value | | | | | | | | | | | | | | $ | (3,651 | ) |
| | | | | | | | | | | | | | | | |
Percentages indicated are based on net assets.
NOTES TO ADDITIONAL INFORMATION — TOTAL RETURN BASKET SWAPS:
| | |
| (1) | | — Notional value represents the market value (including any fees or commissions) of the long and short positions as of the reset date. |
| (2) | | — Current value represents market value as of October 31, 2016 of these positions based on the securities’ last sale or closing price on the principal exchange on which the securities are traded. |
| (3) | | — Value represents the unrealized gain (loss) of the positions. |
| (a) | | — Non-income producing security. |
| (b) | | — Amounts rounds to less than 0.1%. |
| (c) | | — Security is exempt from registration under Rule 144A of the Securities Act of 1933, as amended. Unless otherwise indicated, this security has been determined to be liquid under procedures established by the Board of Trustees and may be resold in transactions exempt from registration, normally to qualified institutional buyers. |
SEE NOTES TO CONSOLIDATED FINANCIAL STATEMENTS.
| | | | | | |
| | | |
| 30 | | | | JPMORGAN EXCHANGE-TRADED FUNDS | | OCTOBER 31, 2016 |
CONSOLIDATED STATEMENT OF ASSETS AND LIABILITIES
AS OF OCTOBER 31, 2016
| | | | |
| | | JPMorgan
Diversified
Alternatives ETF | |
ASSETS: | | | | |
Investments in non-affiliates, at value | | $ | 24,568,934 | |
Investment in affiliates, at value | | | 25,631,779 | |
| | | | |
Total Investment securities, at value | | | 50,200,713 | |
Cash | | | 704,756 | |
Restricted Cash | | | 750 | |
Deposits at broker | | | 1,014,000 | |
Foreign currency, at value | | | 408,129 | |
Receivables: | | | | |
Investment securities sold | | | 53,062 | |
Due from counterparty for swap contracts | | | 203,805 | |
Due from Adviser | | | 134,195 | |
Deferred offering costs | | | 9,143 | |
Dividends from non-affiliates | | | 5,376 | |
Dividends from affiliates | | | 3,182 | |
Unrealized appreciation on forward foreign currency exchange contracts | | | 98,527 | |
Outstanding swap contracts, at value | | | 1,654 | |
| | | | |
Total Assets | | | 52,837,292 | |
| | | | |
| |
LIABILITIES: | | | | |
Payables: | | | | |
Investments securities purchased | | | 608,079 | |
Variation margin on futures contracts | | | 13,383 | |
Unrealized depreciation on forward foreign currency exchange contracts | | | 37,823 | |
Accrued Liabilities: | | | | |
Professional fees | | | 147,430 | |
Custodian and Transfer Agent fees | | | 16,460 | |
Accounting fees | | | 11,402 | |
Administration fees | | | 2,648 | |
Advisory fees | | | 1,992 | |
Trustees’ and Chief Compliance Officer’s fees | | | 1,525 | |
Other | | | 15,466 | |
Outstanding swap contracts, at value | | | 3,651 | |
| | | | |
Total Liabilities | | | 859,859 | |
| | | | |
Net Assets | | $ | 51,977,433 | |
| | | | |
| |
NET ASSETS: | | | | |
Paid-in Capital | | $ | 51,692,646 | |
Accumulated undistributed (distributions in excess of) net investment income | | | 367,786 | |
Accumulated net realized gains (losses) | | | (890 | ) |
Net unrealized appreciation (depreciation) | | | (82,109 | ) |
| | | | |
Total Net Assets | | $ | 51,977,433 | |
| | | | |
| |
Outstanding number of shares
(unlimited number of shares authorized — par value $0.0001) | | | 2,050,000 | |
| | | | |
Net asset value, per share | | $ | 25.35 | |
| | | | |
| |
Cost of investments in non-affiliates | | $ | 24,690,379 | |
Cost of investments in affiliates | | | 25,631,779 | |
Cost of foreign currency | | | 406,885 | |
SEE NOTES TO CONSOLIDATED FINANCIAL STATEMENTS.
| | | | | | | | |
| | | |
| OCTOBER 31, 2016 | | JPMORGAN EXCHANGE-TRADED FUNDS | | | | | 31 | |
CONSOLIDATED STATEMENT OF OPERATIONS
FOR THE PERIOD ENDED OCTOBER 31, 2016
| | | | |
| | | JPMorgan
Diversified
Alternatives ETF (a) | |
INVESTMENT INCOME: | | | | |
Dividend income from non-affiliates | | $ | 9,723 | |
Dividend income from affiliates | | | 3,202 | |
Interest income from affiliates | | | 5 | |
Foreign taxes withheld | | | (515 | ) |
| | | | |
Total Investment Income | | | 12,415 | |
| | | | |
| |
EXPENSES: | | | | |
Investment advisory fees (Note 3.A) | | | 21,733 | |
Administration fees (Note 3.B) | | | 3,079 | |
Trustees’ and Chief Compliance Officer’s fees | | | 1,525 | |
Professional fees | | | 147,430 | |
Printing and mailing costs | | | 2,500 | |
Custodian and Transfer Agent fees | | | 16,431 | |
Registration and filing fees | | | 5,995 | |
Interest expense from affiliates | | | 3,325 | |
Offering costs | | | 6,611 | |
Accounting fees | | | 14,291 | |
Other | | | 1,328 | |
| | | | |
Total expenses | | | 224,248 | |
| | | | |
Less fees waived (Note 3.D) | | | (24,812 | ) |
Less expense reimbursements from affiliates (Note 3.D) | | | (170,781 | ) |
Less expense reimbursements from non-affiliates (Note 3.C) | | | (750 | ) |
| | | | |
Net expenses | | | 27,905 | |
| | | | |
Net investment income (loss) | | | (15,490 | ) |
| | | | |
| |
REALIZED/UNREALIZED GAINS (LOSSES): | | | | |
Net realized gain (loss) on transactions from: | | | | |
Investments in non-affiliates | | | (4,481 | ) |
Futures | | | 25,495 | |
Foreign currency transactions | | | 36,002 | |
Swaps | | | 292,330 | |
| | | | |
Net realized gain (loss) | | | 349,346 | |
| | | | |
Change in net unrealized appreciation/depreciation on: | | | | |
Investments in non-affiliates | | | (121,445 | ) |
Futures | | | (20,388 | ) |
Foreign currency translations | | | 61,721 | |
Swaps | | | (1,997 | ) |
| | | | |
Change in net unrealized appreciation/depreciation | | | (82,109 | ) |
| | | | |
Net realized/unrealized gains (losses) | | | 267,237 | |
| | | | |
Change in net assets resulting from operations | | $ | 251,747 | |
| | | | |
| (a) | Commencement of operations was September 12, 2016. |
SEE NOTES TO CONSOLIDATED FINANCIAL STATEMENTS.
| | | | | | |
| | | |
| 32 | | | | JPMORGAN EXCHANGE-TRADED FUNDS | | OCTOBER 31, 2016 |
CONSOLIDATED STATEMENT OF CHANGES IN NET ASSETS
FOR THE PERIOD INDICATED
| | | | |
| | | JPMorgan
Diversified
Alternatives ETF | |
| | | Period Ended
October 31, 2016 (a) | |
CHANGE IN NET ASSETS RESULTING FROM OPERATIONS: | | | | |
Net investment income (loss) | | $ | (15,490 | ) |
Net realized gain (loss) | | | 349,346 | |
Change in net unrealized appreciation/depreciation | | | (82,109 | ) |
| | | | |
Change in net assets resulting from operations | | | 251,747 | |
| | | | |
| |
CAPITAL TRANSACTIONS: | | | | |
Change in net assets resulting from capital transactions | | $ | 51,725,686 | |
| | | | |
| |
NET ASSETS: | | | | |
Change in net assets | | | 51,977,433 | |
Beginning of period | | | — | |
| | | | |
End of period | | $ | 51,977,433 | |
| | | | |
Accumulated undistributed (distributions in excess of) net investment income | | $ | 367,786 | |
| | | | |
| |
CAPITAL SHARE TRANSACTIONS: | | | | |
Proceeds from shares issued | | | 51,725,686 | |
| | | | |
Total change in net assets resulting from capital transactions | | $ | 51,725,686 | |
| | | | |
| |
SHARE TRANSACTIONS: | | | | |
Issued | | | 2,050,000 | |
| | | | |
Net increase in shares from share transactions | | | 2,050,000 | |
| | | | |
| (a) | Commencement of operations was September 12, 2016. |
SEE NOTES TO CONSOLIDATED FINANCIAL STATEMENTS.
| | | | | | | | |
| | | |
| OCTOBER 31, 2016 | | JPMORGAN EXCHANGE-TRADED FUNDS | | | | | 33 | |
CONSOLIDATED FINANCIAL HIGHLIGHTS
FOR THE PERIOD INDICATED
| | | | | | | | | | | | | | | | | | | | | | | | |
| | | Per share operating performance | |
| | | | | | Investment operations | | | | | | | |
| | | Net asset
value,
beginning
of period | | | Net
investment
income
(loss) (b) | | | Net realized
and unrealized
gains
(losses) on
investments | | | Total from
investment
operations | | | Net asset
value,
end of
period | | | Market
price,
end of
period | |
| | | | | | |
JPMorgan Diversified Alternatives ETF | | | | | | | | | | | | | | | | | | | | | | | | |
September 12, 2016 (a) through October 31, 2016 | | $ | 25.00 | | | $ | (0.02 | ) | | $ | 0.37 | | | $ | 0.35 | | | $ | 25.35 | | | $ | 25.42 | |
| (a) | Commencement of operations. |
| (b) | Calculated based upon average shares outstanding. |
| (c) | Not annualized for periods less than one year. |
| (d) | Includes adjustments in accordance with accounting principles generally accepted in the United States of America and as such, the net asset values for financial reporting purposes and the returns based upon those net asset values may differ from the net asset values and returns for shareholder transactions. |
| (e) | Market price total return is calculated assuming an initial investment made at the beginning of the period market price, reinvestment of all dividends and distributions at market price during the period, and sale at the market price on the last day of the period. The market price presented to calculate the market price total return is the mid-point of the bid/ask spread at the close of business on the NYSE Arca, Inc. |
| (f) | Annualized for periods less than one year, unless otherwise indicated. |
| (g) | Certain non-recurring expenses incurred by the Fund were not annualized for the period indicated. |
| (h) | Portfolio turnover is calculated by dividing the lesser of total purchases or sales of portfolio securities for the reporting period by the monthly average value of portfolio securities owned during the reporting period. Excluded from both the numerator and denominator are amounts relating to derivatives and securities whose maturities or expiration dates at the time of acquisition were one year or less. |
SEE NOTES TO CONSOLIDATED FINANCIAL STATEMENTS.
| | | | | | |
| | | |
| 34 | | | | JPMORGAN EXCHANGE-TRADED FUNDS | | OCTOBER 31, 2016 |
| | | | | | | | | | | | | | | | | | | | | | | | | | |
| Ratios/Supplemental data | |
| | | | | | | | | | Ratios to average net assets (f) | | | | |
| Total return (c)(d) | | | Market
price
total
return (c)(e) | | | Net assets,
end of period | | | Net
expenses | | |
Net
investment
income
(loss) | | | Expenses
without waivers
and reimbursements | | | Portfolio
turnover
rate (c)(h) | |
| | | | | | |
| | | | | | | | | | | | | | | | | | | | | | | | | | |
| | 1.44 | % | | | 1.68 | % | | $ | 51,977,433 | | | | 0.85 | %(g) | | | (0.47 | )% | | | 6.65 | %(g) | | | 5 | % |
SEE NOTES TO CONSOLIDATED FINANCIAL STATEMENTS.
| | | | | | | | |
| | | |
| OCTOBER 31, 2016 | | JPMORGAN EXCHANGE-TRADED FUNDS | | | | | 35 | |
NOTES TO CONSOLIDATED FINANCIAL STATEMENTS
AS OF OCTOBER 31, 2016
1. Organization
J.P. Morgan Exchange-Traded Fund Trust (the “Trust”) was formed on February 25, 2010, and is governed by a Declaration of Trust as amended and restated February 19, 2014, and is registered under the Investment Company Act of 1940, as amended (the “1940 Act”), as an open-ended management investment company. JPMorgan Diversified Alternatives ETF (the “Fund” or the “Diversified Alternatives ETF”) is a separate diversified series of the Trust covered in this report.
The Fund commenced operations on September 12, 2016. The investment objective of the Fund is to seek to provide long-term total return.
J.P. Morgan Investment Management Inc. (“JPMIM” or the “Adviser”) an indirect, wholly-owned subsidiary of JPMorgan Chase & Co. (“JPMorgan”) acts as the Adviser and Administrator (the “Administrator”) to the Fund.
Shares of the Fund are listed and traded on the NYSE Arca, Inc. Market prices for the Fund’s shares may be different from their net asset value (“NAV”). The Fund issues and redeems its shares on a continuous basis, through SEI Investments Distribution Co. (the “Distributor” or “SIDCO”), at NAV in large blocks of shares, typically 50,000 shares, referred to as “Creation Units.” Creation Units are issued and redeemed principally in cash. Shares are generally traded in the secondary market in amounts less than a Creation Unit at market prices that change throughout the day. Only individuals or institutions that have entered into an authorized participant agreement with the Distributor may do business directly with the Fund (each, an “Authorized Participant”).
2. Significant Accounting Policies
The following is a summary of significant accounting policies followed by the Fund in the preparation of its consolidated financial statements. The Fund is an investment company and, accordingly, follows the investment company accounting and reporting guidance of the Financial Accounting Standards Board Accounting Standards Codification Topic 946 — Investment Companies, which is part of the U.S. generally accepted accounting principles (“GAAP”). The preparation of financial statements in conformity with GAAP requires management to make estimates and assumptions that affect the reported amounts of assets and liabilities and the disclosure of contingent assets and liabilities at the date of the financial statements and the reported amounts of increases and decreases in net assets from operations during the reporting period. Actual results could differ from those estimates.
Basis for Consolidation for the Fund
Diversified Alternatives Fund CS Ltd. (the “Subsidiary”), a Cayman Islands exempted company, was incorporated on August 17, 2015 and is currently a wholly-owned subsidiary of the Fund. The Subsidiary acts as an investment vehicle for the Fund in order to effect certain investments on behalf of the Fund consistent with the Fund’s investment objectives and policies as described in the Fund’s prospectus. As of October 31, 2016, net assets of the Fund were $51,977,433 of which $6,237,848, or approximately 12.0%, represented the Subsidiary’s net assets. The net realized gain in the Subsidiary amounted to $38,545. The Consolidated Schedule of Portfolio Investments (“CSOI”) includes positions of the Fund and the Subsidiary. The consolidated financial statements include the accounts of the Fund and the Subsidiary. Subsequent references to the Fund within the Notes to Consolidated Financial Statements collectively refer to the Fund and the Subsidiary. All significant intercompany balances and transactions have been eliminated in consolidation.
A. Valuation of Investments — The valuation of the investments is in accordance with GAAP and the Fund’s valuation policies set forth by and under the supervision and responsibility of the Board of Trustees (the “Board”), which established the following approach to valuation, as described more fully below: (i) investments for which market quotations are readily available shall be valued at such unadjusted quoted prices, and (ii) all other investments for which market quotations are not readily available shall be valued at their fair value as determined in good faith by the Board.
The Administrator has established the J.P. Morgan Asset Management Americas Valuation Committee (“AVC”) to assist the Board with the oversight and monitoring of the valuation of the Fund’s investments. The Administrator implements the valuation policies of the Fund’s investments, as directed by the Board. The AVC oversees and carries out the policies for the valuation of investments held in the Fund. This includes monitoring the appropriateness of fair values based on results of ongoing valuation oversight, including but not limited to consideration of macro or security specific events, market events and pricing vendor and broker due diligence. The Administrator is responsible for discussing and assessing the potential impacts to the fair values on an ongoing basis, and at least on a quarterly basis with the AVC and the Board.
Equities and other exchange-traded instruments are valued at the last sale price or official market closing price on the primary exchange on which the instruments are traded before the net asset value (“NAV”) of the Fund is calculated on a valuation date. Certain foreign equity instruments, as well as certain derivatives with equity reference obligations, are valued by applying international fair value factors provided by approved pricing vendors or third party broker-dealers (collectively referred to as “Pricing Services”). The factors seek to adjust the local closing price for movements of local markets post closing, but prior to the time the NAVs are calculated.
Investments in open-end investment companies (the “Underlying Fund”) are valued at each Underlying Fund’s NAV per share as of the report date.
Futures are generally valued on the basis of available market quotations. Swaps and other derivatives are valued utilizing market quotations from approved Pricing Services.
Valuations reflected in this report are as of the report date. As a result, changes in valuation due to market events and/or issuer related events after the report date and prior to issuance of the report are not reflected herein.
| | | | | | |
| | | |
| 36 | | | | JPMORGAN EXCHANGE-TRADED FUNDS | | OCTOBER 31, 2016 |
The various inputs that are used in determining the valuation of the Fund’s investments are summarized into the three broad levels listed below.
| • | | Level 1 — Unadjusted inputs using quoted prices in active markets for identical investments. |
| • | | Level 2 — Other significant observable inputs including, but not limited to, quoted prices for similar investments, inputs other than quoted prices that are observable for investments (such as interest rates, prepayment speeds, credit risk, etc.) or other market corroborated inputs. |
| • | | Level 3 — Significant inputs based on the best information available in the circumstances, to the extent observable inputs are not available (including the Fund’s assumptions in determining the fair value of investments). |
A financial instrument’s level within the fair value hierarchy is based on the lowest level of any input, both individually and in the aggregate, that is significant to the fair value measurement. The inputs or methodology used for valuing instruments are not necessarily an indication of the risk associated with investing in those instruments.
The following table represents each valuation input as presented on the CSOI:
| | | | | | | | | | | | | | | | |
| | | Level 1
Quoted Prices | | | Level 2
Other significant
observable inputs | | | Level 3
Significant
unobservable inputs | | | Total | |
Investments in Securities | | | | | | | | | | | | | | | | |
Common Stocks | | | | | | | | | | | | | | | | |
Consumer Discretionary | | $ | 4,140,080 | | | $ | — | | | $ | — | | | $ | 4,140,080 | |
Consumer Staples | | | 2,348,807 | | | | — | | | | — | | | | 2,348,807 | |
Energy | | | 522,781 | | | | — | | | | — | | | | 522,781 | |
Financials | | | 1,562,667 | | | | 246,518 | | | | — | | | | 1,809,185 | |
Health Care | | | 2,132,595 | | | | — | | | | — | | | | 2,132,595 | |
Industrials | | | 3,203,198 | | | | — | | | | — | | | | 3,203,198 | |
Information Technology | | | 7,331,544 | | | | — | | | | — | | | | 7,331,544 | |
Materials | | | 1,666,588 | | | | — | | | | — | | | | 1,666,588 | |
Telecommunication Services | | | 139,304 | | | | — | | | | — | | | | 139,304 | |
Utilities | | | 1,274,852 | | | | — | | | | — | | | | 1,274,852 | |
| | | | | | | | | | | | | | | | |
Total Common Stocks | | | 24,322,416 | | | | 246,518 | | | | — | | | | 24,568,934 | |
| | | | | | | | | | | | | | | | |
Short-Term Investment | | | 25,631,779 | | | | — | | | | — | | | | 25,631,779 | |
| | | | | | | | | | | | | | | | |
Total Investments in Securities | | $ | 49,954,195 | | | $ | 246,518 | | | $ | — | | | $ | 50,200,713 | |
| | | | | | | | | | | | | | | | |
| | | | |
| | | Level 1 Quoted Prices | | | Level 2 Other significant
observable inputs | | | Level 3 Significant
unobservable inputs | | | Total | |
Appreciation in Other Financial Instruments | | | | | | | | | | | | | | | | |
Forward Foreign Currency Exchange Contracts | | $ | — | | | $ | 98,527 | | | $ | — | | | $ | 98,527 | |
Futures Contracts | | | 141,930 | | | | — | | | | — | | | | 141,930 | |
Swaps | | | — | | | | — | | | | — | | | | — | |
| | | | | | | | | | | | | | | | |
Total Appreciation in Other Financial Instruments | | $ | 141,930 | | | $ | 98,527 | | | $ | — | | | $ | 240,457 | |
| | | | | | | | | | | | | | | | |
Depreciation in Other Financial Instruments | | | | | | | | | | | | | | | | |
Forward Foreign Currency Exchange Contracts | | $ | — | | | $ | (37,823 | ) | | $ | — | | | $ | (37,823 | ) |
Futures Contracts | | | (162,318 | ) | | | — | | | | — | | | | (162,318 | ) |
Swaps | | | — | | | | (1,997 | ) | | | — | | | | (1,997 | ) |
| | | | | | | | | | | | | | | | |
Total Depreciation in Other Financial Instruments | | $ | (162,318 | ) | | $ | (39,820 | ) | | $ | — | | | $ | (202,138 | ) |
| | | | | | | | | | | | | | | | |
All portfolio holdings designated as Level 1 are disclosed individually on the CSOIs. Please refer to the CSOIs for industry class specifics of the portfolio holdings.
There were no transfers among any levels during the period ended October 31, 2016. Transfers between fair value levels are valued utilizing values as of the beginning of the period.
B. Restricted Securities — Certain securities held by the Fund may be subject to legal or contractual restrictions on resale. Restricted securities generally are resold in transactions exempt from registration under the Securities Act of 1933 (the “Securities Act”). Disposal of these securities may involve time-consuming negotiations and expense. Prompt sale at the current valuation may be difficult and could adversely affect the net assets of the Fund.
As of October 31, 2016, the Fund had no investments in restricted securities other than securities sold to the Fund under Rule 144A.
| | | | | | | | |
| | | |
| OCTOBER 31, 2016 | | JPMORGAN EXCHANGE-TRADED FUNDS | | | | | 37 | |
NOTES TO CONSOLIDATED FINANCIAL STATEMENTS
AS OF OCTOBER 31, 2016 (continued)
C. Derivatives — The Fund used derivative instruments including futures, forward foreign currency exchange contracts and swaps, in connection with its investment strategy. Derivative instruments may be used as substitutes for securities in which the Fund can invest, to hedge portfolio investments or to generate income or gains to the Fund. Certain derivatives are synthetic instruments that attempt to replicate the performance of certain reference assets.
The Fund may be subject to various risks from the use of derivatives including the risk that changes in the value of a derivative may not correlate perfectly with the underlying asset, rate or index; counterparty credit risk related to derivatives counterparties’ failure to perform under contract terms; liquidity risk related to the lack of a liquid market for these contracts allowing the Fund to close out its position(s); and, documentation risk relating to disagreement over contract terms. Investing in certain derivatives also results in a form of leverage and as such, the Fund’s risk of loss associated with these instruments may exceed their value, as recorded in the Consolidated Statement of Assets and Liabilities (“CSAL”).
The Fund is party to various derivative contracts governed by International Swaps and Derivatives Association master agreements (“ISDA agreements”). The Fund’s ISDA agreements, which are separately negotiated with each dealer counterparty, may contain provisions allowing, absent other considerations, a counterparty to exercise rights, to the extent not otherwise waived, against the Fund in the event the Fund’s net assets decline over time by a pre-determined percentage or fall below a pre-determined floor. The ISDA agreements also contain provisions allowing, absent other conditions, the Fund to exercise rights, to the extent not otherwise waived, against the counterparty (i.e., decline in a counterparty’s credit rating below a specified level). Such rights for both the counterparty and Fund often include the ability to terminate (i.e., close out) open contracts at prices which may favor the counterparty, which could have an adverse effect on the Fund. The ISDA agreements give the Fund and counterparty the right, upon an event of default, to close out all transactions traded under such agreements and to net amounts owed or due across all transactions and offset such net payable or receivable with collateral posted to a segregated account by one party to the other.
Counterparty credit risk may be mitigated to the extent a counterparty posts collateral for mark-to-market gains to the Fund.
Notes C(1) — C(4) below describe the various derivatives used by the Fund.
(1). Futures Contracts — The Fund used index, treasury and commodity futures to obtain long and short exposure to the underlying commodities markets.
Futures contracts provide for the delayed delivery of the underlying instrument at a fixed price or are settled for a cash amount based on the change in the value of the underlying instrument at a specific date in the future. Upon entering into a futures contract, the Fund is required to deposit with the broker, cash or securities in an amount equal to a certain percentage of the contract amount, which is referred to as the initial margin deposit. Subsequent payments, referred to as variation margin, are made or received by the Fund periodically and are based on changes in the market value of open futures contracts. Changes in the market value of open futures contracts are recorded as Change in net unrealized appreciation/depreciation in the Consolidated Statement of Operations (“CSOP”). Realized gains or losses, representing the difference between the value of the contract at the time it was opened and the value at the time it was closed, are reported in the CSOP at the closing or expiration of the futures contract. Securities deposited as initial margin are designated in the CSOI and cash deposited is recorded on the CSAL. A receivable from and/or a payable to brokers for the daily variation margin is also recorded on the CSAL.
The use of futures contracts exposes the Fund to interest rate risk, commodities risk and equity price risk. The Fund may be subject to the risk that the change in the value of the futures contract may not correlate perfectly with the underlying instrument. Use of long futures contracts subjects the Fund to risk of loss in excess of the amounts shown on the CSAL, up to the notional amount of the futures contracts. Use of short futures contracts subjects the Fund to unlimited risk of loss. The Fund may enter into futures contracts only on exchanges or boards of trade. The exchange or board of trade acts as the counterparty to each futures transaction; therefore, the Fund’s credit risk is limited to failure of the exchange or board of trade. Under some circumstances, futures exchanges may establish daily limits on the amount that the price of a futures contract can vary from the previous day’s settlement price, which could effectively prevent liquidation of positions.
The Fund’s futures contracts are not subject to master netting arrangements (the right to close out all transactions traded with a counterparty and net amounts owed or due across transactions).
(2). Forward Foreign Currency Exchange Contracts — The Fund may be exposed to foreign currency risks associated with portfolio investments and therefore, at times, used forward foreign currency exchange contracts to hedge or manage these exposures. The Fund also bought forward foreign currency exchange contracts to gain exposure to currencies. Forward foreign currency exchange contracts represent obligations to purchase or sell foreign currency on a specified future date at a price fixed at the time the contracts are entered into. Non-deliverable forward foreign currency exchange contracts are settled with the counterparty in U.S. Dollar without the delivery of foreign currency.
The values of the forward foreign currency exchange contracts are adjusted daily based on the applicable exchange rate of the underlying currency. Changes in the value of these contracts are recorded as unrealized appreciation or depreciation until the contract settlement date. When the forward foreign currency exchange contract is closed, the Fund records a realized gain or loss equal to the difference between the value at the time the contract was opened and the value at the time it was closed. The Fund also records a realized gain or loss when a forward foreign currency exchange contract offsets another forward foreign currency exchange contract with the same counterparty upon settlement.
| | | | | | |
| | | |
| 38 | | | | JPMORGAN EXCHANGE-TRADED FUNDS | | OCTOBER 31, 2016 |
The Fund’s forward foreign currency exchange contracts are subject to master netting arrangements (the right to close out all transactions with a counterparty and net amounts owed or due across transactions). As of October 31, 2016, the Fund did not receive or post collateral for forward foreign currency exchange contracts.
(3). Total Return Basket Swaps — The Fund entered into total return basket swap agreements to obtain exposure to a portfolio of long and short securities. This is a highly specialized activity and a significant aspect of the Fund’s investment strategy.
Under the terms of the agreements, each swap is designed to function as a portfolio of direct investments in long and short equity positions. This means that the Fund has the ability to trade in and out of long and short positions within each swap and will receive all of the economic benefits and risks equivalent to direct investments in these positions such as: capital appreciation (depreciation), corporate actions and dividends received and paid, all of which are reflected in each swap value. Each swap value also includes interest charges and credits related to the notional values of the long and short positions and cash balances within each swap. These interest charges and credits are based on defined market rates based on the local currencies of the positions in the portfolio plus or minus a specified spread and are referred to herein as “financing costs”. Positions within each swap, accrued financing costs and net dividends, are part of the monthly reset. During a reset, any unrealized gains (losses) on positions, accrued financing costs, and net dividends become available for cash settlement between the Fund and the swap counterparty and are recorded as Due from/to counterparty for swap contract on the CSAL and as net realized gain (loss) on transactions from swaps on the CSOP.
The Fund may be required to post or receive collateral based on the net value of the Fund’s outstanding OTC swap contracts with the counterparty in the form of cash or securities. Daily movement of collateral is subject to minimum threshold amounts. Collateral posted by the Fund is held in a segregated account at the Fund’s custodian bank. Cash collateral posted by the Fund is reported on the CSAL as Restricted cash. Collateral received by the Fund is held in escrow in segregated accounts maintained by JPMorgan Chase Bank, N.A. (“JPMCB”), an affiliate of the Fund.
Each swap involves additional risks than if the Fund had invested in the underlying positions directly including: the risk that changes in the value of each swap may not correlate perfectly with the underlying long and short securities; counterparty risk related to the counterparty’s failure to perform under contract terms; liquidity risk related to the lack of a liquid market for each swap contract, which may limit the ability of the Fund to close out its positions; and, documentation risk relating to disagreement over contract terms. The total return basket swaps consist of securities that are denominated in foreign currencies. Changes in currency exchange rates will affect the value of, and investment income from, such securities. Investing in swaps results in a form of leverage (i.e., the Fund’s risk of loss associated with these instruments may exceed their value as recorded on the CSAL).
The value of each swap is derived from a combination of (i) the net value of the underlying positions, which are valued daily using the last sale or closing prices on the principal exchange on which the underlying securities are traded; (ii) financing costs; (iii) the value of dividends; (iv) cash balances within the swap; and (v) other factors, as applicable. The value of each swap is reflected on the CSAL as Outstanding swap contracts, at value. Changes in the value of each swap are recognized as Change in net unrealized appreciation/depreciation of swaps on the CSOP.
The total return basket swaps contracts are subject to master netting arrangements.
(4). Summary of Derivatives Information — The following tables present the value of derivatives held as of October 31, 2016, by their primary underlying risk exposure and respective location on the CSAL:
| | | | | | | | | | | | | | | | | | |
| Derivatives Contracts | | CSAL Location | | | | | | | | | | | | |
| Gross Assets: | | | | Futures Contracts (a) | | | Forward Foreign Currency Exchange
Contracts | | | Swaps | | | Total | |
| Interest rate contracts | | Receivables, Net Assets — Unrealized Appreciation | | $ | 30,603 | | | $ | — | | | $ | — | | | $ | 30,603 | |
| Equity Contracts | | Receivables, Net Assets — Unrealized Appreciation | | | 31,413 | | | | — | | | | — | | | | 31,413 | |
| Foreign exchange contracts | | Receivables | | | — | | | | 98,527 | | | | — | | | | 98,527 | |
| Commodity contracts | | Receivables, Net Assets — Unrealized Appreciation | | | 79,914 | | | | — | | | | — | | | | 79,914 | |
| | | | | | | | | | | | | | | | | | |
Total | | | | $ | 141,930 | | | $ | 98,527 | | | $ | — | | | $ | 240,457 | |
| | | | | | | | | | | | | | | | | | |
| | | | | |
Gross Liabilities: | | | | | | | | | | | | | | |
| Interest rate contracts | | Payables, Net Assets — Unrealized Depreciation | | $ | (88,623 | ) | | $ | — | | | $ | — | | | $ | (88,623 | ) |
| Equity Contracts | | Payables, Net Assets — Unrealized Depreciation | | | (10,335 | ) | | | — | | | | (1,997 | ) | | | (12,332 | ) |
| Foreign exchange contracts | | Payables | | | — | | | | (37,823 | ) | | | — | | | | (37,823 | ) |
| Commodity contracts | | Payables, Net Assets — Unrealized Depreciation | | | (63,360 | ) | | | — | | | | — | | | | (63,360 | ) |
| | | | | | | | | | | | | | | | | | |
Total | | | | $ | (162,318 | ) | | $ | (37,823 | ) | | $ | (1,997 | ) | | $ | (202,138 | ) |
| | | | | | | | | | | | | | | | | | |
| (a) | This amount represents the cumulative appreciation/depreciation of futures contracts as reported on the CSOI. The CSAL only reflects the current day variation margin receivable/payable from/to brokers. |
| | | | | | | | |
| | | |
| OCTOBER 31, 2016 | | JPMORGAN EXCHANGE-TRADED FUNDS | | | | | 39 | |
NOTES TO CONSOLIDATED FINANCIAL STATEMENTS
AS OF OCTOBER 31, 2016 (continued)
The following tables present the Fund’s gross derivative assets and liabilities by counterparty net of amounts available for offset under netting arrangements and any related collateral received or posted by the Fund as of October 31, 2016:
| | | | | | | | | | | | | | | | |
| Counterparty | | Gross Amount of Derivative Assets are
subject to netting
arrangements Presented on the CSAL (a) | | | Derivatives Available for offset | | | Collateral
Received | | | Net Amount Due From Counterparty
(Not less than zero) | |
Bank of America | | $ | 1,635 | | | $ | — | | | $ | — | | | $ | 1,635 | |
Deutsche Bank | | | 46,741 | | | | (10,047 | ) | | | — | | | | 36,694 | |
Goldman Sachs | | | 116 | | | | — | | | | — | | | | 116 | |
Merrill Lynch | | | 2,124 | | | | (2,124 | ) | | | — | | | | — | |
Royal Bank of Canada | | | 9,186 | | | | (2,793 | ) | | | — | | | | 6,393 | |
Toronto Bank | | | 40,360 | | | | (356 | ) | | | — | | | | 40,004 | |
UBS | | | 19 | | | | (19 | ) | | | — | | | | — | |
| | | | | | | | | | | | | | | | |
| | $ | 100,181 | | | $ | (15,339 | ) | | $ | — | | | $ | 84,842 | |
| | | | | | | | | | | | | | | | |
| | | | |
| Counterparty | | Gross Amount of Derivative Liabilities
are subject to netting
arrangements Presented on the CSAL (a) | | | Derivatives Available for offset | | | Collateral
Posted | | | Net Amount Due to Counterparty
(Not less than zero) | |
Deutsche Bank | | $ | 10,047 | | | $ | (10,047 | ) | | $ | — | | | $ | — | |
Merrill Lynch | | | 24,627 | | | | (2,124 | ) | | | — | | | | 22,503 | |
Royal Bank of Canada | | | 2,793 | | | | (2,793 | ) | | | — | | | | — | |
Toronto Bank | | | 356 | | | | (356 | ) | | | — | | | | — | |
UBS | | | 3,651 | | | | (19 | ) | | | — | | | | 3,632 | |
| | | | | | | | | | | | | | | | |
| | $ | 41,474 | | | $ | (15,339 | ) | | $ | — | | | $ | 26,135 | |
| | | | | | | | | | | | | | | | |
| (a) | For financial reporting purposes, the Fund does not offset derivative assets and derivative liabilities subject to master netting arrangements in the CSAL. |
The following tables present the effect of derivatives on the CSOP for the period ended October 31, 2016, by primary underlying risk exposure:
| | | | | | | | | | | | | | | | |
| Amount of Realized Gain (Loss) on Derivatives Recognized on the CSOP | |
| Derivatives Contracts: | | Futures Contracts | | | Forward Foreign Currency Exchange
Contracts | | | Swaps | | | Total | |
Interest rate contracts | | $ | 4,817 | | | $ | — | | | $ | — | | | $ | 4,817 | |
Equity Contracts | | | (1,216 | ) | | | — | | | | 292,330 | | | | 291,114 | |
Foreign exchange contracts | | | — | | | | 40,632 | | | | — | | | | 40,632 | |
Commodity contracts | | | 21,894 | | | | — | | | | — | | | | 21,894 | |
| | | | | | | | | | | | | | | | |
Total | | $ | 25,495 | | | $ | 40,632 | | | $ | 292,330 | | | $ | 358,457 | |
| | | | | | | | | | | | | | | | |
|
| Amount of Change in Unrealized Appreciation (Depreciation) on Derivatives Recognized on the CSOP | |
| Derivatives Contracts: | | Futures Contracts | | | Forward Foreign Currency Exchange
Contracts | | | Swaps | | | Total | |
Interest rate contracts | | $ | (35,498 | ) | | $ | — | | | $ | — | | | $ | (35,498 | ) |
Equity Contracts | | | (1,444 | ) | | | — | | | | (1,997 | ) | | | (3,441 | ) |
Foreign exchange contracts | | | — | | | | 60,704 | | | | — | | | | 60,704 | |
Commodity contracts | | | 16,554 | | | | — | | | | — | | | | 16,554 | |
| | | | | | | | | | | | | | | | |
Total | | $ | (20,388 | ) | | $ | 60,704 | | | $ | (1,997 | ) | | $ | 38,319 | |
| | | | | | | | | | | | | | | | |
The Fund’s derivatives contracts held at October 31, 2016 are not accounted for as hedging instruments under GAAP.
| | | | | | |
| | | |
| 40 | | | | JPMORGAN EXCHANGE-TRADED FUNDS | | OCTOBER 31, 2016 |
Derivatives Volume
The table discloses the volume of the Fund’s futures contracts, forward foreign currency exchange contracts and swaps activity during the period ended October 31, 2016. Please refer to the table in the Summary of Derivatives Information for derivative-related gains and losses associated with volume activity.
| | | | |
Futures Contracts: (a) | | | | |
Commodity | | | | |
Average Notional Balance Long | | $ | 1,694,986 | |
Average Notional Balance Short | | | 1,812,418 | |
Ending Notional Balance Long | | | 3,082,904 | |
Ending Notional Balance Short | | | 3,332,336 | |
Equity | | | | |
Average Notional Balance Long | | | 767,581 | |
Average Notional Balance Short | | | 2,179,148 | |
Ending Notional Balance Long | | | 355,036 | |
Ending Notional Balance Short | | | 3,710,175 | |
Interest | | | | |
Average Notional Balance Long | | | 7,842,796 | |
Average Notional Balance Short | | | 4,959,743 | |
Ending Notional Balance Long | | | 14,741,802 | |
Ending Notional Balance Short | | | 8,054,673 | |
| |
Forward Foreign Currency Exchange Contracts (a) | | | | |
Average Settlement Value Purchased | | | 4,795,323 | |
Average Settlement Value Sold | | | 5,422,373 | |
Ending Settlement Value Purchased | | | 8,297,888 | |
Ending Settlement Value Sold | | | 9,348,764 | |
| |
Total Return Basket Swaps (a) | | | | |
Average Notional Balance Long | | | 10,916,185 | |
Average Notional Balance Short | | | 9,927,509 | |
Ending Notional Balance Long | | | 18,145,920 | |
Ending Notional Balance Short | | | 16,715,898 | |
| (a) | For the period from September 12, 2016 through October 31, 2016. |
D. Foreign Currency Translation — The books and records of the Fund are maintained in U.S. dollars. Foreign currency amounts are translated into U.S. dollars at the prevailing exchange rates of such currencies against the U.S. dollar. The market value of investment securities and other assets and liabilities are translated at the exchange rate as of the valuation date. Purchases and sales of investment securities, income and expenses are translated at the exchange rate prevailing on the respective dates of such transactions.
The Fund does not isolate the effect of changes in foreign exchange rates from changes in market prices of securities held. Accordingly, such changes are included within Change in net unrealized appreciation/depreciation on investments on the CSOP.
E. Offering and Organizational Costs — Total offering costs incurred in connection with the offering of shares of the Fund are amortized on a straight line basis over 12 months from the date the Fund commenced operations. Costs paid in connection with the organization of the Trust, if any, were recorded as an expense at the time it commenced operations. For the period ended October 31, 2016, approximate offering costs incurred by the Fund were $15,754.
F. Security Transactions and Investment Income — Investment transactions are accounted for on the trade date (the date the order to buy or sell is executed). Securities gains and losses are calculated on a specifically identified cost basis. Dividend income, net of foreign taxes withheld, if any, is recorded on the ex-dividend date or when a fund first learns of the dividend.
To the extent such information is publicly available, the Fund records distributions received in excess of income earned from underlying investments as a reduction of cost of investments and/or realized gain. Such amounts are based on estimates if actual amounts are not available and actual amounts of income, realized gain and return of capital may differ from the estimated amounts. The Fund adjusts the estimated amounts of the components of distributions (and consequently their net investment income) as necessary once the issuers provide information about the actual composition of the distributions.
G. Allocation of Expenses — Expenses directly attributable to a fund are charged directly to that fund, while the expenses attributable to more than one fund of the Trust are allocated among the respective funds.
| | | | | | | | |
| | | |
| OCTOBER 31, 2016 | | JPMORGAN EXCHANGE-TRADED FUNDS | | | | | 41 | |
NOTES TO CONSOLIDATED FINANCIAL STATEMENTS
AS OF OCTOBER 31, 2016 (continued)
H. Federal Income Taxes — The Fund is treated as a separate taxable entity for Federal income tax purposes. The Fund’s policy is to comply with the provisions of the Internal Revenue Code of 1986, as amended (the “Code”), applicable to regulated investment companies and to distribute to shareholders all of its distributable net investment income and net realized gain on investments. Accordingly, no provision for Federal income tax is necessary. Management has reviewed the Fund’s tax positions for all open tax years and has determined that as of October 31, no liability for income tax is required in the Fund’s consolidated financial statements for net unrecognized tax benefits. However, management’s conclusions may be subject to future review based on changes in, or the interpretation of, the accounting standards or tax laws and regulations. The Fund’s Federal tax returns for the prior three fiscal years, or since inception if shorter, remain subject to examination by the Internal Revenue Service.
For Federal income tax purposes, taxable income of the Fund and the Subsidiary are separately calculated. The Subsidiary is classified as a controlled foreign corporation under the Code and its taxable income, including net gains, is included as ordinary income in the calculation of the Fund’s taxable income. Net losses of the Subsidiary are not deductible by the Fund either in the current period or carried forward to future periods.
I. Foreign Taxes — The Fund may be subject to foreign taxes on income, gains on investments or currency purchases/repatriation, a portion of which may be recoverable. The Fund will accrue such taxes and recoveries as applicable, based upon its current interpretation of tax rules and regulations that exist in the markets in which it invests.
J. Distributions to Shareholders — Distributions from net investment income, if any, are generally declared and paid annually. Net realized capital gains, if any, are distributed by the Fund at least annually. The amount of distributions from net investment income and net realized capital gains is determined in accordance with Federal income tax regulations, which may differ from GAAP. To the extent these “book/tax” differences are permanent in nature (i.e., that they result from other than timing of recognition — “temporary differences”), such amounts are reclassified within the capital accounts based on their Federal tax-basis treatment.
The following amounts were reclassified within the capital accounts:
| | | | | | | | | | | | |
| | | Paid-in
Capital | | | Undistributed Net
Investment Income | | | Accumulated Net Realized Loss | |
| | $ | (33,040 | ) | | $ | 383,276 | | | $ | (350,236 | ) |
The reclassifications for the Fund relate primarily to reclassification of income and expense from swap transactions, investment in subsidiary and certain foreign currency related transactions.
3. Fees and Other Transactions with Affiliates
A. Investment Advisory Fee — Pursuant to the Investment Advisory Agreement, the Adviser supervises the investments of the Fund and the Subsidiary and for such services is paid a fee. The fee for services to the Fund is accrued daily and paid monthly at an annual rate of 0.60% of the Fund’s average daily net assets.
The Subsidiary has entered into a separate contract with the Adviser to provide investment advisory and other services to the Subsidiary. The fee for services to the Subsidiary is accrued daily and paid monthly at an annual rate of 0.60% of the Subsidiary’s average daily net assets. The Adviser has agreed to waive the advisory fee that it receives from the Fund in an amount equal to the advisory fee paid to the Adviser by the Subsidiary. This waiver will continue in effect so long as the Fund invests in the Subsidiary and may not be terminated without approval by the Fund’s Board.
The Adviser waived Investment Advisory fees and/or reimbursed expenses as outlined in Note 3.D.
B. Administration Fee — Pursuant to an Administration Agreement, the Administrator, provides certain administration services to the Fund and the Subsidiary. In consideration of these services for the Fund, the Administrator receives a fee accrued daily and paid monthly at the annual rate of 0.085% of the daily net assets, notwithstanding any fee waivers and/or expense reimbursements. In consideration for services rendered to the Subsidiary, the Administrator receives a fee accrued daily and paid monthly at an annual rate of 0.10% of the average daily net assets of the Subsidiary.
The Administrator waived Administration fees as outlined in Note 3.D.
C. Custodian and Transfer Agent Fees — JPMCB, a wholly-owned subsidiary of JPMorgan, provides portfolio custody and transfer agent services to the Fund. The amounts paid directly to JPMCB by the Fund for custody services are included in the Custodian and Transfer Agent fees on the CSOP. With respect to the transfer agency services provided by JPMCB for each creation or redemption transaction, the Authorized Participant will generally be responsible for such associated expenses; during the period, the Fund paid no transfer agency fees to JPMCB.
Additionally, Authorized Participants generally pay transaction fees associated with the creation and redemption of Fund shares. These fees are used to offset certain custodian charges incurred by the Fund for these transactions.
For the period ended October 31, 2016, the amount of transaction fees paid by the Authorized Participants that were used to reimburse custodian fees was $750.
Restricted cash on the Statement of Assets and Liabilities is cash received from Authorized Participants for the reimbursement of creation and/or redemption of Fund shares.
Interest income earned on cash balances at the custodian, if any, is included in Interest income from affiliates on the CSOP.
| | | | | | |
| | | |
| 42 | | | | JPMORGAN EXCHANGE-TRADED FUNDS | | OCTOBER 31, 2016 |
Interest expense paid to the custodian related to cash overdrafts, if any, is included in Interest expense to affiliates on the CSOP.
D. Waivers and Reimbursements — The Adviser has contractually agreed to waive fees and/or reimburse the Fund to the extent that total annual operating expenses (excluding acquired fund fees and expenses, dividend expenses related to short sales (if applicable), interest, taxes, expenses related to litigation and potential litigation, and extraordinary expenses) exceed 0.85% of the Fund’s average daily net assets.
The expense limitation agreements were in effect for the period ended October 31, 2016. The contractual expense limitation percentage is in place until at least June 14, 2019.
For the period ended October 31, 2016, the Fund’s service providers waived fees and/or reimbursed expenses for the Fund as follows. None of these parties expect the Fund to repay any such waived fees and/or reimbursed expenses in future years.
| | | | | | | | | | | | | | | | |
| | | Contractual Waivers | | | | | | | |
| | | Investment
Advisory | | | Administration | | | Total | | | Contractual
Reimbursements | |
| | $ | 21,733 | | | $ | 3,079 | | | $ | 24,812 | | | $ | 170,781 | |
Additionally, the Fund may invest in one or more money market funds advised by the Adviser or its affiliates (affiliated money market funds). The Adviser has agreed to waive the total expense ratio of the underlying funds.
The amount of the waivers resulting from investments in these money market funds during the period ended October 31, 2016 was $66. This amount is included in “fees waived” on the CSOP.
E. Related Party Transactions — The Distributor or its agent distributes Creation Units for the Fund on an agency basis. The Distributor does not maintain a secondary market in shares of the Fund. The Distributor has no role in determining the investment policies of the Fund or the securities that are purchased or sold by the Fund. SIDCO receives no fee for its distribution services under the Distribution Agreement. Although the Distributor does not receive any fees under the Distribution Agreement with the Trust, JPMIM pays the Distributor for certain distribution related services.
F. Other — Certain officers of the Trust are affiliated with the Adviser. Such officers, with the exception of the Chief Compliance Officer, receive no compensation from the Fund for serving in their respective roles.
The Board of Trustees appointed a Chief Compliance Officer to the Fund in accordance with Federal securities regulations. The Fund, along with other affiliated funds, makes reimbursement payments, on a pro-rata basis, to the Administrator for a portion of the fees associated with the Office of the Chief Compliance Officer. Such fees are included in Trustees’ and Chief Compliance Officer’s fees on the CSOP.
During the period ended October 31, 2016, the Fund may have purchased securities from an underwriting syndicate in which the principal underwriter or members of the syndicate are affiliated with the Adviser.
The Fund may use related party broker-dealers. For the period ended October 31, 2016, the Fund incurred no brokerage commissions with broker-dealers affiliated with the Advisor or Trust.
4. Investment Transactions
At October 31, 2016, the records of the fund reflected that 100% of the Fund’s total shares outstanding were held by two Authorized Participants, in the form of creation units. However, the individual shares carrying such creation units are listed and traded under the NYSE Arca and have been purchased and sold by persons other than Authorized Participants.
During the period ended October 31, 2016, purchases and sales of investments (excluding short-term investments) were as follows:
| | | | | | | | |
| | | Purchases (excluding U.S. Government) | | | Sales (excluding U.S. Government) | |
| | $ | 31,943,021 | | | $ | 843,826 | |
During the period ended October 31, 2016, there were no purchases or sales of U.S. Government securities.
5. Federal Income Tax Matters
For Federal income tax purposes, the estimated cost and unrealized appreciation (depreciation) in value of investment securities, including the Subsidiary, held at October 31, 2016 were as follows:
| | | | | | | | | | | | | | | | |
| | | Aggregate
Cost | | | Gross
Unrealized
Appreciation | | | Gross
Unrealized
Depreciation | | | Net Unrealized
Appreciation
(Depreciation) | |
| | $ | 50,322,221 | | | $ | 329,315 | | | $ | (450,823 | ) | | $ | (121,508 | ) |
The difference between book and tax basis appreciation (depreciation) on investments is primarily attributed to wash sales.
| | | | | | | | |
| | | |
| OCTOBER 31, 2016 | | JPMORGAN EXCHANGE-TRADED FUNDS | | | | | 43 | |
NOTES TO CONSOLIDATED FINANCIAL STATEMENTS
AS OF OCTOBER 31, 2016 (continued)
The Federal income tax unrealized appreciation (depreciation) in value of investment securities includes unrealized depreciation of the Fund’s investment in its subsidiary of $16,488, when if realized is not deductible for income tax purposes.
There were no taxable distributions for the period ended October 31, 2016.
As of October 31, 2016, the estimated components of net assets (excluding paid-in-capital) on a tax basis were as follows:
| | | | | | | | | | | | | | | | | | | | |
| | | Undistributed
Ordinary Income | | | Undistributed
Long-Term
Capital Gain | | | Unrealized
Appreciation
(Depreciation) | | | Other Temporary
Differences | | | Total Distributable
Earnings | |
| | $ | 431,275 | | | $ | 9,632 | | | $ | (82,174 | ) | | $ | (73,946 | ) | | $ | 284,787 | |
As of October 31, 2016, the Fund had no capital loss carryforwards.
6. Capital Share Transactions
The Trust issues and redeems shares of the Fund only in Creation Units through the Distributor at NAV. Capital shares transactions detail can be found in the Consolidated Statement of Changes in Net Assets.
Shares of the Fund may only be purchased or redeemed by Authorized Participants. An Authorized Participant is either (1) a “Participating Party” or other participant in the clearing process through the Continuous Net Settlement System of the National Securities Clearing Corporation (“NSCC”); or (2) a “DTC Participant”; which, in either case, must have executed an agreement with the Distributor.
Creation Units of the Fund may be created in advance of receipt by the Trust of all or a portion of the applicable basket of equity securities and other instruments (“Deposit Instruments”) and cash as described in the Fund’s registration statement. In these instances, the initial Deposit Instruments and cash must be deposited in an amount equal to the sum of the cash amount, plus at least 105% of the market value of undelivered Deposit Instruments. A transaction fee may be imposed to offset transfer and other transaction costs associated with the purchase or redemption of Creation Units.
Authorized Participants transacting in Creation Units for cash may also pay a variable charge to compensate the relevant fund for market impact expenses relating to investing in portfolio securities. Such variable charges, if any, are included in “Proceeds from shares purchased” or “Proceeds from shares sold” in the Consolidated Statements of Changes in Net Assets.
7. Risks, Concentrations and Indemnifications
In the normal course of business, the Fund enters into contracts that contain a variety of representations which provide general indemnifications. The Fund’s maximum exposure under these arrangements is unknown. The amount of exposure would depend on future claims that may be made against the Fund that have not yet occurred. However, based on experience, the Fund expects the risk of loss to be remote.
As of October 31, 2016, the Adviser owned 95.1% of the outstanding shares of the Fund.
By investing in the Subsidiary, the Fund is indirectly exposed to the risks associated with the Subsidiary’s investments. The derivatives and other investments held by the Subsidiary are generally similar to those that are permitted to be held by the Fund and are subject to the same risks that apply to similar investments if held directly by the Fund.
The Fund will employ various alternative investment strategies that involve the use of complicated investment techniques. There is no guarantee that these strategies will succeed and their use may subject the Fund to greater volatility and loss.
Derivatives, including swap agreements, and futures may be riskier than other types of investments because they may be more sensitive to changes in economic or market conditions than other types of investments and could result in losses that significantly exceed the Fund’s original investment. Many derivatives create leverage thereby causing the Fund to be more volatile than it would be if it had not used derivatives. Derivatives also expose the Fund to counterparty risk including the credit risk of the derivative counterparty.
Disruptions to creations and redemptions, the existence of significant market volatility or potential lack of an active trading market for the Shares (including through a trading halt), as well as other factors, may result in Shares trading significantly above (at a premium) or below (at a discount) to the NAV or to the intraday value of the Fund’s holdings. During such periods, investors may incur significant losses if shares are sold.
The Fund is also subject to counterparty credit risk, which is the risk that a counterparty fails to perform on agreements with the Fund such as swaps and forward foreign currency exchange contracts.
The Fund’s investment in commodity-linked derivative instruments may subject the Fund to greater volatility than investments in traditional securities, particularly if the instruments involve leverage. The value of commodity-linked derivative instruments may be affected by changes in overall market movements, commodity index volatility, changes in interest rates, or factors affecting a particular industry or commodity, such as drought, floods, weather, livestock disease, embargoes, tariffs and international economic, political and regulatory developments.
The Fund is subject to counterparty risk, which is the risk that a counterparty will not fulfill its contractual obligations arising from agreements with the Fund such as forward foreign currency exchange contracts.
| | | | | | |
| | | |
| 44 | | | | JPMORGAN EXCHANGE-TRADED FUNDS | | OCTOBER 31, 2016 |
REPORT OF INDEPENDENT REGISTERED PUBLIC ACCOUNTING FIRM
To the Board of Trustees of J.P. Morgan Exchange-Traded Fund Trust and the Shareholders of JPMorgan Diversified Alternatives
In our opinion, the accompanying consolidated statement of assets and liabilities, including the consolidated schedule of portfolio investments, and the related consolidated statements of operations and of changes in net assets and the consolidated financial highlights present fairly, in all material respects, the financial position of JPMorgan Diversified Alternatives ETF (a separate series of J.P. Morgan Exchange-Traded Fund Trust) and its subsidiary (the “Fund”) as of October 31, 2016, and the results of their operations, the changes in their net assets and the financial highlights for the period September 12, 2016 (commencement of operations) through October 31, 2016, in conformity with accounting principles generally accepted in the United States of America. These financial statements and financial highlights (hereafter referred to as “financial statements”) are the responsibility of the Fund’s management. Our responsibility is to express an opinion on these financial statements based on our audits. We conducted our audits of these financial statements in accordance with the standards of the Public Company Accounting Oversight Board (United States). Those standards require that we plan and perform the audit to obtain reasonable assurance about whether the financial statements are free of material misstatement. An audit includes examining, on a test basis, evidence supporting the amounts and disclosures in the financial statements, assessing the accounting principles used and significant estimates made by management, and evaluating the overall financial statement presentation. We believe that our audits, which included confirmation of securities as of October 31, 2016 by correspondence with the transfer agent, custodian and brokers, provides a reasonable basis for our opinion.
PricewaterhouseCoopers LLP
New York, New York
December 21, 2016
| | | | | | | | |
| | | |
| OCTOBER 31, 2016 | | JPMORGAN EXCHANGE-TRADED FUNDS | | | | | 45 | |
SUPPLEMENTAL INFORMATION
FOR THE PERIOD INDICATED (Unaudited)
The table below indicates the number of trading days in which the Fund traded within the range of the premium/discount noted. The number of days in each range is also shown as a percentage of the total trading days for the period covered in the table. All information within the table is based on historical performance. Past performance cannot be used to predict future results. Shareholders may pay more than NAV when they buy fund shares and receive less than NAV when they sell those shares because shares are bought and sold at current market prices.
| | | | | | | | |
| | | Diversified Alternatives ETF (a) | |
| Range of Premium/(Discount) | | Day Count | | | Percentage | |
Greater than 1.0% and Less than or equal to 1.5% | | | 2 | | | | 5.88 | % |
Greater than 0.5% and Less than or equal to 1.0% | | | 15 | | | | 44.12 | % |
Between 0.5% and -0.5% | | | 17 | | | | 50.00 | % |
| | | | | | | | |
| | | 34 | | | | 100.00 | % |
| | | | | | | | |
| (a) | Commencement of operations was September 12, 2016. |
| | | | | | |
| | | |
| 46 | | | | JPMORGAN EXCHANGE-TRADED FUNDS | | OCTOBER 31, 2016 |
TRUSTEES
(Unaudited)
The Fund’s Statement of Additional Information includes additional information about the Funds Trustees and is available, without charge, upon request by calling 1-844-457-6383 or on the J.P. Morgan Funds’ website at www.jpmorganfunds.com.
| | | | | | | | |
Name (Year of Birth;
Positions With
the Funds since) | | Principal Occupation
During the Past 5 Years | | Number of
Funds in Fund
Complex Overseen
by Trustee (1) | | | Other Directorships Held
During the Past 5 Years |
Independent Trustees | | | | | | | | |
| | | |
Gary L. French (1951);
Trustee of the Trust since 2014 | | Real Estate Investor (2011-present); Senior Consultant for the Regulatory Fundamentals Group LLC (2011-present); Senior Vice President-Fund Administration, State Street Corporation (2002-2010). | | | 14 | | | Independent Trustee, The China Fund, Inc. (2013-present); Exchange Traded Concepts Trust II (2012-2014); Exchange Traded Concepts Trust I (2011-2014). |
| | | |
Robert J. Grassi (1957);
Trustee of the Trust since 2014 | | Sole Proprietor, Academy Hills Advisors LLC (2012-present); Pension Director, Coming Incorporated (2002-2012). | | | 14 | | | None. |
| | | |
Thomas P. Lemke (1954);
Trustee of the Trust since 2014 | | Retired; Executive Vice President and General Counsel, Legg Mason (2005-2013). | | | 14 | | | Independent Trustee of AXA Premier VIP Trust (2014-present); SEI family of funds, (Independent Trustee of The Advisors’ Inner Circle III Funds (5 portfolios) (2014-present)); Independent Trustee of O’Connor EQUUS (2014-present); Independent Trustee of Winton Series Trust (2014-present); Independent Director of The Victory Funds (or their predecessor funds) (35 portfolios) (2014-2015). |
| | | |
Lawrence R. Maffia (1950);
Trustee of the Trust since 2014 | | Retired; Director and President, ICI Mutual Insurance Company (2006-2013). | | | 14 | | | Director, ICI Mutual Insurance Company (1999-2013). |
| | | |
Emily A. Youssouf (1951);
Trustee of the Trust since 2014 | | Clinical Professor, NYU Schack Institute of Real Estate (2009-present); Board Member, NYC Health and Hospitals Corporation (2005-present); Board Member and Member of The Audit Committee and Related Parties Committee, PennyMac Financial Services, Inc. (2013-present) | | | 14 | | | Trustee, NYC School Construction Authority (2009-present); Board Member, NYS Job Development Authority (2008-present); Trustee (2015-present) and Chair of the Audit Committee (2015-present) of the Transit Center; Vice Chair (2011-2013) and Board Member (2013-2014) of New York City Housing Authority. |
Interested Trustee | | | | | | | | |
| | | |
Robert Deutsch (2) (1957);
Trustee of the Trust since 2014 | | Head of the Global ETF Business for JPMorgan Asset Management (2013-present); Head of the Global Liquidity Business for JPMorgan Asset Management (2003-2013). | | | 14 | | | None |
| (1) | A Fund complex means two or more registered investment companies that hold themselves out to investors as related companies for purposes of investment and investor services or have a common investment adviser or have an investment adviser that is an affiliated person of the investment adviser of any of the other registered investment companies. Eleven Funds are currently operating and three additional series are in registration and three additional series have been created and will be registered in the future. |
| (2) | Mr. Deutsch is an interested trustee because he is an employee of the Adviser. |
| | | | | | | | |
| | | |
| OCTOBER 31, 2016 | | JPMORGAN EXCHANGE-TRADED FUNDS | | | | | 47 | |
OFFICERS
(Unaudited)
| | |
Name (Year of Birth),
Positions Held with
the Trusts (Since) | | Principal Occupations During Past 5 Years |
| |
Robert F. Deutsch (1957),
President and Principal Executive Officer (2014)* | | Managing Director, global head of J.P. Morgan Asset Management’s Exchange Traded Funds and a member of the J.P. Morgan Global Funds Operating Committee. Previously, head of the Global Liquidity Business from 2003 to 2013 and National Sales Manager for J.P. Morgan’s U.S. Mutual Funds Business prior to 2003. |
| |
Lauren A. Paino (1973),
Treasurer and Principal Financial Officer (2015)*** | | Executive Director, J.P. Morgan Investment Management Inc. (formerly JPMorgan Funds Management, Inc.) since August 2013; Director, Credit Suisse Asset Management (2000-2013); Manager, PricewaterhouseCoopers LLP (1995-2000). |
| |
Paul Shield (1960),
Vice President and Assistant Treasurer (2016) | | Managing Director and head of Business Management for JPMorgan Asset Management’s Exchange Traded Fund platform since 2013. Senior Global Product Manager of Alternative Investments for BNY Mellon from 2011 to 2013 and Global Product Head for Exchange Traded Funds at JPMorgan Chase Bank from 2008 to 2011. |
| |
Brian S. Shlissel (1964),
Vice President (2016) | | Managing Director and Chief Administrative Officer, leads the JPMorgan U.S. Platform Management Team for JPMorgan’s pooled vehicles, including ETFs and mutual funds since 2014. Prior to joining JPMorgan in 2014, President and Chief Executive Officer for Mutual Funds and Head of Mutual Fund Services for Allianz Global Investors. |
| |
Frank J. Nasta (1964),
Secretary (2014) | | Managing Director and Associate General Counsel, JPMorgan Chase since 2008. |
| |
Stephen M. Ungerman (1953),
Chief Compliance Officer (2014) | | Managing Director, JPMorgan Chase & Co.; Mr. Ungerman has been with JPMorgan Chase & Co. since 2000. |
| |
Elizabeth A. Davin (1964),
Assistant Secretary (2014)** | | Executive Director and Assistant General Counsel, JPMorgan Chase since February 2012; formerly Vice President and Assistant General Counsel, JPMorgan Chase from 2005 until February 2012; Senior Counsel, JPMorgan Chase (formerly Bank One Corporation) from 2004 to 2005. |
| |
Jessica K. Ditullio (1962),
Assistant Secretary (2014)** | | Executive Director and Assistant General Counsel, JPMorgan Chase since February 2011; Ms. Ditullio has served as an attorney with various titles for JPMorgan Chase (formerly Bank One Corporation) since 1990. |
| |
John T. Fitzgerald (1975),
Assistant Secretary (2014) | | Executive Director and Assistant General Counsel, JPMorgan Chase since February 2011; formerly, Vice President and Assistant General Counsel, JPMorgan Chase from 2005 until February 2011. |
| |
Carmine Lekstutis (1980),
Assistant Secretary (2014) | | Executive Director and Assistant General Counsel, JPMorgan Chase since February 2015; formerly Vice President and Assistant General Counsel, JPMorgan Chase from 2011 to February 2015; Associate, Skadden, Arps, Slate, Meagler & Flom LLP (law firm) from 2006 to 2011. |
| |
Gregory S. Samuels (1980),
Assistant Secretary (2014) | | Executive Director and Assistant General Counsel, JPMorgan Chase since February 2014; formerly Vice President and Assistant General Counsel, JPMorgan Chase from 2010 to February 2014; Associate, Ropes & Gray (law firm) from 2008 to 2010. |
| |
Pamela L. Woodley (1971),
Assistant Secretary (2014)*** | | Vice President and Assistant General Counsel, JPMorgan Chase since November 2004. |
| |
Frederick J. Cavaliere (1978),
Assistant Treasurer (2015)*** | | Executive Director, J.P. Morgan Investment Management Inc. (formerly JPMorgan Funds Management, Inc.) since February 2016; formerly Vice President, J.P. Morgan Investment Management Inc. (formerly JPMorgan Funds Management, Inc.) since September 2011; formerly Vice President of J.P. Morgan Investment Management Inc. 2010-2011. Mr. Cavaliere has been with JPMorgan since May 2006. |
| |
Michael M. D’Ambrosio (1969),
Assistant Treasurer (2014) | | Managing Director, J.P. Morgan Investment Management Inc. (formerly JPMorgan Funds Management, Inc.) since 2014; formerly Executive Director, J.P. Morgan Investment Management Inc. (formerly JPMorgan Funds Management, Inc.) from 2012 to 2014; prior to joining JPMorgan Chase, Mr. D’Ambrosio was a Tax Director at PricewaterhouseCoopers LLP since 2006. |
| |
Julie A. Roach (1971),
Assistant Treasurer (2014)** | | Vice President, J.P. Morgan Investment Management Inc. (formerly JPMorgan Funds Management, Inc.) from August 2012; prior to joining JPMorgan Chase, Ms. Roach was a Senior Manager with Deloitte since 2001. |
| |
Jason Ronca (1978),
Assistant Treasurer (2014)**** | | Vice President, Assistant Treasurer and ETF Platform Manager for J.P. Morgan Asset Management since 2014. ETF Product Manager for Corporate Investment Bank responsible for setting the strategy and control agenda for the ETF servicing business from 2010 to May 2014; Prior to 2010, a Vice President in Fund Accounting within J.P. Morgan Investor Services, supporting a series of U.S. registered mutual funds. |
| * | | The contact address for the officer is 500 Stanton Christiana Road, Newark, DE 19173. |
| ** | | The contact address for the officer is 1111 Polaris Parkway, Columbus, OH 43240. |
| *** | | The contact address for the officer is 4 New York Plaza, New York, NY 10004. |
| **** | | The contact address for the officer is One Beacon Street, Boston, MA 02108. |
| | | | | | |
| | | |
| 48 | | | | JPMORGAN EXCHANGE-TRADED FUNDS | | OCTOBER 31, 2016 |
SCHEDULE OF SHAREHOLDER EXPENSES
(Unaudited)
Hypothetical $1,000 Investment
As a shareholder of the Fund, you incur ongoing costs, including investment advisory fees, administration fees, distribution fees and other Fund expenses, in addition to brokerage commissions on your purchases and sales of Fund shares. The examples below are intended to help you understand your ongoing costs (in dollars) of investing in the Fund and to compare these ongoing costs with the ongoing costs of investing in other funds. The examples assume that you had a $1,000 investment at the beginning of the reporting period, September 12, 2016 and continued to hold your shares at the end of the reporting period, October 31, 2016.
Actual Expenses
For the Fund in the table below, the first line provides information about actual account values and actual expenses. You may use the information in this line, together with the amount you invested, to estimate the expenses that you paid over the period. Simply divide your account value by $1,000 (for example, an $8,600 account value divided by
$1,000 = 8.6), then multiply the result by the number under the heading entitled “Expenses Paid During the Period” to estimate the expenses you paid on your account during this period.
Hypothetical Example for Comparison Purposes
The second line in the table below provides information about hypothetical account values and hypothetical expenses based on the Fund’s actual expense ratio and an assumed rate of return of 5% per year before expenses, which is not the Fund’s actual return. The hypothetical account values and expenses may not be used to estimate the actual ending account balance or expenses you paid for the period. You may use this information to compare the ongoing costs of investing in the Fund and other Funds. To do so, compare this 5% hypothetical example with the 5% hypothetical examples that appear in the shareholder reports of other funds. The examples also assume all dividends and distributions have been reinvested. The examples do not take into account brokerage commissions that you pay when purchasing or selling shares of the Fund.
| | | | | | | | | | | | | | | | |
| | | Beginning
Account Value
9/12/2016 | | | Ending
Account Value
10/31/2016 | | | Annualized
Expense
Ratios | | | Expenses
Paid During
Period | |
JPMorgan Diversified Alternatives ETF | | | | | | | | | | | | | | | | |
Actual Fund Return (1) | | $ | 1,000.00 | | | $ | 1,014.40 | | | | 0.85 | % | | $ | 1.12 | |
Hypothetical 5% Return (2) | | | 1,000.00 | | | | 1,020.86 | | | | 0.85 | | | | 4.32 | |
| (1) | Expenses are equal to the Fund’s annualized expense ratio, multiplied by the average account value over the period, multiplied by 48/366 (to reflect the actual period). The Fund commenced operations on September 12, 2016. |
| (2) | Expenses are equal to the Fund’s annualized expense ratio, multiplied by the average account value over the period, multiplied by 184/366 (to reflect the one-half year period). |
| | | | | | | | |
| | | |
| OCTOBER 31, 2016 | | JPMORGAN EXCHANGE-TRADED FUNDS | | | | | 49 | |
BOARD APPROVAL OF INITIAL INVESTMENT ADVISORY AGREEMENT
(Unaudited)
For the JPMorgan Diversified Alternatives ETF
On September 8 - 9, 2015, the Board of the Trust, a statutory Trust organized under the laws of the State of Delaware, held an in-person meeting and approved the initial Investment Advisory Agreement (“Agreement”) for the JPMorgan Diversified Alternatives ETF (the “Fund”). The approval included the approval of a majority of Trustees who are not interested persons of the Trust or the Adviser. Such Trustees are considered Independent Trustees as defined by the 1940 Act. In connection with the approval of the Agreement for the Fund, the Trustees reviewed written materials prepared by the Adviser and received oral presentations from Adviser personnel. Before voting on the proposed Agreement, the Trustees reviewed the Agreement with representatives of the Adviser and with counsel to the Trust and independent legal counsel and received a memorandum from independent legal counsel to the Trustees discussing the legal standards for their consideration of the proposed Agreement. The Trustees also discussed the proposed Agreement in an executive session with independent legal counsel at which no representatives of the Adviser were present. Set forth below is a summary of the material factors evaluated by the Trustees in determining whether to approve the Agreement for the Fund.
The Trustees considered information provided with respect to the Fund and the approval of the Agreement. Each Trustee attributed different weights to the various factors, and no factor alone was considered determinative. The Trustees determined that the proposed compensation to be received by the Adviser from the Fund under the Agreement was fair and reasonable and that the initial approval of the Agreement was in the best interests of the Fund and its potential shareholders.
The factors summarized below were considered and discussed by the Trustees in reaching their conclusions:
Nature, Extent and Quality of Services Provided by the Adviser
In connection with the approval of the initial Agreement, the Trustees considered the materials furnished specifically in connection with the approval of the Agreement, as well as other relevant information furnished for the Trustees. The Trustees considered the background and experience of the Adviser’s senior management and investment personnel, as well as the qualifications, backgrounds and responsibilities of the portfolio management team primarily responsible for the day-to-day management of the Fund. The Trustees also considered the investment strategy and the underlying indices for the Fund, and the infrastructure supporting the portfolio management team. In addition, the Trustees considered information about the structure and distribution strategy of the Fund, how it fits within the Trust’s lineup, and how it will be positioned against identified peers.
The Trustees also considered their knowledge of the nature and quality of the services provided by the Adviser gained from
experience as Trustees of the Trust and in the financial industry. In addition, they considered the overall reputation and capabilities of the Adviser and its affiliates, the commitment of the Adviser to provide high quality service to the Trust, their overall confidence in the Adviser’s integrity and the Adviser’s responsiveness to questions or concerns raised by them.
Based upon these considerations and other factors, the Trustees concluded that they were satisfied with the nature, extent and quality of the investment advisory services to be provided to the Fund by the Adviser.
Fall-Out Benefits
The Trustees reviewed information regarding potential “fallout” or ancillary benefits received by the Adviser and its affiliates as a result of their relationship with the Trust.
The Trustees also considered that the fees that the Administrator, an affiliate of the Adviser, will earn from the Fund for providing administrative services. The Trustees also considered the fees paid to JPMCB, also an affiliate of the Adviser, for custody, transfer agency and other related services. The Trustees also considered that any fall-out or ancillary benefits would be comparable to those related to the other actively managed funds in the complex.
Economies of Scale
The Trustees considered the extent to which the Fund will benefit from economies of scale. The Trustees noted that neither the proposed investment advisory fee schedule nor the proposed administration agreement for the Fund contains breakpoints. The Trustees considered whether it would be appropriate to add advisory fee breakpoints. With respect to the administration agreement, the Trustees also considered the fact that the Fund would benefit from economies of scale for the broader J.P. Morgan mutual fund complex because the administration fee had been set at a level consistent with the lower effective rate of the mutual funds, which includes breakpoints. The Trustees also noted that the Adviser has implemented fee waivers and expense limitations. The Trustees concluded that shareholders of the Fund will generally benefit from the lower expense ratios that resulted from these factors.
Investment Performance
The Trustees considered the Fund’s investment strategy and processes, including the fact that the Fund seeks performance that closely corresponds to its Index, the portfolio management team and competitive positioning against identified peer funds, and concluded that the prospects for competitive future performance were acceptable.
Advisory Fees and Expense Ratios
The Trustees considered the contractual advisory fee rate that will be paid by the Fund to the Adviser and compared that rate
| | | | | | |
| | | |
| 50 | | | | JPMORGAN EXCHANGE-TRADED FUNDS | | OCTOBER 31, 2016 |
to the fees charged to mutual funds with similar investment objectives or in similar asset classes managed by the Adviser, as well as information prepared by Broadridge, using data from Lipper Inc., independent providers of investment company data, concerning management fee rates paid by funds in the same Lipper category as the Fund. The Trustees also noted that the Adviser does not currently manage mutual funds or institutional accounts with the same or substantially similar strategies proposed for the Fund. The Trustees also reviewed information about other projected expenses and the expense ratios for the Fund. The Trustees considered the projected fee waiver and/or
expense reimbursement arrangements proposed for the Fund and considered the net advisory fee rate after taking into account any projected waivers and/or reimbursements.
The Trustees noted that the Fund’s estimated net advisory fees and total expenses were in line with identified peer funds. The Trustees also noted that because the Fund was not yet operational, no profitability information was available. After considering the factors identified above, in light of the information, the Trustees concluded that the advisory fees were reasonable.
| | | | | | | | |
| | | |
| OCTOBER 31, 2016 | | JPMORGAN EXCHANGE-TRADED FUNDS | | | | | 51 | |
THIS PAGE IS INTENTIONALLY LEFT BLANK
| | | | | | |
| | | |
| 52 | | | | JPMORGAN EXCHANGE-TRADED FUNDS | | OCTOBER 31, 2016 |
J.P. Morgan Exchange-Traded Funds are distributed by SEI Investments Distribution Co. (One Freedom Valley Dr., Oaks, PA 19456), which is not affiliated with JPMorgan Chase & Co. or any of its affiliates.
Contact J.P. Morgan Exchange-Traded Funds at 1-844-457-6383 (844-4JPM ETF) for a fund prospectus. You can also visit us at www.jpmorganfunds.com. Investors should carefully consider the investment objectives and risks as well as charges and expenses of the fund before investing. The prospectus contains this and other information about the fund. Read the prospectus carefully before investing.
Investors may obtain information about the Securities Investor Protection Corporation (SIPC), including the SIPC brochure by visiting www.sipc.org or by calling SIPC at 202-371-8300.
The Fund files a complete schedule of its fund holdings for the first and third quarters of its fiscal year with the SEC on Form N-Q. The Fund’s Forms N-Q is available on the SEC’s website at http://www.sec.gov and may be reviewed and copied at the SEC’s Public Reference Room in Washington, DC. Information on the operation of the SEC’s Public Reference Room may be obtained by calling 1-800-SEC-0330. Shareholders may request the Form N-Q without charge by calling 1-844-457-6383 or by visiting the J.P. Morgan Funds’ website at www.jpmorganfunds.com.
A description of each Fund’s policies and procedures with respect to the disclosure of each Fund’s holdings is available in the prospectus and Statement of Additional Information.
A copy of proxy policies and procedures is available without charge upon request by calling 1-844-457-6383 and on the Fund’s website at www.jpmorganfunds.com. A description of such policies and procedures is on the SEC’s website at www.sec.gov. The Trustees have delegated the authority to vote proxies for securities owned by the Fund to the Adviser. A copy of the Fund’s voting record for the most recent 12-month period ended June 30 is available on the SEC’s website at www.sec.gov or at the Fund’s website at www.jpmorganfunds.com no later than August 31 of each year. The Fund’s proxy voting record will include, among other things, a brief description of the matter voted on for each fund security, and will state how each vote was cast, for example, for or against the proposal.


J.P. Morgan Asset Management is the marketing name for the asset management business of JPMorgan Chase & Co. Those businesses include, but are not limited to, J.P. Morgan Investment Management Inc., Security Capital Research & Management Incorporated and J.P. Morgan Alternative Asset Management, Inc.
| | | | |
| | © JPMorgan Chase & Co., 2016. All rights reserved. October 2016. | | AN-DAETF-1016 |
ITEM 2. CODE OF ETHICS.
Disclose whether, as of the end of the period covered by the report, the registrant has adopted a code of ethics that applies to the registrant’s principal executive officer, principal financial officer, principal accounting officer or controller, or persons performing similar functions, regardless of whether these individuals are employed by the registrant or a third party. If the registrant has not adopted such a code of ethics, explain why it has not done so.
The registrant must briefly describe the nature of any amendment, during the period covered by the report, to a provision of its code of ethics that applies to the registrant’s principal executive officer, principal financial officer, principal accounting officer or controller, or persons performing similar functions, regardless of whether these individuals are employed by the registrant or a third party, and that relates to any element of the code of ethics definition enumerated in paragraph (b) of this Item. The registrant must file a copy of any such amendment as an exhibit pursuant to Item 12(a)(1), unless the registrant has elected to satisfy paragraph (f) of this Item by positing its code of ethics on its website pursuant to paragraph (f)(2) of this Item, or by undertaking to provide its code of ethics to any person without charge, upon request, pursuant to paragraph (f)(3) of this Item.
If the registrant has, during the period covered by the report, granted a waiver, including an implicit waiver, from a provision of the code of ethics that applies to the registrant’s principal executive officer, principal financial officer, principal accounting officer or controller, or persons performing similar functions, regardless of whether these individuals are employed by the registrant or third party, that relates to one or more items set forth in paragraph (b) of this Item, the registrant must briefly describe the nature of the waiver, the name of the person to whom the waiver was granted, and the date of the waiver.
The Registrant has adopted a code of ethics that applies to the Registrant’s principal executive officer and principal financial officer. There were no amendments to the code of ethics or waivers granted with respect to the code of ethics in the period covered by the report.
ITEM 3. AUDIT COMMITTEE FINANCIAL EXPERT.
(a) (1) Disclose that the registrant’s board of directors has determined that the registrant either:
(i) Has at least one audit committee financial expert serving on its audit committee; or
(ii) Does not have an audit committee financial expert serving on its audit committee.
The Registrant’s Board of Trustees has determined that the Registrant has at least one audit committee financial expert serving on its audit committee. The Securities and Exchange Commission has stated that the designation or identification of a person as an audit committee financial expert pursuant to this Item 3 of Form N-CSR does not impose on such person any duties, obligations or liabilities that are greater than the duties, obligations and liabilities imposed on such person as a member of the Audit Committee and the Board of Trustees in the absence of such designation or identification.
(2) If the registrant provides the disclosure required by paragraph (a)(1)(i) of this Item, it must disclose the name of the audit committee financial expert and whether that person is “independent.” In order to be considered “independent” for purposes of this Item, a member of an audit committee may not, other than in his or her capacity as a member of the audit committee, the board of directors, or any other board committee:
(i) Accept directly or indirectly any consulting, advisory, or other compensatory fee from the issuer; or
(ii) Be an “interested person” of the investment company as defined in Section 2(a)(19) of the Act (15 U.S.C. 80a-2(a)(19)).
The audit committee financial experts are Gary L. French, Robert J. Grassi, Thomas P. Lemke, Lawrence R. Maffia, and Emily A. Youssouf, each of which is not an “interested person” of the Registrant and is also “independent” as defined by the U.S. Securities and Exchange Commission for purposes of audit committee financial expert determinations.
(3) If the registrant provides the disclosure required by paragraph (a)(1)(ii) of this Item, it must explain why it does not have an audit committee financial expert.
Not applicable.
ITEM 4. PRINCIPAL ACCOUNTANT FEES AND SERVICES.
(a) Disclose, under the caption Audit Fees, the aggregate fees billed for each of the last two fiscal years for professional services rendered by the principal accountant for the audit of the registrant’s annual financial statements or services that are normally provided by the accountant in connection with statutory and regulatory filings or engagements for those fiscal years.
AUDIT FEES
2016 – $314,400
2015 – $133,900
(b) Disclose, under the caption Audit-Related Fees, the aggregate fees billed in each of the last two fiscal years for assurance and related services by the principal accountant that are reasonably related to the performance of the audit of the registrant’s financial statements and are not reported under paragraph (a) of this Item. Registrants shall describe the nature of the services comprising the fees disclosed under this category.
AUDIT-RELATED FEES
2016 – $65,792
2015 – $33,333
Audit-related fees consist of security count procedures performed as required under Rule 17f-2 of the Investment Company Act of 1940 during the Registrant’s fiscal year.
(c) Disclose, under the caption Tax Fees, the aggregate fees billed in each of the last two fiscal years for professional services rendered by the principal accountant for tax compliance, tax advice, and tax planning. Registrants shall describe the nature of the services comprising the fees disclosed under this category.
TAX FEES
2016 – $104,635
2015 – $38,800
The tax fees consist of fees billed in connection with preparing the federal regulated investment company income tax returns for the Registrant for the tax years ended October 31, 2016 and 2015, respectively.
For the last fiscal year, no tax fees were required to be approved pursuant to paragraph (c)(7)(ii) of Rule 2-01 of Regulation S-X.
(d) Disclose, under the caption All Other Fees, the aggregate fees billed in each of the last two fiscal years for products and services provided by the principal accountant, other than the services reported in paragraphs (a) through (c) of this Item. Registrants shall describe the nature of the services comprising the fees disclosed under this category.
ALL OTHER FEES
2016 – $0
2015 – $0
(e) (1) Disclose the audit committee’s pre-approval policies and procedures described in paragraph (c)(7) of Rule 2-01 of Regulation S-X.
Pursuant to the Registrant’s Audit Committee Charter and written policies and procedures for the pre-approval of audit and non-audit services (the “Pre-approval Policy”), the Audit Committee pre-approves all audit and non-audit services performed by the Registrant’s independent public registered accounting firm for the Registrant. In addition, the Audit Committee pre-approves the auditor’s engagement for non-audit services with the Registrant’s investment adviser (not including a sub-adviser whose role is primarily portfolio management and is sub-contracted or overseen by another investment adviser) and any Service Affiliate in accordance with paragraph (c)(7)(ii) of Rule 2-01 of Regulation S-X, if the engagement relates directly to the operations and financial reporting of the Registrant. Proposed services may be pre-approved either 1) without consideration of specific case-by-case services or 2) require the specific pre-approval of the Audit Committee. Therefore, initially the Pre-approval Policy listed a number of audit and non-audit services that have been approved by the Audit Committee, or which were not subject to pre-approval under the transition provisions of Sarbanes-Oxley Act of 2002 (the “Pre-approval List”). The Audit Committee annually reviews and pre-approves the
services included on the Pre-approval List that may be provided by the independent public registered accounting firm without obtaining additional specific pre-approval of individual services from the Audit Committee. The Audit Committee adds to, or subtracts from, the list of general pre-approved services from time to time, based on subsequent determinations. All other audit and non-audit services not on the Pre-approval List must be specifically pre-approved by the Audit Committee.
One or more members of the Audit Committee may be appointed as the Committee’s delegate for the purposes of considering whether to approve such services. Any pre-approvals granted by the delegate will be reported, for informational purposes only, to the Audit Committee at its next scheduled meeting. The Audit Committee’s responsibilities to pre-approve services performed by the independent public registered accounting firm are not delegated to management.
(2) Disclose the percentage of services described in each of paragraphs (b) through (d) of this Item that were approved by the audit committee pursuant to paragraph (c)(7)(i)(C) of Rule 2-01 of Regulation S-X.
2016 – 0.0%
2015 – 0.0%
(f) If greater than 50 percent, disclose the percentage of hours expended on the principal accountant’s engagement to audit the registrant’s financial statements for the most recent fiscal year that were attributed to work performed by persons other than the principal accountant’s full-time, permanent employees.
Not applicable.
(g) Disclose the aggregate non-audit fees billed by the registrant’s accountant for services rendered to the registrant, and rendered to the registrant’s investment adviser (not including any sub-adviser whose role is primarily portfolio management and is subcontracted with or overseen by another investment adviser), and any entity controlling, controlled by, or under common control with the adviser that provides ongoing services to the registrant for each of the last two fiscal years of the registrant.
The aggregate non-audit fees billed by the independent registered public accounting firm for services rendered to the Registrant, and rendered to Service Affiliates, for the last two calendar year ends were:
2016 – $29.4 million
2015 – $30.7 million
(h) Disclose whether the registrant’s audit committee of the board of directors has considered whether the provision of non-audit services that were rendered to the registrant’s investment adviser (not including any subadviser whose role is primarily portfolio management and is subcontracted with or overseen by another investment adviser), and any entity controlling, controlled by, or under common control with the investment adviser that provides ongoing services to the registrant that were not pre-approved pursuant to paragraph (c)(7)(ii) of Rule 2-01 of Regulation S-X is compatible with maintaining the principal accountant’s independence.
The Registrant’s Audit Committee has considered whether the provision of the non-audit services that were rendered to Service Affiliates that were not pre-approved (not requiring pre-approval) is compatible with maintaining the independent public registered accounting firm’s independence. All services provided by the independent public registered accounting firm to the Registrant or to Service Affiliates that were required to be pre-approved were pre-approved as required.
ITEM 5. AUDIT COMMITTEE OF LISTED REGISTRANTS.
(a) If the registrant is a listed issuer as defined in Rule 10A-3 under the Exchange Act (17CFR 240.10A-3), state whether or not the registrant has a separately-designated standing audit committee established in accordance with Section 3(a)(58)(A) of the Exchange Act (15 U.S.C. 78c(a)(58)(A)). If the registrant has such a committee, however designated, identify each committee member. If the entire board of directors is acting as the registrant’s audit committee as specified in Section 3(a)(58)(B) of the Exchange Act (15 U.S.C. 78c(a)(58)(B)), so state.
The registrant has a separately designated Audit Committee established in accordance with Section 3(a)(58)(A) of the Exchange Act. The members of the Audit Committee are Gary L. French, Robert J. Grassi, Thomas P. Lemke, Lawrence R. Maffia, and Emily A. Youssouf.
(b) If applicable, provide the disclosure required by Rule 10A-3(d) under the Exchange Act (17CFR 240.10A-3(d)) regarding an exemption from the listing standards for all audit committees.
Not applicable.
ITEM 6. SCHEDULE OF INVESTMENTS.
File Schedule I – Investments in securities of unaffiliated issuers as of the close of the reporting period as set forth in Section 210.12-12 of Regulation S-X, unless the schedule is included as part of the report to shareholders filed under Item 1 of this Form.
Included in Item 1.
ITEM 7. DISCLOSURE OF PROXY VOTING POLICIES AND PROCEDURES FOR CLOSED-END MANAGEMENT INVESTMENT COMPANIES.
A closed-end management investment company that is filing an annual report on this Form N-CSR must, unless it invests exclusively in non-voting securities, describe the policies and procedures that it uses to determine how to vote proxies relating to portfolio securities, including the procedures that the company uses when a vote presents a conflict between the interests of its shareholders, on the one hand, and those of the company’s investment adviser; principal underwriter; or any affiliated person (as defined in Section 2(a)(3) of the Investment Company Act of 1940 (15 U.S.C. 80a-2(a)(3)) and the rules thereunder) of the company, its investment adviser, or its principal underwriter, on the other. Include any policies and procedures of the company’s investment adviser, or any other third party, that the company uses, or that are used on the company’s behalf, to determine how to vote proxies relating to portfolio securities.
Not applicable.
ITEM 8. PORTFOLIO MANAGERS OF CLOSED-END MANAGEMENT INVESTMENT COMPANIES.
Not applicable.
ITEM 9. PURCHASE OF EQUITY SECURITIES BY CLOSED-END MANAGEMENT INVESTMENT COMPANY AND AFFILIATED PURCHASERS.
(a) If the registrant is a closed-end management investment company, provide the information specified in paragraph (b) of this Item with respect to any purchase made by or on behalf of the registrant or any “affiliated purchaser,” as defined in Rule 10b-18(a)(3) under the Exchange Act (17 CFR 240.10b-18(a)(3)), of shares or other units of any class of the registrant’s equity securities that is registered by the registrant pursuant to Section 12 of the Exchange Act (15 U.S.C. 781).
Not applicable.
ITEM 10. SUBMISSION OF MATTERS TO A VOTE OF SECURITY HOLDERS.
Describe any material changes to the procedures by which shareholders may recommend nominees to the registrant’s board of directors, where those changes were implemented after the registrant last provided disclosure in response to the requirements of Item 7(d)(2)(ii)(G) of Schedule 14A (17 CFR 240.14a-101), or this Item.
No material changes to report.
ITEM 11. CONTROLS AND PROCEDURES.
(a) Disclose the conclusions of the registrant’s principal executive and principal financial officers, or persons performing similar functions, regarding the effectiveness of the registrant’s disclosure controls and procedures (as defined in Rule 30a-3(c) under the Act (17 CFR 270.30a-3(c))) as of a date within 90 days of the filing date of the report that includes the disclosure required by this paragraph, based on the evaluation of these controls and procedures required by Rule 30a-3(b) under the Act (17 CFR 270.30a-3(b)) and Rules 13a-15(b) or 15d-15(b) under the Exchange Act (17 CFR 240.13a-15(b) or 240.15d-15(b)).
The Registrant’s principal executive and principal financial officers have concluded, based on their evaluation of the Registrant’s disclosure controls and procedures as of a date within 90 days of the filing date of this report, that the Registrant’s disclosure controls and procedures are reasonably designed to ensure that information required to be disclosed by the Registrant on Form N-CSR is recorded, processed, summarized and reported within the required time periods and that information required to be disclosed by the Registrant in the reports that it files or submits on Form N-CSR is accumulated and communicated to the Registrant’s management, including its principal executive and principal financial officers, as appropriate to allow timely decisions regarding required disclosure.
(b) Disclose any change in the registrant’s internal control over financial reporting (as defined in Rule 30a-3(d) under the Act (17 CFR 270.30a-3(d)) that occurred during the registrant’s second fiscal quarter of the period covered by this report that has materially affected, or is reasonably likely to materially affect, the registrant’s internal control over financial reporting.
There were no changes in the Registrant’s internal control over financial reporting that occurred during the last fiscal quarter covered by this report that have materially affected, or are reasonably likely to materially affect, the Registrant’s internal control over financial reporting.
ITEM 12. EXHIBITS.
(a) File the exhibits listed below as part of this Form. Letter or number the exhibits in the sequence indicated.
(a)(1) Any code of ethics, or amendment thereto, that is the subject of the disclosure required by Item 2, to the extent that the registrant intends to satisfy the Item 2 requirements through filing of an exhibit.
Code of Ethics applicable to its Principal Executive and Principal Financial Officers pursuant to Section 406 of the Sarbanes-Oxley Act of 2002 attached hereto.
(a)(2) A separate certification for each principal executive officer and principal financial officer of the registrant as required by Rule 30a-2(a) under the Act (17 CFR 270.30a-2).
Certifications pursuant to Rule 30a-2(a) under the Investment Company Act of 1940 are attached hereto.
(a)(3) Any written solicitation to purchase securities under Rule 23c-1 under the Act (17 CFR 270.23c-1) sent or given during the period covered by the report by or on behalf of the registrant to 10 or more persons.
Not applicable.
(b) A separate or combined certification for each principal executive officer and principal officer of the registrant as required by Rule 30a-2(b) under the Act of 1940.
Certifications pursuant to Rule 30a-2(b) under the Investment Company Act of 1940 are attached hereto.
SIGNATURES
Pursuant to the requirements of the Securities Exchange Act of 1934 and the Investment Company Act of 1940, the registrant has duly caused this report to be signed on its behalf by the undersigned, thereunto duly authorized.
| | |
| J.P. Morgan Exchange-Traded Fund Trust |
| |
| By: | | /s/ Robert F. Deutsch |
| | Robert F. Deutsch |
| | President and Principal Executive Officer |
| | December 29, 2016 |
Pursuant to the requirements of the Securities Exchange Act of 1934 and the Investment Company Act of 1940, this report has been signed below by the following persons on behalf of the registrant and in the capacities and on the dates indicated.
| | |
| By: | | /s/ Robert F. Deutsch |
| | Robert F. Deutsch |
| | President and Principal Executive Officer |
| | December 29, 2016 |
| | |
| By: | | /s/ Lauren A. Paino |
| | Lauren A. Paino |
| | Treasurer and Principal Financial Officer |
| | December 29, 2016 |