UNITED STATES
SECURITIES AND EXCHANGE COMMISSION
Washington, D.C. 20549
FORM N-CSR
CERTIFIED SHAREHOLDER REPORT OF REGISTERED
MANAGEMENT INVESTMENT COMPANIES
Investment Company Act file number: 811-22903
J.P. Morgan Exchange-Traded Fund Trust
(Exact name of registrant as specified in charter)
270 Park Avenue
New York, NY 10017
(Address of principal executive offices) (Zip code)
Frank J. Nasta, Esq.
J.P. Morgan Investment Management Inc.
270 Park Avenue
New York, NY 10017
(Name and Address of Agent for Service)
With copies to:
| | |
| Elizabeth A. Davin, Esq. | | Jon S. Rand, Esq. |
| JPMorgan Chase & Co. | | Dechert LLP |
| 1111 Polaris Parkway | | 1095 Avenue of the Americas |
| Columbus, OH 43240 | | New York, NY 10036 |
Registrant’s telephone number, including area code: 844-457-6383
Date of fiscal year end: October 31
Date of reporting period: November 1, 2016 through October 31, 2017
Form N-CSR is to be used by management investment companies to file reports with the Commission not later than 10 days after the transmission to stockholders of any report that is required to be transmitted to stockholders under Rule 30e-1 under the Investment Company Act of 1940 (17 CFR 270.30e-1). The Commission may use the information provided on Form N-CSR in its regulatory, disclosure review, inspection, and policymaking roles.
A registrant is required to disclose the information specified by Form N-CSR, and the Commission will make this information public. A registrant is not required to respond to the collection of information contained in Form N-CSR unless the Form displays a currently valid Office of Management and Budget (“OMB”) control number. Please direct comments concerning the accuracy of the information collection burden estimate and any suggestions for reducing the burden to Secretary, Securities and Exchange Commission, 450 Fifth Street, NW, Washington, DC 20549-0609. The OMB has reviewed this collection of information under the clearance requirements of 44 U.S.C. Section 3507.
ITEM 1. REPORTS TO STOCKHOLDERS
The following is a copy of the report transmitted to shareholders pursuant to Rule 30e-1 under the Investment Company Act of 1940 (17 CFR 270.30e-1).
Annual Report
JPMorgan Exchange-Traded Funds
October 31, 2017
JPMorgan Diversified Return Emerging Markets Equity ETF
JPMorgan Diversified Return Europe Currency Hedged ETF
JPMorgan Diversified Return Europe Equity ETF
JPMorgan Diversified Return Global Equity ETF
JPMorgan Diversified Return International Currency Hedged ETF
JPMorgan Diversified Return International Equity ETF
JPMorgan Diversified Return U.S. Equity ETF
JPMorgan Diversified Return U.S. Mid Cap Equity ETF
JPMorgan Diversified Return U.S. Small Cap Equity ETF

CONTENTS
Investments in a Fund are not bank deposits or obligations of, or guaranteed or endorsed by, any bank and are not insured or guaranteed by the FDIC, the Federal Reserve Board or any other government agency. You could lose money if you sell when the Fund’s share price is lower than when you invested.
Past performance is no guarantee of future performance. The general market views expressed in this report are opinions based on market and other conditions through the end of the reporting period and are subject to change without notice. These views are not intended to predict the future performance of a Fund or the securities markets. References to specific securities and their issuers are for illustrative purposes only and are not intended to be, and should not be interpreted as, recommendations to purchase or sell such securities. Such views are not meant as investment advice and may not be relied on as an indication of trading intent on behalf of any Fund.
Prospective investors should refer to the Funds’ prospectuses for a discussion of the Funds’ investment objectives, strategies and risks. Call J.P. Morgan Exchange-Traded Funds at (844) 457-6383 for a prospectus containing more complete information about a Fund, including management fees and other expenses. Please read it carefully before investing.
Shares are bought and sold throughout the day on an exchange at market price (not NAV) through a brokerage account, and are not individually redeemed from a Fund. Shares may only be redeemed directly from a Fund by Authorized Participants, in very large creation/redemption units. Brokerage commissions will reduce returns.
PRESIDENT’S LETTER
NOVEMBER 28, 2017 (Unaudited)
Dear Shareholder,
The past year has been a milestone for JPMorgan’s Exchange-Traded Funds. We’ve built out our product lineup to include active fixed income ETFs, innovative strategic beta and institutional-quality alternative strategies. Each of these are designed to provide advisers and investors with additional tools for constructing stronger portfolios. During the year, we more than doubled our ETF assets under management, surpassing $2 billion by the end of August. Further, our Diversified Alternatives ETF (JPHF) earned Best New Alternative ETF and Best New Active ETF at the fourth annual ETF.com awards held March 30, 2017 in New York, N.Y.1
| | |
 | | “Our “smart beta” ETFs are designed to provide a smoother ride during period of market volatility, while diversifying unrewarded risks.” |
I am pleased to report that all nine of our equity ETFs turned in a positive performance for the twelve months ended October 31, 2017. Our “smart beta” ETFs are designed to provide a smoother ride during period of market volatility, while diversifying unrewarded risks. The multi-factor stock selection process for the J.P. Morgan ETFs’ underlying equity indexes seeks to identify stocks that exhibit the factors that drive returns, such as momentum or mispriced valuation. Further, by maintaining a neutral risk weighting across economic sectors,
the underlying indexes seek to avoid a concentration in overvalued segments of the market.
During the past year, global economic growth accelerated and equity markets provided investors with strong positive returns. Economic data in the U.S., European Union and the U.K. was sufficiently strong that each their respective central banks moved away from monetary stimulus and toward more normalized monetary policies. Emerging markets also benefitted from synchronized global growth and emerging market equities generally outperformed developed market equities during the twelve month reporting period.
We are proud to bring J.P. Morgan’s experience and equity capabilities to the ETF market place. We are committed to building solutions that address your needs and help you build stronger portfolios. Thank you for your belief in our Firm and our process.
Sincerely,

Joanna M. Gallegos
President, J.P. Morgan Exchange-Traded Funds
J.P Morgan Asset Management
1-844-4JPM-ETF or jpmorgan.com/etfs for more information
| 1 | ETF.com Award winners are selected in a three-part process designed to leverage the insights and opinions of leaders throughout the ETF industry. The awards process began with an open nomination period running from Dec. 5, 2016, through Jan. 4, 2017. ETF.com received hundreds of nominations from participants in all corners of the ETF space. Following the open nominations process, the ETF.com Awards Nominating Committee—made up of senior leaders at ETF.com, Inside ETFs and FactSet—voted to select up to five finalists in each category. Votes were tallied on a majority basis. Winners from these finalists were selected by a majority vote of the ETF.com Awards Selection Committee, a group of independent ETF experts. Committee members recused themselves from voting in any category in which they or their firms appeared as finalists. Ties were decided where possible with head-to-head runoff votes. Voting was completed by Jan. 20, 2017, but results were kept secret until their announcement at the ETF.com U.S. Awards Dinner on March 30, 2017 |
| | | | | | | | |
| | | |
| OCTOBER 31, 2017 | | JPMORGAN EXCHANGE-TRADED FUNDS | | | | | 1 | |
JPMorgan Diversified Return Emerging Markets Equity ETF
FUND COMMENTARY
TWELVE MONTHS ENDED OCTOBER 31, 2017 (Unaudited)
| | | | |
| REPORTING PERIOD RETURN: | |
| JPMorgan Diversified Return Emerging Markets Equity ETF | | | | |
Net Asset Value* | | | 18.95% | |
| Market Price** | | | 18.65% | |
| FTSE Emerging Diversified Factor Index (net of foreign withholding taxes) | | | 20.22% | |
| FTSE Emerging Index (net of foreign withholding taxes) | | | 21.39% | |
| Morgan Stanley Capital International (MSCI) Emerging Markets Index (net of foreign withholding taxes) | | | 26.45% | |
| |
| Net Assets as of 10/31/2017 | | $ | 165,741,046 | |
INVESTMENT OBJECTIVE***
The JPMorgan Diversified Return Emerging Markets Equity ETF (the “Fund”) seeks investment results that closely correspond, before fees and expenses, to the performance of the FTSE Emerging Diversified Factor Index (the “Underlying Index”).
INVESTMENT APPROACH
The Fund is passively managed to the Underlying Index, which provides emerging markets equity exposure, diversified across emerging market regions and super-sectors. The Underlying Index uses a proprietary multi-factor stock selection process that utilizes the following characteristics: value, momentum and quality. The Underlying Index methodology includes quarterly rebalancing.
HOW DID THE MARKET PERFORM?
Global financial markets overall provided positive returns during the reporting period, with emerging market equities outperforming equities in the U.S. and other developed markets. The world’s leading economies continued to expand throughout the first ten months of 2017, lifting corporate profits and capital investment as well as business and consumer sentiment.
Synchronized global growth and industrial demand helped to lift commodities prices, particularly for copper and other metals, toward the end of the reporting period. While global oil prices declined in the early part of the reporting period, prices for benchmark Brent crude oil remained above $50 dollars a barrel through October 2017.
In China, government efforts to curb speculation in its financial markets helped to keep market volatility in check, while economic indicators showed continued strong growth. Global economic growth and low interest rates continued to benefit both equities and bonds in emerging market nations. During the twelve months ended October 31, 2017, emerging market equities generally outperformed developed market equities.
HOW DID THE FUND PERFORM?
For the twelve months ended October 31, 2017, the Fund posted a positive absolute return and had a performance deviation of -1.27% from the Underlying Index. The Fund and the Underlying Index underperformed the FTSE Emerging Index and the MSCI
Emerging Markets Index, both of which are more traditional market capitalization weighted indexes.
Because the Fund’s holdings were closely aligned with those of the Underlying Index, variances in relative performance due to security selection and/or sector allocation were not significant. The majority of the Fund’s deviations from the Underlying Index were related to differences in the net asset value calculations and foreign exchange pricing between the Underlying Index and the Fund, and fees and operating expenses incurred by the Fund.
The Fund’s and the Underlying Index’s allocations to the financials and technology sectors were leading contributors to absolute performance, while their allocations to the health care and telecommunications sectors were the smallest contributors to absolute performance. The Fund’s and the Underlying Index’s allocations to North Asia and Europe, Middle East and Africa were leading contributors to absolute performance, while their allocations to China/India/Pakistan and Latin America were the smallest contributors to absolute performance.
Relative to the FTSE Emerging Index, the Fund’s and the Underlying Index’s underweight positions and security selection in the technology sector and their security selection and overweight positions in the telecommunications sector were leading detractors from performance, while the Fund’s and the Underlying Index’s security selection and underweight position in the health care sector and their security selection in the industrial sectors were leading contributors to performance. The Fund’s and the Underlying Index’s overweight position in Southeast Asia and its underweight position in China/India/Pakistan were leading detractors from relative performance, while their security selection in Europe, Middle East and Africa and their overweight allocation to Latin America made positive contributions to relative performance.
HOW WAS THE FUND POSITIONED?
During the reporting period, the Fund’s largest sector allocations were in the financials and technology sectors, while its smallest allocations were in the health care and utilities sectors. The Fund’s largest regional allocations were in Southeast Asia and North Asia and the smallest allocations were to China/India/Pakistan and Latin America.
| | | | | | |
| | | |
| 2 | | | | JPMORGAN EXCHANGE-TRADED FUNDS | | OCTOBER 31, 2017 |
| | | | | | | | |
| TOP TEN EQUITY HOLDINGS OF THE PORTFOLIO**** | |
| | 1. | | | Taiwan Semiconductor Manufacturing Co. Ltd. (Taiwan) | | | 3.4 | % |
| | 2. | | | Naspers Ltd., Class N (South Africa) | | | 3.2 | |
| | 3. | | | Tencent Holdings Ltd. (China) | | | 3.2 | |
| | 4. | | | China Mobile Ltd. (China) | | | 2.4 | |
| | 5. | | | Hon Hai Precision Industry Co. Ltd. (Taiwan) | | | 2.2 | |
| | 6. | | | Alibaba Group Holding Ltd., ADR (China) | | | 1.6 | |
| | 7. | | | America Movil SAB de CV, Series L (Mexico) | | | 1.3 | |
| | 8. | | | China Construction Bank Corp., Class H (China) | | | 1.3 | |
| | 9. | | | Tenaga Nasional Bhd. (Malaysia) | | | 1.2 | |
| | 10. | | | Telekomunikasi Indonesia Persero Tbk. PT (Indonesia) | | | 1.2 | |
| | | | |
PORTFOLIO COMPOSITION BY COUNTRY**** | |
| China | | | 22.8 | % |
| Taiwan | | | 16.3 | |
| Brazil | | | 8.4 | |
| South Africa | | | 8.2 | |
| India | | | 7.8 | |
| Thailand | | | 5.8 | |
| Indonesia | | | 5.7 | |
| Malaysia | | | 4.9 | |
| Russia | | | 4.6 | |
| Mexico | | | 4.1 | |
| Philippines | | | 2.6 | |
| Poland | | | 1.6 | |
| United Arab Emirates | | | 1.6 | |
| Turkey | | | 1.6 | |
| Chile | | | 1.5 | |
| Others (each less than 1.0%) | | | 2.5 | |
| * | | The return shown is based on net asset value calculated for shareholder transactions and may differ from the return shown in the financial highlights, which reflects adjustments made to the net asset value in accordance with accounting principles generally accepted in the United States of America. The net asset value was $57.15 as of October 31, 2017. |
| ** | | Market price return is calculated assuming an initial investment made at the market price at the beginning of the period, reinvestment of all dividends and distributions at market price during the period, and sale at the market price on the last day of the period. The price used to calculate the market price return is the midpoint of the bid/ask spread at the close of business on the NYSE Arca. The midpoint price was $57.36 as of October 31, 2017. |
| *** | | The adviser seeks to achieve the Fund’s objective. There can be no guarantee it will be achieved. |
| **** | | Percentages indicated are based on total investments as of October 31, 2017. The Fund’s composition is subject to change. |
| | | | | | | | |
| | | |
| OCTOBER 31, 2017 | | JPMORGAN EXCHANGE-TRADED FUNDS | | | | | 3 | |
JPMorgan Diversified Return Emerging Markets Equity ETF
FUND COMMENTARY
TWELVE MONTHS ENDED OCTOBER 31, 2017 (Unaudited) (continued)
| | | | | | | | | | | | |
AVERAGE ANNUAL TOTAL RETURNS AS OF OCTOBER 31, 2017 (Unaudited) | |
| | | INCEPTION DATE | | | 1 YEAR | | | SINCE
INCEPTION | |
| JPMorgan Diversified Return Emerging Markets Equity ETF | | | | | | | | | | | | |
Net Asset Value | | | January 7, 2015 | | | | 18.95% | | | | 6.52% | |
Market Price | | | | | | | 18.65% | | | | 6.67% | |
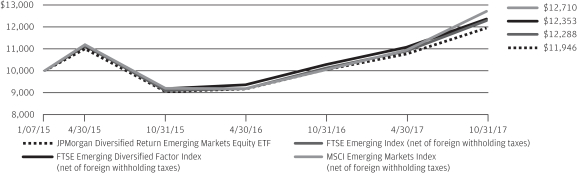
LIFE OF FUND PERFORMANCE (1/07/15 TO 10/31/17)
The performance quoted is past performance and is not a guarantee of future results. Exchange-traded funds are subject to certain market risks. Investment returns and principal value of an investment will fluctuate so that an investor’s shares, when sold or redeemed, may be worth more or less than their original cost. Current performance may be higher or lower than the performance data shown. For up-to-date, month-end performance information please call 1-844-457-6383.
Fund commenced operations on January 7, 2015.
The graph illustrates comparative performance for $10,000 invested in shares of the JPMorgan Diversified Return Emerging Markets Equity ETF, the FTSE Emerging Diversified Factor Index, the FTSE Emerging Index, and the MSCI Emerging Markets Index from January 7, 2015 to October 31, 2017. The performance of the Fund reflects the deduction of Fund expenses and assumes reinvestment of all dividends and capital gain distributions, if any. The performance of the FTSE Emerging Diversified Factor Index, the FTSE Emerging Index and the MSCI Emerging Markets Index does not reflect the deduction of expenses associated with an exchange-traded fund and has been adjusted to reflect reinvestment of all dividends and capital gain distributions of the securities included in the Index, if applicable. The FTSE Emerging Diversified Factor Index is an index comprised of equity securities from emerging markets selected to represent a diversified set of factor characteristics, originally developed by the adviser, and its holdings are selected by the index provider primarily from the constituents of the FTSE Emerging Index. The FTSE Emerging Index is a market-capitalization weighted index and is part of the FTSE Global Equity
Index Series. The series includes large- and mid-cap securities from advanced and secondary emerging markets, classified in accordance with FTSE’s transparent Country Classification Review Process. The FTSE Emerging Index provides investors with a comprehensive means of measuring the performance of the most liquid companies in the emerging markets. FTSE International Limited is the index provider for the two FTSE indexes. The MSCI Emerging Markets Index is a free float-adjusted market capitalization weighted index that is designed to measure the equity market performance of emerging markets. Investors cannot invest directly in an index.
Fund performance reflects the waiver of the Fund’s fees and reimbursement of expenses for certain periods since the inception date. Without these waivers and reimbursements, performance would have been lower. Also, performance shown in this section does not reflect the deduction of taxes that a shareholder may pay on Fund distributions or redemption or sale of Fund shares.
International investing involves a greater degree of risk and increased volatility. Changes in currency exchange rates and differences in accounting and taxation policies outside the United States can raise or lower returns. Also, some overseas markets may not be as politically and economically stable as the United States and other nations.
The returns shown are based on net asset values calculated for shareholder transactions and may differ from the returns shown in the financial highlights, which reflect adjustments made to the net asset values in accordance with accounting principles generally accepted in the United States of America.
| | | | | | |
| | | |
| 4 | | | | JPMORGAN EXCHANGE-TRADED FUNDS | | OCTOBER 31, 2017 |
JPMorgan Diversified Return Europe Currency Hedged ETF
FUND COMMENTARY
TWELVE MONTHS ENDED OCTOBER 31, 2017 (Unaudited)
| | | | |
| REPORTING PERIOD RETURN: | | | |
| JPMorgan Diversified Return Europe Currency Hedged ETF | | | | |
Net Asset Value* | | | 20.87% | |
| Market Price** | | | 20.83% | |
| FTSE Developed Europe Diversified Factor 100% Hedged to USD Index (net of foreign withholding taxes) | | | 20.47% | |
| FTSE Developed Europe Diversified Factor Index (net of foreign withholding taxes) | | | 25.72% | |
| FTSE Developed Europe Index (net of foreign withholding taxes) | | | 27.09% | |
| |
| Net Assets as of 10/31/2017 | | $ | 30,707,245 | |
INVESTMENT OBJECTIVE***
The JPMorgan Diversified Return Europe Currency Hedged ETF (the “Fund”) seeks investment results that closely correspond, before fees and expenses, to the performance of the FTSE Developed Europe Diversified Factor 100% Hedged to USD Index (the “Underlying Index”).
INVESTMENT APPROACH
The Fund is passively managed to the Underlying Index, which is composed of large and mid-cap equity securities in Europe, diversified across industries and international regions. The Underlying Index uses a proprietary multifactor selection process that measures the following characteristics: valuation, momentum and quality. The Underlying Index methodology includes quarterly rebalancing. In addition to reflecting European stock performance, the Underlying Index attempts to minimize the impact of exchange rate fluctuations by hedging European currency exposure versus the U.S. dollar on a monthly basis.
HOW DID THE MARKET PERFORM?
Global financial markets overall provided positive returns during the reporting period, with emerging market equities outperforming equities in the U.S. and other developed markets. The world’s leading economies continued to expand throughout the first ten months of 2017, lifting corporate profits and capital investment as well as business and consumer sentiment.
Synchronized global growth and industrial demand helped to lift commodities prices, particularly for copper and other metals, toward the end of the reporting period. While global oil prices declined in the early part of the reporting period, prices for benchmark Brent crude oil remained above $50 dollars a barrel through October 2017.
In Europe, financial markets continued to benefit from global growth, low interest rates and stimulus from the European Central Bank. Demand from China and other emerging market nations helped to lift exports from Germany and other leading European Union (EU) economies. While the U.K.’s impending exit from the EU and a separatist movement in Spain’s Catalan region remained worrisome for politicians and economists, financial markets appeared to be largely unaffected.
HOW DID THE FUND PERFORM?
The Fund posted a positive absolute performance for the twelve months ended October 31, 2017, and experienced a performance deviation of 0.40% from the Underlying Index. The Fund and the Underlying Index underperformed the FTSE Developed Europe Index, which is a more traditional market capitalization weighted index, that is not hedged to the U.S. dollar.
The Fund’s and the Underlying Index’s allocations to the technology and basic materials sectors were leading contributors to absolute performance, while their allocations to utilities and telecommunications sectors were the smallest contributors to absolute performance. The Fund’s and the Underlying Index’s allocations to the U.K. and Germany were leading contributors to absolute performance, while their allocations to Ireland and Portugal were the smallest contributors to absolute performance.
HOW WAS THE FUND POSITIONED?
During the reporting period, the Fund’s largest country allocations were in the U.K., France and Germany, while its smallest country allocations were in Ireland, Portugal and Austria. The Fund’s largest sector allocations were in the consumer goods, health care, consumer services and industrials sectors, while its smallest allocations were in the oil & gas and basic materials sectors.
| * | | The return shown is based on net asset value calculated for shareholder transactions and may differ from the return shown in the financial highlights, which reflects adjustments made to the net asset value in accordance with accounting principles generally accepted in the United States of America. The net asset value was $29.24 as of October 31, 2017. |
| ** | | Market price return is calculated assuming an initial investment made at the market price at the beginning of the period, reinvestment of all dividends and distributions at market price during the period, and sale at the market price on the last day of the period. The price used to calculate the market price return is the midpoint of the bid/ask spread at the close of business on the NYSE Arca. The midpoint price was $29.29 as of October 31, 2017. |
| *** | | The adviser seeks to achieve the Fund’s objective. There can be no guarantee it will be achieved. |
| | | | | | | | |
| | | |
| OCTOBER 31, 2017 | | JPMORGAN EXCHANGE-TRADED FUNDS | | | | | 5 | |
JPMorgan Diversified Return Europe Currency Hedged ETF
FUND COMMENTARY
TWELVE MONTHS ENDED OCTOBER 31, 2017 (Unaudited) (continued)
| | | | | | | | | | | | |
AVERAGE ANNUAL TOTAL RETURNS AS OF OCTOBER 31, 2017 (Unaudited) | |
| | | INCEPTION DATE | | | 1 YEAR | | | SINCE
INCEPTION | |
| JPMorgan Diversified Return Europe Currency Hedged ETF | | | | | | | | | | | | |
Net Asset Value | | | April 1, 2016 | | | | 20.87% | | | | 16.91% | |
Market Price | | | | | | | 20.83% | | | | 16.97% | |
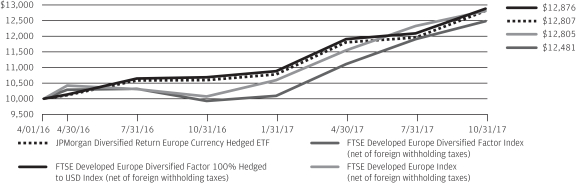
LIFE OF FUND PERFORMANCE (4/01/16 TO 10/31/17)
The performance quoted is past performance and is not a guarantee of future results. Exchange-traded funds are subject to certain market risks. Investment returns and principal value of an investment will fluctuate so that an investor’s shares, when sold or redeemed, may be worth more or less than their original cost. Current performance may be higher or lower than the performance data shown. For up-to-date, month-end performance information please call 1-844-457-6383.
Fund commenced operations on April 1, 2016.
The graph illustrates comparative performance for $10,000 invested in shares of the JPMorgan Diversified Return Europe Currency Hedged ETF, the FTSE Developed Europe Diversified Factor 100% Hedged to USD Index, the FTSE Developed Europe Diversified Factor Index, and the FTSE Developed Europe Index from April 1, 2016 to October 31, 2017. The performance of the Fund reflects the deduction of Fund expenses and assumes reinvestment of all dividends and capital gain distributions, if any. The performance of the FTSE Developed Europe Diversified Factor 100% Hedged to USD Index, the FTSE Developed Europe Diversified Factor Index, and the FTSE Developed Europe Index does not reflect the deduction of expenses associated with an exchange-traded fund and has been adjusted to reflect reinvestment of all dividends and capital gain distributions of the securities included in the Index, if applicable. The FTSE Developed Europe Diversified Factor 100% Hedged to USD Index and the FTSE Developed Europe Diversified Factor Index are indexes comprised of equity securities from developed European markets selected to represent a diversified set of factor characteristics, originally developed by the adviser, and the equity holdings of both indexes are selected by the index provider primarily
from the constituents of the FTSE Developed Europe Index. The FTSE Developed Europe Diversified Factor 100% Hedged to USD Index represents European stock performance with the foreign currency risk of the index securities hedged against the U.S. dollar on a monthly basis. These two indexes include large and mid cap stocks providing coverage of developed European markets. FTSE Developed Europe Index is a market-capitalization weighted index representing the performance of large- and mid-cap companies in developed European markets. FTSE International Limited is the index provider for these three indexes. Investors cannot invest directly in an index.
Fund performance reflects the waiver of the Fund’s fees and reimbursement of expenses for certain periods since the inception date. Without these waivers and reimbursements, performance would have been lower. Also, performance shown in this section does not reflect the deduction of taxes that a shareholder may pay on Fund distributions or redemption or sale of Fund shares.
International investing involves a greater degree of risk and increased volatility. Changes in currency exchange rates and differences in accounting and taxation policies outside the United States can raise or lower returns. Also, some over-seas markets may not be as politically and economically stable as the United States and other nations.
The returns shown are based on net asset values calculated for shareholder transactions and may differ from the returns shown in the financial highlights, which reflect adjustments made to the net asset values in accordance with accounting principles generally accepted in the United States of America.
| | | | | | |
| | | |
| 6 | | | | JPMORGAN EXCHANGE-TRADED FUNDS | | OCTOBER 31, 2017 |
JPMorgan Diversified Return Europe Equity ETF
FUND COMMENTARY
FOR THE YEAR ENDED OCTOBER 31, 2017 (Unaudited)
| | | | |
| REPORTING PERIOD RETURN: | | | |
| JPMorgan Diversified Return Europe Equity ETF | | | | |
Net Asset Value* | | | 25.42% | |
| Market Price** | | | 25.80% | |
| FTSE Developed Europe Diversified Factor Index (net of foreign withholding taxes) | | | 25.72% | |
| FTSE Developed Europe Index (net of foreign withholding taxes) | | | 27.09% | |
| Morgan Stanley Capital International (MSCI) Europe Index (net of foreign withholding taxes) | | | 27.01% | |
| |
| Net Assets as of 10/31/2017 | | $ | 79,492,357 | |
INVESTMENT OBJECTIVE***
The JPMorgan Diversified Return Europe Equity ETF (the “Fund”) seeks investment results that closely correspond, before fees and expenses, to the performance of the FTSE Developed Europe Diversified Factor Index (the “Underlying Index”).
INVESTMENT APPROACH
The Fund is passively managed to the Underlying Index, which is composed of large-cap and mid-cap equity securities in Europe, diversified across industries. The Underlying Index uses a proprietary multifactor security selection process that measures the following characteristics: valuation, momentum and quality. The Underlying Index methodology includes quarterly rebalancing.
HOW DID THE MARKET PERFORM?
Global financial markets overall provided positive returns during the reporting period, with emerging market equities outperforming equities in the U.S. and other developed markets. The world’s leading economies continued to expand throughout the first ten months of 2017, lifting corporate profits and capital investment as well as business and consumer sentiment.
Synchronized global growth and industrial demand helped to lift commodities prices, particularly for copper and other metals, toward the end of the reporting period. While global oil prices declined in the early part of the reporting period, prices for benchmark Brent crude oil remained above $50 dollars a barrel through October 2017.
In Europe, financial markets continued to benefit from global growth, low interest rates and stimulus from the European Central Bank. Demand from China and other emerging market nations helped to lift exports from Germany and other leading European Union (EU) economies. While the U.K.’s impending exit from the EU and a separatist movement in Spain’s Catalan region remained worrisome for politicians and economists, financial markets appeared to be largely unaffected.
HOW DID THE FUND PERFORM?
The Fund posted a positive absolute performance for the twelve months ended October 31, 2017, and had a deviation of -0.30% from the Underlying Index. Both the Fund and the Underlying Index underperformed the FTSE Developed Europe Index and the MSCI Europe Index, both of which are more traditional market capitalization weighted indexes.
Because the Fund’s holdings were closely aligned with those of the Underlying Index, variances in performance relative to the Underlying Index were not significant. The majority of the Fund’s deviation against the Underlying Index was due to the Fund’s small cash allocation and fees and operating expenses incurred by the Fund.
The Fund’s and the Underlying Index’s allocations to the technology and basic materials sectors were leading contributors to absolute performance, while their allocations to utilities and telecommunications sectors were the smallest contributors to absolute performance. The Fund’s and the Underlying Index’s allocations to the U.K. and Germany were leading contributors to absolute performance, while their allocations to Ireland and Portugal were the smallest contributors to absolute performance.
Relative to the FTSE Developed Europe Index, the Fund’s and the Underlying Index’s security selection and underweight position in the financials sectors and their security selection and overweight position in the utilities sector were leading detractors from performance, while their overweight positions and security selection in both the technology and basic materials sectors were leading contributors to performance.
HOW WAS THE FUND POSITIONED?
During the reporting period, the Fund’s largest sector allocations were in the consumer goods and health care sectors, while its smallest allocations were in the oil & gas and financials sectors. The Fund’s largest country allocations were in the U.K. and Germany and its smallest allocations were in Portugal and Austria.
| | | | | | | | |
| | | |
| OCTOBER 31, 2017 | | JPMORGAN EXCHANGE-TRADED FUNDS | | | | | 7 | |
JPMorgan Diversified Return Europe Equity ETF
FUND COMMENTARY
TWELVE MONTHS ENDED OCTOBER 31, 2017 (Unaudited) (continued)
| | | | | | | | |
| TOP TEN EQUITY HOLDINGS OF THE PORTFOLIO**** | |
| | 1. | | | SAP SE (Germany) | | | 2.5 | % |
| | 2. | | | Iberdrola SA (Spain) | | | 2.1 | |
| | 3. | | | Novartis AG (Registered) (Switzerland) | | | 1.8 | |
| | 4. | | | Vodafone Group plc (United Kingdom) | | | 1.8 | |
| | 5. | | | Infineon Technologies AG (Germany) | | | 1.6 | |
| | 6. | | | Capgemini SE (France) | | | 1.6 | |
| | 7. | | | Swisscom AG (Registered) (Switzerland) | | | 1.5 | |
| | 8. | | | ASML Holding NV (Netherlands) | | | 1.4 | |
| | 9. | | | GlaxoSmithKline plc (United Kingdom) | | | 1.4 | |
| | 10. | | | Royal Dutch Shell plc, Class B (Netherlands) | | | 1.3 | |
| | | | |
PORTFOLIO COMPOSITION BY COUNTRY**** | |
United Kingdom | | | 23.2 | % |
Germany | | | 14.3 | |
France | | | 13.1 | |
Switzerland | | | 11.6 | |
Spain | | | 8.1 | |
Sweden | | | 5.9 | |
Netherlands | | | 5.3 | |
Finland | | | 4.8 | |
Denmark | | | 3.1 | |
Norway | | | 2.8 | |
Italy | | | 2.5 | |
Belgium | | | 1.7 | |
Portugal | | | 1.1 | |
Austria | | | 1.1 | |
Others (each less than 1.0%) | | | 1.4 | |
| * | | The return shown is based on net asset value calculated for shareholder transactions and may differ from the return shown in the financial highlights, which reflects adjustments made to the net asset value in accordance with accounting principles generally accepted in the United States of America. The net asset value was $61.15 as of October 31, 2017. |
| ** | | Market price return is calculated assuming an initial investment made at the market price at the beginning of the period, reinvestment of all dividends and distributions at market price during the period, and sale at the market price on the last day of the period. The price used to calculate the market price return is the midpoint of the bid/ask spread at the close of business on the NYSE Arca. The midpoint price was $61.42 as of October 31, 2017. |
| *** | | The adviser seeks to achieve the Fund’s objective. There can be no guarantee it will be achieved. |
| **** | | Percentages indicated are based on total investments as of October 31, 2017. The Fund’s composition is subject to change. |
| | | | | | |
| | | |
| 8 | | | | JPMORGAN EXCHANGE-TRADED FUNDS | | OCTOBER 31, 2017 |
| | | | | | | | | | | | |
AVERAGE ANNUAL TOTAL RETURNS AS OF OCTOBER 31, 2017 (Unaudited) | |
| | | INCEPTION DATE | | | 1 YEAR | | | SINCE
INCEPTION | |
| JPMorgan Diversified Return Europe Equity ETF | | | | | | | | | | | | |
Net Asset Value | | | December 18, 2015 | | | | 25.42% | | | | 12.73% | |
Market Price | | | | | | | 25.80% | | | | 13.00% | |
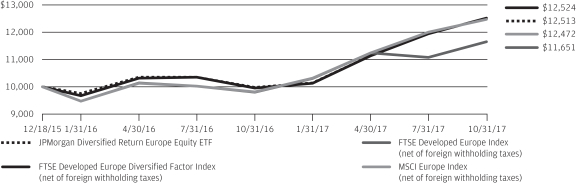
LIFE OF FUND PERFORMANCE (12/18/15 TO 10/31/17)
The performance quoted is past performance and is not a guarantee of future results. Exchange-traded funds are subject to certain market risks. Investment returns and principal value of an investment will fluctuate so that an investor’s shares, when sold or redeemed, may be worth more or less than their original cost. Current performance may be higher or lower than the performance data shown. For up-to-date, month-end performance information please call 1-844-457-6383.
Fund commenced operations on December 18, 2015.
The graph illustrates comparative performance for $10,000 invested in shares of the JPMorgan Diversified Return Europe Equity ETF, the FTSE Developed Europe Diversified Factor Index, the FTSE Developed Europe Index, and the MSCI Europe Index from December 18, 2015 to October 31, 2017. The performance of the Fund reflects the deduction of Fund expenses and assumes reinvestment of all dividends and capital gain distributions, if any. The performance of the FTSE Developed Europe Diversified Factor Index, the FTSE Developed Europe Index, and the MSCI Europe Index does not reflect the deduction of expenses associated with an exchange-traded fund and has been adjusted to reflect reinvestment of all dividends and capital gain distributions of the securities included in the Index, if applicable. The FTSE Developed Europe Diversified Factor Index is an index comprised of equity securities from the developed European markets selected to represent a diversified set of factor characteristics, originally developed by the adviser, and its equity holdings are selected by the index provider primarily from the constituents of the FTSE Developed Europe Index. The FTSE Developed Europe Diversified Factor Index
includes large and mid-cap stocks providing coverage of developed European markets. The FTSE Developed Europe Index is a market-capitalization weighted index representing the performance of large- and mid-cap companies in developed European markets. FTSE International Limited is the index provider for the two FTSE indexes. The MSCI Europe Index is a free float-adjusted market capitalization weighted index that is designed to measure the equity market performance of the developed markets in Europe. Investors can-not invest directly in an index.
Fund performance reflects the waiver of the Fund’s fees and reimbursement of expenses for certain periods since the inception date. Without these waivers and reimbursements, performance would have been lower. Also, performance shown in this section does not reflect the deduction of taxes that a shareholder may pay on Fund distributions or redemption or sale of Fund shares.
International investing involves a greater degree of risk and increased volatility. Changes in currency exchange rates and differences in accounting and taxation policies outside the United States can raise or lower returns. Also, some over-seas markets may not be as politically and economically stable as the United States and other nations.
The returns shown are based on net asset values calculated for shareholder transactions and may differ from the returns shown in the financial highlights, which reflect adjustments made to the net asset values in accordance with accounting principles generally accepted in the United States of America.
| | | | | | | | |
| | | |
| OCTOBER 31, 2017 | | JPMORGAN EXCHANGE-TRADED FUNDS | | | | | 9 | |
JPMorgan Diversified Return Global Equity ETF
FUND COMMENTARY
TWELVE MONTHS ENDED OCTOBER 31, 2017 (Unaudited)
| | | | |
| REPORTING PERIOD RETURN: | | | |
| JPMorgan Diversified Return Global Equity ETF | | | | |
Net Asset Value* | | | 20.61% | |
| Market Price** | | | 20.40% | |
| FTSE Developed Diversified Factor Index (net of foreign withholding taxes) | | | 20.71% | |
| FTSE Developed Index (net of foreign withholding taxes) | | | 23.38% | |
| Morgan Stanley Capital International (MSCI) World Index (net of foreign withholding taxes) | | | 22.77% | |
| |
| Net Assets as of 10/31/2017 | | $ | 103,695,070 | |
INVESTMENT OBJECTIVE***
The JPMorgan Diversified Return Global Equity ETF (the “Fund”) seeks investment results that closely correspond, before fees and expenses, to the performance of the FTSE Developed Diversified Factor Index (the “Underlying Index”).
INVESTMENT APPROACH
The Fund is passively managed to the Underlying Index, which provides exposure to large and mid-cap equity securities in developed global markets, diversified across global regions and industries. The Underlying Index uses a proprietary multi-factor selection process that utilizes the following characteristics: valuation, momentum, volatility and market capitalization. The Underlying Index’s methodology includes quarterly rebalancing.
HOW DID THE MARKET PERFORM?
Global financial markets overall provided positive returns during the reporting period, with emerging market equities outperforming equities in the U.S. and other developed markets. The world’s leading economies continued to expand throughout the first ten months of 2017, lifting corporate profits and capital investment as well as business and consumer sentiment.
Synchronized global growth and industrial demand helped to lift commodities prices, particularly for copper and other metals, toward the end of the reporting period. While global oil prices declined in the early part of the reporting period, prices for benchmark Brent crude oil remained above $50 dollars a barrel through October 2017.
In the U.S., equities prices reached record highs throughout the twelve month reporting period and the Standard & Poor’s 500 Index hit fresh highs in 11 of the 22 trading days in October 2017.
In Europe, financial markets continued to benefit from global growth, low interest rates and stimulus from the European Central Bank. Demand from China and other emerging market nations helped to lift exports from Germany and other leading European Union (EU) economies. While the U.K.’s impending exit from the EU and a separatist movement in Spain’s Catalan region remained worrisome for politicians and economists,
financial markets appeared to be largely unaffected. Japan’s equities market was a leading performer during the final months of the reporting period amid an improving economy and a snap election that handed Prime Minister Shinzo Abe’s Liberal Democratic Party a parliamentary majority.
In China, government efforts to curb speculation in its financial markets helped to keep market volatility in check, while economic indicators showed continued strong growth. Global economic growth and low interest rates continued to benefit both equities and bonds in emerging market nations.
HOW DID THE FUND PERFORM?
For the twelve months ended October 31, 2017, the Fund posted a positive absolute performance and experienced a performance deviation of -0.10% relative to the Underlying Index. The Fund underperformed the FTSE Developed Index (net of foreign withholding taxes) and the MSCI World Index, both of, which are more traditional market capitalization weighted indexes.
Because the Fund’s holdings were closely aligned with those of the Underlying Index, variances in relative performance due to security selection and/or sector allocation were not significant. The majority of the Fund’s deviation against the Underlying Index was due to specific trading limits, differences in valuations because of the timing of the local market closings and the net asset value calculations, the Fund’s small cash allocation and fees and operating expenses incurred by the Fund.
The Fund’s and the Underlying Index’s positions in the basic materials and technology sectors were leading contributors to absolute performance, while their positions in the telecommunications and consumer services sectors were the smallest contributors to absolute performance.
Relative to the FTSE Developed Index, the Fund’s and the Underlying Index’s security selection and underweight position in the financials sector and its security selection and overweight position in the utilities sector were leading detractors from performance. The Fund’s and the Underlying Index’s security selection in both the oil & gas sector and the basic materials sector was a leading contributor to relative performance.
| | | | | | |
| | | |
| 10 | | | | JPMORGAN EXCHANGE-TRADED FUNDS | | OCTOBER 31, 2017 |
HOW WAS THE FUND POSITIONED?
During the reporting period, the Fund’s largest allocation was in North America markets — particularly the U.S. — with modestly smaller allocations to Asia, Japan and Europe. In terms of sectors, the Fund’s largest allocations were in the consumer goods and industrials sectors, while the smallest allocations were in the oil & gas and telecommunications sectors.
| | | | | | | | |
| TOP TEN EQUITY HOLDINGS OF THE PORTFOLIO**** | |
| | 1. | | | Samsung Electronics Co. Ltd. (South Korea) | | | 0.6 | % |
| | 2. | | | SK Hynix, Inc. (South Korea) | | | 0.5 | |
| | 3. | | | CSL Ltd. (Australia) | | | 0.5 | |
| | 4. | | | Toyota Motor Corp. (Japan) | | | 0.4 | |
| | 5. | | | Intel Corp. (United States) | | | 0.4 | |
| | 6. | | | CK Hutchison Holdings Ltd. (Hong Kong) | | | 0.4 | |
| | 7. | | | NAVER Corp. (South Korea) | | | 0.4 | |
| | 8. | | | Wesfarmers Ltd. (Australia) | | | 0.4 | |
| | 9. | | | SoftBank Group Corp. (Japan) | | | 0.4 | |
| | 10. | | | Johnson & Johnson (United States) | | | 0.4 | |
| | | | |
PORTFOLIO COMPOSITION BY COUNTRY**** | |
United States | | | 25.2 | % |
Japan | | | 23.1 | |
South Korea | | | 10.2 | |
Australia | | | 7.0 | |
France | | | 4.6 | |
Hong Kong | | | 4.1 | |
Canada | | | 3.6 | |
Germany | | | 3.3 | |
Sweden | | | 2.7 | |
United Kingdom | | | 2.4 | |
Singapore | | | 2.0 | |
Switzerland | | | 1.8 | |
Spain | | | 1.8 | |
Netherlands | | | 1.4 | |
Others (each less than 1.0%) | | | 6.3 | |
Short-Term Investment | | | 0.5 | |
| * | | The return shown is based on net asset value calculated for shareholder transactions and may differ from the return shown in the financial highlights, which reflects adjustments made to the net asset value in accordance with accounting principles generally accepted in the United States of America. The net asset value was $61.00 as of October 31, 2017. |
| ** | | Market price return is calculated assuming an initial investment made at the market price at the beginning of the period, reinvestment of all dividends and distributions at market price during the period, and sale at the market price on the last day of the period. The price used to calculate the market price return is the midpoint of the bid/ask spread at the close of business on the NYSE Arca. The midpoint price was $61.14 as of October 31, 2017. |
| *** | | The adviser seeks to achieve the Fund’s objective. There can be no guarantee it will be achieved. |
| **** | | Percentages indicated are based on total investments as of October 31, 2017. The Fund’s composition is subject to change. |
| | | | | | | | |
| | | |
| OCTOBER 31, 2017 | | JPMORGAN EXCHANGE-TRADED FUNDS | | | | | 11 | |
JPMorgan Diversified Return Global Equity ETF
FUND COMMENTARY
TWELVE MONTHS ENDED OCTOBER 31, 2017 (Unaudited) (continued)
| | | | | | | | | | | | | | | | |
AVERAGE ANNUAL TOTAL RETURNS AS OF OCTOBER 31, 2017 (Unaudited) | |
| | | INCEPTION DATE | | | 1 YEAR | | | 3 YEARS | | | SINCE
INCEPTION | |
JPMorgan Diversified Return Global Equity ETF | | | | | | | | | | | | | | | | |
Net Asset Value | | | June 16, 2014 | | | | 20.61% | | | | 8.80% | | | | 7.58% | |
Market Price | | | | | | | 20.40% | | | | 8.58% | | | | 7.65% | |
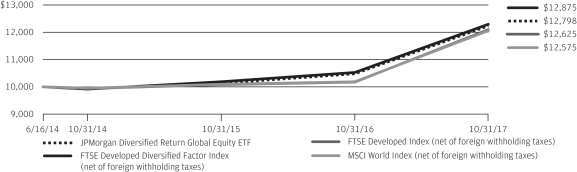
LIFE OF FUND PERFORMANCE (6/16/14 TO 10/31/17)
The performance quoted is past performance and is not a guarantee of future results. Exchange-traded funds are subject to certain market risks. Investment returns and principal value of an investment will fluctuate so that an investor’s shares, when sold or redeemed, may be worth more or less than their original cost. Current performance may be higher or lower than the performance data shown. For up-to-date, month-end performance information please call 1-844-457-6383.
Fund commenced operations on June 16, 2014.
The graph illustrates comparative performance for $10,000 invested in shares of the JPMorgan Diversified Return Global Equity ETF, the FTSE Developed Diversified Factor Index, the FTSE Developed Index, and the MSCI World Index from June 16, 2014 to October 31, 2017. The performance of the Fund reflects the deduction of Fund expenses and assumes reinvestment of all dividends and capital gain distributions, if any. The performance of the FTSE Developed Diversified Factor Index, the FTSE Developed Index and the MSCI World Index does not reflect the deduction of expenses associated with an exchange-traded fund and has been adjusted to reflect reinvestment of all dividends and capital gain distributions of the securities included in the Index, if applicable. The FTSE Developed Diversified Factor Index is an index comprised of equity securities from developed global markets selected to represent a diversified set of factor characteristics, originally developed by the adviser, and its holdings are selected by the index provider primarily from the constituents of the FTSE Developed Index. The FTSE Developed Index is a market-capitalization weighted
index representing the performance of large- and mid-cap companies in developed markets. The index is derived from the FTSE Global Equity Index Series (GEIS), which covers 98% of the world’s investable market capitalization. FTSE International Limited is the index provider for the two FTSE indexes. The MSCI World Index is a free float-adjusted market capitalization weighted index that is designed to measure the equity market performance of developed markets. Investors can not invest directly in an index.
Fund performance reflects the waiver of the Fund’s fees and reimbursement of expenses for certain periods since the inception date. Without these waivers and reimbursements, performance would have been lower. Also, performance shown in this section does not reflect the deduction of taxes that a shareholder may pay on Fund distributions or redemption or sale of Fund shares.
International investing involves a greater degree of risk and increased volatility. Changes in currency exchange rates and differences in accounting and taxation policies outside the United States can raise or lower returns. Also, some over-seas markets may not be as politically and economically stable as the United States and other nations.
The returns shown are based on net asset values calculated for shareholder transactions and may differ from the returns shown in the financial highlights, which reflect adjustments made to the net asset values in accordance with accounting principles generally accepted in the United States of America.
| | | | | | |
| | | |
| 12 | | | | JPMORGAN EXCHANGE-TRADED FUNDS | | OCTOBER 31, 2017 |
JPMorgan Diversified Return International Currency Hedged ETF
FUND COMMENTARY
TWELVE MONTHS ENDED OCTOBER 31, 2017 (Unaudited)
| | | | |
| REPORTING PERIOD RETURN: | |
| JPMorgan Diversified Return International Currency Hedged ETF | | | | |
| Net Asset Value* | | | 20.04% | |
| Market Price** | | | 19.30% | |
| FTSE Developed ex North America Diversified Factor 100% Hedged to USD Index (net of foreign withholding taxes) | | | 20.00% | |
| FTSE Developed ex North America Diversified Factor Index (net of foreign withholding taxes) | | | 20.53% | |
| FTSE Developed ex North America Index (net of foreign with holding taxes) | | | 24.37% | |
| |
| Net Assets as of 10/31/2017 | | $ | 48,274,467 | |
INVESTMENT OBJECTIVE***
The JPMorgan Diversified Return International Currency Hedged ETF (the “Fund”) seeks investment results that closely correspond, before fees and expenses, to the performance of the FTSE Developed ex North America Diversified Factor 100% Hedged to USD Index (the “Underlying Index”).
INVESTMENT APPROACH
The Fund is passively managed to the Underlying Index, which is composed of large and midcap equity securities in developed markets outside North America. The Underlying Index uses a proprietary multi-factor selection process that measures the following characteristics: valuation, momentum, volatility and market capitalization. In addition to reflecting international stock performance, the Underlying Index attempts to minimize the impact of exchange rate fluctuations by hedging currency exposure against the U.S. dollar on a monthly basis.
HOW DID THE MARKET PERFORM?
Global financial markets overall provided positive returns during the reporting period, with emerging market equities outperforming equities in the U.S. and other developed markets. The world’s leading economies continued to expand throughout the first ten months of 2017, lifting corporate profits and capital investment as well as business and consumer sentiment.
Synchronized global growth and industrial demand helped to lift commodities prices, particularly for copper and other metals, toward the end of the reporting period. While global oil prices declined in the early part of the reporting period, prices for benchmark Brent crude oil remained above $50 dollars a barrel through October 2017.
In Europe, financial markets continued to benefit from global growth, low interest rates and stimulus from the European Central Bank. Demand from China and other emerging market nations helped to lift exports from Germany and other leading European Union (EU) economies. While the U.K.’s impending exit from the EU and a separatist movement in Spain’s Catalan region remained worrisome for politicians and economists, financial markets appeared to be largely unaffected. Japan’s equities market was a leading performer during the final
months of the reporting period amid an improving economy and a snap election that handed Prime Minister Shinzo Abe’s Liberal Democratic Party a parliamentary majority.
HOW DID THE FUND PERFORM?
The Fund posted a positive absolute return for the twelve months ended October 31, 2017 and its performance deviated from the Underlying Index by 0.04%. The Fund and the Underlying Index underperformed the non-hedged FTSE Developed ex North America Diversified Factor Index and the FTSE Developed ex North America Index, which is a traditional market capitalization weighted index that is not hedged to the U.S. dollar.
Because the Fund’s holdings closely aligned with those of the Underlying Index, variances in relative performance to the Underlying Index were not significant. The majority of the Fund’s deviation against the Underlying Index was due to differences in performance of the currency hedge, the Fund’s small cash allocation and fees and operating expenses incurred by the Fund.
Relative to the FTSE Developed ex North America Index, the Fund’s and the Underlying Index’s security selection and overweight positions in the utilities sector and their security selection and underweight in the industrials sectors were leading detractors from performance, while the Fund’s and the Underlying Index’s security selection in the consumer goods and basic materials sectors was a leading contributor to performance.
HOW WAS THE FUND POSITIONED?
During the reporting period, the Fund’s largest sector allocations were in the consumer goods and industrials sectors, while the smallest sector allocations were in the oil & gas and telecommunications sectors. The largest regional allocation was in the Asia Pacific ex-Japan region, while the smallest regional allocation was in the U.K.
| * | | The return shown is based on net asset value calculated for shareholder transactions and may differ from the return shown in the financial highlights, which reflects adjustments made to the net asset value in accordance with accounting principles generally accepted in the United States of America. The net asset value was $30.17 as of October 31, 2017. |
| | | | | | | | |
| | | |
| OCTOBER 31, 2017 | | JPMORGAN EXCHANGE-TRADED FUNDS | | | | | 13 | |
JPMorgan Diversified Return International Currency Hedged ETF
FUND COMMENTARY
TWELVE MONTHS ENDED OCTOBER 31, 2017 (Unaudited) (continued)
| ** | | Market price return is calculated assuming an initial investment made at the market price at the beginning of the period, reinvestment of all dividends and distributions at market price during the period, and sale at the market price on the last day of the period. The price used to calculate the market price return is |
| | the midpoint of the bid/ask spread at the close of business on the NYSE Arca. The midpoint price was $30.02 as of October 31, 2017. |
| *** | | The adviser seeks to achieve the Fund’s objective. There can be no guarantee it will be achieved. |
| | | | | | |
| | | |
| 14 | | | | JPMORGAN EXCHANGE-TRADED FUNDS | | OCTOBER 31, 2017 |
| | | | | | | | | | | | |
AVERAGE ANNUAL TOTAL RETURNS AS OF OCTOBER 31, 2017 (Unaudited) | |
| | | INCEPTION DATE | | | 1 YEAR | | | SINCE
INCEPTION | |
| JPMorgan Diversified Return International Currency Hedged ETF | | | | | | | | | | | | |
Net Asset Value | | | April 1, 2016 | | | | 20.04% | | | | 15.93% | |
Market Price | | | | | | | 19.30% | | | | 15.54% | |
LIFE OF FUND PERFORMANCE (4/01/16 TO 10/31/17)
The performance quoted is past performance and is not a guarantee of future results. Exchange-traded funds are subject to certain market risks. Investment returns and principal value of an investment will fluctuate so that an investor’s shares, when sold or redeemed, may be worth more or less than their original cost. Current performance may be higher or lower than the performance data shown. For up-to-date, month-end performance information please call 1-844-457-6383.
Fund commenced operations on April 1, 2016.
The graph illustrates comparative performance for $10,000 invested in shares of the JPMorgan Diversified Return International Currency Hedged ETF, the FTSE Developed ex North America Diversified Factor 100% Hedged to USD Index, the FTSE Developed ex North America Diversified Factor Index, and the FTSE Developed ex North America Index from April 1, 2016 to October 31, 2017. The performance of the Fund reflects the deduction of Fund expenses and assumes reinvestment of all dividends and capital gain distributions, if any. The performance of the FTSE Developed ex North America Diversified Factor 100% Hedged to USD Index, the FTSE Developed ex North America Diversified Factor Index, and the FTSE Developed ex North America Index does not reflect the deduction of expenses associated with an exchange-traded fund and has been adjusted to reflect reinvestment of all dividends and capital gain distributions of the securities included in the Index, if applicable. The FTSE Developed ex North America Diversified Factor 100% Hedged to USD Index and the FTSE Developed ex North America Diversified Factor Index are indexes comprised of equity securities from developed global markets (excluding North America) selected to represent a diversified set of factor characteristics, originally developed by the adviser, and the equity holdings of both indexes are selected by the index provider primarily from the constituents of the FTSE Developed ex North America
Index. The FTSE Developed ex North America Diversified Factor 100% Hedged to USD Index represents international stock performance with the foreign currency risk of the index securities hedged against the U.S. dollar on a monthly basis. These two indexes include large- and mid-cap stocks providing coverage of developed markets outside of North America. The FTSE Developed ex North America Index a market-capitalization weighted index representing the performance of large- and mid-cap stocks in developed markets, excluding the US and Canada. The index is derived from the FTSE Global Equity Index Series (GEIS), which covers 98% of the world’s investable market capitalization. FTSE International Limited is the index provider for these three indexes. Investors cannot invest directly in an index.
Fund performance reflects the waiver of the Fund’s fees and reimbursement of expenses for certain periods since the inception date. Without these waivers and reimbursements, performance would have been lower. Also, performance shown in this section does not reflect the deduction of taxes that a shareholder may pay on Fund distributions or redemption or sale of Fund shares.
International investing involves a greater degree of risk and increased volatility. Changes in currency exchange rates and differences in accounting and taxation policies outside the United States can raise or lower returns. Also, some over-seas markets may not be as politically and economically stable as the United States and other nations.
The returns shown are based on net asset values calculated for shareholder transactions and may differ from the returns shown in the financial highlights, which reflect adjustments made to the net asset values in accordance with accounting principles generally accepted in the United States of America.
| | | | | | | | |
| | | |
| OCTOBER 31, 2017 | | JPMORGAN EXCHANGE-TRADED FUNDS | | | | | 15 | |
JPMorgan Diversified Return International Equity ETF
FUND COMMENTARY
TWELVE MONTHS ENDED OCTOBER 31, 2017 (Unaudited)
| | | | |
| REPORTING PERIOD RETURN: | |
| JPMorgan Diversified Return International Equity ETF | | | | |
| Net Asset Value* | | | 20.35% | |
| Market Price** | | | 20.30% | |
| FTSE Developed ex North America Diversified Factor Index (net of foreign withholding taxes) | | | 20.53% | |
| FTSE Developed ex North America Index (net of foreign withholding taxes) | | | 24.37% | |
| Morgan Stanley Capital International (MSCI) EAFE Index (net of foreign withholding taxes) | | | 23.44% | |
| |
| Net Assets as of 10/31/2017 | | $ | 1,159,887,006 | |
INVESTMENT OBJECTIVE***
The JPMorgan Diversified Return International Equity ETF (the “Fund”) seeks investment results that closely correspond, before fees and expenses, to the performance of the FTSE Developed ex North America Diversified Factor Index (the “Underlying Index”).
INVESTMENT APPROACH
The Fund is passively managed to the Underlying Index, which is composed of large cap and mid cap equity securities in developed markets outside North America, diversified across sectors and international regions. The Underlying Index uses a proprietary multi-factor selection process that measures the following characteristics: valuation, momentum, volatility and specific market capitalization. The Underlying Index methodology includes quarterly rebalancing.
HOW DID THE MARKET PERFORM?
Global financial markets overall provided positive returns during the reporting period, with emerging market equities outperforming equities in the U.S. and other developed markets. The world’s leading economies continued to expand throughout the first ten months of 2017, lifting corporate profits and capital investment as well as business and consumer sentiment. Low interest rates generally weighed on developed market bond prices, while investors’ search for higher yields helped push prices higher for emerging market bonds.
Synchronized global growth and industrial demand helped to lift commodities prices, particularly for copper and other metals, toward the end of the reporting period. While global oil prices declined in the early part of the reporting period, prices for benchmark Brent crude oil remained above $50 dollars a barrel through October 2017.
In Europe, financial markets continued to benefit from global growth, low interest rates and stimulus from the European Central Bank. Demand from China and other emerging market nations helped to lift exports from Germany and other leading European Union (EU) economies. While the U.K.’s impending exit from the EU and a separatist movement in Spain’s Catalan region remained worrisome for politicians and economists,
financial markets appeared to be largely unaffected. Japan’s equities market was a leading performer during the final months of the reporting period amid an improving economy and a snap election that handed Prime Minister Shinzo Abe’s Liberal Democratic Party a parliamentary majority.
HOW DID THE FUND PERFORM?
The Fund posted a positive absolute performance for the twelve months ended October 31, 2017, and its performance deviated by -0.18% from the performance of the Underlying Index. The Fund and the Underlying Index underperformed the FTSE Developed ex North America Index and the MSCI EAFE Index, which are more traditional market capitalization weighted indexes.
Because the Fund’s holdings were closely aligned with those of the Underlying Index, variances in relative performance due to security selection and/or sector allocation were not significant. The majority of the Fund’s deviation against the Underlying Index was due to specific trading limits the net asset value calculations, the Fund’s small cash allocation and fees and operating expenses incurred by the Fund.
The Fund’s and the Underlying Index’s positions in the basic materials and consumer goods sectors were leading contributors to absolute performance, while their positions in the utilities and telecommunications sectors were the smallest contributors to absolute performance.
Relative to the FTSE Developed ex North America Index, the Fund’s and the Underlying Index’s security selection and overweight positions in the utilities sector and their security selection and underweight in the industrials sectors were leading detractors from performance, while the Fund’s and the Underlying Index’s security selection in the consumer goods and basic materials sectors was a leading contributor to performance.
HOW WAS THE FUND POSITIONED?
During the reporting period, the Fund’s largest allocations were in the consumer goods and industrials sectors, while the smallest allocations were in the oil & gas and telecommunications sectors. By region, the Fund’s largest allocations were in Japan
| | | | | | |
| | | |
| 16 | | | | JPMORGAN EXCHANGE-TRADED FUNDS | | OCTOBER 31, 2017 |
and Europe, excluding the U.K. The Fund had modestly smaller allocations to Asia, excluding Japan, and the U.K.
| | | | | | | | |
| TOP TEN EQUITY HOLDINGS OF THE PORTFOLIO**** | |
| | 1. | | | Samsung Electronics Co. Ltd. (South Korea) | | | 0.9 | % |
| | 2. | | | Royal Dutch Shell plc, Class A (Netherlands) | | | 0.9 | |
| | 3. | | | BP plc (United Kingdom) (United Kingdom) | | | 0.8 | |
| | 4. | | | GlaxoSmithKline plc (United Kingdom) (United Kingdom) | | | 0.5 | |
| | 5. | | | AstraZeneca plc (United Kingdom) | | | 0.5 | |
| | 6. | | | Diageo plc (United Kingdom) | | | 0.5 | |
| | 7. | | | RELX plc (United Kingdom) | | | 0.5 | |
| | 8. | | | Vodafone Group plc (United Kingdom) | | | 0.5 | |
| | 9. | | | SoftBank Group Corp. (Japan) | | | 0.5 | |
| | 10. | | | CSL Ltd. (Australia) | | | 0.5 | |
| | | | |
SUMMARY OF INVESTMENTS BY COUNTRY**** | |
| Japan | | | 25.9 | % |
| United Kingdom | | | 16.8 | |
| South Korea | | | 11.2 | |
| Australia | | | 6.8 | |
| Hong Kong | | | 5.5 | |
| France | | | 5.0 | |
| Germany | | | 4.2 | |
| Sweden | | | 3.1 | |
| Singapore | | | 2.6 | |
| Switzerland | | | 2.3 | |
| Spain | | | 1.9 | |
| Netherlands | | | 1.9 | |
| Finland | | | 1.7 | |
| Norway | | | 1.3 | |
| Italy | | | 1.2 | |
| Denmark | | | 1.2 | |
| United States | | | 1.0 | |
| Belgium | | | 1.0 | |
| Others (each less than 1.0%) | | | 4.0 | |
| Short-Term Investment | | | 1.4 | |
| * | | The return shown is based on net asset value calculated for shareholder transactions and may differ from the return shown in the financial highlights, which reflects adjustments made to the net asset value in accordance with accounting principles generally accepted in the United States of America. The net asset value was $59.18 as of October 31, 2017. |
| ** | | Market price return is calculated assuming an initial investment made at the market price at the beginning of the period, reinvestment of all dividends and distributions at market price during the period, and sale at the market price on the last day of the period. The price used to calculate the market price return is the midpoint of the bid/ask spread at the close of business on the NYSE Arca. The midpoint price was $59.36 as of October 31, 2017. |
| *** | | The adviser seeks to achieve the Fund’s objective. There can be no guarantee it will be achieved. |
| **** | | Percentages indicated are based on total investments as of October 31, 2017. The Fund’s composition is subject to change. |
| | | | | | | | |
| | | |
| OCTOBER 31, 2017 | | JPMORGAN EXCHANGE-TRADED FUNDS | | | | | 17 | |
JPMorgan Diversified Return International Equity ETF
FUND COMMENTARY
TWELVE MONTHS ENDED OCTOBER 31, 2017 (Unaudited) (continued)
| | | | | | | | | | | | |
AVERAGE ANNUAL TOTAL RETURNS AS OF OCTOBER 31, 2017 (Unaudited) | |
| | | INCEPTION DATE | | | 1 YEAR | | | SINCE
INCEPTION | |
| JPMorgan Diversified Return International Equity ETF | | | | | | | | | | | | |
Net Asset Value | | | November 5, 2014 | | | | 20.35% | | | | 7.28% | |
Market Price | | | | | | | 20.30% | | | | 7.38% | |
LIFE OF FUND PERFORMANCE (11/5/14 TO 10/31/17)
The performance quoted is past performance and is not a guarantee of future results. Exchange-traded funds are subject to certain market risks. Investment returns and principal value of an investment will fluctuate so that an investor’s shares, when sold or redeemed, may be worth more or less than their original cost. Current performance may be higher or lower than the performance data shown. For up-to-date, month-end performance information please call 1-844-457-6383.
Fund commenced operations on November 5, 2014.
The graph illustrates comparative performance for $10,000 invested in shares of the JPMorgan Diversified Return International Equity ETF, the FTSE Developed ex North America Diversified Factor Index, the FTSE Developed ex North America Index, and the MSCI EAFE Index from November 5, 2014 to October 31, 2017. The performance of the Fund reflects the deduction of Fund expenses and assumes reinvestment of all dividends and capital gain distributions, if any. The performance of the FTSE Developed ex North America Diversified Factor Index, the FTSE Developed ex North America Index and the MSCI EAFE Index does not reflect the deduction of expenses associated with an exchange-traded fund and has been adjusted to reflect reinvestment of all dividends and capital gain distributions of the securities included in the Index, if applicable. The FTSE Developed ex North America Diversified Factor Index is an index comprised of equity securities from developed global markets (excluding North America) selected to represent a diversified set of factor characteristics, originally developed by the adviser and its holdings are selected by the index provider primarily from the constituents of the FTSE Developed ex North American Index. The FTSE Developed ex North
America Index is a market-capitalization weighted index representing the performance of large- and mid-cap stocks in developed markets, excluding the U.S. and Canada. The index is derived from the FTSE Global Equity Index Series (GEIS), which covers 98% of the world’s investable market capitalization. FTSE International Limited is the index provider for the two FTSE indexes. The MSCI EAFE Index is a free float-adjusted market capitalization weighted index that is designed to measure the equity market performance of developed markets, excluding the U.S. and Canada. Investors cannot invest directly in an index.
Fund performance reflects the waiver of the Fund’s fees and reimbursement of expenses for certain periods since the inception date. Without these waivers and reimbursements, performance would have been lower. Also, performance shown in this section does not reflect the deduction of taxes that a shareholder may pay on Fund distributions or redemption or sale of Fund shares.
International investing involves a greater degree of risk and increased volatility. Changes in currency exchange rates and differences in accounting and taxation policies outside the United States can raise or lower returns. Also, some overseas markets may not be as politically and economically stable as the United States and other nations.
The returns shown are based on net asset values calculated for shareholder transactions and may differ from the returns shown in the financial highlights, which reflect adjustments made to the net asset values in accordance with accounting principles generally accepted in the United States of America.
| | | | | | |
| | | |
| 18 | | | | JPMORGAN EXCHANGE-TRADED FUNDS | | OCTOBER 31, 2017 |
JPMorgan Diversified Return U.S. Equity ETF
FUND COMMENTARY
TWELVE MONTHS ENDED OCTOBER 31, 2017 (Unaudited)
| | | | |
| REPORTING PERIOD RETURN: | |
| JPMorgan Diversified Return U.S. Equity ETF | | | | |
| Net Asset Value* | | | 20.99% | |
| Market Price** | | | 21.02% | |
| Russell 1000 Diversified Factor Index | | | 21.42% | |
| Russell 1000 Index | | | 23.67% | |
| |
| Net Assets as of 10/31/2017 | | $ | 356,298,771 | |
INVESTMENT OBJECTIVE***
The JPMorgan Diversified Return U.S. Equity ETF (the “Fund”) seeks investment results that closely correspond, before fees and expenses, to the performance of the Russell 1000 Diversified Factor Index (the “Underlying Index”).
INVESTMENT APPROACH
The Fund is passively managed to the Underlying Index, which is composed of large cap and mid cap equity securities in the U.S. The Underlying Index uses a rules based proprietary multi-factor selection process that utilizes the following characteristics: valuation, momentum and quality. The Underlying Index security selection process then seeks to exclude the least attractive stocks based on these characteristics. The Underlying Index’s methodology includes quarterly rebalancing.
HOW DID THE MARKET PERFORM?
U.S. financial markets overall provided positive returns during the reporting period amid synchronized global economic growth, historically low interest rates and strong corporate earnings. While global oil prices declined in the early part of the reporting period, prices for benchmark Brent crude oil remained above $50 dollars a barrel through October 2017.
U.S. equities prices reached record highs throughout the reporting period and the Standard & Poor’s 500 Index (the “S&P 500”) hit fresh highs in 11 of the 22 trading days in October 2017. During the twelve months ended October 31, 2017, U.S. small capitalization stocks outperformed both large cap and mid cap stocks, generally, and across growth and value categories. Growth stocks generally outperformed value stocks across all market caps.
HOW DID THE FUND PERFORM?
The Fund posted a positive absolute performance and its performance deviated by -0.43% from the Underlying Index for the twelve months ended October 31, 2017. Both the Fund and the Underlying Index underperformed the Russell 1000 Index, which is a more traditional market capitalization weighted index.
Because the Fund’s holdings were closely aligned with those of the Underlying Index, variances in relative performance due to security selection and/or sector allocation were not significant. The majority of the Fund’s deviation against the Underlying Index was due to tax management of the Fund’s portfolio.
The Fund’s and the Underlying Index’s positions in the technology and health care sectors were leading contributors to absolute performance during the reporting period, while the Fund’s and the Underlying Index’s positions in the telecommunications and energy sectors made the smallest contributions to absolute performance.
Relative to the Russell 1000 Index, the Fund’s and the Underlying Index’s underweight position and security selection in the financials sector and their overweight position in the utilities sector were leading detractors from performance, while their underweight position in the oil & gas sector and their security selection in the health care sector were leading contributors to relative performance.
HOW WAS THE FUND POSITIONED?
During the reporting period, the Fund’s largest allocations were in the consumer goods and health care sectors, while the smallest allocations were in the telecommunications and oil & gas sectors.
| | | | | | | | |
| | | |
| OCTOBER 31, 2017 | | JPMORGAN EXCHANGE-TRADED FUNDS | | | | | 19 | |
JPMorgan Diversified Return U.S. Equity ETF
FUND COMMENTARY
TWELVE MONTHS ENDED OCTOBER 31, 2017 (Unaudited) (continued)
| | | | | | | | |
| TOP TEN EQUITY HOLDINGS OF THE PORTFOLIO**** | |
| | 1. | | | NVR, Inc. | | | 0.7 | % |
| | 2. | | | IAC/InterActiveCorp | | | 0.6 | |
| | 3. | | | Harris Corp. | | | 0.6 | |
| | 4. | | | Consolidated Edison, Inc. | | | 0.6 | |
| | 5. | | | WEC Energy Group, Inc. | | | 0.6 | |
| | 6. | | | Waters Corp. | | | 0.6 | |
| | 7. | | | Public Service Enterprise Group, Inc. | | | 0.6 | |
| | 8. | | | Eversource Energy | | | 0.5 | |
| | 9. | | | Monsanto Co. | | | 0.5 | |
| | 10. | | | Ameren Corp. | | | 0.5 | |
| | | | |
PORTFOLIO COMPOSITION BY SECTOR**** | |
| Health Care | | | 16.3 | % |
| Information Technology | | | 15.7 | |
| Consumer Discretionary | | | 15.4 | |
| Utilities | | | 12.2 | |
| Consumer Staples | | | 9.8 | |
| Industrials | | | 8.7 | |
| Financials | | | 8.1 | |
| Materials | | | 6.3 | |
| Energy | | | 4.5 | |
| Real Estate | | | 1.5 | |
| Telecommunication Services | | | 1.1 | |
| Short-Term Investment | | | 0.4 | |
| * | | The return shown is based on net asset value calculated for shareholder transactions and may differ from the return shown in the financial highlights, which reflects adjustments made to the net asset value in accordance with accounting principles generally accepted in the United States of America. The net asset value was $68.52 as of October 31, 2017. |
| ** | | Market price return is calculated assuming an initial investment made at the market price at the beginning of the period, reinvestment of all dividends and distributions at market price during the period, and sale at the market price on the last day of the period. The price used to calculate the market price return is the midpoint of the bid/ask spread at the close of business on the NYSE Arca. The midpoint price was $68.55 as of October 31, 2017. |
| *** | | The adviser seeks to achieve the Fund’s objective. There can be no guarantee it will be achieved. |
| **** | | Percentages indicated are based on total investments as of October 31, 2017. The Fund’s composition is subject to change. |
| | | | | | |
| | | |
| 20 | | | | JPMORGAN EXCHANGE-TRADED FUNDS | | OCTOBER 31, 2017 |
| | | | | | | | | | | | |
AVERAGE ANNUAL TOTAL RETURNS AS OF OCTOBER 31, 2017 (Unaudited) | |
| | | INCEPTION DATE | | | 1 YEAR | | | SINCE
INCEPTION | |
| JPMorgan Diversified Return U.S. Equity ETF | | | | | | | | | | | | |
Net Asset Value | | | September 29, 2015 | | | | 20.99% | | | | 16.98% | |
Market Price | | | | | | | 21.02% | | | | 17.01% | |
LIFE OF FUND PERFORMANCE (9/29/15 TO 10/31/17)
The performance quoted is past performance and is not a guarantee of future results. Exchange-traded funds are subject to certain market risks. Investment returns and principal value of an investment will fluctuate so that an investor’s shares, when sold or redeemed, may be worth more or less than their original cost. Current performance may be higher or lower than the performance data shown. For up-to-date, month-end performance information please call 1-844-457-6383.
Fund commenced operations on September 29, 2015.
The graph illustrates comparative performance for $10,000 invested in shares of the JPMorgan Diversified Return U.S. Equity ETF, the Russell 1000 Diversified Factor Index, and the Russell 1000 Index from September 29, 2015 to October 31, 2017. The performance of the Fund reflects the deduction of Fund expenses and assumes reinvestment of all dividends and capital gain distributions, if any. The performance of the Russell 1000 Diversified Factor Index and Russell 1000 Index does not reflect the deduction of expenses associated with an exchange-traded fund and has been adjusted to reflect reinvestment of all dividends and capital gain distributions of the securities included in the
Index, if applicable. The Russell 1000 Diversified Factor Index is an index comprised of U.S. equity securities selected to represent a diversified set of factor characteristics, originally developed by the adviser, and its holdings are selected by the index provider primarily from the constituents of the Russell 1000 Index. The Russell 1000 Index is a market-capitalization weighted index, which measures the performance of the 1,000 largest companies in the Russell 3000 Index. Investors cannot invest directly in an index.
Fund performance reflects the waiver of the Fund’s fees and reimbursement of expenses for certain periods since the inception date. Without these waivers and reimbursements, performance would have been lower. Also, performance shown in this section does not reflect the deduction of taxes that a shareholder may pay on Fund distributions or redemption or sale of Fund shares.
The returns shown are based on net asset values calculated for shareholder transactions and may differ from the returns shown in the financial highlights, which reflect adjustments made to the net asset values in accordance with accounting principles generally accepted in the United States of America.
| | | | | | | | |
| | | |
| OCTOBER 31, 2017 | | JPMORGAN EXCHANGE-TRADED FUNDS | | | | | 21 | |
JPMorgan Diversified Return U.S. Mid Cap Equity ETF
FUND COMMENTARY
TWELVE MONTHS ENDED OCTOBER 31, 2017 (Unaudited)
| | | | |
| REPORTING PERIOD RETURN: | |
| JPMorgan Diversified Return U.S. Mid Cap Equity ETF | | | | |
| Net Asset Value* | | | 21.25% | |
| Market Price** | | | 21.31% | |
| Russell Midcap Diversified Factor Index | | | 21.61% | |
| Russell Midcap Index | | | 21.09% | |
| |
| Net Assets as of 10/31/2017 | | $ | 62,063,250 | |
INVESTMENT OBJECTIVE***
The JPMorgan Diversified Return U.S. Mid Cap Equity ETF (the “Fund”) seeks investment results that closely correspond, before fees and expenses, to the performance of the Russell MidCap Diversified Factor Index (the “Underlying Index”).
INVESTMENT APPROACH
The Fund is passively managed to the Underlying Index, which tracks mid cap equity securities in the U.S. The Underlying Index uses a proprietary multi-factor selection process that utilizes the following characteristics: relative valuation, momentum and quality. The Underlying Index’s methodology includes quarterly rebalancing.
HOW DID THE MARKET PERFORM?
U.S. financial markets overall provided positive returns during the reporting period amid synchronized global economic growth, historically low interest rates and strong corporate earnings. While global oil prices declined in the early part of the reporting period, prices for benchmark Brent crude oil remained above $50 dollars a barrel through October 2017.
U.S. equities prices reached record highs throughout the reporting period and the Standard & Poor’s 500 Index (the “S&P 500”) hit fresh highs in 11 of the 22 trading days in October 2017. During the twelve months ended October 31, 2017, U.S. mid capitalization stocks generally underperformed both large cap and small cap stocks. Within mid caps, growth stocks outperformed value stocks.
HOW DID THE FUND PERFORM?
The Fund posted a positive absolute performance and its performance deviated by -0.36% from the Underlying Index for
the twelve months ended October 31, 2017. The Fund and the Underlying Index outperformed the Russell Midcap Index, which is a more traditional market capitalization weighted index.
Because the Fund’s holdings were closely aligned with those of the Underlying Index, variances in relative performance due to security selection and/or sector allocation were not significant. The majority of the Fund’s deviation against the Underlying Index was due to tax management of the Fund’s portfolio.
The Fund’s and the Underlying Index’s positions in the technology and industrials sectors were leading contributors to absolute performance during the reporting period, while the Fund’s and the Underlying Index’s positions in the telecommunications and oil & gas sectors made the smallest contribution to absolute performance.
Relative to the Russell Midcap Index, the Fund’s and the Underlying Index’s underweight position and security selection in the oil & gas sector and its overweight position and security selection in the health care sector were leading contributors to performance, while their overweight position and security selection in the utilities sector and their security selection in the technology sector were leading detractors from performance.
HOW WAS THE FUND POSITIONED?
During the reporting period, the Fund’s and the Underlying Index’s largest average allocations were in the financials and consumer goods sectors and the smallest average allocations were in the telecommunications and oil & gas sectors.
| | | | | | |
| | | |
| 22 | | | | JPMORGAN EXCHANGE-TRADED FUNDS | | OCTOBER 31, 2017 |
| | | | | | | | |
| TOP TEN EQUITY HOLDINGS OF THE PORTFOLIO**** | |
| | 1. | | | Great Plains Energy, Inc. | | | 0.5 | % |
| | 2. | | | Alliant Energy Corp. | | | 0.5 | |
| | 3. | | | Xcel Energy, Inc. | | | 0.5 | |
| | 4. | | | Consolidated Edison, Inc. | | | 0.5 | |
| | 5. | | | American Water Works Co., Inc. | | | 0.5 | |
| | 6. | | | Ameren Corp. | | | 0.5 | |
| | 7. | | | CMS Energy Corp. | | | 0.5 | |
| | 8. | | | Public Service Enterprise Group, Inc. | | | 0.5 | |
| | 9. | | | Pinnacle West Capital Corp. | | | 0.5 | |
| | 10. | | | Edison International | | | 0.5 | |
| | | | |
PORTFOLIO COMPOSITION BY SECTOR**** | |
| Consumer Discretionary | | | 15.7 | % |
| Information Technology | | | 15.7 | |
| Health Care | | | 13.1 | |
| Utilities | | | 12.4 | |
| Industrials | | | 12.2 | |
| Financials | | | 9.8 | |
| Materials | | | 6.7 | |
| Consumer Staples | | | 6.3 | |
| Real Estate | | | 3.9 | |
| Energy | | | 3.7 | |
| Telecommunication Services | | | 0.2 | |
| Short-Term Investment | | | 0.3 | |
| * | | The return shown is based on net asset value calculated for shareholder transactions and may differ from the return shown in the financial highlights, which reflects adjustments made to the net asset value in accordance with accounting principles generally accepted in the United States of America. The net asset value was $62.06 as of October 31, 2017. |
| ** | | Market price return is calculated assuming an initial investment made at the market price at the beginning of the period, reinvestment of all dividends and distributions at market price during the period, and sale at the market price on the last day of the period. The price used to calculate the market price return is the midpoint of the bid/ask spread at the close of business on the NYSE Arca. The midpoint price was $62.08 as of October 31, 2017. |
| *** | | The adviser seeks to achieve the Fund’s objective. There can be no guarantee it will be achieved. |
| **** | | Percentages indicated are based on total investments as of October 31, 2017. The Fund’s composition is subject to change. |
| | | | | | | | |
| | | |
| OCTOBER 31, 2017 | | JPMORGAN EXCHANGE-TRADED FUNDS | | | | | 23 | |
JPMorgan Diversified Return U.S. Mid Cap Equity ETF
FUND COMMENTARY
TWELVE MONTHS ENDED OCTOBER 31, 2017 (Unaudited) (continued)
| | | | | | | | | | | | |
AVERAGE ANNUAL TOTAL RETURNS AS OF OCTOBER 31, 2017 (Unaudited) | |
| | | INCEPTION DATE | | | 1 YEAR | | | SINCE
INCEPTION | |
| JPMorgan Diversified Return U.S. Mid Cap Equity ETF | | | | | | | | | | | | |
Net Asset Value | | | May 11, 2016 | | | | 21.25% | | | | 16.50% | |
Market Price | | | | | | | 21.31% | | | | 16.53% | |
LIFE OF FUND PERFORMANCE (5/11/16 TO 10/31/17)
The performance quoted is past performance and is not a guarantee of future results. Exchange-traded funds are subject to certain market risks. Investment returns and principal value of an investment will fluctuate so that an investor’s shares, when sold or redeemed, may be worth more or less than their original cost. Current performance may be higher or lower than the performance data shown. For up-to-date, month-end performance information please call 1-844-457-6383.
Fund commenced operations on May 11, 2016.
The graph illustrates comparative performance for $10,000 invested in shares of the JPMorgan Diversified Return U.S. Mid Cap Equity ETF, the Russell Midcap Diversified Factor Index, and the Russell Midcap Index from May 11, 2016 to October 31, 2017. The performance of the Fund reflects the deduction of Fund expenses and assumes reinvestment of all dividends and capital gain distributions, if any. The performance of the Russell Midcap Diversified Factor Index and Russell Midcap Index does not reflect the deduction of expenses associated with an exchange-traded fund and has been adjusted to reflect reinvestment of all dividends and capital gain distributions of the securities
included in the Index, if applicable. The Russell Midcap Diversified Factor Index is an index comprised of U.S. equity securities selected to represent a diversified set of factor characteristics, originally developed by the adviser, and its holdings are selected by the index provider primarily from the constituents of the Russell Midcap Index. The Russell Midcap Index is a market-capitalization weighted index which measures the performance of the 800 smallest companies in the Russell 1000 Index. Investors cannot invest directly in an index.
Fund performance reflects the waiver of the Fund’s fees and reimbursement of expenses for certain periods since the inception date. Without these waivers and reimbursements, performance would have been lower. Also, performance shown in this section does not reflect the deduction of taxes that a shareholder may pay on Fund distributions or redemption or sale of Fund shares.
The returns shown are based on net asset values calculated for shareholder transactions and may differ from the returns shown in the financial highlights, which reflect adjustments made to the net asset values in accordance with accounting principles generally accepted in the United States of America.
| | | | | | |
| | | |
| 24 | | | | JPMORGAN EXCHANGE-TRADED FUNDS | | OCTOBER 31, 2017 |
JPMorgan Diversified Return U.S. Small Cap Equity ETF
FUND COMMENTARY
PERIOD NOVEMBER 15, 2016 (FUND INCEPTION DATE) THROUGH OCTOBER 31, 2017 (Unaudited)
| | | | |
| REPORTING PERIOD RETURN: | |
| JPMorgan Diversified Return U.S. Small Cap Equity ETF | | | | |
| Net Asset Value* | | | 15.96% | |
| Market Price** | | | 16.16% | |
| Russell 2000 Diversified Factor Index | | | 16.23% | |
| Russell 2000 Index | | | 16.89% | |
| |
| Net Assets as of 10/31/2017 | | $ | 55,011,105 | |
INVESTMENT OBJECTIVE***
The JPMorgan Diversified Return U.S. Small Cap Equity ETF (the “Fund”) seeks investment results that closely correspond, before fees and expenses, to the performance of the Russell 2000 Diversified Factor Index (the “Underlying Index”).
INVESTMENT APPROACH
The Fund is passively managed to the Underlying Index, which tracks small-cap equity securities in the U.S. The Underlying Index uses a proprietary multi-factor selection process that utilizes the following characteristics: relative valuation, momentum and quality. The Underlying Index security selection process then seeks to exclude the least attractive stocks based on these characteristics. The Underlying Index’s methodology includes quarterly rebalancing.
HOW DID THE MARKET PERFORM?
U.S. financial markets overall provided positive returns during the reporting period amid synchronized global economic growth, historically low interest rates and strong corporate earnings. While global oil prices declined in the early part of the reporting period, prices for benchmark Brent crude oil remained above $50 dollars a barrel through October 2017.
U.S. equities prices reached record highs throughout the reporting period and the Standard & Poor’s 500 Index (the “S&P 500”) hit fresh highs in 11 of the 22 trading days in October 2017. During the twelve months ended October 31, 2017, U.S. small capitalization stocks outperformed both large cap and mid cap stocks, generally, and across growth and value categories. Within small caps, growth stocks outperformed value stocks.
HOW DID THE FUND PERFORM?
The Fund posted a positive absolute performance and a performance deviation of -0.27% relative to the Underlying Index for the period November 15, 2016 (the Fund’s inception date) to October 31, 2017. Both the Fund and the Underlying Index underperformed the Russell 2000 Index, which is a more traditional market capitalization weighted index.
Because the Fund’s holdings were closely aligned with those of the Underlying Index, variances in relative performance due to security selection and/or sector allocation were not significant. The majority of the Fund’s deviation against the Underlying Index was due to tax management of the Fund’s portfolio.
The Fund’s and the Underlying Index’s positions in the health care and industrials sectors were leading contributors to absolute performance. The Fund’s and the Underlying Index’s positions in the telecommunications and oil & gas sectors detracted from absolute performance during the reporting period.
Relative to the Russell 2000 Index, the Fund’s and the Underlying Index’s overweight positions and security selection in the consumer goods sector and their underweight position and security selection in the industrials sector were leading detractors from performance, while their security selection and underweight position in the oil & gas sector and their underweight position in the financials sector made a positive contribution to performance.
HOW WAS THE FUND POSITIONED?
During the reporting period, the Fund’s largest allocations were in the consumer goods and consumer services sectors and the smallest allocations were in the telecommunications and oil & gas sectors.
| | | | | | | | |
| | | |
| OCTOBER 31, 2017 | | JPMORGAN EXCHANGE-TRADED FUNDS | | | | | 25 | |
JPMorgan Diversified Return U.S. Small Cap Equity ETF
FUND COMMENTARY
PERIOD NOVEMBER 15, 2016 (FUND INCEPTION DATE) THROUGH OCTOBER 31, 2017 (Unaudited) (continued)
| | | | | | | | |
| TOP TEN EQUITY HOLDINGS OF THE PORTFOLIO**** | |
| | 1. | | | LCI Industries | | | 0.7 | % |
| | 2. | | | Boston Beer Co., Inc. (The), Class A | | | 0.7 | |
| | 3. | | | Webster Financial Corp. | | | 0.7 | |
| | 4. | | | Pool Corp. | | | 0.7 | |
| | 5. | | | West Pharmaceutical Services, Inc. | | | 0.6 | |
| | 6. | | | ALLETE, Inc. | | | 0.6 | |
| | 7. | | | MAXIMUS, Inc. | | | 0.6 | |
| | 8. | | | ONE Gas, Inc. | | | 0.6 | |
| | 9. | | | Columbia Sportswear Co. | | | 0.6 | |
| | 10. | | | Spire, Inc. | | | 0.6 | |
| | | | |
PORTFOLIO COMPOSITION BY SECTOR**** | |
| Consumer Discretionary | | | 20.9 | % |
| Industrials | | | 14.3 | |
| Information Technology | | | 13.6 | |
| Utilities | | | 11.9 | |
| Health Care | | | 11.0 | |
| Consumer Staples | | | 9.1 | |
| Materials | | | 6.7 | |
| Financials | | | 6.0 | |
| Real Estate | | | 2.2 | |
| Energy | | | 2.0 | |
| Telecommunication Services | | | 1.5 | |
| Short-Term Investment | | | 0.8 | |
| * | | The return shown is based on net asset value calculated for shareholder transactions and may differ from the return shown in the financial highlights, which reflects adjustments made to the net asset value in accordance with accounting principles generally accepted in the United States of America. The net asset value was $28.95 as of October 31, 2017. |
| ** | | Market price return is calculated assuming an initial investment made at the market price at the beginning of the period, reinvestment of all dividends and distributions at market price during the period, and sale at the market price on the last day of the period. The price used to calculate the market price return is the midpoint of the bid/ask spread at the close of business on the NYSE Arca. The midpoint price was $29.00 as of October 31, 2017. |
| *** | | The adviser seeks to achieve the Fund’s objective. There can be no guarantee it will be achieved. |
| **** | | Percentages indicated are based on total investments as of October 31, 2017. The Fund’s composition is subject to change. |
| | | | | | |
| | | |
| 26 | | | | JPMORGAN EXCHANGE-TRADED FUNDS | | OCTOBER 31, 2017 |
| | | | | | | | |
AVERAGE ANNUAL TOTAL RETURNS AS OF OCTOBER 31, 2017 (Unaudited) | |
| | | INCEPTION DATE | | | CUMULATIVE
SINCE
INCEPTION | |
| JPMorgan Diversified Return U.S. Small Cap Equity ETF | | | | | | | | |
Net Asset Value | | | November 15, 2016 | | | | 15.96% | |
Market Price | | | | | | | 16.16% | |
LIFE OF FUND PERFORMANCE (11/15/16 TO 10/31/17)
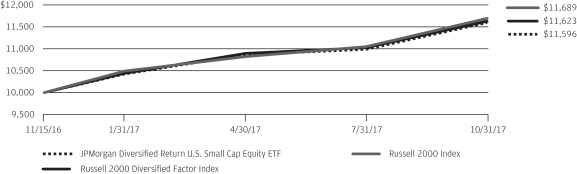
The performance quoted is past performance and is not a guarantee of future results. Exchange-traded funds are subject to certain market risks. Investment returns and principal value of an investment will fluctuate so that an investor’s shares, when sold or redeemed, may be worth more or less than their original cost. Current performance may be higher or lower than the performance data shown. For up-to-date, month-end performance information please call 1-844-457-6383.
Fund commenced operations on November 15, 2016.
The graph illustrates comparative performance for $10,000 invested in shares of the JPMorgan Diversified Return U.S. Small Cap Equity ETF, the Russell 2000 Diversified Factor Index, and the Russell 2000 Index from November 15, 2016 to October 31, 2017. The performance of the Fund reflects the deduction of Fund expenses and assumes reinvestment of all dividends and capital gain distributions, if any. The performance of the Russell 2000 Diversified Factor Index and Russell 2000 Index does not reflect the deduction of expenses associated with an exchange-traded fund and has been adjusted to reflect reinvestment of
all dividends and capital gain distributions of the securities included in the Index, if applicable. The Russell 2000 Diversified Factor Index is comprised of U.S. small cap equity securities selected to represent a diversified set of factor characteristics selected from the Russell 2000 Index. The Russell 2000 Index is an unmanaged index, measuring performance of the 2000 smallest stocks (on the basis of capitalization) in the Russell 3000 Index. Investors cannot invest directly in an index.
Fund performance reflects the waiver of the Fund’s fees and reimbursement of expenses for certain periods since the inception date. Without these waivers and reimbursements, performance would have been lower. Also, performance shown in this section does not reflect the deduction of taxes that a shareholder may pay on Fund distributions or redemption or sale of Fund shares.
The returns shown are based on net asset values calculated for shareholder transactions and may differ from the returns shown in the financial highlights, which reflect adjustments made to the net asset values in accordance with accounting principles generally accepted in the United States of America.
| | | | | | | | |
| | | |
| OCTOBER 31, 2017 | | JPMORGAN EXCHANGE-TRADED FUNDS | | | | | 27 | |
JPMorgan Diversified Emerging Markets Equity ETF
SCHEDULE OF PORTFOLIO INVESTMENTS
AS OF OCTOBER 31, 2017
| | | | | | | | |
SHARES | | | INVESTMENTS | | VALUE($) | |
| | Common Stocks — 99.8% | | | | |
| | | | Brazil — 8.3% | | | | |
| | 13,600 | | | AES Tiete Energia SA | | | 53,963 | |
| | 29,526 | | | Banco Bradesco SA* | | | 296,226 | |
| | 113,966 | | | Banco Bradesco SA (Preference)* | | | 1,210,974 | |
| | 40,839 | | | Banco do Brasil SA* | | | 431,698 | |
| | 14,935 | | | Banco Santander Brasil SA | | | 131,029 | |
| | 25,484 | | | BB Seguridade Participacoes SA | | | 215,087 | |
| | 31,419 | | | BR Malls Participacoes SA | | | 122,168 | |
| | 8,500 | | | Bradespar SA (Preference) | | | 62,542 | |
| | 8,950 | | | Braskem SA (Preference), Class A* | | | 142,268 | |
| | 53,300 | | | CCR SA | | | 295,885 | |
| | 10,000 | | | Cia Brasileira de Distribuicao (Preference)* | | | 233,179 | |
| | 29,722 | | | Cia de Saneamento Basico do Estado de Sao Paulo* | | | 271,935 | |
| | 4,130 | | | Cia de Transmissao de Energia Eletrica Paulista (Preference) | | | 83,653 | |
| | 70,005 | | | Cia Energetica de Minas Gerais (Preference) | | | 165,634 | |
| | 8,803 | | | Cia Paranaense de Energia (Preference) | | | 67,678 | |
| | 42,060 | | | Cielo SA | | | 287,231 | |
| | 25,752 | | | EDP — Energias do Brasil SA* | | | 114,775 | |
| | 34,811 | | | Embraer SA | | | 167,388 | |
| | 12,145 | | | Engie Brasil Energia SA | | | 133,839 | |
| | 14,757 | | | Equatorial Energia SA | | | 275,670 | |
| | 16,413 | | | Estacio Participacoes SA | | | 147,708 | |
| | 10,914 | | | Fibria Celulose SA | | | 174,188 | |
| | 17,000 | | | Fleury SA | | | 149,250 | |
| | 44,564 | | | Gerdau SA (Preference) | | | 149,169 | |
| | 5,300 | | | Grendene SA | | | 44,392 | |
| | 117,904 | | | Itau Unibanco Holding SA (Preference) | | | 1,521,330 | |
| | 145,339 | | | Itausa — Investimentos Itau SA (Preference) | | | 468,721 | |
| | 51,273 | | | JBS SA | | | 117,865 | |
| | 97,041 | | | Kroton Educacional SA | | | 538,111 | |
| | 9,912 | | | Localiza Rent a Car SA* | | | 174,376 | |
| | 45,283 | | | Lojas Renner SA* | | | 476,182 | |
| | 5,483 | | | M Dias Branco SA* | | | 81,089 | |
| | 11,800 | | | Natura Cosmeticos SA | | | 111,677 | |
| | 23,200 | | | Odontoprev SA | | | 111,344 | |
| | 139,518 | | | Petroleo Brasileiro SA* | | | 741,668 | |
| | 182,078 | | | Petroleo Brasileiro SA (Preference)* | | | 935,075 | |
| | 3,586 | | | Porto Seguro SA* | | | 39,200 | |
| | 8,400 | | | Qualicorp SA | | | 89,821 | |
| | 10,762 | | | Sao Martinho SA | | | 60,599 | |
| | 3,694 | | | Smiles Fidelidade SA* | | | 95,373 | |
| | 8,264 | | | Sul America SA | | | 45,346 | |
| | 20,762 | | | Suzano Papel e Celulose SA (Preference), Class A | | | 128,584 | |
| | 36,311 | | | Telefonica Brasil SA (Preference) | | | 560,321 | |
| | | | | | | | |
SHARES | | | INVESTMENTS | | VALUE($) | |
| | |
| | | | Brazil — continued | | | | |
| | 70,590 | | | TIM Participacoes SA | | | 261,317 | |
| | 16,439 | | | Transmissora Alianca de Energia Eletrica SA | | | 103,268 | |
| | 18,118 | | | Usinas Siderurgicas de Minas Gerais SA (Preference), Class A* | | | 48,739 | |
| | 138,502 | | | Vale SA* | | | 1,366,264 | |
| | 14,004 | | | Vale SA (Preference)* | | | 128,298 | |
| | 28,866 | | | WEG SA | | | 188,922 | |
| | | | | | | | |
| | | | | | | 13,821,019 | |
| | | | | | | | |
| | | | Chile — 1.5% | | | | |
| | 235,536 | | | Aguas Andinas SA, Class A | | | 153,453 | |
| | 976,398 | | | Banco de Chile | | | 149,777 | |
| | 1,720 | | | Banco de Credito e Inversiones | | | 115,664 | |
| | 2,345,050 | | | Banco Santander Chile | | | 184,376 | |
| | 9,426 | | | Cia Cervecerias Unidas SA | | | 136,024 | |
| | 613,106 | | | Colbun SA | | | 144,739 | |
| | 16,295 | | | Embotelladora Andina SA (Preference), Class B | | | 83,540 | |
| | 20,155 | | | Empresas COPEC SA | | | 310,601 | |
| | 2,450,590 | | | Enel Americas SA | | | 527,198 | |
| | 1,695,511 | | | Enel Chile SA | | | 197,643 | |
| | 276,534 | | | Enel Generacion Chile SA | | | 241,092 | |
| | 4,448 | | | Sociedad Quimica y Minera de Chile SA (Preference), Class B | | | 265,671 | |
| | | | | | | | |
| | | | | | | 2,509,778 | |
| | | | | | | | |
| | | | China — 22.7% | | | | |
| | 1,100 | | | 58.com, Inc., ADR* | | | 73,887 | |
| | 36,000 | | | Agile Group Holdings Ltd. | | | 52,522 | |
| | 661,000 | | | Agricultural Bank of China Ltd., Class H | | | 311,327 | |
| | 96,000 | | | Air China Ltd., Class H | | | 91,536 | |
| | 14,100 | | | Alibaba Group Holding Ltd., ADR* | | | 2,606,949 | |
| | 140,000 | | | Aluminum Corp. of China Ltd., Class H* | | | 112,447 | |
| | 38,000 | | | Angang Steel Co. Ltd., Class H | | | 33,312 | |
| | 42,500 | | | Anhui Conch Cement Co. Ltd., Class H | | | 182,057 | |
| | 62,000 | | | ANTA Sports Products Ltd. | | | 277,317 | |
| | 500 | | | Autohome, Inc., ADR* | | | 28,755 | |
| | 128,000 | | | AviChina Industry & Technology Co. Ltd., Class H | | | 74,346 | |
| | 71,500 | | | BAIC Motor Corp. Ltd., Class H (a) | | | 83,809 | |
| | 2,400 | | | Baidu, Inc., ADR* | | | 585,456 | |
| | 1,970,000 | | | Bank of China Ltd., Class H | | | 984,533 | |
| | 202,000 | | | Bank of Communications Co. Ltd., Class H | | | 152,497 | |
| | 84,000 | | | BBMG Corp., Class H | | | 41,919 | |
| | 54,000 | | | Beijing Capital International Airport Co. Ltd., Class H | | | 88,675 | |
| | 18,500 | | | Beijing Enterprises Holdings Ltd. | | | 109,987 | |
SEE NOTES TO FINANCIAL STATEMENTS.
| | | | | | |
| | | |
| 28 | | | | JPMORGAN EXCHANGE-TRADED FUNDS | | OCTOBER 31, 2017 |
| | | | | | | | |
SHARES | | | INVESTMENTS | | VALUE($) | |
| | Common Stocks — continued | |
| | | | China — continued | |
| | 304,000 | | | Beijing Enterprises Water Group Ltd. | | | 255,459 | |
| | 43,200 | | | BOE Technology Group Co. Ltd., Class B | | | 28,130 | |
| | 144,000 | | | Brilliance China Automotive Holdings Ltd. | | | 364,915 | |
| | 27,500 | | | BYD Electronic International Co. Ltd. | | | 74,571 | |
| | 843,000 | | | CGN Power Co. Ltd., Class H (a) | | | 247,647 | |
| | 110,000 | | | China Agri-Industries Holdings Ltd. | | | 53,759 | |
| | 66,000 | | | China BlueChemical Ltd., Class H | | | 19,728 | |
| | 244,000 | | | China Cinda Asset Management Co. Ltd., Class H | | | 94,817 | |
| | 214,000 | | | China CITIC Bank Corp. Ltd., Class H | | | 137,890 | |
| | 75,000 | | | China Coal Energy Co. Ltd., Class H | | | 34,350 | |
| | 159,000 | | | China Communications Construction Co. Ltd., Class H | | | 193,121 | |
| | 90,000 | | | China Communications Services Corp. Ltd., Class H | | | 54,619 | |
| | 58,000 | | | China Conch Venture Holdings Ltd. | | | 118,257 | |
| | 2,313,000 | | | China Construction Bank Corp., Class H | | | 2,067,164 | |
| | 166,000 | | | China Dongxiang Group Co. Ltd. | | | 30,870 | |
| | 82,000 | | | China Eastern Airlines Corp. Ltd., Class H | | | 41,651 | |
| | 84,000 | | | China Everbright Bank Co. Ltd., Class H | | | 39,652 | |
| | 94,000 | | | China Everbright International Ltd. | | | 132,620 | |
| | 22,000 | | | China Everbright Ltd. | | | 52,203 | |
| | 76,000 | | | China Evergrande Group* | | | 293,159 | |
| | 95,500 | | | China Galaxy Securities Co. Ltd., Class H | | | 83,321 | |
| | 35,000 | | | China Hongqiao Group Ltd.* | | | 42,031 | |
| | 155,000 | | | China Huarong Asset Management Co. Ltd., Class H (a) | | | 72,913 | |
| | 18,000 | | | China International Capital Corp. Ltd., Class H (a) | | | 37,117 | |
| | 15,500 | | | China International Marine Containers Group Co. Ltd., Class H | | | 30,900 | |
| | 128,000 | | | China Jinmao Holdings Group Ltd. | | | 57,524 | |
| | 300 | | | China Lodging Group Ltd., ADR* | | | 40,167 | |
| | 120,000 | | | China Longyuan Power Group Corp. Ltd., Class H | | | 88,991 | |
| | 34,000 | | | China Machinery Engineering Corp., Class H | | | 20,846 | |
| | 94,000 | | | China Medical System Holdings Ltd. | | | 173,818 | |
| | 98,000 | | | China Merchants Bank Co. Ltd., Class H | | | 374,229 | |
| | 42,000 | | | China Merchants Port Holdings Co. Ltd. | | | 131,383 | |
| | 23,600 | | | China Merchants Securities Co. Ltd., Class H (a) | | | 39,347 | |
| | 121,000 | | | China Minsheng Banking Corp. Ltd., Class H | | | 117,215 | |
| | 399,500 | | | China Mobile Ltd. | | | 4,018,319 | |
| | 141,000 | | | China Molybdenum Co. Ltd., Class H | | | 91,780 | |
| | 104,000 | | | China National Building Material Co. Ltd., Class H | | | 87,779 | |
| | 42,000 | | | China National Materials Co. Ltd., Class H | | | 29,045 | |
| | | | | | | | |
SHARES | | | INVESTMENTS | | VALUE($) | |
| | | | | | | | |
| | | | China — continued | |
| | 100,000 | | | China Overseas Land & Investment Ltd. | | | 324,702 | |
| | 66,800 | | | China Pacific Insurance Group Co. Ltd., Class H | | | 329,846 | |
| | 910,000 | | | China Petroleum & Chemical Corp., Class H | | | 668,230 | |
| | 250,000 | | | China Power International Development Ltd. | | | 79,483 | |
| | 68,000 | | | China Railway Construction Corp. Ltd., Class H | | | 85,397 | |
| | 137,000 | | | China Railway Group Ltd., Class H | | | 110,121 | |
| | 56,000 | | | China Railway Signal & Communication Corp. Ltd., Class H (a) | | | 44,102 | |
| | 173,000 | | | China Reinsurance Group Corp., Class H | | | 38,400 | |
| | 62,000 | | | China Resources Cement Holdings Ltd. | | | 41,906 | |
| | 60,000 | | | China Resources Gas Group Ltd. | | | 219,782 | |
| | 70,000 | | | China Resources Land Ltd. | | | 208,914 | |
| | 142,000 | | | China Resources Power Holdings Co. Ltd. | | | 273,077 | |
| | 121,000 | | | China Shenhua Energy Co. Ltd., Class H | | | 289,465 | |
| | 86,000 | | | China South City Holdings Ltd. | | | 24,041 | |
| | 100,000 | | | China Southern Airlines Co. Ltd., Class H | | | 73,932 | |
| | 68,000 | | | China State Construction International Holdings Ltd. | | | 95,544 | |
| | 37,600 | | | China Taiping Insurance Holdings Co. Ltd. | | | 123,996 | |
| | 1,048,000 | | | China Telecom Corp. Ltd., Class H | | | 525,570 | |
| | 184,000 | | | China Traditional Chinese Medicine Holdings Co. Ltd. | | | 105,478 | |
| | 34,000 | | | China Vanke Co. Ltd., Class H | | | 121,031 | |
| | 49,600 | | | China Zhongwang Holdings Ltd. | | | 29,259 | |
| | 43,900 | | | Chongqing Changan Automobile Co. Ltd., Class B | | | 57,454 | |
| | 67,000 | | | Chongqing Rural Commercial Bank Co. Ltd., Class H | | | 45,547 | |
| | 20,000 | | | CIMC Enric Holdings Ltd.* | | | 13,544 | |
| | 176,000 | | | CITIC Ltd. | | | 257,829 | |
| | 46,000 | | | COSCO SHIPPING Energy Transportation Co. Ltd., Class H | | | 26,938 | |
| | 89,500 | | | COSCO SHIPPING Holdings Co. Ltd., Class H* | | | 49,117 | |
| | 62,000 | | | COSCO SHIPPING Ports Ltd. | | | 71,851 | |
| | 137,000 | | | Country Garden Holdings Co. Ltd. | | | 217,174 | |
| | 144,000 | | | CRRC Corp. Ltd., Class H | | | 142,087 | |
| | 23,500 | | | CSC Financial Co. Ltd., Class H (a) | | | 21,554 | |
| | 320,000 | | | CSPC Pharmaceutical Group Ltd. | | | 556,715 | |
| | 107,500 | | | Dali Foods Group Co. Ltd. (a) | | | 83,229 | |
| | 214,000 | | | Datang International Power Generation Co. Ltd., Class H* | | | 72,166 | |
| | 12,200 | | | Dongfang Electric Corp. Ltd., Class H* | | | 11,905 | |
| | 150,000 | | | Dongfeng Motor Group Co. Ltd., Class H | | | 205,904 | |
| | 55,000 | | | ENN Energy Holdings Ltd. | | | 403,607 | |
| | 54,000 | | | Far East Horizon Ltd. | | | 53,661 | |
| | 80,076 | | | Fosun International Ltd. | | | 198,669 | |
SEE NOTES TO FINANCIAL STATEMENTS.
| | | | | | | | |
| | | |
| OCTOBER 31, 2017 | | JPMORGAN EXCHANGE-TRADED FUNDS | | | | | 29 | |
JPMorgan Diversified Emerging Markets Equity ETF
SCHEDULE OF PORTFOLIO INVESTMENTS
AS OF OCTOBER 31, 2017 (continued)
| | | | | | | | |
SHARES | | | INVESTMENTS | | VALUE($) | |
| | Common Stocks — continued | |
| | | | China — continued | |
| | 26,400 | | | Fuyao Glass Industry Group Co. Ltd., Class H (a) | | | 100,672 | |
| | 251,000 | | | Geely Automobile Holdings Ltd. | | | 778,319 | |
| | 40,000 | | | GF Securities Co. Ltd., Class H | | | 85,304 | |
| | 162,000 | | | Great Wall Motor Co. Ltd., Class H | | | 204,404 | |
| | 19,500 | | | Greentown China Holdings Ltd. | | | 24,358 | |
| | 220,000 | | | Guangdong Investment Ltd. | | | 318,738 | |
| | 116,000 | | | Guangzhou Automobile Group Co. Ltd., Class H | | | 288,471 | |
| | 16,000 | | | Guangzhou Baiyunshan Pharmaceutical Holdings Co. Ltd., Class H | | | 56,204 | |
| | 26,800 | | | Guangzhou R&F Properties Co. Ltd., Class H | | | 57,146 | |
| | 21,000 | | | Haitian International Holdings Ltd. | | | 62,886 | |
| | 8,000 | | | Health and Happiness H&H International Holdings Ltd.* | | | 41,805 | |
| | 37,500 | | | Hengan International Group Co. Ltd. | | | 369,801 | |
| | 194,000 | | | Huadian Fuxin Energy Corp. Ltd., Class H | | | 50,516 | |
| | 122,000 | | | Huadian Power International Corp. Ltd., Class H | | | 50,684 | |
| | 180,000 | | | Huaneng Renewables Corp. Ltd., Class H | | | 61,903 | |
| | 2,022,000 | | | Industrial & Commercial Bank of China Ltd., Class H | | | 1,608,835 | |
| | 36,500 | | | Inner Mongolia Yitai Coal Co. Ltd., Class B | | | 49,078 | |
| | 44,000 | | | Jiangsu Expressway Co. Ltd., Class H | | | 67,460 | |
| | 42,000 | | | Jiangxi Copper Co. Ltd., Class H | | | 67,064 | |
| | 30,000 | | | Kingsoft Corp. Ltd. | | | 75,829 | |
| | 100,000 | | | Kunlun Energy Co. Ltd. | | | 92,738 | |
| | 32,236 | | | KWG Property Holding Ltd. | | | 32,005 | |
| | 10,800 | | | Lao Feng Xiang Co. Ltd., Class B | | | 40,489 | |
| | 14,000 | | | Legend Holdings Corp., Class H (a) | | | 36,812 | |
| | 248,000 | | | Lenovo Group Ltd. | | | 143,859 | |
| | 7,310 | | | Livzon Pharmaceutical Group, Inc., Class H | | | 49,604 | |
| | 26,000 | | | Logan Property Holdings Co. Ltd. | | | 24,086 | |
| | 38,000 | | | Longfor Properties Co. Ltd. | | | 88,765 | |
| | 125,000 | | | Luye Pharma Group Ltd. | | | 83,317 | |
| | 62,000 | | | Maanshan Iron & Steel Co. Ltd., Class H* | | | 29,136 | |
| | 103,000 | | | Metallurgical Corp. of China Ltd., Class H | | | 34,094 | |
| | 800 | | | Momo, Inc., ADR* | | | 24,376 | |
| | 600 | | | NetEase, Inc., ADR | | | 169,152 | |
| | 20,600 | | | New China Life Insurance Co. Ltd., Class H | | | 128,964 | |
| | 1,700 | | | New Oriental Education & Technology Group, Inc., ADR | | | 141,508 | |
| | 21,200 | | | Orient Securities Co. Ltd., Class H (a) | | | 21,636 | |
| | 220,000 | | | People’s Insurance Co. Group of China Ltd. (The), Class H | | | 104,711 | |
| | 116,000 | | | PICC Property & Casualty Co. Ltd., Class H | | | 230,201 | |
| | | | | | | | |
SHARES | | | INVESTMENTS | | VALUE($) | |
| | |
| | | | China — continued | |
| | 129,000 | | | Ping An Insurance Group Co. of China Ltd., Class H | | | 1,133,645 | |
| | 49,000 | | | Poly Property Group Co. Ltd.* | | | 23,749 | |
| | 152,000 | | | Postal Savings Bank of China Co. Ltd., Class H (a) | | | 91,793 | |
| | 14,000 | | | Red Star Macalline Group Corp. Ltd., Class H (a) | | | 16,747 | |
| | 16,800 | | | Shandong Chenming Paper Holdings Ltd., Class B | | | 30,645 | |
| | 11,500 | | | Shandong Chenming Paper Holdings Ltd., Class H | | | 20,919 | |
| | 124,000 | | | Shandong Weigao Group Medical Polymer Co. Ltd., Class H | | | 89,056 | |
| | 36,000 | | | Shanghai Fosun Pharmaceutical Group Co. Ltd., Class H | | | 179,833 | |
| | 16,000 | | | Shanghai Industrial Holdings Ltd. | | | 49,151 | |
| | 52,800 | | | Shanghai Pharmaceuticals Holding Co. Ltd., Class H | | | 136,490 | |
| | 26,000 | | | Shenzhen Expressway Co. Ltd., Class H | | | 26,593 | |
| | 30,044 | | | Shenzhen International Holdings Ltd. | | | 57,423 | |
| | 76,829 | | | Shenzhen Investment Ltd. | | | 34,275 | |
| | 31,000 | | | Shenzhou International Group Holdings Ltd. | | | 264,903 | |
| | 308,000 | | | Sihuan Pharmaceutical Holdings Group Ltd. | | | 111,424 | |
| | 2,200 | | | SINA Corp.* | | | 236,830 | |
| | 74,500 | | | Sino-Ocean Group Holding Ltd. | | | 48,652 | |
| | 52,500 | | | Sinopec Engineering Group Co. Ltd., Class H | | | 45,021 | |
| | 124,000 | | | Sinopec Shanghai Petrochemical Co. Ltd., Class H | | | 73,963 | |
| | 77,600 | | | Sinopharm Group Co. Ltd., Class H | | | 347,455 | |
| | 63,000 | | | Sinotrans Ltd., Class H | | | 30,284 | |
| | 24,000 | | | Sinotruk Hong Kong Ltd. | | | 31,915 | |
| | 48,500 | | | SOHO China Ltd.* | | | 28,097 | |
| | 50,000 | | | Sunac China Holdings Ltd. | | | 254,744 | |
| | 23,000 | | | Sunny Optical Technology Group Co. Ltd. | | | 337,351 | |
| | 117,400 | | | Tencent Holdings Ltd. | | | 5,276,556 | |
| | 20,000 | | | Tianhe Chemicals Group Ltd.*‡ (a) | | | — | |
| | 26,000 | | | Tianjin Capital Environmental Protection Group Co. Ltd., Class H | | | 16,578 | |
| | 36,000 | | | TravelSky Technology Ltd., Class H | | | 93,308 | |
| | 70,000 | | | Weichai Power Co. Ltd., Class H | | | 87,166 | |
| | 19,640 | | | Xinjiang Goldwind Science & Technology Co. Ltd., Class H | | | 24,893 | |
| | 70,000 | | | Yanzhou Coal Mining Co. Ltd., Class H | | | 69,866 | |
| | 160,000 | | | Yuexiu Property Co. Ltd. | | | 31,006 | |
| | 52,000 | | | Zhejiang Expressway Co. Ltd., Class H | | | 64,306 | |
| | 32,000 | | | Zhongsheng Group Holdings Ltd. | | | 65,774 | |
| | 18,100 | | | Zhuzhou CRRC Times Electric Co. Ltd., Class H | | | 105,938 | |
SEE NOTES TO FINANCIAL STATEMENTS.
| | | | | | |
| | | |
| 30 | | | | JPMORGAN EXCHANGE-TRADED FUNDS | | OCTOBER 31, 2017 |
| | | | | | | | |
SHARES | | | INVESTMENTS | | VALUE($) | |
| | Common Stocks — continued | |
| | | | China — continued | |
| | 204,000 | | | Zijin Mining Group Co. Ltd., Class H | | | 70,596 | |
| | 47,200 | | | Zoomlion Heavy Industry Science and Technology Co. Ltd., Class H | | | 22,904 | |
| | 27,200 | | | ZTE Corp., Class H* | | | 94,503 | |
| | | | | | | | |
| | | | | | | 37,683,147 | |
| | | | | | | | |
| | | | Colombia — 0.3% | | | | |
| | 12,930 | | | Almacenes Exito SA | | | 69,962 | |
| | 9,684 | | | Bancolombia SA | | | 88,880 | |
| | 16,927 | | | Bancolombia SA (Preference) | | | 160,030 | |
| | 175,342 | | | Grupo Aval Acciones y Valores SA (Preference) | | | 73,490 | |
| | 34,353 | | | Interconexion Electrica SA ESP | | | 150,645 | |
| | | | | | | | |
| | | | | | | 543,007 | |
| | | | | | | | |
| | | | Czech Republic — 0.3% | | | | |
| | 13,616 | | | CEZ A/S | | | 298,562 | |
| | 2,751 | | | Komercni banka A/S | | | 118,262 | |
| | 18,798 | | | Moneta Money Bank A/S (a) | | | 64,256 | |
| | | | | | | | |
| | | | | | | 481,080 | |
| | | | | | | | |
| | | | Egypt — 0.1% | | | | |
| | 38,557 | | | Commercial International Bank Egypt SAE | | | 172,336 | |
| | 19,966 | | | Egyptian Financial Group-Hermes Holding Co. | | | 26,559 | |
| | 36,739 | | | Talaat Moustafa Group | | | 20,012 | |
| | | | | | | | |
| | | | | | | 218,907 | |
| | | | | | | | |
| | | | Greece — 0.4% | | | | |
| | 50,348 | | | Alpha Bank AE* | | | 100,390 | |
| | 66,557 | | | Eurobank Ergasias SA* | | | 54,366 | |
| | 2,170 | | | FF Group* | | | 45,448 | |
| | 2,713 | | | Hellenic Petroleum SA | | | 23,956 | |
| | 6,600 | | | JUMBO SA | | | 106,094 | |
| | 2,605 | | | Motor Oil Hellas Corinth Refineries SA | | | 62,358 | |
| | 200,680 | | | National Bank of Greece SA* | | | 66,375 | |
| | 13,483 | | | OPAP SA | | | 151,089 | |
| | 10,764 | | | Piraeus Bank SA* | | | 30,965 | |
| | | | | | | | |
| | | | | | | 641,041 | |
| | | | | | | | |
| | | | Hong Kong — 0.8% | | | | |
| | 56,000 | | | China Gas Holdings Ltd. | | | 170,247 | |
| | 447,000 | | | GCL-Poly Energy Holdings Ltd.* | | | 76,858 | |
| | 64,000 | | | Haier Electronics Group Co. Ltd.* | | | 168,753 | |
| | 24,500 | | | Kingboard Chemical Holdings Ltd. | | | 145,385 | |
| | 37,000 | | | Kingboard Laminates Holdings Ltd. | | | 62,179 | |
| | 53,000 | | | Lee & Man Paper Manufacturing Ltd. | | | 64,748 | |
| | 56,000 | | | Nine Dragons Paper Holdings Ltd. | | | 102,928 | |
| | 31,000 | | | Shimao Property Holdings Ltd. | | | 64,982 | |
| | | | | | | | |
SHARES | | | INVESTMENTS | | VALUE($) | |
| | |
| | | | Hong Kong — continued | |
| | 319,000 | | | Sino Biopharmaceutical Ltd. | | | 373,032 | |
| | | | | | | | |
| | | | | | | 1,229,112 | |
| | | | | | | | |
| | | | Hungary — 0.6% | | | | |
| | 20,076 | | | MOL Hungarian Oil & Gas plc | | | 240,424 | |
| | 9,097 | | | OTP Bank plc | | | 366,752 | |
| | 12,032 | | | Richter Gedeon Nyrt. | | | 299,291 | |
| | | | | | | | |
| | | | | | | 906,467 | |
| | | | | | | | |
| | | | India — 7.8% | | | | |
| | 9,486 | | | Adani Enterprises Ltd. | | | 19,398 | |
| | 29,555 | | | Adani Ports & Special Economic Zone Ltd. | | | 196,553 | |
| | 42,067 | | | Ashok Leyland Ltd. | | | 85,260 | |
| | 20,047 | | | Aurobindo Pharma Ltd. | | | 235,418 | |
| | 4,275 | | | Bajaj Finance Ltd. | | | 118,896 | |
| | 990 | | | Bajaj Finserv Ltd. | | | 76,649 | |
| | 11,942 | | | Bank of Baroda | | | 31,334 | |
| | 6,139 | | | Bank of India* | | | 18,129 | |
| | 21,082 | | | Bharat Electronics Ltd. | | | 60,147 | |
| | 6,693 | | | Bharat Forge Ltd. | | | 72,241 | |
| | 35,637 | | | Bharat Petroleum Corp. Ltd. | | | 298,167 | |
| | 58,755 | | | Bharti Infratel Ltd. | | | 401,666 | |
| | 18,583 | | | Cadila Healthcare Ltd. | | | 144,509 | |
| | 3,096 | | | Canara Bank | | | 19,397 | |
| | 2,978 | | | Container Corp. of India Ltd. | | | 63,596 | |
| | 479 | | | Eicher Motors Ltd. | | | 238,581 | |
| | 10,673 | | | Exide Industries Ltd. | | | 34,456 | |
| | 14,497 | | | GAIL India Ltd. | | | 104,176 | |
| | 159,783 | | | GMR Infrastructure Ltd.* | | | 47,439 | |
| | 11,575 | | | Grasim Industries Ltd. | | | 219,489 | |
| | 18,919 | | | HCL Technologies Ltd. | | | 250,021 | |
| | 5,120 | | | Hero MotoCorp Ltd. | | | 304,711 | |
| | 32,055 | | | Hindalco Industries Ltd. | | | 132,456 | |
| | 21,768 | | | Hindustan Petroleum Corp. Ltd. | | | 150,364 | |
| | 37,052 | | | Hindustan Unilever Ltd. | | | 708,103 | |
| | 8,360 | | | Hindustan Zinc Ltd. | | | 40,738 | |
| | 41,169 | | | Housing Development Finance Corp. Ltd. | | | 1,085,742 | |
| | 31,553 | | | ICICI Bank Ltd. | | | 147,915 | |
| | 6,677 | | | ICICI Prudential Life Insurance Co. Ltd. (a) | | | 41,847 | |
| | 2,685 | | | IDFC Ltd. | | | 2,612 | |
| | 8,402 | | | Indiabulls Housing Finance Ltd. | | | 161,535 | |
| | 39,107 | | | Indian Oil Corp. Ltd. | | | 251,098 | |
| | 2,931 | | | IndusInd Bank Ltd. | | | 73,668 | |
| | 2,075 | | | InterGlobe Aviation Ltd. (a) | | | 40,025 | |
| | 13,071 | | | Jindal Steel & Power Ltd.* | | | 32,932 | |
| | 42,300 | | | JSW Steel Ltd. | | | 169,010 | |
SEE NOTES TO FINANCIAL STATEMENTS.
| | | | | | | | |
| | | |
| OCTOBER 31, 2017 | | JPMORGAN EXCHANGE-TRADED FUNDS | | | | | 31 | |
JPMorgan Diversified Emerging Markets Equity ETF
SCHEDULE OF PORTFOLIO INVESTMENTS
AS OF OCTOBER 31, 2017 (continued)
| | | | | | | | |
SHARES | | | INVESTMENTS | | VALUE($) | |
| | Common Stocks — continued | |
| | | | India — continued | |
| | 4,519 | | | Kotak Mahindra Bank Ltd. | | | 71,554 | |
| | 11,330 | | | L&T Finance Holdings Ltd. | | | 35,226 | |
| | 12,074 | | | Larsen & Toubro Ltd. | | | 228,049 | |
| | 6,408 | | | LIC Housing Finance Ltd. | | | 59,301 | |
| | 10,937 | | | Mahindra & Mahindra Ltd. | | | 227,222 | |
| | 7,148 | | | Mangalore Refinery & Petrochemicals Ltd. | | | 15,712 | |
| | 6,322 | | | Maruti Suzuki India Ltd. | | | 802,018 | |
| | 33,045 | | | Motherson Sumi Systems Ltd. | | | 186,489 | |
| | 53 | | | MRF Ltd. | | | 54,401 | |
| | 186,229 | | | NHPC Ltd. | | | 82,151 | |
| | 27,118 | | | NMDC Ltd. | | | 53,704 | |
| | 149,674 | | | NTPC Ltd. | | | 419,139 | |
| | 109,997 | | | Oil & Natural Gas Corp. Ltd. | | | 325,022 | |
| | 6,485 | | | Oil India Ltd. | | | 36,988 | |
| | 766 | | | Oracle Financial Services Software Ltd. | | | 41,406 | |
| | 1,794 | | | Oriental Bank of Commerce* | | | 3,904 | |
| | 11,345 | | | Petronet LNG Ltd. | | | 45,556 | |
| | 16,420 | | | Power Finance Corp. Ltd. | | | 35,289 | |
| | 58,099 | | | Power Grid Corp. of India Ltd. | | | 190,078 | |
| | 11,029 | | | Punjab National Bank* | | | 33,612 | |
| | 7,261 | | | Rajesh Exports Ltd. | | | 87,779 | |
| | 3,199 | | | Reliance Capital Ltd. | | | 28,561 | |
| | 113,798 | | | Reliance Industries Ltd. | | | 1,654,466 | |
| | 41,542 | | | Reliance Power Ltd.* | | | 26,184 | |
| | 49,592 | | | Rural Electrification Corp. Ltd. | | | 132,739 | |
| | 4,348 | | | Shriram Transport Finance Co. Ltd. | | | 78,497 | |
| | 4,400 | | | Sun TV Network Ltd. | | | 58,206 | |
| | 16,510 | | | Tata Consultancy Services Ltd. | | | 669,232 | |
| | 71,601 | | | Tata Power Co. Ltd. (The) | | | 93,939 | |
| | 8,325 | | | Tata Steel Ltd. | | | 90,538 | |
| | 16,257 | | | Titan Co. Ltd. | | | 159,467 | |
| | 3,765 | | | Union Bank of India* | | | 10,266 | |
| | 12,711 | | | UPL Ltd. | | | 157,067 | |
| | 59,739 | | | Vedanta Ltd. | | | 306,682 | |
| | 42,402 | | | Wipro Ltd. | | | 192,695 | |
| | 40,790 | | | Yes Bank Ltd. | | | 198,273 | |
| | | | | | | | |
| | | | | | | 12,969,690 | |
| | | | | | | | |
| | | | Indonesia — 5.6% | | | | |
| | 1,286,600 | | | Adaro Energy Tbk. PT | | | 173,144 | |
| | 2,384,000 | | | Astra International Tbk. PT | | | 1,406,243 | |
| | 883,300 | | | Bank Central Asia Tbk. PT | | | 1,360,672 | |
| | 1,694,700 | | | Bank Mandiri Persero Tbk. PT | | | 880,231 | |
| | 677,200 | | | Bank Negara Indonesia Persero Tbk. PT | | | 379,618 | |
| | 968,700 | | | Bank Rakyat Indonesia Persero Tbk. PT | | | 1,114,489 | |
| | 693,700 | | | Bumi Serpong Damai Tbk. PT | | | 88,045 | |
| | | | | | | | |
SHARES | | | INVESTMENTS | | VALUE($) | |
| | | | | | | | |
| | | | Indonesia — continued | | | | |
| | 54,500 | | | Gudang Garam Tbk. PT | | | 281,290 | |
| | 517,500 | | | Indofood Sukses Makmur Tbk. PT | | | 312,856 | |
| | 221,400 | | | Jasa Marga Persero Tbk. PT | | | 106,109 | |
| | 1,473,800 | | | Perusahaan Gas Negara Persero Tbk. | | | 199,970 | |
| | 81,800 | | | Tambang Batubara Bukit Asam Persero Tbk. PT | | | 69,227 | |
| | 6,672,500 | | | Telekomunikasi Indonesia Persero Tbk. PT | | | 1,990,854 | |
| | 198,700 | | | Tower Bersama Infrastructure Tbk. PT | | | 99,847 | |
| | 135,100 | | | Unilever Indonesia Tbk. PT | | | 494,080 | |
| | 153,600 | | | United Tractors Tbk. PT | | | 392,706 | |
| | | | | | | | |
| | | | | | | 9,349,381 | |
| | | | | | | | |
| | | | Malaysia — 4.9% | | | | |
| | 177,800 | | | AirAsia Bhd. | | | 140,308 | |
| | 175,500 | | | AMMB Holdings Bhd. | | | 177,479 | |
| | 584,455 | | | CIMB Group Holdings Bhd. | | | 847,657 | |
| | 219,600 | | | Gamuda Bhd. | | | 272,328 | |
| | 266,300 | | | Genting Bhd. | | | 569,239 | |
| | 330,800 | | | Genting Malaysia Bhd. | | | 393,183 | |
| | 57,468 | | | Hong Leong Bank Bhd. | | | 216,379 | |
| | 527,808 | | | Malayan Banking Bhd. | | | 1,153,261 | |
| | 287,000 | | | Petronas Chemicals Group Bhd. | | | 499,631 | |
| | 65,900 | | | PPB Group Bhd. | | | 261,203 | |
| | 282,500 | | | Public Bank Bhd. | | | 1,365,192 | |
| | 102,661 | | | RHB Bank Bhd. | | | 123,188 | |
| | 575,100 | | | Tenaga Nasional Bhd. | | | 2,037,643 | |
| | | | | | | | |
| | | | | | | 8,056,691 | |
| | | | | | | | |
| | | | Mexico — 4.1% | | | | |
| | 2,578,200 | | | America Movil SAB de CV, Series L | | | 2,222,940 | |
| | 22,700 | | | Arca Continental SAB de CV | | | 144,464 | |
| | 8,632 | | | Banregio Grupo Financiero SAB de CV | | | 46,042 | |
| | 725,407 | | | Cemex SAB de CV* | | | 589,883 | |
| | 31,200 | | | Coca-Cola Femsa SAB de CV, Series L | | | 210,910 | |
| | 101,803 | | | Fibra Uno Administracion SA de CV, REIT | | | 159,727 | |
| | 42,080 | | | Gentera SAB de CV | | | 42,581 | |
| | 13,029 | | | Gruma SAB de CV, Class B | | | 171,006 | |
| | 14,428 | | | Grupo Aeroportuario del Centro Norte SAB de CV | | | 72,886 | |
| | 18,798 | | | Grupo Aeroportuario del Pacifico SAB de CV, Class B | | | 178,736 | |
| | 9,680 | | | Grupo Aeroportuario del Sureste SAB de CV, Class B | | | 173,083 | |
| | 4,145 | | | Grupo Elektra SAB de CV | | | 166,111 | |
| | 85,970 | | | Grupo Financiero Banorte SAB de CV, Class O | | | 509,405 | |
| | 85,900 | | | Grupo Financiero Inbursa SAB de CV, Class O | | | 147,769 | |
SEE NOTES TO FINANCIAL STATEMENTS.
| | | | | | |
| | | |
| 32 | | | | JPMORGAN EXCHANGE-TRADED FUNDS | | OCTOBER 31, 2017 |
| | | | | | | | |
SHARES | | | INVESTMENTS | | VALUE($) | |
| | Common Stocks — continued | |
| | | | Mexico — continued | |
| | 64,153 | | | Grupo Financiero Santander Mexico SAB de CV, Class B | | | 107,816 | |
| | 158,752 | | | Grupo Mexico SAB de CV, Series B | | | 516,290 | |
| | 5,905 | | | Industrias Penoles SAB de CV | | | 137,678 | |
| | 52,301 | | | Infraestructura Energetica Nova SAB de CV | | | 266,801 | |
| | 19,201 | | | Megacable Holdings SAB de CV | | | 76,076 | |
| | 46,791 | | | Mexichem SAB de CV | | | 120,518 | |
| | 38,237 | | | Nemak SAB de CV (a) | | | 28,780 | |
| | 12,900 | | | OHL Mexico SAB de CV | | | 22,851 | |
| | 330,900 | | | Wal-Mart de Mexico SAB de CV | | | 740,789 | |
| | | | | | | | |
| | | | | | | 6,853,142 | |
| | | | | | | | |
| | | | Pakistan — 0.0% (b) | | | | |
| | 17,600 | | | Habib Bank Ltd. | | | 26,816 | |
| | 23,000 | | | Oil & Gas Development Co. Ltd. | | | 31,407 | |
| | | | | | | | |
| | | | | | | 58,223 | |
| | | | | | | | |
| | | | Peru — 0.1% | | | | |
| | 9,500 | | | Cia de Minas Buenaventura SAA, ADR | | | 131,005 | |
| | | | | | | | |
| | | | Philippines — 2.6% | | | | |
| | 200,380 | | | Aboitiz Equity Ventures, Inc. | | | 290,721 | |
| | 418,800 | | | Alliance Global Group, Inc.* | | | 129,798 | |
| | 24,660 | | | Ayala Corp. | | | 492,093 | |
| | 635,600 | | | Ayala Land, Inc. | | | 532,354 | |
| | 143,100 | | | Bank of the Philippine Islands | | | 271,647 | |
| | 179,520 | | | BDO Unibank, Inc. | | | 478,372 | |
| | 406,100 | | | Bloomberry Resorts Corp.* | | | 74,258 | |
| | 414,700 | | | DMCI Holdings, Inc. | | | 123,225 | |
| | 1,312,100 | | | Energy Development Corp. | | | 146,750 | |
| | 4,115 | | | Globe Telecom, Inc. | | | 162,856 | |
| | 110,850 | | | International Container Terminal Services, Inc. | | | 227,031 | |
| | 37,160 | | | Manila Electric Co. | | | 210,039 | |
| | 1,066,800 | | | Megaworld Corp. | | | 110,141 | |
| | 2,007,600 | | | Metro Pacific Investments Corp. | | | 264,586 | |
| | 116,716 | | | Metropolitan Bank & Trust Co. | | | 195,858 | |
| | 16,520 | | | PLDT, Inc. | | | 547,862 | |
| | 119,420 | | | Semirara Mining & Power Corp. | | | 98,312 | |
| | | | | | | | |
| | | | | | | 4,355,903 | |
| | | | | | | | |
| | | | Poland — 1.7% | | | | |
| | 3,363 | | | Alior Bank SA* | | | 66,827 | |
| | 3,474 | | | Asseco Poland SA | | | 45,544 | |
| | 5,750 | | | Bank Pekao SA | | | 187,886 | |
| | 1,058 | | | Bank Zachodni WBK SA | | | 106,153 | |
| | 1,337 | | | CCC SA | | | 100,258 | |
| | 9,730 | | | Cyfrowy Polsat SA | | | 67,790 | |
| | | | | | | | |
SHARES | | | INVESTMENTS | | VALUE($) | |
| | | | | | | | |
| | | | Poland — continued | | | | |
| | 18,415 | | | Enea SA | | | 70,474 | |
| | 2,169 | | | Grupa Azoty SA | | | 43,500 | |
| | 4,301 | | | Grupa Lotos SA | | | 77,996 | |
| | 2,395 | | | Jastrzebska Spolka Weglowa SA* | | | 64,416 | |
| | 6,348 | | | KGHM Polska Miedz SA | | | 214,568 | |
| | 762 | | | KRUK SA | | | 58,407 | |
| | 470 | | | mBank SA* | | | 59,430 | |
| | 62,955 | | | PGE Polska Grupa Energetyczna SA* | | | 225,727 | |
| | 14,425 | | | Polski Koncern Naftowy ORLEN SA | | | 510,205 | |
| | 78,961 | | | Polskie Gornictwo Naftowe i Gazownictwo SA | | | 145,104 | |
| | 31,292 | | | Powszechna Kasa Oszczednosci Bank Polski SA* | | | 333,051 | |
| | 20,573 | | | Powszechny Zaklad Ubezpieczen SA | | | 265,508 | |
| | 90,101 | | | Tauron Polska Energia SA* | | | 87,132 | |
| | | | | | | | |
| | | | | | | 2,729,976 | |
| | | | | | | | |
| | | | Russia — 4.6% | | | | |
| | 26,297 | | | Aeroflot PJSC | | | 80,942 | |
| | 116,606 | | | Alrosa PJSC | | | 149,876 | |
| | 22,285,305 | | | Federal Grid Co. Unified Energy System PJSC | | | 60,148 | |
| | 490,469 | | | Gazprom PJSC | | | 1,055,322 | |
| | 2,608,081 | | | Inter RAO UES PJSC | | | 159,557 | |
| | 21,761 | | | LUKOIL PJSC | | | 1,154,063 | |
| | 67,746 | | | Magnitogorsk Iron & Steel Works PJSC | | | 51,141 | |
| | 2,142 | | | MMC Norilsk Nickel PJSC | | | 387,709 | |
| | 87,372 | | | Mobile TeleSystems PJSC | | | 420,996 | |
| | 52,106 | | | Moscow Exchange MICEX-RTS PJSC | | | 105,077 | |
| | 688,000 | | | Mosenergo PJSC | | | 36,100 | |
| | 49,987 | | | Novatek PJSC | | | 556,317 | |
| | 40,451 | | | Novolipetsk Steel PJSC | | | 92,135 | |
| | 54,411 | | | Rosneft Oil Co. PJSC | | | 296,645 | |
| | 2,510,498 | | | ROSSETI PJSC | | | 40,631 | |
| | 72,629 | | | Rostelecom PJSC | | | 84,791 | |
| | 9,475,049 | | | RusHydro PJSC | | | 132,338 | |
| | 397,976 | | | Sberbank of Russia PJSC | | | 1,318,746 | |
| | 8,133 | | | Severstal PJSC | | | 124,885 | |
| | 333,462 | | | Surgutneftegas OJSC | | | 166,250 | |
| | 359,433 | | | Surgutneftegas OJSC (Preference) | | | 178,145 | |
| | 69,772 | | | Tatneft PJSC | | | 521,905 | |
| | 73 | | | Transneft PJSC (Preference) | | | 230,915 | |
| | 189,659,185 | | | VTB Bank PJSC | | | 194,590 | |
| | | | | | | | |
| | | | | | | 7,599,224 | |
| | | | | | | | |
| | | | South Africa — 8.2% | | | | |
| | 4,754 | | | African Rainbow Minerals Ltd. | | | 41,720 | |
| | 20,541 | | | AVI Ltd. | | | 143,225 | |
SEE NOTES TO FINANCIAL STATEMENTS.
| | | | | | | | |
| | | |
| OCTOBER 31, 2017 | | JPMORGAN EXCHANGE-TRADED FUNDS | | | | | 33 | |
JPMorgan Diversified Emerging Markets Equity ETF
SCHEDULE OF PORTFOLIO INVESTMENTS
AS OF OCTOBER 31, 2017 (continued)
| | | | | | | | |
SHARES | | | INVESTMENTS | | VALUE($) | |
| | Common Stocks — continued | |
| | | | South Africa — continued | |
| | 23,881 | | | Barclays Africa Group Ltd. | | | 236,567 | |
| | 9,860 | | | Barloworld Ltd. | | | 92,974 | |
| | 20,886 | | | Bid Corp. Ltd. | | | 459,414 | |
| | 15,491 | | | Bidvest Group Ltd. (The) | | | 188,080 | |
| | 1,944 | | | Capitec Bank Holdings Ltd. | | | 129,223 | |
| | 14,917 | | | Clicks Group Ltd. | | | 167,078 | |
| | 9,630 | | | Coronation Fund Managers Ltd. | | | 48,564 | |
| | 15,338 | | | Dis-Chem Pharmacies Ltd. (a) | | | 35,908 | |
| | 12,566 | | | Discovery Ltd. | | | 130,352 | |
| | 7,858 | | | Exxaro Resources Ltd. | | | 79,854 | |
| | 117,612 | | | FirstRand Ltd. | | | 426,912 | |
| | 27,444 | | | Fortress Income Fund Ltd., REIT | | | 77,933 | |
| | 41,569 | | | Fortress Income Fund Ltd., Class A, REIT | | | 49,775 | |
| | 13,820 | | | Foschini Group Ltd. (The) | | | 132,445 | |
| | 100,528 | | | Growthpoint Properties Ltd., REIT | | | 174,377 | |
| | 17,475 | | | Harmony Gold Mining Co. Ltd. | | | 29,882 | |
| | 8,984 | | | Hyprop Investments Ltd., REIT | | | 67,577 | |
| | 7,444 | | | Imperial Holdings Ltd. | | | 106,762 | |
| | 10,220 | | | Investec Ltd. | | | 69,710 | |
| | 68,108 | | | KAP Industrial Holdings Ltd. | | | 40,946 | |
| | 2,418 | | | Kumba Iron Ore Ltd. | | | 46,521 | |
| | 4,438 | | | Liberty Holdings Ltd. | | | 34,888 | |
| | 37,413 | | | MMI Holdings Ltd. | | | 49,747 | |
| | 5,487 | | | Mondi Ltd. | | | 131,618 | |
| | 15,311 | | | Mr Price Group Ltd. | | | 189,767 | |
| | 29,962 | | | Nampak Ltd.* | | | 39,416 | |
| | 21,816 | | | Naspers Ltd., Class N | | | 5,315,091 | |
| | 7,769 | | | Nedbank Group Ltd. | | | 113,853 | |
| | 24,887 | | | Rand Merchant Investment Holdings Ltd. | | | 69,583 | |
| | 186,548 | | | Redefine Properties Ltd., REIT | | | 139,989 | |
| | 24,008 | | | Remgro Ltd. | | | 363,388 | |
| | 7,721 | | | Reunert Ltd. | | | 37,975 | |
| | 24,449 | | | RMB Holdings Ltd. | | | 108,087 | |
| | 61,917 | | | Sanlam Ltd. | | | 309,917 | |
| | 25,895 | | | Sappi Ltd. | | | 173,406 | |
| | 25,713 | | | Sasol Ltd. | | | 751,277 | |
| | 28,086 | | | Shoprite Holdings Ltd. | | | 401,979 | |
| | 46,618 | | | Standard Bank Group Ltd. | | | 541,346 | |
| | 163,991 | | | Steinhoff International Holdings NV | | | 711,900 | |
| | 16,234 | | | Super Group Ltd.* | | | 45,886 | |
| | 26,348 | | | Telkom SA SOC Ltd. | | | 98,693 | |
| | 10,276 | | | Tiger Brands Ltd. | | | 280,655 | |
| | 27,077 | | | Truworths International Ltd. | | | 144,321 | |
| | 43,645 | | | Vodacom Group Ltd. | | | 474,331 | |
| | | | | | | | |
| | | | | | | 13,502,912 | |
| | | | | | | | |
| | | | | | | | |
SHARES | | | INVESTMENTS | | VALUE($) | |
| | | | | | | | |
| | | | Taiwan — 16.2% | | | | |
| | 189,000 | | | Acer, Inc.* | | | 97,803 | |
| | 431,000 | | | Advanced Semiconductor Engineering, Inc. | | | 521,068 | |
| | 153,000 | | | Asia Cement Corp. | | | 136,517 | |
| | 46,000 | | | Asustek Computer, Inc. | | | 398,364 | |
| | 579,000 | | | AU Optronics Corp. | | | 237,256 | |
| | 49,000 | | | Catcher Technology Co. Ltd. | | | 521,503 | |
| | 440,000 | | | Cathay Financial Holding Co. Ltd. | | | 727,064 | |
| | 328,738 | | | Chang Hwa Commercial Bank Ltd. | | | 178,236 | |
| | 38,300 | | | Chicony Electronics Co. Ltd. | | | 95,927 | |
| | 775,000 | | | China Development Financial Holding Corp. | | | 237,595 | |
| | 204,470 | | | China Life Insurance Co. Ltd. | | | 193,318 | |
| | 271,000 | | | Compal Electronics, Inc. | | | 199,529 | |
| | 1,011,395 | | | CTBC Financial Holding Co. Ltd. | | | 647,558 | |
| | 538,715 | | | E.Sun Financial Holding Co. Ltd. | | | 327,909 | |
| | 65,000 | | | Epistar Corp.* | | | 105,338 | |
| | 116,000 | | | Evergreen Marine Corp. Taiwan Ltd.* | | | 69,485 | |
| | 322,000 | | | Far Eastern New Century Corp. | | | 276,160 | |
| | 537,100 | | | First Financial Holding Co. Ltd. | | | 346,513 | |
| | 224,000 | | | Formosa Chemicals & Fibre Corp. | | | 680,516 | |
| | 89,000 | | | Formosa Petrochemical Corp. | | | 311,551 | |
| | 319,000 | | | Formosa Plastics Corp. | | | 972,461 | |
| | 72,533 | | | Foxconn Technology Co. Ltd. | | | 231,341 | |
| | 410,000 | | | Fubon Financial Holding Co. Ltd. | | | 653,421 | |
| | 980,490 | | | Hon Hai Precision Industry Co. Ltd. | | | 3,644,427 | |
| | 458,360 | | | Hua Nan Financial Holdings Co. Ltd. | | | 250,844 | |
| | 566,000 | | | Innolux Corp. | | | 248,081 | |
| | 199,000 | | | Inventec Corp. | | | 154,645 | |
| | 8,000 | | | Largan Precision Co. Ltd. | | | 1,516,477 | |
| | 139,496 | | | Lite-On Technology Corp. | | | 196,994 | |
| | 607,233 | | | Mega Financial Holding Co. Ltd. | | | 477,345 | |
| | 370,000 | | | Nan Ya Plastics Corp. | | | 913,091 | |
| | 47,737 | | | Nanya Technology Corp. | | | 129,774 | |
| | 38,000 | | | Novatek Microelectronics Corp. | | | 140,753 | |
| | 48,000 | | | Oriental Union Chemical Corp.* | | | 41,326 | |
| | 130,000 | | | Pegatron Corp. | | | 336,862 | |
| | 218,000 | | | Pou Chen Corp. | | | 274,739 | |
| | 46,000 | | | President Chain Store Corp. | | | 413,634 | |
| | 175,000 | | | Quanta Computer, Inc. | | | 412,271 | |
| | 31,000 | | | Realtek Semiconductor Corp.* | | | 116,717 | |
| | 432,287 | | | Shin Kong Financial Holding Co. Ltd. | | | 138,320 | |
| | 573,785 | | | SinoPac Financial Holdings Co. Ltd. | | | 176,038 | |
| | 89,200 | | | Synnex Technology International Corp. | | | 113,072 | |
| | 527,973 | | | Taishin Financial Holding Co. Ltd. | | | 231,155 | |
| | 226,113 | | | Taiwan Business Bank | | | 62,467 | |
| | 210,000 | | | Taiwan Cement Corp. | | | 233,415 | |
SEE NOTES TO FINANCIAL STATEMENTS.
| | | | | | |
| | | |
| 34 | | | | JPMORGAN EXCHANGE-TRADED FUNDS | | OCTOBER 31, 2017 |
| | | | | | | | |
SHARES | | | INVESTMENTS | | VALUE($) | |
| | Common Stocks — continued | |
| | | | Taiwan — continued | |
| | 490,674 | | | Taiwan Cooperative Financial Holding Co. Ltd. | | | 265,284 | |
| | 168,000 | | | Taiwan Mobile Co. Ltd. | | | 598,957 | |
| | 687,000 | | | Taiwan Semiconductor Manufacturing Co. Ltd. | | | 5,553,916 | |
| | 148,000 | | | Teco Electric and Machinery Co. Ltd. | | | 138,228 | |
| | 17,000 | | | TPK Holding Co. Ltd.* | | | 56,159 | |
| | 18,000 | | | Transcend Information, Inc.* | | | 51,132 | |
| | 28,000 | | | U-Ming Marine Transport Corp.* | | | 33,228 | |
| | 86,000 | | | Unimicron Technology Corp. | | | 49,081 | |
| | 394,000 | | | Uni-President Enterprises Corp. | | | 823,225 | |
| | 779,000 | | | United Microelectronics Corp. | | | 402,046 | |
| | 203,000 | | | Walsin Lihwa Corp. | | | 103,760 | |
| | 176,661 | | | Wistron Corp. | | | 147,562 | |
| | 640,665 | | | Yuanta Financial Holding Co. Ltd. | | | 284,928 | |
| | 2,000 | | | Yulon Nissan Motor Co. Ltd. | | | 16,057 | |
| | | | | | | | |
| | | | | | | 26,912,443 | |
| | | | | | | | |
| | | | Thailand — 5.8% | | | | |
| | 157,400 | | | Advanced Info Service PCL | | | 921,264 | |
| | 438,200 | | | Airports of Thailand PCL | | | 781,558 | |
| | 28,200 | | | Bangkok Bank PCL | | | 170,700 | |
| | 16,300 | | | Bangkok Bank PCL, NVDR | | | 94,698 | |
| | 428,100 | | | Banpu PCL | | | 225,674 | |
| | 46,200 | | | Bumrungrad Hospital PCL | | | 305,960 | |
| | 221,500 | | | Central Pattana PCL | | | 530,080 | |
| | 46,200 | | | Delta Electronics Thailand PCL | | | 119,576 | |
| | 37,700 | | | Electricity Generating PCL | | | 261,017 | |
| | 234,600 | | | Energy Absolute PCL | | | 305,396 | |
| | 58,200 | | | Glow Energy PCL | | | 157,676 | |
| | 165,900 | | | Indorama Ventures PCL | | | 229,800 | |
| | 192,600 | | | Intouch Holdings PCL, NVDR | | | 336,235 | |
| | 1,174,400 | | | IRPC PCL | | | 228,022 | |
| | 572,100 | | | Krung Thai Bank PCL | | | 313,539 | |
| | 578,700 | | | Land & Houses PCL, NVDR | | | 189,880 | |
| | 138,000 | | | PTT Exploration & Production PCL | | | 358,735 | |
| | 201,900 | | | PTT Global Chemical PCL | | | 486,326 | |
| | 150,600 | | | PTT PCL | | | 1,905,350 | |
| | 109,700 | | | Ratchaburi Electricity Generating Holding PCL | | | 184,099 | |
| | 220,400 | | | Siam Commercial Bank PCL (The) | | | 972,190 | |
| | 103,600 | | | Thai Oil PCL | | | 318,098 | |
| | 1,961,000 | | | TMB Bank PCL | | | 152,299 | |
| | | | | | | | |
| | | | | | | 9,548,172 | |
| | | | | | | | |
| | | | Turkey — 1.6% | | | | |
| | 75,134 | | | Akbank TAS | | | 198,758 | |
| | 10,759 | | | Arcelik A/S | | | 58,868 | |
| | | | | | | | |
SHARES | | | INVESTMENTS | | VALUE($) | |
| | | | | | | | |
| | | | Turkey — continued | | | | |
| | 7,223 | | | Aselsan Elektronik Sanayi ve Ticaret A/S | | | 64,702 | |
| | 6,062 | | | Aygaz A/S | | | 25,774 | |
| | 14,048 | | | BIM Birlesik Magazalar A/S | | | 286,687 | |
| | 68,715 | | | Emlak Konut Gayrimenkul Yatirim Ortakligi A/S, REIT* | | | 47,956 | |
| | 26,740 | | | Enka Insaat ve Sanayi A/S | | | 40,601 | |
| | 63,032 | | | Eregli Demir ve Celik Fabrikalari TAS | | | 148,134 | |
| | 3,975 | | | Ford Otomotiv Sanayi A/S | | | 56,158 | |
| | 32,735 | | | Haci Omer Sabanci Holding A/S | | | 91,125 | |
| | 28,775 | | | KOC Holding A/S | | | 128,851 | |
| | 2,138 | | | Migros Ticaret A/S* | | | 14,732 | |
| | 27,049 | | | Petkim Petrokimya Holding A/S | | | 47,426 | |
| | 16,426 | | | Soda Sanayii A/S | | | 22,741 | |
| | 6,918 | | | TAV Havalimanlari Holding A/S | | | 34,491 | |
| | 7,708 | | | Tofas Turk Otomobil Fabrikasi A/S | | | 62,875 | |
| | 5,719 | | | Tupras Turkiye Petrol Rafinerileri A/S | | | 206,053 | |
| | 34,891 | | | Turk Hava Yollari AO* | | | 95,753 | |
| | 45,412 | | | Turk Telekomunikasyon A/S* | | | 77,390 | |
| | 625 | | | Turk Traktor ve Ziraat Makineleri A/S | | | 12,488 | |
| | 81,529 | | | Turkcell Iletisim Hizmetleri A/S | | | 305,509 | |
| | 76,772 | | | Turkiye Garanti Bankasi A/S | | | 211,515 | |
| | 22,559 | | | Turkiye Halk Bankasi A/S | | | 65,901 | |
| | 51,676 | | | Turkiye Is Bankasi, Class C | | | 97,532 | |
| | 36,790 | | | Turkiye Sinai Kalkinma Bankasi A/S | | | 13,293 | |
| | 38,229 | | | Turkiye Sise ve Cam Fabrikalari A/S | | | 44,918 | |
| | 38,258 | | | Turkiye Vakiflar Bankasi TAO, Class D | | | 63,995 | |
| | 9,587 | | | Ulker Biskuvi Sanayi A/S | | | 51,195 | |
| | 29,139 | | | Yapi ve Kredi Bankasi A/S* | | | 35,440 | |
| | | | | | | | |
| | | | | | | 2,610,861 | |
| | | | | | | | |
| | | | United Arab Emirates — 1.6% | | | | |
| | 146,155 | | | Abu Dhabi Commercial Bank PJSC | | | 294,423 | |
| | 153,600 | | | Air Arabia PJSC | | | 51,860 | |
| | 130,389 | | | Aldar Properties PJSC | | | 84,587 | |
| | 65,781 | | | DAMAC Properties Dubai Co. PJSC | | | 70,749 | |
| | 8,077 | | | DP World Ltd. | | | 191,748 | |
| | 111,648 | | | Dubai Investments PJSC | | | 79,952 | |
| | 92,502 | | | Dubai Islamic Bank PJSC | | | 154,157 | |
| | 78,443 | | | Emaar Malls PJSC | | | 49,338 | |
| | 137,311 | | | Emaar Properties PJSC | | | 309,864 | |
| | 160,627 | | | Emirates Telecommunications Group Co. PJSC | | | 779,737 | |
| | 203,549 | | | First Abu Dhabi Bank PJSC | | | 573,627 | |
| | | | | | | | |
| | | | | | | 2,640,042 | |
| | | | | | | | |
| | | | Total Common Stocks
(Cost $145,771,551) | | | 165,351,223 | |
| | | | | | | | |
SEE NOTES TO FINANCIAL STATEMENTS.
| | | | | | | | |
| | | |
| OCTOBER 31, 2017 | | JPMORGAN EXCHANGE-TRADED FUNDS | | | | | 35 | |
JPMorgan Diversified Emerging Markets Equity ETF
SCHEDULE OF PORTFOLIO INVESTMENTS
AS OF OCTOBER 31, 2017 (continued)
| | | | | | | | |
NO. OF RIGHTS | | | INVESTMENTS | | VALUE($) | |
| | Rights — 0.0% (b) | | | | |
| | | | Brazil — 0.0% (b) | | | | |
| | 11,122 | | | Cia Energetica de Minas Gerais, expiring 11/29/2017* | | | 4,114 | |
| | | | | | | | |
| | | | China — 0.0% | | | | |
| | 51 | | | Fosun International Ltd., expiring 12/31/2017*‡ | | | — | |
| | | | | | | | |
| | | | Taiwan — 0.0% | | | | |
| | 13,852 | | | CTBC Financial Holding Co. Ltd., expiring 12/15/2017* | | | — | |
| | | | | | | | |
| | | | Total Rights
(Cost $—) | | | 4,114 | |
| | | | | | | | |
| | | | Total Investments — 99.8%
(Cost $145,771,551) | | | 165,355,337 | |
| | | | Other Assets Less Liabilities — 0.2% | | | 385,709 | |
| | | | | | | | |
| | | | Net Assets — 100.0% | | $ | 165,741,046 | |
| | | | | | | | |
Percentages indicated are based on net assets.
Summary of Investments by Industry, October 31, 2017
The following table represents the portfolio investments of the Fund by industry classifications as a percentage of total investments:
| | | | |
| INDUSTRY | | PERCENTAGE | |
Banks | | | 19.2 | % |
Oil, Gas & Consumable Fuels | | | 9.6 | |
Wireless Telecommunication Services | | | 6.3 | |
Internet Software & Services | | | 5.4 | |
Semiconductors & Semiconductor Equipment | | | 4.3 | |
Electronic Equipment, Instruments & Components | | | 4.0 | |
Media | | | 3.4 | |
Chemicals | | | 3.3 | |
Electric Utilities | | | 3.2 | |
Metals & Mining | | | 3.1 | |
Automobiles | | | 2.9 | |
Diversified Telecommunication Services | | | 2.8 | |
Insurance | | | 2.7 | |
Real Estate Management & Development | | | 2.5 | |
Technology Hardware, Storage & Peripherals | | | 1.9 | |
Food & Staples Retailing | | | 1.7 | |
Independent Power and Renewable Electricity Producers | | | 1.7 | |
Transportation Infrastructure | | | 1.7 | |
Diversified Financial Services | | | 1.6 | |
Food Products | | | 1.5 | |
Pharmaceuticals | | | 1.4 | |
Industrial Conglomerates | | | 1.2 | |
Others (each less than 1.0%) | | | 14.6 | |
| | |
| * | | — Non-income producing security. |
| ‡ | | — Value determined using significant unobservable inputs. |
| (a) | | — Securities exempt from registration under Rule 144A or section 4(2), of the Securities Act of 1933. Under procedures approved by the Board of Trustees, such securities have been determined to be liquid by the investment adviser and may be resold, normally to qualified institutional buyers in transactions exempt from registration. |
| (b) | | — Represents less than 0.05% of net assets. |
Abbreviations
| | |
| ADR | | — American Depositary Receipt |
| NVDR | | — Non-Voting Depositary Receipt |
| OJSC | | — Open Joint Stock Company |
| PJSC | | — Public Joint Stock Company |
| Preference | | — A special type of equity investment that shares in the earnings of the company, has limited voting rights, and may have a dividend preference. Preference shares may also have liquidation preference. |
| REIT | | — Real Estate Investment Trust |
SEE NOTES TO FINANCIAL STATEMENTS.
| | | | | | |
| | | |
| 36 | | | | JPMORGAN EXCHANGE-TRADED FUNDS | | OCTOBER 31, 2017 |
JPMorgan Diversified Return Europe Currency Hedged ETF
SCHEDULE OF PORTFOLIO INVESTMENTS
AS OF OCTOBER 31, 2017
| | | | | | | | |
| SHARES | | | INVESTMENTS | | VALUE($) | |
| | | | | | | | |
| | Exchange Traded Funds — 100.1% | | | | |
| | | | United States | | | | |
| | 499,909 | | | JPMorgan Diversified Return Europe Equity Fund (a) | | | 30,739,404 | |
| | | | | | | | |
| | | | Total Investments — 100.1%
(Cost $25,994,384) | | | 30,739,404 | |
| | | | Liabilities Less Other Assets — (0.1)% | | | (32,159 | ) |
| | | | | | | | |
| | | | Net Assets — 100.0% | | $ | 30,707,245 | |
| | | | | | | | |
Percentages indicated are based on net assets.
| | |
| (a) | | — Affiliated company as defined under the Investment Company Act of 1940. |
| | | | | | | | | | | | | | | | | | | | | | |
| Forward foreign currency exchange contracts outstanding as of October 31, 2017: | |
| CURRENCY PURCHASED | | | CURRENCY SOLD | | | COUNTERPARTY | | SETTLEMENT
DATE | | | UNREALIZED
APPRECIATION
(DEPRECIATION) ($) | |
EUR | | | 20,720 | | | | USD | | | | 24,002 | | | Royal Bank of Canada | | | 11/03/2017 | | | | 135 | |
GBP | | | 5,449,034 | | | | USD | | | | 7,235,969 | | | National Australia Bank Ltd. | | | 11/03/2017 | | | | 1,368 | |
NOK | | | 6,578,109 | | | | USD | | | | 803,727 | | | Citibank, NA | | | 11/03/2017 | | | | 1,643 | |
SEK | | | 14,412,899 | | | | USD | | | | 1,721,412 | | | Goldman Sachs International | | | 11/03/2017 | | | | 310 | |
USD | | | 3,337,153 | | | | CHF | | | | 3,222,542 | | | Goldman Sachs International | | | 11/03/2017 | | | | 106,821 | |
USD | | | 922,599 | | | | DKK | | | | 5,797,588 | | | Royal Bank of Canada | | | 11/03/2017 | | | | 15,009 | |
USD | | | 431,414 | | | | EUR | | | | 364,299 | | | Goldman Sachs International | | | 11/03/2017 | | | | 7,039 | |
USD | | | 65,073 | | | | EUR | | | | 55,282 | | | National Australia Bank Ltd. | | | 11/03/2017 | | | | 674 | |
USD | | | 14,946,836 | | | | EUR | | | | 12,622,248 | | | Royal Bank of Canada | | | 11/03/2017 | | | | 243,054 | |
USD | | | 53,561 | | | | GBP | | | | 40,200 | | | Citibank, NA | | | 11/03/2017 | | | | 168 | |
USD | | | 7,401,712 | | | | GBP | | | | 5,512,300 | | | Royal Bank of Canada | | | 11/03/2017 | | | | 80,347 | |
USD | | | 827,098 | | | | NOK | | | | 6,578,109 | | | Royal Bank of Canada | | | 11/03/2017 | | | | 21,728 | |
USD | | | 73,454 | | | | SEK | | | | 598,530 | | | Goldman Sachs International | | | 11/03/2017 | | | | 1,956 | |
USD | | | 1,695,625 | | | | SEK | | | | 13,814,368 | | | Royal Bank of Canada | | | 11/03/2017 | | | | 45,403 | |
USD | | | 3,281,655 | | | | CHF | | | | 3,264,358 | | | Goldman Sachs International | | | 12/05/2017 | | | | 2,188 | |
USD | | | 14,686 | | | | DKK | | | | 93,621 | | | Royal Bank of Canada | | | 12/05/2017 | | | | 2 | |
USD | | | 275,060 | | | | EUR | | | | 235,646 | | | Goldman Sachs International | | | 12/05/2017 | | | | 59 | |
USD | | | 30,648 | | | | SEK | | | | 255,929 | | | Royal Bank of Canada | | | 12/05/2017 | | | | 18 | |
| | | | | | | | | | | | | | | | | | | | | | |
Total unrealized appreciation | | | | | | | 527,922 | |
| | | | | | | | | | | | | | | | | | | | | | |
CHF | | | 3,222,542 | | | | USD | | | | 3,233,085 | | | Goldman Sachs International | | | 11/03/2017 | | | | (2,753 | ) |
DKK | | | 5,797,588 | | | | USD | | | | 907,685 | | | Citibank, NA | | | 11/03/2017 | | | | (95 | ) |
EUR | | | 12,986,377 | | | | USD | | | | 15,129,519 | | | National Australia Bank Ltd. | | | 11/03/2017 | | | | (1,558 | ) |
EUR | | | 34,733 | | | | USD | | | | 41,061 | | | Royal Bank of Canada | | | 11/03/2017 | | | | (601 | ) |
GBP | | | 88,966 | | | | USD | | | | 119,453 | | | National Australia Bank Ltd. | | | 11/03/2017 | | | | (1,289 | ) |
GBP | | | 14,499 | | | | USD | | | | 19,433 | | | Royal Bank of Canada | | | 11/03/2017 | | | | (175 | ) |
USD | | | 57,064 | | | | CHF | | | | 56,803 | | | Goldman Sachs International | | | 12/05/2017 | | | | (2 | ) |
USD | | | 933,708 | | | | DKK | | | | 5,953,159 | | | Citibank, NA | | | 12/05/2017 | | | | (32 | ) |
USD | | | 15,154,609 | | | | EUR | | | | 12,986,377 | | | National Australia Bank Ltd. | | | 12/05/2017 | | | | (630 | ) |
USD | | | 575,426 | | | | EUR | | | | 493,126 | | | Royal Bank of Canada | | | 12/05/2017 | | | | (57 | ) |
USD | | | 7,242,284 | | | | GBP | | | | 5,449,034 | | | National Australia Bank Ltd. | | | 12/05/2017 | | | | (1,983 | ) |
USD | | | 202,550 | | | | GBP | | | | 152,388 | | | Royal Bank of Canada | | | 12/05/2017 | | | | (43 | ) |
USD | | | 804,301 | | | | NOK | | | | 6,578,109 | | | Citibank, NA | | | 12/05/2017 | | | | (1,708 | ) |
USD | | | 60,256 | | | | NOK | | | | 492,597 | | | Royal Bank of Canada | | | 12/05/2017 | | | | (101 | ) |
USD | | | 1,724,350 | | | | SEK | | | | 14,412,899 | | | Goldman Sachs International | | | 12/05/2017 | | | | (608 | ) |
USD | | | 40,719 | | | | SEK | | | | 340,315 | | | Royal Bank of Canada | | | 12/05/2017 | | | | (11 | ) |
| | | | | | | | | | | | | | | | | | | | | | |
Total unrealized depreciation | | | | | | | (11,646 | ) |
| | | | | | | | | | | | | | | | | | | | | | |
Net unrealized appreciation | | | | | | | | | | | | | | 516,276 | |
| | | | | | | | | | | | | | | | | | | | | | |
SEE NOTES TO FINANCIAL STATEMENTS.
| | | | | | | | |
| | | |
| OCTOBER 31, 2017 | | JPMORGAN EXCHANGE-TRADED FUNDS | | | | | 37 | |
JPMorgan Diversified Return Europe Currency Hedged ETF
SCHEDULE OF PORTFOLIO INVESTMENTS
AS OF OCTOBER 31, 2017 (continued)
Abbreviations
| | |
| CHF | | — Swiss Franc |
| DKK | | — Danish Krone |
| EUR | | — Euro |
| GBP | | — British Pound |
| NOK | | — Norwegian Krone |
| SEK | | — Swedish Krona |
| USD | | — United States Dollar |
SEE NOTES TO FINANCIAL STATEMENTS.
| | | | | | |
| | | |
| 38 | | | | JPMORGAN EXCHANGE-TRADED FUNDS | | OCTOBER 31, 2017 |
JPMorgan Diversified Return Europe Equity ETF
SCHEDULE OF PORTFOLIO INVESTMENTS
AS OF OCTOBER 31, 2017
| | | | | | | | |
| SHARES | | | INVESTMENTS | | VALUE($) | |
| | Common Stocks — 99.4% | | | | |
| | | | Austria — 1.1% | | | | |
| | 1,778 | | | ANDRITZ AG | | | 100,531 | |
| | 7,158 | | | OMV AG | | | 429,576 | |
| | 6,295 | | | voestalpine AG | | | 346,089 | |
| | | | | | | | |
| | | | | | | 876,196 | |
| | | | | | | | |
| | | | Belgium — 1.7% | | | | |
| | 4,268 | | | bpost SA | | | 120,332 | |
| | 3,759 | | | Colruyt SA | | | 192,252 | |
| | 1,067 | | | Groupe Bruxelles Lambert SA | | | 114,603 | |
| | 11,006 | | | Proximus SADP | | | 365,470 | |
| | 2,041 | | | Solvay SA | | | 303,208 | |
| | 5,945 | | | Umicore SA | | | 265,683 | |
| | | | | | | | |
| | | | | | | 1,361,548 | |
| | | | | | | | |
| | | | Denmark — 3.1% | | | | |
| | 2,535 | | | Chr Hansen Holding A/S | | | 221,838 | |
| | 2,227 | | | Danske Bank A/S | | | 84,990 | |
| | 3,198 | | | DSV A/S | | | 247,288 | |
| | 3,137 | | | ISS A/S | | | 132,846 | |
| | 938 | | | Jyske Bank A/S (Registered) | | | 53,005 | |
| | 15,661 | | | Novo Nordisk A/S, Class B | | | 779,743 | |
| | 1,104 | | | Orsted A/S (a) | | | 61,865 | |
| | 16,727 | | | TDC A/S | | | 98,893 | |
| | 4,242 | | | Tryg A/S | | | 101,054 | |
| | 6,514 | | | Vestas Wind Systems A/S | | | 575,087 | |
| | 3,547 | | | William Demant Holding A/S* | | | 102,364 | |
| | | | | | | | |
| | | | | | | 2,458,973 | |
| | | | | | | | |
| | | | Finland — 4.7% | | | | |
| | 5,378 | | | Elisa OYJ | | | 216,557 | |
| | 29,232 | | | Fortum OYJ | | | 620,433 | |
| | 2,222 | | | Kesko OYJ, Class B | | | 113,474 | |
| | 5,201 | | | Kone OYJ, Class B | | | 281,499 | |
| | 13,726 | | | Neste OYJ | | | 764,145 | |
| | 14,356 | | | Nokia OYJ | | | 70,602 | |
| | 3,522 | | | Orion OYJ, Class B | | | 144,349 | |
| | 7,668 | | | Sampo OYJ, Class A | | | 401,266 | |
| | 22,959 | | | Stora Enso OYJ, Class R | | | 358,808 | |
| | 15,808 | | | UPM-Kymmene OYJ | | | 474,750 | |
| | 4,867 | | | Wartsila OYJ Abp | | | 313,514 | |
| | | | | | | | |
| | | | | | | 3,759,397 | |
| | | | | | | | |
| | | | France — 13.0% | | | | |
| | 823 | | | Aeroports de Paris | | | 138,565 | |
| | 2,101 | | | Air Liquide SA | | | 267,508 | |
| | 2,201 | | | Arkema SA | | | 278,056 | |
| | 5,016 | | | Atos SE | | | 779,064 | |
| | | | | | | | |
| SHARES | | | INVESTMENTS | | VALUE($) | |
| | | | | | | | |
| | | | France — continued | | | | |
| | 3,637 | | | AXA SA | | | 109,795 | |
| | 1,621 | | | BNP Paribas SA | | | 126,518 | |
| | 2,819 | | | Bouygues SA | | | 135,294 | |
| | 2,548 | | | Bureau Veritas SA | | | 68,231 | |
| | 10,114 | | | Capgemini SE | | | 1,228,690 | |
| | 6,667 | | | Carrefour SA | | | 134,176 | |
| | 1,928 | | | Casino Guichard Perrachon SA | | | 110,088 | |
| | 728 | | | Christian Dior SE | | | 249,876 | |
| | 1,867 | | | Cie Generale des Etablissements Michelin | | | 270,242 | |
| | 5,108 | | | CNP Assurances | | | 118,825 | |
| | 5,458 | | | Credit Agricole SA | | | 95,260 | |
| | 2,727 | | | Danone SA | | | 222,881 | |
| | 1,757 | | | Eiffage SA | | | 183,529 | |
| | 637 | | | Eurazeo SA | | | 59,221 | |
| | 1,885 | | | Eutelsat Communications SA | | | 47,215 | |
| | 894 | | | Faurecia | | | 64,990 | |
| | 1,030 | | | Fonciere Des Regions, REIT | | | 104,884 | |
| | 598 | | | Gecina SA, REIT | | | 97,034 | |
| | 152 | | | Hermes International | | | 78,904 | |
| | 1,110 | | | Imerys SA | | | 101,072 | |
| | 1,670 | | | Ingenico Group SA | | | 162,171 | |
| | 548 | | | Kering | | | 251,316 | |
| | 2,002 | | | Klepierre SA, REIT | | | 79,696 | |
| | 4,771 | | | Lagardere SCA | | | 157,115 | |
| | 2,816 | | | Legrand SA | | | 208,977 | |
| | 847 | | | L’Oreal SA | | | 188,511 | |
| | 1,088 | | | LVMH Moet Hennessy Louis Vuitton SE | | | 324,511 | |
| | 7,207 | | | Natixis SA | | | 56,518 | |
| | 36,806 | | | Orange SA | | | 604,638 | |
| | 596 | | | Orpea | | | 71,406 | |
| | 2,250 | | | Renault SA | | | 223,145 | |
| | 1,169 | | | Safran SA | | | 123,122 | |
| | 3,775 | | | Sanofi | | | 357,442 | |
| | 1,413 | | | Schneider Electric SE* | | | 124,148 | |
| | 2,433 | | | SCOR SE | | | 101,002 | |
| | 967 | | | Societe BIC SA | | | 102,106 | |
| | 1,977 | | | Societe Generale SA | | | 110,029 | |
| | 2,632 | | | Sodexo SA | | | 334,851 | |
| | 1,730 | | | Thales SA | | | 180,289 | |
| | 14,497 | | | TOTAL SA | | | 808,036 | |
| | 335 | | | Unibail-Rodamco SE, REIT | | | 83,853 | |
| | 6,341 | | | Valeo SA | | | 429,312 | |
| | 1,746 | | | Vinci SA | | | 171,069 | |
| | | | | | | | |
| | | | | | | 10,323,181 | |
| | | | | | | | |
SEE NOTES TO FINANCIAL STATEMENTS.
| | | | | | | | |
| | | |
| OCTOBER 31, 2017 | | JPMORGAN EXCHANGE-TRADED FUNDS | | | | | 39 | |
JPMorgan Diversified Return Europe Equity ETF
SCHEDULE OF PORTFOLIO INVESTMENTS
AS OF OCTOBER 31, 2017 (continued)
| | | | | | | | |
| SHARES | | | INVESTMENTS | | VALUE($) | |
| | Common Stocks — continued | |
| | | | Germany — 14.2% | | | | |
| | 538 | | | Allianz SE (Registered) | | | 125,601 | |
| | 2,089 | | | Axel Springer SE | | | 140,653 | |
| | 7,252 | | | BASF SE | | | 793,031 | |
| | 1,822 | | | Bayer AG (Registered) | | | 237,004 | |
| | 2,366 | | | Bayerische Motoren Werke AG | | | 242,658 | |
| | 3,694 | | | CECONOMY AG | | | 48,218 | |
| | 877 | | | Continental AG | | | 223,191 | |
| | 3,076 | | | Covestro AG (a) | | | 295,695 | |
| | 3,098 | | | Daimler AG (Registered) | | | 258,640 | |
| | 1,038 | | | Deutsche Boerse AG | | | 107,500 | |
| | 14,896 | | | Deutsche Lufthansa AG (Registered) | | | 478,577 | |
| | 3,850 | | | Deutsche Post AG (Registered) | | | 176,484 | |
| | 45,579 | | | Deutsche Telekom AG (Registered) | | | 825,314 | |
| | 1,404 | | | Deutsche Wohnen SE | | | 60,092 | |
| | 6,679 | | | Evonik Industries AG | | | 242,955 | |
| | 1,050 | | | Fielmann AG | | | 92,262 | |
| | 1,808 | | | Fraport AG Frankfurt Airport Services Worldwide | | | 171,803 | |
| | 4,749 | | | Fresenius Medical Care AG & Co. KGaA | | | 459,808 | |
| | 7,643 | | | Fresenius SE & Co. KGaA | | | 639,843 | |
| | 3,022 | | | FUCHS PETROLUB SE (Preference) | | | 170,176 | |
| | 1,017 | | | Hannover Rueck SE | | | 127,980 | |
| | 411 | | | Hella GmbH & Co. KGaA | | | 24,826 | |
| | 3,559 | | | Henkel AG & Co. KGaA (Preference) | | | 499,742 | |
| | 1,142 | | | HOCHTIEF AG | | | 201,727 | |
| | 1,492 | | | HUGO BOSS AG | | | 133,444 | |
| | 44,797 | | | Infineon Technologies AG | | | 1,238,998 | |
| | 590 | | | LEG Immobilien AG | | | 60,100 | |
| | 578 | | | MAN SE | | | 64,002 | |
| | 1,147 | | | MTU Aero Engines AG | | | 194,097 | |
| | 451 | | | Muenchener Rueckversicherungs-Gesellschaft AG in Muenchen (Registered) | | | 101,251 | |
| | 5,474 | | | ProSiebenSat.1 Media SE | | | 192,815 | |
| | 17,548 | | | SAP SE | | | 2,005,081 | |
| | 1,121 | | | Siemens AG (Registered) | | | 161,012 | |
| | 2,507 | | | Talanx AG | | | 98,457 | |
| | 24,793 | | | Telefonica Deutschland Holding AG | | | 126,466 | |
| | 7,071 | | | TUI AG | | | 127,710 | |
| | 2,991 | | | Uniper SE | | | 84,043 | |
| | 2,129 | | | Vonovia SE | | | 94,045 | |
| | | | | | | | |
| | | | | | | 11,325,301 | |
| | | | | | | | |
| | | | Ireland — 0.3% | | | | |
| | 1,886 | | | Ryanair Holdings plc, ADR* | | | 211,439 | |
| | 1,686 | | | Smurfit Kappa Group plc | | | 50,287 | |
| | | | | | | | |
| | | | | | | 261,726 | |
| | | | | | | | |
| | | | | | | | |
| SHARES | | | INVESTMENTS | | VALUE($) | |
| | | | | | | | |
| | | | Italy — 2.5% | | | | |
| | 4,782 | | | Atlantia SpA | | | 155,896 | |
| | 53,657 | | | Enel SpA | | | 332,763 | |
| | 32,446 | | | Eni SpA | | | 530,428 | |
| | 9,101 | | | Mediobanca SpA | | | 99,696 | |
| | 3,005 | | | Recordati SpA | | | 139,700 | |
| | 100,788 | | | Terna Rete Elettrica Nazionale SpA | | | 608,147 | |
| | 40,696 | | | UnipolSai Assicurazioni SpA | | | 92,602 | |
| | | | | | | | |
| | | | | | | 1,959,232 | |
| | | | | | | | |
| | | | Luxembourg — 0.3% | | | | |
| | 1,339 | | | RTL Group SA | | | 99,488 | |
| | 7,317 | | | SES SA, FDR | | | 119,004 | |
| | | | | | | | |
| | | | | | | 218,492 | |
| | | | | | | | |
| | | | Netherlands — 5.3% | | | | |
| | 2,551 | | | Akzo Nobel NV | | | 230,307 | |
| | 6,337 | | | ASML Holding NV | | | 1,143,381 | |
| | 1,578 | | | Heineken Holding NV | | | 146,473 | |
| | 1,630 | | | Heineken NV | | | 158,816 | |
| | 5,387 | | | ING Groep NV | | | 99,549 | |
| | 15,122 | | | Koninklijke Ahold Delhaize NV | | | 284,568 | |
| | 3,819 | | | Koninklijke DSM NV | | | 325,828 | |
| | 6,190 | | | Koninklijke Philips NV | | | 252,261 | |
| | 2,820 | | | NN Group NV | | | 118,095 | |
| | 233 | | | Randstad Holding NV | | | 14,335 | |
| | 33,021 | | | Royal Dutch Shell plc, Class B | | | 1,063,187 | |
| | 7,561 | | | Wolters Kluwer NV | | | 370,584 | |
| | | | | | | | |
| | | | | | | 4,207,384 | |
| | | | | | | | |
| | | | Norway — 2.8% | | | | |
| | 1,727 | | | Aker BP ASA | | | 39,784 | |
| | 10,774 | | | DNB ASA | | | 207,932 | |
| | 5,520 | | | Gjensidige Forsikring ASA | | | 103,879 | |
| | 14,204 | | | Marine Harvest ASA* | | | 277,368 | |
| | 32,435 | | | Norsk Hydro ASA | | | 250,994 | |
| | 17,517 | | | Orkla ASA | | | 171,582 | |
| | 17,530 | | | Statoil ASA | | | 356,166 | |
| | 27,006 | | | Telenor ASA | | | 573,438 | |
| | 5,061 | | | Yara International ASA | | | 240,361 | |
| | | | | | | | |
| | | | | | | 2,221,504 | |
| | | | | | | | |
| | | | Portugal — 1.1% | | | | |
| | 117,812 | | | EDP — Energias de Portugal SA | | | 420,144 | |
| | 19,881 | | | Galp Energia SGPS SA | | | 369,629 | |
| | 6,068 | | | Jeronimo Martins SGPS SA | | | 110,250 | |
| | | | | | | | |
| | | | | | | 900,023 | |
| | | | | | | | |
SEE NOTES TO FINANCIAL STATEMENTS.
| | | | | | |
| | | |
| 40 | | | | JPMORGAN EXCHANGE-TRADED FUNDS | | OCTOBER 31, 2017 |
| | | | | | | | |
| SHARES | | | INVESTMENTS | | VALUE($) | |
| | Common Stocks — continued | |
| | | | South Africa — 0.4% | | | | |
| | 5,023 | | | Investec plc | | | 34,370 | |
| | 10,496 | | | Mondi plc | | | 253,838 | |
| | | | | | | | |
| | | | | | | 288,208 | |
| | | | | | | | |
| | | | Spain — 8.1% | | | | |
| | 8,096 | | | Abertis Infraestructuras SA | | | 175,107 | |
| | 1,328 | | | Acciona SA | | | 109,964 | |
| | 3,512 | | | ACS Actividades de Construccion y Servicios SA | | | 138,440 | |
| | 724 | | | Aena SME SA (a) | | | 132,835 | |
| | 3,514 | | | Amadeus IT Group SA | | | 238,421 | |
| | 8,671 | | | Banco Santander SA | | | 58,783 | |
| | 10,886 | | | Distribuidora Internacional de Alimentacion SA | | | 53,243 | |
| | 16,072 | | | Enagas SA | | | 462,934 | |
| | 18,639 | | | Endesa SA | | | 426,614 | |
| | 17,950 | | | Gas Natural SDG SA | | | 384,086 | |
| | 10,941 | | | Grifols SA | | | 342,398 | |
| | 210,154 | | | Iberdrola SA | | | 1,698,258 | |
| | 5,461 | | | Industria de Diseno Textil SA | | | 204,122 | |
| | 24,002 | | | Mapfre SA | | | 78,499 | |
| | 5,265 | | | Mediaset Espana Comunicacion SA | | | 57,225 | |
| | 6,593 | | | Merlin Properties Socimi SA, REIT | | | 87,055 | |
| | 20,882 | | | Red Electrica Corp. SA | | | 462,380 | |
| | 31,028 | | | Repsol SA | | | 581,447 | |
| | 12,906 | | | Siemens Gamesa Renewable Energy SA | | | 187,134 | |
| | 51,826 | | | Telefonica SA | | | 543,420 | |
| | | | | | | | |
| | | | | | | 6,422,365 | |
| | | | | | | | |
| | | | Sweden — 5.9% | | | | |
| | 4,866 | | | Alfa Laval AB | | | 123,231 | |
| | 6,511 | | | Atlas Copco AB, Class A | | | 285,517 | |
| | 8,396 | | | Boliden AB | | | 293,791 | |
| | 4,408 | | | Electrolux AB, Series B | | | 155,808 | |
| | 6,120 | | | Hennes & Mauritz AB, Class B | | | 153,582 | |
| | 8,186 | | | Hexagon AB, Class B | | | 419,738 | |
| | 7,062 | | | Husqvarna AB, Class B | | | 68,990 | |
| | 2,414 | | | ICA Gruppen AB | | | 89,026 | |
| | 2,793 | | | Industrivarden AB, Class C | | | 71,770 | |
| | 2,732 | | | Investor AB, Class B | | | 135,361 | |
| | 2,733 | | | Kinnevik AB, Class B | | | 89,648 | |
| | 326 | | | L E Lundbergforetagen AB, Class B | | | 25,447 | |
| | 19,619 | | | Nordea Bank AB | | | 237,090 | |
| | 9,638 | | | Securitas AB, Class B | | | 169,108 | |
| | 8,621 | | | Skandinaviska Enskilda Banken AB, Class A | | | 106,242 | |
| | 7,489 | | | Skanska AB, Class B | | | 164,223 | |
| | 5,518 | | | SKF AB, Class B | | | 128,232 | |
| | 11,841 | | | Svenska Handelsbanken AB, Class A | | | 169,709 | |
| | | | | | | | |
| SHARES | | | INVESTMENTS | | VALUE($) | |
| | |
| | | | Sweden — continued | | | | |
| | 15,207 | | | Swedbank AB, Class A | | | 377,404 | |
| | 32,622 | | | Tele2 AB, Class B | | | 414,944 | |
| | 153,542 | | | Telia Co. AB | | | 710,664 | |
| | 6,447 | | | Trelleborg AB, Class B | | | 159,651 | |
| | 6,628 | | | Volvo AB, Class B | | | 131,276 | |
| | | | | | | | |
| | | | | | | 4,680,452 | |
| | | | | | | | |
| | | | Switzerland — 11.6% | | | | |
| | 5,691 | | | ABB Ltd. (Registered) | | | 148,621 | |
| | 1,563 | | | Adecco Group AG (Registered)* | | | 124,004 | |
| | 840 | | | Baloise Holding AG (Registered) | | | 132,432 | |
| | 87 | | | Banque Cantonale Vaudoise (Registered) | | | 62,570 | |
| | 11,609 | | | Clariant AG (Registered)* | | | 292,081 | |
| | 260 | | | DKSH Holding AG | | | 21,812 | |
| | 411 | | | EMS-Chemie Holding AG (Registered) | | | 269,440 | |
| | 1,612 | | | Ferguson plc | | | 112,727 | |
| | 291 | | | Flughafen Zurich AG (Registered) | | | 63,285 | |
| | 719 | | | Geberit AG (Registered) | | | 325,530 | |
| | 114 | | | Givaudan SA (Registered) | | | 254,595 | |
| | 143 | | | Helvetia Holding AG (Registered) | | | 76,874 | |
| | 817 | | | Kuehne + Nagel International AG (Registered) | | | 142,743 | |
| | 1,854 | | | Lonza Group AG (Registered)* | | | 492,536 | |
| | 6,794 | | | Nestle SA (Registered) | | | 571,637 | |
| | 17,601 | | | Novartis AG (Registered) | | | 1,451,718 | |
| | 1,076 | | | Pargesa Holding SA | | | 90,106 | |
| | 208 | | | Partners Group Holding AG | | | 139,898 | |
| | 4,545 | | | Roche Holding AG | | | 1,050,491 | |
| | 1,019 | | | Schindler Holding AG | | | 230,913 | |
| | 91 | | | SGS SA (Registered) | | | 224,729 | |
| | 25 | | | Sika AG | | | 185,037 | |
| | 2,396 | | | Sonova Holding AG (Registered) | | | 432,555 | |
| | 16,317 | | | STMicroelectronics NV | | | 384,335 | |
| | 698 | | | Swiss Life Holding AG (Registered)* | | | 242,603 | |
| | 797 | | | Swiss Prime Site AG (Registered)* | | | 68,024 | |
| | 986 | | | Swiss Re AG | | | 92,793 | |
| | 2,403 | | | Swisscom AG (Registered) | | | 1,214,055 | |
| | 1,718 | | | Temenos Group AG (Registered)* | | | 198,380 | |
| | 316 | | | Zurich Insurance Group AG | | | 96,432 | |
| | | | | | | | |
| | | | | | | 9,192,956 | |
| | | | | | | | |
| | | | United Kingdom — 23.1% | | | | |
| | 12,400 | | | 3i Group plc | | | 158,251 | |
| | 2,133 | | | Admiral Group plc | | | 54,489 | |
| | 16,414 | | | Anglo American plc | | | 309,618 | |
| | 5,672 | | | AstraZeneca plc | | | 383,773 | |
| | 15,107 | | | BAE Systems plc | | | 119,003 | |
SEE NOTES TO FINANCIAL STATEMENTS.
| | | | | | | | |
| | | |
| OCTOBER 31, 2017 | | JPMORGAN EXCHANGE-TRADED FUNDS | | | | | 41 | |
JPMorgan Diversified Return Europe Equity ETF
SCHEDULE OF PORTFOLIO INVESTMENTS
AS OF OCTOBER 31, 2017 (continued)
| | | | | | | | |
| SHARES | | | INVESTMENTS | | VALUE($) | |
| | Common Stocks — continued | |
| | | | United Kingdom — continued | | | | |
| | 2,824 | | | Bellway plc | | | 136,924 | |
| | 5,249 | | | Berkeley Group Holdings plc | | | 260,802 | |
| | 92,941 | | | BP plc | | | 630,387 | |
| | 15,062 | | | British American Tobacco plc | | | 973,153 | |
| | 9,391 | | | Bunzl plc | | | 292,535 | |
| | 4,278 | | | Burberry Group plc | | | 108,051 | |
| | 55,987 | | | Centrica plc | | | 126,260 | |
| | 27,812 | | | Compass Group plc | | | 610,594 | |
| | 4,500 | | | Croda International plc | | | 250,086 | |
| | 8,263 | | | Daily Mail & General Trust plc, Class A | | | 76,108 | |
| | 6,652 | | | Diageo plc | | | 227,158 | |
| | 17,693 | | | DS Smith plc | | | 122,364 | |
| | 12,694 | | | easyJet plc | | | 225,761 | |
| | 6,306 | | | Experian plc | | | 132,857 | |
| | 13,859 | | | GKN plc | | | 58,414 | |
| | 61,912 | | | GlaxoSmithKline plc | | | 1,111,156 | |
| | 10,935 | | | Hammerson plc, REIT | | | 76,121 | |
| | 11,819 | | | HSBC Holdings plc | | | 115,414 | |
| | 6,678 | | | IMI plc | | | 108,354 | |
| | 2,225 | | | Imperial Brands plc | | | 90,717 | |
| | 8,409 | | | Inchcape plc | | | 87,284 | |
| | 13,377 | | | Informa plc | | | 123,820 | |
| | 7,882 | | | Inmarsat plc | | | 65,015 | |
| | 26,221 | | | International Consolidated Airlines Group SA | | | 221,459 | |
| | 18,664 | | | Intu Properties plc, REIT | | | 53,581 | |
| | 96,906 | | | ITV plc | | | 211,828 | |
| | 63,075 | | | J Sainsbury plc | | | 203,116 | |
| | 4,824 | | | Johnson Matthey plc | | | 216,577 | |
| | 53,809 | | | Kingfisher plc | | | 223,718 | |
| | 39,556 | | | Legal & General Group plc | | | 140,249 | |
| | 11,016 | | | Meggitt plc | | | 75,834 | |
| | 11,885 | | | Micro Focus International plc | | | 417,455 | |
| | 59,714 | | | National Grid plc | | | 718,805 | |
| | 6,625 | | | Next plc | | | 433,054 | |
| | 2,501 | | | Pennon Group plc | | | 26,377 | |
| | 3,304 | | | Persimmon plc | | | 122,958 | |
| | 6,917 | | | Reckitt Benckiser Group plc | | | 618,841 | |
| | 20,602 | | | RELX NV | | | 465,128 | |
| | 19,356 | | | RELX plc | | | 445,399 | |
| | 28,808 | | | Rentokil Initial plc | | | 128,465 | |
| | 5,748 | | | Rio Tinto plc | | | 271,654 | |
| | 15,106 | | | Royal Mail plc | | | 75,116 | |
| | 46,938 | | | Sage Group plc (The) | | | 464,621 | |
| | 18,113 | | | Segro plc, REIT | | | 130,760 | |
| | 12,325 | | | Severn Trent plc | | | 345,586 | |
| | | | | | | | |
| SHARES | | | INVESTMENTS | | VALUE($) | |
| | | | | | | | |
| | | | United Kingdom — continued | | | | |
| | 27,080 | | | Smith & Nephew plc | | | 510,772 | |
| | 6,986 | | | Smiths Group plc | | | 145,769 | |
| | 23,991 | | | SSE plc | | | 440,616 | |
| | 19,215 | | | Tate & Lyle plc | | | 165,062 | |
| | 5,822 | | | Unilever NV, CVA | | | 338,200 | |
| | 18,613 | | | Unilever plc | | | 1,054,873 | |
| | 21,783 | | | United Utilities Group plc | | | 240,998 | |
| | 504,088 | | | Vodafone Group plc | | | 1,441,862 | |
| | 5,555 | | | Whitbread plc | | | 272,453 | |
| | 53,012 | | | William Hill plc | | | 181,912 | |
| | 65,179 | | | Wm Morrison Supermarkets plc | | | 194,084 | |
| | 18,149 | | | WPP plc | | | 320,860 | |
| | | | | | | | |
| | | | | | | 18,352,511 | |
| | | | | | | | |
| | | | United States — 0.2% | | | | |
| | 2,983 | | | Carnival plc | | | 196,664 | |
| | | | | | | | |
| | | | Total Common Stocks
(Cost $67,257,790) | | | 79,006,113 | |
| | | | | | | | |
| | |
NO. OF
RIGHTS | | | | | | |
| | Rights — 0.0% (b) | |
| | | | Spain — 0.0% (b) | | | | |
| | 8,004 | | | Banco Santander SA, expiring 11/1/2017* (Cost $368) | | | 382 | |
| | | | | | | | |
| | | | Total Investments — 99.4% (Cost $67,258,158) | | | 79,006,495 | |
| | | | Other Assets Less Liabilities — 0.6% | | | 485,862 | |
| | | | | | | | |
| | | | Net Assets — 100.0% | | $ | 79,492,357 | |
| | | | | | | | |
Percentages indicated are based on net assets.
SEE NOTES TO FINANCIAL STATEMENTS.
| | | | | | |
| | | |
| 42 | | | | JPMORGAN EXCHANGE-TRADED FUNDS | | OCTOBER 31, 2017 |
Summary of Investments by Industry, October 31, 2017
The following table represents the portfolio investments of the Fund by industry classifications as a percentage of total investments:
| | | | |
| INDUSTRY | | PERCENTAGE | |
Oil, Gas & Consumable Fuels | | | 7.6 | % |
Pharmaceuticals | | | 7.1 | |
Diversified Telecommunication Services | | | 6.8 | |
Electric Utilities | | | 6.5 | |
Chemicals | | | 6.4 | |
Software | | | 3.9 | |
Semiconductors & Semiconductor Equipment | | | 3.5 | |
Insurance | | | 3.2 | |
IT Services | | | 2.8 | |
Banks | | | 2.5 | |
Machinery | | | 2.4 | |
Professional Services | | | 2.4 | |
Wireless Telecommunication Services | | | 2.4 | |
Hotels, Restaurants & Leisure | | | 2.2 | |
Personal Products | | | 2.0 | |
Media | | | 2.0 | |
Food & Staples Retailing | | | 1.9 | |
Metals & Mining | | | 1.9 | |
Food Products | | | 1.8 | |
Health Care Equipment & Supplies | | | 1.6 | |
Electrical Equipment | | | 1.6 | |
Health Care Providers & Services | | | 1.5 | |
Textiles, Apparel & Luxury Goods | | | 1.5 | |
Airlines | | | 1.4 | |
Household Products | | | 1.4 | |
Paper & Forest Products | | | 1.4 | |
Auto Components | | | 1.4 | |
Tobacco | | | 1.3 | |
Construction & Engineering | | | 1.3 | |
Multi-Utilities | | | 1.1 | |
Transportation Infrastructure | | | 1.1 | |
Others (each less than 1.0%) | | | 14.1 | |
| | |
| * | | — Non-income producing security. |
| (a) | | — Securities exempt from registration under Rule 144A or section 4(2), of the Securities Act of 1933. Under procedures approved by the Board of Trustees, such securities have been determined to be liquid by the investment adviser and may be resold, normally to qualified institutional buyers in transactions exempt from registration. |
| (b) | | — Represents less than 0.05% of net assets. |
Abbreviations
| | |
| ADR | | — American Depositary Receipt |
| CVA | | — Dutch Certification |
| FDR | | — Fiduciary Depositary Receipt |
| OYJ | | — Public Limited Company |
| Preference | | — A special type of equity investment that shares in the earnings of the company, has limited voting rights, and may have a dividend preference. Preference shares may also have liquidation preference |
| REIT | | — Real Estate Investment Trust |
| SCA | | — Limited partnership with share capital |
SEE NOTES TO FINANCIAL STATEMENTS.
| | | | | | | | |
| | | |
| OCTOBER 31, 2017 | | JPMORGAN EXCHANGE-TRADED FUNDS | | | | | 43 | |
JPMorgan Diversified Return Global Equity ETF
SCHEDULE OF PORTFOLIO INVESTMENTS
AS OF OCTOBER 31, 2017
| | | | | | | | |
| SHARES | | | INVESTMENTS | | VALUE($) | |
| | Common Stocks — 98.9% | |
| | | | Australia — 6.9% | | | | |
| | 18,050 | | | AGL Energy Ltd. | | | 349,473 | |
| | 11,203 | | | Ansell Ltd. | | | 206,215 | |
| | 30,561 | | | APA Group | | | 200,562 | |
| | 4,467 | | | ASX Ltd. | | | 184,823 | |
| | 57,543 | | | Aurizon Holdings Ltd. | | | 228,371 | |
| | 26,573 | | | Boral Ltd. | | | 145,815 | |
| | 5,253 | | | Caltex Australia Ltd. | | | 137,925 | |
| | 3,500 | | | CIMIC Group Ltd. | | | 129,846 | |
| | 2,413 | | | Cochlear Ltd. | | | 325,042 | |
| | 6,182 | | | Computershare Ltd. | | | 73,903 | |
| | 4,553 | | | CSL Ltd. | | | 484,717 | |
| | 44,301 | | | CSR Ltd. | | | 161,137 | |
| | 31,641 | | | Dexus, REIT | | | 236,928 | |
| | 4,849 | | | Flight Centre Travel Group Ltd. | | | 173,843 | |
| | 62,169 | | | GPT Group (The), REIT | | | 242,759 | |
| | 43,331 | | | Harvey Norman Holdings Ltd. | | | 125,516 | |
| | 107,748 | | | Healthscope Ltd. | | | 161,852 | |
| | 12,235 | | | Incitec Pivot Ltd. | | | 35,888 | |
| | 151,151 | | | Mirvac Group, REIT | | | 279,380 | |
| | 8,009 | | | Orica Ltd. | | | 128,281 | |
| | 55,516 | | | Origin Energy Ltd.* | | | 338,120 | |
| | 69,050 | | | Qantas Airways Ltd. | | | 325,891 | |
| | 5,516 | | | Ramsay Health Care Ltd. | | | 282,803 | |
| | 70,123 | | | Scentre Group, REIT | | | 216,220 | |
| | 15,443 | | | Sonic Healthcare Ltd. | | | 257,925 | |
| | 49,321 | | | Star Entertainment Grp Ltd. (The) | | | 217,486 | |
| | 26,519 | | | Sydney Airport | | | 144,483 | |
| | 47,378 | | | Tabcorp Holdings Ltd. | | | 163,016 | |
| | 46,381 | | | Tatts Group Ltd. | | | 148,264 | |
| | 116,416 | | | Telstra Corp. Ltd. | | | 315,951 | |
| | 13,233 | | | Transurban Group | | | 123,012 | |
| | 6,675 | | | Treasury Wine Estates Ltd. | | | 80,126 | |
| | 12,886 | | | Wesfarmers Ltd. | | | 412,749 | |
| | 13,161 | | | WorleyParsons Ltd.* | | | 141,554 | |
| | | | | | | | |
| | | | | | | 7,179,876 | |
| | | | | | | | |
| | | | Austria — 0.3% | | | | |
| | 5,206 | | | OMV AG | | | 312,430 | |
| | | | | | | | |
| | | | Belgium — 0.7% | | | | |
| | 951 | | | Ageas | | | 46,119 | |
| | 3,039 | | | Colruyt SA | | | 155,428 | |
| | 1,617 | | | Groupe Bruxelles Lambert SA | | | 173,677 | |
| | 6,286 | | | Proximus SADP | | | 208,736 | |
| | 900 | | | Solvay SA | | | 133,702 | |
| | 532 | | | UCB SA | | | 38,727 | |
| | | | | | | | |
| | | | | | | 756,389 | |
| | | | | | | | |
| | | | | | | | |
| SHARES | | | INVESTMENTS | | VALUE($) | |
| | | | | | | | |
| | | | Bermuda — 0.3% | | | | |
| | 1,884 | | | RenaissanceRe Holdings Ltd. | | | 260,670 | |
| | | | | | | | |
| | | | Canada — 3.6% | | | | |
| | 1,618 | | | Agrium, Inc. | | | 176,148 | |
| | 3,771 | | | ARC Resources Ltd. | | | 45,979 | |
| | 5,669 | | | BCE, Inc. | | | 261,764 | |
| | 2,025 | | | Canadian Tire Corp. Ltd., Class A | | | 248,475 | |
| | 5,577 | | | Fortis, Inc. | | | 205,382 | |
| | 11,452 | | | Husky Energy, Inc.* | | | 148,421 | |
| | 5,308 | | | Hydro One Ltd. (a) | | | 93,850 | |
| | 6,086 | | | Imperial Oil Ltd. | | | 197,331 | |
| | 10,030 | | | Inter Pipeline Ltd. | | | 204,005 | |
| | 2,905 | | | Loblaw Cos. Ltd. | | | 149,922 | |
| | 7,759 | | | Metro, Inc. | | | 244,239 | |
| | 6,292 | | | RioCan REIT | | | 119,344 | |
| | 5,866 | | | Rogers Communications, Inc., Class B | | | 304,372 | |
| | 9,159 | | | Shaw Communications, Inc., Class B | | | 209,150 | |
| | 4,189 | | | Suncor Energy, Inc. | | | 142,220 | |
| | 7,306 | | | Teck Resources Ltd., Class B | | | 149,280 | |
| | 7,105 | | | TELUS Corp. | | | 257,302 | |
| | 4,875 | | | Thomson Reuters Corp. | | | 227,936 | |
| | 2,172 | | | Tourmaline Oil Corp.* | | | 39,750 | |
| | 6,104 | | | TransCanada Corp. | | | 289,799 | |
| | | | | | | | |
| | | | | | | 3,714,669 | |
| | | | | | | | |
| | | | Chile — 0.0% (b) | | | | |
| | 579 | | | Antofagasta plc | | | 7,338 | |
| | | | | | | | |
| | | | China — 0.4% | | | | |
| | 228,700 | | | Semiconductor Manufacturing International Corp.* | | | 350,925 | |
| | 288,000 | | | Xinyi Solar Holdings Ltd. | | | 99,742 | |
| | | | | | | | |
| | | | | | | 450,667 | |
| | | | | | | | |
| | | | Denmark — 0.7% | | | | |
| | 1,392 | | | Carlsberg A/S, Class B | | | 159,024 | |
| | 2,774 | | | Chr Hansen Holding A/S | | | 242,752 | |
| | 1,527 | | | H Lundbeck A/S | | | 90,777 | |
| | 1,248 | | | Orsted A/S (a) | | | 69,934 | |
| | 34,344 | | | TDC A/S | | | 203,049 | |
| | | | | | | | |
| | | | | | | 765,536 | |
| | | | | | | | |
| | | | Finland — 0.9% | | | | |
| | 2,259 | | | Elisa OYJ | | | 90,964 | |
| | 12,040 | | | Fortum OYJ | | | 255,542 | |
| | 6,302 | | | Neste OYJ | | | 350,841 | |
| | 1,480 | | | Sampo OYJ, Class A | | | 77,448 | |
| | 9,778 | | | Stora Enso OYJ, Class R | | | 152,813 | |
SEE NOTES TO FINANCIAL STATEMENTS.
| | | | | | |
| | | |
| 44 | | | | JPMORGAN EXCHANGE-TRADED FUNDS | | OCTOBER 31, 2017 |
| | | | | | | | |
| SHARES | | | INVESTMENTS | | VALUE($) | |
| | Common Stocks — continued | |
| | | | Finland — continued | | | | |
| | 1,519 | | | UPM-Kymmene OYJ | | | 45,619 | |
| | | | | | | | |
| | | | | | | 973,227 | |
| | | | | | | | |
| | | | France — 4.6% | | | | |
| | 1,978 | | | Alstom SA | | | 80,023 | |
| | 1,906 | | | Arkema SA | | | 240,788 | |
| | 1,940 | | | Atos SE | | | 301,313 | |
| | 1,860 | | | Bouygues SA | | | 89,268 | |
| | 2,617 | | | Capgemini SE | | | 317,924 | |
| | 2,959 | | | Casino Guichard Perrachon SA | | | 168,957 | |
| | 807 | | | Christian Dior SE | | | 276,992 | |
| | 2,350 | | | Danone SA | | | 192,068 | |
| | 3,039 | | | Dassault Systemes SE | | | 322,609 | |
| | 1,706 | | | Eiffage SA | | | 178,201 | |
| | 6,865 | | | Eutelsat Communications SA | | | 171,955 | |
| | 2,626 | | | Faurecia | | | 190,898 | |
| | 728 | | | Iliad SA | | | 181,723 | |
| | 3,659 | | | Lagardere SCA | | | 120,496 | |
| | 12,229 | | | Orange SA | | | 200,894 | |
| | 1,140 | | | Pernod Ricard SA | | | 170,936 | |
| | 1,564 | | | Sanofi | | | 148,090 | |
| | 3,323 | | | SCOR SE | | | 137,949 | |
| | 1,756 | | | Sodexo SA | | | 223,403 | |
| | 2,650 | | | Thales SA | | | 276,166 | |
| | 3,858 | | | TOTAL SA | | | 215,038 | |
| | 3,745 | | | Valeo SA | | | 253,552 | |
| | 1,207 | | | Vinci SA | | | 118,259 | |
| | 7,117 | | | Vivendi SA | | | 176,728 | |
| | | | | | | | |
| | | | | | | 4,754,230 | |
| | | | | | | | |
| | | | Germany — 3.3% | | | | |
| | 930 | | | BASF SE | | | 101,699 | |
| | 1,919 | | | Beiersdorf AG | | | 215,869 | |
| | 1,833 | | | Covestro AG (a) | | | 176,206 | |
| | 7,955 | | | Deutsche Lufthansa AG (Registered) | | | 255,577 | |
| | 10,950 | | | Deutsche Telekom AG (Registered) | | | 198,275 | |
| | 5,827 | | | Evonik Industries AG | | | 211,963 | |
| | 2,326 | | | Fraport AG Frankfurt Airport Services Worldwide | | | 221,025 | |
| | 2,634 | | | Fresenius Medical Care AG & Co. KGaA | | | 255,029 | |
| | 3,419 | | | Fresenius SE & Co. KGaA | | | 286,226 | |
| | 2,225 | | | Hannover Rueck SE | | | 279,996 | |
| | 1,011 | | | Henkel AG & Co. KGaA (Preference) | | | 141,961 | |
| | 12,978 | | | Infineon Technologies AG | | | 358,946 | |
| | 2,121 | | | Merck KGaA | | | 227,568 | |
| | 2,449 | | | SAP SE | | | 279,829 | |
| | 11,357 | | | Telefonica Deutschland Holding AG | | | 57,931 | |
| | | | | | | | |
| SHARES | | | INVESTMENTS | | VALUE($) | |
| | | | | | | | |
| | | | Germany — continued | | | | |
| | 3,132 | | | TUI AG | | | 56,568 | |
| | 2,920 | | | Uniper SE | | | 82,048 | |
| | | | | | | | |
| | | | | | | 3,406,716 | |
| | | | | | | | |
| | | | Hong Kong — 4.1% | | | | |
| | 16,000 | | | ASM Pacific Technology Ltd. | | | 233,447 | |
| | 64,000 | | | Cathay Pacific Airways Ltd.* | | | 109,487 | |
| | 32,760 | | | CK Hutchison Holdings Ltd. | | | 416,108 | |
| | 26,500 | | | CK Infrastructure Holdings Ltd. | | | 230,738 | |
| | 32,000 | | | CLP Holdings Ltd. | | | 325,694 | |
| | 13,800 | | | Hang Seng Bank Ltd. | | | 327,101 | |
| | 150,647 | | | Hong Kong & China Gas Co. Ltd. | | | 285,570 | |
| | 239,700 | | | Hutchison Port Holdings Trust | | | 103,072 | |
| | 2,500 | | | Jardine Matheson Holdings Ltd. | | | 160,154 | |
| | 3,600 | | | Jardine Strategic Holdings Ltd. | | | 151,002 | |
| | 11,500 | | | Johnson Electric Holdings Ltd. | | | 46,398 | |
| | 44,000 | | | Link REIT | | | 369,922 | |
| | 51,500 | | | MTR Corp. Ltd. | | | 298,571 | |
| | 139,000 | | | New World Development Co. Ltd. | | | 207,238 | |
| | 238,000 | | | PCCW Ltd. | | | 131,225 | |
| | 38,000 | | | Power Assets Holdings Ltd. | | | 329,426 | |
| | 19,500 | | | Swire Pacific Ltd., Class A | | | 192,700 | |
| | 125,000 | | | WH Group Ltd. (a) | | | 126,673 | |
| | 162,000 | | | Xinyi Glass Holdings Ltd. | | | 156,982 | |
| | | | | | | | |
| | | | | | | 4,201,508 | |
| | | | | | | | |
| | | | Ireland — 0.1% | | | | |
| | 566 | | | Ryanair Holdings plc, ADR* | | | 63,454 | |
| | | | | | | | |
| | | | Israel — 0.3% | | | | |
| | 2,656 | | | Check Point Software Technologies Ltd.* | | | 312,638 | |
| | | | | | | | |
| | | | Italy — 0.8% | | | | |
| | 2,196 | | | Buzzi Unicem SpA | | | 61,136 | |
| | 30,886 | | | Italgas SpA | | | 180,427 | |
| | 42,538 | | | Parmalat SpA | | | 161,039 | |
| | 3,718 | | | Recordati SpA | | | 172,847 | |
| | 39,904 | | | Terna Rete Elettrica Nazionale SpA | | | 240,778 | |
| | | | | | | | |
| | | | | | | 816,227 | |
| | | | | | | | |
| | | | Japan — 23.0% | | | | |
| | 2,800 | | | Aisin Seiki Co. Ltd. | | | 145,047 | |
| | 8,200 | | | ANA Holdings, Inc. | | | 315,167 | |
| | 7,400 | | | Aozora Bank Ltd. | | | 289,649 | |
| | 12,700 | | | Brother Industries Ltd. | | | 309,030 | |
| | 9,300 | | | Canon, Inc. | | | 349,374 | |
| | 5,300 | | | Capcom Co. Ltd. | | | 134,845 | |
| | 1,600 | | | Central Japan Railway Co. | | | 290,635 | |
| | 16,500 | | | Chubu Electric Power Co., Inc. | | | 212,792 | |
SEE NOTES TO FINANCIAL STATEMENTS.
| | | | | | | | |
| | | |
| OCTOBER 31, 2017 | | JPMORGAN EXCHANGE-TRADED FUNDS | | | | | 45 | |
JPMorgan Diversified Return Global Equity ETF
SCHEDULE OF PORTFOLIO INVESTMENTS
AS OF OCTOBER 31, 2017 (continued)
| | | | | | | | |
| SHARES | | | INVESTMENTS | | VALUE($) | |
| | Common Stocks — continued | |
| | | | Japan — continued | | | | |
| | 15,700 | | | Chugoku Electric Power Co., Inc. (The) | | | 175,057 | |
| | 4,200 | | | COMSYS Holdings Corp. | | | 106,363 | |
| | 9,300 | | | Cosmo Energy Holdings Co. Ltd. | | | 213,639 | |
| | 8,600 | | | Credit Saison Co. Ltd. | | | 173,164 | |
| | 6,800 | | | Dai Nippon Printing Co. Ltd. | | | 162,996 | |
| | 13,200 | | | Daiichi Sankyo Co. Ltd. | | | 303,187 | |
| | 1,500 | | | Daito Trust Construction Co. Ltd. | | | 262,252 | |
| | 5,100 | | | DIC Corp. | | | 189,311 | |
| | 2,800 | | | Dowa Holdings Co. Ltd. | | | 117,880 | |
| | 4,100 | | | Ebara Corp. | | | 147,546 | |
| | 8,300 | | | Electric Power Development Co. Ltd. | | | 209,169 | |
| | 38,000 | | | Fuji Electric Co. Ltd. | | | 275,315 | |
| | 8,000 | | | FUJIFILM Holdings Corp. | | | 327,262 | |
| | 32,700 | | | Fujikura Ltd. | | | 285,397 | |
| | 19,000 | | | Fujitsu Ltd. | | | 148,057 | |
| | 7,600 | | | Gree, Inc. | | | 51,593 | |
| | 5,200 | | | Hankyu Hanshin Holdings, Inc. | | | 202,734 | |
| | 2,300 | | | Hikari Tsushin, Inc. | | | 297,760 | |
| | 2,200 | | | Hitachi Chemical Co. Ltd. | | | 62,735 | |
| | 5,000 | | | Hitachi High-Technologies Corp. | | | 209,244 | |
| | 4,500 | | | Hitachi Kokusai Electric, Inc. | | | 124,655 | |
| | 10,500 | | | Hokkaido Electric Power Co., Inc.* | | | 82,744 | |
| | 12,300 | | | Hokuriku Electric Power Co. | | | 108,684 | |
| | 9,300 | | | Idemitsu Kosan Co. Ltd. | | | 271,837 | |
| | 27,200 | | | Inpex Corp. | | | 291,236 | |
| | 19,400 | | | ITOCHU Corp. | | | 339,823 | |
| | 7,300 | | | Japan Airlines Co. Ltd. | | | 249,859 | |
| | 5,300 | | | Japan Petroleum Exploration Co. Ltd. | | | 109,367 | |
| | 64,400 | | | JXTG Holdings, Inc. | | | 332,549 | |
| | 23,000 | | | Kaneka Corp. | | | 189,932 | |
| | 19,400 | | | Kansai Electric Power Co., Inc. (The) | | | 265,666 | |
| | 8,000 | | | Kawasaki Kisen Kaisha Ltd.* | | | 208,886 | |
| | 12,500 | | | KDDI Corp. | | | 333,033 | |
| | 7,100 | | | Keisei Electric Railway Co. Ltd. | | | 214,473 | |
| | 3,800 | | | Konami Holdings Corp. | | | 185,080 | |
| | 15,800 | | | Kuraray Co. Ltd. | | | 311,174 | |
| | 500 | | | Kyowa Hakko Kirin Co. Ltd. | | | 9,229 | |
| | 17,000 | | | Kyushu Electric Power Co., Inc. | | | 193,904 | |
| | 800 | | | Lawson, Inc. | | | 52,239 | |
| | 46,400 | | | Marubeni Corp. | | | 311,114 | |
| | 3,500 | | | Mitsubishi Gas Chemical Co., Inc. | | | 85,619 | |
| | 12,200 | | | Mitsubishi Tanabe Pharma Corp. | | | 268,514 | |
| | 195,000 | | | Mizuho Financial Group, Inc. | | | 354,292 | |
| | 2,900 | | | Mochida Pharmaceutical Co. Ltd. | | | 212,307 | |
| | 11,000 | | | NH Foods Ltd. | | | 316,415 | |
| | 2,800 | | | Nihon M&A Center, Inc. | | | 134,049 | |
| | | | | | | | |
| SHARES | | | INVESTMENTS | | VALUE($) | |
| | | | | | | | |
| | | | Japan — continued | | | | |
| | 8,900 | | | Nikon Corp. | | | 169,020 | |
| | 1,100 | | | Nippon Express Co. Ltd. | | | 69,798 | |
| | 12,400 | | | Nippon Kayaku Co. Ltd. | | | 196,870 | |
| | 10,000 | | | Nippon Paper Industries Co. Ltd. | | | 198,944 | |
| | 2,900 | | | Nippon Shokubai Co. Ltd. | | | 218,750 | |
| | 6,600 | | | Nippon Telegraph & Telephone Corp. | | | 319,094 | |
| | 16,000 | | | Nipro Corp. | | | 233,265 | |
| | 23,200 | | | Nissan Motor Co. Ltd. | | | 225,629 | |
| | 6,900 | | | Nisshin Steel Co. Ltd. | | | 100,279 | |
| | 2,900 | | | Nissin Foods Holdings Co. Ltd. | | | 182,604 | |
| | 10,700 | | | Nomura Real Estate Holdings, Inc. | | | 235,513 | |
| | 4,000 | | | Nomura Research Institute Ltd. | | | 169,580 | |
| | 27,800 | | | NTT Data Corp. | | | 323,780 | |
| | 13,900 | | | NTT DOCOMO, Inc. | | | 336,641 | |
| | 7,000 | | | Oji Holdings Corp. | | | 41,027 | |
| | 13,800 | | | Osaka Gas Co. Ltd. | | | 267,293 | |
| | 3,400 | | | Otsuka Corp. | | | 231,773 | |
| | 4,700 | | | Otsuka Holdings Co. Ltd. | | | 196,341 | |
| | 26,100 | | | Resona Holdings, Inc. | | | 141,079 | |
| | 4,000 | | | Sankyo Co. Ltd. | | | 129,110 | |
| | 2,800 | | | Sawai Pharmaceutical Co. Ltd. | | | 158,817 | |
| | 10,000 | | | SBI Holdings, Inc. | | | 157,817 | |
| | 3,500 | | | SCREEN Holdings Co. Ltd. | | | 274,325 | |
| | 3,600 | | | SCSK Corp. | | | 155,246 | |
| | 4,900 | | | Sega Sammy Holdings, Inc. | | | 68,979 | |
| | 14,100 | | | Sekisui Chemical Co. Ltd. | | | 284,599 | |
| | 17,300 | | | Sekisui House Ltd. | | | 323,484 | |
| | 7,000 | | | Seven Bank Ltd. | | | 25,888 | |
| | 1,900 | | | Shimamura Co. Ltd. | | | 211,676 | |
| | 8,600 | | | Shimizu Corp. | | | 101,225 | |
| | 5,500 | | | Showa Denko KK | | | 184,288 | |
| | 24,000 | | | Showa Shell Sekiyu KK | | | 283,134 | |
| | 6,700 | | | Skylark Co. Ltd. | | | 100,213 | |
| | 4,500 | | | SoftBank Group Corp. | | | 398,800 | |
| | 88,900 | | | Sojitz Corp. | | | 268,302 | |
| | 7,400 | | | Square Enix Holdings Co. Ltd. | | | 298,409 | |
| | 11,300 | | | Sumitomo Dainippon Pharma Co. Ltd. | | | 161,277 | |
| | 46,000 | | | Sumitomo Osaka Cement Co. Ltd. | | | 210,669 | |
| | 4,800 | | | Suzuken Co. Ltd. | | | 173,030 | |
| | 3,400 | | | Taisei Corp. | | | 188,384 | |
| | 1,700 | | | Taisho Pharmaceutical Holdings Co. Ltd. | | | 129,466 | |
| | 16,000 | | | Takashimaya Co. Ltd. | | | 147,214 | |
| | 3,700 | | | Takeda Pharmaceutical Co. Ltd. | | | 208,624 | |
| | 8,300 | | | Teijin Ltd. | | | 175,672 | |
| | 5,200 | | | Terumo Corp. | | | 216,686 | |
| | 19,100 | | | Tohoku Electric Power Co., Inc. | | | 250,570 | |
SEE NOTES TO FINANCIAL STATEMENTS.
| | | | | | |
| | | |
| 46 | | | | JPMORGAN EXCHANGE-TRADED FUNDS | | OCTOBER 31, 2017 |
| | | | | | | | |
| SHARES | | | INVESTMENTS | | VALUE($) | |
| | Common Stocks — continued | |
| | | | Japan — continued | | | | |
| | 10,700 | | | Tokyo Broadcasting System Holdings, Inc. | | | 217,878 | |
| | 21,200 | | | Tokyo Electric Power Co. Holdings, Inc.* | | | 87,018 | |
| | 10,000 | | | Tokyo Gas Co. Ltd. | | | 249,456 | |
| | 7,100 | | | Tokyo Tatemono Co. Ltd. | | | 99,601 | |
| | 8,400 | | | Tokyu Corp. | | | 127,067 | |
| | 18,800 | | | Tokyu Fudosan Holdings Corp. | | | 123,255 | |
| | 24,000 | | | Toppan Printing Co. Ltd. | | | 244,169 | |
| | 2,900 | | | Tosoh Corp. | | | 62,584 | |
| | 6,600 | | | Toyo Suisan Kaisha Ltd. | | | 253,902 | |
| | 4,000 | | | Toyota Industries Corp. | | | 246,206 | |
| | 7,400 | | | Toyota Motor Corp. | | | 458,993 | |
| | 7,000 | | | Tsumura & Co. | | | 260,165 | |
| | 10,000 | | | Ube Industries Ltd. | | | 307,201 | |
| | 38,500 | | | Yamada Denki Co. Ltd. | | | 204,789 | |
| | 8,500 | | | Yokohama Rubber Co. Ltd. (The) | | | 191,098 | |
| | | | | | | | |
| | | | | | | 23,800,446 | |
| | | | | | | | |
| | | | Netherlands — 1.4% | | | | |
| | 867 | | | Boskalis Westminster | | | 30,992 | |
| | 1,595 | | | Gemalto NV | | | 63,123 | |
| | 1,802 | | | Heineken Holding NV | | | 167,266 | |
| | 2,106 | | | Koninklijke DSM NV | | | 179,679 | |
| | 45,857 | | | Koninklijke KPN NV | | | 157,788 | |
| | 5,273 | | | Koninklijke Philips NV | | | 214,890 | |
| | 4,252 | | | NN Group NV | | | 178,063 | |
| | 3,150 | | | Royal Dutch Shell plc, Class A | | | 99,161 | |
| | 6,381 | | | Wolters Kluwer NV | | | 312,750 | |
| | | | | | | | |
| | | | | | | 1,403,712 | |
| | | | | | | | |
| | | | New Zealand — 0.3% | | | | |
| | 23,196 | | | Contact Energy Ltd. | | | 91,293 | |
| | 97,690 | | | Spark New Zealand Ltd. | | | 246,132 | |
| | | | | | | | |
| | | | | | | 337,425 | |
| | | | | | | | |
| | | | Norway — 0.9% | | | | |
| | 14,927 | | | Marine Harvest ASA* | | | 291,486 | |
| | 19,909 | | | Orkla ASA | | | 195,012 | |
| | 11,674 | | | Telenor ASA | | | 247,883 | |
| | 4,846 | | | Yara International ASA | | | 230,150 | |
| | | | | | | | |
| | | | | | | 964,531 | |
| | | | | | | | |
| | | | Portugal — 0.4% | | | | |
| | 57,009 | | | EDP — Energias de Portugal SA | | | 203,307 | |
| | 11,300 | | | Galp Energia SGPS SA | | | 210,090 | |
| | | | | | | | |
| | | | | | | 413,397 | |
| | | | | | | | |
| | | | Singapore — 2.0% | | | | |
| | 119,600 | | | CapitaLand Mall Trust, REIT | | | 177,303 | |
| | 95,000 | | | ComfortDelGro Corp. Ltd. | | | 140,834 | |
| | | | | | | | |
| SHARES | | | INVESTMENTS | | VALUE($) | |
| | | | | | | | |
| | | | Singapore — continued | | | | |
| | 400,100 | | | Golden Agri-Resources Ltd. | | | 115,962 | |
| | 57,300 | | | Keppel Corp. Ltd. | | | 315,395 | |
| | 67,700 | | | Sembcorp Industries Ltd. | | | 163,966 | |
| | 20,600 | | | Singapore Airlines Ltd. | | | 155,249 | |
| | 72,700 | | | Singapore Press Holdings Ltd. | | | 143,967 | |
| | 136,200 | | | Singapore Telecommunications Ltd. | | | 374,818 | |
| | 15,400 | | | Venture Corp. Ltd. | | | 220,138 | |
| | 105,500 | | | Wilmar International Ltd. | | | 262,532 | |
| | | | | | | | |
| | | | | | | 2,070,164 | |
| | | | | | | | |
| | | | South Africa — 0.2% | | | | |
| | 7,087 | | | Mondi plc | | | 171,394 | |
| | | | | | | | |
| | | | South Korea — 10.2% | | | | |
| | 1,906 | | | Celltrion, Inc.* | | | 294,647 | |
| | 543 | | | CJ CheilJedang Corp. | | | 177,684 | |
| | 487 | | | E-MART, Inc. | | | 97,487 | |
| | 3,508 | | | GS Holdings Corp. | | | 207,710 | |
| | 4,411 | | | Hankook Tire Co. Ltd. | | | 212,900 | |
| | 518 | | | Hanmi Pharm Co. Ltd.* | | | 214,448 | |
| | 2,136 | | | Hanmi Science Co. Ltd.* | | | 175,092 | |
| | 4,921 | | | Hanon Systems | | | 57,243 | |
| | 9,826 | | | Hanwha Chemical Corp. | | | 267,664 | |
| | 4,873 | | | Hanwha Techwin Co. Ltd.* | | | 167,033 | |
| | 1,002 | | | Hyosung Corp. | | | 120,422 | |
| | 370 | | | Hyundai Construction Equipment Co. Ltd.* | | | 123,756 | |
| | 340 | | | Hyundai Electric & Energy System Co. Ltd.* | | | 71,667 | |
| | 3,943 | | | Hyundai Engineering & Construction Co. Ltd. | | | 133,388 | |
| | 780 | | | Hyundai Heavy Industries Co. Ltd.* | | | 109,096 | |
| | 970 | | | Hyundai Mobis Co. Ltd. | | | 230,736 | |
| | 182 | | | Hyundai Robotics Co. Ltd.* | | | 73,445 | |
| | 4,469 | | | Hyundai Steel Co. | | | 229,685 | |
| | 13,368 | | | Industrial Bank of Korea | | | 183,159 | |
| | 2,855 | | | Kakao Corp. | | | 367,305 | |
| | 9,418 | | | Kia Motors Corp. | | | 298,104 | |
| | 8,763 | | | Korea Electric Power Corp. | | | 307,227 | |
| | 3,926 | | | Korea Gas Corp.* | | | 143,387 | |
| | 267 | | | Korea Zinc Co. Ltd. | | | 122,133 | |
| | 3,959 | | | Korean Air Lines Co. Ltd.* | | | 112,073 | |
| | 3,122 | | | KT&G Corp. | | | 295,383 | |
| | 1,888 | | | LG Corp. | | | 145,168 | |
| | 11,500 | | | LG Display Co. Ltd. | | | 300,847 | |
| | 3,414 | | | LG Electronics, Inc. | | | 277,922 | |
| | 20,871 | | | LG Uplus Corp. | | | 239,654 | |
| | 897 | | | Lotte Chemical Corp. | | | 296,279 | |
| | 372 | | | Lotte Corp. | | | 24,766 | |
| | 1,473 | | | LOTTE Fine Chemical Co. Ltd. | | | 52,987 | |
SEE NOTES TO FINANCIAL STATEMENTS.
| | | | | | | | |
| | | |
| OCTOBER 31, 2017 | | JPMORGAN EXCHANGE-TRADED FUNDS | | | | | 47 | |
JPMorgan Diversified Return Global Equity ETF
SCHEDULE OF PORTFOLIO INVESTMENTS
AS OF OCTOBER 31, 2017 (continued)
| | | | | | | | |
| SHARES | | | INVESTMENTS | | VALUE($) | |
| | Common Stocks — continued | | | | |
| | | | South Korea — continued | | | | |
| | 290 | | | Lotte Shopping Co. Ltd. | | | 58,330 | |
| | 518 | | | NAVER Corp. | | | 414,023 | |
| | 1,224 | | | POSCO | | | 356,778 | |
| | 1,079 | | | Samsung Biologics Co. Ltd.* (a) | | | 370,182 | |
| | 249 | | | Samsung Electronics Co. Ltd. | | | 613,811 | |
| | 550 | | | Samsung SDI Co. Ltd. | | | 101,337 | |
| | 974 | | | Samsung SDS Co. Ltd. | | | 180,351 | |
| | 535 | | | Shinsegae, Inc. | | | 109,354 | |
| | 1,260 | | | SK Holdings Co. Ltd. | | | 326,050 | |
| | 6,815 | | | SK Hynix, Inc. | | | 502,488 | |
| | 2,003 | | | SK Innovation Co. Ltd. | | | 367,432 | |
| | 1,411 | | | SK Telecom Co. Ltd. | | | 333,109 | |
| | 3,246 | | | SKC Co. Ltd. | | | 115,318 | |
| | 2,830 | | | S-Oil Corp. | | | 325,364 | |
| | 17,454 | | | Woori Bank | | | 255,425 | |
| | | | | | | | |
| | | | | | | 10,559,849 | |
| | | | | | | | |
| | | | Spain — 1.7% | | | | |
| | 1,058 | | | Acciona SA | | | 87,607 | |
| | 2,095 | | | Acerinox SA | | | 30,099 | |
| | 478 | | | ACS Actividades de Construccion y Servicios SA | | | 18,842 | |
| | 1,292 | | | Aena SME SA (a) | | | 237,048 | |
| | 7,521 | | | Enagas SA | | | 216,633 | |
| | 9,063 | | | Endesa SA | | | 207,436 | |
| | 9,494 | | | Gas Natural SDG SA | | | 203,148 | |
| | 8,800 | | | Grifols SA | | | 275,395 | |
| | 28,398 | | | Iberdrola SA | | | 229,485 | |
| | 2,978 | | | Red Electrica Corp. SA | | | 65,941 | |
| | 12,568 | | | Repsol SA | | | 235,517 | |
| | | | | | | | |
| | | | | | | 1,807,151 | |
| | | | | | | | |
| | | | Sweden — 2.6% | | | | |
| | 1,935 | | | Autoliv, Inc. | | | 241,604 | |
| | 8,555 | | | Boliden AB | | | 299,355 | |
| | 644 | | | Essity AB, Class B* | | | 19,249 | |
| | 5,729 | | | Getinge AB, Class B | | | 112,768 | |
| | 4,864 | | | Hexagon AB, Class B | | | 249,402 | |
| | 4,648 | | | Investor AB, Class B | | | 230,293 | |
| | 4,938 | | | Lundin Petroleum AB* | | | 116,167 | |
| | 15,355 | | | Securitas AB, Class B | | | 269,418 | |
| | 10,655 | | | Skanska AB, Class B | | | 233,649 | |
| | 3,823 | | | Svenska Cellulosa AB SCA, Class B | | | 35,898 | |
| | 5,793 | | | Swedish Match AB | | | 218,228 | |
| | 22,558 | | | Tele2 AB, Class B | | | 286,932 | |
| | 45,879 | | | Telia Co. AB | | | 212,349 | |
| | | | | | | | |
| SHARES | | | INVESTMENTS | | VALUE($) | |
| | | | | | | | |
| | | | Sweden — continued | | | | |
| | 8,983 | | | Trelleborg AB, Class B | | | 222,452 | |
| | | | | | | | |
| | | | | | | 2,747,764 | |
| | | | | | | | |
| | | | Switzerland — 1.7% | | | | |
| | 1,459 | | | Baloise Holding AG (Registered) | | | 230,022 | |
| | 9,792 | | | Clariant AG (Registered)* | | | 246,366 | |
| | 375 | | | Kuehne + Nagel International AG (Registered) | | | 65,518 | |
| | 1,443 | | | Logitech International SA (Registered) | | | 51,601 | |
| | 130 | | | Lonza Group AG (Registered)* | | | 34,536 | |
| | 2,177 | | | Novartis AG (Registered) | | | 179,557 | |
| | 1,432 | | | Sonova Holding AG (Registered) | | | 258,522 | |
| | 6,944 | | | STMicroelectronics NV | | | 163,561 | |
| | 113 | | | Straumann Holding AG (Registered) | | | 78,897 | |
| | 589 | | | Swiss Life Holding AG (Registered)* | | | 204,718 | |
| | 1,000 | | | Swiss Prime Site AG (Registered)* | | | 85,351 | |
| | 421 | | | Swisscom AG (Registered) | | | 212,699 | |
| | | | | | | | |
| | | | | | | 1,811,348 | |
| | | | | | | | |
| | | | United Kingdom — 2.4% | | | | |
| | 33,284 | | | BP plc | | | 225,754 | |
| | 5,341 | | | Bunzl plc | | | 166,375 | |
| | 2,416 | | | easyJet plc | | | 42,968 | |
| | 10,705 | | | Hammerson plc, REIT | | | 74,520 | |
| | 12,139 | | | Inmarsat plc | | | 100,129 | |
| | 16,590 | | | International Consolidated Airlines Group SA | | | 140,117 | |
| | 365 | | | Johnson Matthey plc | | | 16,387 | |
| | 25,275 | | | Kingfisher plc | | | 105,084 | |
| | 8,397 | | | Land Securities Group plc, REIT | | | 107,849 | |
| | 1,933 | | | Micro Focus International plc | | | 67,896 | |
| | 9,473 | | | RELX NV | | | 213,870 | |
| | 15,758 | | | Royal Mail plc | | | 78,358 | |
| | 22,544 | | | Sage Group plc (The) | | | 223,154 | |
| | 6,395 | | | Severn Trent plc | | | 179,312 | |
| | 12,347 | | | Smith & Nephew plc | | | 232,884 | |
| | 14,769 | | | Tate & Lyle plc | | | 126,870 | |
| | 15,745 | | | United Utilities Group plc | | | 174,196 | |
| | 12,723 | | | William Hill plc | | | 43,659 | |
| | 62,864 | | | Wm Morrison Supermarkets plc | | | 187,191 | |
| | | | | | | | |
| | | | | | | 2,506,573 | |
| | | | | | | | |
| | | | United States — 25.1% | | | | |
| | 7,436 | | | AGNC Investment Corp., REIT | | | 149,687 | |
| | 2,243 | | | Alaska Air Group, Inc. | | | 148,105 | |
| | 1,990 | | | Albemarle Corp. | | | 280,371 | |
| | 5,974 | | | Alcoa Corp.* | | | 285,438 | |
| | 395 | | | Alleghany Corp.* | | | 223,657 | |
SEE NOTES TO FINANCIAL STATEMENTS.
| | | | | | |
| | | |
| 48 | | | | JPMORGAN EXCHANGE-TRADED FUNDS | | OCTOBER 31, 2017 |
| | | | | | | | |
| SHARES | | | INVESTMENTS | | VALUE($) | |
| | Common Stocks — continued | | | | |
| | | | United States — continued | | | | |
| | 7,100 | | | Alliant Energy Corp. | | | 307,146 | |
| | 2,454 | | | Allstate Corp. (The) | | | 230,332 | |
| | 4,487 | | | Amdocs Ltd. | | | 292,104 | |
| | 4,184 | | | Ameren Corp. | | | 259,366 | |
| | 98 | | | American Water Works Co., Inc. | | | 8,600 | |
| | 1,731 | | | Andeavor | | | 183,901 | |
| | 15,031 | | | Annaly Capital Management, Inc., REIT | | | 172,255 | |
| | 1,562 | | | ANSYS, Inc.* | | | 213,541 | |
| | 4,835 | | | Antero Resources Corp.* | | | 93,799 | |
| | 1,566 | | | Anthem, Inc. | | | 327,623 | |
| | 1,583 | | | Arrow Electronics, Inc.* | | | 132,323 | |
| | 3,008 | | | Ashland Global Holdings, Inc. | | | 204,484 | |
| | 904 | | | Assurant, Inc. | | | 90,988 | |
| | 9,389 | | | AT&T, Inc. | | | 315,940 | |
| | 3,656 | | | AutoNation, Inc.* | | | 173,294 | |
| | 3,141 | | | Avery Dennison Corp. | | | 333,480 | |
| | 4,161 | | | Avnet, Inc. | | | 165,608 | |
| | 4,011 | | | Axis Capital Holdings Ltd. | | | 218,158 | |
| | 1,524 | | | Becton Dickinson and Co. | | | 318,013 | |
| | 4,731 | | | Bemis Co., Inc. | | | 212,990 | |
| | 3,876 | | | Broadridge Financial Solutions, Inc. | | | 333,026 | |
| | 7,175 | | | CA, Inc. | | | 232,327 | |
| | 2,946 | | | Carnival Corp. | | | 195,585 | |
| | 1,102 | | | Carnival plc | | | 72,653 | |
| | 7,770 | | | Cars.com, Inc.* | | | 185,081 | |
| | 2,846 | | | Celanese Corp., Series A | | | 296,866 | |
| | 10,275 | | | CenturyLink, Inc. | | | 195,122 | |
| | 3,246 | | | Chevron Corp. | | | 376,179 | |
| | 5,547 | | | Church & Dwight Co., Inc. | | | 250,558 | |
| | 118 | | | Cigna Corp. | | | 23,272 | |
| | 2,771 | | | Cincinnati Financial Corp. | | | 194,441 | |
| | 2,281 | | | Cintas Corp. | | | 339,960 | |
| | 4,071 | | | CMS Energy Corp. | | | 196,914 | |
| | 2,908 | | | CNA Financial Corp. | | | 157,410 | |
| | 4,162 | | | Commerce Bancshares, Inc. | | | 242,062 | |
| | 2,614 | | | Consolidated Edison, Inc. | | | 224,935 | |
| | 1,542 | | | Constellation Brands, Inc., Class A | | | 337,837 | |
| | 932 | | | CR Bard, Inc. | | | 304,829 | |
| | 3,216 | | | Darden Restaurants, Inc. | | | 264,580 | |
| | 1,032 | | | DaVita, Inc.* | | | 62,684 | |
| | 4,013 | | | DENTSPLY SIRONA, Inc. | | | 245,074 | |
| | 2,837 | | | Dr Pepper Snapple Group, Inc. | | | 243,017 | |
| | 4,252 | | | DST Systems, Inc. | | | 249,252 | |
| | 2,685 | | | DTE Energy Co. | | | 296,585 | |
| | 2,748 | | | Eastman Chemical Co. | | | 249,546 | |
| | 1,697 | | | Edgewell Personal Care Co.* | | | 110,186 | |
| | | | | | | | |
| SHARES | | | INVESTMENTS | | VALUE($) | |
| | | | | | | | |
| | | | United States — continued | | | | |
| | 1,151 | | | Everest Re Group Ltd. | | | 273,305 | |
| | 4,860 | | | Eversource Energy | | | 304,430 | |
| | 3,280 | | | Fidelity National Information Services, Inc. | | | 304,253 | |
| | 3,791 | | | Flex Ltd.* | | | 67,480 | |
| | 3,667 | | | Foot Locker, Inc. | | | 110,303 | |
| | 4,456 | | | Garmin Ltd. | | | 252,254 | |
| | 9,372 | | | Gentex Corp. | | | 181,911 | |
| | 1,805 | | | Genuine Parts Co. | | | 159,255 | |
| | 2,471 | | | Harris Corp. | | | 344,260 | |
| | 2,807 | | | Hasbro, Inc. | | | 259,900 | |
| | 853 | | | Helmerich & Payne, Inc. | | | 46,326 | |
| | 3,098 | | | Henry Schein, Inc.* | | | 243,503 | |
| | 4,988 | | | HollyFrontier Corp. | | | 184,307 | |
| | 6,048 | | | Hormel Foods Corp. | | | 188,456 | |
| | 1,492 | | | Ingredion, Inc. | | | 187,022 | |
| | 9,584 | | | Intel Corp. | | | 435,976 | |
| | 1,328 | | | InterActiveCorp* | | | 171,378 | |
| | 1,053 | | | International Flavors & Fragrances, Inc. | | | 155,233 | |
| | 4,536 | | | Interpublic Group of Cos., Inc. (The) | | | 87,318 | |
| | 4,489 | | | Jabil, Inc. | | | 126,949 | |
| | 1,937 | | | JM Smucker Co. (The) | | | 205,419 | |
| | 2,828 | | | Johnson & Johnson | | | 394,252 | |
| | 1,665 | | | L3 Technologies, Inc. | | | 311,655 | |
| | 1,960 | | | Laboratory Corp. of America Holdings* | | | 301,272 | |
| | 1,308 | | | Lam Research Corp. | | | 272,810 | |
| | 5,134 | | | Leggett & Platt, Inc. | | | 242,633 | |
| | 7,968 | | | Leucadia National Corp. | | | 201,590 | |
| | 4,190 | | | Level 3 Communications, Inc.* | | | 224,710 | |
| | 1,968 | | | McCormick & Co., Inc. (Non-Voting) | | | 195,875 | |
| | 6,896 | | | MDU Resources Group, Inc. | | | 188,606 | |
| | 2,689 | | | Molson Coors Brewing Co., Class B | | | 217,459 | |
| | 2,819 | | | Murphy Oil Corp. | | | 75,408 | |
| | 4,852 | | | NiSource, Inc. | | | 127,947 | |
| | 1,106 | | | Northrop Grumman Corp. | | | 326,856 | |
| | 116 | | | NVR, Inc.* | | | 380,639 | |
| | 5,252 | | | Old Republic International Corp. | | | 106,563 | |
| | 4,408 | | | Patterson Cos., Inc. | | | 163,096 | |
| | 2,990 | | | PG&E Corp. | | | 172,732 | |
| | 3,402 | | | Pinnacle West Capital Corp. | | | 298,389 | |
| | 1,813 | | | Public Service Enterprise Group, Inc. | | | 89,200 | |
| | 7,739 | | | PulteGroup, Inc. | | | 233,950 | |
| | 1,798 | | | Quest Diagnostics, Inc. | | | 168,616 | |
| | 1,719 | | | Raytheon Co. | | | 309,764 | |
| | 4,626 | | | Republic Services, Inc. | | | 301,014 | |
| | 3,721 | | | SCANA Corp. | | | 160,524 | |
| | 2,501 | | | Scripps Networks Interactive, Inc., Class A | | | 208,283 | |
SEE NOTES TO FINANCIAL STATEMENTS.
| | | | | | | | |
| | | |
| OCTOBER 31, 2017 | | JPMORGAN EXCHANGE-TRADED FUNDS | | | | | 49 | |
JPMorgan Diversified Return Global Equity ETF
SCHEDULE OF PORTFOLIO INVESTMENTS
AS OF OCTOBER 31, 2017 (continued)
| | | | | | | | |
| SHARES | | | INVESTMENTS | | VALUE($) | |
| | Common Stocks — continued | | | | |
| | | | United States — continued | | | | |
| | 4,847 | | | Southwest Airlines Co. | | | 261,059 | |
| | 31,790 | | | Sprint Corp.* | | | 207,907 | |
| | 3,799 | | | Synopsys, Inc.* | | | 328,690 | |
| | 7,208 | | | TEGNA, Inc. | | | 88,154 | |
| | 4,462 | | | T-Mobile US, Inc.* | | | 266,694 | |
| | 3,621 | | | Torchmark Corp. | | | 304,635 | |
| | 2,671 | | | Tyson Foods, Inc., Class A | | | 194,743 | |
| | 2,846 | | | United Continental Holdings, Inc.* | | | 166,434 | |
| | 1,937 | | | Universal Health Services, Inc., Class B | | | 198,930 | |
| | 1,682 | | | Valero Energy Corp. | | | 132,693 | |
| | 7,144 | | | Verizon Communications, Inc. | | | 341,983 | |
| | 1,586 | | | VMware, Inc., Class A* | | | 189,828 | |
| | 2,194 | | | Wal-Mart Stores, Inc. | | | 191,558 | |
| | 1,085 | | | Walt Disney Co. (The) | | | 106,124 | |
| | 1,444 | | | Waters Corp.* | | | 283,096 | |
| | 3,849 | | | Westlake Chemical Corp. | | | 326,819 | |
| | 3,978 | | | WR Berkley Corp. | | | 272,811 | |
| | 2,913 | | | Wyndham Worldwide Corp. | | | 311,254 | |
| | 6,138 | | | Xcel Energy, Inc. | | | 303,954 | |
| | 4,026 | | | Xylem, Inc. | | | 267,850 | |
| | 830 | | | Zimmer Biomet Holdings, Inc. | | | 100,945 | |
| | | | | | | | |
| | | | | | | 26,030,426 | |
| | | | | | | | |
| | | | Total Common Stocks
(Cost $88,599,653) | | | 102,599,755 | |
| | | | | | | | |
NO. OF
RIGHTS | | | | | | |
| | Rights — 0.0% (b) | |
| | | | South Korea — 0.0% (b) | | | | |
| | 31 | | | Hyundai Construction Equipment Co. Ltd., expiring 11/7/2017* | | | 2,773 | |
| | 26 | | | Hyundai Electric & Energy System Co. Ltd., expiring 12/10/2017* | | | 1,164 | |
| | | | | | | | |
| | | | Total Rights
(cost $—) | | | 3,937 | |
| | | | | | | | |
| SHARES | | | | | | |
| | Investment Company — 0.5% | |
| | 516,620 | | | JPMorgan U.S. Government Money Market Fund, Institutional Class Shares, 0.92% (c)(d)
(Cost $516,620) | | | 516,620 | |
| | | | | | | | |
| | | | Total Investments — 99.4%
(Cost $89,116,273) | | | 103,120,312 | |
| | | | Other Assets Less Liabilities — 0.6% | | | 574,758 | |
| | | | | | | | |
| | | | Net Assets — 100.0% | | $ | 103,695,070 | |
| | | | | | | | |
Percentages indicated are based on net assets.
Summary of Investments by Industry, October 31, 2017
The following table represents the portfolio investments of the Fund by industry classifications as a percentage of total investments:
| | | | |
| INDUSTRY | | PERCENTAGE | |
Oil, Gas & Consumable Fuels | | | 6.8 | % |
Chemicals | | | 6.3 | |
Electric Utilities | | | 5.5 | |
Diversified Telecommunication Services | | | 5.1 | |
Pharmaceuticals | | | 3.4 | |
Insurance | | | 3.4 | |
Food Products | | | 3.3 | |
IT Services | | | 3.0 | |
Health Care Providers & Services | | | 2.8 | |
Software | | | 2.8 | |
Health Care Equipment & Supplies | | | 2.8 | |
Semiconductors & Semiconductor Equipment | | | 2.7 | |
Wireless Telecommunication Services | | | 2.4 | |
Airlines | | | 2.3 | |
Household Durables | | | 2.1 | |
Auto Components | | | 2.0 | |
Hotels, Restaurants & Leisure | | | 1.9 | |
Multi-Utilities | | | 1.8 | |
Equity Real Estate Investment Trusts (REITs) | | | 1.8 | |
Banks | | | 1.8 | |
Metals & Mining | | | 1.6 | |
Industrial Conglomerates | | | 1.6 | |
Food & Staples Retailing | | | 1.6 | |
Technology Hardware, Storage & Peripherals | | | 1.6 | |
Electronic Equipment, Instruments & Components | | | 1.5 | |
Road & Rail | | | 1.5 | |
Media | | | 1.5 | |
Gas Utilities | | | 1.5 | |
Aerospace & Defense | | | 1.3 | |
Beverages | | | 1.3 | |
Construction & Engineering | | | 1.3 | |
Commercial Services & Supplies | | | 1.3 | |
Real Estate Management & Development | | | 1.2 | |
Internet Software & Services | | | 1.2 | |
Specialty Retail | | | 1.1 | |
Trading Companies & Distributors | | | 1.1 | |
Biotechnology | | | 1.0 | |
Automobiles | | | 1.0 | |
Others (each less than 1.0%) | | | 11.3 | |
Short-Term Investment | | | 0.5 | |
SEE NOTES TO FINANCIAL STATEMENTS.
| | | | | | |
| | | |
| 50 | | | | JPMORGAN EXCHANGE-TRADED FUNDS | | OCTOBER 31, 2017 |
| | |
| * | | — Non-income producing security. |
| (a) | | — Securities exempt from registration under Rule 144A or section 4(2), of the Securities Act of 1933. Under procedures approved by the Board of Trustees, such securities have been determined to be liquid by the investment adviser and may be resold, normally to qualified institutional buyers in transactions exempt from registration. |
| (b) | | — Represents less than 0.05% of net assets. |
| (c) | | — Affiliated company as defined under the Investment Company Act of 1940. |
| (d) | | — The rate shown was the current yield as of October 31, 2017. |
Abbreviations
| | |
| ADR | | — American Depositary Receipt |
| OYJ | | — Public Limited Company |
| Preference | | — A special type of equity investment that shares in the earnings of the company, has limited voting rights, and may have a dividend preference. Preference shares may also have liquidation preference. |
| REIT | | — Real Estate Investment Trust |
| SCA | | — Limited partnership with share capital |
SEE NOTES TO FINANCIAL STATEMENTS.
| | | | | | | | |
| | | |
| OCTOBER 31, 2017 | | JPMORGAN EXCHANGE-TRADED FUNDS | | | | | 51 | |
JPMorgan Diversified Return International Currency Hedged ETF
SCHEDULE OF PORTFOLIO INVESTMENTS
AS OF OCTOBER 31, 2017
| | | | | | | | |
| SHARES | | | INVESTMENTS | | VALUE($) | |
| | Exchange Traded Funds — 99.7% | | | | |
| | | | United States | | | | |
| | 811,196 | | | JPMorgan Diversified Return International Equity Fund (a) | | | 48,144,483 | |
| | | | | | | | |
| | | | Total Investments — 99.7%
(Cost $41,516,202) | | | 48,144,483 | |
| | | | Other Assets Less Liabilities —0.3% | | | 129,984 | |
| | | | | | | | |
| | | | Net Assets —100.0% | | $ | 48,274,467 | |
| | | | | | | | |
Percentages indicated are based on net assets.
| | |
| (a) | | — Affiliated company as defined under the Investment Company Act of 1940. |
| | | | | | | | | | | | | | | | | | | | | | |
| Forward foreign currency exchange contracts outstanding as of October 31, 2017: | |
| CURRENCY PURCHASED | | | CURRENCY SOLD | | | COUNTERPARTY | | SETTLEMENT
DATE | | | UNREALIZED
APPRECIATION
(DEPRECIATION) ($) | |
| | EUR | | | | 70,497 | | | USD | | | 81,967 | | | Royal Bank of Canada | | | 11/03/2017 | | | | 155 | |
| | GBP | | | | 7,017,965 | | | USD | | | 9,319,408 | | | National Australia Bank Ltd. | | | 11/03/2017 | | | | 1,762 | |
| | GBP | | | | 295,057 | | | USD | | | 388,321 | | | Royal Bank of Canada | | | 11/03/2017 | | | | 3,570 | |
| | HKD | | | | 186,585 | | | USD | | | 23,908 | | | HSBC Bank, NA | | | 11/03/2017 | | | | 9 | |
| | HKD | | | | 19,537,765 | | | USD | | | 2,504,219 | | | Morgan Stanley | | | 11/03/2017 | | | | 164 | |
| | KRW | | | | 250,904,364 | | | USD | | | 220,161 | | | Goldman Sachs International** | | | 11/03/2017 | | | | 3,856 | |
| | NOK | | | | 4,648,549 | | | USD | | | 567,969 | | | Citibank, NA | | | 11/03/2017 | | | | 1,161 | |
| | SEK | | | | 11,768,988 | | | USD | | | 1,405,635 | | | Goldman Sachs International | | | 11/03/2017 | | | | 253 | |
| | SGD | | | | 112,548 | | | USD | | | 82,470 | | | HSBC Bank, NA | | | 11/03/2017 | | | | 98 | |
| | USD | | | | 3,200,618 | | | AUD | | | 4,081,369 | | | Australia & New Zealand Banking Group Ltd. | | | 11/03/2017 | | | | 76,971 | |
| | USD | | | | 105,716 | | | AUD | | | 135,660 | | | Goldman Sachs International | | | 11/03/2017 | | | | 1,890 | |
| | USD | | | | 799,547 | | | CHF | | | 772,198 | | | Australia & New Zealand Banking Group Ltd. | | | 11/03/2017 | | | | 25,482 | |
| | USD | | | | 12,296 | | | CHF | | | 11,875 | | | Goldman Sachs International | | | 11/03/2017 | | | | 392 | |
| | USD | | | | 34,083 | | | CHF | | | 33,116 | | | Royal Bank of Canada | | | 11/03/2017 | | | | 887 | |
| | USD | | | | 533,910 | | | DKK | | | 3,355,102 | | | Royal Bank of Canada | | | 11/03/2017 | | | | 8,682 | |
| | USD | | | | 499,716 | | | EUR | | | 421,270 | | | Goldman Sachs International | | | 11/03/2017 | | | | 8,974 | |
| | USD | | | | 8,342,613 | | | EUR | | | 7,045,447 | | | Royal Bank of Canada | | | 11/03/2017 | | | | 135,302 | |
| | USD | | | | 9,748,682 | | | GBP | | | 7,260,647 | | | Royal Bank of Canada | | | 11/03/2017 | | | | 105,185 | |
| | USD | | | | 30,607 | | | NOK | | | 243,553 | | | Merrill Lynch International | | | 11/03/2017 | | | | 788 | |
| | USD | | | | 553,655 | | | NOK | | | 4,404,996 | | | Royal Bank of Canada | | | 11/03/2017 | | | | 14,343 | |
| | USD | | | | 271,552 | | | NZD | | | 375,747 | | | Australia & New Zealand Banking Group Ltd. | | | 11/03/2017 | | | | 14,434 | |
| | USD | | | | 45,204 | | | SEK | | | 368,334 | | | Goldman Sachs International | | | 11/03/2017 | | | | 1,204 | |
| | USD | | | | 1,400,179 | | | SEK | | | 11,400,653 | | | Royal Bank of Canada | | | 11/03/2017 | | | | 38,291 | |
| | USD | | | | 1,221,371 | | | SGD | | | 1,658,249 | | | Australia & New Zealand Banking Group Ltd. | | | 11/03/2017 | | | | 4,842 | |
| | USD | | | | 38,714 | | | SGD | | | 52,397 | | | Royal Bank of Canada | | | 11/03/2017 | | | | 274 | |
| | USD | | | | 372,861 | | | JPY | | | 41,857,608 | | | Goldman Sachs International | | | 11/06/2017 | | | | 4,677 | |
| | USD | | | | 479,193 | | | JPY | | | 53,852,649 | | | National Australia Bank Ltd. | | | 11/06/2017 | | | | 5,499 | |
| | USD | | | | 11,119,748 | | | JPY | | | 1,249,603,865 | | | Royal Bank of Canada | | | 11/06/2017 | | | | 128,098 | |
| | EUR | | | | 41,336 | | | USD | | | 48,234 | | | Citibank, NA | | | 12/05/2017 | | | | 6 | |
| | USD | | | | 191,464 | | | AUD | | | 249,767 | | | Morgan Stanley | | | 12/05/2017 | | | | 371 | |
| | USD | | | | 3,005,949 | | | AUD | | | 3,921,778 | | | National Australia Bank Ltd. | | | 12/05/2017 | | | | 5,469 | |
| | USD | | | | 27,872 | | | AUD | | | 36,397 | | | Royal Bank of Canada | | | 12/05/2017 | | | | 25 | |
| | USD | | | | 19,225 | | | CHF | | | 19,136 | | | HSBC Bank, NA | | | 12/05/2017 | | | | — | (a) |
| | USD | | | | 821,727 | | | CHF | | | 817,189 | | | State Street Corp. | | | 12/05/2017 | | | | 755 | |
| | USD | | | | 72,238 | | | EUR | | | 61,887 | | | Goldman Sachs International | | | 12/05/2017 | | | | 15 | |
| | USD | | | | 23,227 | | | HKD | | | 181,118 | | | Merrill Lynch International | | | 12/05/2017 | | | | — | (a) |
| | USD | | | | 508,298 | | | JPY | | | 57,688,655 | | | Citibank, NA | | | 12/05/2017 | | | | 180 | |
| | USD | | | | 11,794,823 | | | JPY | | | 1,338,342,109 | | | National Australia Bank Ltd. | | | 12/05/2017 | | | | 6,792 | |
SEE NOTES TO FINANCIAL STATEMENTS.
| | | | | | |
| | | |
| 52 | | | | JPMORGAN EXCHANGE-TRADED FUNDS | | OCTOBER 31, 2017 |
| | | | | | | | | | | | | | | | | | | | | | |
| CURRENCY PURCHASED | | | CURRENCY SOLD | | | COUNTERPARTY | | SETTLEMENT
DATE | | | UNREALIZED
APPRECIATION
(DEPRECIATION) ($) | |
| | USD | | | | 105,474 | | | JPY | | | 11,974,306 | | | Royal Bank of Canada | | | 12/05/2017 | | | | 5 | |
| | USD | | | | 5,281,242 | | | KRW | | | 5,898,748,078 | | | Merrill Lynch International** | | | 12/05/2017 | | | | 4,777 | |
| | USD | | | | 257,208 | | | NZD | | | 375,747 | | | National Australia Bank Ltd. | | | 12/05/2017 | | | | 247 | |
| | USD | | | | 1,132,098 | | | SGD | | | 1,541,983 | | | HSBC Bank, NA | | | 12/05/2017 | | | | 571 | |
| | USD | | | | 102,487 | | | SGD | | | 139,604 | | | State Street Corp. | | | 12/05/2017 | | | | 44 | |
| | | | | | | | | | | | | | | | | | | | | | |
| | Total unrealized appreciation | | | | 606,500 | |
| | | | | | | | | | | | | | | | | | | | | | |
| | AUD | | | | 4,189,123 | | | USD | | | 3,212,140 | | | National Australia Bank Ltd. | | | 11/03/2017 | | | | (6,025 | ) |
| | AUD | | | | 27,906 | | | USD | | | 21,881 | | | Royal Bank of Canada | | | 11/03/2017 | | | | (524 | ) |
| | CHF | | | | 817,189 | | | USD | | | 820,065 | | | State Street Corp. | | | 11/03/2017 | | | | (900 | ) |
| | DKK | | | | 3,355,102 | | | USD | | | 525,283 | | | Citibank, NA | | | 11/03/2017 | | | | (55 | ) |
| | EUR | | | | 7,396,220 | | | USD | | | 8,616,818 | | | National Australia Bank Ltd. | | | 11/03/2017 | | | | (888 | ) |
| | GBP | | | | 177,641 | | | USD | | | 238,514 | | | National Australia Bank Ltd. | | | 11/03/2017 | | | | (2,573 | ) |
| | KRW | | | | 5,418,421,914 | | | USD | | | 4,851,000 | | | Merrill Lynch International** | | | 11/03/2017 | | | | (13,217 | ) |
| | NZD | | | | 375,747 | | | USD | | | 257,366 | | | National Australia Bank Ltd. | | | 11/03/2017 | | | | (247 | ) |
| | SGD | | | | 1,541,983 | | | USD | | | 1,131,812 | | | HSBC Bank, NA | | | 11/03/2017 | | | | (579 | ) |
| | SGD | | | | 56,115 | | | USD | | | 41,332 | | | National Australia Bank Ltd. | | | 11/03/2017 | | | | (165 | ) |
| | USD | | | | 304,501 | | | GBP | | | 230,017 | | | Royal Bank of Canada | | | 11/03/2017 | | | | (1,004 | ) |
| | USD | | | | 2,422,073 | | | HKD | | | 18,905,304 | | | Australia & New Zealand Banking Group Ltd. | | | 11/03/2017 | | | | (1,239 | ) |
| | USD | | | | 104,962 | | | HKD | | | 819,046 | | | HSBC Bank, NA | | | 11/03/2017 | | | | (25 | ) |
| | USD | | | | 111,692 | | | KRW | | | 125,636,802 | | | Citibank, NA** | | | 11/03/2017 | | | | (481 | ) |
| | USD | | | | 4,845,538 | | | KRW | | | 5,543,689,476 | | | Goldman Sachs International** | | | 11/03/2017 | | | | (104,090 | ) |
| | JPY | | | | 1,338,342,109 | | | USD | | | 11,780,745 | | | National Australia Bank Ltd. | | | 11/06/2017 | | | | (8,545 | ) |
| | JPY | | | | 6,972,013 | | | USD | | | 61,343 | | | Royal Bank of Canada | | | 11/06/2017 | | | | (17 | ) |
| | USD | | | | 564,674 | | | DKK | | | 3,600,269 | | | Citibank, NA | | | 12/05/2017 | | | | (20 | ) |
| | USD | | | | 8,631,107 | | | EUR | | | 7,396,220 | | | National Australia Bank Ltd. | | | 12/05/2017 | | | | (359 | ) |
| | USD | | | | 9,327,542 | | | GBP | | | 7,017,965 | | | National Australia Bank Ltd. | | | 12/05/2017 | | | | (2,554 | ) |
| | USD | | | | 145,287 | | | GBP | | | 109,308 | | | Royal Bank of Canada | | | 12/05/2017 | | | | (32 | ) |
| | USD | | | | 160,595 | | | HKD | | | 1,252,344 | | | Goldman Sachs International | | | 12/05/2017 | | | | (8 | ) |
| | USD | | | | 2,505,404 | | | HKD | | | 19,537,765 | | | Morgan Stanley | | | 12/05/2017 | | | | (156 | ) |
| | USD | | | | 47,639 | | | KRW | | | 53,283,638 | | | Goldman Sachs International** | | | 12/05/2017 | | | | (23 | ) |
| | USD | | | | 568,375 | | | NOK | | | 4,648,549 | | | Citibank, NA | | | 12/05/2017 | | | | (1,207 | ) |
| | USD | | | | 28,838 | | | NOK | | | 235,853 | | | Royal Bank of Canada | | | 12/05/2017 | | | | (61 | ) |
| | USD | | | | 1,408,034 | | | SEK | | | 11,768,988 | | | Goldman Sachs International | | | 12/05/2017 | | | | (496 | ) |
| | USD | | | | 65,254 | | | SEK | | | 545,372 | | | Royal Bank of Canada | | | 12/05/2017 | | | | (17 | ) |
| | | | | | | | | | | | | | | | | | | | | | |
| | Total unrealized depreciation | | | | (145,507 | ) |
| | | | | | | | | | | | | | | | | | | | | | |
| | Net unrealized appreciation | | | | 460,993 | |
| | | | | | | | | | | | | | | | | | | | | | |
| | |
| ** | | — Non-deliverable forward. |
| (a) | | — Amounts rounds to less than 1. |
Abbreviations
| | |
| AUD | | — Australian Dollar |
| CHF | | — Swiss Franc |
| DKK | | — Danish Krone |
| EUR | | — Euro |
| GBP | | — British Pound |
| | |
| HKD | | — Hong Kong Dollar |
| JPY | | — Japanese Yen |
| KRW | | — South Korean Won |
| NOK | | — Norwegian Krone |
| NZD | | — New Zealand Dollar |
| SEK | | — Swedish Krona |
| SGD | | — Singapore Dollar |
| USD | | — United States Dollar |
SEE NOTES TO FINANCIAL STATEMENTS.
| | | | | | | | |
| | | |
| OCTOBER 31, 2017 | | JPMORGAN EXCHANGE-TRADED FUNDS | | | | | 53 | |
JPMorgan Diversified Return International Equity ETF
SCHEDULE OF PORTFOLIO INVESTMENTS
AS OF OCTOBER 31, 2017
| | | | | | | | |
SHARES | | | INVESTMENTS | | VALUE($) | |
| | Common Stocks — 97.8% | |
| | | | Australia — 6.7% | |
| | 236,648 | | | AGL Energy Ltd. | | | 4,581,834 | |
| | 204,022 | | | Ansell Ltd. | | | 3,755,452 | |
| | 368,156 | | | APA Group | | | 2,416,089 | |
| | 157,579 | | | Bendigo & Adelaide Bank Ltd. | | | 1,374,438 | |
| | 134,674 | | | Boral Ltd. | | | 739,002 | |
| | 36,027 | | | Cochlear Ltd. | | | 4,852,995 | |
| | 75,352 | | | Computershare Ltd. | | | 900,799 | |
| | 68,107 | | | Crown Resorts Ltd. | | | 605,617 | |
| | 51,660 | | | CSL Ltd. | | | 5,499,779 | |
| | 638,189 | | | CSR Ltd. | | | 2,321,300 | |
| | 577,785 | | | Dexus, REIT | | | 4,326,450 | |
| | 480,824 | | | Downer EDI Ltd. | | | 2,580,051 | |
| | 1,025,599 | | | GPT Group (The), REIT | | | 4,004,781 | |
| | 527,133 | | | Harvey Norman Holdings Ltd. | | | 1,526,931 | |
| | 1,551,353 | | | Healthscope Ltd. | | | 2,330,344 | |
| | 448,611 | | | Incitec Pivot Ltd. | | | 1,315,884 | |
| | 469,099 | | | Metcash Ltd. | | | 969,065 | |
| | 579,270 | | | Mirvac Group, REIT | | | 1,070,693 | |
| | 807,194 | | | Origin Energy Ltd.* | | | 4,916,207 | |
| | 758,324 | | | Qantas Airways Ltd. | | | 3,579,010 | |
| | 76,264 | | | Ramsay Health Care Ltd. | | | 3,910,030 | |
| | 237,895 | | | Sonic Healthcare Ltd. | | | 3,973,261 | |
| | 168,486 | | | Star Entertainment Grp Ltd. (The) | | | 742,956 | |
| | 899,592 | | | Tabcorp Holdings Ltd. | | | 3,095,265 | |
| | 1,005,026 | | | Tatts Group Ltd. | | | 3,212,714 | |
| | 519,756 | | | TPG Telecom Ltd. | | | 2,151,286 | |
| | 88,942 | | | Transurban Group | | | 826,789 | |
| | 1,703,117 | | | Vicinity Centres, REIT | | | 3,461,797 | |
| | 25,973 | | | Wesfarmers Ltd. | | | 831,937 | |
| | 83,135 | | | Woodside Petroleum Ltd. | | | 1,959,743 | |
| | | | | | | | |
| | | | | | | 77,832,499 | |
| | | | | | | | |
| | | | Austria — 0.8% | |
| | 77,235 | | | OMV AG | | | 4,635,138 | |
| | 71,873 | | | voestalpine AG | | | 3,951,459 | |
| | | | | | | | |
| | | | | | | 8,586,597 | |
| | | | | | | | |
| | | | Belgium — 1.0% | |
| | 59,369 | | | Colruyt SA | | | 3,036,390 | |
| | 21,620 | | | Groupe Bruxelles Lambert SA | | | 2,322,134 | |
| | 105,229 | | | Proximus SADP | | | 3,494,280 | |
| | 60,577 | | | Umicore SA | | | 2,707,198 | |
| | | | | | | | |
| | | | | | | 11,560,002 | |
| | | | | | | | |
| | | | Chile — 0.4% | |
| | 369,721 | | | Antofagasta plc | | | 4,685,702 | |
| | | | | | | | |
| | | | | | | | |
SHARES | | | INVESTMENTS | | VALUE($) | |
| | | | | | | | |
| | | | China — 0.6% | |
| | 2,800,000 | | | FIH Mobile Ltd. | | | 879,246 | |
| | 3,515,800 | | | Semiconductor Manufacturing International Corp.* | | | 5,394,760 | |
| | 2,608,400 | | | Xinyi Solar Holdings Ltd. | | | 903,364 | |
| | | | | | | | |
| | | | | | | 7,177,370 | |
| | | | | | | | |
| | | | Denmark — 1.2% | |
| | 47,123 | | | Chr Hansen Holding A/S | | | 4,123,728 | |
| | 5,019 | | | DSV A/S | | | 388,099 | |
| | 39,455 | | | H Lundbeck A/S | | | 2,345,515 | |
| | 7,980 | | | ISS A/S | | | 337,939 | |
| | 522,642 | | | TDC A/S | | | 3,089,965 | |
| | 117,160 | | | William Demant Holding A/S* | | | 3,381,144 | |
| | | | | | | | |
| | | | | | | 13,666,390 | |
| | | | | | | | |
| | | | Finland — 1.6% | |
| | 77,412 | | | Elisa OYJ | | | 3,117,162 | |
| | 106,152 | | | Fortum OYJ | | | 2,253,018 | |
| | 62,242 | | | Kesko OYJ, Class B | | | 3,178,618 | |
| | 96,934 | | | Neste OYJ | | | 5,396,446 | |
| | 22,346 | | | Nokian Renkaat OYJ | | | 1,024,501 | |
| | 60,679 | | | Orion OYJ, Class B | | | 2,486,923 | |
| | 50,623 | | | UPM-Kymmene OYJ | | | 1,520,324 | |
| | | | | | | | |
| | | | | | | 18,976,992 | |
| | | | | | | | |
| | | | France — 5.0% | |
| | 25,397 | | | Arkema SA | | | 3,208,440 | |
| | 29,005 | | | Atos SE | | | 4,504,936 | |
| | 38,392 | | | Capgemini SE | | | 4,664,018 | |
| | 21,112 | | | Casino Guichard Perrachon SA | | | 1,205,485 | |
| | 14,507 | | | Christian Dior SE | | | 4,979,335 | |
| | 34,408 | | | Dassault Systemes SE | | | 3,652,628 | |
| | 36,608 | | | Eiffage SA | | | 3,823,914 | |
| | 34,135 | | | Eutelsat Communications SA | | | 855,013 | |
| | 5,817 | | | Gecina SA, REIT | | | 943,887 | |
| | 3,832 | | | Iliad SA | | | 956,540 | |
| | 28,744 | | | Ingenico Group SA | | | 2,791,285 | |
| | 5,739 | | | Ipsen SA | | | 693,889 | |
| | 91,987 | | | Lagardere SCA | | | 3,029,247 | |
| | 5,697 | | | Orpea | | | 682,552 | |
| | 91,643 | | | SCOR SE | | | 3,804,416 | |
| | 19,605 | | | Sodexo SA | | | 2,494,204 | |
| | 39,747 | | | Thales SA | | | 4,142,173 | |
| | 66,053 | | | TOTAL SA | | | 3,681,671 | |
| | 19,160 | | | Valeo SA | | | 1,297,213 | |
| | 31,612 | | | Vinci SA | | | 3,097,270 | |
| | 130,825 | | | Vivendi SA | | | 3,248,621 | |
| | | | | | | | |
| | | | | | | 57,756,737 | |
| | | | | | | | |
SEE NOTES TO FINANCIAL STATEMENTS.
| | | | | | |
| | | |
| 54 | | | | JPMORGAN EXCHANGE-TRADED FUNDS | | OCTOBER 31, 2017 |
| | | | | | | | |
SHARES | | | INVESTMENTS | | VALUE($) | |
| | Common Stocks — continued | |
| | | | Germany — 4.2% | |
| | 37,085 | | | Axel Springer SE | | | 2,496,936 | |
| | 36,236 | | | Beiersdorf AG | | | 4,076,207 | |
| | 59,151 | | | Deutsche Telekom AG (Registered) | | | 1,071,067 | |
| | 97,017 | | | Evonik Industries AG | | | 3,529,083 | |
| | 47,386 | | | Fraport AG Frankfurt Airport Services Worldwide | | | 4,502,794 | |
| | 45,757 | | | Fresenius Medical Care AG & Co. KGaA | | | 4,430,284 | |
| | 50,390 | | | Fresenius SE & Co. KGaA | | | 4,218,463 | |
| | 32,030 | | | Hannover Rueck SE | | | 4,030,686 | |
| | 3,552 | | | HOCHTIEF AG | | | 627,439 | |
| | 178,980 | | | Infineon Technologies AG | | | 4,950,239 | |
| | 15,607 | | | Innogy SE (a) | | | 725,819 | |
| | 32,447 | | | Merck KGaA | | | 3,481,334 | |
| | 13,438 | | | OSRAM Licht AG | | | 1,028,945 | |
| | 33,891 | | | SAP SE | | | 3,872,475 | |
| | 40,131 | | | Suedzucker AG | | | 795,272 | |
| | 439,147 | | | Telefonica Deutschland Holding AG | | | 2,240,029 | |
| | 43,016 | | | TUI AG | | | 776,918 | |
| | 65,395 | | | Uniper SE | | | 1,837,508 | |
| | | | | | | | |
| | | | | | | 48,691,498 | |
| | | | | | | | |
| | | | Hong Kong — 5.4% | |
| | 234,400 | | | ASM Pacific Technology Ltd. | | | 3,420,004 | |
| | 1,110,000 | | | Cathay Pacific Airways Ltd.* | | | 1,898,916 | |
| | 413,542 | | | CK Hutchison Holdings Ltd. | | | 5,252,693 | |
| | 438,000 | | | CK Infrastructure Holdings Ltd. | | | 3,813,699 | |
| | 468,000 | | | CLP Holdings Ltd. | | | 4,763,274 | |
| | 726,000 | | | First Pacific Co. Ltd. | | | 552,778 | |
| | 2,394,061 | | | Hong Kong & China Gas Co. Ltd. | | | 4,538,241 | |
| | 3,413,300 | | | Hutchison Port Holdings Trust | | | 1,467,736 | |
| | 73,940 | | | I-CABLE Communications Ltd.* | | | 2,316 | |
| | 18,500 | | | Jardine Matheson Holdings Ltd. | | | 1,185,139 | |
| | 48,600 | | | Jardine Strategic Holdings Ltd. | | | 2,038,533 | |
| | 563,500 | | | Link REIT | | | 4,737,518 | |
| | 389,000 | | | Melco International Development Ltd. | | | 1,066,120 | |
| | 761,500 | | | MTR Corp. Ltd. | | | 4,414,785 | |
| | 6,257,000 | | | PCCW Ltd. | | | 3,449,881 | |
| | 479,000 | | | Power Assets Holdings Ltd. | | | 4,152,507 | |
| | 322,000 | | | Swire Pacific Ltd., Class A | | | 3,182,028 | |
| | 806,000 | | | Techtronic Industries Co. Ltd. | | | 4,731,394 | |
| | 314,000 | | | Wheelock & Co. Ltd. | | | 2,187,465 | |
| | 2,232,000 | | | Xinyi Glass Holdings Ltd. | | | 2,162,860 | |
| | 1,001,500 | | | Yue Yuen Industrial Holdings Ltd. | | | 3,836,244 | |
| | | | | | | | |
| | | | | | | 62,854,131 | |
| | | | | | | | |
| | | | Ireland — 0.1% | |
| | 6,320 | | | Ryanair Holdings plc, ADR* | | | 708,535 | |
| | | | | | | | |
| | | | | | | | |
SHARES | | | INVESTMENTS | | VALUE($) | |
| | | | | | | | |
| | | | Italy — 1.2% | |
| | 546,669 | | | Davide Campari-Milano SpA | | | 4,377,047 | |
| | 111,759 | | | Italgas SpA | | | 652,865 | |
| | 862,979 | | | Parmalat SpA | | | 3,267,033 | |
| | 35,979 | | | Recordati SpA | | | 1,672,634 | |
| | 712,425 | | | Terna Rete Elettrica Nazionale SpA | | | 4,298,717 | |
| | | | | | | | |
| | | | | | | 14,268,296 | |
| | | | | | | | |
| | | | Japan — 25.7% | |
| | 166,800 | | | Alfresa Holdings Corp. | | | 3,187,067 | |
| | 96,600 | | | ANA Holdings, Inc. | | | 3,712,822 | |
| | 92,000 | | | Aozora Bank Ltd. | | | 3,601,045 | |
| | 148,300 | | | Brother Industries Ltd. | | | 3,608,599 | |
| | 109,500 | | | Canon Marketing Japan, Inc. | | | 2,754,382 | |
| | 141,700 | | | Canon, Inc. | | | 5,323,258 | |
| | 121,700 | | | Capcom Co. Ltd. | | | 3,096,344 | |
| | 20,800 | | | Central Japan Railway Co. | | | 3,778,252 | |
| | 278,700 | | | Chubu Electric Power Co., Inc. | | | 3,594,251 | |
| | 288,800 | | | Chugoku Electric Power Co., Inc. (The) | | | 3,220,163 | |
| | 176,300 | | | COMSYS Holdings Corp. | | | 4,464,699 | |
| | 47,300 | | | Credit Saison Co. Ltd. | | | 952,401 | |
| | 39,100 | | | Denka Co. Ltd. | | | 1,306,347 | |
| | 89,800 | | | DIC Corp. | | | 3,333,358 | |
| | 124,400 | | | Electric Power Development Co. Ltd. | | | 3,135,013 | |
| | 198,000 | | | Fuji Electric Co. Ltd. | | | 1,434,534 | |
| | 114,900 | | | FUJIFILM Holdings Corp. | | | 4,700,305 | |
| | 527,700 | | | Fujikura Ltd. | | | 4,605,623 | |
| | 113,100 | | | Gree, Inc. | | | 767,785 | |
| | 269,200 | | | Gunma Bank Ltd. (The) | | | 1,733,062 | |
| | 266,100 | | | Hachijuni Bank Ltd. (The) | | | 1,666,442 | |
| | 106,300 | | | Hankyu Hanshin Holdings, Inc. | | | 4,144,355 | |
| | 36,900 | | | Hikari Tsushin, Inc. | | | 4,777,112 | |
| | 15,500 | | | Hitachi Capital Corp. | | | 378,924 | |
| | 149,300 | | | Hitachi Chemical Co. Ltd. | | | 4,257,411 | |
| | 98,500 | | | Hitachi High-Technologies Corp. | | | 4,122,115 | |
| | 42,200 | | | Hitachi Kokusai Electric, Inc. | | | 1,168,990 | |
| | 124,200 | | | Idemitsu Kosan Co. Ltd. | | | 3,630,345 | |
| | 42,700 | | | Iida Group Holdings Co. Ltd. | | | 819,127 | |
| | 364,000 | | | Inpex Corp. | | | 3,897,418 | |
| | 92,500 | | | Itochu Techno-Solutions Corp. | | | 3,603,074 | |
| | 114,600 | | | Japan Airlines Co. Ltd. | | | 3,922,452 | |
| | 93,800 | | | Japan Petroleum Exploration Co. Ltd. | | | 1,935,589 | |
| | 906,100 | | | JXTG Holdings, Inc. | | | 4,678,920 | |
| | 38,500 | | | Kagome Co. Ltd. | | | 1,282,131 | |
| | 48,000 | | | Kajima Corp. | | | 497,832 | |
| | 375,000 | | | Kaneka Corp. | | | 3,096,724 | |
| | 278,600 | | | Kansai Electric Power Co., Inc. (The) | | | 3,815,177 | |
SEE NOTES TO FINANCIAL STATEMENTS.
| | | | | | | | |
| | | |
| OCTOBER 31, 2017 | | JPMORGAN EXCHANGE-TRADED FUNDS | | | | | 55 | |
JPMorgan Diversified Return International Equity ETF
SCHEDULE OF PORTFOLIO INVESTMENTS
AS OF OCTOBER 31, 2017 (continued)
| | | | | | | | |
SHARES | | | INVESTMENTS | | VALUE($) | |
| | Common Stocks — continued | |
| | | | Japan — continued | |
| | 83,100 | | | Kawasaki Kisen Kaisha Ltd.* | | | 2,169,808 | |
| | 188,700 | | | KDDI Corp. | | | 5,027,466 | |
| | 2,300 | | | Keio Corp. | | | 100,346 | |
| | 27,500 | | | Keisei Electric Railway Co. Ltd. | | | 830,707 | |
| | 62,000 | | | K’s Holdings Corp. | | | 1,422,931 | |
| | 180,500 | | | Kuraray Co. Ltd. | | | 3,554,871 | |
| | 322,300 | | | Kyushu Electric Power Co., Inc. | | | 3,676,185 | |
| | 272,600 | | | Leopalace21 Corp. | | | 2,035,570 | |
| | 76,800 | | | Lintec Corp. | | | 2,134,414 | |
| | 114,200 | | | Matsui Securities Co. Ltd. | | | 960,349 | |
| | 226,100 | | | Mebuki Financial Group, Inc. | | | 943,268 | |
| | 142,000 | | | Medipal Holdings Corp. | | | 2,637,120 | |
| | 54,300 | | | Miraca Holdings, Inc. | | | 2,526,416 | |
| | 169,600 | | | Mitsubishi Gas Chemical Co., Inc. | | | 4,148,871 | |
| | 196,000 | | | Mitsubishi Tanabe Pharma Corp. | | | 4,313,840 | |
| | 171,600 | | | Mitsubishi UFJ Lease & Finance Co. Ltd. | | | 905,350 | |
| | 53,100 | | | Mochida Pharmaceutical Co. Ltd. | | | 3,887,408 | |
| | 35,200 | | | Nagoya Railroad Co. Ltd. | | | 790,800 | |
| | 150,000 | | | NH Foods Ltd. | | | 4,314,744 | |
| | 33,100 | | | Nichirei Corp. | | | 852,071 | |
| | 15,200 | | | Nifco, Inc. | | | 992,274 | |
| | 149,000 | | | Nippo Corp. | | | 3,111,210 | |
| | 35,400 | | | Nippon Express Co. Ltd. | | | 2,246,218 | |
| | 148,700 | | | Nippon Paper Industries Co. Ltd. | | | 2,958,293 | |
| | 35,800 | | | Nippon Shokubai Co. Ltd. | | | 2,700,425 | |
| | 102,300 | | | Nippon Telegraph & Telephone Corp. | | | 4,945,952 | |
| | 300,000 | | | Nipro Corp. | | | 4,373,715 | |
| | 248,500 | | | Nisshin Seifun Group, Inc. | | | 4,367,248 | |
| | 49,900 | | | Nissin Foods Holdings Co. Ltd. | | | 3,142,057 | |
| | 71,300 | | | Nomura Real Estate Holdings, Inc. | | | 1,569,354 | |
| | 76,300 | | | Nomura Research Institute Ltd. | | | 3,234,748 | |
| | 191,100 | | | NTT DOCOMO, Inc. | | | 4,628,205 | |
| | 84,300 | | | NTT Urban Development Corp. | | | 872,569 | |
| | 17,900 | | | Oracle Corp. Japan | | | 1,514,618 | |
| | 206,700 | | | Osaka Gas Co. Ltd. | | | 4,003,583 | |
| | 17,400 | | | Otsuka Corp. | | | 1,186,132 | |
| | 831,600 | | | Resona Holdings, Inc. | | | 4,495,075 | |
| | 35,700 | | | Sankyo Co. Ltd. | | | 1,152,310 | |
| | 19,500 | | | Sapporo Holdings Ltd. | | | 617,928 | |
| | 35,400 | | | Sawai Pharmaceutical Co. Ltd. | | | 2,007,899 | |
| | 85,700 | | | SBI Holdings, Inc. | | | 1,352,490 | |
| | 36,600 | | | SCSK Corp. | | | 1,578,332 | |
| | 78,500 | | | Sega Sammy Holdings, Inc. | | | 1,105,071 | |
| | 142,800 | | | Sekisui Chemical Co. Ltd. | | | 2,882,320 | |
| | 248,400 | | | Sekisui House Ltd. | | | 4,644,701 | |
| | 93,300 | | | Shimachu Co. Ltd. | | | 2,627,633 | |
| | | | | | | | |
SHARES | | | INVESTMENTS | | VALUE($) | |
| | | | | | | | |
| | | | Japan — continued | |
| | 27,300 | | | Shimamura Co. Ltd. | | | 3,041,445 | |
| | 6,400 | | | Showa Denko KK | | | 214,444 | |
| | 380,300 | | | Showa Shell Sekiyu KK | | | 4,486,493 | |
| | 181,400 | | | SKY Perfect JSAT Holdings, Inc. | | | 841,106 | |
| | 98,200 | | | Skylark Co. Ltd. | | | 1,468,790 | |
| | 64,000 | | | SoftBank Group Corp. | | | 5,671,820 | |
| | 1,523,900 | | | Sojitz Corp. | | | 4,599,159 | |
| | 50,400 | | | Square Enix Holdings Co. Ltd. | | | 2,032,406 | |
| | 44,800 | | | Sumitomo Dainippon Pharma Co. Ltd. | | | 639,398 | |
| | 754,000 | | | Sumitomo Osaka Cement Co. Ltd. | | | 3,453,136 | |
| | 55,800 | | | Suzuken Co. Ltd. | | | 2,011,471 | |
| | 87,800 | | | Taisei Corp. | | | 4,864,736 | |
| | 22,800 | | | Taisho Pharmaceutical Holdings Co. Ltd. | | | 1,736,365 | |
| | 86,000 | | | Takashimaya Co. Ltd. | | | 791,278 | |
| | 67,700 | | | Tobu Railway Co. Ltd. | | | 1,986,106 | |
| | 34,100 | | | Toho Co. Ltd. | | | 1,129,778 | |
| | 53,000 | | | Toho Gas Co. Ltd. | | | 1,481,807 | |
| | 245,700 | | | Tohoku Electric Power Co., Inc. | | | 3,223,297 | |
| | 98,000 | | | Toyo Suisan Kaisha Ltd. | | | 3,770,067 | |
| | 74,600 | | | Toyota Industries Corp. | | | 4,591,743 | |
| | 108,700 | | | Tsumura & Co. | | | 4,039,992 | |
| | 122,700 | | | Ube Industries Ltd. | | | 3,769,352 | |
| | 262,000 | | | Yamada Denki Co. Ltd. | | | 1,393,631 | |
| | 163,000 | | | Yamaguchi Financial Group, Inc. | | | 1,974,453 | |
| | 6,000 | | | Yamaha Corp. | | | 235,751 | |
| | 147,900 | | | Yokohama Rubber Co. Ltd. (The) | | | 3,325,098 | |
| | 98,900 | | | Zeon Corp. | | | 1,316,728 | |
| | | | | | | | |
| | | | | | | 297,636,193 | |
| | | | | | | | |
| | | | Jordan — 0.2% | |
| | 161,112 | | | Hikma Pharmaceuticals plc | | | 2,490,310 | |
| | | | | | | | |
| | | | Luxembourg — 0.1% | |
| | 17,236 | | | RTL Group SA | | | 1,280,647 | |
| | | | | | | | |
| | | | Netherlands — 1.9% | |
| | 13,752 | | | Boskalis Westminster | | | 491,586 | |
| | 43,714 | | | Heineken Holding NV | | | 4,057,631 | |
| | 63,772 | | | NN Group NV | | | 2,670,616 | |
| | 319,996 | | | Royal Dutch Shell plc, Class A | | | 10,073,408 | |
| | 90,528 | | | Wolters Kluwer NV | | | 4,437,013 | |
| | | | | | | | |
| | | | | | | 21,730,254 | |
| | | | | | | | |
| | | | New Zealand — 0.5% | |
| | 66,985 | | | Fisher & Paykel Healthcare Corp. Ltd. | | | 607,566 | |
| | 329,638 | | | Fletcher Building Ltd. | | | 1,662,768 | |
| | 1,568,899 | | | Spark New Zealand Ltd. | | | 3,952,868 | |
| | | | | | | | |
| | | | | | | 6,223,202 | |
| | | | | | | | |
SEE NOTES TO FINANCIAL STATEMENTS.
| | | | | | |
| | | |
| 56 | | | | JPMORGAN EXCHANGE-TRADED FUNDS | | OCTOBER 31, 2017 |
| | | | | | | | |
SHARES | | | INVESTMENTS | | VALUE($) | |
| | Common Stocks — continued | |
| | | | Norway — 1.2% | |
| | 208,101 | | | Marine Harvest ASA* | | | 4,063,676 | |
| | 301,342 | | | Norsk Hydro ASA | | | 2,331,892 | |
| | 240,697 | | | Orkla ASA | | | 2,357,672 | |
| | 98,308 | | | Telenor ASA | | | 2,087,447 | |
| | 74,533 | | | Yara International ASA | | | 3,539,774 | |
| | | | | | | | |
| | | | | | | 14,380,461 | |
| | | | | | | | |
| | | | Portugal — 0.7% | |
| | 896,418 | | | EDP — Energias de Portugal SA | | | 3,196,825 | |
| | 208,461 | | | Galp Energia SGPS SA | | | 3,875,723 | |
| | 39,248 | | | Jeronimo Martins SGPS SA | | | 713,103 | |
| | | | | | | | |
| | | | | | | 7,785,651 | |
| | | | | | | | |
| | | | Singapore — 2.6% | |
| | 649,500 | | | Ascendas REIT | | | 1,305,920 | |
| | 1,971,500 | | | CapitaLand Mall Trust, REIT | | | 2,922,688 | |
| | 905,500 | | | ComfortDelGro Corp. Ltd. | | | 1,342,365 | |
| | 9,332,800 | | | Golden Agri-Resources Ltd. | | | 2,704,951 | |
| | 764,100 | | | Keppel Corp. Ltd. | | | 4,205,812 | |
| | 912,100 | | | Sembcorp Industries Ltd. | | | 2,209,061 | |
| | 1,804,100 | | | Singapore Telecommunications Ltd. | | | 4,964,825 | |
| | 924,500 | | | StarHub Ltd. | | | 1,784,311 | |
| | 1,028,600 | | | Suntec REIT | | | 1,472,523 | |
| | 233,300 | | | Venture Corp. Ltd. | | | 3,334,951 | |
| | 1,537,900 | | | Wilmar International Ltd. | | | 3,826,990 | |
| | | | | | | | |
| | | | | | | 30,074,397 | |
| | | | | | | | |
| | | | South Africa — 0.6% | |
| | 268,452 | | | Mediclinic International plc | | | 2,075,089 | |
| | 184,507 | | | Mondi plc | | | 4,462,160 | |
| | | | | | | | |
| | | | | | | 6,537,249 | |
| | | | | | | | |
| | | | South Korea — 11.1% | |
| | 49,518 | | | Celltrion Healthcare Co. Ltd.* | | | 2,603,303 | |
| | 6,955 | | | CJ CheilJedang Corp. | | | 2,275,866 | |
| | 6,106 | | | CJ Corp. | | | 1,017,969 | |
| | 14,806 | | | Daelim Industrial Co. Ltd. | | | 1,103,482 | |
| | 9,933 | | | E-MART, Inc. | | | 1,988,380 | |
| | 63,555 | | | GS Holdings Corp. | | | 3,763,108 | |
| | 21,765 | | | Hankook Tire Co. Ltd. | | | 1,050,503 | |
| | 118,635 | | | Hanwha Chemical Corp. | | | 3,231,658 | |
| | 28,267 | | | Hanwha Corp. | | | 1,127,894 | |
| | 20,932 | | | Hanwha Techwin Co. Ltd.* | | | 717,489 | |
| | 18,008 | | | Hyosung Corp. | | | 2,164,235 | |
| | 20,746 | | | Hyundai Department Store Co. Ltd. | | | 1,694,226 | |
| | 38,574 | | | Hyundai Engineering & Construction Co. Ltd. | | | 1,304,924 | |
| | 7,528 | | | Hyundai Mipo Dockyard Co. Ltd.* | | | 730,148 | |
| | | | | | | | |
SHARES | | | INVESTMENTS | | VALUE($) | |
| | | | | | | | |
| | | | South Korea — continued | |
| | 75,311 | | | Hyundai Steel Co. | | | 3,870,625 | |
| | 217,450 | | | Industrial Bank of Korea | | | 2,979,340 | |
| | 17,042 | | | Kakao Corp. | | | 2,192,507 | |
| | 73,805 | | | Kangwon Land, Inc. | | | 2,262,276 | |
| | 2,756 | | | KCC Corp. | | | 960,356 | |
| | 104,990 | | | Korea Electric Power Corp. | | | 3,680,904 | |
| | 68,937 | | | Korea Gas Corp.* | | | 2,517,748 | |
| | 5,592 | | | Korea Zinc Co. Ltd. | | | 2,557,927 | |
| | 53,559 | | | Korean Air Lines Co. Ltd.* | | | 1,516,176 | |
| | 41,326 | | | KT&G Corp. | | | 3,909,989 | |
| | 56,733 | | | LG Corp. | | | 4,362,190 | |
| | 143,869 | | | LG Display Co. Ltd. | | | 3,763,698 | |
| | 330,932 | | | LG Uplus Corp. | | | 3,799,977 | |
| | 7,769 | | | Lotte Chemical Corp. | | | 2,566,096 | |
| | 8,354 | | | Lotte Corp. | | | 556,212 | |
| | 6,518 | | | Lotte Shopping Co. Ltd. | | | 1,310,013 | |
| | 7,117 | | | Mando Corp. | | | 2,077,419 | |
| | 3,807 | | | NAVER Corp. | | | 3,042,828 | |
| | 17,827 | | | POSCO | | | 5,196,315 | |
| | 12,402 | | | Samsung Biologics Co. Ltd.* (a) | | | 4,254,860 | |
| | 4,221 | | | Samsung Electronics Co. Ltd. | | | 10,405,215 | |
| | 2,300 | | | Samsung SDS Co. Ltd. | | | 425,880 | |
| | 10,150 | | | Shinsegae, Inc. | | | 2,074,664 | |
| | 18,660 | | | SK Holdings Co. Ltd. | | | 4,828,649 | |
| | 74,464 | | | SK Hynix, Inc. | | | 5,490,433 | |
| | 26,839 | | | SK Innovation Co. Ltd. | | | 4,923,370 | |
| | 271,263 | | | SK Networks Co. Ltd. | | | 1,611,812 | |
| | 19,670 | | | SK Telecom Co. Ltd. | | | 4,643,695 | |
| | 61,738 | | | SKC Co. Ltd. | | | 2,193,318 | |
| | 41,370 | | | S-Oil Corp. | | | 4,756,287 | |
| | 253,926 | | | Woori Bank | | | 3,716,005 | |
| | 9,244 | | | Yuhan Corp. | | | 1,684,300 | |
| | | | | | | | |
| | | | | | | 128,904,269 | |
| | | | | | | | |
| | | | Spain — 1.9% | |
| | 12,384 | | | Acciona SA | | | 1,025,448 | |
| | 137,551 | | | Acerinox SA | | | 1,976,182 | |
| | 8,883 | | | Corp. Financiera Alba SA | | | 520,185 | |
| | 116,332 | | | Enagas SA | | | 3,350,798 | |
| | 172,208 | | | Endesa SA | | | 3,941,540 | |
| | 30,539 | | | Ferrovial SA | | | 663,204 | |
| | 156,698 | | | Gas Natural SDG SA | | | 3,352,951 | |
| | 504,392 | | | Iberdrola SA | | | 4,075,999 | |
| | 174,132 | | | Repsol SA | | | 3,263,132 | |
| | | | | | | | |
| | | | | | | 22,169,439 | |
| | | | | | | | |
SEE NOTES TO FINANCIAL STATEMENTS.
| | | | | | | | |
| | | |
| OCTOBER 31, 2017 | | JPMORGAN EXCHANGE-TRADED FUNDS | | | | | 57 | |
JPMorgan Diversified Return International Equity ETF
SCHEDULE OF PORTFOLIO INVESTMENTS
AS OF OCTOBER 31, 2017 (continued)
| | | | | | | | |
SHARES | | | INVESTMENTS | | VALUE($) | |
| | Common Stocks — continued | |
| | | | Sweden — 3.1% | |
| | 133,243 | | | Boliden AB | | | 4,662,408 | |
| | 22,815 | | | Essity AB, Class B* | | | 681,928 | |
| | 82,618 | | | Hexagon AB, Class B | | | 4,236,249 | |
| | 33,232 | | | ICA Gruppen AB | | | 1,225,571 | |
| | 91,313 | | | Investor AB, Class B | | | 4,524,253 | |
| | 230,094 | | | Securitas AB, Class B | | | 4,037,214 | |
| | 146,078 | | | Skanska AB, Class B | | | 3,203,286 | |
| | 66,640 | | | Svenska Cellulosa AB SCA, Class B | | | 625,748 | |
| | 62,602 | | | Swedish Match AB | | | 2,358,278 | |
| | 372,166 | | | Tele2 AB, Class B | | | 4,733,858 | |
| | 720,751 | | | Telia Co. AB | | | 3,335,971 | |
| | 95,632 | | | Trelleborg AB, Class B | | | 2,368,200 | |
| | | | | | | | |
| | | | | | | 35,992,964 | |
| | | | | | | | |
| | | | Switzerland — 2.3% | |
| | 26,787 | | | Baloise Holding AG (Registered) | | | 4,223,165 | |
| | 128,799 | | | Clariant AG (Registered)* | | | 3,240,571 | |
| | 121,263 | | | Coca-Cola HBC AG* | | | 4,098,348 | |
| | 1,082 | | | EMS-Chemie Holding AG (Registered) | | | 709,329 | |
| | 2,521 | | | Flughafen Zurich AG (Registered) | | | 548,256 | |
| | 6,054 | | | Kuehne + Nagel International AG (Registered) | | | 1,057,730 | |
| | 10,075 | | | Lonza Group AG (Registered)* | | | 2,676,536 | |
| | 22,856 | | | Sonova Holding AG (Registered) | | | 4,126,242 | |
| | 94,887 | | | STMicroelectronics NV | | | 2,234,993 | |
| | 3,354 | | | Swiss Re AG | | | 315,646 | |
| | 6,950 | | | Swisscom AG (Registered) | | | 3,511,311 | |
| | | | | | | | |
| | | | | | | 26,742,127 | |
| | | | | | | | |
| | | | United Kingdom — 16.7% | |
| | 113,028 | | | Admiral Group plc | | | 2,887,392 | |
| | 90,461 | | | AstraZeneca plc | | | 6,120,678 | |
| | 295,304 | | | Babcock International Group plc | | | 3,184,150 | |
| | 663,992 | | | BAE Systems plc | | | 5,230,490 | |
| | 459,379 | | | Barratt Developments plc | | | 3,994,218 | |
| | 68,633 | | | Bellway plc | | | 3,327,727 | |
| | 96,248 | | | Berkeley Group Holdings plc | | | 4,782,187 | |
| | 1,376,171 | | | BP plc | | | 9,334,100 | |
| | 301,481 | | | British Land Co. plc (The), REIT | | | 2,407,085 | |
| | 85,453 | | | Bunzl plc | | | 2,661,905 | |
| | 2,056,295 | | | Centrica plc | | | 4,637,296 | |
| | 467,968 | | | ConvaTec Group plc (a) | | | 1,217,567 | |
| | 56,940 | | | Croda International plc | | | 3,164,425 | |
| | 176,492 | | | Diageo plc | | | 6,026,996 | |
| | 539,215 | | | Direct Line Insurance Group plc | | | 2,661,313 | |
| | 303,525 | | | DS Smith plc | | | 2,099,164 | |
| | 122,415 | | | easyJet plc | | | 2,177,134 | |
| | 968,291 | | | GKN plc | | | 4,081,207 | |
| | | | | | | | |
SHARES | | | INVESTMENTS | | VALUE($) | |
| | | | | | | | |
| | | | United Kingdom — continued | |
| | 345,153 | | | GlaxoSmithKline plc | | | 6,194,580 | |
| | 91,517 | | | Halma plc | | | 1,435,984 | |
| | 528,928 | | | Hammerson plc, REIT | | | 3,681,987 | |
| | 147,126 | | | IMI plc | | | 2,387,205 | |
| | 202,242 | | | Inchcape plc | | | 2,099,244 | |
| | 185,726 | | | Informa plc | | | 1,719,113 | |
| | 83,906 | | �� | InterContinental Hotels Group plc | | | 4,648,508 | |
| | 170,685 | | | International Consolidated Airlines Group SA | | | 1,441,582 | |
| | 351,508 | | | J Sainsbury plc | | | 1,131,934 | |
| | 440,558 | | | John Wood Group plc | | | 4,165,833 | |
| | 84,047 | | | Johnson Matthey plc | | | 3,773,348 | |
| | 294,284 | | | Land Securities Group plc, REIT | | | 3,779,715 | |
| | 443,159 | | | Meggitt plc | | | 3,050,720 | |
| | 365,042 | | | Merlin Entertainments plc (a) | | | 1,836,271 | |
| | 135,433 | | | Micro Focus International plc | | | 4,757,018 | |
| | 453,505 | | | National Grid plc | | | 5,459,051 | |
| | 264,426 | | | Pennon Group plc | | | 2,788,794 | |
| | 128,232 | | | Persimmon plc | | | 4,772,123 | |
| | 29,588 | | | Reckitt Benckiser Group plc | | | 2,647,140 | |
| | 195,585 | | | RELX NV | | | 4,415,686 | |
| | 254,757 | | | RELX plc | | | 5,862,189 | |
| | 674,144 | | | Rentokil Initial plc | | | 3,006,244 | |
| | 514,369 | | | Royal Mail plc | | | 2,557,748 | |
| | 480,240 | | | Sage Group plc (The) | | | 4,753,710 | |
| | 14,173 | | | Schroders plc | | | 657,582 | |
| | 480,191 | | | Segro plc, REIT | | | 3,466,550 | |
| | 145,218 | | | Severn Trent plc | | | 4,071,826 | |
| | 289,933 | | | Smith & Nephew plc | | | 5,468,594 | |
| | 219,733 | | | Smiths Group plc | | | 4,584,925 | |
| | 287,027 | | | SSE plc | | | 5,271,511 | |
| | 385,473 | | | Tate & Lyle plc | | | 3,311,323 | |
| | 18,842 | | | Travis Perkins plc | | | 380,380 | |
| | 367,488 | | | United Utilities Group plc | | | 4,065,741 | |
| | 2,008,191 | | | Vodafone Group plc | | | 5,744,106 | |
| | 30,863 | | | Whitbread plc | | | 1,513,722 | |
| | 947,197 | | | Wm Morrison Supermarkets plc | | | 2,820,480 | |
| | | | | | | | |
| | | | | | | 193,717,501 | |
| | | | | | | | |
| | | | United States — 1.0% | |
| | 79,153 | | | Carnival plc | | | 5,218,422 | |
| | 32,665 | | | QIAGEN NV* | | | 1,106,037 | |
| | 110,695 | | | Shire plc | | | 5,452,348 | |
| | | | | | | | |
| | | | | | | 11,776,807 | |
| | | | | | | | |
| | | | Total Common Stocks
(Cost $1,005,785,453) | | | 1,134,206,220 | |
| | | | | | | | |
SEE NOTES TO FINANCIAL STATEMENTS.
| | | | | | |
| | | |
| 58 | | | | JPMORGAN EXCHANGE-TRADED FUNDS | | OCTOBER 31, 2017 |
| | | | | | | | |
NO. OF
RIGHTS | | | INVESTMENTS | | VALUE($) | |
| | Rights — 0.0% (b) | | | | |
| | | | Spain — 0.0% (b) | | | | |
| | 30,539 | | | Ferrovial SA, expiring 11/13/2017*
(Cost $14,329) | | | 14,691 | |
| | | | | | | | |
| | |
| SHARES | | | | | | |
| | Investment Company — 1.4% | |
| | 15,795,486 | | | JPMorgan U.S. Government Money Market Fund, Institutional Class Shares, 0.92% (c) (d)
(Cost $15,795,486) | | | 15,795,486 | |
| | | | | | | | |
| | | | Total Investments — 99.2%
(Cost $1,021,595,268) | | | 1,150,016,397 | |
| | | | Other Assets Less Liabilities — 0.8% | | | 9,870,609 | |
| | | | | | | | |
| | | | Net Assets — 100.0% | | $ | 1,159,887,006 | |
| | | | | | | | |
Percentages indicated are based on net assets.
Summary of Investments by Industry, October 31, 2017
The following table represents the portfolio investments of the Fund by industry classifications as a percentage of total investments:
| | | | |
| INDUSTRY | | PERCENTAGE | |
Oil, Gas & Consumable Fuels | | | 7.2 | % |
Chemicals | | | 6.0 | |
Electric Utilities | | | 5.0 | |
Diversified Telecommunication Services | | | 4.0 | |
Pharmaceuticals | | | 3.8 | |
Food Products | | | 3.6 | |
Equity Real Estate Investment Trusts (REITs) | | | 3.3 | |
Health Care Providers & Services | | | 3.0 | |
Wireless Telecommunication Services | | | 2.8 | |
Industrial Conglomerates | | | 2.7 | |
Household Durables | | | 2.6 | |
Metals & Mining | | | 2.5 | |
Hotels, Restaurants & Leisure | | | 2.5 | |
Health Care Equipment & Supplies | | | 2.4 | |
Construction & Engineering | | | 2.4 | |
Technology Hardware, Storage & Peripherals | | | 2.1 | |
Software | | | 2.1 | |
Semiconductors & Semiconductor Equipment | | | 1.9 | |
Banks | | | 2.0 | |
Auto Components | | | 1.8 | |
Insurance | | | 1.8 | |
Electronic Equipment, Instruments & Components | | | 1.8 | |
IT Services | | | 1.7 | |
Road & Rail | | | 1.7 | |
Beverages | | | 1.7 | |
Gas Utilities | | | 1.6 | |
Airlines | | | 1.6 | |
Food & Staples Retailing | | | 1.5 | |
Multi-Utilities | | | 1.3 | |
Professional Services | | | 1.3 | |
Media | | | 1.3 | |
Specialty Retail | | | 1.2 | |
Commercial Services & Supplies | | | 1.1 | |
Aerospace & Defense | | | 1.1 | |
Biotechnology | | | 1.0 | |
Water Utilities | | | 1.0 | |
Short-Term Investments | | | 1.4 | |
Others (each less than 1.0%) | | | 12.2 | |
SEE NOTES TO FINANCIAL STATEMENTS.
| | | | | | | | |
| | | |
| OCTOBER 31, 2017 | | JPMORGAN EXCHANGE-TRADED FUNDS | | | | | 59 | |
JPMorgan Diversified Return International Equity ETF
SCHEDULE OF PORTFOLIO INVESTMENTS
AS OF OCTOBER 31, 2017 (continued)
| | |
| * | | — Non-income producing security. |
| (a) | | — Securities exempt from registration under Rule 144A or section 4(2), of the Securities Act of 1933. Under procedures approved by the Board of Trustees, such securities have been determined to be liquid by the investment adviser and may be resold, normally to qualified institutional buyers in transactions exempt from registration. |
| (b) | | — Represents less than 0.05% of net assets. |
| (c) | | — Affiliated company as defined under the Investment Company Act of 1940. |
| (d) | | — The rate shown was the current yield as of October 31, 2017. |
Abbreviations
| | |
| ADR | | — American Depositary Receipt |
| OYJ | | — Public Limited Company |
| REIT | | — Real Estate Investment Trust |
| SCA | | — Limited partnership with share capital |
| | | | | | | | | | | | | | | | | | | | |
| Futures contracts outstanding as of October 31, 2017: | | | | | | | |
| DESCRIPTION | | NUMBER OF
CONTRACTS | | | EXPIRATION
DATE | | | TRADING
CURRENCY | | | NOTIONAL
AMOUNT ($) | | | VALUE AND
UNREALIZED
APPRECIATION
(DEPRECIATION) ($) | |
Long Contracts | | | | | | | | | | | | | | | | | | | | |
EURO STOXX 50 Index | | | 34 | | | | 12/2017 | | | | EUR | | | | 1,458,376 | | | | 41,548 | |
FTSE 100 Index | | | 80 | | | | 12/2017 | | | | GBP | | | | 7,936,849 | | | | 32,970 | |
SPI 200 Index | | | 34 | | | | 12/2017 | | | | AUD | | | | 3,841,029 | | | | 22,854 | |
TOPIX Index | | | 19 | | | | 12/2017 | | | | JPY | | | | 2,970,425 | | | | 38,537 | |
| | | | | | | | | | | | | | | | | | | | |
| | | | | | | | | | | | | | | | | | | 135,909 | |
| | | | | | | | | | | | | | | | | | | | |
Abbreviations
| | |
| AUD | | — Australian Dollar |
| EUR | | — Euro |
| FTSE | | — Financial Times and the London Stock Exchange |
| GBP | | — British Pound |
| JPY | | — Japanese Yen |
| SPI | | — Australian Securities Exchange |
| TOPIX | | — Tokyo Stock Price Index |
SEE NOTES TO FINANCIAL STATEMENTS.
| | | | | | |
| | | |
| 60 | | | | JPMORGAN EXCHANGE-TRADED FUNDS | | OCTOBER 31, 2017 |
JPMorgan Diversified Return U.S. Equity ETF
SCHEDULE OF PORTFOLIO INVESTMENTS
AS OF OCTOBER 31, 2017
| | | | | | | | |
| SHARES | | | INVESTMENTS | | VALUE($) | |
| | Common Stocks — 98.9% | | | | |
| | | | Aerospace & Defense — 1.7% | |
| | 10,181 | | | Arconic, Inc. | | | 255,747 | |
| | 2,236 | | | Boeing Co. (The) | | | 576,843 | |
| | 3,324 | | | General Dynamics Corp. | | | 674,705 | |
| | 2,711 | | | L3 Technologies, Inc. | | | 507,445 | |
| | 2,635 | | | Lockheed Martin Corp. | | | 812,002 | |
| | 2,562 | | | Northrop Grumman Corp. | | | 757,148 | |
| | 4,382 | | | Raytheon Co. | | | 789,636 | |
| | 3,586 | | | Rockwell Collins, Inc. | | | 486,262 | |
| | 6,610 | | | Textron, Inc. | | | 348,611 | |
| | 5,783 | | | United Technologies Corp. | | | 692,572 | |
| | | | | | | | |
| | | | | | | 5,900,971 | |
| | | | | | | | |
| | | | Air Freight & Logistics — 0.6% | | | | |
| | 10,028 | | | CH Robinson Worldwide, Inc. | | | 787,499 | |
| | 2,329 | | | FedEx Corp. | | | 525,911 | |
| | 6,685 | | | United Parcel Service, Inc., Class B | | | 785,688 | |
| | | | | | | | |
| | | | | | | 2,099,098 | |
| | | | | | | | |
| | | | Airlines — 0.7% | | | | |
| | 6,342 | | | Alaska Air Group, Inc. | | | 418,762 | |
| | 6,709 | | | American Airlines Group, Inc. | | | 314,116 | |
| | 9,809 | | | Delta Air Lines, Inc. | | | 490,744 | |
| | 16,640 | | | JetBlue Airways Corp.* | | | 318,656 | |
| | 10,383 | | | Southwest Airlines Co. | | | 559,229 | |
| | 5,634 | | | United Continental Holdings, Inc.* | | | 329,476 | |
| | | | | | | | |
| | | | | | | 2,430,983 | |
| | | | | | | | |
| | | | Auto Components — 0.7% | | | | |
| | 861 | | | Adient plc | | | 72,634 | |
| | 7,666 | | | Delphi Automotive plc | | | 761,847 | |
| | 53,812 | | | Gentex Corp. | | | 1,044,491 | |
| | 4,569 | | | Lear Corp. | | | 802,271 | |
| | | | | | | | |
| | | | | | | 2,681,243 | |
| | | | | | | | |
| | | | Automobiles — 0.6% | | | | |
| | 71,736 | | | Ford Motor Co. | | | 880,201 | |
| | 15,996 | | | General Motors Co. | | | 687,508 | |
| | 10,627 | | | Harley-Davidson, Inc. | | | 503,082 | |
| | | | | | | | |
| | | | | | | 2,070,791 | |
| | | | | | | | |
| | | | Banks — 1.9% | | | | |
| | 12,117 | | | Bank of America Corp. | | | 331,885 | |
| | 4,180 | | | Bank of Hawaii Corp. | | | 341,130 | |
| | 9,140 | | | BB&T Corp. | | | 450,053 | |
| | 5,819 | | | Citigroup, Inc. | | | 427,696 | |
| | 6,580 | | | Citizens Financial Group, Inc. | | | 250,106 | |
| | 3,749 | | | Comerica, Inc. | | | 294,559 | |
| | 1,814 | | | Cullen/Frost Bankers, Inc. | | | 178,679 | |
| | | | | | | | |
| SHARES | | | INVESTMENTS | | VALUE($) | |
| | | | | | | | |
| | | | Banks — continued | | | | |
| | 15,424 | | | Fifth Third Bancorp | | | 445,753 | |
| | 30,501 | | | Huntington Bancshares, Inc. | | | 420,914 | |
| | 14,336 | | | KeyCorp | | | 261,632 | |
| | 3,257 | | | M&T Bank Corp. | | | 543,170 | |
| | 24,461 | | | People’s United Financial, Inc. | | | 456,442 | |
| | 3,340 | | | PNC Financial Services Group, Inc. (The) | | | 456,879 | |
| | 769 | | | Popular, Inc. (Puerto Rico) | | | 28,207 | |
| | 16,214 | | | Regions Financial Corp. | | | 250,993 | |
| | 6,944 | | | SunTrust Banks, Inc. | | | 418,098 | |
| | 1,969 | | | Synovus Financial Corp. | | | 92,248 | |
| | 8,362 | | | US Bancorp | | | 454,725 | |
| | 7,698 | | | Wells Fargo & Co. | | | 432,166 | |
| | 5,613 | | | Zions Bancorp | | | 260,780 | |
| | | | | | | | |
| | | | | | | 6,796,115 | |
| | | | | | | | |
| | | | Beverages — 2.1% | | | | |
| | 22,010 | | | Brown-Forman Corp., Class B | | | 1,255,010 | |
| | 34,382 | | | Coca-Cola Co. (The) | | | 1,580,884 | |
| | 5,039 | | | Constellation Brands, Inc., Class A | | | 1,103,995 | |
| | 13,514 | | | Dr Pepper Snapple Group, Inc. | | | 1,157,609 | |
| | 7,294 | | | Molson Coors Brewing Co., Class B | | | 589,866 | |
| | 15,788 | | | PepsiCo, Inc. | | | 1,740,311 | |
| | | | | | | | |
| | | | | | | 7,427,675 | |
| | | | | | | | |
| | | | Biotechnology — 1.8% | | | | |
| | 14,013 | | | AbbVie, Inc. | | | 1,264,673 | |
| | 4,651 | | | Amgen, Inc. | | | 814,948 | |
| | 2,364 | | | Biogen, Inc.* | | | 736,764 | |
| | 685 | | | Bioverativ, Inc.* | | | 38,703 | |
| | 5,829 | | | Celgene Corp.* | | | 588,554 | |
| | 10,736 | | | Exelixis, Inc.* | | | 266,145 | |
| | 9,682 | | | Gilead Sciences, Inc. | | | 725,763 | |
| | 3,049 | | | Incyte Corp.* | | | 345,299 | |
| | 1,183 | | | Regeneron Pharmaceuticals, Inc.* | | | 476,300 | |
| | 5,242 | | | United Therapeutics Corp.* | | | 621,649 | |
| | 2,680 | | | Vertex Pharmaceuticals, Inc.* | | | 391,896 | |
| | | | | | | | |
| | | | | | | 6,270,694 | |
| | | | | | | | |
| | | | Building Products — 0.2% | | | | |
| | 7,110 | | | Fortune Brands Home & Security, Inc. | | | 469,686 | |
| | 8,571 | | | Johnson Controls International plc | | | 354,754 | |
| | | | | | | | |
| | | | | | | 824,440 | |
| | | | | | | | |
| | | | Capital Markets — 2.4% | | | | |
| | 2,191 | | | Ameriprise Financial, Inc. | | | 342,979 | |
| | 8,297 | | | Bank of New York Mellon Corp. (The) | | | 426,881 | |
| | 1,141 | | | BlackRock, Inc. | | | 537,217 | |
SEE NOTES TO FINANCIAL STATEMENTS.
| | | | | | | | |
| | | |
| OCTOBER 31, 2017 | | JPMORGAN EXCHANGE-TRADED FUNDS | | | | | 61 | |
JPMorgan Diversified Return U.S. Equity ETF
SCHEDULE OF PORTFOLIO INVESTMENTS
AS OF OCTOBER 31, 2017 (continued)
| | | | | | | | |
| SHARES | | | INVESTMENTS | | VALUE($) | |
| | Common Stocks — continued | | | | |
| | | | Capital Markets — continued | | | | |
| | 1,937 | | | Cboe Global Markets, Inc. | | | 218,997 | |
| | 6,983 | | | Charles Schwab Corp. (The) | | | 313,118 | |
| | 3,285 | | | CME Group, Inc. | | | 450,604 | |
| | 5,680 | | | E*TRADE Financial Corp.* | | | 247,591 | |
| | 2,986 | | | Eaton Vance Corp. | | | 150,703 | |
| | 5,873 | | | FactSet Research Systems, Inc. | | | 1,115,107 | |
| | 3,697 | | | Federated Investors, Inc., Class B | | | 114,866 | |
| | 5,311 | | | Franklin Resources, Inc. | | | 223,752 | |
| | 1,427 | | | Goldman Sachs Group, Inc. (The) | | | 346,019 | |
| | 6,831 | | | Intercontinental Exchange, Inc. | | | 451,529 | |
| | 8,763 | | | Invesco Ltd. | | | 313,628 | |
| | 6,032 | | | Morgan Stanley | | | 301,600 | |
| | 3,742 | | | Northern Trust Corp. | | | 349,952 | |
| | 3,731 | | | Raymond James Financial, Inc. | | | 316,314 | |
| | 2,794 | | | S&P Global, Inc. | | | 437,177 | |
| | 13,359 | | | SEI Investments Co. | | | 861,789 | |
| | 3,640 | | | State Street Corp. | | | 334,880 | |
| | 3,887 | | | T Rowe Price Group, Inc. | | | 361,102 | |
| | 8,383 | | | TD Ameritrade Holding Corp. | | | 419,066 | |
| | | | | | | | |
| | | | | | | 8,634,871 | |
| | | | | | | | |
| | | | Chemicals — 5.1% | | | | |
| | 8,970 | | | Air Products & Chemicals, Inc. | | | 1,430,087 | |
| | 5,454 | | | Albemarle Corp. | | | 768,414 | |
| | 16,753 | | | Ashland Global Holdings, Inc. | | | 1,138,869 | |
| | 5,837 | | | Cabot Corp. | | | 355,823 | |
| | 13,191 | | | Celanese Corp., Series A | | | 1,375,953 | |
| | 7,365 | | | CF Industries Holdings, Inc. | | | 279,723 | |
| | 5,904 | | | Chemours Co. (The) | | | 334,225 | |
| | 10,442 | | | DowDuPont, Inc. | | | 755,061 | |
| | 8,280 | | | Eastman Chemical Co. | | | 751,907 | |
| | 13,707 | | | Ecolab, Inc. | | | 1,790,957 | |
| | 6,134 | | | FMC Corp. | | | 569,603 | |
| | 18,697 | | | Huntsman Corp. | | | 598,678 | |
| | 10,190 | | | International Flavors & Fragrances, Inc. | | | 1,502,210 | |
| | 11,584 | | | LyondellBasell Industries NV, Class A | | | 1,199,292 | |
| | 15,847 | | | Monsanto Co. | | | 1,919,072 | |
| | 11,263 | | | PPG Industries, Inc. | | | 1,309,211 | |
| | 10,883 | | | Praxair, Inc. | | | 1,590,224 | |
| | 255 | | | RPM International, Inc. | | | 13,599 | |
| | 1,707 | | | Sherwin-Williams Co. (The) | | | 674,521 | |
| | | | | | | | |
| | | | | | | 18,357,429 | |
| | | | | | | | |
| | | | Commercial Services & Supplies — 1.1% | | | | |
| | 7,920 | | | Cintas Corp. | | | 1,180,397 | |
| | 12,238 | | | Herman Miller, Inc. | | | 411,197 | |
| | | | | | | | |
| SHARES | | | INVESTMENTS | | VALUE($) | |
| | | | | | | | |
| | | | Commercial Services & Supplies — continued | |
| | 18,409 | | | Pitney Bowes, Inc. | | | 252,940 | |
| | 16,344 | | | Republic Services, Inc. | | | 1,063,504 | |
| | 11,066 | | | Waste Management, Inc. | | | 909,293 | |
| | | | | | | | |
| | | | | | | 3,817,331 | |
| | | | | | | | |
| | | | Communications Equipment — 1.5% | | | | |
| | 1,473 | | | Arista Networks, Inc.* | | | 294,438 | |
| | 29,837 | | | Cisco Systems, Inc. | | | 1,018,934 | |
| | 4,533 | | | F5 Networks, Inc.* | | | 549,717 | |
| | 15,904 | | | Harris Corp. | | | 2,215,745 | |
| | 23,787 | | | Juniper Networks, Inc. | | | 590,631 | |
| | 7,734 | | | Motorola Solutions, Inc. | | | 700,236 | |
| | | | | | | | |
| | | | | | | 5,369,701 | |
| | | | | | | | |
| | | | Construction & Engineering — 0.0% (a) | | | | |
| | 1,555 | | | Fluor Corp. | | | 67,005 | |
| | | | | | | | |
| | | | Construction Materials — 0.1% | | | | |
| | 1,651 | | | Martin Marietta Materials, Inc. | | | 358,019 | |
| | | | | | | | |
| | | | Consumer Finance — 0.5% | | | | |
| | 4,100 | | | American Express Co. | | | 391,632 | |
| | 4,496 | | | Capital One Financial Corp. | | | 414,441 | |
| | 7,011 | | | Discover Financial Services | | | 466,442 | |
| | 33,125 | | | SLM Corp.* | | | 350,794 | |
| | | | | | | | |
| | | | | | | 1,623,309 | |
| | | | | | | | |
| | | | Containers & Packaging — 0.4% | | | | |
| | 752 | | | Ball Corp. | | | 32,283 | |
| | 6,268 | | | Bemis Co., Inc. | | | 282,185 | |
| | 2,416 | | | Crown Holdings, Inc.* | | | 145,371 | |
| | 9,957 | | | International Paper Co. | | | 570,237 | |
| | 8,863 | | | Sealed Air Corp. | | | 392,011 | |
| | | | | | | | |
| | | | | | | 1,422,087 | |
| | | | | | | | |
| | | | Distributors — 0.4% | | | | |
| | 18,013 | | | Genuine Parts Co. | | | 1,589,287 | |
| | | | | | | | |
| | | | Diversified Consumer Services — 0.0% (a) | | | | |
| | 46 | | | Graham Holdings Co., Class B | | | 25,597 | |
| | 3,422 | | | H&R Block, Inc. | | | 84,660 | |
| | | | | | | | |
| | | | | | | 110,257 | |
| | | | | | | | |
| | | | Diversified Financial Services — 0.2% | | | | |
| | 3,491 | | | Berkshire Hathaway, Inc., Class B* | | | 652,608 | |
| | | | | | | | |
| | | | Diversified Telecommunication Services — 0.7% | |
| | 35,810 | | | AT&T, Inc. | | | 1,205,007 | |
| | 25,353 | | | Verizon Communications, Inc. | | | 1,213,648 | |
| | | | | | | | |
| | | | | | | 2,418,655 | |
| | | | | | | | |
SEE NOTES TO FINANCIAL STATEMENTS.
| | | | | | |
| | | |
| 62 | | | | JPMORGAN EXCHANGE-TRADED FUNDS | | OCTOBER 31, 2017 |
| | | | | | | | |
| SHARES | | | INVESTMENTS | | VALUE($) | |
| | Common Stocks — continued | | | | |
| | | | Electric Utilities — 6.3% | | | | |
| | 35,437 | | | Alliant Energy Corp. | | | 1,533,004 | |
| | 23,331 | | | American Electric Power Co., Inc. | | | 1,736,060 | |
| | 20,539 | | | Duke Energy Corp. | | | 1,813,799 | |
| | 22,479 | | | Edison International | | | 1,797,196 | |
| | 21,791 | | | Entergy Corp. | | | 1,879,692 | |
| | 30,658 | | | Eversource Energy | | | 1,920,417 | |
| | 42,329 | | | Exelon Corp. | | | 1,702,049 | |
| | 3,923 | | | FirstEnergy Corp. | | | 129,263 | |
| | 10,542 | | | NextEra Energy, Inc. | | | 1,634,748 | |
| | 23,826 | | | PG&E Corp. | | | 1,376,428 | |
| | 20,754 | | | Pinnacle West Capital Corp. | | | 1,820,333 | |
| | 43,280 | | | PPL Corp. | | | 1,625,597 | |
| | 35,264 | | | Southern Co. (The) | | | 1,840,781 | |
| | 36,913 | | | Xcel Energy, Inc. | | | 1,827,932 | |
| | | | | | | | |
| | | | | | | 22,637,299 | |
| | | | | | | | |
| | | | Electrical Equipment — 0.6% | | | | |
| | 3,083 | | | AMETEK, Inc. | | | 208,072 | |
| | 7,341 | | | Eaton Corp. plc | | | 587,427 | |
| | 5,491 | | | Emerson Electric Co. | | | 353,950 | |
| | 3,365 | | | Hubbell, Inc. | | | 423,384 | |
| | 3,575 | | | Rockwell Automation, Inc. | | | 717,931 | |
| | | | | | | | |
| | | | | | | 2,290,764 | |
| | | | | | | | |
| | | | Electronic Equipment, Instruments & Components — 0.5% | |
| | 8,427 | | | Amphenol Corp., Class A | | | 733,149 | |
| | 10,114 | | | AVX Corp. | | | 190,548 | |
| | 22,656 | | | Corning, Inc. | | | 709,359 | |
| | | | | | | | |
| | | | | | | 1,633,056 | |
| | | | | | | | |
| | | | Energy Equipment & Services — 0.9% | | | | |
| | 13,063 | | | Baker Hughes a GE Co. | | | 410,570 | |
| | 13,770 | | | Halliburton Co. | | | 588,530 | |
| | 4,982 | | | Helmerich & Payne, Inc. | | | 270,572 | |
| | 15,009 | | | Nabors Industries Ltd. | | | 84,501 | |
| | 9,517 | | | National Oilwell Varco, Inc. | | | 325,386 | |
| | 9,486 | | | Patterson-UTI Energy, Inc. | | | 187,633 | |
| | 16,974 | | | Schlumberger Ltd. | | | 1,086,336 | |
| | 27,522 | | | Transocean Ltd.* | | | 288,981 | |
| | | | | | | | |
| | | | | | | 3,242,509 | |
| | | | | | | | |
| | | | Equity Real Estate Investment Trusts (REITs) — 1.4% | |
| | 1,555 | | | Alexandria Real Estate Equities, Inc. | | | 192,758 | |
| | 3,483 | | | American Tower Corp. | | | 500,403 | |
| | 3,027 | | | AvalonBay Communities, Inc. | | | 548,886 | |
| | 420 | | | Boston Properties, Inc. | | | 50,896 | |
| | 738 | | | Camden Property Trust | | | 67,335 | |
| | | | | | | | |
| SHARES | | | INVESTMENTS | | VALUE($) | |
| | | | | | | | |
| | | | Equity Real Estate Investment Trusts (REITs) — continued | |
| | 2,675 | | | Corporate Office Properties Trust | | | 85,413 | |
| | 2,863 | | | Digital Realty Trust, Inc. | | | 339,094 | |
| | 1,879 | | | Duke Realty Corp. | | | 53,514 | |
| | 7,666 | | | Equity Residential | | | 515,615 | |
| | 411 | | | Essex Property Trust, Inc. | | | 107,859 | |
| | 2,278 | | | Federal Realty Investment Trust | | | 274,544 | |
| | 15,356 | | | Host Hotels & Resorts, Inc. | | | 300,363 | |
| | 3,236 | | | Iron Mountain, Inc. | | | 129,440 | |
| | 717 | | | JBG SMITH Properties* | | | 22,378 | |
| | 582 | | | Liberty Property Trust | | | 24,956 | |
| | 3,526 | | | Park Hotels & Resorts, Inc. | | | 101,513 | |
| | 5,964 | | | Prologis, Inc. | | | 385,155 | |
| | 6,252 | | | Rayonier, Inc. | | | 187,435 | |
| | 4,899 | | | Senior Housing Properties Trust | | | 90,142 | |
| | 2,294 | | | Simon Property Group, Inc. | | | 356,327 | |
| | 1,424 | | | Vornado Realty Trust | | | 106,601 | |
| | 4,679 | | | Weingarten Realty Investors | | | 142,475 | |
| | 4,311 | | | Welltower, Inc. | | | 288,664 | |
| | 8,090 | | | Weyerhaeuser Co. | | | 290,512 | |
| | | | | | | | |
| | | | | | | 5,162,278 | |
| | | | | | | | |
| | | | Food & Staples Retailing — 1.2% | | | | |
| | 4,684 | | | Costco Wholesale Corp. | | | 754,498 | |
| | 8,792 | | | CVS Health Corp. | | | 602,516 | |
| | 12,473 | | | Sysco Corp. | | | 693,748 | |
| | 11,796 | | | Walgreens Boots Alliance, Inc. | | | 781,721 | |
| | 15,625 | | | Wal-Mart Stores, Inc. | | | 1,364,219 | |
| | | | | | | | |
| | | | | | | 4,196,702 | |
| | | | | | | | |
| | | | Food Products — 3.6% | | | | |
| | 15,549 | | | Archer-Daniels-Midland Co. | | | 635,488 | |
| | 6,739 | | | Bunge Ltd. | | | 463,508 | |
| | 28,553 | | | Campbell Soup Co. | | | 1,352,556 | |
| | 25,591 | | | Conagra Brands, Inc. | | | 874,189 | |
| | 21,347 | | | General Mills, Inc. | | | 1,108,336 | |
| | 10,392 | | | Hershey Co. (The) | | | 1,103,423 | |
| | 38,737 | | | Hormel Foods Corp. | | | 1,207,045 | |
| | 8,878 | | | JM Smucker Co. (The) | | | 941,512 | |
| | 21,366 | | | Kellogg Co. | | | 1,336,016 | |
| | 15,132 | | | Kraft Heinz Co. (The) | | | 1,170,158 | |
| | 2,165 | | | Lamb Weston Holdings, Inc. | | | 110,393 | |
| | 17,431 | | | McCormick & Co., Inc. (Non-Voting) | | | 1,734,907 | |
| | 9,228 | | | Tyson Foods, Inc., Class A | | | 672,813 | |
| | | | | | | | |
| | | | | | | 12,710,344 | |
| | | | | | | | |
SEE NOTES TO FINANCIAL STATEMENTS.
| | | | | | | | |
| | | |
| OCTOBER 31, 2017 | | JPMORGAN EXCHANGE-TRADED FUNDS | | | | | 63 | |
JPMorgan Diversified Return U.S. Equity ETF
SCHEDULE OF PORTFOLIO INVESTMENTS
AS OF OCTOBER 31, 2017 (continued)
| | | | | | | | |
| SHARES | | | INVESTMENTS | | VALUE($) | |
| | Common Stocks — continued | | | | |
| | | | Health Care Equipment & Supplies — 5.7% | | | | |
| | 24,574 | | | Abbott Laboratories | | | 1,332,648 | |
| | 4,002 | | | Align Technology, Inc.* | | | 956,398 | |
| | 20,297 | | | Baxter International, Inc. | | | 1,308,548 | |
| | 6,825 | | | Becton Dickinson and Co. | | | 1,424,173 | |
| | 40,651 | | | Boston Scientific Corp.* | | | 1,143,919 | |
| | 4,988 | | | Cooper Cos., Inc. (The) | | | 1,198,417 | |
| | 4,448 | | | CR Bard, Inc. | | | 1,454,807 | |
| | 9,404 | | | Danaher Corp. | | | 867,707 | |
| | 18,248 | | | DENTSPLY SIRONA, Inc. | | | 1,114,405 | |
| | 5,179 | | | Edwards Lifesciences Corp.* | | | 529,449 | |
| | 14,278 | | | Hill-Rom Holdings, Inc. | | | 1,152,377 | |
| | 22,529 | | | Hologic, Inc.* | | | 852,723 | |
| | 4,766 | | | IDEXX Laboratories, Inc.* | | | 791,966 | |
| | 3,002 | | | Intuitive Surgical, Inc.* | | | 1,126,831 | |
| | 15,367 | | | Medtronic plc | | | 1,237,351 | |
| | 8,044 | | | Stryker Corp. | | | 1,245,774 | |
| | 92 | | | Teleflex, Inc. | | | 21,802 | |
| | 5,535 | | | Varex Imaging Corp.* | | | 190,238 | |
| | 15,136 | | | Varian Medical Systems, Inc.* | | | 1,577,020 | |
| | 6,418 | | | Zimmer Biomet Holdings, Inc. | | | 780,557 | |
| | | | | | | | |
| | | | | | | 20,307,110 | |
| | | | | | | | |
| | | | Health Care Providers & Services — 4.9% | | | | |
| | 5,970 | | | Aetna, Inc. | | | 1,015,079 | |
| | 7,633 | | | AmerisourceBergen Corp. | | | 587,359 | |
| | 6,024 | | | Anthem, Inc. | | | 1,260,281 | |
| | 8,504 | | | Cardinal Health, Inc. | | | 526,398 | |
| | 7,536 | | | Centene Corp.* | | | 705,897 | |
| | 4,902 | | | Cigna Corp. | | | 966,772 | |
| | 22,954 | | | DaVita, Inc.* | | | 1,394,226 | |
| | 16,196 | | | Express Scripts Holding Co.* | | | 992,653 | |
| | 13,050 | | | HCA Healthcare, Inc.* | | | 987,233 | |
| | 19,906 | | | Henry Schein, Inc.* | | | 1,564,612 | |
| | 3,992 | | | Humana, Inc. | | | 1,019,357 | |
| | 11,648 | | | Laboratory Corp. of America Holdings* | | | 1,790,414 | |
| | 3,480 | | | McKesson Corp. | | | 479,822 | |
| | 17,800 | | | Quest Diagnostics, Inc. | | | 1,669,284 | |
| | 5,811 | | | UnitedHealth Group, Inc. | | | 1,221,588 | |
| | 12,738 | | | Universal Health Services, Inc., Class B | | | 1,308,193 | |
| | | | | | | | |
| | | | | | | 17,489,168 | |
| | | | | | | | |
| | | | Health Care Technology — 0.2% | | | | |
| | 12,117 | | | Cerner Corp.* | | | 818,140 | |
| | | | | | | | |
| | | | Hotels, Restaurants & Leisure — 3.1% | | | | |
| | 13,110 | | | Carnival Corp. | | | 870,373 | |
| | 6,551 | | | Darden Restaurants, Inc. | | | 538,951 | |
| | | | | | | | |
| SHARES | | | INVESTMENTS | | VALUE($) | |
| | | | | | | | |
| | | | Hotels, Restaurants & Leisure — continued | | | | |
| | 3,499 | | | Domino’s Pizza, Inc. | | | 640,317 | |
| | 8,932 | | | Dunkin’ Brands Group, Inc. | | | 527,613 | |
| | 1,627 | | | Hilton Grand Vacations, Inc.* | | | 66,642 | |
| | 11,061 | | | Hilton Worldwide Holdings, Inc. | | | 799,489 | |
| | 16,590 | | | International Game Technology plc | | | 389,865 | |
| | 6,526 | | | Las Vegas Sands Corp. | | | 413,618 | |
| | 7,554 | | | Marriott International, Inc., Class A | | | 902,552 | |
| | 7,475 | | | McDonald’s Corp. | | | 1,247,652 | |
| | 13,952 | | | MGM Resorts International | | | 437,395 | |
| | 403 | | | Norwegian Cruise Line Holdings Ltd.* | | | 22,467 | |
| | 4,703 | | | Royal Caribbean Cruises Ltd. | | | 582,090 | |
| | 8,483 | | | Speedway Motorsports, Inc. | | | 169,236 | |
| | 16,421 | | | Starbucks Corp. | | | 900,528 | |
| | 6,922 | | | Wyndham Worldwide Corp. | | | 739,616 | |
| | 2,499 | | | Wynn Resorts Ltd. | | | 368,578 | |
| | 14,325 | | | Yum Brands, Inc. | | | 1,066,496 | |
| | 7,575 | | | Yum China Holdings, Inc.* | | | 305,651 | |
| | | | | | | | |
| | | | | | | 10,989,129 | |
| | | | | | | | |
| | | | Household Durables — 2.6% | | | | |
| | 23,138 | | | DR Horton, Inc. | | | 1,022,931 | |
| | 15,562 | | | Garmin Ltd. | | | 880,965 | |
| | 26,076 | | | Leggett & Platt, Inc. | | | 1,232,352 | |
| | 12,972 | | | Lennar Corp., Class A | | | 722,151 | |
| | 3,602 | | | Mohawk Industries, Inc.* | | | 942,860 | |
| | 14,148 | | | Newell Brands, Inc. | | | 576,955 | |
| | 730 | | | NVR, Inc.* | | | 2,395,400 | |
| | 27,950 | | | PulteGroup, Inc. | | | 844,928 | |
| | 3,233 | | | Whirlpool Corp. | | | 529,986 | |
| | | | | | | | |
| | | | | | | 9,148,528 | |
| | | | | | | | |
| | | | Household Products — 1.7% | |
| | 23,638 | | | Church & Dwight Co., Inc. | | | 1,067,728 | |
| | 13,741 | | | Clorox Co. (The) | | | 1,738,649 | |
| | 4,378 | | | Colgate-Palmolive Co. | | | 308,430 | |
| | 3,937 | | | Energizer Holdings, Inc. | | | 169,252 | |
| | 10,612 | | | Kimberly-Clark Corp. | | | 1,193,956 | |
| | 19,047 | | | Procter & Gamble Co. (The) | | | 1,644,518 | |
| | | | | | | | |
| | | | | | | 6,122,533 | |
| | | | | | | | |
| | | | Industrial Conglomerates — 0.5% | | | | |
| | 3,644 | | | 3M Co. | | | 838,812 | |
| | 5,196 | | | Honeywell International, Inc. | | | 749,055 | |
| | 1,338 | | | Roper Technologies, Inc. | | | 345,432 | |
| | | | | | | | |
| | | | | | | 1,933,299 | |
| | | | | | | | |
SEE NOTES TO FINANCIAL STATEMENTS.
| | | | | | |
| | | |
| 64 | | | | JPMORGAN EXCHANGE-TRADED FUNDS | | OCTOBER 31, 2017 |
| | | | | | | | |
| SHARES | | | INVESTMENTS | | VALUE($) | |
| | Common Stocks — continued | | | | |
| | | | Insurance — 2.9% | | | | |
| | 6,406 | | | Aflac, Inc. | | | 537,399 | |
| | 6,759 | | | Allstate Corp. (The) | | | 634,400 | |
| | 2,528 | | | American Financial Group, Inc. | | | 266,679 | |
| | 5,211 | | | Aon plc | | | 747,414 | |
| | 5,158 | | | Assurant, Inc. | | | 519,153 | |
| | 470 | | | Brighthouse Financial, Inc.* | | | 29,224 | |
| | 3,958 | | | Chubb Ltd. | | | 596,945 | |
| | 8,263 | | | Cincinnati Financial Corp. | | | 579,815 | |
| | 1,016 | | | Erie Indemnity Co., Class A | | | 122,733 | |
| | 1,685 | | | Everest Re Group Ltd. | | | 400,103 | |
| | 8,907 | | | FNF Group | | | 333,300 | |
| | 8,373 | | | Hartford Financial Services Group, Inc. (The) | | | 460,934 | |
| | 4,851 | | | Kemper Corp. | | | 310,949 | |
| | 3,199 | | | Lincoln National Corp. | | | 242,420 | |
| | 7,623 | | | Marsh & McLennan Cos., Inc. | | | 616,929 | |
| | 310 | | | Mercury General Corp. | | | 17,351 | |
| | 5,115 | | | MetLife, Inc. | | | 274,062 | |
| | 6,432 | | | Principal Financial Group, Inc. | | | 423,547 | |
| | 12,115 | | | Progressive Corp. (The) | | | 589,395 | |
| | 2,769 | | | Prudential Financial, Inc. | | | 305,864 | |
| | 1,950 | | | Reinsurance Group of America, Inc. | | | 291,291 | |
| | 9,772 | | | Torchmark Corp. | | | 822,118 | |
| | 3,720 | | | Travelers Cos., Inc. (The) | | | 492,714 | |
| | 7,158 | | | WR Berkley Corp. | | | 490,896 | |
| | 2,726 | | | XL Group Ltd. (Bermuda) | | | 110,321 | |
| | | | | | | | |
| | | | | | | 10,215,956 | |
| | | | | | | | |
| | | | Internet & Direct Marketing Retail — 0.4% | | | | |
| | 683 | | | Amazon.com, Inc.* | | | 754,906 | |
| | 332 | | | Priceline Group, Inc. (The)* | | | 634,771 | |
| | | | | | | | |
| | | | | | | 1,389,677 | |
| | | | | | | | |
| | | | Internet Software & Services — 2.1% | | | | |
| | 969 | | | Alphabet, Inc., Class A* | | | 1,001,016 | |
| | 1,056 | | | Alphabet, Inc., Class C* | | | 1,073,572 | |
| | 16,717 | | | eBay, Inc.* | | | 629,228 | |
| | 5,286 | | | Facebook, Inc., Class A* | | | 951,797 | |
| | 17,243 | | | IAC/InterActiveCorp* | | | 2,225,209 | |
| | 16,498 | | | VeriSign, Inc.* | | | 1,773,865 | |
| | | | | | | | |
| | | | | | | 7,654,687 | |
| | | | | | | | |
| | | | IT Services — 3.1% | | | | |
| | 4,511 | | | Accenture plc, Class A | | | 642,186 | |
| | 5,915 | | | Automatic Data Processing, Inc. | | | 687,678 | |
| | 9,216 | | | Cognizant Technology Solutions Corp., Class A | | | 697,375 | |
| | 7,290 | | | CSRA, Inc. | | | 233,207 | |
| | 15,037 | | | DST Systems, Inc. | | | 881,469 | |
| | | | | | | | |
| SHARES | | | INVESTMENTS | | VALUE($) | |
| | | | | |
| | | | IT Services — continued | | | | |
| | 8,900 | | | Fidelity National Information Services, Inc. | | | 825,564 | |
| | 6,777 | | | Fiserv, Inc.* | | | 877,147 | |
| | 3,796 | | | Gartner, Inc.* | | | 475,677 | |
| | 3,070 | | | Global Payments, Inc. | | | 319,127 | |
| | 7,788 | | | International Business Machines Corp. | | | 1,199,819 | |
| | 12,824 | | | Leidos Holdings, Inc. | | | 801,756 | |
| | 4,757 | | | Mastercard, Inc., Class A | | | 707,699 | |
| | 9,765 | | | Paychex, Inc. | | | 622,909 | |
| | 3,418 | | | Teradata Corp.* | | | 114,332 | |
| | 5,415 | | | Total System Services, Inc. | | | 390,151 | |
| | 7,393 | | | Vantiv, Inc., Class A* | | | 517,510 | |
| | 4,408 | | | Visa, Inc., Class A | | | 484,792 | |
| | 20,720 | | | Western Union Co. (The) | | | 411,499 | |
| | | | | | | | |
| | | | | | | 10,889,897 | |
| | | | | | | | |
| | | | Leisure Products — 0.7% | | | | |
| | 16,860 | | | Hasbro, Inc. | | | 1,561,068 | |
| | 19,995 | | | Mattel, Inc. | | | 282,329 | |
| | 4,125 | | | Polaris Industries, Inc. | | | 488,524 | |
| | | | | | | | |
| | | | | | | 2,331,921 | |
| | | | | | | | |
| | | | Life Sciences Tools & Services — 1.7% | | | | |
| | 9,417 | | | Agilent Technologies, Inc. | | | 640,639 | |
| | 2,589 | | | Illumina, Inc.* | | | 531,237 | |
| | 1,054 | | | Mettler-Toledo International, Inc.* | | | 719,492 | |
| | 11,063 | | | Quintiles IMS Holdings, Inc.* | | | 1,195,910 | |
| | 5,565 | | | Thermo Fisher Scientific, Inc. | | | 1,078,664 | |
| | 10,207 | | | Waters Corp.* | | | 2,001,082 | |
| | | | | | | | |
| | | | | | | 6,167,024 | |
| | | | | | | | |
| | | | Machinery — 2.0% | | | | |
| | 188 | | | AGCO Corp. | | | 12,891 | |
| | 3,292 | | | Caterpillar, Inc. | | | 447,054 | |
| | 1,102 | | | Crane Co. | | | 91,598 | |
| | 2,721 | | | Cummins, Inc. | | | 481,290 | |
| | 3,757 | | | Deere & Co. | | | 499,230 | |
| | 6,116 | | | Dover Corp. | | | 584,017 | |
| | 6,314 | | | Fortive Corp. | | | 456,250 | |
| | 5,204 | | | Illinois Tool Works, Inc. | | | 814,530 | |
| | 5,886 | | | Ingersoll-Rand plc | | | 521,500 | |
| | 16,440 | | | ITT, Inc. | | | 766,762 | |
| | 5,487 | | | PACCAR, Inc. | | | 393,582 | |
| | 2,791 | | | Parker-Hannifin Corp. | | | 509,664 | |
| | 8,154 | | | Stanley Black & Decker, Inc. | | | 1,317,279 | |
| | 2,665 | | | Terex Corp. | | | 125,548 | |
| | 5,998 | | | Trinity Industries, Inc. | | | 195,055 | |
| | | | | | | | |
| | | | | | | 7,216,250 | |
| | | | | | | | |
SEE NOTES TO FINANCIAL STATEMENTS.
| | | | | | | | |
| | | |
| OCTOBER 31, 2017 | | JPMORGAN EXCHANGE-TRADED FUNDS | | | | | 65 | |
JPMorgan Diversified Return U.S. Equity ETF
SCHEDULE OF PORTFOLIO INVESTMENTS
AS OF OCTOBER 31, 2017 (continued)
| | | | | | | | |
| SHARES | | | INVESTMENTS | | VALUE($) | |
| | Common Stocks — continued | | | | |
| | | | Media — 2.9% | | | | |
| | 46 | | | Cable One, Inc. | | | 32,651 | |
| | 7,591 | | | CBS Corp. (Non-Voting), Class B | | | 426,007 | |
| | 2,040 | | | Charter Communications, Inc., Class A* | | | 681,707 | |
| | 24,483 | | | Comcast Corp., Class A | | | 882,122 | |
| | 12,137 | | | DISH Network Corp., Class A* | | | 589,130 | |
| | 16,234 | | | EW Scripps Co. (The), Class A* | | | 281,498 | |
| | 40,810 | | | Interpublic Group of Cos., Inc. (The) | | | 785,593 | |
| | 1,462 | | | John Wiley & Sons, Inc., Class A | | | 79,898 | |
| | 4,993 | | | Liberty Media Corp.-Liberty SiriusXM, Class A* | | | 208,258 | |
| | 12,838 | | | Omnicom Group, Inc. | | | 862,585 | |
| | 5,114 | | | Scripps Networks Interactive, Inc., Class A | | | 425,894 | |
| | 171,167 | | | Sirius XM Holdings, Inc. | | | 931,148 | |
| | 23,303 | | | TEGNA, Inc. | | | 284,996 | |
| | 9,393 | | | Time Warner, Inc. | | | 923,238 | |
| | 30,669 | | | Twenty-First Century Fox, Inc., Class A | | | 801,994 | |
| | 23,579 | | | Twenty-First Century Fox, Inc., Class B | | | 600,086 | |
| | 16,500 | | | Viacom, Inc., Class B | | | 396,495 | |
| | 11,218 | | | Walt Disney Co. (The) | | | 1,097,233 | |
| | | | | | | | |
| | | | | | | 10,290,533 | |
| | | | | | | | |
| | | | Metals & Mining — 0.6% | | | | |
| | 3,395 | | | Alcoa Corp.* | | | 162,213 | |
| | 12,659 | | | Freeport-McMoRan, Inc.* | | | 176,973 | |
| | 10,407 | | | Newmont Mining Corp. | | | 376,317 | |
| | 6,470 | | | Nucor Corp. | | | 374,160 | |
| | 2,298 | | | Reliance Steel & Aluminum Co. | | | 176,578 | |
| | 1,586 | | | Royal Gold, Inc. | | | 133,398 | |
| | 6,330 | | | Southern Copper Corp. (Peru) | | | 271,874 | |
| | 6,675 | | | Steel Dynamics, Inc. | | | 248,377 | |
| | 5,468 | | | United States Steel Corp. | | | 138,450 | |
| | | | | | | | |
| | | | | | | 2,058,340 | |
| | | | | | | | |
| | | | Mortgage Real Estate Investment Trusts (REITs) — 0.2% | |
| | 41,059 | | | Annaly Capital Management, Inc. | | | 470,536 | |
| | 14,075 | | | Chimera Investment Corp. | | | 257,573 | |
| | | | | | | | |
| | | | | | | 728,109 | |
| | | | | | | | |
| | | | Multiline Retail — 0.6% | | | | |
| | 10,029 | | | Dollar General Corp. | | | 810,744 | |
| | 7,256 | | | Kohl’s Corp. | | | 303,011 | |
| | 8,853 | | | Macy’s, Inc. | | | 166,082 | |
| | 6,294 | | | Nordstrom, Inc. | | | 249,557 | |
| | 7,604 | | | Target Corp. | | | 448,940 | |
| | | | | | | | |
| | | | | | | 1,978,334 | |
| | | | | | | | |
| | | | | | | | |
| SHARES | | | INVESTMENTS | | VALUE($) | |
| | | | | | | | |
| | | | Multi-Utilities — 5.2% | | | | |
| | 30,458 | | | Ameren Corp. | | | 1,888,091 | |
| | 56,096 | | | CenterPoint Energy, Inc. | | | 1,659,320 | |
| | 37,643 | | | CMS Energy Corp. | | | 1,820,792 | |
| | 23,521 | | | Consolidated Edison, Inc. | | | 2,023,982 | |
| | 20,497 | | | Dominion Energy, Inc. | | | 1,663,127 | |
| | 16,742 | | | DTE Energy Co. | | | 1,849,321 | |
| | 70,333 | | | NiSource, Inc. | | | 1,854,681 | |
| | 39,888 | | | Public Service Enterprise Group, Inc. | | | 1,962,490 | |
| | 15,906 | | | Sempra Energy | | | 1,868,955 | |
| | 29,990 | | | WEC Energy Group, Inc. | | | 2,021,026 | |
| | | | | | | | |
| | | | | | | 18,611,785 | |
| | | | | | | | |
| | | | Oil, Gas & Consumable Fuels — 3.6% | | | | |
| | 5,111 | | | Andeavor | | | 542,993 | |
| | 12,472 | | | Chevron Corp. | | | 1,445,380 | |
| | 13,539 | | | ConocoPhillips | | | 692,520 | |
| | 8,593 | | | CONSOL Energy, Inc.* | | | 138,605 | |
| | 17,263 | | | Exxon Mobil Corp. | | | 1,438,871 | |
| | 2,790 | | | Gulfport Energy Corp.* | | | 38,223 | |
| | 7,743 | | | Hess Corp. | | | 341,931 | |
| | 13,180 | | | HollyFrontier Corp. | | | 487,001 | |
| | 29,847 | | | Kinder Morgan, Inc. | | | 540,529 | |
| | 12,354 | | | Marathon Oil Corp. | | | 175,674 | |
| | 9,799 | | | Marathon Petroleum Corp. | | | 585,392 | |
| | 9,547 | | | Murphy Oil Corp. | | | 255,382 | |
| | 8,249 | | | Occidental Petroleum Corp. | | | 532,638 | |
| | 18,328 | | | ONEOK, Inc. | | | 994,661 | |
| | 15,172 | | | Parsley Energy, Inc., Class A* | | | 403,575 | |
| | 14,766 | | | Phillips 66 | | | 1,344,887 | |
| | 3,720 | | | Pioneer Natural Resources Co. | | | 556,772 | |
| | 10,420 | | | QEP Resources, Inc.* | | | 93,259 | |
| | 8,864 | | | Rice Energy, Inc.* | | | 251,294 | |
| | 9,942 | | | Targa Resources Corp. | | | 412,593 | |
| | 10,422 | | | Valero Energy Corp. | | | 822,192 | |
| | 16,828 | | | Williams Cos., Inc. (The) | | | 479,598 | |
| | 19,021 | | | WPX Energy, Inc.* | | | 214,557 | |
| | | | | | | | |
| | | | | | | 12,788,527 | |
| | | | | | | | |
| | | | Paper & Forest Products — 0.0% (a) | | | | |
| | 3,531 | | | Domtar Corp. | | | 167,087 | |
| | | | | | | | |
| | | | Personal Products — 0.6% | | | | |
| | 9,603 | | | Edgewell Personal Care Co.* | | | 623,523 | |
| | 10,987 | | | Estee Lauder Cos., Inc. (The), Class A | | | 1,228,457 | |
| | 6,499 | | | Nu Skin Enterprises, Inc., Class A | | | 413,401 | |
| | | | | | | | |
| | | | | | | 2,265,381 | |
| | | | | | | | |
SEE NOTES TO FINANCIAL STATEMENTS.
| | | | | | |
| | | |
| 66 | | | | JPMORGAN EXCHANGE-TRADED FUNDS | | OCTOBER 31, 2017 |
| | | | | | | | |
| SHARES | | | INVESTMENTS | | VALUE($) | |
| | Common Stocks — continued | | | | |
| | | | Pharmaceuticals — 1.8% | | | | |
| | 10,539 | | | Bristol-Myers Squibb Co. | | | 649,835 | |
| | 9,993 | | | Eli Lilly & Co. | | | 818,826 | |
| | 11,827 | | | Johnson & Johnson | | | 1,648,802 | |
| | 15,763 | | | Merck & Co., Inc. | | | 868,384 | |
| | 35,510 | | | Pfizer, Inc. | | | 1,244,981 | |
| | 19,226 | | | Zoetis, Inc. | | | 1,227,003 | |
| | | | | | | | |
| | | | | | | 6,457,831 | |
| | | | | | | | |
| | | | Professional Services — 0.3% | | | | |
| | 521 | | | Dun & Bradstreet Corp. (The) | | | 60,868 | |
| | 3,227 | | | Equifax, Inc. | | | 350,226 | |
| | 2,026 | | | Nielsen Holdings plc | | | 75,104 | |
| | 2,837 | | | Robert Half International, Inc. | | | 146,872 | |
| | 4,240 | | | Verisk Analytics, Inc.* | | | 360,612 | |
| | | | | | | | |
| | | | | | | 993,682 | |
| | | | | | | | |
| | | | Real Estate Management & Development — 0.1% | |
| | 3,972 | | | CBRE Group, Inc., Class A* | | | 156,179 | |
| | 278 | | | Jones Lang LaSalle, Inc. | | | 35,998 | |
| | | | | | | | |
| | | | | | | 192,177 | |
| | | | | | | | |
| | | | Road & Rail — 0.6% | | | | |
| | 5,758 | | | CSX Corp. | | | 290,376 | |
| | 5,197 | | | JB Hunt Transport Services, Inc. | | | 552,909 | |
| | 3,711 | | | Norfolk Southern Corp. | | | 487,700 | |
| | 3,119 | | | Ryder System, Inc. | | | 252,888 | |
| | 4,759 | | | Union Pacific Corp. | | | 551,044 | |
| | | | | | | | |
| | | | | | | 2,134,917 | |
| | | | | | | | |
| | | | Semiconductors & Semiconductor Equipment — 3.9% | |
| | 24,143 | | | Advanced Micro Devices, Inc.* | | | 265,211 | |
| | 9,587 | | | Analog Devices, Inc. | | | 875,293 | |
| | 15,354 | | | Applied Materials, Inc. | | | 866,426 | |
| | 2,720 | | | Broadcom Ltd. | | | 717,835 | |
| | 29,403 | | | Intel Corp. | | | 1,337,542 | |
| | 6,445 | | | KLA-Tencor Corp. | | | 701,796 | |
| | 3,788 | | | Lam Research Corp. | | | 790,063 | |
| | 29,650 | | | Marvell Technology Group Ltd. (Bermuda) | | | 547,636 | |
| | 20,605 | | | Maxim Integrated Products, Inc. | | | 1,082,587 | |
| | 10,496 | | | Microchip Technology, Inc. | | | 995,021 | |
| | 12,445 | | | Micron Technology, Inc.* | | | 551,438 | |
| | 2,490 | | | NVIDIA Corp. | | | 514,957 | |
| | 4,751 | | | NXP Semiconductors NV (Netherlands)* | | | 556,105 | |
| | 11,682 | | | ON Semiconductor Corp.* | | | 249,060 | |
| | 13,112 | | | QUALCOMM, Inc. | | | 668,843 | |
| | 4,941 | | | Skyworks Solutions, Inc. | | | 562,582 | |
| | 11,866 | | | Teradyne, Inc. | | | 508,933 | |
| | | | | | | | |
| SHARES | | | INVESTMENTS | | VALUE($) | |
| | | | | | | | |
| | | | Semiconductors & Semiconductor Equipment — continued | |
| | 11,952 | | | Texas Instruments, Inc. | | | 1,155,639 | |
| | 1,630 | | | Versum Materials, Inc. | | | 68,590 | |
| | 13,304 | | | Xilinx, Inc. | | | 980,372 | |
| | | | | | | | |
| | | | | | | 13,995,929 | |
| | | | | | | | |
| | | | Software — 3.3% | | | | |
| | 11,509 | | | Activision Blizzard, Inc. | | | 753,724 | |
| | 6,737 | | | Adobe Systems, Inc.* | | | 1,180,053 | |
| | 20,516 | | | CA, Inc. | | | 664,308 | |
| | 17,009 | | | Cadence Design Systems, Inc.* | | | 734,108 | |
| | 8,461 | | | Citrix Systems, Inc.* | | | 698,963 | |
| | 8,515 | | | Dell Technologies, Inc., Class V* | | | 704,787 | |
| | 7,006 | | | Electronic Arts, Inc.* | | | 837,918 | |
| | 5,697 | | | Intuit, Inc. | | | 860,361 | |
| | 16,066 | | | Microsoft Corp. | | | 1,336,370 | |
| | 18,879 | | | Oracle Corp. | | | 960,941 | |
| | 5,995 | | | Red Hat, Inc.* | | | 724,376 | |
| | 21,660 | | | Symantec Corp. | | | 703,950 | |
| | 5,487 | | | Take-Two Interactive Software, Inc.* | | | 607,137 | |
| | 8,445 | | | VMware, Inc., Class A* | | | 1,010,782 | |
| | | | | | | | |
| | | | | | | 11,777,778 | |
| | | | | | | | |
| | | | Specialty Retail — 2.4% | | | | |
| | 8,151 | | | AutoNation, Inc.* | | | 386,357 | |
| | 6,525 | | | Best Buy Co., Inc. | | | 365,270 | |
| | 5,220 | | | Burlington Stores, Inc.* | | | 490,106 | |
| | 8,207 | | | CarMax, Inc.* | | | 616,346 | |
| | 6,786 | | | Dick’s Sporting Goods, Inc. | | | 166,053 | |
| | 8,881 | | | Foot Locker, Inc. | | | 267,140 | |
| | 5,453 | | | GameStop Corp., Class A | | | 101,917 | |
| | 9,262 | | | Gap, Inc. (The) | | | 240,719 | |
| | 8,106 | | | Home Depot, Inc. (The) | | | 1,343,813 | |
| | 10,665 | | | Lowe’s Cos., Inc. | | | 852,667 | |
| | 12,146 | | | Ross Stores, Inc. | | | 771,150 | |
| | 5,433 | | | Signet Jewelers Ltd. | | | 356,242 | |
| | 7,692 | | | Tiffany & Co. | | | 720,125 | |
| | 13,878 | | | TJX Cos., Inc. (The) | | | 968,684 | |
| | 5,084 | | | Tractor Supply Co. | | | 306,362 | |
| | 3,568 | | | Urban Outfitters, Inc.* | | | 87,487 | |
| | 7,160 | | | Williams-Sonoma, Inc. | | | 369,456 | |
| | | | | | | | |
| | | | | | | 8,409,894 | |
| | | | | | | | |
| | | | Technology Hardware, Storage & Peripherals — 1.2% | |
| | 6,233 | | | Apple, Inc. | | | 1,053,626 | |
| | 32,068 | | | Diebold Nixdorf, Inc. | | | 618,913 | |
| | 47,032 | | | Hewlett Packard Enterprise Co. | | | 654,686 | |
| | 40,466 | | | HP, Inc. | | | 872,042 | |
SEE NOTES TO FINANCIAL STATEMENTS.
| | | | | | | | |
| | | |
| OCTOBER 31, 2017 | | JPMORGAN EXCHANGE-TRADED FUNDS | | | | | 67 | |
JPMorgan Diversified Return U.S. Equity ETF
SCHEDULE OF PORTFOLIO INVESTMENTS
AS OF OCTOBER 31, 2017
| | | | | | | | |
| SHARES | | | INVESTMENTS | | VALUE($) | |
| | Common Stocks — continued | | | | |
| | | | Technology Hardware, Storage & Peripherals — continued | |
| | 11,869 | | | NetApp, Inc. | | | 527,221 | |
| | 4,745 | | | Western Digital Corp. | | | 423,586 | |
| | | | | | | | |
| | | | | | | 4,150,074 | |
| | | | | | | | |
| | | | Textiles, Apparel & Luxury Goods — 1.0% | | | | |
| | 24,906 | | | Hanesbrands, Inc. | | | 560,385 | |
| | 14,297 | | | Michael Kors Holdings Ltd.* | | | 697,837 | |
| | 1,941 | | | NIKE, Inc., Class B | | | 106,736 | |
| | 5,097 | | | PVH Corp. | | | 646,350 | |
| | 5,820 | | | Skechers USA, Inc., Class A* | | | 185,774 | |
| | 15,482 | | | Tapestry, Inc. | | | 633,988 | |
| | 11,244 | | | VF Corp. | | | 783,145 | |
| | | | | | | | |
| | | | | | | 3,614,215 | |
| | | | | | | | |
| | | | Tobacco — 0.6% | | | | |
| | 17,786 | | | Altria Group, Inc. | | | 1,142,217 | |
| | 8,710 | | | Philip Morris International, Inc. | | | 911,414 | |
| | | | | | | | |
| | | | | | | 2,053,631 | |
| | | | | | | | |
| | | | Trading Companies & Distributors — 0.3% | |
| | 8,608 | | | Fastenal Co. | | | 404,318 | |
| | 2,839 | | | United Rentals, Inc.* | | | 401,662 | |
| | 1,428 | | | WW Grainger, Inc. | | | 282,315 | |
| | | | | | | | |
| | | | | | | 1,088,295 | |
| | | | | | | | |
| | | | Water Utilities — 0.5% | | | | |
| | 19,314 | | | American Water Works Co., Inc. | | | 1,694,997 | |
| | | | | | | | |
| | | | | | | | |
| SHARES | | | INVESTMENTS | | VALUE($) | |
| | | | | | | | |
| | | | Wireless Telecommunication Services — 0.4% | |
| | 7,835 | | | Telephone & Data Systems, Inc. | | | 228,390 | |
| | 17,216 | | | T-Mobile US, Inc.* | | | 1,029,000 | |
| | 2,193 | | | United States Cellular Corp.* | | | 80,242 | |
| | | | | | | | |
| | | | | | | 1,337,632 | |
| | | | | | | | |
| | | | Total Common Stocks
(Cost $324,590,717) | | | 352,257,988 | |
| | | | | | | | |
| | Short-Term Investment — 0.4% | | | | |
| | | | Investment Company — 0.4% | | | | |
| | 1,543,961 | | | JPMorgan U.S. Government Money Market Fund, Institutional Class Shares, 0.92% (b)(c)
(Cost $1,543,961) | | | 1,543,961 | |
| | | | | | | | |
| | | | Total Investments — 99.3%
(Cost $326,134,678) | | | 353,801,949 | |
| | | | Other Assets Less Liabilities — 0.7% | | | 2,496,822 | |
| | | | | | | | |
| | | | Net Assets — 100.0% | | $ | 356,298,771 | |
| | | | | | | | |
Percentages indicated are based on net assets.
| | |
| * | | — Non-income producing security. |
| (a) | | — Represents less than 0.05% of net assets. |
| (b) | | — Affiliated company as defined under the Investment Company Act of 1940. |
| (c) | | — The rate shown was the current yield as of October 31, 2017. |
| | | | | | | | | | | | | | | | | | |
| Futures contracts outstanding as of October 31, 2017: | |
| DESCRIPTION | | NUMBER OF
CONTRACTS | | EXPIRATION
DATE | | | TRADING
CURRENCY | | | NOTIONAL
AMOUNT ($) | | | VALUE AND
UNREALIZED
APPRECIATION
(DEPRECIATION) ($) | |
Long Contracts | | | | | | | | | | | | | | | | | | |
| S&P 500 E-Mini Index | | 23 | | | 12/2017 | | | | USD | | | | 2,958,605 | | | | 23,608 | |
| | | | | | | | | | | | | | | | | | |
| | | | | | | | | | | | | | | | | 23,608 | |
| | | | | | | | | | | | | | | | | | |
Abbreviations
| | |
| USD | | — United States Dollar |
SEE NOTES TO FINANCIAL STATEMENTS.
| | | | | | |
| | | |
| 68 | | | | JPMORGAN EXCHANGE-TRADED FUNDS | | OCTOBER 31, 2017 |
JPMorgan Diversified Return U.S. Mid Cap Equity ETF
SCHEDULE OF PORTFOLIO INVESTMENTS
AS OF OCTOBER 31, 2017
| | | | | | | | |
| SHARES | | | INVESTMENTS | | VALUE($) | |
| | Common Stocks — 99.8% | |
| | | | Aerospace & Defense — 1.0% | | | | |
| | 2,168 | | | Arconic, Inc. | | | 54,460 | |
| | 1,603 | | | BWX Technologies, Inc. | | | 96,052 | |
| | 1,855 | | | Hexcel Corp. | | | 112,580 | |
| | 309 | | | Huntington Ingalls Industries, Inc. | | | 71,945 | |
| | 451 | | | L3 Technologies, Inc. | | | 84,418 | |
| | 669 | | | Rockwell Collins, Inc. | | | 90,717 | |
| | 854 | | | Spirit AeroSystems Holdings, Inc., Class A | | | 68,405 | |
| | 1,364 | | | Textron, Inc. | | | 71,937 | |
| | | | | | | | |
| | | | | | | 650,514 | |
| | | | | | | | |
| | | | Air Freight & Logistics — 0.4% | | | | |
| | 1,834 | | | CH Robinson Worldwide, Inc. | | | 144,024 | |
| | 1,335 | | | Expeditors International of Washington, Inc. | | | 77,937 | |
| | | | | | | | |
| | | | | | | 221,961 | |
| | | | | | | | |
| | | | Airlines — 0.8% | | | | |
| | 1,177 | | | Alaska Air Group, Inc. | | | 77,717 | |
| | 1,520 | | | American Airlines Group, Inc. | | | 71,166 | |
| | 973 | | | Copa Holdings SA, Class A (Panama) | | | 119,864 | |
| | 4,045 | | | JetBlue Airways Corp.* | | | 77,462 | |
| | 1,718 | | | Spirit Airlines, Inc.* | | | 63,721 | |
| | 1,053 | | | United Continental Holdings, Inc.* | | | 61,579 | |
| | | | | | | | |
| | | | | | | 471,509 | |
| | | | | | | | |
| | | | Auto Components — 1.0% | | | | |
| | 186 | | | Adient plc | | | 15,691 | |
| | 1,410 | | | Delphi Automotive plc | | | 140,126 | |
| | 9,289 | | | Gentex Corp. | | | 180,300 | |
| | 3,386 | | | Goodyear Tire & Rubber Co. (The) | | | 103,578 | |
| | 955 | | | Lear Corp. | | | 167,688 | |
| | 353 | | | Visteon Corp.* | | | 44,492 | |
| | | | | | | | |
| | | | | | | 651,875 | |
| | | | | | | | |
| | | | Automobiles — 0.4% | | | | |
| | 2,858 | | | Harley-Davidson, Inc. | | | 135,298 | |
| | 1,004 | | | Thor Industries, Inc. | | | 136,765 | |
| | | | | | | | |
| | | | | | | 272,063 | |
| | | | | | | | |
| | | | Banks — 2.5% | | | | |
| | 910 | | | Associated Banc-Corp. | | | 23,023 | |
| | 633 | | | Bank of Hawaii Corp. | | | 51,659 | |
| | 936 | | | Bank of the Ozarks, Inc. | | | 43,636 | |
| | 1,066 | | | BankUnited, Inc. | | | 37,150 | |
| | 1,288 | | | CIT Group, Inc. | | | 60,047 | |
| | 1,162 | | | Citizens Financial Group, Inc. | | | 44,168 | |
| | 662 | | | Comerica, Inc. | | | 52,013 | |
| | 1,448 | | | Commerce Bancshares, Inc. | | | 84,216 | |
| | 859 | | | Cullen/Frost Bankers, Inc. | | | 84,612 | |
| | | | | | | | |
| SHARES | | | INVESTMENTS | | VALUE($) | |
| | | | | | | | |
| | | | Banks — continued | | | | |
| | 901 | | | East West Bancorp, Inc. | | | 53,916 | |
| | 2,197 | | | Fifth Third Bancorp | | | 63,493 | |
| | 2,325 | | | First Horizon National Corp. | | | 43,640 | |
| | 607 | | | First Republic Bank | | | 59,122 | |
| | 2,852 | | | FNB Corp. | | | 38,473 | |
| | 5,655 | | | Huntington Bancshares, Inc. | | | 78,039 | |
| | 2,536 | | | KeyCorp | | | 46,282 | |
| | 603 | | | M&T Bank Corp. | | | 100,562 | |
| | 788 | | | PacWest Bancorp | | | 38,076 | |
| | 4,025 | | | People’s United Financial, Inc. | | | 75,107 | |
| | 906 | | | Popular, Inc. (Puerto Rico) | | | 33,232 | |
| | 3,336 | | | Regions Financial Corp. | | | 51,641 | |
| | 1,282 | | | SunTrust Banks, Inc. | | | 77,189 | |
| | 243 | | | SVB Financial Group* | | | 53,285 | |
| | 1,715 | | | Synovus Financial Corp. | | | 80,348 | |
| | 868 | | | Webster Financial Corp. | | | 47,731 | |
| | 1,002 | | | Western Alliance Bancorp* | | | 55,912 | |
| | 991 | | | Zions Bancorp | | | 46,042 | |
| | | | | | | | |
| | | | | | | 1,522,614 | |
| | | | | | | | |
| | | | Beverages — 0.9% | | | | |
| | 4,103 | | | Brown-Forman Corp., Class B | | | 233,953 | |
| | 1,916 | | | Dr Pepper Snapple Group, Inc. | | | 164,125 | |
| | 2,358 | | | Molson Coors Brewing Co., Class B | | | 190,691 | |
| | | | | | | | |
| | | | | | | 588,769 | |
| | | | | | | | |
| | | | Biotechnology — 0.5% | | | | |
| | 2,417 | | | Exelixis, Inc.* | | | 59,918 | |
| | 873 | | | Incyte Corp.* | | | 98,867 | |
| | 1,176 | | | United Therapeutics Corp.* | | | 139,462 | |
| | | | | | | | |
| | | | | | | 298,247 | |
| | | | | | | | |
| | | | Building Products — 0.9% | | | | |
| | 1,395 | | | Allegion plc | | | 116,329 | |
| | 1,768 | | | AO Smith Corp. | | | 104,666 | |
| | 432 | | | Armstrong World Industries, Inc.* | | | 22,075 | |
| | 1,280 | | | Fortune Brands Home & Security, Inc. | | | 84,557 | |
| | 644 | | | Lennox International, Inc. | | | 123,088 | |
| | 1,178 | | | Owens Corning | | | 97,409 | |
| | 535 | | | USG Corp.* | | | 18,366 | |
| | | | | | | | |
| | | | | | | 566,490 | |
| | | | | | | | �� |
| | | | Capital Markets — 2.0% | | | | |
| | 503 | | | Ameriprise Financial, Inc. | | | 78,740 | |
| | 554 | | | Cboe Global Markets, Inc. | | | 62,635 | |
| | 1,346 | | | E*TRADE Financial Corp.* | | | 58,672 | |
| | 1,130 | | | Eaton Vance Corp. | | | 57,031 | |
SEE NOTES TO FINANCIAL STATEMENTS.
| | | | | | | | |
| | | |
| OCTOBER 31, 2017 | | JPMORGAN EXCHANGE-TRADED FUNDS | | | | | 69 | |
JPMorgan Diversified Return U.S. Mid Cap Equity ETF
SCHEDULE OF PORTFOLIO INVESTMENTS
AS OF OCTOBER 31, 2017 (continued)
| | | | | | | | |
| SHARES | | | INVESTMENTS | | VALUE($) | |
| | Common Stocks — continued | |
| | | | Capital Markets — continued | | | | |
| | 906 | | | FactSet Research Systems, Inc. | | | 172,022 | |
| | 1,729 | | | Federated Investors, Inc., Class B | | | 53,720 | |
| | 994 | | | Invesco Ltd. | | | 35,575 | |
| | 836 | | | Lazard Ltd., Class A | | | 39,743 | |
| | 1,507 | | | Legg Mason, Inc. | | | 57,537 | |
| | 934 | | | LPL Financial Holdings, Inc. | | | 46,336 | |
| | 336 | | | MarketAxess Holdings, Inc. | | | 58,464 | |
| | 583 | | | MSCI, Inc. | | | 68,421 | |
| | 755 | | | Nasdaq, Inc. | | | 54,851 | |
| | 867 | | | Northern Trust Corp. | | | 81,082 | |
| | 829 | | | Raymond James Financial, Inc. | | | 70,283 | |
| | 1,590 | | | SEI Investments Co. | | | 102,571 | |
| | 914 | | | T Rowe Price Group, Inc. | | | 84,910 | |
| | 1,123 | | | TD Ameritrade Holding Corp. | | | 56,139 | |
| | | | | | | | |
| | | | | | | 1,238,732 | |
| | | | | | | | |
| | | | Chemicals — 3.6% | | | | |
| | 1,220 | | | Albemarle Corp. | | | 171,886 | |
| | 1,424 | | | Ashland Global Holdings, Inc. | | | 96,804 | |
| | 1,952 | | | Cabot Corp. | | | 118,994 | |
| | 1,473 | | | Celanese Corp., Series A | | | 153,649 | |
| | 1,739 | | | CF Industries Holdings, Inc. | | | 66,047 | |
| | 1,146 | | | Chemours Co. (The) | | | 64,875 | |
| | 1,799 | | | Eastman Chemical Co. | | | 163,367 | |
| | 1,309 | | | FMC Corp. | | | 121,554 | |
| | 3,150 | | | Huntsman Corp. | | | 100,863 | |
| | 1,051 | | | International Flavors & Fragrances, Inc. | | | 154,938 | |
| | 2,500 | | | Mosaic Co. (The) | | | 55,850 | |
| | 186 | | | NewMarket Corp. | | | 74,473 | |
| | 2,669 | | | Olin Corp. | | | 97,499 | |
| | 3,277 | | | RPM International, Inc. | | | 174,762 | |
| | 2,183 | | | Scotts Miracle-Gro Co. (The) | | | 217,470 | |
| | 1,573 | | | Valvoline, Inc. | | | 37,783 | |
| | 1,959 | | | Westlake Chemical Corp. | | | 166,339 | |
| | 2,223 | | | WR Grace & Co. | | | 170,037 | |
| | | | | | | | |
| | | | | | | 2,207,190 | |
| | | | | | | | |
| | | | Commercial Services & Supplies — 1.4% | | | | |
| | 821 | | | Cintas Corp. | | | 122,362 | |
| | 7,744 | | | Copart, Inc.* | | | 281,029 | |
| | 3,882 | | | KAR Auction Services, Inc. | | | 183,735 | |
| | 6,212 | | | Pitney Bowes, Inc. | | | 85,353 | |
| | 2,871 | | | Republic Services, Inc. | | | 186,816 | |
| | | | | | | | |
| | | | | | | 859,295 | |
| | | | | | | | |
| | | | | | | | |
| SHARES | | | INVESTMENTS | | VALUE($) | |
| | |
| | | | Communications Equipment — 1.5% | | | | |
| | 516 | | | Arista Networks, Inc.* | | | 103,143 | |
| | 188 | | | ARRIS International plc* | | | 5,358 | |
| | 6,209 | | | Brocade Communications Systems, Inc. | | | 72,335 | |
| | 4,019 | | | CommScope Holding Co., Inc.* | | | 129,171 | |
| | 1,058 | | | F5 Networks, Inc.* | | | 128,304 | |
| | 1,614 | | | Harris Corp. | | | 224,862 | |
| | 4,143 | | | Juniper Networks, Inc. | | | 102,871 | |
| | 2,012 | | | Motorola Solutions, Inc. | | | 182,166 | |
| | | | | | | | |
| | | | | | | 948,210 | |
| | | | | | | | |
| | | | Construction & Engineering — 0.3% | | | | |
| | 296 | | | Jacobs Engineering Group, Inc. | | | 17,230 | |
| | 1,575 | | | Quanta Services, Inc.* | | | 59,425 | |
| | 613 | | | Valmont Industries, Inc. | | | 97,406 | |
| | | | | | | | |
| | | | | | | 174,061 | |
| | | | | | | | |
| | | | Construction Materials — 0.2% | | | | |
| | 495 | | | Eagle Materials, Inc. | | | 52,257 | |
| | 272 | | | Martin Marietta Materials, Inc. | | | 58,983 | |
| | | | | | | | |
| | | | | | | 111,240 | |
| | | | | | | | |
| | | | Consumer Finance — 0.4% | | | | |
| | 158 | | | Credit Acceptance Corp.* | | | 45,303 | |
| | 1,098 | | | Discover Financial Services | | | 73,050 | |
| | 2,391 | | | Navient Corp. | | | 29,792 | |
| | 1,684 | | | Santander Consumer USA Holdings, Inc.* | | | 28,022 | |
| | 4,350 | | | SLM Corp.* | | | 46,067 | |
| | 1,152 | | | Synchrony Financial | | | 37,578 | |
| | | | | | | | |
| | | | | | | 259,812 | |
| | | | | | | | |
| | | | Containers & Packaging — 1.7% | | | | |
| | 976 | | | AptarGroup, Inc. | | | 84,980 | |
| | 1,975 | | | Avery Dennison Corp. | | | 209,686 | |
| | 1,285 | | | Bemis Co., Inc. | | | 57,851 | |
| | 1,442 | | | Berry Global Group, Inc.* | | | 85,727 | |
| | 985 | | | Crown Holdings, Inc.* | | | 59,267 | |
| | 5,226 | | | Graphic Packaging Holding Co. | | | 80,951 | |
| | 1,906 | | | International Paper Co. | | | 109,157 | |
| | 1,935 | | | Owens-Illinois, Inc.* | | | 46,227 | |
| | 863 | | | Packaging Corp. of America | | | 100,341 | |
| | 1,489 | | | Sealed Air Corp. | | | 65,858 | |
| | 2,327 | | | Silgan Holdings, Inc. | | | 68,065 | |
| | 1,131 | | | Sonoco Products Co. | | | 58,575 | |
| | 946 | | | WestRock Co. | | | 58,018 | |
| | | | | | | | |
| | | | | | | 1,084,703 | |
| | | | | | | | |
SEE NOTES TO FINANCIAL STATEMENTS.
| | | | | | |
| | | |
| 70 | | | | JPMORGAN EXCHANGE-TRADED FUNDS | | OCTOBER 31, 2017 |
| | | | | | | | |
| SHARES | | | INVESTMENTS | | VALUE($) | |
| | Common Stocks — continued | |
| | | | Distributors — 0.5% | | | | |
| | 1,930 | | | Genuine Parts Co. | | | 170,284 | |
| | 46 | | | LKQ Corp.* | | | 1,734 | |
| | 1,195 | | | Pool Corp. | | | 144,332 | |
| | | | | | | | |
| | | | | | | 316,350 | |
| | | | | | | | |
| | | | Diversified Consumer Services — 0.7% | | | | |
| | 248 | | | Graham Holdings Co., Class B | | | 138,000 | |
| | 4,225 | | | Service Corp. International | | | 149,818 | |
| | 3,162 | | | ServiceMaster Global Holdings, Inc.* | | | 148,962 | |
| | | | | | | | |
| | | | | | | 436,780 | |
| | | | | | | | |
| | | | Diversified Financial Services — 0.2% | | | | |
| | 3,823 | | | Leucadia National Corp. | | | 96,722 | |
| | | | | | | | |
| | | | Electric Utilities — 5.0% | | | | |
| | 7,654 | | | Alliant Energy Corp. | | | 331,112 | |
| | 3,932 | | | Edison International | | | 314,363 | |
| | 3,061 | | | Entergy Corp. | | | 264,042 | |
| | 4,596 | | | Eversource Energy | | | 287,893 | |
| | 10,398 | | | Great Plains Energy, Inc. | | | 341,366 | |
| | 3,742 | | | Hawaiian Electric Industries, Inc. | | | 136,433 | |
| | 4,258 | | | OGE Energy Corp. | | | 156,865 | |
| | 3,636 | | | Pinnacle West Capital Corp. | | | 318,914 | |
| | 8,135 | | | PPL Corp. | | | 305,551 | |
| | 5,686 | | | Westar Energy, Inc. | | | 304,087 | |
| | 6,651 | | | Xcel Energy, Inc. | | | 329,358 | |
| | | | | | | | |
| | | | | | | 3,089,984 | |
| | | | | | | | |
| | | | Electrical Equipment — 0.7% | | | | |
| | 1,685 | | | AMETEK, Inc. | | | 113,721 | |
| | 1,075 | | | Hubbell, Inc. | | | 135,257 | |
| | 389 | | | Regal Beloit Corp. | | | 31,567 | |
| | 655 | | | Rockwell Automation, Inc. | | | 131,537 | |
| | | | | | | | |
| | | | | | | 412,082 | |
| | | | | | | | |
| | | | Electronic Equipment, Instruments & Components — 1.7% | |
| | 1,674 | | | Amphenol Corp., Class A | | | 145,638 | |
| | 970 | | | Arrow Electronics, Inc.* | | | 81,082 | |
| | 953 | | | Avnet, Inc. | | | 37,930 | |
| | 1,405 | | | AVX Corp. | | | 26,470 | |
| | 3,284 | | | CDW Corp. | | | 229,880 | |
| | 466 | | | Cognex Corp. | | | 57,388 | |
| | 180 | | | Coherent, Inc.* | | | 47,288 | |
| | 295 | | | Dolby Laboratories, Inc., Class A | | | 17,092 | |
| | 2,512 | | | FLIR Systems, Inc. | | | 117,612 | |
| | 402 | | | IPG Photonics Corp.* | | | 85,590 | |
| | 2,147 | | | Jabil, Inc. | | | 60,717 | |
| | 863 | | | Keysight Technologies, Inc.* | | | 38,550 | |
| | | | | | | | |
| SHARES | | | INVESTMENTS | | VALUE($) | |
| | | | | | | | |
| | | | Electronic Equipment, Instruments &
Components — continued | |
| | 2,032 | | | National Instruments Corp. | | | 91,440 | |
| | | | | | | | |
| | | | | | | 1,036,677 | |
| | | | | | | | |
| | | | Energy Equipment & Services — 0.9% | |
| | 4,108 | | | Baker Hughes a GE Co. | | | 129,114 | |
| | 526 | | | Dril-Quip, Inc.* | | | 22,145 | |
| | 1,773 | | | Helmerich & Payne, Inc. | | | 96,292 | |
| | 3,294 | | | Nabors Industries Ltd. | | | 18,545 | |
| | 2,165 | | | National Oilwell Varco, Inc. | | | 74,021 | |
| | 2,281 | | | Oceaneering International, Inc. | | | 46,122 | |
| | 1,867 | | | Patterson-UTI Energy, Inc. | | | 36,929 | |
| | 4,267 | | | RPC, Inc. | | | 103,731 | |
| | 5,681 | | | Transocean Ltd.* | | | 59,651 | |
| | | | | | | | |
| | | | | | | 586,550 | |
| | | | | | | | |
| | | | Equity Real Estate Investment Trusts (REITs) — 3.8% | |
| | 513 | | | Alexandria Real Estate Equities, Inc. | | | 63,591 | |
| | 308 | | | American Campus Communities, Inc. | | | 12,807 | |
| | 2,483 | | | American Homes 4 Rent, Class A | | | 52,838 | |
| | 543 | | | AvalonBay Communities, Inc. | | | 98,462 | |
| | 2,372 | | | Brandywine Realty Trust | | | 41,486 | |
| | 1,474 | | | Brixmor Property Group, Inc. | | | 25,751 | |
| | 675 | | | Camden Property Trust | | | 61,587 | |
| | 2,504 | | | Colony NorthStar, Inc., Class A | | | 30,749 | |
| | 1,077 | | | CoreCivic, Inc. | | | 26,559 | |
| | 487 | | | CoreSite Realty Corp. | | | 53,935 | |
| | 154 | | | CubeSmart | | | 4,192 | |
| | 1,163 | | | DCT Industrial Trust, Inc. | | | 67,477 | |
| | 949 | | | DDR Corp. | | | 7,279 | |
| | 1,113 | | | Digital Realty Trust, Inc. | | | 131,824 | |
| | 1,995 | | | Douglas Emmett, Inc. | | | 79,381 | |
| | 2,800 | | | Duke Realty Corp. | | | 79,744 | |
| | 536 | | | EPR Properties | | | 37,080 | |
| | 1,509 | | | Equity Commonwealth* | | | 45,345 | |
| | 729 | | | Equity LifeStyle Properties, Inc. | | | 64,502 | |
| | 82 | | | Federal Realty Investment Trust | | | 9,883 | |
| | 327 | | | Forest City Realty Trust, Inc., Class A | | | 8,054 | |
| | 1,631 | | | Gaming and Leisure Properties, Inc. | | | 59,597 | |
| | 1,816 | | | GGP, Inc. | | | 35,339 | |
| | 935 | | | Highwoods Properties, Inc. | | | 47,732 | |
| | 2,129 | | | Hospitality Properties Trust | | | 60,847 | |
| | 3,159 | | | Host Hotels & Resorts, Inc. | | | 61,790 | |
| | 1,256 | | | Hudson Pacific Properties, Inc. | | | 42,478 | |
| | 1,105 | | | Iron Mountain, Inc. | | | 44,200 | |
| | 86 | | | JBG SMITH Properties* | | | 2,684 | |
| | 771 | | | Kilroy Realty Corp. | | | 54,918 | |
SEE NOTES TO FINANCIAL STATEMENTS.
| | | | | | | | |
| | | |
| OCTOBER 31, 2017 | | JPMORGAN EXCHANGE-TRADED FUNDS | | | | | 71 | |
JPMorgan Diversified Return U.S. Mid Cap Equity ETF
SCHEDULE OF PORTFOLIO INVESTMENTS
AS OF OCTOBER 31, 2017 (continued)
| | | | | | | | |
| SHARES | | | INVESTMENTS | | VALUE($) | |
| | Common Stocks — continued | |
| | | | Equity Real Estate Investment Trusts (REITs) — continued | |
| | 963 | | | Lamar Advertising Co., Class A | | | 67,834 | |
| | 1,696 | | | Liberty Property Trust | | | 72,724 | |
| | 462 | | | Mid-America Apartment Communities, Inc. | | | 47,286 | |
| | 573 | | | National Retail Properties, Inc. | | | 23,023 | |
| | 1,218 | | | Omega Healthcare Investors, Inc. | | | 35,151 | |
| | 1,828 | | | Outfront Media, Inc. | | | 42,867 | |
| | 711 | | | Park Hotels & Resorts, Inc. | | | 20,470 | |
| | 2,642 | | | Piedmont Office Realty Trust, Inc., Class A | | | 51,096 | |
| | 1,507 | | | Prologis, Inc. | | | 97,322 | |
| | 1,308 | | | Rayonier, Inc. | | | 39,214 | |
| | 2,801 | | | Senior Housing Properties Trust | | | 51,538 | |
| | 525 | | | Sun Communities, Inc. | | | 47,387 | |
| | 1,936 | | | Tanger Factory Outlet Centers, Inc. | | | 44,044 | |
| | 681 | | | Taubman Centers, Inc. | | | 32,157 | |
| | 1,195 | | | Uniti Group, Inc. | | | 20,913 | |
| | 1,091 | | | Ventas, Inc. | | | 68,460 | |
| | 175 | | | Vornado Realty Trust | | | 13,101 | |
| | 1,225 | | | Weingarten Realty Investors | | | 37,301 | |
| | 1,031 | | | Welltower, Inc. | | | 69,036 | |
| | 1,663 | | | Weyerhaeuser Co. | | | 59,718 | |
| | 554 | | | WP Carey, Inc. | | | 37,755 | |
| | | | | | | | |
| | | | | | | 2,390,508 | |
| | | | | | | | |
| | | | Food & Staples Retailing — 0.3% | | | | |
| | 1,460 | | | Casey’s General Stores, Inc. | | | 167,272 | |
| | | | | | | | |
| | | | Food Products — 3.8% | | | | |
| | 1,369 | | | Blue Buffalo Pet Products, Inc.* | | | 39,605 | |
| | 1,286 | | | Bunge Ltd. | | | 88,451 | |
| | 3,438 | | | Campbell Soup Co. | | | 162,858 | |
| | 3,617 | | | Conagra Brands, Inc. | | | 123,557 | |
| | 8,725 | | | Flowers Foods, Inc. | | | 166,037 | |
| | 1,958 | | | Hershey Co. (The) | | | 207,901 | |
| | 4,643 | | | Hormel Foods Corp. | | | 144,676 | |
| | 1,402 | | | Ingredion, Inc. | | | 175,741 | |
| | 1,567 | | | JM Smucker Co. (The) | | | 166,180 | |
| | 3,407 | | | Kellogg Co. | | | 213,040 | |
| | 2,856 | | | Lamb Weston Holdings, Inc. | | | 145,627 | |
| | 2,589 | | | McCormick & Co., Inc. (Non-Voting) | | | 257,683 | |
| | 4,896 | | | Pilgrim’s Pride Corp.* | | | 155,595 | |
| | 3,496 | | | Pinnacle Foods, Inc. | | | 190,252 | |
| | 1,688 | | | Tyson Foods, Inc., Class A | | | 123,072 | |
| | | | | | | | |
| | | | | | | 2,360,275 | |
| | | | | | | | |
| | | | Gas Utilities — 1.3% | | | | |
| | 3,545 | | | Atmos Energy Corp. | | | 309,266 | |
| | 3,432 | | | National Fuel Gas Co. | | | 199,227 | |
| | | | | | | | |
| SHARES | | | INVESTMENTS | | VALUE($) | |
| | | | | | | | |
| | | | Gas Utilities — continued | | | | |
| | 6,265 | | | UGI Corp. | | | 299,843 | |
| | | | | | | | |
| | | | | | | 808,336 | |
| | | | | | | | |
| | | | Health Care Equipment & Supplies — 4.9% | | | | |
| | 863 | | | ABIOMED, Inc.* | | | 166,490 | |
| | 1,022 | | | Align Technology, Inc.* | | | 244,238 | |
| | 1,068 | | | Cooper Cos., Inc. (The) | | | 256,598 | |
| | 606 | | | CR Bard, Inc. | | | 198,204 | |
| | 3,964 | | | DENTSPLY SIRONA, Inc. | | | 242,081 | |
| | 1,333 | | | Edwards Lifesciences Corp.* | | | 136,273 | |
| | 3,176 | | | Hill-Rom Holdings, Inc. | | | 256,335 | |
| | 4,133 | | | Hologic, Inc.* | | | 156,434 | |
| | 1,041 | | | IDEXX Laboratories, Inc.* | | | 172,983 | |
| | 108 | | | Intuitive Surgical, Inc.* | | | 40,539 | |
| | 2,737 | | | ResMed, Inc. | | | 230,401 | |
| | 1,253 | | | STERIS plc | | | 116,942 | |
| | 1,068 | | | Teleflex, Inc. | | | 253,095 | |
| | 1,896 | | | Varian Medical Systems, Inc.* | | | 197,544 | |
| | 1,375 | | | West Pharmaceutical Services, Inc. | | | 139,425 | |
| | 1,684 | | | Zimmer Biomet Holdings, Inc. | | | 204,808 | |
| | | | | | | | |
| | | | | | | 3,012,390 | |
| | | | | | | | |
| | | | Health Care Providers & Services — 3.9% | | | | |
| | 3,112 | | | Acadia Healthcare Co., Inc.* | | | 97,592 | |
| | 1,286 | | | AmerisourceBergen Corp. | | | 98,958 | |
| | 291 | | | Brookdale Senior Living, Inc.* | | | 2,919 | |
| | 1,893 | | | Cardinal Health, Inc. | | | 117,177 | |
| | 2,360 | | | Centene Corp.* | | | 221,061 | |
| | 2,845 | | | DaVita, Inc.* | | | 172,805 | |
| | 1,960 | | | Envision Healthcare Corp.* | | | 83,496 | |
| | 3,537 | | | Henry Schein, Inc.* | | | 278,008 | |
| | 1,817 | | | Laboratory Corp. of America Holdings* | | | 279,291 | |
| | 3,025 | | | LifePoint Health, Inc.* | | | 145,654 | |
| | 3,377 | | | MEDNAX, Inc.* | | | 147,879 | |
| | 3,710 | | | Patterson Cos., Inc. | | | 137,270 | |
| | 2,241 | | | Quest Diagnostics, Inc. | | | 210,161 | |
| | 1,455 | | | Universal Health Services, Inc., Class B | | | 149,428 | |
| | 1,312 | | | WellCare Health Plans, Inc.* | | | 259,435 | |
| | | | | | | | |
| | | | | | | 2,401,134 | |
| | | | | | | | |
| | | | Health Care Technology — 0.5% | | | | |
| | 5,699 | | | Allscripts Healthcare Solutions, Inc.* | | | 76,823 | |
| | 2,012 | | | Cerner Corp.* | | | 135,850 | |
| | 1,512 | | | Veeva Systems, Inc., Class A* | | | 92,141 | |
| | | | | | | | |
| | | | | | | 304,814 | |
| | | | | | | | |
SEE NOTES TO FINANCIAL STATEMENTS.
| | | | | | |
| | | |
| 72 | | | | JPMORGAN EXCHANGE-TRADED FUNDS | | OCTOBER 31, 2017 |
| | | | | | | | |
| SHARES | | | INVESTMENTS | | VALUE($) | |
| | Common Stocks — continued | |
| | | | Hotels, Restaurants & Leisure — 3.1% | | | | |
| | 3,046 | | | Aramark | | | 133,080 | |
| | 1,333 | | | Choice Hotels International, Inc. | | | 92,977 | |
| | 1,675 | | | Darden Restaurants, Inc. | | | 137,802 | |
| | 548 | | | Domino’s Pizza, Inc. | | | 100,284 | |
| | 2,331 | | | Dunkin’ Brands Group, Inc. | | | 137,692 | |
| | 1,856 | | | Extended Stay America, Inc. | | | 36,786 | |
| | 328 | | | Hilton Grand Vacations, Inc.* | | | 13,435 | |
| | 2,184 | | | Hilton Worldwide Holdings, Inc. | | | 157,860 | |
| | 2,147 | | | International Game Technology plc | | | 50,454 | |
| | 3,798 | | | MGM Resorts International | | | 119,067 | |
| | 1,754 | | | Norwegian Cruise Line Holdings Ltd.* | | | 97,785 | |
| | 882 | | | Royal Caribbean Cruises Ltd. | | | 109,165 | |
| | 1,979 | | | Six Flags Entertainment Corp. | | | 124,261 | |
| | 720 | | | Vail Resorts, Inc. | | | 164,894 | |
| | 8,575 | | | Wendy’s Co. (The) | | | 130,426 | |
| | 1,309 | | | Wyndham Worldwide Corp. | | | 139,867 | |
| | 573 | | | Wynn Resorts Ltd. | | | 84,512 | |
| | 2,633 | | | Yum China Holdings, Inc.* | | | 106,242 | |
| | | | | | | | |
| | | | | | | 1,936,589 | |
| | | | | | | | |
| | | | Household Durables — 3.0% | | | | |
| | 3,629 | | | DR Horton, Inc. | | | 160,438 | |
| | 2,425 | | | Garmin Ltd. | | | 137,279 | |
| | 5,266 | | | Leggett & Platt, Inc. | | | 248,871 | |
| | 2,448 | | | Lennar Corp., Class A | | | 136,280 | |
| | 661 | | | Mohawk Industries, Inc.* | | | 173,023 | |
| | 3,199 | | | Newell Brands, Inc. | | | 130,455 | |
| | 94 | | | NVR, Inc.* | | | 308,449 | |
| | 7,290 | | | PulteGroup, Inc. | | | 220,377 | |
| | 2,213 | | | Toll Brothers, Inc. | | | 101,887 | |
| | 1,769 | | | Tupperware Brands Corp. | | | 103,929 | |
| | 697 | | | Whirlpool Corp. | | | 114,259 | |
| | | | | | | | |
| | | | | | | 1,835,247 | |
| | | | | | | | |
| | | | Household Products — 1.1% | | | | |
| | 4,758 | | | Church & Dwight Co., Inc. | | | 214,919 | |
| | 2,010 | | | Clorox Co. (The) | | | 254,325 | |
| | 2,280 | | | Energizer Holdings, Inc. | | | 98,017 | |
| | 1,049 | | | Spectrum Brands Holdings, Inc. | | | 115,306 | |
| | | | | | | | |
| | | | | | | 682,567 | |
| | | | | | | | |
| | | | Independent Power and Renewable Electricity
Producers — 0.1% | |
| | 8,811 | | | AES Corp. | | | 93,661 | |
| | | | | | | | |
| | | | | | | | |
| SHARES | | | INVESTMENTS | | VALUE($) | |
| | | | | | | | |
| | | | Industrial Conglomerates — 0.2% | | | | |
| | 345 | | | Carlisle Cos., Inc. | | | 37,892 | |
| | 419 | | | Roper Technologies, Inc. | | | 108,173 | |
| | | | | | | | |
| | | | | | | 146,065 | |
| | | | | | | | |
| | | | | | | | |
| | | | Insurance — 4.1% | | | | |
| | 155 | | | Alleghany Corp.* | | | 87,764 | |
| | 1,458 | | | American Financial Group, Inc. | | | 153,805 | |
| | 1,752 | | | Arch Capital Group Ltd.* | | | 174,569 | |
| | 2,011 | | | Arthur J Gallagher & Co. | | | 127,357 | |
| | 1,746 | | | Aspen Insurance Holdings Ltd. (Bermuda) | | | 74,903 | |
| | 936 | | | Assurant, Inc. | | | 94,208 | |
| | 1,254 | | | Assured Guaranty Ltd. | | | 46,523 | |
| | 1,606 | | | Axis Capital Holdings Ltd. | | | 87,350 | |
| | 2,231 | | | Brown & Brown, Inc. | | | 111,193 | |
| | 1,251 | | | Cincinnati Financial Corp. | | | 87,783 | |
| | 77 | | | CNA Financial Corp. | | | 4,168 | |
| | 288 | | | Erie Indemnity Co., Class A | | | 34,790 | |
| | 309 | | | Everest Re Group Ltd. | | | 73,372 | |
| | 952 | | | First American Financial Corp. | | | 51,808 | |
| | 1,836 | | | FNF Group | | | 68,703 | |
| | 466 | | | Hanover Insurance Group, Inc. (The) | | | 45,845 | |
| | 1,586 | | | Hartford Financial Services Group, Inc. (The) | | | 87,309 | |
| | 565 | | | Lincoln National Corp. | | | 42,816 | |
| | 2,017 | | | Loews Corp. | | | 99,862 | |
| | 10 | | | Markel Corp.* | | | 10,843 | |
| | 757 | | | Mercury General Corp. | | | 42,369 | |
| | 2,800 | | | Old Republic International Corp. | | | 56,812 | |
| | 1,283 | | | Principal Financial Group, Inc. | | | 84,486 | |
| | 2,432 | | | Progressive Corp. (The) | | | 118,317 | |
| | 622 | | | Reinsurance Group of America, Inc. | | | 92,914 | |
| | 696 | | | RenaissanceRe Holdings Ltd. (Bermuda) | | | 96,299 | |
| | 1,618 | | | Torchmark Corp. | | | 136,122 | |
| | 1,241 | | | Unum Group | | | 64,582 | |
| | 1,596 | | | Validus Holdings Ltd. | | | 83,120 | |
| | 1,593 | | | WR Berkley Corp. | | | 109,248 | |
| | 1,803 | | | XL Group Ltd. (Bermuda) | | | 72,967 | |
| | | | | | | | |
| | | | | | | 2,522,207 | |
| | | | | | | | |
| | | | Internet & Direct Marketing Retail — 0.1% | | | | |
| | 702 | | | Liberty Ventures, Series A* | | | 39,986 | |
| | | | | | | | |
| | | | Internet Software & Services — 1.0% | | | | |
| | 2,119 | | | Akamai Technologies, Inc.* | | | 110,718 | |
| | 1,231 | | | IAC/InterActiveCorp* | | | 158,860 | |
| | 1,015 | | | LogMeIn, Inc. | | | 122,866 | |
| | 2,385 | | | VeriSign, Inc.* | | | 256,435 | |
| | | | | | | | |
| | | | | | | 648,879 | |
| | | | | | | | |
SEE NOTES TO FINANCIAL STATEMENTS.
| | | | | | | | |
| | | |
| OCTOBER 31, 2017 | | JPMORGAN EXCHANGE-TRADED FUNDS | | | | | 73 | |
JPMorgan Diversified Return U.S. Mid Cap Equity ETF
SCHEDULE OF PORTFOLIO INVESTMENTS
AS OF OCTOBER 31, 2017 (continued)
| | | | | | | | |
| SHARES | | | INVESTMENTS | | VALUE($) | |
| | Common Stocks — continued | |
| | | | IT Services — 3.7% | | | | |
| | 4,647 | | | Amdocs Ltd. | | | 302,520 | |
| | 1,266 | | | Booz Allen Hamilton Holding Corp. | | | 47,842 | |
| | 1,916 | | | Broadridge Financial Solutions, Inc. | | | 164,623 | |
| | 1,135 | | | Conduent, Inc.* | | | 17,570 | |
| | 563 | | | CoreLogic, Inc.* | | | 26,405 | |
| | 3,428 | | | CSRA, Inc. | | | 109,662 | |
| | 3,362 | | | DST Systems, Inc. | | | 197,080 | |
| | 1,315 | | | DXC Technology Co. | | | 120,349 | |
| | 474 | | | Euronet Worldwide, Inc.* | | | 45,807 | |
| | 1,130 | | | Fidelity National Information Services, Inc. | | | 104,819 | |
| | 3,975 | | | First Data Corp., Class A* | | | 70,795 | |
| | 1,089 | | | Fiserv, Inc.* | | | 140,949 | |
| | 1,201 | | | Gartner, Inc.* | | | 150,497 | |
| | 806 | | | Global Payments, Inc. | | | 83,784 | |
| | 1,131 | | | Jack Henry & Associates, Inc. | | | 124,557 | |
| | 2,320 | | | Leidos Holdings, Inc. | | | 145,046 | |
| | 1,334 | | | Paychex, Inc. | | | 85,096 | |
| | 5,534 | | | Sabre Corp. | | | 108,245 | |
| | 528 | | | Teradata Corp.* | | | 17,661 | |
| | 1,625 | | | Total System Services, Inc. | | | 117,081 | |
| | 1,189 | | | Vantiv, Inc., Class A* | | | 83,230 | |
| | 1,993 | | | Western Union Co. (The) | | | 39,581 | |
| | | | | | | | |
| | | | | | | 2,303,199 | |
| | | | | | | | |
| | | | Leisure Products — 0.6% | | | | |
| | 1,993 | | | Brunswick Corp. | | | 100,945 | |
| | 1,411 | | | Hasbro, Inc. | | | 130,645 | |
| | 4,510 | | | Mattel, Inc. | | | 63,681 | |
| | 928 | | | Polaris Industries, Inc. | | | 109,903 | |
| | | | | | | | |
| | | | | | | 405,174 | |
| | | | | | | | |
| | | | Life Sciences Tools & Services — 2.6% | | | | |
| | 1,988 | | | Agilent Technologies, Inc. | | | 135,244 | |
| | 382 | | | Bio-Rad Laboratories, Inc., Class A* | | | 83,960 | |
| | 1,026 | | | Bio-Techne Corp. | | | 134,426 | |
| | 2,209 | | | Charles River Laboratories International, Inc.* | | | 256,884 | |
| | 622 | | | Illumina, Inc.* | | | 127,628 | |
| | 222 | | | Mettler-Toledo International, Inc.* | | | 151,544 | |
| | 171 | | | PerkinElmer, Inc. | | | 12,367 | |
| | 2,336 | | | QIAGEN NV* | | | 79,097 | |
| | 2,683 | | | Quintiles IMS Holdings, Inc.* | | | 290,032 | |
| | 2,131 | | | VWR Corp.* | | | 70,536 | |
| | 1,274 | | | Waters Corp.* | | | 249,768 | |
| | | | | | | | |
| | | | | | | 1,591,486 | |
| | | | | | | | |
| | | | Machinery — 4.4% | | | | |
| | 1,487 | | | AGCO Corp. | | | 101,964 | |
| | 1,970 | | | Allison Transmission Holdings, Inc. | | | 83,705 | |
| | 698 | | | Crane Co. | | | 58,018 | |
| | | | | | | | |
| SHARES | | | INVESTMENTS | | VALUE($) | |
| | | | | | | | |
| | | | Machinery — continued | | | | |
| | 532 | | | Cummins, Inc. | | | 94,100 | |
| | 1,125 | | | Donaldson Co., Inc. | | | 53,111 | |
| | 1,032 | | | Dover Corp. | | | 98,546 | |
| | 1,556 | | | Fortive Corp. | | | 112,436 | |
| | 1,156 | | | Graco, Inc. | | | 152,349 | |
| | 1,085 | | | IDEX Corp. | | | 139,108 | |
| | 1,124 | | | Ingersoll-Rand plc | | | 99,586 | |
| | 745 | | | ITT, Inc. | | | 34,747 | |
| | 1,093 | | | Lincoln Electric Holdings, Inc. | | | 100,195 | |
| | 1,250 | | | Middleby Corp. (The)* | | | 144,875 | |
| | 490 | | | Nordson Corp. | | | 62,078 | |
| | 918 | | | Oshkosh Corp. | | | 84,052 | |
| | 1,096 | | | PACCAR, Inc. | | | 78,616 | |
| | 506 | | | Parker-Hannifin Corp. | | | 92,401 | |
| | 1,104 | | | Pentair plc (United Kingdom) | | | 77,788 | |
| | 1,352 | | | Snap-on, Inc. | | | 213,318 | |
| | 2,812 | | | SPX Corp.* | | | 82,363 | |
| | 1,689 | | | Stanley Black & Decker, Inc. | | | 272,858 | |
| | 564 | | | Terex Corp. | | | 26,570 | |
| | 1,152 | | | Timken Co. (The) | | | 54,317 | |
| | 3,629 | | | Toro Co. (The) | | | 228,083 | |
| | 903 | | | Trinity Industries, Inc. | | | 29,366 | |
| | 466 | | | WABCO Holdings, Inc.* | | | 68,768 | |
| | 1,452 | | | Xylem, Inc. | | | 96,602 | |
| | | | | | | | |
| | | | | | | 2,739,920 | |
| | | | | | | | |
| | | | Marine — 0.0% (a) | | | | |
| | 334 | | | Kirby Corp.* | | | 23,664 | |
| | | | | | | | |
| | | | Media — 2.2% | | | | |
| | 3,772 | | | Cinemark Holdings, Inc. | | | 137,074 | |
| | 5,079 | | | Discovery Communications, Inc., Class A* | | | 95,892 | |
| | 4,069 | | | Discovery Communications, Inc., Class C* | | | 72,469 | |
| | 4,897 | | | Interpublic Group of Cos., Inc. (The) | | | 94,267 | |
| | 674 | | | Liberty Broadband Corp., Class C* | | | 58,833 | |
| | 933 | | | Liberty Media Corp.-Liberty Formula One, Class C* | | | 35,585 | |
| | 1,224 | | | Liberty Media Corp.-Liberty SiriusXM, Class A* | | | 51,053 | |
| | 4,430 | | | MSG Networks, Inc., Class A* | | | 76,860 | |
| | 2,706 | | | Omnicom Group, Inc. | | | 181,816 | |
| | 5,232 | | | Regal Entertainment Group, Class A | | | 85,543 | |
| | 1,315 | | | Scripps Networks Interactive, Inc., Class A | | | 109,513 | |
| | 28,458 | | | Sirius XM Holdings, Inc. | | | 154,812 | |
| | 4,208 | | | TEGNA, Inc. | | | 51,464 | |
| | 1,418 | | | Tribune Media Co., Class A | | | 58,039 | |
| | 3,261 | | | Viacom, Inc., Class B | | | 78,362 | |
| | | | | | | | |
| | | | | | | 1,341,582 | |
| | | | | | | | |
SEE NOTES TO FINANCIAL STATEMENTS.
| | | | | | |
| | | |
| 74 | | | | JPMORGAN EXCHANGE-TRADED FUNDS | | OCTOBER 31, 2017 |
| | | | | | | | |
| SHARES | | | INVESTMENTS | | VALUE($) | |
| | Common Stocks — continued | |
| | | | Metals & Mining — 1.1% | | | | |
| | 720 | | | Alcoa Corp.* | | | 34,402 | |
| | 789 | | | Compass Minerals International, Inc. | | | 51,758 | |
| | 3,680 | | | Freeport-McMoRan, Inc.* | | | 51,446 | |
| | 2,303 | | | Newmont Mining Corp. | | | 83,277 | |
| | 1,431 | | | Nucor Corp. | | | 82,755 | |
| | 1,035 | | | Reliance Steel & Aluminum Co. | | | 79,529 | |
| | 758 | | | Royal Gold, Inc. | | | 63,755 | |
| | 2,064 | | | Southern Copper Corp. (Peru) | | | 88,649 | |
| | 2,385 | | | Steel Dynamics, Inc. | | | 88,746 | |
| | 1,175 | | | United States Steel Corp. | | | 29,751 | |
| | | | | | | | |
| | | | | | | 654,068 | |
| | | | | | | | |
| | | | Mortgage Real Estate Investment Trusts (REITs) — 0.7% | |
| | 4,411 | | | AGNC Investment Corp. | | | 88,794 | |
| | 7,124 | | | Annaly Capital Management, Inc. | | | 81,641 | |
| | 2,510 | | | Chimera Investment Corp. | | | 45,933 | |
| | 8,438 | | | MFA Financial, Inc. | | | 69,529 | |
| | 3,640 | | | Starwood Property Trust, Inc. | | | 78,296 | |
| | 8,856 | | | Two Harbors Investment Corp. | | | 86,789 | |
| | | | | | | | |
| | | | | | | 450,982 | |
| | | | | | | | |
| | | | Multiline Retail — 0.5% | | | | |
| | 1,986 | | | Dollar General Corp. | | | 160,548 | |
| | 1,472 | | | Kohl’s Corp. | | | 61,471 | |
| | 1,690 | | | Macy’s, Inc. | | | 31,704 | |
| | 1,440 | | | Nordstrom, Inc. | | | 57,096 | |
| | | | | | | | |
| | | | | | | 310,819 | |
| | | | | | | | |
| | | | Multi-Utilities — 5.1% | | | | |
| | 5,211 | | | Ameren Corp. | | | 323,030 | |
| | 8,271 | | | CenterPoint Energy, Inc. | | | 244,656 | |
| | 6,665 | | | CMS Energy Corp. | | | 322,386 | |
| | 3,820 | | | Consolidated Edison, Inc. | | | 328,711 | |
| | 2,799 | | | DTE Energy Co. | | | 309,178 | |
| | 2,265 | | | MDU Resources Group, Inc. | | | 61,948 | |
| | 11,915 | | | NiSource, Inc. | | | 314,199 | |
| | 6,525 | | | Public Service Enterprise Group, Inc. | | | 321,030 | |
| | 3,923 | | | SCANA Corp. | | | 169,238 | |
| | 2,478 | | | Sempra Energy | | | 291,165 | |
| | 2,782 | | | Vectren Corp. | | | 189,565 | |
| | 4,250 | | | WEC Energy Group, Inc. | | | 286,407 | |
| | | | | | | | |
| | | | | | | 3,161,513 | |
| | | | | | | | |
| | | | Oil, Gas & Consumable Fuels — 2.7% | | | | |
| | 834 | | | Andeavor | | | 88,604 | |
| | 2,267 | | | Cheniere Energy, Inc.* | | | 105,960 | |
| | 4,606 | | | CONSOL Energy, Inc.* | | | 74,295 | |
| | 2,947 | | | Devon Energy Corp. | | | 108,744 | |
| | | | | | | | |
| SHARES | | | INVESTMENTS | | VALUE($) | |
| | | | | | | | |
| | | | Oil, Gas & Consumable Fuels — continued | | | | |
| | 916 | | | Diamondback Energy, Inc.* | | | 98,158 | |
| | 1,499 | | | Energen Corp.* | | | 77,498 | |
| | 1,293 | | | Hess Corp. | | | 57,099 | |
| | 2,775 | | | HollyFrontier Corp. | | | 102,536 | |
| | 703 | | | Laredo Petroleum, Inc.* | | | 8,380 | |
| | 3,560 | | | Marathon Oil Corp. | | | 50,623 | |
| | 1,755 | | | Marathon Petroleum Corp. | | | 104,844 | |
| | 1,885 | | | Murphy Oil Corp. | | | 50,424 | |
| | 2,103 | | | Noble Energy, Inc. | | | 58,611 | |
| | 2,959 | | | ONEOK, Inc. | | | 160,585 | |
| | 2,006 | | | Parsley Energy, Inc., Class A* | | | 53,360 | |
| | 2,256 | | | PBF Energy, Inc., Class A | | | 65,356 | |
| | 7,748 | | | QEP Resources, Inc.* | | | 69,345 | |
| | 2,519 | | | Rice Energy, Inc.* | | | 71,414 | |
| | 3,473 | | | SM Energy Co. | | | 74,079 | |
| | 2,361 | | | Targa Resources Corp. | | | 97,981 | |
| | 2,425 | | | Williams Cos., Inc. (The) | | | 69,112 | |
| | 744 | | | World Fuel Services Corp. | | | 20,683 | |
| | 2,831 | | | WPX Energy, Inc.* | | | 31,934 | |
| | | | | | | | |
| | | | | | | 1,699,625 | |
| | | | | | | | |
| | | | Paper & Forest Products — 0.1% | | | | |
| | 1,836 | | | Domtar Corp. | | | 86,880 | |
| | | | | | | | |
| | | | Personal Products — 0.2% | | | | |
| | 615 | | | Coty, Inc., Class A | | | 9,471 | |
| | 15 | | | Edgewell Personal Care Co.* | | | 974 | |
| | 1,922 | | | Nu Skin Enterprises, Inc., Class A | | | 122,258 | |
| | | | | | | | |
| | | | | | | 132,703 | |
| | | | | | | | |
| | | | Pharmaceuticals — 0.9% | | | | |
| | 2,563 | | | Akorn, Inc.* | | | 83,477 | |
| | 2,004 | | | Mallinckrodt plc* | | | 63,467 | |
| | 1,527 | | | Perrigo Co. plc | | | 123,672 | |
| | 4,337 | | | Zoetis, Inc. | | | 276,787 | |
| | | | | | | | |
| | | | | | | 547,403 | |
| | | | | | | | |
| | | | Professional Services — 0.5% | | | | |
| | 472 | | | Dun & Bradstreet Corp. (The) | | | 55,144 | |
| | 686 | | | Equifax, Inc. | | | 74,451 | |
| | 663 | | | ManpowerGroup, Inc. | | | 81,735 | |
| | 1,512 | | | Robert Half International, Inc. | | | 78,276 | |
| | 419 | | | Verisk Analytics, Inc.* | | | 35,636 | |
| | | | | | | | |
| | | | | | | 325,242 | |
| | | | | | | | |
| | | | Real Estate Management & Development — 0.1% | |
| | 1,278 | | | CBRE Group, Inc., Class A* | | | 50,251 | |
| | | | | | | | |
SEE NOTES TO FINANCIAL STATEMENTS.
| | | | | | | | |
| | | |
| OCTOBER 31, 2017 | | JPMORGAN EXCHANGE-TRADED FUNDS | | | | | 75 | |
JPMorgan Diversified Return U.S. Mid Cap Equity ETF
SCHEDULE OF PORTFOLIO INVESTMENTS
AS OF OCTOBER 31, 2017 (continued)
| | | | | | | | |
| SHARES | | | INVESTMENTS | | VALUE($) | |
| | Common Stocks — continued | |
| | | | Road & Rail — 0.7% | | | | |
| | 986 | | | JB Hunt Transport Services, Inc. | | | 104,901 | |
| | 670 | | | Kansas City Southern | | | 69,827 | |
| | 1,364 | | | Landstar System, Inc. | | | 134,695 | |
| | 584 | | | Old Dominion Freight Line, Inc. | | | 70,740 | |
| | 599 | | | Ryder System, Inc. | | | 48,567 | |
| | | | | | | | |
| | | | | | | 428,730 | |
| | | | | | | | |
| | | | Semiconductors & Semiconductor Equipment — 3.3% | |
| | 5,308 | | | Advanced Micro Devices, Inc.* | | | 58,308 | |
| | 1,916 | | | Analog Devices, Inc. | | | 174,931 | |
| | 8,171 | | | Cypress Semiconductor Corp. | | | 129,592 | |
| | 1,710 | | | KLA-Tencor Corp. | | | 186,202 | |
| | 791 | | | Lam Research Corp. | | | 164,979 | |
| | 7,129 | | | Marvell Technology Group Ltd. (Bermuda) | | | 131,673 | |
| | 3,505 | | | Maxim Integrated Products, Inc. | | | 184,153 | |
| | 1,865 | | | Microchip Technology, Inc. | | | 176,802 | |
| | 2,091 | | | Microsemi Corp.* | | | 111,597 | |
| | 6,350 | | | ON Semiconductor Corp.* | | | 135,382 | |
| | 1,673 | | | Qorvo, Inc.* | | | 126,830 | |
| | 1,152 | | | Skyworks Solutions, Inc. | | | 131,167 | |
| | 3,817 | | | Teradyne, Inc. | | | 163,711 | |
| | 1,030 | | | Versum Materials, Inc. | | | 43,342 | |
| | 2,011 | | | Xilinx, Inc. | | | 148,190 | |
| | | | | | | | |
| | | | | | | 2,066,859 | |
| | | | | | | | |
| | | | Software — 3.8% | | | | |
| | 1,460 | | | ANSYS, Inc.* | | | 199,597 | |
| | 4,252 | | | CA, Inc. | | | 137,680 | |
| | 3,889 | | | Cadence Design Systems, Inc.* | | | 167,849 | |
| | 2,052 | | | CDK Global, Inc. | | | 130,425 | |
| | 2,165 | | | Citrix Systems, Inc.* | | | 178,851 | |
| | 2,125 | | | Dell Technologies, Inc., Class V* | | | 175,886 | |
| | 1,810 | | | Manhattan Associates, Inc.* | | | 75,767 | |
| | 1,643 | | | Nuance Communications, Inc.* | | | 24,218 | |
| | 2,331 | | | PTC, Inc.* | | | 154,895 | |
| | 1,251 | | | Red Hat, Inc.* | | | 151,158 | |
| | 4,157 | | | SS&C Technologies Holdings, Inc. | | | 167,111 | |
| | 5,112 | | | Symantec Corp. | | | 166,140 | |
| | 3,406 | | | Synopsys, Inc.* | | | 294,687 | |
| | 1,116 | | | Take-Two Interactive Software, Inc.* | | | 123,485 | |
| | 1,090 | | | Tyler Technologies, Inc.* | | | 193,246 | |
| | 98 | | | Ultimate Software Group, Inc. (The)* | | | 19,854 | |
| | | | | | | | |
| | | | | | | 2,360,849 | |
| | | | | | | | |
| | | | Specialty Retail — 2.4% | | | | |
| | 1,611 | | | AutoNation, Inc.* | | | 76,362 | |
| | 4 | | | AutoZone, Inc.* | | | 2,358 | |
| | | | | | | | |
| SHARES | | | INVESTMENTS | | VALUE($) | |
| | | | | | | | |
| | | | Specialty Retail — continued | | | | |
| | 2,470 | | | Bed Bath & Beyond, Inc. | | | 49,153 | |
| | 1,332 | | | Best Buy Co., Inc. | | | 74,565 | |
| | 1,070 | | | Burlington Stores, Inc.* | | | 100,462 | |
| | 1,233 | | | CarMax, Inc.* | | | 92,598 | |
| | 2,797 | | | Dick’s Sporting Goods, Inc. | | | 68,443 | |
| | 1,480 | | | Foot Locker, Inc. | | | 44,519 | |
| | 3,606 | | | GameStop Corp., Class A | | | 67,396 | |
| | 2,893 | | | Gap, Inc. (The) | | | 75,189 | |
| | 1,223 | | | Murphy USA, Inc.* | | | 90,942 | |
| | 1,481 | | | Penske Automotive Group, Inc. | | | 69,044 | |
| | 2,211 | | | Ross Stores, Inc. | | | 140,376 | |
| | 684 | | | Sally Beauty Holdings, Inc.* | | | 11,840 | |
| | 978 | | | Signet Jewelers Ltd. | | | 64,128 | |
| | 1,389 | | | Tiffany & Co. | | | 130,038 | |
| | 1,476 | | | Tractor Supply Co. | | | 88,944 | |
| | 566 | | | Ulta Beauty, Inc.* | | | 114,213 | |
| | 1,961 | | | Williams-Sonoma, Inc. | | | 101,188 | |
| | | | | | | | |
| | | | | | | 1,461,758 | |
| | | | | | | | |
| | | | Technology Hardware, Storage & Peripherals — 0.6% | |
| | 2,888 | | | NCR Corp.* | | | 92,676 | |
| | 3,124 | | | NetApp, Inc. | | | 138,768 | |
| | 971 | | | Western Digital Corp. | | | 86,681 | |
| | 1,415 | | | Xerox Corp. | | | 42,889 | |
| | | | | | | | |
| | | | | | | 361,014 | |
| | | | | | | | |
| | | | Textiles, Apparel & Luxury Goods — 1.2% | | | | |
| | 1,275 | | | Carter’s, Inc. | | | 123,331 | |
| | 3,656 | | | Hanesbrands, Inc. | | | 82,260 | |
| | 2,147 | | | Michael Kors Holdings Ltd.* | | | 104,795 | |
| | 1,002 | | | PVH Corp. | | | 127,064 | |
| | 2,824 | | | Tapestry, Inc. | | | 115,643 | |
| | 1,000 | | | Under Armour, Inc., Class C* | | | 11,530 | |
| | 2,390 | | | VF Corp. | | | 166,463 | |
| | | | | | | | |
| | | | | | | 731,086 | |
| | | | | | | | |
| | | | Trading Companies & Distributors — 0.8% | | | | |
| | 1,205 | | | Air Lease Corp. | | | 52,357 | |
| | 951 | | | Fastenal Co. | | | 44,668 | |
| | 1,563 | | | HD Supply Holdings, Inc.* | | | 55,314 | |
| | 663 | | | MSC Industrial Direct Co., Inc., Class A | | | 54,963 | |
| | 283 | | | United Rentals, Inc.* | | | 40,039 | |
| | 600 | | | Watsco, Inc. | | | 99,942 | |
| | 671 | | | WESCO International, Inc.* | | | 42,374 | |
| | 428 | | | WW Grainger, Inc. | | | 84,616 | |
| | | | | | | | |
| | | | | | | 474,273 | |
| | | | | | | | |
SEE NOTES TO FINANCIAL STATEMENTS.
| | | | | | |
| | | |
| 76 | | | | JPMORGAN EXCHANGE-TRADED FUNDS | | OCTOBER 31, 2017 |
| | | | | | | | |
| SHARES | | | INVESTMENTS | | VALUE($) | |
| | Common Stocks — continued | |
| | | | Transportation Infrastructure — 0.1% | | | | |
| | 1,075 | | | Macquarie Infrastructure Corp. | | | 74,766 | |
| | | | | | | | |
| | | | Water Utilities — 0.9% | | | | |
| | 3,697 | | | American Water Works Co., Inc. | | | 324,449 | |
| | 6,714 | | | Aqua America, Inc. | | | 238,212 | |
| | | | | | | | |
| | | | | | | 562,661 | |
| | | | | | | | |
| | | | Wireless Telecommunication Services — 0.2% | |
| | 2,731 | | | Telephone & Data Systems, Inc. | | | 79,609 | |
| | 724 | | | United States Cellular Corp.* | | | 26,491 | |
| | | | | | | | |
| | | | | | | 106,100 | |
| | | | | | | | |
| | | | Total Common Stocks
(Cost $55,620,196) | | | 61,904,967 | |
| | | | | | | | |
| | Short-Term Investment — 0.3% | | | | |
| | | | Investment Company — 0.3% | | | | |
| | 192,796 | | | JPMorgan U.S. Government Money Market Fund, Institutional Class Shares, 0.92% (b)(c)
(Cost $192,796) | | | 192,796 | |
| | | | | | | | |
| | | | Total Investments — 100.1% (Cost $55,812,992) | | | 62,097,763 | |
| | | | Liabilities Less Other Assets — (0.1%) | | | (34,513 | ) |
| | | | | | | | |
| | | | Net Assets — 100.0% | | $ | 62,063,250 | |
| | | | | | | | |
Percentages indicated are based on net assets.
| | |
| * | | — Non-income producing security. |
| (a) | | — Represents less than 0.05% of net assets. |
| (b) | | — Affiliated company as defined under the Investment Company Act of 1940. |
| (c) | | — The rate shown was the current yield as of October 31, 2017. |
SEE NOTES TO FINANCIAL STATEMENTS.
| | | | | | | | |
| | | |
| OCTOBER 31, 2017 | | JPMORGAN EXCHANGE-TRADED FUNDS | | | | | 77 | |
JPMorgan Diversified Return U.S. Small Cap Equity ETF
SCHEDULE OF PORTFOLIO INVESTMENTS
AS OF OCTOBER 31, 2017
| | | | | | | | |
| SHARES | | | INVESTMENTS | | VALUE($) | |
| | | | | | | | |
| | Common Stocks — 98.5% | |
| | | | Aerospace & Defense — 1.1% | |
| | 980 | | | AAR Corp. | | | 38,112 | |
| | 2,360 | | | Aerojet Rocketdyne Holdings, Inc.* | | | 74,529 | |
| | 676 | | | Aerovironment, Inc.* | | | 34,584 | |
| | 1,439 | | | Axon Enterprise, Inc.* | | | 33,054 | |
| | 651 | | | Cubic Corp. | | | 35,512 | |
| | 664 | | | Curtiss-Wright Corp. | | | 78,518 | |
| | 415 | | | Esterline Technologies Corp.* | | | 39,363 | |
| | 857 | | | KLX, Inc.* | | | 47,015 | |
| | 1,449 | | | Mercury Systems, Inc.* | | | 73,131 | |
| | 1,207 | | | Moog, Inc., Class A* | | | 105,926 | |
| | 507 | | | National Presto Industries, Inc. | | | 59,268 | |
| | | | | | | | |
| | | | | | | 619,012 | |
| | | | | | | | |
| | | | Air Freight & Logistics — 0.2% | |
| | 601 | | | Atlas Air Worldwide Holdings, Inc.* | | | 36,871 | |
| | 886 | | | Forward Air Corp. | | | 50,892 | |
| | 995 | | | Hub Group, Inc., Class A* | | | 43,084 | |
| | | | | | | | |
| | | | | | | 130,847 | |
| | | | | | | | |
| | | | Airlines — 0.2% | |
| | 297 | | | Allegiant Travel Co. | | | 40,511 | |
| | 1,549 | | | SkyWest, Inc. | | | 72,958 | |
| | | | | | | | |
| | | | | | | 113,469 | |
| | | | | | | | |
| | | | Auto Components — 2.6% | |
| | 5,428 | | | American Axle & Manufacturing Holdings, Inc.* | | | 96,564 | |
| | 3,043 | | | Cooper Tire & Rubber Co. | | | 99,810 | |
| | 1,400 | | | Cooper-Standard Holdings, Inc.* | | | 156,072 | |
| | 6,205 | | | Dana, Inc. | | | 189,190 | |
| | 2,757 | | | Dorman Products, Inc.* | | | 190,536 | |
| | 1,046 | | | Fox Factory Holding Corp.* | | | 44,507 | |
| | 3,047 | | | Gentherm, Inc.* | | | 102,075 | |
| | 3,282 | | | LCI Industries | | | 406,312 | |
| | 1,299 | | | Modine Manufacturing Co.* | | | 27,344 | |
| | 1,121 | | | Stoneridge, Inc.* | | | 25,492 | |
| | 1,715 | | | Tenneco, Inc. | | | 99,659 | |
| | | | | | | | |
| | | | | | | 1,437,561 | |
| | | | | | | | |
| | | | Automobiles — 0.4% | |
| | 4,749 | | | Winnebago Industries, Inc. | | | 233,413 | |
| | | | | | | | |
| | | | Banks — 3.3% | |
| | 260 | | | 1st Source Corp. | | | 13,341 | |
| | 729 | | | Ameris Bancorp | | | 34,919 | |
| | 1,205 | | | AmeriServ Financial, Inc. | | | 4,941 | |
| | 556 | | | BancFirst Corp. | | | 30,385 | |
| | 1,806 | | | BancorpSouth, Inc. | | | 57,070 | |
| | 615 | | | Banner Corp. | | | 35,252 | |
| | | | | | | | |
| SHARES | | | INVESTMENTS | | VALUE($) | |
| | | | | | | | |
| | | | | | | | |
| | | | Banks — continued | |
| | 1,773 | | | Brookline Bancorp, Inc. | | | 27,304 | |
| | 965 | | | Capital Bank Financial Corp., Class A | | | 39,179 | |
| | 195 | | | Capital City Bank Group, Inc. | | | 4,809 | |
| | 740 | | | Cathay General Bancorp | | | 30,932 | |
| | 160 | | | Chemical Financial Corp. | | | 8,430 | |
| | 923 | | | Community Bank System, Inc. | | | 51,033 | |
| | 628 | | | Community Trust Bancorp, Inc. | | | 30,332 | |
| | 761 | | | CVB Financial Corp. | | | 18,158 | |
| | 989 | | | Farmers Capital Bank Corp. | | | 41,142 | |
| | 736 | | | FCB Financial Holdings, Inc., Class A* | | | 34,371 | |
| | 70 | | | First Busey Corp. | | | 2,178 | |
| | 648 | | | First Financial Bancorp | | | 17,690 | |
| | 582 | | | First Financial Bankshares, Inc. | | | 26,568 | |
| | 173 | | | First Financial Corp. | | | 8,218 | |
| | 212 | | | First Merchants Corp. | | | 9,116 | |
| | 757 | | | First Midwest Bancorp, Inc. | | | 17,479 | |
| | 1,907 | | | Fulton Financial Corp. | | | 34,707 | |
| | 730 | | | Glacier Bancorp, Inc. | | | 27,711 | |
| | 1,057 | | | Great Western Bancorp, Inc. | | | 42,904 | |
| | 696 | | | Hancock Holding Co. | | | 33,930 | |
| | 1,553 | | | Home BancShares, Inc. | | | 34,911 | |
| | 442 | | | IBERIABANK Corp. | | | 32,598 | |
| | 822 | | | Independent Bank Corp. | | | 59,266 | |
| | 4,700 | | | Investors Bancorp, Inc. | | | 64,625 | |
| | 1,056 | | | MB Financial, Inc. | | | 48,513 | |
| | 309 | | | NBT Bancorp, Inc. | | | 11,785 | |
| | 641 | | | OFG Bancorp (Puerto Rico) | | | 5,705 | |
| | 2,230 | | | Old National Bancorp | | | 40,586 | |
| | 340 | | | Renasant Corp. | | | 14,076 | |
| | 487 | | | Republic Bancorp, Inc., Class A | | | 19,149 | |
| | 543 | | | S&T Bancorp, Inc. | | | 22,203 | |
| | 202 | | | Sandy Spring Bancorp, Inc. | | | 8,163 | |
| | 2,299 | | | Sterling Bancorp | | | 57,590 | |
| | 1,278 | | | Trustmark Corp. | | | 42,097 | |
| | 515 | | | UMB Financial Corp. | | | 37,868 | |
| | 1,985 | | | Umpqua Holdings Corp. | | | 40,613 | |
| | 904 | | | United Bankshares, Inc. | | | 32,499 | |
| | 1,622 | | | United Community Banks, Inc. | | | 44,475 | |
| | 4,585 | | | Valley National Bancorp | | | 52,728 | |
| | 6,605 | | | Webster Financial Corp. | | | 363,209 | |
| | 435 | | | WesBanco, Inc. | | | 17,574 | |
| | 496 | | | Westamerica Bancorp | | | 28,882 | |
| | 479 | | | Wintrust Financial Corp. | | | 38,938 | |
| | | | | | | | |
| | | | | | | 1,800,152 | |
| | | | | | | | |
SEE NOTES TO FINANCIAL STATEMENTS.
| | | | | | |
| | | |
| 78 | | | | JPMORGAN EXCHANGE-TRADED FUNDS | | OCTOBER 31, 2017 |
| | | | | | | | |
| SHARES | | | INVESTMENTS | | VALUE($) | |
| | | | | | | | |
| | Common Stocks — continued | |
| | | | Beverages — 1.5% | |
| | 2,101 | | | Boston Beer Co., Inc. (The), Class A* | | | 374,083 | |
| | 758 | | | Coca-Cola Bottling Co. Consolidated | | | 170,974 | |
| | 1,436 | | | MGP Ingredients, Inc. | | | 97,591 | |
| | 1,657 | | | National Beverage Corp. | | | 162,220 | |
| | | | | | | | |
| | | | | | | 804,868 | |
| | | | | | | | |
| | | | Biotechnology — 1.9% | |
| | 3,690 | | | Achillion Pharmaceuticals, Inc.* | | | 14,834 | |
| | 1,513 | | | Acorda Therapeutics, Inc.* | | | 40,208 | |
| | 336 | | | Arena Pharmaceuticals, Inc.* | | | 9,418 | |
| | 344 | | | Avexis, Inc.* | | | 35,951 | |
| | 1,081 | | | Blueprint Medicines Corp.* | | | 71,800 | |
| | 789 | | | Chimerix, Inc.* | | | 3,882 | |
| | 714 | | | Dynavax Technologies Corp.* | | | 15,708 | |
| | 605 | | | Eagle Pharmaceuticals, Inc.* | | | 32,519 | |
| | 1,269 | | | Emergent BioSolutions, Inc.* | | | 52,016 | |
| | 954 | | | Enanta Pharmaceuticals, Inc.* | | | 47,385 | |
| | 644 | | | Five Prime Therapeutics, Inc.* | | | 28,890 | |
| | 723 | | | Genomic Health, Inc.* | | | 23,707 | |
| | 1,768 | | | Halozyme Therapeutics, Inc.* | | | 31,347 | |
| | 1,057 | | | ImmunoGen, Inc.* | | | 6,131 | |
| | 3,673 | | | Inovio Pharmaceuticals, Inc.* | | | 21,414 | |
| | 2,773 | | | Ironwood Pharmaceuticals, Inc.* | | | 42,649 | |
| | 2,229 | | | Keryx Biopharmaceuticals, Inc.* | | | 14,444 | |
| | 326 | | | Ligand Pharmaceuticals, Inc.* | | | 47,384 | |
| | 292 | | | Merrimack Pharmaceuticals, Inc. | | | 3,428 | |
| | 3,353 | | | MiMedx Group, Inc.* | | | 42,516 | |
| | 1,553 | | | Momenta Pharmaceuticals, Inc.* | | | 21,897 | |
| | 1,512 | | | Myriad Genetics, Inc.* | | | 51,831 | |
| | 863 | | | NewLink Genetics Corp.* | | | 8,078 | |
| | 2,579 | | | Novavax, Inc.* | | | 2,811 | |
| | 7,989 | | | PDL BioPharma, Inc.* | | | 23,647 | |
| | 1,715 | | | Repligen Corp.* | | | 63,798 | |
| | 1,887 | | | Retrophin, Inc.* | | | 46,930 | |
| | 456 | | | Sage Therapeutics, Inc.* | | | 28,856 | |
| | 2,715 | | | Sangamo Therapeutics, Inc.* | | | 33,666 | |
| | 695 | | | Spark Therapeutics, Inc.* | | | 56,225 | |
| | 3,202 | | | Spectrum Pharmaceuticals, Inc.* | | | 62,727 | |
| | 2,421 | | | Vanda Pharmaceuticals, Inc.* | | | 38,010 | |
| | | | | | | | |
| | | | | | | 1,024,107 | |
| | | | | | | | |
| | | | Building Products — 1.2% | |
| | 1,290 | | | Advanced Drainage Systems, Inc. | | | 25,219 | |
| | 1,010 | | | American Woodmark Corp.* | | | 97,566 | |
| | 1,395 | | | Apogee Enterprises, Inc. | | | 66,583 | |
| | 1,988 | | | Builders FirstSource, Inc.* | | | 35,824 | |
| | | | | | | | |
| SHARES | | | INVESTMENTS | | VALUE($) | |
| | | | | | | | |
| | | | | | | | |
| | | | Building Products — continued | |
| | 749 | | | Gibraltar Industries, Inc.* | | | 24,904 | |
| | 1,785 | | | Griffon Corp. | | | 40,252 | |
| | 625 | | | Masonite International Corp.* | | | 41,937 | |
| | 222 | | | NCI Building Systems, Inc.* | | | 3,541 | |
| | 523 | | | Patrick Industries, Inc.* | | | 48,639 | |
| | 1,532 | | | Quanex Building Products Corp. | | | 33,627 | |
| | 1,109 | | | Simpson Manufacturing Co., Inc. | | | 61,816 | |
| | 528 | | | Trex Co., Inc.* | | | 57,790 | |
| | 863 | | | Universal Forest Products, Inc. | | | 97,433 | |
| | | | | | | | |
| | | | | | | 635,131 | |
| | | | | | | | |
| | | | Capital Markets — 0.1% | |
| | 607 | | | Evercore, Inc., Class A | | | 48,621 | |
| | 223 | | | Financial Engines, Inc. | | | 8,050 | |
| | | | | | | | |
| | | | | | | 56,671 | |
| | | | | | | | |
| | | | Chemicals — 3.9% | |
| | 3,521 | | | A Schulman, Inc. | | | 138,375 | |
| | 1,266 | | | AdvanSix, Inc.* | | | 58,578 | |
| | 1,006 | | | American Vanguard Corp. | | | 22,635 | |
| | 1,459 | | | Balchem Corp. | | | 122,979 | |
| | 2,074 | | | Calgon Carbon Corp. | | | 45,006 | |
| | 4,879 | | | Ferro Corp.* | | | 116,218 | |
| | 99 | | | Flotek Industries, Inc.* | | | 487 | |
| | 1,852 | | | GCP Applied Technologies, Inc.* | | | 54,171 | |
| | 3,118 | | | HB Fuller Co. | | | 177,320 | |
| | 1,339 | | | Ingevity Corp.* | | | 95,377 | |
| | 930 | | | Innophos Holdings, Inc. | | | 45,505 | |
| | 1,521 | | | Innospec, Inc. | | | 94,074 | |
| | 765 | | | Koppers Holdings, Inc.* | | | 37,141 | |
| | 2,296 | | | Kraton Corp.* | | | 112,573 | |
| | 989 | | | LSB Industries, Inc.* | | | 7,467 | |
| | 4,340 | | | Minerals Technologies, Inc. | | | 312,046 | |
| | 2,244 | | | PolyOne Corp. | | | 103,381 | |
| | 2,794 | | | Rayonier Advanced Materials, Inc. | | | 40,150 | |
| | 4,116 | | | Sensient Technologies Corp. | | | 313,022 | |
| | 1,108 | | | Stepan Co. | | | 88,485 | |
| | 1,101 | | | Tredegar Corp. | | | 21,304 | |
| | 1,378 | | | Trinseo SA | | | 97,838 | |
| | 2,222 | | | Tronox Ltd., Class A | | | 58,816 | |
| | | | | | | | |
| | | | | | | 2,162,948 | |
| | | | | | | | |
| | | | Commercial Services & Supplies — 3.9% | |
| | 1,497 | | | ABM Industries, Inc. | | | 62,829 | |
| | 10,701 | | | ACCO Brands Corp.* | | | 139,648 | |
| | 789 | | | Brady Corp., Class A | | | 30,021 | |
| | 697 | | | Brink’s Co. (The) | | | 53,042 | |
SEE NOTES TO FINANCIAL STATEMENTS.
| | | | | | | | |
| | | |
| OCTOBER 31, 2017 | | JPMORGAN EXCHANGE-TRADED FUNDS | | | | | 79 | |
JPMorgan Diversified Return U.S. Small Cap Equity ETF
SCHEDULE OF PORTFOLIO INVESTMENTS
AS OF OCTOBER 31, 2017 (continued)
| | | | | | | | |
| SHARES | | | INVESTMENTS | | VALUE($) | |
| | | | | | | | |
| | Common Stocks — continued | |
| | | | Commercial Services & Supplies — continued | |
| | 483 | | | CompX International, Inc. | | | 7,173 | |
| | 712 | | | Deluxe Corp. | | | 49,591 | |
| | 4,645 | | | Healthcare Services Group, Inc. | | | 245,674 | |
| | 4,820 | | | Herman Miller, Inc. | | | 161,952 | |
| | 3,542 | | | HNI Corp. | | | 121,207 | |
| | 11,235 | | | Interface, Inc. | | | 256,158 | |
| | 1,589 | | | Kimball International, Inc., Class B | | | 30,461 | |
| | 4,946 | | | Knoll, Inc. | | | 104,954 | |
| | 1,315 | | | Matthews International Corp., Class A | | | 82,648 | |
| | 860 | | | McGrath RentCorp | | | 38,442 | |
| | 223 | | | Mobile Mini, Inc. | | | 7,381 | |
| | 740 | | | MSA Safety, Inc. | | | 58,830 | |
| | 542 | | | Multi-Color Corp. | | | 44,823 | |
| | 7,235 | | | Rollins, Inc. | | | 317,689 | |
| | 7,020 | | | Steelcase, Inc., Class A | | | 102,141 | |
| | 641 | | | Team, Inc.* | | | 7,884 | |
| | 1,478 | | | Tetra Tech, Inc. | | | 72,792 | |
| | 690 | | | UniFirst Corp. | | | 108,675 | |
| | 649 | | | Viad Corp. | | | 37,674 | |
| | 987 | | | Virco Manufacturing Corp.* | | | 5,577 | |
| | | | | | | | |
| | | | | | | 2,147,266 | |
| | | | | | | | |
| | | | Communications Equipment — 1.5% | |
| | 3,675 | | | ADTRAN, Inc. | | | 77,543 | |
| | 683 | | | Applied Optoelectronics, Inc.* | | | 27,825 | |
| | 1,363 | | | CalAmp Corp.* | | | 30,981 | |
| | 1,800 | | | Ciena Corp.* | | | 38,286 | |
| | 1,683 | | | Comtech Telecommunications Corp. | | | 36,201 | |
| | 3,933 | | | Extreme Networks, Inc.* | | | 47,196 | |
| | 1,526 | | | Finisar Corp.* | | | 35,922 | |
| | 1,834 | | | Infinera Corp.* | | | 15,351 | |
| | 7,436 | | | Inseego Corp.* | | | 11,154 | |
| | 832 | | | InterDigital, Inc. | | | 61,027 | |
| | 1,095 | | | Lumentum Holdings, Inc.* | | | 69,149 | |
| | 830 | | | NETGEAR, Inc.* | | | 38,720 | |
| | 1,210 | | | NetScout Systems, Inc.* | | | 34,364 | |
| | 4,149 | | | Oclaro, Inc.* | | | 34,312 | |
| | 1,079 | | | Plantronics, Inc. | | | 48,943 | |
| | 1,005 | | | Sonus Networks, Inc.* | | | 7,839 | |
| | 848 | | | Ubiquiti Networks, Inc.* | | | 52,729 | |
| | 1,070 | | | ViaSat, Inc.* | | | 69,657 | |
| | 9,045 | | | Viavi Solutions, Inc.* | | | 83,938 | |
| | | | | | | | |
| | | | | | | 821,137 | |
| | | | | | | | |
| | | | Construction & Engineering — 0.6% | |
| | 1,154 | | | Aegion Corp.* | | | 26,877 | |
| | 560 | | | Argan, Inc. | | | 38,500 | |
| | | | | | | | |
| SHARES | | | INVESTMENTS | | VALUE($) | |
| | | | | | | | |
| | | | | | | | |
| | | | Construction & Engineering — continued | |
| | 1,662 | | | Comfort Systems USA, Inc. | | | 73,626 | |
| | 508 | | | Dycom Industries, Inc.* | | | 44,618 | |
| | 833 | | | EMCOR Group, Inc. | | | 67,065 | |
| | 409 | | | Granite Construction, Inc. | | | 26,049 | |
| | 1,086 | | | MasTec, Inc.* | | | 47,295 | |
| | 1,116 | | | Tutor Perini Corp.* | | | 31,471 | |
| | | | | | | | |
| | | | | | | 355,501 | |
| | | | | | | | |
| | | | Construction Materials — 0.1% | |
| | 565 | | | US Concrete, Inc.* | | | 44,183 | |
| | | | | | | | |
| | | | Consumer Finance — 0.2% | |
| | 811 | | | Encore Capital Group, Inc.* | | | 37,671 | |
| | 660 | | | EZCORP, Inc., Class A* | | | 6,765 | |
| | 66 | | | FirstCash, Inc. | | | 4,214 | |
| | 538 | | | PRA Group, Inc.* | | | 15,010 | |
| | 239 | | | World Acceptance Corp.* | | | 20,913 | |
| | | | | | | | |
| | | | | | | 84,573 | |
| | | | | | | | |
| | | | Containers & Packaging — 0.1% | |
| | 1,041 | | | Greif, Inc., Class A | | | 57,807 | |
| | 1,027 | | | Myers Industries, Inc. | | | 22,183 | |
| | | | | | | | |
| | | | | | | 79,990 | |
| | | | | | | | |
| | | | Distributors — 0.7% | |
| | 1,034 | | | Core-Mark Holding Co., Inc. | | | 35,218 | |
| | 2,991 | | | Pool Corp. | | | 361,253 | |
| | | | | | | | |
| | | | | | | 396,471 | |
| | | | | | | | |
| | | | Diversified Consumer Services — 0.9% | |
| | 1,723 | | | Adtalem Global Education, Inc. | | | 63,665 | |
| | 1,407 | | | American Public Education, Inc.* | | | 28,140 | |
| | 1,591 | | | Bridgepoint Education, Inc.* | | | 15,401 | |
| | 1,025 | | | Bright Horizons Family Solutions, Inc.* | | | 88,457 | |
| | 894 | | | Carriage Services, Inc. | | | 23,155 | |
| | 2,769 | | | Chegg, Inc.* | | | 42,947 | |
| | 1,033 | | | Grand Canyon Education, Inc.* | | | 92,464 | |
| | 373 | | | Houghton Mifflin Harcourt Co.* | | | 3,693 | |
| | 196 | | | K12, Inc.* | | | 3,179 | |
| | 2,240 | | | Regis Corp.* | | | 33,443 | |
| | 948 | | | Sotheby’s* | | | 49,125 | |
| | 379 | | | Strayer Education, Inc. | | | 35,524 | |
| | 2,623 | | | Universal Technical Institute, Inc.* | | | 8,735 | |
| | 757 | | | Weight Watchers International, Inc.* | | | 34,004 | |
| | | | | | | | |
| | | | | | | 521,932 | |
| | | | | | | | |
| | | | Diversified Telecommunication Services — 1.4% | |
| | 3,333 | | | Alaska Communications Systems Group, Inc.* | | | 8,132 | |
| | 1,881 | | | Cogent Communications Holdings, Inc. | | | 101,386 | |
SEE NOTES TO FINANCIAL STATEMENTS.
| | | | | | |
| | | |
| 80 | | | | JPMORGAN EXCHANGE-TRADED FUNDS | | OCTOBER 31, 2017 |
| | | | | | | | |
| SHARES | | | INVESTMENTS | | VALUE($) | |
| | | | | | | | |
| | Common Stocks — continued | |
| | | | Diversified Telecommunication Services — continued | |
| | 3,281 | | | IDT Corp., Class B | | | 43,244 | |
| | 22,467 | | | Iridium Communications, Inc.* | | | 269,604 | |
| | 38,714 | | | Vonage Holdings Corp.* | | | 314,745 | |
| | 31,224 | | | Windstream Holdings, Inc. | | | 58,701 | |
| | | | | | | | |
| | | | | | | 795,812 | |
| | | | | | | | |
| | | | Electric Utilities — 4.1% | |
| | 4,483 | | | ALLETE, Inc. | | | 351,243 | |
| | 5,716 | | | El Paso Electric Co. | | | 328,670 | |
| | 3,611 | | | IDACORP, Inc. | | | 332,320 | |
| | 2,061 | | | MGE Energy, Inc. | | | 136,129 | |
| | 3,241 | | | Otter Tail Corp. | | | 148,924 | |
| | 7,578 | | | PNM Resources, Inc. | | | 328,885 | |
| | 6,951 | | | Portland General Electric Co. | | | 331,841 | |
| | 20,273 | | | Spark Energy, Inc., Class A | | | 283,822 | |
| | | | | | | | |
| | | | | | | 2,241,834 | |
| | | | | | | | |
| | | | Electrical Equipment — 0.4% | |
| | 1,246 | | | AZZ, Inc. | | | 59,559 | |
| | 907 | | | Encore Wire Corp. | | | 40,951 | |
| | 694 | | | EnerSys | | | 48,143 | |
| | 646 | | | Generac Holdings, Inc.* | | | 33,650 | |
| | 2,120 | | | LSI Industries, Inc. | | | 14,734 | |
| | 469 | | | Vicor Corp.* | | | 10,107 | |
| | | | | | | | |
| | | | | | | 207,144 | |
| | | | | | | | |
| | | | Electronic Equipment, Instruments & Components — 2.3% | |
| | 597 | | | Anixter International, Inc.* | | | 41,014 | |
| | 1,296 | | | Badger Meter, Inc. | | | 56,765 | |
| | 580 | | | Belden, Inc. | | | 46,348 | |
| | 838 | | | Benchmark Electronics, Inc.* | | | 25,936 | |
| | 363 | | | CTS Corp. | | | 9,874 | |
| | 1,941 | | | Daktronics, Inc. | | | 19,934 | |
| | 1,040 | | | Fabrinet (Thailand)* | | | 38,667 | |
| | 1,358 | | | II-VI, Inc.* | | | 61,382 | |
| | 2,148 | | | Insight Enterprises, Inc.* | | | 96,767 | |
| | 1,012 | | | Itron, Inc.* | | | 79,088 | |
| | 663 | | | Littelfuse, Inc. | | | 138,567 | |
| | 850 | | | Methode Electronics, Inc. | | | 39,865 | |
| | 1,551 | | | MTS Systems Corp. | | | 80,730 | |
| | 1,130 | | | Park Electrochemical Corp. | | | 21,334 | |
| | 1,061 | | | PC Connection, Inc. | | | 28,647 | |
| | 386 | | | PCM, Inc.* | | | 5,423 | |
| | 996 | | | Plexus Corp.* | | | 61,184 | |
| | 479 | | | Rogers Corp.* | | | 72,846 | |
| | 1,151 | | | Sanmina Corp.* | | | 37,667 | |
| | 1,018 | | | ScanSource, Inc.* | | | 43,723 | |
| | | | | | | | |
| SHARES | | | INVESTMENTS | | VALUE($) | |
| | | | | | | | |
| | | | | | | | |
| | | | Electronic Equipment, Instruments & Components — continued | |
| | 681 | | | SYNNEX Corp. | | | 91,853 | |
| | 577 | | | Systemax, Inc. | | | 16,473 | |
| | 630 | | | Tech Data Corp.* | | | 58,445 | |
| | 1,542 | | | TTM Technologies, Inc.* | | | 24,333 | |
| | 3,594 | | | Vishay Intertechnology, Inc. | | | 79,967 | |
| | | | | | | | |
| | | | | | | 1,276,832 | |
| | | | | | | | |
| | | | Energy Equipment & Services — 0.7% | |
| | 2,358 | | | Archrock, Inc. | | | 28,296 | |
| | 1,450 | | | Bristow Group, Inc. | | | 13,688 | |
| | 1,255 | | | CARBO Ceramics, Inc.* | | | 10,391 | |
| | 10,018 | | | Ensco plc, Class A | | | 53,997 | |
| | 469 | | | Geospace Technologies Corp.* | | | 7,044 | |
| | 1,059 | | | Gulf Island Fabrication, Inc. | | | 13,926 | |
| | 2,160 | | | Helix Energy Solutions Group, Inc.* | | | 14,731 | |
| | 1,520 | | | Matrix Service Co.* | | | 21,432 | |
| | 7,883 | | | McDermott International, Inc.* | | | 52,186 | |
| | 3,036 | | | Newpark Resources, Inc.* | | | 26,565 | |
| | 2,952 | | | Parker Drilling Co.* | | | 3,100 | |
| | 3,952 | | | Pioneer Energy Services Corp.* | | | 7,509 | |
| | 1,826 | | | SEACOR Holdings, Inc.* | | | 86,187 | |
| | 2,649 | | | TETRA Technologies, Inc.* | | | 7,523 | |
| | 2,230 | | | Unit Corp.* | | | 41,746 | |
| | | | | | | | |
| | | | | | | 388,321 | |
| | | | | | | | |
| | | | Equity Real Estate Investment Trusts (REITs) — 2.1% | |
| | 196 | | | Acadia Realty Trust | | | 5,517 | |
| | 715 | | | Agree Realty Corp. | | | 33,812 | |
| | 1,398 | | | American Assets Trust, Inc. | | | 54,228 | |
| | 1,689 | | | CareTrust REIT, Inc. | | | 31,922 | |
| | 225 | | | Chesapeake Lodging Trust | | | 6,278 | |
| | 2,922 | | | Cousins Properties, Inc. | | | 26,356 | |
| | 1,618 | | | DiamondRock Hospitality Co. | | | 17,572 | |
| | 404 | | | EastGroup Properties, Inc. | | | 36,598 | |
| | 1,775 | | | First Industrial Realty Trust, Inc. | | | 54,812 | |
| | 1,680 | | | Four Corners Property Trust, Inc. | | | 41,462 | |
| | 1,894 | | | Franklin Street Properties Corp. | | | 18,940 | |
| | 1,235 | | | GEO Group, Inc. (The) | | | 32,048 | |
| | 1,073 | | | Government Properties Income Trust | | | 19,496 | |
| | 175 | | | Healthcare Realty Trust, Inc. | | | 5,642 | |
| | 169 | | | Kite Realty Group Trust | | | 3,159 | |
| | 957 | | | Lexington Realty Trust | | | 9,685 | |
| | 2,247 | | | LTC Properties, Inc. | | | 104,508 | |
| | 446 | | | Mack-Cali Realty Corp. | | | 10,155 | |
| | 625 | | | National Health Investors, Inc. | | | 47,619 | |
| | 872 | | | Pennsylvania REIT | | | 8,476 | |
| | 397 | | | Potlatch Corp. | | | 20,565 | |
SEE NOTES TO FINANCIAL STATEMENTS.
| | | | | | | | |
| | | |
| OCTOBER 31, 2017 | | JPMORGAN EXCHANGE-TRADED FUNDS | | | | | 81 | |
JPMorgan Diversified Return U.S. Small Cap Equity ETF
SCHEDULE OF PORTFOLIO INVESTMENTS
AS OF OCTOBER 31, 2017 (continued)
| | | | | | | | |
| SHARES | | | INVESTMENTS | | VALUE($) | |
| | | | | | | | |
| | Common Stocks — continued | |
| | | | Equity Real Estate Investment Trusts (REITs) — continued | |
| | 511 | | | PS Business Parks, Inc. | | | 67,621 | |
| | 1,740 | | | Ramco-Gershenson Properties Trust | | | 21,976 | |
| | 234 | | | Retail Opportunity Investments Corp. | | | 4,207 | |
| | 1,668 | | | Rexford Industrial Realty, Inc. | | | 49,523 | |
| | 919 | | | Ryman Hospitality Properties, Inc. | | | 60,774 | |
| | 1,405 | | | Sabra Health Care REIT, Inc. | | | 27,988 | |
| | 493 | | | Saul Centers, Inc. | | | 30,132 | |
| | 1,209 | | | Select Income REIT | | | 29,209 | |
| | 1,431 | | | STAG Industrial, Inc. | | | 39,066 | |
| | 1,125 | | | Starwood Waypoint Homes* | | | 40,849 | |
| | 1,957 | | | Summit Hotel Properties, Inc. | | | 30,940 | |
| | 1,048 | | | Sunstone Hotel Investors, Inc. | | | 17,103 | |
| | 909 | | | Terreno Realty Corp. | | | 33,379 | |
| | 1,559 | | | Urban Edge Properties | | | 36,574 | |
| | 1,198 | | | Washington REIT | | | 38,564 | |
| | 1,606 | | | Xenia Hotels & Resorts, Inc. | | | 34,947 | |
| | | | | | | | |
| | | | | | | 1,151,702 | |
| | | | | | | | |
| | | | Food & Staples Retailing — 0.7% | |
| | 3,246 | | | Andersons, Inc. (The) | | | 121,563 | |
| | 746 | | | Ingles Markets, Inc., Class A | | | 17,382 | |
| | 1,577 | | | Performance Food Group Co.* | | | 44,629 | |
| | 700 | | | PriceSmart, Inc. | | | 58,660 | |
| | 3,083 | | | SpartanNash Co. | | | 75,687 | |
| | 1,109 | | | United Natural Foods, Inc.* | | | 42,996 | |
| | | | | | | | |
| | | | | | | 360,917 | |
| | | | | | | | |
| | | | Food Products — 4.1% | |
| | 4,442 | | | B&G Foods, Inc. | | | 141,256 | |
| | 1,506 | | | Bob Evans Farms, Inc. | | | 116,248 | |
| | 1,443 | | | Calavo Growers, Inc. | | | 106,349 | |
| | 2,609 | | | Cal-Maine Foods, Inc.* | | | 117,405 | |
| | 7,036 | | | Darling Ingredients, Inc.* | | | 128,407 | |
| | 6,776 | | | Dean Foods Co. | | | 66,066 | |
| | 283 | | | Farmer Brothers Co.* | | | 9,608 | |
| | 6,506 | | | Fresh Del Monte Produce, Inc. | | | 289,582 | |
| | 8,417 | | | Hostess Brands, Inc.* | | | 97,048 | |
| | 1,567 | | | J&J Snack Foods Corp. | | | 208,677 | |
| | 2,372 | | | Lancaster Colony Corp. | | | 297,022 | |
| | 2,178 | | | Sanderson Farms, Inc. | | | 325,764 | |
| | 18 | | | Seaboard Corp. | | | 79,202 | |
| | 4,889 | | | Snyder’s-Lance, Inc. | | | 183,973 | |
| | 3,048 | | | Tootsie Roll Industries, Inc. | | | 108,509 | |
| | | | | | | | |
| | | | | | | 2,275,116 | |
| | | | | | | | |
| | | | | | | | |
| SHARES | | | INVESTMENTS | | VALUE($) | |
| | | | | | | | |
| | | | | | | | |
| | | | Gas Utilities — 4.0% | |
| | 7,361 | | | New Jersey Resources Corp. | | | 327,196 | |
| | 3,178 | | | Northwest Natural Gas Co. | | | 210,860 | |
| | 4,561 | | | ONE Gas, Inc. | | | 351,106 | |
| | 9,513 | | | South Jersey Industries, Inc. | | | 323,157 | |
| | 3,895 | | | Southwest Gas Holdings, Inc. | | | 320,909 | |
| | 4,387 | | | Spire, Inc. | | | 346,354 | |
| | 3,990 | | | WGL Holdings, Inc. | | | 341,943 | |
| | | | | | | | |
| | | | | | | 2,221,525 | |
| | | | | | | | |
| | | | Health Care Equipment & Supplies — 5.3% | |
| | 1,276 | | | Abaxis, Inc. | | | 61,758 | |
| | 3,638 | | | Accuray, Inc.* | | | 17,281 | |
| | 925 | | | Analogic Corp. | | | 74,278 | |
| | 900 | | | Anika Therapeutics, Inc.* | | | 49,167 | |
| | 1,088 | | | Cantel Medical Corp. | | | 106,711 | |
| | 2,314 | | | CONMED Corp. | | | 120,837 | |
| | 1,106 | | | Glaukos Corp.* | | | 39,053 | |
| | 1,775 | | | Globus Medical, Inc., Class A* | | | 56,569 | |
| | 2,554 | | | Haemonetics Corp.* | | | 121,468 | |
| | 1,689 | | | Halyard Health, Inc.* | | | 71,191 | |
| | 1,432 | | | ICU Medical, Inc.* | | | 273,655 | |
| | 636 | | | Inogen, Inc.* | | | 62,919 | |
| | 1,058 | | | Insulet Corp.* | | | 62,221 | |
| | 1,435 | | | Integer Holdings Corp.* | | | 69,741 | |
| | 1,578 | | | Integra LifeSciences Holdings Corp.* | | | 73,819 | |
| | 4,010 | | | Invacare Corp. | | | 62,155 | |
| | 894 | | | iRhythm Technologies, Inc.* | | | 45,549 | |
| | 1,249 | | | LivaNova plc* | | | 92,301 | |
| | 2,251 | | | Masimo Corp.* | | | 197,548 | |
| | 2,617 | | | Meridian Bioscience, Inc. | | | 39,124 | |
| | 2,532 | | | Merit Medical Systems, Inc.* | | | 96,343 | |
| | 3,131 | | | Natus Medical, Inc.* | | | 132,754 | |
| | 1,285 | | | Neogen Corp.* | | | 103,057 | |
| | 550 | | | Nevro Corp.* | | | 48,169 | |
| | 1,208 | | | NuVasive, Inc.* | | | 68,530 | |
| | 1,200 | | | NxStage Medical, Inc.* | | | 32,340 | |
| | 2,675 | | | OraSure Technologies, Inc.* | | | 52,831 | |
| | 813 | | | Orthofix International NV* | | | 43,683 | |
| | 585 | | | Penumbra, Inc.* | | | 58,822 | |
| | 2,418 | | | Quidel Corp.* | | | 99,017 | |
| | 1,761 | | | Surmodics, Inc.* | | | 52,390 | |
| | 3,487 | | | West Pharmaceutical Services, Inc. | | | 353,582 | |
| | 2,029 | | | Wright Medical Group NV* | | | 53,180 | |
| | | | | | | | |
| | | | | | | 2,892,043 | |
| | | | | | | | |
SEE NOTES TO FINANCIAL STATEMENTS.
| | | | | | |
| | | |
| 82 | | | | JPMORGAN EXCHANGE-TRADED FUNDS | | OCTOBER 31, 2017 |
| | | | | | | | |
| SHARES | | | INVESTMENTS | | VALUE($) | |
| | | | | | | | |
| | Common Stocks — continued | |
| | | | Health Care Providers & Services — 1.9% | |
| | 783 | | | Almost Family, Inc.* | | | 34,648 | |
| | 582 | | | Amedisys, Inc.* | | | 28,000 | |
| | 1,059 | | | AMN Healthcare Services, Inc.* | | | 46,490 | |
| | 849 | | | BioScrip, Inc.* | | | 2,148 | |
| | 547 | | | BioTelemetry, Inc.* | | | 15,890 | |
| | 615 | | | Chemed Corp. | | | 137,410 | |
| | 977 | | | Diplomat Pharmacy, Inc.* | | | 20,566 | |
| | 2,085 | | | Genesis Healthcare, Inc.* | | | 2,036 | |
| | 1,942 | | | HealthSouth Corp. | | | 89,604 | |
| | 2,393 | | | Kindred Healthcare, Inc. | | | 14,478 | |
| | 947 | | | LHC Group, Inc.* | | | 63,269 | |
| | 1,411 | | | Magellan Health, Inc.* | | | 120,358 | |
| | 671 | | | Molina Healthcare, Inc.* | | | 45,514 | |
| | 2,702 | | | Owens & Minor, Inc. | | | 66,388 | |
| | 3,788 | | | PharMerica Corp.* | | | 110,988 | |
| | 2,677 | | | Select Medical Holdings Corp.* | | | 51,265 | |
| | 1,232 | | | Teladoc, Inc.* | | | 40,718 | |
| | 3,453 | | | Tivity Health, Inc.* | | | 159,701 | |
| | | | | | | | |
| | | | | | | 1,049,471 | |
| | | | | | | | |
| | | | Health Care Technology — 0.6% | |
| | 705 | | | Computer Programs & Systems, Inc. | | | 21,256 | |
| | 1,908 | | | HMS Holdings Corp.* | | | 36,710 | |
| | 981 | | | Medidata Solutions, Inc.* | | | 73,801 | |
| | 3,667 | | | Omnicell, Inc.* | | | 182,616 | |
| | 1,254 | | | Quality Systems, Inc.* | | | 17,644 | |
| | | | | | | | |
| | | | | | | 332,027 | |
| | | | | | | | |
| | | | Hotels, Restaurants & Leisure — 3.3% | |
| | 3,583 | | | Belmond Ltd., Class A (United Kingdom)* | | | 47,117 | |
| | 50 | | | Biglari Holdings, Inc.* | | | 17,872 | |
| | 1,089 | | | BJ’s Restaurants, Inc.* | | | 34,521 | |
| | 2,291 | | | Bloomin’ Brands, Inc. | | | 40,734 | |
| | 3,183 | | | Boyd Gaming Corp. | | | 93,039 | |
| | 322 | | | Buffalo Wild Wings, Inc.* | | | 38,060 | |
| | 3,324 | | | Caesars Entertainment Corp.* | | | 43,046 | |
| | 1,970 | | | Cheesecake Factory, Inc. (The) | | | 88,138 | |
| | 377 | | | Churchill Downs, Inc. | | | 78,623 | |
| | 984 | | | Chuy’s Holdings, Inc.* | | | 22,140 | |
| | 557 | | | Cracker Barrel Old Country Store, Inc. | | | 86,964 | |
| | 981 | | | Dave & Buster’s Entertainment, Inc.* | | | 47,284 | |
| | 1,781 | | | DineEquity, Inc. | | | 84,793 | |
| | 2,426 | | | Dover Motorsports, Inc. | | | 4,731 | |
| | 2,764 | | | El Pollo Loco Holdings, Inc.* | | | 31,786 | |
| | 1,833 | | | Eldorado Resorts, Inc.* | | | 47,108 | |
| | 3,431 | | | ILG, Inc. | | | 101,798 | |
| | 657 | | | Jack in the Box, Inc. | | | 68,006 | |
| | | | | | | | |
| SHARES | | | INVESTMENTS | | VALUE($) | |
| | | | | | | | |
| | | | | | | | |
| | | | Hotels, Restaurants & Leisure — continued | |
| | 587 | | | Marcus Corp. (The) | | | 15,937 | |
| | 825 | | | Marriott Vacations Worldwide Corp. | | | 108,587 | |
| | 1,132 | | | Noodles & Co.* | | | 4,924 | |
| | 3,256 | | | Papa John’s International, Inc. | | | 221,571 | |
| | 1,714 | | | Planet Fitness, Inc., Class A | | | 45,661 | |
| | 2,363 | | | Red Robin Gourmet Burgers, Inc.* | | | 161,629 | |
| | 2,064 | | | Red Rock Resorts, Inc., Class A | | | 50,836 | |
| | 1,978 | | | Ruby Tuesday, Inc.* | | | 4,688 | |
| | 1,603 | | | Ruth’s Hospitality Group, Inc. | | | 33,823 | |
| | 1,251 | | | Scientific Games Corp., Class A* | | | 59,548 | |
| | 1,794 | | | Texas Roadhouse, Inc. | | | 89,718 | |
| | 1,327 | | | Wingstop, Inc. | | | 44,946 | |
| | | | | | | | |
| | | | | | | 1,817,628 | |
| | | | | | | | |
| | | | Household Durables — 5.0% | |
| | 1,313 | | | Bassett Furniture Industries, Inc. | | | 50,944 | |
| | 6,547 | | | Beazer Homes USA, Inc.* | | | 137,356 | |
| | 6,081 | | | Ethan Allen Interiors, Inc. | | | 180,910 | |
| | 544 | | | Hamilton Beach Brands Holding Co.*‡ | | | 17,294 | |
| | 1,435 | | | Hamilton Beach Brands Holding Co., Class A* | | | 55,635 | |
| | 2,820 | | | Helen of Troy Ltd.* | | | 261,978 | |
| | 661 | | | Installed Building Products, Inc.* | | | 46,072 | |
| | 2,369 | | | iRobot Corp.* | | | 159,173 | |
| | 6,583 | | | KB Home | | | 180,572 | |
| | 6,296 | | | La-Z-Boy, Inc. | | | 169,677 | |
| | 2,644 | | | LGI Homes, Inc.* | | | 159,513 | |
| | 4,904 | | | M/I Homes, Inc.* | | | 163,794 | |
| | 5,865 | | | MDC Holdings, Inc. | | | 217,240 | |
| | 3,140 | | | Meritage Homes Corp.* | | | 152,918 | |
| | 1,697 | | | Skyline Corp.* | | | 21,196 | |
| | 5,443 | | | Taylor Morrison Home Corp., Class A* | | | 131,448 | |
| | 1,231 | | | TopBuild Corp.* | | | 81,234 | |
| | 10,844 | | | TRI Pointe Group, Inc.* | | | 191,830 | |
| | 1,861 | | | Universal Electronics, Inc.* | | | 111,660 | |
| | 3,687 | | | William Lyon Homes, Class A* | | | 102,314 | |
| | 10,283 | | | ZAGG, Inc.* | | | 160,929 | |
| | | | | | | | |
| | | | | | | 2,753,687 | |
| | | | | | | | |
| | | | Household Products — 1.0% | |
| | 2,441 | | | Central Garden & Pet Co.* | | | 93,197 | |
| | 4,477 | | | Central Garden & Pet Co., Class A* | | | 165,246 | |
| | 425 | | | HRG Group, Inc.* | | | 6,894 | |
| | 929 | | | Spectrum Brands Holdings, Inc. | | | 102,116 | |
| | 1,765 | | | WD-40 Co. | | | 195,650 | |
| | | | | | | | |
| | | | | | | 563,103 | |
| | | | | | | | |
SEE NOTES TO FINANCIAL STATEMENTS.
| | | | | | | | |
| | | |
| OCTOBER 31, 2017 | | JPMORGAN EXCHANGE-TRADED FUNDS | | | | | 83 | |
JPMorgan Diversified Return U.S. Small Cap Equity ETF
SCHEDULE OF PORTFOLIO INVESTMENTS
AS OF OCTOBER 31, 2017 (continued)
| | | | | | | | |
| SHARES | | | INVESTMENTS | | VALUE($) | |
| | | | | | | | |
| | Common Stocks — continued | |
| | | | Independent Power and Renewable Electricity Producers — 0.7% | |
| | 882 | | | Atlantica Yield plc (Spain) | | | 19,739 | |
| | 1,373 | | | NRG Yield, Inc., Class A | | | 25,195 | |
| | 2,759 | | | Ormat Technologies, Inc. | | | 179,142 | |
| | 4,202 | | | Pattern Energy Group, Inc. | | | 96,940 | |
| | 4,597 | | | TerraForm Power, Inc., Class A | | | 61,736 | |
| | | | | | | | |
| | | | | | | 382,752 | |
| | | | | | | | |
| | | | Insurance — 1.2% | |
| | 174 | | | Baldwin & Lyons, Inc., Class B | | | 3,993 | |
| | 1,914 | | | CNO Financial Group, Inc. | | | 45,878 | |
| | 237 | | | Crawford & Co., Class B | | | 2,792 | |
| | 1,060 | | | Employers Holdings, Inc. | | | 50,562 | |
| | 518 | | | FBL Financial Group, Inc., Class A | | | 40,067 | |
| | 1,059 | | | Fidelity & Guaranty Life | | | 32,935 | |
| | 857 | | | Horace Mann Educators Corp. | | | 37,537 | |
| | 719 | | | Infinity Property & Casualty Corp. | | | 67,838 | |
| | 72 | | | National Western Life Group, Inc., Class A | | | 25,746 | |
| | 958 | | | Navigators Group, Inc. (The) | | | 55,564 | |
| | 641 | | | Primerica, Inc. | | | 56,728 | |
| | 655 | | | RLI Corp. | | | 38,704 | |
| | 483 | | | Safety Insurance Group, Inc. | | | 39,703 | |
| | 2,037 | | | Selective Insurance Group, Inc. | | | 121,405 | |
| | 931 | | | State Auto Financial Corp. | | | 23,871 | |
| | 757 | | | Stewart Information Services Corp. | | | 28,721 | |
| | | | | | | | |
| | | | | | | 672,044 | |
| | | | | | | | |
| | | | Internet & Direct Marketing Retail — 0.8% | |
| | 1,145 | | | HSN, Inc. | | | 43,166 | |
| | 6,322 | | | Nutrisystem, Inc. | | | 315,784 | |
| | 1,566 | | | PetMed Express, Inc. | | | 55,374 | |
| | 133 | | | Shutterfly, Inc.* | | | 5,679 | |
| | | | | | | | |
| | | | | | | 420,003 | |
| | | | | | | | |
| | | | Internet Software & Services — 1.4% | |
| | 891 | | | 2U, Inc.* | | | 56,694 | |
| | 929 | | | Alarm.com Holdings, Inc.* | | | 43,366 | |
| | 1,345 | | | Blucora, Inc.* | | | 29,187 | |
| | 906 | | | Envestnet, Inc.* | | | 48,380 | |
| | 1,721 | | | Five9, Inc.* | | | 43,421 | |
| | 1,288 | | | GrubHub, Inc.* | | | 78,594 | |
| | 911 | | | j2 Global, Inc. | | | 67,542 | |
| | 605 | | | Liquidity Services, Inc.* | | | 3,449 | |
| | 2,568 | | | LivePerson, Inc.* | | | 36,080 | |
| | 7,591 | | | Meet Group, Inc. (The)* | | | 25,733 | |
| | 1,523 | | | Shutterstock, Inc.* | | | 59,382 | |
| | 256 | | | Stamps.com, Inc.* | | | 57,446 | |
| | 632 | | | Trade Desk, Inc. (The), Class A* | | | 41,661 | |
| | | | | | | | |
| SHARES | | | INVESTMENTS | | VALUE($) | |
| | | | | | | | |
| | | | | | | | |
| | | | Internet Software & Services — continued | |
| | 3,350 | | | TrueCar, Inc.* | | | 54,203 | |
| | 2,726 | | | Web.com Group, Inc.* | | | 65,697 | |
| | 2,063 | | | XO Group, Inc.* | | | 41,177 | |
| | | | | | | | |
| | | | | | | 752,012 | |
| | | | | | | | |
| | | | IT Services — 2.1% | |
| | 2,712 | | | Acxiom Corp.* | | | 68,234 | |
| | 710 | | | CACI International, Inc., Class A* | | | 102,063 | |
| | 989 | | | Cardtronics plc, Class A* | | | 22,648 | |
| | 1,145 | | | Computer Task Group, Inc.* | | | 5,771 | |
| | 2,425 | | | Convergys Corp. | | | 62,395 | |
| | 1,749 | | | CSG Systems International, Inc. | | | 74,053 | |
| | 544 | | | EPAM Systems, Inc.* | | | 49,586 | |
| | 1,659 | | | EVERTEC, Inc. (Puerto Rico) | | | 24,885 | |
| | 665 | | | ExlService Holdings, Inc.* | | | 41,509 | |
| | 427 | | | ManTech International Corp., Class A | | | 19,817 | |
| | 5,287 | | | MAXIMUS, Inc. | | | 351,215 | |
| | 1,497 | | | Perficient, Inc.* | | | 29,117 | |
| | 1,066 | | | Science Applications International Corp. | | | 78,180 | |
| | 532 | | | Sykes Enterprises, Inc.* | | | 15,396 | |
| | 1,478 | | | Syntel, Inc.* | | | 34,526 | |
| | 1,359 | | | TeleTech Holdings, Inc. | | | 56,602 | |
| | 4,033 | | | Travelport Worldwide Ltd. | | | 63,278 | |
| | 1,278 | | | Unisys Corp.* | | | 11,183 | |
| | 1,128 | | | Virtusa Corp.* | | | 43,044 | |
| | | | | | | | |
| | | | | | | 1,153,502 | |
| | | | | | | | |
| | | | Leisure Products — 0.6% | |
| | 13,719 | | | Callaway Golf Co. | | | 197,965 | |
| | 7,786 | | | JAKKS Pacific, Inc.* | | | 21,412 | |
| | 7,430 | | | Nautilus, Inc.* | | | 96,590 | |
| | 369 | | | Sturm Ruger & Co., Inc. | | | 18,284 | |
| | | | | | | | |
| | | | | | | 334,251 | |
| | | | | | | | |
| | | | Life Sciences Tools & Services — 0.4% | |
| | 1,420 | | | Cambrex Corp.* | | | 61,415 | |
| | 674 | | | Fluidigm Corp.* | | | 3,909 | |
| | 855 | | | INC Research Holdings, Inc., Class A* | | | 48,863 | |
| | 3,077 | | | Luminex Corp. | | | 65,694 | |
| | 835 | | | PRA Health Sciences, Inc.* | | | 67,994 | |
| | | | | | | | |
| | | | | | | 247,875 | |
| | | | | | | | |
| | | | Machinery — 3.1% | |
| | 963 | | | Actuant Corp., Class A | | | 24,556 | |
| | 1,205 | | | Albany International Corp., Class A | | | 72,722 | |
| | 404 | | | Astec Industries, Inc. | | | 20,988 | |
| | 851 | | | Barnes Group, Inc. | | | 55,392 | |
| | 8,794 | | | Briggs & Stratton Corp. | | | 221,609 | |
SEE NOTES TO FINANCIAL STATEMENTS.
| | | | | | |
| | | |
| 84 | | | | JPMORGAN EXCHANGE-TRADED FUNDS | | OCTOBER 31, 2017 |
| | | | | | | | |
| SHARES | | | INVESTMENTS | | VALUE($) | |
| | | | | | | | |
| | Common Stocks — continued | |
| | | | Machinery — continued | |
| | 1,770 | | | Chart Industries, Inc.* | | | 76,995 | |
| | 503 | | | CIRCOR International, Inc. | | | 22,107 | |
| | 2,384 | | | Columbus McKinnon Corp. | | | 94,311 | |
| | 810 | | | EnPro Industries, Inc. | | | 67,829 | |
| | 558 | | | ESCO Technologies, Inc. | | | 32,336 | |
| | 1,151 | | | Federal Signal Corp. | | | 24,574 | |
| | 1,074 | | | Franklin Electric Co., Inc. | | | 48,867 | |
| | 501 | | | Greenbrier Cos., Inc. (The) | | | 26,152 | |
| | 2,970 | | | Hillenbrand, Inc. | | | 117,463 | |
| | 608 | | | John Bean Technologies Corp. | | | 64,995 | |
| | 957 | | | Kennametal, Inc. | | | 41,773 | |
| | 284 | | | LB Foster Co., Class A* | | | 7,072 | |
| | 241 | | | Lindsay Corp. | | | 22,066 | |
| | 561 | | | LS Starrett Co. (The), Class A | | | 4,769 | |
| | 2,402 | | | Manitowoc Co., Inc. (The)* | | | 22,867 | |
| | 1,157 | | | Meritor, Inc.* | | | 30,094 | |
| | 325 | | | Middleby Corp. (The)* | | | 37,668 | |
| | 1,691 | | | Mueller Industries, Inc. | | | 58,762 | |
| | 3,714 | | | Mueller Water Products, Inc., Class A | | | 44,345 | |
| | 703 | | | RBC Bearings, Inc.* | | | 87,045 | |
| | 1,757 | | | Rexnord Corp.* | | | 44,839 | |
| | 392 | | | Standex International Corp. | | | 40,592 | |
| | 692 | | | Tennant Co. | | | 47,990 | |
| | 5,257 | | | Titan International, Inc. | | | 51,203 | |
| | 1,127 | | | TriMas Corp.* | | | 29,922 | |
| | 2,344 | | | Wabash National Corp. | | | 52,740 | |
| | 881 | | | Watts Water Technologies, Inc., Class A | | | 59,379 | |
| | 658 | | | Woodward, Inc. | | | 50,883 | |
| | | | | | | | |
| | | | | | | 1,704,905 | |
| | | | | | | | |
| | | | Marine — 0.0% (a) | |
| | 857 | | | Matson, Inc. | | | 23,336 | |
| | | | | | | | |
| | | | Media — 1.4% | |
| | 1,405 | | | AMC Entertainment Holdings, Inc., Class A | | | 19,529 | |
| | 1,777 | | | EW Scripps Co. (The), Class A* | | | 30,813 | |
| | 4,424 | | | Gannett Co., Inc. | | | 38,489 | |
| | 2,761 | | | Gray Television, Inc.* | | | 42,989 | |
| | 2,487 | | | Liberty Media Corp.-Liberty Formula One, Class A* | | | 90,527 | |
| | 459 | | | Liberty Media Corp.-Liberty Formula One, Class C* | | | 17,506 | |
| | 966 | | | Loral Space & Communications, Inc.* | | | 45,547 | |
| | 1,600 | | | MDC Partners, Inc., Class A* | | | 18,400 | |
| | 1,741 | | | Meredith Corp. | | | 92,273 | |
| | 1,792 | | | MSG Networks, Inc., Class A* | | | 31,091 | |
| | 4,453 | | | New York Times Co. (The), Class A | | | 85,052 | |
| | | | | | | | |
| SHARES | | | INVESTMENTS | | VALUE($) | |
| | | | | | | | |
| | | | | | | | |
| | | | Media — continued | |
| | 982 | | | Nexstar Media Group, Inc., Class A | | | 62,652 | |
| | 1,521 | | | Scholastic Corp. | | | 56,186 | |
| | 1,308 | | | Sinclair Broadcast Group, Inc., Class A | | | 41,464 | |
| | 3,319 | | | Time, Inc. | | | 38,500 | |
| | 3,119 | | | World Wrestling Entertainment, Inc., Class A | | | 82,747 | |
| | | | | | | | |
| | | | | | | 793,765 | |
| | | | | | | | |
| | | | Metals & Mining — 1.6% | |
| | 4,293 | | | AK Steel Holding Corp.* | | | 19,705 | |
| | 2,541 | | | Allegheny Technologies, Inc.* | | | 63,982 | |
| | 1,492 | | | Carpenter Technology Corp. | | | 74,287 | |
| | 2,466 | | | Century Aluminum Co.* | | | 34,524 | |
| | 6,662 | | | Cleveland-Cliffs, Inc.* | | | 39,706 | |
| | 1,950 | | | Coeur Mining, Inc.* | | | 14,800 | |
| | 3,897 | | | Commercial Metals Co. | | | 75,914 | |
| | 2,065 | | | Compass Minerals International, Inc. | | | 135,464 | |
| | 1,271 | | | Haynes International, Inc. | | | 45,349 | |
| | 11,876 | | | Hecla Mining Co. | | | 56,055 | |
| | 1,518 | | | Kaiser Aluminum Corp. | | | 150,555 | |
| | 661 | | | Materion Corp. | | | 33,942 | |
| | 725 | | | Olympic Steel, Inc. | | | 13,688 | |
| | 3,330 | | | SunCoke Energy, Inc.* | | | 36,930 | |
| | 1,725 | | | Worthington Industries, Inc. | | | 78,487 | |
| | | | | | | | |
| | | | | | | 873,388 | |
| | | | | | | | |
| | | | Mortgage Real Estate Investment Trusts (REITs) — 0.5% | |
| | 1,068 | | | AG Mortgage Investment Trust, Inc. | | | 20,089 | |
| | 1,893 | | | ARMOUR Residential REIT, Inc. | | | 47,420 | |
| | 6,562 | | | Capstead Mortgage Corp. | | | 57,877 | |
| | 6,218 | | | CYS Investments, Inc. | | | 49,744 | |
| | 5,081 | | | New York Mortgage Trust, Inc. | | | 30,638 | |
| | 1,813 | | | Redwood Trust, Inc. | | | 28,482 | |
| | 2,503 | | | Western Asset Mortgage Capital Corp. | | | 25,205 | |
| | | | | | | | |
| | | | | | | 259,455 | |
| | | | | | | | |
| | | | Multiline Retail — 0.4% | |
| | 1,320 | | | Big Lots, Inc. | | | 67,729 | |
| | 1,015 | | | Dillard’s, Inc., Class A | | | 51,562 | |
| | 3,392 | | | Fred’s, Inc., Class A | | | 14,959 | |
| | 1,639 | | | Ollie’s Bargain Outlet Holdings, Inc.* | | | 73,181 | |
| | | | | | | | |
| | | | | | | 207,431 | |
| | | | | | | | |
| | | | Multi-Utilities — 1.7% | |
| | 6,251 | | | Avista Corp. | | | 326,552 | |
| | 4,732 | | | Black Hills Corp. | | | 308,810 | |
| | 4,842 | | | NorthWestern Corp. | | | 287,034 | |
| | | | | | | | |
| | | | | | | 922,396 | |
| | | | | | | | |
SEE NOTES TO FINANCIAL STATEMENTS.
| | | | | | | | |
| | | |
| OCTOBER 31, 2017 | | JPMORGAN EXCHANGE-TRADED FUNDS | | | | | 85 | |
JPMorgan Diversified Return U.S. Small Cap Equity ETF
SCHEDULE OF PORTFOLIO INVESTMENTS
AS OF OCTOBER 31, 2017 (continued)
| | | | | | | | |
| SHARES | | | INVESTMENTS | | VALUE($) | |
| | | | | | | | |
| | Common Stocks — continued | |
| | | | Oil, Gas & Consumable Fuels — 1.3% | |
| | 6,558 | | | Abraxas Petroleum Corp.* | | | 13,969 | |
| | 3,456 | | | Callon Petroleum Co.* | | | 38,327 | |
| | 1,100 | | | Contango Oil & Gas Co.* | | | 4,389 | |
| | 2,483 | | | CVR Energy, Inc. | | | 68,158 | |
| | 2,747 | | | Delek US Energy, Inc. | | | 71,559 | |
| | 4,659 | | | DHT Holdings, Inc. | | | 18,357 | |
| | 734 | | | Frontline Ltd. (Norway) | | | 4,470 | |
| | 1,401 | | | GasLog Ltd. (Monaco) | | | 24,167 | |
| | 2,119 | | | Golar LNG Ltd. (Bermuda) | | | 44,775 | |
| | 3,785 | | | Green Plains, Inc. | | | 69,644 | |
| | 5,273 | | | Halcon Resources Corp.* | | | 34,696 | |
| | 719 | | | NACCO Industries, Inc., Class A | | | 29,910 | |
| | 881 | | | Northern Oil and Gas, Inc.* | | | 705 | |
| | 1,963 | | | Oasis Petroleum, Inc.* | | | 18,550 | |
| | 1,062 | | | REX American Resources Corp.* | | | 93,647 | |
| | 1,850 | | | Sanchez Energy Corp.* | | | 8,011 | |
| | 3,126 | | | Scorpio Tankers, Inc. (Monaco) | | | 11,129 | |
| | 2,767 | | | SemGroup Corp., Class A | | | 72,080 | |
| | 4,070 | | | Ship Finance International Ltd. (Norway) | | | 60,643 | |
| | 6,315 | | | Teekay Tankers Ltd., Class A (Bermuda) | | | 9,346 | |
| | 4,279 | | | W&T Offshore, Inc.* | | | 13,393 | |
| | | | | | | | |
| | | | | | | 709,925 | |
| | | | | | | | |
| | | | Paper & Forest Products — 0.9% | |
| | 1,248 | | | Boise Cascade Co.* | | | 44,242 | |
| | 1,080 | | | Clearwater Paper Corp.* | | | 49,842 | |
| | 558 | | | Deltic Timber Corp. | | | 51,676 | |
| | 2,333 | | | KapStone Paper and Packaging Corp. | | | 52,399 | |
| | 1,925 | | | Louisiana-Pacific Corp.* | | | 52,322 | |
| | 4,125 | | | PH Glatfelter Co. | | | 86,460 | |
| | 3,810 | | | Schweitzer-Mauduit International, Inc. | | | 160,896 | |
| | | | | | | | |
| | | | | | | 497,837 | |
| | | | | | | | |
| | | | Personal Products — 0.8% | |
| | 2,568 | | | Medifast, Inc. | | | 160,243 | |
| | 371 | | | Nature’s Sunshine Products, Inc. | | | 3,673 | |
| | 3,884 | | | USANA Health Sciences, Inc.* | | | 255,179 | |
| | | | | | | | |
| | | | | | | 419,095 | |
| | | | | | | | |
| | | | Pharmaceuticals — 0.9% | |
| | 595 | | | ANI Pharmaceuticals, Inc.* | | | 34,557 | |
| | 1,759 | | | Catalent, Inc.* | | | 74,916 | |
| | 2,216 | | | Corcept Therapeutics, Inc.* | | | 43,633 | |
| | 1,014 | | | Depomed, Inc.* | | | 4,908 | |
| | 1,171 | | | Impax Laboratories, Inc.* | | | 21,253 | |
| | 3,295 | | | Innoviva, Inc.* | | | 40,331 | |
| | 872 | | | Lannett Co., Inc.* | | | 17,353 | |
| | | | | | | | |
| SHARES | | | INVESTMENTS | | VALUE($) | |
| | | | | | | | |
| | | | | | | | |
| | | | Pharmaceuticals — continued | |
| | 2,065 | | | Nektar Therapeutics* | | | 49,746 | |
| | 358 | | | Pacira Pharmaceuticals, Inc.* | | | 11,474 | |
| | 1,130 | | | Paratek Pharmaceuticals, Inc.* | | | 24,182 | |
| | 1,889 | | | Prestige Brands Holdings, Inc.* | | | 88,594 | |
| | 855 | | | Supernus Pharmaceuticals, Inc.* | | | 35,568 | |
| | 1,109 | | | Theravance Biopharma, Inc. (Cayman Islands)* | | | 32,006 | |
| | | | | | | | |
| | | | | | | 478,521 | |
| | | | | | | | |
| | | | Professional Services — 1.0% | |
| | 414 | | | Acacia Research Corp.* | | | 1,863 | |
| | 707 | | | Advisory Board Co. (The)* | | | 38,125 | |
| | 802 | | | CRA International, Inc. | | | 33,892 | |
| | 2,277 | | | Forrester Research, Inc. | | | 99,505 | |
| | 893 | | | FTI Consulting, Inc.* | | | 38,176 | |
| | 399 | | | Heidrick & Struggles International, Inc. | | | 9,915 | |
| | 483 | | | Huron Consulting Group, Inc.* | | | 17,678 | |
| | 618 | | | Insperity, Inc. | | | 58,648 | |
| | 627 | | | Kelly Services, Inc., Class A | | | 16,496 | |
| | 567 | | | Korn/Ferry International | | | 23,718 | |
| | 1,967 | | | Navigant Consulting, Inc.* | | | 34,049 | |
| | 889 | | | On Assignment, Inc.* | | | 54,425 | |
| | 949 | | | Resources Connection, Inc. | | | 14,947 | |
| | 1,466 | | | TriNet Group, Inc.* | | | 50,899 | |
| | 353 | | | TrueBlue, Inc.* | | | 9,566 | |
| | 785 | | | WageWorks, Inc.* | | | 50,044 | |
| | | | | | | | |
| | | | | | | 551,946 | |
| | | | | | | | |
| | | | Real Estate Management & Development — 0.0% (a) | |
| | 1,269 | | | Kennedy-Wilson Holdings, Inc. | | | 24,682 | |
| | | | | | | | |
| | | | Road & Rail — 1.3% | |
| | 861 | | | AMERCO | | | 338,063 | |
| | 1,136 | | | ArcBest Corp. | | | 37,034 | |
| | 1,121 | | | Avis Budget Group, Inc.* | | | 46,241 | |
| | 1,423 | | | Covenant Transportation Group, Inc., Class A* | | | 42,263 | |
| | 1,895 | | | Heartland Express, Inc. | | | 40,420 | |
| | 2,193 | | | Knight-Swift Transportation Holdings, Inc.* | | | 90,900 | |
| | 698 | | | Saia, Inc.* | | | 45,230 | |
| | 1,890 | | | Werner Enterprises, Inc. | | | 67,379 | |
| | | | | | | | |
| | | | | | | 707,530 | |
| | | | | | | | |
| | | | Semiconductors & Semiconductor Equipment — 3.0% | |
| | 918 | | | Advanced Energy Industries, Inc.* | | | 77,773 | |
| | 4,347 | | | Amkor Technology, Inc.* | | | 50,295 | |
| | 2,804 | | | Brooks Automation, Inc. | | | 96,430 | |
| | 1,230 | | | Cabot Microelectronics Corp. | | | 118,904 | |
| | 1,044 | | | CEVA, Inc.* | | | 50,425 | |
| | 696 | | | Cirrus Logic, Inc.* | | | 38,976 | |
SEE NOTES TO FINANCIAL STATEMENTS.
| | | | | | |
| | | |
| 86 | | | | JPMORGAN EXCHANGE-TRADED FUNDS | | OCTOBER 31, 2017 |
| | | | | | | | |
| SHARES | | | INVESTMENTS | | VALUE($) | |
| | | | | | | | |
| | Common Stocks — continued | |
| | | | Semiconductors & Semiconductor Equipment — continued | |
| | 305 | | | Cohu, Inc. | | | 7,869 | |
| | 2,557 | | | Cree, Inc.* | | | 91,285 | |
| | 1,691 | | | Diodes, Inc.* | | | 58,069 | |
| | 413 | | | DSP Group, Inc.* | | | 5,534 | |
| | 3,457 | | | Entegris, Inc. | | | 113,217 | |
| | 1,365 | | | Inphi Corp.* | | | 55,938 | |
| | 1,791 | | | Integrated Device Technology, Inc.* | | | 55,646 | |
| | 6,004 | | | Lattice Semiconductor Corp.* | | | 35,123 | |
| | 2,298 | | | MaxLinear, Inc.* | | | 56,232 | |
| | 1,037 | | | MKS Instruments, Inc. | | | 112,670 | |
| | 847 | | | Monolithic Power Systems, Inc. | | | 103,054 | |
| | 2,222 | | | Nanometrics, Inc.* | | | 62,816 | |
| | 2,593 | | | NeoPhotonics Corp.* | | | 13,510 | |
| | 2,496 | | | Photronics, Inc.* | | | 24,211 | |
| | 900 | | | Power Integrations, Inc. | | | 72,315 | |
| | 3,483 | | | Rambus, Inc.* | | | 51,235 | |
| | 2,536 | | | Semtech Corp.* | | | 104,103 | |
| | 22 | | | Sigma Designs, Inc.* | | | 133 | |
| | 1,140 | | | Silicon Laboratories, Inc.* | | | 108,186 | |
| | 356 | | | Synaptics, Inc.* | | | 13,215 | |
| | 1,436 | | | Ultra Clean Holdings, Inc.* | | | 36,647 | |
| | 2,877 | | | Xcerra Corp.* | | | 28,338 | |
| | | | | | | | |
| | | | | | | 1,642,149 | |
| | | | | | | | |
| | | | Software — 3.1% | |
| | 6,182 | | | 8x8, Inc.* | | | 82,530 | |
| | 5,218 | | | ACI Worldwide, Inc.* | | | 125,649 | |
| | 1,144 | | | Agilysys, Inc.* | | | 14,037 | |
| | 1,475 | | | Aspen Technology, Inc.* | | | 95,167 | |
| | 976 | | | Barracuda Networks, Inc.* | | | 22,751 | |
| | 1,169 | | | Blackbaud, Inc. | | | 118,420 | |
| | 872 | | | BroadSoft, Inc.* | | | 47,829 | |
| | 1,895 | | | Callidus Software, Inc.* | | | 48,038 | |
| | 1,464 | | | CommVault Systems, Inc.* | | | 76,201 | |
| | 1,322 | | | Ebix, Inc. | | | 89,830 | |
| | 606 | | | Ellie Mae, Inc.* | | | 54,510 | |
| | 805 | | | Fair Isaac Corp. | | | 116,854 | |
| | 1,290 | | | Gigamon, Inc.* | | | 49,665 | |
| | 485 | | | Globant SA* | | | 18,294 | |
| | 436 | | | MicroStrategy, Inc., Class A* | | | 57,665 | |
| | 937 | | | Paycom Software, Inc.* | | | 77,021 | |
| | 2,144 | | | Pegasystems, Inc. | | | 124,995 | |
| | 2,829 | | | Progress Software Corp. | | | 119,752 | |
| | 2,167 | | | Qualys, Inc.* | | | 114,634 | |
| | 2,274 | | | RealNetworks, Inc.* | | | 10,733 | |
| | 1,125 | | | RealPage, Inc.* | | | 48,713 | |
| | | | | | | | |
| SHARES | | | INVESTMENTS | | VALUE($) | |
| | | | | | | | |
| | | | | | | | |
| | | | Software — continued | |
| | 1,323 | | | RingCentral, Inc., Class A* | | | 55,765 | |
| | 1,905 | | | Rosetta Stone, Inc.* | | | 19,374 | |
| | 2,135 | | | TiVo Corp. | | | 38,750 | |
| | 1,748 | | | VASCO Data Security International, Inc.* | | | 23,773 | |
| | 1,486 | | | Verint Systems, Inc.* | | | 62,709 | |
| | | | | | | | |
| | | | | | | 1,713,659 | |
| | | | | | | | |
| | | | Specialty Retail — 2.8% | |
| | 1,355 | | | Aaron’s, Inc. | | | 49,864 | |
| | 1,367 | | | Abercrombie & Fitch Co., Class A | | | 18,359 | |
| | 3,523 | | | American Eagle Outfitters, Inc. | | | 45,869 | |
| | 857 | | | Asbury Automotive Group, Inc.* | | | 52,620 | |
| | 1,515 | | | bebe stores, Inc.* | | | 8,348 | |
| | 2,921 | | | Buckle, Inc. (The) | | | 48,050 | |
| | 1,978 | | | Caleres, Inc. | | | 54,059 | |
| | 1,651 | | | Cato Corp. (The), Class A | | | 21,232 | |
| | 4,243 | | | Chico’s FAS, Inc. | | | 33,902 | |
| | 739 | | | Children’s Place, Inc. (The) | | | 80,403 | |
| | 1,437 | | | Citi Trends, Inc. | | | 31,269 | |
| | 679 | | | Conn’s, Inc.* | | | 20,879 | |
| | 3,276 | | | DSW, Inc., Class A | | | 62,735 | |
| | 1,774 | | | Express, Inc.* | | | 12,010 | |
| | 2,061 | | | Finish Line, Inc. (The), Class A | | | 19,105 | |
| | 1,210 | | | Five Below, Inc.* | | | 66,853 | |
| | 2,958 | | | Francesca’s Holdings Corp.* | | | 19,138 | |
| | 695 | | | Genesco, Inc.* | | | 17,028 | |
| | 1,669 | | | GNC Holdings, Inc., Class A | | | 11,416 | |
| | 878 | | | Group 1 Automotive, Inc. | | | 68,984 | |
| | 2,678 | | | Guess?, Inc. | | | 43,410 | |
| | 1,535 | | | Haverty Furniture Cos., Inc. | | | 36,610 | |
| | 1,413 | | | Hibbett Sports, Inc.* | | | 18,086 | |
| | 1,491 | | | Kirkland’s, Inc.* | | | 17,445 | |
| | 514 | | | Lithia Motors, Inc., Class A | | | 58,175 | |
| | 519 | | | Lumber Liquidators Holdings, Inc.* | | | 15,975 | |
| | 2,446 | | | Monro, Inc. | | | 120,710 | |
| | 7,377 | | | Office Depot, Inc. | | | 22,869 | |
| | 2,653 | | | Pier 1 Imports, Inc. | | | 11,036 | |
| | 1,586 | | | Rent-A-Center, Inc. | | | 15,765 | |
| | 582 | | | RH* | | | 52,333 | |
| | 3,653 | | | Select Comfort Corp.* | | | 118,723 | |
| | 2,633 | | | Shoe Carnival, Inc. | | | 49,421 | |
| | 1,394 | | | Sonic Automotive, Inc., Class A | | | 27,671 | |
| | 1,131 | | | Tailored Brands, Inc. | | | 17,474 | |
| | 906 | | | Vitamin Shoppe, Inc.* | | | 4,168 | |
| | 8,181 | | | Zumiez, Inc.* | | | 144,395 | |
| | | | | | | | |
| | | | | | | 1,516,389 | |
| | | | | | | | |
SEE NOTES TO FINANCIAL STATEMENTS.
| | | | | | | | |
| | | |
| OCTOBER 31, 2017 | | JPMORGAN EXCHANGE-TRADED FUNDS | | | | | 87 | |
JPMorgan Diversified Return U.S. Small Cap Equity ETF
SCHEDULE OF PORTFOLIO INVESTMENTS
AS OF OCTOBER 31, 2017 (continued)
| | | | | | | | |
| SHARES | | | INVESTMENTS | | VALUE($) | |
| | | | | | | | |
| | Common Stocks — continued | |
| | | | Technology Hardware, Storage & Peripherals — 0.2% | |
| | 1,274 | | | Cray, Inc.* | | | 26,308 | |
| | 1,794 | | | Diebold Nixdorf, Inc. | | | 34,624 | |
| | 1,290 | | | Super Micro Computer, Inc.* | | | 25,671 | |
| | | | | | | | |
| | | | | | | 86,603 | |
| | | | | | | | |
| | | | Textiles, Apparel & Luxury Goods — 1.8% | |
| | 5,609 | | | Columbia Sportswear Co. | | | 349,889 | |
| | 2,894 | | | G-III Apparel Group Ltd.* | | | 73,334 | |
| | 1,493 | | | Movado Group, Inc. | | | 41,356 | |
| | 1,660 | | | Oxford Industries, Inc. | | | 107,236 | |
| | 7,578 | | | Steven Madden Ltd.* | | | 295,542 | |
| | 4,830 | | | Wolverine World Wide, Inc. | | | 131,859 | |
| | | | | | | | |
| | | | | | | 999,216 | |
| | | | | | | | |
| | | | Thrifts & Mortgage Finance — 0.8% | |
| | 1,088 | | | BofI Holding, Inc.* | | | 29,267 | |
| | 3,171 | | | Capitol Federal Financial, Inc. | | | 43,728 | |
| | 2,140 | | | Dime Community Bancshares, Inc. | | | 47,187 | |
| | 2,619 | | | Kearny Financial Corp. | | | 39,416 | |
| | 3,286 | | | MGIC Investment Corp.* | | | 46,990 | |
| | 2,452 | | | Northwest Bancshares, Inc. | | | 41,365 | |
| | 2,057 | | | OceanFirst Financial Corp. | | | 57,082 | |
| | 1,896 | | | Oritani Financial Corp. | | | 32,137 | |
| | 1,384 | | | PHH Corp.* | | | 18,283 | |
| | 2,159 | | | TrustCo Bank Corp. | | | 19,809 | |
| | 1,649 | | | Washington Federal, Inc. | | | 57,385 | |
| | | | | | | | |
| | | | | | | 432,649 | |
| | | | | | | | |
| | | | Tobacco — 1.0% | |
| | 3,421 | | | Universal Corp. | | | 196,194 | |
| | 15,811 | | | Vector Group Ltd. | | | 328,553 | |
| | | | | | | | |
| | | | | | | 524,747 | |
| | | | | | | | |
| | | | Trading Companies & Distributors — 1.1% | |
| | 2,336 | | | Aircastle Ltd. | | | 54,335 | |
| | 2,799 | | | Applied Industrial Technologies, Inc. | | | 178,156 | |
| | 1,749 | | | Beacon Roofing Supply, Inc.* | | | 96,912 | |
| | 327 | | | DXP Enterprises, Inc.* | | | 10,487 | |
| | 985 | | | GATX Corp. | | | 58,519 | |
| | 1,322 | | | Kaman Corp. | | | 73,953 | |
| | 498 | | | Lawson Products, Inc.* | | | 12,525 | |
| | 3,822 | | | MRC Global, Inc.* | | | 65,547 | |
| | 832 | | | Textainer Group Holdings Ltd.* | | | 16,266 | |
| | 1,724 | | | Titan Machinery, Inc.* | | | 25,670 | |
| | | | | | | | |
| | | | | | | 592,370 | |
| | | | | | | | |
| | | | | | | | |
| SHARES | | | INVESTMENTS | | VALUE($) | |
| | | | | | | | |
| | | | | | | | |
| | | | Water Utilities — 1.3% | |
| | 3,865 | | | American States Water Co. | | | 207,744 | |
| | 5,291 | | | California Water Service Group | | | 222,222 | |
| | 3,502 | | | Connecticut Water Service, Inc. | | | 217,194 | |
| | 1,456 | | | SJW Group | | | 86,355 | |
| | | | | | | | |
| | | | | | | 733,515 | |
| | | | | | | | |
| | | | Total Common Stocks
(Cost $49,482,958) | | | 54,174,342 | |
| | | | | | | | |
| | |
NO. OF
RIGHTS | | | | | | |
| | Rights — 0.0% (a) | | | | |
| | | | Media — 0.0% (a) | | | | |
| | 1,533 | | | Media General, Inc., CVR*‡
(Cost $—) | | | 75 | |
| | | | | | | | |
| | |
| SHARES | | | | | | |
| | Short-Term Investment — 0.8% | | | | |
| | | | Investment Company — 0.8% | | | | |
| | 461,963 | | | JPMorgan U.S. Government Money Market Fund, Institutional Class Shares, 0.92% (b) (c)
(Cost $461,963) | | | 461,963 | |
| | | | | | | | |
| | | | Total Investments — 99.3%
(Cost $49,944,921) | | | 54,636,380 | |
| | | | Other Assets Less Liabilities — 0.7% | | | 374,725 | |
| | | | | | | | |
| | | | Net Assets — 100.0% | | $ | 55,011,105 | |
| | | | | | | | |
Percentages indicated are based on net assets.
| | |
| * | | — Non-income producing security. |
| ‡ | | — Value determined using significant unobservable inputs. |
| (a) | | — Represents less than 0.05% of net assets. |
(b) | | — Affiliated company as defined under the Investment Company Act of 1940. |
(c) | | — The rate shown was the current yield as of October 31, 2017. |
Abbreviations
| | |
CVR | | — Contingent Value Rights |
SEE NOTES TO FINANCIAL STATEMENTS.
| | | | | | |
| | | |
| 88 | | | | JPMORGAN EXCHANGE-TRADED FUNDS | | OCTOBER 31, 2017 |
| | | | | | | | | | | | | | | | | | | | |
| Futures contracts outstanding as of October 31, 2017: | |
| DESCRIPTION | | NUMBER OF
CONTRACTS | | | EXPIRATION
DATE | | | TRADING
CURRENCY | | | NOTIONAL
AMOUNT ($) | | | VALUE AND
UNREALIZED
APPRECIATION
(DEPRECIATION) ($) | |
Long Contracts | | | | | | | | | | | | | | | | | | | | |
Russell 2000 E-Mini Index | | | 8 | | | | 12/2017 | | | | USD | | | | 601,120 | | | | 11,914 | |
| | | | | | | | | | | | | | | | | | | | |
| | | | | | | | | | | | | | | | | | | 11,914 | |
| | | | | | | | | | | | | | | | | | | | |
Abbreviations
| | |
| USD | | — United States Dollar |
SEE NOTES TO FINANCIAL STATEMENTS.
| | | | | | | | |
| | | |
| OCTOBER 31, 2017 | | JPMORGAN EXCHANGE-TRADED FUNDS | | | | | 89 | |
STATEMENTS OF ASSETS AND LIABILITIES
AS OF OCTOBER 31, 2017
| | | | | | | | | | | | |
| | | JPMorgan
Diversified Return Emerging
Markets Equity ETF | | | JPMorgan
Diversified
Return Europe
Currency
Hedged ETF | | | JPMorgan
Diversified
Return Europe
Equity ETF | |
ASSETS: | | | | | | | | | | | | |
Investments in non-affiliates, at value | | $ | 165,355,337 | | | $ | — | | | $ | 79,006,495 | |
Investments in affiliates, at value | | | — | | | | 30,739,404 | | | | — | |
Cash | | | 543,716 | | | | 19,472 | | | | 336,576 | |
Restricted cash | | | — | | | | — | | | | 5,700 | |
Foreign currency, at value | | | 119,977 | | | | — | | | | 3,746 | |
Segregated cash balance with Authorized Participant for deposit securities | | | — | | | | — | | | | 453,284 | |
Receivables: | | | | | | | | | | | | |
Dividends from non-affiliates | | | 122,710 | | | | — | | | | 59,286 | |
Tax reclaims | | | — | | | | — | | | | 211,009 | |
Unrealized appreciation on forward foreign currency exchange contracts | | | — | | | | 527,922 | | | | — | |
Due from Adviser | | | 31,576 | | | | 16,084 | | | | 7,414 | |
Prepaid Expenses | | | 9,841 | | | | 1,165 | | | | 1,882 | |
| | | | | | | | | | | | |
Total Assets | | | 166,183,157 | | | | 31,304,047 | | | | 80,085,392 | |
| | | | | | | | | | | | |
| | | |
LIABILITIES: | | | | | | | | | | | | |
Payables: | | | | | | | | | | | | |
Investment securities purchased | | | 765 | | | | 526,455 | | | | — | |
Unrealized depreciation on forward foreign currency exchange contracts | | | — | | | | 11,646 | | | | — | |
Accrued liabilities: | | | | | | | | | | | | |
Administration fees | | | 11,983 | | | | 2,177 | | | | 5,322 | |
Custodian and Transfer Agent fees | | | 72,480 | | | | 3,417 | | | | 42,004 | |
Trustees’ and Chief Compliance Officer’s fees | | | 2,541 | | | | 371 | | | | 926 | |
Deferred India capital gains tax | | | 240,033 | | | | — | | | | — | |
Accounting fees | | | 14,591 | | | | 234 | | | | 9,477 | |
Professional Fees | | | 72,402 | | | | 42,347 | | | | 78,375 | |
Collateral upon return of deposit securities | | | — | | | | — | | | | 453,284 | |
Other | | | 27,316 | | | | 10,155 | | | | 3,647 | |
| | | | | | | | | | | | |
Total Liabilities | | | 442,111 | | | | 596,802 | | | | 593,035 | |
| | | | | | | | | | | | |
Net Assets | | $ | 165,741,046 | | | $ | 30,707,245 | | | $ | 79,492,357 | |
| | | | | | | | | | | | |
| | | |
NET ASSETS: | | | | | | | | | | | | |
Paid-in-Capital | | $ | 148,691,660 | | | $ | 27,087,053 | | | $ | 66,250,524 | |
Accumulated undistributed (distributions in excess of) net investment income | | | 3,326,876 | | | | 34,913 | | | | 1,745,875 | |
Accumulated net realized gains (losses) | | | (5,618,609 | ) | | | (1,676,017 | ) | | | (258,230 | ) |
Net unrealized appreciation (depreciation) | | | 19,341,119 | | | | 5,261,296 | | | | 11,754,188 | |
| | | | | | | | | | | | |
Total Net Assets | | $ | 165,741,046 | | | $ | 30,707,245 | | | $ | 79,492,357 | |
| | | | | | | | | | | | |
| | | |
Outstanding number of shares
(unlimited number of shares authorized — par value $0.0001) | | | 2,900,000 | | | | 1,050,000 | | | | 1,300,000 | |
| | | | | | | | | | | | |
Net asset value, per share | | $ | 57.15 | | | $ | 29.24 | | | $ | 61.15 | |
| | | | | | | | | | | | |
| | | |
Cost of investments in non-affiliates | | $ | 145,771,551 | | | $ | — | | | $ | 67,258,158 | |
Cost of investments in affiliates | | | — | | | | 25,994,384 | | | | — | |
Cost of foreign currency | | | 120,854 | | | | — | | | | 3,765 | |
SEE NOTES TO FINANCIAL STATEMENTS.
| | | | | | |
| | | |
| 90 | | | | JPMORGAN EXCHANGE-TRADED FUNDS | | OCTOBER 31, 2017 |
| | | | | | | | | | | | |
| | | JPMorgan
Diversified
Return Global
Equity ETF | | | JPMorgan
Diversified
Return International
Currency
Hedged ETF | | | JPMorgan
Diversified
Return International Equity ETF | |
ASSETS: | | | | | | | | | | | | |
Investments in non-affiliates, at value | | $ | 102,603,692 | | | $ | — | | | $ | 1,134,220,911 | |
Investments in affiliates, at value | | | 516,620 | | | | 48,144,483 | | | | 15,795,486 | |
Cash | | | 304,558 | | | | 120,774 | | | | 5,545,149 | |
Restricted cash | | | 23,100 | | | | — | | | | 64,800 | |
Foreign currency, at value | | | 156,207 | | | | — | | | | 587,442 | |
Deposits at broker for futures contracts | | | — | | | | — | | | | 755,000 | |
Segregated cash balance with Authorized Participant for deposit securities | | | — | | | | — | | | | 35,807 | |
Receivables: | | | | | | | | | | | | |
Dividends from non-affiliates | | | 202,048 | | | | — | | | | 2,861,104 | |
Dividends from affiliates | | | 395 | | | | — | | | | 3,201 | |
Tax reclaims | | | 48,804 | | | | — | | | | 604,498 | |
Variation margin on futures contracts | | | — | | | | — | | | | 117,690 | |
Unrealized appreciation on forward foreign currency exchange contracts | | | — | | | | 606,500 | | | | — | |
Due from Adviser | | | 16,879 | | | | 20,285 | | | | 2,735 | |
Prepaid Expenses | | | 3,971 | | | | 4,630 | | | | 48,833 | |
| | | | | | | | | | | | |
Total Assets | | | 103,876,274 | | | | 48,896,672 | | | | 1,160,642,656 | |
| | | | | | | | | | | | |
| | | |
LIABILITIES: | | | | | | | | | | | | |
Payables: | | | | | | | | | | | | |
Investment securities purchased | | | — | | | | 416,988 | | | | — | |
Unrealized depreciation on forward foreign currency exchange contracts | | | — | | | | 145,507 | | | | — | |
Accrued liabilities: | | | | | | | | | | | | |
Investment advisory fees | | | — | | | | 3,064 | | | | 168,405 | |
Administration fees | | | 6,995 | | | | 3,387 | | | | 80,246 | |
Custodian and Transfer Agent fees | | | 53,506 | | | | — | | | | 134,994 | |
Trustees’ and Chief Compliance Officer’s fees | | | 1,162 | | | | 615 | | | | 15,375 | |
Accounting fees | | | 11,438 | | | | 342 | | | | 18,096 | |
Professional Fees | | | 103,664 | | | | 41,086 | | | | 198,382 | |
Collateral upon return of deposit securities | | | — | | | | — | | | | 35,807 | |
Other | | | 4,439 | | | | 11,216 | | | | 104,345 | |
| | | | | | | | | | | | |
Total Liabilities | | | 181,204 | | | | 622,205 | | | | 755,650 | |
| | | | | | | | | | | | |
Net Assets | | $ | 103,695,070 | | | $ | 48,274,467 | | | $ | 1,159,887,006 | |
| | | | | | | | | | | | |
| | | |
NET ASSETS: | | | | | | | | | | | | |
Paid-in-Capital | | $ | 89,907,780 | | | $ | 42,131,513 | | | $ | 1,023,037,644 | |
Accumulated undistributed (distributions in excess of) net investment income | | | 1,204,535 | | | | 14,482 | | | | 17,961,437 | |
Accumulated net realized gains (losses) | | | (1,417,771 | ) | | | (960,802 | ) | | | (9,660,030 | ) |
Net unrealized appreciation (depreciation) | | | 14,000,526 | | | | 7,089,274 | | | | 128,547,955 | |
| | | | | | | | | | | | |
Total Net Assets | | $ | 103,695,070 | | | $ | 48,274,467 | | | $ | 1,159,887,006 | |
| | | | | | | | | | | | |
| | | |
Outstanding number of shares
(unlimited number of shares authorized — par value $0.0001) | | | 1,700,000 | | | | 1,600,000 | | | | 19,600,000 | |
| | | | | | | | | | | | |
Net asset value, per share | | $ | 61.00 | | | $ | 30.17 | | | $ | 59.18 | |
| | | | | | | | | | | | |
| | | |
Cost of investments in non-affiliates | | $ | 88,599,653 | | | $ | — | | | $ | 1,005,799,782 | |
Cost of investments in affiliates | | | 516,620 | | | | 41,516,202 | | | | 15,795,486 | |
Cost of foreign currency | | | 159,338 | | | | — | | | | 590,816 | |
SEE NOTES TO FINANCIAL STATEMENTS.
| | | | | | | | |
| | | |
| OCTOBER 31, 2017 | | JPMORGAN EXCHANGE-TRADED FUNDS | | | | | 91 | |
STATEMENTS OF ASSETS AND LIABILITIES
AS OF OCTOBER 31, 2017 (continued)
| | | | | | | | | | | | |
| | | JPMorgan
Diversified
Return U.S.
Equity ETF | | | JPMorgan
Diversified
Return U.S.
Mid Cap
Equity ETF | | | JPMorgan
Diversified
Return U.S.
Small Cap
Equity ETF | |
ASSETS: | | | | | | | | | | | | |
Investments in non-affiliates, at value | | $ | 352,257,988 | | | $ | 61,904,967 | | | $ | 54,174,417 | |
Investments in affiliates, at value | | | 1,543,961 | | | | 192,796 | | | | 461,963 | |
Cash | | | — | | | | 4,612 | | | | — | |
Restricted cash | | | 15,950 | | | | 6,000 | | | | 12,600 | |
Deposits at broker for futures contracts | | | 30,000 | | | | — | | | | 8,000 | |
Receivables: | | | | | | | | | | | | |
Investment securities sold | | | 2,291,679 | | | | — | | | | 421,347 | |
Dividends from non-affiliates | | | 264,167 | | | | 31,474 | | | | 15,145 | |
Dividends from affiliates | | | 1,429 | | | | 816 | | | | 356 | |
Tax reclaims | | | 496 | | | | — | | | | 5 | |
Variation margin on futures contracts | | | 2,305 | | | | — | | | | 2,479 | |
Due from Adviser | | | 7,219 | | | | 3,507 | | | | 11,577 | |
Deferred offering costs | | | — | | | | — | | | | 39 | |
Prepaid Expenses | | | 22,063 | | | | 4,391 | | | | 6 | |
| | | | | | | | | | | | |
Total Assets | | | 356,437,257 | | | | 62,148,563 | | | | 55,107,934 | |
| | | | | | | | | | | | |
| | | |
LIABILITIES: | | | | | | | | | | | | |
Payables: | | | | | | | | | | | | |
Due to custodian | | | 3,061 | | | | — | | | | 5,999 | |
Accrued liabilities: | | | | | | | | | | | | |
Administration fees | | | 24,712 | | | | 5,110 | | | | 3,597 | |
Custodian and Transfer Agent fees | | | 19,091 | | | | 11,734 | | | | 30,547 | |
Trustees’ and Chief Compliance Officer’s fees | | | 4,187 | | | | 913 | | | | 549 | |
Accounting fees | | | 3,658 | | | | 1,526 | | | | 1,798 | |
Professional Fees | | | 52,954 | | | | 47,758 | | | | 38,187 | |
Other | | | 30,823 | | | | 18,272 | | | | 16,152 | |
| | | | | | | | | | | | |
Total Liabilities | | | 138,486 | | | | 85,313 | | | | 96,829 | |
| | | | | | | | | | | | |
Net Assets | | $ | 356,298,771 | | | $ | 62,063,250 | | | $ | 55,011,105 | |
| | | | | | | | | | | | |
| | | |
NET ASSETS: | | | | | | | | | | | | |
Paid-in-Capital | | $ | 326,881,524 | | | $ | 55,136,078 | | | $ | 50,301,050 | |
Accumulated undistributed (distributions in excess of) net investment income | | | 3,670,669 | | | | 689,381 | | | | 301,790 | |
Accumulated net realized gains (losses) | | | (1,944,301 | ) | | | (46,980 | ) | | | (295,108 | ) |
Net unrealized appreciation (depreciation) | | | 27,690,879 | | | | 6,284,771 | | | | 4,703,373 | |
| | | | | | | | | | | | |
Total Net Assets | | $ | 356,298,771 | | | $ | 62,063,250 | | | $ | 55,011,105 | |
| | | | | | | | | | | | |
| | | |
Outstanding number of shares
(unlimited number of shares authorized — par value $0.0001) | | | 5,200,000 | | | | 1,000,000 | | | | 1,900,000 | |
| | | | | | | | | | | | |
Net asset value, per share | | $ | 68.52 | | | $ | 62.06 | | | $ | 28.95 | |
| | | | | | | | | | | | |
| | | |
Cost of investments in non-affiliates | | $ | 324,590,717 | | | $ | 55,620,196 | | | $ | 49,482,958 | |
Cost of investments in affiliates | | | 1,543,961 | | | | 192,796 | | | | 461,963 | |
SEE NOTES TO FINANCIAL STATEMENTS.
| | | | | | |
| | | |
| 92 | | | | JPMORGAN EXCHANGE-TRADED FUNDS | | OCTOBER 31, 2017 |
STATEMENTS OF OPERATIONS
FOR THE YEAR ENDED OCTOBER 31, 2017
| | | | | | | | | | | | |
| | | JPMorgan
Diversified
Return Emerging
Markets
Equity ETF | | | JPMorgan
Diversified
Return Europe
Currency
Hedged ETF | | | JPMorgan
Diversified
Return Europe
Equity ETF | |
INVESTMENT INCOME: | | | | | | | | | | | | |
Dividend income from non-affiliates | | $ | 4,511,025 | | | $ | — | | | $ | 2,402,740 | |
Dividend income from affiliates | | | 2,356 | | | | 604,070 | | | | — | |
Interest income from affiliates | | | 3,168 | | | | 1,550 | | | | 420 | |
Foreign taxes withheld | | | (520,601 | ) | | | — | | | | (235,840 | ) |
| | | | | | | | | | | | |
Total investment income | | | 3,995,948 | | | | 605,620 | | | | 2,167,320 | |
| | | | | | | | | | | | |
| | | |
EXPENSES: | | | | | | | | | | | | |
Investment advisory fees (Note 3.A) | | | 531,882 | | | | 91,888 | | | | 195,645 | |
Administration fees (Note 3.B) | | | 102,750 | | | | 23,668 | | | | 55,433 | |
Accounting fees (Note 3.D) | | | 73,914 | | | | 12,930 | | | | 54,075 | |
Interest expense to affiliates | | | 2,154 | | | | 157 | | | | 274 | |
Professional fees | | | 109,294 | | | | 51,692 | | | | 92,328 | |
Trustees’ and Chief Compliance Officer’s fees | | | 24,524 | | | | 6,504 | | | | 15,179 | |
Printing and mailing costs | | | 17,834 | | | | 3,018 | | | | 5,318 | |
Registration and filing fees | | | 26,015 | | | | 12,759 | | | | 14,831 | |
Custodian and Transfer Agent fees (Note 3.C) | | | 359,444 | | | | 8,090 | | | | 66,728 | |
Insurance expense | | | 11,438 | | | | 6,738 | | | | 9,952 | |
Offering costs (Note 2.F) | | | — | | | | 17,981 | | | | 692 | |
Other | | | 23,583 | | | | 9,511 | | | | 11,187 | |
| | | | | | | | | | | | |
Total expenses | | | 1,282,832 | | | | 244,936 | | | | 521,642 | |
| | | | | | | | | | | | |
Less fees waived (Note 3.E) | | | (607,254 | ) | | | (115,556 | ) | | | (235,439 | ) |
Less expense reimbursements from affiliates (Note 3.E) (Note 8) | | | — | | | | (168,340 | ) | | | — | |
Less expense reimbursements from non-affiliates (Note 3.C) | | | (132,300 | ) | | | — | | | | (5,700 | ) |
| | | | | | | | | | | | |
Net expenses | | | 543,278 | | | | (38,960 | ) | | | 280,503 | |
| | | | | | | | | | | | |
Net investment income (loss) | | | 3,452,670 | | | | 644,580 | | | | 1,886,817 | |
| | | | | | | | | | | | |
| | | |
REALIZED/UNREALIZED GAINS (LOSSES): | | | | | | | | | | | | |
Net realized gain (loss) on transactions from: | | | | | | | | | | | | |
Investments in non-affiliates | | | 1,005,245 | | | | — | | | | (73,383 | ) |
Investments in affiliates | | | — | | | | (79,372 | ) | | | — | |
Futures | | | 71,555 | | | | 5,999 | | | | — | |
Foreign currency transactions | | | (91,699 | ) | | | 7,345 | | | | 7,600 | |
Forward foreign currency exchange contracts | | | 51,437 | | | | (705,378 | ) | | | 3,080 | |
| | | | | | | | | | | | |
Net realized gain (loss) | | | 1,036,538 | | | | (771,406 | ) | | | (62,703 | ) |
| | | | | | | | | | | | |
Change in net unrealized appreciation/depreciation on: | | | | | | | | | | | | |
Investments in non-affiliates | | | 19,211,548 | (a) | | | — | | | | 13,093,805 | |
Investments in affiliates | | | — | | | | 5,863,107 | | | | — | |
Foreign currency translations | | | (4,668 | ) | | | — | | | | 8,089 | |
Forward foreign currency exchange contracts | | | — | | | | (421,384 | ) | | | — | |
| | | | | | | | | | | | |
Change in net unrealized appreciation/depreciation | | | 19,206,880 | | | | 5,441,723 | | | | 13,101,894 | |
| | | | | | | | | | | | |
Net realized/unrealized gains (losses) | | | 20,243,418 | | | | 4,670,317 | | | | 13,039,191 | |
| | | | | | | | | | | | |
Change in net assets resulting from operations | | $ | 23,696,088 | | | $ | 5,314,897 | | | $ | 14,926,008 | |
| | | | | | | | | | | | |
| (a) | Net change in India capital gains tax of approximately $(240,033). |
SEE NOTES TO FINANCIAL STATEMENTS.
| | | | | | | | |
| | | |
| OCTOBER 31, 2017 | | JPMORGAN EXCHANGE-TRADED FUNDS | | | | | 93 | |
STATEMENTS OF OPERATIONS
FOR THE YEAR ENDED OCTOBER 31, 2017 (continued)
| | | | | | | | | | | | |
| | | JPMorgan
Diversified
Return Global
Equity ETF | | �� | JPMorgan
Diversified
Return International
Currency
Hedged ETF | | | JPMorgan
Diversified
Return International
Equity ETF | |
INVESTMENT INCOME: | | | | | | | | | | | | |
Dividend income from non-affiliates | | $ | 2,137,908 | | | $ | — | | | $ | 25,416,065 | |
Dividend income from affiliates | | | 520 | | | | 486,815 | | | | 19,760 | |
Interest income from affiliates | | | 1,001 | | | | 195 | | | | 4,684 | |
Foreign taxes withheld | | | (185,031 | ) | | | — | | | | (1,894,416 | ) |
| | | | | | | | | | | | |
Total investment income | | | 1,954,398 | | | | 487,010 | | | | 23,546,093 | |
| | | | | | | | | | | | |
| | | |
EXPENSES: | | | | | | | | | | | | |
Investment advisory fees (Note 3.A) | | | 191,686 | | | | 105,174 | | | | 1,844,303 | |
Administration fees (Note 3.B) | | | 67,889 | | | | 33,110 | | | | 653,194 | |
Accounting fees (Note 3.D) | | | 62,331 | | | | 13,725 | | | | 190,627 | |
Interest expense to affiliates | | | 227 | | | | 249 | | | | 2,281 | |
Professional fees | | | 138,127 | | | | 59,846 | | | | 349,830 | |
Trustees’ and Chief Compliance Officer’s fees | | | 18,544 | | | | 8,497 | | | | 162,429 | |
Printing and mailing costs | | | 12,122 | | | | 6,227 | | | | 103,890 | |
Registration and filing fees | | | 13,708 | | | | 10,906 | | | | 75,591 | |
Custodian and Transfer Agent fees (Note 3.C) | | | 101,145 | | | | 1,670 | | | | 401,834 | |
Insurance expense | | | 13,903 | | | | 8,881 | | | | 89,811 | |
Offering costs (Note 2.F) | | | — | | | | 35,616 | | | | — | |
Other | | | 21,040 | | | | 12,357 | | | | 81,764 | |
| | | | | | | | | | | | |
Total expenses | | | 640,722 | | | | 296,258 | | | | 3,955,554 | |
| | | | | | | | | | | | |
Less fees waived (Note 3.E) | | | (259,575 | ) | | | (138,284 | ) | | | (453,814 | ) |
Less expense reimbursements from affiliates (Note 3.E) (Note 8) | | | (46,694 | ) | | | (190,757 | ) | | | — | |
Less expense reimbursements from non-affiliates (Note 3.C) | | | (30,800 | ) | | | — | | | | (201,600 | ) |
| | | | | | | | | | | | |
Net expenses | | | 303,653 | | | | (32,783 | ) | | | 3,300,140 | |
| | | | | | | | | | | | |
Net investment income (loss) | | | 1,650,745 | | | | 519,793 | | | | 20,245,953 | |
| | | | | | | | | | | | |
| | | |
REALIZED/UNREALIZED GAINS (LOSSES): | | | | | | | | | | | | |
Net realized gain (loss) on transactions from: | | | | | | | | | �� | | | |
Investments in non-affiliates | | | 553,947 | | | | — | | | | (3,961,415 | ) |
In-kind redemptions in non-affiliates | | | 1,993,665 | | | | — | | | | 4,151,369 | |
Investments in affiliates | | | — | | | | 62,314 | | | | — | |
Futures | | | — | | | | — | | | | (42,116 | ) |
Foreign currency transactions | | | (7,244 | ) | | | (93 | ) | | | (17,538 | ) |
Forward foreign currency exchange contracts | | | (1,686 | ) | | | (179,919 | ) | | | 41,751 | |
| | | | | | | | | | | | |
Net realized gain (loss) | | | 2,538,682 | | | | (117,698 | ) | | | 172,051 | |
| | | | | | | | | | | | |
Change in net unrealized appreciation/depreciation on: | | | | | | | | | | | | |
Investments in non-affiliates | | | 10,663,605 | | | | — | | | | 122,973,099 | |
Investments in affiliates | | | — | | | | 6,973,733 | | | | — | |
Futures | | | — | | | | — | | | | 135,909 | |
Foreign currency translations | | | 4,946 | | | | — | | | | 34,736 | |
Forward foreign currency exchange contracts | | | — | | | | (410,982 | ) | | | — | |
| | | | | | | | | | | | |
Change in net unrealized appreciation/depreciation | | | 10,668,551 | | | | 6,562,751 | | | | 123,143,744 | |
| | | | | | | | | | | | |
Net realized/unrealized gains (losses) | | | 13,207,233 | | | | 6,445,053 | | | | 123,315,795 | |
| | | | | | | | | | | | |
Change in net assets resulting from operations | | $ | 14,857,978 | | | $ | 6,964,846 | | | $ | 143,561,748 | |
| | | | | | | | | | | | |
SEE NOTES TO FINANCIAL STATEMENTS.
| | | | | | |
| | | |
| 94 | | | | JPMORGAN EXCHANGE-TRADED FUNDS | | OCTOBER 31, 2017 |
| | | | | | | | | | | | |
| | | JPMorgan
Diversified
Return U.S.
Equity ETF | | | JPMorgan
Diversified
Return U.S.
Mid Cap
Equity ETF | | | JPMorgan
Diversified
Return U.S.
Small Cap
Equity ETF (a) | |
INVESTMENT INCOME: | | | | | | | | | | | | |
Dividend income from non-affiliates | | $ | 4,787,201 | | | $ | 962,138 | | | $ | 431,319 | |
Dividend income from affiliates | | | 7,893 | | | | 3,154 | | | | 1,401 | |
Interest income from affiliates | | | 51 | | | | 12 | | | | 2,752 | |
| | | | | | | | | | | | |
Total investment income | | | 4,795,145 | | | | 965,304 | | | | 435,472 | |
| | | | | | | | | | | | |
| | | |
EXPENSES: | | | | | | | | | | | | |
Investment advisory fees (Note 3.A) | | | 538,832 | | | | 128,187 | | | | 90,324 | |
Administration fees (Note 3.B) | | | 199,134 | | | | 45,400 | | | | 26,474 | |
Accounting fees (Note 3.D) | | | 50,333 | | | | 19,341 | | | | 15,008 | |
Professional fees | | | 108,196 | | | | 61,322 | | | | 55,575 | |
Trustees’ and Chief Compliance Officer’s fees | | | 51,825 | | | | 11,717 | | | | 5,995 | |
Printing and mailing costs | | | 29,204 | | | | 6,435 | | | | 4,314 | |
Registration and filing fees | | | 31,216 | | | | 14,538 | | | | 20,459 | |
Custodian and Transfer Agent fees (Note 3.C) | | | 51,687 | | | | 27,654 | | | | 65,045 | |
Insurance expense | | | 25,495 | | | | 3,989 | | | | 4,866 | |
Offering costs (Note 2.F) | | | — | | | | 9,789 | | | | 11,701 | |
Other | | | 25,774 | | | | 5,017 | | | | 3,043 | |
| | | | | | | | | | | | |
Total expenses | | | 1,111,696 | | | | 333,389 | | | | 302,804 | |
| | | | | | | | | | | | |
Less fees waived (Note 3.E) | | | (572,126 | ) | | | (173,587 | ) | | | (116,798 | ) |
Less expense reimbursements from affiliates (Note 3.E) (Note 8) | | | — | | | | (8,380 | ) | | | (61,704 | ) |
Less expense reimbursements from non-affiliates (Note 3.C) | | | (40,600 | ) | | | (10,500 | ) | | | (27,300 | ) |
| | | | | | | | | | | | |
Net expenses | | | 498,970 | | | | 140,922 | | | | 97,002 | |
| | | | | | | | | | | | |
Net investment income (loss) | | | 4,296,175 | | | | 824,382 | | | | 338,470 | |
| | | | | | | | | | | | |
| | | |
REALIZED/UNREALIZED GAINS (LOSSES): | | | | | | | | | | | | |
Net realized gain (loss) on transactions from: | | | | | | | | | | | | |
Investments in non-affiliates | | | (1,759,582 | ) | | | 25,727 | | | | (284,531 | ) |
In-kind redemptions in non-affiliates | | | 10,809,680 | | | | 3,547,360 | | | | — | |
Futures | | | (21,024 | ) | | | 2,302 | | | | (10,577 | ) |
| | | | | | | | | | | | |
Net realized gain (loss) | | | 9,029,074 | | | | 3,575,389 | | | | (295,108 | ) |
| | | | | | | | | | | | |
Change in net unrealized appreciation/depreciation on: | | | | | | | | | | | | |
Investments in non-affiliates | | | 27,976,993 | | | | 5,506,350 | | | | 4,691,459 | |
Futures | | | 23,608 | | | | — | | | | 11,914 | |
| | | | | | | | | | | | |
Change in net unrealized appreciation/depreciation | | | 28,000,601 | | | | 5,506,350 | | | | 4,703,373 | |
| | | | | | | | | | | | |
Net realized/unrealized gains (losses) | | | 37,029,675 | | | | 9,081,739 | | | | 4,408,265 | |
| | | | | | | | | | | | |
Change in net assets resulting from operations | | $ | 41,325,850 | | | $ | 9,906,121 | | | $ | 4,746,735 | |
| | | | | | | | | | | | |
| (a) | Commencement of operations was November 15, 2016. |
SEE NOTES TO FINANCIAL STATEMENTS.
| | | | | | | | |
| | | |
| OCTOBER 31, 2017 | | JPMORGAN EXCHANGE-TRADED FUNDS | | | | | 95 | |
STATEMENTS OF CHANGES IN NET ASSETS
FOR THE PERIODS INDICATED
| | | | | | | | | | | | | | | | |
| | | JPMorgan Diversified Return
Emerging Markets Equity ETF | | | JPMorgan Diversified Return
Europe Currency Hedged ETF | |
| | | Year Ended
October 31, 2017 | | | Year Ended
October 31, 2016 | | | Year Ended
October 31, 2017 | | | Period Ended
October 31, 2016 (a) | |
CHANGE IN NET ASSETS RESULTING FROM OPERATIONS: | | | | | | | | | | | | | | | | |
Net investment income (loss) | | $ | 3,452,670 | | | $ | 732,592 | | | $ | 644,580 | | | $ | (67,905 | ) |
Net realized gain (loss) | | | 1,036,538 | | | | (5,347,986 | ) | | | (771,406 | ) | | | 893,007 | |
Change in net unrealized appreciation/depreciation | | | 19,206,880 | | | | 6,262,628 | | | | 5,441,723 | | | | (180,427 | ) |
| | | | | | | | | | | | | | | | |
Change in net assets resulting from operations | | | 23,696,088 | | | | 1,647,234 | | | | 5,314,897 | | | | 644,675 | |
| | | | | | | | | | | | | | | | |
| | | | |
DISTRIBUTIONS TO SHAREHOLDERS: | | | | | | | | | | | | | | | | |
From net investment income | | | (771,056 | ) | | | (1,050,480 | ) | | | (534,400 | ) | | | — | |
From net realized gains | | | — | | | | — | | | | (1,806,320 | ) | | | — | |
| | | | | | | | | | | | | | | | |
Total distributions to shareholders | | | (771,056 | ) | | | (1,050,480 | ) | | | (2,340,720 | ) | | | — | |
| | | | | | | | | | | | | | | | |
| | | | |
CAPITAL TRANSACTIONS: | | | | | | | | | | | | | | | | |
Change in net assets resulting from capital transactions | | | 99,006,553 | | | | 7,027,033 | | | | 1,249,800 | | | | 25,838,593 | |
| | | | | | | | | | | | | | | | |
| | | | |
NET ASSETS: | | | | | | | | | | | | | | | | |
Change in net assets | | | 121,931,585 | | | | 7,623,787 | | | | 4,223,977 | | | | 26,483,268 | |
Beginning of period | | | 43,809,461 | | | | 36,185,674 | | | | 26,483,268 | | | | — | |
| | | | | | | | | | | | | | | | |
End of period | | $ | 165,741,046 | | | $ | 43,809,461 | | | $ | 30,707,245 | | | $ | 26,483,268 | |
| | | | | | | | | | | | | | | | |
Accumulated undistributed (distributions in excess of) net investment income | | $ | 3,326,876 | | | $ | 660,929 | | | $ | 34,913 | | | $ | (59,634 | ) |
| | | | | | | | | | | | | | | | |
| | | | |
CAPITAL SHARE TRANSACTIONS: | | | | | | | | | | | | | | | | |
Proceeds from shares issued | | $ | 99,006,553 | | | $ | 14,272,477 | | | $ | 1,249,800 | | | $ | 25,838,593 | |
Redeemed | | | — | | | | (7,245,444 | ) | | | — | | | | — | |
| | | | | | | | | | | | | | | | |
Total change in net assets resulting from capital transactions | | $ | 99,006,553 | | | $ | 7,027,033 | | | $ | 1,249,800 | | | $ | 25,838,593 | |
| | | | | | | | | | | | | | | | |
| | | | |
SHARE TRANSACTIONS: | | | | | | | | | | | | | | | | |
Issued | | | 2,000,000 | | | | 300,000 | | | | 50,000 | | | | 1,000,000 | |
Redeemed | | | — | | | | (200,000 | ) | | | — | | | | — | |
| | | | | | | | | | | | | | | | |
Net increase in shares from share transactions | | | 2,000,000 | | | | 100,000 | | | | 50,000 | | | | 1,000,000 | |
| | | | | | | | | | | | | | | | |
| (a) | Commencement of operations was April 1, 2016. |
SEE NOTES TO FINANCIAL STATEMENTS.
| | | | | | |
| | | |
| 96 | | | | JPMORGAN EXCHANGE-TRADED FUNDS | | OCTOBER 31, 2017 |
| | | | | | | | | | | | | | | | |
| | | JPMorgan Diversified Return
Europe Equity ETF | | | JPMorgan Diversified Return
Global Equity ETF | |
| | | Year Ended
October 31, 2017 | | | Period Ended
October 31, 2016 (a) | | | Year Ended
October 31, 2017 | | | Year Ended
October 31, 2016 | |
CHANGE IN NET ASSETS RESULTING FROM OPERATIONS: | | | | | | | | | | | | | | | | |
Net investment income (loss) | | $ | 1,886,817 | | | $ | 1,200,080 | | | $ | 1,650,745 | | | $ | 1,466,798 | |
Net realized gain (loss) | | | (62,703 | ) | | | (196,912 | ) | | | 2,538,682 | | | | (1,594,236 | ) |
Change in net unrealized appreciation/depreciation | | | 13,101,894 | | | | (1,347,706 | ) | | | 10,668,551 | | | | 3,452,655 | |
| | | | | | | | | | | | | | | | |
Change in net assets resulting from operations | | | 14,926,008 | | | | (344,538 | ) | | | 14,857,978 | | | | 3,325,217 | |
| | | | | | | | | | | | | | | | |
| | | | |
DISTRIBUTIONS TO SHAREHOLDERS: | | | | | | | | | | | | | | | | |
From net investment income | | | (1,338,720 | ) | | | (918 | ) | | | (1,695,420 | ) | | | (1,057,127 | ) |
| | | | | | | | | | | | | | | | |
Total distributions to shareholders | | | (1,338,720 | ) | | | (918 | ) | | | (1,695,420 | ) | | | (1,057,127 | ) |
| | | | | | | | | | | | | | | | |
| | | | |
CAPITAL TRANSACTIONS: | | | | | | | | | | | | | | | | |
Change in net assets resulting from capital transactions | | | 6,045,436 | | | | 60,205,089 | | | | 12,975,579 | | | | 24,758,809 | |
| | | | | | | | | | | | | | | | |
| | | | |
NET ASSETS: | | | | | | | | | | | | | | | | |
Change in net assets | | | 19,632,724 | | | | 59,859,633 | | | | 26,138,137 | | | | 27,026,899 | |
Beginning of period | | | 59,859,633 | | | | — | | | | 77,556,933 | | | | 50,530,034 | |
| | | | | | | | | | | | | | | | |
End of period | | $ | 79,492,357 | | | $ | 59,859,633 | | | $ | 103,695,070 | | | $ | 77,556,933 | |
| | | | | | | | | | | | | | | | |
Accumulated undistributed (distributions in excess of) net investment income | | $ | 1,745,875 | | | $ | 1,181,263 | | | $ | 1,204,535 | | | $ | 1,249,069 | |
| | | | | | | | | | | | | | | | |
| | | | |
CAPITAL SHARE TRANSACTIONS: | | | | | | | | | | | | | | | | |
Proceeds from shares issued | | $ | 6,045,436 | | | $ | 60,205,089 | | | $ | 23,855,987 | | | $ | 24,758,809 | |
Redeemed | | | — | | | | — | | | | (10,880,408 | ) | | | — | |
| | | | | | | | | | | | | | | | |
Total change in net assets resulting from capital transactions | | $ | 6,045,436 | | | $ | 60,205,089 | | | $ | 12,975,579 | | | $ | 24,758,809 | |
| | | | | | | | | | | | | | | | |
| | | | |
SHARE TRANSACTIONS: | | | | | | | | | | | | | | | | |
Issued | | | 100,000 | | | | 1,200,000 | | | | 400,000 | | | | 500,000 | |
Redeemed | | | — | | | | — | | | | (200,000 | ) | | | — | |
| | | | | | | | | | | | | | | | |
Net increase in shares from share transactions | | | 100,000 | | | | 1,200,000 | | | | 200,000 | | | | 500,000 | |
| | | | | | | | | | | | | | | | |
| (a) | Commencement of operations was December 18, 2015. |
SEE NOTES TO FINANCIAL STATEMENTS.
| | | | | | | | |
| | | |
| OCTOBER 31, 2017 | | JPMORGAN EXCHANGE-TRADED FUNDS | | | | | 97 | |
STATEMENTS OF CHANGES IN NET ASSETS
FOR THE PERIODS INDICATED (continued)
| | | | | | | | | | | | | | | | |
| | | JPMorgan Diversified Return
International Currency Hedged ETF | | | JPMorgan Diversified Return
International Equity ETF | |
| | | Year Ended
October 31, 2017 | | | Period Ended
October 31, 2016 (a) | | | Year Ended
October 31, 2017 | | | Year Ended
October 31, 2016 | |
CHANGE IN NET ASSETS RESULTING FROM OPERATIONS: | | | | | | | | | | | | | | | | |
Net investment income (loss) | | $ | 519,793 | | | $ | (67,264 | ) | | $ | 20,245,953 | | | $ | 6,954,232 | |
Net realized gain (loss) | | | (117,698 | ) | | | 66,331 | | | | 172,051 | | | | (5,272,526 | ) |
Change in net unrealized appreciation/depreciation | | | 6,562,751 | | | | 526,523 | | | | 123,143,744 | | | | 5,716,709 | |
| | | | | | | | | | | | | | | | |
Change in net assets resulting from operations | | | 6,964,846 | | | | 525,590 | | | | 143,561,748 | | | | 7,398,415 | |
| | | | | | | | | | | | | | | | |
| | | | |
DISTRIBUTIONS TO SHAREHOLDERS: | | | | | | | | | | | | | | | | |
From net investment income | | | (431,255 | ) | | | — | | | | (9,230,405 | ) | | | (2,154,090 | ) |
From net realized gains | | | (918,280 | ) | | | — | | | | — | | | | — | |
| | | | | | | | | | | | | | | | |
Total distributions to shareholders | | | (1,349,535 | ) | | | — | | | | (9,230,405 | ) | | | (2,154,090 | ) |
| | | | | | | | | | | | | | | | |
| | | | |
CAPITAL TRANSACTIONS: | | | | | | | | | | | | | | | | |
Change in net assets resulting from capital transactions | | | 16,343,042 | | | | 25,790,524 | | | | 555,512,947 | | | | 372,684,784 | |
| | | | | | | | | | | | | | | | |
| | | | |
NET ASSETS: | | | | | | | | | | | | | | | | |
Change in net assets | | | 21,958,353 | | | | 26,316,114 | | | | 689,844,290 | | | | 377,929,109 | |
Beginning of period | | | 26,316,114 | | | | — | | | | 470,042,716 | | | | 92,113,607 | |
| | | | | | | | | | | | | | | | |
End of period | | $ | 48,274,467 | | | $ | 26,316,114 | | | $ | 1,159,887,006 | | | $ | 470,042,716 | |
| | | | | | | | | | | | | | | | |
Accumulated undistributed (distributions in excess of) net investment income | | $ | 14,482 | | | $ | (54,114 | ) | | $ | 17,961,437 | | | $ | 6,655,210 | |
| | | | | | | | | | | | | | | | |
| | | | |
CAPITAL SHARE TRANSACTIONS: | | | | | | | | | | | | | | | | |
Proceeds from shares issued | | $ | 16,343,042 | | | $ | 25,790,524 | | | $ | 581,072,027 | | | $ | 372,684,784 | |
Redeemed | | | — | | | | — | | | | (25,559,080 | ) | | | — | |
| | | | | | | | | | | | | | | | |
Total change in net assets resulting from capital transactions | | $ | 16,343,042 | | | $ | 25,790,524 | | | $ | 555,512,947 | | | $ | 372,684,784 | |
| | | | | | | | | | | | | | | | |
| | | | |
SHARE TRANSACTIONS: | | | | | | | | | | | | | | | | |
Issued | | | 600,000 | | | | 1,000,000 | | | | 10,700,000 | | | | 7,600,000 | |
Redeemed | | | — | | | | — | | | | (500,000 | ) | | | — | |
| | | | | | | | | | | | | | | | |
Net increase in shares from share transactions | | | 600,000 | | | | 1,000,000 | | | | 10,200,000 | | | | 7,600,000 | |
| | | | | | | | | | | | | | | | |
| (a) | Commencement of operations was April 1, 2016. |
SEE NOTES TO FINANCIAL STATEMENTS.
| | | | | | |
| | | |
| 98 | | | | JPMORGAN EXCHANGE-TRADED FUNDS | | OCTOBER 31, 2017 |
| | | | | | | | | | | | | | | | |
| | | JPMorgan Diversified Return
U.S. Equity ETF | | | JPMorgan Diversified Return
U.S. Mid Cap Equity ETF | |
| | | Year Ended
October 31, 2017 | | | Year Ended
October 31, 2016 | | | Year Ended
October 31, 2017 | | | Period Ended
October 31, 2016 (a) | |
CHANGE IN NET ASSETS RESULTING FROM OPERATIONS: | | | | | | | | | | | | | | | | |
Net investment income (loss) | | $ | 4,296,175 | | | $ | 891,049 | | | $ | 824,382 | | | $ | 256,306 | |
Net realized gain (loss) | | | 9,029,074 | | | | (233,079 | ) | | | 3,575,389 | | | | (84,431 | ) |
Change in net unrealized appreciation/depreciation | | | 28,000,601 | | | | (1,126,048 | ) | | | 5,506,350 | | | | 778,421 | |
| | | | | | | | | | | | | | | | |
Change in net assets resulting from operations | | | 41,325,850 | | | | (468,078 | ) | | | 9,906,121 | | | | 950,296 | |
| | | | | | | | | | | | | | | | |
| | | | |
DISTRIBUTIONS TO SHAREHOLDERS: | | | | | | | | | | | | | | | | |
From net investment income | | | (1,329,650 | ) | | | (130,025 | ) | | | (396,160 | ) | | | — | |
| | | | | | | | | | | | | | | | |
Total distributions to shareholders | | | (1,329,650 | ) | | | (130,025 | ) | | | (396,160 | ) | | | — | |
| | | | | | | | | | | | | | | | |
| | | | |
CAPITAL TRANSACTIONS: | | | | | | | | | | | | | | | | |
Change in net assets resulting from capital transactions | | | 190,764,313 | | | | 115,309,738 | | | | 16,399,401 | | | | 35,203,592 | |
| | | | | | | | | | | | | | | | |
| | | | |
NET ASSETS: | | | | | | | | | | | | | | | | |
Change in net assets | | | 230,760,513 | | | | 114,711,635 | | | | 25,909,362 | | | | 36,153,888 | |
Beginning of period | | | 125,538,258 | | | | 10,826,623 | | | | 36,153,888 | | | | — | |
| | | | | | | | | | | | | | | | |
End of period | | $ | 356,298,771 | | | $ | 125,538,258 | | | $ | 62,063,250 | | | $ | 36,153,888 | |
| | | | | | | | | | | | | | | | |
Accumulated undistributed (distributions in excess of) net investment income | | $ | 3,670,669 | | | $ | 775,559 | | | $ | 689,381 | | | $ | 260,771 | |
| | | | | | | | | | | | | | | | |
| | | | |
CAPITAL SHARE TRANSACTIONS: | | | | | | | | | | | | | | | | |
Proceeds from shares issued | | $ | 266,609,754 | | | $ | 115,309,738 | | | $ | 34,787,448 | | | $ | 35,203,592 | |
Redeemed | | | (75,845,441 | ) | | | — | | | | (18,388,047 | ) | | | — | |
| | | | | | | | | | | | | | | | |
Total change in net assets resulting from capital transactions | | $ | 190,764,313 | | | $ | 115,309,738 | | | $ | 16,399,401 | | | $ | 35,203,592 | |
| | | | | | | | | | | | | | | | |
| | | | |
SHARE TRANSACTIONS: | | | | | | | | | | | | | | | | |
Issued | | | 4,200,000 | | | | 2,000,000 | | | | 600,000 | | | | 700,000 | |
Redeemed | | | (1,200,000 | ) | | | — | | | | (300,000 | ) | | | — | |
| | | | | | | | | | | | | | | | |
Net increase in shares from share transactions | | | 3,000,000 | | | | 2,000,000 | | | | 300,000 | | | | 700,000 | |
| | | | | | | | | | | | | | | | |
| (a) | Commencement of operations was May 11, 2016. |
SEE NOTES TO FINANCIAL STATEMENTS.
| | | | | | | | |
| | | |
| OCTOBER 31, 2017 | | JPMORGAN EXCHANGE-TRADED FUNDS | | | | | 99 | |
STATEMENTS OF CHANGES IN NET ASSETS
FOR THE PERIODS INDICATED (continued)
| | | | |
| | | JPMorgan
Diversified Return
U.S. Small Cap
Equity ETF | |
| | | Period Ended
October 31, 2017 (a) | |
CHANGE IN NET ASSETS RESULTING FROM OPERATIONS: | |
Net investment income (loss) | | $ | 338,470 | |
Net realized gain (loss) | | | (295,108 | ) |
Change in net unrealized appreciation/depreciation | | | 4,703,373 | |
| | | | |
Change in net assets resulting from operations | | | 4,746,735 | |
| | | | |
| |
DISTRIBUTIONS TO SHAREHOLDERS: | | | | |
From net investment income | | | (36,680 | ) |
| | | | |
Total distributions to shareholders | | | (36,680 | ) |
| | | | |
| |
CAPITAL TRANSACTIONS: | | | | |
Change in net assets resulting from capital transactions | | | 50,301,050 | |
| | | | |
| |
NET ASSETS: | | | | |
Change in net assets | | | 55,011,105 | |
Beginning of period | | | — | |
| | | | |
End of period | | $ | 55,011,105 | |
| | | | |
Accumulated undistributed (distributions in excess of) net investment income | | $ | 301,790 | |
| | | | |
| |
CAPITAL SHARE TRANSACTIONS: | | | | |
Proceeds from shares issued | | $ | 50,301,050 | |
Redeemed | | | — | |
| | | | |
Total change in net assets resulting from capital transactions | | $ | 50,301,050 | |
| | | | |
| |
SHARE TRANSACTIONS: | | | | |
Issued | | | 1,900,000 | |
Redeemed | | | — | |
| | | | |
Net increase in shares from share transactions | | | 1,900,000 | |
| | | | |
| (a) | Commencement of operations was November 15, 2016. |
SEE NOTES TO FINANCIAL STATEMENTS.
| | | | | | |
| | | |
| 100 | | | | JPMORGAN EXCHANGE-TRADED FUNDS | | OCTOBER 31, 2017 |
THIS PAGE IS INTENTIONALLY LEFT BLANK
| | | | | | | | |
| | | |
| OCTOBER 31, 2017 | | JPMORGAN EXCHANGE-TRADED FUNDS | | | | | 101 | |
FINANCIAL HIGHLIGHTS
FOR THE PERIODS INDICATED
| | | | | | | | | | | | | | | | | | | | | | | | | | | | |
| | | Per share operating performance | |
| | | | | | Investment operations | | | Distributions | |
| | | Net asset
value,
beginning
of period | | | Net
investment
income
(loss) (b)(c) | | | Net realized
and unrealized
gains
(losses) on
investments | | | Total from
investment
operations | | | Net
investment
income | | | Net
realized
gain (loss) | | | Total from
distributions | |
JPMorgan Diversified Return Emerging Markets Equity ETF | | | | | | | | | | | | | | | | | | | | | | | | | | | | |
Year Ended October 31, 2017 | | $ | 48.68 | | | $ | 1.50 | | | $ | 7.56 | | | $ | 9.06 | | | $ | (0.59 | ) | | $ | — | | | $ | (0.59 | ) |
Year Ended October 31, 2016 | | | 45.23 | | | | 1.04 | | | | 3.72 | | | | 4.76 | | | | (1.31 | ) | | | — | | | | (1.31 | ) |
January 7, 2015 (a) through October 31, 2015 | | | 50.00 | | | | 1.29 | | | | (6.06 | ) | | | (4.77 | ) | | | — | | | | — | | | | — | |
| | | | | | | |
JPMorgan Diversified Return Europe Currency Hedged ETF | | | | | | | | | | | | | | | | | | | | | | | | | | | | |
Year Ended October 31, 2017 | | | 26.48 | | | | 0.62 | (k) | | | 4.48 | | | | 5.10 | | | | (0.53 | ) | | | (1.81 | ) | | | (2.34 | ) |
April 1, 2016 (a) through October 31, 2016 | | | 25.00 | | | | (0.07 | ) | | | 1.55 | | | | 1.48 | | | | — | | | | — | | | | — | |
| | | | | | | |
JPMorgan Diversified Return Europe Equity ETF | | | | | | | | | | | | | | | | | | | | | | | | | | | | |
Year Ended October 31, 2017 | | | 49.88 | | | | 1.57 | | | | 10.82 | | | | 12.39 | | | | (1.12 | ) | | | — | | | | (1.12 | ) |
December 18, 2015 (a) through October 31, 2016 | | | 50.00 | | | | 1.39 | | | | (1.51 | ) | | | (0.12 | ) | | | — | (j) | | | — | | | | — | (j) |
| | | | | | | |
JPMorgan Diversified Return Global Equity ETF | | | | | | | | | | | | | | | | | | | | | | | | | | | | |
Year Ended October 31, 2017 | | | 51.70 | | | | 1.15 | | | | 9.28 | | | | 10.43 | | | | (1.13 | ) | | | — | | | | (1.13 | ) |
Year Ended October 31, 2016 | | | 50.53 | | | | 1.14 | | | | 0.99 | | | | 2.13 | | | | (0.96 | ) | | | — | | | | (0.96 | ) |
Year Ended October 31, 2015 | | | 49.69 | | | | 1.08 | | | | 0.08 | | | | 1.16 | | | | (0.32 | ) | | | — | | | | (0.32 | ) |
June 16, 2014 (a) through October 31, 2014 | | | 50.00 | | | | 0.38 | | | | (0.69 | ) | | | (0.31 | ) | | | — | | | | — | | | | — | |
| (a) | Commencement of operations. |
| (b) | Calculated based upon average shares outstanding. |
| (c) | Net investment income (loss) is affected by the timing of distributions from underlying funds. |
| (d) | Not annualized for periods less than one year. |
| (e) | Includes adjustments in accordance with accounting principles generally accepted in the United States of America and as such, the net asset values for financial reporting purposes and the returns based upon those net asset values may differ from the net asset values and returns for shareholder transactions. |
| (f) | Market price total return is calculated assuming an initial investment made at the beginning of the period market price, reinvestment of all dividends and distributions at market price during the period, and sale at the market price on the last day of the period. The market price presented to calculate the market price total return is the mid-point of the bid/ask spread at the close of business on the NYSE Arca, Inc. |
| (g) | Annualized for periods less than one year, unless otherwise indicated. |
| (h) | Certain non-recurring expenses incurred by the Fund were not annualized for the periods indicated. |
| (i) | Does not include expenses of underlying funds. |
| (j) | Amount rounds to less than $0.005. |
| (k) | As described in Note 8, amount reflects an out of period adjustment related to an expense reimbursement for acquired fund fees. Had the Fund not recorded the out of period adjustment, the net investment income (loss) per share would have been $0.56, the net investment income (loss) ratio would have been 2.10%, the net expense ratio would have been 0.07%, and the total return would have been 20.66%. |
SEE NOTES TO FINANCIAL STATEMENTS.
| | | | | | |
| | | |
| 102 | | | | JPMORGAN EXCHANGE-TRADED FUNDS | | OCTOBER 31, 2017 |
| | | | | | | | | | | | | | | | | | | | | | | | | | | | | | | | | | |
| | | Ratios/Supplemental data | |
| | | | | | | | | | | | | | | | Ratios to average net assets (g) | | | | |
Net asset
value,
end of
period | | |
Market
price,
end of
period | | | Total
return (d)(e) | | | Market
price
total
return (d)(f) | | | Net assets,
end of
period | | | Net
expenses (i) | | | Net
investment
income
(loss) (c) | | | Expenses
without waivers
and reimbursements (i) | | | Portfolio
turnover
rate (d) | |
| | | | | | | | | | | | | | | | | | | | | | | | | | | | | | | | | | |
| $ | 57.15 | | | $ | 57.36 | | | | 18.95 | % | | | 18.65 | % | | $ | 165,741,046 | | | | 0.45 | % | | | 2.85 | % | | | 1.06 | % | | | 60 | % |
| | 48.68 | | | | 48.98 | | | | 11.02 | | | | 11.63 | | | | 43,809,461 | | | | 0.45 | | | | 2.33 | | | | 1.91 | | | | 44 | |
| | 45.23 | | | | 45.27 | | | | (9.54 | ) | | | (9.46 | ) | | | 36,185,674 | | | | 0.45 | (h) | | | 3.18 | | | | 2.07 | (h) | | | 46 | |
| | | | | | | | |
| | | | | | | | | | | | | | | | | | | | | | | | | | | | | | | | | | |
| | 29.24 | | | | 29.29 | | | | 20.87 | (k) | | | 20.83 | | | | 30,707,245 | | | | (0.14 | )(k) | | | 2.31 | (k) | | | 0.88 | | | | 12 | |
| | 26.48 | | | | 26.52 | | | | 5.96 | | | | 6.08 | | | | 26,483,268 | | | | 0.49 | (h) | | | (0.49 | ) | | | 1.08 | (h) | | | 1 | |
| | | | | | | | |
| | | | | | | | | | | | | | | | | | | | | | | | | | | | | | | | | | |
| | 61.15 | | | | 61.42 | | | | 25.42 | | | | 25.80 | | | | 79,492,357 | | | | 0.43 | | | | 2.89 | | | | 0.80 | | | | 18 | |
| | 49.88 | | | | 49.95 | | | | (0.23 | ) | | | (0.09 | ) | | | 59,859,633 | | | | 0.43 | (h) | | | 3.14 | | | | 1.14 | (h) | | | 15 | |
| | | | | | | | |
| | | | | | | | | | | | | | | | | | | | | | | | | | | | | | | | | | |
| | 61.00 | | | | 61.14 | | | | 20.61 | | | | 20.40 | | | | 103,695,070 | | | | 0.38 | | | | 2.06 | | | | 0.80 | | | | 26 | |
| | 51.70 | | | | 51.91 | | | | 4.31 | | | | 4.44 | | | | 77,556,933 | | | | 0.38 | | | | 2.26 | | | | 0.93 | | | | 22 | |
| | 50.53 | | | | 50.67 | | | | 2.36 | | | | 1.82 | | | | 50,530,034 | | | | 0.38 | | | | 2.16 | | | | 1.52 | | | | 18 | |
| | 49.69 | | | | 50.09 | | | | (0.62 | ) | | | 0.18 | | | | 24,846,767 | | | | 0.38 | (h) | | | 2.01 | | | | 5.19 | (h) | | | 14 | |
SEE NOTES TO FINANCIAL STATEMENTS.
| | | | | | | | |
| | | |
| OCTOBER 31, 2017 | | JPMORGAN EXCHANGE-TRADED FUNDS | | | | | 103 | |
FINANCIAL HIGHLIGHTS
FOR THE PERIODS INDICATED (continued)
| | | | | | | | | | | | | | | | | | | | | | | | | | | | |
| | | Per share operating performance | |
| | | | | | Investment operations | | | Distributions | |
| | | Net asset
value,
beginning
of period | | | Net
investment
income
(loss) (b)(c) | | | Net realized
and unrealized
gains
(losses) on
investments | | | Total from
investment
operations | | | Net
investment
income | | | Net
realized
gain (loss) | | | Total from
distributions | |
JPMorgan Diversified Return International Currency Hedged ETF | | | | | | | | | | | | | | | | | | | | | | | | | | | | |
Year Ended October 31, 2017 | | $ | 26.32 | | | | 0.37 | (l) | | $ | 4.70 | | | $ | 5.07 | | | $ | (0.39 | ) | | $ | (0.83 | ) | | $ | (1.22 | ) |
April 1, 2016 (a) through October 31, 2016 | | | 25.00 | | | | (0.07 | ) | | | 1.39 | | | | 1.32 | | | | — | | | | — | | | | — | |
| | | | | | | |
JPMorgan Diversified Return International Equity ETF | | | | | | | | | | | | | | | | | | | | | | | | | | | | |
Year Ended October 31, 2017 | | | 50.00 | | | | 1.43 | | | | 8.57 | | | | 10.00 | | | | (0.82 | ) | | | — | | | | (0.82 | ) |
Year Ended October 31, 2016 | | | 51.17 | | | | 1.28 | | | | (1.37 | )(d) | | | (0.09 | ) | | | (1.08 | ) | | | — | | | | (1.08 | ) |
November 5, 2014 (a) through October 31, 2015 | | | 50.00 | | | | 1.39 | | | | (0.07 | ) | | | 1.32 | | | | (0.15 | ) | | | — | | | | (0.15 | ) |
| | | | | | | |
JPMorgan Diversified Return U.S. Equity ETF | | | | | | | | | | | | | | | | | | | | | | | | | | | | |
Year Ended October 31, 2017 | | | 57.06 | | | | 1.17 | | | | 10.75 | | | | 11.92 | | | | (0.46 | ) | | | — | | | | (0.46 | ) |
Year Ended October 31, 2016 | | | 54.13 | | | | 1.10 | | | | 2.09 | (d) | | | 3.19 | | | | (0.26 | ) | | | — | | | | (0.26 | ) |
September 29, 2015 (a) through October 31, 2015 | | | 50.00 | | | | 0.06 | | | | 4.07 | | | | 4.13 | | | | — | | | | — | | | | — | |
| | | | | | | |
JPMorgan Diversified Return U.S. Mid Cap Equity ETF | | | | | | | | | | | | | | | | | | | | | | | | | | | | |
Year Ended October 31, 2017 | | | 51.65 | | | | 0.89 | | | | 10.02 | | | | 10.91 | | | | (0.50 | ) | | | — | | | | (0.50 | ) |
May 11, 2016 (a) through October 31, 2016 | | | 50.00 | | | | 0.42 | | | | 1.23 | | | | 1.65 | | | | — | | | | — | | | | — | |
| | | | | | | |
JPMorgan Diversified Return U.S. Small Cap Equity ETF | | | | | | | | | | | | | | | | | | | | | | | | | | | | |
November 15, 2016 (a) through October 31, 2017 | | | 25.00 | | | | 0.28 | | | | 3.71 | | | | 3.99 | | | | (0.04 | ) | | | — | | | | (0.04 | ) |
| (a) | Commencement of operations. |
| (b) | Calculated based upon average shares outstanding. |
| (c) | Net investment income (loss) is affected by the timing of distributions from underlying funds. |
| (d) | Calculation of the net realized and unrealized gains (losses) per share do not correlate with the Fund’s net realized and unrealized gains (losses) presented on the Statement of Operations due to the timing of capital transactions in relation to the fluctuating market values of the Fund’s investments. |
| (e) | Not annualized for periods less than one year. |
| (f) | Includes adjustments in accordance with accounting principles generally accepted in the United States of America and as such, the net asset values for financial reporting purposes and the returns based upon those net asset values may differ from the net asset values and returns for shareholder transactions. |
| (g) | Market price total return is calculated assuming an initial investment made at the beginning of the period market price, reinvestment of all dividends and distributions at market price during the period, and sale at the market price on the last day of the period. The market price presented to calculate the market price total return is the mid-point of the bid/ask spread at the close of business on the NYSE Arca, Inc. |
| (h) | Annualized for periods less than one year, unless otherwise indicated. |
| (i) | Certain non-recurring expenses incurred by the Fund were not annualized for the periods indicated. |
| (j) | Does not include expenses of underlying funds. |
| (k) | Amount rounds to less than 1%. |
| (l) | As described in Note 8, amount reflects an out of period adjustment related to an expense reimbursement for acquired fund fees. Had the Fund not recorded the out of period adjustment, the net investment income (loss) per share would have been $0.33, the net investment income (loss) ratio would have been 1.18%, the net expense ratio would have been 0.07%, and the total return would have been 19.84%. |
SEE NOTES TO FINANCIAL STATEMENTS.
| | | | | | |
| | | |
| 104 | | | | JPMORGAN EXCHANGE-TRADED FUNDS | | OCTOBER 31, 2017 |
| | | | | | | | | | | | | | | | | | | | | | | | | | | | | | | | | | |
| | | Ratios/Supplemental data | |
| | | | | | | | | | | | | | | | Ratios to average net assets (h) | | | | |
Net asset
value,
end of
period | | |
Market
price,
end of
period | | | Total
return (e)(f) | | | Market
price
total
return (e)(g) | | | Net assets, end of
period | | | Net
expenses (j) | | | Net
investment
income
(loss) (c) | | | Expenses
without waivers
and reimbursements (j) | | | Portfolio
turnover
rate (e) | |
| | | | | | | | | | | | | | | | | | | | | | | | | | | | | | | | | | |
| $ | 30.17 | | | $ | 30.02 | | | | 20.04 | %(l) | | | 19.30 | % | | $ | 48,274,467 | | | | (0.08 | )%(l) | | | 1.33 | %(l) | | | 0.76 | % | | | 5 | % |
| | 26.32 | | | | 26.34 | | | | 5.28 | | | | 5.36 | | | | 26,316,114 | | | | 0.49 | (i) | | | (0.49 | ) | | | 1.14 | (i) | | | 4 | |
| | | | | | | | |
| | | | | | | | | | | | | | | | | | | | | | | | | | | | | | | | | | |
| | 59.18 | | | | 59.36 | | | | 20.35 | | | | 20.30 | | | | 1,159,887,006 | | | | 0.43 | | | | 2.63 | | | | 0.51 | | | | 29 | |
| | 50.00 | | | | 50.17 | | | | (0.15 | ) | | | 0.41 | | | | 470,042,716 | | | | 0.43 | | | | 2.56 | | | | 0.75 | | | | 27 | |
| | 51.17 | | | | 51.05 | | | | 2.65 | | | | 2.40 | | | | 92,113,607 | | | | 0.43 | (i) | | | 2.72 | | | | 1.33 | (i) | | | 20 | |
| | | | | | | | |
| | | | | | | | | | | | | | | | | | | | | | | | | | | | | | | | | | |
| | 68.52 | | | | 68.55 | | | | 20.99 | | | | 21.02 | | | | 356,298,771 | | | | 0.21 | | | | 1.83 | | | | 0.47 | | | | 27 | |
| | 57.06 | | | | 57.08 | | | | 5.92 | | | | 5.90 | | | | 125,538,258 | | | | 0.29 | | | | 1.95 | | | | 0.90 | | | | 22 | |
| | 54.13 | | | | 54.16 | | | | 8.26 | | | | 8.32 | | | | 10,826,623 | | | | 0.29 | (i) | | | 1.20 | | | | 5.75 | (i) | | | — | (k) |
| | | | | | | | |
| | | | | | | | | | | | | | | | | | | | | | | | | | | | | | | | | | |
| | 62.06 | | | | 62.08 | | | | 21.25 | | | | 21.31 | | | | 62,063,250 | | | | 0.26 | | | | 1.54 | | | | 0.62 | | | | 31 | |
| | 51.65 | | | | 51.64 | | | | 3.30 | | | | 3.28 | | | | 36,153,888 | | | | 0.34 | (i) | | | 1.69 | | | | 1.02 | (i) | | | 15 | |
| | | | | | | | |
| | | | | | | | | | | | | | | | | | | | | | | | | | | | | | | | | | |
| | 28.95 | | | | 29.00 | | | | 15.96 | | | | 16.16 | | | | 55,011,105 | | | | 0.31 | (i) | | | 1.08 | | | | 0.97 | (i) | | | 24 | |
SEE NOTES TO FINANCIAL STATEMENTS.
| | | | | | | | |
| | | |
| OCTOBER 31, 2017 | | JPMORGAN EXCHANGE-TRADED FUNDS | | | | | 105 | |
NOTES TO FINANCIAL STATEMENTS
AS OF OCTOBER 31, 2017
1. Organization
J.P. Morgan Exchange-Traded Fund Trust (the “Trust”) was formed on February 25, 2010, and is governed by a Declaration of Trust as amended and restated February 19, 2014, and is registered under the Investment Company Act of 1940, as amended (the “1940 Act”), as an open-ended management investment company.
The following are 9 separate funds of the Trust (collectively, the “Funds”) covered in this report:
| | |
| | | Diversified/Non-Diversified |
| JPMorgan Diversified Return Emerging Markets Equity ETF | | Diversified |
| JPMorgan Diversified Return Europe Currency Hedged ETF | | Diversified |
| JPMorgan Diversified Return Europe Equity ETF | | Diversified |
| JPMorgan Diversified Return Global Equity ETF | | Diversified |
| JPMorgan Diversified Return International Currency Hedged ETF | | Diversified |
| JPMorgan Diversified Return International Equity ETF | | Diversified |
| JPMorgan Diversified Return U.S. Equity ETF | | Diversified |
| JPMorgan Diversified Return U.S. Mid Cap Equity ETF | | Diversified |
| JPMorgan Diversified Return U.S. Small Cap Equity ETF | | Diversified |
The JPMorgan Diversified Return Emerging Markets Equity ETF (the “Emerging Markets Equity ETF”) commenced operations on January 7, 2015. The investment objective of the Fund is to seek investment results that closely correspond, before fees and expenses, to the performance of the FTSE Emerging Diversified Factor Index.
The JPMorgan Diversified Return Europe Currency Hedged ETF (the “Europe Currency Hedged ETF”) commenced operations on April 1, 2016. The investment objective of the Fund is to seek investment results that closely correspond, before fees and expenses, to the performance of the FTSE Developed Europe Diversified Factor 100% Hedged to USD Index.
The JPMorgan Diversified Return Europe Equity ETF (the “Europe Equity ETF”) commenced operations on December 18, 2015. The investment objective of the Fund is to seek investment results that closely correspond, before fees and expenses, to the performance of the FTSE Developed Europe Diversified Factor Index.
The JPMorgan Diversified Return Global Equity ETF (the “Global Equity ETF”) commenced operations on June 16, 2014. The investment objective of the Fund is to seek investment results that closely correspond, before fees and expenses, to the performance of the FTSE Developed Diversified Factor Index.
The JPMorgan Diversified Return International Currency Hedged ETF (the “International Currency Hedged ETF”) commenced operations on April 1, 2016. The investment objective of the Fund is to seek investment results that closely correspond, before fees and expenses, to the performance of the FTSE Developed ex North America Diversified Factor 100% Hedged to USD Index.
The JPMorgan Diversified Return International Equity ETF (the “International Equity ETF”) commenced operations on November 5, 2014. The investment objective of the Fund is to seek investment results that closely correspond, before fees and expenses, to the performance of the FTSE Developed ex North America Diversified Factor Index.
The JPMorgan Diversified Return U.S. Equity ETF (the “U.S. Equity ETF”) commenced operations on September 29, 2015. The investment objective of the Fund is to seek investment results that closely correspond, before fees and expenses, to the performance of the Russell 1000 Diversified Factor Index.
The JPMorgan Diversified Return U.S. Mid Cap Equity ETF (the “U.S. Mid Cap Equity ETF”) commenced operations on May 11, 2016. The investment objective of the Fund is to seek investment results that closely correspond, before fees and expenses, to the performance of the Russell Midcap Diversified Factor Index.
The JPMorgan Diversified Return U.S. Small Cap Equity ETF (the “U.S. Small Cap Equity ETF”) commenced operations on November 15, 2016. The investment objective of the Fund is to seek investment results that closely correspond, before fees and expenses, to the performance of the Russell 2000 Diversified Factor Index.
J.P. Morgan Investment Management Inc. (“JPMIM” or the “Adviser”), an indirect, wholly-owned subsidiary of JPMorgan Chase & Co. (“JPMorgan”), acts as the Adviser and Administrator (the “Administrator”) to the Funds.
Shares of each Fund are listed and traded on the NYSE Arca, Inc. Market prices for the Funds’ shares may be different from their net asset value (“NAV”). Effective October 1, 2017, JPMorgan Distribution Services, Inc. (the “Distributor” or “JPMDS”), an indirect, wholly-owned subsidiary of JPMorgan, serves as the Funds’ distributor. Prior to October 1, 2017, SEI Investments Distribution Co. (“SIDCO”) was the distributor of the Funds. The agreement with JPMDS is substantially similar to the agreement with SIDCO. The Funds issue and redeem their shares on a continuous basis, through the Distributor, at NAV in large blocks of shares, typically 100,000 shares for all funds, except for the Europe Currency Hedged ETF, the International Currency Hedged ETF and the U.S. Small Cap Equity ETF which trade in blocks of 50,000 shares, referred to as “Creation Units.” Creation Units are issued and redeemed principally in-kind for a basket of securities and a cash amount which may be substituted in Funds with sizeable
| | | | | | |
| | | |
| 106 | | | | JPMORGAN EXCHANGE-TRADED FUNDS | | OCTOBER 31, 2017 |
exposure to market or sponsor restricted securities. Shares are generally traded in the secondary market in amounts less than a Creation Unit at market prices that change throughout the day. Only individuals or institutions that have entered into an authorized participant agreement with the Distributor may do business directly with the Funds (each, an “Authorized Participant”).
2. Significant Accounting Policies
The following is a summary of significant accounting policies followed by the Funds in the preparation of their financial statements. The Funds are investment companies and, accordingly, follow the investment company accounting and reporting guidance of the Financial Accounting Standards Board Accounting Standards Codification Topic 946 — Investment Companies, which is part of the U.S. generally accepted accounting principles (“GAAP”). The preparation of financial statements in conformity with GAAP requires management to make estimates and assumptions that affect the reported amounts of assets and liabilities and the disclosure of contingent assets and liabilities at the date of the financial statements and the reported amounts of increases and decreases in net assets from operations during the reporting period. Actual results could differ from those estimates.
A. Valuation of Investments — The valuation of the investments is in accordance with GAAP and the Funds’ valuation policies set forth by and under the supervision and responsibility of the Board of Trustees (the “Board”), which established the following approach to valuation, as described more fully below: (i) investments for which market quotations are readily available shall be valued at such unadjusted quoted prices, and (ii) all other investments for which market quotations are not readily available shall be valued at their fair value as determined in good faith by the Board.
The Administrator has established the J.P. Morgan Asset Management Americas Valuation Committee (“AVC”) to assist the Board with the oversight and monitoring of the valuation of the Funds’ investments. The Administrator implements the valuation policies of the Funds’ investments, as directed by the Board. The AVC oversees and carries out the policies for the valuation of investments held in the Funds. This includes monitoring the appropriateness of fair values based on results of ongoing valuation oversight, including but not limited to consideration of macro or security specific events, market events and pricing vendor and broker due diligence. The Administrator is responsible for discussing and assessing the potential impacts to the fair values on an ongoing basis, and at least on a quarterly basis with the AVC and the Board.
Equities and other exchange-traded instruments are valued at the last sale price or official market closing price on the primary exchange on which the instrument is traded before the NAVs of the Funds are calculated on a valuation date. Certain foreign equity instruments, including investments with equity reference obligations, are valued by applying an international fair value factor provided by an approved pricing vendors or third party broker-dealers (collectively referred to as “Pricing Services”). The factors seek to adjust the local closing price for movements of local markets post-closing, but prior to the time the NAVs are calculated.
Investments in mutual funds (the “Underlying Funds”) are valued at each Underlying Fund’s NAV per share as of the report date. Forward foreign currency exchange contracts are valued utilizing market quotations from approved Pricing Services.
Futures are generally valued on the basis of available market quotations.
Valuations reflected in this report are as of the report date. As a result, changes in valuation due to market events and/or issuer related events after the report date and prior to issuance of the report are not reflected herein.
The various inputs that are used in determining the valuation of the Funds’ investments are summarized into the three broad levels listed below.
| • | | Level 1 — Unadjusted inputs using quoted prices in active markets for identical investments. |
| • | | Level 2 — Other significant observable inputs including, but not limited to, quoted prices for similar investments, inputs other than quoted prices that are observable for investments (such as interest rates, prepayment speeds, credit risk, etc.) or other market corroborated inputs. |
| • | | Level 3 — Significant inputs based on the best information available in the circumstances, to the extent observable inputs are not available (including the Funds’ assumptions in determining the fair value of investments). |
A financial instrument’s level within the fair value hierarchy is based on the lowest level of any input, both individually and in the aggregate, that is significant to the fair value measurement. The inputs or methodology used for valuing instruments are not necessarily an indication of the risk associated with investing in those instruments.
The following tables represent each valuation input as presented on the Schedules of Portfolio Investments:
Emerging Markets Equity ETF
| | | | | | | | | | | | | | | | |
| | | Level 1
Quoted prices | | | Level 2
Other significant
observable inputs | | | Level 3
Significant
unobservable inputs | | | Total | |
Investments in Securities | | | | | | | | | | | | | | | | |
Common Stocks | | | | | | | | | | | | | | | | |
Brazil | | $ | 13,821,019 | | | $ | — | | | $ | — | | | $ | 13,821,019 | |
Chile | | | 2,509,778 | | | | — | | | | — | | | | 2,509,778 | |
China | | | 4,120,914 | | | | 33,562,233 | | | | — | | | | 37,683,147 | |
Colombia | | | 543,007 | | | | — | | | | — | | | | 543,007 | |
| | | | | | | | |
| | | |
| OCTOBER 31, 2017 | | JPMORGAN EXCHANGE-TRADED FUNDS | | | | | 107 | |
NOTES TO FINANCIAL STATEMENTS
AS OF OCTOBER 31, 2017 (continued)
Emerging Markets Equity ETF (continued)
| | | | | | | | | | | | | | | | |
| | | Level 1
Quoted prices | | | Level 2
Other significant
observable inputs | | | Level 3
Significant
unobservable inputs | | | Total | |
Czech Republic | | $ | 182,518 | | | $ | 298,562 | | | $ | — | | | $ | 481,080 | |
Egypt | | | 198,895 | | | | 20,012 | | | | — | | | | 218,907 | |
Greece | | | 364,989 | | | | 276,052 | | | | — | | | | 641,041 | |
Hong Kong | | | — | | | | 1,229,112 | | | | — | | | | 1,229,112 | |
Hungary | | | — | | | | 906,467 | | | | — | | | | 906,467 | |
India | | | — | | | | 12,969,690 | | | | — | | | | 12,969,690 | |
Indonesia | | | 1,274,185 | | | | 8,075,196 | | | | — | | | | 9,349,381 | |
Malaysia | | | 1,249,541 | | | | 6,807,150 | | | | — | | | | 8,056,691 | |
Mexico | | | 6,853,142 | | | | — | | | | — | | | | 6,853,142 | |
Pakistan | | | 26,816 | | | | 31,407 | | | | — | | | | 58,223 | |
Peru | | | 131,005 | | | | — | | | | — | | | | 131,005 | |
Philippines | | | 1,308,141 | | | | 3,047,762 | | | | — | | | | 4,355,903 | |
Poland | | | 558,804 | | | | 2,171,172 | | | | — | | | | 2,729,976 | |
Russia | | | 5,522,206 | | | | 2,077,018 | | | | — | | | | 7,599,224 | |
South Africa | | | 2,199,643 | | | | 11,303,269 | | | | — | | | | 13,502,912 | |
Taiwan | | | — | | | | 26,912,443 | | | | — | | | | 26,912,443 | |
Thailand | | | 8,416,459 | | | | 1,131,713 | | | | — | | | | 9,548,172 | |
Turkey | | | — | | | | 2,610,861 | | | | — | | | | 2,610,861 | |
United Arab Emirates | | | 825,526 | | | | 1,814,516 | | | | — | | | | 2,640,042 | |
| | | | | | | | | | | | | | | | |
Total Common Stocks | | | 50,106,588 | | | | 115,244,635 | | | | — | | | | 165,351,223 | |
| | | | | | | | | | | | | | | | |
Rights | | | | | | | | | | | | | | | | |
Brazil | | | 4,114 | | | | — | | | | — | | | | 4,114 | |
China | | | — | | | | — | | | | — | (a) | | | — | |
Taiwan | | | — | | | | — | (a) | | | — | | | | — | |
| | | | | | | | | | | | | | | | |
Total Rights | | | 4,114 | | | | — | (a) | | | — | (a) | | | 4,114 | |
| | | | | | | | | | | | | | | | |
Total Investments in Securities | | $ | 50,110,702 | | | $ | 115,244,635 | | | $ | — | (a) | | $ | 165,355,337 | |
| | | | | | | | | | | | | | | | |
Europe Currency Hedged ETF
| | | | | | | | | | | | | | | | |
| | | Level 1
Quoted prices | | | Level 2
Other significant
observable inputs | | | Level 3
Significant
unobservable inputs | | | Total | |
Total Investments in Securities | | $ | 30,739,404 | | | $ | — | | | $ | — | | | $ | 30,739,404 | |
| | | | | | | | | | | | | | | | |
Appreciation in Other Financial Instruments | | | | | | | | | | | | | | | | |
Forward Foreign Currency Exchange Contracts | | $ | — | | | $ | 527,922 | | | $ | — | | | $ | 527,922 | |
| | | | | | | | | | | | | | | | |
Depreciation in Other Financial Instruments | | | | | | | | | | | | | | | | |
Forward Foreign Currency Exchange Contracts | | $ | — | | | $ | (11,646 | ) | | $ | — | | | $ | (11,646 | ) |
| | | | | | | | | | | | | | | | |
Europe Equity ETF
| | | | | | | | | | | | | | | | |
| | | Level 1
Quoted prices | | | Level 2
Other significant
observable inputs | | | Level 3
Significant
unobservable inputs | | | Total | |
Investments in Securities | | | | | | | | | | | | | | | | |
Common Stocks | | | | | | | | | | | | | | | | |
Austria | | $ | 100,531 | | | $ | 775,665 | | | $ | — | | | $ | 876,196 | |
Belgium | | | — | | | | 1,361,548 | | | | — | | | | 1,361,548 | |
Denmark | | | — | | | | 2,458,973 | | | | — | | | | 2,458,973 | |
Finland | | | 313,514 | | | | 3,445,883 | | | | — | | | | 3,759,397 | |
France | | | 320,179 | | | | 10,003,002 | | | | — | | | | 10,323,181 | |
Germany | | | 98,457 | | | | 11,226,844 | | | | — | | | | 11,325,301 | |
Ireland | | | 261,726 | | | | — | | | | — | | | | 261,726 | |
Italy | | | 747,847 | | | | 1,211,385 | | | | — | | | | 1,959,232 | |
Luxembourg | | | — | | | | 218,492 | | | | — | | | | 218,492 | |
| | | | | | |
| | | |
| 108 | | | | JPMORGAN EXCHANGE-TRADED FUNDS | | OCTOBER 31, 2017 |
Europe Equity ETF (continued)
| | | | | | | | | | | | | | | | |
| | | Level 1
Quoted prices | | | Level 2
Other significant
observable inputs | | | Level 3
Significant
unobservable inputs | | | Total | |
Netherlands | | $ | 284,568 | | | $ | 3,922,816 | | | $ | — | | | $ | 4,207,384 | |
Norway | | | 277,368 | | | | 1,944,136 | | | | — | | | | 2,221,504 | |
Portugal | | | — | | | | 900,023 | | | | — | | | | 900,023 | |
South Africa | | | — | | | | 288,208 | | | | — | | | | 288,208 | |
Spain | | | — | | | | 6,422,365 | | | | — | | | | 6,422,365 | |
Sweden | | | — | | | | 4,680,452 | | | | — | | | | 4,680,452 | |
Switzerland | | | 130,594 | | | | 9,062,362 | | | | — | | | | 9,192,956 | |
United Kingdom | | | 729,068 | | | | 17,623,443 | | | | — | | | | 18,352,511 | |
United States | | | — | | | | 196,664 | | | | — | | | | 196,664 | |
| | | | | | | | | | | | | | | | |
Total Common Stocks | | | 3,263,852 | | | | 75,742,261 | | | | — | | | | 79,006,113 | |
| | | | | | | | | | | | | | | | |
Right | | | | | | | | | | | | | | | | |
Spain | | | 382 | | | | — | | | | — | | | | 382 | |
| | | | | | | | | | | | | | | | |
Total Investments in Securities | | $ | 3,264,234 | | | $ | 75,742,261 | | | $ | — | | | $ | 79,006,495 | |
| | | | | | | | | | | | | | | | |
Global Equity ETF
| | | | | | | | | | | | | | | | |
| | | Level 1
Quoted prices | | | Level 2
Other significant
observable inputs | | | Level 3
Significant
unobservable inputs | | | Total | |
Investments in Securities | | | | | | | | | | | | | | | | |
Common Stocks | | | | | | | | | | | | | | | | |
Australia | | $ | — | | | $ | 7,179,876 | | | $ | — | | | $ | 7,179,876 | |
Austria | | | — | | | | 312,430 | | | | — | | | | 312,430 | |
Belgium | | | — | | | | 756,389 | | | | — | | | | 756,389 | |
Bermuda | | | 260,670 | | | | — | | | | — | | | | 260,670 | |
Canada | | | 3,714,669 | | | | — | | | | — | | | | 3,714,669 | |
Chile | | | — | | | | 7,338 | | | | — | | | | 7,338 | |
China | | | — | | | | 450,667 | | | | — | | | | 450,667 | |
Denmark | | | — | | | | 765,536 | | | | — | | | | 765,536 | |
Finland | | | — | | | | 973,227 | | | | — | | | | 973,227 | |
France | | | — | | | | 4,754,230 | | | | — | | | | 4,754,230 | |
Germany | | | — | | | | 3,406,716 | | | | — | | | | 3,406,716 | |
Hong Kong | | | — | | | | 4,201,508 | | | | — | | | | 4,201,508 | |
Ireland | | | 63,454 | | | | — | | | | — | | | | 63,454 | |
Israel | | | 312,638 | | | | — | | | | — | | | | 312,638 | |
Italy | | | 755,091 | | | | 61,136 | | | | — | | | | 816,227 | |
Japan | | | — | | | | 23,800,446 | | | | — | | | | 23,800,446 | |
Netherlands | | | — | | | | 1,403,712 | | | | — | | | | 1,403,712 | |
New Zealand | | | — | | | | 337,425 | | | | — | | | | 337,425 | |
Norway | | | 291,486 | | | | 673,045 | | | | — | | | | 964,531 | |
Portugal | | | — | | | | 413,397 | | | | — | | | | 413,397 | |
Singapore | | | — | | | | 2,070,164 | | | | — | | | | 2,070,164 | |
South Africa | | | — | | | | 171,394 | | | | — | | | | 171,394 | |
South Korea | | | 635,473 | | | | 9,924,376 | | | | — | | | | 10,559,849 | |
Spain | | | — | | | | 1,807,151 | | | | — | | | | 1,807,151 | |
Sweden | | | 241,604 | | | | 2,506,160 | | | | — | | | | 2,747,764 | |
Switzerland | | | 85,351 | | | | 1,725,997 | | | | — | | | | 1,811,348 | |
United Kingdom | | | 265,549 | | | | 2,241,024 | | | | — | | | | 2,506,573 | |
United States | | | 25,957,773 | | | | 72,653 | | | | — | | | | 26,030,426 | |
| | | | | | | | | | | | | | | | |
Total Common Stocks | | | 32,583,758 | | | | 70,015,997 | | | | — | | | | 102,599,755 | |
| | | | | | | | | | | | | | | | |
Rights | | | | | | | | | | | | | | | | |
South Korea | | | — | | | | 3,937 | | | | — | | | | 3,937 | |
| | | | | | | | | | | | | | | | |
Short-Term Investment | | | | | | | | | | | | | | | | |
Investment Company | | $ | 516,620 | | | $ | — | | | $ | — | | | $ | 516,620 | |
| | | | | | | | | | | | | | | | |
Total Investments in Securities | | $ | 33,100,378 | | | $ | 70,019,934 | | | $ | — | | | $ | 103,120,312 | |
| | | | | | | | | | | | | | | | |
| | | | | | | | |
| | | |
| OCTOBER 31, 2017 | | JPMORGAN EXCHANGE-TRADED FUNDS | | | | | 109 | |
NOTES TO FINANCIAL STATEMENTS
AS OF OCTOBER 31, 2017 (continued)
International Currency Hedged ETF
| | | | | | | | | | | | | | | | |
| | | Level 1
Quoted prices | | | Level 2
Other significant
observable inputs | | | Level 3
Significant
unobservable inputs | | | Total | |
Total Investments in Securities | | $ | 48,144,483 | | | $ | — | | | $ | — | | | $ | 48,144,483 | |
| | | | | | | | | | | | | | | | |
Appreciation in Other Financial Instruments | | | | | | | | | | | | | | | | |
Forward Foreign Currency Exchange Contracts | | $ | — | | | $ | 606,500 | | | $ | — | | | $ | 606,500 | |
| | | | | | | | | | | | | | | | |
Depreciation in Other Financial Instruments | | | | | | | | | | | | | | | | |
Forward Foreign Currency Exchange Contracts | | $ | — | | | $ | (145,507 | ) | | $ | — | | | $ | (145,507 | ) |
| | | | | | | | | | | | | | | | |
International Equity ETF
| | | | | | | | | | | | | | | | |
| | | Level 1
Quoted prices | | | Level 2
Other significant
observable inputs | | | Level 3
Significant
unobservable inputs | | | Total | |
Investments in Securities | | | | | | | | | | | | | | | | |
Common Stocks | | | | | | | | | | | | | | | | |
Australia | | $ | — | | | $ | 77,832,499 | | | $ | — | | | $ | 77,832,499 | |
Austria | | | — | | | | 8,586,597 | | | | — | | | | 8,586,597 | |
Belgium | | | — | | | | 11,560,002 | | | | — | | | | 11,560,002 | |
Chile | | | — | | | | 4,685,702 | | | | — | | | | 4,685,702 | |
China | | | — | | | | 7,177,370 | | | | — | | | | 7,177,370 | |
Denmark | | | — | | | | 13,666,390 | | | | — | | | | 13,666,390 | |
Finland | | | — | | | | 18,976,992 | | | | — | | | | 18,976,992 | |
France | | | 943,887 | | | | 56,812,850 | | | | — | | | | 57,756,737 | |
Germany | | | — | | | | 48,691,498 | | | | — | | | | 48,691,498 | |
Hong Kong | | | 552,778 | | | | 62,301,353 | | | | — | | | | 62,854,131 | |
Ireland | | | 708,535 | | | | — | | | | — | | | | 708,535 | |
Italy | | | 9,891,249 | | | | 4,377,047 | | | | — | | | | 14,268,296 | |
Japan | | | — | | | | 297,636,193 | | | | — | | | | 297,636,193 | |
Jordan | | | — | | | | 2,490,310 | | | | — | | | | 2,490,310 | |
Luxembourg | | | — | | | | 1,280,647 | | | | — | | | | 1,280,647 | |
Netherlands | | | — | | | | 21,730,254 | | | | — | | | | 21,730,254 | |
New Zealand | | | — | | | | 6,223,202 | | | | — | | | | 6,223,202 | |
Norway | | | 4,063,676 | | | | 10,316,785 | | | | — | | | | 14,380,461 | |
Portugal | | | — | | | | 7,785,651 | | | | — | | | | 7,785,651 | |
Singapore | | | — | | | | 30,074,397 | | | | — | | | | 30,074,397 | |
South Africa | | | 2,075,089 | | | | 4,462,160 | | | | — | | | | 6,537,249 | |
South Korea | | | 8,587,956 | | | | 120,316,313 | | | | — | | | | 128,904,269 | |
Spain | | | — | | | | 22,169,439 | | | | — | | | | 22,169,439 | |
Sweden | | | — | | | | 35,992,964 | | | | — | | | | 35,992,964 | |
Switzerland | | | — | | | | 26,742,127 | | | | — | | | | 26,742,127 | |
United Kingdom | | | 15,312,918 | | | | 178,404,583 | | | | — | | | | 193,717,501 | |
United States | | | 1,106,037 | | | | 10,670,770 | | | | — | | | | 11,776,807 | |
| | | | | | | | | | | | | | | | |
Total Common Stocks | | | 43,242,125 | | | | 1,090,964,095 | | | | — | | | | 1,134,206,220 | |
| | | | | | | | | | | | | | | | |
Right | | | | | | | | | | | | | | | | |
Spain | | | 14,691 | | | | — | | | | — | | | | 14,691 | |
Short-Term Investment | | | | | | | | | | | | | | | | |
Investment Company | | | 15,795,486 | | | | — | | | | — | | | | 15,795,486 | |
| | | | | | | | | | | | | | | | |
Total Investments in Securities | | $ | 59,052,302 | | | $ | 1,090,964,095 | | | $ | — | | | $ | 1,150,016,397 | |
| | | | | | | | | | | | | | | | |
Appreciation in Other Financial Instruments | | | | | | | | | | | | | | | | |
Futures | | $ | — | | | $ | 135,909 | | | $ | — | | | $ | 135,909 | |
| | | | | | | | | | | | | | | | |
| | | | | | |
| | | |
| 110 | | | | JPMORGAN EXCHANGE-TRADED FUNDS | | OCTOBER 31, 2017 |
U.S. Equity ETF
| | | | | | | | | | | | | | | | |
| | | Level 1
Quoted prices | | | Level 2
Other significant
observable inputs | | | Level 3
Significant
unobservable inputs | | | Total | |
Total Investments in Securities (b) | | $ | 353,801,949 | | | $ | — | | | $ | — | | | $ | 353,801,949 | |
| | | | | | | | | | | | | | | | |
Appreciation in Other Financial Instruments | | | | | | | | | | | | | | | | |
Futures (b) | | $ | 23,608 | | | $ | — | | | $ | — | | | $ | 23,608 | |
| | | | | | | | | | | | | | | | |
U.S. Mid Cap Equity ETF
| | | | | | | | | | | | | | | | |
| | | Level 1
Quoted prices | | | Level 2
Other significant
observable inputs | | | Level 3
Significant
unobservable inputs | | | Total | |
Total Investments in Securities (b) | | $ | 62,097,763 | | | $ | — | | | $ | — | | | $ | 62,097,763 | |
| | | | | | | | | | | | | | | | |
U.S. Small Cap Equity ETF
| | | | | | | | | | | | | | | | |
| | | Level 1
Quoted prices | | | Level 2
Other significant
observable inputs | | | Level 3
Significant
unobservable inputs | | | Total | |
Investments in Securities | | | | | | | | | | | | | | | | |
Common Stocks | | | | | | | | | | | | | | | | |
Aerospace & Defense | | $ | 619,012 | | | $ | — | | | $ | — | | | $ | 619,012 | |
Air Freight & Logistics | | | 130,847 | | | | — | | | | — | | | | 130,847 | |
Airlines | | | 113,469 | | | | — | | | | — | | | | 113,469 | |
Auto Components | | | 1,437,561 | | | | — | | | | — | | | | 1,437,561 | |
Automobiles | | | 233,413 | | | | — | | | | — | | | | 233,413 | |
Banks | | | 1,800,152 | | | | — | | | | — | | | | 1,800,152 | |
Beverages | | | 804,868 | | | | — | | | | — | | | | 804,868 | |
Biotechnology | | | 1,024,107 | | | | — | | | | — | | | | 1,024,107 | |
Building Products | | | 635,131 | | | | — | | | | — | | | | 635,131 | |
Capital Markets | | | 56,671 | | | | — | | | | — | | | | 56,671 | |
Chemicals | | | 2,162,948 | | | | — | | | | — | | | | 2,162,948 | |
Commercial Services & Supplies | | | 2,147,266 | | | | — | | | | — | | | | 2,147,266 | |
Communications Equipment | | | 821,137 | | | | — | | | | — | | | | 821,137 | |
Construction & Engineering | | | 355,501 | | | | — | | | | — | | | | 355,501 | |
Construction Materials | | | 44,183 | | | | — | | | | — | | | | 44,183 | |
Consumer Finance | | | 84,573 | | | | — | | | | — | | | | 84,573 | |
Containers & Packaging | | | 79,990 | | | | — | | | | — | | | | 79,990 | |
Distributors | | | 396,471 | | | | — | | | | — | | | | 396,471 | |
Diversified Consumer Services | | | 521,932 | | | | — | | | | — | | | | 521,932 | |
Diversified Telecommunication Services | | | 795,812 | | | | — | | | | — | | | | 795,812 | |
Electric Utilities | | | 2,241,834 | | | | — | | | | — | | | | 2,241,834 | |
Electrical Equipment | | | 207,144 | | | | — | | | | — | | | | 207,144 | |
Electronic Equipment, Instruments & Components | | | 1,276,832 | | | | — | | | | — | | | | 1,276,832 | |
Energy Equipment & Services | | | 388,321 | | | | — | | | | — | | | | 388,321 | |
Equity Real Estate Investment Trusts (REITs) | | | 1,151,702 | | | | — | | | | — | | | | 1,151,702 | |
Food & Staples Retailing | | | 360,917 | | | | — | | | | — | | | | 360,917 | |
Food Products | | | 2,275,116 | | | | — | | | | — | | | | 2,275,116 | |
Gas Utilities | | | 2,221,525 | | | | — | | | | — | | | | 2,221,525 | |
Health Care Equipment & Supplies | | | 2,892,043 | | | | — | | | | — | | | | 2,892,043 | |
Health Care Providers & Services | | | 1,049,471 | | | | — | | | | — | | | | 1,049,471 | |
Health Care Technology | | | 332,027 | | | | — | | | | — | | | | 332,027 | |
Hotels, Restaurants & Leisure | | | 1,817,628 | | | | — | | | | — | | | | 1,817,628 | |
Household Durables | | | 2,736,393 | | | | — | | | | 17,294 | | | | 2,753,687 | |
Household Products | | | 563,103 | | | | — | | | | — | | | | 563,103 | |
Independent Power and Renewable Electricity Producers | | | 382,752 | | | | — | | | | — | | | | 382,752 | |
Insurance | | | 672,044 | | | | — | | | | — | | | | 672,044 | |
| | | | | | | | |
| | | |
| OCTOBER 31, 2017 | | JPMORGAN EXCHANGE-TRADED FUNDS | | | | | 111 | |
NOTES TO FINANCIAL STATEMENTS
AS OF OCTOBER 31, 2017 (continued)
U.S. Small Cap Equity ETF (continued)
| | | | | | | | | | | | | | | | |
| | | Level 1
Quoted prices | | | Level 2
Other significant
observable inputs | | | Level 3
Significant
unobservable inputs | | | Total | |
Internet & Direct Marketing Retail | | $ | 420,003 | | | $ | — | | | $ | — | | | $ | 420,003 | |
Internet Software & Services | | | 752,012 | | | | — | | | | — | | | | 752,012 | |
IT Services | | | 1,153,502 | | | | — | | | | — | | | | 1,153,502 | |
Leisure Products | | | 334,251 | | | | — | | | | — | | | | 334,251 | |
Life Sciences Tools & Services | | | 247,875 | | | | — | | | | — | | | | 247,875 | |
Machinery | | | 1,704,905 | | | | — | | | | — | | | | 1,704,905 | |
Marine | | | 23,336 | | | | — | | | | — | | | | 23,336 | |
Media | | | 793,765 | | | | — | | | | — | | | | 793,765 | |
Metals & Mining | | | 873,388 | | | | — | | | | — | | | | 873,388 | |
Mortgage Real Estate Investment Trusts (REITs) | | | 259,455 | | | | — | | | | — | | | | 259,455 | |
Multiline Retail | | | 207,431 | | | | — | | | | — | | | | 207,431 | |
Multi-Utilities | | | 922,396 | | | | — | | | | — | | | | 922,396 | |
Oil, Gas & Consumable Fuels | | | 709,925 | | | | — | | | | — | | | | 709,925 | |
Paper & Forest Products | | | 497,837 | | | | — | | | | — | | | | 497,837 | |
Personal Products | | | 419,095 | | | | — | | | | — | | | | 419,095 | |
Pharmaceuticals | | | 478,521 | | | | — | | | | — | | | | 478,521 | |
Professional Services | | | 551,946 | | | | — | | | | — | | | | 551,946 | |
Real Estate Management & Development | | | 24,682 | | | | — | | | | — | | | | 24,682 | |
Road & Rail | | | 707,530 | | | | — | | | | — | | | | 707,530 | |
Semiconductors & Semiconductor Equipment | | | 1,642,149 | | | | — | | | | — | | | | 1,642,149 | |
Software | | | 1,713,659 | | | | — | | | | — | | | | 1,713,659 | |
Specialty Retail | | | 1,516,389 | | | | — | | | | — | | | | 1,516,389 | |
Technology Hardware, Storage & Peripherals | | | 86,603 | | | | — | | | | — | | | | 86,603 | |
Textiles, Apparel & Luxury Goods | | | 999,216 | | | | — | | | | — | | | | 999,216 | |
Thrifts & Mortgage Finance | | | 432,649 | | | | — | | | | — | | | | 432,649 | |
Tobacco | | | 524,747 | | | | — | | | | — | | | | 524,747 | |
Trading Companies & Distributors | | | 592,370 | | | | — | | | | — | | | | 592,370 | |
Water Utilities | | | 733,515 | | | | — | | | | — | | | | 733,515 | |
| | | | | | | | | | | | | | | | |
Total Common Stocks | | | 54,157,048 | | | | — | | | | 17,294 | | | | 54,174,342 | |
| | | | | | | | | | | | | | | | |
Rights | | | | | | | | | | | | | | | | |
Media | | | — | | | | — | | | | 75 | | | | 75 | |
Short-Term Investment | | | | | | | | | | | | | | | | |
Investment Company | | | 461,963 | | | | — | | | | — | | | | 461,963 | |
| | | | | | | | | | | | | | | | |
Total Investments in Securities | | $ | 54,619,011 | | | $ | — | | | $ | 17,369 | | | $ | 54,636,380 | |
| | | | | | | | | | | | | | | | |
Appreciation in Other Financial Instruments | | | | | | | | | | | | | | | | |
Futures | | $ | 11,914 | | | $ | — | | | $ | — | | | $ | 11,914 | |
| | | | | | | | | | | | | | | | |
| (b) | All portfolio holdings designated as level 1 are disclosed individually on the Schedule of Portfolio Investments (“SOI”). |
Transfers between fair value levels are valued utilizing values as of the beginning of the period.
Transfers from level 1 to level 2 in the amount of $930,017 and from level 2 to level 1 in the amount of $3,048,848 for Emerging Markets Equity ETF are due to the application and non-application of the fair value factors to certain securities during the year ended October 31, 2017.
Transfers from level 2 to level 1 in the amount of $2,094,520 for Europe Equity ETF are due to the non-application of the fair value factors to certain securities during the year ended October 31, 2017.
Transfers from level 2 to level 1 in the amount of $1,128,718 for Global Equity ETF are due to the non-application of the fair value factors to certain securities during the year ended October 31, 2017.
Transfers from level 2 to level 1 in the amount of $10,504,498 for International Equity ETF are due to the non-application of the fair value factors to certain securities during the year ended October 31, 2017.
There were no transfers among any levels during the year ended October 31, 2017 for Europe Currency Hedged ETF, International Currency Hedged ETF, U.S. Equity ETF, U.S. Mid Cap Equity ETF and U.S. Small Cap Equity ETF.
| | | | | | |
| | | |
| 112 | | | | JPMORGAN EXCHANGE-TRADED FUNDS | | OCTOBER 31, 2017 |
There were no significant transfers between Level 2 and Level 3 during the year ended October 31, 2017 for Emerging Markets Equity ETF.
B. Restricted Securities — Certain securities held by the Funds may be subject to legal or contractual restrictions on resale. Restricted securities generally are resold in transactions exempt from registration under the Securities act of 1933 (the “Securities Act”). Disposal of these securities may involve time-consuming negotiations and expense. Prompt sale at the current valuation may be difficult and could adversely affect the net asset value of the Funds. As of October 31, 2017, the Funds had no investments in restricted securities other than securities sold to the Fund under Rule 144A.
C. Derivatives — Certain Funds are party to various derivative contracts governed by International Swaps and Derivatives Association master agreements (“ISDA agreements”). Certain Funds’ ISDA agreements, which are separately negotiated with each dealer counterparty, may contain provisions allowing, absent other considerations, a counterparty to exercise rights, to the extent not otherwise waived, against the Funds in the event the Funds’ net assets decline over time by a pre-determined percentage or fall below a pre-determined floor. The ISDA agreements may also contain provisions allowing, absent other conditions, the Funds to exercise rights, to the extent not otherwise waived, against the counterparty (e.g., decline in a counterparty’s credit rating below a specified level). Such rights for both the counterparty and the Funds often include the ability to terminate (i.e., close out) open contracts at prices which may favor the counterparty, which could have an adverse effect on the Funds. The ISDA agreements give the Funds and counterparty the right, upon an event of default, to close out all transactions traded under such agreements and to net amounts owed or due across all transactions and offset such net payable or receivable with collateral posted to a segregated account by one party to the other.
(1). Forward Foreign Currency Exchange Contracts — The Emerging Markets Equity ETF, Europe Currency Hedged ETF, Europe Equity ETF, Global Equity ETF, International Currency Hedged ETF and International Equity ETF may be exposed to foreign currency risks associated with portfolio investments and therefore used forward foreign currency exchange contracts to hedge or manage these exposures. These Funds also bought forward foreign currency exchange contracts to gain exposure to currencies. Forward foreign currency exchange contracts represent obligations to purchase or sell foreign currency on a specified future date at a price fixed at the time the contracts are entered into. Non-deliverable forward foreign currency exchange contracts are settled with the counterparty in U.S. dollar without the delivery of foreign currency.
The values of the forward foreign currency exchange contracts are adjusted daily based on the applicable exchange rate of the underlying currency. Changes in the value of these contracts are recorded as unrealized appreciation or depreciation until the contract settlement date. When the forward foreign currency exchange contract is closed, the Fund records a realized gain or loss equal to the difference between the value at the time the contract was opened and the value at the time it was closed. The Fund also records a realized gain or loss when a forward foreign currency exchange contract offsets another forward foreign currency exchange contract with the same counterparty upon settlement.
These Funds’ forward foreign currency exchange contracts are subject to master netting arrangements (the right to close out all transactions with a counterparty and net amounts owed or due across transactions). The Funds may be required to post or receive collateral for non-deliverable forward foreign currency exchange contracts.
(2). Futures Contracts — The Emerging Markets Equity ETF, Europe Currency Hedged ETF, International Equity ETF, U.S. Equity ETF, U.S. Mid Cap Equity ETF and U.S. Small Cap Equity ETF used index futures to obtain long and short exposure to the underlying commodities markets. The purchase of futures contracts will tend to increase a Fund’s exposure to positive and negative price fluctuations in the underlying instrument. The sale of futures contracts will tend to offset both positive and negative market price changes. The Emerging Markets Equity ETF, Europe Currency Hedged ETF, International Equity ETF, U.S. Equity ETF, U.S. Mid Cap Equity ETF and U.S. Small Cap Equity ETF also used index or other financial futures contracts to manage and hedge interest rate risk associated with portfolio investments.
Futures contracts provide for the delayed delivery of the underlying instrument at a fixed price or are settled for a cash amount based on the change in the value of the underlying instrument at a specific date in the future. Upon entering into a futures contract, Funds are required to deposit with the broker, cash or securities in an amount equal to a certain percentage of the contract amount, which is referred to as the initial margin deposit. Subsequent payments, referred to as variation margin, are made or received by the Funds periodically and are based on changes in the market value of open futures contracts. Changes in the market value of open futures contracts are recorded as Change in net unrealized appreciation/depreciation in the Statements of Operations. Realized gains or losses, representing the difference between the value of the contract at the time it was opened and the value at the time it was closed, are reported in the Statements of Operations at the closing or expiration of the futures contract. Securities deposited as initial margin are designated in the Schedule of Portfolio Investments and cash deposited is recorded on the Statements of Assets and Liabilities. A receivable from and/or a payable to brokers for the daily variation margin is also recorded on the Statements of Assets and Liabilities.
The use of futures contracts exposes these Funds to interest rate risk. The Funds may be subject to the risk that the change in the value of the futures contract may not correlate perfectly with the underlying instrument. Use of long futures contracts subjects Funds to risk of loss in excess of the amounts shown on the Statements of Assets and Liabilities, up to the notional amount of the futures contracts. Use of short futures contracts subjects Funds to unlimited risk of loss. The Funds may enter into futures contracts only on exchanges or boards of trade. The exchange or board of trade acts as the counterparty to each futures transaction; therefore, the Funds’ credit risk is limited to failure of the exchange or board of trade. Under some circumstances, futures exchanges may establish daily limits on the amount that the price of a futures contract can vary from the previous day’s settlement price, which could effectively prevent liquidation of positions.
| | | | | | | | |
| | | |
| OCTOBER 31, 2017 | | JPMORGAN EXCHANGE-TRADED FUNDS | | | | | 113 | |
NOTES TO FINANCIAL STATEMENTS
AS OF OCTOBER 31, 2017 (continued)
These Funds’ futures contracts are not subject to master netting arrangements (the right to close out all transactions traded with a counterparty and net amounts owed or due across transactions).
(3). Summary of Derivatives Information
The following table presents the value of derivatives held as of October 31, 2017, by their primary underlying risk exposure and respective location on the Statements of Assets and Liabilities:
Europe Currency Hedged ETF
| | | | | | |
| Derivative Contracts | | Statements of Assets and Liabilities Location | | | |
| Gross Assets: | | | | Forward Foreign
Currency Exchange
Contracts | |
| Foreign exchange contracts | | Receivables | | $ | 527,922 | |
| | | | | | |
| | |
Gross Liabilities: | | | | | |
| Foreign exchange contracts | | Payables | | $ | (11,646 | ) |
| | | | | | |
The following table presents the Fund’s gross derivative assets and liabilities by counterparty net of amounts available for offset under netting arrangements and any related collateral received or posted by the Fund as of October 31, 2017.
| | | | | | | | | | | | | | | | |
| Counterparty | | Gross Amount of
Derivative Assets
Subject to Netting
Arrangements
Presented in the
Statements of Assets
and Liabilities (a) | | | Derivatives
Available
for offset | | | Collateral
Received | | | Net Amount Due
from Counterparty
(not less than zero) | |
Citibank, N.A. | | $ | 1,811 | | | $ | (1,811 | ) | | $ | — | | | $ | — | |
Goldman Sachs International | | | 118,373 | | | | (3,363 | ) | | | — | | | | 115,010 | |
National Australia Bank | | | 2,042 | | | | (2,042 | ) | | | — | | | | — | |
Royal Bank of Canada | | | 405,696 | | | | (988 | ) | | | — | | | | 404,708 | |
| | | | | | | | | | | | | | | | |
| | $ | 527,922 | | | $ | (8,204 | ) | | $ | — | | | $ | 519,718 | |
| | | | | | | | | | | | | | | | |
| | | | |
| Counterparty | | Gross Amount of
Derivative Assets
Subject to Netting
Arrangements
Presented in the
Statements of Assets
and Liabilities (a) | | | Derivatives
Available
for offset | | | Collateral
Posted | | | Net Amount Due
to Counterparty
(not less than zero) | |
Citibank, N.A. | | $ | 1,835 | | | $ | (1,811 | ) | | $ | — | | | $ | 24 | |
Goldman Sachs International | | | 3,363 | | | | (3,363 | ) | | | — | | | | — | |
National Australia Bank | | | 5,460 | | | | (2,042 | ) | | | — | | | | 3,418 | |
Royal Bank of Canada | | | 988 | | | | (988 | ) | | | — | | | | — | |
| | | | | | | | | | | | | | | | |
| | $ | 11,646 | | | $ | (8,204 | ) | | $ | — | | | $ | 3,442 | |
| | | | | | | | | | | | | | | | |
| (a) | For financial reporting purposes, the Fund does not offset derivative assets and derivative liabilities subject to master netting arrangements on the Statements of Assets and Liabilities. |
The following table presents the value of derivatives held as of October 31, 2017, by their primary underlying risk exposure and respective location on the Statements of Assets and Liabilities:
International Currency Hedged ETF
| | | | | | |
| Derivative Contracts | | Statements of Assets and Liabilities Location | | | |
| Gross Assets: | | | | Forward Foreign
Currency Exchange
Contracts | |
| Foreign exchange contracts | | Receivables | | $ | 606,500 | |
| | | | | | |
| | |
Gross Liabilities: | | | | | |
| Foreign exchange contracts | | Payables | | $ | (145,507 | ) |
| | | | | | |
| | | | | | |
| | | |
| 114 | | | | JPMORGAN EXCHANGE-TRADED FUNDS | | OCTOBER 31, 2017 |
The following table presents the Fund’s gross derivative assets and liabilities by counterparty net of amounts available for offset under netting arrangements and any related collateral received or posted by the Fund as of October 31, 2017.
| | | | | | | | | | | | | | | | |
| Counterparty | | Gross Amount of
Derivative Assets
Subject to Netting
Arrangements
Presented in the
Statements of Assets
and Liabilities (a) | | | Derivatives
Available
for offset | | | Collateral
Received | | | Net Amount Due
from Counterparty
(not less than zero) | |
Australia and New Zealand Banking Group Limited | | $ | 121,729 | | | $ | (1,239 | ) | | $ | — | | | $ | 120,490 | |
Citibank, N.A. | | | 1,347 | | | | (1,347 | ) | | | — | | | | — | |
Goldman Sachs International | | | 21,261 | | | | (21,261 | ) | | | — | | | | — | |
HSBC Bank, NA | | | 678 | | | | (604 | ) | | | — | | | | 74 | |
Merrill Lynch International | | | 5,565 | | | | (5,565 | ) | | | — | | | | — | |
Morgan Stanley | | | 535 | | | | (156 | ) | | | — | | | | 379 | |
National Australia Bank Ltd. | | | 19,769 | | | | (19,769 | ) | | | — | | | | — | |
Royal Bank of Canada | | | 434,817 | | | | (1,655 | ) | | | — | | | | 433,162 | |
State Street Corp. | | | 799 | | | | (799 | ) | | | — | | | | — | |
| | | | | | | | | | | | | | | | |
| | $ | 606,500 | | | $ | (52,395 | ) | | $ | — | | | $ | 554,105 | |
| | | | | | | | | | | | | | | | |
| | | | |
| Counterparty | | Gross Amount of
Derivative Assets
Subject to Netting
Arrangements
Presented in the
Statements of Assets
and Liabilities (a) | | | Derivatives
Available
for offset | | | Collateral
Posted | | | Net Amount Due
to Counterparty
(not less than zero) | |
Australia and New Zealand Banking Group Limited | | $ | 1,239 | | | $ | (1,239 | ) | | $ | — | | | $ | — | |
Citibank, N.A. | | | 1,763 | | | | (1,347 | ) | | | | | | | 416 | |
Goldman Sachs International | | | 104,617 | | | | (21,261 | ) | | | — | | | | 83,356 | |
HSBC Bank, NA | | | 604 | | | | (604 | ) | | | — | | | | — | |
Merrill Lynch International | | | 13,217 | | | | (5,565 | ) | | | — | | | | 7,652 | |
Morgan Stanley | | | 156 | | | | (156 | ) | | | — | | | | — | |
National Australia Bank Ltd. | | | 21,356 | | | | (19,769 | ) | | | | | | | 1,587 | |
Royal Bank of Canada | | | 1,655 | | | | (1,655 | ) | | | — | | | | — | |
State Street Corp. | | | 900 | | | | (799 | ) | | | — | | | | 101 | |
| | | | | | | | | | | | | | | | |
| | $ | 145,507 | | | $ | (52,395 | ) | | $ | — | | | $ | 93,112 | |
| | | | | | | | | | | | | | | | |
| (a) | For financial reporting purposes, the Fund does not offset derivative assets and derivative liabilities subject to master netting arrangements on the Statements of Assets and Liabilities. |
The following table presents the value of derivatives held as of October 31, 2017, by their primary underlying risk exposure and respective location on the Statements of Assets and Liabilities:
International Equity ETF
| | | | |
| Derivative Contracts | | Statements of Assets and Liabilities Location | | |
| Gross Assets: | | | | Futures Contracts (a) |
| Equity contracts | | Receivables, Net Assets — Unrealized Appreciation | | $135,909 |
| | | | |
| (a) | This amount represents the cumulative appreciation (depreciation) of futures contracts as reported on the SOI. The Statements of Assets and Liabilities only reflect the current day variation margin receivable/payable from/to brokers. |
| | | | | | | | |
| | | |
| OCTOBER 31, 2017 | | JPMORGAN EXCHANGE-TRADED FUNDS | | | | | 115 | |
NOTES TO FINANCIAL STATEMENTS
AS OF OCTOBER 31, 2017 (continued)
The following table presents the value of derivatives held as of October 31, 2017, by their primary underlying risk exposure and respective location on the Statements of Assets and Liabilities:
U.S. Equity ETF
| | | | |
| Derivative Contracts | | Statements of Assets and Liabilities Location | | |
| Gross Assets: | | | | Futures Contracts (a) |
| Equity contracts | | Receivables, Net Assets — Unrealized Appreciation | | $23,608 |
| | | | |
| (a) | This amount represents the cumulative appreciation (depreciation) of futures contracts as reported on the SOI. The Statements of Assets and Liabilities only reflect the current day variation margin receivable/payable from/to brokers. |
The following table presents the value of derivatives held as of October 31, 2017, by their primary underlying risk exposure and respective location on the Statements of Assets and Liabilities:
U.S. Small Cap Equity ETF
| | | | |
| Derivative Contracts | | Statements of Assets and Liabilities Location | | |
| Gross Assets: | | | | Futures Contracts (a) |
| Equity contracts | | Receivables, Net Assets — Unrealized Appreciation | | $11,914 |
| | | | |
| (a) | This amount represents the cumulative appreciation (depreciation) of futures contracts as reported on the SOI. The Statements of Assets and Liabilities only reflect the current day variation margin receivable/payable from/to brokers. |
The following tables present the effect of derivatives on the Statements of Operations for the period ended October 31, 2017, by primary underlying risk exposure:
Emerging Markets Equity ETF
| | | | | | | | | | | | | | |
| Amount of Realized Gain (Loss) on Derivatives Recognized on the Statements of Operations | |
| Derivative Contracts | | | | Futures Contracts | | | Forward Foreign
Currency Exchange
Contracts | | | Total | |
| Futures contracts | | | | $ | 71,555 | | | $ | — | | | $ | 71,555 | |
| Foreign exchange contracts | | | | | — | | | | 51,437 | | | | 51,437 | |
| | | | | | | | | | | | | | |
| | | | $ | 71,555 | | | $ | 51,437 | | | $ | 122,992 | |
| | | | | | | | | | | | | | |
Europe Currency Hedged ETF
| | | | | | | | | | | | | | |
| Amount of Realized Gain (Loss) on Derivatives Recognized on the Statements of Operations | |
| Derivative Contracts | | | | Futures Contracts | | | Forward Foreign
Currency Exchange
Contracts | | | Total | |
| Futures contracts | | | | $ | 5,999 | | | $ | — | | | $ | 5,999 | |
| Foreign exchange contracts | | | | | — | | | | (705,378 | ) | | | (705,378 | ) |
| | | | | | | | | | | | | | |
| | | | $ | 5,999 | | | $ | (705,378 | ) | | $ | (699,379 | ) |
| | | | | | | | | | | | | | |
|
| Amount of Change in Unrealized Appreciation (Depreciation) on Derivatives Recognized on the Statements of Operations | |
| Derivative Contracts | | | | | Forward Foreign
Currency Exchange
Contracts | |
| Foreign exchange contracts | | | | | | $(421,384) | |
| | | | | | | |
| | | | | | |
| | | |
| 116 | | | | JPMORGAN EXCHANGE-TRADED FUNDS | | OCTOBER 31, 2017 |
Europe Equity ETF
| | | | |
| Amount of Realized Gain (Loss) on Derivatives Recognized on the Statements of Operations |
| Derivative Contracts | | | | Forward Foreign
Currency Exchange
Contracts |
| Foreign exchange contracts | | | | $3,080 |
| | | | |
Global Equity ETF
| | | | |
| Amount of Realized Gain (Loss) on Derivatives Recognized on the Statements of Operations |
| Derivative Contracts | | | | Forward Foreign
Currency Exchange
Contracts |
| Foreign exchange contracts | | | | $(1,686) |
| | | | |
International Currency Hedged ETF
| | | | |
| Amount of Realized Gain (Loss) on Derivatives Recognized on the Statements of Operations |
| Derivative Contracts | | | | Forward Foreign
Currency Exchange
Contracts |
| Foreign exchange contracts | | | | $(179,919) |
| | | | |
|
| Amount of Change in Unrealized Appreciation (Depreciation) on Derivatives Recognized on the Statements of Operations |
| Derivative Contracts | | | | Forward Foreign
Currency Exchange
Contracts |
| Foreign exchange contracts | | | | $(410,982) |
| | | | |
International Equity ETF
| | | | | | | | | | | | | | |
| Amount of Realized Gain (Loss) on Derivatives Recognized on the Statements of Operations | |
| Derivative Contracts | | | | Futures Contracts | | | Forward Foreign
Currency Exchange
Contracts | | | Total | |
| Futures contracts | | | | $ | (42,116 | ) | | $ | — | | | $ | (42,116 | ) |
| Foreign exchange contracts | | | | | — | | | | 41,751 | | | | 41,751 | |
| | | | | | | | | | | | | | |
| | | | $ | (42,116 | ) | | $ | 41,751 | | | $ | (365 | ) |
| | | | | | | | | | | | | | |
|
| Amount of Change in Unrealized Appreciation (Depreciation) on Derivatives Recognized on the Statements of Operations | |
| Derivative Contracts | | | | | Futures Contracts | |
| Futures contracts | | | | | | $135,909 | |
| | | | | | | |
U.S. Equity ETF
| | | | |
| | | Amount of Realized Gain (Loss) on Derivatives Recognized on the Statements of Operations | | |
| Derivative Contracts | | | | Futures Contracts |
| Futures contracts | | | | $(21,024) |
| | | | |
|
| Amount of Change in Unrealized Appreciation (Depreciation) on Derivatives Recognized on the Statements of Operations |
| Derivative Contracts | | | | Futures Contracts |
| Futures contracts | | | | $23,608 |
| | | | |
U.S. Mid Cap Equity ETF
| | | | |
| | | Amount of Realized Gain (Loss) on Derivatives Recognized on the Statements of Operations | | |
| Derivative Contracts | | | | Futures Contracts |
| Futures contracts | | | | $2,302 |
| | | | |
| | | | | | | | |
| | | |
| OCTOBER 31, 2017 | | JPMORGAN EXCHANGE-TRADED FUNDS | | | | | 117 | |
NOTES TO FINANCIAL STATEMENTS
AS OF OCTOBER 31, 2017 (continued)
U.S. Small Cap Equity ETF
| | | | |
| | | Amount of Realized Gain (Loss) on Derivatives Recognized on the Statements of Operations | | |
| Derivative Contracts | | | | Futures Contracts |
| Futures contracts | | | | $(10,577) |
| | | | |
|
| Amount of Change in Unrealized Appreciation (Depreciation) on Derivatives Recognized on the Statements of Operations |
| Derivative Contracts | | | | Futures Contracts |
| Futures contracts | | | | $11,914 |
| | | | |
Derivatives Volume
The table below discloses the volume of the Fund’s forward foreign currency contracts and futures contracts activity for the period ended October 31, 2017. Please refer to the tables in the Summary of Derivatives Information for derivative-related gains and losses associated with volume activity.
| | | | | | | | | | | | | | | | | | | | | | | | | | | | | | | | |
| | | Emerging
Markets
Equity ETF | | | Europe
Currency
Hedged ETF | | | Global
Equity ETF | | | International
Currency
Hedged ETF | | | International
Equity ETF | | | U.S.
Equity ETF | | | U.S.
Mid Cap
Equity ETF | | | U.S.
Small Cap
Equity ETF | |
Forward Foreign Currency Exchange Contracts: | | | | | | | | | | | | | | | | | | | | | |
Average Settlement Value Purchased | | $ | — | | | $ | 11,424,546 | | | $ | 132,392 | | | $ | 14,071,065 | | | $ | — | | | $ | — | | | $ | — | | | $ | — | |
Average Settlement Value Sold | | | — | | | | 38,481,500 | | | | 162,876 | | | | 51,920,335 | | | | — | | | | — | | | | — | | | | — | |
Ending Settlement Value Purchased | | | — | | | | 29,235,346 | | | | — | | | | 46,200,592 | | | | — | | | | — | | | | — | | | | — | |
Ending Settlement Value Sold | | | — | | | | 60,151,844 | | | | — | | | | 93,395,111 | | | | — | | | | — | | | | — | | | | — | |
Futures Contracts: | | | | | | | | | | | | | | | | | | | | | | | | | | | | | | | | |
Average Notional Balance Long | | | 1,153,110 | (a) | | | 302,635 | | | | — | | | | — | | | | 1,709,695 | | | | 399,557 | | | | 143,495 | | | | 79,902 | |
Average Notional Balance Short | | | — | | | | — | | | | — | | | | — | | | | — | | | | — | | | | — | | | | — | |
Ending Notional Balance Long | | | — | | | | — | | | | — | | | | — | | | | 16,206,679 | | | | 2,958,605 | | | | — | | | | 601,120 | |
Ending Notional Balance Short | | | — | | | | — | | | | — | | | | — | | | | — | | | | — | | | | — | | | | — | |
| (a) | For the period from December 1, 2016 to December 31, 2016 |
The Funds’ derivatives contracts held at October 31, 2017 are not accounted for as hedging instruments under GAAP.
D. Foreign Currency Translation — The books and records of the Funds are maintained in U.S. dollars. Foreign currency amounts are translated into U.S. dollars at the prevailing exchange rates of such currencies against the U.S. dollar. The market value of investment securities and other assets and liabilities are translated at the exchange rate as of the valuation date. Purchases and sales of investment securities, income and expenses are translated at the exchange rate prevailing on the respective dates of such transactions.
The Funds do not isolate the effect of changes in the foreign exchange rates from changes in the market prices of securities held. Accordingly, such changes are included within Change in net unrealized appreciation/depreciation on investments on the Statements of Operations.
Reported realized foreign currency gains and losses arise from the disposition of foreign currency, currency gains or losses realized between the trade and settlement dates on securities transactions, and the difference between the amounts of dividends, interest and withholding taxes recorded on the Funds’ books on the transaction date and the U.S. dollar equivalent of the amounts actually received or paid. The reported realized foreign currency gains and losses are included in Net realized gain (loss) on foreign currency transactions on the Statements of Operations. Unrealized foreign currency gains and losses arise from changes (due to changes in exchange rates) in the value of foreign currency and other assets and liabilities denominated in foreign currencies, which are held at year end and are included in Change in net unrealized appreciation/depreciation on foreign currency translations on the Statements of Operations.
E. Investment Transactions with Affiliates — Emerging Markets Equity ETF, Europe Currency Hedged ETF, Global Equity ETF, International Currency Hedged ETF, International Equity ETF, U.S. Equity ETF, U.S. Mid Cap Equity ETF, and U.S. Small Cap Equity ETF invest in Underlying Funds and/or other ETFs advised by the Adviser or its affiliates.
| | | | | | |
| | | |
| 118 | | | | JPMORGAN EXCHANGE-TRADED FUNDS | | OCTOBER 31, 2017 |
An issuer which is under common control with a Fund may be considered an affiliate. For the purposes of the financial statements, the Funds assume the following to be affiliated issuers. Included in the Realized Gain (Loss) amounts in the table below are distributions of realized capital gains, if any, received from the Underlying Funds and other ETFs advised by the Adviser or its affiliates:
| | | | | | | | | | | | | | | | | | | | | | | | | | | | | | | | |
| | | | | | For the period ended October 31, 2017 | | | | | | | | | | |
| Affiliate | | Value at
Beginning of
Period | | | Purchase Cost | | | Sales
Proceeds | | | Realized
Gain(Loss) | | | Change in
Unrealized
Gain(Loss) | | | Shares at
October 31,
2017 | | | Value at
October 31,
2017 | | | Dividend
Income | |
Emerging Markets Equity ETF | | | | | | | | | | | | | | | | | | | | | | | | | | | | | | | | |
JPMorgan U.S. Government Money Market Fund, Institutional Class Shares | | $ | — | | | $ | 8,685,161 | | | $ | 8,685,161 | | | $ | — | | | $ | — | | | | — | | | $ | — | | | $ | 2,356 | |
| | | | | | | | |
Europe Currency Hedged ETF | | | | | | | | | | | | | | | | | | | | | | | | | | | | | | | | |
JPMorgan Diversified Return Europe Equity ETF | | | 26,524,064 | | | | 4,423,126 | | | | 5,991,521 | | | | (79,372 | ) | | | 5,863,107 | | | | 499,909 | | | | 30,739,404 | | | | 604,070 | |
| | | | | | | | |
Global Equity ETF | | | | | | | | | | | | | | | | | | | | | | | | | | | | | | | | |
JPMorgan U.S. Government Money Market Fund, Institutional Class Shares | | | — | | | | 516,620 | | | | — | | | | — | | | | — | | | | 516,620 | | | | 516,620 | | | | 520 | |
| | | | | | | | |
International Currency Hedged ETF | | | | | | | | | | | | | | | | | | | | | | | | | | | | | | | | |
JPMorgan Diversified Return International Equity ETF | | | 26,351,076 | | | | 18,522,183 | | | | 3,764,823 | | | | 62,314 | | | | 6,973,733 | | | | 811,196 | | | | 48,144,483 | | | | 486,815 | |
| | | | | | | | |
International Equity ETF | | | | | | | | | | | | | | | | | | | | | | | | | | | | | | | | |
JPMorgan U.S. Government Money Market Fund, Institutional Class Shares | | | 1,161,468 | | | | 29,661,712 | | | | 15,027,694 | | | | — | | | | — | | | | 15,795,486 | | | | 15,795,486 | | | | 19,760 | |
| | | | | | | | |
U.S. Equity ETF | | | | | | | | | | | | | | | | | | | | | | | | | | | | | | | | |
JPMorgan U.S. Government Money Market Fund, Institutional Class Shares | | | 1,660,652 | | | | 12,050,758 | | | | 12,167,449 | | | | — | | | | — | | | | 1,543,961 | | | | 1,543,961 | | | | 7,893 | |
| | | | | | | | |
U.S. Mid Cap Equity ETF | | | | | | | | | | | | | | | | | | | | | | | | | | | | | | | | |
JPMorgan U.S. Government Money Market Fund, Institutional Class Shares | | | 621,429 | | | | 5,086,855 | | | | 5,515,488 | | | | — | | | | — | | | | 192,796 | | | | 192,796 | | | | 3,154 | |
| | | | | | | | |
U.S. Small Cap Equity ETF (a) | | | | | | | | | | | | | | | | | | | | | | | | | | | | | | | | |
JPMorgan U.S. Government Money Market Fund, Institutional Class Shares | | | — | | | | 3,428,568 | | | | 2,966,605 | | | | — | | | | — | | | | 461,963 | | | | 461,963 | | | | 1,401 | |
| (a) | Commencement of operations was November 15, 2016. |
F. Offering and Organizational Costs — Total offering costs incurred in connection with the offering of shares of each Fund are amortized on a straight line basis over 12 months from the date the Fund commenced operations. Costs paid in connection with the organization of the Trust, if any, were recorded as an expense at the time the Fund commenced operations. Approximate total offering costs incurred by the Funds were as follows:
| | | | |
Europe Currency Hedged ETF | | $ | 40,806 | |
Europe Equity ETF | | | 5,373 | |
International Currency Hedged ETF | | | 81,862 | |
U.S. Mid Cap Equity ETF | | | 16,448 | |
U.S. Small Cap Equity ETF | | | 11,740 | |
G. Security Transactions and Investment Income — Investment transactions are accounted for on the trade date (the date the order to buy or sell is executed). Securities gains and losses are calculated on a specifically identified cost basis. Interest income is determined on the basis of coupon interest accrued using the effective interest method which adjusts for amortization of premiums and accretion of discounts. Dividend income net of foreign taxes withheld, if any, is recorded on the ex-dividend date or when a fund first learns of the dividend.
| | | | | | | | |
| | | |
| OCTOBER 31, 2017 | | JPMORGAN EXCHANGE-TRADED FUNDS | | | | | 119 | |
NOTES TO FINANCIAL STATEMENTS
AS OF OCTOBER 31, 2017 (continued)
To the extent such information is publicly available, the Funds record distributions received in excess of income earned from underlying investments as a reduction of cost of investments and/or realized gain. Such amounts are based on estimates if actual amounts are not available and actual amounts of income, realized gain and return of capital may differ from the estimated amounts. The Funds adjust the estimated amounts of the components of distributions (and consequently their net investment income) as necessary once the issuers provide information about the actual composition of the distributions.
H. Allocation of Expenses — Expenses directly attributable to a fund are charged directly to that fund, while the expenses attributable to more than one fund of the Trust are allocated among the respective funds.
I. Federal Income Taxes — Each Fund is treated as a separate taxable entity for Federal income tax purposes. Each Fund’s policy is to comply with the provisions of the Internal Revenue Code of 1986, as amended (the “Code”), applicable to regulated investment companies and to distribute to shareholders all of its distributable net investment income and net realized gain on investments. Accordingly, no provision for Federal income tax is necessary. Management has reviewed the Funds’ tax positions for all open tax years and has determined that as of October 31, 2017, no liability for income tax is required in the Funds’ financial statements for net unrecognized tax benefits. However, management’s conclusions may be subject to future review based on changes in, or the interpretation of, the accounting standards or tax laws and regulations. Each of the Funds’ Federal tax returns for the prior three fiscal years, or since inception if shorter, remains subject to examination by the Internal Revenue Service.
J. Foreign Taxes — The Funds may be subject to foreign taxes on income, gains on investments or currency purchases/repatriation, a portion of which may be recoverable. The Funds will accrue such taxes and recoveries as applicable, based upon their current interpretation of tax rules and regulations that exist in the markets in which they invest.
Certain Funds are subject to a tax imposed on short-term capital gains on securities of issuers domiciled in India. The Funds record an estimated deferred tax liability for these securities that have been held for less than one year at the end of the reporting period, assuming those positions were disposed of at the end of the period. This amount, if any, is reported as Deferred India capital gains tax in the accompanying Statements of Assets and Liabilities. Short-term realized capital losses on the sale of securities of issuers domiciled in India can be carried forward for eight years to offset potential future short-term realized capital gains.
K. Distributions to Shareholders — Distributions from net investment income, if any, are generally declared and paid annually. Net realized capital gains, if any, are distributed by each Fund at least annually. The amount of distributions from net investment income and net realized capital gains is determined in accordance with Federal income tax regulations, which may differ from GAAP. To the extent these “book/tax” differences are permanent in nature (i.e., that they result from other than timing of recognition — “temporary differences”), such amounts are reclassified within the capital accounts based on their Federal tax-basis treatment.
The following amounts were reclassified within the capital accounts:
| | | | | | | | | | | | |
| | | Paid-in-Capital | | | Accumulated
Undistributed
Distributions in
Excess of)
Net Investment
Income | | | Accumulated
Net Realized
Gains (Losses) | |
Emerging Markets Equity ETF | | $ | (1 | ) | | $ | (15,667 | ) | | $ | 15,668 | |
Europe Currency Hedged ETF | | | (1,340 | ) | | | (15,633 | ) | | | 16,973 | |
Europe Equity ETF | | | (1 | ) | | | 16,515 | | | | (16,514 | ) |
Global Equity ETF | | | 1,965,574 | | | | 141 | | | | (1,965,715 | ) |
International Currency Hedged ETF | | | (2,053 | ) | | | (19,942 | ) | | | 21,995 | |
International Equity ETF | | | 4,057,804 | | | | 290,679 | | | | (4,348,483 | ) |
U.S. Equity ETF | | | 10,807,473 | | | | (71,415 | ) | | | (10,736,058 | ) |
U.S. Mid Cap Equity ETF | | | 3,533,085 | | | | 388 | | | | (3,533,473 | ) |
The reclassifications for the Funds relate primarily to foreign currency gains or losses, investments in passive foreign investment companies (“PFICs”), non-taxable dividends and redemptions in-kind.
3. Fees and Other Transactions with Affiliates
A. Investment Advisory Fee — Pursuant to the Investment Advisory Agreement, the Adviser supervises the investments of each Fund and is paid a fee. The fee is accrued daily and paid monthly based on each Fund’s respective average daily net assets. The annual rate for each Fund is as follows:
| | | | |
Emerging Markets Equity ETF | | | 0.44 | % |
Europe Currency Hedged ETF | | | 0.33 | % |
Europe Equity ETF | | | 0.30 | % |
Global Equity ETF | | | 0.24 | % |
International Currency Hedged ETF | | | 0.27 | % |
International Equity ETF | | | 0.24 | % |
U.S. Equity ETF | | | 0.23 | % |
U.S. Mid Cap Equity ETF | | | 0.24 | % |
U.S. Small Cap Equity ETF | | | 0.29 | % |
| | | | | | |
| | | |
| 120 | | | | JPMORGAN EXCHANGE-TRADED FUNDS | | OCTOBER 31, 2017 |
The Adviser waived Investment Advisory fees and/or reimbursed expenses as outlined in Note 3.D.
B. Administration Fee — Pursuant to an Administration Agreement, the Administrator provides certain administration services to the Funds. In consideration of these services, the Administrator receives a fee accrued daily and paid monthly at an annual rate of 0.085% of the average daily net assets of each Fund in the Trust covered by the Administration Agreement.
The Administrator waived administration fees as outlined in Note 3.D.
Effective October 1, 2017 JPMorgan Chase Bank, N.A. (“JPMCB”), a wholly-owned subsidiary of JPMorgan, serves as the Fund’s sub-administrator (the “Sub-administrator”). For its services as Sub-administrator, JPMCB receives a portion of the fees payable to the Administrator.
C. Custodian and Transfer Agent Fees — JPMCB provides portfolio custody and transfer agency services. The amounts paid directly to JPMCB by the Funds for custody services are included in the Custodian and Transfer Agent fees on the Statements of Operations. Payments to the custodian may be reduced by credits earned by each Fund, based on uninvested cash balances held by the custodian. Such earnings credits, if any, are presented separately on the Statements of Operations. With respect to the transfer agency services provided by JPMCB for each creation or redemption transaction, the Authorized Participant will generally be responsible for such associated expenses; during the period, the Funds paid no transfer agency fees to JPMCB.
Additionally, Authorized Participants generally pay transaction fees associated with the creation and redemption of Fund shares. These fees are used to offset certain custodian charges incurred by the Funds for these transactions.
For the period ended October 31, 2017, the amount of transaction fees paid by the Authorized Participants that were used to reimburse custodian fees were as follows:
| | | | |
Emerging Markets Equity ETF | | $ | 132,300 | |
Europe Equity ETF | | | 5,700 | |
Global Equity ETF | | | 30,800 | |
International Equity ETF | | | 201,600 | |
U.S. Equity ETF | | | 40,600 | |
U.S. Mid Cap Equity ETF | | | 10,500 | |
U.S. Small Cap Equity ETF | | | 27,300 | |
Such amounts are included in expense reimbursements from non-affiliates in the Statements of Operations.
Restricted cash on the Statements of Assets and Liabilities is cash received from Authorized Participants for the reimbursement of creation and/or redemption of Fund shares.
Interest income earned on cash balances at the custodian, if any, is included in Interest income from affiliates on the Statements of Operations.
Interest expense paid to the custodian related to overdrafts, if any, is included in Interest expense to affiliates on the Statements of Operations.
D. Accounting Fees — Beginning on October 1, 2017, JPMCB began to also provide accounting services to the Funds. Prior to October 1, 2017 a non-affiliated entity provided accounting services to the Funds. The following are the amounts incurred by the Funds during the period October 1, 2017 through October 31, 2017 that are payable directly to JPMCB by the Funds for accounting fees which are included in accounting fees on the Statements of Operations:
| | | | |
Emerging Markets Equity ETF | | $ | 7,054 | |
Europe Equity ETF | | | 4,101 | |
Global Equity ETF | | | 4,434 | |
International Currency Hedged ETF | | | 102 | |
International Equity ETF | | | 9,281 | |
U.S. Equity ETF | | | 1,830 | |
U.S. Mid Cap Equity ETF | | | 1,724 | |
U.S. Small Cap Equity ETF | | | 1,204 | |
E. Waivers and Reimbursements — The Adviser has contractually agreed to waive fees and/or reimburse the Funds to the extent that total annual operating expenses, (excluding acquired fund fees and expenses, except with respect to Diversified Return Europe Equity Currency Hedged ETF and Diversified Return International Currency Hedged ETF where the expense limitation agreement includes acquired fund fees and expenses, dividend
| | | | | | | | |
| | | |
| OCTOBER 31, 2017 | | JPMORGAN EXCHANGE-TRADED FUNDS | | | | | 121 | |
NOTES TO FINANCIAL STATEMENTS
AS OF OCTOBER 31, 2017 (continued)
expenses related to short sales, interest, taxes, expenses related to litigation and potential litigation, and extraordinary expenses), exceed the percentages of the Funds’ respective average daily net assets as shown in the below table:
| | | | |
| | | Expense Cap | |
Emerging Markets Equity ETF | | | 0.45 | % |
Europe Currency Hedged ETF | | | 0.49 | % |
Europe Equity ETF | | | 0.43 | % |
Global Equity ETF | | | 0.38 | % |
International Currency Hedged ETF | | | 0.49 | % |
International Equity ETF | | | 0.43 | % |
U.S. Equity ETF* | | | 0.19 | % |
U.S. Mid Cap Equity ETF** | | | 0.24 | % |
U.S. Small Cap Equity ETF*** | | | 0.29 | % |
| * | Prior to March 1, 2017, the contractual expense limitation for the Diversified Return U.S. Equity ETF was 0.29%. |
| ** | Prior to March 1, 2017, the contractual expense limitation for the Diversified Return U.S. Mid Cap Equity ETF was 0.34%. |
| *** | Prior to March 1, 2017, the contractual expense limitation for the Diversified Return U.S. Small Cap Equity ETF was 0.39%. |
The expense limitation agreements were in effect for the period ended October 31, 2017. The contractual expense limitation percentages in the table above are in place until at least February 29, 2020.
For the period ended October 31, 2017, the Funds’ service providers waived fees and/or reimbursed expenses for each Fund as follows. None of these parties expect the Funds to repay any such waived fees and/or reimbursed expenses in future years.
| | | | | | | | | | | | | | | | |
| | | Contractual Waivers | | | | |
| | | Investment
Advisory Fees | | | Administration
Fees | | | Total | | | Contractual
Reimbursements | |
Emerging Markets Equity ETF | | $ | 363,825 | | | $ | 242,550 | | | $ | 606,375 | | | $ | — | |
Europe Currency Hedged ETF | | | 59,539 | | | | 39,692 | | | | 99,231 | | | | 168,340 | * |
Europe Equity ETF | | | 141,257 | | | | 94,172 | | | | 235,429 | | | | — | |
Global Equity ETF | | | 155,739 | | | | 103,826 | | | | 259,565 | | | | 46,694 | |
International Currency Hedged ETF | | | 72,650 | | | | 48,434 | | | | 121,084 | | | | 190,757 | * |
International Equity ETF | | | 269,014 | | | | 179,342 | | | | 448,356 | | | | — | |
U.S. Equity ETF | | | 341,841 | | | | 227,894 | | | | 569,735 | | | | — | |
U.S. Mid Cap Equity ETF | | | 103,586 | | | | 69,057 | | | | 172,643 | | | | 8,380 | |
U.S. Small Cap Equity ETF | | | 69,842 | | | | 46,562 | | | | 116,404 | | | | 61,704 | |
| * | As disclosed in Note 8, amounts include out of period adjustments. |
Additionally, the Funds may invest in one or more money market funds advised by the Adviser or its affiliates (affiliated money market funds). The Adviser has agreed to waive the net expense ratio of the Underlying Funds.
The amount of the waivers resulting from investments in these money market funds for the period ended October 31, 2017 were as follows:
| | | | |
Emerging Markets Equity ETF | | $ | 879 | |
Europe Currency Hedged ETF | | | 16,325 | |
Europe Equity ETF | | | 10 | |
Global Equity ETF | | | 10 | |
International Currency Hedged ETF | | | 17,200 | |
International Equity ETF | | | 5,458 | |
U.S. Equity ETF | | | 2,391 | |
U.S. Mid Cap Equity ETF | | | 944 | |
U.S. Small Cap Equity ETF | | | 394 | |
F. Distribution Services
The Distributor or its agent distributes Creation Units for each Fund on an agency basis. The Distributor does not maintain a secondary market in shares of each Fund. JPMDS receives, and SIDCO received, no fees for their distribution services under their respective distribution agreements with the Trust. Although the Trust does not, and did not, pay any fees under the Distribution Agreements, JPMIM pays JPMDS, and paid SIDCO, for certain distribution related services.
| | | | | | |
| | | |
| 122 | | | | JPMORGAN EXCHANGE-TRADED FUNDS | | OCTOBER 31, 2017 |
G. Other — Certain officers of the Trust are affiliated with the Adviser. Such officers, with the exception of the Chief Compliance Officer, receive no compensation from the Funds for serving in their respective roles.
The Board of Trustees appointed a Chief Compliance Officer to the Funds in accordance with Federal securities regulations. The Funds, along with other affiliated funds, make reimbursement payments, on a pro-rata basis, to the Administrator for a portion of the fees associated with the Office of the Chief Compliance Officer. Such fees are included in Trustees’ and Chief Compliance Officer’s fees in the Funds’ Statements of Operations.
The Funds may use related party broker-dealers. For the period ended October 31, 2017, the Funds incurred no brokerage commissions with broker-dealers affiliated with the Adviser.
The Securities and Exchange Commission (“SEC”) has granted an exemptive order permitting the Funds to engage in principal transactions with J.P. Morgan Securities, Inc., an affiliated broker, involving taxable money market instruments, subject to certain conditions.
An affiliate of JPMorgan made a payment to the International Currency Hedged ETF and the Europe Currency Hedged ETF of approximately $35,000 and $4,500, respectively, relating to a NAV error, which was booked to Capital Transactions on the Statement of Changes in Net Assets to the respective Fund.
4. Investment Transactions
During the period ended October 31, 2017, purchases and sales of investments (excluding short-term investments) were as follows:
| | | | | | | | |
| | | Purchases
(excluding U.S.
Government) | | | Sales
(excluding U.S.
Government) | |
Emerging Markets Equity ETF | | $ | 112,817,050 | | | $ | 71,009,219 | |
Europe Currency Hedged ETF | | | 3,187,584 | | | | 5,991,519 | |
Europe Equity ETF | | | 12,014,208 | | | | 11,655,330 | |
Global Equity ETF | | | 22,523,102 | | | | 20,677,062 | |
International Currency Hedged ETF | | | 2,120,766 | | | | 3,765,454 | |
International Equity ETF | | | 276,291,667 | | | | 223,174,155 | |
U.S. Equity ETF | | | 63,475,183 | | | | 63,310,835 | |
U.S. Mid Cap Equity ETF | | | 16,227,725 | | | | 16,952,582 | |
U.S. Small Cap Equity ETF | | | 8,006,433 | | | | 7,710,282 | |
During the period ended October 31, 2017, there were no purchases or sales of U.S. Government securities.
For the period ended October 31, 2017, in-kind transactions associated with creations and redemptions were:
| | | | | | | | | | | | |
| | | In-Kind
Purchases | | | In-Kind
Sales | | | Realized
Gain (Loss) | |
Emerging Markets Equity ETF | | $ | 59,220,624 | | | $ | — | | | $ | — | |
Europe Currency Hedged ETF | | | 1,235,542 | | | | — | | | | — | |
Europe Equity ETF | | | 6,006,125 | | | | — | | | | — | |
Global Equity ETF | | | 20,343,878 | | | | 9,703,640 | | | | 1,993,665 | |
International Currency Hedged ETF | | | 16,401,416 | | | | — | | | | — | |
International Equity ETF | | | 512,796,071 | | | | 22,651,454 | | | | 4,151,369 | |
U.S. Equity ETF | | | 263,393,406 | | | | 72,222,099 | | | | 10,809,680 | |
U.S. Mid Cap Equity ETF | | | 34,131,366 | | | | 16,111,051 | | | | 3,547,360 | |
U.S. Small Cap Equity ETF | | | 49,485,021 | | | | — | | | | — | |
| | | | | | | | |
| | | |
| OCTOBER 31, 2017 | | JPMORGAN EXCHANGE-TRADED FUNDS | | | | | 123 | |
NOTES TO FINANCIAL STATEMENTS
AS OF OCTOBER 31, 2017 (continued)
5. Federal Income Tax Matters
For Federal income tax purposes, the estimated cost and unrealized appreciation (depreciation) in value of investment securities held at October 31, 2017 were as follows:
| | | | | | | | | | | | | | | | |
| | | Aggregate Cost | | | Gross Unrealized Appreciation | | | Gross Unrealized Depreciation | | | Net Unrealized Appreciation | |
Emerging Markets Equity ETF | | $ | 146,668,264 | | | $ | 21,759,920 | | | $ | (3,072,847 | ) | | $ | 18,687,073 | |
Europe Currency Hedged ETF | | | 26,601,304 | | | | 4,667,471 | | | | (13,095 | ) | | | 4,654,376 | |
Europe Equity ETF | | | 67,449,935 | | | | 13,389,544 | | | | (1,832,984 | ) | | | 11,556,560 | |
Global Equity ETF | | | 89,727,218 | | | | 15,723,056 | | | | (2,329,962 | ) | | | 13,393,094 | |
International Currency Hedged ETF | | | 42,051,062 | | | | 6,710,842 | | | | (156,428 | ) | | | 6,554,414 | |
International Equity ETF | | | 1,029,471,841 | | | | 138,602,479 | | | | (17,922,014 | ) | | | 120,680,465 | |
U.S. Equity ETF | | | 326,644,093 | | | | 34,854,591 | | | | (7,673,127 | ) | | | 27,181,464 | |
U.S. Mid Cap Equity ETF | | | 55,849,167 | | | | 7,436,515 | | | | (1,187,919 | ) | | | 6,248,596 | |
U.S. Small Cap Equity ETF | | | 49,963,890 | | | | 5,944,268 | | | | (1,259,864 | ) | | | 4,684,404 | |
The difference between book and tax basis appreciation (depreciation) on investments is primarily attributed to investments in passive foreign investment companies (“PFICs”), wash sale loss deferrals, mark to market of forward currency contracts, mark to market of futures contracts and investments in real estate investment trusts (“REITs”).
The tax character of distributions paid during the year ended October 31, 2017 was as follows:
| | | | | | | | | | | | |
| | | Ordinary
Income* | | | Net Long-Term
Capital Gains | | | Total Distributions
Paid | |
Emerging Markets Equity ETF | | $ | 771,056 | | | $ | — | | | $ | 771,056 | |
Europe Currency Hedged ETF | | | 1,256,932 | | | | 1,083,788 | | | | 2,340,720 | |
Europe Equity ETF | | | 1,338,720 | | | | — | | | | 1,338,720 | |
Global Equity ETF | | | 1,695,420 | | | | — | | | | 1,695,420 | |
International Currency Hedged ETF | | | 801,634 | | | | 547,901 | | | | 1,349,535 | |
International Equity ETF | | | 9,230,405 | | | | — | | | | 9,230,405 | |
U.S. Equity ETF | | | 1,329,650 | | | | — | | | | 1,329,650 | |
U.S. Mid Cap Equity ETF | | | 396,160 | | | | — | | | | 396,160 | �� |
U.S. Small Cap Equity ETF | | | 36,680 | | | | — | | | | 36,680 | |
| * | Short-term gain distributions are treated as ordinary income for income tax purposes. |
The tax character of distributions paid during the year ended October 31, 2016 was a follows:
| | | | | | | | |
| | | Ordinary
Income* | | | Total Distributions
Paid | |
Emerging Markets Equity ETF | | $ | 1,050,480 | | | $ | 1,050,480 | |
Europe Equity ETF | | | 918 | | | | 918 | |
Global Equity ETF | | | 1,057,127 | | | | 1,057,127 | |
International Equity ETF | | | 2,154,090 | | | | 2,154,090 | |
U.S. Equity ETF | | | 130,025 | | | | 130,025 | |
| * | Short-term gain distributions are treated as ordinary income for income tax purposes. |
| | | | | | |
| | | |
| 124 | | | | JPMORGAN EXCHANGE-TRADED FUNDS | | OCTOBER 31, 2017 |
As of October 31, 2017, the estimated components of net assets (excluding paid-in-capital) on a tax basis were as follows:
| | | | | | | | | | | | |
| | | Current
Distributable
Ordinary
Income | | | Current Distributable
Long-Term Capital
Gain or (Tax Basis
Capital Loss Carryover) | | | Unrealized
Appreciation | |
Emerging Markets Equity ETF | | $ | 3,428,600 | | | $ | (4,823,620 | ) | | $ | 18,444,406 | |
Europe Currency Hedged ETF | | | 65,059 | | | | (1,069,100 | ) | | | 4,639,366 | |
Europe Equity ETF | | | 1,912,779 | | | | (233,355 | ) | | | 11,562,411 | |
Global Equity ETF | | | 1,618,878 | | | | (1,221,165 | ) | | | 13,389,581 | |
International Currency Hedged ETF | | | 50,550 | | | | (425,941 | ) | | | 6,539,729 | |
International Equity ETF | | | 22,095,958 | | | | (5,917,979 | ) | | | 120,671,381 | |
U.S. Equity ETF | | | 3,670,672 | | | | (1,434,889 | ) | | | 27,181,464 | |
U.S. Mid Cap Equity ETF | | | 689,381 | | | | (10,805 | ) | | | 6,248,596 | |
U.S. Small Cap Equity ETF | | | 301,790 | | | | (276,140 | ) | | | 4,684,404 | |
As of October 31, 2017, the Funds had net capital loss carryforwards, with no expiration dates, as follows:
| | | | | | | | |
| | | Capital Loss Carryforward Character | |
| | | Short-Term | | | Long-Term | |
Emerging Markets Equity ETF | | $ | 4,210,288 | * | | $ | 613,332 | * |
Europe Currency Hedged ETF | | | 503,280 | | | | 565,820 | |
Europe Equity ETF | | | 233,355 | | | | — | |
Global Equity ETF | | | 850,210 | | | | 370,955 | |
International Currency Hedged ETF | | | 218,381 | | | | 207,560 | |
International Equity ETF | | | 1,412,312 | * | | | 4,505,667 | * |
U.S. Equity ETF | | | 1,174,597 | | | | 260,292 | |
U.S. Mid Cap Equity ETF | | | — | | | | 10,805 | |
U.S. Small Cap Equity ETF | | | 276,140 | | | | — | |
| * | Amount includes capital loss carryforwards from business combinations, which are limited in future years under Internal Revenue Code Sections 381-384. |
During the year ended October 31, 2017, the following Funds utilized capital loss carryforwards as follows:
| | | | |
Emerging Markets Equity ETF | | $ | 1,590,294 | |
Global Equity ETF | | | 801,991 | |
International Equity ETF | | | 421,033 | |
U.S. Mid Cap Equity ETF | | | 87,090 | |
Late year ordinary losses incurred after December 31 and within the taxable year are deemed to arise on the first business day of the Funds’ next taxable year. For the year ended October 31, 2017, the following Funds deferred to November 1, 2017 late year ordinary losses of:
| | | | |
| | | Late Year
Ordinary Loss
Deferral | |
Europe Currency Hedged ETF | | $ | 15,135 | |
International Currency Hedged ETF | | | 21,385 | |
6. Capital Share Transactions
The Trust issues and redeems shares of the Funds only in Creation Units through the Distributor at NAV. Capital shares transactions detail can be found in the Statements of Changes in Net Assets.
Shares of the Funds may only be purchased or redeemed by Authorized Participants. Such Authorized Participants may from time to time hold, of record or beneficially, a substantial percentage of the Funds’ shares outstanding, act as executing or clearing broker for investment transactions on behalf of the Funds. An Authorized Participant is either (1) a “Participating Party” or other participant in the clearing process through the Continuous Net Settlement System of the National Securities Clearing Corporation (“NSCC”); or (2) a DTC Participant; which, in either case, must have executed an agreement with the Distributor.
Creation Units of a Fund may be created in advance of receipt by the Trust of all or a portion of the applicable basket of equity securities and other instruments (“Deposit Instruments”) and cash as described in the Funds’ registration statement. In these instances, the initial Deposit Instruments and cash must be deposited in an amount equal to the sum of the cash amount, plus at least 105% of the market value of undelivered Deposit Instruments. A transaction fee may be imposed to offset transfer and other transaction costs associated with the purchase or redemption of Creation Units.
| | | | | | | | |
| | | |
| OCTOBER 31, 2017 | | JPMORGAN EXCHANGE-TRADED FUNDS | | | | | 125 | |
NOTES TO FINANCIAL STATEMENTS
AS OF OCTOBER 31, 2017 (continued)
7. Risks, Concentrations and Indemnifications
In the normal course of business, the Funds enter into contracts that contain a variety of representations which provide general indemnifications. The Funds’ maximum exposure under these arrangements is unknown. The amount of exposure, if any, would depend on future claims that may be made against the Funds that have not yet occurred. However, based on experience, the Funds expect the risk of loss to be remote.
As of October 31, 2017, the Adviser owned shares representing more than 10% of net assets of the following Funds:
| | | | |
| | | %
Ownership | |
Europe Currency Hedged ETF | | | 93 | % |
Europe Equity ETF | | | 40 | % |
Global Equity ETF | | | 17 | % |
International Currency Hedged ETF | | | 60 | % |
U.S. Mid Cap Equity ETF | | | 29 | % |
U.S. Small Cap Equity ETF | | | 50 | % |
Furthermore, as of October 31, 2017, the Europe Currency Hedged ETF owned approximately 38% of the shares outstanding of the Europe Equity ETF.
Significant transactions by the Adviser may impact the Fund’s performance.
Each Fund may have elements of risk not typically associated with investment in the United States of America due to concentrated investments in a limited number of countries or regions, which may vary throughout the year depending on a Fund’s benchmark index (each an “underlying index”). Such concentrations may subject the Funds to additional risks resulting from political or economic conditions in such countries or regions and the possible imposition of adverse governmental laws or currency exchange restrictions could cause the securities and their markets to be less liquid and their prices to be more volatile than those of comparable U.S. securities. As of October 31, 2017, the following Funds had non-U.S. country allocations representing greater than 10% of total investments as follows:
| | | | | | | | | | | | | | | | | | | | | | | | | | | | | | | | |
| | | China | | | France | | | Germany | | | Japan | | | Switzerland | | | South
Korea | | | Taiwan | | | United
Kingdom | |
Emerging Markets Equity ETF | | | 22.8 | % | | | — | % | | | — | % | | | — | % | | | — | % | | | — | % | | | 16.3 | % | | | — | % |
Europe Equity ETF | | | — | | | | 13.1 | | | | 14.3 | | | | — | | | | 11.6 | | | | — | | | | — | | | | 23.2 | |
Global Equity ETF | | | — | | | | — | | | | — | | | | 23.1 | | | | — | | | | 10.2 | | | | — | | | | — | |
International Equity ETF | | | — | | | | — | | | | — | | | | 25.9 | | | | — | | | | 11.2 | | | | — | | | | 16.8 | |
With the exception of U.S. Equity ETF, U.S. Mid Cap Equity ETF, and U.S. Small Cap Equity ETF as of October 31, 2017, a significant portion of the net assets of the Funds noted in the table above consisted of securities that are denominated in foreign currencies. Changes in currency exchange rates will affect the value of, and investment income from, such securities.
Premium/Discount Risk — Disruptions to creations and redemptions, the existence of significant market volatility or potential lack of an active trading market for the Shares (including through a trading halt), as well as other factors, may result in Shares trading significantly above (at a premium) or below (at a discount) to the NAV or to the intraday value of the Fund’s holdings. During such periods, investors may incur significant losses if shares are sold.
Index Tracking Risk — A Fund may not track the return of the underlying index for a number of reasons and therefore may not achieve its investment objective. For example, each Fund incurs a number of operating expenses not applicable to its underlying index, and incurs costs in buying and selling securities, especially when rebalancing the Fund’s securities holdings to reflect changes in the composition of the underlying index. In addition, a Fund’s return may differ from the return of its underlying index as a result of, among other things, pricing differences and the inability to purchase certain securities included in the underlying index due to regulatory or other restrictions. To the extent of the previously outlined items, each Fund’s return differs from the return of the underlying index.
Counterparty Risk — The Funds are subject to counterparty risk, which is the risk that a counterparty will not fulfill its contractual obligations arising from agreements with the Funds such as forward foreign currency exchange contracts.
Derivatives Risk — Derivatives and futures may be riskier than other types of investments because they may be more sensitive to changes in economic or market conditions than other types of investments and could result in losses that significantly exceed the Fund’s original investment. Many derivatives create leverage thereby causing a Fund to be more volatile than it would be if it had not used derivatives. Derivatives also expose a Fund to counterparty risk including the credit risk of the derivative counterparty.
8. Out of Period Adjustment
The Europe Currency Hedged ETF and International Currency Hedged ETF each recorded an out of period adjustment in the October 31, 2017 financial statements which resulted in an increase to net investment income of approximately $59,388 and $59,006, respectively, as well as the changes to the Financial Highlights as disclosed therein. These adjustments resulted from an adjustment related to an expense reimbursement, from the
| | | | | | |
| | | |
| 126 | | | | JPMORGAN EXCHANGE-TRADED FUNDS | | OCTOBER 31, 2017 |
Adviser, for acquired fund fees that was not recorded in the October 31, 2016 financial statements. Management has evaluated the adjustment and concluded that it is not material to the previously issued 2016 or the current year financial statements.
9. Investment Company Reporting Modernization
In October 2016, the U.S. Securities and Exchange Commission adopted new rules and forms, and amendments to certain current rules and forms, to modernize the reporting and disclosure of information by registered investment companies. In part, the final rules amend Regulation S-X and require standardized, enhanced disclosures about derivatives in investment company financial statements, as well as other amendments. The amendments to Regulation S-X were applied to Funds’ financial statements as of October 31, 2017. The adoption had no effect on the Funds’ net assets or results of operations.
| | | | | | | | |
| | | |
| OCTOBER 31, 2017 | | JPMORGAN EXCHANGE-TRADED FUNDS | | | | | 127 | |
REPORT OF INDEPENDENT REGISTERED PUBLIC ACCOUNTING FIRM
To the Board of Trustees of J.P. Morgan Exchange-Traded Fund Trust and Shareholders of JPMorgan Diversified Return Emerging Markets Equity ETF, JPMorgan Diversified Return Europe Currency Hedged ETF, JPMorgan Diversified Return Europe Equity ETF, JPMorgan Diversified Return Global Equity ETF, JPMorgan Diversified Return International Currency Hedged ETF, JPMorgan Diversified Return International Equity ETF, JPMorgan Diversified Return U.S. Equity ETF, JPMorgan Diversified Return U.S. Mid Cap Equity ETF and JPMorgan Diversified Return U.S. Small Cap Equity ETF
In our opinion, the accompanying statements of assets and liabilities, including the schedules of portfolio investments, and the related statements of operations and of changes in net assets and the financial highlights present fairly, in all material respects, the financial position of each of the nine funds listed in the table below
| | |
JPMorgan Diversified Return Emerging Markets Equity ETF, JPMorgan Diversified Return Global Equity ETF, JPMorgan Diversified Return International Equity ETF, JPMorgan Diversified Return U.S. Equity ETF | | Statements of changes in net assets for the two years in the period ended October 31, 2017 |
JPMorgan Diversified Return Europe Currency Hedged ETF, JPMorgan Diversified Return International Currency Hedged ETF | | Statements of changes in net assets for the year ended October 31, 2017 and for the period April 1, 2016 (commencement of operations) through October 31, 2016 |
| JPMorgan Diversified Return Europe Equity ETF | | Statement of changes in net assets for the year ended October 31, 2017 and for the period December 18, 2015 (commencement of operations) through October 31, 2016 |
| JPMorgan Diversified Return U.S. Mid Cap Equity ETF | | Statement of changes in net assets for the year ended October 31, 2017 and for the period May 11, 2016 (commencement of operations) through October 31, 2016 |
| JPMorgan Diversified Return U.S. Small Cap Equity ETF | | Statement of changes in net assets for the period November 15, 2016 (commencement of operations) through October 31, 2017 |
(nine of the funds constituting J.P. Morgan Exchange-Traded Fund Trust, hereafter collectively referred to as the “Funds”) as of October 31, 2017, the results of each of their operations for the year then ended (or for JPMorgan Diversified Return U.S. Small Cap Equity ETF for the period November 15, 2016 (commencement of operations) through October 31, 2017), the changes in each of their net assets for the respective periods described in the table above, and the financial highlights for each of the periods indicated therein, in conformity with accounting principles generally accepted in the United States of America. These financial statements and financial highlights (hereafter referred to as “financial statements”) are the responsibility of the Funds’ management. Our responsibility is to express an opinion on these financial statements based on our audits. We conducted our audits of these financial statements in accordance with the standards of the Public Company Accounting Oversight Board (United States). Those standards require that we plan and perform the audit to obtain reasonable assurance about whether the financial statements are free of material misstatement. An audit includes examining, on a test basis, evidence supporting the amounts and disclosures in the financial statements, assessing the accounting principles used and significant estimates made by management, and evaluating the overall financial statement presentation. We believe that our audits, which included confirmation of securities as of October 31, 2017 by correspondence with the transfer agent, custodian, brokers and the application of alternative auditing procedures where securities purchased confirmations had not been received, provide a reasonable basis for our opinions.
/s/ PricewaterhouseCoopers LLP
New York, New York
December 22, 2017
| | | | | | |
| | | |
| 128 | | | | JPMORGAN EXCHANGE-TRADED FUNDS | | OCTOBER 31, 2017 |
SUPPLEMENTAL INFORMATION
FOR THE PERIODS INDICATED (Unaudited)
The table below indicates the number of trading days in which the Funds traded within the range of the premium/discount noted. The number of days in each range is also shown as a percentage of the total trading days for the period covered in the table. All information within the table is based on historical performance. Past performance cannot be used to predict future results. Shareholders may pay more than NAV when they buy fund shares and receive less than NAV when they sell those shares because shares are bought and sold at current market prices.
| | | | | | | | | | | | | | | | | | | | | | | | |
| | | Emerging Markets
Equity ETF (a) | | | Europe Currency
Hedged ETF (b) | | | Europe Equity ETF (c) | |
| Range of Premium/(Discount) | | Day Count | | | Percentage | | | Day Count | | | Percentage | | | Day Count | | | Percentage | |
Greater than 2.0% and Less than or equal to 2.5% | | | — | | | | — | % | | | 1 | | | | 0.25 | % | | | — | | | | — | % |
Greater than 1.5% and Less than or equal to 2.0% | | | 3 | | | | 0.42 | % | | | 2 | | | | 0.50 | % | | | — | | | | — | % |
Greater than 1.0% and Less than or equal to 1.5% | | | 32 | | | | 4.50 | % | | | 1 | | | | 0.25 | % | | | 1 | | | | 0.21 | % |
Greater than 0.5% and Less than or equal to 1.0% | | | 268 | | | | 37.75 | % | | | 16 | | | | 4.01 | % | | | 24 | | | | 5.11 | % |
Greater than 0.0% and Less than or equal to 0.5% | | | 192 | | | | 27.04 | % | | | 248 | | | | 62.16 | % | | | 368 | | | | 78.30 | % |
Less than or equal to 0.0% and greater than or equal to –0.5% | | | 89 | | | | 12.54 | % | | | 125 | | | | 31.33 | % | | | 77 | | | | 16.38 | % |
Less than –0.5% and greater than or equal to –1.0% | | | 94 | | | | 13.24 | % | | | 3 | | | | 0.75 | % | | | — | | | | — | % |
Less than –1.0% and greater than or equal to –1.5% | | | 26 | | | | 3.66 | % | | | 1 | | | | 0.25 | % | | | — | | | | — | % |
Less than –1.5% and greater than or equal to –2.0% | | | 6 | | | | 0.85 | % | | | 1 | | | | 0.25 | % | | | — | | | | — | % |
Less than –4.0% and greater than or equal to –4.5% | | | — | | | | — | % | | | 1 | | | | 0.25 | % | | | — | | | | — | % |
| | | | | | | | | | | | | | | | | | | | | | | | |
| | | 710 | | | | 100.00 | % | | | 399 | | | | 100.00 | % | | | 470 | | | | 100.00 | % |
| | | | | | | | | | | | | | | | | | | | | | | | |
| | | |
| | | Global Equity ETF (d) | | | International Currency
Hedged ETF (b) | | | International Equity ETF (e) | |
| Range of Premium/(Discount) | | Day Count | | | Percentage | | | Day Count | | | Percentage | | | Day Count | | | Percentage | |
Greater than 1.0% and Less than or equal to 1.5% | | | — | | | | — | % | | | — | | | | — | % | | | 1 | | | | 0.13 | % |
Greater than 0.5% and Less than or equal to 1.0% | | | 39 | | | | 4.58 | % | | | 13 | | | | 3.25 | % | | | 138 | | | | 18.37 | % |
Greater than 0.0% and Less than or equal to 0.5% | | | 671 | | | | 78.76 | % | | | 317 | | | | 79.25 | % | | | 569 | | | | 75.77 | % |
Less than or equal to 0.0% and greater than or equal to –0.5% | | | 139 | | | | 16.31 | % | | | 69 | | | | 17.25 | % | | | 40 | | | | 5.33 | % |
Less than –0.5% and greater than or equal to –1.0% | | | 2 | | | | 0.23 | % | | | 1 | | | | 0.25 | % | | | 3 | | | | 0.40 | % |
Less than –1.0% and greater than or equal to –1.5% | | | 1 | | | | 0.12 | % | | | — | | | | — | % | | | — | | | | – | % |
| | | | | | | | | | | | | | | | | | | | | | | | |
| | | 852 | | | | 100.00 | % | | | 400 | | | | 100.00 | % | | | 751 | | | | 100.00 | % |
| | | | | | | | | | | | | | | | | | | | | | | | |
| | | |
| | | U.S. Equity ETF (f) | | | U.S. Mid Cap ETF (g) | | | U.S. Small Cap Equity ETF (h) | |
| Range of Premium/(Discount) | | Day Count | | | Percentage | | | Day Count | | | Percentage | | | Day Count | | | Percentage | |
Greater than 4.5% and Less than or equal to 5.0% | | | 1 | | | | 0.19 | % | | | 3 | | | | 0.82 | % | | | — | | | | — | % |
Greater than 0.0% and Less than or equal to 0.5% | | | 469 | | | | 88.99 | % | | | 320 | | | | 86.95 | % | | | 236 | | | | 97.93 | % |
Less than or equal to 0.0% and greater than or equal to –0.5% | | | 57 | | | | 10.82 | % | | | 45 | | | | 12.23 | % | | | 5 | | | | 2.07 | % |
| | | | | | | | | | | | | | | | | | | | | | | | |
| | | 527 | | | | 100.00 | % | | | 368 | | | | 100.00 | % | | | 241 | | | | 100.00 | % |
| | | | | | | | | | | | | | | | | | | | | | | | |
| (a) | For the period January 7, 2015 (fund inception date) to October 31, 2017. |
| (b) | For the period April 1, 2016 (fund inception date) to October 31, 2017. |
| (c) | For the period December 18, 2015 (fund inception date) to October 31, 2017. |
| (d) | For the period June 16, 2014 (fund inception date) to October 31, 2017. |
| (e) | For the period November 5, 2014 (fund inception date) to October 31, 2017. |
| (f) | For the period September 29, 2015 (fund inception date) to October 31, 2017. |
| (g) | For the period May 11, 2016 (fund inception date) to October 31, 2017. |
| (h) | For the period November 15, 2016 (fund inception date) to October 31, 2017. |
| | | | | | | | |
| | | |
| OCTOBER 31, 2017 | | JPMORGAN EXCHANGE-TRADED FUNDS | | | | | 129 | |
TRUSTEES
(Unaudited)
The Fund’s Statement of Additional Information includes additional information about the Funds Trustees and is available, without charge, upon request by calling 1-844-457-6383 or on the J.P. Morgan Funds’ website at www.jpmorganfunds.com.
| | | | | | | | |
Name (Year of Birth;
Positions With
the Funds since) | | Principal Occupation
During Past 5 Years | | Number of
Funds in Fund
Complex Overseen
by Trustee (1) | | | Other Directorships Held
During Past 5 Years |
Independent Trustees | | | | | | | | |
| | | |
| Gary L. French (1951); Trustee of the Trust since 2014 | | Real Estate Investor (2011-present); Senior Consultant for the Regulatory Fundamentals Group LLC (2011-2017); Senior Vice President-Fund Administration, State Street Corporation (2002-2010). | | | 22 | | | Independent Trustee, The China Fund, Inc. (2013-present); Exchange Traded Concepts Trust II (2012-2014); Exchange Traded Concepts Trust I (2011-2014). |
| | | |
| Robert J. Grassi (1957); Trustee of the Trust since 2014 | | Sole Proprietor, Academy Hills Advisors LLC (2012-present); Pension Director, Corning Incorporated (2002-2012). | | | 22 | | | None. |
| | | |
| Thomas P. Lemke (1954); Trustee of the Trust since 2014 | | Retired; Executive Vice President and General Counsel, Legg Mason (2005-2013). | | | 22 | | | Independent Trustee of AXA Premier VIP Trust (2014-present); SEI family of funds (Independent Trustee of Advisors’ Inner Circle III Funds (5 portfolios) (from February 2014 to present)); Independent Trustee of O’Connor EQUUS (May 2014-present); Independent Trustee of Winton Series Trust (December 2014-present); Independent Director of The Victory Funds (or their predecessor funds) (35 portfolios) (2014-March 2015). |
| | | |
| Lawrence R. Maffia (1950); Trustee of the Trust since 2014 | | Retired; Director and President, ICI Mutual Insurance Company (2006-2013). | | | 22 | | | Director, ICI Mutual Insurance Company (1999-2013). |
| | | |
| Emily A. Youssouf (1951); Trustee of the Trust since 2014 | | Clinical Professor, NYU Schack Institute of Real Estate (2009-present); Board Member (2005-present), Chair of Capital Committee (2006-2016), Chair of Audit Committee (2005-present), and Chair of IT Committee (2016-present), NYC Health and Hospitals Corporation; Board Member and Member of the Audit Committee and Related Parties Committee (2013-present) and Member of the Risk Management Committee (2017-present), PennyMac Financial Services, Inc. | | | 22 | | | Trustee, NYC School Construction Authority (2009-present); Board Member, NYS Job Development Authority (2008-present); Trustee (2015-present) and Chair of the Audit and Finance Committee (2015-present) of the Transit Center Foundation; Vice Chair (2011-2013) and Board Member (2013-2014) of New York City Housing Authority. |
Interested Trustee | | | | | | | | |
| | | |
| Robert Deutsch (2) (1957); Chairman and Trustee of the Trust since 2014 | | Retired; Head of the Global ETF Business for JPMorgan Asset Management (2013-2017); Head of the Global Liquidity Business for JPMorgan Asset Management (2003-2013). | | | 22 | | | None |
| (1) | A Fund complex means two or more registered investment companies that hold themselves out to investors as related companies for purposes of investment and investor services or have a common investment adviser or have an investment adviser that is an affiliated person of the investment adviser of any of the other registered investment companies. Thirteen series of the Trust have commenced operations, but nine additional series have been created and are expected to commence operations in the future. |
| (2) | Mr. Deutsch is an interested trustee because he was an employee of the Adviser until August 2017. |
The contact address for each of the Trustees is 270 Park Avenue, New York, NY 10017.
| | | | | | |
| | | |
| 130 | | | | JPMORGAN EXCHANGE-TRADED FUNDS | | OCTOBER 31, 2017 |
OFFICERS
(Unaudited)
| | |
Name (Year of Birth), Positions Held with the Trusts (Since) | | Principal Occupations During Past 5 Years |
| |
| Joanna Gallegos (1975), President and Principal Executive Officer (2017) | | Managing Director, Head of J.P. Morgan Asset Management’s U.S. Exchange Traded Funds business. Previously, Head of J.P. Morgan Asset Management’s ETF Product Development team from August 2013 to July 2017; Managing Director of the Strategic Initiatives Group in BlackRock’s iShares Exchange Traded Funds division from 2010 to 2013. |
| |
| Lauren A. Paino (1973), Treasurer and Principal Financial Officer (2015)** | | Executive Director, J.P. Morgan Investment Management Inc. (formerly JPMorgan Funds Management, Inc.) since August 2013; Director, Credit Suisse Asset Management (2000-2013). |
| |
| Paul Shield (1960), Vice President and Assistant Treasurer (2016) | | Managing Director and head of Business Management for JPMorgan Asset Management’s Exchange Traded Fund platform since 2013. Senior Global Product Manager of Alternative Investments for BNY Mellon from 2011 to 2013 and Global Product Head for Exchange Traded Funds at JPMorgan Chase Bank from 2008 to 2011. |
| |
Brian S. Shlissel (1964), Vice President (2016) | | Managing Director and Chief Administrative Officer for J.P. Morgan pooled vehicles, J.P. Morgan Investment Management Inc. (formerly JPMorgan Funds Management Inc.) (2014-present); Managing Director and Head of Mutual Fund Services, Allianz Global Investors; President and Chief Executive Officer, Allianz Global Investors Mutual Funds and PIMCO Closed-End Funds (1999-2014). |
| |
| Frank J. Nasta (1964), Secretary (2014) | | Managing Director and Associate General Counsel, JPMorgan Chase since 2008. |
| |
| Stephen M. Ungerman (1953), Chief Compliance Officer (2014) | | Managing Director, JPMorgan Chase & Co.; Mr. Ungerman has been with JPMorgan Chase & Co. since 2000. |
| |
| Elizabeth A. Davin (1964), Assistant Secretary (2014)* | | Executive Director and Assistant General Counsel, JPMorgan Chase. Ms. Davin has been with JPMorgan Chase (formerly Bank One Corporation) since 2004. |
| |
| Jessica K. Ditullio (1962), Assistant Secretary (2014)* | | Executive Director and Assistant General Counsel, JPMorgan Chase since February 2011; Ms. Ditullio has been with JPMorgan Chase (formerly Bank One Corporation) since 1990. |
| |
| John T. Fitzgerald (1975), Assistant Secretary (2014) | | Executive Director and Assistant General Counsel, JPMorgan Chase since February 2011; Mr. Fitzgerald has been with JPMorgan Chase since 2005. |
| |
| Carmine Lekstutis (1980), Assistant Secretary (2014) | | Executive Director and Assistant General Counsel, JPMorgan Chase since February 2015; formerly Vice President and Assistant General Counsel, JPMorgan Chase from 2011 to February 2015. |
| |
| Gregory S. Samuels (1980), Assistant Secretary (2014) | | Executive Director and Assistant General Counsel, JPMorgan Chase since February 2014; formerly Vice President and Assistant General Counsel, JPMorgan Chase since 2010. |
| |
| Pamela L. Woodley (1971), Assistant Secretary (2014) | | Vice President and Assistant General Counsel, JPMorgan Chase since November 2004. |
| |
| Zachary E. Vonnegut-Gabovitch (1986), Assistant Secretary (2017) | | Vice President and Assistant General Counsel, JPMorgan Chase since September 2016; Associate, Morgan Lewis & Bockius (law firm) from 2012 to 2016. |
| |
| Frederick J. Cavaliere (1978), Assistant Treasurer (2015)** | | Executive Director, J.P. Morgan Investment Management Inc. (formerly JPMorgan Funds Management, Inc.) since February 2016; formerly Vice President, J.P. Morgan Investment Management Inc. (formerly JPMorgan Funds Management, Inc.) since September 2011; formerly Vice President of J.P. Morgan Investment Management Inc. 2010-2011. Mr. Cavaliere has been with JPMorgan since May 2006. |
| |
| Michael M. D’Ambrosio (1969), Assistant Treasurer (2014) | | Managing Director, J.P. Morgan Investment Management Inc. (formerly JPMorgan Funds Management, Inc.) since 2014; formerly Executive Director, J.P. Morgan Investment Management Inc. (formerly JPMorgan Funds Management, Inc.) from 2012 to 2014; prior to joining JPMorgan Chase, Mr. D’Ambrosio was a Tax Director at PricewaterhouseCoopers LLP since 2006. |
| |
| Jason Ronca (1978), Assistant Treasurer (2014)*** | | Executive Director, since February 2017; formerly Vice President for J.P. Morgan Asset Management since 2014. ETF Product Manager for Corporate Investment Bank responsible for setting the strategy and control agenda for the ETF servicing business from 2010 to May 2014; Prior to 2010, a Vice President in Fund Accounting within J.P. Morgan Investor Services, supporting a series of U.S. registered mutual funds. |
The contact address for each of officers, unless otherwise noted, is 270 Park Avenue, New York, NY 10017.
| * | | The contact address for the officer is 1111 Polaris Parkway, Columbus, OH 43240. |
| ** | | The contact address for the officer is 4 New York Plaza, New York, NY 10004. |
| *** | | The contact address for the officer is One Beacon Street, Boston, MA 02108. |
| | | | | | | | |
| | | |
| OCTOBER 31, 2017 | | JPMORGAN EXCHANGE-TRADED FUNDS | | | | | 131 | |
SCHEDULE OF SHAREHOLDER EXPENSES
(Unaudited)
Hypothetical $1,000 Investment
As a shareholder of the Funds, you incur ongoing costs, investment advisory fees, administration fees and other Fund expenses, in addition to brokerage commissions on your purchases and sales of Fund shares. The examples below are intended to help you understand your ongoing costs (in dollars) of investing in the Fund and to compare these ongoing costs with the ongoing costs of investing in other funds. The examples assume that you had a $1,000 investment at the beginning of the reporting period May 1, 2017 and continued to hold your shares at the end of the reporting period, October 31, 2017.
Actual Expenses
For the Fund in the table below, the first line provides information about actual account values and actual expenses. You may use the information in this line, together with the amount you invested, to estimate the expenses that you paid over the period. Simply divide your account value by $1,000 (for example, an $8,600 account value divided by $1,000 = 8.6), then
multiply the result by the number under the heading entitled “Expenses Paid During the Period” to estimate the expenses you paid on your account during this period.
Hypothetical Example for Comparison Purposes
The second line in the table below provides information about hypothetical account values and hypothetical expenses based on the Fund’s actual expense ratio and an assumed rate of return of 5% per year before expenses, which is not the Fund’s actual return. The hypothetical account values and expenses may not be used to estimate the actual ending account balance or expenses you paid for the period. You may use this information to compare the ongoing costs of investing in the Fund and other Funds. To do so, compare this 5% hypothetical example with the 5% hypothetical examples that appear in the shareholder reports of other funds. The examples also assume all dividends and distributions have been reinvested.
| | | | | | | | | | | | | | | | |
| | | Beginning
Account Value
May 1, 2017 | | | Ending
Account Value
October 31, 2017 | | | Annualized
Expense
Ratio | | | Expenses
Paid During
the Period | |
JPMorgan Diversified Return Emerging Markets Equity ETF | | | | | | | | | | | | | | | | |
Actual | | $ | 1,000.00 | | | $ | 1,110.60 | | | | 0.45 | % | | $ | 2.39 | |
Hypothetical (1) | | | 1,000.00 | | | | 1,022.94 | | | | 0.45 | | | | 2.29 | |
| | | | |
JPMorgan Diversified Return Europe Currency Hedged ETF | | | | | | | | | | | | | | | | |
Actual | | $ | 1,000.00 | | | $ | 1,084.90 | | | | 0.07 | % | | $ | 0.37 | |
Hypothetical (1)(2) | | | 1,000.00 | | | | 1,024.85 | | | | 0.07 | | | | 0.36 | |
| | | | |
JPMorgan Diversified Return Europe Equity ETF | | | | | | | | | | | | | | | | |
Actual | | $ | 1,000.00 | | | $ | 1,123.30 | | | | 0.43 | % | | $ | 2.30 | |
Hypothetical (1) | | | 1,000.00 | | | | 1,023.04 | | | | 0.43 | | | | 2.19 | |
| | | | |
JPMorgan Diversified Return Global Equity ETF | | | | | | | | | | | | | | | | |
Actual | | $ | 1,000.00 | | | $ | 1,104.10 | | | | 0.38 | % | | $ | 2.02 | |
Hypothetical (1) | | | 1,000.00 | | | | 1,023.29 | | | | 0.38 | | | | 1.94 | |
| | | | |
JPMorgan Diversified Return International Currency Hedged ETF | | | | | | | | | | | | | | | | |
Actual | | $ | 1,000.00 | | | $ | 1,082.90 | | | | 0.06 | % | | $ | 0.32 | |
Hypothetical (1)(2) | | | 1,000.00 | | | | 1,024.90 | | | | 0.06 | | | | 0.31 | |
| | | | |
JPMorgan Diversified Return International Equity ETF | | | | | | | | | | | | | | | | |
Actual | | $ | 1,000.00 | | | $ | 1,099.00 | | | | 0.43 | % | | $ | 2.27 | |
Hypothetical (1) | | | 1,000.00 | | | | 1,023.04 | | | | 0.43 | | | | 2.19 | |
| | | | |
JPMorgan Diversified Return U.S. Equity ETF | | | | | | | | | | | | | | | | |
Actual | | $ | 1,000.00 | | | $ | 1,074.20 | | | | 0.19 | % | | $ | 0.99 | |
Hypothetical (1) | | | 1,000.00 | | | | 1,024.25 | | | | 0.19 | | | | 0.97 | |
| | | | |
JPMorgan Diversified Return U.S. Mid Cap Equity ETF | | | | | | | | | | | | | | | | |
Actual | | $ | 1,000.00 | | | $ | 1,067.40 | | | | 0.24 | % | | $ | 1.25 | |
Hypothetical (1) | | | 1,000.00 | | | | 1,024.00 | | | | 0.24 | | | | 1.22 | |
| | | | |
JPMorgan Diversified Return U.S. Small Cap Equity ETF | | | | | | | | | | | | | | | | |
Actual | | $ | 1,000.00 | | | $ | 1,067.10 | | | | 0.29 | % | | $ | 1.51 | |
Hypothetical (1) | | | 1,000.00 | | | | 1,023.74 | | | | 0.29 | | | | 1.48 | |
| (1) | Expenses are equal to the Fund’s annualized expense ratio, multiplied by the average account value over the period, multiplied by 184/365 (to reflect the one-half year period). |
| | | | | | |
| | | |
| 132 | | | | JPMORGAN EXCHANGE-TRADED FUNDS | | OCTOBER 31, 2017 |
TAX LETTER
(Unaudited)
Certain tax information for the J.P. Morgan Funds is required to be provided to shareholders based upon the Fund’s income and distributions for the taxable year ended October 31, 2017. The information and distributions reported in this letter may differ from the information and taxable distributions reported to the shareholders for the calendar year ending December 31, 2017. The information necessary to complete your income tax returns for the calendar year ending December 31, 2017 will be provided under separate cover.
Dividends Received Deductions (DRD)
The Funds listed below had the following percentage, or maximum allowable percentage, of ordinary income distributions eligible for the 70% dividends received deductions for corporate shareholders for the fiscal year ended October 31, 2017:
| | | | |
| | | Dividends
Received
Deduction | |
Global Equity ETF | | | 5.38 | % |
U.S. Equity ETF | | | 100.00 | |
U.S. Mid Cap Equity ETF | | | 100.00 | |
U.S. Small Cap Equity ETF | | | 100.00 | |
Long Term Capital Gain
The Funds listed below distributed the following amount, or maximum allowable amount, of long-term capital gain dividends for the fiscal year ended October 31, 2017:
| | | | |
| | | Long Term
Capital Gain | |
Europe Currency Hedged ETF | | $ | 1,083,788 | |
International Currency Hedged ETF | | | 547,901 | |
Qualified Dividend Income (QDI)
The Funds listed below had the following amount, or maximum allowable amount, of ordinary income distributions treated as qualified dividends for the fiscal year ended October 31, 2017:
| | | | |
| | | Qualified Dividend Income | |
Emerging Markets Equity ETF | | $ | 1,332,735 | |
Europe Equity ETF | | | 1,574,794 | |
Global Equity ETF | | | 1,880,230 | |
International Currency Hedged ETF | | | 486,815 | |
International Equity ETF | | | 11,099,070 | |
U.S. Equity ETF | | | 1,329,650 | |
U.S. Mid Cap Equity ETF | | | 396,160 | |
U.S. Small Cap Equity ETF | | | 36,680 | |
Foreign Source Income and Foreign Tax Credit Pass Through
For the fiscal year ended October 31, 2017, the following Funds intend to elect to pass through to shareholders taxes paid to foreign countries. Gross income and foreign tax expenses are as follows or amounts as finally determined:
| | | | | | | | |
| | | Gross
Income | | | Foreign Tax Pass Through | |
Emerging Markets Equity ETF | | $ | 4,101,802 | | | $ | 561,679 | |
Europe Equity ETF | | | 1,221,813 | | | | 236,074 | |
Global Equity ETF | | | 1,573,717 | | | | 184,463 | |
International Equity ETF | | | 16,759,083 | | | | 1,868,665 | |
| | | | | | | | |
| | | |
| OCTOBER 31, 2017 | | JPMORGAN EXCHANGE-TRADED FUNDS | | | | | 133 | |
J.P. Morgan Exchange-Traded Funds are distributed by JPMorgan Distribution Services, Inc, an indirect, wholly-owned subsidiary of JPMorgan Chase & Co.
Contact J.P. Morgan Exchange-Traded Funds at 1-844-457-6383 (844-4JPM ETF) for a fund prospectus. You can also visit us at www.jpmorganfunds.com. Investors should carefully consider the investment objectives and risks as well as charges and expenses of the fund before investing. The prospectus contains this and other information about the fund. Read the prospectus carefully before investing.
Investors may obtain information about the Securities Investor Protection Corporation (SIPC), including the SIPC brochure by visiting www.sipc.org or by calling SIPC at 202-371-8300.
The Fund files a complete schedule of its fund holdings for the first and third quarters of its fiscal year with the SEC on Form N-Q. The Fund’s Forms N-Q is available on the SEC’s website at http://www.sec.gov and may be reviewed and copied at the SEC’s Public Reference Room in Washington, DC. Information on the operation of the SEC’s Public Reference Room may be obtained by calling 1-800-SEC-0330. Shareholders may request the Form N-Q without charge by calling 1-844-457-6383 or by visiting the J.P. Morgan Funds’ website at www.jpmorganfunds.com.
A description of each Fund’s policies and procedures with respect to the disclosure of each Fund’s holdings is available in the prospectus and Statement of Additional Information.
A copy of proxy policies and procedures is available without charge upon request by calling 1-844-457-6383 and on the Fund’s website at www.jpmorganfunds.com. A description of such policies and procedures is on the SEC’s website at www.sec.gov. The Trustees have delegated the authority to vote proxies for securities owned by the Fund to the Adviser. A copy of the Fund’s voting record for the most recent 12-month period ended June 30 is available on the SEC’s website at www.sec.gov or at the Fund’s website at www.jpmorganfunds.com no later than August 31 of each year. The Fund’s proxy voting record will include, among other things, a brief description of the matter voted on for each fund security, and will state how each vote was cast, for example, for or against the proposal.


J.P. Morgan Asset Management is the marketing name for the asset management businesses of JPMorgan Chase & Co. Those businesses include, but are not limited to, J.P. Morgan Investment Management Inc., Security Capital Research & Management Incorporated and J.P. Morgan Alternative Asset Management, Inc.
| | | | |
| | © JPMorgan Chase & Co., 2017. All rights reserved. October 2017. | | AN-ETF-1017 |
Annual Report
JPMorgan Exchange-Traded Funds
October 31, 2017
JPMorgan Diversified Alternatives ETF
CONTENTS
Investments in the Fund are not bank deposits or obligations of, or guaranteed or endorsed by, any bank and are not insured or guaranteed by the FDIC, the Federal Reserve Board or any other government agency. You could lose money if you sell when the Fund’s share price is lower than when you invested.
Past performance is no guarantee of future performance. The general market views expressed in this report are opinions based on market and other conditions through the end of the reporting period and are subject to change without notice. These views are not intended to predict the future performance of the Fund or the securities markets. References to specific securities and their issuers are for illustrative purposes only and are not intended to be, and should not be interpreted as, recommendations to purchase or sell such securities. Such views are not meant as investment advice and may not be relied on as an indication of trading intent on behalf of the Fund.
Prospective investors should refer to the Fund’s prospectus for a discussion of the Fund’s investment objectives, strategies and risks. Call J.P. Morgan Exchange-Traded Funds at (844) 457-6383 for a prospectus containing more complete information about the Fund, including management fees and other expenses. Please read it carefully before investing.
Shares are bought and sold throughout the day on an exchange at market price (not NAV) through a brokerage account, and are not individually redeemed from the Fund. Shares may only be redeemed directly from the Fund by Authorized Participants, in very large creation/redemption units. Brokerage commissions will reduce returns.
PRESIDENT’S LETTER
NOVEMBER 28, 2017 (Unaudited)
Dear Shareholder,
The past year has been a milestone for JPMorgan’s Exchange-Traded Funds. We’ve built out our product lineup to include active fixed income ETFs, innovative strategic beta and institutional-quality alternative strategies. Each of these are designed to provide advisers and investors with additional tools for constructing stronger portfolios. During the year, we more than doubled our ETF assets under management, surpassing $2 billion by the end of August. Further, our Diversified Alternatives ETF (JPHF) earned Best New Alternative ETF and Best New Active ETF at the fourth annual ETF.com awards held March 30, 2017 in New York, N.Y.1
| | |
 | | “During the year, we more than doubled our ETF assets under management, surpassing $2 billion by the end of August.” |
During the past year, global economic growth accelerated and both bond and equity markets generally provided investors with positive returns. With equity markets at record highs and interest rates poised to rise, we believe alternatives offer access to potential gains and diversification – without trading late cycle equity risk for interest rate risk.
Our Diversified Alternatives ETF (JPHF) seeks to achieve its investment objective by allocating assets across multiple investment strategies, such as those utilized by certain hedge funds, in a systematic, low-cost, transparent manner. The Fund seeks to enhance portfolio diversification and risk-adjusted returns by systematically allocating across equity long/short, event-driven, global macro and managed futures based strategies, which are then implemented with equity, fixed-income, currency and commodity securities, depending on the strategy. I am pleased to report that JPHF delivered positive risk adjusted returns and diversification when compared to traditional asset classes for the twelve months ending October 31, 2017.
We are proud to bring J.P. Morgan’s experience and capabilities to the ETF market place. We are committed to building solutions that address your needs and help you build stronger portfolios. Thank you for your belief in our Firm and our process.
Sincerely,

Joanna M. Gallegos
President, J.P. Morgan Exchange-Traded Funds
J.P Morgan Asset Management
1-844-4JPM-ETF or jpmorgan.com/etfs for more information
| 1 | ETF.com Award winners are selected in a three-part process designed to leverage the insights and opinions of leaders throughout the ETF industry. The awards process began with an open nomination period running from Dec. 5, 2016, through Jan. 4, 2017. ETF.com received hundreds of nominations from participants in all corners of the ETF space. Following the open nominations process, the ETF.com Awards Nominating Committee—made up of senior leaders at ETF.com, Inside ETFs and FactSet—voted to select up to five finalists in each category. Votes were tallied on a majority basis. Winners from these finalists were selected by a majority vote of the ETF.com Awards Selection Committee, a group of independent ETF experts. Committee members recused themselves from voting in any category in which they or their firms appeared as finalists. Ties were decided where possible with head-to-head runoff votes. Voting was completed by Jan. 20, 2017, but results were kept secret until their announcement at the ETF.com U.S. Awards Dinner on March 30, 2017 |
| | | | | | | | |
| | | |
| OCTOBER 31, 2017 | | JPMORGAN EXCHANGE-TRADED FUNDS | | | | | 1 | |
JPMorgan Diversified Alternatives ETF
FUND COMMENTARY
TWELVE MONTHS ENDED OCTOBER 31, 2017 (Unaudited)
| | | | |
| REPORTING PERIOD RETURN: | | | |
JPMorgan Diversified Alternatives ETF | | | | |
| Net Asset Value* | | | 3.56% | |
| Market Price** | | | 3.51% | |
| BofA Merrill Lynch 3-Month U.S. Treasury Bill Index | | | 0.72% | |
| |
| Net Assets as of 10/31/2017 | | $ | 153,782,741 | |
INVESTMENT OBJECTIVE***
The JPMorgan Diversified Alternatives ETF (the “Fund”) seeks to provide long-term total return.
INVESTMENT APPROACH
The Fund seeks to achieve its investment objective by allocating assets across a variety of strategies commonly employed by hedge funds, including Equity Long/Short, Event Driven and Global Macro Based strategies. The Fund seeks to achieve the efficiency of rules-based investing with the diversification benefits of alternative strategies without replicating an index.
The Fund uses derivatives, including swaps, futures, options, and forward contracts, in implementing its strategies, and under normal market conditions, the Fund’s managers seek to obtain a significant portion of the Fund’s exposure through the use of derivatives, in addition to its exposure through direct investments. Derivatives, which are instruments that have a value based on another instrument, exchange rate or index, are primarily used as an efficient means of implementing a particular strategy in order to gain exposure to a desired return factor.
HOW DID THE MARKET PERFORM?
Global financial markets overall provided positive returns during the reporting period, with emerging market equities outperforming equities in the U.S. and other developed markets. The world’s leading economies continued to expand through the first ten months of 2017, lifting corporate profits and capital investment, as well as business and consumer sentiment. Low interest rates generally weighed on developed market bond prices, while investors’ search for higher yields helped push prices higher for emerging market bonds.
Synchronized global growth and industrial demand helped to lift commodities prices, particularly for copper and other metals, toward the end of the reporting period. While global oil prices declined in the early part of the reporting period, prices for benchmark Brent crude remained above $50 dollars a barrel through October 2017.
In the U.S., equities prices reached record highs throughout the twelve month reporting period and the Standard & Poor’s 500 Index (the “S&P 500”) hit fresh highs on 11 of the 22 trading days in October 2017.
In Europe, financial markets continued to benefit from global growth, low interest rates and stimulus from the European Central Bank. Demand from China and other emerging market nations helped to lift exports from Germany and other leading European Union (EU) economies. While the U.K.’s impending exit from the EU and a separatist movement in Spain’s Catalan region, remained worrisome for politicians and economists, financial markets appeared to be largely unaffected. Japan’s equities market was a leading performer during the final months of the reporting period amid an improving economy and a snap election that handed Prime Minister Shinzo Abe’s Liberal Democratic Party a parliamentary majority.
In China, government efforts to curb speculation in its financial markets helped to keep market volatility in check, while economic indicators showed continued strong growth. Global economic growth and low interest rates continued to benefit both equities and bonds in emerging market nations.
HOW DID THE FUND PERFORM?
For the twelve months ended October 31, 2017, the Fund posted a positive absolute performance and experienced a deviation of 2.84% relative to its benchmark, the BofA Merrill Lynch 3-Month U.S. Treasury Bill Index (the “Index”).
The Fund’s allocation to equities, which are not held in the Index, was a leading contributor to performance relative to the Index. References to the Index and to other indexes mentioned herein are for informational purposes and are not an indication of how the Fund is managed. The use of the Index does not imply the Fund is being managed like the Index and does not imply low risk or low volatility, but rather is disclosed to allow for comparison of the Fund’s performance to that of a well-known and widely recognized index.
On an absolute basis, the Fund’s allocations to the momentum factor within the Equity Long/Short sub-strategy, which was implemented primarily through the use of equities and total return swaps contracts, were the leading contributors to performance for the reporting period. The Fund’s allocations to relative value fixed income, foreign exchange and commodity-based return factors within the Global Macro Based sub-strategy, which was implemented primarily through the use of fixed-income futures, currency forward contracts and commodities futures, were leading detractors from performance.
| | | | | | |
| | | |
| 2 | | | | JPMORGAN EXCHANGE-TRADED FUNDS | | OCTOBER 31, 2017 |
HOW WAS THE FUND POSITIONED?
At the end of the reporting period, the Fund’s largest allocation was to the Equity Long/Short sub-strategy, while the smallest allocation was to the Event Driven sub-strategy.
| | | | | | |
RISK ALLOCATION AS OF OCTOBER 31, 2017 | |
| Strategy | | | | % of Risk
Allocation**** | |
| Equity Long/Short (1) | | | 51 | % |
| Event Driven (2) | | | 21 | |
| Global Macro (3) | | | 28 | |
| | | | | | | | |
| TOP TEN LONG HOLDINGS OF THE PORTFOLIO (a) | |
| | 1. | | | Rockwell Collins, Inc. | | | 1.2 | % |
| | 2. | | | Monsanto Co. | | | 1.2 | |
| | 3. | | | Calpine Corp. | | | 1.2 | |
| | 4. | | | Akorn, Inc. | | | 1.1 | |
| | 5. | | | Scripps Networks Interactive, Inc., Class A | | | 1.1 | |
| | 6. | | | Brocade Communications Systems, Inc. | | | 1.1 | |
| | 7. | | | Bob Evans Farms, Inc. | | | 0.7 | |
| | 8. | | | Gigamon, Inc. | | | 0.6 | |
| | 9. | | | BroadSoft, Inc. | | | 0.6 | |
| | 10. | | | VWR Corp. | | | 0.5 | |
| | | | | | | | |
| TOP TEN SHORT HOLDINGS OF THE PORTFOLIO (a) | |
| | 1. | | | Lennar Corp., Class A. | | | 0.8 | % |
| | 2. | | | Vistra Energy Corp. | | | 0.7 | |
| | 3. | | | AT&T, Inc. | | | 0.6 | |
| | 4. | | | EQT Corp. | | | 0.6 | |
| | 5. | | | CenturyLink, Inc. | | | 0.5 | |
| | 6. | | | Becton Dickinson and Co. | | | 0.4 | |
| | 7. | | | Liberty Interactive Corp. QVC Group, Class A | | | 0.4 | |
| | 8. | | | HOCHTIEF AG (Germany) | | | 0.6 | |
| | 9. | | | Strayer Education, Inc. | | | 0.2 | |
| | 10. | | | Tabcorp Holdings Ltd. (Australia) | | | 0.2 | |
| * | | The return shown is based on net asset value calculated for shareholder transactions and may differ from the return shown in the financial highlights, which reflects adjustments made to the net asset value in accordance with accounting principles generally accepted in the United States of America. The net asset value was $26.06 as of October 31, 2017. |
| ** | | Market price return is calculated assuming an initial investment made at the inception date net asset value, reinvestment of all dividends and distributions at market price during the period, and sale at the market price on the last day of the period. The price used to calculate the market price return is the midpoint of the bid/ask spread at the close of business on the NYSE Arca. The midpoint price was $26.09 as of October 31, 2017. |
| *** | | The adviser seeks to achieve the Fund’s objective. There can be no guarantee it will be achieved. |
| **** | | Risk allocations are calculated as the standard deviation (volatility of an asset class) divided by the overall volatility of the Fund. Risk, as measured by standard deviation, shows how widely a set of values varies from the mean. It is a historical measure of the volatility of returns earned by the Fund. The percentages above represent the current risk allocation based on the Fund’s holdings as of October 31, 2017 and are not representative of the targeted equal risk allocation across asset classes over the long term. Holdings and allocations may vary over time. |
| (1) | | Equity Long/Short strategies seek to profit by exploiting pricing inefficiencies between related equity securities by maintaining long and short positions. |
| (2) | | Event Driven strategies seek to profit from investing in securities of companies on the basis that a specific event or catalyst will affect future pricing. For example, merger arbitrage strategies seek to capitalize on price discrepancies and returns generated by a corporate transaction. |
| (3) | | Global Macro based strategies aim to exploit macro-economic imbalances across the globe. The macro based strategies may be implemented through a broad range of asset classes including, but not limited to, equities, fixed income, currency and commodities. |
| (a) | | Percentages indicated are based upon total investments plus the current value of the total net long and short positions within each Total Return Basket Swap as of October 31, 2017. The Fund’s portfolio composition is subject to change. |
| | | | | | | | |
| | | |
| OCTOBER 31, 2017 | | JPMORGAN EXCHANGE-TRADED FUNDS | | | | | 3 | |
JPMorgan Diversified Alternatives ETF
FUND COMMENTARY
TWELVE MONTHS ENDED OCTOBER 31, 2017 (Unaudited) (continued)
| | | | | | | | | | | | |
AVERAGE ANNUAL TOTAL RETURNS AS OF OCTOBER 31, 2017 | |
| | | |
| | | INCEPTION DATE | | | 1 YEAR | | | CUMULATIVE
SINCE
INCEPTION | |
JPMorgan Diversified Alternatives ETF | | | | | | | | | | | | |
Net Asset Value | | | September 12, 2016 | | | | 3.56 | % | | | 4.44 | % |
Market Price | | | | | | | 3.51 | % | | | 4.61 | % |
LIFE OF FUND PERFORMANCE (09/12/16 TO 10/31/17)
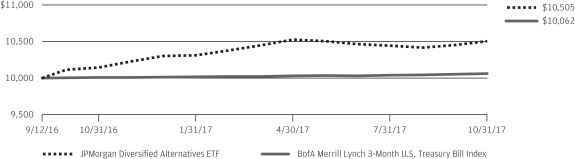
The performance quoted is past performance and is not a guarantee of future results. Exchange-traded funds are subject to certain market risks. Investment returns and principal value of an investment will fluctuate so that an investor’s shares, when sold or redeemed, may be worth more or less than their original cost. Current performance may be higher or lower than the performance data shown. For up-to-date, month-end performance information please call 1-844-457-6383.
Fund commenced operations on September 12, 2016.
The graph illustrates comparative performance for $10,000 invested in shares of the JPMorgan Diversified Alternatives ETF and the BofA Merrill Lynch 3-Month U.S. Treasury Bill Index from September 12, 2016 to October 31, 2017. The performance of the Fund assumes reinvestment of all dividends and capital gain distributions, if any. The performance of the BofA Merrill Lynch 3-Month U.S. Treasury Bill Index does not reflect the deduction of expenses and has been adjusted to reflect reinvestment of all dividends and capital gain distributions of the securities included in the benchmark, if applicable. The BofA Merrill Lynch 3-Month U.S. Treasury Bill Index is comprised of a single issue
purchased at the beginning of the month and held for a full month. Each month the index is rebalanced and the issue selected is the outstanding Treasury Bill that matures closest to, but not beyond, 3 months from the rebalancing date. Investors cannot invest directly in an index. The Fund is not an index fund. The Fund is actively managed and does not seek to replicate the performance of a specified index.
The performance of the Fund reflects the deduction of Fund expenses and assumes reinvestment of all dividends and capital gain distributions, if any. Fund performance reflects the waiver of the Fund’s fees and reimbursement of expenses since the inception date. Without these waivers and reimbursements, performance would have been lower. Also, performance shown in this section does not reflect the deduction of taxes that a shareholder may pay on Fund distributions or redemption or sale of Fund shares.
The returns shown are based on net asset values calculated for shareholder transactions and may differ from the returns shown in the financial highlights, which reflect adjustments made to the net asset values in accordance with accounting principles generally accepted in the United States of America.
| | | | | | |
| | | |
| 4 | | | | JPMORGAN EXCHANGE-TRADED FUNDS | | OCTOBER 31, 2017 |
JPMorgan Diversified Alternatives ETF
CONSOLIDATED SCHEDULE OF PORTFOLIO INVESTMENTS
AS OF OCTOBER 31, 2017
| | | | | | | | |
| SHARES | | | INVESTMENTS | | VALUE($) | |
| | Common Stocks — 44.6% | |
| | | | Aerospace & Defense — 1.4% | |
| | 1,615 | | | L3 Technologies, Inc. | | | 302,296 | |
| | 13,692 | | | Rockwell Collins, Inc. | | | 1,856,635 | |
| | | | | | | | |
| | | | | | | 2,158,931 | |
| | | | | | | | |
| | | | Auto Components — 1.4% | | | | |
| | 5,450 | | | BorgWarner, Inc. | | | 287,324 | |
| | 8,685 | | | Cooper Tire & Rubber Co. | | | 284,868 | |
| | 2,807 | | | Cooper-Standard Holdings, Inc.* | | | 312,924 | |
| | 3,800 | | | Delphi Automotive plc | | | 377,644 | |
| | 13,827 | | | Gentex Corp. | | | 268,382 | |
| | 1,590 | | | Lear Corp. | | | 279,188 | |
| | 6,523 | | | Standard Motor Products, Inc. | | | 284,860 | |
| | | | | | | | |
| | | | | | | 2,095,190 | |
| | | | | | | | |
| | | | Banks — 0.4% | | | | |
| | 5,800 | | | CIT Group, Inc. | | | 270,396 | |
| | 7,056 | | | Sandy Spring Bancorp, Inc. | | | 285,133 | |
| | | | | | | | |
| | | | | | | 555,529 | |
| | | | | | | | |
| | | | Beverages — 0.2% | | | | |
| | 2,459 | | | PepsiCo, Inc. | | | 271,056 | |
| | | | | | | | |
| | | | Biotechnology — 0.1% | | | | |
| | 3,400 | | | Acorda Therapeutics, Inc.* | | | 90,355 | |
| | 59 | | | AquaBounty Technologies, Inc.* | | | 372 | |
| | | | | | | | |
| | | | | | | 90,727 | |
| | | | | | | | |
| | | | Capital Markets — 0.4% | | | | |
| | 17,034 | | | BGC Partners, Inc., Class A | | | 258,406 | |
| | 7,547 | | | Houlihan Lokey, Inc. | | | 314,181 | |
| | | | | | | | |
| | | | | | | 572,587 | |
| | | | | | | | |
| | | | Chemicals — 2.0% | | | | |
| | 13,054 | | | Calgon Carbon Corp. | | | 283,272 | |
| | 3,325 | | | Eastman Chemical Co. | | | 301,943 | |
| | 3,255 | | | LyondellBasell Industries NV, Class A | | | 336,990 | |
| | 14,925 | | | Monsanto Co. | | | 1,807,418 | |
| | 30,500 | | | Platform Speciality Products* | | | 326,350 | |
| | | | | | | | |
| | | | | | | 3,055,973 | |
| | | | | | | | |
| | | | Commercial Services & Supplies — 0.6% | | | | |
| | 8,547 | | | Brady Corp., Class A | | | 325,213 | |
| | 4,035 | | | Deluxe Corp. | | | 281,038 | |
| | 11,989 | | | Quad/Graphics, Inc. | | | 273,229 | |
| | | | | | | | |
| | | | | | | 879,480 | |
| | | | | | | | |
| | | | Communications Equipment — 1.4% | | | | |
| | 138,795 | | | Brocade Communications Systems, Inc. | | | 1,616,962 | |
| | 8,914 | | | Cisco Systems, Inc. | | | 304,413 | |
| | 2,236 | | | F5 Networks, Inc.* | | | 271,160 | |
| | | | | | | | |
| | | | | | | 2,192,535 | |
| | | | | | | | |
| | | | | | | | |
| SHARES | | | INVESTMENTS | | VALUE($) | |
| | | | | | | | |
| | | | Construction & Engineering — 0.2% | | | | |
| | 5,403 | | | Jacobs Engineering Group, Inc. | | | 314,509 | |
| | | | | | | | |
| | | | Consumer Finance — 0.1% | | | | |
| | 16,800 | | | Navient Corp. | | | 209,328 | |
| | | | | | | | |
| | | | Containers & Packaging — 0.2% | | | | |
| | 5,023 | | | Greif, Inc., Class A | | | 278,927 | |
| | | | | | | | |
| | | | Diversified Financial Services — 0.2% | | | | |
| | 6,700 | | | Voya Financial, Inc. | | | 269,072 | |
| | | | | | | | |
| | | | Diversified Telecommunication Services — 0.3% | |
| | 2,657 | | | Straight Path Communications, Inc., Class B* | | | 482,272 | |
| | | | | | | | |
| | | | Electric Utilities — 0.4% | | | | |
| | 3,977 | | | ALLETE, Inc. | | | 311,598 | |
| | 8,732 | | | Hawaiian Electric Industries, Inc. | | | 318,369 | |
| | | | | | | | |
| | | | | | | 629,967 | |
| | | | | | | | |
| | | | Electrical Equipment — 0.4% | | | | |
| | 3,609 | | | Eaton Corp. plc | | | 288,792 | |
| | 3,725 | | | Regal Beloit Corp. | | | 302,284 | |
| | | | | | | | |
| | | | | | | 591,076 | |
| | | | | | | | |
| | | | Electronic Equipment, Instruments & Components — 1.4% | |
| | 7,869 | | | Benchmark Electronics, Inc.* | | | 243,546 | |
| | 8,911 | | | Corning, Inc. | | | 279,003 | |
| | 4,559 | | | Dolby Laboratories, Inc., Class A | | | 264,148 | |
| | 7,043 | | | Methode Electronics, Inc. | | | 330,317 | |
| | 7,610 | | | Sanmina Corp.* | | | 249,037 | |
| | 2,711 | | | Tech Data Corp.* | | | 251,500 | |
| | 17,981 | | | TTM Technologies, Inc.* | | | 283,740 | |
| | 13,398 | | | Vishay Intertechnology, Inc. | | | 298,106 | |
| | | | | | | | |
| | | | | | | 2,199,397 | |
| | | | | | | | |
| | | | Energy Equipment & Services — 1.0% | | | | |
| | 23,518 | | | Archrock, Inc. | | | 282,216 | |
| | 2,600 | | | Basic Energy Services, Inc.* | | | 49,036 | |
| | 5,295 | | | Helmerich & Payne, Inc. | | | 287,571 | |
| | 8,526 | | | National Oilwell Varco, Inc. | | | 291,504 | |
| | 14,242 | | | Patterson-UTI Energy, Inc. | | | 281,707 | |
| | 2,800 | | | Tidewater, Inc.* | | | 76,300 | |
| | 16,149 | | | Unit Corp.* | | | 302,309 | |
| | | | | | | | |
| | | | | | | 1,570,643 | |
| | | | | | | | |
| | | | Food & Staples Retailing — 0.2% | | | | |
| | 3,646 | | | Wal-Mart Stores, Inc. | | | 318,332 | |
| | | | | | | | |
| | | | Food Products — 1.9% | | | | |
| | 12,549 | | | Bob Evans Farms, Inc. | | | 968,657 | |
| | 5,450 | | | Campbell Soup Co. | | | 258,167 | |
| | 8,365 | | | Conagra Brands, Inc. | | | 285,749 | |
SEE NOTES TO CONSOLIDATED FINANCIAL STATEMENTS.
| | | | | | | | |
| | | |
| OCTOBER 31, 2017 | | JPMORGAN EXCHANGE-TRADED FUNDS | | | | | 5 | |
JPMorgan Diversified Alternatives ETF
CONSOLIDATED SCHEDULE OF PORTFOLIO INVESTMENTS
AS OF OCTOBER 31, 2017 (continued)
| | | | | | | | |
| SHARES | | | INVESTMENTS | | VALUE($) | |
| | Common Stocks — continued | |
| | | | Food Products — continued | | | | |
| | 16,331 | | | Flowers Foods, Inc. | | | 310,779 | |
| | 2,366 | | | JM Smucker Co. (The) | | | 250,914 | |
| | 4,191 | | | John B Sanfilippo & Son, Inc. | | | 246,640 | |
| | 199 | | | Lamb Weston Holdings, Inc. | | | 10,147 | |
| | 1,660 | | | Sanderson Farms, Inc. | | | 248,286 | |
| | 4,565 | | | Tyson Foods, Inc., Class A | | | 332,834 | |
| | | | | | | | |
| | | | | | | 2,912,173 | |
| | | | | | | | |
| | | | Gas Utilities — 0.6% | | | | |
| | 5,649 | | | UGI Corp. | | | 270,361 | |
| | 7,346 | | | WGL Holdings, Inc. | | | 629,552 | |
| | | | | | | | |
| | | | | | | 899,913 | |
| | | | | | | | |
| | | | Health Care Equipment & Supplies — 0.8% | | | | |
| | 3,935 | | | Hill-Rom Holdings, Inc. | | | 317,594 | |
| | 6,949 | | | Natus Medical, Inc.* | | | 294,637 | |
| | 21,585 | | | NxStage Medical, Inc.* | | | 581,716 | |
| | | | | | | | |
| | | | | | | 1,193,947 | |
| | | | | | | | |
| | | | Health Care Providers & Services — 1.9% | | | | |
| | 3,432 | | | Aetna, Inc. | | | 583,543 | |
| | 1,413 | | | Chemed Corp. | | | 315,706 | |
| | 8,000 | | | Community Health Systems, Inc.* | | | 47,200 | |
| | 4,577 | | | Express Scripts Holding Co.* | | | 280,524 | |
| | 6,661 | | | HealthSouth Corp. | | | 307,338 | |
| | 10,472 | | | Owens & Minor, Inc. | | | 257,297 | |
| | 10,926 | | | PharMerica Corp.* | | | 320,132 | |
| | 2,647 | | | Quest Diagnostics, Inc. | | | 248,236 | |
| | 1,504 | | | UnitedHealth Group, Inc. | | | 316,171 | |
| | 1,586 | | | WellCare Health Plans, Inc.* | | | 313,616 | |
| | | | | | | | |
| | | | | | | 2,989,763 | |
| | | | | | | | |
| | | | Hotels, Restaurants & Leisure — 1.8% | | | | |
| | 15,100 | | | Bloomin’ Brands, Inc. | | | 268,478 | |
| | 2,600 | | | Buffalo Wild Wings, Inc.* | | | 307,320 | |
| | 1,300 | | | Churchill Downs, Inc. | | | 271,115 | |
| | 3,297 | | | Darden Restaurants, Inc. | | | 271,244 | |
| | 9,900 | | | ILG, Inc. | | | 293,733 | |
| | 18,900 | | | La Quinta Holdings, Inc.* | | | 333,018 | |
| | 4,800 | | | SeaWorld Entertainment, Inc.* | | | 55,104 | |
| | 4,800 | | | Six Flags Entertainment Corp. | | | 301,392 | |
| | 6,242 | | | Wyndham Worldwide Corp. | | | 666,958 | |
| | | | | | | | |
| | | | | | | 2,768,362 | |
| | | | | | | | |
| | | | Household Durables — 0.8% | | | | |
| | 5,000 | | | Garmin Ltd. | | | 283,050 | |
| | 10,192 | | | KB Home | | | 279,566 | |
| | | | | | | | |
| SHARES | | | INVESTMENTS | | VALUE($) | |
| | | | | | | | |
| | | | Household Durables — continued | | | | |
| | 10,000 | | | PulteGroup, Inc. | | | 302,300 | |
| | 12,832 | | | Taylor Morrison Home Corp., Class A* | | | 309,893 | |
| | | | | | | | |
| | | | | | | 1,174,809 | |
| | | | | | | | |
| | | | Household Products — 0.7% | | | | |
| | 8,461 | | | Central Garden & Pet Co.* | | | 323,041 | |
| | 5,270 | | | Church & Dwight Co., Inc. | | | 238,046 | |
| | 3,212 | | | Procter & Gamble Co. (The) | | | 277,324 | |
| | 2,681 | | | Spectrum Brands Holdings, Inc. | | | 294,695 | |
| | | | | | | | |
| | | | | | | 1,133,106 | |
| | | | | | | | |
| | | | Independent Power and Renewable Electricity Producers — 1.5% | | | | |
| | 23,415 | | | AES Corp. | | | 248,901 | |
| | 13,778 | | | Atlantica Yield plc (Spain) | | | 308,352 | |
| | 120,870 | | | Calpine Corp.* | | | 1,805,798 | |
| | | | | | | | |
| | | | | | | 2,363,051 | |
| | | | | | | | |
| | | | Industrial Conglomerates — 0.2% | | | | |
| | 2,500 | | | Honeywell International, Inc. | | | 360,400 | |
| | | | | | | | |
| | | | Insurance — 1.4% | | | | |
| | 3,900 | | | American International Group, Inc. | | | 251,979 | |
| | 5,551 | | | Athene Holding Ltd., Class A* | | | 289,374 | |
| | 1,073 | | | Everest Re Group Ltd. | | | 254,784 | |
| | 5,007 | | | Fidelity & Guaranty Life | | | 155,718 | |
| | 4,263 | | | Principal Financial Group, Inc. | | | 280,719 | |
| | 2,522 | | | Prudential Financial, Inc. | | | 278,580 | |
| | 2,104 | | | Reinsurance Group of America, Inc. | | | 314,295 | |
| | 3,940 | | | State National Cos., Inc. | | | 82,819 | |
| | 5,884 | | | Unum Group | | | 306,203 | |
| | | | | | | | |
| | | | | | | 2,214,471 | |
| | | | | | | | |
| | | | Internet Software & Services — 0.5% | | | | |
| | 301 | | | Alphabet, Inc., Class C* | | | 306,008 | |
| | 15,521 | | | Bankrate, Inc.* | | | 215,742 | |
| | 11,357 | | | Blucora, Inc.* | | | 246,447 | |
| | | | | | | | |
| | | | | | | 768,197 | |
| | | | | | | | |
| | | | IT Services — 1.6% | | | | |
| | 2,220 | | | Accenture plc, Class A | | | 316,039 | |
| | 4,317 | | | Amdocs Ltd. | | | 281,037 | |
| | 600 | | | Automatic Data Processing, Inc. | | | 69,756 | |
| | 11,787 | | | Convergys Corp. | | | 303,279 | |
| | 5,000 | | | DST Systems, Inc. | | | 293,100 | |
| | 3,900 | | | DXC Technology Co. | | | 356,928 | |
| | 16,500 | | | MoneyGram International, Inc.* | | | 256,575 | |
| | 4,037 | | | Science Applications International Corp. | | | 296,074 | |
| | 14,698 | | | Western Union Co. (The) | | | 291,902 | |
| | | | | | | | |
| | | | | | | 2,464,690 | |
| | | | | | | | |
SEE NOTES TO CONSOLIDATED FINANCIAL STATEMENTS.
| | | | | | |
| | | |
| 6 | | | | JPMORGAN EXCHANGE-TRADED FUNDS | | OCTOBER 31, 2017 |
| | | | | | | | |
| SHARES | | | INVESTMENTS | | VALUE($) | |
| | Common Stocks — continued | |
| | | | Life Sciences Tools & Services — 1.3% | |
| | 4,729 | | | Agilent Technologies, Inc. | | | 321,714 | |
| | 4,845 | | | Cambrex Corp.* | | | 209,546 | |
| | 2,858 | | | Charles River Laboratories International, Inc.* | | | 332,357 | |
| | 2,800 | | | Quintiles IMS Holdings, Inc.* | | | 302,680 | |
| | 24,714 | | | VWR Corp.* | | | 818,033 | |
| | | | | | | | |
| | | | | | | 1,984,330 | |
| | | | | | | | |
| | | | Machinery — 1.9% | | | | |
| | 6,800 | | | Allison Transmission Holdings, Inc. | | | 288,932 | |
| | 1,707 | | | Cummins, Inc. | | | 301,934 | |
| | 6,320 | | | Greenbrier Cos., Inc. (The) | | | 329,904 | |
| | 2,021 | | | Illinois Tool Works, Inc. | | | 316,327 | |
| | 2,971 | | | Ingersoll-Rand plc | | | 263,231 | |
| | 5,500 | | | Pentair plc (United Kingdom) | | | 387,530 | |
| | 2,013 | | | Stanley Black & Decker, Inc. | | | 325,200 | |
| | 6,400 | | | Terex Corp. | | | 301,504 | |
| | 5,802 | | | Timken Co. (The) | | | 273,564 | |
| | 2,500 | | | Trinity Industries, Inc. | | | 81,300 | |
| | | | | | | | |
| | | | | | | 2,869,426 | |
| | | | | | | | |
| | | | Media — 2.1% | | | | |
| | 4,100 | | | AMC Networks, Inc., Class A* | | | 208,608 | |
| | 4,333 | | | CBS Corp. (Non-Voting), Class B | | | 243,168 | |
| | 7,203 | | | Comcast Corp., Class A | | | 259,524 | |
| | 13,488 | | | Discovery Communications, Inc., Class C* | | | 240,221 | |
| | 4,667 | | | Meredith Corp. | | | 247,351 | |
| | 3,601 | | | Omnicom Group, Inc. | | | 241,951 | |
| | 19,991 | | | Scripps Networks Interactive, Inc., Class A | | | 1,664,851 | |
| | 1,258 | | | Time Warner, Inc. | | | 123,649 | |
| | | | | | | | |
| | | | | | | 3,229,323 | |
| | | | | | | | |
| | | | Metals & Mining — 0.2% | | | | |
| | 4,700 | | | Nucor Corp. | | | 271,801 | |
| | 18,700 | | | Sandstorm Gold Ltd. (Canada)* | | | 80,592 | |
| | | | | | | | |
| | | | | | | 352,393 | |
| | | | | | | | |
| | | | Multiline Retail — 0.5% | | | | |
| | 5,778 | | | Big Lots, Inc. | | | 296,469 | |
| | 4,300 | | | Dillard’s, Inc., Class A | | | 218,440 | |
| | 5,196 | | | Target Corp. | | | 306,772 | |
| | | | | | | | |
| | | | | | | 821,681 | |
| | | | | | | | |
| | | | Multi-Utilities — 0.7% | | | | |
| | 5,131 | | | Ameren Corp. | | | 318,071 | |
| | 8,779 | | | Avista Corp. | | | 458,615 | |
| | 10,170 | | | CenterPoint Energy, Inc. | | | 300,828 | |
| | | | | | | | |
| | | | | | | 1,077,514 | |
| | | | | | | | |
| | | | | | | | |
| SHARES | | | INVESTMENTS | | VALUE($) | |
| | | | | | | | |
| | | | Oil, Gas & Consumable Fuels — 0.9% | | | | |
| | 2,300 | | | Bonanza Creek Energy, Inc.* | | | 77,809 | |
| | 23,100 | | | CONSOL Energy, Inc.* | | | 372,603 | |
| | 1,300 | | | Energen Corp.* | | | 67,210 | |
| | 8,205 | | | HollyFrontier Corp. | | | 303,175 | |
| | 2,600 | | | Peabody Energy Corp.* | | | 80,314 | |
| | 300 | | | SandRidge Energy, Inc.* | | | 5,631 | |
| | 3,400 | | | Stone Energy Corp.* | | | 100,028 | |
| | 4,183 | | | Valero Energy Corp. | | | 329,997 | |
| | | | | | | | |
| | | | | | | 1,336,767 | |
| | | | | | | | |
| | | | Paper & Forest Products — 0.2% | | | | |
| | 7,485 | | | Schweitzer-Mauduit International, Inc. | | | 316,092 | |
| | | | | | | | |
| | | | Personal Products — 0.2% | | | | |
| | 7,605 | | | Inter Parfums, Inc. | | | 352,112 | |
| | | | | | | | |
| | | | Pharmaceuticals — 2.1% | | | | |
| | 52,136 | | | Akorn, Inc.* | | | 1,698,070 | |
| | 2,171 | | | Johnson & Johnson | | | 302,659 | |
| | 6,300 | | | Mallinckrodt plc* | | | 199,521 | |
| | 4,591 | | | Merck & Co., Inc. | | | 252,918 | |
| | 8,650 | | | Pfizer, Inc. | | | 303,269 | |
| | 1,753 | | | STADA Arzneimittel AG (Germany) | | | 168,566 | |
| | 2,913 | | | Taro Pharmaceutical Industries Ltd.* | | | 327,479 | |
| | | | | | | | |
| | | | | | | 3,252,482 | |
| | | | | | | | |
| | | | Professional Services — 0.4% | | | | |
| | 5,033 | | | ICF International, Inc.* | | | 270,272 | |
| | 2,679 | | | ManpowerGroup, Inc. | | | 330,267 | |
| | | | | | | | |
| | | | | | | 600,539 | |
| | | | | | | | |
| | | | Real Estate Management & Development — 0.0% (a) | |
| | 1,800 | | | CBRE Group, Inc., Class A* | | | 70,776 | |
| | | | | | | | |
| | | | Semiconductors & Semiconductor Equipment — 2.9% | | | | |
| | 3,244 | | | Advanced Energy Industries, Inc.* | | | 274,832 | |
| | 6,171 | | | Applied Materials, Inc. | | | 348,230 | |
| | 5,266 | | | Cirrus Logic, Inc.* | | | 294,896 | |
| | 8,258 | | | Intel Corp. | | | 375,656 | |
| | 2,889 | | | KLA-Tencor Corp. | | | 314,583 | |
| | 12,721 | | | Kulicke & Soffa Industries, Inc. (Singapore)* | | | 288,131 | |
| | 1,741 | | | Lam Research Corp. | | | 363,120 | |
| | 6,417 | | | Maxim Integrated Products, Inc. | | | 337,149 | |
| | 2,965 | | | Microchip Technology, Inc. | | | 281,082 | |
| | 4,945 | | | NXP Semiconductors NV (Netherlands)* | | | 578,812 | |
| | 7,931 | | | Teradyne, Inc. | | | 340,161 | |
| | 3,518 | | | Texas Instruments, Inc. | | | 340,155 | |
| | 11,381 | | | Xperi Corp. | | | 261,763 | |
| | | | | | | | |
| | | | | | | 4,398,570 | |
| | | | | | | | |
SEE NOTES TO CONSOLIDATED FINANCIAL STATEMENTS.
| | | | | | | | |
| | | |
| OCTOBER 31, 2017 | | JPMORGAN EXCHANGE-TRADED FUNDS | | | | | 7 | |
JPMorgan Diversified Alternatives ETF
CONSOLIDATED SCHEDULE OF PORTFOLIO INVESTMENTS
AS OF OCTOBER 31, 2017 (continued)
| | | | | | | | |
| SHARES | | | INVESTMENTS | | VALUE($) | |
| | Common Stocks — continued | |
| | | | Software — 2.2% | | | | |
| | 16,870 | | | BroadSoft, Inc.* | | | 925,319 | |
| | 3,501 | | | Citrix Systems, Inc.* | | | 289,218 | |
| | 24,900 | | | Gigamon, Inc.* | | | 958,650 | |
| | 5,595 | | | Oracle Corp. | | | 284,786 | |
| | 2,200 | | | Progress Software Corp. | | | 93,126 | |
| | 11,579 | | | Silver Spring Networks, Inc.* | | | 186,653 | |
| | 3,748 | | | Synopsys, Inc.* | | | 324,277 | |
| | 2,410 | | | VMware, Inc., Class A* | | | 288,453 | |
| | | | | | | | |
| | | | | | | 3,350,482 | |
| | | | | | | | |
| | | | Specialty Retail — 1.8% | | | | |
| | 6,195 | | | Aaron’s, Inc. | | | 227,976 | |
| | 5,176 | | | Best Buy Co., Inc. | | | 289,753 | |
| | 37,235 | | | Chico’s FAS, Inc. | | | 297,508 | |
| | 2,789 | | | Children’s Place, Inc. (The) | | | 303,443 | |
| | 11,192 | | | Dick’s Sporting Goods, Inc. | | | 273,868 | |
| | 11,400 | | | Michaels Cos., Inc. (The)* | | | 221,388 | |
| | 1,300 | | | O’Reilly Automotive, Inc.* | | | 274,235 | |
| | 34,231 | | | Rent-A-Center, Inc. | | | 340,256 | |
| | 13,700 | | | Sally Beauty Holdings, Inc.* | | | 237,147 | |
| | 4,000 | | | Signet Jewelers Ltd. | | | 262,280 | |
| | | | | | | | |
| | | | | | | 2,727,854 | |
| | | | | | | | |
| | | | Technology Hardware, Storage & Peripherals — 0.4% | |
| | 1,875 | | | Apple, Inc. | | | 316,950 | |
| | 14,751 | | | HP, Inc. | | | 317,884 | |
| | | | | | | | |
| | | | | | | 634,834 | |
| | | | | | | | |
| | | | | | | | |
| SHARES | | | INVESTMENTS | | VALUE($) | |
| | |
| | | | Textiles, Apparel & Luxury Goods — 0.4% | | | | |
| | 1,100 | | | Deckers Outdoor Corp.* | | | 75,064 | |
| | 6,100 | | | Michael Kors Holdings Ltd.* | | | 297,741 | |
| | 2,411 | | | PVH Corp. | | | 305,739 | |
| | | | | | | | |
| | | | | | | 678,544 | |
| | | | | | | | |
| | | | Trading Companies & Distributors — 0.4% | |
| | 5,100 | | | AerCap Holdings NV (Ireland)* | | | 268,464 | |
| | 6,054 | | | Rush Enterprises, Inc., Class A* | | | 307,422 | |
| | | | | | | | |
| | | | | | | 575,886 | |
| | | | | | | | |
| | | | Total Common Stocks
(Cost $65,239,698) | | | 68,608,018 | |
| | | | | | | | |
| | Short-Term Investment — 51.8% | |
| | | | Investment Company — 51.8% | | | | |
| | 79,678,128 | | | JPMorgan U.S. Government Money Market Fund, Institutional Class Shares, 0.92% (b) (c)
(Cost $79,678,128) | | | 79,678,128 | |
| | | | | | | | |
| | | | Total Investments — 96.4%
(Cost $144,917,826) | | | 148,286,146 | |
| | | | Other Assets Less Liabilities — 3.6% | | | 5,496,595 | |
| | | | | | | | |
| | | | NET ASSETS — 100.0% | | $ | 153,782,741 | |
| | | | | | | | |
Percentages indicated are based on net assets.
| | |
| * | | Non-incomeproducing security. |
| (a) | | Representsless than 0.05% of net assets. |
| (b) | | Affiliatedcompany as defined under the Investment Company Act of 1940. |
| (c) | | Therate shown was the current yield as of October 31, 2017. |
| | | | | | | | | | | | | | | | | | | | |
| Futures contracts outstanding as of October 31, 2017: | |
| DESCRIPTION | | NUMBER OF
CONTRACTS | | | EXPIRATION
DATE | | | TRADING
CURRENCY | | | NOTIONAL
AMOUNT | | | VALUE AND
UNREALIZED
APPRECIATION
(DEPRECIATION) | |
Long Contracts | |
CAC 40 10 Euro Index | | | 8 | | | | 11/2017 | | | | EUR | | | $ | 512,698 | | | $ | 10,842 | |
LME Nickel Base Metal | | | 2 | | | | 11/2017 | | | | USD | | | | 147,138 | | | | 6,300 | |
LME Zinc Base Metal | | | 16 | | | | 11/2017 | | | | USD | | | | 1,323,600 | | | | 34,342 | |
100 oz Gold | | | 7 | | | | 12/2017 | | | | USD | | | | 889,350 | | | | (1,899 | ) |
Australia 10 Year Bond | | | 294 | | | | 12/2017 | | | | AUD | | | | 28,993,595 | | | | (161,240 | ) |
Canada 10 Year Bond | | | 42 | | | | 12/2017 | | | | CAD | | | | 4,474,118 | | | | 9,976 | |
Cocoa | | | 3 | | | | 12/2017 | | | | USD | | | | 62,820 | | | | (1,449 | ) |
Copper | | | 7 | | | | 12/2017 | | | | USD | | | | 542,675 | | | | 17,384 | |
Cotton No. 2 | | | 1 | | | | 12/2017 | | | | USD | | | | 34,190 | | | | 777 | |
DAX Index | | | 1 | | | | 12/2017 | | | | EUR | | | | 386,337 | | | | 20,981 | |
EURO STOXX 50 Index | | | 13 | | | | 12/2017 | | | | EUR | | | | 557,615 | | | | 22,311 | |
Euro-Bobl | | | 24 | | | | 12/2017 | | | | EUR | | | | 3,684,094 | | | | 13,505 | |
Euro-Bund | | | 8 | | | | 12/2017 | | | | EUR | | | | 1,516,635 | | | | 8,430 | |
FTSE 100 Index | | | 12 | | | | 12/2017 | | | | GBP | | | | 1,190,527 | | | | 16,763 | |
FTSE/MIB Index | | | 6 | | | | 12/2017 | | | | EUR | | | | 795,299 | | | | 20,808 | |
SEE NOTES TO CONSOLIDATED FINANCIAL STATEMENTS.
| | | | | | |
| | | |
| 8 | | | | JPMORGAN EXCHANGE-TRADED FUNDS | | OCTOBER 31, 2017 |
| | | | | | | | | | | | | | | | | | | | |
| Futures contracts outstanding as of October 31, 2017: | |
| DESCRIPTION | | NUMBER OF
CONTRACTS | | | EXPIRATION
DATE | | | TRADING
CURRENCY | | | NOTIONAL
AMOUNT | | | VALUE AND
UNREALIZED
APPRECIATION
(DEPRECIATION) | |
Lean Hogs | | | 6 | | | | 12/2017 | | | | USD | | | $ | 163,200 | | | $ | 14,022 | |
LME Aluminum Base Metal | | | 18 | | | | 12/2017 | | | | USD | | | | 968,625 | | | | 10,706 | |
LME Nickel Base Metal | | | 4 | | | | 12/2017 | | | | USD | | | | 294,660 | | | | 33,324 | |
LME Zinc Base Metal | | | 24 | | | | 12/2017 | | | | USD | | | | 1,974,000 | | | | 36,058 | |
S&P 500 E-Mini Index | | | 10 | | | | 12/2017 | | | | USD | | | | 1,286,350 | | | | 40,955 | |
SPI 200 Index | | | 3 | | | | 12/2017 | | | | AUD | | | | 338,914 | | | | 11,293 | |
U.S. Treasury 10 Year Note | | | 199 | | | | 12/2017 | | | | USD | | | | 24,856,344 | | | | (308,919 | ) |
U.S. Treasury 5 Year Note | | | 26 | | | | 12/2017 | | | | USD | | | | 3,046,063 | | | | (27,227 | ) |
U.S. Treasury Long Bond | | | 6 | | | | 12/2017 | | | | USD | | | | 914,438 | | | | (12,691 | ) |
Feeder Cattle | | | 21 | | | | 01/2018 | | | | USD | | | | 1,675,538 | | | | 59,351 | |
LME Zinc Base Metal | | | 7 | | | | 01/2018 | | | | USD | | | | 573,300 | | | | 2,954 | |
WTI Crude Oil | | | 5 | | | | 01/2018 | | | | USD | | | | 273,450 | | | | 1,687 | |
Cocoa | | | 15 | | | | 03/2018 | | | | USD | | | | 313,350 | | | | 3,865 | |
Copper | | | 7 | | | | 03/2018 | | | | USD | | | | 546,175 | | | | 25,531 | |
Cotton No. 2 | | | 29 | | | | 03/2018 | | | | USD | | | | 990,930 | | | | (13,209 | ) |
Feeder Cattle | | | 8 | | | | 03/2018 | | | | USD | | | | 624,300 | | | | 5,414 | |
100 oz Gold | | | 4 | | | | 04/2018 | | | | USD | | | | 511,440 | | | | (2,651 | ) |
Sugar No. 11 | | | 30 | | | | 06/2018 | | | | USD | | | | 500,976 | | | | 3,147 | |
| | | | | | | | | | | | | | | | | | | | |
| | | | | | | | | | | | | | | | | | | (98,559 | ) |
| | | | | | | | | | | | | | | | | | | | |
Short Contracts | | | | | | | | | | | | | | | | | | | | |
IBEX 35 Index | | | (1 | ) | | | 11/2017 | | | | EUR | | | | (122,798 | ) | | | (4,350 | ) |
LME Nickel Base Metal | | | (2 | ) | | | 11/2017 | | | | USD | | | | (147,138 | ) | | | (13,716 | ) |
LME Zinc Base Metal | | | (16 | ) | | | 11/2017 | | | | USD | | | | (1,323,600 | ) | | | (7,048 | ) |
Natural Gas | | | (10 | ) | | | 11/2017 | | | | USD | | | | (289,600 | ) | | | 26,803 | |
Australia 10 Year Bond | | | (8 | ) | | | 12/2017 | | | | AUD | | | | (788,941 | ) | | | (8,665 | ) |
Australia 3 Year Bond | | | (45 | ) | | | 12/2017 | | | | AUD | | | | (3,843,276 | ) | | | (2,677 | ) |
Coffee ‘C’ | | | (8 | ) | | | 12/2017 | | | | USD | | | | (375,300 | ) | | | 49,270 | |
Corn | | | (26 | ) | | | 12/2017 | | | | USD | | | | (449,475 | ) | | | 51,648 | |
Euro-Bund | | | (114 | ) | | | 12/2017 | | | | EUR | | | | (21,612,044 | ) | | | (74,065 | ) |
Euro-Buxl | | | (4 | ) | | | 12/2017 | | | | EUR | | | | (774,020 | ) | | | 4,216 | |
Japan 10 Year Bond Mini | | | (182 | ) | | | 12/2017 | | | | JPY | | | | (24,087,929 | ) | | | 82,734 | |
Live Cattle | | | (10 | ) | | | 12/2017 | | | | USD | | | | (502,500 | ) | | | (39,690 | ) |
LME Aluminum Base Metal | | | (6 | ) | | | 12/2017 | | | | USD | | | | (322,875 | ) | | | (3,112 | ) |
LME Zinc Base Metal | | | (2 | ) | | | 12/2017 | | | | USD | | | | (164,500 | ) | | | (7,481 | ) |
Long Gilt | | | (46 | ) | | | 12/2017 | | | | GBP | | | | (7,595,929 | ) | | | 106,797 | |
Natural Gas | | | (37 | ) | | | 12/2017 | | | | USD | | | | (1,119,620 | ) | | | 49,562 | |
S&P 500 E-Mini Index | | | (71 | ) | | | 12/2017 | | | | USD | | | | (9,133,085 | ) | | | (279,385 | ) |
Silver | | | (1 | ) | | | 12/2017 | | | | USD | | | | (83,465 | ) | | | 1,232 | |
Wheat | | | (13 | ) | | | 12/2017 | | | | USD | | | | (272,025 | ) | | | 37,449 | |
Natural Gas | | | (15 | ) | | | 01/2018 | | | | USD | | | | (454,500 | ) | | | 10,740 | |
Soybean | | | (5 | ) | | | 01/2018 | | | | USD | | | | (246,188 | ) | | | 785 | |
Lean Hogs | | | (16 | ) | | | 02/2018 | | | | USD | | | | (467,200 | ) | | | (56,973 | ) |
Live Cattle | | | (13 | ) | | | 02/2018 | | | | USD | | | | (673,660 | ) | | | (64,538 | ) |
Sugar No. 11 | | | (14 | ) | | | 02/2018 | | | | USD | | | | (231,123 | ) | | | (4,668 | ) |
Coffee ‘C’ | | | (10 | ) | | | 03/2018 | | | | USD | | | | (482,250 | ) | | | 40,939 | |
Corn | | | (31 | ) | | | 03/2018 | | | | USD | | | | (557,225 | ) | | | 3,746 | |
Wheat | | | (40 | ) | | | 03/2018 | | | | USD | | | | (872,000 | ) | | | 9,095 | |
Lean Hogs | | | (10 | ) | | | 04/2018 | | | | USD | | | | (299,600 | ) | | | (839 | ) |
Sugar No. 11 | | | (29 | ) | | | 04/2018 | | | | USD | | | | (481,354 | ) | | | (12,105 | ) |
Corn | | | (20 | ) | | | 05/2018 | | | | USD | | | | (368,250 | ) | | | 2,141 | |
Wheat | | | (26 | ) | | | 05/2018 | | | | USD | | | | (584,025 | ) | | | 36,348 | |
| | | | | | | | | | | | | | | | | | | | |
| | | | | | | | | | | | | | | | | | | (65,807 | ) |
| | | | | | | | | | | | | | | | | | | | |
| | | | | | | | | | | | | | | | | | | (164,366 | ) |
| | | | | | | | | | | | | | | | | | | | |
SEE NOTES TO CONSOLIDATED FINANCIAL STATEMENTS.
| | | | | | | | |
| | | |
| OCTOBER 31, 2017 | | JPMORGAN EXCHANGE-TRADED FUNDS | | | | | 9 | |
JPMorgan Diversified Alternatives ETF
CONSOLIDATED SCHEDULE OF PORTFOLIO INVESTMENTS
AS OF OCTOBER 31, 2017 (continued)
| | |
| Abbreviations |
| AUD | | AustralianDollar |
| CAC | | ContinuousAssisted Quotation |
| CAD | | CanadianDollar |
| DAX | | DeutscherAktien Index |
| EUR | | Euro |
| FTSE | | FinancialTimes and the London Stock Exchange |
| GBP | | BritishPound |
| IBEX | | MadridStock Exchange |
| JPY | | JapaneseYen |
| LME | | LondonMetal Exchange |
| SPI | | AustralianSecurities Exchange |
| USD | | UnitedStates Dollar |
| WTI | | WestTexas Intermediate |
| | | | | | | | | | | | | | | | | | | | |
| Forward foreign currency exchange contracts outstanding as of October 31, 2017: | |
| CURRENCY PURCHASED | | | CURRENCY SOLD | | | COUNTERPARTY | | SETTLEMENT
DATE | | | UNREALIZED
APPRECIATION
(DEPRECIATION) | |
| INR | | | 89,205,656 | | | USD | | | 1,369,109 | | | Goldman Sachs International** | | | 11/22/2017 | | | $ | 6,837 | |
| NOK | | | 2,522,438 | | | USD | | | 308,842 | | | Royal Bank Of Canada | | | 11/22/2017 | | | | 126 | |
| USD | | | 821,017 | | | AUD | | | 1,045,491 | | | HSBC Bank, NA | | | 11/22/2017 | | | | 21,021 | |
| USD | | | 1,962 | | | BRL | | | 6,265 | | | Merrill Lynch International** | | | 11/22/2017 | | | | 52 | |
| USD | | | 5,228,314 | | | CHF | | | 5,096,158 | | | TD Bank Financial Group | | | 11/22/2017 | | | | 113,351 | |
| USD | | | 574,911 | | | EUR | | | 488,758 | | | Royal Bank Of Canada | | | 11/22/2017 | | | | 4,959 | |
| USD | | | 1,370,295 | | | HUF | | | 357,572,267 | | | HSBC Bank, NA | | | 11/22/2017 | | | | 31,533 | |
| USD | | | 350 | | | ILS | | | 1,229 | | | Royal Bank Of Canada | | | 11/22/2017 | | | | 1 | |
| USD | | | 2,023,974 | | | JPY | | | 226,656,771 | | | Barclays Bank plc | | | 11/22/2017 | | | | 28,878 | |
| USD | | | 2,194,086 | | | NZD | | | 3,053,635 | | | HSBC Bank, NA | | | 11/22/2017 | | | | 105,300 | |
| USD | | | 1,377,464 | | | PLN | | | 4,956,277 | | | HSBC Bank, NA | | | 11/22/2017 | | | | 15,888 | |
| USD | | | 1,363,203 | | | RON | | | 5,306,490 | | | Barclays Bank plc | | | 11/22/2017 | | | | 20,571 | |
| | | | | | | | | | | | | | | | | | | | |
Total unrealized appreciation | | | | 348,517 | |
| | | | | | | | | | | | | | | | | | | | |
| CAD | | | 6,136,623 | | | USD | | | 4,895,309 | | | HSBC Bank, NA | | | 11/22/2017 | | | | (137,811 | ) |
| EUR | | | 488,758 | | | USD | | | 575,618 | | | Goldman Sachs International | | | 11/22/2017 | | | | (5,666 | ) |
| EUR | | | 189,249 | | | USD | | | 223,035 | | | HSBC Bank, NA | | | 11/22/2017 | | | | (2,348 | ) |
| MXN | | | 24,685,353 | | | USD | | | 1,289,383 | | | Deutsche Bank AG, New York | | | 11/22/2017 | | | | (6,473 | ) |
| NOK | | | 40,387,641 | | | USD | | | 5,097,313 | | | Barclays Bank plc | | | 11/22/2017 | | | | (150,318 | ) |
| RUB | | | 78,277,248 | | | USD | | | 1,356,152 | | | Goldman Sachs International** | | | 11/22/2017 | | | | (20,283 | ) |
| SEK | | | 13,260,387 | | | USD | | | 1,632,504 | | | Barclays Bank plc | | | 11/22/2017 | | | | (46,766 | ) |
| TRY | | | 4,838,302 | | | USD | | | 1,309,420 | | | HSBC Bank, NA | | | 11/22/2017 | | | | (41,477 | ) |
| USD | | | 322,581 | | | CHF | | | 323,046 | | | Goldman Sachs International | | | 11/22/2017 | | | | (1,657 | ) |
| USD | | | 1,918,072 | | | GBP | | | 1,445,233 | | | HSBC Bank, NA | | | 11/22/2017 | | | | (2,524 | ) |
| USD | | | 1,374,520 | | | KRW | | | 1,555,338,363 | | | Goldman Sachs International** | | | 11/22/2017 | | | | (16,666 | ) |
| USD | | | 1,366,281 | | | TWD | | | 41,200,329 | | | Merrill Lynch International** | | | 11/22/2017 | | | | (2,584 | ) |
| ZAR | | | 18,375,583 | | | USD | | | 1,367,269 | | | HSBC Bank, NA | | | 11/22/2017 | | | | (72,380 | ) |
| | | | | | | | | | | | | | | | | | | | |
Total unrealized depreciation | | | | (506,953 | ) |
| | | | | | | | | | | | | | | | | | | | |
Net unrealized depreciation | | | | (158,436 | ) |
| | | | | | | | | | | | | | | | | | | | |
| | |
| ** | | — Non-deliverable forward. |
SEE NOTES TO CONSOLIDATED FINANCIAL STATEMENTS.
| | | | | | |
| | | |
| 10 | | | | JPMORGAN EXCHANGE-TRADED FUNDS | | OCTOBER 31, 2017 |
| | |
| Abbreviations |
| AUD | | AustralianDollar |
| BRL | | BrazilianReal |
| CAD | | CanadianDollar |
| EUR | | Euro |
| GBP | | BritishPound |
| HUF | | HungaryForint |
| ILS | | IsraeliShekel |
| INR | | IndianRupee |
| JPY | | JapaneseYen |
| KRW | | KoreanRepublic Won |
| MXN | | MexicanPeso |
| NOK | | NorwegianKrone |
| NZD | | NewZealand Dollar |
| PLN | | PolishZloty |
| RON | | RomaniaNew Leu |
| RUB | | RussiaRuble |
| SEK | | SwedishKrona |
| TRY | | TurkeyLira |
| TWD | | TaiwanNew Dollar |
| USD | | UnitedStates Dollar |
| ZAR | | SouthAfrica Rand |
| | | | | | | | | | | | | | | | | | | | | | | | | | | | |
| Over the Counter (“OTC”) Total Return Swap contracts outstanding as of October 31, 2017: | |
| REFERENCE ENTITY | | PAYMENTS MADE BY FUND | | PAYMENTS
RECEIVED BY FUND | | FREQUENCY
OF
PAYMENTS
MADE/
RECEIVED | | | COUNTERPARTY | | | MATURITY
DATE | | | NOTIONAL
AMOUNT | | | UPFRONT
PAYMENTS
(RECEIPTS) | | | VALUE AND
UNREALIZED
APPRECIATION
(DEPRECIATION) | |
Media Gen, Inc., CVR | | Total appreciation/depreciation of the position at maturity | | Total appreciation/depreciation of the position at maturity | |
| At
Termination |
| |
| Bank of
America |
| | | 10/18/2018 | | | | USD 1,329 | | | $ | — | | | $ | 65 | ‡ |
| | | | | | | | | | | | | | | | | | | | | | | | | | | | |
| | | | | | | | | | | | | | | | | | | | | | | — | | | | 65 | |
| | | | | | | | | | | | | | | | | | | | | | | | | | | | |
| | |
| ‡ | | — Value determined using significant unobservable inputs. |
SEE NOTES TO CONSOLIDATED FINANCIAL STATEMENTS.
| | | | | | | | |
| | | |
| OCTOBER 31, 2017 | | JPMORGAN EXCHANGE-TRADED FUNDS | | | | | 11 | |
JPMorgan Diversified Alternatives ETF
ADDITIONAL INFORMATION-TOTAL RETURN BASKET SWAPS
AS OF OCTOBER 31, 2017
| | | | | | | | | | | | | | | | | | | | | | |
| Total Return Basket Swaps Outstanding at October 31, 2017 | | | | | | | |
| COUNTERPARTY | | DESCRIPTION | | TERMINATION
DATE | | | NOTIONAL
VALUE (1) | | | NET UNREALIZED
APPRECIATION
(DEPRECIATION) (2) | | | NET CASH
AND OTHER
RECEIVABLES
(PAYABLES) | | | VALUE (Note 2C (3)) | |
| Bank of America | | The Fund receives the total return on a portfolio of long and short equity positions and pays or receives the net of one month LIBOR on long positions and short positions respectively, which is denominated in GBP based on the local currencies of the positions within the swaps. | | | 03/29/2019 | | | $ | (5,459,101 | ) | | $ | 696 | | | $ | — | | | $ | 696 | |
| | | | | | | | | | | | | | | | | | | | | | |
| | | | | | | | | | | | | | | | |
| | | | |
| REFERENCE ENTITY | | SHARES | | | NOTIONAL
VALUE($) (1) | | | UNREALIZED
APPRECIATION
(DEPRECIATION)($) (2) | | | PERCENTAGE
OF NET ASSETS (%) | |
Long Positions | | | | | | | | | | | | | | | | |
| | | | |
Common Stocks | | | | | | | | | | | | | | | | |
Capital Markets | | | | | | | | | | | | | | | | |
3i Group plc | | | 2,539 | | | | 32,403 | | | | (3 | ) | | | 0.0 | (a) |
| | | | | | | | | | | | | | | | |
Energy Equipment & Services | | | | | | | | | | | | | | | | |
Petrofac Ltd. | | | 1,945 | | | | 10,836 | | | | 4 | | | | 0.0 | (a) |
| | | | | | | | | | | | | | | | |
Food & Staples Retailing | | | | | | | | | | | | | | | | |
Wm Morrison Supermarkets plc | | | 8,155 | | | | 24,283 | | | | — | | | | 0.0 | |
| | | | | | | | | | | | | | | | |
Hotels, Restaurants & Leisure | | | | | | | | | | | | | | | | |
Carnival plc | | | 453 | | | | 29,865 | | | | 18 | | | | 0.0 | (a) |
William Hill plc | | | 5,283 | | | | 18,129 | | | | (2 | ) | | | 0.0 | (a) |
| | | | | | | | | | | | | | | | |
| | | 5,736 | | | | 47,994 | | | | 16 | | | | 0.0 | (a) |
| | | | | | | | | | | | | | | | |
Metals & Mining | | | | | | | | | | | | | | | | |
Rio Tinto plc | | | 694 | | | | 32,799 | | | | 91 | | | | 0.0 | (a) |
| | | | | | | | | | | | | | | | |
Multi-Utilities | | | | | | | | | | | | | | | | |
Centrica plc | | | 6,876 | | | | 15,507 | | | | — | | | | 0.0 | |
| | | | | | | | | | | | | | | | |
Total Long Positions of Total Return Basket Swaps | | | 25,945 | | | | 163,822 | | | | 108 | | | | 0.0 | (a) |
| | | | | | | | | | | | | | | | |
| | | | |
Short Positions | | | | | | | | | | | | | | | | |
| | | | |
Common Stocks | | | | | | | | | | | | | | | | |
Aerospace & Defense | | | | | | | | | | | | | | | | |
Cobham plc* | | | (124,361 | ) | | | (229,586 | ) | | | — | | | | 0.0 | |
| | | | | | | | | | | | | | | | |
Banks | | | | | | | | | | | | | | | | |
Barclays plc | | | (99,497 | ) | | | (245,530 | ) | | | 197 | | | | 0.0 | (a) |
Standard Chartered plc* | | | (25,214 | ) | | | (251,128 | ) | | | 165 | | | | 0.0 | (a) |
| | | | | | | | | | | | | | | | |
| | | (124,711 | ) | | | (496,658 | ) | | | 362 | | | | 0.0 | (a) |
| | | | | | | | | | | | | | | | |
Capital Markets | | | | | | | | | | | | | | | | |
Hargreaves Lansdown plc | | | (13,207 | ) | | | (277,429 | ) | | | 67 | | | | 0.0 | (a) |
St James’s Place plc | | | (15,272 | ) | | | (238,700 | ) | | | 37 | | | | 0.0 | (a) |
| | | | | | | | | | | | | | | | |
| | | (28,479 | ) | | | (516,129 | ) | | | 104 | | | | 0.0 | (a) |
| | | | | | | | | | | | | | | | |
Chemicals | | | | | | | | | | | | | | | | |
Johnson Matthey plc | | | (5,188 | ) | | | (232,919 | ) | | | 47 | | | | 0.0 | (a) |
| | | | | | | | | | | | | | | | |
SEE NOTES TO CONSOLIDATED FINANCIAL STATEMENTS.
| | | | | | |
| | | |
| 12 | | | | JPMORGAN EXCHANGE-TRADED FUNDS | | OCTOBER 31, 2017 |
| | | | | | | | | | | | | | | | |
| | | | |
| REFERENCE ENTITY | | SHARES | | | NOTIONAL
VALUE($) (1) | | | UNREALIZED
APPRECIATION
(DEPRECIATION)($) (2) | | | PERCENTAGE
OF NET ASSETS (%) | |
Short Positions — continued | | | | | | | | | | | | | | | | |
| | | | |
Common Stocks — continued | | | | | | | | | | | | | | | | |
Construction & Engineering | | | | | | | | | | | | | | | | |
Balfour Beatty plc | | | (70,966 | ) | | | (258,166 | ) | | | 88 | | | | 0.0 | (a) |
| | | | | | | | | | | | | | | | |
Diversified Consumer Services | | | | | | | | | | | | | | | | |
Dignity plc | | | (7,742 | ) | | | (249,146 | ) | | | — | | | | 0.0 | |
| | | | | | | | | | | | | | | | |
Food Products | | | | | | | | | | | | | | | | |
Associated British Foods plc | | | (5,363 | ) | | | (237,362 | ) | | | (28 | ) | | | 0.0 | (a) |
| | | | | | | | | | | | | | | | |
Hotels, Restaurants & Leisure | | | | | | | | | | | | | | | | |
Compass Group plc | | | (11,088 | ) | | | (243,430 | ) | | | — | | | | 0.0 | |
Domino’s Pizza Group plc | | | (52,213 | ) | | | (232,774 | ) | | | 23 | | | | 0.0 | (a) |
GVC Holdings plc | | | (22,067 | ) | | | (274,769 | ) | | | (3 | ) | | | 0.0 | (a) |
InterContinental Hotels Group plc | | | (5,031 | ) | | | (278,724 | ) | | | 46 | | | | 0.0 | (a) |
Merlin Entertainments plc (b) | | | (39,519 | ) | | | (198,792 | ) | | | 29 | | | | 0.0 | (a) |
Whitbread plc | | | (4,431 | ) | | | (217,325 | ) | | | 9 | | | | 0.0 | (a) |
| | | | | | | | | | | | | | | | |
| | | (134,349 | ) | | | (1,445,814 | ) | | | 104 | | | | 0.0 | (a) |
| | | | | | | | | | | | | | | | |
Industrial Conglomerates | | | | | | | | | | | | | | | | |
DCC plc | | | (2,632 | ) | | | (249,601 | ) | | | (9 | ) | | | 0.0 | (a) |
| | | | | | | | | | | | | | | | |
IT Services | | | | | | | | | | | | | | | | |
NCC Group plc | | | (11,111 | ) | | | (33,941 | ) | | | — | | | | 0.0 | |
| | | | | | | | | | | | | | | | |
Metals & Mining | | | | | | | | | | | | | | | | |
Fresnillo plc | | | (12,264 | ) | | | (212,097 | ) | | | (22 | ) | | | 0.0 | (a) |
Petra Diamonds Ltd.* | | | (249,890 | ) | | | (255,556 | ) | | | — | | | | 0.0 | |
| | | | | | | | | | | | | | | | |
| | | (262,154 | ) | | | (467,653 | ) | | | (22 | ) | | | 0.0 | (a) |
| | | | | | | | | | | | | | | | |
Multiline Retail | | | | | | | | | | | | | | | | |
B&M European Value Retail SA | | | (24,734 | ) | | | (130,511 | ) | | | 4 | | | | 0.0 | (a) |
| | | | | | | | | | | | | | | | |
Oil, Gas & Consumable Fuels | | | | | | | | | | | | | | | | |
Cairn Energy plc* | | | (106,979 | ) | | | (300,416 | ) | | | (50 | ) | | | 0.0 | (a) |
| | | | | | | | | | | | | | | | |
Software | | | | | | | | | | | | | | | | |
Sophos Group plc (b) | | | (33,791 | ) | | | (278,645 | ) | | | 57 | | | | 0.0 | (a) |
| | | | | | | | | | | | | | | | |
Trading Companies & Distributors | | | | | | | | | | | | | | | | |
Bunzl plc | | | (8,342 | ) | | | (259,858 | ) | | | (45 | ) | | | 0.0 | (a) |
| | | | | | | | | | | | | | | | |
Water Utilities | | | | | | | | | | | | | | | | |
Pennon Group plc | | | (22,426 | ) | | | (236,518 | ) | | | (24 | ) | | | 0.0 | (a) |
| | | | | | | | | | | | | | | | |
Total Short Positions of Total Return Basket Swaps | | | (973,328 | ) | | | (5,622,923 | ) | | | 588 | | | | 0.0 | (a) |
| | | | | | | | | | | | | | | | |
Total of Long and Short Positions of Total Return Basket Swaps | | | (947,383 | ) | | | (5,459,101 | ) | | | 696 | | | | 0.0 | (a) |
| | | | | | | | | | | | | | | | |
| | | | | | | | | | | | | | | | | | | | | | |
| COUNTERPARTY | | DESCRIPTION | | TERMINATION
DATE | | | NOTIONAL
VALUE | | | NET
UNREALIZED
APPRECIATION
(DEPRECIATION) | | | NET CASH
AND OTHER
RECEIVABLES
(PAYABLES) | | | VALUE (Note 2C (3)) | |
| Bank of America | | The Fund receives the total return on a portfolio of long and short equity positions and pays or receives the net of one month BA on long positions and short positions respectively, which is denominated in CAD based on the local currencies of the positions within the swaps. | | | 10/15/2018 | | | $ | (2,658,343 | ) | | $ | — | | | $ | — | | | $ | — | |
| | | | | | | | | | | | | | | | | | | | | | |
SEE NOTES TO CONSOLIDATED FINANCIAL STATEMENTS.
| | | | | | | | |
| | | |
| OCTOBER 31, 2017 | | JPMORGAN EXCHANGE-TRADED FUNDS | | | | | 13 | |
JPMorgan Diversified Alternatives ETF
ADDITIONAL INFORMATION-TOTAL RETURN BASKET SWAPS
AS OF OCTOBER 31, 2017 (continued)
| | | | | | | | | | | | | | | | |
| REFERENCE ENTITY | | SHARES | | | NOTIONAL VALUE($) (1) | | | UNREALIZED APPRECIATION (DEPRECIATION)($) (2) | | | PERCENTAGE
OF NET ASSETS (%) | |
Long Positions | | | | | | | | | | | | | | | | |
| | | | |
Common Stocks | | | | | | | | | | | | | | | | |
Banks | | | | | | | | | | | | | | | | |
Laurentian Bank of Canada | | | 880 | | | | 40,927 | | | | — | | | | 0.0 | |
| | | | | | | | | | | | | | | | |
Oil, Gas & Consumable Fuels | | | | | | | | | | | | | | | | |
Bonavista Energy Corp. | | | 9,860 | | | | 20,941 | | | | — | | | | 0.0 | |
| | | | | | | | | | | | | | | | |
Trading Companies & Distributors | | | | | | | | | | | | | | | | |
Toromont Industries Ltd. | | | 3,209 | | | | 141,459 | | | | — | | | �� | 0.0 | |
| | | | | | | | | | | | | | | | |
Total Long Positions of Total Return Basket Swaps | | | 13,949 | | | | 203,327 | | | | — | | | | 0.0 | |
| | | | | | | | | | | | | | | | |
| | | | |
Short Positions | | | | | | | | | | | | | | | | |
| | | | |
Common Stocks | | | | | | | | | | | | | | | | |
Aerospace & Defense | | | | | | | | | | | | | | | | |
Bombardier, Inc.* | | | (93,153 | ) | | | (197,122 | ) | | | — | | | | 0.0 | |
| | | | | | | | | | | | | | | | |
Chemicals | | | | | | | | | | | | | | | | |
Potash Corp. of Saskatchewan, Inc. | | | (13,523 | ) | | | (263,206 | ) | | | — | | | | 0.0 | |
| | | | | | | | | | | | | | | | |
Diversified Financial Services | | | | | | | | | |
Element Fleet Management Corp. | | | (34,219 | ) | | | (263,652 | ) | | | — | | | | 0.0 | |
| | | | | | | | | | | | | | | | |
Energy Equipment & Services | | | | | | | | | | | | | | | | |
Precision Drilling Corp.* | | | (88,090 | ) | | | (264,250 | ) | | | — | | | | 0.0 | |
| | | | | | | | | | | | | | | | |
Independent Power and Renewable Electricity Producers | | | | | | | | | | | | | | | | |
Northland Power, Inc. | | | (12,708 | ) | | | (243,009 | ) | | | — | | | | 0.0 | |
| | | | | | | | | | | | | | | | |
Metals & Mining | | | | | | | | | | | | | | | | |
Alamos Gold, Inc. | | | (37,201 | ) | | | (235,588 | ) | | | — | | | | 0.0 | |
First Majestic Silver Corp.* | | | (35,934 | ) | | | (242,048 | ) | | | — | | | | 0.0 | |
Franco-Nevada Corp. | | | (2,971 | ) | | | (236,096 | ) | | | — | | | | 0.0 | |
Goldcorp, Inc. | | | (19,103 | ) | | | (249,504 | ) | | | — | | | | 0.0 | |
MAG Silver Corp.* | | | (23,000 | ) | | | (245,136 | ) | | | — | | | | 0.0 | |
| | | | | | | | | | | | | | | | |
| | | (118,209 | ) | | | (1,208,372 | ) | | | — | | | | 0.0 | |
| | | | | | | | | | | | | | | | |
Oil, Gas & Consumable Fuels | | | | | | | | | | | | | | | | |
MEG Energy Corp.* | | | (43,903 | ) | �� | | (194,996 | ) | | | — | | | | 0.0 | |
| | | | | | | | | | | | | | | | |
Technology Hardware, Storage & Peripherals | | | | | | | | | | | | | | | | |
BlackBerry Ltd.* | | | (20,746 | ) | | | (227,063 | ) | | | — | | | | 0.0 | |
| | | | | | | | | | | | | | | | |
Total Short Positions of Total Return Basket Swaps | | | (424,551 | ) | | | (2,861,670 | ) | | | — | | | | 0.0 | |
| | | | | | | | | | | | | | | | |
Total of Long and Short Positions of Total Return Basket Swaps | | | (410,602 | ) | | | (2,658,343 | ) | | | — | | | | 0.0 | |
| | | | | | | | | | | | | | | | |
| | | | | | | | | | | | | | | | | | | | | | |
| COUNTERPARTY | | DESCRIPTION | | TERMINATION
DATE | | | NOTIONAL
VALUE (1) | | | NET UNREALIZED
APPRECIATION
(DEPRECIATION) (2) | | | NET CASH
AND OTHER
RECEIVABLES
(PAYABLES) | | | VALUE (Note 2C(3)) | |
| Bank of America | | The Fund receives the total return on a portfolio of short equity positions and pays or receives the net of one month LIBOR on short positions, which is denominated in USD based on the local currencies of the positions within the swaps. | | | 10/18/2018 | | | $ | (25,193,920 | ) | | $ | — | | | $ | — | | | $ | — | |
| | | | | | | | | | | | | | | | | | | | | | |
SEE NOTES TO CONSOLIDATED FINANCIAL STATEMENTS.
| | | | | | |
| | | |
| 14 | | | | JPMORGAN EXCHANGE-TRADED FUNDS | | OCTOBER 31, 2017 |
| | | | | | | | | | | | | | | | |
| REFERENCE ENTITY | | SHARES | | | NOTIONAL VALUE($) (1) | | | UNREALIZED APPRECIATION (DEPRECIATION)($) (2) | | | PERCENTAGE OF NET ASSETS (%) | |
Short Positions | | | | | | | | | | | | | | | | |
| | | | |
Common Stocks | | | | | | | | | | | | | | | | |
Aerospace & Defense | | | | | | | | | | | | | | | | |
Aerovironment, Inc.* | | | (5,213 | ) | | | (266,697 | ) | | | — | | | | 0.0 | |
TransDigm Group, Inc. | | | (1,053 | ) | | | (292,208 | ) | | | — | | | | 0.0 | |
| | | | | | | | | | | | | | | | |
| | | (6,266 | ) | | | (558,905 | ) | | | — | | | | 0.0 | |
| | | | | | | | | | | | | | | | |
Air Freight & Logistics | | | | | | | | | | | | | | | | |
Hub Group, Inc.* | | | (6,399 | ) | | | (277,077 | ) | | | — | | | | 0.0 | |
| | | | | | | | | | | | | | | | |
Airlines | | | | | | | | | | | | | | | | |
Spirit Airlines, Inc.* | | | (7,044 | ) | | | (261,262 | ) | | | — | | | | 0.0 | |
| | | | | | | | | | | | | | | | |
Banks | | | | | | | | | | | | | | | | |
Signature Bank* | | | (2,225 | ) | | | (289,272 | ) | | | — | | | | 0.0 | |
| | | | | | | | | | | | | | | | |
Building Products | | | | | | | | | | | | | | | | |
Armstrong World Industries, Inc.* | | | (4,426 | ) | | | (226,169 | ) | | | — | | | | 0.0 | |
| | | | | | | | | | | | | | | | |
Capital Markets | | | | | | | | | | | | | | | | |
Charles Schwab Corp. (The) | | | (5,293 | ) | | | (237,338 | ) | | | — | | | | 0.0 | |
Interactive Brokers Group, Inc. | | | (5,003 | ) | | | (270,262 | ) | | | — | | | | 0.0 | |
TD Ameritrade Holding Corp. | | | (5,586 | ) | | | (279,244 | ) | | | — | | | | 0.0 | |
| | | | | | | | | | | | | | | | |
| | | (15,882 | ) | | | (786,844 | ) | | | — | | | | 0.0 | |
| | | | | | | | | | | | | | | | |
Chemicals | | | | | | | | | | | | | | | | |
CF Industries Holdings, Inc. | | | (7,685 | ) | | | (291,876 | ) | | | — | | | | 0.0 | |
| | | | | | | | | | | | | | | | |
Commercial Services & Supplies | | | | | | | | | | | | | | | | |
Clean Harbors, Inc.* | | | (4,642 | ) | | | (248,393 | ) | | | — | | | | 0.0 | |
Covanta Holding Corp. | | | (17,372 | ) | | | (279,689 | ) | | | — | | | | 0.0 | |
Healthcare Services Group, Inc. | | | (4,330 | ) | | | (229,014 | ) | | | — | | | | 0.0 | |
| | | | | | | | | | | | | | | | |
| | | (26,344 | ) | | | (757,096 | ) | | | — | | | | 0.0 | |
| | | | | | | | | | | | | | | | |
Communications Equipment | | | | | | | | | | | | | | | | |
Infinera Corp.* | | | (27,781 | ) | | | (232,527 | ) | | | — | | | | 0.0 | |
ViaSat, Inc.* | | | (3,661 | ) | | | (238,331 | ) | | | — | | | | 0.0 | |
| | | | | | | | | | | | | | | | |
| | | (31,442 | ) | | | (470,858 | ) | | | — | | | | 0.0 | |
| | | | | | | | | | | | | | | | |
Consumer Finance | | | | | | | | | | | | | | | | |
LendingClub Corp.* | | | (40,899 | ) | | | (232,715 | ) | | | — | | | | 0.0 | |
| | | | | | | | | | | | | | | | |
Containers & Packaging | | | | | | | | | | | | | | | | |
Ball Corp. | | | (5,642 | ) | | | (242,211 | ) | | | — | | | | 0.0 | |
| | | | | | | | | | | | | | | | |
Distributors | | | | | | | | | | | | | | | | |
Core-Mark Holding Co., Inc. | | | (7,216 | ) | | | (245,777 | ) | | | — | | | | 0.0 | |
LKQ Corp.* | | | (6,413 | ) | | | (241,706 | ) | | | — | | | | 0.0 | |
| | | | | | | | | | | | | | | | |
| | | (13,629 | ) | | | (487,483 | ) | | | — | | | | 0.0 | |
| | | | | | | | | | | | | | | | |
Diversified Consumer Services | | | | | | | | | | | | | | | | |
Chegg, Inc.* | | | (17,630 | ) | | | (273,441 | ) | | | — | | | | 0.0 | |
Houghton Mifflin Harcourt Co.* | | | (21,378 | ) | | | (211,642 | ) | | | — | | | | 0.0 | |
| | | | | | | | | | | | | | | | |
| | | (39,008 | ) | | | (485,083 | ) | | | — | | | | 0.0 | |
| | | | | | | | | | | | | | | | |
Electrical Equipment | | | | | | | | | | | | | | | | |
Acuity Brands, Inc. | | | (1,596 | ) | | | (266,851 | ) | | | — | | | | 0.0 | |
| | | | | | | | | | | | | | | | |
Electronic Equipment, Instruments & Components | | | | | | | | | | | | | | | | |
Fitbit, Inc.* | | | (38,355 | ) | | | (235,500 | ) | | | — | | | | 0.0 | |
| | | | | | | | | | | | | | | | |
Energy Equipment & Services | | | | | | | | | | | | | | | | |
Weatherford International plc* | | | (57,185 | ) | | | (198,432 | ) | | | — | | | | 0.0 | |
| | | | | | | | | | | | | | | | |
SEE NOTES TO CONSOLIDATED FINANCIAL STATEMENTS.
| | | | | | | | |
| | | |
| OCTOBER 31, 2017 | | JPMORGAN EXCHANGE-TRADED FUNDS | | | | | 15 | |
JPMorgan Diversified Alternatives ETF
ADDITIONAL INFORMATION-TOTAL RETURN BASKET SWAPS
AS OF OCTOBER 31, 2017 (continued)
| | | | | | | | | | | | | | | | |
| REFERENCE ENTITY | | SHARES | | | NOTIONAL VALUE($) (1) | | | UNREALIZED APPRECIATION (DEPRECIATION)($) (2) | | | PERCENTAGE OF NET ASSETS (%) | |
Short Positions — continued | | | | | | | | | | | | | | | | |
| | | | |
Common Stocks — continued | | | | | | | | | | | | | | | | |
Food & Staples Retailing | | | | | | | | | |
Casey’s General Stores, Inc. | | | (2,368 | ) | | | (271,302 | ) | | | — | | | | 0.0 | |
Costco Wholesale Corp. | | | (1,640 | ) | | | (264,171 | ) | | | — | | | | 0.0 | |
Smart & Final Stores, Inc.* | | | (31,004 | ) | | | (186,024 | ) | | | — | | | | 0.0 | |
| | | | | | | | | | | | | | | | |
| | | (35,012 | ) | | | (721,497 | ) | | | — | | | | 0.0 | |
| | | | | | | | | | | | | | | | |
Health Care Equipment & Supplies | | | | | | | | | | | | | | | | |
AtriCure, Inc.* | | | (12,462 | ) | | | (267,185 | ) | | | — | | | | 0.0 | |
DexCom, Inc.* | | | (5,089 | ) | | | (228,852 | ) | | | — | | | | 0.0 | |
Insulet Corp.* | | | (4,251 | ) | | | (250,001 | ) | | | — | | | | 0.0 | |
Nevro Corp.* | | | (2,876 | ) | | | (251,880 | ) | | | — | | | | 0.0 | |
| | | | | | | | | | | | | | | | |
| | | (24,678 | ) | | | (997,918 | ) | | | — | | | | 0.0 | |
| | | | | | | | | | | | | | | | |
Hotels, Restaurants & Leisure | | | | | | | | | | | | | | | | |
Chipotle Mexican Grill, Inc.* | | | (889 | ) | | | (241,719 | ) | | | — | | | | 0.0 | |
MGM Resorts International | | | (9,266 | ) | | | (290,489 | ) | | | — | | | | 0.0 | |
Red Robin Gourmet Burgers, Inc.* | | | (4,022 | ) | | | (275,105 | ) | | | — | | | | 0.0 | |
Wynn Resorts Ltd. | | | (1,639 | ) | | | (241,736 | ) | | | — | | | | 0.0 | |
| | | | | | | | | | | | | | | | |
| | | (15,816 | ) | | | (1,049,049 | ) | | | — | | | | 0.0 | |
| | | | | | | | | | | | | | | | |
Household Durables | | | | | | | | | | | | | | | | |
Universal Electronics, Inc.* | | | (4,171 | ) | | | (250,260 | ) | | | — | | | | 0.0 | |
| | | | | | | | | | | | | | | | |
Independent Power and Renewable Electricity Producers | | | | | | | | | | | | | | | | |
NRG Energy, Inc. | | | (9,282 | ) | | | (232,050 | ) | | | — | | | | 0.0 | |
| | | | | | | | | | | | | | | | |
Insurance | | | | | | | | | | | | | | | | |
Cincinnati Financial Corp. | | | (3,360 | ) | | | (235,771 | ) | | | — | | | | 0.0 | |
| | | | | | | | | | | | | | | | |
Internet & Direct Marketing Retail | | | | | | | | | | | | | | | | |
Groupon, Inc.* | | | (57,314 | ) | | | (273,388 | ) | | | — | | | | 0.0 | |
Netflix, Inc.* | | | (1,386 | ) | | | (272,252 | ) | | | — | | | | 0.0 | |
TripAdvisor, Inc.* | | | (6,472 | ) | | | (242,700 | ) | | | — | | | | 0.0 | |
Wayfair, Inc.* | | | (3,169 | ) | | | (221,513 | ) | | | — | | | | 0.0 | |
| | | | | | | | | | | | | | | | |
| | | (68,341 | ) | | | (1,009,853 | ) | | | — | | | | 0.0 | |
| | | | | | | | | | | | | | | | |
Internet Software & Services | | | | | | | | | | | | | | | | |
Cornerstone OnDemand, Inc.* | | | (6,091 | ) | | | (233,651 | ) | | | — | | | | 0.0 | |
Etsy, Inc.* | | | (14,721 | ) | | | (245,841 | ) | | | — | | | | 0.0 | |
GTT Communications, Inc.* | | | (6,905 | ) | | | (251,687 | ) | | | — | | | | 0.0 | |
Hortonworks, Inc.* | | | (15,144 | ) | | | (250,027 | ) | | | — | | | | 0.0 | |
MINDBODY, Inc.* | | | (8,543 | ) | | | (275,512 | ) | | | — | | | | 0.0 | |
Nutanix, Inc.* | | | (9,235 | ) | | | (263,198 | ) | | | — | | | | 0.0 | |
SPS Commerce, Inc.* | | | (4,111 | ) | | | (202,097 | ) | | | — | | | | 0.0 | |
Wix.com Ltd.* | | | (3,608 | ) | | | (251,838 | ) | | | — | | | | 0.0 | |
Zillow Group, Inc.* | | | (5,715 | ) | | | (235,915 | ) | | | — | | | | 0.0 | |
| | | | | | | | | | | | | | | | |
| | | (74,073 | ) | | | (2,209,766 | ) | | | — | | | | 0.0 | |
| | | | | | | | | | | | | | | | |
IT Services | | | | | | | | | | | | | | | | |
Syntel, Inc.* | | | (12,032 | ) | | | (281,068 | ) | | | — | | | | 0.0 | |
| | | | | | | | | | | | | | | | |
Machinery | | | | | | | | | | | | | | | | |
Flowserve Corp. | | | (6,107 | ) | | | (269,135 | ) | | | — | | | | 0.0 | |
Welbilt, Inc.* | | | (10,776 | ) | | | (237,719 | ) | | | — | | | | 0.0 | |
| | | | | | | | | | | | | | | | |
| | | (16,883 | ) | | | (506,854 | ) | | | — | | | | 0.0 | |
| | | | | | | | | | | | | | | | |
Marine | | | | | | | | | | | | | | | | |
Matson, Inc. | | | (9,666 | ) | | | (263,205 | ) | | | — | | | | 0.0 | |
| | | | | | | | | | | | | | | | |
SEE NOTES TO CONSOLIDATED FINANCIAL STATEMENTS.
| | | | | | |
| | | |
| 16 | | | | JPMORGAN EXCHANGE-TRADED FUNDS | | OCTOBER 31, 2017 |
| | | | | | | | | | | | | | | | |
| REFERENCE ENTITY | | SHARES | | | NOTIONAL VALUE($) (1) | | | UNREALIZED APPRECIATION (DEPRECIATION)($) (2) | | | PERCENTAGE OF NET ASSETS (%) | |
Short Positions — continued | | | | | | | | | | | | | | | | |
| | | | |
Common Stocks — continued | | | | | | | | | | | | | | | | |
Media | | | | | | | | | | | | | | | | |
Liberty Broadband Corp.* | | | (2,796 | ) | | | (244,063 | ) | | | — | | | | 0.0 | |
Lions Gate Entertainment Corp.* | | | (7,924 | ) | | | (229,954 | ) | | | — | | | | 0.0 | |
| | | | | | | | | | | | | | | | |
| | | (10,720 | ) | | | (474,017 | ) | | | — | | | | 0.0 | |
| | | | | | | | | | | | | | | | |
Metals & Mining | | | | | | | | | | | | | | | | |
Alcoa Corp. | | | (5,661 | ) | | | (270,483 | ) | | | — | | | | 0.0 | |
Coeur Mining, Inc.* | | | (27,237 | ) | | | (206,729 | ) | | | — | | | | 0.0 | |
Compass Minerals International, Inc. | | | (3,629 | ) | | | (238,062 | ) | | | — | | | | 0.0 | |
| | | | | | | | | | | | | | | | |
| | | (36,527 | ) | | | (715,274 | ) | | | — | | | | 0.0 | |
| | | | | | | | | | | | | | | | |
Multi-Utilities | | | | | | | | | | | | | | | | |
Dominion Energy, Inc. | | | (3,031 | ) | | | (245,935 | ) | | | — | | | | 0.0 | |
NiSource, Inc. | | | (8,971 | ) | | | (236,565 | ) | | | — | | | | 0.0 | |
Sempra Energy | | | (2,228 | ) | | | (261,790 | ) | | | — | | | | 0.0 | |
| | | | | | | | | | | | | | | | |
| | | (14,230 | ) | | | (744,290 | ) | | | — | | | | 0.0 | |
| | | | | | | | | | | | | | | | |
Oil, Gas & Consumable Fuels | | | | | | | | | | | | | | | | |
Antero Resources Corp.* | | | (12,342 | ) | | | (239,435 | ) | | | — | | | | 0.0 | |
Cheniere Energy, Inc.* | | | (5,795 | ) | | | (270,858 | ) | | | — | | | | 0.0 | |
Concho Resources, Inc.* | | | (2,058 | ) | | | (276,204 | ) | | | — | | | | 0.0 | |
Continental Resources, Inc.* | | | (6,992 | ) | | | (284,644 | ) | | | — | | | | 0.0 | |
Eclipse Resources Corp.* | | | (98,904 | ) | | | (219,567 | ) | | | — | | | | 0.0 | |
EQT Corp. | | | (2,598 | ) | | | (162,479 | ) | | | — | | | | 0.0 | |
Extraction Oil & Gas, Inc.* | | | (15,270 | ) | | | (243,557 | ) | | | — | | | | 0.0 | |
Hess Corp. | | | (5,994 | ) | | | (264,695 | ) | | | — | | | | 0.0 | |
Kosmos Energy Ltd.* | | | (30,996 | ) | | | (238,049 | ) | | | — | | | | 0.0 | |
Parsley Energy, Inc.* | | | (9,858 | ) | | | (262,223 | ) | | | — | | | | 0.0 | |
PDC Energy, Inc.* | | | (5,771 | ) | | | (293,917 | ) | | | — | | | | 0.0 | |
SM Energy Co. | | | (12,794 | ) | | | (272,896 | ) | | | — | | | | 0.0 | |
| | | | | | | | | | | | | | | | |
| | | (209,372 | ) | | | (3,028,524 | ) | | | — | | | | 0.0 | |
| | | | | | | | | | | | | | | | |
Personal Products | | | | | | | | | | | | | | | | |
Edgewell Personal Care Co.* | | | (3,904 | ) | | | (253,487 | ) | | | — | | | | 0.0 | |
| | | | | | | | | | | | | | | | |
Pharmaceuticals | | | | | | | | | | | | | | | | |
Aerie Pharmaceuticals, Inc.* | | | (4,335 | ) | | | (267,686 | ) | | | — | | | | 0.0 | |
Dermira, Inc.* | | | (8,099 | ) | | | (216,810 | ) | | | — | | | | 0.0 | |
Impax Laboratories, Inc.* | | | (12,152 | ) | | | (220,559 | ) | | | — | | | | 0.0 | |
Nektar Therapeutics* | | | (11,463 | ) | | | (276,144 | ) | | | — | | | | 0.0 | |
Pacira Pharmaceuticals, Inc.* | | | (7,959 | ) | | | (255,086 | ) | | | — | | | | 0.0 | |
| | | | | | | | | | | | | | | | |
| | | (44,008 | ) | | | (1,236,285 | ) | | | — | | | | 0.0 | |
| | | | | | | | | | | | | | | | |
Road & Rail | | | | | | | | | | | | | | | | |
AMERCO | | | (652 | ) | | | (256,001 | ) | | | — | | | | 0.0 | |
Werner Enterprises, Inc. | | | (7,284 | ) | | | (259,675 | ) | | | — | | | | 0.0 | |
| | | | | | | | | | | | | | | | |
| | | (7,936 | ) | | | (515,676 | ) | | | — | | | | 0.0 | |
| | | | | | | | | | | | | | | | |
Semiconductors & Semiconductor Equipment | | | | | | | | | | | | | | | | |
Cavium, Inc.* | | | (3,798 | ) | | | (262,024 | ) | | | — | | | | 0.0 | |
| | | | | | | | | | | | | | | | |
Software | | | | | | | | | | | | | | | | |
Autodesk, Inc.* | | | (2,213 | ) | | | (276,536 | ) | | | — | | | | 0.0 | |
FireEye, Inc.* | | | (14,577 | ) | | | (246,643 | ) | | | — | | | | 0.0 | |
Globant SA* | | | (5,615 | ) | | | (211,798 | ) | | | — | | | | 0.0 | |
HubSpot, Inc.* | | | (2,788 | ) | | | (241,301 | ) | | | — | | | | 0.0 | |
SEE NOTES TO CONSOLIDATED FINANCIAL STATEMENTS.
| | | | | | | | |
| | | |
| OCTOBER 31, 2017 | | JPMORGAN EXCHANGE-TRADED FUNDS | | | | | 17 | |
JPMorgan Diversified Alternatives ETF
ADDITIONAL INFORMATION-TOTAL RETURN BASKET SWAPS
AS OF OCTOBER 31, 2017 (continued)
| | | | | | | | | | | | | | | | |
| REFERENCE ENTITY | | SHARES | | | NOTIONAL VALUE($) (1) | | | UNREALIZED APPRECIATION (DEPRECIATION)($) (2) | | | PERCENTAGE OF NET ASSETS (%) | |
Short Positions — continued | | | | | | | | | | | | | | | | |
| | | | |
Common Stocks — continued | | | | | | | | | | | | | | | | |
Software — continued | | | | | | | | | | | | | | | | |
PROS Holdings, Inc.* | | | (4,744 | ) | | | (107,167 | ) | | | — | | | | 0.0 | |
Splunk, Inc.* | | | (3,760 | ) | | | (253,048 | ) | | | — | | | | 0.0 | |
Tableau Software, Inc.* | | | (3,087 | ) | | | (250,325 | ) | | | — | | | | 0.0 | |
Workday, Inc.* | | | (2,406 | ) | | | (267,042 | ) | | | — | | | | 0.0 | |
Zendesk, Inc.* | | | (8,819 | ) | | | (273,389 | ) | | | — | | | | 0.0 | |
| | | | | | | | | | | | | | | | |
| | | (48,009 | ) | | | (2,127,249 | ) | | | — | | | | 0.0 | |
| | | | | | | | | | | | | | | | |
Specialty Retail | | | | | | | | | | | | | | | | |
CarMax, Inc.* | | | (3,713 | ) | | | (278,846 | ) | | | — | | | | 0.0 | |
L Brands, Inc. | | | (6,212 | ) | | | (267,364 | ) | | | — | | | | 0.0 | |
Monro, Inc. | | | (4,606 | ) | | | (227,306 | ) | | | — | | | | 0.0 | |
| | | | | | | | | | | | | | | | |
| | | (14,531 | ) | | | (773,516 | ) | | | — | | | | 0.0 | |
| | | | | | | | | | | | | | | | |
Technology Hardware, Storage & Peripherals | | | | | | | | | | | | | | | | |
Pure Storage, Inc.* | | | (17,218 | ) | | | (282,892 | ) | | | — | | | | 0.0 | |
| | | | | | | | | | | | | | | | |
Trading Companies & Distributors | | | | | | | | | | | | | | | | |
SiteOne Landscape Supply, Inc.* | | | (3,796 | ) | | | (241,084 | ) | | | — | | | | 0.0 | |
| | | | | | | | | | | | | | | | |
Water Utilities | | | | | | | | | | | | | | | | |
American Water Works Co., Inc. | | | (2,801 | ) | | | (245,816 | ) | | | — | | | | 0.0 | |
California Water Service Group | | | (5,709 | ) | | | (239,778 | ) | | | — | | | | 0.0 | |
| | | | | | | | | | | | | | | | |
| | | (8,510 | ) | | | (485,594 | ) | | | — | | | | 0.0 | |
| | | | | | | | | | | | | | | | |
Wireless Telecommunication Services | | | | | | | | | | | | | | | | |
Sprint Corp.* | | | (35,028 | ) | | | (229,083 | ) | | | — | | | | 0.0 | |
| | | | | | | | | | | | | | | | |
Total Short Positions of Total Return Basket Swaps | | | (1,034,928 | ) | | | (25,193,920 | ) | | | — | | | | 0.0 | |
| | | | | | | | | | | | | | | | |
| | | | | | | | | | | | | | | | | | | | | | |
| COUNTERPARTY | | DESCRIPTION | | TERMINATION DATE | | | NOTIONAL VALUE (1) | | | NET UNREALIZED APPRECIATION (DEPRECIATION) (2) | | | NET CASH AND OTHER RECEIVABLES (PAYABLES) | | | VALUE (Note 2C(3)) | |
| Bank of America | | The Fund receives the total return on a portfolio of Short equity positions and pays or receives the net of one month EURIBOR on short positions, which is denominated in EUR based on the local currencies of the positions within the swaps. | | | 03/29/2019 | | | $ | (6,892,767 | ) | | $ | (5,015 | ) | | $ | — | | | $ | (5,015 | ) |
| | | | | | | | | | | | | | | | | | | | | | |
| | | | | | | | | | | | | | | | |
| REFERENCE ENTITY | | SHARES | | | NOTIONAL VALUE($) (1) | | | UNREALIZED APPRECIATION (DEPRECIATION)($) (2) | | | PERCENTAGE OF NET ASSETS (%) | |
Short Positions | | | | | | | | | | | | | | | | |
| | | | |
Common Stocks | | | | | | | | | | | | | | | | |
Beverages | | | | | | | | | | | | | | | | |
Anheuser-Busch InBev SA/NV | | | (2,096 | ) | | | (257,014 | ) | | | (532 | ) | | | 0.0 | (a) |
Davide Campari-Milano SpA | | | (34,674 | ) | | | (277,626 | ) | | | 257 | | | | 0.0 | (a) |
Remy Cointreau SA | | | (1,851 | ) | | | (240,410 | ) | | | (1 | ) | | | 0.0 | (a) |
| | | | | | | | | | | | | | | | |
| | | (38,621 | ) | | | (775,050 | ) | | | (276 | ) | | | 0.0 | (a) |
| | | | | | | | | | | | | | | | |
Capital Markets | | | | | | | | | | | | | | | | |
Deutsche Bank AG (Registered) | | | (14,255 | ) | | | (233,628 | ) | | | (1,989 | ) | | | 0.0 | (a) |
| | | | | | | | | | | | | | | | |
SEE NOTES TO CONSOLIDATED FINANCIAL STATEMENTS.
| | | | | | |
| | | |
| 18 | | | | JPMORGAN EXCHANGE-TRADED FUNDS | | OCTOBER 31, 2017 |
| | | | | | | | | | | | | | | | |
| REFERENCE ENTITY | | SHARES | | | NOTIONAL VALUE($) (1) | | | UNREALIZED APPRECIATION (DEPRECIATION)($) (2) | | | PERCENTAGE OF NET ASSETS (%) | |
Short Positions — continued | | | | | | | | | | | | | | | | |
| | | | |
Common Stocks — continued | | | | | | | | | | | | | | | | |
Chemicals | | | | | | | | | | | | | | | | |
OCI NV* | | | (1,375 | ) | | | (32,619 | ) | | | (1 | ) | | | 0.0 | (a) |
Symrise AG | | | (3,324 | ) | | | (259,028 | ) | | | (342 | ) | | | 0.0 | (a) |
| | | | | | | | | | | | | | | | |
| | | (4,699 | ) | | | (291,647 | ) | | | (343 | ) | | | 0.0 | (a) |
| | | | | | | | | | | | | | | | |
Commercial Services & Supplies | | | | | | | | | | | | | | | | |
Prosegur Cia de Seguridad SA | | | (35,311 | ) | | | (269,473 | ) | | | (59 | ) | | | 0.0 | (a) |
Societe BIC SA | | | (2,089 | ) | | | (220,579 | ) | | | 55 | | | | 0.0 | (a) |
| | | | | | | | | | | | | | | | |
| | | (37,400 | ) | | | (490,052 | ) | | | (4 | ) | | | 0.0 | (a) |
| | | | | | | | | | | | | | | | |
Construction & Engineering | | | | | | | | | | | | | | | | |
Ferrovial SA* | | | (11,091 | ) | | | (240,859 | ) | | | 87 | | | | 0.0 | (a) |
Sacyr SA* | | | (92,488 | ) | | | (237,631 | ) | | | (77 | ) | | | 0.0 | (a) |
| | | | | | | | | | | | | | | | |
| | | (103,579 | ) | | | (478,490 | ) | | | 10 | | | | 0.0 | (a) |
| | | | | | | | | | | | | | | | |
Diversified Telecommunication Services | | | | | | | | | | | | | | | | |
Iliad SA | | | (1,022 | ) | | | (255,111 | ) | | | 68 | | | | 0.0 | (a) |
| | | | | | | | | | | | | | | | |
Electrical Equipment | | | | | | | | | | | | | | | | |
Nexans SA | | | (3,893 | ) | | | (254,787 | ) | | | 67 | | | | 0.0 | (a) |
| | | | | | | | | | | | | | | | |
Health Care Equipment & Supplies | | | | | | | | | | | | | | | | |
Sartorius Stedim Biotech | | | (3,690 | ) | | | (251,476 | ) | | | 17 | | | | 0.0 | (a) |
| | | | | | | | | | | | | | | | |
Health Care Providers & Services | | | | | | | | | | | | | | | | |
Korian SA | | | (7,845 | ) | | | (254,949 | ) | | | 8 | | | | 0.0 | (a) |
| | | | | | | | | | | | | | | | |
Hotels, Restaurants & Leisure | | | | | | | | | | | | | | | | |
Accor SA | | | (5,208 | ) | | | (259,816 | ) | | | 44 | | | | 0.0 | (a) |
NH Hotel Group SA | | | (39,773 | ) | | | (251,463 | ) | | | 107 | | | | 0.0 | (a) |
| | | | | | | | | | | | | | | | |
| | | (44,981 | ) | | | (511,279 | ) | | | 151 | | | | 0.0 | (a) |
| | | | | | | | | | | | | | | | |
Internet & Direct Marketing Retail | | | | | | | | | | | | | | | | |
Yoox Net-A-Porter Group SpA* | | | (1,836 | ) | | | (68,581 | ) | | | 70 | | | | 0.0 | (a) |
Zalando SE* (b) | | | (4,535 | ) | | | (228,297 | ) | | | (1,383 | ) | | | 0.0 | (a) |
| | | | | | | | | | | | | | | | |
| | | (6,371 | ) | | | (296,878 | ) | | | (1,313 | ) | | | 0.0 | (a) |
| | | | | | | | | | | | | | | | |
IT Services | | | | | | | | | | | | | | | | |
Tieto OYJ | | | (7,396 | ) | | | (226,441 | ) | | | 226 | | | | 0.0 | (a) |
| | | | | | | | | | | | | | | | |
Leisure Products | | | | | | | | | | | | | | | | |
Amer Sports OYJ* | | | (9,821 | ) | | | (244,353 | ) | | | 119 | | | | 0.0 | (a) |
| | | | | | | | | | | | | | | | |
Life Sciences Tools & Services | | | | | | | | | | | | | | | | |
MorphoSys AG* | | | (3,086 | ) | | | (267,832 | ) | | | 191 | | | | 0.0 | (a) |
| | | | | | | | | | | | | | | | |
Machinery | | | | | | | | | | | | | �� | | | |
Alstom SA | | | (5,678 | ) | | | (229,711 | ) | | | 60 | | | | 0.0 | (a) |
Heidelberger Druckmaschinen AG* | | | (57,060 | ) | | | (228,110 | ) | | | (795 | ) | | | 0.0 | (a) |
KION Group AG | | | (2,664 | ) | | | (213,460 | ) | | | (242 | ) | | | 0.0 | (a) |
| | | | | | | | | | | | | | | | |
| | | (65,402 | ) | | | (671,281 | ) | | | (977 | ) | | | 0.0 | (a) |
| | | | | | | | | | | | | | | | |
Media | | | | | | | | | | | | | | | | |
Altice NV* | | | (7,855 | ) | | | (148,134 | ) | | | 48 | | | | 0.0 | (a) |
JCDecaux SA | | | (7,032 | ) | | | (269,004 | ) | | | 78 | | | | 0.0 | (a) |
| | | | | | | | | | | | | | | | |
| | | (14,887 | ) | | | (417,138 | ) | | | 126 | | | | 0.0 | (a) |
| | | | | | | | | | | | | | | | |
Metals & Mining | | | | | | | | | | | | | | | | |
thyssenkrupp AG | | | (8,366 | ) | | | (224,427 | ) | | | (1,215 | ) | | | 0.0 | (a) |
| | | | | | | | | | | | | | | | |
SEE NOTES TO CONSOLIDATED FINANCIAL STATEMENTS.
| | | | | | | | |
| | | |
| OCTOBER 31, 2017 | | JPMORGAN EXCHANGE-TRADED FUNDS | | | | | 19 | |
JPMorgan Diversified Alternatives ETF
ADDITIONAL INFORMATION-TOTAL RETURN BASKET SWAPS
AS OF OCTOBER 31, 2017 (continued)
| | | | | | | | | | | | | | | | |
| REFERENCE ENTITY | | SHARES | | | NOTIONAL VALUE($) (1) | | | UNREALIZED APPRECIATION (DEPRECIATION)($) (2) | | | PERCENTAGE OF NET ASSETS (%) | |
Short Positions — continued | | | | | | | | | | | | | | | | |
| | | | |
Common Stocks — continued | | | | | | | | | | | | | | | | |
Professional Services | | | | | | | | | | | | | | | | |
Bureau Veritas SA | | | (10,008 | ) | | | (267,997 | ) | | | 74 | | | | 0.0 | (a) |
| | | | | | | | | | | | | | | | |
Road & Rail | | | | | | | | | | | | | | | | |
Europcar Groupe SA (b) | | | (16,295 | ) | | | (233,044 | ) | | | 45 | | | | 0.0 | (a) |
| | | | | | | | | | | | | | | | |
Transportation Infrastructure | | | | | | | | | | | | | | | | |
Groupe Eurotunnel SE (Registered) | | | (19,220 | ) | | | (241,571 | ) | | | — | | | | 0.0 | |
| | | | | | | | | | | | | | | | |
Total Common Stocks | | | (420,837 | ) | | | (6,887,431 | ) | | | (5,015 | ) | | | 0.0 | (a) |
| | | | | | | | | | | | | | | | |
Right | | | | | | | | | | | | | | | | |
Construction & Engineering | | | | | | | | | |
Ferrovial SA | | | (11,091 | ) | | | (5,336 | ) | | | — | | | | 0.0 | |
| | | | | | | | | | | | | | | | |
Total Short Positions of Total Return Basket Swaps | | | (431,928 | ) | | | (6,892,767 | ) | | | (5,015 | ) | | | 0.0 | (a) |
| | | | | | | | | | | | | | | | |
| | | | | | | | | | | | | | | | | | | | | | |
| COUNTERPARTY | | DESCRIPTION | | TERMINATION DATE | | | NOTIONAL VALUE (1) | | | NET UNREALIZED APPRECIATION (DEPRECIATION) (2) | | | NET CASH AND OTHER RECEIVABLES (PAYABLES) | | | VALUE
(Note 2C(3)) | |
| Bank of America | | The Fund receives the total return on a portfolio of long and short equity positions and pays or receives the net of one month LIBOR on long positions and short positions respectively, which is denominated in JPY based on the local currencies of the positions within the swaps. | |
|
10/19/2018 |
| | $ | (8,204,733 | ) | | $ | (55,222 | ) | | $ | — | | | $ | (55,222 | ) |
| | | | | | | | | | | | | | | | | | | | | | |
| | | | | | | | | | | | | | | | |
| REFERENCE ENTITY | | SHARES | | | NOTIONAL VALUE($) (1) | | | UNREALIZED APPRECIATION (DEPRECIATION)($) (2) | | | PERCENTAGE OF NET ASSETS (%) | |
Long Positions | | | | | | | | | | | | | | | | |
| | | | |
Common Stocks | | | | | | | | | | | | | | | | |
Auto Components | | | | | | | | | | | | | | | | |
Bridgestone Corp.* | | | 2,700 | | | | 128,980 | | | | 991 | | | | 0.0 | (a) |
Sumitomo Rubber Industries Ltd.* | | | 6,500 | | | | 123,420 | | | | 857 | | | | 0.0 | (a) |
| | | | | | | | | | | | | | | | |
| | | 9,200 | | | | 252,400 | | | | 1,848 | | | | 0.0 | (a) |
| | | | | | | | | | | | | | | | |
Building Products | | | | | | | | | | | | | | | | |
Nichias Corp. | | | 12,000 | | | | 156,251 | | | | 586 | | | | 0.0 | (a) |
| | | | | | | | | | | | | | | | |
Chemicals | | | | | | | | | | | | | | | | |
Hitachi Chemical Co. Ltd. | | | 4,300 | | | | 122,618 | | | | 1,036 | | | | 0.0 | (a) |
Kuraray Co. Ltd.* | | | 6,900 | | | | 135,893 | | | | 993 | | | | 0.0 | (a) |
Mitsubishi Chemical Holdings Corp. | | | 10,900 | | | | 113,854 | | | | 976 | | | | 0.0 | (a) |
Mitsubishi Gas Chemical Co., Inc. | | | 5,500 | | | | 134,545 | | | | 1,090 | | | | 0.0 | (a) |
Mitsui Chemicals, Inc. | | | 4,200 | | | | 129,511 | | | | 968 | | | | 0.0 | (a) |
| | | | | | | | | | | | | | | | |
| | | 31,800 | | | | 636,421 | | | | 5,063 | | | | 0.0 | (a) |
| | | | | | | | | | | | | | | | |
Construction & Engineering | | | | | | | | | | | | | | | | |
Obayashi Corp. | | | 13,000 | | | | 170,213 | | | | 1,003 | | | | 0.0 | (a) |
Taisei Corp. | | | 2,200 | | | | 121,895 | | | | 582 | | | | 0.0 | (a) |
| | | | | | | | | | | | | | | | |
| | | 15,200 | | | | 292,108 | | | | 1,585 | | | | 0.0 | (a) |
| | | | | | | | | | | | | | | | |
Diversified Telecommunication Services | | | | | | | | | | | | | | | | |
Nippon Telegraph & Telephone Corp. | | | 600 | | | | 29,008 | | | | 129 | | | | 0.0 | (a) |
| | | | | | | | | | | | | | | | |
SEE NOTES TO CONSOLIDATED FINANCIAL STATEMENTS.
| | | | | | |
| | | |
| 20 | | | | JPMORGAN EXCHANGE-TRADED FUNDS | | OCTOBER 31, 2017 |
| | | | | | | | | | | | | | | | |
| REFERENCE ENTITY | | SHARES | | | NOTIONAL VALUE($) (1) | | | UNREALIZED APPRECIATION (DEPRECIATION)($) (2) | | | PERCENTAGE OF NET ASSETS (%) | |
Long Positions — continued | | | | | | | | | | | | | | | | |
| | | | |
Common Stocks — continued | | | | | | | | | | | | | | | | |
Electrical Equipment | | | | | | | | | | | | | | | | |
Fuji Electric Co. Ltd. | | | 21,000 | | | | 152,147 | | | | 1,257 | | | | 0.0 | (a) |
| | | | | | | | | | | | | | | | |
Health Care Providers & Services | | | | | | | | | | | | | | | | |
BML, Inc.* | | | 4,900 | | | | 108,475 | | | | 654 | | | | 0.0 | (a) |
Miraca Holdings, Inc. | | | 2,800 | | | | 130,276 | | | | 501 | | | | 0.0 | (a) |
| | | | | | | | | | | | | | | | |
| | | 7,700 | | | | 238,751 | | | | 1,155 | | | | 0.0 | (a) |
| | | | | | | | | | | | | | | | |
Internet Software & Services | | | | | | | | | | | | | | | | |
Mixi, Inc. | | | 2,800 | | | | 136,505 | | | | 575 | | | | 0.0 | (a) |
| | | | | | | | | | | | | | | | |
Leisure Products | | | | | | | | | | | | | | | | |
Bandai Namco Holdings, Inc. | | | 4,300 | | | | 147,353 | | | | 811 | | | | 0.0 | (a) |
| | | | | | | | | | | | | | | | |
Oil, Gas & Consumable Fuels | | | | | | | | | | | | | | | | |
JXTG Holdings, Inc. | | | 14,700 | | | | 75,908 | | | | 511 | | | | 0.0 | (a) |
Showa Shell Sekiyu KK* | | | 10,700 | | | | 126,230 | | | | 885 | | | | 0.0 | (a) |
| | | | | | | | | | | | | | | | |
| | | 25,400 | | | | 202,138 | | | | 1,396 | | | | 0.0 | (a) |
| | | | | | | | | | | | | | | | |
Pharmaceuticals | | | | | | | | | | | | | | | | |
Astellas Pharma, Inc. | | | 8,800 | | | | 117,118 | | | | 370 | | | | 0.0 | (a) |
Mitsubishi Tanabe Pharma Corp. | | | 5,800 | | | | 127,654 | | | | 438 | | | | 0.0 | (a) |
Shionogi & Co. Ltd. | | | 2,700 | | | | 145,360 | | | | 820 | | | | 0.0 | (a) |
| | | | | | | | | | | | | | | | |
| | | 17,300 | | | | 390,132 | | | | 1,628 | | | | 0.0 | (a) |
| | | | | | | | | | | | | | | | |
Semiconductors & Semiconductor Equipment | | | | | | | | | | | | | | | | |
Ulvac, Inc. | | | 1,600 | | | | 113,350 | | | | 919 | | | | 0.0 | (a) |
| | | | | | | | | | | | | | | | |
Specialty Retail | | | | | | | | | | | | | | | | |
Kohnan Shoji Co. Ltd.* | | | 5,500 | | | | 117,549 | | | | 491 | | | | 0.0 | (a) |
| | | | | | | | | | | | | | | | |
Trading Companies & Distributors | | | | | | | | | | | | | | | | |
Sumitomo Corp. | | | 8,700 | | | | 125,838 | | | | 852 | | | | 0.0 | (a) |
| | | | | | | | | | | | | | | | |
Wireless Telecommunication Services | | | | | | | | | | | | | | | | |
NTT DOCOMO, Inc. | | | 5,200 | | | | 125,937 | | | | 585 | | | | 0.0 | (a) |
| | | | | | | | | | | | | | | | |
Total Long Positions of Total Return Basket Swaps | | | 168,300 | | | | 3,115,888 | | | | 18,880 | | | | 0.0 | (a) |
| | | | | | | | | | | | | | | | |
| | | | |
Short Positions | | | | | | | | | | | | | | | | |
| | | | |
Common Stocks | | | | | | | | | | | | | | | | |
Air Freight & Logistics | | | | | | | | | | | | | | | | |
Yamato Holdings Co. Ltd. | | | (11,000 | ) | | | (224,904 | ) | | | (1,285 | ) | | | 0.0 | (a) |
| | | | | | | | | | | | | | | | |
Banks | | | | | | | | | | | | | | | | |
Suruga Bank Ltd. | | | (12,100 | ) | | | (275,500 | ) | | | (2,225 | ) | | | 0.0 | (a) |
| | | | | | | | | | | | | | | | |
Chemicals | | | | | | | | | | | | | | | | |
Nippon Shokubai Co. Ltd. | | | (3,300 | ) | | | (248,922 | ) | | | (1,941 | ) | | | 0.0 | (a) |
Tokyo Ohka Kogyo Co. Ltd. | | | (7,700 | ) | | | (281,589 | ) | | | (2,248 | ) | | | 0.0 | (a) |
Toray Industries, Inc. | | | (26,400 | ) | | | (267,211 | ) | | | (1,714 | ) | | | 0.0 | (a) |
| | | | | | | | | | | | | | | | |
| | | (37,400 | ) | | | (797,722 | ) | | | (5,903 | ) | | | 0.0 | (a) |
| | | | | | | | | | | | | | | | |
Commercial Services & Supplies | | | | | | | | | | | | | | | | |
Sohgo Security Services Co. Ltd. | | | (4,800 | ) | | | (231,254 | ) | | | (1,607 | ) | | | 0.0 | (a) |
| | | | | | | | | | | | | | | | |
Construction & Engineering | | | | | | | | | | | | | | | | |
JGC Corp.* | | | (14,300 | ) | | | (239,846 | ) | | | (2,278 | ) | | | 0.0 | (a) |
| | | | | | | | | | | | | | | | |
SEE NOTES TO CONSOLIDATED FINANCIAL STATEMENTS.
| | | | | | | | |
| | | |
| OCTOBER 31, 2017 | | JPMORGAN EXCHANGE-TRADED FUNDS | | | | | 21 | |
JPMorgan Diversified Alternatives ETF
ADDITIONAL INFORMATION-TOTAL RETURN BASKET SWAPS
AS OF OCTOBER 31, 2017 (continued)
| | | | | | | | | | | | | | | | |
| REFERENCE ENTITY | | SHARES | | | NOTIONAL VALUE($) (1) | | | UNREALIZED APPRECIATION (DEPRECIATION)($) (2) | | | PERCENTAGE OF NET ASSETS (%) | |
Short Positions — continued | | | | | | | | | | | | | | | | |
| | | | |
Common Stocks — continued | | | | | | | | | | | | | | | | |
Consumer Finance | | | | | | | | | | | | | | | | |
Acom Co. Ltd.* | | | (52,400 | ) | | | (217,842 | ) | | | (1,246 | ) | | | 0.0 | (a) |
Aiful Corp.* | | | (72,200 | ) | | | (251,846 | ) | | | (2,301 | ) | | | 0.0 | (a) |
| | | | | | | | | | | | | | | | |
| | | (124,600 | ) | | | (469,688 | ) | | | (3,547 | ) | | | 0.0 | (a) |
| | | | | | | | | | | | | | | | |
Electric Utilities | | | | | | | | | | | | | | | | |
Chugoku Electric Power Co., Inc. (The) | | | (23,200 | ) | | | (258,683 | ) | | | (1,393 | ) | | | 0.0 | (a) |
Hokkaido Electric Power Co., Inc. | | | (32,100 | ) | | | (252,960 | ) | | | (1,422 | ) | | | 0.0 | (a) |
Hokuriku Electric Power Co. | | | (11,500 | ) | | | (101,615 | ) | | | (476 | ) | | | 0.0 | (a) |
| | | | | | | | | | | | | | | | |
| | | (66,800 | ) | | | (613,258 | ) | | | (3,291 | ) | | | 0.0 | (a) |
| | | | | | | | | | | | | | | | |
Electronic Equipment, Instruments & Components | | | | | | | | | | | | | | | | |
Alps Electric Co. Ltd. | | | (8,700 | ) | | | (266,255 | ) | | | (2,665 | ) | | | 0.0 | (a) |
TDK Corp. | | | (3,500 | ) | | | (268,938 | ) | | | (2,063 | ) | | | 0.0 | (a) |
| | | | | | | | | | | | | | | | |
| | | (12,200 | ) | | | (535,193 | ) | | | (4,728 | ) | | | 0.0 | (a) |
| | | | | | | | | | | | | | | | |
Food & Staples Retailing | | | | | | | | | | | | | | | | |
Aeon Co. Ltd. | | | (16,800 | ) | | | (259,853 | ) | | | (1,215 | ) | | | 0.0 | (a) |
Sugi Holdings Co. Ltd. | | | (4,600 | ) | | | (233,459 | ) | | | (435 | ) | | | 0.0 | (a) |
Tsuruha Holdings, Inc.* | | | (2,100 | ) | | | (260,364 | ) | | | (1,246 | ) | | | 0.0 | (a) |
| | | | | | | | | | | | | | | | |
| | | (23,500 | ) | | | (753,676 | ) | | | (2,896 | ) | | | 0.0 | (a) |
| | | | | | | | | | | | | | | | |
Food Products | | | | | | | | | | | | | | | | |
Kameda Seika Co. Ltd.* | | | (5,700 | ) | | | (258,143 | ) | | | (476 | ) | | | 0.0 | (a) |
Kikkoman Corp. | | | (6,300 | ) | | | (216,219 | ) | | | (1,242 | ) | | | 0.0 | (a) |
Nissin Foods Holdings Co. Ltd. | | | (3,500 | ) | | | (220,385 | ) | | | (913 | ) | | | 0.0 | (a) |
| | | | | | | | | | | | | | | | |
| | | (15,500 | ) | | | (694,747 | ) | | | (2,631 | ) | | | 0.0 | (a) |
| | | | | | | | | | | | | | | | |
Health Care Equipment & Supplies | | | | | | | | | | | | | | | | |
Sysmex Corp. | | | (3,700 | ) | | | (253,227 | ) | | | (1,690 | ) | | | 0.0 | (a) |
Terumo Corp.* | | | (6,300 | ) | | | (262,523 | ) | | | (1,835 | ) | | | 0.0 | (a) |
| | | | | | | | | | | | | | | | |
| | | (10,000 | ) | | | (515,750 | ) | | | (3,525 | ) | | | 0.0 | (a) |
| | | | | | | | | | | | | | | | |
Hotels, Restaurants & Leisure | | | | | | | | | | | | | | | | |
Create Restaurants Holdings, Inc.* | | | (25,000 | ) | | | (267,985 | ) | | | (846 | ) | | | 0.0 | (a) |
HIS Co. Ltd. | | | (3,800 | ) | | | (127,244 | ) | | | (415 | ) | | | 0.0 | (a) |
Kyoritsu Maintenance Co. Ltd.* | | | (4,900 | ) | | | (154,756 | ) | | | (911 | ) | | | 0.0 | (a) |
| | | | | | | | | | | | | | | | |
| | | (33,700 | ) | | | (549,985 | ) | | | (2,172 | ) | | | 0.0 | (a) |
| | | | | | | | | | | | | | | | |
Household Durables | | | | | | | | | | | | | | | | |
Pioneer Corp.* | | | (126,100 | ) | | | (244,181 | ) | | | (1,307 | ) | | | 0.0 | (a) |
| | | | | | | | | | | | | | | | |
Industrial Conglomerates | | | | | | | | | | | | | | | | |
Keihan Holdings Co. Ltd. | | | (7,000 | ) | | | (213,890 | ) | | | (882 | ) | | | 0.0 | (a) |
| | | | | | | | | | | | | | | | |
Internet & Direct Marketing Retail | | | | | | | | | | | | | | | | |
Rakuten, Inc. | | | (22,000 | ) | | | (235,418 | ) | | | (1,497 | ) | | | 0.0 | (a) |
| | | | | | | | | | | | | | | | |
Internet Software & Services | | | | | | | | | | | | | | | | |
GMO internet, Inc. | | | (15,600 | ) | | | (241,009 | ) | | | (1,875 | ) | | | 0.0 | (a) |
Yahoo Japan Corp.* | | | (56,200 | ) | | | (251,262 | ) | | | (672 | ) | | | 0.0 | (a) |
| | | | | | | | | | | | | | | | |
| | | (71,800 | ) | | | (492,271 | ) | | | (2,547 | ) | | | 0.0 | (a) |
| | | | | | | | | | | | | | | | |
Machinery | | | | | | | | | | | | | | | | |
FANUC Corp. | | | (1,100 | ) | | | (257,206 | ) | | | (2,099 | ) | | | 0.0 | (a) |
| | | | | | | | | | | | | | | | |
SEE NOTES TO CONSOLIDATED FINANCIAL STATEMENTS.
| | | | | | |
| | | |
| 22 | | | | JPMORGAN EXCHANGE-TRADED FUNDS | | OCTOBER 31, 2017 |
| | | | | | | | | | | | | | | | |
| REFERENCE ENTITY | | SHARES | | | NOTIONAL VALUE($) (1) | | | UNREALIZED APPRECIATION (DEPRECIATION)($) (2) | | | PERCENTAGE OF NET ASSETS (%) | |
Short Positions — continued | | | | | | | | | | | | | | | | |
| | | | |
Common Stocks — continued | | | | | | | | | | | | | | | | |
Marine | | | | | | | | | | | | | | | | |
Nippon Yusen KK* | | | (12,600 | ) | | | (266,485 | ) | | | (2,417 | ) | | | 0.0 | (a) |
| | | | | | | | | | | | | | | | |
Media | | | | | | | | | | | | | | | | |
LIFULL Co. Ltd. | | | (5,700 | ) | | | (43,801 | ) | | | (238 | ) | | | 0.0 | (a) |
| | | | | | | | | | | | | | | | |
Multiline Retail | | | | | | | | | | | | | | | | |
Don Quijote Holdings Co. Ltd. | | | (5,300 | ) | | | (222,309 | ) | | | (1,602 | ) | | | 0.0 | (a) |
Isetan Mitsukoshi Holdings Ltd. | | | (19,900 | ) | | | (216,926 | ) | | | (2,008 | ) | | | 0.0 | (a) |
Marui Group Co. Ltd. | | | (15,500 | ) | | | (237,222 | ) | | | (2,074 | ) | | | 0.0 | (a) |
| | | | | | | | | | | | | | | | |
| | | (40,700 | ) | | | (676,457 | ) | | | (5,684 | ) | | | 0.0 | (a) |
| | | | | | | | | | | | | | | | |
Pharmaceuticals | | | | | | | | | | | | | | | | |
Chugai Pharmaceutical Co. Ltd.* | | | (5,100 | ) | | | (243,152 | ) | | | (946 | ) | | | 0.0 | (a) |
| | | | | | | | | | | | | | | | |
Real Estate Management & Development | | | | | | | | | | | | | | | | |
Mitsubishi Estate Co. Ltd.* | | | (13,400 | ) | | | (243,003 | ) | | | (1,943 | ) | | | 0.0 | (a) |
| | | | | | | | | | | | | | | | |
Road & Rail | | | | | | | | | | | | | | | | |
Keio Corp. | | | (5,200 | ) | | | (226,869 | ) | | | (1,408 | ) | | | 0.0 | (a) |
Kintetsu Group Holdings Co. Ltd.* | | | (6,300 | ) | | | (242,253 | ) | | | (1,235 | ) | | | 0.0 | (a) |
Odakyu Electric Railway Co. Ltd. | | | (11,400 | ) | | | (223,010 | ) | | | (1,436 | ) | | | 0.0 | (a) |
Tokyu Corp. | | | (15,800 | ) | | | (239,008 | ) | | | (1,393 | ) | | | 0.0 | (a) |
| | | | | | | | | | | | | | | | |
| | | (38,700 | ) | | | (931,140 | ) | | | (5,472 | ) | | | 0.0 | (a) |
| | | | | | | | | | | | | | | | |
Software | | | | | | | | | | | | | | | | |
LINE Corp.* | | | (7,300 | ) | | | (302,367 | ) | | | (2,868 | ) | | | 0.0 | (a) |
Nintendo Co. Ltd. | | | (600 | ) | | | (232,777 | ) | | | (1,653 | ) | | | 0.0 | (a) |
| | | | | | | | | | | | | | | | |
| | | (7,900 | ) | | | (535,144 | ) | | | (4,521 | ) | | | 0.0 | (a) |
| | | | | | | | | | | | | | | | |
Specialty Retail | | | | | | | | | | | | | | | | |
Fast Retailing Co. Ltd. | | | (700 | ) | | | (234,203 | ) | | | (2,665 | ) | | | 0.0 | (a) |
IDOM, Inc.* | | | (14,800 | ) | | | (107,930 | ) | | | (677 | ) | | | 0.0 | (a) |
| | | | | | | | | | | | | | | | |
| | | (15,500 | ) | | | (342,133 | ) | | | (3,342 | ) | | | 0.0 | (a) |
| | | | | | | | | | | | | | | | |
Technology Hardware, Storage & Peripherals | | | | | | | | | | | | | | | | |
Ricoh Co. Ltd. | | | (23,100 | ) | | | (214,364 | ) | | | (1,862 | ) | | | 0.0 | (a) |
| | | | | | | | | | | | | | | | |
Trading Companies & Distributors | | | | | | | | | | | | | | | | |
MonotaRO Co. Ltd.* | | | (8,700 | ) | | | (239,577 | ) | | | (1,619 | ) | | | 0.0 | (a) |
| | | | | | | | | | | | | | | | |
Transportation Infrastructure | | | | | | | | | | | | | | | | |
Mitsubishi Logistics Corp. | | | (9,300 | ) | | | (240,876 | ) | | | (1,638 | ) | | | 0.0 | (a) |
| | | | | | | | | | | | | | | | |
Total Short Positions of Total Return Basket Swaps | | | (774,600 | ) | | | (11,320,621 | ) | | | (74,102 | ) | | | 0.0 | (a) |
| | | | | | | | | | | | | | | | |
Total of Long and Short Positions of Total Return Basket Swaps | | | (606,300 | ) | | | (8,204,733 | ) | | | (55,222 | ) | | | 0.0 | (a) |
| | | | | | | | | | | | | | | | |
| | | | | | | | | | | | | | | | | | | | | | |
| COUNTERPARTY | | DESCRIPTION | | TERMINATION DATE | | | NOTIONAL VALUE (1) | | | NET UNREALIZED APPRECIATION (DEPRECIATION) (2) | | | NET CASH AND OTHER RECEIVABLES (PAYABLES) | | | VALUE
(Note 2C(3)) | |
| Bank of America | | The Fund receives the total return on a portfolio of long and short equity positions and pays or receives the net of one month BBR on long positions and short positions respectively, which is denominated in AUD based on the local currencies of the positions within the swaps. | | | 10/18/2018 | | | $ | (751,083 | ) | | $ | (1,357 | ) | | $ | — | | | $ | (1,357 | ) |
| | | | | | | | | | | | | | | | | | | | | | |
SEE NOTES TO CONSOLIDATED FINANCIAL STATEMENTS.
| | | | | | | | |
| | | |
| OCTOBER 31, 2017 | | JPMORGAN EXCHANGE-TRADED FUNDS | | | | | 23 | |
JPMorgan Diversified Alternatives ETF
ADDITIONAL INFORMATION-TOTAL RETURN BASKET SWAPS
AS OF OCTOBER 31, 2017 (continued)
| | | | | | | | | | | | | | | | |
| REFERENCE ENTITY | | SHARES | | | NOTIONAL VALUE($) (1) | | | UNREALIZED APPRECIATION (DEPRECIATION)($) (2) | | | PERCENTAGE OF NET ASSETS (%) | |
Long Positions | |
| | |
Common Stocks | | | | | | | | | |
Metals & Mining | | | | | | | | | |
Fortescue Metals Group Ltd. | | | 22,105 | | | | 78,597 | | | | 97 | | | | 0.0 | (a) |
Rio Tinto Ltd. | | | 2,561 | | | | 136,466 | | | | 340 | | | | 0.0 | (a) |
| | | | | | | | | | | | | | | | |
| | | 24,666 | | | | 215,063 | | | | 437 | | | | 0.0 | (a) |
| | | | | | | | | | | | | | | | |
Total Long Positions of Total Return Basket Swaps | | | 24,666 | | | | 215,063 | | | | 437 | | | | 0.0 | (a) |
| | | | | | | | | | | | | | | | |
| | | | |
Short Positions | | | | | | | | | | | | | | | | |
| | | | |
Common Stocks | | | | | | | | | | | | | | | | |
Capital Markets | | | | | | | | | |
Platinum Asset Management Ltd. | | | (13,175 | ) | | | (73,635 | ) | | | (25 | ) | | | 0.0 | (a) |
| | | | | | | | | | | | | | | | |
Health Care Providers & Services | | | | | | | | | | | | | | | | |
Healthscope Ltd. | | | (171,545 | ) | | | (257,684 | ) | | | (352 | ) | | | 0.0 | (a) |
| | | | | | | | | | | | | | | | |
Hotels, Restaurants & Leisure | | | | | | | | | | | | | | | | |
Domino’s Pizza Enterprises Ltd. | | | (3,517 | ) | | | (125,743 | ) | | | (335 | ) | | | 0.0 | (a) |
| | | | | | | | | | | | | | | | |
Internet Software & Services | | | | | | | | | | | | | | | | |
NEXTDC Ltd.* | | | (63,208 | ) | | | (250,023 | ) | | | (401 | ) | | | 0.0 | (a) |
| | | | | | | | | | | | | | | | |
Metals & Mining | | | | | | | | | | | | | | | | |
Iluka Resources Ltd. | | | (34,236 | ) | | | (246,702 | ) | | | (661 | ) | | | 0.0 | (a) |
| | | | | | | | | | | | | | | | |
Professional Services | | | | | | | | | | | | | | | | |
IPH Ltd. | | | (2,756 | ) | | | (12,359 | ) | | | (20 | ) | | | 0.0 | (a) |
| | | | | | | | | | | | | | | | |
Total Short Positions of Total Return Basket Swaps | | | (288,437 | ) | | | (966,146 | ) | | | (1,794 | ) | | | 0.0 | (a) |
| | | | | | | | | | | | | | | | |
Total of Long and Short Positions of Total Return Basket Swaps | | | (263,771 | ) | | | (751,083 | ) | | | (1,357 | ) | | | 0.0 | (a) |
| | | | | | | | | | | | | | | | |
| | | | | | | | | | | | | | | | | | | | | | |
| COUNTERPARTY | | DESCRIPTION | | TERMINATION DATE | | | NOTIONAL VALUE (1) | | | NET UNREALIZED APPRECIATION (DEPRECIATION) (2) | | | NET CASH AND OTHER RECEIVABLES (PAYABLES) | | | VALUE
(Note 2C(3)) | |
| Bank of America | | The Fund receives the total return on a portfolio of long and short equity positions and pays or receives the net of one month LIBOR on long positions and short positions respectively, which is denominated in CHF based on the local currencies of the positions within the swaps. | | | 03/29/2019 | | | $ | (756,833 | ) | | $ | (222 | ) | | $ | — | | | $ | (222 | ) |
| | | | | | | | | | | | | | | | | | | | | | |
| | | | | | | | | | | | | | | | |
| REFERENCE ENTITY | | SHARES | | | NOTIONAL VALUE($) (1) | | | UNREALIZED APPRECIATION (DEPRECIATION)($) (2) | | | PERCENTAGE OF NET ASSETS (%) | |
Long Positions | |
| | |
Common Stocks | | | | | | | | | |
Electrical Equipment | | | | | | | | | |
ABB Ltd. (Registered) | | | 926 | | | | 24,182 | | | | (24 | ) | | | 0.0 | (a) |
| | | | | | | | | | | | | | | | |
| | | | |
Short Positions | | | | | | | | | | | | | | | | |
| | | | |
Common Stocks | | | | | | | | | | | | | | | | |
Machinery | | | | | | | | | | | | | | | | |
Burckhardt Compression Holding AG | | | (847 | ) | | | (252,331 | ) | | | 32 | | | | 0.0 | (a) |
| | | | | | | | | | | | | | | | |
SEE NOTES TO CONSOLIDATED FINANCIAL STATEMENTS.
| | | | | | |
| | | |
| 24 | | | | JPMORGAN EXCHANGE-TRADED FUNDS | | OCTOBER 31, 2017 |
| | | | | | | | | | | | | | | | |
| REFERENCE ENTITY | | SHARES | | | NOTIONAL VALUE($) (1) | | | UNREALIZED APPRECIATION (DEPRECIATION)($) (2) | | | PERCENTAGE OF NET ASSETS (%) | |
Short Positions — continued | | | | | | | | | | | | | | | | |
| | | | |
Common Stocks — continued | | | | | | | | | | | | | | | | |
Semiconductors & Semiconductor Equipment | | | | | | | | | | | | | | | | |
ams AG | | | (3,199 | ) | | | (291,866 | ) | | | (232 | ) | | | 0.0 | (a) |
| | | | | | | | | | | | | | | | |
Specialty Retail | | | | | | | | | | | | | | | | |
Dufry AG (Registered)* | | | (1,591 | ) | | | (236,818 | ) | | | 2 | | | | 0.0 | (a) |
| | | | | | | | | | | | | | | | |
Total Short Positions of Total Return Basket Swaps | | | (5,637 | ) | | | (781,015 | ) | | | (198 | ) | | | 0.0 | (a) |
| | | | | | | | | | | | | | | | |
Total of Long and Short Positions of Total Return Basket Swaps | | | (4,711 | ) | | | (756,833 | ) | | | (222 | ) | | | 0.0 | (a) |
| | | | | | | | | | | | | | | | |
| | | | | | | | | | | | | | | | | | | | | | |
| COUNTERPARTY | | DESCRIPTION | | TERMINATION DATE | | | NOTIONAL VALUE (1) | | | NET UNREALIZED APPRECIATION (DEPRECIATION) (2) | | | NET CASH AND OTHER RECEIVABLES (PAYABLES) | | | VALUE
(Note 2C(3)) | |
| Bank of America | | The Fund receives the total return on a portfolio of long and short equity positions and pays or receives the net of one month LIBOR on long positions and short positions respectively, which is denominated in GBP based on the local currencies of the positions within the swaps. | | | 03/29/2019 | | | $ | 644,931 | | | $ | (25 | ) | | $ | — | | | $ | (25 | ) |
| | | | | | | | | | | | | | | | | | | | | | |
| | | | | | | | | | | | | | | | |
| REFERENCE ENTITY | | SHARES | | | NOTIONAL VALUE($) (1) | | | UNREALIZED APPRECIATION (DEPRECIATION)($) (2) | | | PERCENTAGE OF NET ASSETS (%) | |
Long Positions | | | | | | | | | | | | | | | | |
| | | | |
Common Stocks | | | | | | | | | | | | | | | | |
Capital Markets | | | | | | | | | | | | | | | | |
Sole Realisation Co. plc*‡ | | | 153 | | | | 142 | | | | — | | | | 0.0 | |
| | | | | | | | | | | | | | | | |
Food & Staples Retailing | | | | | | | | | | | | | | | | |
Booker Group plc | | | 90,905 | | | | 242,920 | | | | — | | | | 0.0 | |
| | | | | | | | | | | | | | | | |
IT Services | | | | | | | | | | | | | | | | |
Paysafe Group plc* | | | 75,624 | | | | 588,578 | | | | — | | | | 0.0 | |
| | | | | | | | | | | | | | | | |
Total Long Positions of Total Return Basket Swaps | | | 166,682 | | | | 831,640 | | | | — | | | | 0.0 | |
| | | | | | | | | | | | | | | | |
| | | | |
Short Positions | | | | | | | | | | | | | | | | |
| | | | |
Common Stocks | | | | | | | | | | | | | | | | |
Food & Staples Retailing | | | | | | | | | | | | | | | | |
Tesco plc | | | (77,486 | ) | | | (186,709 | ) | | | (25 | ) | | | 0.0 | (a) |
| | | | | | | | | | | | | | | | |
Total of Long and Short Positions of Total Return Basket Swaps | | | 89,196 | | | | 644,931 | | | | (25 | ) | | | 0.0 | (a) |
| | | | | | | | | | | | | | | | |
| | | | | | | | | | | | | | | | | | | | | | |
| COUNTERPARTY | | DESCRIPTION | | TERMINATION DATE | | | NOTIONAL VALUE (1) | | | NET UNREALIZED APPRECIATION (DEPRECIATION) (2) | | | NET CASH AND OTHER RECEIVABLES (PAYABLES) | | | VALUE
(Note 2C(3)) | |
| Bank of America | | The Fund receives the total return on a portfolio of long and short equity positions and pays or receives the net of one month LIBOR on long positions and short positions respectively, which is denominated in USD based on the local currencies of the positions within the swaps. | | | 10/18/2018 | | | $ | 2,405,892 | | | $ | — | | | $ | — | | | $ | — | |
| | | | | | | | | | | | | | | | | | | | | | |
SEE NOTES TO CONSOLIDATED FINANCIAL STATEMENTS.
| | | | | | | | |
| | | |
| OCTOBER 31, 2017 | | JPMORGAN EXCHANGE-TRADED FUNDS | | | | | 25 | |
JPMorgan Diversified Alternatives ETF
ADDITIONAL INFORMATION-TOTAL RETURN BASKET SWAPS
AS OF OCTOBER 31, 2017 (continued)
| | | | | | | | | | | | | | | | |
| REFERENCE ENTITY | | SHARES | | | NOTIONAL VALUE($) (1) | | | UNREALIZED APPRECIATION (DEPRECIATION)($) (2) | | | PERCENTAGE OF NET ASSETS (%) | |
Long Positions | | | | | | | | | | | | | | | | |
| | | | |
Common Stocks | | | | | | | | | | | | | | | | |
Banks | | | | | | | | | | | | | | | | |
MainSource Financial Group, Inc. | | | 3,208 | | | | 120,910 | | | | — | | | | 0.0 | |
| | | | | | | | | | | | | | | | |
Diversified Telecommunication Services | | | | | | | | | | | | | | | | |
Level 3 Communications, Inc.* | | | 784 | | | | 42,046 | | | | — | | | | 0.0 | |
| | | | | | | | | | | | | | | | |
Health Care Equipment & Supplies | | | | | | | | | | | | | | | | |
CR Bard, Inc. | | | 5,448 | | | | 1,781,877 | | | | — | | | | 0.0 | |
| | | | | | | | | | | | | | | | |
Internet & Direct Marketing Retail | | | | | | | | | | | | | | | | |
HSN, Inc. | | | 14,258 | | | | 537,527 | | | | — | | | | 0.0 | |
| | | | | | | | | | | | | | | | |
Media | | | | | | | | | | | | | | | | |
Time Warner, Inc. | | | 16,319 | | | | 1,603,995 | | | | — | | | | 0.0 | |
| | | | | | | | | | | | | | | | |
Oil, Gas & Consumable Fuels | | | | | | | | | | | | | | | | |
Rice Energy, Inc.* | | | 41,768 | | | | 1,184,123 | | | | — | | | | 0.0 | |
| | | | | | | | | | | | | | | | |
Semiconductors & Semiconductor Equipment | | | | | | | | | | | | | | | | |
IXYS Corp.* | | | 5,124 | | | | 126,563 | | | | — | | | | 0.0 | |
| | | | | | | | | | | | | | | | |
Total Long Positions of Total Return Basket Swaps | | | 86,909 | | | | 5,397,041 | | | | — | | | | 0.0 | |
| | | | | | | | | | | | | | | | |
| | | | |
Short Positions | | | | | | | | | | | | | | | | |
| | | | |
Common Stocks | | | | | | | | | | | | | | | | |
Banks | | | | | | | | | | | | | | | | |
First Financial Bancorp | | | (4,406 | ) | | | (120,284 | ) | | | — | | | | 0.0 | |
| | | | | | | | | | | | | | | | |
Diversified Telecommunication Services | | | | | | | | | | | | | | | | |
AT&T, Inc. | | | (25,005 | ) | | | (841,418 | ) | | | — | | | | 0.0 | |
CenturyLink, Inc. | | | (1,108 | ) | | | (21,041 | ) | | | — | | | | 0.0 | |
| | | | | | | | | | | | | | | | |
| | | (26,113 | ) | | | (862,459 | ) | | | — | | | | 0.0 | |
| | | | | | | | | | | | | | | | |
Electronic Equipment, Instruments & Components | | | | | | | | | | | | | | | | |
Littelfuse, Inc. | | | (321 | ) | | | (67,089 | ) | | | — | | | | 0.0 | |
| | | | | | | | | | | | | | | | |
Health Care Equipment & Supplies | | | | | | | | | | | | | | | | |
Becton Dickinson and Co. | | | (2,737 | ) | | | (571,130 | ) | | | — | | | | 0.0 | |
| | | | | | | | | | | | | | | | |
Internet & Direct Marketing Retail | | | | | | | | | | | | | | | | |
Liberty Interactive Corp. QVC Group* | | | (23,290 | ) | | | (529,149 | ) | | | — | | | | 0.0 | |
| | | | | | | | | | | | | | | | |
Oil, Gas & Consumable Fuels | | | | | | | | | | | | | | | | |
EQT Corp. | | | (13,448 | ) | | | (841,038 | ) | | | — | | | | 0.0 | |
| | | | | | | | | | | | | | | | |
Total Short Positions of Total Return Basket Swaps | | | (70,315 | ) | | | (2,991,149 | ) | | | — | | | | 0.0 | |
| | | | | | | | | | | | | | | | |
Total of Long and Short Positions of Total Return Basket Swaps | | | 16,594 | | | | 2,405,892 | | | | — | | | | 0.0 | |
| | | | | | | | | | | | | | | | |
| | | | | | | | | | | | | | | | | | | | | | |
| COUNTERPARTY | | DESCRIPTION | | TERMINATION DATE | | | NOTIONAL VALUE (1) | | | NET UNREALIZED APPRECIATION (DEPRECIATION) (2) | | | NET CASH AND OTHER RECEIVABLES (PAYABLES) | | | VALUE (Note 2C(3)) | |
| Bank of America | | The Fund receives the total return on a portfolio of long and short equity positions and pays or receives the net of one month BA on long positions and short positions respectively, which is denominated in CAD based on the local currencies of the positions within the swaps. | | | 10/18/2018 to 10/22/2018 | | | $ | 426,324 | | | $ | — | | | $ | — | | | $ | — | |
| | | | | | | | | | | | | | | | | | | | | | |
SEE NOTES TO CONSOLIDATED FINANCIAL STATEMENTS.
| | | | | | |
| | | |
| 26 | | | | JPMORGAN EXCHANGE-TRADED FUNDS | | OCTOBER 31, 2017 |
| | | | | | | | | | | | | | | | |
| REFERENCE ENTITY | | SHARES | | | NOTIONAL VALUE($) (1) | | | UNREALIZED APPRECIATION (DEPRECIATION)($) (2) | | | PERCENTAGE OF NET ASSETS (%) | |
Long Positions | | | | | | | | | | | | | | | | |
| | | | |
Common Stocks | | | | | | | | | | | | | | | | |
Food & Staples Retailing | | | | | | | | | | | | | | | | |
Jean Coutu Group PJC, Inc. (The) | | | 13,533 | | | | 256,792 | | | | — | | | | 0.0 | |
| | | | | | | | | | | | | | | | |
Metals & Mining | | | | | | | | | | | | | | | | |
Richmont Mines, Inc.* | | | 26,860 | | | | 233,810 | | | | — | | | | 0.0 | |
| | | | | | | | | | | | | | | | |
Total Long Positions of Total Return Basket Swaps | | | 40,393 | | | | 490,602 | | | | — | | | | 0.0 | |
| | | | | | | | | | | | | | | | |
| | | | |
Short Positions | | | | | | | | | | | | | | | | |
| | | | |
Common Stocks | | | | | | | | | | | | | | | | |
Food & Staples Retailing | | | | | | | | | | | | | | | | |
Metro, Inc. | | | (2,042 | ) | | | (64,278 | ) | | | — | | | | 0.0 | |
| | | | | | | | | | | | | | | | |
Total of Long and Short Positions of Total Return Basket Swaps | | | 38,351 | | | | 426,324 | | | | — | | | | 0.0 | |
| | | | | | | | | | | | | | | | |
| | | | | | | | | | | | | | | | | | | | | | |
| COUNTERPARTY | | DESCRIPTION | | TERMINATION DATE | | | NOTIONAL VALUE (1) | | | NET UNREALIZED APPRECIATION (DEPRECIATION) (2) | | | NET CASH AND OTHER RECEIVABLES (PAYABLES) | | | VALUE (Note 2C(3)) | |
| Bank of America | | The Fund receives the total return on a portfolio of short equity positions and pays or receives the net of one month EURIBOR on short positions, which is denominated in EUR based on the local currencies of the positions within the swaps. | | | 04/30/2019 | | | $ | (427,302 | ) | | $ | (409 | ) | | $ | — | | | $ | (409 | ) |
| | | | | | | | | | | | | | | | | | | | | | |
| | | | | | | | | | | | | | | | |
| REFERENCE ENTITY | | SHARES | | | NOTIONAL VALUE($) (1) | | | UNREALIZED APPRECIATION (DEPRECIATION)($) (2) | | | PERCENTAGE OF NET ASSETS (%) | |
Short Positions | | | | | | | | | | | | | | | | |
| | | | |
Common Stocks | | | | | | | | | | | | | | | | |
Construction & Engineering | | | | | | | | | | | | | | | | |
HOCHTIEF AG | | | (2,419 | ) | | | (427,302 | ) | | | (409 | ) | | | 0.0 | (a) |
| | | | | | | | | | | | | | | | |
| | | | | | | | | | | | | | | | | | | | | | |
| COUNTERPARTY | | DESCRIPTION | | TERMINATION DATE | | | NOTIONAL VALUE (1) | | | NET UNREALIZED APPRECIATION (DEPRECIATION) (2) | | | NET CASH AND OTHER RECEIVABLES (PAYABLES) | | | VALUE (Note 2C(3)) | |
| Bank of America | | The Fund receives the total return on a portfolio of long and short equity positions and pays or receives the net of one month BBR on long positions and short positions respectively, which is denominated in AUD based on the local currencies of the positions within the swaps. | | | 10/18/2018 | | | $ | 33,143 | | | $ | 121 | | | $ | — | | | $ | 121 | |
| | | | | | | | | | | | | | | | | | | | | | |
SEE NOTES TO CONSOLIDATED FINANCIAL STATEMENTS.
| | | | | | | | |
| | | |
| OCTOBER 31, 2017 | | JPMORGAN EXCHANGE-TRADED FUNDS | | | | | 27 | |
JPMorgan Diversified Alternatives ETF
ADDITIONAL INFORMATION-TOTAL RETURN BASKET SWAPS
AS OF OCTOBER 31, 2017 (continued)
| | | | | | | | | | | | | | | | |
| REFERENCE ENTITY | | SHARES | | | NOTIONAL VALUE($) (1) | | | UNREALIZED APPRECIATION (DEPRECIATION)($) (2) | | | PERCENTAGE OF NET ASSETS (%) | |
Long Positions | | | | | | | | | | | | | | | | |
| | | | |
Common Stocks | | | | | | | | | | | | | | | | |
Hotels, Restaurants & Leisure | | | | | | | | | | | | | | | | |
Tatts Group Ltd. | | | 70,285 | | | | 224,676 | | | | 361 | | | | 0.0 | (a) |
| | | | | | | | | | | | | | | | |
| | | | |
Short Positions | | | | | | | | | | | | | | | | |
| | | | |
Common Stocks | | | | | | | | | | | | | | | | |
Hotels, Restaurants & Leisure | | | | | | | | | | | | | | | | |
Tabcorp Holdings Ltd. | | | (55,666 | ) | | | (191,533 | ) | | | (240 | ) | | | 0.0 | (a) |
| | | | | | | | | | | | | | | | |
Total of Long and Short Positions of Total Return Basket Swaps | | | 14,619 | | | | 33,143 | | | | 121 | | | | 0.0 | (a) |
| | | | | | | | | | | | | | | | |
| | | | | | | | | | | | | | | | | | | | | | |
| COUNTERPARTY | | DESCRIPTION | | TERMINATION DATE | | | NOTIONAL VALUE (1) | | | NET UNREALIZED APPRECIATION (DEPRECIATION) (2) | | | NET CASH AND OTHER RECEIVABLES (PAYABLES) | | | VALUE (Note 2C(3)) | |
| UBS | | The Fund receives the total return on a portfolio of long and short equity positions and pays or receives the net of one month LIBOR on long positions and short positions respectively, plus or minus a specified spread (rates range from 0.0% to 0.25%), which is denominated in GBP based on the local currencies of the positions within the swaps. | | | 09/12/2019 | | | $ | 2,813,663 | | | $ | 41 | | | $ | — | | | $ | 41 | |
| | | | | | | | | | | | | | | | | | | | | | |
| | | | | | | | | | | | | | | | |
| REFERENCE ENTITY | | SHARES | | | NOTIONAL VALUE($) (1) | | | UNREALIZED APPRECIATION (DEPRECIATION)($) (2) | | | PERCENTAGE OF NET ASSETS (%) | |
Long Positions | | | | | | | | | | | | | | | | |
| | | | |
Common Stocks | | | | | | | | | | | | | | | | |
Banks | | | | | | | | | | | | | | | | |
Aldermore Group plc* | | | 51,816 | | | | 207,147 | | | | — | | | | 0.0 | |
| | | | | | | | | | | | | | | | |
Capital Markets | | | | | | | | | | | | | | | | |
Sole Realisation Co. plc*‡ | | | 698 | | | | 649 | | | | — | | | | 0.0 | |
| | | | | | | | | | | | | | | | |
Health Care Providers & Services | | | | | | | | | | | | | | | | |
Spire Healthcare Group plc* (b) | | | 64,054 | | | | 252,736 | | | | 68 | | | | 0.0 | (a) |
| | | | | | | | | | | | | | | | |
IT Services | | | | | | | | | | | | | | | | |
Paysafe Group plc* | | | 57,395 | | | | 446,703 | | | | — | | | | 0.0 | |
| | | | | | | | | | | | | | | | |
Media | | | | | | | | | | | | | | | | |
Sky plc | | | 139,685 | | | | 1,749,452 | | | | (27 | ) | | | 0.0 | (a) |
| | | | | | | | | | | | | | | | |
Semiconductors & Semiconductor Equipment | | | | | | | | | | | | | | | | |
Imagination Technologies Group plc* | | | 112,914 | | | | 270,690 | | | | — | | | | 0.0 | |
| | | | | | | | | | | | | | | | |
Total Long Positions of Total Return Basket Swaps | | | 426,562 | | | | 2,927,377 | | | | 41 | | | | 0.0 | (a) |
| | | | | | | | | | | | | | | | |
| | | | |
Short Positions | | | | | | | | | | | | | | | | |
| | | | |
Common Stocks | | | | | | | | | | | | | | | | |
Health Care Providers & Services | | | | | | | | | | | | | | | | |
Mediclinic International plc | | | (14,711 | ) | | | (113,714 | ) | | | — | | | | 0.0 | |
| | | | | | | | | | | | | | | | |
Total of Long and Short Positions of Total Return Basket Swaps | | | 411,851 | | | | 2,813,663 | | | | 41 | | | | 0.0 | (a) |
| | | | | | | | | | | | | | | | |
SEE NOTES TO CONSOLIDATED FINANCIAL STATEMENTS.
| | | | | | |
| | | |
| 28 | | | | JPMORGAN EXCHANGE-TRADED FUNDS | | OCTOBER 31, 2017 |
| | | | | | | | | | | | | | | | | | | | | | |
| COUNTERPARTY | | DESCRIPTION | | TERMINATION DATE | | | NOTIONAL VALUE (1) | | | NET UNREALIZED APPRECIATION (DEPRECIATION) | | | NET CASH AND OTHER RECEIVABLES (PAYABLES) (2) | | | VALUE (Note 2C(3)) | |
| UBS | | The Fund receives the total return on a portfolio of long and short equity positions and pays or receives the net of one month LIBOR on long positions and short positions respectively, plus or minus a specified spread (rates range from 0.0% to 0.25%), which is denominated in USD based on the local currencies of the positions within the swaps. | | | 09/12/2019 | | | $ | 1,096,412 | | | $ | — | | | $ | — | | | $ | — | |
| | | | | | | | | | | | | | | | | | | | | | |
| | | | | | | | | | | | | | | | |
| REFERENCE ENTITY | | SHARES | | | NOTIONAL VALUE($) (1) | | | UNREALIZED APPRECIATION (DEPRECIATION)($) (2) | | | PERCENTAGE OF NET ASSETS (%) | |
Long Positions | | | | | | | | | | | | | | | | |
| | | | |
Common Stocks | | | | | | | | | | | | | | | | |
Diversified Consumer Services | | | | | | | | | | | | | | | | |
Capella Education Co. | | | 3,871 | | | | 315,293 | | | | — | | | | 0.0 | |
| | | | | | | | | | | | | | | | |
Diversified Telecommunication Services | | | | | | | | | | | | | | | | |
Level 3 Communications, Inc.* | | | 29,385 | | | | 1,575,918 | | | | — | | | | 0.0 | |
| | | | | | | | | | | | | | | | |
Household Durables | | | | | | | | | | | | | | | | |
CalAtlantic Group, Inc. | | | 30,000 | | | | 1,480,200 | | | | — | | | | 0.0 | |
| | | | | | | | | | | | | | | | |
Independent Power and Renewable Electricity Producers | | | | | | | | | | | | | | | | |
Dynegy, Inc.* | | | 79,900 | | | | 994,755 | | | | — | | | | 0.0 | |
| | | | | | | | | | | | | | | | |
Total Long Positions of Total Return Basket Swaps | | | 143,156 | | | | 4,366,166 | | | | — | | | | 0.0 | |
| | | | | | | | | | | | | | | | |
| | | | |
Short Positions | | | | | | | | | | | | | | | | |
| | | | |
Common Stocks | | | | | | | | | | | | | | | | |
Diversified Consumer Services | | | | | | | | | | | | | | | | |
Strayer Education, Inc.* | | | (3,353 | ) | | | (314,277 | ) | | | — | | | | 0.0 | |
| | | | | | | | | | | | | | | | |
Diversified Telecommunication Services | | | | | | | | | | | | | | | | |
CenturyLink, Inc. | | | (41,560 | ) | | | (789,224 | ) | | | — | | | | 0.0 | |
| | | | | | | | | | | | | | | | |
Household Durables | | | | | | | | | | | | | | | | |
Lennar Corp. | | | (20,300 | ) | | | (1,130,101 | ) | | | — | | | | 0.0 | |
| | | | | | | | | | | | | | | | |
Independent Power and Renewable Electricity Producers | | | | | | | | | | | | | | | | |
Vistra Energy Corp. | | | (53,300 | ) | | | (1,036,152 | ) | | | — | | | | 0.0 | |
| | | | | | | | | | | | | | | | |
Total Short Positions of Total Return Basket Swaps | | | (118,513 | ) | | | (3,269,754 | ) | | | — | | | | 0.0 | |
| | | | | | | | | | | | | | | | |
Total of Long and Short Positions of Total Return Basket Swaps | | | 24,643 | | | | 1,096,412 | | | | — | | | | 0.0 | |
| | | | | | | | | | | | | | | | |
| | | | | | | | | | | | | | | | | | | | | | |
| COUNTERPARTY | | DESCRIPTION | | TERMINATION DATE | | | NOTIONAL VALUE (1) | | | NET UNREALIZED APPRECIATION (DEPRECIATION) | | | NET CASH AND OTHER RECEIVABLES (PAYABLES) (2) | | | VALUE (Note 2C(3)) | |
| UBS | | The Fund receives the total return on a portfolio of long equity positions and pays or receives the net of one month CDOR on long positions, plus or minus a specified spread (rates range from 0.0% to 0.15%), which is denominated in CAD based on the local currencies of the positions within the swaps. | | | 09/12/2019 | | | $ | 419,143 | | | $ | — | | | $ | — | | | $ | — | |
| | | | | | | | | | | | | | | | | | | | | | |
SEE NOTES TO CONSOLIDATED FINANCIAL STATEMENTS.
| | | | | | | | |
| | | |
| OCTOBER 31, 2017 | | JPMORGAN EXCHANGE-TRADED FUNDS | | | | | 29 | |
JPMorgan Diversified Alternatives ETF
ADDITIONAL INFORMATION-TOTAL RETURN BASKET SWAPS
AS OF OCTOBER 31, 2017 (continued)
| | | | | | | | | | | | | | | | |
| REFERENCE ENTITY | | SHARES | | | NOTIONAL VALUE($) (1) | | | UNREALIZED APPRECIATION (DEPRECIATION)($) (2) | | | PERCENTAGE OF NET ASSETS (%) | |
Long Positions | | | | | | | | | | | | | | | | |
| | | | |
Common Stocks | | | | | | | | | | | | | | | | |
Construction & Engineering | | | | | | | | | | | | | | | | |
Aecon Group, Inc. | | | 27,830 | | | | 419,143 | | | | — | | | | 0.0 | |
| | | | | | | | | | | | | | | | |
| | | | | | | | | | | | | | | | | | | | | | |
| COUNTERPARTY | | DESCRIPTION | | TERMINATION
DATE | | | NOTIONAL
VALUE (1) | | | NET UNREALIZED
APPRECIATION
(DEPRECIATION) (2) | | | NET CASH
AND OTHER
RECEIVABLES
(PAYABLES) | | | VALUE
(Note 2C(3)) | |
| UBS | | The Fund receives the total return on a portfolio of long equity positions and pays or receives the net of one month LIBOR on long positions, plus or minus a specified spread (rates range from 0.25% to 0.75%), which is denominated in EUR based on the local currencies of the positions within the swaps. | | | 09/12/2019 | | | $ | 3,215,506 | | | $ | (577 | ) | | $ | — | | | $ | (577 | ) |
| | | | | | | | | | | | | | | | | | | | | | |
| | | | | | | | | | | | | | | | |
| REFERENCE ENTITY | | SHARES | | | NOTIONAL VALUE($) (1) | | | UNREALIZED APPRECIATION (DEPRECIATION)($) (2) | | | PERCENTAGE
OF NET ASSETS (%) | |
Long Positions | | | | | | | | | | | | | | | | |
| | | | |
Common Stocks | | | | | | | | | | | | | | | | |
Aerospace & Defense | | | | | | | | | | | | | | | | |
Zodiac Aerospace | | | 25,080 | | | | 716,857 | | | | (357 | ) | | | 0.0 | (a) |
| | | | | | | | | | | | | | | | |
Beverages | | | | | | | | | | | | | | | | |
Refresco Group NV(b) | | | 8,704 | | | | 201,256 | | | | — | | | | 0.0 | |
| | | | | | | | | | | | | | | | |
Machinery | | | | | | | | | | | | | | | | |
Pfeiffer Vacuum Technology AG | | | 524 | | | | 84,141 | | | | — | | | | 0.0 | |
| | | | | | | | | | | | | | | | |
Pharmaceuticals | | | | | | | | | | | | | | | | |
STADA Arzneimittel AG | | | 2,810 | | | | 270,205 | | | | — | | | | 0.0 | |
| | | | | | | | | | | | | | | | |
Transportation Infrastructure | | | | | | | | | | | | | | | | |
Abertis Infraestructuras SA | | | 89,836 | | | | 1,943,047 | | | | (220 | ) | | | 0.0 | (a) |
| | | | | | | | | | | | | | | | |
Total Long Positions of Total Return Basket Swaps | | | 126,954 | | | | 3,215,506 | | | | (577 | ) | | | 0.0 | (a) |
| | | | | | | | | | | | | | | | |
| | | | | | | | | | | | | | | | | | | | | | |
| COUNTERPARTY | | DESCRIPTION | | TERMINATION
DATE | | | NOTIONAL
VALUE (1) | | | NET UNREALIZED
APPRECIATION
(DEPRECIATION) (2) | | | NET CASH
AND OTHER
RECEIVABLES
(PAYABLES) | | | VALUE
(Note 2C(3)) | |
| UBS | | The Fund receives the total return on a portfolio of long equity positions and pays or receives the net of one month LIBOR on long positions, plus or minus a specified spread (rates range from 0.0% to 0.40%), which is denominated in JPY based on the local currencies of the positions within the swaps. | | | 09/12/2019 | | | $ | 195,553 | | | $ | 1,490 | | | $ | — | | | $ | 1,490 | |
| | | | | | | | | | | | | | | | | | | | | | |
| | | | | | | | | | | | | | | | |
| REFERENCE ENTITY | | SHARES | | | NOTIONAL VALUE($) (1) | | | UNREALIZED APPRECIATION (DEPRECIATION)($) (2) | | | PERCENTAGE OF NET ASSETS (%) | |
Long Positions | | | | | | | | | | | | | | | | |
| | | | |
Common Stocks | | | | | | | | | | | | | | | | |
Media | | | | | | | | | | | | | | | | |
Asatsu-DK, Inc.* | | | 5,900 | | | | 195,553 | | | | 1,490 | | | | 0.0 | (a) |
| | | | | | | | | | | | | | | | |
SEE NOTES TO CONSOLIDATED FINANCIAL STATEMENTS.
| | | | | | |
| | | |
| 30 | | | | JPMORGAN EXCHANGE-TRADED FUNDS | | OCTOBER 31, 2017 |
| | | | | | | | | | | | | | | | | | | | | | |
| COUNTERPARTY | | DESCRIPTION | | TERMINATION
DATE | | | NOTIONAL
VALUE (1) | | | NET UNREALIZED
APPRECIATION
(DEPRECIATION) (2) | | | NET CASH
AND OTHER
RECEIVABLES
(PAYABLES) | | | VALUE
(Note 2C(3)) | |
| UBS | | The Fund receives the total return on a portfolio of long and short equity positions and pays or receives the net of one month BBSW on long positions and short positions respectively, plus or minus a specified spread (rates range from 0.0% to 0.35%), which is denominated in AUD based on the local currencies of the positions within the swaps. | | | 09/12/2019 | | | $ | 393,701 | | | $ | 470 | | | $ | — | | | $ | 470 | |
| | | | | | | | | | | | | | | | | | | | | | |
| | | | | | | | | | | | | | | | |
| REFERENCE ENTITY | | SHARES | | | NOTIONAL
VALUE($) (1) | | | UNREALIZED
APPRECIATION
(DEPRECIATION)($) (2) | | | PERCENTAGE
OF NET ASSETS (%) | |
Long Positions | | | | | | | | | | | | | | | | |
| | | | |
Common Stocks | | | | | | | | | | | | | | | | |
Hotels, Restaurants & Leisure | | | | | | | | | | | | | | | | |
Mantra Group Ltd. | | | 108,476 | | | | 324,124 | | | | 338 | | | | 0.0 | (a) |
Tatts Group Ltd. | | | 113,716 | | | | 363,510 | | | | 584 | | | | 0.0 | (a) |
| | | | | | | | | | | | | | | | |
| | | 222,192 | | | | 687,634 | | | | 922 | | | | 0.0 | (a) |
| | | | | | | | | | | | | | | | |
Metals & Mining | | | | | | | | | | | | | | | | |
Westgold Resources Ltd.* | | | 10,783 | | | | 15,411 | | | | (63 | ) | | | 0.0 | (a) |
| | | | | | | | | | | | | | | | |
Total Common Stocks | | | 232,975 | | | | 703,045 | | | | 859 | | | | 0.0 | (a) |
| | | | | | | | | | | | | | | | |
Warrant | | | | | | | | | | | | | | | | |
Metals & Mining | | | | | | | | | | | | | | | | |
Westgold Resources Ltd.* | | | 2,156 | | | | 536 | | | | — | | | | 0.0 | |
| | | | | | | | | | | | | | | | |
Total Long Positions of Total Return Basket Swaps | | | 235,131 | | | | 703,581 | | | | 859 | | | | 0.0 | (a) |
| | | | | | | | | | | | | | | | |
|
Short Positions | |
| | |
Common Stocks | | | | | | | | | |
Hotels, Restaurants & Leisure | | | | | | | | | | | | | | | | |
Tabcorp Holdings Ltd. | | | (90,062 | ) | | | (309,880 | ) | | | (389 | ) | | | 0.0 | (a) |
| | | | | | | | | | | | | | | | |
Total of Long and Short Positions of Total Return Basket Swaps | | | 145,069 | | | | 393,701 | | | | 470 | | | | 0.0 | (a) |
| | | | | | | | | | | | | | | | |
| | | | | | | | | | | | | | | | | | | | | | |
| COUNTERPARTY | | DESCRIPTION | | TERMINATION
DATE | | | NOTIONAL
VALUE (1) | | | NET UNREALIZED
APPRECIATION
(DEPRECIATION) (2) | | | NET CASH
AND OTHER
RECEIVABLES
(PAYABLES) | | | VALUE
(Note 2C(3)) | |
| UBS | | The Fund receives the total return on a portfolio of long equity positions and pays or receives the net of one month STIBOR on long positions, plus or minus a specified spread (rates range from 0.0% to 0.35%), which is denominated in SEK based on the local currencies of the positions within the swaps. | | | 09/12/2019 | | | $ | 398,888 | | | $ | (38 | ) | | $ | — | | | $ | (38 | ) |
| | | | | | | | | | | | | | | | | | | | | | |
| | | | | | | | | | | | | | | | |
| REFERENCE ENTITY | | SHARES | | | NOTIONAL
VALUE($) (1) | | | UNREALIZED
APPRECIATION
(DEPRECIATION)($) (2) | | | PERCENTAGE
OF NET ASSETS (%) | |
Long Positions | | | | | | | | | | | | | | | | |
| | | | |
Common Stocks | | | | | | | | | | | | | | | | |
Health Care Equipment & Supplies | | | | | | | | | | | | | | | | |
Getinge AB | | | 20,265 | | | | 398,888 | | | | (38 | ) | | | 0.0 | (a) |
| | | | | | | | | | | | | | | | |
SEE NOTES TO CONSOLIDATED FINANCIAL STATEMENTS.
| | | | | | | | |
| | | |
| OCTOBER 31, 2017 | | JPMORGAN EXCHANGE-TRADED FUNDS | | | | | 31 | |
JPMorgan Diversified Alternatives ETF
ADDITIONAL INFORMATION-TOTAL RETURN BASKET SWAPS
AS OF OCTOBER 31, 2017 (continued)
| | | | | | | | | | | | | | | | | | | | | | |
| COUNTERPARTY | | DESCRIPTION | | TERMINATION
DATE | | | NOTIONAL
VALUE (1) | | | NET UNREALIZED
APPRECIATION
(DEPRECIATION) (2) | | | NET CASH
AND OTHER
RECEIVABLES
(PAYABLES) | | | VALUE
(Note 2C(3)) | |
| UBS | | The Fund receives the total return on a portfolio of long equity positions and pays or receives the net of one month CIBOR on long positions, plus or minus a specified spread (rates range from 0.0% to 0.20%), which is denominated in DKK based on the local currencies of the positions within the swaps. | | | 09/25/2020 | | | $ | 922,010 | | | $ | — | | | $ | — | | | $ | — | |
| | | | | | | | | | | | | | | | | | | | | | |
| | | | | | | | | | | | | | | | |
| REFERENCE ENTITY | | SHARES | | | NOTIONAL
VALUE($) (1) | | | UNREALIZED
APPRECIATION
(DEPRECIATION)($) (2) | | | PERCENTAGE
OF NET ASSETS (%) | |
Long Positions | | | | | | | | | | | | | | | | |
| | | | |
Common Stocks | | | | | | | | | | | | | | | | |
IT Services | | | | | | | | | | | | | | | | |
Nets A/S* (b) | | | 36,113 | | | | 922,010 | | | | — | | | | 0.0 | |
| | | | | | | | | | | | | | | | |
| | | | | | | | | | | | | | | | | | | | | | |
| COUNTERPARTY | | DESCRIPTION | | TERMINATION
DATE | | | NOTIONAL
VALUE (1) | | | NET UNREALIZED
APPRECIATION
(DEPRECIATION) (2) | | | NET CASH
AND OTHER
RECEIVABLES
(PAYABLES) | | | VALUE
(Note 2C(3)) | |
| UBS | | The Fund receives the total return on a portfolio of long and short equity positions and pays or receives the net of one month LIBOR on long positions and short positions respectively, plus or minus a specified spread (rates range from 0.0% to 0.25%), which is denominated in GBP based on the local currencies of the positions within the swaps. | | | 09/12/2019 | | | $ | 6,833,900 | | | $ | 531 | | | $ | — | | | $ | 531 | |
| | | | | | | | | | | | | | | | | | | | | | |
| | | | | | | | | | | | | | | | |
| REFERENCE ENTITY | | SHARES | | | NOTIONAL
VALUE($) (1) | | | UNREALIZED
APPRECIATION
(DEPRECIATION)($) (2) | | | PERCENTAGE
OF NET ASSETS (%) | |
Long Positions | | | | | | | | | | | | | | | | |
| | | | |
Common Stocks | | | | | | | | | | | | | | | | |
Airlines | | | | | | | | | | | | | | | | |
International Consolidated Airlines Group SA | | | 33,783 | | | | 285,327 | | | | (40 | ) | | | 0.0 | (a) |
| | | | | | | | | | | | | | | | |
Capital Markets | | | | | | | | | | | | | | | | |
3i Group plc | | | 21,147 | | | | 269,881 | | | | (29 | ) | | | 0.0 | (a) |
Investec plc | | | 37,055 | | | | 253,553 | | | | (148 | ) | | | 0.0 | (a) |
| | | | | | | | | | | | | | | | |
| | | 58,202 | | | | 523,434 | | | | (177 | ) | | | 0.0 | (a) |
| | | | | | | | | | | | | | | | |
Chemicals | | | | | | | | | | | | | | | | |
Synthomer plc | | | 43,765 | | | | 284,588 | | | | (116 | ) | | | 0.0 | (a) |
| | | | | | | | | | | | | | | | |
Commercial Services & Supplies | | | | | | | | | | | | | | | | |
G4S plc | | | 71,538 | | | | 266,938 | | | | (49 | ) | | | 0.0 | (a) |
| | | | | | | | | | | | | | | | |
Construction & Engineering | | | | | | | | | | | | | | | | |
Kier Group plc | | | 17,075 | | | | 235,711 | | | | (142 | ) | | | 0.0 | (a) |
| | | | | | | | | | | | | | | | |
Energy Equipment & Services | | | | | | | | | | | | | | | | |
Petrofac Ltd. | | | 44,777 | | | | 249,455 | | | | 94 | | | | 0.0 | (a) |
| | | | | | | | | | | | | | | | |
Equity Real Estate Investment Trusts (REITs) | | | | | | | | | | | | | | | | |
UNITE Group plc (The) | | | 31,896 | | | | 297,810 | | | | — | | | | 0.0 | |
| | | | | | | | | | | | | | | | |
Food & Staples Retailing | | | | | | | | | | | | | | | | |
Wm Morrison Supermarkets plc | | | 82,236 | | | | 244,875 | | | | — | | | | 0.0 | |
| | | | | | | | | | | | | | | | |
SEE NOTES TO CONSOLIDATED FINANCIAL STATEMENTS.
| | | | | | |
| | | |
| 32 | | | | JPMORGAN EXCHANGE-TRADED FUNDS | | OCTOBER 31, 2017 |
| | | | | | | | | | | | | | | | |
| REFERENCE ENTITY | | SHARES | | | NOTIONAL
VALUE($) (1) | | | UNREALIZED
APPRECIATION
(DEPRECIATION)($) (2) | | | PERCENTAGE
OF NET ASSETS (%) | |
Long Positions — continued | |
| | |
Common Stocks — continued | | | | | | | | | |
Hotels, Restaurants & Leisure | | | | | | | | | | | | | | | | |
Carnival plc | | | 3,776 | | | | 248,945 | | | | 146 | | | | 0.0 | (a) |
William Hill plc | | | 82,685 | | | | 283,735 | | | | (35 | ) | | | 0.0 | (a) |
| | | | | | | | | | | | | | | | |
| | | 86,461 | | | | 532,680 | | | | 111 | | | | 0.0 | (a) |
| �� | | | | | | | | | | | | | | | |
Household Durables | | | | | | | | | | | | | | | | |
Barratt Developments plc | | | 35,964 | | | | 312,701 | | | | 75 | | | | 0.0 | (a) |
Bellway plc | | | 7,042 | | | | 341,437 | | | | 59 | | | | 0.0 | (a) |
Berkeley Group Holdings plc | | | 6,193 | | | | 307,706 | | | | — | | | | 0.0 | |
Crest Nicholson Holdings plc | | | 40,802 | | | | 307,030 | | | | 37 | | | | 0.0 | (a) |
Persimmon plc | | | 7,513 | | | | 279,595 | | | | — | | | | 0.0 | |
Redrow plc | | | 33,381 | | | | 288,621 | | | | — | | | | 0.0 | |
Taylor Wimpey plc | | | 119,069 | | | | 315,542 | | | | 50 | | | | 0.0 | (a) |
| | | | | | | | | | | | | | | | |
| | | 249,964 | | | | 2,152,632 | | | | 221 | | | | 0.0 | (a) |
| | | | | | | | | | | | | | | | |
Household Products | | | | | | | | | | | | | | | | |
Reckitt Benckiser Group plc | | | 2,939 | | | | 262,942 | | | | 46 | | | | 0.0 | (a) |
| | | | | | | | | | | | | | | | |
Insurance | | | | | | | | | | | | | | | | |
Aviva plc | | | 41,068 | | | | 275,502 | | | | 52 | | | | 0.0 | (a) |
| | | | | | | | | | | | | | | | |
Metals & Mining | | | | | | | | | | | | | | | | |
Centamin plc | | | 135,753 | | | | 251,246 | | | | 87 | | | | 0.0 | (a) |
Rio Tinto plc | | | 5,639 | | | | 266,503 | | | | 740 | | | | 0.0 | (a) |
| | | | | | | | | | | | | | | | |
| | | 141,392 | | | | 517,749 | | | | 827 | | | | 0.0 | (a) |
| | | | | | | | | | | | | | | | |
Multiline Retail | | | | | | | | | | | | | | | | |
Marks & Spencer Group plc | | | 59,629 | | | | 272,528 | | | | 14 | | | | 0.0 | (a) |
| | | | | | | | | | | | | | | | |
Multi-Utilities | | | | | | | | | | | | | | | | |
Centrica plc | | | 101,673 | | | | 229,290 | | | | (3 | ) | | | 0.0 | (a) |
| | | | | | | | | | | | | | | | |
Paper & Forest Products | | | | | | | | | | | | | | | | |
Mondi plc | | | 10,828 | | | | 261,867 | | | | (15 | ) | | | 0.0 | (a) |
| | | | | | | | | | | | | | | | |
Wireless Telecommunication Services | | | | | | | | | | | | | | | | |
Vodafone Group plc | | | 93,731 | | | | 268,102 | | | | (295 | ) | | | 0.0 | (a) |
| | | | | | | | | | | | | | | | |
Total Long Positions of Total Return Basket Swaps | | | 1,170,957 | | | | 7,161,430 | | | | 528 | | | | 0.0 | (a) |
| | | | | | | | | | | | | | | | |
|
Short Positions | |
| | |
Common Stocks | | | | | | | | | |
Aerospace & Defense | | | | | | | | | | | | | | | | |
Cobham plc* | | | (12,065 | ) | | | (22,274 | ) | | | — | | | | 0.0 | |
| | | | | | | | | | | | | | | | |
IT Services | | | | | | | | | | | | | | | | |
NCC Group plc | | | (64,383 | ) | | | (196,674 | ) | | | — | | | | 0.0 | |
| | | | | | | | | | | | | | | | |
Multiline Retail | | | | | | | | | | | | | | | | |
B&M European Value Retail SA | | | (20,578 | ) | | | (108,582 | ) | | | 3 | | | | 0.0 | (a) |
| | | | | | | | | | | | | | | | |
Total Short Positions of Total Return Basket Swaps | | | (97,026 | ) | | | (327,530 | ) | | | 3 | | | | 0.0 | (a) |
| | | | | | | | | | | | | | | | |
Total of Long and Short Positions of Total Return Basket Swaps | | | 1,073,931 | | | | 6,833,900 | | | | 531 | | | | 0.0 | (a) |
| | | | | | | | | | | | | | | | |
SEE NOTES TO CONSOLIDATED FINANCIAL STATEMENTS.
| | | | | | | | |
| | | |
| OCTOBER 31, 2017 | | JPMORGAN EXCHANGE-TRADED FUNDS | | | | | 33 | |
JPMorgan Diversified Alternatives ETF
ADDITIONAL INFORMATION-TOTAL RETURN BASKET SWAPS
AS OF OCTOBER 31, 2017 (continued)
| | | | | | | | | | | | | | | | | | | | | | |
| COUNTERPARTY | | DESCRIPTION | | TERMINATION
DATE | | | NOTIONAL
VALUE (1) | | | NET UNREALIZED
APPRECIATION
(DEPRECIATION) (2) | | | NET CASH
AND OTHER
RECEIVABLES
(PAYABLES) | | | VALUE
(Note 2C(3)) | |
| UBS | | The Fund receives the total return on a portfolio of long and short equity positions and pays or receives the net of one month CDOR on long positions and short positions respectively, plus or minus a specified spread (rates range from 0.0% to 0.15%), which is denominated in CAD based on the local currencies of the positions within the swaps. | | | 09/12/2019 | | | $ | 5,494,134 | | | $ | — | | | $ | — | | | $ | — | |
| | | | | | | | | | | | | | | | | | | | | | |
| | | | | | | | | | | | | | | | |
| REFERENCE ENTITY | | SHARES | | | NOTIONAL
VALUE($) (1) | | | UNREALIZED
APPRECIATION
(DEPRECIATION)($) (2) | | | PERCENTAGE
OF NET ASSETS (%) | |
Long Positions | | | | | | | | | | | | | | | | |
| | | | |
Common Stocks | | | | | | | | | | | | | | | | |
Auto Components | | | | | | | | | | | | | | | | |
Linamar Corp. | | | 5,074 | | | | 307,877 | | | | — | | | | 0.0 | |
Magna International, Inc. | | | 5,967 | | | | 325,523 | | | | — | | | | 0.0 | |
| | | | | | | | | | | | | | | | |
| | | 11,041 | | | | 633,400 | | | | — | | | | 0.0 | |
| | | | | | | | | | | | | | | | |
Banks | | | | | | | | | | | | | | | | |
Bank of Nova Scotia (The) | | | 4,588 | | | | 296,170 | | | | — | | | | 0.0 | |
Laurentian Bank of Canada | | | 5,729 | | | | 266,444 | | | | — | | | | 0.0 | |
National Bank of Canada | | | 6,347 | | | | 308,027 | | | | — | | | | 0.0 | |
Royal Bank of Canada | | | 3,816 | | | | 298,364 | | | | — | | | | 0.0 | |
Toronto-Dominion Bank (The) | | | 5,512 | | | | 313,348 | | | | — | | | | 0.0 | |
| | | | | | | | | | | | | | | | |
| | | 25,992 | | | | 1,482,353 | | | | — | | | | 0.0 | |
| | | | | | | | | | | | | | | | |
Commercial Services & Supplies | | | | | | | | | | | | | | | | |
Transcontinental, Inc. | | | 14,071 | | | | 312,374 | | | | — | | | | 0.0 | |
| | | | | | | | | | | | | | | | |
Distributors | | | | | | | | | | | | | | | | |
Uni-Select, Inc. | | | 13,756 | | | | 297,277 | | | | — | | | | 0.0 | |
| | | | | | | | | | | | | | | | |
Energy Equipment & Services | | | | | | | | | | | | | | | | |
Enerflex Ltd. | | | 19,193 | | | | 261,094 | | | | — | | | | 0.0 | |
| | | | | | | | | | | | | | | | |
Food Products | | | | | | | | | | | | | | | | |
Maple Leaf Foods, Inc. | | | 10,899 | | | | 282,676 | | | | — | | | | 0.0 | |
| | | | | | | | | | | | | | | | |
Independent Power and Renewable Electricity Producers | | | | | | | | | | | | | | | | |
TransAlta Renewables, Inc. | | | 24,571 | | | | 264,927 | | | | — | | | | 0.0 | |
| | | | | | | | | | | | | | | | |
IT Services | | | | | | | | | | | | | | | | |
CGI Group, Inc.* | | | 5,398 | | | | 286,825 | | | | — | | | | 0.0 | |
| | | | | | | | | | | | | | | | |
Media | | | | | | | | | | | | | | | | |
Cogeco Communications, Inc. | | | 4,063 | | | | 292,104 | | | | — | | | | 0.0 | |
| | | | | | | | | | | | | | | | |
Oil, Gas & Consumable Fuels | | | | | | | | | | | | | | | | |
Bonavista Energy Corp. | | | 101,539 | | | | 215,655 | | | | — | | | | 0.0 | |
Enerplus Corp. | | | 31,704 | | | | 290,720 | | | | — | | | | 0.0 | |
Parex Resources, Inc.* | | | 22,781 | | | | 303,017 | | | | — | | | | 0.0 | |
| | | | | | | | | | | | | | | | |
| | | 156,024 | | | | 809,392 | | | | — | | | | 0.0 | |
| | | | | | | | | | | | | | | | |
Paper & Forest Products | | | | | | | | | | | | | | | | |
West Fraser Timber Co. Ltd. | | | 4,640 | | | | 282,227 | | | | — | | | | 0.0 | |
| | | | | | | | | | | | | | | | |
Thrifts & Mortgage Finance | | | | | | | | | | | | | | | | |
Genworth MI Canada, Inc. | | | 9,877 | | | | 306,929 | | | | — | | | | 0.0 | |
| | | | | | | | | | | | | | | | |
Trading Companies & Distributors | | | | | | | | | | | | | | | | |
Toromont Industries Ltd. | | | 2,761 | | | | 121,710 | | | | — | | | | 0.0 | |
| | | | | | | | | | | | | | | | |
| Total Long Positions of Total Return Basket Swaps | | | 302,286 | | | | 5,633,288 | | | | — | | | | 0.0 | |
| | | | | | | | | | | | | | | | |
SEE NOTES TO CONSOLIDATED FINANCIAL STATEMENTS.
| | | | | | |
| | | |
| 34 | | | | JPMORGAN EXCHANGE-TRADED FUNDS | | OCTOBER 31, 2017 |
| | | | | | | | | | | | | | | | |
| REFERENCE ENTITY | | SHARES | | | NOTIONAL
VALUE($) (1) | | | UNREALIZED
APPRECIATION
(DEPRECIATION)($) (2) | | | PERCENTAGE
OF NET ASSETS (%) | |
Short Positions | |
| | |
Common Stocks | | | | | | | | | |
Aerospace & Defense | | | | | | | | | | | | | | | | |
Bombardier, Inc.* | | | (37,825 | ) | | | (80,042 | ) | | | — | | | | 0.0 | |
| | | | | | | | | | | | | | | | |
Oil, Gas & Consumable Fuels | | | | | | | | | | | | | | | | |
MEG Energy Corp.* | | | (13,309 | ) | | | (59,112 | ) | | | — | | | | 0.0 | |
| | | | | | | | | | | | | | | | |
Total Short Positions of Total Return Basket Swaps | | | (51,134 | ) | | | (139,154 | ) | | | — | | | | 0.0 | |
| | | | | | | | | | | | | | | | |
Total of Long and Short Positions of Total Return Basket Swaps | | | 251,152 | | | | 5,494,134 | | | | — | | | | 0.0 | |
| | | | | | | | | | | | | | | | |
| | | | | | | | | | | | | | | | | | | | | | |
| COUNTERPARTY | | DESCRIPTION | | TERMINATION
DATE | | | NOTIONAL
VALUE (1) | | | NET UNREALIZED
APPRECIATION
(DEPRECIATION) (2) | | | NET CASH
AND OTHER
RECEIVABLES
(PAYABLES) | | | VALUE
(Note 2C(3)) | |
| UBS | | The Fund receives the total return on a portfolio of short equity positions and pays or receives the net of one month LIBOR on short positions, plus or minus a specified spread (rates range from 0.0% to 0.25%), which is denominated in USD based on the local currencies of the positions within the swaps. | | | 09/12/2019 | | | $ | (31,190 | ) | | $ | — | | | $ | — | | | $ | — | |
| | | | | | | | | | | | | | | | | | | | | | |
| | | | | | | | | | | | | | | | |
| REFERENCE ENTITY | | SHARES | | | NOTIONAL
VALUE($) (1) | | | UNREALIZED
APPRECIATION
(DEPRECIATION)($) (2) | | | PERCENTAGE OF NET ASSETS (%) | |
Short Positions | | | | | | | | | | | | | | | | |
| | | | |
Common Stocks | | | | | | | | | | | | | | | | |
Food & Staples Retailing | | | | | | | | | | | | | | | | |
Smart & Final Stores, Inc.* | | | (2,101 | ) | | | (12,606 | ) | | | — | | | | 0.0 | |
| | | | | | | | | | | | | | | | |
Hotels, Restaurants & Leisure | | | | | | | | | | | | | | | | |
Wynn Resorts Ltd. | | | (126 | ) | | | (18,584 | ) | | | — | | | | 0.0 | |
| | | | | | | | | | | | | | | | |
Total Short Positions of Total Return Basket Swaps | | | (2,227 | ) | | | (31,190 | ) | | | — | | | | 0.0 | |
| | | | | | | | | | | | | | | | |
| | | | | | | | | | | | | | | | | | | | | | |
| COUNTERPARTY | | DESCRIPTION | | TERMINATION
DATE | | | NOTIONAL
VALUE (1) | | | NET UNREALIZED
APPRECIATION
(DEPRECIATION) (2) | | | NET CASH
AND OTHER
RECEIVABLES
(PAYABLES) | | | VALUE
(Note 2C(3)) | |
| UBS | | The Fund receives the total return on a portfolio of long and short equity positions and pays or receives the net of one month LIBOR on long positions and short positions respectively, plus or minus a specified spread (rates range from 0.25% to 0.75%), which is denominated in EUR based on the local currencies of the positions within the swaps. | | | 09/12/2019 | | | $ | 13,530,326 | | | $ | 3,220 | | | $ | — | | | $ | 3,220 | |
| | | | | | | | | | | | | | | | | | | | | | |
| | | | | | | | | | | | | | | | |
| REFERENCE ENTITY | | SHARES | | | NOTIONAL
VALUE($) (1) | | | UNREALIZED
APPRECIATION
(DEPRECIATION)($) (2) | | | PERCENTAGE
OF NET ASSETS (%) | |
Long Positions | | | | | | | | | | | | | | | | |
| | | | |
Common Stocks | | | | | | | | | | | | | | | | |
Air Freight & Logistics | | | | | | | | | | | | | | | | |
Cia de Distribucion Integral Logista Holdings SA | | | 11,477 | | | | 268,876 | | | | (41 | ) | | | 0.0 | (a) |
| | | | | | | | | | | | | | | | |
SEE NOTES TO CONSOLIDATED FINANCIAL STATEMENTS.
| | | | | | | | |
| | | |
| OCTOBER 31, 2017 | | JPMORGAN EXCHANGE-TRADED FUNDS | | | | | 35 | |
JPMorgan Diversified Alternatives ETF
ADDITIONAL INFORMATION-TOTAL RETURN BASKET SWAPS
AS OF OCTOBER 31, 2017 (continued)
| | | | | | | | | | | | | | | | |
| REFERENCE ENTITY | | SHARES | | | NOTIONAL VALUE($) (1) | | | UNREALIZED
APPRECIATION
(DEPRECIATION)($) (2) | | | PERCENTAGE
OF NET ASSETS (%) | |
Long Positions — continued | |
| | |
Common Stocks — continued | | | | | | | | | |
Airlines | | | | | | | | | | | | | | | | |
Deutsche Lufthansa AG (Registered) | | | 9,893 | | | | 317,841 | | | | 2,087 | | | | 0.0 | (a) |
| | | | | | | | | | | | | | | | |
Auto Components | | | | | | | | | | | | | | | | |
Cie Generale des Etablissements Michelin | | | 2,115 | | | | 306,139 | | | | 153 | | | | 0.0 | (a) |
| | | | | | | | | | | | | | | | |
Automobiles | | | | | | | | | | | | | | | | |
Peugeot SA | | | 12,959 | | | | 307,460 | | | | 44 | | | | 0.0 | (a) |
| | | | | | | | | | | | | | | | |
Banks | | | | | | | | | | | | | | | | |
Banco de Sabadell SA | | | 140,200 | | | | 280,710 | | | | (23 | ) | | | 0.0 | (a) |
| | | | | | | | | | | | | | | | |
Chemicals | | | | | | | | | | | | | | | | |
Covestro AG (b) | | | 3,708 | | | | 356,449 | | | | 714 | | | | 0.0 | (a) |
Lenzing AG | | | 1,711 | | | | 231,593 | | | | — | | | | 0.0 | |
| | | | | | | | | | | | | | | | |
| | | 5,419 | | | | 588,042 | | | | 714 | | | | 0.0 | (a) |
| | | | | | | | | | | | | | | | |
Construction & Engineering | | | | | | | | | | | | | | | | |
Eiffage SA | | | 2,723 | | | | 284,433 | | | | (54 | ) | | | 0.0 | (a) |
Maire Tecnimont SpA | | | 45,891 | | | | 257,318 | | | | (126 | ) | | | 0.0 | (a) |
| | | | | | | | | | | | | | | | |
| | | 48,614 | | | | 541,751 | | | | (180 | ) | | | 0.0 | (a) |
| | | | | | | | | | | | | | | | |
Diversified Telecommunication Services | | | | | | | | | | | | | | | | |
Deutsche Telekom AG (Registered) | | | 15,838 | | | | 286,784 | | | | (1,757 | ) | | | 0.0 | (a) |
Telefonica Deutschland Holding AG | | | 54,953 | | | | 280,308 | | | | 1,023 | | | | 0.0 | (a) |
Telefonica SA | | | 26,147 | | | | 274,164 | | | | (135 | ) | | | 0.0 | (a) |
| | | | | | | | | | | | | | | | |
| | | 96,938 | | | | 841,256 | | | | (869 | ) | | | 0.0 | (a) |
| | | | | | | | | | | | | | | | |
Electric Utilities | | | | | | | | | | | | | | | | |
EDP — Energias de Portugal SA | | | 66,784 | | | | 238,166 | | | | (114 | ) | | | 0.0 | (a) |
Endesa SA | | | 12,047 | | | | 275,735 | | | | (13 | ) | | | 0.0 | (a) |
Enel SpA | | | 50,942 | | | | 315,926 | | | | (59 | ) | | | 0.0 | (a) |
Iberdrola SA | | | 35,992 | | | | 290,852 | | | | (26 | ) | | | 0.0 | (a) |
Verbund AG | | | 11,496 | | | | 279,171 | | | | (235 | ) | | | 0.0 | (a) |
| | | | | | | | | | | | | | | | |
| | | 177,261 | | | | 1,399,850 | | | | (447 | ) | | | 0.0 | (a) |
| | | | | | | | | | | | | | | | |
Electrical Equipment | | | | | | | | | | | | | | | | |
Philips Lighting NV (b) | | | 7,726 | | | | 292,823 | | | | 110 | | | | 0.0 | (a) |
| | | | | | | | | | | | | | | | |
Energy Equipment & Services | | | | | | | | | | | | | | | | |
Tecnicas Reunidas SA | | | 8,780 | | | | 282,691 | | | | 109 | | | | 0.0 | (a) |
| | | | | | | | | | | | | | | | |
Food & Staples Retailing | | | | | | | | | | | | | | | | |
Distribuidora Internacional de Alimentacion SA | | | 47,331 | | | | 231,495 | | | | (65 | ) | | | 0.0 | (a) |
| | | | | | | | | | | | | | | | |
Health Care Equipment & Supplies | | | | | | | | | | | | | | | | |
Koninklijke Philips NV | | | 6,392 | | | | 260,493 | | | | 228 | | | | 0.0 | (a) |
| | | | | | | | | | | | | | | | |
Insurance | | | | | | | | | | | | | | | | |
Allianz SE (Registered) | | | 1,376 | | | | 321,239 | | | | 1,715 | | | | 0.0 | (a) |
ASR Nederland NV | | | 7,699 | | | | 315,618 | | | | (62 | ) | | | 0.0 | (a) |
CNP Assurances | | | 12,130 | | | | 282,174 | | | | (65 | ) | | | 0.0 | (a) |
Talanx AG | | | 7,028 | | | | 276,010 | | | | — | | | | 0.0 | |
| | | | | | | | | | | | | | | | |
| | | 28,233 | | | | 1,195,041 | | | | 1,588 | | | | 0.0 | (a) |
| | | | | | | | | | | | | | | | |
IT Services | | | | | | | | | | | | | | | | |
Sopra Steria Group | | | 1,409 | | | | 264,327 | | | | — | | | | 0.0 | |
| | | | | | | | | | | | | | | | |
Machinery | | | | | | | | | | | | | | | | |
Cargotec OYJ | | | 4,920 | | | | 290,444 | | | | (121 | ) | | | 0.0 | (a) |
Construcciones y Auxiliar de Ferrocarriles SA | | | 6,447 | | | | 265,471 | | | | — | | | | 0.0 | |
SEE NOTES TO CONSOLIDATED FINANCIAL STATEMENTS.
| | | | | | |
| | | |
| 36 | | | | JPMORGAN EXCHANGE-TRADED FUNDS | | OCTOBER 31, 2017 |
| | | | | | | | | | | | | | | | |
| REFERENCE ENTITY | | SHARES | | | NOTIONAL
VALUE($) (1) | | | UNREALIZED
APPRECIATION
(DEPRECIATION)($) (2) | | | PERCENTAGE
OF NET ASSETS (%) | |
Long Positions — continued | |
| | |
Common Stocks — continued | | | | | | | | | |
Machinery — continued | | | | | | | | | | | | | | | | |
Fincantieri SpA* | | | 212,610 | | | | 264,221 | | | | (278 | ) | | | 0.0 | (a) |
Valmet OYJ | | | 13,503 | | | | 261,807 | | | | (80 | ) | | | 0.0 | (a) |
| | | | | | | | | | | | | | | | |
| | | 237,480 | | | | 1,081,943 | | | | (479 | ) | | | 0.0 | (a) |
| | | | | | | | | | | | | | | | |
Media | | | | | | | | | | | | | | | | |
Metropole Television SA | | | 11,367 | | | | 262,790 | | | | (41 | ) | | | 0.0 | (a) |
| | | | | | | | | | | | | | | | |
Multi-Utilities | | | | | | | | | | | | | | | | |
A2A SpA | | | 173,124 | | | | 297,310 | | | | (144 | ) | | | 0.0 | (a) |
Engie SA | | | 17,923 | | | | 302,934 | | | | — | | | | 0.0 | |
Iren SpA | | | 114,798 | | | | 315,852 | | | | — | | | | 0.0 | |
REN — Redes Energeticas Nacionais SGPS SA | | | 85,768 | | | | 272,361 | | | | (85 | ) | | | 0.0 | (a) |
| | | | | | | | | | | | | | | | |
| | | 391,613 | | | | 1,188,457 | | | | (229 | ) | | | 0.0 | (a) |
| | | | | | | | | | | | | | | | |
Oil, Gas & Consumable Fuels | | | | | | | | | | | | | | | | |
Eni SpA | | | 18,565 | | | | 303,501 | | | | (120 | ) | | | 0.0 | (a) |
Gaztransport Et Technigaz SA | | | 5,059 | | | | 247,614 | | | | (9 | ) | | | 0.0 | (a) |
Neste OYJ | | | 6,664 | | | | 370,994 | | | | (289 | ) | | | 0.0 | (a) |
OMV AG | | | 5,043 | | | | 302,648 | | | | (351 | ) | | | 0.0 | (a) |
Repsol SA | | | 14,733 | | | | 276,088 | | | | 41 | | | | 0.0 | (a) |
TOTAL SA | | | 5,684 | | | | 316,816 | | | | (132 | ) | | | 0.0 | (a) |
| | | | | | | | | | | | | | | | |
| | | 55,748 | | | | 1,817,661 | | | | (860 | ) | | | 0.0 | (a) |
| | | | | | | | | | | | | | | | |
Paper & Forest Products | | | | | | | | | | | | | | | | |
UPM-Kymmene OYJ | | | 10,443 | | | | 313,627 | | | | (218 | ) | | | 0.0 | (a) |
| | | | | | | | | | | | | | | | |
Pharmaceuticals | | | | | | | | | | | | | | | | |
Bayer AG (Registered) | | | 2,192 | | | | 285,133 | | | | (76 | ) | | | 0.0 | (a) |
Merck KGaA | | | 2,556 | | | | 274,241 | | | | 652 | | | | 0.0 | (a) |
Sanofi | | | 2,975 | | | | 281,693 | | | | (12 | ) | | | 0.0 | (a) |
| | | | | | | | | | | | | | | | |
| | | 7,723 | | | | 841,067 | | | | 564 | | | | 0.0 | (a) |
| | | | | | | | | | | | | | | | |
Real Estate Management & Development | | | | | | | | | | | | | | | | |
CA Immobilien Anlagen AG | | | 9,220 | | | | 263,128 | | | | — | | | | 0.0 | |
Nexity SA | | | 5,387 | | | | 331,097 | | | | 88 | | | | 0.0 | (a) |
TAG Immobilien AG | | | 17,930 | | | | 309,111 | | | | 733 | | | | 0.0 | (a) |
| | | | | | | | | | | | | | | | |
| | | 32,537 | | | | 903,336 | | | | 821 | | | | 0.0 | (a) |
| | | | | | | | | | | | | | | | |
Technology Hardware, Storage & Peripherals | | | | | | | | | | | | | | | | |
Neopost SA | | | 6,128 | | | | 225,882 | | | | 30 | | | | 0.0 | (a) |
| | | | | | | | | | | | | | | | |
Textiles, Apparel & Luxury Goods | | | | | | | | | | | | | | | | |
Moncler SpA | | | 8,935 | | | | 253,652 | | | | (93 | ) | | | 0.0 | (a) |
| | | | | | | | | | | | | | | | |
| Total Long Positions of Total Return Basket Swaps | | | 1,366,721 | | | | 14,267,210 | | | | 2,903 | | | | 0.0 | (a) |
| | | | | | | | | | | | | | | | |
|
Short Positions | |
| | |
Common Stocks | | | | | | | | | |
Chemicals | | | | | | | | | | | | | | | | |
OCI NV* | | | (9,618 | ) | | | (228,166 | ) | | | (7 | ) | | | 0.0 | (a) |
| | | | | | | | | | | | | | | | |
Internet & Direct Marketing Retail | | | | | | | | | | | | | | | | |
Yoox Net-A-Porter Group SpA* | | | (4,151 | ) | | | (155,055 | ) | | | 158 | | | | 0.0 | (a) |
| | | | | | | | | | | | | | | | |
Media | | | | | | | | | | | | | | | | |
Altice NV* | | | (5,259 | ) | | | (99,177 | ) | | | 32 | | | | 0.0 | (a) |
| | | | | | | | | | | | | | | | |
SEE NOTES TO CONSOLIDATED FINANCIAL STATEMENTS.
| | | | | | | | |
| | | |
| OCTOBER 31, 2017 | | JPMORGAN EXCHANGE-TRADED FUNDS | | | | | 37 | |
JPMorgan Diversified Alternatives ETF
ADDITIONAL INFORMATION-TOTAL RETURN BASKET SWAPS
AS OF OCTOBER 31, 2017 (continued)
| | | | | | | | | | | | | | | | |
| REFERENCE ENTITY | | SHARES | | | NOTIONAL
VALUE($) (1) | | | UNREALIZED
APPRECIATION
(DEPRECIATION)($) (2) | | | PERCENTAGE OF
NET ASSETS (%) | |
Short Positions — continued | |
| | |
Common Stocks — continued | | | | | | | | | |
Metals & Mining | | | | | | | | | | | | | | | | |
Eramet* | | | (3,090 | ) | | | (254,486 | ) | | | 134 | | | | 0.0 | (a) |
| | | | | | | | | | | | | | | | |
Total Short Positions of Total Return Basket Swaps | | | (22,118 | ) | | | (736,884 | ) | | | 317 | | | | 0.0 | (a) |
| | | | | | | | | | | | | | | | |
Total of Long and Short Positions of Total Return Basket Swaps | | | 1,344,603 | | | | 13,530,326 | | | | 3,220 | | | | 0.0 | (a) |
| | | | | | | | | | | | | | | | |
| | | | | | | | | | | | | | | | | | | | | | |
| COUNTERPARTY | | DESCRIPTION | | TERMINATION
DATE | | | NOTIONAL
VALUE (1) | | | NET UNREALIZED
APPRECIATION
(DEPRECIATION) (2) | | | NET CASH
AND OTHER
RECEIVABLES
(PAYABLES) | | | VALUE
(Note 2C(3)) | |
| UBS | | The Fund receives the total return on a portfolio of long and short equity positions and pays or receives the net of one month LIBOR on long positions and short positions respectively, plus or minus a specified spread (rates range from 0.0% to 0.40%), which is denominated in JPY based on the local currencies of the positions within the swaps. | | | 09/12/2019 | | | $ | 9,447,839 | | | $ | 58,547 | | | $ | — | | | $ | 58,547 | |
| | | | | | | | | | | | | | | | | | | | | | |
| | | | | | | | | | | | | | | | |
| REFERENCE ENTITY | | SHARES | | | NOTIONAL
VALUE($) (1) | | | UNREALIZED
APPRECIATION
(DEPRECIATION)($) (2) | | | PERCENTAGE
OF NET ASSETS (%) | |
Long Positions | | | | | | | | | | | | | | | | |
| | | | |
Common Stocks | | | | | | | | | | | | | | | | |
Auto Components | | | | | | | | | | | | | | | | |
Bridgestone Corp.* | | | 4,100 | | | | 195,859 | | | | 1,505 | | | | 0.0 | (a) |
NHK Spring Co. Ltd. | | | 26,600 | | | | 304,414 | | | | 3,101 | | | | 0.0 | (a) |
Sumitomo Rubber Industries Ltd.* | | | 10,100 | | | | 191,776 | | | | 1,332 | | | | 0.0 | (a) |
TS Tech Co. Ltd. | | | 9,400 | | | | 336,651 | | | | 2,664 | | | | 0.0 | (a) |
Unipres Corp. | | | 10,200 | | | | 275,398 | | | | 3,589 | | | | 0.0 | (a) |
| | | | | | | | | | | | | | | | |
| | | 60,400 | | | | 1,304,098 | | | | 12,191 | | | | 0.0 | (a) |
| | | | | | | | | | | | | | | | |
Building Products | | | | | | | | | | | | | | | | |
Asahi Glass Co. Ltd.* | | | 6,700 | | | | 262,574 | | | | 1,539 | | | | 0.0 | (a) |
Nichias Corp. | | | 12,000 | | | | 156,251 | | | | 586 | | | | 0.0 | (a) |
Nichiha Corp.* | | | 8,200 | | | | 329,800 | | | | 949 | | | | 0.0 | (a) |
Takasago Thermal Engineering Co. Ltd.* | | | 17,100 | | | | 301,085 | | | | 1,360 | | | | 0.0 | (a) |
| | | | | | | | | | | | | | | | |
| | | 44,000 | | | | 1,049,710 | | | | 4,434 | | | | 0.0 | (a) |
| | | | | | | | | | | | | | | | |
Chemicals | | | | | | | | | | | | | | | | |
Hitachi Chemical Co. Ltd. | | | 5,400 | | | | 153,985 | | | | 1,301 | | | | 0.0 | (a) |
Kuraray Co. Ltd.* | | | 7,700 | | | | 151,648 | | | | 1,109 | | | | 0.0 | (a) |
Mitsubishi Chemical Holdings Corp. | | | 17,000 | | | | 177,570 | | | | 1,523 | | | | 0.0 | (a) |
Mitsubishi Gas Chemical Co., Inc. | | | 6,700 | | | | 163,900 | | | | 1,328 | | | | 0.0 | (a) |
Mitsui Chemicals, Inc. | | | 6,000 | | | | 185,016 | | | | 1,383 | | | | 0.0 | (a) |
Sumitomo Bakelite Co. Ltd. | | | 38,000 | | | | 309,023 | | | | 1,895 | | | | 0.0 | (a) |
Tosoh Corp. | | | 12,000 | | | | 258,969 | | | | 1,672 | | | | 0.0 | (a) |
| | | | | | | | | | | | | | | | |
| | | 92,800 | | | | 1,400,111 | | | | 10,211 | | | | 0.0 | (a) |
| | | | | | | | | | | | | | | | |
Construction & Engineering | | | | | | | | | | | | | | | | |
Kinden Corp. | | | 17,100 | | | | 288,783 | | | | 1,539 | | | | 0.0 | (a) |
Nishimatsu Construction Co. Ltd.* | | | 10,200 | | | | 307,940 | | | | 1,146 | | | | 0.0 | (a) |
Obayashi Corp. | | | 11,300 | | | | 147,954 | | | | 872 | | | | 0.0 | (a) |
Okumura Corp.* | | | 8,200 | | | | 313,895 | | | | 1,271 | | | | 0.0 | (a) |
SEE NOTES TO CONSOLIDATED FINANCIAL STATEMENTS.
| | | | | | |
| | | |
| 38 | | | | JPMORGAN EXCHANGE-TRADED FUNDS | | OCTOBER 31, 2017 |
| | | | | | | | | | | | | | | | |
| REFERENCE ENTITY | | SHARES | | | NOTIONAL
VALUE($) (1) | | | UNREALIZED
APPRECIATION
(DEPRECIATION)($) (2) | | | PERCENTAGE
OF NET ASSETS (%) | |
Long Positions — continued | | | | | | | | | | | | | | | | |
| | | | |
Common Stocks — continued | | | | | | | | | | | | | | | | |
Construction & Engineering — continued | | | | | | | | | | | | | | | | |
Taisei Corp. | | | 2,800 | | | | 155,140 | | | | 740 | | | | 0.0 | (a) |
Toda Corp.* | | | 42,000 | | | | 342,182 | | | | 1,986 | | | | 0.0 | (a) |
| | | | | | | | | | | | | | | | |
| | | 91,600 | | | | 1,555,894 | | | | 7,554 | | | | 0.0 | (a) |
| | | | | | | | | | | | | | | | |
Diversified Telecommunication Services | | | | | | | | | | | | | | | | |
Nippon Telegraph & Telephone Corp. | | | 5,400 | | | | 261,077 | | | | 1,157 | | | | 0.0 | (a) |
| | | | | | | | | | | | | | | | |
Electrical Equipment | | | | | | | | | | | | | | | | |
Fuji Electric Co. Ltd. | | | 29,000 | | | | 210,108 | | | | 1,736 | | | | 0.0 | (a) |
| | | | | | | | | | | | | | | | |
Electronic Equipment, Instruments & Components | | | | | | | | | | | | | | | | |
Azbil Corp.* | | | 6,100 | | | | 266,367 | | | | 1,348 | | | | 0.0 | (a) |
| | | | | | | | | | | | | | | | |
Energy Equipment & Services | | | | | | | | | | | | | | | | |
Modec, Inc.* | | | 11,500 | | | | 265,091 | | | | 1,320 | | | | 0.0 | (a) |
| | | | | | | | | | | | | | | | |
Food & Staples Retailing | | | | | | | | | | | | | | | | |
Matsumotokiyoshi Holdings Co. Ltd. | | | 3,800 | | | | 273,270 | | | | 1,232 | | | | 0.0 | (a) |
| | | | | | | | | | | | | | | | |
Food Products | | | | | | | | | | | | | | | | |
Prima Meat Packers Ltd.* | | | 39,000 | | | | 254,847 | | | | 689 | | | | 0.0 | (a) |
| | | | | | | | | | | | | | | | |
Health Care Equipment & Supplies | | | | | | | | | | | | | | | | |
Hoya Corp. | | | 5,500 | | | | 298,819 | | | | 1,871 | | | | 0.0 | (a) |
Nikkiso Co. Ltd.* | | | 31,700 | | | | 297,788 | | | | 2,269 | | | | 0.0 | (a) |
| | | | | | | | | | | | | | | | |
| | | 37,200 | | | | 596,607 | | | | 4,140 | | | | 0.0 | (a) |
| | | | | | | | | | | | | | | | |
Health Care Providers & Services | | | | | | | | | | | | | | | | |
BML, Inc.* | | | 9,100 | | | | 201,453 | | | | 1,214 | | | | 0.0 | (a) |
Miraca Holdings, Inc. | | | 3,500 | | | | 162,844 | | | | 627 | | | | 0.0 | (a) |
| | | | | | | | | | | | | | | | |
| | | 12,600 | | | | 364,297 | | | | 1,841 | | | | 0.0 | (a) |
| | | | | | | | | | | | | | | | |
Household Durables | | | | | | | | | | | | | | | | |
Starts Corp., Inc.* | | | 11,200 | | | | 303,756 | | | | 1,360 | | | | 0.0 | (a) |
| | | | | | | | | | | | | | | | |
Internet Software & Services | | | | | | | | | | | | | | | | |
Mixi, Inc. | | | 2,400 | | | | 117,005 | | | | 493 | | | | 0.0 | (a) |
| | | | | | | | | | | | | | | | |
IT Services | | | | | | | | | | | | | | | | |
NEC Networks & System Integration Corp.* | | | 11,200 | | | | 279,108 | | | | 1,928 | | | | 0.0 | (a) |
| | | | | | | | | | | | | | | | |
Leisure Products | | | | | | | | | | | | | | | | |
Bandai Namco Holdings, Inc. | | | 4,000 | | | | 137,072 | | | | 755 | | | | 0.0 | (a) |
| | | | | | | | | | | | | | | | |
Oil, Gas & Consumable Fuels | | | | | | | | | | | | | | | | |
JXTG Holdings, Inc. | | | 39,300 | | | | 202,937 | | | | 1,365 | | | | 0.0 | (a) |
Showa Shell Sekiyu KK* | | | 15,400 | | | | 181,678 | | | | 1,274 | | | | 0.0 | (a) |
| | | | | | | | | | | | | | | | |
| | | 54,700 | | | | 384,615 | | | | 2,639 | | | | 0.0 | (a) |
| | | | | | | | | | | | | | | | |
Pharmaceuticals | | | | | | | | | | | | | | | | |
Astellas Pharma, Inc. | | | 15,000 | | | | 199,633 | | | | 631 | | | | 0.0 | (a) |
KYORIN Holdings, Inc.* | | | 13,100 | | | | 269,044 | | | | 1,295 | | | | 0.0 | (a) |
Mitsubishi Tanabe Pharma Corp. | | | 6,300 | | | | 138,659 | | | | 475 | | | | 0.0 | (a) |
Shionogi & Co. Ltd. | | | 2,600 | | | | 139,976 | | | | 790 | | | | 0.0 | (a) |
Tsumura & Co. | | | 7,300 | | | | 271,315 | | | | 1,028 | | | | 0.0 | (a) |
| | | | | | | | | | | | | | | | |
| | | 44,300 | | | | 1,018,627 | | | | 4,219 | | | | 0.0 | (a) |
| | | | | | | | | | | | | | | | |
Semiconductors & Semiconductor Equipment | | | | | | | | | | | | | | | | |
Ulvac, Inc. | | | 2,700 | | | | 191,279 | | | | 1,551 | | | | 0.0 | (a) |
| | | | | | | | | | | | | | | | |
SEE NOTES TO CONSOLIDATED FINANCIAL STATEMENTS.
| | | | | | | | |
| | | |
| OCTOBER 31, 2017 | | JPMORGAN EXCHANGE-TRADED FUNDS | | | | | 39 | |
JPMorgan Diversified Alternatives ETF
ADDITIONAL INFORMATION-TOTAL RETURN BASKET SWAPS
AS OF OCTOBER 31, 2017 (continued)
| | | | | | | | | | | | | | | | |
| REFERENCE ENTITY | | SHARES | | | NOTIONAL
VALUE($) (1) | | | UNREALIZED
APPRECIATION
(DEPRECIATION)($) (2) | | | PERCENTAGE
OF NET ASSETS (%) | |
Long Positions — continued | | | | | | | | | | | | | | | | |
| | | | |
Common Stocks — continued | | | | | | | | | | | | | | | | |
Specialty Retail | | | | | | | | | | | | | | | | |
Kohnan Shoji Co. Ltd.* | | | 10,300 | | | | 220,137 | | | | 920 | | | | 0.0 | (a) |
| | | | | | | | | | | | | | | | |
Technology Hardware, Storage & Peripherals | | | | | | | | | | | | | | | | |
Brother Industries Ltd. | | | 11,200 | | | | 272,531 | | | | 2,738 | | | | 0.0 | (a) |
Maxell Holdings Ltd.* | | | 13,100 | | | | 297,711 | | | | 1,735 | | | | 0.0 | (a) |
| | | | | | | | | | | | | | | | |
| | | 24,300 | | | | 570,242 | | | | 4,473 | | | | 0.0 | (a) |
| | | | | | | | | | | | | | | | |
Trading Companies & Distributors | | | | | | | | | | | | | | | | |
Sumitomo Corp. | | | 12,800 | | | | 185,141 | | | | 1,254 | | | | 0.0 | (a) |
| | | | | | | | | | | | | | | | |
Wireless Telecommunication Services | | | | | | | | | | | | | | | | |
NTT DOCOMO, Inc. | | | 7,200 | | | | 174,375 | | | | 810 | | | | 0.0 | (a) |
| | | | | | | | | | | | | | | | |
Total Long Positions of Total Return Basket Swaps | | | 618,500 | | | | 11,382,834 | | | | 68,255 | | | | 0.0 | (a) |
| | | | | | | | | | | | | | | | |
| | | | |
Short Positions | | | | | | | | | | | | | | | | |
| | | | |
Common Stocks | | | | | | | | | | | | | | | | |
Air Freight & Logistics | | | | | | | | | | | | | | | | |
Yamato Holdings Co. Ltd. | | | (1,000 | ) | | | (20,446 | ) | | | (117 | ) | | | 0.0 | (a) |
| | | | | | | | | | | | | | | | |
Commercial Services & Supplies | | | | | | | | | | | | | | | | |
Sohgo Security Services Co. Ltd. | | | (800 | ) | | | (38,542 | ) | | | (268 | ) | | | 0.0 | (a) |
| | | | | | | | | | | | | | | | |
Consumer Finance | | | | | | | | | | | | | | | | |
Acom Co. Ltd.* | | | (3,800 | ) | | | (15,798 | ) | | | (90 | ) | | | 0.0 | (a) |
| | | | | | | | | | | | | | | | |
Electric Utilities | | | | | | | | | | | | | | | | |
Hokuriku Electric Power Co. | | | (16,900 | ) | | | (149,329 | ) | | | (699 | ) | | | 0.0 | (a) |
| | | | | | | | | | | | | | | | |
Electronic Equipment, Instruments & Components | | | | | | | | | | | | | | | | |
Japan Display, Inc.* | | | (29,300 | ) | | | (63,206 | ) | | | (1,101 | ) | | | 0.0 | (a) |
| | | | | | | | | | | | | | | | |
Food & Staples Retailing | | | | | | | | | | | | | | | | |
Sugi Holdings Co. Ltd. | | | (400 | ) | | | (20,301 | ) | | | (38 | ) | | | 0.0 | (a) |
| | | | | | | | | | | | | | | | |
Food Products | | | | | | | | | | | | | | | | |
Kikkoman Corp. | | | (2,000 | ) | | | (68,641 | ) | | | (394 | ) | | | 0.0 | (a) |
Nissin Foods Holdings Co. Ltd. | | | (500 | ) | | | (31,484 | ) | | | (130 | ) | | | 0.0 | (a) |
| | | | | | | | | | | | | | | | |
| | | (2,500 | ) | | | (100,125 | ) | | | (524 | ) | | | 0.0 | (a) |
| | | | | | | | | | | | | | | | |
Hotels, Restaurants & Leisure | | | | | | | | | | | | | | | | |
Colowide Co. Ltd.* | | | (13,500 | ) | | | (253,380 | ) | | | (1,082 | ) | | | 0.0 | (a) |
HIS Co. Ltd. | | | (4,700 | ) | | | (157,380 | ) | | | (514 | ) | | | 0.0 | (a) |
Kyoritsu Maintenance Co. Ltd.* | | | (4,100 | ) | | | (129,490 | ) | | | (762 | ) | | | 0.0 | (a) |
| | | | | | | | | | | | | | | | |
| | | (22,300 | ) | | | (540,250 | ) | | | (2,358 | ) | | | 0.0 | (a) |
| | | | | | | | | | | | | | | | |
Industrial Conglomerates | | | | | | | | | | | | | | | | |
Keihan Holdings Co. Ltd. | | | (800 | ) | | | (24,445 | ) | | | (101 | ) | | | 0.0 | (a) |
Toshiba Corp.* | | | (80,000 | ) | | | (231,476 | ) | | | — | | | | 0.0 | |
| | | | | | | | | | | | | | | | |
| | | (80,800 | ) | | | (255,921 | ) | | | (101 | ) | | | 0.0 | (a) |
| | | | | | | | | | | | | | | | |
Internet & Direct Marketing Retail | | | | | | | | | | | | | | | | |
Rakuten, Inc. | | | (2,600 | ) | | | (27,822 | ) | | | (177 | ) | | | 0.0 | (a) |
| | | | | | | | | | | | | | | | |
Internet Software & Services | | | | | | | | | | | | | | | | |
GMO internet, Inc. | | | (3,700 | ) | | | (57,162 | ) | | | (445 | ) | | | 0.0 | (a) |
| | | | | | | | | | | | | | | | |
Media | | | | | | | | | | | | | | | | |
LIFULL Co. Ltd. | | | (24,800 | ) | | | (190,573 | ) | | | (1,037 | ) | | | 0.0 | (a) |
| | | | | | | | | | | | | | | | |
SEE NOTES TO CONSOLIDATED FINANCIAL STATEMENTS.
| | | | | | |
| | | |
| 40 | | | | JPMORGAN EXCHANGE-TRADED FUNDS | | OCTOBER 31, 2017 |
| | | | | | | | | | | | | | | | |
| REFERENCE ENTITY | | SHARES | | | NOTIONAL
VALUE($) (1) | | | UNREALIZED
APPRECIATION
(DEPRECIATION)($) (2) | | | PERCENTAGE
OF NET ASSETS (%) | |
Short Positions — continued | | | | | | | | | | | | | | | | |
| | | | |
Common Stocks — continued | | | | | | | | | | | | | | | | |
Multiline Retail | | | | | | | | | | | | | | | | |
Don Quijote Holdings Co. Ltd. | | | (500 | ) | | | (20,973 | ) | | | (151 | ) | | | 0.0 | (a) |
Isetan Mitsukoshi Holdings Ltd. | | | (1,300 | ) | | | (14,171 | ) | | | (131 | ) | | | 0.0 | (a) |
| | | | | | | | | | | | | | | | |
| | | (1,800 | ) | | | (35,144 | ) | | | (282 | ) | | | 0.0 | (a) |
| | | | | | | | | | | | | | | | |
Pharmaceuticals | | | | | | | | | | | | | | | | |
Nichi-iko Pharmaceutical Co. Ltd.* | | | (15,200 | ) | | | (236,053 | ) | | | (1,313 | ) | | | 0.0 | (a) |
| | | | | | | | | | | | | | | | |
Road & Rail | | | | | | | | | | | | | | | | |
Keio Corp. | | | (400 | ) | | | (17,451 | ) | | | (108 | ) | | | 0.0 | (a) |
Odakyu Electric Railway Co. Ltd. | | | (1,000 | ) | | | (19,562 | ) | | | (126 | ) | | | 0.0 | (a) |
| | | | | | | | | | | | | | | | |
| | | (1,400 | ) | | | (37,013 | ) | | | (234 | ) | | | 0.0 | (a) |
| | | | | | | | | | | | | | | | |
Specialty Retail | | | | | | | | | | | | | | | | |
IDOM, Inc.* | | | (20,200 | ) | | | (147,310 | ) | | | (924 | ) | | | 0.0 | (a) |
| | | | | | | | | | | | | | | | |
Total Short Positions of Total Return Basket Swaps | | | (227,500 | ) | | | (1,934,995 | ) | | | (9,708 | ) | | | 0.0 | (a) |
| | | | | | | | | | | | | | | | |
Total of Long and Short Positions of Total Return Basket Swaps | | | 391,000 | | �� | | 9,447,839 | | | | 58,547 | | | | 0.0 | (a) |
| | | | | | | | | | | | | | | | |
| | | | | | | | | | | | | | | | | | | | | | |
| COUNTERPARTY | | DESCRIPTION | | TERMINATION
DATE | | | NOTIONAL
VALUE (1) | | | NET UNREALIZED
APPRECIATION
(DEPRECIATION) (2) | | | NET CASH
AND OTHER
RECEIVABLES
(PAYABLES) | | | VALUE
(Note 2C(3)) | |
| UBS | | The Fund receives the total return on a portfolio of long equity positions and pays or receives the net of one month LIBOR on long positions, plus or minus a specified spread (rates range from 0.0% to 0.25%), which is denominated in CHF based on the local currencies of the positions within the swaps. | | | 09/12/2019 | | | $ | 2,193,077 | | | $ | (199 | ) | | $ | — | | | $ | (199 | ) |
| | | | | | | | | | | | | | | | | | | | | | |
| | | | | | | | | | | | | | | | |
| REFERENCE ENTITY | | SHARES | | | NOTIONAL
VALUE($) (1) | | | UNREALIZED
APPRECIATION
(DEPRECIATION)($) (2) | | | PERCENTAGE
OF NET ASSETS (%) | |
Long Positions | | | | | | | | | | | | | | | | |
| | | | |
Common Stocks | | | | | | | | | | | | | | | | |
Diversified Telecommunication Services | | | | | | | | | | | | | | | | |
Sunrise Communications Group AG* (b) | | | 3,602 | | | | 299,650 | | | | (21 | ) | | | 0.0 | (a) |
| | | | | | | | | | | | | | | | |
Electrical Equipment | | | | | | | | | | | | | | | | |
ABB Ltd. (Registered) | | | 11,277 | | | | 294,499 | | | | (298 | ) | | | 0.0 | (a) |
| | | | | | | | | | | | | | | | |
Insurance | | | | | | | | | | | | | | | | |
Baloise Holding AG (Registered) | | | 1,801 | | | | 283,941 | | | | (24 | ) | | | 0.0 | (a) |
Swiss Life Holding AG (Registered)* | | | 802 | | | | 278,751 | | | | (38 | ) | | | 0.0 | (a) |
| | | | | | | | | | | | | | | | |
| | | 2,603 | | | | 562,692 | | | | (62 | ) | | | 0.0 | (a) |
| | | | | | | | | | | | | | | | |
Pharmaceuticals | | | | | | | | | | | | | | | | |
Novartis AG (Registered) | | | 3,100 | | | | 255,686 | | | | 266 | | | | 0.0 | (a) |
| | | | | | | | | | | | | | | | |
Real Estate Management & Development | | | | | | | | | | | | | | | | |
Allreal Holding AG (Registered)* | | | 1,569 | | | | 262,242 | | | | (84 | ) | | | 0.0 | (a) |
Mobimo Holding AG (Registered)* | | | 995 | | | | 251,331 | | | | — | | | | 0.0 | |
Swiss Prime Site AG (Registered)* | | | 3,128 | | | | 266,977 | | | | — | | | | 0.0 | |
| | | | | | | | | | | | | | | | |
| | | 5,692 | | | | 780,550 | | | | (84 | ) | | | 0.0 | (a) |
| | | | | | | | | | | | | | | | |
Total Long Positions of Total Return Basket Swaps | | | 26,274 | | | | 2,193,077 | | | | (199 | ) | | | 0.0 | (a) |
| | | | | | | | | | | | | | | | |
SEE NOTES TO CONSOLIDATED FINANCIAL STATEMENTS.
| | | | | | | | |
| | | |
| OCTOBER 31, 2017 | | JPMORGAN EXCHANGE-TRADED FUNDS | | | | | 41 | |
JPMorgan Diversified Alternatives ETF
ADDITIONAL INFORMATION-TOTAL RETURN BASKET SWAPS
AS OF OCTOBER 31, 2017 (continued)
| | | | | | | | | | | | | | | | | | | | | | |
| COUNTERPARTY | | DESCRIPTION | | TERMINATION
DATE | | | NOTIONAL
VALUE (1) | | | NET UNREALIZED
APPRECIATION
(DEPRECIATION) (2) | | | NET CASH
AND OTHER
RECEIVABLES
(PAYABLES) | | | VALUE
(Note 2C(3)) | |
| UBS | | The Fund receives the total return on a portfolio of long and short equity positions and pays or receives the net of one month BBSW on long positions and short positions respectively, plus or minus a specified spread (rates range from 0.0% to 0.35%), which is denominated in AUD based on the local currencies of the positions within the swaps. | | | 09/12/2019 | | | $ | 612,338 | | | $ | 1,259 | | | $ | — | | | $ | 1,259 | |
| | | | | | | | | | | | | | | | | | | | | | |
| | | | | | | | | | | | | | | | |
| REFERENCE ENTITY | | SHARES | | | NOTIONAL VALUE($) (1) | | | UNREALIZED
APPRECIATION
(DEPRECIATION)($) (2) | | | PERCENTAGE
OF NET ASSETS (%) | |
Long Positions | | | | | | | | | | | | | | | | |
| | | | |
Common Stocks | | | | | | | | | | | | | | | | |
Beverages | | | | | | | | | | | | | | | | |
Coca-Cola Amatil Ltd. | | | 43,702 | | | | 272,839 | | | | 243 | | | | 0.0 | (a) |
| | | | | | | | | | | | | | | | |
Food & Staples Retailing | | | | | | | | | | | | | | | | |
Metcash Ltd. | | | 140,421 | | | | 290,082 | | | | 984 | | | | 0.0 | (a) |
| | | | | | | | | | | | | | | | |
Media | | | | | | | | | | | | | | | | |
Nine Entertainment Co. Holdings Ltd. | | | 226,266 | | | | 259,976 | | | | 217 | | | | 0.0 | (a) |
| | | | | | | | | | | | | | | | |
Metals & Mining | | | | | | | | | | | | | | | | |
Fortescue Metals Group Ltd. | | | 46,251 | | | | 164,450 | | | | 203 | | | | 0.0 | (a) |
Rio Tinto Ltd. | | | 3,043 | | | | 162,150 | | | | 404 | | | | 0.0 | (a) |
| | | | | | | | | | | | | | | | |
| | | 49,294 | | | | 326,600 | | | | 607 | | | | 0.0 | (a) |
| | | | | | | | | | | | | | | | |
Total Long Positions of Total Return Basket Swaps | | | 459,683 | | | | 1,149,497 | | | | 2,051 | | | | 0.0 | (a) |
| | | | | | | | | | | | | | | | |
| | | | |
Short Positions | | | | | | | | | | | | | | | | |
| | | | |
Common Stocks | | | | | | | | | | | | | | | | |
Capital Markets | | | | | | | | | | | | | | | | |
Platinum Asset Management Ltd. | | | (29,828 | ) | | | (166,708 | ) | | | (57 | ) | | | 0.0 | (a) |
| | | | | | | | | | | | | | | | |
Hotels, Restaurants & Leisure | | | | | | | | | | | | | | | | |
Domino’s Pizza Enterprises Ltd. | | | (3,710 | ) | | | (132,643 | ) | | | (353 | ) | | | 0.0 | (a) |
| | | | | | | | | | | | | | | | |
Professional Services | | | | | | | | | | | | | | | | |
IPH Ltd. | | | (53,029 | ) | | | (237,808 | ) | | | (382 | ) | | | 0.0 | (a) |
| | | | | | | | | | | | | | | | |
Total Short Positions of Total Return Basket Swaps | | | (86,567 | ) | | | (537,159 | ) | | | (792 | ) | | | 0.0 | (a) |
| | | | | | | | | | | | | | | | |
Total of Long and Short Positions of Total Return Basket Swaps | | | 373,116 | | | | 612,338 | | | | 1,259 | | | | 0.0 | (a) |
| | | | | | | | | | | | | | | | |
| * | Non-income producing security. |
| ‡ | Value determined using significant unobservable inputs. |
| (a) | Amounts rounds to less than 0.05%. |
| (b) | Securities exempt from registration under Rule 144A or section 4(2), of the Securities Act of 1933. Under procedures approved by the Board of Trustees, such securities have been determined to be liquid by the investment adviser and may be resold, normally to qualified institutional buyers in transactions exempt from registration. |
| CVR | Contingent Value Rights |
| (1) | Notional value represents market value as of October 31, 2017 of these positions based on the securities’ last sale or closing price on the principal exchange on which the securities are traded. |
| (2) | Unrealized appreciation (depreciation) represents the unrealized gain(loss) of the positions subsequent to the swap reset. |
SEE NOTES TO CONSOLIDATED FINANCIAL STATEMENTS.
| | | | | | |
| | | |
| 42 | | | | JPMORGAN EXCHANGE-TRADED FUNDS | | OCTOBER 31, 2017 |
| | | | | | |
| The following reference rates, and their values as of year-end, are used for security descriptions: | | | |
| | | | | VALUE | |
| BA | | Banker’sAcceptance Rate | | | 1.26 | % |
| BBR | | BankBase Rate | | | 1.26 | % |
| BBSW | | ASXAustralia Bank Bill Short Term Rates | | | 1.69 | % |
| CDOR | | CanadaBankers Acceptances Rates | | | 1.32 | % |
| CIBOR | | CopenhagenInterbank Offered Rates | | | 0.36 | % |
| EURIBOR | | EuroInterbank Offered Rate | | | 0.38 | % |
| LIBOR | | LondonInterbank Offered Rate | | | 1.38 | % |
| STIBOR | | StockholmInterbank Offered Rates | | | 0.46 | % |
| | | | | | | | |
| Summary of total OTC swap contracts outstanding as of October 31, 2017: | | | | | | |
| | | NET UPFRONT
PAYMENTS
(RECEIPTS) $ | | | VALUE $ | |
Assets | |
OTC Total return basket swaps contracts outstanding | | | — | | | | 66,375 | |
OTC Total return swap contracts outstanding | | | — | | | | 65 | |
| | | | | | | | |
Total OTC swap contracts outstanding | | | — | | | | 66,440 | |
| | | | | | | | |
Liabilities | | | | | | | | |
| | | | | | | | |
Total OTC Total return basket swaps outstanding | | | — | | | | (63,064 | ) |
| | | | | | | | |
SEE NOTES TO CONSOLIDATED FINANCIAL STATEMENTS.
| | | | | | | | |
| | | |
| OCTOBER 31, 2017 | | JPMORGAN EXCHANGE-TRADED FUNDS | | | | | 43 | |
CONSOLIDATED STATEMENT OF ASSETS AND LIABILITIES
AS OF OCTOBER 31, 2017
| | | | |
| | | JPMorgan
Diversified
Alternatives ETF | |
ASSETS: | | | | |
Investments in non-affiliates, at value | | $ | 68,608,018 | |
Investments in affiliates, at value | | | 79,678,128 | |
Cash | | | 773,764 | |
Restricted cash | | | 2,000 | |
Restricted cash for OTC derivatives | | | 460,000 | |
Foreign currency, at value | | | 1,138,185 | |
Deposits at broker for futures contracts | | | 3,373,000 | |
Receivables: | | | | |
Investment securities sold | | | 269,827 | |
Dividends from non-affiliates | | | 25,342 | |
Dividends from affiliates | | | 56,709 | |
Tax reclaims | | | 600 | |
Variation margin on futures contracts | | | 230,995 | |
Unrealized appreciation on forward foreign currency exchange contracts | | | 348,517 | |
Outstanding OTC swap contracts, at value | | | 66,440 | |
Due from counterparty for swap contracts | | | 125,362 | |
Prepaid expenses | | | 5,464 | |
| | | | |
Total Assets | | | 155,162,351 | |
| | | | |
| |
LIABILITIES: | | | | |
Payables: | | | | |
Investment securities purchased | | | 304,144 | |
Unrealized depreciation on forward foreign currency exchange contracts | | | 506,953 | |
Outstanding OTC swap contracts, at value | | | 63,064 | |
Due to counterparty for swap contracts | | | 277,647 | |
Accrued liabilities: | | | | |
Investment advisory fees | | | 34,187 | |
Administration fees | | | 14,331 | |
Custodian and Transfer Agent fees | | | 8,828 | |
Trustees’ and Chief Compliance Officer’s fees | | | 2,381 | |
Accounting fees | | | 4,409 | |
Professional Fees | | | 143,327 | |
Other | | | 20,339 | |
| | | | |
Total Liabilities | | | 1,379,610 | |
| | | | |
Net Assets | | $ | 153,782,741 | |
| | | | |
| |
NET ASSETS: | | | | |
Paid-in-Capital | | $ | 151,178,269 | |
Accumulated undistributed (distributions in excess of) net investment income | | | (500,199 | ) |
Accumulated net realized gains (losses) | | | 47,288 | |
Net unrealized appreciation (depreciation) | | | 3,057,383 | |
| | | | |
Total Net Assets | | $ | 153,782,741 | |
| | | | |
| |
Outstanding number of shares
(unlimited number of shares authorized — par value $0.0001) | | | 5,900,000 | |
| | | | |
Net asset value, per share | | $ | 26.06 | |
| | | | |
Cost of investments in non-affiliates | | $ | 65,239,698 | |
Cost of investments in affiliates | | | 79,678,128 | |
Cost of foreign currency | | | 1,140,044 | |
SEE NOTES TO CONSOLIDATED FINANCIAL STATEMENTS.
| | | | | | |
| | | |
| 44 | | | | JPMORGAN EXCHANGE-TRADED FUNDS | | OCTOBER 31, 2017 |
CONSOLIDATED STATEMENT OF OPERATIONS
FOR THE YEAR ENDED OCTOBER 31, 2017
| | | | |
| | | JPMorgan
Diversified
Alternatives ETF | |
INVESTMENT INCOME: | | | | |
Dividend income from non-affiliates | | $ | 666,101 | |
Dividend income from affiliates | | | 256,269 | |
Interest income from affiliates | | | 9,496 | |
Foreign taxes withheld | | | (51,593 | ) |
| | | | |
Total investment income | | | 880,273 | |
| | | | |
| |
EXPENSES: | | | | |
Investment advisory fees (Note 3.A) | | | 590,584 | |
Administration fees (Note 3.B) | | | 85,517 | |
Accounting fees (Note 3.D) | | | 116,248 | |
Interest expense to affiliates | | | 2,203 | |
Professional fees | | | 175,408 | |
Trustees’ and Chief Compliance Officer’s fees | | | 15,718 | |
Printing and mailing costs | | | 21,965 | |
Registration and filing fees | | | 30,444 | |
Custodian and Transfer Agent fees (Note 3.C) | | | 14,503 | |
Insurance expense | | | 5,223 | |
Offering costs (Note 2.F) | | | 72,501 | |
Other | | | 9,532 | |
| | | | |
Total expenses | | | 1,139,846 | |
| | | | |
Less fees waived (Note 3.E) | | | (474,476 | ) |
Less expense reimbursements from non-affiliates (Note 3.C) | | | (4,200 | ) |
| | | | |
Net expenses | | | 661,170 | |
| | | | |
Net investment income (loss) | | | 219,103 | |
| | | | |
| |
REALIZED/UNREALIZED GAINS (LOSSES): | | | | |
Net realized gain (loss) on transactions from: | | | | |
Investments in non-affiliates | | | 947,806 | |
Futures | | | (885,192 | ) |
Foreign currency transactions | | | 67,229 | |
Forward foreign currency exchange contracts | | | (370,515 | ) |
Swaps | | | (966,098 | ) |
| | | | |
Net realized gain (loss) | | | (1,206,770 | ) |
| | | | |
Change in net unrealized appreciation/depreciation on: | | | | |
Investments in non-affiliates | | | 3,489,765 | |
Futures | | | (143,978 | ) |
Foreign currency translations | | | 7,472 | |
Forward foreign currency exchange contracts | | | (219,140 | ) |
Swaps | | | 5,373 | |
| | | | |
Change in net unrealized appreciation/depreciation | | | 3,139,492 | |
| | | | |
Net realized/unrealized gains (losses) | | | 1,932,722 | |
| | | | |
Change in net assets resulting from operations | | $ | 2,151,825 | |
| | | | |
SEE NOTES TO CONSOLIDATED FINANCIAL STATEMENTS.
| | | | | | | | |
| | | |
| OCTOBER 31, 2017 | | JPMORGAN EXCHANGE-TRADED FUNDS | | | | | 45 | |
CONSOLIDATED STATEMENT OF CHANGES IN NET ASSETS
FOR THE PERIODS INDICATED
| | | | | | | | |
| | | JPMorgan Diversified Alternatives ETF | |
| | | Year Ended
October 31, 2017 | | | Period Ended
October 31, 2016 (a) | |
CHANGE IN NET ASSETS RESULTING FROM OPERATIONS: | | | | | | | | |
Net investment income (loss) | | $ | 219,103 | | | $ | (15,490 | ) |
Net realized gain (loss) | | | (1,206,770 | ) | | | 349,346 | |
Change in net unrealized appreciation/depreciation | | | 3,139,492 | | | | (82,109 | ) |
| | | | | | | | |
Change in net assets resulting from operations | | | 2,151,825 | | | | 251,747 | |
| | | | | | | | |
| | |
DISTRIBUTIONS TO SHAREHOLDERS: | | | | | | | | |
From net investment income | | | (444,087 | ) | | | — | |
From net realized gains | | | (13,545 | ) | | | — | |
| | | | | | | | |
Total distributions to shareholders | | | (457,632 | ) | | | — | |
| | | | | | | | |
| | |
CAPITAL TRANSACTIONS: | | | | | | | | |
Change in net assets resulting from capital transactions | | | 100,111,115 | | | | 51,725,686 | |
| | | | | | | | |
| | |
NET ASSETS: | | | | | | | | |
Change in net assets | | | 101,805,308 | | | | 51,977,433 | |
Beginning of period | | | 51,977,433 | | | | — | |
| | | | | | | | |
End of period | | $ | 153,782,741 | | | $ | 51,977,433 | |
| | | | | | | | |
Accumulated undistributed (distributions in excess of) net investment income | | $ | (500,199 | ) | | $ | 367,786 | |
| | | | | | | | |
| | |
CAPITAL TRANSACTIONS: | | | | | | | | |
Proceeds from shares issued | | $ | 100,111,115 | | | $ | 51,725,686 | |
| | | | | | | | |
Total change in net assets resulting from capital transactions | | $ | 100,111,115 | | | $ | 51,725,686 | |
| | | | | | | | |
| | |
SHARE TRANSACTIONS: | | | | | | | | |
Issued | | | 3,850,000 | | | | 2,050,000 | |
| | | | | | | | |
Net increase in shares from share transactions | | | 3,850,000 | | | | 2,050,000 | |
| | | | | | | | |
| (a) | Commencement of operations was September 12, 2016. |
SEE NOTES TO CONSOLIDATED FINANCIAL STATEMENTS.
| | | | | | |
| | | |
| 46 | | | | JPMORGAN EXCHANGE-TRADED FUNDS | | OCTOBER 31, 2017 |
THIS PAGE IS INTENTIONALLY LEFT BLANK
| | | | | | | | |
| | | |
| OCTOBER 31, 2017 | | JPMORGAN EXCHANGE-TRADED FUNDS | | | | | 47 | |
CONSOLIDATED FINANCIAL HIGHLIGHTS
FOR THE PERIODS INDICATED
| | | | | | | | | | | | | | | | | | | | | | | | | | | | | | | | |
| | | Per share operating performance | |
| | | | | | Investment operations | | | Distributions | | | | |
| | | Net asset
value,
beginning
of period | | | Net
investment
income
(loss) (b) | | | Net realized
and unrealized
gains
(losses) on
investments | | | Total from
investment
operations | | | Net
investment
income (loss) | | | Net
realized
gain
(loss) | | | Total from
distributions | | | Net asset
value,
end of
period | |
|
JPMorgan Diversified Alternatives ETF | |
Year Ended October 31, 2017 | | $ | 25.35 | | | $ | 0.07 | | | $ | 0.86 | | | $ | 0.93 | | | $ | (0.21 | ) | | $ | (0.01 | ) | | $ | (0.22 | ) | | $ | 26.06 | |
September 12, 2016 (a) through October 31, 2016 | | | 25.00 | | | | (0.02 | ) | | | 0.37 | | | | 0.35 | | | | — | | | | — | | | | — | | | | 25.35 | |
| (a) | Commencement of operations. |
| (b) | Calculated based upon average shares outstanding. |
| (c) | Not annualized for periods less than one year. |
| (d) | Includes adjustments in accordance with accounting principles generally accepted in the United States of America and as such, the net asset values for financial reporting purposes and the returns based upon those net asset values may differ from the net asset values and returns for shareholder transactions. |
| (e) | Market price total return is calculated assuming an initial investment made at the beginning of the period market price, reinvestment of all dividends and distributions at market price during the period, and sale at the market price on the last day of the period. The market price presented to calculate the market price total return is the mid-point of the bid/ask spread at the close of business on the NYSE Arca, Inc. |
| (f) | Annualized for periods less than one year, unless otherwise indicated. |
| (g) | Certain non-recurring expenses incurred by the Fund were not annualized for the period indicated. |
SEE NOTES TO CONSOLIDATED FINANCIAL STATEMENTS.
| | | | | | |
| | | |
| 48 | | | | JPMORGAN EXCHANGE-TRADED FUNDS | | OCTOBER 31, 2017 |
| | | | | | | | | | | | | | | | | | | | | | | | | | | | | | |
| Ratios/Supplemental data | |
| | | | | | | | | | | | | Ratios to average net assets (f) | |
Market
price, end of
period | | | Total
return (c)(d) | | | Market
price total
return (c)(e) | | | Net assets,
end of period | | | Net
expenses | | |
Net
investment
income
(loss) | | | Expenses
without waivers
and reimbursements | | | Portfolio
turnover
rate (c) | |
|
| | |
| $ | 26.09 | | | | 3.68 | % | | | 3.51 | % | | $ | 153,782,741 | | | | 0.76 | % | | | 0.25 | % | | | 1.31 | % | | | 107 | % |
| | 25.42 | | | | 1.44 | | | | 1.68 | | | | 51,977,433 | | | | 0.85 | (g) | | | (0.47 | ) | | | 6.65 | (g) | | | 5 | |
SEE NOTES TO CONSOLIDATED FINANCIAL STATEMENTS.
| | | | | | | | |
| | | |
| OCTOBER 31, 2017 | | JPMORGAN EXCHANGE-TRADED FUNDS | | | | | 49 | |
NOTES TO CONSOLIDATED FINANCIAL STATEMENTS
AS OF OCTOBER 31, 2017
1. Organization
J.P. Morgan Exchange-Traded Fund Trust (the “Trust”) was formed on February 25, 2010, and is governed by a Declaration of Trust as amended and restated February 19, 2014, and is registered under the Investment Company Act of 1940, as amended (the “1940 Act”), as an open-ended management investment company. JPMorgan Diversified Alternatives ETF (the “Fund” or the “Diversified Alternatives ETF”) is a separate diversified series of the Trust covered in this report.
The Fund commenced operations on September 12, 2016. The investment objective of the Fund is to seek to provide long-term total return.
J.P. Morgan Investment Management Inc. (“JPMIM” or the “Adviser”), an indirect, wholly-owned subsidiary of JPMorgan Chase & Co. (“JPMorgan”), acts as the Adviser and Administrator (the “Administrator”) to the Fund.
Shares of the Fund are listed and traded on the NYSE Arca, Inc. Market prices for the Fund’s shares may be different from their net asset value (“NAV”). Effective October 1, 2017, JPMorgan Distribution Services, Inc. (the “Distributor” or “JPMDS”), an indirect, wholly-owned subsidiary of JPMorgan, serves as the Fund’s distributor. Prior to October 1, 2017, SEI Investments Distribution Co. (“SIDCO”) was the distributor of the Fund. The agreement with JPMDS is substantially similar to the agreement with SIDCO. The Fund issues and redeems its shares on a continuous basis, through the Distributor, at NAV in large blocks of shares, typically 50,000 shares, referred to as “Creation Units.” Creation Units are issued and redeemed principally in cash. Shares are generally traded in the secondary market in amounts less than a Creation Unit at market prices that change throughout the day. Only individuals or institutions that have entered into an authorized participant agreement with the Distributor may do business directly with the Fund (each, an “Authorized Participant”).
Basis for Consolidation for the Fund
Diversified Alternatives Fund CS Ltd. (the “Subsidiary”), a Cayman Islands exempted company, was incorporated on August 17, 2015 and is currently a wholly-owned subsidiary of the Fund. The Subsidiary acts as an investment vehicle for the Fund in order to effect certain investments on behalf of the Fund consistent with the Fund’s investment objectives and policies as described in the Fund’s prospectus. The consolidated financial statements include the accounts of the Fund and the Subsidiary. Subsequent references to the Fund within the Notes to Consolidated Financial Statements collectively refer to the Fund and the Subsidiary. All significant intercompany balances and transactions have been eliminated in consolidation.
2. Significant Accounting Policies
The following is a summary of significant accounting policies followed by the Fund in the preparation of its consolidated financial statements. The Fund is an investment company and, accordingly, follows the investment company accounting and reporting guidance of the Financial Accounting Standards Board Accounting Standards Codification Topic 946 — Investment Companies, which is part of the U.S. generally accepted accounting principles (“GAAP”). The preparation of financial statements in conformity with GAAP requires management to make estimates and assumptions that affect the reported amounts of assets and liabilities and the disclosure of contingent assets and liabilities at the date of the financial statements and the reported amounts of increases and decreases in net assets from operations during the reporting period. Actual results could differ from those estimates.
A. Valuation of Investments — The valuation of the investments is in accordance with GAAP and the Fund’s valuation policies set forth by and under the supervision and responsibility of the Board of Trustees (the “Board”), which established the following approach to valuation, as described more fully below: (i) investments for which market quotations are readily available shall be valued at such unadjusted quoted prices, and (ii) all other investments for which market quotations are not readily available shall be valued at their fair value as determined in good faith by the Board.
The Administrator has established the J.P. Morgan Asset Management Americas Valuation Committee (“AVC”) to assist the Board with the oversight and monitoring of the valuation of the Fund’s investments. The Administrator implements the valuation policies of the Fund’s investments, as directed by the Board. The AVC oversees and carries out the policies for the valuation of investments held in the Fund. This includes monitoring the appropriateness of fair values based on results of ongoing valuation oversight, including but not limited to consideration of macro or security specific events, market events and pricing vendor and broker due diligence. The Administrator is responsible for discussing and assessing the potential impacts to the fair values on an ongoing basis, and at least on a quarterly basis with the AVC and the Board.
Equities and other exchange-traded instruments are valued at the last sale price or official market closing price on the primary exchange on which the instruments are traded before the net asset value (“NAV”) of the Fund is calculated on a valuation date. Certain foreign equity instruments, as well as certain derivatives with equity reference obligations, are valued by applying international fair value factors provided by approved pricing vendors or third party broker-dealers (collectively referred to as “Pricing Services”). The factors seek to adjust the local closing price for movements of local markets post closing, but prior to the time the NAVs are calculated.
Investments in open-end investment companies (the “Underlying Fund”) are valued at each Underlying Fund’s NAV per share as of the report date. Forward foreign currency exchange contracts are valued utilizing market quotations from approved Pricing Services.
Futures are generally valued on the basis of available market quotations. Swaps and other derivatives are valued utilizing market quotations from approved Pricing Services.
Valuations reflected in this report are as of the report date. As a result, changes in valuation due to market events and/or issuer related events after the report date and prior to issuance of the report are not reflected herein.
| | | | | | |
| | | |
| 50 | | | | JPMORGAN EXCHANGE-TRADED FUNDS | | OCTOBER 31, 2017 |
The various inputs that are used in determining the valuation of the Fund’s investments are summarized into the three broad levels listed below.
| • | | Level 1 — Unadjusted inputs using quoted prices in active markets for identical investments. |
| • | | Level 2 — Other significant observable inputs including, but not limited to, quoted prices for similar investments, inputs other than quoted prices that are observable for investments (such as interest rates, prepayment speeds, credit risk, etc.) or other market corroborated inputs. |
| • | | Level 3 — Significant inputs based on the best information available in the circumstances, to the extent observable inputs are not available (including the Fund’s assumptions in determining the fair value of investments). |
A financial instrument’s level within the fair value hierarchy is based on the lowest level of any input, both individually and in the aggregate, that is significant to the fair value measurement. The inputs or methodology used for valuing instruments are not necessarily an indication of the risk associated with investing in those instruments.
The following table represents each valuation input as presented on the Consolidated Schedule of Portfolio Investments (“CSOI”):
| | | | | | | | | | | | | | | | |
| | | Level 1
Quoted prices | | | Level 2
Other significant
observable inputs | | | Level 3
Significant
unobservable inputs | | | Total | |
Investments in Securities | | | | | | | | | | | | | | | | |
Common Stocks | | | | | | | | | | | | | | | | |
Aerospace & Defense | | $ | 2,158,931 | | | $ | — | | | $ | — | | | $ | 2,158,931 | |
Auto Components | | | 2,095,190 | | | | — | | | | — | | | | 2,095,190 | |
Banks | | | 555,529 | | | | — | | | | — | | | | 555,529 | |
Beverages | | | 271,056 | | | | — | | | | — | | | | 271,056 | |
Biotechnology | | | 90,727 | | | | — | | | | — | | | | 90,727 | |
Capital Markets | | | 572,587 | | | | — | | | | — | | | | 572,587 | |
Chemicals | | | 3,055,973 | | | | — | | | | — | | | | 3,055,973 | |
Commercial Services & Supplies | | | 879,480 | | | | — | | | | — | | | | 879,480 | |
Communications Equipment | | | 2,192,535 | | | | — | | | | — | | | | 2,192,535 | |
Construction & Engineering | | | 314,509 | | | | — | | | | — | | | | 314,509 | |
Consumer Finance | | | 209,328 | | | | — | | | | — | | | | 209,328 | |
Containers & Packaging | | | 278,927 | | | | — | | | | — | | | | 278,927 | |
Diversified Financial Services | | | 269,072 | | | | — | | | | — | | | | 269,072 | |
Diversified Telecommunication Services | | | 482,272 | | | | — | | | | — | | | | 482,272 | |
Electric Utilities | | | 629,967 | | | | — | | | | — | | | | 629,967 | |
Electrical Equipment | | | 591,076 | | | | — | | | | — | | | | 591,076 | |
Electronic Equipment, Instruments & Components | | | 2,199,397 | | | | — | | | | — | | | | 2,199,397 | |
Energy Equipment & Services | | | 1,570,643 | | | | — | | | | — | | | | 1,570,643 | |
Food & Staples Retailing | | | 318,332 | | | | — | | | | — | | | | 318,332 | |
Food Products | | | 2,912,173 | | | | — | | | | — | | | | 2,912,173 | |
Gas Utilities | | | 899,913 | | | | — | | | | — | | | | 899,913 | |
Health Care Equipment & Supplies | | | 1,193,947 | | | | — | | | | — | | | | 1,193,947 | |
Health Care Providers & Services | | | 2,989,763 | | | | — | | | | — | | | | 2,989,763 | |
Hotels, Restaurants & Leisure | | | 2,768,362 | | | | — | | | | — | | | | 2,768,362 | |
Household Durables | | | 1,174,809 | | | | — | | | | — | | | | 1,174,809 | |
Household Products | | | 1,133,106 | | | | — | | | | — | | | | 1,133,106 | |
Independent Power and Renewable Electricity Producers | | | 2,363,051 | | | | — | | | | — | | | | 2,363,051 | |
Industrial Conglomerates | | | 360,400 | | | | — | | | | — | | | | 360,400 | |
Insurance | | | 2,214,471 | | | | — | | | | — | | | | 2,214,471 | |
Internet Software & Services | | | 768,197 | | | | — | | | | — | | | | 768,197 | |
IT Services | | | 2,464,690 | | | | — | | | | — | | | | 2,464,690 | |
Life Sciences Tools & Services | | | 1,984,330 | | | | — | | | | — | | | | 1,984,330 | |
Machinery | | | 2,869,426 | | | | — | | | | — | | | | 2,869,426 | |
Media | | | 3,229,323 | | | | — | | | | — | | | | 3,229,323 | |
Metals & Mining | | | 352,393 | | | | — | | | | — | | | | 352,393 | |
Multiline Retail | | | 821,681 | | | | — | | | | — | | | | 821,681 | |
Multi-Utilities | | | 1,077,514 | | | | — | | | | — | | | | 1,077,514 | |
Oil, Gas & Consumable Fuels | | | 1,336,767 | | | | — | | | | — | | | | 1,336,767 | |
Paper & Forest Products | | | 316,092 | | | | — | | | | — | | | | 316,092 | |
Personal Products | | | 352,112 | | | | — | | | | — | | | | 352,112 | |
| | | | | | | | |
| | | |
| OCTOBER 31, 2017 | | JPMORGAN EXCHANGE-TRADED FUNDS | | | | | 51 | |
NOTES TO CONSOLIDATED FINANCIAL STATEMENTS
AS OF OCTOBER 31, 2017 (continued)
| | | | | | | | | | | | | | | | |
| | | Level 1
Quoted prices | | | Level 2
Other significant
observable inputs | | | Level 3
Significant
unobservable inputs | | | Total | |
Pharmaceuticals | | $ | 3,252,482 | | | $ | — | | | $ | — | | | $ | 3,252,482 | |
Professional Services | | | 600,539 | | | | — | | | | — | | | | 600,539 | |
Real Estate Management & Development | | | 70,776 | | | | — | | | | — | | | | 70,776 | |
Semiconductors & Semiconductor Equipment | | | 4,398,570 | | | | — | | | | — | | | | 4,398,570 | |
Software | | | 3,350,482 | | | | — | | | | — | | | | 3,350,482 | |
Specialty Retail | | | 2,727,854 | | | | — | | | | — | | | | 2,727,854 | |
Technology Hardware, Storage & Peripherals | | | 634,834 | | | | — | | | | — | | | | 634,834 | |
Textiles, Apparel & Luxury Goods | | | 678,544 | | | | — | | | | — | | | | 678,544 | |
Trading Companies & Distributors | | | 575,886 | | | | — | | | | — | | | | 575,886 | |
| | | | | | | | | | | | | | | | |
Total Common Stocks | | | 68,608,018 | | | | — | | | | — | | | | 68,608,018 | |
| | | | | | | | | | | | | | | | |
| | | | |
Short-Term Investments | | | | | | | | | | | | | | | | |
Investment Company | | | 79,678,128 | | | | — | | | | — | | | | 79,678,128 | |
| | | | | | | | | | | | | | | | |
Total Investments in Securities | | $ | 148,286,146 | | | $ | — | | | $ | — | | | $ | 148,286,146 | |
| | | | | | | | | | | | | | | | |
Appreciation in Other Financial Instruments | | | | | | | | | | | | | | | | |
Forward Foreign Currency Exchange Contracts | | $ | — | | | $ | 348,517 | | | $ | — | | | $ | 348,517 | |
Futures | | | 841,232 | | | | 102,999 | | | | — | | | | 944,231 | |
Swaps | | | — | | | | 66,375 | | | | 65 | | | | 66,440 | |
| | | | | | | | | | | | | | | | |
Total Appreciation in Other Financial Instruments | | $ | 841,232 | | | $ | 517,891 | | | $ | 65 | | | $ | 1,359,188 | |
| | | | | | | | | | | | | | | | |
Depreciation in Other Financial Instruments | | | | | | | | | | | | | | | | |
Forward Foreign Currency Exchange Contracts | | $ | — | | | $ | (506,953 | ) | | $ | — | | | $ | (506,953 | ) |
Futures | | | (1,104,247 | ) | | | (4,350 | ) | | | — | | | | (1,108,597 | ) |
Swaps | | | | | | | (63,064 | ) | | | | | | | (63,064 | ) |
| | | | | | | | | | | | | | | | |
Total Depreciation in Other Financial Instruments | | $ | (1,104,247 | ) | | $ | (574,367 | ) | | $ | — | | | $ | (1,678,614 | ) |
| | | | | | | | | | | | | | | | |
All portfolio holdings designated as Level 1 are disclosed individually on the CSOIs. Please refer to the CSOIs for industry class specifics of the portfolio holdings.
There were no transfers among any levels during the year ended October 31, 2017. Transfers between fair value levels are valued utilizing values as of the beginning of the year.
B. Restricted Securities — Certain securities held by the Fund may be subject to legal or contractual restrictions on resale. Restricted securities generally are resold in transactions exempt from registration under the Securities Act of 1933 (the “Securities Act”). Disposal of these securities may involve time-consuming negotiations and expense. Prompt sale at the current valuation may be difficult and could adversely affect the net asset value of the Fund.
As of October 31, 2017, the Fund had no investments in restricted securities other than securities sold to the Fund under Rule 144A.
C. Derivatives — The Fund used derivative instruments including futures, forward foreign currency exchange contracts and swaps, in connection with its investment strategy. Derivative instruments may be used as substitutes for securities in which the Fund can invest, to hedge portfolio investments or to generate income or gains to the Fund. Certain derivatives are synthetic instruments that attempt to replicate the performance of certain reference assets.
The Fund may be subject to various risks from the use of derivatives including the risk that changes in the value of a derivative may not correlate perfectly with the underlying asset, rate or index; counterparty credit risk related to derivatives counterparties’ failure to perform under contract terms; liquidity risk related to the lack of a liquid market for these contracts allowing the Fund to close out its position(s); and, documentation risk relating to disagreement over contract terms. Investing in certain derivatives also results in a form of leverage and as such, the Fund’s risk of loss associated with these instruments may exceed their value, as recorded in the Consolidated Statement of Assets and Liabilities (“CSAL”).
The Fund is party to various derivative contracts governed by International Swaps and Derivatives Association master agreements (“ISDA agreements”). The Fund’s ISDA agreements, which are separately negotiated with each dealer counterparty, may contain provisions allowing, absent other considerations, a counterparty to exercise rights, to the extent not otherwise waived, against the Fund in the event the Fund’s net assets decline over time by a predetermined percentage or fall below a pre-determined floor. The ISDA agreements also contain provisions allowing, absent other conditions, the Fund to exercise rights, to the extent not otherwise waived, against the counterparty (e.g., decline in a counterparty’s credit rating below a specified level). Such rights for both the counterparty and Fund often include the ability to terminate (i.e., close out) open con-
| | | | | | |
| | | |
| 52 | | | | JPMORGAN EXCHANGE-TRADED FUNDS | | OCTOBER 31, 2017 |
tracts at prices which may favor the counterparty, which could have an adverse effect on the Fund. The ISDA agreements give the Fund and counterparty the right, upon an event of default, to close out all transactions traded under such agreements and to net amounts owed or due across all transactions and offset such net payable or receivable with collateral posted to a segregated account by one party to the other.
Counterparty credit risk may be mitigated to the extent a counterparty posts collateral for mark-to-market gains to the Fund.
Notes C(1) — C(4) below describe the various derivatives used by the Fund.
(1). Futures Contracts — The Fund used index, treasury and commodity futures to obtain long and short exposure to the underlying commodities markets.
Futures contracts provide for the delayed delivery of the underlying instrument at a fixed price or are settled for a cash amount based on the change in the value of the underlying instrument at a specific date in the future. Upon entering into a futures contract, the Fund is required to deposit with the broker, cash or securities in an amount equal to a certain percentage of the contract amount, which is referred to as the initial margin deposit. Subsequent payments, referred to as variation margin, are made or received by the Fund periodically and are based on changes in the market value of open futures contracts. Changes in the market value of open futures contracts are recorded as Change in net unrealized appreciation/depreciation in the Consolidated Statement of Operations (“CSOP”). Realized gains or losses, representing the difference between the value of the contract at the time it was opened and the value at the time it was closed, are reported in the CSOP at the closing or expiration of the futures contract. Securities deposited as initial margin are designated in the CSOI and cash deposited is recorded on the CSAL. A receivable from and/or a payable to brokers for the daily variation margin is also recorded on the CSAL.
The use of futures contracts exposes the Fund to interest rate risk, commodities risk and equity price risk. The Fund may be subject to the risk that the change in the value of the futures contract may not correlate perfectly with the underlying instrument. Use of long futures contracts subjects the Fund to risk of loss in excess of the amounts shown on the CSAL, up to the notional amount of the futures contracts. Use of short futures contracts subjects the Fund to unlimited risk of loss. The Fund may enter into futures contracts only on exchanges or boards of trade. The exchange or board of trade acts as the counterparty to each futures transaction; therefore, the Fund’s credit risk is limited to failure of the exchange or board of trade. Under some circumstances, futures exchanges may establish daily limits on the amount that the price of a futures contract can vary from the previous day’s settlement price, which could effectively prevent liquidation of positions.
The Fund’s futures contracts are not subject to master netting arrangements (the right to close out all transactions traded with a counterparty and net amounts owed or due across transactions).
(2). Forward Foreign Currency Exchange Contracts — The Fund may be exposed to foreign currency risks associated with portfolio investments and therefore, at times, used forward foreign currency exchange contracts to hedge or manage these exposures. The Fund also bought forward foreign currency exchange contracts to gain exposure to currencies. Forward foreign currency exchange contracts represent obligations to purchase or sell foreign currency on a specified future date at a price fixed at the time the contracts are entered into. Non-deliverable forward foreign currency exchange contracts are settled with the counterparty in U.S. dollar without the delivery of foreign currency.
The values of the forward foreign currency exchange contracts are adjusted daily based on the applicable exchange rate of the underlying currency. Changes in the value of these contracts are recorded as unrealized appreciation or depreciation until the contract settlement date. When the forward foreign currency exchange contract is closed, the Fund records a realized gain or loss equal to the difference between the value at the time the contract was opened and the value at the time it was closed. The Fund also records a realized gain or loss when a forward foreign currency exchange contract offsets another forward foreign currency exchange contract with the same counterparty upon settlement.
The Fund’s forward foreign currency exchange contracts are subject to master netting arrangements (the right to close out all transactions with a counterparty and net amounts owed or due across transactions). The Fund may be required to post or receive collateral for non-deliverable forward foreign currency exchange contracts.
(3). Total Return Swaps — The Fund used total return swaps to gain long or short exposure to underlying stock. To the extent the total return of the stock underlying the transaction exceeds or falls short of the offsetting interest rate obligation, the Fund will receive a payment from or make a payment to the counterparty. These arrangements involve the periodic exchange of cash flows based on the total return of the underlying stock and interest rate obligations.
(4). Total Return Basket Swaps — The Fund entered into total return basket swap agreements to obtain exposure to a portfolio of long and short securities. This is a highly specialized activity and a significant aspect of the Fund’s investment strategy.
Under the terms of the agreements, each swap is designed to function as a portfolio of direct investments in long and short equity positions. This means that the Fund has the ability to trade in and out of long and short positions within each swap and will receive all of the economic benefits and risks equivalent to direct investments in these positions such as: capital appreciation (depreciation), corporate actions and dividends received and paid, all of which are reflected in each swap value. Each swap value also includes interest charges and credits related to the notional values of the long and short positions and cash balances within each swap. These interest charges and credits are based on defined market rates based on the local currencies of the positions in the portfolio plus or minus a specified spread and are referred to herein as “financing costs”. Positions within each swap, accrued financing costs and net dividends, are part of the monthly reset. During a reset, any unrealized gains (losses) on positions, accrued financing costs, and net dividends become available for cash settlement between the Fund and the swap counterparty and are recorded as Due from/to counterparty for swap contract on the CSAL and as net realized gain (loss) on transactions from swaps on the CSOP.
| | | | | | | | |
| | | |
| OCTOBER 31, 2017 | | JPMORGAN EXCHANGE-TRADED FUNDS | | | | | 53 | |
NOTES TO CONSOLIDATED FINANCIAL STATEMENTS
AS OF OCTOBER 31, 2017 (continued)
The Fund may be required to post or receive collateral based on the net value of the Fund’s outstanding over-the-counter swap contracts with the counterparty in the form of cash or securities. Daily movement of collateral is subject to minimum threshold amounts. Collateral posted by the Fund is held in a segregated account at the Fund’s custodian bank. Cash collateral posted by the Fund is reported on the CSAL as Restricted cash. Collateral received by the Fund is held in escrow in segregated accounts maintained by JPMorgan Chase Bank, N.A. (“JPMCB”), an affiliate of the Fund.
The total return basket swaps include securities that are denominated in foreign currencies. Changes in currency exchange rates will affect the value of, and investment income from, such securities. Investing in swaps results in a form of leverage (i.e., the Fund’s risk of loss associated with these instruments may exceed their value as recorded on the CSAL).
The value of each swap is derived from a combination of (i) the net value of the underlying positions, which are valued daily using the last sale or closing prices on the principal exchange on which the underlying securities are traded; (ii) financing costs; (iii) the value of dividends; (iv) cash balances within the swap; and (v) other factors, as applicable. The value of each swap is reflected on the CSAL as Outstanding swap contracts, at value. Changes in the value of each swap are recognized as Change in net unrealized appreciation/depreciation of swaps on the CSOP.
The total return basket swaps contracts are subject to master netting arrangements. The fund may be required to post or receive collateral for the total return basket swaps.
(5). Summary of Derivatives Information — The following tables present the value of derivatives held as of October 31, 2017, by their primary underlying risk exposure and respective location on the CSAL:
| | | | | | | | | | | | | | | | | | |
| Derivatives Contracts | | CSAL Location | | | | | | | | | | | | |
| Gross Assets: | | | | Futures
Contracts (a) | | | Forward Foreign
Currency Exchange
Contracts | | | Swaps | | | Total | |
| Interest rate contracts | | Receivables, Net Assets — Unrealized Appreciation | | $ | 225,658 | | | $ | — | | | $ | — | | | $ | 225,658 | |
| Equity contracts | | Receivables, Net Assets — Unrealized Appreciation | | | 143,953 | | | | — | | | | 66,440 | | | | 210,393 | |
| Foreign exchange contracts | | Receivables | | | — | | | | 348,517 | | | | — | | | | 348,517 | |
| Commodity contracts | | Receivables, Net Assets — Unrealized Appreciation | | | 574,620 | | | | — | | | | — | | | | 574,620 | |
| | | | | | | | | | | | | | | | | | |
Total | | | | $ | 944,231 | | | $ | 348,517 | | | $ | 66,440 | | | $ | 1,359,188 | |
| | | | | | | | | | | | | | | | | | |
| | | | | |
Gross Liabilities: | | | | | | | | | | | | | | |
| Interest rate contracts | | Payables, Net Assets — Unrealized Depreciation | | $ | (595,484 | ) | | $ | — | | | $ | — | | | $ | (595,484 | ) |
| Equity contracts | | Payables, Net Assets — Unrealized Depreciation | | | (283,735 | ) | | | — | | | | (63,064 | ) | | | (346,799 | ) |
| Foreign exchange contracts | | Payables | | | — | | | | (506,953 | ) | | | — | | | | (506,953 | ) |
| Commodity contracts | | Payables, Net Assets — Unrealized Depreciation | | | (229,378 | ) | | | — | | | | — | | | | (229,378 | ) |
| | | | | | | | | | | | | | | | | | |
Total | | | | $ | (1,108,597 | ) | | $ | (506,953 | ) | | $ | (63,064 | ) | | $ | (1,678,614 | ) |
| | | | | | | | | | | | | | | | | | |
| (a) | This amount represents the cumulative appreciation/depreciation of futures contracts as reported on the CSOI. The CSAL only reflects the current day variation margin receivable/payable from/to brokers. |
The following tables present the effect of derivatives on the CSOP for the year ended October 31, 2017, by primary underlying risk exposure:
| | | | | | | | | | | | | | | | |
| Amount of Realized Gain (Loss) on Derivatives Recognized on the CSOP | |
| Derivatives Contracts: | | Futures
Contracts | | | Forward Foreign
Currency Exchange
Contracts | | | Swaps | | | Total | |
Interest rate contracts | | $ | (116,682 | ) | | $ | — | | | $ | — | | | $ | (116,682 | ) |
Equity contracts | | | (193,767 | ) | | | — | | | | (966,098 | ) | | | (1,159,865 | ) |
Foreign exchange contracts | | | — | | | | (370,515 | ) | | | — | | | | (370,515 | ) |
Commodity contracts | | | (574,743 | ) | | | — | | | | — | | | | (574,743 | ) |
| | | | | | | | | | | | | | | | |
Total | | $ | (885,192 | ) | | $ | (370,515 | ) | | $ | (966,098 | ) | | $ | (2,221,805 | ) |
| | | | | | | | | | | | | | | | |
| | | | | | |
| | | |
| 54 | | | | JPMORGAN EXCHANGE-TRADED FUNDS | | OCTOBER 31, 2017 |
| | | | | | | | | | | | | | | | |
|
| Amount of Change in Unrealized Appreciation (Depreciation) on Derivatives Recognized on the CSOP | |
| Derivatives Contracts: | | Futures
Contracts | | | Forward Foreign
Currency Exchange
Contracts | | | Swaps | | | Total | |
Interest rate contracts | | $ | (311,805 | ) | | $ | — | | | $ | — | | | $ | (311,805 | ) |
Equity contracts | | | (160,861 | ) | | | — | | | | 5,373 | | | | (155,488 | ) |
Foreign exchange contracts | | | — | | | | (219,140 | ) | | | — | | | | (219,140 | ) |
Commodity contracts | | | 328,688 | | | | — | | | | — | | | | 328,688 | |
| | | | | | | | | | | | | | | | |
Total | | $ | (143,978 | ) | | $ | (219,140 | ) | | $ | 5,373 | | | $ | (357,745 | ) |
| | | | | | | | | | | | | | | | |
The Fund’s derivatives contracts held at October 31, 2017 are not accounted for as hedging instruments under GAAP.
Derivatives Volume
The table discloses the volume of the Fund’s futures contracts, forward foreign currency exchange contracts and swaps activity during the year ended October 31, 2017. Please refer to the table in the Summary of Derivatives Information for derivative-related gains and losses associated with volume activity:
| | | | |
Future Contracts: | | | | |
Commodity | | | | |
Average Notional Balance Long | | $ | 5,689,222 | |
Average Notional Balance Short | | | 5,368,665 | |
Ending Notional Balance Long | | | 12,409,717 | |
Ending Notional Balance Short | | | 10,767,473 | |
Equity | | | | |
Average Notional Balance Long | | | 3,877,377 | |
Average Notional Balance Short | | | 11,773,828 | |
Ending Notional Balance Long | | | 5,067,741 | |
Ending Notional Balance Short | | | 9,255,883 | |
Interest | | | | |
Average Notional Balance Long | | | 30,930,519 | |
Average Notional Balance Short | | | 20,215,394 | |
Ending Notional Balance Long | | | 67,485,286 | |
Ending Notional Balance Short | | | 58,702,139 | |
| |
Forward Foreign Currency Exchange Contracts | | | | |
Average Settlement Value Purchased | | | 11,313,330 | |
Average Settlement Value Sold | | | 13,220,094 | |
Ending Settlement Value Purchased | | | 19,423,955 | |
Ending Settlement Value Sold | | | 19,937,030 | |
| |
Total Return Swaps: | | | | |
Average Notional Balance Long | | | 1,329 | (a) |
Ending Notional Balance Long | | | 1,329 | |
| |
Total Return Basket Swaps | | | | |
Average Notional Balance Long | | | 38,221,045 | |
Average Notional Balance Short | | | 37,292,143 | |
Ending Notional Balance Long | | | 65,506,730 | |
Ending Notional Balance Short | | | 64,810,235 | |
| (a) | For the period October 1, 2017 through October 31, 2017. |
D. Foreign Currency Translation — The books and records of the Fund are maintained in U.S. dollars. Foreign currency amounts are translated into U.S. dollars at the prevailing exchange rates of such currencies against the U.S. dollar. The market value of investment securities and other assets and liabilities are translated at the exchange rate as of the valuation date. Purchases and sales of investment securities, income and expenses are translated at the exchange rate prevailing on the respective dates of such transactions.
The Fund does not isolate the effect of changes in foreign exchange rates from changes in market prices of securities held. Accordingly, such changes are included within Change in net unrealized appreciation/depreciation on investments on the CSOP.
| | | | | | | | |
| | | |
| OCTOBER 31, 2017 | | JPMORGAN EXCHANGE-TRADED FUNDS | | | | | 55 | |
NOTES TO CONSOLIDATED FINANCIAL STATEMENTS
AS OF OCTOBER 31, 2017 (continued)
E. Investment Transactions with Affiliates — The Fund invests in Underlying Funds and/or other ETFs advised by the Adviser or its affiliates.
An issuer which is under common control with a Fund may be considered an affiliate. For the purposes of the financial statements, the Fund assumes the following to be affiliated issuers. Included in the Realized Gain (Loss) amounts in the table below are distributions of realized capital gains, if any, received from the Underlying Funds and other ETFs advised by the Adviser or its affiliates:
| | | | | | | | | | | | | | | | | | | | | | | | | | | | | | | | |
| | | | | | For the year ended October 31, 2017 | | | | | | | | | | |
| Affiliate | | Value at
Beginning of
year | | | Purchase Cost | | | Sales
Proceeds | | | Realized
Gain(Loss) | | | Change in
Unrealized
Gain(Loss) | | | Shares at
October 31,
2017 | | | Value at
October 31,
2017 | | | Dividend
Income | |
JPMorgan U.S. Government Money Market Fund, Institutional Class Shares | | $ | 25,631,779 | | | $ | 73,308,019 | | | $ | 19,261,670 | | | $ | — | | | $ | — | | | | 79,678,128 | | | $ | 79,678,128 | | | $ | 256,269 | |
F. Offering and Organizational Costs — Total offering costs incurred in connection with the offering of shares of the Fund are amortized on a straight line basis over 12 months from the date the Fund commenced operations. Costs paid in connection with the organization of the Trust, if any, were recorded as an expense at the time it commenced operations. Approximate total offering costs incurred by the Fund were $79,112.
G. Security Transactions and Investment Income — Investment transactions are accounted for on the trade date (the date the order to buy or sell is executed). Securities gains and losses are calculated on a specifically identified cost basis. Dividend income, net of foreign taxes withheld, if any, is recorded on the ex-dividend date or when a fund first learns of the dividend.
To the extent such information is publicly available, the Fund records distributions received in excess of income earned from underlying investments as a reduction of cost of investments and/or realized gain. Such amounts are based on estimates if actual amounts are not available and actual amounts of income, realized gain and return of capital may differ from the estimated amounts. The Fund adjusts the estimated amounts of the components of distributions (and consequently their net investment income) as necessary once the issuers provide information about the actual composition of the distributions.
H. Allocation of Expenses — Expenses directly attributable to a fund are charged directly to that fund, while the expenses attributable to more than one fund of the Trust are allocated among the respective funds.
I. Federal Income Taxes — The Fund is treated as a separate taxable entity for Federal income tax purposes. The Fund’s policy is to comply with the provisions of the Internal Revenue Code of 1986, as amended (the “Code”), applicable to regulated investment companies and to distribute to shareholders all of its distributable net investment income and net realized gain on investments. Accordingly, no provision for Federal income tax is necessary. Management has reviewed the Fund’s tax positions for all open tax years and has determined that as of October 31, no liability for income tax is required in the Fund’s consolidated financial statements for net unrecognized tax benefits. However, management’s conclusions may be subject to future review based on changes in, or the interpretation of, the accounting standards or tax laws and regulations. The Fund’s Federal tax returns for the prior three fiscal years, or since inception if shorter, remain subject to examination by the Internal Revenue Service.
For Federal income tax purposes, taxable income of the Fund and the Subsidiary are separately calculated. The Subsidiary is classified as a controlled foreign corporation under the Code and its taxable income, including net gains, is included as ordinary income in the calculation of the Fund’s taxable income. Net losses of the Subsidiary are not deductible by the Fund either in the current period or carried forward to future periods.
J. Foreign Taxes — The Fund may be subject to foreign taxes on income, gains on investments or currency purchases/repatriation, a portion of which may be recoverable. The Fund will accrue such taxes and recoveries as applicable, based upon its current interpretation of tax rules and regulations that exist in the markets in which it invests.
K. Distributions to Shareholders — Distributions from net investment income, if any, are generally declared and paid annually. Net realized capital gains, if any, are distributed by the Fund at least annually. The amount of distributions from net investment income and net realized capital gains is determined in accordance with Federal income tax regulations, which may differ from GAAP. To the extent these “book/tax” differences are permanent in nature (i.e., that they result from other than timing of recognition — “temporary differences”), such amounts are reclassified within the capital accounts based on their Federal tax-basis treatment.
The following amounts were reclassified within the capital accounts:
| | | | | | | | | | | | |
| | | Paid-in-Capital | | | Accumulated
undistributed
(distributions in
excess of)
net investment
income | | | Accumulated
net realized
gains (losses) | |
| | $ | (625,492 | ) | | $ | (643,001 | ) | | $ | 1,268,493 | |
| | | | | | |
| | | |
| 56 | | | | JPMORGAN EXCHANGE-TRADED FUNDS | | OCTOBER 31, 2017 |
The reclassifications for the Fund relate primarily to reclassification of income and expense from swap transactions, investment in Subsidiary, net operating losses, and certain foreign currency related transactions.
3. Fees and Other Transactions with Affiliates
A. Investment Advisory Fee — Pursuant to the Investment Advisory Agreement, the Adviser supervises the investments of the Fund and the Subsidiary and for such services is paid a fee. The fee for services to the Fund is accrued daily and paid monthly at an annual rate of 0.60% of the Fund’s average daily net assets.
The Subsidiary has entered into a separate contract with the Adviser to provide investment advisory and other services to the Subsidiary. The fee for services to the Subsidiary is accrued daily and paid monthly at an annual rate of 0.60% of the Subsidiary’s average daily net assets. The Adviser has agreed to waive the advisory fee that it receives from the Fund in an amount equal to the advisory fee paid to the Adviser by the Subsidiary. This waiver will continue in effect so long as the Fund invests in the Subsidiary and may not be terminated without approval by the Fund’s Board.
The Adviser waived Investment Advisory fees and/or reimbursed expenses as outlined in Note 3.D.
B. Administration Fee — Pursuant to an Administration Agreement, the Administrator provides certain administration services to the Fund and the Subsidiary. In consideration of these services for the Fund, the Administrator receives a fee accrued daily and paid monthly at the annual rate of 0.085% of the daily net assets, notwithstanding any fee waivers and/or expense reimbursements. In consideration for services rendered to the Subsidiary, the Administrator receives a fee accrued daily and paid monthly at an annual rate of 0.10% of the average daily net assets of the Subsidiary.
The Administrator waived Administration fees as outlined in Note 3.D.
Effective October 1, 2017 JPMorgan Chase Bank, N.A. (“JPMCB”), a wholly-owned subsidiary of JPMorgan, serves as the Fund’s sub-administrator (the “Sub-administrator”). For its services as Sub-administrator, JPMCB receives a portion of the fees payable to the Administrator.
C. Custodian and Transfer Agent Fees — JPMCB provides portfolio custody and transfer agent services. The amounts paid directly to JPMCB by the Fund for custody services are included in the Custodian and Transfer Agent fees on the CSOP. Payments to the custodian may be reduced by credits earned by the Fund, based on uninvested cash balances held by the custodian. Such earnings credits, if any, are presented separately on the CSOP.
With respect to the transfer agency services provided by JPMCB for each creation or redemption transaction, the Authorized Participant will generally be responsible for such associated expenses; during the year, the Fund paid no transfer agency fees to JPMCB.
Additionally, Authorized Participants generally pay transaction fees associated with the creation and redemption of Fund shares. These fees are used to offset certain custodian charges incurred by the Fund for these transactions.
For the year ended October 31, 2017, the amount of transaction fees paid by the Authorized Participants that were used to reimburse custodian fees was $4,200.
Restricted cash on the CSAL is cash received from Authorized Participants for the reimbursement of creation and/or redemption of Fund shares.
Interest income earned on cash balances at the custodian, if any, is included in Interest income from affiliates on the CSOP.
Interest expense paid to the custodian related to cash overdrafts, if any, is included in Interest expense to affiliates on the CSOP.
D. Accounting Fees — Beginning on October 1, 2017, JPMCB began to also provide accounting services to the Fund. Prior to October 1, 2017 a non-affiliated entity provided accounting services to the Fund. For the period October 1, 2017 through October 31, 2017 the Fund incurred $8,414 in accounting fees that were payable directly to JPMCB and which are included in accounting fees on the CSOP.
E. Waivers and Reimbursements — The Adviser has contractually agreed to waive fees and/or reimburse the Fund to the extent that total annual operating expenses (excluding acquired fund fees and expenses, dividend expenses related to short sales (if applicable), interest, taxes, expenses related to litigation and potential litigation, and extraordinary expenses) exceed 0.85% of the Fund’s average daily net assets.
The expense limitation agreements were in effect for the year ended October 31, 2017. The contractual expense limitation percentage is in place until at least February 28, 2021.
For the year ended October 31, 2017, the Fund’s service providers waived fees and/or reimbursed expenses for the Fund as follows. None of these parties expect the Fund to repay any such waived fees and/or reimbursed expenses in future years.
| | | | | | | | | | | | | | | | |
| | | Contractual Waivers | | | | | | | |
| | | Investment
Advisory
Fees | | | Administration
Fees | | | Total | | | Contractual
Reimbursements | |
| | $ | 237,659 | | | $ | 158,440 | | | $ | 396,099 | | | $ | — | |
Additionally, the Fund may invest in one or more money market funds advised by the Adviser or its affiliates (affiliated money market funds). The Adviser has agreed to waive the net expense ratio of the underlying funds.
| | | | | | | | |
| | | |
| OCTOBER 31, 2017 | | JPMORGAN EXCHANGE-TRADED FUNDS | | | | | 57 | |
NOTES TO CONSOLIDATED FINANCIAL STATEMENTS
AS OF OCTOBER 31, 2017 (continued)
The amount of the waivers resulting from investments in these money market funds during the year ended October 31, 2017 was $78,377. This amount is included in “fees waived” on the CSOP.
F. Distribution Services — The Distributor or its agent distributes Creation Units for the Fund on an agency basis. The Distributor does not maintain a secondary market in shares of the Fund. JPMDS receives, and SIDCO received, no fees for their distribution services under their respective distribution agreements with the Trust. Although the Trust does not, and did not, pay any fees under the Distribution Agreements, JPMIM pays JPMDS, and paid SIDCO, for certain distribution related services.
G. Other — Certain officers of the Trust are affiliated with the Adviser. Such officers, with the exception of the Chief Compliance Officer, receive no compensation from the Fund for serving in their respective roles.
The Board of Trustees appointed a Chief Compliance Officer to the Fund in accordance with Federal securities regulations. The Fund, along with other affiliated funds, makes reimbursement payments, on a pro-rata basis, to the Administrator for a portion of the fees associated with the Office of the Chief Compliance Officer. Such fees are included in Trustees’ and Chief Compliance Officer’s fees on the CSOP.
During the year ended October 31, 2017, the Fund may have purchased securities from an underwriting syndicate in which the principal underwriter or members of the syndicate are affiliated with the Adviser.
The Fund may use related party broker-dealers. For the year ended October 31, 2017, the Fund incurred no brokerage commissions with broker-dealers affiliated with the Advisor or Trust.
4. Investment Transactions
At October 31, 2017, the records of the Fund reflected that 100% of the Fund’s total shares outstanding were held by two Authorized Participants, in the form of creation units. However, the individual shares carrying such creation units are listed and traded under the NYSE Arca and have been purchased and sold by persons other than Authorized Participants.
During the year ended October 31, 2017, purchases and sales of investments (excluding short-term investments) were as follows:
| | | | | | | | |
| | | Purchases
(excluding U.S.
Government) | | | Sales
(excluding U.S. Government) | |
| | $ | 114,048,753 | | | $ | 58,692,472 | |
During the year ended October 31, 2017, there were no purchases or sales of U.S. Government securities.
5. Federal Income Tax Matters
For Federal income tax purposes, the estimated cost and unrealized appreciation (depreciation) in value of investment securities, including the Subsidiary, held at October 31, 2017 were as follows:
| | | | | | | | | | | | | | | | |
| | | Aggregate
Cost | | | Gross
Unrealized
Appreciation | | | Gross
Unrealized
Depreciation | | | Net Unrealized
Appreciation | |
| | $ | 145,970,438 | | | $ | 6,740,116 | | | $ | (3,678,808 | ) | | $ | 3,061,308 | |
The difference between book and tax basis appreciation (depreciation) on investments is primarily attributed to mark to market of futures contracts, mark to market of foreign currency forward contracts and investment in Subsidiary.
The Federal income tax unrealized appreciation (depreciation) in value of investment securities includes unrealized depreciation of the Fund’s investment in its subsidiary of $311,011, which, if realized is not deductible for income tax purposes.
The tax character of distributions paid during the year ended October 31, 2017 was as follows:
| | | | | | | | | | | | |
| | | Ordinary
Income* | | | Net
Long-Term
Capital Gains | | | Total
Distributions
Paid | |
| | $ | 447,993 | | | $ | 9,639 | | | $ | 457,632 | |
| * | Short-term gain distributions are treated as ordinary income for tax purposes. |
There were no distributions paid for the year ended October 31, 2016.
As of October 31, 2017, the estimated components of net assets (excluding paid-in-capital) on a tax basis were as follows:
| | | | | | | | | | | | | | | | |
| | | Current
Distributable
Ordinary
Income | | | Current
Distributable
Long-Term
Capital Gain | | | Tax Basis
Capital Loss
Carryover | | | Unrealized
Appreciation | |
| | $ | — | | | $ | — | | | $ | (120,837 | ) | | $ | 3,385,039 | |
| | | | | | |
| | | |
| 58 | | | | JPMORGAN EXCHANGE-TRADED FUNDS | | OCTOBER 31, 2017 |
The cumulative timing differences primarily consist of late year ordinary loss deferrals, mark to market of futures contracts and mark to market of foreign currency forward contracts.
During the year ended October 31, 2017 the Subsidiary had approximately $296,000 of losses for tax purposes. The Subsidiary’s loss for the current year is not available to offset its future taxable income.
As of October 31, 2017, the Fund had net long-term capital loss carryforwards, with no expiration date, of $120,837.
Late year ordinary losses incurred after December 31, 2016 and within the taxable year are deemed to arise on the first business day of the Fund’s next taxable year. For the year ended October 31, 2017, the Fund deferred to November 1, 2017 late year ordinary losses of $659,728.
6. Capital Share Transactions
The Trust issues and redeems shares of the Fund only in Creation Units through the Distributor at NAV. Capital shares transactions detail can be found in the Consolidated Statement of Changes in Net Assets.
Shares of the Fund may only be purchased or redeemed by Authorized Participants. An Authorized Participant is either (1) a “Participating Party” or other participant in the clearing process through the Continuous Net Settlement System of the National Securities Clearing Corporation (“NSCC”); or (2) a “DTC Participant”; which, in either case, must have executed an agreement with the Distributor.
Creation Units of the Fund may be created in advance of receipt by the Trust of all or a portion of the applicable basket of equity securities and other instruments (“Deposit Instruments”) and cash as described in the Fund’s registration statement. In these instances, the initial Deposit Instruments and cash must be deposited in an amount equal to the sum of the cash amount, plus at least 105% of the market value of undelivered Deposit Instruments. A transaction fee may be imposed to offset transfer and other transaction costs associated with the purchase or redemption of Creation Units.
Authorized Participants transacting in Creation Units for cash may also pay a variable charge to compensate the relevant fund for market impact expenses relating to investing in portfolio securities. Such variable charges, if any, are included in “Proceeds from shares purchased” or “Proceeds from shares issued” in the Consolidated Statements of Changes in Net Assets.
7. Risks, Concentrations and Indemnifications
In the normal course of business, the Fund enters into contracts that contain a variety of representations which provide general indemnifications. The Fund’s maximum exposure under these arrangements is unknown. The amount of exposure, if any, would depend on future claims that may be made against the Fund that have not yet occurred. However, based on experience, the Fund expects the risk of loss to be remote.
As of October 31, 2017, the Adviser owned 64% of the outstanding shares of the Fund.
By investing in the Subsidiary, the Fund is indirectly exposed to the risks associated with the Subsidiary’s investments. The derivatives and other investments held by the Subsidiary are generally similar to those that are permitted to be held by the Fund and are subject to the same risks that apply to similar investments if held directly by the Fund.
The Fund employs various alternative investment strategies that involve the use of complicated investment techniques. There is no guarantee that these strategies will succeed and their use may subject the Fund to greater volatility and loss.
Derivatives, including swap agreements and futures, may be riskier than other types of investments because they may be more sensitive to changes in economic or market conditions than other types of investments and could result in losses that significantly exceed the Fund’s original investment. Many derivatives create leverage thereby causing the Fund to be more volatile than it would be if it had not used derivatives. Derivatives also expose the Fund to counterparty risk including the credit risk of the derivative counterparty.
Disruptions to creations and redemptions, the existence of significant market volatility or potential lack of an active trading market for the Shares (including through a trading halt), as well as other factors, may result in Shares trading significantly above (at a premium) or below (at a discount) to the NAV or to the intraday value of the Fund’s holdings. During such periods, investors may incur significant losses if shares are sold.
The Fund is also subject to counterparty credit risk, which is the risk that a counterparty fails to perform on agreements with the Fund such as swaps and forward foreign currency exchange contracts.
The Fund’s investment in commodity-linked derivative instruments may subject the Fund to greater volatility than investments in traditional securities, particularly if the instruments involve leverage. The value of commodity-linked derivative instruments may be affected by changes in overall market movements, commodity index volatility, changes in interest rates, or factors affecting a particular industry or commodity, such as drought, floods, weather, livestock disease, embargoes, tariffs and international economic, political and regulatory developments.
The Fund is subject to counterparty risk, which is the risk that a counterparty will not fulfill its contractual obligations arising from agreements with the Fund such as forward foreign currency exchange contracts.
8. Investment Company Reporting Modernization
In October 2016, the U.S. Securities and Exchange Commission adopted new rules and forms, and amendments to certain current rules and forms, to modernize the reporting and disclosure of information by registered investment companies. In part, the final rules amend Regulation S-X and require standardized, enhanced disclosures about derivatives in investment company financial statements, as well as other amendments. The amendments to Regulation S-X were applied to Fund’s financial statements as of October 31, 2017. The adoption had no effect on the Fund’s net assets or results of operations.
| | | | | | | | |
| | | |
| OCTOBER 31, 2017 | | JPMORGAN EXCHANGE-TRADED FUNDS | | | | | 59 | |
REPORT OF INDEPENDENT REGISTERED PUBLIC ACCOUNTING FIRM
To the Board of Trustees of J.P. Morgan Exchange-Traded Fund Trust and the Shareholders of JPMorgan Diversified Alternatives ETF
In our opinion, the accompanying consolidated statement of assets and liabilities, including the consolidated schedule of portfolio investments, and the related consolidated statements of operations and of changes in net assets and the consolidated financial highlights present fairly, in all material respects, the financial position of the JPMorgan Diversified Alternatives ETF (a separate series of the J.P. Morgan Exchange-Traded Fund Trust) and its subsidiary (the “Fund”) as of October 31, 2017, the results of their operations for the year then ended and the changes in their net assets and the financial highlights for the year then ended and for the period September 12, 2016 (commencement of operations) through October 31, 2016, in conformity with accounting principles generally accepted in the United States of America. These financial statements and financial highlights (hereafter referred to as “financial statements”) are the responsibility of the Fund’s management. Our responsibility is to express an opinion on these financial statements based on our audits. We conducted our audits of these financial statements in accordance with the standards of the Public Company Accounting Oversight Board (United States). Those standards require that we plan and perform the audit to obtain reasonable assurance about whether the financial statements are free of material misstatement. An audit includes examining, on a test basis, evidence supporting the amounts and disclosures in the financial statements, assessing the accounting principles used and significant estimates made by management, and evaluating the overall financial statement presentation. We believe that our audits, which included confirmation of securities as of October 31, 2017 by correspondence with the transfer agent, custodian and brokers, provide a reasonable basis for our opinion.
/s/ PricewaterhouseCoopers LLP
New York, New York
December 22, 2017
| | | | | | |
| | | |
| 60 | | | | JPMORGAN EXCHANGE-TRADED FUNDS | | OCTOBER 31, 2017 |
SUPPLEMENTAL INFORMATION
FOR THE PERIODS INDICATED (Unaudited)
The table below indicates the number of trading days in which the Fund traded within the range of the premium/discount noted. The number of days in each range is also shown as a percentage of the total trading days for the period covered in the table. All information within the table is based on historical performance. Past performance cannot be used to predict future results. Shareholders may pay more than NAV when they buy fund shares and receive less than NAV when they sell those shares because shares are bought and sold at current market prices.
| | | | | | | | |
| | | Diversified Alternatives ETF (a) | |
| Range of Premium/(Discount) | | Day Count | | | Percentage | |
Greater than 1.0% and Less than or equal to 1.5% | | | 2 | | | | 0.70 | % |
Greater than 0.5% and Less than or equal to 1.0% | | | 102 | | | | 35.66 | % |
Greater than 0.0% and Less than or equal to 0.5% | | | 175 | | | | 61.19 | % |
Less than or equal to 0.0% and greater than or equal to -0.5% | | | 7 | | | | 2.45 | % |
| | | | | | | | |
| | | 286 | | | | 100.00 | % |
| | | | | | | | |
| (a) | For the period September 12, 2016 (fund inception date) to October 31, 2017. |
| | | | | | | | |
| | | |
| OCTOBER 31, 2017 | | JPMORGAN EXCHANGE-TRADED FUNDS | | | | | 61 | |
TRUSTEES
(Unaudited)
The Fund’s Statement of Additional Information includes additional information about the Funds Trustees and is available, without charge, upon request by calling 1-844-457-6383 or on the J.P. Morgan Funds’ website at www.jpmorganfunds.com.
| | | | | | | | |
Name (Year of Birth;
Positions With
the Funds since) | | Principal Occupation
During Past 5 Years | | Number of
Funds in Fund
Complex Overseen
by Trustee (1) | | | Other Directorships Held
During Past 5 Years |
Independent Trustees | | | | | | | | |
| | | |
Gary L. French (1951);
Trustee of the Trust since 2014 | | Real Estate Investor (2011-present); Senior Consultant for the Regulatory Fundamentals Group LLC (2011-2017); Senior Vice President-Fund Administration, State Street Corporation (2002-2010). | | | 22 | | | Independent Trustee, The China Fund, Inc. (2013-present); Exchange Traded Concepts Trust II (2012-2014); Exchange Traded Concepts Trust I (2011-2014). |
| | | |
Robert J. Grassi (1957);
Trustee of the Trust since 2014 | | Sole Proprietor, Academy Hills Advisors LLC (2012-present); Pension Director, Corning Incorporated (2002-2012). | | | 22 | | | None. |
| | | |
Thomas P. Lemke (1954);
Trustee of the Trust since 2014 | | Retired; Executive Vice President and General Counsel, Legg Mason (2005-2013). | | | 22 | | | Independent Trustee of AXA Premier VIP Trust (2014-present); SEI family of funds (Independent Trustee of Advisors’ Inner Circle III Funds (5 portfolios) (from February 2014 to present)); Independent Trustee of O’Connor EQUUS (May 2014-present); Independent Trustee of Winton Series Trust (December 2014-present); Independent Director of The Victory Funds (or their predecessor funds) (35 portfolios) (2014-March 2015). |
| | | |
Lawrence R. Maffia (1950);
Trustee of the Trust since 2014 | | Retired; Director and President, ICI Mutual Insurance Company (2006-2013). | | | 22 | | | Director, ICI Mutual Insurance Company (1999-2013). |
| | | |
Emily A. Youssouf (1951);
Trustee of the Trust since 2014 | | Clinical Professor, NYU Schack Institute of Real Estate (2009-present); Board Member (2005-present), Chair of Capital Committee (2006-2016), Chair of Audit Committee (2005-present), and Chair of IT Committee (2016-present), NYC Health and Hospitals Corporation; Board Member and Member of the Audit Committee and Related Parties Committee (2013-present) and Member of the Risk Management Committee (2017-present), PennyMac Financial Services, Inc. | | | 22 | | | Trustee, NYC School Construction Authority (2009-present); Board Member, NYS Job Development Authority (2008-present); Trustee (2015-present) and Chair of the Audit and Finance Committee (2015-present) of the Transit Center Foundation; Vice Chair (2011-2013) and Board Member (2013-2014) of New York City Housing Authority. |
Interested Trustee | | | | | | | | |
| | | |
| Robert Deutsch (2) (1957); Chairman and Trustee of the Trust since 2014 | | Retired; Head of the Global ETF Business for JPMorgan Asset Management (2013-2017); Head of the Global Liquidity Business for JPMorgan Asset Management (2003-2013). | | | 22 | | | None |
| (1) | A Fund complex means two or more registered investment companies that hold themselves out to investors as related companies for purposes of investment and investor services or have a common investment adviser or have an investment adviser that is an affiliated person of the investment adviser of any of the other registered investment companies. Thirteen series of the Trust have commenced operations, but nine additional series have been created and are expected to commence operations in the future. |
| (2) | Mr. Deutsch is an interested trustee because he was an employee of the Adviser until August 2017. |
The contact address for each of the Trustees is 270 Park Avenue, New York, NY 10017.
| | | | | | |
| | | |
| 62 | | | | JPMORGAN EXCHANGE-TRADED FUNDS | | OCTOBER 31, 2017 |
OFFICERS
(Unaudited)
| | |
Name (Year of Birth), Positions Held with the Trusts (Since) | | Principal Occupations During Past 5 Years |
| |
Joanna Gallegos (1975),
President and Principal Executive Officer (2017) | | Managing Director, Head of J.P. Morgan Asset Management’s U.S. Exchange Traded Funds business. Previously, Head of J.P. Morgan Asset Management’s ETF Product Development team from August 2013 to July 2017; Managing Director of the Strategic Initiatives Group in BlackRock’s iShares Exchange Traded Funds division from 2010 to 2013. |
| |
Lauren A. Paino (1973),
Treasurer and Principal Financial Officer (2015)** | | Executive Director, J.P. Morgan Investment Management Inc. (formerly JPMorgan Funds Management, Inc.) since August 2013; Director, Credit Suisse Asset Management (2000-2013). |
| |
Paul Shield (1960),
Vice President and Assistant Treasurer (2016) | | Managing Director and head of Business Management for JPMorgan Asset Management’s Exchange Traded Fund platform since 2013. Senior Global Product Manager of Alternative Investments for BNY Mellon from 2011 to 2013 and Global Product Head for Exchange Traded Funds at JPMorgan Chase Bank from 2008 to 2011. |
| |
Brian S. Shlissel (1964),
Vice President (2016) | | Managing Director and Chief Administrative Officer for J.P. Morgan pooled vehicles, J.P. Morgan Investment Management Inc. (formerly JPMorgan Funds Management Inc.) (2014-present); Managing Director and Head of Mutual Fund Services, Allianz Global Investors; President and Chief Executive Officer, Allianz Global Investors Mutual Funds and PIMCO Closed-End Funds (1999-2014). |
| |
| Frank J. Nasta (1964), Secretary (2014) | | Managing Director and Associate General Counsel, JPMorgan Chase since 2008. |
| |
Stephen M. Ungerman (1953),
Chief Compliance Officer (2014) | | Managing Director, JPMorgan Chase & Co.; Mr. Ungerman has been with JPMorgan Chase & Co. since 2000. |
| |
Elizabeth A. Davin (1964),
Assistant Secretary (2014)* | | Executive Director and Assistant General Counsel, JPMorgan Chase. Ms. Davin has been with JPMorgan Chase (formerly Bank One Corporation) since 2004. |
| |
Jessica K. Ditullio (1962),
Assistant Secretary (2014)* | | Executive Director and Assistant General Counsel, JPMorgan Chase since February 2011; Ms. Ditullio has been with JPMorgan Chase (formerly Bank One Corporation) since 1990. |
| |
John T. Fitzgerald (1975),
Assistant Secretary (2014) | | Executive Director and Assistant General Counsel, JPMorgan Chase since February 2011; Mr. Fitzgerald has been with JPMorgan Chase since 2005. |
| |
Carmine Lekstutis (1980),
Assistant Secretary (2014) | | Executive Director and Assistant General Counsel, JPMorgan Chase since February 2015; formerly Vice President and Assistant General Counsel, JPMorgan Chase from 2011 to February 2015. |
| |
Gregory S. Samuels (1980),
Assistant Secretary (2014) | | Executive Director and Assistant General Counsel, JPMorgan Chase since February 2014; formerly Vice President and Assistant General Counsel, JPMorgan Chase since 2010. |
| |
Pamela L. Woodley (1971),
Assistant Secretary (2014) Zachary E. Vonnegut-Gabovitch (1986), Assistant Secretary (2017) | | Vice President and Assistant General Counsel, JPMorgan Chase since November 2004. Vice President and Assistant General Counsel, JPMorgan Chase since September 2016; Associate, Morgan Lewis & Bockius (law firm) from 2012 to 2016. |
| |
Frederick J. Cavaliere (1978),
Assistant Treasurer (2015)** | | Executive Director, J.P. Morgan Investment Management Inc. (formerly JPMorgan Funds Management, Inc.) since February 2016; formerly Vice President, J.P. Morgan Investment Management Inc. (formerly JPMorgan Funds Management, Inc.) since September 2011; formerly Vice President of J.P. Morgan Investment Management Inc. 2010-2011. Mr. Cavaliere has been with JPMorgan since May 2006. |
| |
Michael M. D’Ambrosio (1969),
Assistant Treasurer (2014) | | Managing Director, J.P. Morgan Investment Management Inc. (formerly JPMorgan Funds Management, Inc.) since 2014; formerly Executive Director, J.P. Morgan Investment Management Inc. (formerly JPMorgan Funds Management, Inc.) from 2012 to 2014; prior to joining JPMorgan Chase, Mr. D’Ambrosio was a Tax Director at PricewaterhouseCoopers LLP since 2006. |
| |
Jason Ronca (1978), Assistant
Treasurer (2014)*** | | Executive Director, since February 2017; formerly Vice President for J.P. Morgan Asset Management since 2014. ETF Product Manager for Corporate Investment Bank responsible for setting the strategy and control agenda for the ETF servicing business from 2010 to May 2014; Prior to 2010, a Vice President in Fund Accounting within J.P. Morgan Investor Services, supporting a series of U.S. registered mutual funds. |
The contact address for each of the officers, unless otherwise noted, is 270 Park Avenue, New York, NY 10017.
| * | | The contact address for the officer is 1111 Polaris Parkway, Columbus, OH 43240. |
| ** | | The contact address for the officer is 4 New York Plaza, New York, NY 10004. |
| *** | | The contact address for the officer is One Beacon Street, Boston, MA 02108. |
| | | | | | | | |
| | | |
| OCTOBER 31, 2017 | | JPMORGAN EXCHANGE-TRADED FUNDS | | | | | 63 | |
SCHEDULE OF SHAREHOLDER EXPENSES
(Unaudited)
Hypothetical $1,000 Investment
As a shareholder of the Fund, you incur ongoing costs, including investment advisory fees, administration fee and other Fund expenses. The examples below are intended to help you understand your ongoing costs (in dollars) of investing in the Fund and to compare these ongoing costs with the ongoing costs of investing in other funds. The examples assume that you had a $1,000 investment at the beginning of the reporting period, May 1, 2017 and continued to hold your shares at the end of the reporting period, October 31, 2017.
Actual Expenses
For the Fund in the table below, the first line provides information about actual account values and actual expenses. You may use the information in this line, together with the amount you invested, to estimate the expenses that you paid over the period. Simply divide your account value by $1,000 (for example, an $8,600 account value divided by $1,000 = 8.6), then multiply the result by the number under the heading entitled
“Expenses Paid During the Period” to estimate the expenses you paid on your account during this period.
Hypothetical Example for Comparison Purposes
The second line in the table below provides information about hypothetical account values and hypothetical expenses based on the Fund’s actual expense ratio and an assumed rate of return of 5% per year before expenses, which is not the Fund’s actual return. The hypothetical account values and expenses may not be used to estimate the actual ending account balance or expenses you paid for the period. You may use this information to compare the ongoing costs of investing in the Fund and other Funds. To do so, compare this 5% hypothetical example with the 5% hypothetical examples that appear in the shareholder reports of other funds. The examples also assume all dividends and distributions have been reinvested. The examples do not take into account brokerage commissions that you pay when purchasing or selling shares of the Fund.
| | | | | | | | | | | | | | | | |
| | | Beginning Account Value May 1, 2017 | | | Ending Account Value October 31, 2017 | | | Annualized Expense Ratio | | | Expenses Paid During
the Period | |
JPMorgan Diversified Alternatives ETF | | | | | | | | | | | | | | | | |
Actual | | $ | 1,000.00 | | | $ | 997.70 | | | | 0.75 | % | | $ | 3.78 | |
Hypothetical (1) | | | 1,000.00 | | | | 1,021.42 | | | | 0.75 | | | | 3.82 | |
| (1) | Expenses are equal to the Fund’s annualized expense ratio, multiplied by the average account value over the period, multiplied by 184/365 (to reflect the actual period). |
| | | | | | |
| | | |
| 64 | | | | JPMORGAN EXCHANGE-TRADED FUNDS | | OCTOBER 31, 2017 |
TAX LETTER
(Unaudited)
Certain tax information for the J.P. Morgan Funds is required to be provided to shareholders based upon the Fund's income and distributions for the taxable year ended October 31, 2017. The information and distributions reported in this letter may differ from the information and taxable distributions reported to the shareholders for the calendar year ending December 31, 2017. The information necessary to complete your income tax returns for the calendar year ending December 31, 2017 will be provided under separate cover.
Dividends Received Deductions (DRD)
The Fund had 100.00%, or maximum allowable percentage, of ordinary income distributions eligible for the 70% dividend received deduction for corporate rate shareholders for the fiscal year ended October 31, 2017.
Long Term Capital Gain
The Fund distributed $9,639, or maximum allowable amount, of long-term capital gain dividends for the fiscal year ended October 31, 2017.
Qualified Dividend Income (QDI)
The Fund had $447,993, or maximum allowable amount, of ordinary income distributions treated as qualified dividends for the fiscal year ended October 31, 2017.
| | | | | | | | |
| | | |
| OCTOBER 31, 2017 | | JPMORGAN EXCHANGE-TRADED FUNDS | | | | | 65 | |
J.P. Morgan Exchange-Traded Funds are distributed by JPMorgan Distribution Services, Inc., an indirect, wholly-owned subsidiary of JPMorgan Chase & Co.
Contact J.P. Morgan Exchange-Traded Funds at 1-844-457-6383 (844-4JPM ETF) for a fund prospectus. You can also visit us at www.jpmorganfunds.com. Investors should carefully consider the investment objectives and risks as well as charges and expenses of the fund before investing. The prospectus contains this and other information about the fund. Read the prospectus carefully before investing.
Investors may obtain information about the Securities Investor Protection Corporation (SIPC), including the SIPC brochure by visiting www.sipc.org or by calling SIPC at 202-371-8300.
The Fund files a complete schedule of its fund holdings for the first and third quarters of its fiscal year with the SEC on Form N-Q. The Fund’s Forms N-Q is available on the SEC’s website at http://www.sec.gov and may be reviewed and copied at the SEC’s Public Reference Room in Washington, DC. Information on the operation of the SEC’s Public Reference Room may be obtained by calling 1-800-SEC-0330. Shareholders may request the Form N-Q without charge by calling 1-844-457-6383 or by visiting the J.P. Morgan Funds’ website at www.jpmorganfunds.com.
A description of each Fund’s policies and procedures with respect to the disclosure of each Fund’s holdings is available in the prospectus and Statement of Additional Information.
A copy of proxy policies and procedures is available without charge upon request by calling 1-844-457-6383 and on the Fund’s website at www.jpmorganfunds.com. A description of such policies and procedures is on the SEC’s website at www.sec.gov. The Trustees have delegated the authority to vote proxies for securities owned by the Fund to the Adviser. A copy of the Fund’s voting record for the most recent 12-month period ended June 30 is available on the SEC’s website at www.sec.gov or at the Fund’s website at www.jpmorganfunds.com no later than August 31 of each year. The Fund’s proxy voting record will include, among other things, a brief description of the matter voted on for each fund security, and will state how each vote was cast, for example, for or against the proposal.


J.P. Morgan Asset Management is the marketing name for the asset management businesses of JPMorgan Chase & Co. Those businesses include, but are not limited to, J.P. Morgan Investment Management Inc., Security Capital Research & Management Incorporated and J.P. Morgan Alternative Asset Management, Inc.
| | | | |
| | © JPMorgan Chase & Co., 2017. All rights reserved. October 2017. | | AN-DAETF-1017 |
ITEM 2. CODE OF ETHICS.
Disclose whether, as of the end of the period covered by the report, the registrant has adopted a code of ethics that applies to the registrant’s principal executive officer, principal financial officer, principal accounting officer or controller, or persons performing similar functions, regardless of whether these individuals are employed by the registrant or a third party. If the registrant has not adopted such a code of ethics, explain why it has not done so.
The registrant must briefly describe the nature of any amendment, during the period covered by the report, to a provision of its code of ethics that applies to the registrant’s principal executive officer, principal financial officer, principal accounting officer or controller, or persons performing similar functions, regardless of whether these individuals are employed by the registrant or a third party, and that relates to any element of the code of ethics definition enumerated in paragraph (b) of this Item. The registrant must file a copy of any such amendment as an exhibit pursuant to Item 12(a)(1), unless the registrant has elected to satisfy paragraph (f) of this Item by positing its code of ethics on its website pursuant to paragraph (f)(2) of this Item, or by undertaking to provide its code of ethics to any person without charge, upon request, pursuant to paragraph (f)(3) of this Item.
If the registrant has, during the period covered by the report, granted a waiver, including an implicit waiver, from a provision of the code of ethics that applies to the registrant’s principal executive officer, principal financial officer, principal accounting officer or controller, or persons performing similar functions, regardless of whether these individuals are employed by the registrant or third party, that relates to one or more items set forth in paragraph (b) of this Item, the registrant must briefly describe the nature of the waiver, the name of the person to whom the waiver was granted, and the date of the waiver.
The Registrant has adopted a code of ethics that applies to the Registrant’s principal executive officer and principal financial officer. There were no amendments to the code of ethics or waivers granted with respect to the code of ethics in the period covered by the report.
ITEM 3. AUDIT COMMITTEE FINANCIAL EXPERT.
(a) (1) Disclose that the registrant’s board of directors has determined that the registrant either:
| | (i) | Has at least one audit committee financial expert serving on its audit committee; or |
| | (ii) | Does not have an audit committee financial expert serving on its audit committee. |
The Registrant’s Board of Trustees has determined that the Registrant has at least one audit committee financial expert serving on its audit committee. The Securities and Exchange Commission has stated that the designation or identification of a person as an audit committee financial expert pursuant to this Item 3 of Form N-CSR does not impose on such person any duties, obligations or liabilities that are greater than the duties, obligations and liabilities imposed on such person as a member of the Audit Committee and the Board of Trustees in the absence of such designation or identification.
(2) If the registrant provides the disclosure required by paragraph (a)(1)(i) of this Item, it must disclose the name of the audit committee financial expert and whether that person is “independent.” In order to be considered “independent” for purposes of this Item, a member of an audit committee may not, other than in his or her capacity as a member of the audit committee, the board of directors, or any other board committee:
| | (i) | Accept directly or indirectly any consulting, advisory, or other compensatory fee from the issuer; or |
| | (ii) | Be an “interested person” of the investment company as defined in Section 2(a)(19) of the Act (15 U.S.C. 80a-2(a)(19)). |
The audit committee financial experts are Gary L. French, Robert J. Grassi, Thomas P. Lemke, Lawrence R. Maffia, and EmilyA. Youssouf, each of which is not an “interested person” of the Registrant and is also “independent” as defined by the U.S. Securities and Exchange Commission for purposes of audit committee financial expert determinations.
(3) If the registrant provides the disclosure required by paragraph (a)(1)(ii) of this Item, it must explain why it does not have an audit committee financial expert.
Not applicable.
ITEM 4. PRINCIPAL ACCOUNTANT FEES AND SERVICES.
(a) Disclose, under the caption Audit Fees, the aggregate fees billed for each of the last two fiscal years for professional services rendered by the principal accountant for the audit of the registrant’s annual financial statements or services that are normally provided by the accountant in connection with statutory and regulatory filings or engagements for those fiscal years.
|
AUDIT FEES 2017 – $404,380 2016 – $314,400 |
(b) Disclose, under the caption Audit-Related Fees, the aggregate fees billed in each of the last two fiscal years for assurance and related services by the principal accountant that are reasonably related to the performance of the audit of the registrant’s financial statements and are not reported under paragraph (a) of this Item. Registrants shall describe the nature of the services comprising the fees disclosed under this category.
|
AUDIT-RELATED FEES 2017 – $76,752 2016 – $65,792 |
Audit-related fees consist of security count procedures performed as required under Rule 17f-2 of the Investment Company Act of 1940 during the Registrant’s fiscal year.
(c) Disclose, under the caption Tax Fees, the aggregate fees billed in each of the last two fiscal years for professional services rendered by the principal accountant for tax compliance, tax advice, and tax planning. Registrants shall describe the nature of the services comprising the fees disclosed under this category.
|
TAX FEES 2017 – $132,675 2016 – $104,635 |
The tax fees consist of fees billed in connection with preparing the federal regulated investment company income tax returns for the Registrant for the tax years ended October 31, 2017 and 2016, respectively.
For the last fiscal year, no tax fees were required to be approved pursuant to paragraph (c)(7)(ii) of Rule 2-01 of Regulation S-X.
(d) Disclose, under the caption All Other Fees, the aggregate fees billed in each of the last two fiscal years for products and services provided by the principal accountant, other than the services reported in paragraphs (a) through (c) of this Item. Registrants shall describe the nature of the services comprising the fees disclosed under this category.
|
ALL OTHER FEES 2017 – $0 2016 – $0 |
(e)(1) Disclose the audit committee’s pre-approval policies and procedures described in paragraph (c)(7) of Rule 2-01 of Regulation S-X.
Pursuant to the Registrant’s Audit Committee Charter and written policies and procedures for the pre-approval of audit and non-audit services (the “Pre-approval Policy”), the Audit Committee pre-approves all audit and non-audit services performed by the Registrant’s independent public registered accounting firm for the Registrant. In addition, the Audit Committee pre-approves the auditor’s engagement for non-audit services with the Registrant’s investment adviser (not including a sub-adviser whose role is primarily portfolio management and is sub-contracted or overseen by another investment adviser) and any Service Affiliate in accordance with paragraph (c)(7)(ii) of Rule 2-01 of Regulation S-X, if the engagement relates directly to the operations and financial reporting of the Registrant. Proposed services may be pre-approved either 1) without consideration of specific case-by-case services or 2) require the specific pre-approval of the Audit Committee. Therefore, initially the Pre-approval Policy listed a number of audit and non-audit services that have been approved by the Audit Committee, or which were not subject to pre-approval under the transition provisions
of Sarbanes-Oxley Act of 2002 (the “Pre-approval List”). The Audit Committee annually reviews and pre-approves the services included on the Pre-approval List that may be provided by the independent public registered accounting firm without obtaining additional specific pre-approval of individual services from the Audit Committee. The Audit Committee adds to, or subtracts from, the list of general pre-approved services from time to time, based on subsequent determinations. All other audit and non-audit services not on the Pre-approval List must be specifically pre-approved by the Audit Committee.
One or more members of the Audit Committee may be appointed as the Committee’s delegate for the purposes of considering whether to approve such services. Any pre-approvals granted by the delegate will be reported, for informational purposes only, to the Audit Committee at its next scheduled meeting. The Audit Committee’s responsibilities to pre-approve services performed by the independent public registered accounting firm are not delegated to management.
(2) Disclose the percentage of services described in each of paragraphs (b) through (d) of this Item that were approved by the audit committee pursuant to paragraph (c)(7)(i)(C) of Rule 2-01 of Regulation S-X.
(f) If greater than 50 percent, disclose the percentage of hours expended on the principal accountant’s engagement to audit the registrant’s financial statements for the most recent fiscal year that were attributed to work performed by persons other than the principal accountant’s full-time, permanent employees.
Not applicable.
(g) Disclose the aggregate non-audit fees billed by the registrant’s accountant for services rendered to the registrant, and rendered to the registrant’s investment adviser (not including any sub-adviser whose role is primarily portfolio management and is subcontracted with or overseen by another investment adviser), and any entity controlling, controlled by, or under common control with the adviser that provides ongoing services to the registrant for each of the last two fiscal years of the registrant.
The aggregate non-audit fees billed by the independent registered public accounting firm for services rendered to the Registrant, and rendered to Service Affiliates, for the last two calendar year ends were:
|
2017 – $28.9 million 2016 – $29.4 million |
(h) Disclose whether the registrant’s audit committee of the board of directors has considered whether the provision of non-audit services that were rendered to the registrant’s investment adviser (not including any subadviser whose role is primarily portfolio management and is subcontracted with or overseen by another investment adviser), and any entity controlling, controlled by, or under common control with the investment adviser that provides ongoing services to the registrant that were not pre-approved pursuant to paragraph (c)(7)(ii) of Rule 2-01 of Regulation S-X is compatible with maintaining the principal accountant’s independence.
The Registrant’s Audit Committee has considered whether the provision of the non-audit services that were rendered to Service Affiliates that were not pre-approved (not requiring pre-approval) is compatible with maintaining the independent public registered accounting firm’s independence. All services provided by the independent public registered accounting firm to the Registrant or to Service Affiliates that were required to be pre-approved were pre-approved as required.
ITEM 5. AUDIT COMMITTEE OF LISTED REGISTRANTS.
(a) If the registrant is a listed issuer as defined in Rule 10A-3 under the Exchange Act (17CFR 240.10A-3), state whether or not the registrant has a separately-designated standing audit committee established in accordance with Section 3(a)(58)(A) of the Exchange Act (15 U.S.C. 78c(a)(58)(A)). If the registrant has such a committee, however designated, identify each committee member. If the entire board of directors is acting as the registrant’s audit committee as specified in Section 3(a)(58)(B) of the Exchange Act (15
U.S.C. 78c(a)(58)(B)), so state.
The registrant has a separately designated Audit Committee established in accordance with Section 3(a)(58)(A) of the Exchange Act. The members of the Audit Committee are Gary L. French, Robert J. Grassi, Thomas P. Lemke, Lawrence R. Maffia, and Emily A. Youssouf.
(b) If applicable, provide the disclosure required by Rule 10A-3(d) under the Exchange Act (17CFR 240.10A-3(d)) regarding an exemption from the listing standards for all audit committees.
Not applicable.
ITEM 6. SCHEDULE OF INVESTMENTS.
File Schedule I – Investments in securities of unaffiliated issuers as of the close of the reporting period as set forth in Section 210.12-12 of Regulation S-X, unless the schedule is included as part of the report to shareholders filed under Item 1 of this Form.
Included in Item 1.
ITEM 7. DISCLOSURE OF PROXY VOTING POLICIES AND PROCEDURES FOR CLOSED-END MANAGEMENT INVESTMENT COMPANIES.
A closed-end management investment company that is filing an annual report on this Form N-CSR must, unless it invests exclusively in non-voting securities, describe the policies and procedures that it uses to determine how to vote proxies relating to portfolio securities, including the procedures that the company uses when a vote presents a conflict between the interests of its shareholders, on the one hand, and those of the company’s investment adviser; principal underwriter; or any affiliated person (as defined in Section 2(a)(3) of the Investment Company Act of 1940 (15 U.S.C. 80a-2(a)(3)) and the rules thereunder) of the company, its investment adviser, or its principal underwriter, on the other. Include any policies and procedures of the company’s investment adviser, or any other third party, that the company uses, or that are used on the company’s behalf, to determine how to vote proxies relating to portfolio securities.
Not applicable.
ITEM 8. PORTFOLIO MANAGERS OF CLOSED-END MANAGEMENT INVESTMENT COMPANIES.
Not applicable.
ITEM 9. PURCHASE OF EQUITY SECURITIES BY CLOSED-END MANAGEMENT INVESTMENT COMPANY AND AFFILIATED PURCHASERS.
(a) If the registrant is a closed-end management investment company, provide the information specified in paragraph (b) of this Item with respect to any purchase made by or on behalf of the registrant or any “affiliated purchaser,” as defined in Rule 10b-18(a)(3) under the Exchange Act (17 CFR 240.10b-18(a)(3)), of shares or other units of any class of the registrant’s equity securities that is registered by the registrant pursuant to Section 12 of the Exchange Act (15 U.S.C. 781).
Not applicable.
ITEM 10. SUBMISSION OF MATTERS TO A VOTE OF SECURITY HOLDERS.
Describe any material changes to the procedures by which shareholders may recommend nominees to the registrant’s board of directors, where those changes were implemented after the registrant last provided disclosure in response to the requirements of Item 7(d)(2)(ii)(G) of Schedule 14A (17 CFR 240.14a-101), or this Item.
No material changes to report.
ITEM 11. CONTROLS AND PROCEDURES.
(a) Disclose the conclusions of the registrant’s principal executive and principal financial officers, or persons performing similar functions, regarding the effectiveness of the registrant’s disclosure controls and procedures (as defined in Rule 30a-3(c) under the Act (17 CFR 270.30a-3(c))) as of a date within 90 days of the filing date of the report that includes the disclosure required by this paragraph, based on the evaluation of these controls and procedures required by Rule 30a-3(b) under the Act (17 CFR 270.30a-3(b))and Rules 13a-15(b) or 15d-15(b) under the Exchange Act (17 CFR 240.13a-15(b) or 240.15d-15(b)).
The Registrant’s principal executive and principal financial officers have concluded, based on their evaluation of the Registrant’s disclosure controls and procedures as of a date within 90 days of the filing date of this report, that the Registrant’s disclosure controls and procedures are reasonably designed to ensure that information required to be disclosed by the Registrant on Form N-CSR is recorded, processed, summarized and reported within the required time periods and that information required to be disclosed by the Registrant in the reports that it files or submits on Form N-CSR is accumulated and communicated to the Registrant’s management, including its principal executive and principal financial officers, as appropriate to allow timely decisions regarding required disclosure.
(b) Disclose any change in the registrant’s internal control over financial reporting (as defined in Rule 30a-3(d) under the Act (17 CFR 270.30a-3(d)) that occurred during the registrant’s second fiscal quarter of the period covered by this report that has materially affected, or is reasonably likely to materially affect, the registrant’s internal control over financial reporting.
There were no changes in the Registrant’s internal control over financial reporting that occurred during the last fiscal quarter covered by this report that have materially affected, or are reasonably likely to materially affect, the Registrant’s internal control over financial reporting.
ITEM 12. EXHIBITS.
(a) File the exhibits listed below as part of this Form. Letter or number the exhibits in the sequence indicated.
(a)(1) Any code of ethics, or amendment thereto, that is the subject of the disclosure required by Item 2, to the extent that the registrant intends to satisfy the Item 2 requirements through filing of an exhibit.
Code of Ethics applicable to its Principal Executive and Principal Financial Officers pursuant to Section 406 of the Sarbanes-Oxley Act of 2002 attached hereto.
(a)(2) A separate certification for each principal executive officer and principal financial officer of the registrant as required by Rule 30a-2(a) under the Act (17 CFR 270.30a-2).
Certifications pursuant to Rule 30a-2(a) under the Investment Company Act of 1940 are attached hereto.
(a)(3) Any written solicitation to purchase securities under Rule 23c-1 under the Act (17 CFR 270.23c-1) sent or given during the period covered by the report by or on behalf of the registrant to 10 or more persons.
Not applicable.
(b) A separate or combined certification for each principal executive officer and principal officer of the registrant as required by Rule 30a-2(b) under the Act of 1940.
Certifications pursuant to Rule 30a-2(b) under the Investment Company Act of 1940 are attached hereto.
SIGNATURES
Pursuant to the requirements of the Securities Exchange Act of 1934 and the Investment Company Act of 1940, the registrant has duly caused this report to be signed on its behalf by the undersigned, thereunto duly authorized.
J.P. Morgan Exchange-Traded Fund Trust
| | |
| By: | | /s/ Joanna M. Gallegos |
| | Joanna M. Gallegos |
| | President and Principal Executive Officer |
| | January 2, 2018 |
Pursuant to the requirements of the Securities Exchange Act of 1934 and the Investment Company Act of 1940, this report has been signed below by the following persons on behalf of the registrant and in the capacities and on the dates indicated.
| | |
| By: | | /s/ Joanna M. Gallegos |
| | Joanna M. Gallegos |
| | President and Principal Executive Officer |
| | January 2, 2018 |
| | |
| By: | | /s/ Lauren A. Paino |
| | Lauren A. Paino |
| | Treasurer and Principal Financial Officer |
| | January 2, 2018 |
