UNITED STATES
SECURITIES AND EXCHANGE COMMISSION
Washington, D.C. 20549
FORM N-CSR
CERTIFIED SHAREHOLDER REPORT OF REGISTERED
MANAGEMENT INVESTMENT COMPANIES
Investment Company Act file number: 811-22903
J.P. Morgan Exchange-Traded Fund Trust
(Exact name of registrant as specified in charter)
270 Park Avenue
New York, NY 10017
(Address of principal executive offices) (Zip code)
Noah Greenhill, Esq.
J.P. Morgan Investment Management Inc.
270 Park Avenue
New York, NY 10017
(Name and Address of Agent for Service)
With copies to:
| | |
| Elizabeth A. Davin, Esq. | | Jon S. Rand, Esq. |
| JPMorgan Chase & Co. | | Dechert LLP |
| 1111 Polaris Parkway | | 1095 Avenue of the Americas |
| Columbus, OH 43240 | | New York, NY 10036 |
Registrant’s telephone number, including area code: (800) 480-4111
Date of fiscal year end: October 31
Date of reporting period: November 1, 2017 through October 31, 2018
Form N-CSR is to be used by management investment companies to file reports with the Commission not later than 10 days after the transmission to stockholders of any report that is required to be transmitted to stockholders under Rule 30e-1 under the Investment Company Act of 1940 (17 CFR 270.30e-1). The Commission may use the information provided on Form N-CSR in its regulatory, disclosure review, inspection, and policymaking roles.
A registrant is required to disclose the information specified by Form N-CSR, and the Commission will make this information public. A registrant is not required to respond to the collection of information contained in Form N-CSR unless the Form displays a currently valid Office of Management and Budget (“OMB”) control number. Please direct comments concerning the accuracy of the information collection burden estimate and any suggestions for reducing the burden to Secretary, Securities and Exchange Commission, 450 Fifth Street, NW, Washington, DC 20549-0609. The OMB has reviewed this collection of information under the clearance requirements of 44 U.S.C. Section 3507.
ITEM 1. REPORTS TO STOCKHOLDERS.
The following is a copy of the report transmitted to shareholders pursuant to Rule 30e-1 under the Investment Company Act of 1940 (17 CFR 270.30e-1).
Annual Report
J.P. Morgan Exchange-Traded Funds
October 31, 2018
JPMorgan BetaBuilders Canada ETF
JPMorgan BetaBuilders Developed Asia ex-Japan ETF
JPMorgan BetaBuilders Europe ETF
JPMorgan BetaBuilders Japan ETF
JPMorgan Diversified Return Emerging Markets Equity ETF
JPMorgan Diversified Return Europe Currency Hedged ETF
JPMorgan Diversified Return Europe Equity ETF
JPMorgan Diversified Return Global Equity ETF
JPMorgan Diversified Return International Currency Hedged ETF
JPMorgan Diversified Return International Equity ETF
JPMorgan Diversified Return U.S. Equity ETF
JPMorgan Diversified Return U.S. Mid Cap Equity ETF
JPMorgan Diversified Return U.S. Small Cap Equity ETF
JPMorgan U.S. Dividend ETF
JPMorgan U.S. Minimum Volatility ETF
JPMorgan U.S. Momentum Factor ETF
JPMorgan U.S. Quality Factor ETF
JPMorgan U.S. Value Factor ETF
Beginning on January 1, 2021, as permitted by regulations adopted by the Securities and Exchange Commission, paper copies of the Fund’s annual and semi-annual shareholder reports will no longer be sent by mail, unless you specifically request paper copies of the reports. Instead, the reports will be made available on the Fund’s website www.jpmorganfunds.com and you will be notified by mail each time a report is posted and provided with a website to access the report. If you already elected to receive shareholder reports electronically, you will not be affected by this change and you need not take any action.
You may elect to receive shareholder reports and other communications from the Fund electronically anytime by contacting your financial intermediary (such as a broker dealer, bank, or retirement plan).
Alternatively, you may elect to receive paper copies of all future reports free of charge by contacting your financial intermediary. Your election to receive paper reports will apply to all funds held within your account(s).

CONTENTS
Investments in a Fund are not bank deposits or obligations of, or guaranteed or endorsed by, any bank and are not insured or guaranteed by the FDIC, the Federal Reserve Board or any other government agency. You could lose money if you sell when the Fund’s share price is lower than when you invested.
Past performance is no guarantee of future performance. The general market views expressed in this report are opinions based on market and other conditions through the end of the reporting period and are subject to change without notice. These views are not intended to predict the future performance of a Fund or the securities markets. References to specific securities and their issuers are for illustrative purposes only and are not intended to be, and should not be interpreted as, recommendations to purchase or sell such securities. Such views are not meant as investment advice and may not be relied on as an indication of trading intent on behalf of any Fund.
Prospective investors should refer to the Funds’ prospectuses for a discussion of the Funds’ investment objectives, strategies and risks. Call J.P. Morgan Exchange-Traded Funds at (844) 457-6383 for a prospectus containing more complete information about a Fund, including management fees and other expenses. Please read it carefully before investing.
Shares are bought and sold throughout the day on an exchange at market price (not at net asset value) through a brokerage account, and are not individually subscribed and redeemed from a Fund. Shares may only be subscribed and redeemed directly from a Fund by Authorized Participants, in very large creation/redemption units. Brokerage commissions will reduce returns.
PRESIDENT’S LETTER
DECEMBER 15, 2018 (Unaudited)
Dear Shareholder,
This past year has been a monumental one for JPMorgan’s Exchange-Traded Funds. We’ve expanded our investment lineup to 31 funds, including the launch of our BetaBuilders® ETF suite, which provides investors with market-capitalization weighted exposure to select regions or asset classes. Additionally, our business was recently awarded “The industry’s fastest-growing ETF manager”1 climbing to $16.3 billion in assets under management through mid-December 2018 from $2.9 billion at the end of last year.
| | |
 | | “Our range of investment solutions can help you navigate a changing financial market landscape.” — Joanna M. Gallegos |
During the twelve months ended October 31, 2018, U.S. equity markets outperformed other developed equity markets, as well as emerging markets equity. Record corporate profits, low unemployment rates and high levels of both consumer and business confidence helped propel U.S. equity prices higher. However, we have also seen the return of equity market volatility.
Amid recent volatility in U.S. equity markets and anticipated rising interest rates, we believe our ETFs can provide solutions for investors in changing markets. Our JPMorgan Diversified
Return U.S. Equity ETF (JPUS), is designed to provide better risk-adjusted returns than market cap-weighted indexes. Recent market volatility has showcased the power of diversification and our unique risk-weighting approach; JPUS has recorded bottom decile volatility and top quintile Sharpe ratio over three years.2
We are proud to bring J.P. Morgan’s experience and capabilities to the ETF market place. Our range of investment solutions can help you navigate a changing financial market landscape. We are committed to building solutions that address your needs and help you build stronger portfolios. Thank you for your belief in our Firm and our process.
Sincerely,

Joanna M. Gallegos
President, J.P. Morgan Exchange-Traded Funds
J.P Morgan Asset Management
1-844-4JPM-ETF or jpmorgan.com/etfs for more information
| 1 | | Ignites.com as of 11/28/18 |
| 2 | | Morningstar Large Blend Category. Ranked: 1-yr. (752/1422), 3-yrs. (141/1305), since inception (141/1305); 5- and 10-yr. periods n/a. Volatility as measured by standard deviation. Sharpe ratio is a measure of the risk-adjusted return of an investment. |
| | | | | | | | |
| | | |
| OCTOBER 31, 2018 | | J.P. MORGAN EXCHANGE-TRADED FUNDS | | | | | 1 | |
Market Overview
Twelve Months Ended October 31, 2018 (Unaudited)
U.S. equity markets outperformed other developed market equity as well as emerging markets equity during the reporting period. Record corporate profits, low unemployment rates and high levels of both consumer and business confidence helped propel U.S. equity prices higher. Globally, bond markets largely underperformed equity markets. For the twelve months ended October 31, 2018, the MSCI World Index returned 1.16%.
After reaching record highs in the final months of 2017, the S&P 500 Index closed in record high territory 14 times in January 2018. However, a sharp sell-off in both equity and bond markets in early February 2018 spread to other markets and lifted market volatility from historic lows. While global equity and bond prices rebounded somewhat in subsequent months, it wasn’t until August 2018 that the S&P 500 Index returned to record highs. U.S. equity market volatility remained elevated in September and October 2018. For the twelve month reporting period, the S&P 500 Index returned 7.35%. The Russell Midcap Index returned 2.79% and the Russell 2000 Index returned 1.85% for the reporting period.
Meanwhile, economic growth in the European Union (“EU”) decelerated during the reporting period amid weakness in European exports and consumer confidence. Geo-political events, including a newly elected populist government in Italy and continued uncertainty over the final terms of a so-called Brexit agreement also weighed down equity and bond prices across the EU. Investor fears that the U.K. would leave the EU without an exit agreement also weighed on equity prices in London. For the reporting period, the MSCI EAFE Index returned -6.39%.
In emerging markets, a slowdown in credit growth in China and investor concerns about global trade tensions hurt equity prices. A stronger U.S. dollar and rising U.S. interest rates put further pressure on emerging markets, particularly those nations most reliant on foreign lending. For the reporting period, the MSCI Emerging Markets Index returned -12.19%.
| | | | | | |
| | | |
| 2 | | | | J.P. MORGAN EXCHANGE-TRADED FUNDS | | OCTOBER 31, 2018 |
JPMorgan BetaBuilders Canada ETF
FUND COMMENTARY
Period August 7, 2018 (Fund Inception Date) Through October 31, 2018 (Unaudited)
| | | | |
| REPORTING PERIOD RETURN: | | | |
| JPMorgan BetaBuilders Canada ETF | | | | |
| Net Asset Value* | | | (8.18)% | |
| Market Price** | | | (8.05)% | |
| Morningstar® Canada Target Market Exposure IndexSM | | | (8.21)% | |
| |
| Net Assets as of 10/31/2018 | | $ | 2,044,698,826 | |
INVESTMENT OBJECTIVE***
The JPMorgan BetaBuilders Canada ETF (the “Fund”) seeks investment results that closely correspond, before fees and expenses, to the performance of the Morningstar® Canada Target Market Exposure IndexSM (the “Underlying Index”).
INVESTMENT APPROACH
The Underlying Index is a free-float adjusted market-capitalization weighted index consisting of stocks traded primarily on the Toronto Stock Exchange. Using a “passive” investment approach, the Fund attempts to replicate the Index as closely as possible before considering fees and expenses and invests at least 80% of its assets in securities included in the Underlying Index.
HOW DID THE FUND PERFORM?
For the period from inception on August 7, 2018 to October 31, 2018, the Fund performed in line with the Underlying Index,
before considering the effects of operating expenses, fees and tax management of the Fund’s portfolio.
The Fund’s and the Underlying Index’s allocations to the oil & gas and basic materials sectors were leading detractors from absolute performance, while their allocations to the utilities and telecommunications sectors were the smallest detractors from absolute performance.
HOW WAS THE FUND POSITIONED?
During the reporting period, the Fund’s and the Underlying Index’s largest allocations were in the financials and oil & gas sectors and their smallest allocations were in health care and consumer goods sectors.
| | | | | | | | |
| | | |
| OCTOBER 31, 2018 | | J.P. MORGAN EXCHANGE-TRADED FUNDS | | | | | 3 | |
JPMorgan BetaBuilders Canada ETF
FUND COMMENTARY
Period August 7, 2018 (Fund Inception Date) Through October 31, 2018 (Unaudited) (continued)
| | | | | | | | |
| TOP TEN EQUITY POSITIONS OF THE PORTFOLIO**** | |
| | 1. | | | Royal Bank of Canada | | | 7.8 | % |
| | 2. | | | Toronto-Dominion Bank (The) | | | 7.5 | |
| | 3. | | | Bank of Nova Scotia (The) | | | 4.9 | |
| | 4. | | | Canadian National Railway Co. | | | 4.6 | |
| | 5. | | | Suncor Energy, Inc. | | | 4.0 | |
| | 6. | | | Enbridge, Inc. | | | 3.9 | |
| | 7. | | | Bank of Montreal | | | 3.5 | |
| | 8. | | | Canadian Imperial Bank of Commerce | | | 2.8 | |
| | 9. | | | Brookfield Asset Management, Inc., Class A | | | 2.6 | |
| | 10. | | | TransCanada Corp. | | | 2.5 | |
| * | | The return shown is based on net asset value calculated for shareholder transactions and may differ from the return shown in the financial highlights, which reflects adjustments made to the net asset value in accordance with accounting principles generally accepted in the United States of America. The net asset value was $22.59 as of October 31, 2018. |
| ** | | Market price return is calculated assuming an initial investment made at the inception date net asset value, reinvestment of all dividends and distributions at market price during the period, and sale at the market price on the last day of the period. The price used to calculate the market price return is the midpoint of the bid/ask spread at the close of business on the Cboe BZX Exchange, Inc. The midpoint price was $22.62 as of October 31, 2018. |
| *** | | The adviser seeks to achieve the Fund’s objective. There can be no guarantee it will be achieved. |
| **** | | Percentages indicated are based on total investments as of October 31, 2018. The Fund’s portfolio composition is subject to change. |
| | | | | | |
| | | |
| 4 | | | | J.P. MORGAN EXCHANGE-TRADED FUNDS | | OCTOBER 31, 2018 |
| | | | | | | | |
TOTAL RETURNS AS OF OCTOBER 31, 2018 (Unaudited) | |
| | | INCEPTION DATE | | | CUMULATIVE
SINCE
INCEPTION | |
JPMorgan BetaBuilders Canada ETF | | | | | | | | |
Net Asset Value | | | August 7, 2018 | | |
| (8.18)%
|
|
Market Price | | | | | | | (8.05)% | |
LIFE OF FUND PERFORMANCE (8/7/18 TO 10/31/18)
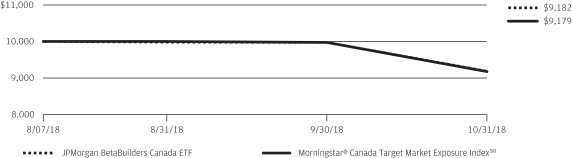
The performance quoted is past performance and is not a guarantee of future results. Exchange-traded funds are subject to certain market risks. Investment returns and principal value of an investment will fluctuate so that an investor’s shares, when sold or redeemed, may be worth more or less than their original cost. Current performance may be higher or lower than the performance data shown. For up-to-date, month-end performance information please call 1-844-457-6383.
Fund commenced operations on August 7, 2018.
The graph illustrates comparative performance for $10,000 invested in shares of the JPMorgan BetaBuilders Canada ETF and Morningstar® Canada Target Market Exposure IndexSM from August 7, 2018 to October 31, 2018. The performance of the Fund reflects the deduction of Fund expenses and assumes reinvestment of all dividends and capital gain distributions, if any. The performance of the Morningstar® Canada Target Market Exposure IndexSM does not reflect the deduction of expenses associated with an exchange-traded fund and has been adjusted to reflect reinvestment of all dividends and capital gain distributions of the securities included in the Index, if applicable. The Morningstar® Canada Target Market Exposure IndexSM is a free float adjusted market
capitalization weighted index which consists of stocks traded primarily on the Toronto Stock Exchange. Investors cannot invest directly in an index.
Fund performance reflects the waiver of the Fund’s fees and reimbursement of expenses for certain periods since the inception date. Without these waivers and reimbursements, performance would have been lower. Also, performance shown in this section does not reflect the deduction of taxes that a shareholder may pay on Fund distributions or redemption or sale of Fund shares.
International investing involves a greater degree of risk and increased volatility. Changes in currency exchange rates and differences in accounting and taxation policies outside the United States can raise or lower returns. Also, some over- seas markets may not be as politically and economically stable as the United States and other nations.
The returns shown are based on net asset values calculated for shareholder transactions and may differ from the returns shown in the financial highlights, which reflect adjustments made to the net asset values in accordance with accounting principles generally accepted in the United States of America.
| | | | | | | | |
| | | |
| OCTOBER 31, 2018 | | J.P. MORGAN EXCHANGE-TRADED FUNDS | | | | | 5 | |
JPMorgan BetaBuilders Developed Asia ex-Japan ETF
FUND COMMENTARY
Period August 7, 2018 (Fund Inception Date) Through October 31, 2018 (Unaudited)
| | | | |
| REPORTING PERIOD RETURN: | | | |
| JPMorgan BetaBuilders Developed Asia ex-Japan ETF | | | | |
| Net Asset Value* | | | (9.97)% | |
| Market Price** | | | (9.93)% | |
| Morningstar® Developed Asia Pacific ex-Japan Target Market Exposure IndexSM | | | (10.17)% | |
| |
| Net Assets as of 10/31/2018 | | $ | 603,313,934 | |
INVESTMENT OBJECTIVE***
The JPMorgan BetaBuilders Developed Asia ex-Japan ETF (the “Fund”) seeks investment results that closely correspond, before fees and expenses, to the performance of the Morningstar® Developed Asia Pacific ex-Japan Target Market Exposure IndexSM (the “Underlying Index”).
INVESTMENT APPROACH
The Underlying Index is a free-float adjusted market-cap weighted index consisting of stocks from developed Asia Pacific countries other than Japan, including: Australia, Hong Kong, New Zealand and Singapore. Using a “passive” investment approach, the Fund attempts to replicate the Underlying Index as closely as possible before considering fees and expenses and invests at least 80% of its assets in securities included in the Underlying Index.
HOW DID THE FUND PERFORM?
For the period from inception on August 7, 2018 to October 31, 2018, the Fund performed in line with the Underlying Index,
before considering the effects of operating expenses, fees and tax management of the Fund’s portfolio.
The Fund’s and the Underlying Index’s exposures to the technology and the consumer services sectors were leading detractors from absolute performance, while their exposure to the telecommunications sector made a positive contribution to absolute performance. The Fund’s and the Underlying Index’s exposures to Hong Kong and Australia were leading detractors from absolute performance, while their exposure to the New Zealand was the smallest detractor from absolute performance.
HOW WAS THE FUND POSITIONED?
During the reporting period, the Fund’s and the Underlying Index’s largest allocations were in financials, industrials and consumer services sectors and their smallest allocations were in the technology and telecommunications sectors. The Fund and the Underlying Index were mainly invested in four equity markets during the reporting period, with the largest allocation to Australia followed by Hong Kong, Singapore and New Zealand.
| | | | | | |
| | | |
| 6 | | | | J.P. MORGAN EXCHANGE-TRADED FUNDS | | OCTOBER 31, 2018 |
| | | | | | | | |
| TOP TEN EQUITY HOLDINGS OF THE PORTFOLIO**** | |
| | 1. | | | AIA Group Ltd. (Hong Kong) | | | 5.9 | % |
| | 2. | | | Commonwealth Bank of Australia (Australia) | | | 5.5 | |
| | 3. | | | BHP Billiton Ltd. (Australia) | | | 4.7 | |
| | 4. | | | Westpac Banking Corp. (Australia) | | | 4.2 | |
| | 5. | | | CSL Ltd. (Australia) | | | 3.9 | |
| | 6. | | | Australia & New Zealand Banking Group Ltd. (Australia) | | | 3.4 | |
| | 7. | | | National Australia Bank Ltd. (Australia) | | | 3.1 | |
| | 8. | | | Wesfarmers Ltd. (Australia) | | | 2.4 | |
| | 9. | | | Hong Kong Exchanges & Clearing Ltd. (Hong Kong) | | | 2.0 | |
| | 10. | | | Oversea-Chinese Banking Corp. Ltd. (Singapore) | | | 2.0 | |
| | | | |
PORTFOLIO COMPOSITION BY COUNTRY**** | |
| Australia | | | 57.1 | % |
| Hong Kong | | | 27.2 | |
| Singapore | | | 12.0 | |
| New Zealand | | | 2.1 | |
| Macau | | | 1.0 | |
| Others (each less than 1.0%) | | | 0.6 | |
| * | | The return shown is based on net asset value calculated for shareholder transactions and may differ from the return shown in the financial highlights, which reflects adjustments made to the net asset value in accordance with accounting principles generally accepted in the United States of America. The net asset value was $22.68 as of October 31, 2018. |
| ** | | Market price return is calculated assuming an initial investment made at the inception date net asset value, reinvestment of all dividends and distributions at market price during the period, and sale at the market price on the last day of the period. The price used to calculate the market price return is the midpoint of the bid/ask spread at the close of business on the Cboe BZX Exchange, Inc. The midpoint price was $22.69 as of October 31, 2018. |
| *** | | The adviser seeks to achieve the Fund’s objective. There can be no guarantee it will be achieved. |
| **** | | Percentages indicated are based on total investments as of October 31, 2018. The Fund’s portfolio composition is subject to change. |
| | | | | | | | |
| | | |
| OCTOBER 31, 2018 | | J.P. MORGAN EXCHANGE-TRADED FUNDS | | | | | 7 | |
JPMorgan BetaBuilders Developed Asia ex-Japan ETF
FUND COMMENTARY
Period August 7, 2018 (Fund Inception Date) Through October 31, 2018 (Unaudited) (continued)
| | | | | | | | |
TOTAL RETURNS AS OF OCTOBER 31, 2018 (Unaudited) | |
| | | INCEPTION DATE | | | CUMULATIVE
SINCE
INCEPTION | |
JPMorgan BetaBuilders Developed Asia ex-Japan ETF | | | | | |
Net Asset Value | | | August 7, 2018 | | | | (9.97)% | |
Market Price | | | | | | | (9.93)% | |
LIFE OF FUND PERFORMANCE (8/7/18 TO 10/31/18)
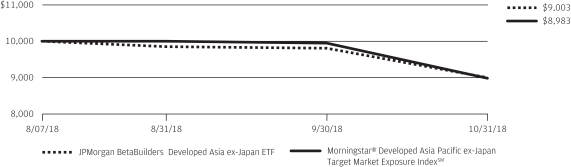
The performance quoted is past performance and is not a guarantee of future results. Exchange-traded funds are subject to certain market risks. Investment returns and principal value of an investment will fluctuate so that an investor’s shares, when sold or redeemed, may be worth more or less than their original cost. Current performance may be higher or lower than the performance data shown. For up-to-date, month-end performance information please call 1-844-457-6383.
Fund commenced operations on August 7, 2018.
The graph illustrates comparative performance for $10,000 invested in shares of the JPMorgan BetaBuilders Developed Asia ex-Japan ETF and Morningstar® Developed Asia Pacific ex-Japan Target Market Exposure IndexSM from August 7, 2018 to October 31, 2018. The performance of the Fund reflects the deduction of Fund expenses and assumes reinvestment of all dividends and capital gain distributions, if any. The performance of the Morningstar® Developed Asia Pacific ex-Japan Target Market Exposure IndexSM does not reflect the deduction of expenses associated with an exchange-traded fund and has been adjusted to reflect reinvestment of all dividends and capital gain distributions of the securities included in the Index, if applicable. The Morningstar® Developed Asia Pacific ex-Japan Target Market Exposure IndexSM is a free float adjusted
market capitalization-weighted index that consists of equity securities from developed Asia-Pacific countries or regions other than Japan, including: Australia, Hong Kong, New Zealand, and Singapore. Investors cannot invest directly in an index.
Fund performance reflects the waiver of the Fund’s fees and reimbursement of expenses for certain periods since the inception date. Without these waivers and reimbursements, performance would have been lower. Also, performance shown in this section does not reflect the deduction of taxes that a shareholder may pay on Fund distributions or redemption or sale of Fund shares.
International investing involves a greater degree of risk and increased volatility. Changes in currency exchange rates and differences in accounting and taxation policies outside the United States can raise or lower returns. Also, some over- seas markets may not be as politically and economically stable as the United States and other nations.
The returns shown are based on net asset values calculated for shareholder transactions and may differ from the returns shown in the financial highlights, which reflect adjustments made to the net asset values in accordance with accounting principles generally accepted in the United States of America.
| | | | | | |
| | | |
| 8 | | | | J.P. MORGAN EXCHANGE-TRADED FUNDS | | OCTOBER 31, 2018 |
JPMorgan BetaBuilders Europe ETF
FUND COMMENTARY
Period June 15, 2018 (Fund Inception Date) Through October 31, 2018 (Unaudited)
| | | | |
| REPORTING PERIOD RETURN: | | | |
| JPMorgan BetaBuilders Europe ETF | | | | |
| Net Asset Value* | | | (8.75)% | |
| Market Price** | | | (8.55)% | |
| Morningstar® Developed Europe Target Market Exposure IndexSM | | | (8.39)% | |
| |
| Net Assets as of 10/31/2018 | | $ | 1,314,930,292 | |
INVESTMENT OBJECTIVE***
The JPMorgan BetaBuilders Europe ETF (the “Fund”) seeks investment results that closely correspond, before fees and expenses, to the performance of the Morningstar® Developed Europe Target Market Exposure IndexSM (the “Underlying Index”).
INVESTMENT APPROACH
The Underlying Index is a free-float adjusted market-cap weighted index consisting of stocks traded on the primary exchanges in developed countries or regions across Europe. Using a “passive” investment approach, the Fund attempts to replicate the Underlying Index as closely as possible before considering fees and expenses and invests at least 80% of its assets in securities included in the Underlying Index.
HOW DID THE FUND PERFORM?
For the period from inception on June 15, 2018 to October 31, 2018, the Fund performed in line with the Underlying Index, before considering the effects of operating expenses, fees and tax management of the Fund’s portfolio.
The Fund’s and the Underlying Index’s exposures to the technology and basic materials sectors were leading detractors from absolute performance, while their exposure to the health care sector made a positive contribution to absolute performance during the reporting period.
By country, the Fund’s and the Underlying Index’s exposures to Ireland and Belgium were leading detractors from absolute performance, while their exposures to Switzerland made a positive contribution to absolute performance.
HOW WAS THE FUND POSITIONED?
During the reporting period, the Fund’s and the Underlying Index’s largest allocations were in the financials and consumer goods sectors and their smallest allocations were in the telecommunications and utilities sectors. The Fund’s and the Underlying Index’s largest country allocations were in the U.K. and France and their smallest country allocations were in Austria and Portugal.
| | | | | | | | |
| | | |
| OCTOBER 31, 2018 | | J.P. MORGAN EXCHANGE-TRADED FUNDS | | | | | 9 | |
JPMorgan BetaBuilders Europe ETF
FUND COMMENTARY
Period June 15, 2018 (Fund Inception Date) Through October 31, 2018 (Unaudited) (continued)
| | | | | | | | |
| TOP TEN EQUITY HOLDINGS OF THE PORTFOLIO**** | |
| | 1. | | | Nestle SA (Registered) (Switzerland) | | | 2.9 | % |
| | 2. | | | Novartis AG (Registered) (Switzerland) | | | 2.5 | |
| | 3. | | | Roche Holding AG (Switzerland) | | | 2.0 | |
| | 4. | | | HSBC Holdings plc (United Kingdom) | | | 1.9 | |
| | 5. | | | TOTAL SA (France) | | | 1.7 | |
| | 6. | | | Royal Dutch Shell plc, Class A (Netherlands) | | | 1.7 | |
| | 7. | | | BP plc (United Kingdom) | | | 1.6 | |
| | 8. | | | Royal Dutch Shell plc, Class B (Netherlands) | | | 1.4 | |
| | 9. | | | SAP SE (Germany) | | | 1.3 | |
| | 10. | | | Sanofi (France) | | | 1.2 | |
| | | | |
SUMMARY OF INVESTMENTS BY COUNTRY**** | |
| United Kingdom | | | 23.1 | % |
| France | | | 15.9 | |
| Switzerland | | | 13.8 | |
| Germany | | | 13.4 | |
| Netherlands | | | 7.0 | |
| Spain | | | 4.5 | |
| Sweden | | | 4.3 | |
| Italy | | | 3.2 | |
| United States | | | 3.0 | |
| Denmark | | | 2.6 | |
| Finland | | | 2.1 | |
| Belgium | | | 1.9 | |
| Norway | | | 1.3 | |
| Australia | | | 1.1 | |
| Others (each less than 1.0%) | | | 2.8 | |
| * | | The return shown is based on net asset value calculated for shareholder transactions and may differ from the return shown in the financial highlights, which reflects adjustments made to the net asset value in accordance with accounting principles generally accepted in the United States of America. The net asset value was $22.59 as of October 31, 2018. |
| ** | | Market price return is calculated assuming an initial investment made at the inception date net asset value, reinvestment of all dividends and distributions at market price during the period, and sale at the market price on the last day of the period. The price used to calculate the market price return is the midpoint of the bid/ask spread at the close of business on the Cboe BZX Exchange, Inc. The midpoint price was $22.64 as of October 31, 2018. |
| *** | | The adviser seeks to achieve the Fund’s objective. There can be no guarantee it will be achieved. |
| **** | | Percentages indicated are based on total investments as of October 31, 2018. The Fund’s portfolio composition is subject to change. |
| | | | | | |
| | | |
| 10 | | | | J.P. MORGAN EXCHANGE-TRADED FUNDS | | OCTOBER 31, 2018 |
| | | | | | | | |
TOTAL RETURNS AS OF OCTOBER 31, 2018 (Unaudited) | |
| | | INCEPTION DATE | | | CUMULATIVE
SINCE
INCEPTION | |
JPMorgan BetaBuilders Europe ETF | | | | | | | | |
Net Asset Value | | | June 15, 2018 | | | | (8.75)% | |
Market Price | | | | | | | (8.55)% | |
LIFE OF FUND PERFORMANCE (6/15/18 TO 10/31/18)
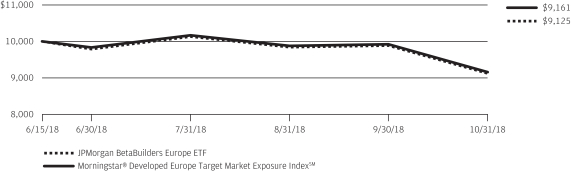
The performance quoted is past performance and is not a guarantee of future results. Exchange-traded funds are subject to certain market risks. Investment returns and principal value of an investment will fluctuate so that an investor’s shares, when sold or redeemed, may be worth more or less than their original cost. Current performance may be higher or lower than the performance data shown. For up-to-date, month-end performance information please call 1-844-457-6383.
Fund commenced operations on June 15, 2018.
The graph illustrates comparative performance for $10,000 invested in shares of the JPMorgan BetaBuilders Europe ETF and Morningstar® Developed Europe Target Market Exposure IndexSM from June 15, 2018 to October 31, 2018. The performance of the Fund reflects the deduction of Fund expenses and assumes reinvestment of all dividends and capital gain distributions, if any. The performance of the Morningstar® Developed Europe Target Market Exposure IndexSM does not reflect the deduction of expenses associated with an exchange-traded fund and has been adjusted to reflect reinvestment of all dividends and capital gain distributions of the securities included in the Index, if applicable. Morningstar® Developed Europe Target Market Exposure IndexSM is a
free float adjusted market capitalization-weighted index which consists of equity securities from developed European countries or regions. Investors cannot invest directly in an index.
Fund performance reflects the waiver of the Fund’s fees and reimbursement of expenses for certain periods since the inception date. Without these waivers and reimbursements, performance would have been lower. Also, performance shown in this section does not reflect the deduction of taxes that a shareholder may pay on Fund distributions or redemption or sale of Fund shares.
International investing involves a greater degree of risk and increased volatility. Changes in currency exchange rates and differences in accounting and taxation policies outside the United States can raise or lower returns. Also, some over- seas markets may not be as politically and economically stable as the United States and other nations.
The returns shown are based on net asset values calculated for shareholder transactions and may differ from the returns shown in the financial highlights, which reflect adjustments made to the net asset values in accordance with accounting principles generally accepted in the United States of America.
| | | | | | | | |
| | | |
| OCTOBER 31, 2018 | | J.P. MORGAN EXCHANGE-TRADED FUNDS | | | | | 11 | |
JPMorgan BetaBuilders Japan ETF
FUND COMMENTARY
Period June 15, 2018 (Fund Inception Date) Through October 31, 2018 (Unaudited)
| | | | |
| REPORTING PERIOD RETURN: | | | |
| JPMorgan BetaBuilders Japan ETF | | | | |
| Net Asset Value* | | | (8.35)% | |
| Market Price** | | | (8.51)% | |
| Morningstar® Japan Target Market Exposure IndexSM | | | (8.38)% | |
| |
| Net Assets as of 10/31/2018 | | $ | 2,336,087,667 | |
INVESTMENT OBJECTIVE***
The JPMorgan BetaBuilders Japan ETF (the “Fund”) seeks investment results that closely correspond, before fees and expenses, to the performance of the Morningstar® Japan Target Market Exposure IndexSM (the “Underlying Index”).
INVESTMENT APPROACH
The Underlying Index is a free-float adjusted market-cap weighted index consisting of stocks traded primarily on the Tokyo or Nagoya Stock Exchange. Using a “passive” investment approach, the Fund attempts to replicate the Underlying Index as closely as possible before considering fees and expenses and invests at least 80% of its assets in securities included in the Underlying Index.
HOW DID THE FUND PERFORM?
For the period from inception on June 15, 2018 to October 31, 2018, the Fund performed in line with the Underlying Index,
before considering the effects of operating expenses, fees and tax management of the Fund’s portfolio.
The Fund’s and the Underlying Index’s exposures to the basic materials and consumer goods sectors were leading detractors from absolute performance, while their exposure to the oil & gas sector made a positive contribution to absolute performance.
HOW WAS THE FUND POSITIONED?
During the reporting period, the Fund’s and the Underlying Index’s largest allocations were in the consumer goods and industrials sectors and their smallest allocations were in the oil & gas and utilities sectors.
| | | | | | |
| | | |
| 12 | | | | J.P. MORGAN EXCHANGE-TRADED FUNDS | | OCTOBER 31, 2018 |
| | | | | | | | |
| TOP TEN EQUITY HOLDINGS OF THE PORTFOLIO**** | |
| | 1. | | | Toyota Motor Corp. | | | 4.2 | % |
| | 2. | | | Mitsubishi UFJ Financial Group, Inc. | | | 2.1 | |
| | 3. | | | SoftBank Group Corp. | | | 1.8 | |
| | 4. | | | Sony Corp. | | | 1.8 | |
| | 5. | | | Sumitomo Mitsui Financial Group, Inc. | | | 1.5 | |
| | 6. | | | Honda Motor Co. Ltd. | | | 1.4 | |
| | 7. | | | Keyence Corp. | | | 1.2 | |
| | 8. | | | Mitsubishi Corp. | | | 1.2 | |
| | 9. | | | Mizuho Financial Group, Inc. | | | 1.2 | |
| | 10. | | | Recruit Holdings Co. Ltd. | | | 1.1 | |
| * | | The return shown is based on net asset value calculated for shareholder transactions and may differ from the return shown in the financial highlights, which reflects adjustments made to the net asset value in accordance with accounting principles generally accepted in the United States of America. The net asset value was $22.72 as of October 31, 2018. |
| ** | | Market price return is calculated assuming an initial investment made at the inception date net asset value, reinvestment of all dividends and distributions at market price during the period, and sale at the market price on the last day of the period. The price used to calculate the market price return is the midpoint of the bid/ask spread at the close of business on the Cboe BZX Exchange, Inc. The midpoint price was $22.68 as of October 31, 2018. |
| *** | | The adviser seeks to achieve the Fund’s objective. There can be no guarantee it will be achieved. |
| **** | | Percentages indicated are based on total investments as of October 31, 2018. The Fund’s portfolio composition is subject to change. |
| | | | | | | | |
| | | |
| OCTOBER 31, 2018 | | J.P. MORGAN EXCHANGE-TRADED FUNDS | | | | | 13 | |
JPMorgan BetaBuilders Japan ETF
FUND COMMENTARY
Period June 15, 2018 (Fund Inception Date) Through October 31, 2018 (Unaudited) (continued)
| | | | | | | | |
TOTAL RETURNS AS OF OCTOBER 31, 2018 (Unaudited) | |
| | | INCEPTION DATE | | | CUMULATIVE
SINCE
INCEPTION | |
JPMorgan BetaBuilders Japan ETF | | | | | | | | |
Net Asset Value | | | June 15, 2018 | | | | (8.35)% | |
Market Price | | | | | | | (8.51)% | |
LIFE OF FUND PERFORMANCE (6/15/18 TO 10/31/18)
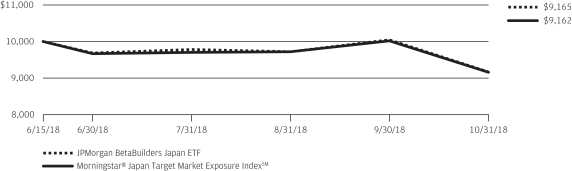
The performance quoted is past performance and is not a guarantee of future results. Exchange-traded funds are subject to certain market risks. Investment returns and principal value of an investment will fluctuate so that an investor’s shares, when sold or redeemed, may be worth more or less than their original cost. Current performance may be higher or lower than the performance data shown. For up-to-date, month-end performance information please call 1-844-457-6383.
Fund commenced operations on June 15, 2018.
The graph illustrates comparative performance for $10,000 invested in shares of the JPMorgan BetaBuilders Japan ETF and Morningstar® Japan Target Market Exposure IndexSM from June 15, 2018 to October 31, 2018. The performance of the Fund reflects the deduction of Fund expenses and assumes reinvestment of all dividends and capital gain distributions, if any. The performance of the Morningstar® Japan Target Market Exposure IndexSM does not reflect the deduction of expenses associated with an exchange-traded fund and has been adjusted to reflect reinvestment of all dividends and capital gain distributions of the securities included in the Index, if applicable. Morningstar® Japan Target Market Exposure IndexSM is a free float adjusted market capitalization weighted
index which consists of stocks traded primarily on the Tokyo Stock Exchange or the Nagoya Stock Exchange. Investors cannot invest directly in an index.
Fund performance reflects the waiver of the Fund’s fees and reimbursement of expenses for certain periods since the inception date. Without these waivers and reimbursements, performance would have been lower. Also, performance shown in this section does not reflect the deduction of taxes that a shareholder may pay on Fund distributions or redemption or sale of Fund shares.
International investing involves a greater degree of risk and increased volatility. Changes in currency exchange rates and differences in accounting and taxation policies outside the United States can raise or lower returns. Also, some over- seas markets may not be as politically and economically stable as the United States and other nations.
The returns shown are based on net asset values calculated for shareholder transactions and may differ from the returns shown in the financial highlights, which reflect adjustments made to the net asset values in accordance with accounting principles generally accepted in the United States of America.
| | | | | | |
| | | |
| 14 | | | | J.P. MORGAN EXCHANGE-TRADED FUNDS | | OCTOBER 31, 2018 |
JPMorgan Diversified Return Emerging Markets Equity ETF
FUND COMMENTARY
Twelve Months Ended October 31, 2018 (Unaudited)
| | | | |
| REPORTING PERIOD RETURN: | |
| JPMorgan Diversified Return Emerging Markets Equity ETF | | | | |
Net Asset Value* | | | (6.93)% | |
Market Price** | | | (7.43)% | |
JP Morgan Diversified Factor Emerging Markets Equity Index (net of foreign withholding taxes) | | | (6.44)% | |
FTSE Emerging Index (net of foreign withholding taxes) | | | (10.91)% | |
MSCI Emerging Markets Index (net of foreign withholding taxes) | | | (12.52)% | |
| |
Net Assets as of 10/31/2018 | | $ | 213,804,252 | |
INVESTMENT OBJECTIVE***
The JPMorgan Diversified Return Emerging Markets Equity ETF (the “Fund”) seeks investment results that closely correspond, before fees and expenses, to the performance of the JP Morgan Diversified Factor Emerging Markets Equity Index (the “Underlying Index”).
INVESTMENT APPROACH
The Fund is passively managed to the Underlying Index, which provides emerging markets equity exposure, diversified across emerging market regions and super-sectors. The Underlying Index uses a proprietary multi-factor stock selection process that utilizes the following characteristics: value, momentum and quality. The Underlying Index methodology includes quarterly rebalancing.
HOW DID THE FUND PERFORM?
The Fund posted a negative absolute return for the twelve months ended October 31, 2018 and performed in line with the Underlying Index, before considering differences in the net asset value calculations and foreign exchange pricing between the Underlying Index and the Fund and fees and operating expenses incurred by the Fund. The Fund and the Underlying Index outperformed the FTSE Emerging Index and the MSCI Emerging Markets Index, both of which are more traditional market capitalization weighted indexes.
The Fund’s and the Underlying Index’s allocations to the oil & gas sectors and basic materials sectors were leading contributors to absolute performance, while their allocations to the
consumer goods and industrials sectors were leading detractors from absolute performance. The Fund’s and the Underlying Index’s small allocation to the North America was a leading contributor to absolute performance, while their allocations to Europe and Asia Pacific were the largest detractors from absolute performance.
Relative to the FTSE Emerging Index, the Fund’s and the Underlying Index’s security selection and underweight positions in both the consumer services and technology sectors were leading contributors to performance, while the Fund’s and the Underlying Index’s security selection in the industrials and consumer goods sectors was a leading detractor from relative performance. The Fund’s and the Underlying Index’s security selection in Asia Pacific was a leading contributor to relative performance, while their security selection in Europe made the smallest contribution to from relative performance.
HOW WAS THE FUND POSITIONED?
At the end of the reporting period, the Fund’s and the Underlying Index’s largest sector allocations were in the financials and oil & gas sectors, while its smallest allocations were in the health care and consumer services sectors. The Fund’s largest regional allocation was in China/India/Pakistan and its smallest allocation was in Latin America.
| | | | | | | | |
| | | |
| OCTOBER 31, 2018 | | J.P. MORGAN EXCHANGE-TRADED FUNDS | | | | | 15 | |
JPMorgan Diversified Return Emerging Markets Equity ETF
FUND COMMENTARY
Twelve Months Ended October 31, 2018 (Unaudited) (continued)
| | | | | | | | |
| TOP TEN EQUITY HOLDINGS OF THE PORTFOLIO**** | |
| | 1. | | | Taiwan Semiconductor Manufacturing Co. Ltd. (Taiwan) | | | 2.9 | % |
| | 2. | | | China Mobile Ltd. (China) | | | 2.8 | |
| | 3. | | | Vale SA (Brazil) | | | 1.7 | |
| | 4. | | | Baidu, Inc., ADR (China) | | | 1.3 | |
| | 5. | | | Hon Hai Precision Industry Co. Ltd. (Taiwan) | | | 1.3 | |
| | 6. | | | Tenaga Nasional Bhd. (Malaysia) | | | 1.3 | |
| | 7. | | | PTT PCL (Thailand) | | | 1.2 | |
| | 8. | | | China Construction Bank Corp., Class H (China) | | | 1.2 | |
| | 9. | | | LUKOIL PJSC (Russia) | | | 1.2 | |
| | 10. | | | Itau Unibanco Holding SA (Preference) (Brazil) | | | 1.1 | |
| | | | |
PORTFOLIO COMPOSITION BY COUNTRY**** | |
China | | | 21.2 | % |
Taiwan | | | 15.3 | |
Brazil | | | 9.8 | |
India | | | 9.2 | |
Thailand | | | 7.0 | |
Malaysia | | | 6.6 | |
Russia | | | 6.3 | |
South Africa | | | 6.2 | |
Mexico | | | 4.2 | |
Indonesia | | | 3.9 | |
Qatar | | | 1.6 | |
United Arab Emirates | | | 1.4 | |
Chile | | | 1.4 | |
Philippines | | | 1.3 | |
Turkey | | | 1.0 | |
Others (each less than 1.0%) | | | 3.6 | |
| * | | The return shown is based on net asset value calculated for shareholder transactions and may differ from the return shown in the financial highlights, which reflects adjustments made to the net asset value in accordance with accounting principles generally accepted in the United States of America. The net asset value was $50.91 as of October 31, 2018. |
| ** | | Market price return is calculated assuming an initial investment made at the market price at the beginning of the period, reinvestment of all dividends and distributions at market price during the period, and sale at the market price on the last day of the period. The price used to calculate the market price return is the midpoint of the bid/ask spread at the close of business on the NYSE Arca. The midpoint price was $50.83 as of October 31, 2018. |
| *** | | The adviser seeks to achieve the Fund’s objective. There can be no guarantee it will be achieved. |
| **** | | Percentages indicated are based on total investments as of October 31, 2018. The Fund’s composition is subject to change. |
| | | | | | |
| | | |
| 16 | | | | J.P. MORGAN EXCHANGE-TRADED FUNDS | | OCTOBER 31, 2018 |
| | | | | | | | | | | | |
AVERAGE ANNUAL TOTAL RETURNS AS OF OCTOBER 31, 2018 (Unaudited) | |
| | | INCEPTION DATE | | | 1 YEAR | | | SINCE
INCEPTION | |
| JPMorgan Diversified Return Emerging Markets Equity ETF | | | | | | | | | | | | |
Net Asset Value | | | January 7, 2015 | | | | (6.93)% | | | | 2.82% | |
Market Price | | | | | | | (7.43)% | | | | 2.78% | |
LIFE OF FUND PERFORMANCE (1/07/15 TO 10/31/18)
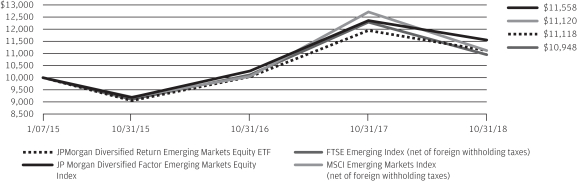
The performance quoted is past performance and is not a guarantee of future results. Exchange-traded funds are subject to certain market risks. Investment returns and principal value of an investment will fluctuate so that an investor’s shares, when sold or redeemed, may be worth more or less than their original cost. Current performance may be higher or lower than the performance data shown. For up-to-date, month-end performance information please call 1-844-457-6383.
Fund commenced operations on January 7, 2015.
The graph illustrates comparative performance for $10,000 invested in shares of the JPMorgan Diversified Return Emerging Markets Equity ETF, the JP Morgan Diversified Factor Emerging Markets Equity Index, the FTSE Emerging Index, and the MSCI Emerging Markets Index from January 7, 2015 to October 31, 2018. The performance of the Fund reflects the deduction of Fund expenses and assumes reinvestment of all dividends and capital gain distributions, if any. The performance of the JP Morgan Diversified Factor Emerging Markets Equity Index, the FTSE Emerging Index and the MSCI Emerging Markets Index does not reflect the deduction of expenses associated with an exchange-traded fund and has been adjusted to reflect reinvestment of all dividends and capital gain distributions of the securities included in the Index, if applicable. The Fund’s adviser is a sponsor of the JP Morgan Diversified Factor Emerging Markets Equity Index and developed the proprietary factors on which the index is based. FTSE Russell, the benchmark administrator, administers, calculates and governs the JP Morgan Diversified Factor Emerging Markets Equity Index. The FTSE Emerging Index is a market-capitalization weighted
index and is part of the FTSE Global Equity Index Series. The series includes large- and mid-cap securities from advanced and secondary emerging markets, classified in accordance with FTSE’s transparent Country Classification Review Process. The FTSE Emerging Index provides investors with a comprehensive means of measuring the performance of the most liquid companies in the emerging markets. The MSCI Emerging Markets Index is a free float-adjusted market capitalization weighted index that is designed to measure the equity market performance of emerging markets. Investors cannot invest directly in an index.
Fund performance reflects the waiver of the Fund’s fees and reimbursement of expenses for certain periods since the inception date. Without these waivers and reimbursements, performance would have been lower. Also, performance shown in this section does not reflect the deduction of taxes that a shareholder may pay on Fund distributions or redemption or sale of Fund shares.
International investing involves a greater degree of risk and increased volatility. Changes in currency exchange rates and differences in accounting and taxation policies outside the United States can raise or lower returns. Also, some overseas markets may not be as politically and economically stable as the United States and other nations.
The returns shown are based on net asset values calculated for shareholder transactions and may differ from the returns shown in the financial highlights, which reflect adjustments made to the net asset values in accordance with accounting principles generally accepted in the United States of America.
| | | | | | | | |
| | | |
| OCTOBER 31, 2018 | | J.P. MORGAN EXCHANGE-TRADED FUNDS | | | | | 17 | |
JPMorgan Diversified Return Europe Currency Hedged ETF
FUND COMMENTARY
Twelve Months Ended October 31, 2018 (Unaudited)
| | | | |
| REPORTING PERIOD RETURN: | | | |
JPMorgan Diversified Return Europe Currency Hedged ETF | | | | |
Net Asset Value* | | | (3.18)% | |
Market Price** | | | (2.78)% | |
JP Morgan Diversified Factor Europe Currency Hedged (USD) Index (net of foreign withholding taxes) | | | (2.27)% | |
JP Morgan Diversified Factor Europe Equity Index (net of foreign withholding taxes) | | | (7.70)% | |
FTSE Developed Europe Index (net of foreign withholding taxes) | | | (8.25)% | |
| |
Net Assets as of 10/31/2018 | | $ | 28,894,238 | |
INVESTMENT OBJECTIVE***
The JPMorgan Diversified Return Europe Currency Hedged ETF (the “Fund”) seeks investment results that closely correspond, before fees and expenses, to the performance of the JP Morgan Diversified Factor Europe Currency Hedged (USD) Index (the “Underlying Index”).
INVESTMENT APPROACH
The Fund is passively managed to the Underlying Index, which is composed of large cap and mid cap equity securities of companies from developed Europe, diversified across sectors. The Underlying Index uses a proprietary multifactor selection process that measures the following characteristics: valuation, momentum and quality. The Underlying Index methodology includes quarterly rebalancing. In addition to reflecting European stock performance, the Underlying Index attempts to minimize the impact of exchange rate fluctuations by hedging European currency exposure versus the U.S. dollar on a monthly basis. The Fund seeks to achieve its investment objective by investing a substantial portion of its assets in the JPMorgan Diversified Return Europe Equity ETF.
HOW DID THE FUND PERFORM?
The Fund posted a negative absolute performance for the twelve months ended October 31, 2018, and performed in line with the Underlying Index, before considering differences in performance of the currency hedge, the Fund’s small cash allocation and fees and operating expenses incurred by the Fund.
The Fund and the Underlying Index outperformed both the JP Morgan Diversified Factor Europe Equity Index, which is not hedged to the U.S. dollar, and the FTSE Developed Europe Index, which is a more traditional market capitalization weighted index that is not hedged to the U.S. dollar. The Fund’s and the Underlying Index’s currency hedge, using currency forward contracts, helped performance as the U.S. dollar strengthened against most other currencies during the reporting period.
The Fund’s and the Underlying Index’s allocations to the consumer goods and telecommunications sectors were leading detractors from absolute performance, while their allocation to the oil & gas sector made a positive contribution to absolute performance. The Fund’s and the Underlying Index’s allocations to Austria and Italy were leading detractors from absolute performance, while their allocations to Ireland and Finland were leading contributors to absolute performance.
Relative to the FTSE Developed Europe Index, the Fund’s and the Underlying Index’s security selection in the health care and consumer goods sectors was a leading detractor from performance, while the Fund’s and the Underlying Index’s underweight position and security selection in the financials sector and their security selection in the utilities sector were leading contributors to relative performance.
HOW WAS THE FUND POSITIONED?
During the reporting period, the Fund’s and the Underlying Index’s largest sector allocations were in the consumer goods and health care sectors, while its smallest allocations were in the oil & gas and telecommunications sectors. The Fund’s largest country allocations were in the U.K. and France and its smallest allocations were in Ireland and Austria.
| * | | The return shown is based on net asset value calculated for shareholder transactions and may differ from the return shown in the financial highlights, which reflects adjustments made to the net asset value in accordance with accounting principles generally accepted in the United States of America. The net asset value was $27.52 as of October 31, 2018. |
| ** | | Market price return is calculated assuming an initial investment made at the market price at the beginning of the period, reinvestment of all dividends and distributions at market price during the period, and sale at the market price on the last day of the period. The price used to calculate the market price return is the midpoint of the bid/ask spread at the close of business on the NYSE Arca. The midpoint price was $27.68 as of October 31, 2018. |
| *** | | The adviser seeks to achieve the Fund’s objective. There can be no guarantee it will be achieved. |
| | | | | | |
| | | |
| 18 | | | | J.P. MORGAN EXCHANGE-TRADED FUNDS | | OCTOBER 31, 2018 |
| | | | | | | | | | | | |
AVERAGE ANNUAL TOTAL RETURNS AS OF OCTOBER 31, 2018 (Unaudited) | |
| | | INCEPTION DATE | | | 1 YEAR | | | SINCE
INCEPTION | |
| JPMorgan Diversified Return Europe Currency Hedged ETF | | | | | | | | | | | | |
Net Asset Value | | | April 1, 2016 | | | | (3.18)% | | | | 8.68% | |
Market Price | | | | | | | (2.78)% | | | | 8.89% | |
LIFE OF FUND PERFORMANCE (4/01/16 TO 10/31/18)
The performance quoted is past performance and is not a guarantee of future results. Exchange-traded funds are subject to certain market risks. Investment returns and principal value of an investment will fluctuate so that an investor’s shares, when sold or redeemed, may be worth more or less than their original cost. Current performance may be higher or lower than the performance data shown. For up-to-date, month-end performance information please call 1-844-457-6383.
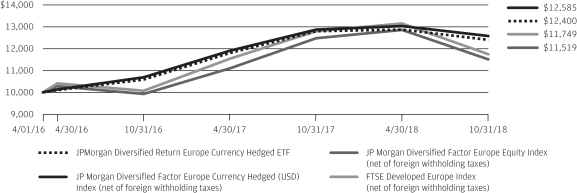
Fund commenced operations on April 1, 2016.
The graph illustrates comparative performance for $10,000 invested in shares of the JPMorgan Diversified Return Europe Currency Hedged ETF, the JP Morgan Diversified Factor Europe Currency Hedged (USD) Index, the JP Morgan Diversified Factor Europe Equity Index, and the FTSE Developed Europe Index from April 1, 2016 to October 31, 2018. The performance of the Fund reflects the deduction of Fund expenses and assumes reinvestment of all dividends and capital gain distributions, if any. The performance of the JP Morgan Diversified Factor Europe Currency Hedged (USD) Index, the JP Morgan Diversified Factor Europe Equity Index, and the FTSE Developed Europe Index does not reflect the deduction of expenses associated with an exchange-traded fund and has been adjusted to reflect reinvestment of all dividends and capital gain distributions of the securities included in the Index, if applicable. The Fund’s adviser is a sponsor of the JP Morgan Diversified Factor Europe Currency Hedged (USD) Index and the JP Morgan Diversified Factor Europe Equity Index and developed the proprietary factors on which the indexes are based. FTSE Russell, the benchmark administrator, administers,
calculates and governs the JP Morgan Diversified Factor Europe Currency Hedged (USD) Index and JP Morgan Diversified Factor Europe Equity Index. The JP Morgan Diversified Factor Europe Currency hedged (USD) Index represents European stock performance with the foreign currency risk of the index securities hedged against the U.S. dollar on a monthly basis. The two JP Morgan indexes include large and mid cap stocks providing coverage of developed European markets. FTSE Developed Europe Index is a market-capitalization weighted index representing the performance of large- and mid-cap companies in developed European markets. Investors cannot invest directly in an index.
Fund performance reflects the waiver of the Fund’s fees and reimbursement of expenses for certain periods since the inception date. Without these waivers and reimbursements, performance would have been lower. Also, performance shown in this section does not reflect the deduction of taxes that a shareholder may pay on Fund distributions or redemption or sale of Fund shares.
International investing involves a greater degree of risk and increased volatility. Changes in currency exchange rates and differences in accounting and taxation policies outside the United States can raise or lower returns. Also, some over-seas markets may not be as politically and economically stable as the United States and other nations.
The returns shown are based on net asset values calculated for shareholder transactions and may differ from the returns shown in the financial highlights, which reflect adjustments made to the net asset values in accordance with accounting principles generally accepted in the United States of America.
| | | | | | | | |
| | | |
| OCTOBER 31, 2018 | | J.P. MORGAN EXCHANGE-TRADED FUNDS | | | | | 19 | |
JPMorgan Diversified Return Europe Equity ETF
FUND COMMENTARY
Twelve Months Ended October 31, 2018 (Unaudited)
| | | | |
| REPORTING PERIOD RETURN: | | | |
JPMorgan Diversified Return Europe Equity ETF | | | | |
Net Asset Value* | | | (8.11)% | |
Market Price** | | | (8.33)% | |
JP Morgan Diversified Factor Europe Equity Index (net of foreign withholding taxes) | | | (7.70)% | |
FTSE Developed Europe Index (net of foreign withholding taxes) | | | (8.25)% | |
MSCI Europe Index (net of foreign withholding taxes) | | | (8.34)% | |
| |
Net Assets as of 10/31/2018 | | $ | 74,820,788 | |
INVESTMENT OBJECTIVE***
The JPMorgan Diversified Return Europe Equity ETF (the “Fund”) seeks investment results that closely correspond, before fees and expenses, to the performance of the JP Morgan Diversified Factor Europe Equity Index (the “Underlying Index”).
INVESTMENT APPROACH
The Fund is passively managed to the Underlying Index, which is composed of large cap and mid cap equity securities of companies in developed Europe, diversified across sectors. The Underlying Index uses a proprietary multifactor security selection process that measures the following characteristics: valuation, momentum and quality. The Underlying Index methodology includes quarterly rebalancing.
HOW DID THE FUND PERFORM?
The Fund posted a negative absolute performance for the twelve months ended October 31, 2018, and performed in line with the Underlying Index, before considering the Fund’s small cash allocation and fees and operating expenses incurred by the Fund. The Fund underperformed the FTSE Developed Europe Index and the MSCI Europe Index, both of which are more traditional market capitalization weighted indexes.
The Fund’s and the Underlying Index’s allocations to the consumer goods and telecommunications sectors were leading detractors from absolute performance, while their allocation to the oil & gas sector made a positive contribution to absolute performance. The Fund’s and the Underlying Index’s allocations to Austria and Italy were leading detractors from absolute performance, while their allocations to Ireland and Finland were leading contributors to absolute performance.
Relative to the FTSE Developed Europe Index, the Fund’s and the Underlying Index’s security selection in the health care and consumer goods sectors was a leading detractor from performance, while the Fund’s and the Underlying Index’s underweight position and security selection in the financials sector and their security selection in the utilities sector were leading contributors to relative performance.
HOW WAS THE FUND POSITIONED?
During the reporting period, the Fund’s and the Underlying Index’s largest sector allocations were in the consumer goods and health care sectors, while its smallest allocations were in the oil & gas and telecommunications sectors. The Fund’s largest country allocations were in the U.K. and France and its smallest allocations were in Ireland and Austria.
| | | | | | |
| | | |
| 20 | | | | J.P. MORGAN EXCHANGE-TRADED FUNDS | | OCTOBER 31, 2018 |
| | | | | | | | |
| TOP TEN EQUITY HOLDINGS OF THE PORTFOLIO**** | |
| | 1. | | | Neste OYJ (Finland) | | | 0.7 | % |
| | 2. | | | Capgemini SE (France) | | | 0.6 | |
| | 3. | | | Novartis AG (Registered) (Switzerland) | | | 0.5 | |
| | 4. | | | Nestle SA (Registered) (Switzerland) | | | 0.5 | |
| | 5. | | | Marine Harvest ASA (Norway) | | | 0.5 | |
| | 6. | | | BT Group plc (United Kingdom) | | | 0.5 | |
| | 7. | | | Sanofi (France) | | | 0.5 | |
| | 8. | | | BP plc (United Kingdom) | | | 0.5 | |
| | 9. | | | AstraZeneca plc (United Kingdom) | | | 0.5 | |
| | 10. | | | Roche Holding AG (Switzerland) | | | 0.5 | |
| | | | |
PORTFOLIO COMPOSITION BY COUNTRY**** | |
United Kingdom | | | 20.7 | % |
France | | | 15.1 | |
Germany | | | 12.4 | |
Switzerland | | | 9.5 | |
Sweden | | | 6.2 | |
Spain | | | 5.3 | |
Netherlands | | | 4.9 | |
Italy | | | 4.6 | |
Finland | | | 4.5 | |
Denmark | | | 4.3 | |
Norway | | | 2.7 | |
Belgium | | | 2.2 | |
Luxembourg | | | 1.3 | |
United States | | | 1.1 | |
Others (each less than 1.0%) | | | 5.2 | |
| * | | The return shown is based on net asset value calculated for shareholder transactions and may differ from the return shown in the financial highlights, which reflects adjustments made to the net asset value in accordance with accounting principles generally accepted in the United States of America. The net asset value was $53.44 as of October 31, 2018. |
| ** | | Market price return is calculated assuming an initial investment made at the market price at the beginning of the period, reinvestment of all dividends and distributions at market price during the period, and sale at the market price on the last day of the period. The price used to calculate the market price return is the midpoint of the bid/ask spread at the close of business on the NYSE Arca. The midpoint price was $53.56 as of October 31, 2018. |
| *** | | The adviser seeks to achieve the Fund’s objective. There can be no guarantee it will be achieved. |
| **** | | Percentages indicated are based on total investments as of October 31, 2018. The Fund’s composition is subject to change. |
| | | | | | | | |
| | | |
| OCTOBER 31, 2018 | | J.P. MORGAN EXCHANGE-TRADED FUNDS | | | | | 21 | |
JPMorgan Diversified Return Europe Equity ETF
FUND COMMENTARY
Twelve Months Ended October 31, 2018 (Unaudited) (continued)
| | | | | | | | | | | | |
AVERAGE ANNUAL TOTAL RETURNS AS OF OCTOBER 31, 2018 (Unaudited) | |
| | | INCEPTION DATE | | | 1 YEAR | | | SINCE
INCEPTION | |
| JPMorgan Diversified Return Europe Equity ETF | | | | | | | | | | | | |
Net Asset Value | | | December 18, 2015 | | | | (8.11)% | | | | 4.98% | |
Market Price | | | | | | | (8.33)% | | | | 5.06% | |
LIFE OF FUND PERFORMANCE (12/18/15 TO 10/31/18)
The performance quoted is past performance and is not a guarantee of future results. Exchange-traded funds are subject to certain market risks. Investment returns and principal value of an investment will fluctuate so that an investor’s shares, when sold or redeemed, may be worth more or less than their original cost. Current performance may be higher or lower than the performance data shown. For up-to-date, month-end performance information please call 1-844-457-6383.
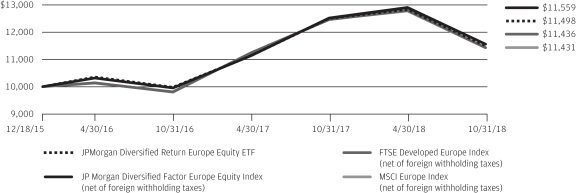
Fund commenced operations on December 18, 2015.
The graph illustrates comparative performance for $10,000 invested in shares of the JPMorgan Diversified Return Europe Equity ETF, the JP Morgan Diversified Factor Europe Equity Index, the FTSE Developed Europe Index, and the MSCI Europe Index from December 18, 2015 to October 31, 2018. The performance of the Fund reflects the deduction of Fund expenses and assumes reinvestment of all dividends and capital gain distributions, if any. The performance of the JP Morgan Diversified Factor Europe Equity Index, the FTSE Developed Europe Index, and the MSCI Europe Index does not reflect the deduction of expenses associated with an exchange-traded fund and has been adjusted to reflect reinvestment of all dividends and capital gain distributions of the securities included in the Index, if applicable. The Fund’s adviser is a sponsor of the JP Morgan Diversified Factor Europe Equity Index and developed the proprietary factors on which the index is based. FTSE Russell, the benchmark administrator, administers, calculates and governs the JP Morgan Diversified Factor Europe Equity Index. The JP Morgan Diversified Factor Europe Equity
Index includes large and mid-cap stocks providing coverage of developed European markets. The FTSE Developed Europe Index is a market-capitalization weighted index representing the performance of large- and mid-cap companies in developed European markets. The MSCI Europe Index is a free float-adjusted market capitalization weighted index that is designed to measure the equity market performance of the developed markets in Europe. Investors cannot invest directly in an index.
Fund performance reflects the waiver of the Fund’s fees and reimbursement of expenses for certain periods since the inception date. Without these waivers and reimbursements, performance would have been lower. Also, performance shown in this section does not reflect the deduction of taxes that a shareholder may pay on Fund distributions or redemption or sale of Fund shares.
International investing involves a greater degree of risk and increased volatility. Changes in currency exchange rates and differences in accounting and taxation policies outside the United States can raise or lower returns. Also, some over-seas markets may not be as politically and economically stable as the United States and other nations.
The returns shown are based on net asset values calculated for shareholder transactions and may differ from the returns shown in the financial highlights, which reflect adjustments made to the net asset values in accordance with accounting principles generally accepted in the United States of America.
| | | | | | |
| | | |
| 22 | | | | J.P. MORGAN EXCHANGE-TRADED FUNDS | | OCTOBER 31, 2018 |
JPMorgan Diversified Return Global Equity ETF
FUND COMMENTARY
Twelve Months Ended October 31, 2018 (Unaudited)
| | | | |
| REPORTING PERIOD RETURN: | | | |
JPMorgan Diversified Return Global Equity ETF | | | | |
Net Asset Value* | | | (4.34)% | |
Market Price** | | | (4.65)% | |
JP Morgan Diversified Factor Global Developed Equity Index (net of foreign withholding taxes) | | | (3.94)% | |
FTSE Developed Index (net of foreign withholding taxes) | | | 0.58% | |
MSCI World Index (net of foreign withholding taxes) | | | 1.16% | |
| |
Net Assets as of 10/31/2018 | | $ | 203,457,264 | |
INVESTMENT OBJECTIVE***
The JPMorgan Diversified Return Global Equity ETF (the “Fund”) seeks investment results that closely correspond, before fees and expenses, to the performance of the JP Morgan Diversified Factor Global Developed Equity Index (the “Underlying Index”).
INVESTMENT APPROACH
The Fund is passively managed to the Underlying Index, which provides exposure to large and mid cap equity securities in developed global markets, diversified across global regions and sectors. At the start of the reporting period, the Underlying Index used a proprietary multi-factor selection process that utilized the following characteristics: valuation, momentum, volatility and market capitalization. From June 15, 2018 to the end of the reporting period, the Underlying Index’s proprietary multi-factor selection process utilized the following characteristics: value, quality and momentum. The Underlying Index’s methodology includes quarterly rebalancing.
HOW DID THE FUND PERFORM?
For the twelve months ended October 31, 2018, the Fund posted a negative absolute performance and performed in line with the Underlying Index, before consideration of specific trading limits, differences in valuations because of the timing of the local market closings and the net asset value calculations, the Fund’s small cash allocation and fees and operating expenses incurred by the Fund. The Fund and the Underlying Index underperformed the FTSE Developed Index (net of foreign withholding taxes) and the MSCI World Index (net of foreign
withholding taxes), both of which are more traditional market capitalization weighted indexes.
The Fund’s and the Underlying Index’s positions in the basic materials and technology sectors were leading detractors from absolute performance, while their positions in the oil & gas and health care sectors were leading contributors to absolute performance.
The Fund’s and the Underlying Index’s allocations to Asia Pacific, excluding Japan, and the U.K. were leading detractors from absolute performance, while their allocation to North America made a positive contribution to absolute performance.
Relative to the FTSE Developed Index, the Fund’s and the Underlying Index’s security selection in the technology and consumer services sectors was a leading detractor from performance. The Fund’s and the Underlying Index’s underweight allocation and security selection in the financials sector and their security selection in the oil & gas sector were leading contributors to relative performance.
HOW WAS THE FUND POSITIONED?
During the reporting period, the Fund’s largest allocation was to North American markets — particularly the U.S. — with modestly smaller allocations to Asia, Japan and Europe. In terms of sectors, the Fund’s largest allocations were in the consumer goods and consumer services sectors, while the smallest allocations were in the telecommunications and oil & gas sectors.
| | | | | | | | |
| | | |
| OCTOBER 31, 2018 | | J.P. MORGAN EXCHANGE-TRADED FUNDS | | | | | 23 | |
JPMorgan Diversified Return Global Equity ETF
FUND COMMENTARY
Twelve Months Ended October 31, 2018 (Unaudited) (continued)
| | | | | | | | |
| TOP TEN EQUITY HOLDINGS OF THE PORTFOLIO**** | |
| | 1. | | | Samsung Electronics Co. Ltd. (South Korea) | | | 0.4 | % |
| | 2. | | | Marine Harvest ASA (Norway) | | | 0.4 | |
| | 3. | | | Showa Shell Sekiyu KK (Japan) | | | 0.3 | |
| | 4. | | | Johnson & Johnson (United States) | | | 0.3 | |
| | 5. | | | Verizon Communications, Inc. (United States) | | | 0.3 | |
| | 6. | | | Church & Dwight Co., Inc. (United States) | | | 0.3 | |
| | 7. | | | Anthem, Inc. (United States) | | | 0.3 | |
| | 8. | | | Pfizer, Inc. (United States) | | | 0.3 | |
| | 9. | | | DTE Energy Co. (United States) | | | 0.3 | |
| | 10. | | | FUJIFILM Holdings Corp. (Japan) | | | 0.3 | |
| | | | |
PORTFOLIO COMPOSITION BY COUNTRY**** | |
United States | | | 25.9 | % |
Japan | | | 22.3 | |
South Korea | | | 8.4 | |
Australia | | | 8.2 | |
Hong Kong | | | 4.0 | |
France | | | 3.8 | |
Canada | | | 3.6 | |
United Kingdom | | | 3.1 | |
Germany | | | 3.0 | |
Sweden | | | 2.5 | |
Singapore | | | 2.2 | |
Switzerland | | | 2.0 | |
Spain | | | 1.9 | |
Netherlands | | | 1.8 | |
Finland | | | 1.1 | |
Norway | | | 1.0 | |
Others (each less than 1.0%) | | | 5.2 | |
| * | | The return shown is based on net asset value calculated for shareholder transactions and may differ from the return shown in the financial highlights, which reflects adjustments made to the net asset value in accordance with accounting principles generally accepted in the United States of America. The net asset value was $56.52 as of October 31, 2018. |
| ** | | Market price return is calculated assuming an initial investment made at the market price at the beginning of the period, reinvestment of all dividends and distributions at market price during the period, and sale at the market price on the last day of the period. The price used to calculate the market price return is the midpoint of the bid/ask spread at the close of business on the NYSE Arca. The midpoint price was $56.47 as of October 31, 2018. |
| *** | | The adviser seeks to achieve the Fund’s objective. There can be no guarantee it will be achieved. |
| **** | | Percentages indicated are based on total investments as of October 31, 2018. The Fund’s composition is subject to change. |
| | | | | | |
| | | |
| 24 | | | | J.P. MORGAN EXCHANGE-TRADED FUNDS | | OCTOBER 31, 2018 |
| | | | | | | | | | | | |
AVERAGE ANNUAL TOTAL RETURNS AS OF OCTOBER 31, 2018 (Unaudited) | |
| | | INCEPTION DATE | | | 1 YEAR | | | SINCE
INCEPTION | |
| JPMorgan Diversified Return Global Equity ETF | | | | | | | | | | | | |
Net Asset Value | | | June 16, 2014 | | | | (4.34)% | | | | 4.73% | |
Market Price | | | | | | | (4.65)% | | | | 4.71% | |
LIFE OF FUND PERFORMANCE (6/16/14 TO 10/31/18)
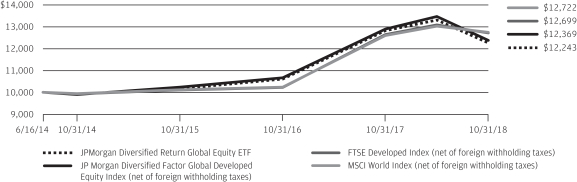
The performance quoted is past performance and is not a guarantee of future results. Exchange-traded funds are subject to certain market risks. Investment returns and principal value of an investment will fluctuate so that an investor’s shares, when sold or redeemed, may be worth more or less than their original cost. Current performance may be higher or lower than the performance data shown. For up-to-date, month-end performance information please call 1-844-457-6383.
Fund commenced operations on June 16, 2014.
The graph illustrates comparative performance for $10,000 invested in shares of the JPMorgan Diversified Return Global Equity ETF, the JP Morgan Diversified Factor Global Developed Equity Index, the FTSE Developed Index, and the MSCI World Index from June 16, 2014 to October 31, 2018. The performance of the Fund reflects the deduction of Fund expenses and assumes reinvestment of all dividends and capital gain distributions, if any. The performance of the JP Morgan Diversified Factor Global Developed Equity Index, the FTSE Developed Index and the MSCI World Index does not reflect the deduction of expenses associated with an exchange-traded fund and has been adjusted to reflect reinvestment of all dividends and capital gain distributions of the securities included in the Index, if applicable. The Fund’s adviser is a sponsor of the JP Morgan Diversified Factor Global Developed Equity Index and developed the proprietary factors on which the index is based. FTSE Russell, the benchmark administrator, administers, calculates and governs the JP Morgan Diversified
Factor Global Developed Equity Index. The FTSE Developed Index is a market-capitalization weighted index representing the performance of large- and mid-cap companies in developed markets. The index is derived from the FTSE Global Equity Index Series (GEIS), which covers 98% of the world’s investable market capitalization. The MSCI World Index is a free float-adjusted market capitalization weighted index that is designed to measure the equity market performance of developed markets. Investors can not invest directly in an index.
Fund performance reflects the waiver of the Fund’s fees and reimbursement of expenses for certain periods since the inception date. Without these waivers and reimbursements, performance would have been lower. Also, performance shown in this section does not reflect the deduction of taxes that a shareholder may pay on Fund distributions or redemption or sale of Fund shares.
International investing involves a greater degree of risk and increased volatility. Changes in currency exchange rates and differences in accounting and taxation policies outside the United States can raise or lower returns. Also, some over-seas markets may not be as politically and economically stable as the United States and other nations.
The returns shown are based on net asset values calculated for shareholder transactions and may differ from the returns shown in the financial highlights, which reflect adjustments made to the net asset values in accordance with accounting principles generally accepted in the United States of America.
| | | | | | | | |
| | | |
| OCTOBER 31, 2018 | | J.P. MORGAN EXCHANGE-TRADED FUNDS | | | | | 25 | |
JPMorgan Diversified Return International Currency Hedged ETF
FUND COMMENTARY
Twelve Months Ended October 31, 2018 (Unaudited)
| | | | |
| REPORTING PERIOD RETURN: | | | |
| JPMorgan Diversified Return International Currency Hedged ETF | | | | |
| Net Asset Value* | | | (3.42)% | |
| Market Price** | | | (3.28)% | |
| JP Morgan Diversified Factor International Currency Hedged (USD) Index (net of foreign withholding taxes) | | | (2.30)% | |
| JP Morgan Diversified Factor International Equity Index (net of foreign withholding taxes) | | | (6.30)% | |
| FTSE Developed ex North America Index (net of foreign withholding taxes) | | | (7.53)% | |
| |
| Net Assets as of 4/30/2018 | | $ | 31,366,788 | |
INVESTMENT OBJECTIVE***
The JPMorgan Diversified Return International Currency Hedged ETF (the “Fund”) seeks investment results that closely correspond, before fees and expenses, to the performance of the JP Morgan Diversified Factor International Currency Hedged (USD) Index (the “Underlying Index”).
INVESTMENT APPROACH
The Fund is passively managed to the Underlying Index, which is composed of large and mid cap equity securities in developed markets outside North America. The Underlying Index began the reporting period using a proprietary multi-factor selection process that utilized the following characteristics: valuation, momentum, volatility and market capitalization. From June 15, 2018 to the end of the reporting period, the Underlying Index’s proprietary multi-factor selection process utilized the following characteristics: value, quality and momentum.
In addition to reflecting international stock performance, the Underlying Index attempts to minimize the impact of exchange rate fluctuations by hedging currency exposure against the U.S. dollar on a monthly basis. The Fund seeks to achieve its investment objective by investing a substantial portion of its assets in the JPMorgan Diversified Return International Equity ETF.
HOW DID THE FUND PERFORM?
The Fund posted a negative absolute return for the twelve months ended October 31, 2018, and performed in line with the Underlying Index, before considering differences in performance of the currency hedge, the Fund’s small cash allocation and fees and operating expenses incurred by the Fund.
The Fund and the Underlying Index outperformed the non-hedged JP Morgan Diversified Factor International Equity Index and the FTSE Developed ex North America Index, which is a traditional market capitalization weighted index that is not hedged to the U.S. dollar. The Fund’s and the Underlying Index’s currency hedge, using currency forward contracts, helped performance as the U.S. dollar strengthened against most other currencies during the reporting period.
The Fund’s and the Underlying Index’s positions in the technology and basic materials sectors were leading detractors from absolute performance, while their positions in the oil & gas and health care sectors were leading contributors to absolute performance.
Relative to FTSE Developed ex North America Index, the Fund’s and the Underlying Index’s security selection and underweight position in the financials sector and its security selection in the utilities sector were leading contributors to performance, while the Fund’s and the Underlying Index’s security selection in the basic materials and technologies sectors was a leading detractor from relative performance.
HOW WAS THE FUND POSITIONED?
During the reporting period, the Fund’s largest allocations were in the consumer goods and consumer services sectors, while the smallest allocations were in the oil & gas and telecommunications sectors. By region, the Fund’s largest allocations were in the Asia Pacific, excluding Japan, with modestly smaller allocations to Japan and Europe, excluding the U.K.
| | | | | | |
| | | |
| 26 | | | | J.P. MORGAN EXCHANGE-TRADED FUNDS | | OCTOBER 31, 2018 |
| * | | The return shown is based on net asset value calculated for shareholder transactions and may differ from the return shown in the financial highlights, which reflects adjustments made to the net asset value in accordance with accounting principles generally accepted in the United States of America. The net asset value was $28.52 as of October 31, 2018. |
| ** | | Market price return is calculated assuming an initial investment made at the market price at the beginning of the period, |
| | reinvestment of all dividends and distributions at market price during the period, and sale at the market price on the last day of the period. The price used to calculate the market price return is the midpoint of the bid/ask spread at the close of business on the NYSE Arca. The midpoint price was $28.41 as of October 31, 2018. |
| *** | | The adviser seeks to achieve the Fund’s objective. There can be no guarantee it will be achieved. |
| | | | | | | | |
| | | |
| OCTOBER 31, 2018 | | J.P. MORGAN EXCHANGE-TRADED FUNDS | | | | | 27 | |
JPMorgan Diversified Return International Currency Hedged ETF
FUND COMMENTARY
Twelve Months Ended October 31, 2018 (Unaudited) (continued)
| | | | | | | | | | | | |
AVERAGE ANNUAL TOTAL RETURNS AS OF OCTOBER 31, 2018 (Unaudited) | |
| | | INCEPTION DATE | | | 1 YEAR | | | SINCE
INCEPTION | |
| JPMorgan Diversified Return International Currency Hedged ETF | | | | | | | | | | | | |
Net Asset Value | | | April 1, 2016 | | | | (3.42)% | | | | 8.02% | |
Market Price | | | | | | | (3.28)% | | | | 7.86% | |
LIFE OF FUND PERFORMANCE (4/01/16 TO 10/31/18)
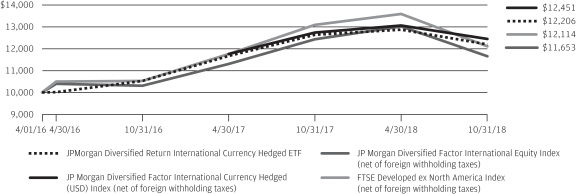
The performance quoted is past performance and is not a guarantee of future results. Exchange-traded funds are subject to certain market risks. Investment returns and principal value of an investment will fluctuate so that an investor’s shares, when sold or redeemed, may be worth more or less than their original cost. Current performance may be higher or lower than the performance data shown. For up-to-date, month-end performance information please call 1-844-457-6383.
Fund commenced operations on April 1, 2016.
The graph illustrates comparative performance for $10,000 invested in shares of the JPMorgan Diversified Return International Currency Hedged ETF, the JP Morgan Diversified Factor International Currency Hedged (USD) Index, the JP Morgan Diversified Factor International Equity Index, and the FTSE Developed ex North America Index from April 1, 2016 to October 31, 2018. The performance of the Fund reflects the deduction of Fund expenses and assumes reinvestment of all dividends and capital gain distributions, if any. The performance of the JP Morgan Diversified Factor International Currency Hedged (USD) Index, the JP Morgan Diversified Factor International Equity Index, and the FTSE Developed ex North America Index does not reflect the deduction of expenses associated with an exchange-traded fund and has been adjusted to reflect reinvestment of all dividends and capital gain distributions of the securities included in the Index, if applicable. The Fund’s adviser is a sponsor of the JP Morgan Diversified Factor International Currency Hedged (USD) Index and the JP Morgan Diversified Factor International Equity Index and developed the proprietary factors on which the indexes are based. FTSE Russell, the benchmark administrator, administers, calculates and governs the JP Morgan Diversified Factor International Currency Hedged (USD) Index and JP Morgan
Diversified Factor International Equity Index. The JP Morgan Diversified Factor International Currency Hedged (USD) Index represents international stock performance with the foreign currency risk of the index securities hedged against the U.S. dollar on a monthly basis. These two indexes include large- and mid-cap stocks providing coverage of developed markets outside of North America. The FTSE Developed ex North America Index is a market-capitalization weighted index representing the performance of large- and mid-cap stocks in developed markets, excluding the US and Canada. The index is derived from the FTSE Global Equity Index Series (GEIS), which covers 98% of the world’s investable market capitalization.
Fund performance reflects the waiver of the Fund’s fees and reimbursement of expenses for certain periods since the inception date. Without these waivers and reimbursements, performance would have been lower. Also, performance shown in this section does not reflect the deduction of taxes that a shareholder may pay on Fund distributions or redemption or sale of Fund shares.
International investing involves a greater degree of risk and increased volatility. Changes in currency exchange rates and differences in accounting and taxation policies outside the United States can raise or lower returns. Also, some over-seas markets may not be as politically and economically stable as the United States and other nations.
The returns shown are based on net asset values calculated for shareholder transactions and may differ from the returns shown in the financial highlights, which reflect adjustments made to the net asset values in accordance with accounting principles generally accepted in the United States of America.
| | | | | | |
| | | |
| 28 | | | | J.P. MORGAN EXCHANGE-TRADED FUNDS | | OCTOBER 31, 2018 |
JPMorgan Diversified Return International Equity ETF
FUND COMMENTARY
Twelve Months Ended October 31, 2018 (Unaudited)
| | | | |
| REPORTING PERIOD RETURN: | | | |
| JPMorgan Diversified Return International Equity ETF | | | | |
| Net Asset Value* | | | (6.72)% | |
| Market Price** | | | (7.22)% | |
| JP Morgan Diversified Factor International Equity Index (net of foreign withholding taxes) | | | (6.30)% | |
| FTSE Developed ex North America Index (net of foreign withholding taxes) | | | (7.53)% | |
| MSCI EAFE Index (net of foreign withholding taxes) | | | (6.85)% | |
| |
| Net Assets as of 10/31/2018 | | $ | 1,444,332,261 | |
INVESTMENT OBJECTIVE***
The JPMorgan Diversified Return International Equity ETF (the “Fund”) seeks investment results that closely correspond, before fees and expenses, to the performance of the JP Morgan Diversified Factor International Equity Index (the “Underlying Index”).
INVESTMENT APPROACH
The Fund is passively managed to the Underlying Index, which is composed of large cap and mid cap equity securities in developed markets outside North America, diversified across sectors and international regions. At the start of the reporting period, the Underlying Index used a proprietary multi-factor selection process that utilized the following characteristics: valuation, momentum, volatility and specific market capitalization. From June 15, 2018 to the end of the reporting period, the Underlying Index’s proprietary multi-factor selection process utilized the following characteristics: value, quality and momentum. The Underlying Index methodology includes quarterly rebalancing.
HOW DID THE FUND PERFORM?
The Fund posted a negative absolute performance for the twelve months ended October 31, 2018, and performed in line with the Underlying Index, before considering differences due to specific trading limits the net asset value calculations, the Fund’s small cash allocation and fees and operating expenses incurred by the Fund.
The Fund and the Underlying Index outperformed the FTSE Developed ex North America Index and the Fund underperformed the MSCI EAFE Index. Both of these indexes are more traditional market capitalization weighted indexes.
The Fund’s and the Underlying Index’s positions in the technology and basic materials sectors were leading detractors from absolute performance, while their positions in the oil & gas and health care sectors were leading contributors to absolute performance.
Relative to FTSE Developed ex North America Index, the Fund’s and the Underlying Index’s security selection and underweight position in the financials sector and its security selection in the utilities sector were leading contributors to performance, while the Fund’s and the Underlying Index’s security selection in the basic materials and technologies sectors was a leading detractor from relative performance.
HOW WAS THE FUND POSITIONED?
During the reporting period, the Fund’s largest allocations were in the consumer goods and consumer services sectors, while the smallest allocations were in the oil & gas and telecommunications sectors. By region, the Fund’s largest allocations were in the Asia Pacific, excluding Japan, with modestly smaller allocations to Japan and Europe, excluding the U.K.
| | | | | | | | |
| | | |
| OCTOBER 31, 2018 | | J.P. MORGAN EXCHANGE-TRADED FUNDS | | | | | 29 | |
JPMorgan Diversified Return International Equity ETF
FUND COMMENTARY
Twelve Months Ended October 31, 2018 (Unaudited) (continued)
| | | | | | | | |
| TOP TEN EQUITY HOLDINGS OF THE PORTFOLIO**** | |
| | 1. | | | Marine Harvest ASA (Norway) | | | 0.5 | % |
| | 2. | | | Shire plc (United States) | | | 0.5 | |
| | 3. | | | AstraZeneca plc (United Kingdom) | | | 0.4 | |
| | 4. | | | SK Innovation Co. Ltd. (South Korea) | | | 0.4 | |
| | 5. | | | COMSYS Holdings Corp. (Japan) | | | 0.4 | |
| | 6. | | | SK Telecom Co. Ltd. (South Korea) | | | 0.4 | |
| | 7. | | | Centrica plc (United Kingdom) | | | 0.4 | |
| | 8. | | | Chr Hansen Holding A/S (Denmark) | | | 0.4 | |
| | 9. | | | Alfresa Holdings Corp. (Japan) | | | 0.4 | |
| | 10. | | | Japan Airlines Co. Ltd. (Japan) | | | 0.4 | |
| | | | |
SUMMARY OF INVESTMENTS BY COUNTRY**** | |
| Japan | | | 25.1 | % |
| United Kingdom | | | 16.5 | |
| South Korea | | | 9.3 | |
| Australia | | | 9.0 | |
| Hong Kong | | | 5.5 | |
| France | | | 5.5 | |
| Germany | | | 3.9 | |
| Sweden | | | 3.3 | |
| Singapore | | | 2.6 | |
| Netherlands | | | 2.5 | |
| Switzerland | | | 2.4 | |
| Finland | | | 1.9 | |
| Spain | | | 1.8 | |
| Norway | | | 1.6 | |
| Italy | | | 1.3 | |
| Belgium | | | 1.1 | |
| Others (each less than 1.0%) | | | 6.7 | |
| * | | The return shown is based on net asset value calculated for shareholder transactions and may differ from the return shown in the financial highlights, which reflects adjustments made to the net asset value in accordance with accounting principles generally accepted in the United States of America. The net asset value was $53.10 as of October 31, 2018. |
| ** | | Market price return is calculated assuming an initial investment made at the market price at the beginning of the period, reinvestment of all dividends and distributions at market price during the period, and sale at the market price on the last day of the period. The price used to calculate the market price return is the midpoint of the bid/ask spread at the close of business on the NYSE Arca. The midpoint price was $52.98 as of October 31, 2018. |
| *** | | The adviser seeks to achieve the Fund’s objective. There can be no guarantee it will be achieved. |
| **** | | Percentages indicated are based on total investments as of October 31, 2018. The Fund’s composition is subject to change. |
| | | | | | |
| | | |
| 30 | | | | J.P. MORGAN EXCHANGE-TRADED FUNDS | | OCTOBER 31, 2018 |
| | | | | | | | | | | | |
AVERAGE ANNUAL TOTAL RETURNS AS OF OCTOBER 31, 2018 (Unaudited) | |
| | | INCEPTION DATE | | | 1 YEAR | | | SINCE
INCEPTION | |
| JPMorgan Diversified Return International Equity ETF | | | | | | | | | | | | |
Net Asset Value | | | November 5, 2014 | | | | (6.72)% | | | | 3.58% | |
Market Price | | | | | | | (7.22)% | | | | 3.51% | |
LIFE OF FUND PERFORMANCE (11/5/14 TO 10/31/18)
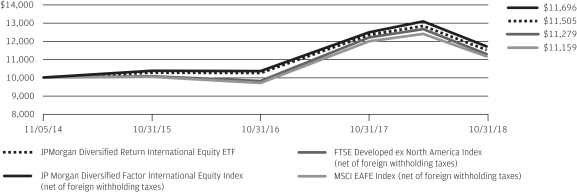
The performance quoted is past performance and is not a guarantee of future results. Exchange-traded funds are subject to certain market risks. Investment returns and principal value of an investment will fluctuate so that an investor’s shares, when sold or redeemed, may be worth more or less than their original cost. Current performance may be higher or lower than the performance data shown. For up-to-date, month-end performance information please call 1-844-457-6383.
Fund commenced operations on November 5, 2014.
The graph illustrates comparative performance for $10,000 invested in shares of the JPMorgan Diversified Return International Equity ETF, the JP Morgan Diversified Factor International Equity Index, the FTSE Developed ex North America Index, and the MSCI EAFE Index from November 5, 2014 to October 31, 2018. The performance of the Fund reflects the deduction of Fund expenses and assumes reinvestment of all dividends and capital gain distributions, if any. The performance of the JP Morgan Diversified Factor International Equity Index, the FTSE Developed ex North America Index and the MSCI EAFE Index does not reflect the deduction of expenses associated with an exchange-traded fund and has been adjusted to reflect reinvestment of all dividends and capital gain distributions of the securities included in the Index, if applicable. The Fund’s adviser is a sponsor of the JP Morgan Diversified Factor International Equity Index and developed the proprietary factors on which the index is based. FTSE Russell, the benchmark administrator, administers, calculates and governs the JP Morgan Diversified Factor International Equity Index. The FTSE Developed ex North America Index is
a market-capitalization weighted index representing the performance of large- and mid-cap stocks in developed markets, excluding the U.S. and Canada. The index is derived from the FTSE Global Equity Index Series (GEIS), which covers 98% of the world’s investable market capitalization. The MSCI EAFE Index is a free float-adjusted market capitalization weighted index that is designed to measure the equity market performance of developed markets, excluding the U.S. and Canada. Investors cannot invest directly in an index.
Fund performance reflects the waiver of the Fund’s fees and reimbursement of expenses for certain periods since the inception date. Without these waivers and reimbursements, performance would have been lower. Also, performance shown in this section does not reflect the deduction of taxes that a shareholder may pay on Fund distributions or redemption or sale of Fund shares.
International investing involves a greater degree of risk and increased volatility. Changes in currency exchange rates and differences in accounting and taxation policies outside the United States can raise or lower returns. Also, some overseas markets may not be as politically and economically stable as the United States and other nations.
The returns shown are based on net asset values calculated for shareholder transactions and may differ from the returns shown in the financial highlights, which reflect adjustments made to the net asset values in accordance with accounting principles generally accepted in the United States of America.
| | | | | | | | |
| | | |
| OCTOBER 31, 2018 | | J.P. MORGAN EXCHANGE-TRADED FUNDS | | | | | 31 | |
JPMorgan Diversified Return U.S. Equity ETF
FUND COMMENTARY
Twelve Months Ended October 31, 2018 (Unaudited)
| | | | |
| Reporting Period Return: | |
| JPMorgan Diversified Return U.S. Equity ETF | | | | |
| Net Asset Value* | | | 4.74% | |
| Market Price** | | | 4.70% | |
| JP Morgan Diversified Factor US Equity Index | | | 5.10% | |
| Russell 1000 Index | | | 6.98% | |
| |
| Net Assets as of 10/31/2018 | | $ | 559,362,329 | |
INVESTMENT OBJECTIVE***
The JPMorgan Diversified Return U.S. Equity ETF (the “Fund”) seeks investment results that closely correspond, before fees and expenses, to the performance of the JP Morgan Diversified Factor US Equity Index (the “Underlying Index”).
INVESTMENT APPROACH
The Fund is passively managed to the Underlying Index, which is composed of large cap and mid cap equity securities of U.S. companies. The Underlying Index uses a rules based proprietary multi-factor selection process that utilizes the following characteristics: valuation, momentum and quality. During the reporting period, the Underlying Index security selection process sought to exclude the least attractive stocks based on these characteristics. The Underlying Index’s methodology includes quarterly rebalancing.
HOW DID THE FUND PERFORM?
The Fund posted a positive absolute performance for the twelve months ended October 31, 2018 and performed in line with the Underlying Index, before considering operating expenses, fees and tax management of the Fund’s portfolio. Both the Fund and the Underlying Index underperformed the Russell 1000 Index, which is a more traditional market capitalization weighted index.
During the reporting period, the Fund’s and the Underlying Index’s positions in the consumer services and health care sectors were leading contributors to absolute performance, while the Fund’s and the Underlying Index’s position in the basic materials sector detracted from absolute performance.
Relative to the Russell 1000 Index, the Fund’s and the Underlying Index’s overweight position in the basic materials sector and their security selection and underweight position in the technology sector were leading detractors from performance, while their security selection in the industrials and oil & gas sectors was a leading contributor to relative performance.
HOW WAS THE FUND POSITIONED?
During the reporting period, the Fund’s and the Underlying Index’s largest allocations were in the consumer goods and health care sectors, while the smallest allocations were in the telecommunications and oil & gas sectors.
| | | | | | |
| | | |
| 32 | | | | J.P. MORGAN EXCHANGE-TRADED FUNDS | | OCTOBER 31, 2018 |
| | | | | | | | |
| TOP TEN EQUITY HOLDINGS OF THE PORTFOLIO**** | |
| | 1. | | | Marathon Petroleum Corp. | | | 0.5 | % |
| | 2. | | | McCormick & Co., Inc. (Non-Voting) | | | 0.5 | |
| | 3. | | | Hormel Foods Corp. | | | 0.5 | |
| | 4. | | | AES Corp. | | | 0.5 | |
| | 5. | | | Procter & Gamble Co. (The) | | | 0.5 | |
| | 6. | | | Coca-Cola Co. (The) | | | 0.5 | |
| | 7. | | | Verizon Communications, Inc. | | | 0.4 | |
| | 8. | | | Church & Dwight Co., Inc. | | | 0.4 | |
| | 9. | | | Linde plc | | | 0.4 | |
| | 10. | | | Johnson & Johnson | | | 0.4 | |
| | | | |
PORTFOLIO COMPOSITION BY SECTOR**** | |
Consumer Goods | | | 14.3 | % |
Consumer Services | | | 12.4 | |
Financials | | | 12.3 | |
Health Care | | | 12.1 | |
Utilities | | | 11.6 | |
Industrials | | | 10.8 | |
Technology | | | 9.3 | |
Basic Materials | | | 8.0 | |
Oil & Gas | | | 5.0 | |
Telecommunications | | | 2.2 | |
Short-Term Investment | | | 1.2 | |
Investment of cash collateral from securities loaned | | | 0.8 | |
| * | | The return shown is based on net asset value calculated for shareholder transactions and may differ from the return shown in the financial highlights, which reflects adjustments made to the net asset value in accordance with accounting principles generally accepted in the United States of America. The net asset value was $69.92 as of October 31, 2018. |
| ** | | Market price return is calculated assuming an initial investment made at the market price at the beginning of the period, reinvestment of all dividends and distributions at market price during the period, and sale at the market price on the last day of the period. The price used to calculate the market price return is the midpoint of the bid/ask spread at the close of business on the NYSE Arca. The midpoint price was $69.93 as of October 31, 2018. |
| *** | | The adviser seeks to achieve the Fund’s objective. There can be no guarantee it will be achieved. |
| **** | | Percentages indicated are based on total investments as of October 31, 2018. The Fund’s composition is subject to change. |
| | | | | | | | |
| | | |
| OCTOBER 31, 2018 | | J.P. MORGAN EXCHANGE-TRADED FUNDS | | | | | 33 | |
JPMorgan Diversified Return U.S. Equity ETF
FUND COMMENTARY
Twelve Months Ended October 31, 2018 (Unaudited) (continued)
| | | | | | | | | | | | |
AVERAGE ANNUAL TOTAL RETURNS AS OF OCTOBER 31, 2018 (Unaudited) | |
| | | INCEPTION DATE | | | 1 YEAR | | | SINCE
INCEPTION | |
| JPMorgan Diversified Return U.S. Equity ETF | | | | | | | | | | | | |
Net Asset Value | | | September 29, 2015 | | | | 4.74% | | | | 12.87% | |
Market Price | | | | | | | 4.70% | | | | 12.87% | |
LIFE OF FUND PERFORMANCE (9/29/15 TO 10/31/18)
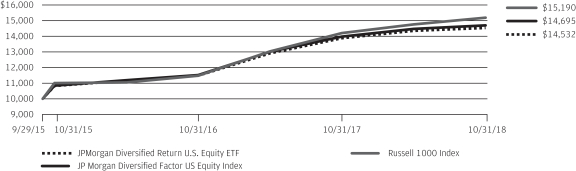
The performance quoted is past performance and is not a guarantee of future results. Exchange-traded funds are subject to certain market risks. Investment returns and principal value of an investment will fluctuate so that an investor’s shares, when sold or redeemed, may be worth more or less than their original cost. Current performance may be higher or lower than the performance data shown. For up-to-date, month-end performance information please call 1-844-457-6383.
Fund commenced operations on September 29, 2015.
The graph illustrates comparative performance for $10,000 invested in shares of the JPMorgan Diversified Return U.S. Equity ETF, the JP Morgan Diversified Factor US Equity Index, and the Russell 1000 Index from September 29, 2015 to October 31, 2018. The performance of the Fund reflects the deduction of Fund expenses and assumes reinvestment of all dividends and capital gain distributions, if any. The performance of the JP Morgan Diversified Factor US Equity Index and Russell 1000 Index does not reflect the deduction of expenses associated with an exchange-traded fund and has been adjusted to reflect reinvestment of all dividends and capital gain distributions of the securities
included in the Index, if applicable. The Fund’s adviser is a sponsor of the JP Morgan Diversified Factor US Equity Index and developed the proprietary factors on which the index is based. FTSE Russell, the benchmark administrator, administers, calculates and governs the JP Morgan Diversified Factor US Equity Index. The Russell 1000 Index is a market-capitalization weighted index, which measures the performance of the 1,000 largest companies in the Russell 3000 Index. Investors cannot invest directly in an index.
Fund performance reflects the waiver of the Fund’s fees and reimbursement of expenses for certain periods since the inception date. Without these waivers and reimbursements, performance would have been lower. Also, performance shown in this section does not reflect the deduction of taxes that a shareholder may pay on Fund distributions or redemption or sale of Fund shares.
The returns shown are based on net asset values calculated for shareholder transactions and may differ from the returns shown in the financial highlights, which reflect adjustments made to the net asset values in accordance with accounting principles generally accepted in the United States of America.
| | | | | | |
| | | |
| 34 | | | | J.P. MORGAN EXCHANGE-TRADED FUNDS | | OCTOBER 31, 2018 |
JPMorgan Diversified Return U.S. Mid Cap Equity ETF
FUND COMMENTARY
Twelve Months Ended October 31, 2018 (Unaudited)
| | | | |
| REPORTING PERIOD RETURN: | |
| JPMorgan Diversified Return U.S. Mid Cap Equity ETF | | | | |
Net Asset Value* | | | 2.59% | |
Market Price** | | | 2.57% | |
JP Morgan Diversified Factor US Mid Cap Equity Index | | | 2.78% | |
Russell Midcap Index | | | 2.80% | |
| |
Net Assets as of 10/31/2018 | | $ | 112,028,180 | |
INVESTMENT OBJECTIVE***
The JPMorgan Diversified Return U.S. Mid Cap Equity ETF (the “Fund”) seeks investment results that closely correspond, before fees and expenses, to the performance of the JP Morgan Diversified Factor US Mid Cap Equity Index (the “Underlying Index”).
INVESTMENT APPROACH
The Fund is passively managed to the Underlying Index, which tracks mid cap equity securities of U.S. companies. The Underlying Index uses a proprietary multi-factor selection process that utilizes the following characteristics: relative valuation, momentum and quality. The Underlying Index’s methodology includes quarterly rebalancing.
HOW DID THE FUND PERFORM?
The Fund posted a positive absolute performance for the twelve months ended October 31, 2018 and performed in line with the Underlying Index, before considering operating expenses, fees and tax management of the Fund’s portfolio. The Fund and the Underlying Index underperformed the Russell Midcap Index, which is a more traditional market capitalization weighted index.
During the reporting period, the Fund’s and the Underlying Index’s positions in the health care and consumer services sectors were leading contributors to absolute performance, while the Fund’s and the Underlying Index’s positions in the basic materials and telecommunications sectors detracted from absolute performance.
Relative to the Russell Midcap Index, the Fund’s and the Underlying Index’s overweight positions in the basic materials and utilities sectors were leading detractors from performance, while their security selection and overweight position in the health care sector and their underweight position in the financials sector were leading contributors to performance.
HOW WAS THE FUND POSITIONED?
During the reporting period, the Fund’s and the Underlying Index’s largest allocations were in the industrials and financials sectors and the smallest allocations were in the telecommunications and oil & gas sectors.
| | | | | | | | |
| | | |
| OCTOBER 31, 2018 | | J.P. MORGAN EXCHANGE-TRADED FUNDS | | | | | 35 | |
JPMorgan Diversified Return U.S. Mid Cap Equity ETF
FUND COMMENTARY
Twelve Months Ended October 31, 2018 (Unaudited) (continued)
| | | | | | | | |
| TOP TEN EQUITY HOLDINGS OF THE PORTFOLIO**** | |
| | 1. | | | McCormick & Co., Inc. (Non-Voting) | | | 0.5 | % |
| | 2. | | | Edison International | | | 0.5 | |
| | 3. | | | Church & Dwight Co., Inc. | | | 0.5 | |
| | 4. | | | CDW Corp. | | | 0.4 | |
| | 5. | | | Clorox Co. (The) | | | 0.4 | |
| | 6. | | | PPL Corp. | | | 0.4 | |
| | 7. | | | Xcel Energy, Inc. | | | 0.4 | |
| | 8. | | | Ameren Corp. | | | 0.4 | |
| | 9. | | | Eversource Energy | | | 0.4 | |
| | 10. | | | WEC Energy Group, Inc. | | | 0.4 | |
| | | | |
PORTFOLIO COMPOSITION BY SECTOR**** | |
Financials | | | 13.6 | % |
Consumer Goods | | | 13.6 | |
Consumer Services | | | 13.0 | |
Health Care | | | 11.9 | |
Industrials | | | 11.3 | |
Utilities | | | 10.2 | |
Technology | | | 10.0 | |
Basic Materials | | | 7.1 | |
Oil & Gas | | | 4.4 | |
Telecommunications | | | 1.1 | |
Short-Term Investment | | | 3.2 | |
Investment of cash collateral from securities loaned | | | 0.6 | |
| * | | The return shown is based on net asset value calculated for shareholder transactions and may differ from the return shown in the financial highlights, which reflects adjustments made to the net asset value in accordance with accounting principles generally accepted in the United States of America. The net asset value was $62.24 as of October 31, 2018. |
| ** | | Market price return is calculated assuming an initial investment made at the market price at the beginning of the period, reinvestment of all dividends and distributions at market price during the period, and sale at the market price on the last day of the period. The price used to calculate the market price return is the midpoint of the bid/ask spread at the close of business on the NYSE Arca. The midpoint price was $62.25 as of October 31, 2018. |
| *** | | The adviser seeks to achieve the Fund’s objective. There can be no guarantee it will be achieved. |
| **** | | Percentages indicated are based on total investments as of October 31, 2018. The Fund’s composition is subject to change. |
| | | | | | |
| | | |
| 36 | | | | J.P. MORGAN EXCHANGE-TRADED FUNDS | | OCTOBER 31, 2018 |
| | | | | | | | | | | | |
AVERAGE ANNUAL TOTAL RETURNS AS OF OCTOBER 31, 2018 (Unaudited) | |
| | | INCEPTION DATE | | | 1 YEAR | | | SINCE
INCEPTION | |
JPMorgan Diversified Return U.S. Mid Cap Equity ETF | | | | | | | | | | | | |
Net Asset Value | | | May 11, 2016 | | | | 2.59% | | | | 10.66% | |
Market Price | | | | | | | 2.57% | | | | 10.67% | |
LIFE OF FUND PERFORMANCE (5/11/16 TO 10/31/18)
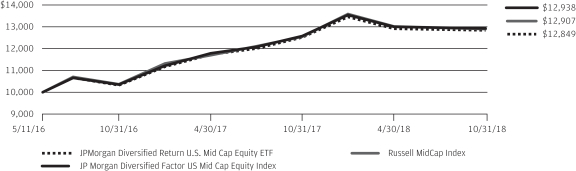
The performance quoted is past performance and is not a guarantee of future results. Exchange-traded funds are subject to certain market risks. Investment returns and principal value of an investment will fluctuate so that an investor’s shares, when sold or redeemed, may be worth more or less than their original cost. Current performance may be higher or lower than the performance data shown. For up-to-date, month-end performance information please call 1-844-457-6383.
Fund commenced operations on May 11, 2016.
The graph illustrates comparative performance for $10,000 invested in shares of the JPMorgan Diversified Return U.S. Mid Cap Equity ETF, JP Morgan Diversified Factor US Mid Cap Equity Index, and the Russell Midcap Index from May 11, 2016 to October 31, 2018. The performance of the Fund reflects the deduction of Fund expenses and assumes reinvestment of all dividends and capital gain distributions, if any. The performance of the JP Morgan Diversified Factor US Mid Cap Equity Index and Russell Midcap Index does not reflect the deduction of expenses associated with an exchange-traded fund and has been adjusted to reflect reinvestment of all dividends and capital gain distributions of the
securities included in the Index, if applicable. The Fund’s adviser is a sponsor of the JP Morgan Diversified Factor US Mid Cap Equity Index and developed the proprietary factors on which the index is based. FTSE Russell, the benchmark administrator, administers, calculates and governs the JP Morgan Diversified Factor US Mid Cap Equity Index. The Russell Midcap Index is a market-capitalization weighted index which measures the performance of the 800 smallest companies in the Russell 1000 Index. Investors cannot invest directly in an index.
Fund performance reflects the waiver of the Fund’s fees and reimbursement of expenses for certain periods since the inception date. Without these waivers and reimbursements, performance would have been lower. Also, performance shown in this section does not reflect the deduction of taxes that a shareholder may pay on Fund distributions or redemption or sale of Fund shares.
The returns shown are based on net asset values calculated for shareholder transactions and may differ from the returns shown in the financial highlights, which reflect adjustments made to the net asset values in accordance with accounting principles generally accepted in the United States of America.
| | | | | | | | |
| | | |
| OCTOBER 31, 2018 | | J.P. MORGAN EXCHANGE-TRADED FUNDS | | | | | 37 | |
JPMorgan Diversified Return U.S. Small Cap Equity ETF
FUND COMMENTARY
Twelve Months Ended October 31, 2018 (Unaudited)
| | | | |
| REPORTING PERIOD RETURN: | |
| JPMorgan Diversified Return U.S. Small Cap Equity ETF | | | | |
Net Asset Value* | | | 3.61% | |
Market Price** | | | 3.43% | |
JP Morgan Diversified Factor US Small Cap Equity Index | | | 3.94% | |
Russell 2000 Index | | | 1.85% | |
| |
Net Assets as of 10/31/2018 | | $ | 96,135,254 | |
INVESTMENT OBJECTIVE***
The JPMorgan Diversified Return U.S. Small Cap Equity ETF (the “Fund”) seeks investment results that closely correspond, before fees and expenses, to the performance of the JP Morgan Diversified Factor US Small Cap Equity Index (the “Underlying Index”).
INVESTMENT APPROACH
The Fund is passively managed to the Underlying Index, which tracks small cap equity securities of U.S. companies. The Underlying Index uses a proprietary multi-factor selection process that utilizes the following characteristics: relative valuation, momentum and quality. The Underlying Index security selection process seeks to exclude the least attractive stocks based on these characteristics. The Underlying Index’s methodology includes quarterly rebalancing.
HOW DID THE FUND PERFORM?
The Fund posted a positive absolute performance for the twelve months ended October 31, 2018 and performed in line with the Underlying Index, before considering operating expenses, fees and tax management of the Fund’s portfolio. Both the Fund and the Underlying Index outperformed the
Russell 2000 Index, which is a more traditional market capitalization weighted index.
During the reporting period, the Fund’s and the Underlying Index’s positions in the telecommunications and consumer services sectors were leading contributors to absolute performance, while the Fund’s and the Underlying Index’s positions in the basic materials and industrials sectors detracted from absolute performance during the reporting period.
Relative to the Russell 2000 Index, the Fund’s and the Underlying Index’s security selection and overweight position in the consumer services sector and their underweight position in the financials sector were leading contributors to performance, while their security selection and overweight position in the basic materials sector and their overweight position in the utilities sector were leading detractors from performance.
HOW WAS THE FUND POSITIONED?
During the reporting period, the Fund’s largest allocations were in the consumer goods and consumer services sectors and its smallest allocations were in the telecommunications and oil & gas sectors.
| | | | | | |
| | | |
| 38 | | | | J.P. MORGAN EXCHANGE-TRADED FUNDS | | OCTOBER 31, 2018 |
| | | | | | | | |
| TOP TEN EQUITY HOLDINGS OF THE PORTFOLIO**** | |
| | 1. | | | Lancaster Colony Corp. | | | 0.8 | % |
| | 2. | | | New Jersey Resources Corp. | | | 0.8 | |
| | 3. | | | Black Hills Corp. | | | 0.7 | |
| | 4. | | | Helen of Troy Ltd. | | | 0.7 | |
| | 5. | | | Boston Beer Co., Inc. (The), Class A | | | 0.7 | |
| | 6. | | | American States Water Co. | | | 0.7 | |
| | 7. | | | Columbia Sportswear Co. | | | 0.7 | |
| | 8. | | | Rollins, Inc. | | | 0.7 | |
| | 9. | | | Iridium Communications, Inc. | | | 0.7 | |
| | 10. | | | Spire, Inc. | | | 0.7 | |
| | | | |
PORTFOLIO COMPOSITION BY SECTOR**** | |
Consumer Goods | | | 21.2 | % |
Consumer Services | | | 13.2 | |
Industrials | | | 11.9 | |
Utilities | | | 11.5 | |
Health Care | | | 10.5 | |
Technology | | | 9.3 | |
Financials | | | 7.6 | |
Basic Materials | | | 5.4 | |
Oil & Gas | | | 3.4 | |
Telecommunications | | | 2.0 | |
Short-Term Investment | | | 1.5 | |
Investment of cash collateral from securities loaned | | | 2.5 | |
| * | | The return shown is based on net asset value calculated for shareholder transactions and may differ from the return shown in the financial highlights, which reflects adjustments made to the net asset value in accordance with accounting principles generally accepted in the United States of America. The net asset value was $29.58 as of October 31, 2018. |
| ** | | Market price return is calculated assuming an initial investment made at the market price at the beginning of the period, reinvestment of all dividends and distributions at market price during the period, and sale at the market price on the last day of the period. The price used to calculate the market price return is the midpoint of the bid/ask spread at the close of business on the NYSE Arca. The midpoint price was $29.58 as of October 31, 2018. |
| *** | | The adviser seeks to achieve the Fund’s objective. There can be no guarantee it will be achieved. |
| **** | | Percentages indicated are based on total investments as of October 31, 2018. The Fund’s composition is subject to change. |
| | | | | | | | |
| | | |
| OCTOBER 31, 2018 | | J.P. MORGAN EXCHANGE-TRADED FUNDS | | | | | 39 | |
JPMorgan Diversified Return U.S. Small Cap Equity ETF
FUND COMMENTARY
Twelve Months Ended October 31, 2018 (Unaudited) (continued)
| | | | | | | | | | | | |
AVERAGE ANNUAL TOTAL RETURNS AS OF OCTOBER 31, 2018 (Unaudited) | |
| | | INCEPTION DATE | | | 1 YEAR | | | SINCE
INCEPTION | |
JPMorgan Diversified Return U.S. Small Cap Equity ETF | | | | | | | | | | | | |
Net Asset Value | | | November 15, 2016 | | | | 3.61% | | | | 9.83% | |
Market Price | | | | | | | 3.43% | | | | 9.82% | |
LIFE OF FUND PERFORMANCE (11/15/16 TO 10/31/18)
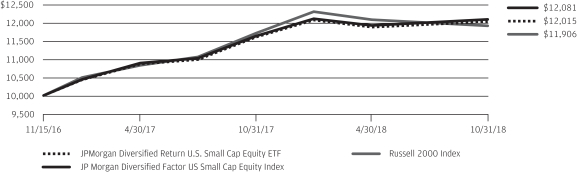
The performance quoted is past performance and is not a guarantee of future results. Exchange-traded funds are subject to certain market risks. Investment returns and principal value of an investment will fluctuate so that an investor’s shares, when sold or redeemed, may be worth more or less than their original cost. Current performance may be higher or lower than the performance data shown. For up-to-date, month-end performance information please call 1-844-457-6383.
Fund commenced operations on November 15, 2016.
The graph illustrates comparative performance for $10,000 invested in shares of the JPMorgan Diversified Return U.S. Small Cap Equity ETF, the JP Morgan Diversified Factor US Small Cap Equity Index, and the Russell 2000 Index from November 15, 2016 to October 31, 2018. The performance of the Fund reflects the deduction of Fund expenses and assumes reinvestment of all dividends and capital gain distributions, if any. The performance of the JP Morgan Diversified Factor US Small Cap Equity Index and Russell 2000 Index does not reflect the deduction of expenses associated with an exchange-traded fund and has been adjusted to reflect reinvestment of all dividends and capital gain distributions of
the securities included in the Index, if applicable. The Fund’s adviser is a sponsor of the JP Morgan Diversified Factor US Small Cap Equity Index and developed the proprietary factors on which the index is based. FTSE Russell, the benchmark administrator, administers, calculates and governs the JP Morgan Diversified Factor US Small Cap Equity Index. The Russell 2000 Index is an unmanaged index, measuring performance of the 2000 smallest stocks (on the basis of capitalization) in the Russell 3000 Index. Investors cannot invest directly in an index.
Fund performance reflects the waiver of the Fund’s fees and reimbursement of expenses for certain periods since the inception date. Without these waivers and reimbursements, performance would have been lower. Also, performance shown in this section does not reflect the deduction of taxes that a shareholder may pay on Fund distributions or redemption or sale of Fund shares.
The returns shown are based on net asset values calculated for shareholder transactions and may differ from the returns shown in the financial highlights, which reflect adjustments made to the net asset values in accordance with accounting principles generally accepted in the United States of America.
| | | | | | |
| | | |
| 40 | | | | J.P. MORGAN EXCHANGE-TRADED FUNDS | | OCTOBER 31, 2018 |
JPMorgan U.S. Dividend ETF
FUND COMMENTARY
Period November 8, 2017 (Fund Inception Date) Through October 31, 2018 (Unaudited)
| | | | |
REPORTING PERIOD RETURN: | | | |
| JPMorgan U.S. Dividend ETF | | | | |
| Net Asset Value* | | | 3.08% | |
| Market Price** | | | 2.99% | |
| JP Morgan US Dividend Index | | | 3.38% | |
| Russell 1000 Index | | | 6.22% | |
| |
| Net Assets as of 10/31/2018 | | $ | 27,411,126 | |
INVESTMENT OBJECTIVE***
The JPMorgan U.S. Dividend ETF (the “Fund”) seeks investment results that closely correspond, before fees and expenses, to the performance of the JP Morgan US Dividend Index. (the “Underlying Index”).
INVESTMENT APPROACH
The Fund is passively managed to the Underlying Index, which consists of large and mid cap U.S. equity securities selected to provide exposure to the highest dividend yielding sectors on a risk adjusted basis. The Underlying Index uses a proprietary selection process that seeks to identify companies within each sector that have higher dividend yields over a rolling twelve month period. Within each sector, individual equity securities are also weighted to diversify risk. The Underlying Index’s methodology includes quarterly rebalancing.
HOW DID THE FUND PERFORM?
For the period from inception on November 8, 2017 to October 31, 2018, the Fund posted a positive absolute performance in line with the Underlying Index, before considering operating expenses, fees and tax management of the Fund’s portfolio. The Fund and the Underlying Index underperformed the Russell 1000 Index, which is a more traditional market capitalization weighted index.
On an absolute basis, the Fund’s and the Underlying Index’s allocations to the telecommunications and consumer services sectors were leading contributors to performance, while the Fund’s and the Underlying Index’s allocations to the industrials and consumer goods sectors were leading detractors from performance.
Relative to the Russell 1000 Index, the Fund’s and the Underlying Index’s security selection and underweight position in the technology sector and their security selection in the industrials
sector were leading detractors from performance. The Fund’s and the Underlying Index’s security selection in the oil & gas and telecommunications sectors was a leading contributor to relative performance.
Leading individual detractors from performance relative to the Russell 1000 Index included the Fund’s and the Underlying Index’s underweight positions in Apple Inc., Amazon.com Inc. and Microsoft Corp. Shares of Apple, a maker of smartphones and other consumer electronics that was not held in the Fund, rose amid continued earnings and revenue growth during the reporting period. Shares of Amazon.com, an online retailer that was not held in the Fund, rose amid continued sales and earnings growth. Shares of Microsoft, a provider of software and services, rose amid better-than-expected earnings.
Leading individual contributors to performance relative to the Russell 1000 Index included the Funds’ and the Underlying Index’s overweight positions in Macy’s Inc. and Kohl’s Corp. and their underweight position in Facebook Inc. Shares of Macy’s, a department store retailer, rose as the company’s relatively high dividend remained attractive to investors. Shares of Kohl’s, a department store retailer, rose amid better-than-expected earnings and sales. Shares of Facebook, an Internet social media provider that was not held in the Fund, fell after the company reported lower-than-expected revenue and forecast slowing revenue growth.
HOW WAS THE FUND POSITIONED?
During the reporting period, among the Fund’s largest allocations were the utilities and consumer discretionary sectors and among the smallest allocations were the telecommunications and oil & gas sectors.
| | | | | | | | |
| | | |
| OCTOBER 31, 2018 | | J.P. MORGAN EXCHANGE-TRADED FUNDS | | | | | 41 | |
JPMorgan U.S. Dividend ETF
FUND COMMENTARY
Period November 8, 2017 (Fund Inception Date) Through October 31, 2018 (Unaudited) (continued)
| | | | | | | | |
| TOP TEN EQUITY HOLDINGS OF THE PORTFOLIO**** | |
| | 1. | | | Philip Morris International, Inc. | | | 0.7 | % |
| | 2. | | | McDonald’s Corp. | | | 0.7 | |
| | 3. | | | Coca-Cola Co. (The) | | | 0.7 | |
| | 4. | | | Merck & Co., Inc. | | | 0.7 | |
| | 5. | | | AES Corp. | | | 0.7 | |
| | 6. | | | Procter & Gamble Co. (The) | | | 0.7 | |
| | 7. | | | Johnson & Johnson | | | 0.7 | |
| | 8. | | | Verizon Communications, Inc. | | | 0.7 | |
| | 9. | | | Pfizer, Inc. | | | 0.7 | |
| | 10. | | | Edison International | | | 0.7 | |
| | | | |
PORTFOLIO COMPOSITION BY SECTOR**** | |
| Utilities | | | 18.0 | % |
| Financials | | | 15.2 | |
| Consumer Goods | | | 13.9 | |
| Consumer Services | | | 10.9 | |
| Health Care | | | 8.5 | |
| Industrials | | | 8.1 | |
| Basic Materials | | | 6.3 | |
| Technology | | | 5.4 | |
| Oil & Gas | | | 5.1 | |
| Telecommunications | | | 3.6 | |
| Short-Term Investment | | | 4.5 | |
| Investment of cash collateral from securities loaned | | | 0.5 | |
| * | | The return shown is based on net asset value calculated for shareholder transactions and may differ from the return shown in the financial highlights, which reflects adjustments made to the net asset value in accordance with accounting principles generally accepted in the United States of America. The net asset value was $24.92 as of October 31, 2018. |
| ** | | Market price return is calculated assuming an initial investment made at the inception date net asset value, reinvestment of all dividends and distributions at market price during the period, and sale at the market price on the last day of the period. The price used to calculate the market price return is the midpoint of the bid/ask spread at the close of business on the NYSE Arca. The midpoint price was $24.90 as of October 31, 2018. |
| *** | | The adviser seeks to achieve the Fund’s objective. There can be no guarantee it will be achieved. |
| **** | | Percentages indicated are based on total investments as of October 31, 2018. The Fund’s composition is subject to change. |
| | | | | | |
| | | |
| 42 | | | | J.P. MORGAN EXCHANGE-TRADED FUNDS | | OCTOBER 31, 2018 |
| | | | | | | | |
TOTAL RETURNS AS OF OCTOBER 31, 2018 (Unaudited) | |
| | | INCEPTION DATE | | | CUMULATIVE
SINCE
INCEPTION | |
JPMorgan U.S. Dividend ETF | | | | | | | | |
Net Asset Value | | | November 8, 2017 | | | | 3.08% | |
Market Price | | | | | | | 2.99% | |
LIFE OF FUND PERFORMANCE (11/8/17 TO 10/31/18)
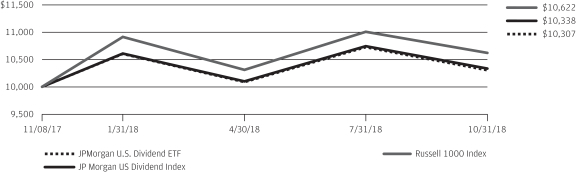
The performance quoted is past performance and is not a guarantee of future results. Exchange-traded funds are subject to certain market risks. Investment returns and principal value of an investment will fluctuate so that an investor’s shares, when sold or redeemed, may be worth more or less than their original cost. Current performance may be higher or lower than the performance data shown. For up-to-date, month-end performance information please call 1-844-457-6383.
Fund commenced operations on November 8, 2017.
The graph illustrates comparative performance for $10,000 invested in shares of the JPMorgan U.S. Dividend ETF, the JP Morgan US Dividend Index, and the Russell 1000 Index from November 8, 2017 to October 31, 2018. The performance of the Fund reflects the deduction of Fund expenses and assumes reinvestment of all dividends and capital gain distributions, if any. The performance of the JP Morgan US Dividend Index and Russell 1000 Index does not reflect the deduction of expenses associated with an exchange-traded fund and has been adjusted to reflect reinvestment of all dividends and capital gain
distributions of the securities included in the Index, if applicable. The Fund’s adviser is a sponsor of the JP Morgan US Dividend Index and developed the proprietary factors on which the index is based. FTSE International Limited, the benchmark administrator, administers, calculates and governs the JP Morgan US Dividend Index. The Russell 1000 Index is a market-capitalization weighted index, which measures the performance of the 1,000 largest companies in the Russell 3000 Index. Investors cannot invest directly in an index.
Fund performance reflects the waiver of the Fund’s fees and reimbursement of expenses for certain periods since the inception date. Without these waivers and reimbursements, performance would have been lower. Also, performance shown in this section does not reflect the deduction of taxes that a shareholder may pay on Fund distributions or redemption or sale of Fund shares.
The returns shown are based on net asset values calculated for shareholder transactions and may differ from the returns shown in the financial highlights, which reflect adjustments made to the net asset values in accordance with accounting principles generally accepted in the United States of America.
| | | | | | | | |
| | | |
| OCTOBER 31, 2018 | | J.P. MORGAN EXCHANGE-TRADED FUNDS | | | | | 43 | |
JPMorgan U.S. Minimum Volatility ETF
FUND COMMENTARY
Period November 8, 2017 (Fund Inception Date) Through October 31, 2018 (Unaudited)
| | | | |
REPORTING PERIOD RETURN: | | | |
JPMorgan U.S. Minimum Volatility ETF | | | | |
Net Asset Value* | | | 6.69% | |
Market Price** | | | 6.69% | |
JP Morgan US Minimum Volatility Index | | | 6.78% | |
Russell 1000 Index | | | 6.22% | |
| |
Net Assets as of 10/31/2018 | | $ | 27,445,770 | |
INVESTMENT OBJECTIVE***
The JPMorgan U.S. Minimum Volatility ETF (the “Fund”) seeks investment results that closely correspond, before fees and expenses, to the performance of the JP Morgan US Minimum Volatility Index (the “Underlying Index”).
INVESTMENT APPROACH
The Fund is passively managed to the Underlying Index, which consists of large and mid cap U.S. equity securities, is designed so that it targets lower volatility than the Russell 1000 Index. The Underlying Index is designed to distribute risk among sectors and stocks in order to seek to minimize the overall portfolio volatility based upon the parameters of the rule-based process. The Underlying Index’s methodology includes quarterly rebalancing.
HOW DID THE FUND PERFORM?
For the period from inception on November 8, 2017 to October 31, 2018, the Fund posted a positive absolute performance in line with the Underlying Index, before considering operating expenses, fees and tax management of the Fund’s portfolio. The Fund and the Underlying Index outperformed the Russell 1000 Index, which is a more traditional market capitalization weighted equity index.
In terms of absolute performance, the Fund’s and the Underlying Index’s allocations to the consumer services and telecommunications and consumer services sectors were leading contributors to performance, while the Fund’s and the Underlying Index’s allocations to the industrials sector detracted from absolute performance.
Relative to the Russell 1000 Index, the Fund’s and the Underlying Index’s security selection and overweight position in the health care sector and their security selection in the oil & gas sector were leading contributors to performance, while their
overweight position in the utilities sector and their underweight position in the technology sector were leading detractors from performance.
Leading individual contributors to performance relative to the Russell 1000 Index included the Fund’s and the Underlying Index’s underweight positions in General Electric Co. and Facebook Inc. and its overweight position in McCormick & Co. Shares of General Electric, an industrial conglomerate not held in the Fund and Underlying Index, fell after the company reported lower-than-expected results for several consecutive quarters and its credit rating was downgraded. Shares of Facebook, an Internet social media provider that was not held in the Fund and Underlying Index, fell after the company reported lower-than-expected revenue and forecast slowing revenue growth. Shares of McCormick, a maker of food seasonings, rose after the company reported better-than-expected earnings for the third quarter of 2018 and forecast higher earnings for the full year 2018.
Leading individual detractors from performance relative to the Russell 1000 Index included the Fund’s and the Underlying Index’s underweight positions in Apple Inc., Amazon.com Inc. and Microsoft Corp. Shares of Apple, a maker of smartphones and related devices that was not held in the Fund and the Underlying Index, rose amid continued earnings and revenue growth during the reporting period. Shares of Amazon.com, an online retailer that was not held in the Fund and the Underlying Index, rose amid continued sales and earnings growth. Shares of Microsoft, a provider of software and services, rose amid better-than-expected earnings.
HOW WAS THE FUND POSITIONED?
During the reporting period, among the Fund’s and the Underlying Index’s largest allocations were in the health care, consumer goods and utilities sectors, while among their smallest allocations were to the telecommunications and oil & gas sectors.
| | | | | | |
| | | |
| 44 | | | | J.P. MORGAN EXCHANGE-TRADED FUNDS | | OCTOBER 31, 2018 |
| | | | | | | | |
| TOP TEN EQUITY HOLDINGS OF THE PORTFOLIO**** | |
| | 1. | | | McCormick & Co., Inc. (Non-Voting) | | | 0.7 | % |
| | 2. | | | Conagra Brands, Inc. | | | 0.7 | |
| | 3. | | | McDonald’s Corp. | | | 0.7 | |
| | 4. | | | Merck & Co., Inc. | | | 0.7 | |
| | 5. | | | Verizon Communications, Inc. | | | 0.7 | |
| | 6. | | | Pinnacle West Capital Corp. | | | 0.6 | |
| | 7. | | | Yum! Brands, Inc. | | | 0.6 | |
| | 8. | | | T-Mobile US, Inc. | | | 0.6 | |
| | 9. | | | Pfizer, Inc. | | | 0.6 | |
| | 10. | | | Abbott Laboratories | | | 0.6 | |
| | | | |
PORTFOLIO COMPOSITION BY SECTOR**** | |
Health Care | | | 19.6 | |
Utilities | | | 16.9 | |
Consumer Goods | | | 16.2 | |
Financials | | | 11.6 | |
Consumer Services | | | 9.0 | |
Industrials | | | 6.0 | |
Technology | | | 4.7 | |
Basic Materials | | | 4.7 | |
Oil & Gas | | | 4.7 | |
Telecommunications | | | 3.5 | |
Short-Term Investment | | | 2.8 | |
Investment of cash collateral from securities loaned | | | 0.3 | |
| * | | The return shown is based on net asset value calculated for shareholder transactions and may differ from the return shown in the financial highlights, which reflects adjustments made to the net asset value in accordance with accounting principles generally accepted in the United States of America. The net asset value was $26.14 as of October 31, 2018. |
| ** | | Market price return is calculated assuming an initial investment made at the inception date net asset value, reinvestment of all dividends and distributions at market price during the period, and sale at the market price on the last day of the period. The price used to calculate the market price return is the midpoint of the bid/ask spread at the close of business on the NYSE Arca. The midpoint price was $26.14 as of October 31, 2018. |
| *** | | The adviser seeks to achieve the Fund’s objective. There can be no guarantee it will be achieved. |
| **** | | Percentages indicated are based on total investments as of October 31, 2018. The Fund’s composition is subject to change. |
| | | | | | | | |
| | | |
| OCTOBER 31, 2018 | | J.P. MORGAN EXCHANGE-TRADED FUNDS | | | | | 45 | |
JPMorgan U.S. Minimum Volatility ETF
FUND COMMENTARY
Period November 8, 2017 (Fund Inception Date) Through October 31, 2018 (Unaudited) (continued)
| | | | | | | | |
TOTAL RETURNS AS OF OCTOBER 31, 2018 (Unaudited) | |
| | | INCEPTION DATE | | | CUMULATIVE
SINCE
INCEPTION | |
JPMorgan U.S. Minimum Volatility ETF | | | | | | | | |
Net Asset Value | | | November 8, 2017 | | | | 6.69% | |
Market Price | | | | | | | 6.69% | |
LIFE OF FUND PERFORMANCE (11/8/17 TO 10/31/18)
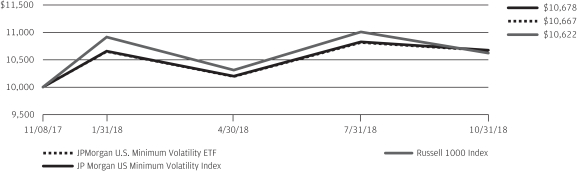
The performance quoted is past performance and is not a guarantee of future results. Exchange-traded funds are subject to certain market risks. Investment returns and principal value of an investment will fluctuate so that an investor’s shares, when sold or redeemed, may be worth more or less than their original cost. Current performance may be higher or lower than the performance data shown. For up-to-date, month-end performance information please call 1-844-457-6383.
Fund commenced operations on November 8, 2017.
The graph illustrates comparative performance for $10,000 invested in shares of the JPMorgan U.S. Minimum Volatility ETF, the JP Morgan US Minimum Volatility Index, and the Russell 1000 Index from November 8, 2017 to October 31, 2018. The performance of the Fund reflects the deduction of Fund expenses and assumes reinvestment of all dividends and capital gain distributions, if any. The performance of the JP Morgan US Minimum Volatility Index and Russell 1000 Index does not reflect the deduction of expenses associated with an exchange-traded fund and has been adjusted to reflect reinvestment of all dividends and capital gain distributions of the securities included in the Index, if
applicable. The Fund’s adviser is a sponsor of the JP Morgan US Minimum Volatility Index and developed the proprietary factors on which the index is based. FTSE International Limited, the benchmark administrator, administers, calculates and governs the JP Morgan US Minimum Volatility Index. The Russell 1000 Index is a market-capitalization weighted index, which measures the performance of the 1,000 largest companies in the Russell 3000 Index. Investors cannot invest directly in an index.
Fund performance reflects the waiver of the Fund’s fees and reimbursement of expenses for certain periods since the inception date. Without these waivers and reimbursements, performance would have been lower. Also, performance shown in this section does not reflect the deduction of taxes that a shareholder may pay on Fund distributions or redemption or sale of Fund shares.
The returns shown are based on net asset values calculated for shareholder transactions and may differ from the returns shown in the financial highlights, which reflect adjustments made to the net asset values in accordance with accounting principles generally accepted in the United States of America.
| | | | | | |
| | | |
| 46 | | | | J.P. MORGAN EXCHANGE-TRADED FUNDS | | OCTOBER 31, 2018 |
JPMorgan U.S. Momentum Factor ETF
FUND COMMENTARY
Period November 8, 2017 (Fund Inception Date) Through October 31, 2018 (Unaudited)
| | | | |
REPORTING PERIOD RETURN: | | | |
| JPMorgan U.S. Momentum Factor ETF | | | | |
Net Asset Value* | | | 5.17% | |
Market Price** | | | 5.21% | |
JP Morgan US Momentum Factor Index | | | 5.41% | |
Russell 1000 Index | | | 6.22% | |
| |
Net Assets as of 10/31/2018 | | $ | 28,575,370 | |
INVESTMENT OBJECTIVE***
The JPMorgan U.S. Momentum Factor ETF (the “Fund”) seeks investment results that closely correspond, before fees and expenses, to the performance of the JP Morgan US Momentum Factor Index (the “Underlying Index”).
INVESTMENT APPROACH
The Fund is passively managed to the Underlying Index, which is composed of U.S. large and mid cap securities selected to represent positive momentum factor characteristics. The Underlying Index uses a proprietary selection process that utilizes a momentum factor to identify the companies that have had better recent performance compared with other companies. The Underlying Index’s methodology includes quarterly rebalancing.
HOW DID THE FUND PERFORM?
For the period from inception on November 8, 2017 to October 31, 2018, the Fund posted a positive absolute performance in line with the Underlying Index, before considering operating expenses, fees and tax management of the Fund’s portfolio. Both the Fund and the Underlying Index underperformed the Russell 1000 Index, which is a more traditional market capitalization weighted index.
On an absolute basis, the Fund’s and the Underlying Index’s allocations to the telecommunications and consumer services sectors were leading contributors to performance, while the Fund’s and the Underlying Index’s allocations to the basic materials and consumer goods sectors were leading detractors from performance.
Relative to the Russell 1000 Index, the Fund’s and the Underlying Index’s security selection in the technology and consumer goods sectors was a leading detractor from relative performance, while the Fund’s and the Underlying Index’s security selection in the industrials and oil & gas sectors was a leading contributor to performance.
Leading individual detractors from performance relative to the Russell 1000 Index included the Funds’ and Underlying Index’s underweight positions in Apple Inc. and Johnson & Johnson, and its overweight position in AbbVie Inc. Shares of Apple, a maker of smartphones and related devices that was not held in the Fund and the Underlying Index, rose amid continued earnings and revenue growth during the reporting period. Shares of Johnson & Johnson, a maker of drugs and other health care products, rose after the company reported better-than-expected earnings and revenue for the third quarter of 2018. Shares of AbbVie, a drug maker, fell after the U.S. Federal Trade Commission fined the company $448 million for blocking consumer access to lower cost versions of a key AbbVie drug and after the company reported disappointing results from a cancer drug clinical trial.
Leading individual contributors to performance relative to the Russell 1000 Index included the Fund’s and Underlying Index’s underweight position in General Electric Co. and its overweight positions in Boeing Co. and Square Co. Shares of General Electric, an industrial conglomerate that was not held in the Fund and the Underlying Index, fell after the company reported lower-than-expected results for several consecutive quarters and its credit rating was downgraded. Shares of Boeing, an aircraft manufacturer, rose after the company reported better-than-expected third-quarter earnings and raised its profit forecast amid strong demand. Shares of Square, a provider of credit card processing, rose after the company raised its 2018 revenue forecast.
HOW WAS THE FUND POSITIONED?
During the reporting period, among the Fund’s largest positions were the technology and consumer discretionary sectors and among its smallest positions were the real estate and materials sectors.
| | | | | | | | |
| | | |
| OCTOBER 31, 2018 | | J.P. MORGAN EXCHANGE-TRADED FUNDS | | | | | 47 | |
JPMorgan U.S. Momentum Factor ETF
FUND COMMENTARY
Period November 8, 2017 (Fund Inception Date) Through October 31, 2018 (Unaudited) (continued)
| | | | | | | | |
| TOP TEN EQUITY HOLDINGS OF THE PORTFOLIO**** | |
| | 1. | | | Berkshire Hathaway, Inc., Class B | | | 2.2 | % |
| | 2. | | | Apple, Inc. | | | 2.1 | |
| | 3. | | | Microsoft Corp. | | | 2.1 | |
| | 4. | | | Visa, Inc., Class A | | | 2.0 | |
| | 5. | | | UnitedHealth Group, Inc. | | | 1.9 | |
| | 6. | | | Verizon Communications, Inc. | | | 1.9 | |
| | 7. | | | Alphabet, Inc., Class A | | | 1.8 | |
| | 8. | | | Amazon.com, Inc. | | | 1.7 | |
| | 9. | | | Boeing Co. (The) | | | 1.6 | |
| | 10. | | | Home Depot, Inc. (The) | | | 1.5 | |
| | | | |
PORTFOLIO COMPOSITION BY SECTOR**** | |
Technology | | | 21.2 | % |
Financials | | | 18.9 | |
Consumer Services | | | 13.4 | |
Health Care | | | 13.1 | |
Industrials | | | 12.8 | |
Consumer Goods | | | 7.5 | |
Oil & Gas | | | 5.4 | |
Utilities | | | 3.0 | |
Basic Materials | | | 2.2 | |
Telecommunications | | | 2.1 | |
Short-Term Investment | | | 0.2 | |
Investment of cash collateral from securities loaned | | | 0.2 | |
| * | | The return shown is based on net asset value calculated for shareholder transactions and may differ from the return shown in the financial highlights, which reflects adjustments made to the net asset value in accordance with accounting principles generally accepted in the United States of America. The net asset value was $25.98 as of October 31, 2018. |
| ** | | Market price return is calculated assuming an initial investment made at the inception date net asset value, reinvestment of all dividends and distributions at market price during the period, and sale at the market price on the last day of the period. The price used to calculate the market price return is the midpoint of the bid/ask spread at the close of business on the NYSE Arca. The midpoint price was $25.99 as of October 31, 2018. |
| *** | | The adviser seeks to achieve the Fund’s objective. There can be no guarantee it will be achieved. |
| **** | | Percentages indicated are based on total investments as of October 31, 2018. The Fund’s composition is subject to change. |
| | | | | | |
| | | |
| 48 | | | | J.P. MORGAN EXCHANGE-TRADED FUNDS | | OCTOBER 31, 2018 |
| | | | | | | | |
TOTAL RETURNS AS OF OCTOBER 31, 2018 (Unaudited) | |
| | | INCEPTION DATE | | | CUMULATIVE
SINCE
INCEPTION | |
JPMorgan U.S. Momentum Factor ETF | | | | | |
Net Asset Value | | | November 8, 2017 | | | | 5.17% | |
Market Price | | | | | | | 5.21% | |
LIFE OF FUND PERFORMANCE (11/8/17 TO 10/31/18)
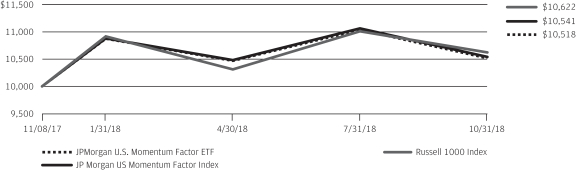
The performance quoted is past performance and is not a guarantee of future results. Exchange-traded funds are subject to certain market risks. Investment returns and principal value of an investment will fluctuate so that an investor’s shares, when sold or redeemed, may be worth more or less than their original cost. Current performance may be higher or lower than the performance data shown. For up-to-date, month-end performance information please call 1-844-457-6383.
Fund commenced operations on November 8, 2017.
The graph illustrates comparative performance for $10,000 invested in shares of the JPMorgan U.S. Momentum Factor ETF, the JP Morgan US Momentum Factor Index, and the Russell 1000 Index from November 8, 2017 to October 31, 2018. The performance of the Fund reflects the deduction of Fund expenses and assumes reinvestment of all dividends and capital gain distributions, if any. The performance of the JP Morgan US Momentum Factor Index and Russell 1000 Index does not reflect the deduction of expenses associated with an exchange-traded fund and has been adjusted to reflect reinvestment of all dividends and capital gain distributions of the securities included in the Index, if
applicable. The Fund’s adviser is a sponsor of the JP Morgan US Momentum Factor Index and developed the proprietary factors on which the index is based. FTSE International Limited, the benchmark administrator, administers, calculates and governs the JP Morgan US Momentum Factor Index. The Russell 1000 Index is a market-capitalization weighted index, which measures the performance of the 1,000 largest companies in the Russell 3000 Index. Investors cannot invest directly in an index.
Fund performance reflects the waiver of the Fund’s fees and reimbursement of expenses for certain periods since the inception date. Without these waivers and reimbursements, performance would have been lower. Also, performance shown in this section does not reflect the deduction of taxes that a shareholder may pay on Fund distributions or redemption or sale of Fund shares.
The returns shown are based on net asset values calculated for shareholder transactions and may differ from the returns shown in the financial highlights, which reflect adjustments made to the net asset values in accordance with accounting principles generally accepted in the United States of America.
| | | | | | | | |
| | | |
| OCTOBER 31, 2018 | | J.P. MORGAN EXCHANGE-TRADED FUNDS | | | | | 49 | |
JPMorgan U.S. Quality Factor ETF
FUND COMMENTARY
Period November 8, 2017 (Fund Inception Date) Through October 31, 2018 (Unaudited)
| | | | |
REPORTING PERIOD RETURN: | | | |
JPMorgan U.S. Quality Factor ETF | | | | |
Net Asset Value* | | | 8.15% | |
Market Price** | | | 8.15% | |
JP Morgan US Quality Factor Index | | | 8.37% | |
Russell 1000 Index | | | 6.22% | |
| |
Net Assets as of 10/31/2018 | | $ | 29,215,267 | |
INVESTMENT OBJECTIVE***
The JPMorgan U.S. Quality Factor ETF (the “Fund”) seeks investment results that closely correspond, before fees and expenses, to the performance of the JP Morgan US Quality Factor Index. (the “Underlying Index”).
INVESTMENT APPROACH
The Fund is passively managed to the Underlying Index, which consists of large and mid cap U.S. equity securities selected to represent quality factor characteristics. The Underlying Index uses a proprietary selection process that utilizes a quality factor to identify higher quality companies relative to their sector peers as measured by profitability, quality of earnings and solvency. The Underlying Index’s methodology includes quarterly rebalancing.
HOW DID THE FUND PERFORM?
For the period from inception on November 8, 2017 to October 31, 2018, the Fund posted a positive absolute performance in line with the Underlying Index, before considering operating expenses, fees and tax management of the Fund’s portfolio. Both the Fund and the Underlying Index outperformed the Russell 1000 Index, which is a more traditional market capitalization weighted index.
On an absolute basis, the Fund’s and the Underlying Index’s allocations to the consumer services and telecommunications sectors were leading contributors to performance, while the Fund’s and the Underlying Index’s allocation to the basic materials sector was leading detractor from performance.
Relative to the Russell 1000 Index, the Fund’s and the Underlying Index’s security selection in the financials and industrials sectors was a leading contributor to performance. The Fund’s
and the Underlying Index’s security selection in the technology and health care sectors was a leading detractor from performance.
Leading individual contributors to performance relative to the Russell 1000 Index included the Fund’s and the Underlying Index’s underweight position in General Electric Co. and its overweight positions in Boeing Co. and Mastercard Inc. Shares of General Electric, an industrial conglomerate, fell after the company reported lower-than-expected results for several consecutive quarters and its credit rating was downgraded. Shares of Boeing, an aircraft manufacturer, rose after the company reported better-than-expected third-quarter earnings and raised its profit forecast amid strong demand. Shares of Mastercard, a provider of electronic payment services, rose after the company reported better-than-expected earnings and volumes for the third quarter of 2018.
Leading individual detractors from performance relative to the Russell 1000 Index included the Fund’s and the Underlying Index’s underweight positions in Amazon.com Inc., Apple Inc. and Microsoft Corp. Shares of Amazon.com, an online retailer that was not held in the Fund, rose amid continued sales and earnings growth. Shares of Apple, a maker of smartphones and other consumer electronics, rose amid continued earnings and revenue growth during the reporting period. Shares of Microsoft, a provider of software and services, rose amid better-than-expected earnings.
HOW WAS THE FUND POSITIONED?
During the reporting period, among the Fund’s largest allocations were the technology and health care sectors and among its smallest allocations were the materials and real estate sectors.
| | | | | | |
| | | |
| 50 | | | | J.P. MORGAN EXCHANGE-TRADED FUNDS | | OCTOBER 31, 2018 |
| | | | | | | | |
| TOP TEN EQUITY HOLDINGS OF THE PORTFOLIO**** | |
| | 1. | | | Johnson & Johnson | | | 2.1 | % |
| | 2. | | | Berkshire Hathaway, Inc., Class B | | | 2.1 | |
| | 3. | | | Apple, Inc. | | | 2.0 | |
| | 4. | | | Microsoft Corp. | | | 2.0 | |
| | 5. | | | Visa, Inc., Class A | | | 1.9 | |
| | 6. | | | Alphabet, Inc., Class A | | | 1.9 | |
| | 7. | | | Pfizer, Inc. | | | 1.8 | |
| | 8. | | | Cisco Systems, Inc. | | | 1.7 | |
| | 9. | | | Home Depot, Inc. (The) | | | 1.6 | |
| | 10. | | | Facebook, Inc., Class A | | | 1.6 | |
| | | | |
PORTFOLIO COMPOSITION BY SECTOR**** | |
| Technology | | | 20.4 | % |
| Financials | | | 18.4 | |
| Health Care | | | 13.1 | |
| Consumer Services | | | 12.9 | |
| Industrials | | | 12.0 | |
| Consumer Goods | | | 7.7 | |
| Oil & Gas | | | 5.3 | |
| Utilities | | | 2.9 | |
| Basic Materials | | | 2.2 | |
| Telecommunications | | | 2.0 | |
| Short-Term Investment | | | 2.9 | |
| Investment of cash collateral from securities loaned | | | 0.2 | |
| * | | The return shown is based on net asset value calculated for shareholder transactions and may differ from the return shown in the financial highlights, which reflects adjustments made to the net asset value in accordance with accounting principles generally accepted in the United States of America. The net asset value was $26.56 as of October 31, 2018. |
| ** | | Market price return is calculated assuming an initial investment made at the inception date net asset value, reinvestment of all dividends and distributions at market price during the period, and sale at the market price on the last day of the period. The price used to calculate the market price return is the midpoint of the bid/ask spread at the close of business on the NYSE Arca. The midpoint price was $26.56 as of October 31, 2018. |
| *** | | The adviser seeks to achieve the Fund’s objective. There can be no guarantee it will be achieved. |
| **** | | Percentages indicated are based on total investments as of October 31, 2018. The Fund’s composition is subject to change. |
| | | | | | | | |
| | | |
| OCTOBER 31, 2018 | | J.P. MORGAN EXCHANGE-TRADED FUNDS | | | | | 51 | |
JPMorgan U.S. Quality Factor ETF
FUND COMMENTARY
Period November 8, 2017 (Fund Inception Date) Through October 31, 2018 (Unaudited) (continued)
| | | | | | | | |
TOTAL RETURNS AS OF OCTOBER 31, 2018 (Unaudited) | |
| | | INCEPTION DATE | | | CUMULATIVE
SINCE
INCEPTION | |
JPMorgan U.S. Quality Factor ETF | | | | | | | | |
Net Asset Value | | | November 8, 2017 | | | | 8.15% | |
Market Price | | | | | | | 8.15% | |
LIFE OF FUND PERFORMANCE (11/8/17 TO 10/31/18)
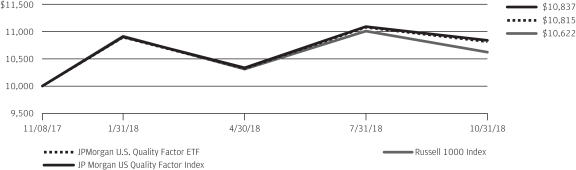
The performance quoted is past performance and is not a guarantee of future results. Exchange-traded funds are subject to certain market risks. Investment returns and principal value of an investment will fluctuate so that an investor’s shares, when sold or redeemed, may be worth more or less than their original cost. Current performance may be higher or lower than the performance data shown. For up-to-date, month-end performance information please call 1-844-457-6383.
Fund commenced operations on November 8, 2017.
The graph illustrates comparative performance for $10,000 invested in shares of the JPMorgan U.S. Quality Factor ETF, the JP Morgan US Quality Factor Index, and the Russell 1000 Index from November 8, 2017 to October 31, 2018. The performance of the Fund reflects the deduction of Fund expenses and assumes reinvestment of all dividends and capital gain distributions, if any. The performance of the JP Morgan US Quality Factor Index and Russell 1000 Index does not reflect the deduction of expenses associated with an exchange-traded fund and has been adjusted to reflect reinvestment of all dividends and capital gain distributions of the securities included in the Index, if applicable. The
Fund’s adviser is a sponsor of the JP Morgan US Quality Factor Index and developed the proprietary factors on which the index is based. FTSE International Limited, the benchmark administrator, administers, calculates and governs the JP Morgan US Quality Factor Index. The Russell 1000 Index is a market-capitalization weighted index, which measures the performance of the 1,000 largest companies in the Russell 3000 Index. Investors cannot invest directly in an index.
Fund performance reflects the waiver of the Fund’s fees and reimbursement of expenses for certain periods since the inception date. Without these waivers and reimbursements, performance would have been lower. Also, performance shown in this section does not reflect the deduction of taxes that a shareholder may pay on Fund distributions or redemption or sale of Fund shares.
The returns shown are based on net asset values calculated for shareholder transactions and may differ from the returns shown in the financial highlights, which reflect adjustments made to the net asset values in accordance with accounting principles generally accepted in the United States of America.
| | | | | | |
| | | |
| 52 | | | | J.P. MORGAN EXCHANGE-TRADED FUNDS | | OCTOBER 31, 2018 |
JPMorgan U.S. Value Factor ETF
FUND COMMENTARY
Period November 8, 2017 (Fund Inception Date) Through October 31, 2018 (Unaudited)
| | | | |
REPORTING PERIOD RETURN: | | | |
JPMorgan U.S. Value Factor ETF | | | | |
Net Asset Value* | | | 3.12% | |
Market Price** | | | 3.12% | |
JP Morgan US Value Factor Index | | | 3.51% | |
Russell 1000 Index | | | 6.22% | |
| |
Net Assets as of 10/31/2018 | | $ | 28,986,509 | |
INVESTMENT OBJECTIVE***
The JPMorgan U.S. Value Factor ETF (the “Fund”) seeks investment results that closely correspond, before fees and expenses, to the performance of the JP Morgan US Value Factor Index. (the “Underlying Index”).
INVESTMENT APPROACH
The Fund is passively managed to the Underlying Index, which consists of large and mid cap U.S. equity securities selected to represent value factor characteristics. The Underlying Index uses a proprietary selection process that utilizes a value factor to identify companies of higher relative value compared with their sector peers as measured by book yield, earnings yield, dividend yield and cash flow yield. The Underlying Index’s methodology includes quarterly rebalancing.
HOW DID THE FUND PERFORM?
For the period from inception on November 8, 2017 to October 31, 2018, the Fund posted a positive absolute performance in line with the Underlying Index, before considering operating expenses, fees and tax management of the Fund’s portfolio. The Fund and the Underlying Index underperformed the Russell 1000 Index, which is a more traditional market capitalization weighted index.
On an absolute basis, the Fund’s and the Underlying Index’s allocations to the health care and telecommunications sectors were leading contributors to performance, while the Fund’s and the Underlying Index’s allocations to the industrials and basic materials sectors were leading detractors from performance.
Relative to the Russell 1000 Index, the Fund’s and the Underlying Index’s security selection in the technology and industrials sectors was a leading detractor from performance. The Fund’s and the Underlying Index’s security selection in the health care
and oil & gas sectors was a leading contributor to relative performance.
Leading individual detractors from performance relative to the Russell 1000 Index, included the Fund’s and the Underlying Index’s underweight positions in Amazon.com Inc. and Apple Inc. and its overweight position in General Electric Co. Shares of Amazon.com, an online retailer that was not held in the Fund, and the Underlying Index rose amid continued sales and earnings growth. Shares of Apple, a maker of smartphones and other consumer electronics, rose amid continued earnings and revenue growth during the reporting period. Shares of General Electric, an industrial conglomerate, fell after the company reported lower-than-expected results for several consecutive quarters and its credit rating was downgraded.
Leading individual contributors to performance relative to the Russell 1000 Index included the Fund’s and the Underlying Index’s underweight positions in Facebook Inc. and its overweight positions in Cisco Systems Inc. and NetApp Inc. Shares of Facebook, an Internet social media provider that was not held in the Fund, fell after the company reported lower-than-expected revenue and forecast slowing revenue growth. Shares of Cisco Systems, a provider of technology networking products and services, rose after the company reported better-than-expected earnings and revenue. Shares of NetApp, a data storage and management company, rose amid continued earnings growth, a share repurchase program and an increase in the company’s dividend.
HOW WAS THE FUND POSITIONED?
During the reporting period, among the Fund’s largest allocations were the technology and health care sectors and among its smallest allocations were the real estate and materials sectors.
| | | | | | | | |
| | | |
| OCTOBER 31, 2018 | | J.P. MORGAN EXCHANGE-TRADED FUNDS | | | | | 53 | |
JPMorgan U.S. Value Factor ETF
FUND COMMENTARY
Period November 8, 2017 (Fund Inception Date) Through October 31, 2018 (Unaudited) (continued)
| | | | | | | | |
| TOP TEN EQUITY HOLDINGS OF THE PORTFOLIO**** | |
| | 1. | | | Apple, Inc. | | | 2.1 | % |
| | 2. | | | Microsoft Corp. | | | 2.1 | |
| | 3. | | | Pfizer, Inc. | | | 1.9 | |
| | 4. | | | Wells Fargo & Co. | | | 1.9 | |
| | 5. | | | Johnson & Johnson | | | 1.8 | |
| | 6. | | | Intel Corp. | | | 1.8 | |
| | 7. | | | Cisco Systems, Inc. | | | 1.8 | |
| | 8. | | | Exxon Mobil Corp. | | | 1.7 | |
| | 9. | | | Procter & Gamble Co. (The) | | | 1.6 | |
| | 10. | | | UnitedHealth Group, Inc. | | | 1.6 | |
| | | | |
PORTFOLIO COMPOSITION BY SECTOR**** | |
| Technology | | | 20.4 | % |
| Financials | | | 16.5 | |
| Health Care | | | 14.2 | |
| Consumer Services | | | 14.2 | |
| Industrials | | | 11.4 | |
| Consumer Goods | | | 7.9 | |
| Oil & Gas | | | 5.8 | |
| Utilities | | | 3.0 | |
| Telecommunications | | | 2.1 | |
| Basic Materials | | | 1.9 | |
| Short-Term Investment | | | 2.4 | |
| Investment of cash collateral from securities loaned | | | 0.2 | |
| * | | The return shown is based on net asset value calculated for shareholder transactions and may differ from the return shown in the financial highlights, which reflects adjustments made to the net asset value in accordance with accounting principles generally accepted in the United States of America. The net asset value was $25.21 as of October 31, 2018. |
| ** | | Market price return is calculated assuming an initial investment made at the inception date net asset value, reinvestment of all dividends and distributions at market price during the period, and sale at the market price on the last day of the period. The price used to calculate the market price return is the midpoint of the bid/ask spread at the close of business on the NYSE Arca. The midpoint price was $25.21 as of October 31, 2018. |
| *** | | The adviser seeks to achieve the Fund’s objective. There can be no guarantee it will be achieved. |
| **** | | Percentages indicated are based on total investments as of October 31, 2018. The Fund’s composition is subject to change. |
| | | | | | |
| | | |
| 54 | | | | J.P. MORGAN EXCHANGE-TRADED FUNDS | | OCTOBER 31, 2018 |
| | | | | | | | |
TOTAL RETURNS AS OF OCTOBER 31, 2018 (Unaudited) | |
| | | INCEPTION DATE | | | CUMULATIVE
SINCE
INCEPTION | |
JPMorgan U.S. Value Factor ETF | | | | | | | | |
Net Asset Value | | | November 8, 2017 | | | | 3.12% | |
Market Price | | | | | | | 3.12% | |
LIFE OF FUND PERFORMANCE (11/8/17 TO 10/31/18)
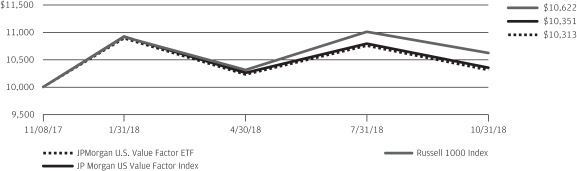
The performance quoted is past performance and is not a guarantee of future results. Exchange-traded funds are subject to certain market risks. Investment returns and principal value of an investment will fluctuate so that an investor’s shares, when sold or redeemed, may be worth more or less than their original cost. Current performance may be higher or lower than the performance data shown. For up-to-date, month-end performance information please call 1-844-457-6383.
Fund commenced operations on November 8, 2017.
The graph illustrates comparative performance for $10,000 invested in shares of the JPMorgan U.S. Value Factor ETF, the JP Morgan US Value Factor Index, and the Russell 1000 Index from November 8, 2017 to October 31, 2018. The performance of the Fund reflects the deduction of Fund expenses and assumes reinvestment of all dividends and capital gain distributions, if any. The performance of the JP Morgan US Value Factor Index and Russell 1000 Index does not reflect the deduction of expenses associated with an exchange-traded fund and has been adjusted to reflect reinvestment of all dividends and capital gain distributions of the securities included in the Index, if applicable. The
Fund’s adviser is a sponsor of the JP Morgan US Value Factor Index and developed the proprietary factors on which the index is based. FTSE International Limited, the benchmark administrator, administers, calculates and governs the JP Morgan US Value Factor Index. The Russell 1000 Index is a market-capitalization weighted index, which measures the performance of the 1,000 largest companies in the Russell 3000 Index. Investors cannot invest directly in an index.
Fund performance reflects the waiver of the Fund’s fees and reimbursement of expenses for certain periods since the inception date. Without these waivers and reimbursements, performance would have been lower. Also, performance shown in this section does not reflect the deduction of taxes that a shareholder may pay on Fund distributions or redemption or sale of Fund shares.
The returns shown are based on net asset values calculated for shareholder transactions and may differ from the returns shown in the financial highlights, which reflect adjustments made to the net asset values in accordance with accounting principles generally accepted in the United States of America.
| | | | | | | | |
| | | |
| OCTOBER 31, 2018 | | J.P. MORGAN EXCHANGE-TRADED FUNDS | | | | | 55 | |
JPMorgan BetaBuilders Canada ETF
SCHEDULE OF PORTFOLIO INVESTMENTS
AS OF OCTOBER 31, 2018
| | | | | | | | |
| SHARES | | | INVESTMENTS | | VALUE($) | |
| | | | | | | | |
| Common Stocks — 99.2%
| | | | |
| | | | Aerospace & Defense — 0.7% | |
| | 3,261,663 | | | Bombardier, Inc., Class B* | | | 7,903,608 | |
| | 415,341 | | | CAE, Inc. | | | 7,325,928 | |
| | | | | | | | |
| | | | | | | 15,229,536 | |
| | | | | | | | |
| | | | Airlines — 0.4% | |
| | 422,487 | | | Air Canada* | | | 8,016,807 | |
| | | | | | | | |
| | | | Auto Components — 1.2% | |
| | 494,325 | | | Magna International, Inc. | | | 24,336,058 | |
| | | | | | | | |
| | | | Banks — 28.4% | |
| | 992,083 | | | Bank of Montreal (a) | | | 74,177,317 | |
| | 1,909,679 | | | Bank of Nova Scotia (The) | | | 102,486,856 | |
| | 687,150 | | | Canadian Imperial Bank of Commerce | | | 59,337,774 | |
| | 524,181 | | | National Bank of Canada | | | 23,795,098 | |
| | 2,234,404 | | | Royal Bank of Canada | | | 162,804,536 | |
| | 2,835,258 | | | Toronto-Dominion Bank (The) | | | 157,285,800 | |
| | | | | | | | |
| | | | | | | 579,887,381 | |
| | | | | | | | |
| | | | Capital Markets — 4.0% | |
| | 1,353,818 | | | Brookfield Asset Management, Inc., Class A | | | 55,244,865 | |
| | 372,965 | | | CI Financial Corp. | | | 5,516,069 | |
| | 130,559 | | | IGM Financial, Inc. | | | 3,206,329 | |
| | 313,810 | | | Thomson Reuters Corp. | | | 14,605,294 | |
| | 55,246 | | | TMX Group Ltd. | | | 3,474,356 | |
| | | | | | | | |
| | | | | | | 82,046,913 | |
| | | | | | | | |
| | | | Chemicals — 2.9% | |
| | 123,184 | | | Methanex Corp. | | | 7,977,087 | |
| | 954,021 | | | Nutrien Ltd. | | | 50,503,797 | |
| | | | | | | | |
| | | | | | | 58,480,884 | |
| | | | | | | | |
| | | | Commercial Services & Supplies — 1.8% | |
| | 167,652 | | | Ritchie Bros Auctioneers, Inc. | | | 5,639,129 | |
| | 408,417 | | | Waste Connections, Inc. | | | 31,222,672 | |
| | | | | | | | |
| | | | | | | 36,861,801 | |
| | | | | | | | |
| | | | Construction & Engineering — 0.7% | |
| | 272,259 | | | SNC-Lavalin Group, Inc. | | | 9,720,212 | |
| | 98,529 | | | WSP Global, Inc. | | | 4,918,778 | |
| | | | | | | | |
| | | | | | | 14,638,990 | |
| | | | | | | | |
| | | | Containers & Packaging — 0.5% | |
| | 223,669 | | | CCL Industries, Inc., Class B | | | 9,409,236 | |
| | | | | | | | |
| | | | Diversified Financial Services — 0.4% | |
| | 126,613 | | | Onex Corp. | | | 8,324,171 | |
| | | | | | | | |
| | | | Diversified Telecommunication Services — 1.4% | |
| | 459,542 | | | BCE, Inc. | | | 17,785,457 | |
| | 304,985 | | | TELUS Corp. | | | 10,443,787 | |
| | | | | | | | |
| | | | | | | 28,229,244 | |
| | | | | | | | |
| | | | | | | | |
| SHARES | | | INVESTMENTS | | VALUE($) | |
| | | | | | | | |
| | | | | | | | |
| | | | Electric Utilities — 1.9% | |
| | 359,425 | | | Emera, Inc. | | | 11,090,314 | |
| | 658,734 | | | Fortis, Inc. | | | 21,766,819 | |
| | 471,280 | | | Hydro One Ltd. (b) | | | 6,855,567 | |
| | | | | | | | |
| | | | | | | 39,712,700 | |
| | | | | | | | |
| | | | Equity Real Estate Investment Trusts (REITs) — 0.4% | |
| | 217,077 | | | H&R | | | 3,283,074 | |
| | 237,007 | | | RioCan | | | 4,320,839 | |
| | | | | | | | |
| | | | | | | 7,603,913 | |
| | | | | | | | |
| | | | Food & Staples Retailing — 3.3% | |
| | 677,975 | | | Alimentation Couche-Tard, Inc., Class B | | | 32,378,205 | |
| | 247,771 | | | Empire Co. Ltd., Class A | | | 4,507,665 | |
| | 73,390 | | | George Weston Ltd. | | | 5,337,911 | |
| | 278,866 | | | Loblaw Cos. Ltd. | | | 13,947,007 | |
| | 373,560 | | | Metro, Inc. | | | 11,722,256 | |
| | | | | | | | |
| | | | | | | 67,893,044 | |
| | | | | | | | |
| | | | Food Products — 0.5% | |
| | 343,145 | | | Saputo, Inc. | | | 10,455,047 | |
| | | | | | | | |
| | | | Gas Utilities — 0.2% | |
| | 412,597 | | | AltaGas Ltd. (a) | | | 5,187,041 | |
| | | | | | | | |
| | | | Hotels, Restaurants & Leisure — 1.0% | |
| | 387,543 | | | Restaurant Brands International, Inc. | | | 21,231,039 | |
| | | | | | | | |
| | | | Insurance — 7.7% | |
| | 43,197 | | | Fairfax Financial Holdings Ltd. | | | 20,990,635 | |
| | 429,218 | | | Great-West Lifeco, Inc. | | | 9,849,729 | |
| | 170,010 | | | Industrial Alliance Insurance & Financial Services, Inc. | | | 6,010,304 | |
| | 215,670 | | | Intact Financial Corp. | | | 17,039,642 | |
| | 3,074,955 | | | Manulife Financial Corp. | | | 48,420,994 | |
| | 569,065 | | | Power Corp. of Canada | | | 11,749,164 | |
| | 376,417 | | | Power Financial Corp. | | | 8,106,211 | |
| | 941,162 | | | Sun Life Financial, Inc. | | | 34,466,497 | |
| | | | | | | | |
| | | | | | | 156,633,176 | |
| | | | | | | | |
| | | | IT Services — 2.2% | |
| | 390,256 | | | CGI Group, Inc., Class A* | | | 24,101,039 | |
| | 145,444 | | | Shopify, Inc., Class A* (a) | | | 20,093,357 | |
| | | | | | | | |
| | | | | | | 44,194,396 | |
| | | | | | | | |
| | | | Media — 0.8% | |
| | 241,917 | | | Quebecor, Inc., Class B | | | 4,744,804 | |
| | 681,790 | | | Shaw Communications, Inc., Class B | | | 12,693,739 | |
| | | | | | | | |
| | | | | | | 17,438,543 | |
| | | | | | | | |
SEE NOTES TO FINANCIAL STATEMENTS.
| | | | | | |
| | | |
| 56 | | | | J.P. MORGAN EXCHANGE-TRADED FUNDS | | OCTOBER 31, 2018 |
| | | | | | | | |
| SHARES | | | INVESTMENTS | | VALUE($) | |
| | | | | | | | |
| | Common Stocks — continued | | | | |
| | | | Metals & Mining — 5.8% | |
| | 363,074 | | | Agnico Eagle Mines Ltd. | | | 12,824,597 | |
| | 1,809,747 | | | Barrick Gold Corp. | | | 22,669,093 | |
| | 1,068,840 | | | First Quantum Minerals Ltd. (Zambia) | | | 10,668,508 | |
| | 288,673 | | | Franco-Nevada Corp. | | | 18,029,317 | |
| | 1,347,697 | | | Goldcorp, Inc. | | | 12,172,219 | |
| | 1,938,450 | | | Kinross Gold Corp.* | | | 5,035,891 | |
| | 987,398 | | | Lundin Mining Corp. (Chile) | | | 4,057,749 | |
| | 782,109 | | | Teck Resources Ltd., Class B | | | 16,165,586 | |
| | 1,528,716 | | | Turquoise Hill Resources Ltd. (Mongolia)* | | | 2,577,956 | |
| | 687,745 | | | Wheaton Precious Metals Corp. | | | 11,305,254 | |
| | 1,471,469 | | | Yamana Gold, Inc. (Brazil) | | | 3,342,088 | |
| | | | | | | | |
| | | | | | | 118,848,258 | |
| | | | | | | | |
| | | | Multiline Retail — 1.2% | |
| | 95,177 | | | Canadian Tire Corp. Ltd., Class A (a) | | | 10,710,259 | |
| | 466,153 | | | Dollarama, Inc. | | | 12,892,727 | |
| | | | | | | | |
| | | | | | | 23,602,986 | |
| | | | | | | | |
| | | | Multi-Utilities — 0.4% | |
| | 116,546 | | | Atco Ltd., Class I | | | 3,397,801 | |
| | 184,439 | | | Canadian Utilities Ltd., Class A | | | 4,375,427 | |
| | | | | | | | |
| | | | | | | 7,773,228 | |
| | | | | | | | |
| | | | Oil, Gas & Consumable Fuels — 19.5% | |
| | 548,626 | | | ARC Resources Ltd. | | | 5,109,313 | |
| | 613,636 | | | Cameco Corp. | | | 6,572,424 | |
| | 1,893,228 | | | Canadian Natural Resources Ltd. | | | 51,945,304 | |
| | 1,581,133 | | | Cenovus Energy, Inc. | | | 13,379,788 | |
| | 851,626 | | | Crescent Point Energy Corp. (a) | | | 4,023,786 | |
| | 2,659,712 | | | Enbridge, Inc. | | | 82,875,450 | |
| | 1,482,548 | | | Encana Corp. | | | 15,135,740 | |
| | 467,638 | | | Husky Energy, Inc. | | | 6,610,766 | |
| | 371,840 | | | Imperial Oil Ltd. | | | 11,614,616 | |
| | 601,155 | | | Inter Pipeline Ltd. | | | 9,749,447 | |
| | 322,192 | | | Keyera Corp. | | | 8,027,572 | |
| | 784,046 | | | Pembina Pipeline Corp. | | | 25,359,625 | |
| | 324,180 | | | PrairieSky Royalty Ltd. (a) | | | 4,925,064 | |
| | 426,212 | | | Seven Generations Energy Ltd., Class A* | | | 4,568,234 | |
| | 2,523,851 | | | Suncor Energy, Inc. | | | 84,661,977 | |
| | 392,174 | | | Tourmaline Oil Corp. | | | 5,719,732 | |
| | 1,406,611 | | | TransCanada Corp. | | | 53,039,743 | |
| | 236,270 | | | Vermilion Energy, Inc. (a) | | | 6,265,476 | |
| | | | | | | | |
| | | | | | | 399,584,057 | |
| | | | | | | | |
| | | | Pharmaceuticals — 0.5% | |
| | 475,860 | | | Bausch Health Cos., Inc.* | | | 10,887,541 | |
| | | | | | | | |
| | | | | | | | |
| SHARES | | | INVESTMENTS | | VALUE($) | |
| | | | | | | | |
| | | | | | | | |
| | | | Road & Rail — 7.0% | |
| | 1,138,355 | | | Canadian National Railway Co. | | | 97,315,107 | |
| | 220,978 | | | Canadian Pacific Railway Ltd. | | | 45,316,898 | |
| | | | | | | | |
| | | | | | | 142,632,005 | |
| | | | | | | | |
| | | | Software — 2.1% | |
| | 749,636 | | | BlackBerry Ltd.* | | | 6,918,666 | |
| | 30,627 | | | Constellation Software, Inc. | | | 21,078,179 | |
| | 415,326 | | | Open Text Corp. | | | 14,020,348 | |
| | | | | | | | |
| | | | | | | 42,017,193 | |
| | | | | | | | |
| | | | Textiles, Apparel & Luxury Goods — 0.5% | |
| | 322,824 | | | Gildan Activewear, Inc. | | | 9,649,530 | |
| | | | | | | | |
| | | | Thrifts & Mortgage Finance — 0.1% | |
| | 59,861 | | | Genworth MI Canada, Inc. (a) | | | 1,964,825 | |
| | | | | | | | |
| | | | Trading Companies & Distributors — 0.3% | |
| | 260,755 | | | Finning International, Inc. | | | 5,415,353 | |
| | | | | | | | |
| | | | Wireless Telecommunication Services — 1.4% | |
| | 556,864 | | | Rogers Communications, Inc., Class B | | | 28,675,461 | |
| | | | | | | | |
| | | | Total Common Stocks
(Cost $2,159,812,603) | | | 2,026,860,357 | |
| | | | | | | | |
| Short-Term Investments — 0.0% (c)
| | | | |
| | | | Investment Companies — 0.0% (c) | | | | |
| | 190,063 | | | JPMorgan U.S. Government Money Market Fund Class Institutional Shares, 2.02% (d) (e)
(Cost $190,063) | | | 190,063 | |
| | | | | | | | |
| Investment of Cash Collateral from Securities Loaned — 3.5%
|
|
| | 1,992,504 | | | JPMorgan Prime Money Market Fund Class IM Shares, 1.88% (d) (e) | | | 1,992,902 | |
| | 50,004,700 | | | JPMorgan Securities Lending Money Market Fund Class Agency SL Shares,
2.27% (d) (e) | | | 49,999,700 | |
| | 19,883,026 | | | JPMorgan U.S. Government Money Market Fund Class IM Shares, 2.07% (d) (e) | | | 19,883,026 | |
| | | | | | | | |
| | | | Total Investment of Cash Collateral From Securities Loaned
(Cost $71,875,827) | | | 71,875,628 | |
| | | | | | | | |
| | | | Total Investments — 102.7% (Cost $2,231,878,493) | | | 2,098,926,048 | |
| | | | Liabilities in Excess of
Other Assets — (2.7%) | | | (54,227,222 | ) |
| | | | | | | | |
| | | | NET ASSETS — 100.0% | | | 2,044,698,826 | |
| | | | | | | | |
Percentages indicated are based on net assets.
SEE NOTES TO FINANCIAL STATEMENTS.
| | | | | | | | |
| | | |
| OCTOBER 31, 2018 | | J.P. MORGAN EXCHANGE-TRADED FUNDS | | | | | 57 | |
JPMorgan BetaBuilders Canada ETF
SCHEDULE OF PORTFOLIO INVESTMENTS
AS OF OCTOBER 31, 2018 (continued)
| | |
| (a) | | — The security or a portion of this security is on loan at October 31, 2018. The total value of securities on loan at October 31, 2018 was $63,988,967. |
| (b) | | — Security exempt from registration pursuant to Regulation S under the Securities Act of 1933, as amended. Regulation S applies to securities offerings that are made outside of the United States and do not involve direct selling efforts in the United States and as such may have restrictions on resale. |
| (c) | | — Amount rounds to less than 0.1% of net assets. |
| (d) | | — Investment in affiliate. Fund is registered under the Investment Company Act of 1940, as amended, and advised by J.P. Morgan Investment Management Inc. |
| (e) | | — The rate shown is the current yield as of October 31, 2018. |
| * | | — Non-income producing security. |
| | | | | | | | | | | | | | | | | | |
| Futures contracts outstanding as of October 31, 2018: | |
| DESCRIPTION | | NUMBER OF
CONTRACTS | | EXPIRATION
DATE | | | TRADING
CURRENCY | | | NOTIONAL
AMOUNT ($) | | | VALUE AND
UNREALIZED
APPRECIATION
(DEPRECIATION) ($) | |
Long Contracts | | | | | | | | | | | | | | | | | | |
| S&P/TSX 60 Index | | 123 | | | 12/2018 | | | | CAD | | | | 16,674,070 | | | | (382,489 | ) |
| | | | | | | | | | | | | | | | | | |
| | | | | | | | | | | | | | | | | (382,489 | ) |
| | | | | | | | | | | | | | | | | | |
Abbreviations
| | |
| CAD | | — Canadian Dollar |
| TSX | | — Toronto Stock Exchange |
SEE NOTES TO FINANCIAL STATEMENTS.
| | | | | | |
| | | |
| 58 | | | | J.P. MORGAN EXCHANGE-TRADED FUNDS | | OCTOBER 31, 2018 |
JPMorgan BetaBuilders Developed Asia ex-Japan ETF
SCHEDULE OF PORTFOLIO INVESTMENTS
AS OF OCTOBER 31, 2018
| | | | | | | | |
| SHARES | | | INVESTMENTS | | VALUE($) | |
| | | | | | | | |
| | Common Stocks — 99.5% | | | | |
| | | | Australia — 56.8% | | | | |
| | 251,874 | | | AGL Energy Ltd. | | | 3,216,545 | |
| | 892,018 | | | Alumina Ltd. | | | 1,618,864 | |
| | 443,335 | | | Amcor Ltd. | | | 4,183,403 | |
| | 1,120,555 | | | AMP Ltd. | | | 1,964,928 | |
| | 451,662 | | | APA Group | | | 3,075,818 | |
| | 243,892 | | | Aristocrat Leisure Ltd. | | | 4,595,885 | |
| | 74,099 | | | ASX Ltd. | | | 3,112,208 | |
| | 761,824 | | | Aurizon Holdings Ltd. | | | 2,269,730 | |
| | 662,061 | | | AusNet Services | | | 803,024 | |
| | 1,107,942 | | | Australia & New Zealand Banking Group Ltd. | | | 20,393,514 | |
| | 184,559 | | | Bendigo & Adelaide Bank Ltd. | | | 1,341,104 | |
| | 1,228,481 | | | BHP Billiton Ltd. | | | 28,345,546 | |
| | 210,608 | | | BlueScope Steel Ltd. | | | 2,158,863 | |
| | 448,759 | | | Boral Ltd. | | | 1,787,754 | |
| | 607,960 | | | Brambles Ltd. | | | 4,579,730 | |
| | 99,841 | | | Caltex Australia Ltd. | | | 1,997,700 | |
| | 219,604 | | | Challenger Ltd. | | | 1,599,346 | |
| | 37,410 | | | CIMIC Group Ltd. | | | 1,256,040 | |
| | 194,006 | | | Coca-Cola Amatil Ltd. | | | 1,365,357 | |
| | 21,929 | | | Cochlear Ltd. | | | 2,763,343 | |
| | 673,669 | | | Commonwealth Bank of Australia | | | 33,124,882 | |
| | 192,406 | | | Computershare Ltd. | | | 2,701,895 | |
| | 137,120 | | | Crown Resorts Ltd. | | | 1,220,077 | |
| | 173,208 | | | CSL Ltd. | | | 23,122,774 | |
| | 386,320 | | | Dexus, REIT | | | 2,791,286 | |
| | 23,853 | | | Domino’s Pizza Enterprises Ltd. | | | 914,209 | |
| | 22,051 | | | Flight Centre Travel Group Ltd. | | | 727,396 | |
| | 655,209 | | | Fortescue Metals Group Ltd. | | | 1,864,941 | |
| | 613,509 | | | Goodman Group, REIT | | | 4,508,953 | |
| | 687,059 | | | GPT Group (The), REIT | | | 2,512,729 | |
| | 241,610 | | | Harvey Norman Holdings Ltd. | | | 546,937 | |
| | 497,286 | | | Healthscope Ltd. | | | 746,094 | |
| | 160,191 | | | Iluka Resources Ltd. | | | 920,011 | |
| | 641,431 | | | Incitec Pivot Ltd. | | | 1,777,317 | |
| | 884,539 | | | Insurance Australia Group Ltd. | | | 4,278,218 | |
| | 223,351 | | | LendLease Group | | | 2,789,333 | |
| | 121,146 | | | Macquarie Group Ltd. | | | 10,102,630 | |
| | 1,054,239 | | | Medibank Pvt Ltd. | | | 2,090,310 | |
| | 1,418,322 | | | Mirvac Group, REIT | | | 2,181,714 | |
| | 1,044,732 | | | National Australia Bank Ltd. | | | 18,710,648 | |
| | 292,206 | | | Newcrest Mining Ltd. | | | 4,277,374 | |
| | 143,523 | | | Orica Ltd. | | | 1,748,663 | |
| | 672,881 | | | Origin Energy Ltd.* | | | 3,487,042 | |
| | 320,063 | | | Qantas Airways Ltd. | | | 1,242,406 | |
| | 522,506 | | | QBE Insurance Group Ltd. | | | 4,198,186 | |
| | | | | | | | |
| SHARES | | | INVESTMENTS | | VALUE($) | |
| | | | | | | | |
| | | | | | | | |
| | | | Australia — continued | | | | |
| | 49,507 | | | Ramsay Health Care Ltd. | | | 1,976,080 | |
| | 18,654 | | | REA Group Ltd. | | | 949,364 | |
| | 157,873 | | | Rio Tinto Ltd. | | | 8,590,236 | |
| | 674,396 | | | Santos Ltd. | | | 3,165,329 | |
| | 2,038,145 | | | Scentre Group, REIT | | | 5,741,986 | |
| | 134,230 | | | SEEK Ltd. | | | 1,705,391 | |
| | 41,554 | | | Seven Group Holdings Ltd. | | | 524,967 | |
| | 162,532 | | | Sonic Healthcare Ltd. | | | 2,601,301 | |
| | 1,967,065 | | | South32 Ltd. | | | 5,073,360 | |
| | 931,919 | | | Stockland, REIT | | | 2,383,955 | |
| | 496,117 | | | Suncorp Group Ltd. | | | 4,932,939 | |
| | 422,312 | | | Sydney Airport | | | 1,930,207 | |
| | 769,459 | | | Tabcorp Holdings Ltd. | | | 2,525,125 | |
| | 1,593,470 | | | Telstra Corp. Ltd. | | | 3,485,620 | |
| | 130,572 | | | TPG Telecom Ltd. | | | 664,845 | |
| | 998,316 | | | Transurban Group | | | 8,029,806 | |
| | 275,102 | | | Treasury Wine Estates Ltd. | | | 2,961,076 | |
| | 1,230,108 | | | Vicinity Centres, REIT | | | 2,307,529 | |
| | 434,032 | | | Wesfarmers Ltd. | | | 14,374,146 | |
| | 1,314,844 | | | Westpac Banking Corp. | | | 24,976,421 | |
| | 358,320 | | | Woodside Petroleum Ltd. | | | 8,821,939 | |
| | 502,742 | | | Woolworths Group Ltd. | | | 10,147,045 | |
| | | | | | | | |
| | | | | | | 342,883,394 | |
| | | | | | | | |
| | | | China — 0.1% | | | | |
| | 876,100 | | | Yangzijiang Shipbuilding Holdings Ltd. | | | 785,579 | |
| | | | | | | | |
| | | | Hong Kong — 27.1% | | | | |
| | 4,623,000 | | | AIA Group Ltd. | | | 35,167,377 | |
| | 97,300 | | | ASM Pacific Technology Ltd. | | | 843,860 | |
| | 558,800 | | | Bank of East Asia Ltd. (The) | | | 1,811,798 | |
| | 378,000 | | | Cathay Pacific Airways Ltd. | | | 481,601 | |
| | 183,500 | | | Chinese Estates Holdings Ltd. | | | 172,704 | |
| | 421,400 | | | Chow Tai Fook Jewellery Group Ltd. | | | 369,756 | |
| | 1,018,000 | | | CK Asset Holdings Ltd. | | | 6,624,888 | |
| | 1,063,500 | | | CK Hutchison Holdings Ltd. | | | 10,711,704 | |
| | 283,000 | | | CK Infrastructure Holdings Ltd. | | | 2,071,173 | |
| | 694,500 | | | CLP Holdings Ltd. | | | 7,782,176 | |
| | 114,200 | | | Dairy Farm International Holdings Ltd. | | | 1,031,710 | |
| | 958,000 | | | Galaxy Entertainment Group Ltd. | | | 5,201,111 | |
| | 30,000 | | | Guoco Group Ltd. | | | 505,417 | |
| | 325,000 | | | Hang Lung Group Ltd. | | | 800,130 | |
| | 760,000 | | | Hang Lung Properties Ltd. | | | 1,377,632 | |
| | 278,200 | | | Hang Seng Bank Ltd. | | | 6,523,117 | |
| | 571,000 | | | Henderson Land Development Co. Ltd. | | | 2,663,190 | |
| | 878,500 | | | HK Electric Investments & HK Electric Investments Ltd. (a) | | | 835,712 | |
SEE NOTES TO FINANCIAL STATEMENTS.
| | | | | | | | |
| | | |
| OCTOBER 31, 2018 | | J.P. MORGAN EXCHANGE-TRADED FUNDS | | | | | 59 | |
JPMorgan BetaBuilders Developed Asia ex-Japan ETF
SCHEDULE OF PORTFOLIO INVESTMENTS
AS OF OCTOBER 31, 2018 (continued)
| | | | | | | | |
| SHARES | | | INVESTMENTS | | VALUE($) | |
| | | | | | | | |
| | Common Stocks — continued | | | | |
| | | | Hong Kong — continued | | | | |
| | 1,388,000 | | | HKT Trust & HKT Ltd. | | | 1,914,286 | |
| | 3,418,000 | | | Hong Kong & China Gas Co. Ltd. | | | 6,528,858 | |
| | 453,300 | | | Hong Kong Exchanges & Clearing Ltd. | | | 12,069,917 | |
| | 241,000 | | | Hopewell Holdings Ltd. | | | 744,643 | |
| | 2,067,200 | | | Hutchison Port Holdings Trust | | | 508,511 | |
| | 238,000 | | | Hysan Development Co. Ltd. | | | 1,116,148 | |
| | 121,100 | | | Jardine Matheson Holdings Ltd. | | | 6,992,730 | |
| | 67,800 | | | Jardine Strategic Holdings Ltd. | | | 2,277,575 | |
| | 227,000 | | | Kerry Properties Ltd. | | | 714,664 | |
| | 1,192,000 | | | Kingston Financial Group Ltd. | | | 276,218 | |
| | 2,348,000 | | | Li & Fung Ltd. | | | 465,990 | |
| | 188,000 | | | Lifestyle International Holdings Ltd. | | | 325,096 | |
| | 814,000 | | | Link REIT, REIT | | | 7,234,096 | |
| | 607,000 | | | MTR Corp. Ltd. | | | 2,945,306 | |
| | 2,185,000 | | | New World Development Co. Ltd. | | | 2,779,680 | |
| | 614,000 | | | NWS Holdings Ltd. | | | 1,218,678 | |
| | 74,000 | | | Orient Overseas International Ltd.* | | | 434,744 | |
| | 1,687,000 | | | PCCW Ltd. | | | 926,280 | |
| | 496,500 | | | Power Assets Holdings Ltd. | | | 3,315,586 | |
| | 496,000 | | | Shangri-La Asia Ltd. | | | 677,534 | |
| | 1,244,000 | | | Sino Land Co. Ltd. | | | 1,954,330 | |
| | 588,500 | | | Sun Hung Kai Properties Ltd. | | | 7,648,255 | |
| | 188,000 | | | Swire Pacific Ltd., Class A | | | 1,953,074 | |
| | 342,500 | | | Swire Pacific Ltd., Class B | | | 552,818 | |
| | 402,800 | | | Swire Properties Ltd. | | | 1,376,499 | |
| | 559,500 | | | Techtronic Industries Co. Ltd. | | | 2,634,557 | |
| | 3,595,000 | | | WH Group Ltd. (a) | | | 2,524,642 | |
| | 441,000 | | | Wharf Holdings Ltd. (The) | | | 1,102,412 | |
| | 439,000 | | | Wharf Real Estate Investment Co. Ltd. | | | 2,728,006 | |
| | 296,000 | | | Wheelock & Co. Ltd. | | | 1,582,422 | |
| | 269,000 | | | Yue Yuen Industrial Holdings Ltd. | | | 738,611 | |
| | | | | | | | |
| | | | | | | 163,237,222 | |
| | | | | | | | |
| | | | Ireland — 0.4% | | | | |
| | 169,732 | | | James Hardie Industries plc, CHDI | | | 2,267,255 | |
| | | | | | | | |
| | | | Luxembourg — 0.1% | | | | |
| | 152,529 | | | L’Occitane International SA | | | 285,921 | |
| | | | | | | | |
| | | | Macau — 1.0% | | | | |
| | 320,042 | | | MGM China Holdings Ltd. | | | 454,228 | |
| | 928,046 | | | Sands China Ltd. | | | 3,669,965 | |
| | 822,000 | | | SJM Holdings Ltd. | | | 666,102 | |
| | 556,909 | | | Wynn Macau Ltd. | | | 1,160,123 | |
| | | | | | | | |
| | | | | | | 5,950,418 | |
| | | | | | | | |
| | | | New Zealand — 2.1% | | | | |
| | 281,231 | | | a2 Milk Co. Ltd.* | | | 1,929,716 | |
| | 359,072 | | | Auckland International Airport Ltd. | | | 1,642,063 | |
| | | | | | | | |
| SHARES | | | INVESTMENTS | | VALUE($) | |
| | | | | | | | |
| | | | | | | | |
| | | | New Zealand — continued | | | | |
| | 274,244 | | | Contact Energy Ltd. | | | 1,002,724 | |
| | 219,147 | | | Fisher & Paykel Healthcare Corp. Ltd. | | | 1,949,390 | |
| | 326,662 | | | Fletcher Building Ltd.* | | | 1,293,885 | |
| | 239,888 | | | Mercury NZ Ltd. | | | 533,316 | |
| | 480,751 | | | Meridian Energy Ltd. | | | 986,210 | |
| | 158,859 | | | Ryman Healthcare Ltd. | | | 1,258,712 | |
| | 702,593 | | | Spark New Zealand Ltd. | | | 1,814,529 | |
| | | | | | | | |
| | | | | | | 12,410,545 | |
| | | | | | | | |
| | | | Singapore — 11.9% | | | | |
| | 975,100 | | | Ascendas, REIT | | | 1,775,551 | |
| | 1,060,700 | | | CapitaLand Commercial Trust, REIT | | | 1,325,399 | |
| | 957,000 | | | CapitaLand Ltd. | | | 2,173,814 | |
| | 1,032,700 | | | CapitaLand Mall Trust, REIT | | | 1,572,918 | |
| | 236,700 | | | City Developments Ltd. | | | 1,352,718 | |
| | 828,700 | | | ComfortDelGro Corp. Ltd. | | | 1,349,341 | |
| | 695,200 | | | DBS Group Holdings Ltd. | | | 11,795,757 | |
| | 145,000 | | | Frasers Property Ltd. | | | 165,297 | |
| | 2,167,100 | | | Genting Singapore Ltd. | | | 1,379,068 | |
| | 2,535,200 | | | Golden Agri-Resources Ltd. | | | 467,417 | |
| | 22,000 | | | Great Eastern Holdings Ltd. | | | 406,479 | |
| | 37,900 | | | Jardine Cycle & Carriage Ltd. | | | 830,032 | |
| | 555,200 | | | Keppel Corp. Ltd. | | | 2,487,547 | |
| | 691,600 | | | Keppel REIT, REIT | | | 564,565 | |
| | 807,100 | | | Mapletree North Asia Commercial Trust, REIT (a) | | | 659,291 | |
| | 353,800 | | | Olam International Ltd. | | | 460,126 | |
| | 1,524,300 | | | Oversea-Chinese Banking Corp. Ltd. | | | 11,841,457 | |
| | 256,300 | | | SATS Ltd. | | | 922,415 | |
| | 348,600 | | | Sembcorp Industries Ltd. | | | 711,695 | |
| | 311,500 | | | Sembcorp Marine Ltd. | | | 358,814 | |
| | 94,100 | | | SIA Engineering Co. Ltd. | | | 192,229 | |
| | 199,200 | | | Singapore Airlines Ltd. | | | 1,365,532 | |
| | 315,600 | | | Singapore Exchange Ltd. | | | 1,561,207 | |
| | 611,800 | | | Singapore Press Holdings Ltd. | | | 1,172,487 | |
| | 585,100 | | | Singapore Technologies Engineering Ltd. | | | 1,501,445 | |
| | 3,000,700 | | | Singapore Telecommunications Ltd. | | | 6,854,198 | |
| | 225,300 | | | StarHub Ltd. | | | 306,146 | |
| | 857,400 | | | Suntec, REIT | | | 1,097,294 | |
| | 82,100 | | | United Industrial Corp. Ltd. | | | 165,960 | |
| | 542,800 | | | United Overseas Bank Ltd. | | | 9,596,974 | |
| | 206,100 | | | UOL Group Ltd. | | | 897,697 | |
| | 102,700 | | | Venture Corp. Ltd. | | | 1,136,910 | |
| | 1,380,600 | | | Wilmar International Ltd. | | | 3,153,721 | |
| | 251,500 | | | Yanlord Land Group Ltd. | | | 229,373 | |
| | | | | | | | |
| | | | | | | 71,830,874 | |
| | | | | | | | |
SEE NOTES TO FINANCIAL STATEMENTS.
| | | | | | |
| | | |
| 60 | | | | J.P. MORGAN EXCHANGE-TRADED FUNDS | | OCTOBER 31, 2018 |
| | | | | | | | |
| SHARES | | | INVESTMENTS | | VALUE($) | |
| | | | | | | | |
| | Common Stocks — continued | | | | |
| | | | Taiwan — 0.0% (b) | | | | |
| | 590,000 | | | FIT Hon Teng Ltd. (a) | | | 244,665 | |
| | | | | | | | |
| | | | Total Common Stocks
(Cost $659,637,915) | | | 599,895,873 | |
| | | | | | | | |
| | Short-Term Investments — 0.0% (b) | | | | |
| | | | Investment Companies — 0.0% (b) | | | | |
| | 254,772 | | | JPMorgan U.S. Government Money Market Fund Class Institutional Shares, 2.02% (c) (d)
(Cost $254,772) | | | 254,772 | |
| | | | | | | | |
| | | | Total Investments — 99.5%
(Cost $659,892,687) | | | 600,150,645 | |
| | | | Other Assets Less Liabilities — 0.5% | | | 3,163,289 | |
| | | | | | | | |
| | | | NET ASSETS — 100.0% | | | 603,313,934 | |
| | | | | | | | |
Percentages indicated are based on net assets.
Abbreviations
| | |
| CHDI | | — Clearing House Electronic Subregister System (CHESS) Depository Interest |
| REIT | | — Real Estate Investment Trust |
| (a) | | — Security exempt from registration pursuant to Regulation S under the Securities Act of 1933, as amended. Regulation S applies to securities offerings that are made outside of the United States and do not involve direct selling efforts in the United States and as such may have restrictions on resale. |
| (b) | | — Amount rounds to less than 0.1% of net assets. |
| (c) | | — Investment in affiliate. Fund is registered under the Investment Company Act of 1940, as amended, and advised by J.P. Morgan Investment Management Inc. |
| (d) | | — The rate shown is the current yield as of October 31, 2018. |
| * | | — Non-income producing security. |
Summary of Investments by Industry, October 31, 2018
The following table represents the portfolio investments of the Fund by industry classifications as a percentage of total investments:
| | | | |
| INDUSTRY | | PERCENTAGE | |
Banks | | | 23.3 | % |
Metals & Mining | | | 8.8 | |
Insurance | | | 8.5 | |
Real Estate Management & Development | | | 7.2 | |
Equity Real Estate Investment Trusts (REITs) | | | 6.1 | |
Capital Markets | | | 4.5 | |
Food & Staples Retailing | | | 4.3 | |
Industrial Conglomerates | | | 4.3 | |
Hotels, Restaurants & Leisure | | | 3.9 | |
Biotechnology | | | 3.9 | |
Oil, Gas & Consumable Fuels | | | 2.9 | |
Electric Utilities | | | 2.7 | |
Diversified Telecommunication Services | | | 2.6 | |
Transportation Infrastructure | | | 2.2 | |
Gas Utilities | | | 1.6 | |
Food Products | | | 1.3 | |
Health Care Providers & Services | | | 1.1 | |
Road & Rail | | | 1.1 | |
Others (each less than 1.0%) | | | 9.7 | |
SEE NOTES TO FINANCIAL STATEMENTS.
| | | | | | | | |
| | | |
| OCTOBER 31, 2018 | | J.P. MORGAN EXCHANGE-TRADED FUNDS | | | | | 61 | |
JPMorgan BetaBuilders Developed Asia ex-Japan ETF
SCHEDULE OF PORTFOLIO INVESTMENTS
AS OF OCTOBER 31, 2018 (continued)
| | | | | | | | | | | | | | | | | | | | |
| Futures contracts outstanding as of October 31, 2018: | |
| DESCRIPTION | | NUMBER OF
CONTRACTS | | | EXPIRATION
DATE | | | TRADING
CURRENCY | | | NOTIONAL
AMOUNT ($) | | | VALUE AND
UNREALIZED
APPRECIATION
(DEPRECIATION) ($) | |
Long Contracts | |
Hang Seng Index | | | 6 | | | | 11/2018 | | | | HKD | | | | 955,523 | | | | 2,008 | |
MSCI Singapore Index | | | 12 | | | | 11/2018 | | | | SGD | | | | 297,455 | | | | 2,349 | |
SPI 200 Index | | | 18 | | | | 12/2018 | | | | AUD | | | | 1,853,449 | | | | (98,086 | ) |
| | | | | | | | | | | | | | | | | | | | |
| | | | | | | | | | | | | | | | | | | (93,729 | ) |
| | | | | | | | | | | | | | | | | | | | |
Abbreviations
| | |
| AUD | | — AustralianDollar |
| HKD | | — HongKong Dollar |
| MSCI | | — MorganStanley Capital International |
| SGD | | — SingaporeDollar |
| SPI | | — AustralianSecurities Exchange |
SEE NOTES TO FINANCIAL STATEMENTS.
| | | | | | |
| | | |
| 62 | | | | J.P. MORGAN EXCHANGE-TRADED FUNDS | | OCTOBER 31, 2018 |
JPMorgan BetaBuilders Europe ETF
SCHEDULE OF PORTFOLIO INVESTMENTS
AS OF OCTOBER 31, 2018
| | | | | | | | |
| SHARES | | | INVESTMENTS | | VALUE($) | |
| | Common Stocks — 99.3% | | | | |
| | | | Australia — 1.1% | | | | |
| | 318,465 | | | BHP Billiton plc | | | 6,352,960 | |
| | 172,619 | | | Rio Tinto plc | | | 8,380,786 | |
| | | | | | | | |
| | | | | | | 14,733,746 | |
| | | | | | | | |
| | | | Austria — 0.5% | | | | |
| | 10,818 | | | ANDRITZ AG | | | 560,698 | |
| | 5,878 | | | BAWAG Group AG (a) | | | 253,571 | |
| | 45,367 | | | Erste Group Bank AG* | | | 1,846,774 | |
| | 5,157 | | | EVN AG | | | 90,186 | |
| | 13,968 | | | IMMOFINANZ AG* | | | 332,518 | |
| | 2,003 | | | Lenzing AG | | | 181,691 | |
| | 4,782 | | | Oesterreichische Post AG | | | 194,117 | |
| | 21,718 | | | OMV AG | | | 1,206,056 | |
| | 20,337 | | | Raiffeisen Bank International AG | | | 554,260 | |
| | 2,322 | | | Strabag SE | | | 81,662 | |
| | 21,037 | | | Telekom Austria AG* | | | 156,309 | |
| | 17,707 | | | UNIQA Insurance Group AG | | | 165,372 | |
| | 10,006 | | | Verbund AG | | | 402,764 | |
| | 5,792 | | | Vienna Insurance Group AG Wiener Versicherung Gruppe | | | 153,816 | |
| | 16,618 | | | voestalpine AG | | | 589,772 | |
| | | | | | | | |
| | | | | | | 6,769,566 | |
| | | | | | | | |
| | | | Belgium — 1.9% | | | | |
| | 3,389 | | | Ackermans & van Haaren NV | | | 533,555 | |
| | 29,083 | | | Ageas | | | 1,455,169 | |
| | 150,641 | | | Anheuser-Busch InBev SA/NV | | | 11,141,612 | |
| | 14,780 | | | bpost SA | | | 224,310 | |
| | 7,894 | | | Colruyt SA | | | 458,990 | |
| | 4,555 | | | Elia System Operator SA/NV | | | 284,771 | |
| | 12,168 | | | Groupe Bruxelles Lambert SA | | | 1,131,662 | |
| | 51,553 | | | KBC Group NV | | | 3,552,829 | |
| | 23,451 | | | Proximus SADP | | | 597,482 | |
| | 2,374 | | | Sofina SA | | | 454,067 | |
| | 11,017 | | | Solvay SA | | | 1,254,917 | |
| | 8,788 | | | Telenet Group Holding NV | | | 425,765 | |
| | 19,350 | | | UCB SA | | | 1,625,014 | |
| | 31,574 | | | Umicore SA | | | 1,486,280 | |
| | | | | | | | |
| | | | | | | 24,626,423 | |
| | | | | | | | |
| | | | Chile — 0.0% (b) | | | | |
| | 52,031 | | | Antofagasta plc | | | 520,832 | |
| | | | | | | | |
| | | | Colombia — 0.0% (b) | | | | |
| | 9,092 | | | Millicom International Cellular SA, SDR | | | 513,082 | |
| | | | | | | | |
| | | | Denmark — 2.6% | | | | |
| | 491 | | | AP Moller — Maersk A/S, Class A | | | 582,672 | |
| | 981 | | | AP Moller — Maersk A/S, Class B | | | 1,238,229 | |
| | | | | | | | |
| SHARES | | | INVESTMENTS | | VALUE($) | |
| | | | | |
| | | | Denmark — continued | | | | |
| | 15,953 | | | Carlsberg A/S, Class B | | | 1,759,881 | |
| | 14,718 | | | Chr Hansen Holding A/S | | | 1,485,666 | |
| | 17,608 | | | Coloplast A/S, Class B | | | 1,643,066 | |
| | 105,374 | | | Danske Bank A/S | | | 2,016,715 | |
| | 28,342 | | | DSV A/S | | | 2,273,726 | |
| | 9,197 | | | Genmab A/S* | | | 1,258,462 | |
| | 21,961 | | | GN Store Nord A/S | | | 931,556 | |
| | 9,278 | | | H Lundbeck A/S | | | 432,741 | |
| | 24,360 | | | ISS A/S | | | 800,011 | |
| | 10,756 | | | Jyske Bank A/S (Registered) | | | 439,178 | |
| | 265,320 | | | Novo Nordisk A/S, Class B | | | 11,458,257 | |
| | 33,006 | | | Novozymes A/S, Class B | | | 1,630,002 | |
| | 25,200 | | | Orsted A/S (a) | | | 1,597,951 | |
| | 16,591 | | | Pandora A/S (c) | | | 1,037,992 | |
| | 913 | | | Rockwool International A/S, Class A | | | 261,277 | |
| | 1,073 | | | Rockwool International A/S, Class B | | | 366,600 | |
| | 18,229 | | | Tryg A/S | | | 439,428 | |
| | 31,021 | | | Vestas Wind Systems A/S | | | 1,945,339 | |
| | 17,126 | | | William Demant Holding A/S* | | | 562,961 | |
| | | | | | | | |
| | | | | | | 34,161,710 | |
| | | | | | | | |
| | | | Finland — 2.2% | | | | |
| | 17,564 | | | Amer Sports OYJ* | | | 652,885 | |
| | 22,575 | | | Elisa OYJ | | | 898,169 | |
| | 65,643 | | | Fortum OYJ | | | 1,381,831 | |
| | 14,381 | | | Huhtamaki OYJ (c) | | | 403,206 | |
| | 3,252 | | | Kesko OYJ, Class A | | | 182,517 | |
| | 10,235 | | | Kesko OYJ, Class B | | | 597,751 | |
| | 60,952 | | | Kone OYJ, Class B | | | 2,966,807 | |
| | 9,992 | | | Konecranes OYJ | | | 357,823 | |
| | 19,267 | | | Metso OYJ | | | 608,296 | |
| | 19,325 | | | Neste OYJ | | | 1,586,875 | |
| | 849,150 | | | Nokia OYJ | | | 4,796,495 | |
| | 18,728 | | | Nokian Renkaat OYJ | | | 595,707 | |
| | 480,944 | | | Nordea Bank AB | | | 4,179,825 | |
| | 4,926 | | | Orion OYJ, Class A | | | 170,443 | |
| | 15,703 | | | Orion OYJ, Class B | | | 540,173 | |
| | 48,257 | | | Outokumpu OYJ | | | 202,279 | |
| | 73,535 | | | Sampo OYJ, Class A | | | 3,381,660 | |
| | 86,795 | | | Stora Enso OYJ, Class R | | | 1,304,113 | |
| | 80,244 | | | UPM-Kymmene OYJ | | | 2,579,744 | |
| | 68,701 | | | Wartsila OYJ Abp | | | 1,168,989 | |
| | | | | | | | |
| | | | | | | 28,555,588 | |
| | | | | | | | |
| | | | France — 16.1% | | | | |
| | 29,172 | | | Accor SA | | | 1,332,939 | |
| | 4,925 | | | Aeroports de Paris | | | 1,030,078 | |
SEE NOTES TO FINANCIAL STATEMENTS.
| | | | | | | | |
| | | |
| OCTOBER 31, 2018 | | J.P. MORGAN EXCHANGE-TRADED FUNDS | | | | | 63 | |
JPMorgan BetaBuilders Europe ETF
SCHEDULE OF PORTFOLIO INVESTMENTS
AS OF OCTOBER 31, 2018 (continued)
| | | | | | | | |
| SHARES | | | INVESTMENTS | | VALUE($) | |
| | Common Stocks — continued | | | | |
| | | | France — continued | | | | |
| | 64,570 | | | Air Liquide SA | | | 7,805,623 | |
| | 86,213 | | | Airbus SE | | | 9,527,767 | |
| | 24,086 | | | Alstom SA* | | | 1,051,900 | |
| | 9,052 | | | Amundi SA (a) | | | 537,742 | |
| | 10,960 | | | Arkema SA | | | 1,149,853 | |
| | 14,158 | | | Atos SE | | | 1,210,893 | |
| | 296,354 | | | AXA SA | | | 7,416,757 | |
| | 6,424 | | | BioMerieux | | | 489,884 | |
| | 172,632 | | | BNP Paribas SA | | | 8,996,549 | |
| | 136,400 | | | Bollore SA (c) | | | 577,080 | |
| | 33,565 | | | Bouygues SA | | | 1,222,796 | |
| | 39,995 | | | Bureau Veritas SA | | | 902,290 | |
| | 24,227 | | | Capgemini SE | | | 2,958,232 | |
| | 84,491 | | | Carrefour SA | | | 1,638,600 | |
| | 8,109 | | | Casino Guichard Perrachon SA (c) | | | 357,629 | |
| | 83,664 | | | Cie de Saint-Gobain | | | 3,151,742 | |
| | 27,147 | | | Cie Generale des Etablissements Michelin SCA | | | 2,779,162 | |
| | 23,815 | | | CNP Assurances | | | 530,776 | |
| | 8,128 | | | Covivio, REIT | | | 815,572 | |
| | 184,534 | | | Credit Agricole SA | | | 2,363,411 | |
| | 97,103 | | | Danone SA | | | 6,876,192 | |
| | 346 | | | Dassault Aviation SA | | | 574,129 | |
| | 20,325 | | | Dassault Systemes SE | | | 2,544,376 | |
| | 36,078 | | | Edenred | | | 1,368,552 | |
| | 11,082 | | | Eiffage SA | | | 1,082,290 | |
| | 72,630 | | | Electricite de France SA | | | 1,203,337 | |
| | 276,397 | | | Engie SA | | | 3,672,540 | |
| | 29,928 | | | EssilorLuxottica SA | | | 4,087,521 | |
| | 25,970 | | | Eutelsat Communications SA | | | 526,012 | |
| | 8,263 | | | Gecina SA, REIT | | | 1,211,875 | |
| | 69,658 | | | Getlink | | | 876,180 | |
| | 5,417 | | | Hermes International | | | 3,092,574 | |
| | 6,794 | | | ICADE, REIT | | | 576,372 | |
| | 4,071 | | | Iliad SA | | | 470,548 | |
| | 5,543 | | | Imerys SA | | | 341,688 | |
| | 5,548 | | | Ipsen SA | | | 769,249 | |
| | 11,523 | | | JCDecaux SA | | | 378,274 | |
| | 11,226 | | | Kering SA | | | 4,989,828 | |
| | 31,278 | | | Klepierre SA, REIT | | | 1,059,931 | |
| | 18,386 | | | Lagardere SCA | | | 502,576 | |
| | 39,924 | | | Legrand SA | | | 2,607,076 | |
| | 37,056 | | | L’Oreal SA | | | 8,348,951 | |
| | 40,621 | | | LVMH Moet Hennessy Louis Vuitton SE | | | 12,324,631 | |
| | 137,750 | | | Natixis SA | | | 804,171 | |
| | 323,504 | | | Orange SA | | | 5,049,363 | |
| | | | | | | | |
| SHARES | | | INVESTMENTS | | VALUE($) | |
| | | | | | | | |
| | | | France — continued | | | | |
| | 31,201 | | | Pernod Ricard SA | | | 4,757,733 | |
| | 84,594 | | | Peugeot SA | | | 2,010,865 | |
| | 32,978 | | | Publicis Groupe SA | | | 1,908,995 | |
| | 31,210 | | | Renault SA | | | 2,330,573 | |
| | 45,508 | | | Rexel SA | | | 580,105 | |
| | 50,307 | | | Safran SA | | | 6,501,064 | |
| | 172,869 | | | Sanofi | | | 15,447,672 | |
| | 80,620 | | | Schneider Electric SE | | | 5,829,721 | |
| | 4,068 | | | SEB SA | | | 583,295 | |
| | 114,124 | | | Societe Generale SA | | | 4,183,529 | |
| | 13,647 | | | Sodexo SA (c) | | | 1,393,043 | |
| | 63,921 | | | Suez | | | 922,016 | |
| | 15,963 | | | Thales SA | | | 2,038,763 | |
| | 380,827 | | | TOTAL SA | | | 22,345,185 | |
| | 10,478 | | | Ubisoft Entertainment SA* | | | 939,903 | |
| | 20,750 | | | Unibail — Rodamco-Westfield, REIT | | | 3,754,901 | |
| | 36,220 | | | Valeo SA | | | 1,168,250 | |
| | 84,782 | | | Veolia Environnement SA | | | 1,689,662 | |
| | 77,185 | | | Vinci SA (c) | | | 6,869,416 | |
| | 115,299 | | | Vivendi SA | | | 2,780,817 | |
| | | | | | | | |
| | | | | | | 211,221,019 | |
| | | | | | | | |
| | | | Germany — 13.5% | |
| | 7,200 | | | 1&1 Drillisch AG | | | 321,165 | |
| | 27,442 | | | adidas AG | | | 6,453,366 | |
| | 64,822 | | | Allianz SE (Registered) | | | 13,503,716 | |
| | 102,841 | | | Aroundtown SA | | | 852,204 | |
| | 138,495 | | | BASF SE | | | 10,627,906 | |
| | 140,613 | | | Bayer AG (Registered) | | | 10,778,332 | |
| | 48,105 | | | Bayerische Motoren Werke AG (c) | | | 4,142,359 | |
| | 8,387 | | | Bayerische Motoren Werke AG (Preference) | | | 631,680 | |
| | 14,820 | | | Beiersdorf AG | | | 1,532,349 | |
| | 23,296 | | | Brenntag AG | | | 1,216,624 | |
| | 158,622 | | | Commerzbank AG* | | | 1,493,570 | |
| | 16,286 | | | Continental AG | | | 2,683,703 | |
| | 28,402 | | | Covestro AG (a) | | | 1,831,611 | |
| | 150,017 | | | Daimler AG (Registered) | | | 8,886,497 | |
| | 17,386 | | | Delivery Hero SE* (a) | | | 700,049 | |
| | 286,705 | | | Deutsche Bank AG (Registered) | | | 2,802,178 | |
| | 29,102 | | | Deutsche Boerse AG | | | 3,677,695 | |
| | 35,714 | | | Deutsche Lufthansa AG (Registered) | | | 716,892 | |
| | 146,424 | | | Deutsche Post AG (Registered) | | | 4,623,377 | |
| | 488,217 | | | Deutsche Telekom AG (Registered) | | | 8,007,577 | |
| | 53,480 | | | Deutsche Wohnen SE | | | 2,446,185 | |
| | 5,132 | | | DWS Group GmbH & Co. KGaA* (a) | | | 143,262 | |
| | 331,888 | | | E.ON SE | | | 3,209,377 | |
SEE NOTES TO FINANCIAL STATEMENTS.
| | | | | | |
| | | |
| 64 | | | | J.P. MORGAN EXCHANGE-TRADED FUNDS | | OCTOBER 31, 2018 |
| | | | | | | | |
| SHARES | | | INVESTMENTS | | VALUE($) | |
| | Common Stocks — continued | | | | |
| | | | Germany — continued | |
| | 22,482 | | | Evonik Industries AG | | | 695,498 | |
| | 5,568 | | | Fraport AG Frankfurt Airport Services Worldwide | | | 429,992 | |
| | 31,958 | | | Fresenius Medical Care AG & Co. KGaA | | | 2,509,230 | |
| | 61,749 | | | Fresenius SE & Co. KGaA | | | 3,924,509 | |
| | 24,765 | | | GEA Group AG | | | 752,509 | |
| | 9,089 | | | Hannover Rueck SE | | | 1,222,296 | |
| | 22,138 | | | HeidelbergCement AG | | | 1,502,383 | |
| | 15,271 | | | Henkel AG & Co. KGaA | | | 1,495,915 | |
| | 26,860 | | | Henkel AG & Co. KGaA (Preference) | | | 2,934,584 | |
| | 2,710 | | | HOCHTIEF AG | | | 401,590 | |
| | 9,556 | | | HUGO BOSS AG | | | 682,905 | |
| | 170,042 | | | Infineon Technologies AG | | | 3,407,113 | |
| | 19,264 | | | Innogy SE (a) | | | 850,779 | |
| | 28,858 | | | K+S AG (Registered) (c) | | | 537,393 | |
| | 10,151 | | | KION Group AG | | | 593,184 | |
| | 13,795 | | | LANXESS AG | | | 853,879 | |
| | 5,095 | | | MAN SE | | | 530,758 | |
| | 498 | | | MAN SE (Preference) | | | 51,217 | |
| | 19,488 | | | Merck KGaA | | | 2,085,279 | |
| | 22,542 | | | Muenchener Rueckversicherungs-Gesellschaft AG in Muenchen (Registered) | | | 4,841,696 | |
| | 23,085 | | | Porsche Automobil Holding SE (Preference) | | | 1,468,090 | |
| | 35,137 | | | ProSiebenSat.1 Media SE | | | 811,366 | |
| | 81,600 | | | RWE AG | | | 1,587,464 | |
| | 5,878 | | | RWE AG (Preference) (Non-Voting) | | | 97,724 | |
| | 163,010 | | | SAP SE | | | 17,454,049 | |
| | 128,162 | | | Siemens AG (Registered) | | | 14,731,812 | |
| | 21,103 | | | Siemens Healthineers AG* (a) | | | 873,384 | |
| | 18,397 | | | Symrise AG | | | 1,541,064 | |
| | 6,099 | | | Talanx AG | | | 217,925 | |
| | 121,099 | | | Telefonica Deutschland Holding AG | | | 470,763 | |
| | 61,019 | | | thyssenkrupp AG (c) | | | 1,279,029 | |
| | 67,223 | | | TUI AG | | | 1,110,992 | |
| | 29,240 | | | Uniper SE | | | 843,819 | |
| | 18,858 | | | United Internet AG (Registered) | | | 780,360 | |
| | 4,897 | | | Volkswagen AG | | | 806,188 | |
| | 27,671 | | | Volkswagen AG (Preference) | | | 4,648,809 | |
| | 78,113 | | | Vonovia SE | | | 3,569,490 | |
| | 17,311 | | | Wirecard AG | | | 3,238,141 | |
| | 17,889 | | | Zalando SE* (a) (c) | | | 691,502 | |
| | | | | | | | |
| | | | | | | 177,806,354 | |
| | | | | | | | |
| | | | Ghana — 0.1% | | | | |
| | 208,553 | | | Tullow Oil plc* | | | 598,352 | |
| | | | | | | | |
| | | | | | | | |
| SHARES | | | INVESTMENTS | | VALUE($) | |
| | | | | | | | |
| | | | Ireland — 0.9% | | | | |
| | 139,985 | | | Bank of Ireland Group plc | | | 989,079 | |
| | 126,507 | | | CRH plc | | | 3,773,474 | |
| | 30,334 | | | Glanbia plc | | | 536,316 | |
| | 22,793 | | | Kerry Group plc, Class A | | | 2,336,392 | |
| | 23,002 | | | Kingspan Group plc | | | 1,000,444 | |
| | 12,439 | | | Paddy Power Betfair plc | | | 1,073,584 | |
| | 13,933 | | | Ryanair Holdings plc, ADR* | | | 1,153,652 | |
| | 35,628 | | | Smurfit Kappa Group plc | | | 1,158,288 | |
| | | | | | | | |
| | | | | | | 12,021,229 | |
| | | | | | | | |
| | | | Italy — 3.3% | | | | |
| | 236,203 | | | A2A SpA | | | 380,607 | |
| | 185,451 | | | Assicurazioni Generali SpA | | | 2,992,592 | |
| | 70,917 | | | Atlantia SpA | | | 1,424,998 | |
| | 37,869 | | | Banca Mediolanum SpA | | | 219,413 | |
| | 23,166 | | | Brembo SpA | | | 256,468 | |
| | 6,138 | | | Buzzi Unicem SpA (Savings Shares) | | | 68,966 | |
| | 10,723 | | | Buzzi Unicem SpA | | | 205,905 | |
| | 85,826 | | | Davide Campari-Milano SpA | | | 660,538 | |
| | 3,614 | | | DiaSorin SpA | | | 342,799 | |
| | 1,163,927 | | | Enel SpA | | | 5,706,810 | |
| | 383,586 | | | Eni SpA | | | 6,812,392 | |
| | 18,806 | | | Ferrari NV | | | 2,202,217 | |
| | 59,421 | | | FinecoBank Banca Fineco SpA | | | 621,046 | |
| | 112,302 | | | Hera SpA | | | 309,939 | |
| | 2,375,774 | | | Intesa Sanpaolo SpA | | | 5,262,517 | |
| | 59,284 | | | Leonardo SpA | | | 642,680 | |
| | 21,046 | | | Luxottica Group SpA | | | 1,321,758 | |
| | 53,439 | | | Mediaset SpA* | | | 160,802 | |
| | 94,340 | | | Mediobanca Banca di Credito Finanziario SpA | | | 826,209 | |
| | 26,010 | | | Moncler SpA | | | 903,270 | |
| | 47,547 | | | Parmalat SpA | | | 146,483 | |
| | 55,794 | | | Pirelli & C SpA* (a) | | | 410,022 | |
| | 68,931 | | | Poste Italiane SpA (a) | | | 494,607 | |
| | 40,433 | | | Prysmian SpA | | | 785,479 | |
| | 15,406 | | | Recordati SpA | | | 521,550 | |
| | 86,896 | | | Saipem SpA* | | | 475,211 | |
| | 7,360 | | | Salvatore Ferragamo SpA | | | 174,099 | |
| | 337,823 | | | Snam SpA | | | 1,396,748 | |
| | 908,646 | | | Telecom Italia SpA | | | 459,047 | |
| | 1,742,234 | | | Telecom Italia SpA* | | | 1,024,703 | |
| | 211,199 | | | Terna Rete Elettrica Nazionale SpA | | | 1,090,947 | |
| | 318,585 | | | UniCredit SpA | | | 4,073,160 | |
| | 153,561 | | | Unione di Banche Italiane SpA | | | 468,692 | |
| | 115,205 | | | UnipolSai Assicurazioni SpA | | | 251,522 | |
| | | | | | | | |
| | | | | | | 43,094,196 | |
| | | | | | | | |
SEE NOTES TO FINANCIAL STATEMENTS.
| | | | | | | | |
| | | |
| OCTOBER 31, 2018 | | J.P. MORGAN EXCHANGE-TRADED FUNDS | | | | | 65 | |
JPMorgan BetaBuilders Europe ETF
SCHEDULE OF PORTFOLIO INVESTMENTS
AS OF OCTOBER 31, 2018 (continued)
| | | | | | | | |
| SHARES | | | INVESTMENTS | | VALUE($) | |
| | Common Stocks — continued | | | | |
| | | | Jersey — 0.1% | | | | |
| | 14,148 | | | Randgold Resources Ltd. | | | 1,112,793 | |
| | | | | | | | |
| | | | Jordan — 0.0% (b) | | | | |
| | 20,936 | | | Hikma Pharmaceuticals plc | | | 507,802 | |
| | | | | | | | |
| | | | Luxembourg — 0.5% | | | | |
| | 96,497 | | | ArcelorMittal | | | 2,407,887 | |
| | 1,701 | | | Eurofins Scientific SE | | | 857,206 | |
| | 5,834 | | | RTL Group SA | | | 374,451 | |
| | 57,824 | | | SES SA, FDR | | | 1,242,755 | |
| | 71,207 | | | Tenaris SA | | | 1,048,213 | |
| | | | | | | | |
| | | | | | | 5,930,512 | |
| | | | | | | | |
| | | | Mexico — 0.0% (b) | | | | |
| | 27,772 | | | Fresnillo plc | | | 301,162 | |
| | | | | | | | |
| | | | Netherlands — 7.1% | | | | |
| | 62,361 | | | ABN AMRO Group NV, CVA (a) | | | 1,529,565 | |
| | 211,709 | | | Aegon NV | | | 1,298,337 | |
| | 38,029 | | | Akzo Nobel NV | | | 3,193,105 | |
| | 81,040 | | | Altice Europe NV* (c) | | | 192,798 | |
| | 8,871 | | | Altice Europe NV, Class B* | | | 21,168 | |
| | 65,064 | | | ASML Holding NV | | | 11,206,892 | |
| | 12,751 | | | Boskalis Westminster (c) | | | 366,627 | |
| | 14,536 | | | EXOR NV | | | 822,084 | |
| | 12,816 | | | Gemalto NV* | | | 731,028 | |
| | 8,820 | | | GrandVision NV (a) | | | 222,419 | |
| | 12,324 | | | HAL Trust | | | 1,979,089 | |
| | 17,804 | | | Heineken Holding NV | | | 1,539,980 | |
| | 35,605 | | | Heineken NV | | | 3,203,287 | |
| | 581,677 | | | ING Groep NV | | | 6,881,818 | |
| | 188,000 | | | Koninklijke Ahold Delhaize NV | | | 4,303,416 | |
| | 27,356 | | | Koninklijke DSM NV | | | 2,388,419 | |
| | 633,732 | | | Koninklijke KPN NV | | | 1,672,118 | |
| | 141,869 | | | Koninklijke Philips NV | | | 5,291,126 | |
| | 10,018 | | | Koninklijke Vopak NV | | | 453,045 | |
| | 45,938 | | | NN Group NV | | | 1,972,492 | |
| | 9,535 | | | OCI NV* | | | 270,917 | |
| | 18,754 | | | Randstad NV | | | 943,563 | |
| | 693,182 | | | Royal Dutch Shell plc, Class A | | | 22,083,471 | |
| | 564,769 | | | Royal Dutch Shell plc, Class B | | | 18,418,770 | |
| | 43,770 | | | Wolters Kluwer NV | | | 2,483,272 | |
| | | | | | | | |
| | | | | | | 93,468,806 | |
| | | | | | | | |
| | | | Norway — 1.3% | | | | |
| | 3,702 | | | Aker ASA, Class A | | | 281,233 | |
| | 16,290 | | | Aker BP ASA | | | 534,227 | |
| | 140,309 | | | DNB ASA | | | 2,534,879 | |
| | 164,484 | | | Equinor ASA | | | 4,254,593 | |
| | | | | | | | |
| SHARES | | | INVESTMENTS | | VALUE($) | |
| | | | | | | | |
| | | | Norway — continued | | | | |
| | 28,643 | | | Gjensidige Forsikring ASA | | | 443,197 | |
| | 9,046 | | | Kongsberg Gruppen ASA | | | 148,530 | |
| | 42,221 | | | Leroy Seafood Group ASA | | | 389,211 | |
| | 62,825 | | | Marine Harvest ASA | | | 1,521,012 | |
| | 205,909 | | | Norsk Hydro ASA | | | 1,067,799 | |
| | 124,453 | | | Orkla ASA | | | 1,073,944 | |
| | 8,198 | | | Salmar ASA | | | 432,737 | |
| | 12,046 | | | Schibsted ASA, Class A | | | 416,913 | |
| | 15,372 | | | Schibsted ASA, Class B | | | 486,428 | |
| | 70,534 | | | Storebrand ASA | | | 586,198 | |
| | 99,842 | | | Telenor ASA | | | 1,830,639 | |
| | 15,402 | | | TGS NOPEC Geophysical Co. ASA | | | 514,499 | |
| | 26,543 | | | Yara International ASA | | | 1,139,845 | |
| | | | | | | | |
| | | | | | | 17,655,884 | |
| | | | | | | | |
| | | | Portugal — 0.3% | | | | |
| | 1,390,171 | | | Banco Comercial Portugues SA, Class R* | | | 373,937 | |
| | 367,814 | | | EDP — Energias de Portugal SA | | | 1,293,140 | |
| | 68,609 | | | Galp Energia SGPS SA | | | 1,192,990 | |
| | 37,004 | | | Jeronimo Martins SGPS SA | | | 454,186 | |
| | 33,535 | | | Navigator Co. SA (The) | | | 166,907 | |
| | 37,284 | | | NOS SGPS SA | | | 209,122 | |
| | 141,738 | | | Sonae SGPS SA | | | 141,619 | |
| | | | | | | | |
| | | | | | | 3,831,901 | |
| | | | | | | | |
| | | | Russia — 0.1% | | | | |
| | 49,979 | | | Evraz plc | | | 346,290 | |
| | 36,698 | | | Polymetal International plc | | | 340,359 | |
| | | | | | | | |
| | | | | | | 686,649 | |
| | | | | | | | |
| | | | South Africa — 0.5% | | | | |
| | 211,921 | | | Anglo American plc | | | 4,523,110 | |
| | 61,140 | | | Mediclinic International plc | | | 293,834 | |
| | 743,290 | | | Old Mutual Ltd. | | | 1,120,597 | |
| | | | | | | | |
| | | | | | | 5,937,541 | |
| | | | | | | | |
| | | | Spain — 4.5% | | | | |
| | 3,620 | | | Acciona SA | | | 305,352 | |
| | 41,281 | | | ACS Actividades de Construccion y Servicios SA | | | 1,545,621 | |
| | 11,082 | | | Aena SME SA (a) | | | 1,770,703 | |
| | 66,163 | | | Amadeus IT Group SA | | | 5,327,747 | |
| | 1,005,421 | | | Banco Bilbao Vizcaya Argentaria SA | | | 5,549,014 | |
| | 846,834 | | | Banco de Sabadell SA | | | 1,114,948 | |
| | 2,418,694 | | | Banco Santander SA | | | 11,508,041 | |
| | 181,410 | | | Bankia SA | | | 569,819 | |
| | 541,154 | | | CaixaBank SA (c) | | | 2,189,894 | |
| | 28,931 | | | EDP Renovaveis SA | | | 260,183 | |
SEE NOTES TO FINANCIAL STATEMENTS.
| | | | | | |
| | | |
| 66 | | | | J.P. MORGAN EXCHANGE-TRADED FUNDS | | OCTOBER 31, 2018 |
| | | | | | | | |
| SHARES | | | INVESTMENTS | | VALUE($) | |
| | Common Stocks — continued | | | | |
| | | | Spain — continued | | | | |
| | 34,191 | | | Enagas SA | | | 906,522 | |
| | 47,899 | | | Endesa SA | | | 1,001,524 | |
| | 71,354 | | | Ferrovial SA | | | 1,428,580 | |
| | 44,331 | | | Grifols SA | | | 1,262,999 | |
| | 39,145 | | | Grifols SA (Preference), Class B (c) | | | 813,494 | |
| | 912,566 | | | Iberdrola SA | | | 6,457,155 | |
| | 159,781 | | | Industria de Diseno Textil SA (c) | | | 4,503,379 | |
| | 148,598 | | | Mapfre SA | | | 444,039 | |
| | 54,325 | | | Naturgy Energy Group SA | | | 1,335,181 | |
| | 65,266 | | | Red Electrica Corp. SA | | | 1,351,428 | |
| | 197,355 | | | Repsol SA | | | 3,526,507 | |
| | 33,887 | | | Siemens Gamesa Renewable Energy SA* | | | 375,299 | |
| | 688,945 | | | Telefonica SA | | | 5,651,458 | |
| | 26,962 | | | Zardoya Otis SA | | | 184,575 | |
| | | | | | | | |
| | | | | | | 59,383,462 | |
| | | | | | | | |
| | | | Sweden — 4.3% | | | | |
| | 49,347 | | | Ahlsell AB (a) | | | 249,768 | |
| | 45,179 | | | Alfa Laval AB | | | 1,152,747 | |
| | 149,543 | | | Assa Abloy AB, Class B | | | 2,974,525 | |
| | 97,459 | | | Atlas Copco AB, Class A* | | | 2,409,359 | |
| | 58,837 | | | Atlas Copco AB, Class B* | | | 1,347,563 | |
| | 15,818 | | | Axfood AB | | | 282,178 | |
| | 41,245 | | | Boliden AB* | | | 941,901 | |
| | 41,200 | | | Castellum AB | | | 710,194 | |
| | 38,889 | | | Electrolux AB, Series B | | | 808,105 | |
| | 55,328 | | | Elekta AB, Class B | | | 701,654 | |
| | 4,349 | | | Essity AB, Class A | | | 98,818 | |
| | 91,342 | | | Essity AB, Class B | | | 2,084,558 | |
| | 14,764 | | | Fastighets AB Balder, Class B* | | | 370,270 | |
| | 32,954 | | | Getinge AB, Class B | | | 323,257 | |
| | 123,341 | | | Hennes & Mauritz AB, Class B (c) | | | 2,178,544 | |
| | 41,006 | | | Hexagon AB, Class B | | | 2,006,982 | |
| | 38,744 | | | Hexpol AB | | | 358,539 | |
| | 14,983 | | | Holmen AB, Class B | | | 343,014 | |
| | 62,082 | | | Husqvarna AB, Class B | | | 468,437 | |
| | 11,531 | | | ICA Gruppen AB (c) | | | 407,960 | |
| | 23,077 | | | Industrivarden AB, Class A | | | 492,380 | |
| | 25,178 | | | Industrivarden AB, Class C | | | 522,974 | |
| | 11,105 | | | Intrum AB (c) | | | 283,248 | |
| | 20,507 | | | Investment AB Latour, Class B | | | 248,109 | |
| | 20,204 | | | Investor AB, Class A | | | 881,061 | |
| | 68,680 | | | Investor AB, Class B | | | 2,975,655 | |
| | 36,472 | | | Kinnevik AB, Class B | | | 1,011,135 | |
| | 8,027 | | | L E Lundbergforetagen AB, Class B | | | 247,432 | |
| | 26,693 | | | Lundin Petroleum AB | | | 812,112 | |
| | | | | | | | |
| SHARES | | | INVESTMENTS | | VALUE($) | |
| | | | | | | | |
| | | | Sweden — continued | | | | |
| | 13,155 | | | NCC AB, Class B (c) | | | 196,029 | |
| | 61,715 | | | Nibe Industrier AB, Class B | | | 644,118 | |
| | 10,020 | | | Saab AB, Class B | | | 392,846 | |
| | 166,577 | | | Sandvik AB | | | 2,633,382 | |
| | 48,266 | | | Securitas AB, Class B | | | 827,211 | |
| | 242,133 | | | Skandinaviska Enskilda Banken AB, Class A | | | 2,505,689 | |
| | 56,098 | | | Skanska AB, Class B | | | 881,838 | |
| | 2,521 | | | SKF AB, Class A | | | 40,250 | |
| | 57,037 | | | SKF AB, Class B | | | 914,424 | |
| | 35,777 | | | SSAB AB, Class A | | | 142,832 | |
| | 91,913 | | | SSAB AB, Class B | | | 298,079 | |
| | 4,493 | | | Svenska Cellulosa AB SCA, Class A | | | 43,468 | |
| | 91,342 | | | Svenska Cellulosa AB SCA, Class B | | | 863,498 | |
| | 225,576 | | | Svenska Handelsbanken AB, Class A | | | 2,451,975 | |
| | 5,312 | | | Svenska Handelsbanken AB, Class B | | | 58,842 | |
| | 139,966 | | | Swedbank AB, Class A | | | 3,148,472 | |
| | 26,529 | | | Swedish Match AB | | | 1,351,353 | |
| | 24,728 | | | Swedish Orphan Biovitrum AB* | | | 504,766 | |
| | 53,108 | | | Tele2 AB, Class B | | | 603,054 | |
| | 9,075 | | | Telefonaktiebolaget LM Ericsson, Class A | | | 80,477 | |
| | 422,178 | | | Telefonaktiebolaget LM Ericsson, Class B | | | 3,675,802 | |
| | 411,330 | | | Telia Co. AB | | | 1,851,599 | |
| | 36,580 | | | Trelleborg AB, Class B | | | 659,991 | |
| | 37,862 | | | Volvo AB, Class A | | | 566,959 | |
| | 247,378 | | | Volvo AB, Class B | | | 3,694,385 | |
| | | | | | | | |
| | | | | | | 56,723,818 | |
| | | | | | | | |
| | | | Switzerland — 14.0% | | | | |
| | 290,966 | | | ABB Ltd. (Registered) | | | 5,854,685 | |
| | 25,113 | | | Adecco Group AG (Registered) | | | 1,229,784 | |
| | 7,355 | | | Baloise Holding AG (Registered) | | | 1,051,273 | |
| | 337 | | | Barry Callebaut AG (Registered) | | | 658,693 | |
| | 166 | | | Chocoladefabriken Lindt & Spruengli AG | | | 1,144,452 | |
| | 16 | | | Chocoladefabriken Lindt & Spruengli AG (Registered) | | | 1,277,268 | |
| | 78,704 | | | Cie Financiere Richemont SA (Registered) | | | 5,752,526 | |
| | 29,981 | | | Coca-Cola HBC AG* | | | 885,597 | |
| | 366,137 | | | Credit Suisse Group AG (Registered)* | | | 4,786,753 | |
| | 1,063 | | | EMS-Chemie Holding AG (Registered) | | | 585,682 | |
| | 5,583 | | | Geberit AG (Registered) | | | 2,185,956 | |
| | 1,196 | | | Givaudan SA (Registered) | | | 2,899,006 | |
| | 1,825,492 | | | Glencore plc* | | | 7,429,136 | |
| | 33,748 | | | Julius Baer Group Ltd.* | | | 1,539,070 | |
| | 7,598 | | | Kuehne + Nagel International AG (Registered) | | | 1,056,005 | |
| | 72,290 | | | LafargeHolcim Ltd. (Registered)* | | | 3,347,784 | |
SEE NOTES TO FINANCIAL STATEMENTS.
| | | | | | | | |
| | | |
| OCTOBER 31, 2018 | | J.P. MORGAN EXCHANGE-TRADED FUNDS | | | | | 67 | |
JPMorgan BetaBuilders Europe ETF
SCHEDULE OF PORTFOLIO INVESTMENTS
AS OF OCTOBER 31, 2018 (continued)
| | | | | | | | |
| SHARES | | | INVESTMENTS | | VALUE($) | |
| | Common Stocks — continued | | | | |
| | | | Switzerland — continued | | | | |
| | 11,234 | | | Lonza Group AG (Registered)* | | | 3,532,413 | |
| | 461,855 | | | Nestle SA (Registered) | | | 38,991,235 | |
| | 384,603 | | | Novartis AG (Registered) | | | 33,680,595 | |
| | 5,128 | | | Pargesa Holding SA | | | 376,447 | |
| | 2,822 | | | Partners Group Holding AG | | | 2,009,137 | |
| | 4,100 | | | Roche Holding AG — BR | | | 998,176 | |
| | 105,936 | | | Roche Holding AG — Genusschein | | | 25,780,840 | |
| | 6,138 | | | Schindler Holding AG | | | 1,294,286 | |
| | 2,932 | | | Schindler Holding AG (Registered) | | | 608,854 | |
| | 787 | | | SGS SA (Registered) | | | 1,869,165 | |
| | 19,239 | | | Sika AG (Registered) | | | 2,466,873 | |
| | 7,985 | | | Sonova Holding AG (Registered) | | | 1,302,228 | |
| | 100,198 | | | STMicroelectronics NV | | | 1,523,153 | |
| | 1,633 | | | Straumann Holding AG (Registered) | | | 1,114,697 | |
| | 1,855 | | | Sulzer AG (Registered) | | | 186,192 | |
| | 4,650 | | | Swatch Group AG (The) | | | 1,570,648 | |
| | 11,228 | | | Swatch Group AG (The) (Registered) | | | 749,478 | |
| | 5,164 | | | Swiss Life Holding AG (Registered)* | | | 1,947,938 | |
| | 45,954 | | | Swiss Re AG | | | 4,146,555 | |
| | 3,825 | | | Swisscom AG (Registered) | | | 1,751,398 | |
| | 577,629 | | | UBS Group AG (Registered)* | | | 8,073,594 | |
| | 6,666 | | | Vifor Pharma AG | | | 963,430 | |
| | 22,698 | | | Zurich Insurance Group AG* | | | 7,047,307 | |
| | | | | | | | |
| | | | | | | 183,668,309 | |
| | | | | | | | |
| | | | United Arab Emirates — 0.0% (b) | | | | |
| | 12,854 | | | NMC Health plc | | | 579,581 | |
| | | | | | | | |
| | | | United Kingdom — 23.4% | | | | |
| | 146,445 | | | 3i Group plc | | | 1,639,791 | |
| | 38,538 | | | Admiral Group plc | | | 990,658 | |
| | 38,623 | | | Aggreko plc | | | 423,288 | |
| | 75,897 | | | Ashtead Group plc | | | 1,873,659 | |
| | 8,055 | | | ASOS plc* | | | 561,156 | |
| | 53,723 | | | Associated British Foods plc | | | 1,637,841 | |
| | 190,791 | | | AstraZeneca plc | | | 14,593,540 | |
| | 143,567 | | | Auto Trader Group plc (a) | | | 750,190 | |
| | 593,570 | | | Aviva plc | | | 3,243,794 | |
| | 75,597 | | | Babcock International Group plc | | | 589,521 | |
| | 481,175 | | | BAE Systems plc | | | 3,226,416 | |
| | 2,404,341 | | | Barclays plc | | | 5,297,499 | |
| | 151,837 | | | Barratt Developments plc | | | 995,895 | |
| | 21,139 | | | Berkeley Group Holdings plc | | | 944,772 | |
| | 3,009,808 | | | BP plc | | | 21,742,011 | |
| | 345,214 | | | British American Tobacco plc | | | 14,965,119 | |
| | 149,857 | | | British Land Co. plc (The), REIT | | | 1,131,769 | |
| | 1,322,681 | | | BT Group plc | | | 4,050,057 | |
| | | | | | | | |
| SHARES | | | INVESTMENTS | | VALUE($) | |
| | | | | | | | |
| | | | United Kingdom — continued | | | | |
| | 50,606 | | | Bunzl plc | | | 1,492,873 | |
| | 63,074 | | | Burberry Group plc | | | 1,459,492 | |
| | 850,178 | | | Centrica plc | | | 1,596,877 | |
| | 149,824 | | | CNH Industrial NV | | | 1,557,467 | |
| | 35,113 | | | Coca-Cola European Partners plc | | | 1,597,290 | |
| | 240,204 | | | Compass Group plc | | | 4,724,526 | |
| | 20,375 | | | Croda International plc | | | 1,255,010 | |
| | 15,276 | | | DCC plc | | | 1,309,317 | |
| | 16,704 | | | Derwent London plc, REIT | | | 624,624 | |
| | 369,873 | | | Diageo plc | | | 12,787,069 | |
| | 207,324 | | | Direct Line Insurance Group plc | | | 871,233 | |
| | 152,703 | | | Dixons Carphone plc | | | 330,148 | |
| | 206,227 | | | DS Smith plc | | | 1,034,764 | |
| | 39,366 | | | easyJet plc | | | 603,079 | |
| | 138,998 | | | Experian plc | | | 3,196,843 | |
| | 165,900 | | | Fiat Chrysler Automobiles NV* | | | 2,524,738 | |
| | 233,958 | | | G4S plc | | | 642,064 | |
| | 744,619 | | | GlaxoSmithKline plc | | | 14,421,603 | |
| | 87,189 | | | GVC Holdings plc | | | 1,044,382 | |
| | 56,981 | | | Halma plc | | | 966,990 | |
| | 119,601 | | | Hammerson plc, REIT | | | 667,731 | |
| | 40,766 | | | Hargreaves Lansdown plc | | | 971,853 | |
| | 3,050,688 | | | HSBC Holdings plc | | | 25,105,945 | |
| | 145,276 | | | Imperial Brands plc | | | 4,920,880 | |
| | 188,717 | | | Informa plc | | | 1,722,152 | |
| | 29,790 | | | InterContinental Hotels Group plc | | | 1,563,075 | |
| | 124,132 | | | International Consolidated Airlines Group SA | | | 956,994 | |
| | 24,240 | | | Intertek Group plc | | | 1,452,372 | |
| | 129,769 | | | Intu Properties plc, REIT | | | 324,598 | |
| | 546,274 | | | ITV plc | | | 1,036,977 | |
| | 257,174 | | | J Sainsbury plc | | | 1,021,771 | |
| | 63,104 | | | JD Sports Fashion plc | | | 328,884 | |
| | 102,184 | | | John Wood Group plc | | | 931,330 | |
| | 29,996 | | | Johnson Matthey plc | | | 1,137,260 | |
| | 88,509 | | | Just Eat plc* | | | 686,607 | |
| | 321,363 | | | Kingfisher plc | | | 1,043,519 | |
| | 113,278 | | | Land Securities Group plc, REIT | | | 1,232,250 | |
| | 890,794 | | | Legal & General Group plc | | | 2,858,449 | |
| | 43,125 | | | Linde plc | | | 7,075,344 | |
| | 10,762,137 | | | Lloyds Banking Group plc | | | 7,853,559 | |
| | 47,534 | | | London Stock Exchange Group plc | | | 2,619,017 | |
| | 244,987 | | | Marks & Spencer Group plc | | | 926,588 | |
| | 732,551 | | | Melrose Industries plc | | | 1,576,888 | |
| | 107,005 | | | Merlin Entertainments plc (a) | | | 441,909 | |
| | 65,621 | | | Micro Focus International plc | | | 1,017,271 | |
SEE NOTES TO FINANCIAL STATEMENTS.
| | | | | | |
| | | |
| 68 | | | | J.P. MORGAN EXCHANGE-TRADED FUNDS | | OCTOBER 31, 2018 |
| | | | | | | | |
| SHARES | | | INVESTMENTS | | VALUE($) | |
| | Common Stocks — continued | | | | |
| | | | United Kingdom — continued | | | | |
| | 55,371 | | | Mondi plc | | | 1,303,923 | |
| | 554,311 | | | National Grid plc | | | 5,855,767 | |
| | 685,414 | | | NatWest Markets plc | | | 2,063,439 | |
| | 47,521 | | | NEX Group plc | | | 689,173 | |
| | 21,058 | | | Next plc | | | 1,398,942 | |
| | 117,704 | | | Pearson plc | | | 1,352,177 | |
| | 47,188 | | | Persimmon plc | | | 1,381,057 | |
| | 389,910 | | | Prudential plc | | | 7,807,411 | |
| | 111,064 | | | Reckitt Benckiser Group plc | | | 8,981,092 | |
| | 323,203 | | | RELX plc | | | 6,391,875 | |
| | 277,043 | | | Rentokil Initial plc | | | 1,117,213 | |
| | 138,628 | | | Rightmove plc | | | 800,240 | |
| | 280,443 | | | Rolls-Royce Holdings plc* | | | 3,007,525 | |
| | 12,678,658 | | | Rolls-Royce Holdings plc (Preference)* | | | 16,206 | |
| | 132,692 | | | Royal Mail plc | | | 609,180 | |
| | 154,778 | | | RSA Insurance Group plc | | | 1,113,171 | |
| | 168,850 | | | Sage Group plc (The) | | | 1,173,999 | |
| | 18,727 | | | Schroders plc | | | 640,885 | |
| | 7,537 | | | Schroders plc (Non-Voting) | | | 215,142 | |
| | 152,192 | | | Segro plc, REIT | | | 1,193,166 | |
| | 36,209 | | | Severn Trent plc | | | 860,484 | |
| | 134,353 | | | Smith & Nephew plc | | | 2,183,889 | |
| | 59,211 | | | Smiths Group plc | | | 1,055,467 | |
| | 154,175 | | | SSE plc | | | 2,247,166 | |
| | 79,774 | | | St James’s Place plc | | | 1,030,939 | |
| | 418,517 | | | Standard Chartered plc | | | 2,933,264 | |
| | 438,602 | | | Standard Life Aberdeen* | | | 190,555 | |
| | 390,486 | | | Standard Life Aberdeen plc | | | 1,348,675 | |
| | 38,996 | | | Subsea 7 SA | | | 489,450 | |
| | 70,274 | | | Tate & Lyle plc | | | 604,221 | |
| | 493,237 | | | Taylor Wimpey plc | | | 1,015,589 | |
| | 65,109 | | | TechnipFMC plc | | | 1,727,162 | |
| | 1,464,609 | | | Tesco plc | | | 3,988,753 | |
| | 37,671 | | | Travis Perkins plc | | | 532,054 | |
| | 258,550 | | | Unilever NV, CVA (c) | | | 13,893,184 | |
| | 180,897 | | | Unilever plc | | | 9,582,048 | |
| | 102,814 | | | United Utilities Group plc | | | 952,747 | |
| | 4,040,306 | | | Vodafone Group plc | | | 7,597,948 | |
| | 39,139 | | | Weir Group plc (The) | | | 792,038 | |
| | 27,613 | | | Whitbread plc | | | 1,552,612 | |
| | 354,956 | | | Wm Morrison Supermarkets plc | | | 1,124,569 | |
| | 190,083 | | | WPP plc | | | 2,150,928 | |
| | | | | | | | |
| | | | | | | 307,135,913 | |
| | | | | | | | |
| | | | United States — 1.0% | | | | |
| | 31,013 | | | Carnival plc | | | 1,690,379 | |
| | 35,036 | | | Ferguson plc | | | 2,362,111 | |
| | | | | | | | |
| SHARES | | | INVESTMENTS | | VALUE($) | |
| | | | | | | | |
| | | | United States — continued | | | | |
| | 34,811 | | | QIAGEN NV* (c) | | | 1,263,595 | |
| | 138,035 | | | Shire plc | | | 8,330,542 | |
| | | | | | | | |
| | | | | | | 13,646,627 | |
| | | | | | | | |
| | | | Total Common Stocks
(Cost $1,396,379,819) | | | 1,305,192,857 | |
| | | | | | | | |
| | Short-Term Investments — 0.0% (b) | | | | |
| | | | Investment Companies — 0.0% (b) | | | | |
| | 296,502 | | | JPMorgan U.S. Government Money Market Fund Class Institutional Shares, 2.02% (d) (e)
(Cost $296,502) | | | 296,502 | |
| | | | | | | | |
| | Investment of Cash Collateral from Securities Loaned — 2.0% | |
| | 2,998,700 | | | JPMorgan Prime Money Market Fund Class IM Shares, 1.88% (d) (e) | | | 2,999,300 | |
| | 18,001,300 | | | JPMorgan Securities Lending Money Market Fund Class Agency SL Shares,
2.27% (d) (e) | | | 17,999,500 | |
| | 5,502,935 | | | JPMorgan U.S. Government Money Market Fund Class IM Shares, 2.07% (d) (e) | | | 5,502,935 | |
| | | | | | | | |
| | | | Total Investment of Cash Collateral from Securities Loaned
(Cost $26,502,535) | | | 26,501,735 | |
| | | | | | | | |
| | | | Total Investments — 101.3%
(Cost 1,423,178,856) | | | 1,331,991,094 | |
| | | | Liabilities in Excess of
Other Assets — (1.3%) | | | (17,060,802 | ) |
| | | | | | | | |
| | | | NET ASSETS — 100.0% | | | 1,314,930,292 | |
| | | | | | | | |
Percentages indicated are based on net assets.
Abbreviations
| | |
| ADR | | — American Depositary Receipt |
| CVA | | — Dutch Certification |
| FDR | | — Fiduciary Depositary Receipt |
| OYJ | | — Public Limited Company |
| Preference | | — A special type of equity investment that shares in the earnings of the company, has limited voting rights, and may have a dividend preference. Preference shares may also have liquidation preference. |
| REIT | | — Real Estate Investment Trust |
| SCA | | — Limited partnership with share capital |
| SDR | | — Swedish Depositary Receipt |
SEE NOTES TO FINANCIAL STATEMENTS.
| | | | | | | | |
| | | |
| OCTOBER 31, 2018 | | J.P. MORGAN EXCHANGE-TRADED FUNDS | | | | | 69 | |
JPMorgan BetaBuilders Europe ETF
SCHEDULE OF PORTFOLIO INVESTMENTS
AS OF OCTOBER 31, 2018 (continued)
| | |
| (a) | | — Security exempt from registration pursuant to Regulation S under the Securities Act of 1933, as amended. Regulation S applies to securities offerings that are made outside of the United States and do not involve direct selling efforts in the United States and as such may have restrictions on resale. |
| (b) | | — Amount rounds to less than 0.1% of net assets. |
| (c) | | — The security or a portion of this security is on loan at October 31, 2018. The total value of securities on loan at October 31, 2018 was $25,217,228. |
| (d) | | — Investment in affiliate. Fund is registered under the Investment Company Act of 1940, as amended, and advised by J.P. Morgan Investment Management Inc. |
| (e) | | — The rate shown is the current yield as of October 31, 2018. |
| * | | — Non-income producing security. |
Summary of Investments by Industry, October 31, 2018
The following table represents the portfolio investments of the Fund by industry classifications as a percentage of total investments:
| | | | |
| INDUSTRY | | PERCENTAGE | |
Pharmaceuticals | | | 10.1 | % |
Banks | | | 9.5 | |
Oil, Gas & Consumable Fuels | | | 8.1 | |
Insurance | | | 5.6 | |
Food Products | | | 4.3 | |
Chemicals | | | 4.0 | |
Textiles, Apparel & Luxury Goods | | | 3.0 | |
Beverages | | | 2.9 | |
Metals & Mining | | | 2.7 | |
Diversified Telecommunication Services | | | 2.6 | |
Personal Products | | | 2.5 | |
Capital Markets | | | 2.4 | |
Automobiles | | | 2.2 | |
Machinery | | | 2.0 | |
Aerospace & Defense | | | 2.0 | |
Electric Utilities | | | 1.8 | |
Software | | | 1.7 | |
Tobacco | | | 1.6 | |
Multi-Utilities | | | 1.5 | |
Health Care Equipment & Supplies | | | 1.5 | |
Electrical Equipment | | | 1.4 | |
Professional Services | | | 1.4 | |
Industrial Conglomerates | | | 1.3 | |
Semiconductors & Semiconductor Equipment | | | 1.2 | |
Hotels, Restaurants & Leisure | | | 1.2 | |
Household Products | | | 1.2 | |
Food & Staples Retailing | | | 1.1 | |
Construction & Engineering | | | 1.1 | |
Media | | | 1.0 | |
Diversified Financial Services | | | 1.0 | |
IT Services | | | 1.0 | |
Others (each less than 1.0%) | | | 13.1 | |
Investment of cash collateral from securities loaned | | | 2.0 | |
| | | | | | | | | | | | | | | | | | | | |
| Futures contracts outstanding as of October 31, 2018: | | | | | | | |
| DESCRIPTION | | NUMBER OF
CONTRACTS | | | EXPIRATION
DATE | | | TRADING
CURRENCY | | | NOTIONAL
AMOUNT ($) | | | VALUE AND
UNREALIZED
APPRECIATION
(DEPRECIATION) ($) | |
Long Contracts | | | | | | | | | | | | | | | | | | | | |
EURO STOXX 50 Index | | | 160 | | | | 12/2018 | | | | EUR | | | | 5,766,548 | | | | (53,241 | ) |
FTSE 100 Index | | | 40 | | | | 12/2018 | | | | GBP | | | | 3,622,674 | | | | 33,855 | |
| | | | | | | | | | | | | | | | | | | | |
| | | | | | | | | | | | | | | | | | | (19,386 | ) |
| | | | | | | | | | | | | | | | | | | | |
Abbreviations
| | |
| EUR | | — Euro |
| FTSE | | — Financial Times and the London Stock Exchange |
| GBP | | — British Pound |
SEE NOTES TO FINANCIAL STATEMENTS.
| | | | | | |
| | | |
| 70 | | | | J.P. MORGAN EXCHANGE-TRADED FUNDS | | OCTOBER 31, 2018 |
JPMorgan BetaBuilders Japan ETF
SCHEDULE OF PORTFOLIO INVESTMENTS
AS OF OCTOBER 31, 2018
| | | | | | | | |
| SHARES | | | INVESTMENTS | | VALUE($) | |
| | Common Stocks — 99.2% | | | | |
| | | | Air Freight & Logistics — 0.5% | | | | |
| | 152,100 | | | SG Holdings Co. Ltd. | | | 3,829,026 | |
| | 256,300 | | | Yamato Holdings Co. Ltd. | | | 7,006,834 | |
| | | | | | | | |
| | | | | | | 10,835,860 | |
| | | | | | | | |
| | | | Airlines — 0.2% | | | | |
| | 72,800 | | | ANA Holdings, Inc. | | | 2,447,944 | |
| | 72,900 | | | Japan Airlines Co. Ltd. | | | 2,587,305 | |
| | | | | | | | |
| | | | | | | 5,035,249 | |
| | | | | | | | |
| | | | Auto Components — 2.7% | | | | |
| | 113,400 | | | Aisin Seiki Co. Ltd. | | | 4,435,219 | |
| | 380,600 | | | Bridgestone Corp. | | | 14,675,669 | |
| | 328,000 | | | Denso Corp. | | | 14,630,693 | |
| | 79,400 | | | Koito Manufacturing Co. Ltd. | | | 3,779,925 | |
| | 108,800 | | | NGK Spark Plug Co. Ltd. | | | 2,201,597 | |
| | 137,200 | | | NHK Spring Co. Ltd. | | | 1,174,799 | |
| | 75,800 | | | NOK Corp. | | | 1,090,675 | |
| | 97,700 | | | Stanley Electric Co. Ltd. | | | 2,889,997 | |
| | 492,800 | | | Sumitomo Electric Industries Ltd. | | | 6,720,605 | |
| | 109,400 | | | Sumitomo Rubber Industries Ltd. | | | 1,569,309 | |
| | 31,200 | | | Tokai Rika Co. Ltd. | | | 568,904 | |
| | 47,300 | | | Toyoda Gosei Co. Ltd. | | | 1,020,151 | |
| | 53,200 | | | Toyota Boshoku Corp. | | | 887,257 | |
| | 127,900 | | | Toyota Industries Corp. | | | 6,282,724 | |
| | 81,900 | | | Yokohama Rubber Co. Ltd. (The) | | | 1,586,519 | |
| | | | | | | | |
| | | | | | | 63,514,043 | |
| | | | | | | | |
| | | | Automobiles — 7.9% | | | | |
| | 1,135,400 | | | Honda Motor Co. Ltd. | | | 32,410,596 | |
| | 385,500 | | | Isuzu Motors Ltd. | | | 5,054,117 | |
| | 370,400 | | | Mazda Motor Corp. | | | 3,945,165 | |
| | 429,000 | | | Mitsubishi Motors Corp. | | | 2,694,664 | |
| | 1,495,900 | | | Nissan Motor Co. Ltd. | | | 13,609,343 | |
| | 394,600 | | | Subaru Corp. | | | 10,644,215 | |
| | 276,800 | | | Suzuki Motor Corp. | | | 13,803,108 | |
| | 1,666,600 | | | Toyota Motor Corp. | | | 97,631,046 | |
| | 198,200 | | | Yamaha Motor Co. Ltd. | | | 4,687,393 | |
| | | | | | | | |
| | | | | | | 184,479,647 | |
| | | | | | | | |
| | | | Banks — 6.9% | | | | |
| | 48,600 | | | 77 Bank Ltd. (The) | | | 1,003,861 | |
| | 74,400 | | | Aozora Bank Ltd. | | | 2,567,276 | |
| | 48,200 | | | Bank of Kyoto Ltd. (The) | | | 2,164,281 | |
| | 485,600 | | | Chiba Bank Ltd. (The) | | | 3,072,081 | |
| | 200,000 | | | Chugoku Bank Ltd. (The) | | | 1,795,980 | |
| | 789,300 | | | Concordia Financial Group Ltd. | | | 3,612,438 | |
| | 106,000 | | | Fukuoka Financial Group, Inc. | | | 2,604,498 | |
| | | | | | | | |
| SHARES | | | INVESTMENTS | | VALUE($) | |
| | | | | | | | |
| | | | Banks — continued | | | | |
| | 263,600 | | | Gunma Bank Ltd. (The) | | | 1,193,410 | |
| | 315,900 | | | Hachijuni Bank Ltd. (The) | | | 1,334,317 | |
| | 197,100 | | | Hiroshima Bank Ltd. (The) | | | 1,215,733 | |
| | 81,100 | | | Hokuhoku Financial Group, Inc. | | | 1,004,719 | |
| | 202,500 | | | Iyo Bank Ltd. (The) | | | 1,201,062 | |
| | 287,100 | | | Kyushu Financial Group, Inc. | | | 1,266,980 | |
| | 662,300 | | | Mebuki Financial Group, Inc. | | | 2,016,945 | |
| | 8,175,500 | | | Mitsubishi UFJ Financial Group, Inc. | | | 49,482,155 | |
| | 15,805,200 | | | Mizuho Financial Group, Inc. | | �� | 27,143,275 | |
| | 1,371,500 | | | Resona Holdings, Inc. | | | 7,214,138 | |
| | 460,700 | | | Seven Bank Ltd. | | | 1,439,804 | |
| | 122,700 | | | Shinsei Bank Ltd. | | | 1,869,089 | |
| | 354,000 | | | Shizuoka Bank Ltd. (The) | | | 3,097,150 | |
| | 881,500 | | | Sumitomo Mitsui Financial Group, Inc. | | | 34,321,289 | |
| | 242,700 | | | Sumitomo Mitsui Trust Holdings, Inc. | | | 9,643,323 | |
| | 154,600 | | | Yamaguchi Financial Group, Inc. | | | 1,627,810 | |
| | | | | | | | |
| | | | | | | 161,891,614 | |
| | | | | | | | |
| | | | Beverages — 1.4% | | | | |
| | 278,200 | | | Asahi Group Holdings Ltd. | | | 12,225,519 | |
| | 98,800 | | | Coca-Cola Bottlers Japan Holdings, Inc. | | | 2,585,714 | |
| | 568,100 | | | Kirin Holdings Co. Ltd. | | | 13,556,308 | |
| | 49,600 | | | Sapporo Holdings Ltd. | | | 920,109 | |
| | 78,500 | | | Suntory Beverage & Food Ltd. | | | 3,199,260 | |
| | | | | | | | |
| | | | | | | 32,486,910 | |
| | | | | | | | |
| | | | Biotechnology — 0.1% | | | | |
| | 57,900 | | | PeptiDream, Inc.* | | | 1,898,721 | |
| | | | | | | | |
| | | | Building Products — 1.4% | | | | |
| | 146,600 | | | AGC, Inc. | | | 4,801,800 | |
| | 181,900 | | | Daikin Industries Ltd. | | | 21,084,379 | |
| | 181,000 | | | LIXIL Group Corp. | | | 2,845,449 | |
| | 100,000 | | | TOTO Ltd. | | | 3,577,627 | |
| | | | | | | | |
| | | | | | | 32,309,255 | |
| | | | | | | | |
| | | | Capital Markets — 1.1% | | | | |
| | 1,004,300 | | | Daiwa Securities Group, Inc. | | | 5,759,369 | |
| | 333,900 | | | Japan Exchange Group, Inc. | | | 5,980,392 | |
| | 76,100 | | | Matsui Securities Co. Ltd. | | | 775,604 | |
| | 2,174,100 | | | Nomura Holdings, Inc. | | | 10,439,939 | |
| | 139,400 | | | SBI Holdings, Inc. | | | 3,640,154 | |
| | | | | | | | |
| | | | | | | 26,595,458 | |
| | | | | | | | |
| | | | Chemicals — 4.3% | | | | |
| | 120,000 | | | Air Water, Inc. | | | 1,943,884 | |
| | 873,200 | | | Asahi Kasei Corp. | | | 10,477,050 | |
| | 215,000 | | | Daicel Corp. | | | 2,274,489 | |
SEE NOTES TO FINANCIAL STATEMENTS.
| | | | | | | | |
| | | |
| OCTOBER 31, 2018 | | J.P. MORGAN EXCHANGE-TRADED FUNDS | | | | | 71 | |
JPMorgan BetaBuilders Japan ETF
SCHEDULE OF PORTFOLIO INVESTMENTS
AS OF OCTOBER 31, 2018 (continued)
| | | | | | | | |
| SHARES | | | INVESTMENTS | | VALUE($) | |
| | Common Stocks — continued | | | | |
| | | | Chemicals — continued | | | | |
| | 54,700 | | | DIC Corp. | | | 1,614,204 | |
| | 63,000 | | | Hitachi Chemical Co. Ltd. | | | 993,008 | |
| | 127,100 | | | JSR Corp. | | | 1,894,194 | |
| | 43,400 | | | Kaneka Corp. | | | 1,813,942 | |
| | 159,600 | | | Kansai Paint Co. Ltd. (a) | | | 2,358,297 | |
| | 239,100 | | | Kuraray Co. Ltd. | | | 3,284,163 | |
| | 934,700 | | | Mitsubishi Chemical Holdings Corp. | | | 7,286,356 | |
| | 131,700 | | | Mitsubishi Gas Chemical Co., Inc. | | | 2,210,741 | |
| | 127,600 | | | Mitsui Chemicals, Inc. | | | 2,861,324 | |
| | 124,700 | | | Nippon Paint Holdings Co. Ltd. (a) | | | 3,895,232 | |
| | 22,700 | | | Nippon Shokubai Co. Ltd. | | | 1,464,547 | |
| | 95,500 | | | Nissan Chemical Corp. | | | 4,502,948 | |
| | 100,300 | | | Nitto Denko Corp. | | | 6,266,251 | |
| | 253,800 | | | Shin-Etsu Chemical Co. Ltd. | | | 21,207,660 | |
| | 88,000 | | | Showa Denko KK | | | 3,831,838 | |
| | 1,030,000 | | | Sumitomo Chemical Co. Ltd. | | | 5,159,672 | |
| | 131,300 | | | Taiyo Nippon Sanso Corp. | | | 2,110,290 | |
| | 124,400 | | | Teijin Ltd. | | | 2,156,686 | |
| | 1,012,500 | | | Toray Industries, Inc. | | | 7,181,961 | |
| | 203,100 | | | Tosoh Corp. | | | 2,673,973 | |
| | 68,600 | | | Ube Industries Ltd. | | | 1,494,291 | |
| | | | | | | | |
| | | | | | | 100,957,001 | |
| | | | | | | | |
| | | | Commercial Services & Supplies — 1.0% | |
| | 185,900 | | | Dai Nippon Printing Co. Ltd. | | | 4,171,133 | |
| | 73,300 | | | Park24 Co. Ltd. | | | 1,928,388 | |
| | 132,400 | | | Secom Co. Ltd. | | | 10,839,798 | |
| | 53,400 | | | Sohgo Security Services Co. Ltd. | | | 2,378,496 | |
| | 203,200 | | | Toppan Printing Co. Ltd. | | | 2,872,726 | |
| | | | | | | | |
| | | | | | | 22,190,541 | |
| | | | | | | | |
| | | | Construction & Engineering — 0.9% | | | | |
| | 159,600 | | | JGC Corp. | | | 3,089,353 | |
| | 311,800 | | | Kajima Corp. | | | 4,014,904 | |
| | 86,700 | | | Kinden Corp. | | | 1,390,133 | |
| | 446,300 | | | Obayashi Corp. | | | 3,940,035 | |
| | 454,100 | | | Shimizu Corp. | | | 3,686,092 | |
| | 139,300 | | | Taisei Corp. | | | 5,957,650 | |
| | | | | | | | |
| | | | | | | 22,078,167 | |
| | | | | | | | |
| | | | Construction Materials — 0.1% | | | | |
| | 78,700 | | | Taiheiyo Cement Corp. | | | 2,315,880 | |
| | | | | | | | |
| | | | Consumer Finance — 0.2% | | | | |
| | 286,900 | | | Acom Co. Ltd. | | | 1,056,050 | |
| | 72,900 | | | AEON Financial Service Co. Ltd. | | | 1,426,782 | |
| | 101,900 | | | Credit Saison Co. Ltd. | | | 1,618,175 | |
| | | | | | | | |
| SHARES | | | INVESTMENTS | | VALUE($) | |
| | | | | | | | |
| | | | Consumer Finance — continued | |
| | 30,400 | | | Hitachi Capital Corp. | | | 745,382 | |
| | 354,500 | | | Orient Corp. (a) | | | 554,530 | |
| | | | | | | | |
| | | | | | | 5,400,919 | |
| | | | | | | | |
| | | | Containers & Packaging — 0.1% | | | | |
| | 101,400 | | | Toyo Seikan Group Holdings Ltd. | | | 2,068,744 | |
| | | | | | | | |
| | | | Distributors — 0.0% (b) | | | | |
| | 32,000 | | | Canon Marketing Japan, Inc. | | | 605,537 | |
| | | | | | | | |
| | | | Diversified Consumer Services — 0.1% | | | | |
| | 51,100 | | | Benesse Holdings, Inc. | | | 1,425,109 | |
| | | | | | | | |
| | | | Diversified Financial Services — 0.7% | | | | |
| | 334,500 | | | Mitsubishi UFJ Lease & Finance Co. Ltd. | | | 1,719,066 | |
| | 824,000 | | | ORIX Corp. | | | 13,423,786 | |
| | 32,000 | | | Tokyo Century Corp. | | | 1,717,552 | |
| | | | | | | | |
| | | | | | | 16,860,404 | |
| | | | | | | | |
| | | | Diversified Telecommunication Services — 0.7% | |
| | 403,100 | | | Nippon Telegraph & Telephone Corp. | | | 16,623,287 | |
| | | | | | | | |
| | | | Electric Utilities — 1.3% | | | | |
| | 445,600 | | | Chubu Electric Power Co., Inc. | | | 6,425,858 | |
| | 211,200 | | | Chugoku Electric Power Co., Inc. (The) | | | 2,716,601 | |
| | 125,300 | | | Hokuriku Electric Power Co.* | | | 1,167,243 | |
| | 499,200 | | | Kansai Electric Power Co., Inc. (The) | | | 7,640,506 | |
| | 292,300 | | | Kyushu Electric Power Co., Inc. | | | 3,395,636 | |
| | 129,000 | | | Shikoku Electric Power Co., Inc. | | | 1,619,144 | |
| | 312,000 | | | Tohoku Electric Power Co., Inc. | | | 3,941,995 | |
| | 497,400 | | | Tokyo Electric Power Co. Holdings, Inc.* | | | 2,545,781 | |
| | | | | | | | |
| | | | | | | 29,452,764 | |
| | | | | | | | |
| | | | Electrical Equipment — 2.0% | | | | |
| | 95,200 | | | Fuji Electric Co. Ltd. | | | 2,906,025 | |
| | 45,700 | | | Furukawa Electric Co. Ltd. | | | 1,233,312 | |
| | 51,400 | | | GS Yuasa Corp. | | | 1,055,098 | |
| | 36,500 | | | Mabuchi Motor Co. Ltd. | | | 1,298,353 | |
| | 1,336,500 | | | Mitsubishi Electric Corp. | | | 16,919,344 | |
| | 172,800 | | | Nidec Corp. | | | 22,195,275 | |
| | 79,300 | | | Ushio, Inc. | | | 956,794 | |
| | | | | | | | |
| | | | | | | 46,564,201 | |
| | | | | | | | |
| | | | Electronic Equipment, Instruments & Components — 5.0% | |
| | 124,500 | | | Alps Electric Co. Ltd. | | | 2,934,815 | |
| | 200,800 | | | Citizen Watch Co. Ltd. | | | 1,155,797 | |
| | 87,300 | | | Hamamatsu Photonics KK | | | 2,918,405 | |
| | 20,700 | | | Hirose Electric Co. Ltd. | | | 1,972,872 | |
| | 43,500 | | | Hitachi High-Technologies Corp. | | | 1,632,529 | |
| | 599,300 | | | Hitachi Ltd. | | | 18,320,718 | |
SEE NOTES TO FINANCIAL STATEMENTS.
| | | | | | |
| | | |
| 72 | | | | J.P. MORGAN EXCHANGE-TRADED FUNDS | | OCTOBER 31, 2018 |
| | | | | | | | |
| SHARES | | | INVESTMENTS | | VALUE($) | |
| | Common Stocks — continued | | | | |
| | | | Electronic Equipment, Instruments & Components — continued | |
| | 81,900 | | | Ibiden Co. Ltd. | | | 1,011,315 | |
| | 58,000 | | | Keyence Corp. | | | 28,334,149 | |
| | 225,100 | | | Kyocera Corp. | | | 12,183,064 | |
| | 133,200 | | | Murata Manufacturing Co. Ltd. | | | 20,730,617 | |
| | 53,300 | | | Nippon Electric Glass Co. Ltd. | | | 1,342,919 | |
| | 132,100 | | | Omron Corp. | | | 5,348,004 | |
| | 173,300 | | | Shimadzu Corp. | | | 4,379,811 | |
| | 80,500 | | | TDK Corp. | | | 6,941,521 | |
| | 165,600 | | | Yaskawa Electric Corp. | | | 4,786,450 | |
| | 150,000 | | | Yokogawa Electric Corp. | | | 2,945,112 | |
| | | | | | | | |
| | | | | | | 116,938,098 | |
| | | | | | | | |
| | | | Entertainment — 1.5% | | | | |
| | 69,000 | | | DeNA Co. Ltd. | | | 1,147,734 | |
| | 293,200 | | | GungHo Online Entertainment, Inc. (a) | | | 530,066 | |
| | 63,800 | | | Konami Holdings Corp. | | | 2,433,984 | |
| | 283,000 | | | Nexon Co. Ltd.* | | | 3,228,252 | |
| | 75,400 | | | Nintendo Co. Ltd. | | | 23,540,097 | |
| | 54,100 | | | Square Enix Holdings Co. Ltd. | | | 1,939,022 | |
| | 85,700 | | | Toho Co. Ltd. | | | 2,795,997 | |
| | | | | | | | |
| | | | | | | 35,615,152 | |
| | | | | | | | |
| | | | Equity Real Estate Investment Trusts (REITs) — 1.4% | |
| | 824 | | | Advance Residence Investment Corp. | | | 2,105,135 | |
| | 1,068 | | | Daiwa House REIT Investment Corp. | | | 2,340,437 | |
| | 2,360 | | | GLP J-Reit | | | 2,335,331 | |
| | 561 | | | Japan Prime Realty Investment Corp. | | | 2,001,736 | |
| | 858 | | | Japan Real Estate Investment Corp. | | | 4,428,005 | |
| | 1,609 | | | Japan Retail Fund Investment Corp. | | | 2,971,814 | |
| | 874 | | | Nippon Building Fund, Inc. | | | 4,994,597 | |
| | 1,343 | | | Nippon Prologis REIT, Inc. | | | 2,703,336 | |
| | 2,663 | | | Nomura Real Estate Master Fund, Inc. | | | 3,449,322 | |
| | 1,737 | | | Orix JREIT, Inc. | | | 2,657,270 | |
| | 1,878 | | | United Urban Investment Corp. | | | 2,855,048 | |
| | | | | | | | |
| | | | | | | 32,842,031 | |
| | | | | | | | |
| | | | Food & Staples Retailing — 2.1% | | | | |
| | 542,000 | | | Aeon Co. Ltd. | | | 12,440,071 | |
| | 6,000 | | | Cosmos Pharmaceutical Corp. | | | 1,226,384 | |
| | 48,900 | | | FamilyMart UNY Holdings Co. Ltd. | | | 5,667,996 | |
| | 29,900 | | | Lawson, Inc. | | | 1,897,978 | |
| | 53,700 | | | Matsumotokiyoshi Holdings Co. Ltd. | | | 1,941,462 | |
| | 494,700 | | | Seven & i Holdings Co. Ltd. | | | 21,420,510 | |
| | 34,500 | | | Sundrug Co. Ltd. | | | 1,253,691 | |
| | 24,300 | | | Tsuruha Holdings, Inc. | | | 2,536,196 | |
| | | | | | | | |
| SHARES | | | INVESTMENTS | | VALUE($) | |
| | | | | | | | |
| | | | Food & Staples Retailing — continued | | | | |
| | 30,000 | | | Welcia Holdings Co. Ltd. | | | 1,530,500 | |
| | | | | | | | |
| | | | | | | 49,914,788 | |
| | | | | | | | |
| | | | Food Products — 1.9% | | | | |
| | 356,800 | | | Ajinomoto Co., Inc. | | | 5,764,269 | |
| | 70,400 | | | Calbee, Inc. | | | 2,335,677 | |
| | 33,900 | | | Ezaki Glico Co. Ltd. | | | 1,689,924 | |
| | 75,200 | | | Kewpie Corp. | | | 1,728,594 | |
| | 108,200 | | | Kikkoman Corp. | | | 5,927,986 | |
| | 89,800 | | | MEIJI Holdings Co. Ltd. | | | 5,958,205 | |
| | 69,200 | | | NH Foods Ltd. | | | 2,386,422 | |
| | 160,900 | | | Nisshin Seifun Group, Inc. | | | 3,201,590 | |
| | 49,800 | | | Nissin Foods Holdings Co. Ltd. | | | 3,211,078 | |
| | 60,700 | | | Toyo Suisan Kaisha Ltd. | | | 2,086,536 | |
| | 100,700 | | | Yakult Honsha Co. Ltd. | | | 7,130,722 | |
| | 110,200 | | | Yamazaki Baking Co. Ltd. | | | 1,986,370 | |
| | | | | | | | |
| | | | | | | 43,407,373 | |
| | | | | | | | |
| | | | Gas Utilities — 0.6% | | | | |
| | 258,800 | | | Osaka Gas Co. Ltd. | | | 4,732,417 | |
| | 59,700 | | | Toho Gas Co. Ltd. | | | 2,055,600 | |
| | 249,500 | | | Tokyo Gas Co. Ltd. | | | 6,135,929 | |
| | | | | | | | |
| | | | | | | 12,923,946 | |
| | | | | | | | |
| | | | Health Care Equipment & Supplies — 1.8% | |
| | 76,600 | | | Asahi Intecc Co. Ltd. | | | 3,137,102 | |
| | 236,000 | | | Hoya Corp. | | | 13,351,889 | |
| | 203,300 | | | Olympus Corp. | | | 6,776,354 | |
| | 98,800 | | | Sysmex Corp. | | | 6,929,787 | |
| | 207,500 | | | Terumo Corp. | | | 11,201,252 | |
| | | | | | | | |
| | | | | | | 41,396,384 | |
| | | | | | | | |
| | | | Health Care Providers & Services — 0.4% | |
| | 133,200 | | | Alfresa Holdings Corp. | | | 3,552,666 | |
| | 126,800 | | | Medipal Holdings Corp. | | | 2,714,293 | |
| | 33,400 | | | Miraca Holdings, Inc. | | | 813,091 | |
| | 54,400 | | | Suzuken Co. Ltd. | | | 2,753,478 | |
| | | | | | | | |
| | | | | | | 9,833,528 | |
| | | | | | | | |
| | | | Health Care Technology — 0.2% | | | | |
| | 254,800 | | | M3, Inc. | | | 4,129,550 | |
| | | | | | | | |
| | | | Hotels, Restaurants & Leisure — 0.6% | |
| | 43,700 | | | McDonald’s Holdings Co. Japan Ltd. | | | 1,923,339 | |
| | 140,000 | | | Oriental Land Co. Ltd. | | | 13,170,298 | |
| | | | | | | | |
| | | | | | | 15,093,637 | |
| | | | | | | | |
| | | | Household Durables — 3.6% | | | | |
| | 147,200 | | | Casio Computer Co. Ltd. | | | 2,221,712 | |
SEE NOTES TO FINANCIAL STATEMENTS.
| | | | | | | | |
| | | |
| OCTOBER 31, 2018 | | J.P. MORGAN EXCHANGE-TRADED FUNDS | | | | | 73 | |
JPMorgan BetaBuilders Japan ETF
SCHEDULE OF PORTFOLIO INVESTMENTS
AS OF OCTOBER 31, 2018 (continued)
| | | | | | | | |
| SHARES | | | INVESTMENTS | | VALUE($) | |
| | Common Stocks — continued | | | | |
| | | | Household Durables — continued | | | | |
| | 185,500 | | | Haseko Corp. | | | 2,350,584 | |
| | 112,600 | | | Iida Group Holdings Co. Ltd. | | | 2,049,639 | |
| | 251,200 | | | Nikon Corp. | | | 4,379,081 | |
| | 1,447,900 | | | Panasonic Corp. | | | 15,538,075 | |
| | 25,700 | | | Rinnai Corp. | | | 1,866,959 | |
| | 275,100 | | | Sekisui Chemical Co. Ltd. | | | 4,326,199 | |
| | 427,400 | | | Sekisui House Ltd. | | | 6,272,960 | |
| | 113,000 | | | Sharp Corp. (a) | | | 1,734,577 | |
| | 791,600 | | | Sony Corp. | | | 42,838,821 | |
| | | | | | | | |
| | | | | | | 83,578,607 | |
| | | | | | | | |
| | | | Household Products — 0.6% | | | | |
| | 184,700 | | | Lion Corp. | | | 3,472,520 | |
| | 76,000 | | | Pigeon Corp. | | | 3,214,211 | |
| | 252,500 | | | Unicharm Corp. | | | 6,850,006 | |
| | | | | | | | |
| | | | | | | 13,536,737 | |
| | | | | | | | |
| | | | Independent Power and Renewable Electricity
Producers — 0.1% | |
| | 107,000 | | | Electric Power Development Co. Ltd. | | | 2,913,115 | |
| | | | | | | | |
| | | | Industrial Conglomerates — 0.8% | | | | |
| | 69,300 | | | Keihan Holdings Co. Ltd. | | | 2,629,672 | |
| | 179,100 | | | Seibu Holdings, Inc. | | | 3,249,338 | |
| | 407,100 | | | Toshiba Corp.* | | | 12,201,828 | |
| | | | | | | | |
| | | | | | | 18,080,838 | |
| | | | | | | | |
| | | | Insurance — 3.2% | | | | |
| | 745,700 | | | Dai-ichi Life Holdings, Inc. | | | 13,993,311 | |
| | 924,500 | | | Japan Post Holdings Co. Ltd. | | | 10,963,172 | |
| | 43,400 | | | Japan Post Insurance Co. Ltd. | | | 1,033,649 | |
| | 314,100 | | | MS&AD Insurance Group Holdings, Inc. | | | 9,434,696 | |
| | 236,300 | | | Sompo Holdings, Inc. | | | 9,746,321 | |
| | 100,800 | | | Sony Financial Holdings, Inc. | | | 2,325,402 | |
| | 386,900 | | | T&D Holdings, Inc. | | | 6,184,873 | |
| | 467,600 | | | Tokio Marine Holdings, Inc. | | | 22,029,636 | |
| | | | | | | | |
| | | | | | | 75,711,060 | |
| | | | | | | | |
| | | | Interactive Media & Services — 0.2% | | | | |
| | 81,300 | | | Kakaku.com, Inc. | | | 1,472,514 | |
| | 42,900 | | | LINE Corp.* (a) | | | 1,367,734 | |
| | 26,200 | | | Mixi, Inc. | | | 572,469 | |
| | 702,800 | | | Yahoo Japan Corp. | | | 2,192,595 | |
| | | | | | | | |
| | | | | | | 5,605,312 | |
| | | | | | | | |
| | | | Internet & Direct Marketing Retail — 0.3% | |
| | 510,100 | | | Rakuten, Inc. | | | 3,450,309 | |
| | 122,200 | | | ZOZO, Inc. | | | 2,932,072 | |
| | | | | | | | |
| | | | | | | 6,382,381 | |
| | | | | | | | |
| | | | | | | | |
| SHARES | | | INVESTMENTS | | VALUE($) | |
| | | | | | | | |
| | | | IT Services — 1.1% | | | | |
| | 128,800 | | | Fujitsu Ltd. | | | 7,835,986 | |
| | 57,800 | | | Itochu Techno-Solutions Corp. | | | 1,096,122 | |
| | 81,600 | | | Nomura Research Institute Ltd. | | | 3,617,617 | |
| | 403,800 | | | NTT Data Corp. | | | 5,184,184 | |
| | 43,800 | | | Obic Co. Ltd. | | | 3,987,551 | |
| | 70,500 | | | Otsuka Corp. | | | 2,338,406 | |
| | 30,400 | | | SCSK Corp. | | | 1,288,217 | |
| | | | | | | | |
| | | | | | | 25,348,083 | |
| | | | | | | | |
| | | | Leisure Products — 0.8% | | | | |
| | 136,000 | | | Bandai Namco Holdings, Inc. | | | 4,838,168 | |
| | 27,800 | | | Sankyo Co. Ltd. | | | 1,061,424 | |
| | 113,000 | | | Sega Sammy Holdings, Inc. | | | 1,450,955 | |
| | 52,700 | | | Shimano, Inc. | | | 7,197,514 | |
| | 103,500 | | | Yamaha Corp. | | | 4,548,244 | |
| | | | | | | | |
| | | | | | | 19,096,305 | |
| | | | | | | | |
| | | | Machinery — 5.0% | | | | |
| | 249,300 | | | Amada Holdings Co. Ltd. | | | 2,348,615 | |
| | 78,400 | | | Daifuku Co. Ltd. | | | 3,366,985 | |
| | 122,500 | | | FANUC Corp. | | | 21,310,965 | |
| | 179,100 | | | Hino Motors Ltd. | | | 1,714,395 | |
| | 65,000 | | | Hitachi Construction Machinery Co. Ltd. | | | 1,725,777 | |
| | 33,900 | | | Hoshizaki Corp. | | | 2,736,427 | |
| | 97,800 | | | IHI Corp. | | | 3,577,765 | |
| | 153,900 | | | JTEKT Corp. | | | 1,914,769 | |
| | 103,700 | | | Kawasaki Heavy Industries Ltd. | | | 2,457,527 | |
| | 605,900 | | | Komatsu Ltd. | | | 15,779,124 | |
| | 727,400 | | | Kubota Corp. | | | 11,483,315 | |
| | 69,000 | | | Kurita Water Industries Ltd. | | | 1,699,480 | |
| | 175,600 | | | Makita Corp. | | | 6,070,908 | |
| | 263,800 | | | MINEBEA MITSUMI, Inc. | | | 4,035,619 | |
| | 177,300 | | | MISUMI Group, Inc. | | | 3,553,233 | |
| | 209,000 | | | Mitsubishi Heavy Industries Ltd. | | | 7,367,614 | |
| | 77,700 | | | Nabtesco Corp. | | | 1,705,581 | |
| | 176,400 | | | NGK Insulators Ltd. | | | 2,482,666 | |
| | 294,800 | | | NSK Ltd. | | | 2,912,606 | |
| | 44,100 | | | SMC Corp. | | | 14,056,197 | |
| | 76,600 | | | Sumitomo Heavy Industries Ltd. | | | 2,409,129 | |
| | 76,800 | | | THK Co. Ltd. | | | 1,696,154 | |
| | | | | | | | |
| | | | | | | 116,404,851 | |
| | | | | | | | |
| | | | Marine — 0.2% | | | | |
| | 36,100 | | | Kawasaki Kisen Kaisha Ltd.* (a) | | | 481,051 | |
| | 75,500 | | | Mitsui OSK Lines Ltd. | | | 1,834,995 | |
| | 105,100 | | | Nippon Yusen KK | | | 1,694,834 | |
| | | | | | | | |
| | | | | | | 4,010,880 | |
| | | | | | | | |
SEE NOTES TO FINANCIAL STATEMENTS.
| | | | | | |
| | | |
| 74 | | | | J.P. MORGAN EXCHANGE-TRADED FUNDS | | OCTOBER 31, 2018 |
| | | | | | | | |
| SHARES | | | INVESTMENTS | | VALUE($) | |
| | Common Stocks — continued | | | | |
| | | | Media — 0.6% | | | | |
| | 62,400 | | | CyberAgent, Inc. (a) | | | 2,655,318 | |
| | 153,000 | | | Dentsu, Inc. | | | 7,096,114 | |
| | 28,400 | | | Fuji Media Holdings, Inc. | | | 460,931 | |
| | 186,800 | | | Hakuhodo DY Holdings, Inc. | | | 3,115,561 | |
| | 31,200 | | | Nippon Television Holdings, Inc. | | | 497,803 | |
| | 22,700 | | | Tokyo Broadcasting System Holdings, Inc. | | | 420,327 | |
| | | | | | | | |
| | | | | | | 14,246,054 | |
| | | | | | | | |
| | | | Metals & Mining — 1.3% | | | | |
| | 25,000 | | | Daido Steel Co. Ltd. | | | 1,029,263 | |
| | 126,200 | | | Hitachi Metals Ltd. | | | 1,483,977 | |
| | 359,600 | | | JFE Holdings, Inc. | | | 6,757,451 | |
| | 227,800 | | | Kobe Steel Ltd. | | | 1,831,583 | |
| | 50,100 | | | Maruichi Steel Tube Ltd. | | | 1,443,590 | |
| | 80,800 | | | Mitsubishi Materials Corp. | | | 2,236,940 | |
| | 550,400 | | | Nippon Steel & Sumitomo Metal Corp. | | | 10,152,772 | |
| | 172,400 | | | Sumitomo Metal Mining Co. Ltd. | | | 5,428,196 | |
| | 28,900 | | | Yamato Kogyo Co. Ltd. | | | 761,625 | |
| | | | | | | | |
| | | | | | | 31,125,397 | |
| | | | | | | | |
| | | | Multiline Retail — 0.9% | | | | |
| | 84,500 | | | Don Quijote Holdings Co. Ltd. | | | 5,047,799 | |
| | 248,700 | | | Isetan Mitsukoshi Holdings Ltd. | | | 2,906,631 | |
| | 28,600 | | | Izumi Co. Ltd. | | | 1,552,815 | |
| | 165,100 | | | J Front Retailing Co. Ltd. | | | 2,163,522 | |
| | 131,400 | | | Marui Group Co. Ltd. | | | 2,829,277 | |
| | 18,600 | | | Ryohin Keikaku Co. Ltd. | | | 4,916,537 | |
| | 27,400 | | | Seria Co. Ltd. (a) | | | 919,245 | |
| | 108,800 | | | Takashimaya Co. Ltd. | | | 1,712,261 | |
| | | | | | | | |
| | | | | | | 22,048,087 | |
| | | | | | | | |
| | | | Oil, Gas & Consumable Fuels — 1.3% | | | | |
| | 104,400 | | | Idemitsu Kosan Co. Ltd. | | | 4,729,601 | |
| | 672,300 | | | Inpex Corp. | | | 7,655,220 | |
| | 2,133,000 | | | JXTG Holdings, Inc. | | | 14,412,644 | |
| | 127,100 | | | Showa Shell Sekiyu KK | | | 2,425,852 | |
| | | | | | | | |
| | | | | | | 29,223,317 | |
| | | | | | | | |
| | | | Paper & Forest Products — 0.2% | | | | |
| | 627,600 | | | Oji Holdings Corp. | | | 4,456,667 | |
| | | | | | | | |
| | | | Personal Products — 1.8% | | | | |
| | 308,200 | | | Kao Corp. | | | 20,502,150 | |
| | 32,700 | | | Kobayashi Pharmaceutical Co. Ltd. | | | 2,132,762 | |
| | 21,300 | | | Kose Corp. | | | 3,183,218 | |
| | 52,500 | | | Pola Orbis Holdings, Inc. | | | 1,402,488 | |
| | 250,800 | | | Shiseido Co. Ltd. | | | 15,824,352 | |
| | | | | | | | |
| | | | | | | 43,044,970 | |
| | | | | | | | |
| | | | | | | | |
| SHARES | | | INVESTMENTS | | VALUE($) | |
| | | | | | | | |
| | | | Pharmaceuticals — 5.7% | | | | |
| | 1,232,600 | | | Astellas Pharma, Inc. | | | 19,043,923 | |
| | 131,500 | | | Chugai Pharmaceutical Co. Ltd. | | | 7,698,901 | |
| | 380,900 | | | Daiichi Sankyo Co. Ltd. | | | 14,559,219 | |
| | 184,700 | | | Eisai Co. Ltd. | | | 15,381,896 | |
| | 52,000 | | | Hisamitsu Pharmaceutical Co., Inc. | | | 2,930,066 | |
| | 159,800 | | | Kyowa Hakko Kirin Co. Ltd. | | | 3,094,823 | |
| | 153,900 | | | Mitsubishi Tanabe Pharma Corp. | | | 2,273,247 | |
| | 37,400 | | | Nippon Shinyaku Co. Ltd. | | | 2,148,681 | |
| | 321,000 | | | Ono Pharmaceutical Co. Ltd. | | | 7,284,654 | |
| | 347,100 | | | Otsuka Holdings Co. Ltd. | | | 16,601,089 | |
| | 254,200 | | | Santen Pharmaceutical Co. Ltd. | | | 3,765,165 | |
| | 183,700 | | | Shionogi & Co. Ltd. | | | 11,746,460 | |
| | 105,600 | | | Sumitomo Dainippon Pharma Co. Ltd. | | | 2,206,377 | |
| | 33,900 | | | Taisho Pharmaceutical Holdings Co. Ltd. | | | 3,614,640 | |
| | 470,300 | | | Takeda Pharmaceutical Co. Ltd. (a) | | | 19,498,426 | |
| | 44,900 | | | Tsumura & Co. | | | 1,396,526 | |
| | | | | | | | |
| | | | | | | 133,244,093 | |
| | | | | | | | |
| | | | Professional Services — 1.3% | | | | |
| | 82,900 | | | Nihon M&A Center, Inc. | | | 1,986,476 | |
| | 120,300 | | | Persol Holdings Co. Ltd. | | | 2,282,287 | |
| | 980,600 | | | Recruit Holdings Co. Ltd. | | | 26,318,904 | |
| | | | | | | | |
| | | | | | | 30,587,667 | |
| | | | | | | | |
| | | | Real Estate Management & Development — 2.9% | |
| | 60,900 | | | Aeon Mall Co. Ltd. | | | 1,124,738 | |
| | 48,100 | | | Daito Trust Construction Co. Ltd. | | | 6,341,426 | |
| | 419,900 | | | Daiwa House Industry Co. Ltd. | | | 12,678,602 | |
| | 306,100 | | | Hulic Co. Ltd. | | | 2,801,006 | |
| | 867,700 | | | Mitsubishi Estate Co. Ltd. | | | 13,867,409 | |
| | 617,000 | | | Mitsui Fudosan Co. Ltd. | | | 13,896,226 | |
| | 76,700 | | | Nomura Real Estate Holdings, Inc. | | | 1,440,807 | |
| | 69,800 | | | NTT Urban Development Corp. | | | 1,037,348 | |
| | 296,100 | | | Sumitomo Realty & Development Co. Ltd. | | | 10,174,017 | |
| | 133,500 | | | Tokyo Tatemono Co. Ltd. | | | 1,435,813 | |
| | 352,500 | | | Tokyu Fudosan Holdings Corp. | | | 1,986,105 | |
| | | | | | | | |
| | | | | | | 66,783,497 | |
| | | | | | | | |
| | | | Road & Rail — 4.2% | | | | |
| | 128,300 | | | Central Japan Railway Co. | | | 24,621,886 | |
| | 236,200 | | | East Japan Railway Co. | | | 20,629,175 | |
| | 157,300 | | | Hankyu Hanshin Holdings, Inc. | | | 5,195,721 | |
| | 173,500 | | | Keikyu Corp. | | | 2,567,785 | |
| | 76,300 | | | Keio Corp. | | | 4,144,164 | |
| | 106,300 | | | Keisei Electric Railway Co. Ltd. | | | 3,275,962 | |
| | 120,900 | | | Kintetsu Group Holdings Co. Ltd. | | | 4,644,258 | |
| | 100,300 | | | Kyushu Railway Co. | | | 3,080,215 | |
SEE NOTES TO FINANCIAL STATEMENTS.
| | | | | | | | |
| | | |
| OCTOBER 31, 2018 | | J.P. MORGAN EXCHANGE-TRADED FUNDS | | | | | 75 | |
JPMorgan BetaBuilders Japan ETF
SCHEDULE OF PORTFOLIO INVESTMENTS
AS OF OCTOBER 31, 2018 (continued)
| | | | | | | | |
| SHARES | | | INVESTMENTS | | VALUE($) | |
| | Common Stocks — continued | | | | |
| | | | Road & Rail — continued | |
| | 121,400 | | | Nagoya Railroad Co. Ltd. | | | 2,931,969 | |
| | 72,100 | | | Nankai Electric Railway Co. Ltd. | | | 1,765,728 | |
| | 53,000 | | | Nippon Express Co. Ltd. | | | 3,344,752 | |
| | 209,800 | | | Odakyu Electric Railway Co. Ltd. | | | 4,435,320 | |
| | 131,300 | | | Tobu Railway Co. Ltd. | | | 3,651,800 | |
| | 355,300 | | | Tokyu Corp. | | | 5,869,724 | |
| | 121,800 | | | West Japan Railway Co. | | | 8,191,982 | |
| | | | | | | | |
| | | | | | | 98,350,441 | |
| | | | | | | | |
| | | | Semiconductors & Semiconductor Equipment — 1.1% | |
| | 109,700 | | | Advantest Corp. | | | 2,025,117 | |
| | 20,000 | | | Disco Corp. | | | 3,179,198 | |
| | 59,100 | | | Rohm Co. Ltd. | | | 4,154,984 | |
| | 146,500 | | | SUMCO Corp. | | | 1,977,316 | |
| | 102,800 | | | Tokyo Electron Ltd. | | | 13,872,727 | |
| | | | | | | | |
| | | | | | | 25,209,342 | |
| | | | | | | | |
| | | | Software — 0.2% | | | | |
| | 21,900 | | | Oracle Corp. Japan | | | 1,482,389 | |
| | 75,600 | | | Trend Micro, Inc. | | | 4,351,976 | |
| | | | | | | | |
| | | | | | | 5,834,365 | |
| | | | | | | | |
| | | | Specialty Retail — 1.7% | | | | |
| | 20,900 | | | ABC-Mart, Inc. | | | 1,221,919 | |
| | 38,700 | | | Fast Retailing Co. Ltd. | | | 19,485,659 | |
| | 17,300 | | | Hikari Tsushin, Inc. | | | 3,021,521 | |
| | 133,500 | | | K’s Holdings Corp. | | | 1,686,496 | |
| | 54,100 | | | Nitori Holdings Co. Ltd. | | | 7,064,022 | |
| | 17,600 | | | Shimamura Co. Ltd. | | | 1,480,416 | |
| | 136,200 | | | USS Co. Ltd. | | | 2,455,936 | |
| | 467,700 | | | Yamada Denki Co. Ltd. (a) | | | 2,205,369 | |
| | | | | | | | |
| | | | | | | 38,621,338 | |
| | | | | | | | |
| | | | Technology Hardware, Storage & Peripherals — 2.1% | |
| | 161,100 | | | Brother Industries Ltd. | | | 2,948,386 | |
| | 673,300 | | | Canon, Inc. | | | 19,177,881 | |
| | 266,300 | | | FUJIFILM Holdings Corp. | | | 11,517,577 | |
| | 311,800 | | | Konica Minolta, Inc. | | | 3,086,318 | |
| | 160,300 | | | NEC Corp. | | | 4,601,449 | |
| | 463,400 | | | Ricoh Co. Ltd. | | | 4,625,788 | |
| | 200,500 | | | Seiko Epson Corp. | | | 3,230,305 | |
| | | | | | | | |
| | | | | | | 49,187,704 | |
| | | | | | | | |
| | | | Textiles, Apparel & Luxury Goods — 0.1% | |
| | 120,600 | | | Asics Corp. | | | 1,745,508 | |
| | | | | | | | |
| | | | Tobacco — 0.8% | | | | |
| | 696,400 | | | Japan Tobacco, Inc. | | | 17,894,226 | |
| | | | | | | | |
| | | | | | | | |
| SHARES | | | INVESTMENTS | | VALUE($) | |
| | | | | | | | |
| | | | Trading Companies & Distributors — 4.0% | |
| | 959,900 | | | ITOCHU Corp. | | | 17,802,275 | |
| | 1,081,200 | | | Marubeni Corp. | | | 8,767,116 | |
| | 991,300 | | | Mitsubishi Corp. | | | 27,900,448 | |
| | 1,083,300 | | | Mitsui & Co. Ltd. | | | 18,100,437 | |
| | 83,700 | | | MonotaRO Co. Ltd. | | | 1,845,300 | |
| | 699,400 | | | Sojitz Corp. | | | 2,352,056 | |
| | 776,800 | | | Sumitomo Corp. | | | 11,781,475 | |
| | 149,200 | | | Toyota Tsusho Corp. | | | 5,384,423 | |
| | | | | | | | |
| | | | | | | 93,933,530 | |
| | | | | | | | |
| | | | Transportation Infrastructure — 0.2% | |
| | 46,600 | | | Japan Airport Terminal Co. Ltd. | | | 1,794,931 | |
| | 75,700 | | | Kamigumi Co. Ltd. | | | 1,562,043 | |
| | 51,400 | | | Mitsubishi Logistics Corp. | | | 1,178,369 | |
| | | | | | | | |
| | | | | | | 4,535,343 | |
| | | | | | | | |
| | | | Wireless Telecommunication Services — 3.8% | |
| | 1,085,600 | | | KDDI Corp. | | | 26,271,358 | |
| | 751,500 | | | NTT DOCOMO, Inc. | | | 18,636,332 | |
| | 542,100 | | | SoftBank Group Corp. | | | 42,901,154 | |
| | | | | | | | |
| | | | | | | 87,808,844 | |
| | | | | | | | |
| | | | Total Common Stocks
(Cost $2,433,472,200) | | | 2,316,232,357 | |
| | | | | | | | |
| | Short-Term Investments — 0.0% (b) | | | | |
| | | | Investment Companies — 0.0% (b) | | | | |
| | 288,800 | | | JPMorgan U.S. Government Money Market Fund Class Institutional Shares,
2.02% (c) (d)
(Cost $288,800) | | | 288,800 | |
| | | | | | | | |
| | Investment of Cash Collateral from Securities Loaned — 0.8% | |
| | 13,001,100 | | | JPMorgan Securities Lending Money Market Fund Class Agency SL Shares,
2.27% (c) (d) | | | 12,999,800 | |
| | 6,499,769 | | | JPMorgan U.S. Government Money Market Fund Class IM Shares, 2.07% (c) (d) | | | 6,499,769 | |
| | | | | | | | |
| | | | Total Investment of Cash Collateral from Securities Loaned
(Cost $19,499,769) | | | 19,499,569 | |
| | | | | | | | |
| | | | Total Investments — 100.0% (Cost $2,453,260,769) | | | 2,336,020,726 | |
| | | | Other Assets Less
Liabilities — 0.0% (b) | | | 66,941 | |
| | | | | | | | |
| | | | NET ASSETS — 100.0% | | | 2,336,087,667 | |
| | | | | | | | |
Percentages indicated are based on net assets.
SEE NOTES TO FINANCIAL STATEMENTS.
| | | | | | |
| | | |
| 76 | | | | J.P. MORGAN EXCHANGE-TRADED FUNDS | | OCTOBER 31, 2018 |
| | |
| (a) | | — The security or a portion of this security is on loan at October 31, 2018. The total value of securities on loan at October 31, 2018 was $17,759,855. |
| (b) | | — Amount rounds to less than 0.1% of net assets. |
| (c) | | — Investment in affiliate. Fund is registered under the Investment Company Act of 1940, as amended, and advised by J.P. Morgan Investment Management Inc. |
| (d) | | — The rate shown is the current yield as of October 31, 2018. |
| * | | — Non-income producing security. |
| | | | | | | | | | | | | | | | | | | | |
| Futures contracts outstanding as of October 31, 2018: | | | | | | | |
| DESCRIPTION | | NUMBER OF
CONTRACTS | | | EXPIRATION
DATE | | | TRADING
CURRENCY | | | NOTIONAL
AMOUNT ($) | | | VALUE AND
UNREALIZED
APPRECIATION
(DEPRECIATION) ($) | |
Long Contracts | | | | | | | | | | | | | | | | | | | | |
TOPIX Index | | | 28 | | | | 12/2018 | | | | JPY | | | | 4,063,456 | | | | (165,724 | ) |
TOPIX Index | | | 95 | | | | 03/2019 | | | | JPY | | | | 13,824,611 | | | | (410,353 | ) |
| | | | | | | | | | | | | | | | | | | | |
| | | | | | | | | | | | | | | | | | | (576,077 | ) |
| | | | | | | | | | | | | | | | | | | | |
Abbreviations
| | |
| JPY | | — Japanese Yen |
| TOPIX | | — Tokyo Stock Price Index |
SEE NOTES TO FINANCIAL STATEMENTS.
| | | | | | | | |
| | | |
| OCTOBER 31, 2018 | | J.P. MORGAN EXCHANGE-TRADED FUNDS | | | | | 77 | |
JPMorgan Diversified Return Emerging Markets Equity ETF
SCHEDULE OF PORTFOLIO INVESTMENTS
AS OF OCTOBER 31, 2018
| | | | | | | | |
| SHARES | | | INVESTMENTS | | VALUE($) | |
| | Common Stocks — 99.4% | | | | |
| | | | Brazil — 9.8% | | | | |
| | 40,100 | | | Atacadao Distribuicao Comercio e Industria Ltda* | | | 163,460 | |
| | 22,520 | | | Azul SA (Preference)* | | | 183,476 | |
| | 49,599 | | | Banco Bradesco SA* | | | 400,364 | |
| | 183,068 | | | Banco Bradesco SA (Preference)* | | | 1,677,447 | |
| | 11,913 | | | Banco BTG Pactual SA* | | | 63,286 | |
| | 54,775 | | | Banco do Brasil SA* | | | 627,745 | |
| | 11,673 | | | Banco do Estado do Rio Grande do Sul SA (Preference), Class B | | | 61,447 | |
| | 22,537 | | | Banco Santander Brasil SA | | | 255,740 | |
| | 38,979 | | | BB Seguridade Participacoes SA | | | 278,923 | |
| | 12,920 | | | Bradespar SA (Preference) | | | 119,323 | |
| | 12,928 | | | Braskem SA (Preference), Class A | | | 180,988 | |
| | 45,800 | | | Centrais Eletricas Brasileiras SA* | | | 287,365 | |
| | 32,500 | | | Centrais Eletricas Brasileiras SA (Preference)* | | | 230,378 | |
| | 48,168 | | | Cia de Saneamento Basico do Estado de Sao Paulo* | | | 358,526 | |
| | 6,577 | | | Cia de Transmissao de Energia Eletrica Paulista (Preference) | | | 115,564 | |
| | 11,250 | | | Cia Energetica de Minas Gerais | | | 33,253 | |
| | 131,772 | | | Cia Energetica de Minas Gerais (Preference) | | | 391,262 | |
| | 14,032 | | | Cia Paranaense de Energia (Preference) | | | 98,750 | |
| | 41,415 | | | Cia Siderurgica Nacional SA* | | | 105,944 | |
| | 11,241 | | | Cosan SA | | | 96,809 | |
| | 42,233 | | | EDP—Energias do Brasil SA | | | 158,537 | |
| | 19,709 | | | Engie Brasil Energia SA | | | 210,780 | |
| | 23,517 | | | Equatorial Energia SA | | | 427,369 | |
| | 30,298 | | | Estacio Participacoes SA | | | 188,472 | |
| | 15,854 | | | Fibria Celulose SA | | | 304,853 | |
| | 70,398 | | | Gerdau SA (Preference) | | | 305,881 | |
| | 55,686 | | | Hypera SA* | | | 442,465 | |
| | 6,991 | | | IRB Brasil Resseguros SA | | | 134,692 | |
| | 169,679 | | | Itau Unibanco Holding SA (Preference) | | | 2,240,501 | |
| | 253,023 | | | Itausa—Investimentos Itau SA (Preference) | | | 761,483 | |
| | 176,027 | | | Kroton Educacional SA | | | 539,220 | |
| | 59,087 | | | Localiza Rent a Car SA* | | | 454,088 | |
| | 8,709 | | | Magazine Luiza SA | | | 394,111 | |
| | 22,700 | | | Petrobras Distribuidora SA | | | 145,844 | |
| | 194,711 | | | Petroleo Brasileiro SA* | | | 1,581,128 | |
| | 256,764 | | | Petroleo Brasileiro SA (Preference)* | | | 1,904,945 | |
| | 5,499 | | | Porto Seguro SA* | | | 80,339 | |
| | 14,000 | | | Qualicorp Consultoria e Corretora de Seguros SA | | | 53,946 | |
| | 18,890 | | | Sao Martinho SA | | | 97,711 | |
| | 6,811 | | | Smiles Fidelidade SA* | | | 68,595 | |
| | 12,793 | | | Sul America SA | | | 85,080 | |
| | | | | | | | |
| SHARES | | | INVESTMENTS | | VALUE($) | |
| | | | | | | | |
| | | | Brazil — continued | | | | |
| | 58,432 | | | Telefonica Brasil SA (Preference) | | | 676,564 | |
| | 30,524 | | | Transmissora Alianca de Energia Eletrica SA | | | 184,054 | |
| | 26,214 | | | Usinas Siderurgicas de Minas Gerais SA (Preference), Class A | | | 72,130 | |
| | 240,863 | | | Vale SA | | | 3,643,850 | |
| | | | | | | | |
| | | | | | | 20,886,688 | |
| | | | | | | | |
| | | | Chile — 1.3% | | | | |
| | 393,201 | | | AES Gener SA | | | 110,135 | |
| | 385,159 | | | Aguas Andinas SA, Class A | | | 200,331 | |
| | 1,563,806 | | | Banco de Chile | | | 216,617 | |
| | 2,221 | | | Banco de Credito e Inversiones SA | | | 139,641 | |
| | 3,482,586 | | | Banco Santander Chile | | | 255,588 | |
| | 1,018,982 | | | Colbun SA | | | 191,175 | |
| | 77,050 | | | Empresas CMPC SA | | | 263,773 | |
| | 33,083 | | | Empresas COPEC SA | | | 463,719 | |
| | 3,863,522 | | | Enel Americas SA | | | 608,889 | |
| | 3,234,697 | | | Enel Chile SA | | | 281,547 | |
| | 9,742,260 | | | Itau CorpBanca | | | 90,283 | |
| | 33,893 | | | Parque Arauco SA | | | 76,887 | |
| | | | | | | | |
| | | | | | | 2,898,585 | |
| | | | | | | | |
| | | | China — 21.2% | | | | |
| | 158,500 | | | 3SBio, Inc. (a) | | | 231,721 | |
| | 50,000 | | | Agile Group Holdings Ltd. | | | 57,447 | |
| | 1,101,000 | | | Agricultural Bank of China Ltd., Class H | | | 484,638 | |
| | 172,000 | | | Air China Ltd., Class H | | | 139,055 | |
| | 50,000 | | | Angang Steel Co. Ltd., Class H | | | 42,758 | |
| | 62,500 | | | Anhui Conch Cement Co. Ltd., Class H | | | 323,946 | |
| | 11,600 | | | Anhui Gujing Distillery Co. Ltd., Class B | | | 60,254 | |
| | 119,000 | | | ANTA Sports Products Ltd. | | | 491,296 | |
| | 3,026 | | | Autohome, Inc., ADR | | | 219,022 | |
| | 131,000 | | | AviChina Industry & Technology Co. Ltd., Class H | | | 87,479 | |
| | 131,500 | | | BAIC Motor Corp. Ltd., Class H (a) | | | 74,235 | |
| | 14,926 | | | Baidu, Inc., ADR* | | | 2,836,836 | |
| | 2,704,000 | | | Bank of China Ltd., Class H | | | 1,152,016 | |
| | 275,000 | | | Bank of Communications Co. Ltd., Class H | | | 206,596 | |
| | 125,000 | | | BBMG Corp., Class H | | | 34,579 | |
| | 88,000 | | | Beijing Capital International Airport Co. Ltd., Class H | | | 95,537 | |
| | 27,500 | | | Beijing Enterprises Holdings Ltd. | | | 149,104 | |
| | 514,000 | | | Beijing Enterprises Water Group Ltd. | | | 262,479 | |
| | 264,000 | | | Brilliance China Automotive Holdings Ltd. | | | 231,589 | |
| | 38,000 | | | BYD Electronic International Co. Ltd. | | | 44,716 | |
| | 62,000 | | | CAR, Inc.* | | | 49,285 | |
| | 1,345,000 | | | CGN Power Co. Ltd., Class H (a) | | | 309,321 | |
SEE NOTES TO FINANCIAL STATEMENTS.
| | | | | | |
| | | |
| 78 | | | | J.P. MORGAN EXCHANGE-TRADED FUNDS | | OCTOBER 31, 2018 |
| | | | | | | | |
| SHARES | | | INVESTMENTS | | VALUE($) | |
| | Common Stocks — continued | | | | |
| | | | China — continued | | | | |
| | 204,000 | | | China Agri-Industries Holdings Ltd. | | | 68,373 | |
| | 86,000 | | | China BlueChemical Ltd., Class H | | | 29,481 | |
| | 336,000 | | | China Cinda Asset Management Co. Ltd., Class H | | | 82,482 | |
| | 290,000 | | | China CITIC Bank Corp. Ltd., Class H | | | 179,752 | |
| | 98,000 | | | China Coal Energy Co. Ltd., Class H | | | 44,005 | |
| | 237,000 | | | China Communications Construction Co. Ltd., Class H | | | 217,307 | |
| | 136,000 | | | China Communications Services Corp. Ltd., Class H | | | 110,210 | |
| | 75,500 | | | China Conch Venture Holdings Ltd. | | | 212,426 | |
| | 3,189,000 | | | China Construction Bank Corp., Class H | | | 2,530,622 | |
| | 150,000 | | | China Eastern Airlines Corp. Ltd., Class H | | | 83,252 | |
| | 109,000 | | | China Everbright Bank Co. Ltd., Class H | | | 48,652 | |
| | 190,000 | | | China Everbright International Ltd. | | | 151,999 | |
| | 30,000 | | | China Everbright Ltd. | | | 53,199 | |
| | 104,000 | | | China Evergrande Group | | | 249,368 | |
| | 66,000 | | | China Foods Ltd. | | | 30,991 | |
| | 134,000 | | | China Galaxy Securities Co. Ltd., Class H | | | 67,505 | |
| | 348,000 | | | China Huarong Asset Management Co. Ltd., Class H (a) | | | 63,185 | |
| | 34,000 | | | China International Capital Corp. Ltd., Class H (a) | | | 56,003 | |
| | 200,000 | | | China Jinmao Holdings Group Ltd. | | | 84,270 | |
| | 262,000 | | | China Life Insurance Co. Ltd., Class H | | | 524,995 | |
| | 161,000 | | | China Longyuan Power Group Corp. Ltd., Class H | | | 122,522 | |
| | 146,000 | | | China Medical System Holdings Ltd. | | | 174,389 | |
| | 132,500 | | | China Merchants Bank Co. Ltd., Class H | | | 511,632 | |
| | 68,000 | | | China Merchants Port Holdings Co. Ltd. | | | 115,826 | |
| | 222,800 | | | China Minsheng Banking Corp. Ltd., Class H | | | 164,515 | |
| | 637,000 | | | China Mobile Ltd. | | | 5,967,338 | |
| | 177,000 | | | China Molybdenum Co. Ltd., Class H | | | 66,096 | |
| | 206,250 | | | China National Building Material Co. Ltd., Class H | | | 148,286 | |
| | 134,000 | | | China Overseas Land & Investment Ltd. | | | 421,275 | |
| | 91,200 | | | China Pacific Insurance Group Co. Ltd., Class H | | | 340,486 | |
| | 1,198,000 | | | China Petroleum & Chemical Corp., Class H | | | 975,862 | |
| | 544,000 | | | China Power International Development Ltd. | | | 107,633 | |
| | 100,500 | | | China Railway Construction Corp. Ltd., Class H | | | 127,636 | |
| | 207,000 | | | China Railway Group Ltd., Class H | | | 184,998 | |
| | 86,000 | | | China Railway Signal & Communication Corp. Ltd., Class H (a) | | | 57,909 | |
| | 240,000 | | | China Reinsurance Group Corp., Class H | | | 45,994 | |
| | 114,000 | | | China Resources Cement Holdings Ltd. | | | 101,195 | |
| | 98,000 | | | China Resources Gas Group Ltd. | | | 375,629 | |
| | 94,000 | | | China Resources Land Ltd. | | | 319,713 | |
| | | | | | | | |
| SHARES | | | INVESTMENTS | | VALUE($) | |
| | | | | | | | |
| | | | China — continued | | | | |
| | 199,000 | | | China Resources Pharmaceutical Group Ltd. (a) | | | 292,374 | |
| | 228,000 | | | China Resources Power Holdings Co. Ltd. | | | 401,154 | |
| | 157,500 | | | China Shenhua Energy Co. Ltd., Class H | | | 356,336 | |
| | 88,000 | | | China South City Holdings Ltd. | | | 12,934 | |
| | 178,000 | | | China Southern Airlines Co. Ltd., Class H | | | 97,025 | |
| | 96,000 | | | China State Construction International Holdings Ltd. | | | 68,651 | |
| | 51,200 | | | China Taiping Insurance Holdings Co. Ltd. | | | 171,980 | |
| | 1,690,000 | | | China Telecom Corp. Ltd., Class H | | | 799,594 | |
| | 296,000 | | | China Traditional Chinese Medicine Holdings Co. Ltd. | | | 188,990 | |
| | 47,500 | | | China Vanke Co. Ltd., Class H | | | 146,675 | |
| | 65,600 | | | China Zhongwang Holdings Ltd. | | | 29,191 | |
| | 83,600 | | | Chongqing Changan Automobile Co. Ltd., Class B | | | 56,483 | |
| | 100,000 | | | Chongqing Rural Commercial Bank Co. Ltd., Class H | | | 55,240 | |
| | 120,000 | | | CIFI Holdings Group Co. Ltd. | | | 50,347 | |
| | 28,000 | | | CIMC Enric Holdings Ltd. | | | 21,524 | |
| | 263,000 | | | CITIC Ltd. | | | 395,160 | |
| | 80,500 | | | CITIC Securities Co. Ltd., Class H | | | 142,123 | |
| | 755,000 | | | CNOOC Ltd. | | | 1,285,750 | |
| | 68,000 | | | COSCO SHIPPING Energy Transportation Co. Ltd., Class H | | | 37,256 | |
| | 92,000 | | | COSCO SHIPPING Ports Ltd. | | | 94,028 | |
| | 266,000 | | | Country Garden Holdings Co. Ltd. | | | 286,258 | |
| | 215,000 | | | CRRC Corp. Ltd., Class H | | | 188,828 | |
| | 536,000 | | | CSPC Pharmaceutical Group Ltd. | | | 1,142,113 | |
| | 200,000 | | | Dali Foods Group Co. Ltd. (a) | | | 142,990 | |
| | 342,000 | | | Datang International Power Generation Co. Ltd., Class H | | | 76,479 | |
| | 278,000 | | | Dongfeng Motor Group Co. Ltd., Class H | | | 274,695 | |
| | 87,600 | | | ENN Energy Holdings Ltd. | | | 747,453 | |
| | 75,000 | | | Far East Horizon Ltd. | | | 72,686 | |
| | 105,576 | | | Fosun International Ltd. | | | 154,895 | |
| | 58,000 | | | Future Land Development Holdings Ltd. | | | 33,456 | |
| | 49,200 | | | Fuyao Glass Industry Group Co. Ltd., Class H (a) | | | 145,430 | |
| | 579,000 | | | GCL-Poly Energy Holdings Ltd.* | | | 34,405 | |
| | 468,000 | | | Geely Automobile Holdings Ltd. | | | 901,837 | |
| | 55,800 | | | GF Securities Co. Ltd., Class H | | | 72,297 | |
| | 294,500 | | | Great Wall Motor Co. Ltd., Class H | | | 174,939 | |
| | 27,000 | | | Greentown China Holdings Ltd. | | | 18,869 | |
| | 354,000 | | | Guangdong Investment Ltd. | | | 633,756 | |
| | 136,000 | | | Guangshen Railway Co. Ltd., Class H | | | 50,954 | |
SEE NOTES TO FINANCIAL STATEMENTS.
| | | | | | | | |
| | | |
| OCTOBER 31, 2018 | | J.P. MORGAN EXCHANGE-TRADED FUNDS | | | | | 79 | |
JPMorgan Diversified Return Emerging Markets Equity ETF
SCHEDULE OF PORTFOLIO INVESTMENTS
AS OF OCTOBER 31, 2018 (continued)
| | | | | | | | |
| SHARES | | | INVESTMENTS | | VALUE($) | |
| | Common Stocks — continued | | | | |
| | | | China — continued | | | | |
| | 295,200 | | | Guangzhou Automobile Group Co. Ltd., Class H | | | 299,198 | |
| | 28,000 | | | Guangzhou Baiyunshan Pharmaceutical Holdings Co. Ltd., Class H | | | 102,213 | |
| | 36,800 | | | Guangzhou R&F Properties Co. Ltd., Class H | | | 58,105 | |
| | 29,800 | | | Guotai Junan Securities Co. Ltd., Class H (a) | | | 62,829 | |
| | 30,000 | | | Haitian International Holdings Ltd. | | | 58,918 | |
| | 122,400 | | | Haitong Securities Co. Ltd., Class H | | | 123,317 | |
| | 14,500 | | | Health & Happiness H&H International Holdings Ltd.* | | | 82,743 | |
| | 69,000 | | | Hengan International Group Co. Ltd. | | | 548,507 | |
| | 198,000 | | | Huadian Power International Corp. Ltd., Class H | | | 75,102 | |
| | 522,000 | | | Huaneng Power International, Inc., Class H | | | 290,966 | |
| | 614,000 | | | Huaneng Renewables Corp. Ltd., Class H | | | 158,028 | |
| | 61,400 | | | Huatai Securities Co. Ltd., Class H (a) | | | 98,851 | |
| | 2,795,000 | | | Industrial & Commercial Bank of China Ltd., Class H | | | 1,896,332 | |
| | 48,400 | | | Inner Mongolia Yitai Coal Co. Ltd., Class B | | | 57,654 | |
| | 64,000 | | | Jiangsu Expressway Co. Ltd., Class H | | | 85,855 | |
| | 55,000 | | | Jiangxi Copper Co. Ltd., Class H | | | 60,751 | |
| | 42,000 | | | Jiayuan International Group Ltd. | | | 73,696 | |
| | 130,000 | | | Kunlun Energy Co. Ltd. | | | 147,912 | |
| | 44,236 | | | KWG Group Holdings Ltd. | | | 33,948 | |
| | 21,300 | | | Legend Holdings Corp., Class H (a) | | | 57,931 | |
| | 390,000 | | | Lenovo Group Ltd. | | | 248,739 | |
| | 152,500 | | | Li Ning Co. Ltd.* | | | 143,456 | |
| | 15,523 | | | Livzon Pharmaceutical Group, Inc., Class H | | | 45,365 | |
| | 36,000 | | | Logan Property Holdings Co. Ltd. | | | 33,340 | |
| | 52,500 | | | Longfor Group Holdings Ltd. | | | 127,585 | |
| | 196,500 | | | Luye Pharma Group Ltd. (a) | | | 152,528 | |
| | 78,000 | | | Maanshan Iron & Steel Co. Ltd., Class H | | | 42,005 | |
| | 153,000 | | | Metallurgical Corp. of China Ltd., Class H‡ | | | 37,188 | |
| | 5,451 | | | Momo, Inc., ADR* | | | 182,990 | |
| | 30,700 | | | New China Life Insurance Co. Ltd., Class H | | | 144,032 | |
| | 28,400 | | | Orient Securities Co. Ltd., Class H (a) | | | 18,703 | |
| | 290,000 | | | People’s Insurance Co. Group of China Ltd. (The), Class H | | | 118,611 | |
| | 974,000 | | | PetroChina Co. Ltd., Class H | | | 700,329 | |
| | 236,000 | | | PICC Property & Casualty Co. Ltd., Class H | | | 229,402 | |
| | 177,000 | | | Ping An Insurance Group Co. of China Ltd., Class H | | | 1,673,364 | |
| | 68,000 | | | Poly Property Group Co. Ltd. | | | 20,379 | |
| | 206,000 | | | Postal Savings Bank of China Co. Ltd., Class H (a) | | | 123,252 | |
| | 18,262 | | | Red Star Macalline Group Corp. Ltd., Class H (a) | | | 16,156 | |
| | | | | | | | |
| SHARES | | | INVESTMENTS | | VALUE($) | |
| | | | | | | | |
| | | | China — continued | | | | |
| | 22,750 | | | Shandong Chenming Paper Holdings Ltd., Class H | | | 12,811 | |
| | 204,000 | | | Shandong Weigao Group Medical Polymer Co. Ltd., Class H | | | 182,733 | |
| | 12,200 | | | Shanghai Baosight Software Co. Ltd., Class B | | | 21,130 | |
| | 150,000 | | | Shanghai Electric Group Co. Ltd., Class H | | | 48,820 | |
| | 24,000 | | | Shanghai Industrial Holdings Ltd. | | | 50,544 | |
| | 100,700 | | | Shanghai Pharmaceuticals Holding Co. Ltd., Class H | | | 223,001 | |
| | 36,000 | | | Shenzhen Expressway Co. Ltd., Class H | | | 33,180 | |
| | 46,044 | | | Shenzhen International Holdings Ltd. | | | 88,213 | |
| | 112,829 | | | Shenzhen Investment Ltd. | | | 32,475 | |
| | 71,000 | | | Shenzhou International Group Holdings Ltd. | | | 787,149 | |
| | 42,500 | | | Shimao Property Holdings Ltd. | | | 83,744 | |
| | 491,000 | | | Sihuan Pharmaceutical Holdings Group Ltd. | | | 99,975 | |
| | 103,500 | | | Sino-Ocean Group Holding Ltd. | | | 40,685 | |
| | 78,000 | | | Sinopec Engineering Group Co. Ltd., Class H | | | 72,661 | |
| | 160,000 | | | Sinopec Shanghai Petrochemical Co. Ltd., Class H | | | 70,311 | |
| | 123,200 | | | Sinopharm Group Co. Ltd., Class H | | | 596,824 | |
| | 106,000 | | | Sinotrans Ltd., Class H | | | 37,082 | |
| | 36,500 | | | Sinotruk Hong Kong Ltd. | | | 52,778 | |
| | 78,000 | | | Sunac China Holdings Ltd. | | | 213,484 | |
| | 34,700 | | | Sunny Optical Technology Group Co. Ltd. | | | 302,962 | |
| | 20,000 | | | Tianhe Chemicals Group Ltd.*‡ (a) | | | — | |
| | 40,338 | | | Vipshop Holdings Ltd., ADR* | | | 196,043 | |
| | 105,000 | | | Weichai Power Co. Ltd., Class H | | | 103,803 | |
| | 25,840 | | | Xinjiang Goldwind Science & Technology Co. Ltd., Class H | | | 19,296 | |
| | 110,600 | | | Yangzijiang Shipbuilding Holdings Ltd. | | | 99,172 | |
| | 90,000 | | | Yanzhou Coal Mining Co. Ltd., Class H | | | 85,597 | |
| | 222,000 | | | Yuexiu Property Co. Ltd. | | | 35,228 | |
| | 2,169 | | | YY, Inc., ADR* | | | 138,599 | |
| | 78,000 | | | Zhejiang Expressway Co. Ltd., Class H | | | 65,589 | |
| | 61,500 | | | Zhongsheng Group Holdings Ltd. | | | 112,429 | |
| | 27,200 | | | Zhuzhou CRRC Times Electric Co. Ltd., Class H | | | 145,810 | |
| | 256,000 | | | Zijin Mining Group Co. Ltd., Class H | | | 95,760 | |
| | 69,800 | | | Zoomlion Heavy Industry Science and Technology Co. Ltd., Class H | | | 22,391 | |
| | | | | | | | |
| | | | | | | 45,256,634 | |
| | | | | | | | |
| | | | Colombia — 0.6% | | | | |
| | 23,742 | | | Almacenes Exito SA | | | 102,504 | |
| | 15,793 | | | Bancolombia SA | | | 145,691 | |
| | 25,771 | | | Bancolombia SA (Preference) | | | 237,738 | |
| | 335,120 | | | Ecopetrol SA | | | 391,901 | |
SEE NOTES TO FINANCIAL STATEMENTS.
| | | | | | |
| | | |
| 80 | | | | J.P. MORGAN EXCHANGE-TRADED FUNDS | | OCTOBER 31, 2018 |
| | | | | | | | |
| SHARES | | | INVESTMENTS | | VALUE($) | |
| | Common Stocks — continued | | | | |
| | | | Colombia — continued | | | | |
| | 237,240 | | | Grupo Aval Acciones y Valores SA (Preference) | | | 84,005 | |
| | 14,697 | | | Grupo de Inversiones Suramericana SA | | | 142,428 | |
| | 59,979 | | | Interconexion Electrica SA ESP | | | 225,794 | |
| | | | | | | | |
| | | | | | | 1,330,061 | |
| | | | | | | | |
| | | | Czech Republic — 0.4% | | | | |
| | 22,829 | | | CEZ A/S | | | 543,184 | |
| | 4,472 | | | Komercni banka A/S | | | 169,706 | |
| | 30,455 | | | Moneta Money Bank A/S (a) | | | 100,979 | |
| | | | | | | | |
| | | | | | | 813,869 | |
| | | | | | | | |
| | | | Egypt — 0.2% | | | | |
| | 62,621 | | | Commercial International Bank Egypt SAE | | | 280,572 | |
| | 38,769 | | | Egyptian Financial Group-Hermes Holding Co.* | | | 30,699 | |
| | 59,930 | | | ElSewedy Electric Co. | | | 50,733 | |
| | 57,268 | | | Talaat Moustafa Group | | | 29,613 | |
| | | | | | | | |
| | | | | | | 391,617 | |
| | | | | | | | |
| | | | Greece — 0.4% | | | | |
| | 88,388 | | | Alpha Bank AE* | | | 133,388 | |
| | 111,984 | | | Eurobank Ergasias SA* | | | 75,488 | |
| | 12,844 | | | JUMBO SA | | | 187,012 | |
| | 3,952 | | | Motor Oil Hellas Corinth Refineries SA | | | 93,553 | |
| | 8,115 | | | Mytilineos Holdings SA | | | 71,674 | |
| | 33,891 | | | National Bank of Greece SA* | | | 58,658 | |
| | 25,835 | | | OPAP SA | | | 242,720 | |
| | | | | | | | |
| | | | | | | 862,493 | |
| | | | | | | | |
| | | | Hong Kong — 0.7% | | | | |
| | 258,000 | | | Bosideng International Holdings Ltd. | | | 36,318 | |
| | 76,800 | | | China Gas Holdings Ltd. | | | 243,793 | |
| | 113,000 | | | Haier Electronics Group Co. Ltd.* | | | 237,298 | |
| | 33,000 | | | Kingboard Holdings Ltd. | | | 88,646 | |
| | 50,000 | | | Kingboard Laminates Holdings Ltd. | | | 38,384 | |
| | 70,000 | | | Lee & Man Paper Manufacturing Ltd. | | | 60,101 | |
| | 78,000 | | | Nine Dragons Paper Holdings Ltd. | | | 74,700 | |
| | 787,500 | | | Sino Biopharmaceutical Ltd. | | | 710,791 | |
| | | | | | | | |
| | | | | | | 1,490,031 | |
| | | | | | | | |
| | | | Hungary — 0.4% | | | | |
| | 30,243 | | | MOL Hungarian Oil & Gas plc | | | 317,106 | |
| | 13,578 | | | OTP Bank Nyrt | | | 487,796 | |
| | | | | | | | |
| | | | | | | 804,902 | |
| | | | | | | | |
| | | | India — 9.2% | | | | |
| | 12,222 | | | Adani Enterprises Ltd. | | | 28,087 | |
| | 11,340 | | | Adani Gas Ltd.*‡ | | | 9,286 | |
| | | | | | | | |
| SHARES | | | INVESTMENTS | | VALUE($) | |
| | | | | | | | |
| | | | India — continued | | | | |
| | 62,221 | | | Ashok Leyland Ltd. | | | 96,491 | |
| | 15,559 | | | Asian Paints Ltd. | | | 258,965 | |
| | 31,827 | | | Aurobindo Pharma Ltd. | | | 341,082 | |
| | 6,450 | | | Avenue Supermarts Ltd.* (a) | | | 116,769 | |
| | 6,124 | | | Bajaj Finance Ltd. | | | 197,045 | |
| | 1,349 | | | Bajaj Finserv Ltd. | | | 98,510 | |
| | 961 | | | Bajaj Holdings & Investment Ltd. | | | 36,597 | |
| | 18,686 | | | Bank of Baroda* | | | 27,977 | |
| | 46,203 | | | Bharat Petroleum Corp. Ltd. | | | 172,306 | |
| | 2,761 | | | Britannia Industries Ltd. | | | 210,486 | |
| | 58,489 | | | Coal India Ltd. | | | 210,799 | |
| | 6,373 | | | Colgate-Palmolive India Ltd. | | | 96,369 | |
| | 51,590 | | | Dabur India Ltd. | | | 268,461 | |
| | 19,549 | | | Exide Industries Ltd. | | | 70,353 | |
| | 25,059 | | | GAIL India Ltd. | | | 126,961 | |
| | 967 | | | GlaxoSmithKline Consumer Healthcare Ltd. | | | 91,476 | |
| | 37,522 | | | Godrej Consumer Products Ltd. | | | 368,600 | |
| | 17,417 | | | Grasim Industries Ltd. | | | 196,512 | |
| | 30,257 | | | HCL Technologies Ltd. | | | 432,556 | |
| | 11,413 | | | HDFC Standard Life Insurance Co. Ltd. (a) | | | 57,516 | |
| | 9,776 | | | Hero MotoCorp Ltd. | | | 364,976 | |
| | 41,558 | | | Hindalco Industries Ltd. | | | 123,908 | |
| | 28,222 | | | Hindustan Petroleum Corp. Ltd. | | | 85,884 | |
| | 70,338 | | | Hindustan Unilever Ltd. | | | 1,544,236 | |
| | 10,838 | | | Hindustan Zinc Ltd. | | | 38,483 | |
| | 60,760 | | | Housing Development Finance Corp. Ltd. | | | 1,453,595 | |
| | 20,732 | | | IDBI Bank Ltd.* | | | 16,593 | |
| | 11,527 | | | Indiabulls Housing Finance Ltd. | | | 130,014 | |
| | 101,402 | | | Indian Oil Corp. Ltd. | | | 190,257 | |
| | 211,205 | | | Infosys Ltd. | | | 1,951,758 | |
| | 285,945 | | | ITC Ltd. | | | 1,083,599 | |
| | 17,557 | | | Jindal Steel & Power Ltd.* | | | 40,708 | |
| | 54,842 | | | JSW Steel Ltd. | | | 251,786 | |
| | 17,232 | | | L&T Finance Holdings Ltd. | | | 29,782 | |
| | 1,518 | | | Larsen & Toubro Infotech Ltd. (a) | | | 36,315 | |
| | 17,853 | | | Larsen & Toubro Ltd. | | | 313,733 | |
| | 8,739 | | | LIC Housing Finance Ltd. | | | 48,557 | |
| | 10,472 | | | Mahindra & Mahindra Financial Services Ltd. | | | 57,873 | |
| | 35,337 | | | Mahindra & Mahindra Ltd. | | | 366,346 | |
| | 9,267 | | | Mangalore Refinery & Petrochemicals Ltd. | | | 10,265 | |
| | 4,052 | | | Mphasis Ltd. | | | 54,169 | |
| | 2,330 | | | Nestle India Ltd. | | | 319,541 | |
| | 295,651 | | | NHPC Ltd. | | | 97,410 | |
| | 35,159 | | | NMDC Ltd. | | | 51,940 | |
| | 246,008 | | | NTPC Ltd. | | | 531,153 | |
SEE NOTES TO FINANCIAL STATEMENTS.
| | | | | | | | |
| | | |
| OCTOBER 31, 2018 | | J.P. MORGAN EXCHANGE-TRADED FUNDS | | | | | 81 | |
JPMorgan Diversified Return Emerging Markets Equity ETF
SCHEDULE OF PORTFOLIO INVESTMENTS
AS OF OCTOBER 31, 2018 (continued)
| | | | | | | | |
| SHARES | | | INVESTMENTS | | VALUE($) | |
| | Common Stocks — continued | | | | |
| | | | India — continued | | | | |
| | 142,609 | | | Oil & Natural Gas Corp. Ltd. | | | 295,408 | |
| | 12,612 | | | Oil India Ltd. | | | 33,680 | |
| | 1,155 | | | Oracle Financial Services Software Ltd. | | | 56,662 | |
| | 470 | | | Page Industries Ltd. | | | 187,359 | |
| | 45,028 | | | Petronet LNG Ltd. | | | 137,343 | |
| | 5,643 | | | Pidilite Industries Ltd. | | | 73,184 | |
| | 10,301 | | | Piramal Enterprises Ltd. | | | 302,856 | |
| | 22,377 | | | Power Finance Corp. Ltd. | | | 28,904 | |
| | 92,236 | | | Power Grid Corp. of India Ltd. | | | 231,851 | |
| | 78,729 | | | REC Ltd. | | | 123,938 | |
| | 150,082 | | | Reliance Industries Ltd. | | | 2,154,619 | |
| | 65,950 | | | Reliance Power Ltd.* | | | 26,988 | |
| | 5,925 | | | Shriram Transport Finance Co. Ltd. | | | 93,590 | |
| | 45,900 | | | Steel Authority of India Ltd.* | | | 40,072 | |
| | 51,956 | | | Tata Consultancy Services Ltd. | | | 1,362,050 | |
| | 113,671 | | | Tata Power Co. Ltd. (The) | | | 117,647 | |
| | 13,381 | | | Tata Steel Ltd. | | | 100,337 | |
| | 24,963 | | | Tech Mahindra Ltd. | | | 251,434 | |
| | 31,003 | | | Titan Co. Ltd. | | | 354,709 | |
| | 13,850 | | | Torrent Power Ltd. | | | 48,312 | |
| | 6,500 | | | United Breweries Ltd. | | | 107,299 | |
| | 16,865 | | | UPL Ltd. | | | 153,839 | |
| | 77,451 | | | Vedanta Ltd. | | | 221,600 | |
| | 57,625 | | | Wipro Ltd. | | | 257,971 | |
| | 60,229 | | | Yes Bank Ltd. | | | 153,176 | |
| | | | | | | | |
| | | | | | | 19,620,913 | |
| | | | | | | | |
| | | | Indonesia — 3.9% | | | | |
| | 1,465,000 | | | Adaro Energy Tbk. PT | | | 159,196 | |
| | 3,493,400 | | | Astra International Tbk. PT | | | 1,817,145 | |
| | 1,060,100 | | | Bank Central Asia Tbk. PT | | | 1,650,641 | |
| | 2,016,100 | | | Bank Mandiri Persero Tbk. PT | | | 905,877 | |
| | 814,700 | | | Bank Negara Indonesia Persero Tbk. PT | | | 393,375 | |
| | 5,825,200 | | | Bank Rakyat Indonesia Persero Tbk. PT | | | 1,209,009 | |
| | 480,700 | | | Bukit Asam Tbk. PT | | | 135,003 | |
| | 830,200 | | | Bumi Serpong Damai Tbk. PT* | | | 60,273 | |
| | 1,279,600 | | | Charoen Pokphand Indonesia Tbk. PT | | | 463,490 | |
| | 80,600 | | | Gudang Garam Tbk. PT | | | 384,220 | |
| | 324,500 | | | Indah Kiat Pulp & Paper Corp. Tbk. PT | | | 271,949 | |
| | 387,700 | | | Matahari Department Store Tbk. PT | | | 123,864 | |
| | 869,700 | | | Media Nusantara Citra Tbk. PT | | | 44,747 | |
| | 1,966,400 | | | Perusahaan Gas Negara Persero Tbk. | | | 287,987 | |
| | 188,400 | | | United Tractors Tbk. PT | | | 415,955 | |
| | 228,200 | | | Vale Indonesia Tbk. PT* | | | 44,042 | |
| | | | | | | | |
| | | | | | | 8,366,773 | |
| | | | | | | | |
| | | | | | | | |
| SHARES | | | INVESTMENTS | | VALUE($) | |
| | | | | | | | |
| | | | Kuwait — 0.4% | | | | |
| | 35,000 | | | Agility Public Warehousing Co. KSC | | | 95,638 | |
| | 20,779 | | | Boubyan Bank KSCP | | | 35,983 | |
| | 3,795 | | | Humansoft Holding Co. KSC | | | 38,106 | |
| | 92,500 | | | Kuwait Finance House KSCP | | | 178,762 | |
| | 152,497 | | | Mobile Telecommunications Co. KSC | | | 223,566 | |
| | 89,664 | | | National Bank of Kuwait SAKP | | | 242,646 | |
| | | | | | | | |
| | | | | | | 814,701 | |
| | | | | | | | |
| | | | Malaysia — 6.5% | | | | |
| | 254,700 | | | AirAsia Group Bhd. | | | 160,026 | |
| | 207,700 | | | AMMB Holdings Bhd. | | | 188,780 | |
| | 715,055 | | | CIMB Group Holdings Bhd. | | | 978,401 | |
| | 556,000 | | | Dialog Group Bhd. | | | 450,338 | |
| | 281,100 | | | Gamuda Bhd. | | | 160,823 | |
| | 387,600 | | | Genting Bhd. | | | 680,214 | |
| | 283,700 | | | Hartalega Holdings Bhd. | | | 424,452 | |
| | 67,768 | | | Hong Leong Bank Bhd. | | | 335,585 | |
| | 535,300 | | | IOI Corp. Bhd. | | | 575,753 | |
| | 632,708 | | | Malayan Banking Bhd. | | | 1,436,085 | |
| | 111,200 | | | Malaysia Airports Holdings Bhd. | | | 221,031 | |
| | 354,500 | | | Maxis Bhd. | | | 443,243 | |
| | 10,400 | | | Nestle Malaysia Bhd. | | | 357,395 | |
| | 336,500 | | | Petronas Chemicals Group Bhd. | | | 752,397 | |
| | 49,600 | | | Petronas Dagangan Bhd. | | | 308,697 | |
| | 140,000 | | | Petronas Gas Bhd. | | | 612,396 | |
| | 113,560 | | | PPB Group Bhd. | | | 455,048 | |
| | 216,900 | | | Press Metal Aluminium Holdings Bhd. | | | 251,091 | |
| | 335,700 | | | Public Bank Bhd. | | | 1,974,732 | |
| | 120,700 | | | RHB Bank Bhd. | | | 151,000 | |
| | 439,800 | | | Sime Darby Bhd. | | | 231,343 | |
| | 768,300 | | | Tenaga Nasional Bhd. | | | 2,700,681 | |
| | 594,500 | | | YTL Power International Bhd. | | | 135,163 | |
| | | | | | | | |
| | | | | | | 13,984,674 | |
| | | | | | | | |
| | | | Mexico — 4.2% | | | | |
| | 229,500 | | | Alfa SAB de CV, Class A | | | 241,891 | |
| | 26,384 | | | Alpek SAB de CV* | | | 34,731 | |
| | 40,197 | | | Banco del Bajio SA (a) | | | 79,016 | |
| | 99,319 | | | Banco Santander Mexico SA Institucion de Banca Multiple Grupo Financiero Santand, Class B | | | 123,848 | |
| | 1,162,400 | | | Cemex SAB de CV* | | | 580,249 | |
| | 23,400 | | | El Puerto de Liverpool SAB de CV, Class C1 | | | 148,292 | |
| | 179,589 | | | Fibra Uno Administracion SA de CV, REIT | | | 192,999 | |
| | 255,400 | | | Fomento Economico Mexicano SAB de CV | | | 2,171,244 | |
| | 33,011 | | | GMexico Transportes SAB de CV (a) | | | 45,194 | |
| | 24,929 | | | Gruma SAB de CV, Class B | | | 260,172 | |
SEE NOTES TO FINANCIAL STATEMENTS.
| | | | | | |
| | | |
| 82 | | | | J.P. MORGAN EXCHANGE-TRADED FUNDS | | OCTOBER 31, 2018 |
| | | | | | | | |
| SHARES | | | INVESTMENTS | | VALUE($) | |
| | Common Stocks — continued | | | | |
| | | | Mexico — continued | | | | |
| | 24,380 | | | Grupo Aeroportuario del Centro Norte SAB de CV | | | 127,569 | |
| | 26,971 | | | Grupo Aeroportuario del Pacifico SAB de CV, Class B | | | 223,129 | |
| | 15,380 | | | Grupo Aeroportuario del Sureste SAB de CV, Class B | | | 255,641 | |
| | 35,800 | | | Grupo Carso SAB de CV, Series A1 | | | 105,356 | |
| | 165,222 | | | Grupo Financiero Banorte SAB de CV, Class O | | | 909,023 | |
| | 131,081 | | | Grupo Financiero Inbursa SAB de CV, Class O | | | 169,907 | |
| | 250,014 | | | Grupo Mexico SAB de CV, Series B | | | 576,873 | |
| | 8,640 | | | Industrias Penoles SAB de CV | | | 121,774 | |
| | 73,400 | | | Infraestructura Energetica Nova SAB de CV | | | 287,735 | |
| | 98,700 | | | Kimberly-Clark de Mexico SAB de CV, Class A | | | 142,269 | |
| | 36,030 | | | Megacable Holdings SAB de CV | | | 159,759 | |
| | 71,815 | | | Mexichem SAB de CV | | | 189,708 | |
| | 70,000 | | | Nemak SAB de CV (a) | | | 50,967 | |
| | 16,190 | | | Promotora y Operadora de Infraestructura SAB de CV | | | 147,337 | |
| | 13,243 | | | Regional SAB de CV | | | 64,496 | |
| | 618,696 | | | Wal-Mart de Mexico SAB de CV | | | 1,580,148 | |
| | | | | | | | |
| | | | | | | 8,989,327 | |
| | | | | | | | |
| | | | Pakistan — 0.0% (b) | | | | |
| | 30,200 | | | Oil & Gas Development Co. Ltd. | | | 36,167 | |
| | | | | | | | |
| | | | Philippines — 1.2% | | | | |
| | 525,600 | | | Alliance Global Group, Inc.* | | | 111,934 | |
| | 26,885 | | | Ayala Corp. | | | 462,832 | |
| | 750,600 | | | Ayala Land, Inc. | | | 556,949 | |
| | 581,700 | | | Bloomberry Resorts Corp. | | | 91,451 | |
| | 5,550 | | | Globe Telecom, Inc. | | | 216,793 | |
| | 10,228 | | | GT Capital Holdings, Inc. | | | 145,281 | |
| | 52,600 | | | Manila Electric Co. | | | 362,059 | |
| | 1,325,000 | | | Megaworld Corp. | | | 109,320 | |
| | 2,762,800 | | | Metro Pacific Investments Corp. | | | 248,173 | |
| | 14,060 | | | PLDT, Inc. | | | 362,847 | |
| | | | | | | | |
| | | | | | | 2,667,639 | |
| | | | | | | | |
| | | | Qatar — 1.6% | | | | |
| | 11,955 | | | Barwa Real Estate Co. | | | 122,768 | |
| | 11,658 | | | Commercial Bank PQSC (The) | | | 132,541 | |
| | 9,340 | | | Doha Bank QPSC | | | 56,358 | |
| | 15,614 | | | Industries Qatar QSC | | | 600,819 | |
| | 22,547 | | | Masraf Al Rayan QSC | | | 235,172 | |
| | 7,365 | | | Qatar Electricity & Water Co. QSC | | | 379,930 | |
| | 21,095 | | | Qatar Gas Transport Co. Ltd. | | | 100,908 | |
| | 6,962 | | | Qatar Islamic Bank SAQ | | | 292,512 | |
| | | | | | | | |
| SHARES | | | INVESTMENTS | | VALUE($) | |
| | | | | | | | |
| | | | Qatar — continued | | | | |
| | 26,697 | | | Qatar National Bank QPSC | | | 1,429,002 | |
| | | | | | | | |
| | | | | | | 3,350,010 | |
| | | | | | | | |
| | | | Russia — 6.3% | | | | |
| | 65,520 | | | Aeroflot PJSC | | | 96,740 | |
| | 175,450 | | | Alrosa PJSC | | | 266,070 | |
| | 37,486,813 | | | Federal Grid Co. Unified Energy System PJSC | | | 87,044 | |
| | 745,110 | | | Gazprom PJSC | | | 1,755,409 | |
| | 5,120,506 | | | Inter RAO UES PJSC | | | 309,806 | |
| | 32,906 | | | LUKOIL PJSC | | | 2,466,936 | |
| | 8,668 | | | Magnit PJSC | | | 472,717 | |
| | 124,391 | | | Magnitogorsk Iron & Steel Works PJSC | | | 90,438 | |
| | 3,254 | | | MMC Norilsk Nickel PJSC | | | 543,660 | |
| | 141,143 | | | Mobile TeleSystems PJSC | | | 553,582 | |
| | 85,084 | | | Moscow Exchange MICEX-RTS PJSC* | | | 113,418 | |
| | 75,905 | | | Novatek PJSC | | | 1,208,867 | |
| | 61,446 | | | Novolipetsk Steel PJSC | | | 149,642 | |
| | 3,109 | | | Polyus PJSC, GDR (a) | | | 95,822 | |
| | 82,659 | | | Rosneft Oil Co. PJSC | | | 576,425 | |
| | 122,120 | | | Rostelecom PJSC | | | 129,781 | |
| | 16,558,900 | | | RusHydro PJSC | | | 138,201 | |
| | 613,824 | | | Sberbank of Russia PJSC | | | 1,764,305 | |
| | 13,215 | | | Severstal PJSC | | | 206,483 | |
| | 406,622 | | | Sistema PJSC FC | | | 48,190 | |
| | 506,610 | | | Surgutneftegas PJSC | | | 203,745 | |
| | 546,099 | | | Surgutneftegas PJSC (Preference) | | | 315,502 | |
| | 105,996 | | | Tatneft PJSC | | | 1,253,272 | |
| | 10,459 | | | Tatneft PJSC (Preference) | | | 83,302 | |
| | 110 | | | Transneft PJSC (Preference) | | | 285,543 | |
| | 299,098,247 | | | VTB Bank PJSC | | | 166,299 | |
| | | | | | | | |
| | | | | | | 13,381,199 | |
| | | | | | | | |
| | | | Singapore — 0.0% (b) | | | | |
| | 23,200 | | | Yanlord Land Group Ltd. | | | 21,159 | |
| | | | | | | | |
| | | | South Africa — 6.2% | | | | |
| | 43,615 | | | Absa Group Ltd. | | | 440,699 | |
| | 7,820 | | | AECI Ltd. | | | 50,092 | |
| | 7,228 | | | African Rainbow Minerals Ltd. | | | 61,190 | |
| | 4,508 | | | Anglo American Platinum Ltd. | | | 146,768 | |
| | 56,142 | | | Aspen Pharmacare Holdings Ltd. | | | 593,701 | |
| | 2,403 | | | Assore Ltd. | | | 50,192 | |
| | 40,126 | | | AVI Ltd. | | | 271,995 | |
| | 16,384 | | | Barloworld Ltd. | | | 133,544 | |
| | 41,360 | | | Bid Corp. Ltd. | | | 774,417 | |
| | 25,324 | | | Bidvest Group Ltd. (The) | | | 316,035 | |
| | 3,210 | | | Capitec Bank Holdings Ltd. | | | 215,647 | |
SEE NOTES TO FINANCIAL STATEMENTS.
| | | | | | | | |
| | | |
| OCTOBER 31, 2018 | | J.P. MORGAN EXCHANGE-TRADED FUNDS | | | | | 83 | |
JPMorgan Diversified Return Emerging Markets Equity ETF
SCHEDULE OF PORTFOLIO INVESTMENTS
AS OF OCTOBER 31, 2018 (continued)
| | | | | | | | |
| SHARES | | | INVESTMENTS | | VALUE($) | |
| | Common Stocks — continued | | | | |
| | | | South Africa — continued | | | | |
| | 29,343 | | | Clicks Group Ltd. | | | 373,935 | |
| | 15,416 | | | Coronation Fund Managers Ltd. | | | 51,355 | |
| | 20,758 | | | Discovery Ltd. | | | 222,781 | |
| | 17,647 | | | Exxaro Resources Ltd. | | | 180,491 | |
| | 201,786 | | | FirstRand Ltd. | | | 881,334 | |
| | 27,499 | | | Foschini Group Ltd. (The) | | | 301,038 | |
| | 171,678 | | | Growthpoint Properties Ltd., REIT | | | 263,583 | |
| | 30,640 | | | Harmony Gold Mining Co. Ltd.* | | | 57,201 | |
| | 14,766 | | | Hyprop Investments Ltd., REIT | | | 90,353 | |
| | 12,217 | | | Imperial Holdings Ltd. | | | 135,555 | |
| | 17,497 | | | Investec Ltd. | | | 108,843 | |
| | 5,091 | | | JSE Ltd. | | | 56,592 | |
| | 143,971 | | | KAP Industrial Holdings Ltd. | | | 76,045 | |
| | 3,789 | | | Kumba Iron Ore Ltd. | | | 74,290 | |
| | 6,865 | | | Liberty Holdings Ltd. | | | 50,253 | |
| | 30,119 | | | Mr Price Group Ltd. | | | 471,579 | |
| | 51,539 | | | Nampak Ltd.* | | | 51,998 | |
| | 12,888 | | | Nedbank Group Ltd. | | | 217,874 | |
| | 40,810 | | | Pick n Pay Stores Ltd. | | | 188,469 | |
| | 41,359 | | | Rand Merchant Investment Holdings Ltd. | | | 96,103 | |
| | 305,332 | | | Redefine Properties Ltd., REIT | | | 198,484 | |
| | 41,116 | | | Remgro Ltd. | | | 530,055 | |
| | 12,866 | | | Reunert Ltd. | | | 69,552 | |
| | 42,484 | | | RMB Holdings Ltd. | | | 214,581 | |
| | 107,583 | | | Sanlam Ltd. | | | 541,715 | |
| | 39,324 | | | Sappi Ltd. | | | 220,944 | |
| | 38,024 | | | Sasol Ltd. | | | 1,242,623 | |
| | 54,944 | | | Shoprite Holdings Ltd. | | | 670,767 | |
| | 23,162 | | | SPAR Group Ltd. (The) | | | 276,060 | |
| | 79,080 | | | Standard Bank Group Ltd. | | | 876,144 | |
| | 27,817 | | | Super Group Ltd.* | | | 75,423 | |
| | 41,625 | | | Telkom SA SOC Ltd. | | | 151,376 | |
| | 13,302 | | | Tongaat Hulett Ltd. | | | 51,044 | |
| | 50,274 | | | Truworths International Ltd. | | | 275,388 | |
| | 63,451 | | | Tsogo Sun Holdings Ltd. | | | 86,881 | |
| | 87,836 | | | Vodacom Group Ltd. | | | 740,700 | |
| | 44,175 | | | Vukile Property Fund Ltd., REIT | | | 60,786 | |
| | | | | | | | |
| | | | | | | 13,286,475 | |
| | | | | | | | |
| | | | Taiwan — 15.3% | | | | |
| | 257,000 | | | Acer, Inc.* | | | 180,841 | |
| | 298,500 | | | ASE Technology Holding Co. Ltd.* | | | 602,052 | |
| | 200,000 | | | Asia Cement Corp. | | | 212,055 | |
| | 65,000 | | | Asustek Computer, Inc. | | | 481,991 | |
| | 784,000 | | | AU Optronics Corp. | | | 306,313 | |
| | 68,000 | | | Catcher Technology Co. Ltd. | | | 687,561 | |
| | | | | | | | |
| SHARES | | | INVESTMENTS | | VALUE($) | |
| | | | | | | | |
| | | | Taiwan — continued | | | | |
| | 556,000 | | | Cathay Financial Holding Co. Ltd. | | | 882,747 | |
| | 85,000 | | | Chailease Holding Co. Ltd. | | | 243,794 | |
| | 430,600 | | | Chang Hwa Commercial Bank Ltd. | | | 244,621 | |
| | 52,551 | | | Chicony Electronics Co. Ltd. | | | 105,327 | |
| | 980,000 | | | China Development Financial Holding Corp. | | | 315,539 | |
| | 180,838 | | | China Life Insurance Co. Ltd. | | | 171,878 | |
| | 1,003,000 | | | China Steel Corp. | | | 792,166 | |
| | 364,000 | | | Compal Electronics, Inc. | | | 201,065 | |
| | 1,283,395 | | | CTBC Financial Holding Co. Ltd. | | | 859,401 | |
| | 724,582 | | | E.Sun Financial Holding Co. Ltd. | | | 481,101 | |
| | 26,000 | | | Eclat Textile Co. Ltd. | | | 309,574 | |
| | 272,850 | | | Eva Airways Corp. | | | 124,991 | |
| | 532,000 | | | Far Eastern New Century Corp. | | | 535,095 | |
| | 45,000 | | | Feng TAY Enterprise Co. Ltd. | | | 270,704 | |
| | 681,501 | | | First Financial Holding Co. Ltd. | | | 431,147 | |
| | 285,000 | | | Formosa Chemicals & Fibre Corp. | | | 1,034,281 | |
| | 117,000 | | | Formosa Petrochemical Corp. | | | 461,890 | |
| | 404,000 | | | Formosa Plastics Corp. | | | 1,321,113 | |
| | 134,000 | | | Formosa Taffeta Co. Ltd. | | | 146,065 | |
| | 98,533 | | | Foxconn Technology Co. Ltd. | | | 209,232 | |
| | 515,000 | | | Fubon Financial Holding Co. Ltd. | | | 807,986 | |
| | 20,000 | | | Globalwafers Co. Ltd. | | | 159,211 | |
| | 1,061,992 | | | Hon Hai Precision Industry Co. Ltd.* | | | 2,703,352 | |
| | 598,951 | | | Hua Nan Financial Holdings Co. Ltd. | | | 338,310 | |
| | 742,000 | | | Innolux Corp. | | | 225,304 | |
| | 267,000 | | | Inventec Corp. | | | 215,790 | |
| | 14,000 | | | Largan Precision Co. Ltd. | | | 1,529,688 | |
| | 764,233 | | | Mega Financial Holding Co. Ltd. | | | 647,147 | |
| | 463,000 | | | Nan Ya Plastics Corp. | | | 1,153,337 | |
| | 72,737 | | | Nanya Technology Corp. | | | 121,453 | |
| | 51,000 | | | Novatek Microelectronics Corp. | | | 225,620 | |
| | 57,000 | | | Oriental Union Chemical Corp. | | | 51,725 | |
| | 182,000 | | | Pegatron Corp. | | | 332,559 | |
| | 346,000 | | | Pou Chen Corp. | | | 351,103 | |
| | 76,000 | | | President Chain Store Corp. | | | 859,724 | |
| | 41,000 | | | Realtek Semiconductor Corp. | | | 165,096 | |
| | 586,119 | | | Shin Kong Financial Holding Co. Ltd. | | | 193,245 | |
| | 736,580 | | | SinoPac Financial Holdings Co. Ltd. | | | 250,564 | |
| | 122,200 | | | Synnex Technology International Corp. | | | 131,870 | |
| | 692,604 | | | Taishin Financial Holding Co. Ltd. | | | 308,605 | |
| | 296,957 | | | Taiwan Business Bank | | | 98,030 | |
| | 398,000 | | | Taiwan Cement Corp. | | | 447,386 | |
| | 633,944 | | | Taiwan Cooperative Financial Holding Co. Ltd. | | | 357,056 | |
| | 60,000 | | | Taiwan Fertilizer Co. Ltd.* | | | 81,599 | |
| | 812,000 | | | Taiwan Semiconductor Manufacturing Co. Ltd. | | | 6,095,994 | |
SEE NOTES TO FINANCIAL STATEMENTS.
| | | | | | |
| | | |
| 84 | | | | J.P. MORGAN EXCHANGE-TRADED FUNDS | | OCTOBER 31, 2018 |
| | | | | | | | |
| SHARES | | | INVESTMENTS | | VALUE($) | |
| | Common Stocks — continued | | | | |
| | | | Taiwan — continued | | | | |
| | 625,000 | | | Uni-President Enterprises Corp. | | | 1,514,909 | |
| | 1,053,000 | | | United Microelectronics Corp. | | | 401,279 | |
| | 77,000 | | | Vanguard International Semiconductor Corp. | | | 142,462 | |
| | 273,000 | | | Walsin Lihwa Corp. | | | 135,780 | |
| | 43,000 | | | Walsin Technology Corp. | | | 181,705 | |
| | 245,523 | | | Wistron Corp. | | | 150,516 | |
| | 35,000 | | | Yageo Corp. | | | 358,894 | |
| | 785,665 | | | Yuanta Financial Holding Co. Ltd. | | | 382,068 | |
| | | | | | | | |
| | | | | | | 32,731,911 | |
| | | | | | | | |
| | | | Thailand — 7.0% | |
| | 217,200 | | | Advanced Info Service PCL | | | 1,271,445 | |
| | 544,400 | | | Airports of Thailand PCL | | | 1,046,571 | |
| | 34,600 | | | Bangkok Bank PCL | | | 221,595 | |
| | 19,800 | | | Bangkok Bank PCL, NVDR | | | 123,753 | |
| | 1,688,600 | | | Bangkok Dusit Medical Services PCL | | | 1,252,335 | |
| | 522,800 | | | Banpu PCL | | | 275,305 | |
| | 269,300 | | | Central Pattana PCL | | | 642,208 | |
| | 57,800 | | | Delta Electronics Thailand PCL | | | 120,335 | |
| | 51,900 | | | Electricity Generating PCL | | | 362,063 | |
| | 80,000 | | | Glow Energy PCL | | | 202,181 | |
| | 67,100 | | | Gulf Energy Development PCL | | | 158,136 | |
| | 955,600 | | | Home Product Center PCL | | | 430,341 | |
| | 211,600 | | | Indorama Ventures PCL | | | 347,126 | |
| | 240,300 | | | Intouch Holdings PCL, NVDR | | | 384,646 | |
| | 1,226,600 | | | IRPC PCL | | | 225,869 | |
| | 673,000 | | | Krung Thai Bank PCL | | | 408,567 | |
| | 717,000 | | | Land & Houses PCL, NVDR | | | 223,324 | |
| | 165,600 | | | PTT Exploration & Production PCL | | | 693,599 | |
| | 243,800 | | | PTT Global Chemical PCL | | | 566,293 | |
| | 1,716,500 | | | PTT PCL | | | 2,590,318 | |
| | 151,000 | | | Ratchaburi Electricity Generating Holding PCL | | | 223,198 | |
| | 106,700 | | | Siam Cement PCL (The) (Registered) | | | 1,325,321 | |
| | 262,300 | | | Siam Commercial Bank PCL (The) | | | 1,088,533 | |
| | 122,600 | | | Thai Oil PCL | | | 313,550 | |
| | 2,330,900 | | | TMB Bank PCL | | | 160,689 | |
| | 2,069,100 | | | True Corp. PCL | | | 369,010 | |
| | | | | | | | |
| | | | | | | 15,026,311 | |
| | | | | | | | |
| | | | Turkey — 1.0% | |
| | 124,651 | | | Akbank T.A.S. | | | 147,411 | |
| | 117,327 | | | Emlak Konut Gayrimenkul Yatirim Ortakligi A/S, REIT | | | 35,139 | |
| | 34,642 | | | Enerjisa Enerji A/S (a) | | | 29,890 | |
| | 38,899 | | | Enka Insaat ve Sanayi A/S | | | 32,507 | |
| | 95,955 | | | Eregli Demir ve Celik Fabrikalari TAS | | | 155,716 | |
| | 7,810 | | | Ford Otomotiv Sanayi A/S | | | 83,871 | |
| | | | | | | | |
| SHARES | | | INVESTMENTS | | VALUE($) | |
| | | | | | | | |
| | | | Turkey — continued | |
| | 53,234 | | | Haci Omer Sabanci Holding A/S | | | 67,903 | |
| | 10,750 | | | Iskenderun Demir ve Celik A/S | | | 13,365 | |
| | 59,273 | | | KOC Holding A/S | | | 165,579 | |
| | 3,023 | | | Koza Altin Isletmeleri A/S* | | | 24,367 | |
| | 60,110 | | | Petkim Petrokimya Holding A/S | | | 54,714 | |
| | 27,084 | | | Soda Sanayii A/S | | | 32,845 | |
| | 13,455 | | | TAV Havalimanlari Holding A/S | | | 56,018 | |
| | 13,275 | | | Tekfen Holding A/S | | | 50,539 | |
| | 14,877 | | | Tofas Turk Otomobil Fabrikasi A/S | | | 56,153 | |
| | 8,822 | | | Tupras Turkiye Petrol Rafinerileri A/S | | | 208,143 | |
| | 67,569 | | | Turk Hava Yollari AO* | | | 170,199 | |
| | 151,943 | | | Turkcell Iletisim Hizmetleri A/S | | | 309,196 | |
| | 127,790 | | | Turkiye Garanti Bankasi A/S | | | 160,749 | |
| | 37,845 | | | Turkiye Halk Bankasi A/S | | | 41,852 | |
| | 86,616 | | | Turkiye Is Bankasi A/S, Class C | | | 61,991 | |
| | 46,804 | | | Turkiye Sise ve Cam Fabrikalari A/S | | | 39,638 | |
| | 63,934 | | | Turkiye Vakiflar Bankasi TAO, Class D | | | 39,226 | |
| | 18,308 | | | Ulker Biskuvi Sanayi A/S* | | | 48,411 | |
| | 94,376 | | | Yapi ve Kredi Bankasi A/S* | | | 27,370 | |
| | | | | | | | |
| | | | | | | 2,112,792 | |
| | | | | | | | |
| | | | United Arab Emirates — 1.4% | |
| | 120,023 | | | Abu Dhabi Commercial Bank PJSC | | | 264,407 | |
| | 276,428 | | | Air Arabia PJSC | | | 76,762 | |
| | 230,439 | | | Aldar Properties PJSC | | | 108,533 | |
| | 52,925 | | | Arabtec Holding PJSC | | | 28,961 | |
| | 438,441 | | | Dana Gas PJSC | | | 137,137 | |
| | 13,027 | | | DP World Ltd. | | | 234,356 | |
| | 126,618 | | | Dubai Investments PJSC | | | 55,831 | |
| | 96,839 | | | Dubai Islamic Bank PJSC | | | 138,675 | |
| | 47,758 | | | Emaar Development PJSC | | | 64,540 | |
| | 207,648 | | | Emaar Properties PJSC | | | 288,111 | |
| | 194,357 | | | Emirates Telecommunications Group Co. PJSC | | | 921,619 | |
| | 161,469 | | | First Abu Dhabi Bank PJSC | | | 607,873 | |
| | | | | | | | |
| | | | | | | 2,926,805 | |
| | | | | | | | |
| | | | United Kingdom — 0.1% | | | | |
| | 8,172 | | | Mondi Ltd. | | | 195,585 | |
| | | | | | | | |
| | | | United States — 0.1% | | | | |
| | 119,721 | | | JBS SA | | | 329,100 | |
| | | | | | | | |
| | | | Total Common Stocks
(Cost $216,001,988) | | | 212,576,421 | |
| | | | | | | | |
SEE NOTES TO FINANCIAL STATEMENTS.
| | | | | | | | |
| | | |
| OCTOBER 31, 2018 | | J.P. MORGAN EXCHANGE-TRADED FUNDS | | | | | 85 | |
JPMorgan Diversified Return Emerging Markets Equity ETF
SCHEDULE OF PORTFOLIO INVESTMENTS
AS OF OCTOBER 31, 2018 (continued)
| | | | | | | | |
NO. OF
RIGHTS | | | INVESTMENTS | | VALUE($) | |
| | Rights — 0.0% (b) | | | | |
| | | | Chile — 0.0% (b) | | | | |
| | 169 | | | Banco de Credito e Inversiones SA, expiring 11/29/2018 (Strike Price CLP41,500.00)* | | | 413 | |
| | | | | | | | |
| | | | Russia — 0.0% (b) | | | | |
| | 502,715 | | | RusHydro PJSC, expiring 12/28/2018
(Strike Price $1.00)* | | | — | (c) |
| | | | | | | | |
| | | | Taiwan — 0.0% (b) | | | | |
| | 13,971 | | | Taishin Financial Holding Co. Ltd., expiring 11/22/2018 (Strike Price $1.00)* | | | 1,355 | |
| | | | | | | | |
| | | | Total Rights
(Cost $—) | | | 1,768 | |
| | | | | | | | |
| | |
| SHARES | | | | | | |
| | Short-Term Investments — 0.4% | | | | |
| | | | Investment Companies — 0.4% | | | | |
| | 753,648 | | | JPMorgan U.S. Government Money Market Fund Class Institutional Shares,
2.02% (d) (e)
(Cost $753,648) | | | 753,648 | |
| | | | | | | | |
| | | | Total Investments — 99.8%
(Cost 216,755,636) | | | 213,331,837 | |
| | | | Other Assets Less Liabilities — 0.2% | | | 472,415 | |
| | | | | | | | |
| | | | NET ASSETS — 100.0% | | | 213,804,252 | |
| | | | | | | | |
Percentages indicated are based on net assets.
Abbreviations
| | |
| ADR | | — American Depositary Receipt |
| CLP | | — Chilean Peso |
| GDR | | — Global Depositary Receipt |
| NVDR | | — Non-voting depository receipt |
| Preference | | — A special type of equity investment that shares in the earnings of the company, has limited voting rights, and may have a dividend preference. Preference shares may also have liquidation preference. |
| REIT | | — Real Estate Investment Trust |
| |
| (a) | | — Security exempt from registration pursuant to Regulation S under the Securities Act of 1933, as amended. Regulation S applies to securities offerings that are made outside of the United States and do not involve direct selling efforts in the United States and as such may have restrictions on resale. |
| (b) | | — Amount rounds to less than 0.1% of net assets. |
| (c) | | — Amount rounds to less than 1. |
| (d) | | — Investment in affiliate. Fund is registered under the Investment Company Act of 1940, as amended, and advised by J.P. Morgan Investment Management Inc. |
| (e) | | — The rate shown is the current yield as of October 31, 2018. |
| * | | — Non-income producing security. |
| ‡ | | — Value determined using significant unobservable inputs. |
Summary of Investments by Industry, October 31, 2018
The following table represents the portfolio investments of the Fund by industry classifications as a percentage of total investments:
| | | | |
| INDUSTRY | | PERCENTAGE | |
Banks | | | 19.1 | % |
Oil, Gas & Consumable Fuels | | | 12.3 | |
Wireless Telecommunication Services | | | 4.9 | |
Metals & Mining | | | 4.3 | |
Semiconductors & Semiconductor Equipment | | | 3.7 | |
Chemicals | | | 3.6 | |
Electric Utilities | | | 3.6 | |
Electronic Equipment, Instruments & Components | | | 2.9 | |
Insurance | | | 2.9 | |
Food & Staples Retailing | | | 2.6 | |
Food Products | | | 2.5 | |
Real Estate Management & Development | | | 2.2 | |
Automobiles | | | 2.2 | |
Pharmaceuticals | | | 2.2 | |
IT Services | | | 2.0 | |
Diversified Financial Services | | | 1.9 | |
Independent Power and Renewable Electricity Producers | | | 1.7 | |
Interactive Media & Services | | | 1.6 | |
Construction Materials | | | 1.6 | |
Industrial Conglomerates | | | 1.5 | |
Diversified Telecommunication Services | | | 1.5 | |
Textiles, Apparel & Luxury Goods | | | 1.4 | |
Transportation Infrastructure | | | 1.4 | |
Gas Utilities | | | 1.3 | |
Technology Hardware, Storage & Peripherals | | | 1.2 | |
Beverages | | | 1.1 | |
Health Care Providers & Services | | | 1.0 | |
Others (each less than 1.0%) | | | 11.8 | |
SEE NOTES TO FINANCIAL STATEMENTS.
| | | | | | |
| | | |
| 86 | | | | J.P. MORGAN EXCHANGE-TRADED FUNDS | | OCTOBER 31, 2018 |
| | | | | | | | | | | | | | | | | | | | |
| Futures contracts outstanding as of October 31, 2018: | | | | | | | |
| DESCRIPTION | | NUMBER OF
CONTRACTS | | | EXPIRATION
DATE | | | TRADING
CURRENCY | | | NOTIONAL
AMOUNT ($) | | | VALUE AND
UNREALIZED
APPRECIATION
(DEPRECIATION) ($) | |
Long Contracts | | | | | | | | | | | | | | | | | | | | |
MSCI Emerging Markets E-Mini Index | | | 21 | | | | 12/2018 | | | | USD | | | | 1,004,430 | | | | 14,197 | |
| | | | | | | | | | | | | | | | | | | | |
| | | | | | | | | | | | | | | | | | | 14,197 | |
| | | | | | | | | | | | | | | | | | | | |
Abbreviations
| | |
| MSCI | | — Morgan Stanley Capital International |
| USD | | — United States Dollar |
SEE NOTES TO FINANCIAL STATEMENTS.
| | | | | | | | |
| | | |
| OCTOBER 31, 2018 | | J.P. MORGAN EXCHANGE-TRADED FUNDS | | | | | 87 | |
JPMorgan Diversified Return Europe Currency Hedged ETF
SCHEDULE OF PORTFOLIO INVESTMENTS
AS OF OCTOBER 31, 2018
| | | | | | | | |
| SHARES | | | INVESTMENTS | | VALUE($) | |
| | Exchange Traded Funds — 100.1% | | | | |
| | | | United States — 100.1% | | | | |
| | 539,865 | | | JPMorgan Diversified Return Europe Equity ETF (a)
(Cost $28,437,436) | | | 28,919,164 | |
| | | | | | | | |
| | | | Total Investments — 100.1%
(Cost $28,437,436) | | | 28,919,164 | |
| | | | Liabilities in Excess of
Other Assets — (0.1)% | | | (24,926 | ) |
| | | | | | | | |
| | | | NET ASSETS — 100.0% | | | 28,894,238 | |
| | | | | | | | |
Percentages indicated are based on net assets.
Abbreviations
| | |
| ETF | | — Exchange Traded Fund |
| (a) | | — Investment in affiliate. Fund is registered under the Investment Company Act of 1940, as amended, and advised by J.P. Morgan Investment Management Inc. |
| | | | | | | | | | | | | | | | | | | | | | |
| Forward foreign currency exchange contracts outstanding as of October 31, 2018: | |
| CURRENCY PURCHASED | | | CURRENCY SOLD | | | COUNTERPARTY | | SETTLEMENT
DATE | | | UNREALIZED
APPRECIATION
(DEPRECIATION) ($) | |
USD | | | 2,990,225 | | | | CHF | | | | 2,912,394 | | | Goldman Sachs International | | | 11/5/2018 | | | | 97,756 | |
USD | | | 107,753 | | | | DKK | | | | 703,948 | | | Citibank, NA | | | 11/5/2018 | | | | 856 | |
USD | | | 1,089,743 | �� | | | DKK | | | | 6,976,758 | | | Merrill Lynch International | | | 11/5/2018 | | | | 30,300 | |
USD | | | 129,927 | | | | DKK | | | | 831,791 | | | Royal Bank of Canada | | | 11/5/2018 | | | | 3,616 | |
USD | | | 16,065,949 | | | | EUR | | | | 13,794,188 | | | Barclays Bank plc | | | 11/5/2018 | | | | 438,386 | |
USD | | | 65,102 | | | | EUR | | | | 55,927 | | | Merrill Lynch International | | | 11/5/2018 | | | | 1,743 | |
USD | | | 488,795 | | | | EUR | | | | 427,980 | | | Societe Generale | | | 11/5/2018 | | | | 3,932 | |
USD | | | 135,063 | | | | GBP | | | | 102,774 | | | BNP Paribas | | | 11/5/2018 | | | | 3,681 | |
USD | | | 7,110,459 | | | | GBP | | | | 5,443,994 | | | Citibank, NA | | | 11/5/2018 | | | | 151,083 | |
USD | | | 138,616 | | | | GBP | | | | 106,131 | | | Merrill Lynch International | | | 11/5/2018 | | | | 2,942 | |
USD | | | 218,256 | | | | GBP | | | | 168,817 | | | Royal Bank of Canada | | | 11/5/2018 | | | | 2,448 | |
USD | | | 739,032 | | | | NOK | | | | 6,010,950 | | | BNP Paribas | | | 11/5/2018 | | | | 25,885 | |
USD | | | 68,297 | | | | NOK | | | | 555,419 | | | Goldman Sachs International | | | 11/5/2018 | | | | 2,401 | |
USD | | | 58,776 | | | | PLN | | | | 216,442 | | | Citibank, NA | | | 11/5/2018 | | | | 2,366 | |
USD | | | 1,869,945 | | | | SEK | | | | 16,595,914 | | | BNP Paribas | | | 11/5/2018 | | | | 55,992 | |
USD | | | 156,132 | | | | SEK | | | | 1,389,300 | | | Goldman Sachs International | | | 11/5/2018 | | | | 4,280 | |
GBP | | | 433,372 | | | | USD | | | | 554,440 | | | Merrill Lynch International | | | 12/5/2018 | | | | 343 | |
USD | | | 2,654,073 | | | | CHF | | | | 2,662,065 | | | Goldman Sachs International | | | 12/5/2018 | | | | 2,690 | |
USD | | | 1,296,409 | | | | DKK | | | | 8,512,497 | | | Societe Generale | | | 12/5/2018 | | | | 306 | |
USD | | | 15,861,985 | | | | EUR | | | | 13,965,412 | | | National Australia Bank Ltd. | | | 12/5/2018 | | | | 853 | |
USD | | | 782,340 | | | | NOK | | | | 6,566,369 | | | Citibank, NA | | | 12/5/2018 | | | | 2,274 | |
USD | | | 56,571 | | | | PLN | | | | 216,442 | | | TD Bank Financial Group | | | 12/5/2018 | | | | 122 | |
USD | | | 1,959,879 | | | | SEK | | | | 17,869,321 | | | Societe Generale | | | 12/5/2018 | | | | 1,627 | |
| | | | | | | | | | | | | | | | | | | | | | |
Total unrealized appreciation | | | | | | | 835,882 | |
| | | | | | | | | | | | | | | | | | | | | | |
CHF | | | 250,330 | | | | USD | | | | 257,057 | | | Goldman Sachs International | | | 11/5/2018 | | | | (8,440 | ) |
EUR | | | 39,815 | | | | USD | | | | 46,172 | | | Barclays Bank plc | | | 11/5/2018 | | | | (1,065 | ) |
EUR | | | 127,389 | | | | USD | | | | 148,258 | | | BNP Paribas | | | 11/5/2018 | | | | (3,937 | ) |
EUR | | | 190,744 | | | | USD | | | | 222,138 | | | Merrill Lynch International | | | 11/5/2018 | | | | (6,043 | ) |
SEK | | | 115,893 | | | | USD | | | | 12,966 | | | Barclays Bank plc | | | 11/5/2018 | | | | (298 | ) |
CHF | | | 197,430 | | | | USD | | | | 196,843 | | | Goldman Sachs International | | | 12/5/2018 | | | | (205 | ) |
SEE NOTES TO FINANCIAL STATEMENTS.
| | | | | | |
| | | |
| 88 | | | | J.P. MORGAN EXCHANGE-TRADED FUNDS | | OCTOBER 31, 2018 |
| | | | | | | | | | | | | | | | | | | | | | |
| CURRENCY PURCHASED | | | CURRENCY SOLD | | | COUNTERPARTY | | SETTLEMENT
DATE | | | UNREALIZED
APPRECIATION
(DEPRECIATION) ($) | |
DKK | | | 704,312 | | | | USD | | | | 107,269 | | | Citibank, NA | | | 12/5/2018 | | | | (31 | ) |
EUR | | | 1,008,916 | | | | USD | | | | 1,145,873 | | | Goldman Sachs International | | | 12/5/2018 | | | | (3 | ) |
NOK | | | 359,927 | | | | USD | | | | 42,872 | | | Societe Generale | | | 12/5/2018 | | | | (114 | ) |
PLN | | | 23,617 | | | | USD | | | | 6,170 | | | Merrill Lynch International | | | 12/5/2018 | | | | (10 | ) |
SEK | | | 1,455,697 | | | | USD | | | | 159,687 | | | Societe Generale | | | 12/5/2018 | | | | (161 | ) |
USD | | | 70,514 | | | | CHF | | | | 70,937 | | | Goldman Sachs International | | | 12/5/2018 | | | | (138 | ) |
USD | | | 34,437 | | | | DKK | | | | 226,461 | | | Citibank, NA | | | 12/5/2018 | | | | (44 | ) |
USD | | | 422,351 | | | | EUR | | | | 372,316 | | | Royal Bank of Canada | | | 12/5/2018 | | | | (505 | ) |
USD | | | 196,635 | | | | GBP | | | | 153,785 | | | Barclays Bank plc | | | 12/5/2018 | | | | (233 | ) |
USD | | | 7,414,542 | | | | GBP | | | | 5,793,291 | | | Citibank, NA | | | 12/5/2018 | | | | (1,756 | ) |
USD | | | 20,088 | | | | NOK | | | | 169,179 | | | Barclays Bank plc | | | 12/5/2018 | | | | (10 | ) |
USD | | | 51,181 | | | | SEK | | | | 467,687 | | | Royal Bank of Canada | | | 12/5/2018 | | | | (73 | ) |
| | | | | | | | | | | | | | | | | | | | | | |
Total unrealized depreciation | | | | | | | (23,066 | ) |
| | | | | | | | | | | | | | | | | | | | | | |
Net unrealized appreciation | | | | | | | | | | | | | | 812,816 | |
| | | | | | | | | | | | | | | | | | | | | | |
Abbreviations
| | |
| CHF | | — Swiss Franc |
| DKK | | — Danish Krone |
| EUR | | — Euro |
| GBP | | — British Pound |
| NOK | | — Norwegian Krone |
| PLN | | — Polish Zloty |
| SEK | | — Swedish Krona |
| USD | | — United States Dollar |
SEE NOTES TO FINANCIAL STATEMENTS.
| | | | | | | | |
| | | |
| OCTOBER 31, 2018 | | J.P. MORGAN EXCHANGE-TRADED FUNDS | | | | | 89 | |
JPMorgan Diversified Return Europe Equity ETF
SCHEDULE OF PORTFOLIO INVESTMENTS
AS OF OCTOBER 31, 2018
| | | | | | | | |
| SHARES | | | INVESTMENTS | | VALUE($) | |
| | Common Stocks — 99.1% | |
| | | | Australia — 0.7% | |
| | 11,550 | | | BHP Billiton plc | | | 230,408 | |
| | 6,288 | | | Rio Tinto plc | | | 305,287 | |
| | | | | | | | |
| | | | | | | 535,695 | |
| | | | | | | | |
| | | | Austria — 0.9% | |
| | 1,058 | | | ANDRITZ AG | | | 54,836 | |
| | 5,797 | | | OMV AG | | | 321,922 | |
| | 1,023 | | | Verbund AG | | | 41,178 | |
| | 6,191 | | | voestalpine AG | | | 219,719 | |
| | | | | | | | |
| | | | | | | 637,655 | |
| | | | | | | | |
| | | | Belgium — 2.2% | |
| | 4,955 | | | Ageas | | | 247,924 | |
| | 1,028 | | | bpost SA | | | 15,601 | |
| | 4,006 | | | Colruyt SA | | | 232,926 | |
| | 1,159 | | | Groupe Bruxelles Lambert SA | | | 107,791 | |
| | 11,714 | | | Proximus SADP | | | 298,448 | |
| | 2,189 | | | Solvay SA | | | 249,343 | |
| | 2,742 | | | UCB SA | | | 230,273 | |
| | 5,228 | | | Umicore SA | | | 246,097 | |
| | | | | | | | |
| | | | | | | 1,628,403 | |
| | | | | | | | |
| | | | Chile — 0.2% | |
| | 17,762 | | | Antofagasta plc | | | 177,798 | |
| | | | | | | | |
| | | | Denmark — 4.2% | |
| | 5,852 | | | Ambu A/S, Class B | | | 121,981 | |
| | 1,990 | | | Carlsberg A/S, Class B | | | 219,530 | |
| | 3,205 | | | Chr Hansen Holding A/S | | | 323,519 | |
| | 2,657 | | | Coloplast A/S, Class B | | | 247,934 | |
| | 3,458 | | | DSV A/S | | | 277,417 | |
| | 4,739 | | | GN Store Nord A/S | | | 201,022 | |
| | 4,179 | | | H Lundbeck A/S | | | 194,915 | |
| | 1,643 | | | ISS A/S | | | 53,958 | |
| | 6,940 | | | Novo Nordisk A/S, Class B | | | 299,715 | |
| | 4,938 | | | Novozymes A/S, Class B | | | 243,863 | |
| | 5,031 | | | Orsted A/S (a) | | | 319,020 | |
| | 174 | | | Rockwool International A/S, Class B | | | 59,449 | |
| | 7,613 | | | Tryg A/S | | | 183,519 | |
| | 3,308 | | | Vestas Wind Systems A/S | | | 207,446 | |
| | 6,846 | | | William Demant Holding A/S* | | | 225,040 | |
| | | | | | | | |
| | | | | | | 3,178,328 | |
| | | | | | | | |
| | | | Finland — 4.5% | |
| | 6,978 | | | Elisa OYJ | | | 277,627 | |
| | 12,961 | | | Fortum OYJ | | | 272,838 | |
| | 4,254 | | | Kesko OYJ, Class B | | | 248,445 | |
| | 5,661 | | | Kone OYJ, Class B | | | 275,546 | |
| | 6,741 | | | Neste OYJ | | | 553,538 | |
| | | | | | | | |
| SHARES | | | INVESTMENTS | | VALUE($) | |
| | | | | | | | |
| | | | Finland — continued | |
| | 45,045 | | | Nokia OYJ | | | 254,441 | |
| | 22,006 | | | Nordea Bank AB | | | 191,251 | |
| | 7,824 | | | Orion OYJ, Class B | | | 269,140 | |
| | 6,458 | | | Sampo OYJ, Class A | | | 296,985 | |
| | 16,356 | | | Stora Enso OYJ, Class R | | | 245,752 | |
| | 8,552 | | | UPM-Kymmene OYJ | | | 274,936 | |
| | 9,971 | | | Wartsila OYJ Abp | | | 169,663 | |
| | | | | | | | |
| | | | | | | 3,330,162 | |
| | | | | | | | |
| | | | France — 15.0% | |
| | 4,605 | | | Accor SA | | | 210,414 | |
| | 883 | | | Aeroports de Paris | | | 184,682 | |
| | 2,388 | | | Air Liquide SA | | | 288,676 | |
| | 2,360 | | | Arkema SA | | | 247,596 | |
| | 2,684 | | | Atos SE | | | 229,555 | |
| | 4,591 | | | AXA SA | | | 114,897 | |
| | 826 | | | BioMerieux | | | 62,989 | |
| | 873 | | | BNP Paribas SA | | | 45,496 | |
| | 3,065 | | | Bouygues SA | | | 111,660 | |
| | 2,798 | | | Bureau Veritas SA | | | 63,123 | |
| | 3,517 | | | Capgemini SE | | | 429,442 | |
| | 2,065 | | | Casino Guichard Perrachon SA | | | 91,072 | |
| | 2,045 | | | Cie Generale des Etablissements Michelin SCA | | | 209,356 | |
| | 2,385 | | | Cie Plastic Omnium SA | | | 66,308 | |
| | 5,473 | | | CNP Assurances | | | 121,979 | |
| | 2,387 | | | Covivio, REIT | | | 239,514 | |
| | 3,116 | | | Danone SA | | | 220,655 | |
| | 62 | | | Dassault Aviation SA | | | 102,879 | |
| | 1,814 | | | Dassault Systemes SE | | | 227,085 | |
| | 4,970 | | | Edenred | | | 188,528 | |
| | 2,227 | | | Eiffage SA | | | 217,493 | |
| | 18,777 | | | Electricite de France SA | | | 311,098 | |
| | 16,960 | | | Engie SA | | | 225,351 | |
| | 1,891 | | | EssilorLuxottica SA | | | 258,270 | |
| | 727 | | | Eurazeo SE | | | 53,091 | |
| | 8,104 | | | Eutelsat Communications SA | | | 164,143 | |
| | 2,951 | | | Faurecia SA | | | 143,060 | |
| | 1,452 | | | Gecina SA, REIT | | | 212,954 | |
| | 363 | | | Hermes International | | | 207,237 | |
| | 2,087 | | | Imerys SA | | | 128,649 | |
| | 1,793 | | | Ingenico Group SA | | | 126,899 | |
| | 1,299 | | | Ipsen SA | | | 180,111 | |
| | 606 | | | Kering SA | | | 269,360 | |
| | 2,198 | | | Klepierre SA, REIT | | | 74,485 | |
| | 5,099 | | | Lagardere SCA | | | 139,380 | |
| | 3,086 | | | Legrand SA | | | 201,519 | |
SEE NOTES TO FINANCIAL STATEMENTS.
| | | | | | |
| | | |
| 90 | | | | J.P. MORGAN EXCHANGE-TRADED FUNDS | | OCTOBER 31, 2018 |
| | | | | | | | |
| SHARES | | | INVESTMENTS | | VALUE($) | |
| | Common Stocks — continued | |
| | | | France — continued | |
| | 1,123 | | | L’Oreal SA | | | 253,019 | |
| | 973 | | | LVMH Moet Hennessy Louis Vuitton SE | | | 295,213 | |
| | 7,957 | | | Natixis SA | | | 46,452 | |
| | 19,925 | | | Orange SA | | | 310,996 | |
| | 1,260 | | | Orpea | | | 155,122 | |
| | 1,556 | | | Pernod Ricard SA | | | 237,269 | |
| | 10,834 | | | Peugeot SA | | | 257,533 | |
| | 3,639 | | | Publicis Groupe SA | | | 210,650 | |
| | 2,454 | | | Renault SA | | | 183,250 | |
| | 1,942 | | | Rubis SCA | | | 100,196 | |
| | 2,198 | | | Safran SA | | | 284,043 | |
| | 3,995 | | | Sanofi | | | 356,995 | |
| | 405 | | | Sartorius Stedim Biotech | | | 50,184 | |
| | 3,069 | | | Schneider Electric SE | | | 221,923 | |
| | 2,639 | | | SCOR SE | | | 121,950 | |
| | 216 | | | SEB SA | | | 30,971 | |
| | 777 | | | Societe BIC SA | | | 74,385 | |
| | 2,823 | | | Sodexo SA | | | 288,163 | |
| | 1,984 | | | Thales SA | | | 253,393 | |
| | 5,638 | | | TOTAL SA | | | 330,812 | |
| | 2,320 | | | Ubisoft Entertainment SA* | | | 208,110 | |
| | 4,765 | | | Valeo SA | | | 153,692 | |
| | 11,687 | | | Veolia Environnement SA | | | 232,916 | |
| | 2,028 | | | Vinci SA | | | 180,491 | |
| | | | | | | | |
| | | | | | | 11,206,734 | |
| | | | | | | | |
| | | | Germany — 12.3% | |
| | 1,381 | | | 1&1 Drillisch AG | | | 61,601 | |
| | 736 | | | Allianz SE (Registered) | | | 153,323 | |
| | 3,430 | | | Axel Springer SE | | | 227,776 | |
| | 3,680 | | | BASF SE | | | 282,398 | |
| | 3,177 | | | Bayer AG (Registered) | | | 243,525 | |
| | 2,631 | | | Bayerische Motoren Werke AG | | | 226,557 | |
| | 734 | | | Carl Zeiss Meditec AG | | | 60,125 | |
| | 12,891 | | | CECONOMY AG | | | 65,869 | |
| | 1,018 | | | Continental AG | | | 167,752 | |
| | 3,329 | | | Covestro AG (a) | | | 214,683 | |
| | 3,613 | | | Daimler AG (Registered) | | | 214,022 | |
| | 1,171 | | | Deutsche Boerse AG | | | 147,982 | |
| | 12,243 | | | Deutsche Lufthansa AG (Registered) | | | 245,755 | |
| | 4,453 | | | Deutsche Post AG (Registered) | | | 140,605 | |
| | 17,270 | | | Deutsche Telekom AG (Registered) | | | 283,257 | |
| | 5,417 | | | Deutsche Wohnen SE | | | 247,775 | |
| | 12,705 | | | E.ON SE | | | 122,858 | |
| | 7,134 | | | Evonik Industries AG | | | 220,696 | |
| | 1,453 | | | Fielmann AG | | | 90,129 | |
| | | | | | | | |
| SHARES | | | INVESTMENTS | | VALUE($) | |
| | | | | | | | |
| | | | Germany — continued | |
| | 1,139 | | | Fraport AG Frankfurt Airport Services Worldwide | | | 87,960 | |
| | 3,256 | | | Fresenius Medical Care AG & Co. KGaA | | | 255,650 | |
| | 3,378 | | | Fresenius SE & Co. KGaA | | | 214,692 | |
| | 3,229 | | | FUCHS PETROLUB SE (Preference) | | | 149,469 | |
| | 1,101 | | | Hannover Rueck SE | | | 148,063 | |
| | 1,775 | | | Hella GmbH & Co. KGaA | | | 83,028 | |
| | 2,585 | | | Henkel AG & Co. KGaA (Preference) | | | 282,424 | |
| | 596 | | | HOCHTIEF AG | | | 88,320 | |
| | 2,781 | | | HUGO BOSS AG | | | 198,740 | |
| | 12,463 | | | Infineon Technologies AG | | | 249,720 | |
| | 5,892 | | | Innogy SE* | | | 245,721 | |
| | 2,284 | | | LEG Immobilien AG | | | 249,662 | |
| | 2,351 | | | Merck KGaA | | | 251,565 | |
| | 1,331 | | | MTU Aero Engines AG | | | 282,614 | |
| | 3,418 | | | Porsche Automobil Holding SE (Preference) | | | 217,368 | |
| | 8,507 | | | ProSiebenSat.1 Media SE | | | 196,439 | |
| | 411 | | | Puma SE | | | 211,344 | |
| | 481 | | | Rheinmetall AG | | | 41,628 | |
| | 9,734 | | | RWE AG | | | 189,367 | |
| | 2,874 | | | SAP SE | | | 307,729 | |
| | 1,352 | | | Scout24 AG (a) | | | 56,031 | |
| | 1,483 | | | Siemens AG (Registered) | | | 170,466 | |
| | 2,390 | | | Symrise AG | | | 200,203 | |
| | 2,670 | | | Talanx AG | | | 95,402 | |
| | 51,291 | | | Telefonica Deutschland Holding AG | | | 199,390 | |
| | 10,808 | | | TUI AG | | | 179,319 | |
| | 8,900 | | | Uniper SE | | | 256,839 | |
| | 4,669 | | | United Internet AG (Registered) | | | 193,207 | |
| | 907 | | | Volkswagen AG (Preference) | | | 152,379 | |
| | 5,448 | | | Vonovia SE | | | 248,955 | |
| | 956 | | | Wacker Chemie AG | | | 85,394 | |
| | | | | | | | |
| | | | | | | 9,205,776 | |
| | | | | | | | |
| | | | Ireland — 0.5% | |
| | 2,072 | | | Paddy Power Betfair plc | | | 177,686 | |
| | 6,116 | | | Smurfit Kappa Group plc | | | 198,835 | |
| | | | | | | | |
| | | | | | | 376,521 | |
| | | | | | | | |
| | | | Italy — 4.6% | |
| | 142,545 | | | A2A SpA | | | 229,691 | |
| | 15,062 | | | Assicurazioni Generali SpA | | | 243,053 | |
| | 8,753 | | | Atlantia SpA | | | 175,882 | |
| | 512 | | | DiaSorin SpA | | | 48,565 | |
| | 59,838 | | | Enel SpA | | | 293,389 | |
| | 18,003 | | | Eni SpA | | | 319,729 | |
| | 89,741 | | | Intesa Sanpaolo SpA | | | 198,783 | |
SEE NOTES TO FINANCIAL STATEMENTS.
| | | | | | | | |
| | | |
| OCTOBER 31, 2018 | | J.P. MORGAN EXCHANGE-TRADED FUNDS | | | | | 91 | |
JPMorgan Diversified Return Europe Equity ETF
SCHEDULE OF PORTFOLIO INVESTMENTS
AS OF OCTOBER 31, 2018 (continued)
| | | | | | | | |
| SHARES | | | INVESTMENTS | | VALUE($) | |
| | Common Stocks — continued | |
| | | | Italy — continued | |
| | 38,170 | | | Italgas SpA | | | 196,940 | |
| | 9,872 | | | Mediobanca Banca di Credito Finanziario SpA | | | 86,457 | |
| | 5,459 | | | Moncler SpA | | | 189,579 | |
| | 29,112 | | | Poste Italiane SpA (a) | | | 208,890 | |
| | 7,001 | | | Recordati SpA | | | 237,009 | |
| | 45,874 | | | Saipem SpA* | | | 250,872 | |
| | 61,282 | | | Snam SpA | | | 253,374 | |
| | 104,290 | | | Telecom Italia SpA* | | | 61,339 | |
| | 62,315 | | | Terna Rete Elettrica Nazionale SpA | | | 321,888 | |
| | 43,412 | | | UnipolSai Assicurazioni SpA | | | 94,779 | |
| | | | | | | | |
| | | | | | | 3,410,219 | |
| | | | | | | | |
| | | | Jersey — 0.3% | |
| | 3,151 | | | Randgold Resources Ltd. | | | 247,838 | |
| | | | | | | | |
| | | | Jordan — 0.3% | |
| | 9,589 | | | Hikma Pharmaceuticals plc | | | 232,581 | |
| | | | | | | | |
| | | | Kazakhstan — 0.1% | |
| | 16,911 | | | KAZ Minerals plc | | | 111,658 | |
| | | | | | | | |
| | | | Luxembourg — 1.3% | |
| | 7,882 | | | ArcelorMittal | | | 196,679 | |
| | 98 | | | Eurofins Scientific SE | | | 49,386 | |
| | 2,690 | | | RTL Group SA | | | 172,656 | |
| | 14,478 | | | SES SA, FDR | | | 311,162 | |
| | 13,985 | | | Tenaris SA | | | 205,868 | |
| | | | | | | | |
| | | | | | | 935,751 | |
| | | | | | | | |
| | | | Netherlands — 4.9% | |
| | 2,265 | | | Aalberts Industries NV | | | 83,030 | |
| | 3,296 | | | ABN AMRO Group NV, CVA (a) | | | 80,843 | |
| | 40,462 | | | Aegon NV | | | 248,139 | |
| | 2,951 | | | Akzo Nobel NV | | | 247,781 | |
| | 50,078 | | | Altice Europe NV* | | | 119,138 | |
| | 1,668 | | | ASML Holding NV | | | 287,303 | |
| | 5,252 | | | ASR Nederland NV | | | 238,426 | |
| | 1,332 | | | Gemalto NV* | | | 75,978 | |
| | 1,713 | | | Heineken Holding NV | | | 148,168 | |
| | 1,818 | | | Heineken NV | | | 163,561 | |
| | 13,603 | | | Koninklijke Ahold Delhaize NV | | | 311,380 | |
| | 3,138 | | | Koninklijke DSM NV | | | 273,975 | |
| | 96,296 | | | Koninklijke KPN NV | | | 254,079 | |
| | 7,455 | | | Koninklijke Philips NV | | | 278,041 | |
| | 5,892 | | | NN Group NV | | | 252,991 | |
| | 287 | | | Randstad NV | | | 14,440 | |
| | 8,704 | | | Royal Dutch Shell plc, Class B | | | 283,863 | |
| | 5,192 | | | Wolters Kluwer NV | | | 294,566 | |
| | | | | | | | |
| | | | | | | 3,655,702 | |
| | | | | | | | |
| | | | | | | | |
| SHARES | | | INVESTMENTS | | VALUE($) | |
| | | | | | | | |
| | | | Norway — 2.6% | | | | |
| | 6,922 | | | Aker BP ASA | | | 227,005 | |
| | 11,826 | | | DNB ASA | | | 213,653 | |
| | 12,875 | | | Equinor ASA | | | 333,029 | |
| | 5,912 | | | Gjensidige Forsikring ASA | | | 91,477 | |
| | 15,159 | | | Marine Harvest ASA | | | 367,004 | |
| | 39,938 | | | Norsk Hydro ASA | | | 207,110 | |
| | 27,726 | | | Orkla ASA | | | 239,256 | |
| | 16,271 | | | Telenor ASA | | | 298,335 | |
| | | | | | | | |
| | | | | | | 1,976,869 | |
| | | | | | | | |
| | | | Poland — 0.2% | | | | |
| | 5,618 | | | Polski Koncern Naftowy ORLEN SA | | | 135,098 | |
| | | | | | | | |
| | | | Portugal — 0.9% | | | | |
| | 83,877 | | | EDP – Energias de Portugal SA | | | 294,890 | |
| | 16,169 | | | Galp Energia SGPS SA | | | 281,151 | |
| | 6,522 | | | Jeronimo Martins SGPS SA | | | 80,051 | |
| | | | | | | | |
| | | | | | | 656,092 | |
| | | | | | | | |
| | | | Russia — 0.3% | | | | |
| | 28,430 | | | Evraz plc | | | 196,983 | |
| | 6,660 | | | Polymetal International plc | | | 61,769 | |
| | | | | | | | |
| | | | | | | 258,752 | |
| | | | | | | | |
| | | | South Africa — 0.4% | | | | |
| | 14,171 | | | Anglo American plc | | | 302,457 | |
| | | | | | | | |
| | | | Spain — 5.2% | | | | |
| | 1,416 | | | Acciona SA | | | 119,441 | |
| | 8,643 | | | Acerinox SA | | | 96,576 | |
| | 3,962 | | | ACS Actividades de Construccion y Servicios SA | | | 148,343 | |
| | 791 | | | Aena SME SA (a) | | | 126,387 | |
| | 3,585 | | | Amadeus IT Group SA | | | 288,681 | |
| | 11,769 | | | Enagas SA | | | 312,037 | |
| | 14,619 | | | Endesa SA | | | 305,670 | |
| | 11,148 | | | Grifols SA | | | 317,609 | |
| | 44,757 | | | Iberdrola SA | | | 316,693 | |
| | 6,008 | | | Industria de Diseno Textil SA | | | 169,334 | |
| | 14,280 | | | Mediaset Espana Comunicacion SA | | | 97,102 | |
| | 18,045 | | | Merlin Properties Socimi SA, REIT | | | 226,105 | |
| | 12,199 | | | Naturgy Energy Group SA | | | 299,823 | |
| | 15,595 | | | Red Electrica Corp. SA | | | 322,917 | |
| | 17,165 | | | Repsol SA | | | 306,719 | |
| | 12,873 | | | Siemens Gamesa Renewable Energy SA* | | | 142,568 | |
| | 39,182 | | | Telefonica SA | | | 321,412 | |
| | | | | | | | |
| | | | | | | 3,917,417 | |
| | | | | | | | |
SEE NOTES TO FINANCIAL STATEMENTS.
| | | | | | |
| | | |
| 92 | | | | J.P. MORGAN EXCHANGE-TRADED FUNDS | | OCTOBER 31, 2018 |
| | | | | | | | |
| SHARES | | | INVESTMENTS | | VALUE($) | |
| | Common Stocks — continued | |
| | | | Sweden — 6.2% | | | | |
| | 5,277 | | | Alfa Laval AB | | | 134,643 | |
| | 7,139 | | | Atlas Copco AB, Class A* | | | 176,489 | |
| | 9,000 | | | Boliden AB* | | | 205,531 | |
| | 10,059 | | | Elekta AB, Class B | | | 127,565 | |
| | 6,820 | | | Hennes & Mauritz AB, Class B | | | 120,460 | |
| | 5,540 | | | Hexagon AB, Class B | | | 271,148 | |
| | 7,639 | | | Husqvarna AB, Class B | | | 57,640 | |
| | 5,832 | | | ICA Gruppen AB | | | 206,333 | |
| | 3,872 | | | Industrivarden AB, Class C | | | 80,426 | |
| | 3,070 | | | Investor AB, Class B | | | 133,012 | |
| | 7,202 | | | Kinnevik AB, Class B | | | 199,665 | |
| | 713 | | | L E Lundbergforetagen AB, Class B | | | 21,978 | |
| | 4,153 | | | Lundin Petroleum AB | | | 126,352 | |
| | 14,692 | | | Sandvik AB | | | 232,263 | |
| | 10,331 | | | Securitas AB, Class B | | | 177,059 | |
| | 9,686 | | | Skandinaviska Enskilda Banken AB, Class A | | | 100,234 | |
| | 8,071 | | | Skanska AB, Class B | | | 126,873 | |
| | 5,993 | | | SKF AB, Class B | | | 96,080 | |
| | 18,425 | | | Svenska Cellulosa AB SCA, Class B | | | 174,180 | |
| | 14,203 | | | Swedbank AB, Class A | | | 319,490 | |
| | 5,294 | | | Swedish Match AB | | | 269,669 | |
| | 6,139 | | | Swedish Orphan Biovitrum AB* | | | 125,314 | |
| | 26,537 | | | Tele2 AB, Class B | | | 301,334 | |
| | 29,537 | | | Telefonaktiebolaget LM Ericsson, Class B | | | 257,171 | |
| | 74,094 | | | Telia Co. AB | | | 333,534 | |
| | 6,924 | | | Trelleborg AB, Class B | | | 124,926 | |
| | 7,597 | | | Volvo AB, Class B | | | 113,455 | |
| | | | | | | | |
| | | | | | | 4,612,824 | |
| | | | | | | | |
| | | | Switzerland — 9.4% | | | | |
| | 6,714 | | | ABB Ltd. (Registered) | | | 135,096 | |
| | 1,716 | | | Adecco Group AG (Registered) | | | 84,033 | |
| | 908 | | | Baloise Holding AG (Registered) | | | 129,783 | |
| | 92 | | | Banque Cantonale Vaudoise (Registered) | | | 68,762 | |
| | 67 | | | Barry Callebaut AG (Registered) | | | 130,957 | |
| | 6,381 | | | Clariant AG (Registered)* | | | 137,529 | |
| | 438 | | | EMS-Chemie Holding AG (Registered) | | | 241,325 | |
| | 316 | | | Flughafen Zurich AG (Registered) | | | 62,452 | |
| | 723 | | | Geberit AG (Registered) | | | 283,082 | |
| | 131 | | | Georg Fischer AG (Registered) | | | 121,875 | |
| | 125 | | | Givaudan SA (Registered) | | | 302,990 | |
| | 54,451 | | | Glencore plc* | | | 221,597 | |
| | 154 | | | Helvetia Holding AG (Registered) | | | 94,329 | |
| | 6,102 | | | Logitech International SA (Registered) | | | 225,922 | |
| | 1,026 | | | Lonza Group AG (Registered)* | | | 322,615 | |
| | 4,391 | | | Nestle SA (Registered) | | | 370,702 | |
| | | | | | | | |
| SHARES | | | INVESTMENTS | | VALUE($) | |
| | | | | | | | |
| | | | Switzerland — continued | | | | |
| | 4,299 | | | Novartis AG (Registered) | | | 376,474 | |
| | 7,003 | | | OC Oerlikon Corp. AG (Registered)* | | | 83,344 | |
| | 1,957 | | | Pargesa Holding SA | | | 143,663 | |
| | 227 | | | Partners Group Holding AG | | | 161,614 | |
| | 1,430 | | | Roche Holding AG | | | 348,008 | |
| | 1,096 | | | Schindler Holding AG | | | 231,108 | |
| | 98 | | | SGS SA (Registered) | | | 232,755 | |
| | 1,623 | | | Sika AG (Registered) | | | 208,105 | |
| | 1,728 | | | Sonova Holding AG (Registered) | | | 281,810 | |
| | 12,009 | | | STMicroelectronics NV | | | 182,554 | |
| | 378 | | | Straumann Holding AG (Registered) | | | 258,025 | |
| | 520 | | | Swatch Group AG (The) | | | 175,642 | |
| | 753 | | | Swiss Life Holding AG (Registered)* | | | 284,043 | |
| | 940 | | | Swiss Prime Site AG (Registered)* | | | 76,275 | |
| | 1,163 | | | Swiss Re AG | | | 104,941 | |
| | 735 | | | Swisscom AG (Registered) | | | 336,543 | |
| | 1,816 | | | Temenos AG (Registered)* | | | 249,586 | |
| | 1,607 | | | Vifor Pharma AG | | | 232,258 | |
| | 393 | | | Zurich Insurance Group AG* | | | 122,019 | |
| | | | | | | | |
| | | | | | | 7,021,816 | |
| | | | | | | | |
| | | | United Arab Emirates — 0.3% | | | | |
| | 5,308 | | | NMC Health plc | | | 239,335 | |
| | | | | | | | |
| | | | United Kingdom — 20.5% | | | | |
| | 13,504 | | | 3i Group plc | | | 151,209 | |
| | 2,359 | | | Admiral Group plc | | | 60,641 | |
| | 8,163 | | | Ashtead Group plc | | | 201,519 | |
| | 4,553 | | | AstraZeneca plc | | | 348,257 | |
| | 1,257 | | | AVEVA Group plc | | | 42,047 | |
| | 17,233 | | | BAE Systems plc | | | 115,552 | |
| | 32,342 | | | Barratt Developments plc | | | 212,130 | |
| | 5,710 | | | Bellway plc | | | 209,429 | |
| | 5,609 | | | Berkeley Group Holdings plc | | | 250,685 | |
| | 49,237 | | | BP plc | | | 355,674 | |
| | 7,142 | | | British American Tobacco plc | | | 309,608 | |
| | 22,520 | | | British Land Co. plc (The), REIT | | | 170,078 | |
| | 117,119 | | | BT Group plc | | | 358,619 | |
| | 9,054 | | | Bunzl plc | | | 267,092 | |
| | 9,144 | | | Burberry Group plc | | | 211,586 | |
| | 15,431 | | | Compass Group plc | | | 303,509 | |
| | 4,817 | | | Croda International plc | | | 296,706 | |
| | 7,975 | | | Diageo plc | | | 275,708 | |
| | 13,534 | | | easyJet plc | | | 207,338 | |
| | 10,447 | | | Experian plc | | | 240,273 | |
| | 11,346 | | | Fiat Chrysler Automobiles NV* | | | 172,668 | |
| | 16,937 | | | GlaxoSmithKline plc | | | 328,032 | |
SEE NOTES TO FINANCIAL STATEMENTS.
| | | | | | | | |
| | | |
| OCTOBER 31, 2018 | | J.P. MORGAN EXCHANGE-TRADED FUNDS | | | | | 93 | |
JPMorgan Diversified Return Europe Equity ETF
SCHEDULE OF PORTFOLIO INVESTMENTS
AS OF OCTOBER 31, 2018 (continued)
| | | | | | | | |
| SHARES | | | INVESTMENTS | | VALUE($) | |
| | Common Stocks — continued | |
| | | | United Kingdom — continued | | | | |
| | 7,178 | | | IMI plc | | | 91,006 | |
| | 2,723 | | | Imperial Brands plc | | | 92,235 | |
| | 16,980 | | | Inchcape plc | | | 117,275 | |
| | 24,086 | | | Informa plc | | | 219,799 | |
| | 45,820 | | | Inmarsat plc | | | 266,463 | |
| | 28,172 | | | International Consolidated Airlines Group SA | | | 217,192 | |
| | 3,011 | | | Intertek Group plc | | | 180,408 | |
| | 104,106 | | | ITV plc | | | 197,622 | |
| | 67,451 | | | J Sainsbury plc | | | 267,988 | |
| | 20,467 | | | John Wood Group plc | | | 186,541 | |
| | 5,315 | | | Johnson Matthey plc | | | 201,512 | |
| | 22,273 | | | Just Eat plc* | | | 172,782 | |
| | 57,838 | | | Kingfisher plc | | | 187,810 | |
| | 71,176 | | | Legal & General Group plc | | | 228,395 | |
| | 1,776 | | | Linde plc | | | 291,316 | |
| | 33,891 | | | Meggitt plc | | | 229,293 | |
| | 13,023 | | | Micro Focus International plc | | | 201,885 | |
| | 11,262 | | | Mondi plc | | | 265,207 | |
| | 31,041 | | | National Grid plc | | | 327,919 | |
| | 4,325 | | | Next plc | | | 287,322 | |
| | 20,918 | | | Pearson plc | | | 240,305 | |
| | 11,820 | | | Pennon Group plc | | | 112,604 | |
| | 6,683 | | | Persimmon plc | | | 195,592 | |
| | 3,940 | | | Reckitt Benckiser Group plc | | | 318,605 | |
| | 15,030 | | | RELX plc | | | 297,243 | |
| | 54,970 | | | Rentokil Initial plc | | | 221,674 | |
| | 24,674 | | | Rightmove plc | | | 142,432 | |
| | 36,875 | | | Royal Mail plc | | | 169,290 | |
| | 37,836 | | | Sage Group plc (The) | | | 263,070 | |
| | 1,128 | | | Schroders plc | | | 38,603 | |
| | 28,786 | | | Segro plc, REIT | | | 225,679 | |
| | 12,553 | | | Severn Trent plc | | | 298,314 | |
| | 18,448 | | | Smith & Nephew plc | | | 299,870 | |
| | 7,555 | | | Smiths Group plc | | | 134,672 | |
| | 18,516 | | | SSE plc | | | 269,879 | |
| | 27,183 | | | Tate & Lyle plc | | | 233,722 | |
| | 99,014 | | | Taylor Wimpey plc | | | 203,873 | |
| | 79,373 | | | Tesco plc | | | 216,166 | |
| | 5,925 | | | Unilever NV, CVA | | | 318,380 | |
| | 5,914 | | | Unilever plc | | | 313,262 | |
| | 32,212 | | | United Utilities Group plc | | | 298,499 | |
| | 139,471 | | | Vodafone Group plc | | | 262,280 | |
| | 5,503 | | | Whitbread plc | | | 309,420 | |
| | 58,423 | | | William Hill plc | | | 157,052 | |
| | 76,465 | | | Wm Morrison Supermarkets plc | | | 242,256 | |
| | | | | | | | |
| SHARES | | | INVESTMENTS | | VALUE($) | |
| | | | | | | | |
| | | | United Kingdom — continued | | | | |
| | 19,700 | | | WPP plc | | | 222,920 | |
| | | | | | | | |
| | | | | | | 15,323,992 | |
| | | | | | | | |
| | | | United States — 1.1% | | | | |
| | 3,909 | | | Carnival plc | | | 213,062 | |
| | 3,264 | | | Ferguson plc | | | 220,057 | |
| | 3,412 | | | QIAGEN NV* | | | 123,851 | |
| | 4,878 | | | Shire plc | | | 294,392 | |
| | | | | | | | |
| | | | | | | 851,362 | |
| | | | | | | | |
| | | | Total Common Stocks
(Cost $73,847,159) | | | 74,166,835 | |
| | | | | | | | |
| | | | Total Investments — 99.1%
(Cost 73,847,159) | | | 74,166,835 | |
| | | | Other Assets Less Liabilities — 0.9% | | | 653,953 | |
| | | | | | | | |
| | | | NET ASSETS — 100.0% | | | 74,820,788 | |
| | | | | | | | |
Percentages indicated are based on net assets.
Abbreviations
| | |
| CVA | | — Dutch Certification |
| FDR | | — Fiduciary Depositary Receipt |
| OYJ | | — Public Limited Company |
| Preference | | — A special type of equity investment that shares in the earnings of the company, has limited voting rights, and may have a dividend preference. Preference shares may also have liquidation preference. |
| REIT | | — Real Estate Investment Trust |
| SCA | | — Limited partnership with share capital |
| |
| (a) | | — Security exempt from registration pursuant to Regulation S under the Securities Act of 1933, as amended. Regulation S applies to securities offerings that are made outside of the United States and do not involve direct selling efforts in the United States and as such may have restrictions on resale. |
| * | | — Non-income producing security. |
SEE NOTES TO FINANCIAL STATEMENTS.
| | | | | | |
| | | |
| 94 | | | | J.P. MORGAN EXCHANGE-TRADED FUNDS | | OCTOBER 31, 2018 |
Summary of Investments by Industry, October 31, 2018
The following table represents the portfolio investments of the Fund by industry classifications as a percentage of total investments:
| | | | |
| INDUSTRY | | PERCENTAGE | |
Chemicals | | | 6.7 | % |
Oil, Gas & Consumable Fuels | | | 5.6 | |
Pharmaceuticals | | | 5.6 | |
Insurance | | | 5.2 | |
Diversified Telecommunication Services | | | 5.1 | |
Electric Utilities | | | 4.3 | |
Metals & Mining | | | 3.8 | |
Media | | | 3.4 | |
Health Care Equipment & Supplies | | | 3.3 | |
Machinery | | | 2.7 | |
Food & Staples Retailing | | | 2.6 | |
Hotels, Restaurants & Leisure | | | 2.5 | |
Textiles, Apparel & Luxury Goods | | | 2.4 | |
Multi-Utilities | | | 2.1 | |
Food Products | | | 2.1 | |
Automobiles | | | 1.9 | |
Professional Services | | | 1.9 | |
Software | | | 1.8 | |
Banks | | | 1.8 | |
Aerospace & Defense | | | 1.7 | |
Household Durables | | | 1.6 | |
Equity Real Estate Investment Trusts (REITs) | | | 1.5 | |
Beverages | | | 1.4 | |
Paper & Forest Products | | | 1.3 | |
IT Services | | | 1.3 | |
Electrical Equipment | | | 1.2 | |
Personal Products | | | 1.2 | |
Construction & Engineering | | | 1.2 | |
Health Care Providers & Services | | | 1.2 | |
Auto Components | | | 1.1 | |
Real Estate Management & Development | | | 1.1 | |
Diversified Financial Services | | | 1.0 | |
Biotechnology | | | 1.0 | |
Semiconductors & Semiconductor Equipment | | | 1.0 | |
Commercial Services & Supplies | | | 1.0 | |
Water Utilities | | | 1.0 | |
Others (each less than 1.0%) | | | 14.4 | |
SEE NOTES TO FINANCIAL STATEMENTS.
| | | | | | | | |
| | | |
| OCTOBER 31, 2018 | | J.P. MORGAN EXCHANGE-TRADED FUNDS | | | | | 95 | |
JPMorgan Diversified Return Europe Equity ETF
SCHEDULE OF PORTFOLIO INVESTMENTS
AS OF OCTOBER 31, 2018 (continued)
| | | | | | | | | | | | | | | | | | | | |
| Futures contracts outstanding as of October 31, 2018: | | | | | | | |
| DESCRIPTION | | NUMBER OF
CONTRACTS | | | EXPIRATION
DATE | | | TRADING
CURRENCY | | | NOTIONAL
AMOUNT ($) | | | VALUE AND
UNREALIZED
APPRECIATION
(DEPRECIATION) ($) | |
Long Contracts | | | | | |
EURO STOXX 50 Index | | | 7 | | | | 12/2018 | | | | EUR | | | | 252,287 | | | | 4,435 | |
FTSE 100 Index | | | 1 | | | | 12/2018 | | | | GBP | | | | 90,567 | | | | 2,171 | |
| | | | | | | | | | | | | | | | | | | | |
| | | | | | | | | | | | | | | | | | | 6,606 | |
| | | | | | | | | | | | | | | | | | | | |
Abbreviations
| | |
| EUR | | — Euro |
| FTSE | | — Financial Times and the London Stock Exchange |
| GBP | | — British Pound |
SEE NOTES TO FINANCIAL STATEMENTS.
| | | | | | |
| | | |
| 96 | | | | J.P. MORGAN EXCHANGE-TRADED FUNDS | | OCTOBER 31, 2018 |
JPMorgan Diversified Return Global Equity ETF
SCHEDULE OF PORTFOLIO INVESTMENTS
AS OF OCTOBER 31, 2018
| | | | | | | | |
| SHARES | | | INVESTMENTS | | VALUE($) | |
| | Common Stocks — 98.8% | |
| | | | Australia — 8.2% | | | | |
| | 25,843 | | | AGL Energy Ltd. | | | 330,027 | |
| | 148,977 | | | Alumina Ltd. | | | 270,368 | |
| | 23,717 | | | Ansell Ltd. | | | 391,006 | |
| | 39,585 | | | APA Group | | | 269,574 | |
| | 12,121 | | | Aristocrat Leisure Ltd. | | | 228,407 | |
| | 10,696 | | | ASX Ltd. | | | 449,239 | |
| | 70,321 | | | Aurizon Holdings Ltd. | | | 209,510 | |
| | 24,584 | | | BHP Billiton Ltd. | | | 567,243 | |
| | 13,385 | | | BlueScope Steel Ltd. | | | 137,205 | |
| | 81,172 | | | Boral Ltd. | | | 323,371 | |
| | 23,199 | | | Brambles Ltd. | | | 174,757 | |
| | 15,506 | | | Caltex Australia Ltd. | | | 310,257 | |
| | 8,932 | | | CIMIC Group Ltd. | | | 299,892 | |
| | 4,203 | | | Cochlear Ltd. | | | 529,633 | |
| | 22,480 | | | Computershare Ltd. | | | 315,679 | |
| | 24,162 | | | Crown Resorts Ltd. | | | 214,991 | |
| | 4,464 | | | CSL Ltd. | | | 595,931 | |
| | 93,781 | | | CSR Ltd. | | | 235,252 | |
| | 70,501 | | | Dexus, REIT | | | 509,392 | |
| | 11,058 | | | Flight Centre Travel Group Ltd. | | | 364,770 | |
| | 58,183 | | | Fortescue Metals Group Ltd. | | | 165,608 | |
| | 157,623 | | | GPT Group (The), REIT | | | 576,463 | |
| | 94,036 | | | Harvey Norman Holdings Ltd. | | | 212,871 | |
| | 228,097 | | | Healthscope Ltd. | | | 342,221 | |
| | 69,915 | | | Incitec Pivot Ltd. | | | 193,725 | |
| | 29,736 | | | Insurance Australia Group Ltd. | | | 143,822 | |
| | 7,998 | | | LendLease Group | | | 99,884 | |
| | 5,228 | | | Macquarie Group Ltd. | | | 435,974 | |
| | 373,273 | | | Mirvac Group, REIT | | | 574,182 | |
| | 21,610 | | | Oil Search Ltd. | | | 118,801 | |
| | 58,049 | | | Origin Energy Ltd.* | | | 300,825 | |
| | 137,097 | | | Qantas Airways Ltd. | | | 532,177 | |
| | 10,109 | | | Ramsay Health Care Ltd. | | | 403,502 | |
| | 8,746 | | | Rio Tinto Ltd. | | | 475,890 | |
| | 36,563 | | | Santos Ltd. | | | 171,611 | |
| | 152,497 | | | Scentre Group, REIT | | | 429,624 | |
| | 6,778 | | | SEEK Ltd. | | | 86,114 | |
| | 34,287 | | | Sonic Healthcare Ltd. | | | 548,758 | |
| | 179,161 | | | South32 Ltd. | | | 462,084 | |
| | 112,544 | | | Star Entertainment Grp Ltd. (The) | | | 379,517 | |
| | 15,660 | | | Suncorp Group Ltd. | | | 155,709 | |
| | 81,124 | | | Sydney Airport | | | 370,783 | |
| | 111,050 | | | Telstra Corp. Ltd. | | | 242,915 | |
| | 53,679 | | | Transurban Group | | | 431,759 | |
| | 35,244 | | | Treasury Wine Estates Ltd. | | | 379,351 | |
| | | | | | | | |
| SHARES | | | INVESTMENTS | | VALUE($) | |
| | | | | | | | |
| | | | Australia — continued | | | | |
| | 18,818 | | | Wesfarmers Ltd. | | | 623,209 | |
| | 16,727 | | | Woodside Petroleum Ltd. | | | 411,823 | |
| | 22,822 | | | Woolworths Group Ltd. | | | 460,626 | |
| | 25,387 | | | WorleyParsons Ltd. | | | 262,584 | |
| | | | | | | | |
| | | | | | | 16,718,916 | |
| | | | | | | | |
| | | | Austria — 0.2% | | | | |
| | 8,693 | | | OMV AG | | | 482,745 | |
| | | | | | | | |
| | | | Belgium — 0.9% | | | | |
| | 6,169 | | | Ageas | | | 308,666 | |
| | 6,433 | | | Colruyt SA | | | 374,042 | |
| | 4,147 | | | Groupe Bruxelles Lambert SA | | | 385,684 | |
| | 13,783 | | | Proximus SADP | | | 351,162 | |
| | 1,905 | | | Solvay SA | | | 216,993 | |
| | 1,128 | | | UCB SA | | | 94,729 | |
| | | | | | | | |
| | | | | | | 1,731,276 | |
| | | | | | | | |
| | | | Bermuda — 0.2% | |
| | 3,352 | | | RenaissanceRe Holdings Ltd. | | | 409,480 | |
| | | | | | | | |
| | | | Canada — 3.6% | |
| | 9,708 | | | BCE, Inc. | | | 375,725 | |
| | 1,234 | | | Canadian Imperial Bank of Commerce | | | 106,560 | |
| | 4,415 | | | Canadian Tire Corp. Ltd., Class A | | | 496,820 | |
| | 4,221 | | | CGI Group, Inc., Class A* | | | 260,676 | |
| | 13,787 | | | Fortis, Inc. | | | 455,569 | |
| | 29,566 | | | Husky Energy, Inc. | | | 417,960 | |
| | 18,025 | | | Hydro One Ltd. (a) | | | 262,204 | |
| | 5,608 | | | Imperial Oil Ltd. | | | 175,169 | |
| | 16,857 | | | Inter Pipeline Ltd. | | | 273,384 | |
| | 8,714 | | | Loblaw Cos. Ltd. | | | 435,816 | |
| | 16,469 | | | Metro, Inc. | | | 516,795 | |
| | 7,193 | | | National Bank of Canada | | | 326,525 | |
| | 13,436 | | | RioCan, REIT | | | 244,950 | |
| | 12,697 | | | Rogers Communications, Inc., Class B | | | 653,826 | |
| | 20,442 | | | Shaw Communications, Inc., Class B | | | 380,594 | |
| | 10,621 | | | Suncor Energy, Inc. | | | 356,279 | |
| | 14,818 | | | Teck Resources Ltd., Class B | | | 306,277 | |
| | 15,338 | | | TELUS Corp. | | | 525,228 | |
| | 10,483 | | | Thomson Reuters Corp. | | | 487,898 | |
| | 2,946 | | | Toronto-Dominion Bank (The) | | | 163,429 | |
| | | | | | | | |
| | | | | | | 7,221,684 | |
| | | | | | | | |
| | | | Chile — 0.0% (b) | |
| | 1,225 | | | Antofagasta plc | | | 12,262 | |
| | | | | | | | |
SEE NOTES TO FINANCIAL STATEMENTS.
| | | | | | | | |
| | | |
| OCTOBER 31, 2018 | | J.P. MORGAN EXCHANGE-TRADED FUNDS | | | | | 97 | |
JPMorgan Diversified Return Global Equity ETF
SCHEDULE OF PORTFOLIO INVESTMENTS
AS OF OCTOBER 31, 2018 (continued)
| | | | | | | | |
| SHARES | | | INVESTMENTS | | VALUE($) | |
| | Common Stocks — continued | |
| | | | China — 0.5% | |
| | 150,000 | | | China Mengniu Dairy Co. Ltd.* | | | 443,832 | |
| | 436,200 | | | Semiconductor Manufacturing International Corp.* | | | 360,318 | |
| | 556,000 | | | Xinyi Solar Holdings Ltd. | | | 173,956 | |
| | | | | | | | |
| | | | | | | 978,106 | |
| | | | | | | | |
| | | | Denmark — 0.8% | |
| | 3,755 | | | Carlsberg A/S, Class B | | | 414,239 | |
| | 5,873 | | | Chr Hansen Holding A/S | | | 592,833 | |
| | 3,231 | | | H Lundbeck A/S | | | 150,699 | |
| | 6,645 | | | Orsted A/S (a) | | | 421,365 | |
| | | | | | | | |
| | | | | | | 1,579,136 | |
| | | | | | | | |
| | | | Finland — 1.1% | |
| | 10,312 | | | Elisa OYJ | | | 410,273 | |
| | 25,489 | | | Fortum OYJ | | | 536,561 | |
| | 2,051 | | | Kesko OYJ, Class B | | | 119,784 | |
| | 7,537 | | | Neste OYJ | | | 618,902 | |
| | 3,134 | | | Sampo OYJ, Class A | | | 144,124 | |
| | 20,700 | | | Stora Enso OYJ, Class R | | | 311,022 | |
| | 5,865 | | | UPM-Kymmene OYJ | | | 188,552 | |
| | | | | | | | |
| | | | | | | 2,329,218 | |
| | | | | | | | |
| | | | France — 3.8% | | | | |
| | 4,188 | | | Alstom SA* | | | 182,901 | |
| | 4,036 | | | Arkema SA | | | 423,431 | |
| | 1,854 | | | Atos SE | | | 158,567 | |
| | 5,288 | | | Bouygues SA | | | 192,645 | |
| | 5,009 | | | Capgemini SE | | | 611,623 | |
| | 6,265 | | | Casino Guichard Perrachon SA | | | 276,304 | |
| | 4,975 | | | Danone SA | | | 352,297 | |
| | 4,038 | | | Dassault Systemes SE | | | 505,495 | |
| | 4,184 | | | Eiffage SA | | | 408,618 | |
| | 14,533 | | | Eutelsat Communications SA | | | 294,360 | |
| | 5,812 | | | Faurecia SA | | | 281,756 | |
| | 182 | | | Iliad SA | | | 21,037 | |
| | 10,860 | | | Lagardere SCA | | | 296,855 | |
| | 26,943 | | | Orange SA | | | 420,536 | |
| | 2,851 | | | Pernod Ricard SA | | | 434,739 | |
| | 7,588 | | | Peugeot SA | | | 180,373 | |
| | 4,390 | | | Sanofi | | | 392,293 | |
| | 5,435 | | | SCOR SE | | | 251,156 | |
| | 3,719 | | | Sodexo SA | | | 379,624 | |
| | 4,646 | | | Thales SA | | | 593,378 | |
| | 8,167 | | | TOTAL SA | | | 479,202 | |
| | 2,556 | | | Vinci SA | | | 227,482 | |
| | | | | | | | |
| SHARES | | | INVESTMENTS | | VALUE($) | |
| | | | | | | | |
| | | | France — continued | | | | |
| | 15,063 | | | Vivendi SA | | | 363,294 | |
| | | | | | | | |
| | | | | | | 7,727,966 | |
| | | | | | | | |
| | | | Germany — 3.0% | | | | |
| | 1,968 | | | BASF SE | | | 151,022 | |
| | 4,063 | | | Beiersdorf AG | | | 420,104 | |
| | 3,879 | | | Covestro AG (a) | | | 250,152 | |
| | 16,840 | | | Deutsche Lufthansa AG (Registered) | | | 338,031 | |
| | 27,022 | | | Deutsche Telekom AG (Registered) | | | 443,206 | |
| | 12,334 | | | Evonik Industries AG | | | 381,562 | |
| | 4,924 | | | Fraport AG Frankfurt Airport Services Worldwide | | | 380,259 | |
| | 5,575 | | | Fresenius Medical Care AG & Co. KGaA | | | 437,730 | |
| | 7,238 | | | Fresenius SE & Co. KGaA | | | 460,017 | |
| | 4,711 | | | Hannover Rueck SE | | | 633,539 | |
| | 24,023 | | | Infineon Technologies AG | | | 481,346 | |
| | 1,468 | | | Merck KGaA | | | 157,081 | |
| | 1,075 | | | Rheinmetall AG | | | 93,034 | |
| | 5,184 | | | SAP SE | | | 555,069 | |
| | 45,693 | | | Telefonica Deutschland Holding AG | | | 177,628 | |
| | 11,837 | | | TUI AG | | | 196,391 | |
| | 14,623 | | | Uniper SE | | | 421,996 | |
| | 4,388 | | | United Internet AG (Registered) | | | 181,579 | |
| | | | | | | | |
| | | | | | | 6,159,746 | |
| | | | | | | | |
| | | | Hong Kong — 4.0% | | | | |
| | 38,400 | | | ASM Pacific Technology Ltd. | | | 333,034 | |
| | 126,000 | | | Cathay Pacific Airways Ltd. | | | 160,534 | |
| | 59,760 | | | CK Hutchison Holdings Ltd. | | | 601,910 | |
| | 35,000 | | | CK Infrastructure Holdings Ltd. | | | 256,152 | |
| | 52,000 | | | CLP Holdings Ltd. | | | 582,683 | |
| | 52,000 | | | Galaxy Entertainment Group Ltd. | | | 282,315 | |
| | 24,200 | | | Hang Seng Bank Ltd. | | | 567,431 | |
| | 20,000 | | | Henderson Land Development Co. Ltd. | | | 93,282 | |
| | 276,211 | | | Hong Kong & China Gas Co. Ltd. | | | 527,602 | |
| | 548,800 | | | Hutchison Port Holdings Trust | | | 134,999 | |
| | 7,100 | | | Jardine Matheson Holdings Ltd. | | | 409,978 | |
| | 7,700 | | | Jardine Strategic Holdings Ltd. | | | 258,663 | |
| | 25,000 | | | Johnson Electric Holdings Ltd. | | | 56,076 | |
| | 68,000 | | | Link REIT, REIT | | | 604,322 | |
| | 117,000 | | | MTR Corp. Ltd. | | | 567,711 | |
| | 374,000 | | | New World Development Co. Ltd. | | | 475,790 | |
| | 457,000 | | | PCCW Ltd. | | | 250,925 | |
| | 46,500 | | | Power Assets Holdings Ltd. | | | 310,523 | |
| | 20,000 | | | Sun Hung Kai Properties Ltd. | | | 259,924 | |
| | 44,500 | | | Swire Pacific Ltd., Class A | | | 462,297 | |
SEE NOTES TO FINANCIAL STATEMENTS.
| | | | | | |
| | | |
| 98 | | | | J.P. MORGAN EXCHANGE-TRADED FUNDS | | OCTOBER 31, 2018 |
| | | | | | | | |
| SHARES | | | INVESTMENTS | | VALUE($) | |
| | Common Stocks — continued | |
| | | | Hong Kong — continued | | | | |
| | 40,000 | | | Techtronic Industries Co. Ltd. | | | 188,351 | |
| | 596,000 | | | WH Group Ltd. (a) | | | 418,550 | |
| | 370,000 | | | Xinyi Glass Holdings Ltd. | | | 367,370 | |
| | | | | | | | |
| | | | | | | 8,170,422 | |
| | | | | | | | |
| | | | Israel — 0.3% | | | | |
| | 5,596 | | | Check Point Software Technologies Ltd.* | | | 621,156 | |
| | | | | | | | |
| | | | Italy — 0.9% | | | | |
| | 4,650 | | | Buzzi Unicem SpA | | | 89,290 | |
| | 76,282 | | | Enel SpA | | | 374,016 | |
| | 70,227 | | | Italgas SpA | | | 362,340 | |
| | 88,931 | | | Parmalat SpA | | | 273,979 | |
| | 8,769 | | | Recordati SpA | | | 296,863 | |
| | 84,477 | | | Terna Rete Elettrica Nazionale SpA | | | 436,365 | |
| | | | | | | | |
| | | | | | | 1,832,853 | |
| | | | | | | | |
| | | | Japan — 22.2% | | | | |
| | 11,600 | | | Advantest Corp. | | | 214,142 | |
| | 7,000 | | | Aisin Seiki Co. Ltd. | | | 273,779 | |
| | 16,200 | | | ANA Holdings, Inc. | | | 544,735 | |
| | 16,000 | | | Aozora Bank Ltd. | | | 552,102 | |
| | 29,200 | | | Asahi Kasei Corp. | | | 350,355 | |
| | 16,300 | | | Astellas Pharma, Inc. | | | 251,838 | |
| | 26,500 | | | Brother Industries Ltd. | | | 484,992 | |
| | 18,200 | | | Canon, Inc. | | | 518,398 | |
| | 23,800 | | | Capcom Co. Ltd. | | | 496,110 | |
| | 3,200 | | | Central Japan Railway Co. | | | 614,108 | |
| | 36,300 | | | Chubu Electric Power Co., Inc. | | | 523,471 | |
| | 26,600 | | | Chugoku Electric Power Co., Inc. (The) | | | 342,148 | |
| | 9,400 | | | COMSYS Holdings Corp. | | | 261,605 | |
| | 15,400 | | | Cosmo Energy Holdings Co. Ltd. | | | 566,391 | |
| | 18,300 | | | Credit Saison Co. Ltd. | | | 290,605 | |
| | 2,100 | | | Dai Nippon Printing Co. Ltd. | | | 47,119 | |
| | 16,100 | | | Daiichi Sankyo Co. Ltd. | | | 615,394 | |
| | 2,100 | | | Daito Trust Construction Co. Ltd. | | | 276,861 | |
| | 29,200 | | | Daiwa Securities Group, Inc. | | | 167,454 | |
| | 11,000 | | | DIC Corp. | | | 324,611 | |
| | 6,300 | | | Dowa Holdings Co. Ltd. | | | 183,350 | |
| | 5,900 | | | Ebara Corp. | | | 171,845 | |
| | 14,600 | | | Electric Power Development Co. Ltd. | | | 397,490 | |
| | 5,000 | | | FamilyMart UNY Holdings Co. Ltd. | | | 579,550 | |
| | 500 | | | Fast Retailing Co. Ltd. | | | 251,753 | |
| | 8,200 | | | Fuji Electric Co. Ltd. | | | 250,309 | |
| | 15,400 | | | FUJIFILM Holdings Corp. | | | 666,056 | |
| | 50,700 | | | Fujikura Ltd. | | | 218,711 | |
| | 400 | | | Fujitsu Ltd. | | | 24,335 | |
| | | | | | | | |
| SHARES | | | INVESTMENTS | | VALUE($) | |
| | | | | | | | |
| | | | Japan — continued | | | | |
| | 11,000 | | | Hankyu Hanshin Holdings, Inc. | | | 363,337 | |
| | 3,600 | | | Hikari Tsushin, Inc. | | | 628,756 | |
| | 10,600 | | | Hitachi High-Technologies Corp. | | | 397,812 | |
| | 4,200 | | | Hokkaido Electric Power Co., Inc. | | | 24,512 | |
| | 20,700 | | | Hokuriku Electric Power Co.* | | | 192,833 | |
| | 13,800 | | | Honda Motor Co. Ltd. | | | 393,928 | |
| | 8,800 | | | Idemitsu Kosan Co. Ltd. | | | 398,664 | |
| | 34,800 | | | ITOCHU Corp. | | | 645,400 | |
| | 17,300 | | | Japan Airlines Co. Ltd. | | | 613,997 | |
| | 8,100 | | | Japan Petroleum Exploration Co. Ltd. | | | 169,315 | |
| | 20,700 | | | JXTG Holdings, Inc. | | | 139,870 | |
| | 9,900 | | | Kaneka Corp. | | | 413,779 | |
| | 30,600 | | | Kansai Electric Power Co., Inc. (The) | | | 468,348 | |
| | 14,000 | | | Kawasaki Kisen Kaisha Ltd.* | | | 186,557 | |
| | 24,100 | | | KDDI Corp. | | | 583,216 | |
| | 15,100 | | | Keisei Electric Railway Co. Ltd. | | | 465,353 | |
| | 15,300 | | | Kirin Holdings Co. Ltd. | | | 365,097 | |
| | 19,400 | | | K’s Holdings Corp. | | | 245,079 | |
| | 33,900 | | | Kuraray Co. Ltd. | | | 465,634 | |
| | 19,000 | | | Kyushu Electric Power Co., Inc. | | | 220,722 | |
| | 1,900 | | | Lawson, Inc. | | | 120,607 | |
| | 79,800 | | | Marubeni Corp. | | | 647,073 | |
| | 1,100 | | | Miraca Holdings, Inc. | | | 26,778 | |
| | 22,900 | | | Mitsubishi Corp. | | | 644,528 | |
| | 10,700 | | | Mitsubishi Gas Chemical Co., Inc. | | | 179,612 | |
| | 26,000 | | | Mitsubishi Tanabe Pharma Corp. | | | 384,044 | |
| | 27,000 | | | Mitsui & Co. Ltd. | | | 451,132 | |
| | 372,900 | | | Mizuho Financial Group, Inc. | | | 640,405 | |
| | 6,000 | | | Mochida Pharmaceutical Co. Ltd. | | | 474,355 | |
| | 8,100 | | | NH Foods Ltd. | | | 279,335 | |
| | 11,800 | | | Nihon M&A Center, Inc. | | | 282,755 | |
| | 27,600 | | | Nikon Corp. | | | 481,141 | |
| | 1,200 | | | Nippon Express Co. Ltd. | | | 75,730 | |
| | 24,400 | | | Nippon Kayaku Co. Ltd. | | | 290,389 | |
| | 20,900 | | | Nippon Paper Industries Co. Ltd. | | | 378,663 | |
| | 6,100 | | | Nippon Shokubai Co. Ltd. | | | 393,557 | |
| | 4,500 | | | Nippon Telegraph & Telephone Corp. | | | 185,574 | |
| | 29,900 | | | Nipro Corp. | | | 380,753 | |
| | 52,500 | | | Nissan Motor Co. Ltd. | | | 477,633 | |
| | 14,900 | | | Nisshin Steel Co. Ltd. | | | 194,484 | |
| | 6,100 | | | Nissin Foods Holdings Co. Ltd. | | | 393,325 | |
| | 22,700 | | | Nomura Real Estate Holdings, Inc. | | | 426,419 | |
| | 8,600 | | | Nomura Research Institute Ltd. | | | 381,268 | |
| | 33,900 | | | NTT Data Corp. | | | 435,225 | |
| | 25,200 | | | NTT DOCOMO, Inc. | | | 624,931 | |
SEE NOTES TO FINANCIAL STATEMENTS.
| | | | | | | | |
| | | |
| OCTOBER 31, 2018 | | J.P. MORGAN EXCHANGE-TRADED FUNDS | | | | | 99 | |
JPMorgan Diversified Return Global Equity ETF
SCHEDULE OF PORTFOLIO INVESTMENTS
AS OF OCTOBER 31, 2018 (continued)
| | | | | | | | |
| SHARES | | | INVESTMENTS | | VALUE($) | |
| | Common Stocks — continued | |
| | | | Japan — continued | | | | |
| | 49,400 | | | Oji Holdings Corp. | | | 350,796 | |
| | 2,500 | | | Oriental Land Co. Ltd. | | | 235,184 | |
| | 24,800 | | | Osaka Gas Co. Ltd. | | | 453,493 | |
| | 14,300 | | | Otsuka Corp. | | | 474,315 | |
| | 900 | | | Otsuka Holdings Co. Ltd. | | | 43,045 | |
| | 43,700 | | | Resona Holdings, Inc. | | | 229,864 | |
| | 600 | | | Ryohin Keikaku Co. Ltd. | | | 158,598 | |
| | 10,600 | | | Sankyo Co. Ltd. | | | 404,716 | |
| | 6,600 | | | Sawai Pharmaceutical Co. Ltd. | | | 334,568 | |
| | 13,300 | | | SBI Holdings, Inc. | | | 347,303 | |
| | 3,300 | | | SCREEN Holdings Co. Ltd. | | | 179,397 | |
| | 7,800 | | | SCSK Corp. | | | 330,529 | |
| | 10,500 | | | Sega Sammy Holdings, Inc. | | | 134,823 | |
| | 30,500 | | | Sekisui Chemical Co. Ltd. | | | 479,640 | |
| | 36,600 | | | Sekisui House Ltd. | | | 537,179 | |
| | 4,100 | | | Shimamura Co. Ltd. | | | 344,870 | |
| | 19,200 | | | Shimizu Corp. | | | 155,853 | |
| | 400 | | | Showa Denko KK | | | 17,417 | |
| | 37,000 | | | Showa Shell Sekiyu KK | | | 706,188 | |
| | 14,400 | | | Skylark Holdings Co. Ltd. | | | 224,190 | |
| | 183,100 | | | Sojitz Corp. | | | 615,758 | |
| | 5,500 | | | Sony Corp. | | | 297,642 | |
| | 13,200 | | | Square Enix Holdings Co. Ltd. | | | 473,107 | |
| | 56,600 | | | Sumitomo Chemical Co. Ltd. | | | 283,531 | |
| | 11,000 | | | Sumitomo Corp. | | | 166,833 | |
| | 30,500 | | | Sumitomo Dainippon Pharma Co. Ltd. | | | 637,259 | |
| | 11,100 | | | Sumitomo Mitsui Financial Group, Inc. | | | 432,180 | |
| | 9,900 | | | Sumitomo Mitsui Trust Holdings, Inc. | | | 393,362 | |
| | 9,600 | | | Sumitomo Osaka Cement Co. Ltd. | | | 356,668 | |
| | 10,100 | | | Suzuken Co. Ltd. | | | 511,216 | |
| | 7,300 | | | Taisei Corp. | | | 312,210 | |
| | 3,500 | | | Taisho Pharmaceutical Holdings Co. Ltd. | | | 373,193 | |
| | 13,900 | | | Takashimaya Co. Ltd. | | | 218,754 | |
| | 9,300 | | | Takeda Pharmaceutical Co. Ltd. | | | 385,574 | |
| | 22,200 | | | Teijin Ltd. | | | 384,875 | |
| | 11,000 | | | Terumo Corp. | | | 593,801 | |
| | 29,700 | | | Tohoku Electric Power Co., Inc. | | | 375,248 | |
| | 22,600 | | | Tokyo Broadcasting System Holdings, Inc. | | | 418,476 | |
| | 93,500 | | | Tokyo Electric Power Co. Holdings, Inc.* | | | 478,550 | |
| | 9,100 | | | Tokyo Gas Co. Ltd. | | | 223,795 | |
| | 15,300 | | | Tokyo Tatemono Co. Ltd. | | | 164,554 | |
| | 11,500 | | | Tokyu Corp. | | | 189,985 | |
| | 40,600 | | | Tokyu Fudosan Holdings Corp. | | | 228,754 | |
| | 23,700 | | | Toppan Printing Co. Ltd. | | | 335,057 | |
| | 13,900 | | | Toyo Suisan Kaisha Ltd. | | | 477,807 | |
| | | | | | | | |
| SHARES | | | INVESTMENTS | | VALUE($) | |
| | | | | | | | |
| | | | Japan — continued | | | | |
| | 8,900 | | | Toyota Industries Corp. | | | 437,187 | |
| | 10,300 | | | Toyota Motor Corp. | | | 603,384 | |
| | 13,800 | | | Tsumura & Co. | | | 429,222 | |
| | 21,100 | | | Ube Industries Ltd. | | | 459,614 | |
| | 83,900 | | | Yamada Denki Co. Ltd. | | | 395,618 | |
| | 17,800 | | | Yokohama Rubber Co. Ltd. (The) | | | 344,811 | |
| | | | | | | | |
| | | | | | | 45,231,535 | |
| | | | | | | | |
| | | | Macau — 0.4% | | | | |
| | 95,964 | | | Sands China Ltd. | | | 379,490 | |
| | 134,000 | | | SJM Holdings Ltd. | | | 108,586 | |
| | 136,862 | | | Wynn Macau Ltd. | | | 285,104 | |
| | | | | | | | |
| | | | | | | 773,180 | |
| | | | | | | | |
| | | | Netherlands — 1.8% | | | | |
| | 51,476 | | | Aegon NV | | | 315,684 | |
| | 457 | | | Boskalis Westminster | | | 13,140 | |
| | 3,560 | | | Gemalto NV* | | | 203,063 | |
| | 3,815 | | | Heineken Holding NV | | | 329,983 | |
| | 11,849 | | | Koninklijke Ahold Delhaize NV | | | 271,230 | |
| | 4,458 | | | Koninklijke DSM NV | | | 389,223 | |
| | 161,669 | | | Koninklijke KPN NV | | | 426,568 | |
| | 11,562 | | | Koninklijke Philips NV | | | 431,215 | |
| | 10,234 | | | NN Group NV | | | 439,429 | |
| | 6,656 | | | Royal Dutch Shell plc, Class A | | | 212,047 | |
| | 10,326 | | | Wolters Kluwer NV | | | 585,841 | |
| | | | | | | | |
| | | | | | | 3,617,423 | |
| | | | | | | | |
| | | | New Zealand — 0.3% | | | | |
| | 54,528 | | | Contact Energy Ltd. | | | 199,372 | |
| | 193,894 | | | Spark New Zealand Ltd. | | | 500,754 | |
| | | | | | | | |
| | | | | | | 700,126 | |
| | | | | | | | |
| | | | Norway — 1.0% | | | | |
| | 8,927 | | | Equinor ASA | | | 230,909 | |
| | 30,283 | | | Marine Harvest ASA | | | 733,160 | |
| | 42,147 | | | Orkla ASA | | | 363,700 | |
| | 24,711 | | | Telenor ASA | | | 453,085 | |
| | 7,811 | | | Yara International ASA | | | 335,430 | |
| | | | | | | | |
| | | | | | | 2,116,284 | |
| | | | | | | | |
| | | | Portugal — 0.4% | | | | |
| | 132,420 | | | EDP – Energias de Portugal SA | | | 465,555 | |
| | 23,920 | | | Galp Energia SGPS SA | | | 415,927 | |
| | | | | | | | |
| | | | | | | 881,482 | |
| | | | | | | | |
SEE NOTES TO FINANCIAL STATEMENTS.
| | | | | | |
| | | |
| 100 | | | | J.P. MORGAN EXCHANGE-TRADED FUNDS | | OCTOBER 31, 2018 |
| | | | | | | | |
| SHARES | | | INVESTMENTS | | VALUE($) | |
| | Common Stocks — continued | |
| | | | Singapore — 2.2% | | | | |
| | 285,700 | | | CapitaLand Mall Trust, REIT | | | 435,153 | |
| | 264,100 | | | ComfortDelGro Corp. Ltd. | | | 430,024 | |
| | 25,900 | | | DBS Group Holdings Ltd. | | | 439,456 | |
| | 140,400 | | | Genting Singapore Ltd. | | | 89,346 | |
| | 607,500 | | | Golden Agri-Resources Ltd. | | | 112,005 | |
| | 114,300 | | | Keppel Corp. Ltd. | | | 512,116 | |
| | 151,200 | | | Sembcorp Industries Ltd. | | | 308,687 | |
| | 49,900 | | | Singapore Airlines Ltd. | | | 342,069 | |
| | 154,300 | | | Singapore Press Holdings Ltd. | | | 295,709 | |
| | 127,500 | | | Singapore Telecommunications Ltd. | | | 291,235 | |
| | 12,700 | | | United Overseas Bank Ltd. | | | 224,542 | |
| | 33,700 | | | Venture Corp. Ltd. | | | 373,066 | |
| | 223,500 | | | Wilmar International Ltd. | | | 510,544 | |
| | | | | | | | |
| | | | | | | 4,363,952 | |
| | | | | | | | |
| | | | South Africa — 0.2% | | | | |
| | 14,256 | | | Anglo American plc | | | 304,271 | |
| | | | | | | | |
| | | | South Korea — 8.4% | | | | |
| | 5,837 | | | Celltrion Healthcare Co. Ltd.* | | | 327,293 | |
| | 1,252 | | | CJ CheilJedang Corp. | | | 357,133 | |
| | 25,047 | | | Doosan Infracore Co. Ltd.* | | | 170,288 | |
| | 1,840 | | | E-MART, Inc. | | | 331,012 | |
| | 8,655 | | | GS Engineering & Construction Corp. | | | 319,148 | |
| | 7,427 | | | GS Holdings Corp. | | | 316,971 | |
| | 9,817 | | | Hankook Tire Co. Ltd. | | | 356,653 | |
| | 244 | | | Hanmi Pharm Co. Ltd. | | | 83,733 | |
| | 3,435 | | | Hanmi Science Co. Ltd. | | | 201,657 | |
| | 15,597 | | | Hanon Systems | | | 150,434 | |
| | 9,443 | | | Hanwha Aerospace Co. Ltd.* | | | 236,778 | |
| | 7,514 | | | Hanwha Chemical Corp. | | | 107,004 | |
| | 3,564 | | | Hotel Shilla Co. Ltd. | | | 224,616 | |
| | 131 | | | Hyosung Advanced Materials Corp.* | | | 12,083 | |
| | 342 | | | Hyosung Chemical Corp.* | | | 39,437 | |
| | 290 | | | Hyosung Corp. | | | 13,105 | |
| | 624 | | | Hyosung Heavy Industries Corp.* | | | 23,243 | |
| | 185 | | | Hyosung TNC Co. Ltd.* | | | 28,482 | |
| | 1,467 | | | Hyundai Construction Equipment Co. Ltd.* | | | 96,711 | |
| | 9,467 | | | Hyundai Engineering & Construction Co. Ltd. | | | 382,582 | |
| | 151 | | | Hyundai Heavy Industries Holdings Co. Ltd.* | | | 47,451 | |
| | 1,652 | | | Hyundai Mobis Co. Ltd. | | | 275,953 | |
| | 4,137 | | | Hyundai Motor Co. | | | 387,484 | |
| | 10,058 | | | Hyundai Steel Co. | | | 369,091 | |
| | 28,300 | | | Industrial Bank of Korea | | | 369,556 | |
| | 5,896 | | | Kakao Corp. | | | 476,598 | |
| | 15,199 | | | Kia Motors Corp. | | | 379,910 | |
| | | | | | | | |
| SHARES | | | INVESTMENTS | | VALUE($) | |
| | | | | | | | |
| | | | South Korea — continued | | | | |
| | 10,987 | | | Korea Electric Power Corp. | | | 262,441 | |
| | 5,572 | | | Korea Gas Corp.* | | | 255,611 | |
| | 541 | | | Korea Zinc Co. Ltd. | | | 180,434 | |
| | 10,362 | | | Korean Air Lines Co. Ltd. | | | 250,843 | |
| | 7,230 | | | KT&G Corp. | | | 644,708 | |
| | 5,674 | | | LG Corp. | | | 330,581 | |
| | 8,308 | | | LG Display Co. Ltd. | | | 121,226 | |
| | 6,451 | | | LG Electronics, Inc. | | | 360,642 | |
| | 269 | | | LG Household & Health Care Ltd. | | | 247,374 | |
| | 40,942 | | | LG Uplus Corp. | | | 581,878 | |
| | 1,688 | | | Lotte Chemical Corp. | | | 390,000 | |
| | 3,991 | | | LOTTE Fine Chemical Co. Ltd. | | | 143,516 | |
| | 1,085 | | | NCSoft Corp. | | | 410,084 | |
| | 1,382 | | | Netmarble Corp. (a) | | | 136,500 | |
| | 2,186 | | | POSCO | | | 500,360 | |
| | 1,161 | | | Samsung Biologics Co. Ltd.* (a) | | | 397,386 | |
| | 1,110 | | | Samsung C&T Corp. | | | 106,236 | |
| | 3,463 | | | Samsung Electro-Mechanics Co. Ltd. | | | 361,483 | |
| | 20,003 | | | Samsung Electronics Co. Ltd. | | | 748,828 | |
| | 16,825 | | | Samsung Engineering Co. Ltd.* | | | 271,586 | |
| | 2,082 | | | Samsung SDS Co. Ltd. | | | 354,155 | |
| | 1,508 | | | Shinsegae, Inc. | | | 344,309 | |
| | 2,563 | | | SK Holdings Co. Ltd. | | | 590,146 | |
| | 8,797 | | | SK Hynix, Inc. | | | 529,803 | |
| | 3,058 | | | SK Innovation Co. Ltd. | | | 573,895 | |
| | 2,366 | | | SK Telecom Co. Ltd. | | | 555,917 | |
| | 6,871 | | | SKC Co. Ltd. | | | 200,939 | |
| | 5,158 | | | S-Oil Corp. | | | 562,853 | |
| | 42,803 | | | Woori Bank | | | 593,078 | |
| | | | | | | | |
| | | | | | | 17,091,218 | |
| | | | | | | | |
| | | | Spain — 1.9% | | | | |
| | 2,239 | | | Acciona SA | | | 188,862 | |
| | 4,435 | | | Acerinox SA | | | 49,556 | |
| | 2,678 | | | ACS Actividades de Construccion y Servicios SA | | | 100,268 | |
| | 2,736 | | | Aena SME SA (a) | | | 437,163 | |
| | 2,347 | | | Cellnex Telecom SA (a) | | | 58,385 | |
| | 17,020 | | | Enagas SA | | | 451,259 | |
| | 15,640 | | | Grifols SA | | | 445,587 | |
| | 63,181 | | | Iberdrola SA | | | 447,058 | |
| | 20,099 | | | Naturgy Energy Group SA | | | 493,986 | |
| | 15,794 | | | Red Electrica Corp. SA | | | 327,038 | |
| | 28,091 | | | Repsol SA | | | 501,954 | |
| | 50,266 | | | Telefonica SA | | | 412,335 | |
| | | | | | | | |
| | | | | | | 3,913,451 | |
| | | | | | | | |
SEE NOTES TO FINANCIAL STATEMENTS.
| | | | | | | | |
| | | |
| OCTOBER 31, 2018 | | J.P. MORGAN EXCHANGE-TRADED FUNDS | | | | | 101 | |
JPMorgan Diversified Return Global Equity ETF
SCHEDULE OF PORTFOLIO INVESTMENTS
AS OF OCTOBER 31, 2018 (continued)
| | | | | | | | |
| SHARES | | | INVESTMENTS | | VALUE($) | |
| | Common Stocks — continued | |
| | | | Sweden — 2.5% | | | | |
| | 4,257 | | | Autoliv, Inc. (c) | | | 354,778 | |
| | 14,360 | | | Boliden AB* | | | 327,936 | |
| | 10,298 | | | Hexagon AB, Class B | | | 504,022 | |
| | 9,842 | | | Investor AB, Class B | | | 426,418 | |
| | 3,485 | | | Kinnevik AB, Class B | | | 96,617 | |
| | 4,428 | | | Lundin Petroleum AB | | | 134,718 | |
| | 32,506 | | | Securitas AB, Class B | | | 557,107 | |
| | 22,554 | | | Skanska AB, Class B | | | 354,540 | |
| | 8,093 | | | Svenska Cellulosa AB SCA, Class B | | | 76,507 | |
| | 12,258 | | | Swedish Match AB | | | 624,406 | |
| | 47,753 | | | Tele2 AB, Class B | | | 542,247 | |
| | 127,677 | | | Telia Co. AB | | | 574,737 | |
| | 19,018 | | | Trelleborg AB, Class B | | | 343,130 | |
| | 2,611 | | | Veoneer, Inc.* | | | 87,677 | |
| | | | | | | | |
| | | | | | | 5,004,840 | |
| | | | | | | | |
| | | | Switzerland — 2.0% | | | | |
| | 3,088 | | | Baloise Holding AG (Registered) | | | 441,377 | |
| | 162 | | | Barry Callebaut AG (Registered) | | | 316,642 | |
| | 17,073 | | | Clariant AG (Registered)* | | | 367,972 | |
| | 795 | | | Kuehne + Nagel International AG (Registered) | | | 110,493 | |
| | 6,216 | | | Logitech International SA (Registered) | | | 230,143 | |
| | 274 | | | Lonza Group AG (Registered)* | | | 86,156 | |
| | 4,608 | | | Novartis AG (Registered) | | | 403,534 | |
| | 3,032 | | | Sonova Holding AG (Registered) | | | 494,472 | |
| | 237 | | | Straumann Holding AG (Registered) | | | 161,778 | |
| | 1,285 | | | Swiss Life Holding AG (Registered)* | | | 484,721 | |
| | 2,679 | | | Swiss Prime Site AG (Registered)* | | | 217,383 | |
| | 982 | | | Swisscom AG (Registered) | | | 449,640 | |
| | 2,498 | | | Vifor Pharma AG | | | 361,033 | |
| | | | | | | | |
| | | | | | | 4,125,344 | |
| | | | | | | | |
| | | | United Kingdom — 3.0% | | | | |
| | 3,960 | | | Bellway plc | | | 145,243 | |
| | 70,458 | | | BP plc | | | 508,969 | |
| | 3,079 | | | Bunzl plc | | | 90,830 | |
| | 11,649 | | | Coca-Cola European Partners plc | | | 529,913 | |
| | 5,115 | | | easyJet plc | | | 78,361 | |
| | 14,847 | | | Hammerson plc, REIT | | | 82,891 | |
| | 32,843 | | | Inmarsat plc | | | 190,996 | |
| | 35,045 | | | International Consolidated Airlines Group SA | | | 270,179 | |
| | 53,504 | | | Kingfisher plc | | | 173,736 | |
| | 10,452 | | | Land Securities Group plc, REIT | | | 113,698 | |
| | 9,927 | | | Mondi plc | | | 233,769 | |
| | | | | | | | |
| SHARES | | | INVESTMENTS | | VALUE($) | |
| | | | | | | | |
| | | | United Kingdom — continued | | | | |
| | 33,341 | | | Pearson plc | | | 383,020 | |
| | 3,857 | | | Persimmon plc | | | 112,883 | |
| | 63,049 | | | Rentokil Initial plc | | | 254,254 | |
| | 65,722 | | | Royal Mail plc | | | 301,725 | |
| | 47,305 | | | Sage Group plc (The) | | | 328,907 | |
| | 29,730 | | | Segro plc, REIT | | | 233,080 | |
| | 26,140 | | | Smith & Nephew plc | | | 424,902 | |
| | 31,263 | | | Tate & Lyle plc | | | 268,802 | |
| | 111,931 | | | Taylor Wimpey plc | | | 230,469 | |
| | 33,333 | | | United Utilities Group plc | | | 308,887 | |
| | 204,539 | | | Vodafone Group plc | | | 384,643 | |
| | 20,754 | | | William Hill plc | | | 55,791 | |
| | 152,144 | | | Wm Morrison Supermarkets plc | | | 482,021 | |
| | | | | | | | |
| | | | | | | 6,187,969 | |
| | | | | | | | |
| | | | United States — 25.0% | | | | |
| | 2,060 | | | AbbVie, Inc. | | | 160,371 | |
| | 22,826 | | | AGNC Investment Corp., REIT | | | 407,216 | |
| | 2,850 | | | Air Products & Chemicals, Inc. | | | 439,898 | |
| | 4,833 | | | Alaska Air Group, Inc. | | | 296,843 | |
| | 12,868 | | | Alcoa Corp.* | | | 450,251 | |
| | 881 | | | Alleghany Corp. | | | 529,199 | |
| | 9,176 | | | Alliant Energy Corp. | | | 394,384 | |
| | 5,525 | | | Allstate Corp. (The) | | | 528,853 | |
| | 9,651 | | | Amdocs Ltd. | | | 610,619 | |
| | 9,076 | | | Ameren Corp. | | | 586,128 | |
| | 6,044 | | | American Electric Power Co., Inc. | | | 443,388 | |
| | 294 | | | American Water Works Co., Inc. | | | 26,028 | |
| | 39,431 | | | Annaly Capital Management, Inc., REIT | | | 389,184 | |
| | 3,454 | | | ANSYS, Inc.* | | | 516,546 | |
| | 2,477 | | | Anthem, Inc. | | | 682,587 | |
| | 3,462 | | | Aramark | | | 124,355 | |
| | 6,364 | | | Ashland Global Holdings, Inc. | | | 470,809 | |
| | 2,080 | | | Assurant, Inc. | | | 202,197 | |
| | 20,377 | | | AT&T, Inc. | | | 625,166 | |
| | 8,148 | | | AutoNation, Inc.* | | | 329,831 | |
| | 6,813 | | | Avangrid, Inc. | | | 320,279 | |
| | 5,722 | | | Avery Dennison Corp. | | | 519,100 | |
| | 8,872 | | | Avnet, Inc. | | | 355,501 | |
| | 6,613 | | | Axis Capital Holdings Ltd. | | | 368,939 | |
| | 7,386 | | | Baxter International, Inc. | | | 461,699 | |
| | 2,475 | | | Becton Dickinson and Co. | | | 570,487 | |
| | 4,807 | | | Broadridge Financial Solutions, Inc. | | | 562,131 | |
| | 7,565 | | | Brown & Brown, Inc. | | | 213,182 | |
| | 14,984 | | | CA, Inc. | | | 664,690 | |
| | 7,273 | | | Carnival Corp. | | | 407,579 | |
SEE NOTES TO FINANCIAL STATEMENTS.
| | | | | | |
| | | |
| 102 | | | | J.P. MORGAN EXCHANGE-TRADED FUNDS | | OCTOBER 31, 2018 |
| | | | | | | | |
| SHARES | | | INVESTMENTS | | VALUE($) | |
| | Common Stocks — continued | |
| | | | United States — continued | | | | |
| | 2,326 | | | Carnival plc | | | 126,780 | |
| | 5,656 | | | Celanese Corp. | | | 548,293 | |
| | 16,658 | | | CenterPoint Energy, Inc. | | | 449,933 | |
| | 26,574 | | | CenturyLink, Inc. | | | 548,487 | |
| | 5,325 | | | Chevron Corp. | | | 594,536 | |
| | 11,549 | | | Church & Dwight Co., Inc. | | | 685,664 | |
| | 2,221 | | | Cigna Corp. | | | 474,872 | |
| | 6,064 | | | Cincinnati Financial Corp. | | | 476,873 | |
| | 3,118 | | | Cintas Corp. | | | 567,071 | |
| | 9,282 | | | CMS Energy Corp. | | | 459,645 | |
| | 6,175 | | | CNA Financial Corp. | | | 267,810 | |
| | 9,277 | | | Commerce Bancshares, Inc. | | | 590,017 | |
| | 6,019 | | | Consolidated Edison, Inc. | | | 457,444 | |
| | 2,967 | | | Constellation Brands, Inc., Class A | | | 591,115 | |
| | 5,646 | | | Darden Restaurants, Inc. | | | 601,581 | |
| | 2,248 | | | DaVita, Inc.* | | | 151,380 | |
| | 8,885 | | | DENTSPLY SIRONA, Inc. | | | 307,688 | |
| | 5,945 | | | DTE Energy Co. | | | 668,218 | |
| | 5,923 | | | Eastman Chemical Co. | | | 464,067 | |
| | 1,293 | | | Everest Re Group Ltd. | | | 281,693 | |
| | 10,494 | | | Eversource Energy | | | 663,850 | |
| | 4,834 | | | Exelon Corp. | | | 211,778 | |
| | 6,064 | | | Fidelity National Information Services, Inc. | | | 631,262 | |
| | 9,299 | | | Foot Locker, Inc. | | | 438,355 | |
| | 9,616 | | | Garmin Ltd. | | | 636,195 | |
| | 20,822 | | | Gentex Corp. | | | 438,303 | |
| | 4,073 | | | Genuine Parts Co. | | | 398,828 | |
| | 4,050 | | | Harris Corp. | | | 602,275 | |
| | 6,141 | | | Hasbro, Inc. | | | 563,191 | |
| | 1,092 | | | Henry Schein, Inc.* | | | 90,636 | |
| | 8,576 | | | HollyFrontier Corp. | | | 578,365 | |
| | 13,661 | | | Hormel Foods Corp. (c) | | | 596,166 | |
| | 2,473 | | | IAC/InterActiveCorp* | | | 486,167 | |
| | 3,420 | | | Ingredion, Inc. | | | 346,036 | |
| | 11,888 | | | Intel Corp. | | | 557,309 | |
| | 1,206 | | | International Flavors & Fragrances, Inc. | | | 174,460 | |
| | 7,438 | | | International Paper Co. | | | 337,388 | |
| | 10,035 | | | Interpublic Group of Cos., Inc. (The) | | | 232,411 | |
| | 4,634 | | | IQVIA Holdings, Inc.* | | | 569,658 | |
| | 5,091 | | | Jabil, Inc. | | | 125,900 | |
| | 4,297 | | | JM Smucker Co. (The) | | | 465,451 | |
| | 4,917 | | | Johnson & Johnson | | | 688,331 | |
| | 3,067 | | | L3 Technologies, Inc. | | | 581,104 | |
| | 3,666 | | | Laboratory Corp. of America Holdings* | | | 588,576 | |
| | 2,991 | | | Lam Research Corp. | | | 423,914 | |
| | | | | | | | |
| SHARES | | | INVESTMENTS | | VALUE($) | |
| | | | | | | | |
| | | | United States — continued | | | | |
| | 6,184 | | | Leggett & Platt, Inc. | | | 224,541 | |
| | 2,057 | | | LyondellBasell Industries NV, Class A | | | 183,628 | |
| | 1,979 | | | ManpowerGroup, Inc. | | | 150,978 | |
| | 2,263 | | | Marathon Petroleum Corp. | | | 159,428 | |
| | 4,379 | | | McCormick & Co., Inc. (Non-Voting) | | | 630,576 | |
| | 17,001 | | | MDU Resources Group, Inc. | | | 424,345 | |
| | 6,001 | | | Molson Coors Brewing Co., Class B | | | 384,064 | |
| | 27,811 | | | News Corp., Class A | | | 366,827 | |
| | 1,091 | | | NextEra Energy, Inc. | | | 188,198 | |
| | 2,007 | | | Northrop Grumman Corp. | | | 525,734 | |
| | 197 | | | NVR, Inc.* | | | 441,089 | |
| | 21,497 | | | Old Republic International Corp. | | | 474,009 | |
| | 15,840 | | | Pfizer, Inc. | | | 682,070 | |
| | 2,941 | | | Phillips 66 | | | 302,394 | |
| | 7,244 | | | Pinnacle West Capital Corp. | | | 595,819 | |
| | 4,402 | | | Public Service Enterprise Group, Inc. | | | 235,199 | |
| | 16,745 | | | PulteGroup, Inc. | | | 411,425 | |
| | 4,413 | | | Quest Diagnostics, Inc. | | | 415,307 | |
| | 3,160 | | | Raytheon Co. | | | 553,126 | |
| | 8,891 | | | Republic Services, Inc. | | | 646,198 | |
| | 8,011 | | | SCANA Corp. | | | 320,841 | |
| | 10,516 | | | Southwest Airlines Co. | | | 516,336 | |
| | 1,834 | | | Synopsys, Inc.* | | | 164,198 | |
| | 8,234 | | | Toll Brothers, Inc. | | | 277,156 | |
| | 7,479 | | | Torchmark Corp. | | | 633,172 | |
| | 6,044 | | | Tyson Foods, Inc., Class A | | | 362,156 | |
| | 780 | | | United Continental Holdings, Inc.* | | | 66,698 | |
| | 2,033 | | | UnitedHealth Group, Inc. | | | 531,325 | |
| | 4,260 | | | Universal Health Services, Inc., Class B | | | 517,846 | |
| | 4,022 | | | Valero Energy Corp. | | | 366,364 | |
| | 12,034 | | | Verizon Communications, Inc. | | | 687,021 | |
| | 3,444 | | | VMware, Inc., Class A* | | | 486,947 | |
| | 6,277 | | | Walmart, Inc. | | | 629,458 | |
| | 4,039 | | | Walt Disney Co. (The) | | | 463,798 | |
| | 2,989 | | | Waters Corp.* | | | 566,983 | |
| | 5,720 | | | Westlake Chemical Corp. | | | 407,836 | |
| | 8,410 | | | WR Berkley Corp. | | | 638,319 | |
| | 5,844 | | | Wyndham Destinations, Inc. | | | 209,683 | |
| | 3,273 | | | Wyndham Hotels & Resorts, Inc. | | | 161,326 | |
| | 13,472 | | | Xcel Energy, Inc. | | | 660,263 | |
| | 8,602 | | | Xylem, Inc. | | | 564,119 | |
| | 2,087 | | | Zimmer Biomet Holdings, Inc. | | | 237,062 | |
| | | | | | | | |
| | | | | | | 50,860,378 | |
| | | | | | | | |
| | | | Total Common Stocks
(Cost $204,543,360) | | | 201,146,419 | |
| | | | | | | | |
SEE NOTES TO FINANCIAL STATEMENTS.
| | | | | | | | |
| | | |
| OCTOBER 31, 2018 | | J.P. MORGAN EXCHANGE-TRADED FUNDS | | | | | 103 | |
JPMorgan Diversified Return Global Equity ETF
SCHEDULE OF PORTFOLIO INVESTMENTS
AS OF OCTOBER 31, 2018 (continued)
| | | | | | | | |
NO. OF
RIGHTS | | | INVESTMENTS | | VALUE($) | |
| | Rights — 0.0% (b) | | | | |
| | | | Australia — 0.0% (b) | | | | |
| | 17,270 | | | WorleyParsons Ltd., expiring 11/7/2018 (Strike Price $1.00)*
(Cost $—) | | | — | (d) |
| | | | | | | | |
| | |
| SHARES | | | | | | |
| | Short-Term Investments — 0.3% | | | | |
| | | | Investment Companies — 0.3% | | | | |
| | 627,017 | | | JPMorgan U.S. Government Money Market Fund Class Institutional Shares,
2.02% (e) (f)
(Cost $627,017) | | | 627,017 | |
| | | | | | | | |
| | Investment of Cash Collateral from Securities Loaned — 0.5% | |
| | 924,151 | | | JPMorgan U.S. Government Money Market Fund Class IM Shares,
2.07% (e) (f)
(Cost $924,151) | | | 924,151 | |
| | | | | | | | |
| | | | Total Investments — 99.6%
(Cost 206,094,528) | | | 202,697,587 | |
| | | | Other Assets Less Liabilities — 0.4% | | | 759,677 | |
| | | | | | | | |
| | | | NET ASSETS — 100.0% | | | 203,457,264 | |
| | | | | | | | |
Percentages indicated are based on net assets.
Abbreviations
| | |
| OYJ | | — Public Limited Company |
| REIT | | — Real Estate Investment Trust |
| SCA | | — Limited partnership with share capital |
| | |
| (a) | | — Security exempt from registration pursuant to Regulation S under the Securities Act of 1933, as amended. Regulation S applies to securities offerings that are made outside of the United States and do not involve direct selling efforts in the United States and as such may have restrictions on resale. |
| (b) | | — Amount rounds to less than 0.1% of net assets. |
| (c) | | — The security or a portion of this security is on loan at October 31, 2018. The total value of securities on loan at October 31, 2018 was $905,726. |
| (d) | | — Amount rounds to less than 1. |
| (e) | | — Investment in affiliate. Fund is registered under the Investment Company Act of 1940, as amended, and advised by J.P. Morgan Investment Management Inc. |
| (f) | | — The rate shown is the current yield as of October 31, 2018. |
| * | | — Non-income producing security. |
Summary of Investments by Industry, October 31, 2018
The following table represents the portfolio investments of the Fund by industry classifications as a percentage of total investments:
| | | | |
| INDUSTRY | | PERCENTAGE | |
Oil, Gas & Consumable Fuels | | | 5.9 | % |
Electric Utilities | | | 5.7 | |
Chemicals | | | 5.2 | |
Diversified Telecommunication Services | | | 4.6 | |
Insurance | | | 4.1 | |
Food Products | | | 3.8 | |
Pharmaceuticals | | | 3.7 | |
Health Care Providers & Services | | | 3.2 | |
Banks | | | 2.8 | |
Food & Staples Retailing | | | 2.6 | |
IT Services | | | 2.5 | |
Hotels, Restaurants & Leisure | | | 2.5 | |
Health Care Equipment & Supplies | | | 2.5 | |
Metals & Mining | | | 2.4 | |
Household Durables | | | 2.4 | |
Software | | | 2.0 | |
Airlines | | | 2.0 | |
Multi-Utilities | | | 1.9 | |
Equity Real Estate Investment Trusts (REITs) | | | 1.9 | |
Beverages | | | 1.7 | |
Auto Components | | | 1.7 | |
Wireless Telecommunication Services | | | 1.7 | |
Construction & Engineering | | | 1.6 | |
Trading Companies & Distributors | | | 1.6 | |
Semiconductors & Semiconductor Equipment | | | 1.6 | |
Industrial Conglomerates | | | 1.6 | |
Aerospace & Defense | | | 1.5 | |
Specialty Retail | | | 1.5 | |
Road & Rail | | | 1.4 | |
Real Estate Management & Development | | | 1.3 | |
Media | | | 1.3 | |
Technology Hardware, Storage & Peripherals | | | 1.3 | |
Gas Utilities | | | 1.3 | |
Commercial Services & Supplies | | | 1.3 | |
Automobiles | | | 1.2 | |
Entertainment | | | 1.2 | |
Electronic Equipment, Instruments & Components | | | 1.1 | |
Others (each less than 1.0%) | | | 12.4 | |
SEE NOTES TO FINANCIAL STATEMENTS.
| | | | | | |
| | | |
| 104 | | | | J.P. MORGAN EXCHANGE-TRADED FUNDS | | OCTOBER 31, 2018 |
| | | | | | | | | | |
| Futures contracts outstanding as of October 31, 2018: | | | | |
| | | | | | | | | | | | | | | | | | | | |
| DESCRIPTION | | NUMBER OF
CONTRACTS | | | EXPIRATION
DATE | | | TRADING
CURRENCY | | | NOTIONAL
AMOUNT ($) | | | VALUE AND
UNREALIZED
APPRECIATION
(DEPRECIATION) ($) | |
Long Contracts | | | | | | | | | | | | | | | | | | | | |
MSCI EAFE E-Mini Index | | | 16 | | | | 12/2018 | | | | USD | | | | 1,450,480 | | | | (16,408 | ) |
S&P 500 E-Mini Index | | | 4 | | | | 12/2018 | | | | USD | | | | 542,040 | | | | (1,468 | ) |
| | | | | | | | | | | | | | | | | | | | |
| | | | | | | | | | | | | | | | | | | (17,876 | ) |
| | | | | | | | | | | | | | | | | | | | |
Abbreviations
| | |
| EAFE | | — Europe, Australasia, and Far East |
| MSCI | | — Morgan Stanley Capital International |
| USD | | — United States Dollar |
SEE NOTES TO FINANCIAL STATEMENTS.
| | | | | | | | |
| | | |
| OCTOBER 31, 2018 | | J.P. MORGAN EXCHANGE-TRADED FUNDS | | | | | 105 | |
JPMorgan Diversified Return International Currency Hedged ETF
SCHEDULE OF PORTFOLIO INVESTMENTS
AS OF OCTOBER 31, 2018
| | | | | | | | |
| SHARES | | | INVESTMENTS | | VALUE($) | |
| | Exchange Traded Funds — 100.1% | | | | |
| | | | United States — 100.1% | | | | |
| | 592,880 | | | JPMorgan Diversified Return International Equity ETF (a)
(Cost $30,690,692) | | | 31,392,996 | |
| | | | | | | | |
| | | | Total Investments — 100.1%
(Cost $30,690,692) | | | 31,392,996 | |
| | | | Liabilities in Excess of Other Assets — (0.1)% | | | (26,208 | ) |
| | | | | | | | |
| | | | NET ASSETS — 100.0% | | | 31,366,788 | |
| | | | | | | | |
Percentages indicated are based on net assets.
Abbreviations
| | |
| ETF | | — Exchange Traded Fund |
| |
| (a) | | — Investment in affiliate. Fund is registered under the Investment Company Act of 1940, as amended, and advised by J.P. Morgan Investment Management Inc. |
| | | | | | | | | | | | | | | | | | | | | | |
| Forward foreign currency exchange contracts outstanding as of October 31, 2018: | |
| CURRENCY PURCHASED | | | CURRENCY SOLD | | | COUNTERPARTY | | SETTLEMENT
DATE | | | UNREALIZED
APPRECIATION
(DEPRECIATION) ($) | |
USD | | | 2,552,294 | | | | AUD | | | | 3,538,881 | | | HSBC Bank, NA | | | 11/5/2018 | | | | 46,152 | |
USD | | | 371,516 | | | | AUD | | | | 513,427 | | | National Australia Bank Ltd. | | | 11/5/2018 | | | | 7,920 | |
USD | | | 741,719 | | | | CHF | | | | 722,183 | | | State Street Corp. | | | 11/5/2018 | | | | 24,477 | |
USD | | | 335,234 | | | | DKK | | | | 2,146,238 | | | Merrill Lynch International | | | 11/5/2018 | | | | 9,321 | |
USD | | | 6,513,791 | | | | EUR | | | | 5,592,726 | | | Barclays Bank plc | | | 11/5/2018 | | | | 177,740 | |
USD | | | 68,256 | | | | EUR | | | | 58,636 | | | Merrill Lynch International | | | 11/5/2018 | | | | 1,827 | |
USD | | | 6,709,055 | | | | GBP | | | | 5,136,666 | | | Citibank, NA | | | 11/5/2018 | | | | 142,554 | |
USD | | | 108,509 | | | | GBP | | | | 83,080 | | | Merrill Lynch International | | | 11/5/2018 | | | | 2,303 | |
USD | | | 70,910 | | | | GBP | | | | 54,285 | | | Royal Bank of Canada | | | 11/5/2018 | | | | 1,514 | |
USD | | | 2,136,332 | | | | HKD | | | | 16,709,365 | | | HSBC Bank, NA | | | 11/5/2018 | | | | 5,304 | |
USD | | | 40,912 | | | | KRW | | | | 45,416,877 | | | Goldman Sachs International** | | | 11/5/2018 | | | | 1,086 | |
USD | | | 3,350,333 | | | | KRW | | | | 3,716,792,747 | | | Merrill Lynch International** | | | 11/5/2018 | | | | 91,029 | |
USD | | | 481,019 | | | | NOK | | | | 3,912,385 | | | BNP Paribas | | | 11/5/2018 | | | | 16,848 | |
USD | | | 18,583 | | | | NOK | | | | 151,128 | | | Goldman Sachs International | | | 11/5/2018 | | | | 653 | |
USD | | | 188,905 | | | | NZD | | | | 284,812 | | | State Street Corp. | | | 11/5/2018 | | | | 3,044 | |
USD | | | 1,133,076 | | | | SEK | | | | 10,056,143 | | | BNP Paribas | | | 11/5/2018 | | | | 33,928 | |
USD | | | 892,586 | | | | SGD | | | | 1,218,488 | | | HSBC Bank, NA | | | 11/5/2018 | | | | 12,855 | |
GBP | | | 383,623 | | | | USD | | | | 490,793 | | | Merrill Lynch International | | | 12/5/2018 | | | | 303 | |
JPY | | | 92,733,010 | | | | USD | | | | 823,548 | | | UBS AG | | | 12/5/2018 | | | | 380 | |
KRW | | | 502,370,839 | | | | USD | | | | 440,483 | | | Citibank, NA** | | | 12/5/2018 | | | | 48 | |
USD | | | 2,873,897 | | | | AUD | | | | 4,052,309 | | | National Australia Bank Ltd. | | | 12/5/2018 | | | | 3,224 | |
USD | | | 673,007 | | | | CHF | | | | 675,122 | | | State Street Corp. | | | 12/5/2018 | | | | 594 | |
USD | | | 303,620 | | | | DKK | | | | 1,993,632 | | | Societe Generale | | | 12/5/2018 | | | | 72 | |
USD | | | 6,206,440 | | | | EUR | | | | 5,464,353 | | | National Australia Bank Ltd. | | | 12/5/2018 | | | | 334 | |
USD | | | 2,166,838 | | | | HKD | | | | 16,966,565 | | | UBS AG | | | 12/5/2018 | | | | 765 | |
USD | | | 484,141 | | | | NOK | | | | 4,063,513 | | | Citibank, NA | | | 12/5/2018 | | | | 1,407 | |
USD | | | 175,973 | | | | NZD | | | | 269,397 | | | UBS AG | | | 12/5/2018 | | | | 120 | |
USD | | | 1,076,428 | | | | SEK | | | | 9,814,399 | | | Societe Generale | | | 12/5/2018 | | | | 894 | |
USD | | | 839,398 | | | | SGD | | | | 1,161,820 | | | HSBC Bank, NA | | | 12/5/2018 | | | | 48 | |
| | | | | | | | | | | | | | | | | | | | | | |
Total unrealized appreciation | | | | | | | 586,744 | |
| | | | | | | | | | | | | | | | | | | | | | |
CHF | | | 47,061 | | | | USD | | | | 48,334 | | | Barclays Bank plc | | | 11/5/2018 | | | | (1,594 | ) |
DKK | | | 152,605 | | | | USD | | | | 23,838 | | | HSBC Bank, NA | | | 11/5/2018 | | | | (664 | ) |
SEE NOTES TO FINANCIAL STATEMENTS.
| | | | | | |
| | | |
| 106 | | | | J.P. MORGAN EXCHANGE-TRADED FUNDS | | OCTOBER 31, 2018 |
| | | | | | | | | | | | | | | | | | | | | | |
| CURRENCY PURCHASED | | | CURRENCY SOLD | | | COUNTERPARTY | | SETTLEMENT
DATE | | | UNREALIZED
APPRECIATION
(DEPRECIATION) ($) | |
EUR | | | 47,027 | | | | USD | | | | 54,731 | | | BNP Paribas | | | 11/5/2018 | | | | (1,453 | ) |
EUR | | | 139,983 | | | | USD | | | | 163,022 | | | Merrill Lynch International | | | 11/5/2018 | | | | (4,435 | ) |
KRW | | | 41,548,069 | | | | USD | | | | 37,459 | | | Merrill Lynch International** | | | 11/5/2018 | | | | (1,025 | ) |
NZD | | | 15,415 | | | | USD | | | | 10,223 | | | Merrill Lynch International | | | 11/5/2018 | | | | (164 | ) |
SEK | | | 241,744 | | | | USD | | | | 27,243 | | | Goldman Sachs International | | | 11/5/2018 | | | | (820 | ) |
SGD | | | 56,668 | | | | USD | | | | 41,510 | | | Societe Generale | | | 11/5/2018 | | | | (597 | ) |
USD | | | 70,627 | | | | JPY | | | | 8,029,260 | | | Barclays Bank plc | | | 11/5/2018 | | | | (547 | ) |
USD | | | 333,726 | | | | JPY | | | | 37,801,711 | | | Citibank, NA | | | 11/5/2018 | | | | (1,361 | ) |
USD | | | 85,890 | | | | JPY | | | | 9,727,364 | | | National Australia Bank Ltd. | | | 11/5/2018 | | | | (337 | ) |
USD | | | 8,047,257 | | | | JPY | | | | 911,509,570 | | | State Street Corp. | | | 11/5/2018 | | | | (32,668 | ) |
AUD | | | 306,754 | | | | USD | | | | 217,544 | | | UBS AG | | | 12/5/2018 | | | | (238 | ) |
CHF | | | 53,498 | | | | USD | | | | 53,328 | | | Royal Bank of Canada | | | 12/5/2018 | | | | (45 | ) |
DKK | | | 122,775 | | | | USD | | | | 18,699 | | | Citibank, NA | | | 12/5/2018 | | | | (5 | ) |
EUR | | | 417,107 | | | | USD | | | | 473,728 | | | Goldman Sachs International | | | 12/5/2018 | | | | (1 | ) |
HKD | | | 2,000,729 | | | | USD | | | | 255,510 | | | HSBC Bank, NA | | | 12/5/2018 | | | | (83 | ) |
NZD | | | 10,823 | | | | USD | | | | 7,069 | | | Goldman Sachs International | | | 12/5/2018 | | | | (4 | ) |
SEK | | | 584,097 | | | | USD | | | | 64,074 | | | Societe Generale | | | 12/5/2018 | | | | (65 | ) |
SGD | | | 74,191 | | | | USD | | | | 53,617 | | | Societe Generale | | | 12/5/2018 | | | | (18 | ) |
USD | | | 46,675 | | | | AUD | | | | 65,954 | | | Barclays Bank plc | | | 12/5/2018 | | | | (47 | ) |
USD | | | 100,209 | | | | EUR | | | | 88,337 | | | Royal Bank of Canada | | | 12/5/2018 | | | | (120 | ) |
USD | | | 110,168 | | | | GBP | | | | 86,160 | | | Barclays Bank plc | | | 12/5/2018 | | | | (131 | ) |
USD | | | 6,749,967 | | | | GBP | | | | 5,274,031 | | | Citibank, NA | | | 12/5/2018 | | | | (1,599 | ) |
USD | | | 8,725,579 | | | | JPY | | | | 982,530,472 | | | National Australia Bank Ltd. | | | 12/5/2018 | | | | (4,161 | ) |
USD | | | 3,262,651 | | | | KRW | | | | 3,720,661,555 | | | Goldman Sachs International** | | | 12/5/2018 | | | | (12 | ) |
USD | | | 49,563 | | | | KRW | | | | 56,539,966 | | | Merrill Lynch International** | | | 12/5/2018 | | | | (17 | ) |
USD | | | 17,650 | | | | SEK | | | | 161,281 | | | Royal Bank of Canada | | | 12/5/2018 | | | | (24 | ) |
| | | | | | | | | | | | | | | | | | | | | | |
Total unrealized depreciation | | | | | | | (52,235 | ) |
| | | | | | | | | | | | | | | | | | | | | | |
Net unrealized appreciation | | | | | | | | | | | | | | 534,509 | |
| | | | | | | | | | | | | | | | | | | | | | |
| | |
| ** | | — Non-deliverable forward. |
Abbreviations
| | |
| AUD | | — Australian Dollar |
| CHF | | — Swiss Franc |
| DKK | | — Danish Krone |
| EUR | | — Euro |
| GBP | | — British Pound |
| HKD | | — Hong Kong Dollar |
| JPY | | — Japanese Yen |
| KRW | | — South Korean Won |
| NOK | | — Norwegian Krone |
| NZD | | — New Zealand Dollar |
| SEK | | — Swedish Krona |
| SGD | | — Singapore Dollar |
| USD | | — United States Dollar |
SEE NOTES TO FINANCIAL STATEMENTS.
| | | | | | | | |
| | | |
| OCTOBER 31, 2018 | | J.P. MORGAN EXCHANGE-TRADED FUNDS | | | | | 107 | |
JPMorgan Diversified Return International Equity ETF
SCHEDULE OF PORTFOLIO INVESTMENTS
AS OF OCTOBER 31, 2018
| | | | | | | | |
| SHARES | | | INVESTMENTS | | VALUE($) | |
| | Common Stocks — 99.0% | | | | |
| | | | Australia — 9.0% | | | | |
| | 411,412 | | | AGL Energy Ltd. | | | 5,253,917 | |
| | 1,248,223 | | | Alumina Ltd. | | | 2,265,317 | |
| | 281,533 | | | Ansell Ltd. | | | 4,641,441 | |
| | 352,039 | | | APA Group | | | 2,397,385 | |
| | 230,203 | | | Atlas Arteria Ltd. | | | 1,115,143 | |
| | 206,335 | | | BHP Billiton plc | | | 4,116,113 | |
| | 254,595 | | | Boral Ltd. | | | 1,014,248 | |
| | 234,208 | | | Brambles Ltd. | | | 1,764,276 | |
| | 76,186 | | | Caltex Australia Ltd. | | | 1,524,392 | |
| | 28,091 | | | CIMIC Group Ltd. | | | 943,155 | |
| | 388,495 | | | Coca-Cola Amatil Ltd. | | | 2,734,112 | |
| | 39,953 | | | Cochlear Ltd. | | | 5,034,605 | |
| | 232,695 | | | Computershare Ltd. | | | 3,267,661 | |
| | 144,810 | | | Crown Resorts Ltd. | | | 1,288,502 | |
| | 37,934 | | | CSL Ltd. | | | 5,064,081 | |
| | 880,647 | | | CSR Ltd. | | | 2,209,128 | |
| | 727,131 | | | Dexus, REIT | | | 5,253,756 | |
| | 663,499 | | | Downer EDI Ltd. | | | 3,266,642 | |
| | 1,425,208 | | | GPT Group (The), REIT | | | 5,212,306 | |
| | 768,381 | | | Harvey Norman Holdings Ltd. | | | 1,739,398 | |
| | 1,707,687 | | | Healthscope Ltd. | | | 2,562,098 | |
| | 314,274 | | | Incitec Pivot Ltd. | | | 870,810 | |
| | 33,148 | | | Macquarie Group Ltd. | | | 2,764,284 | |
| | 704,581 | | | Metcash Ltd. | | | 1,377,074 | |
| | 1,017,466 | | | Mirvac Group, REIT | | | 1,565,103 | |
| | 340,327 | | | Oil Search Ltd. | | | 1,870,949 | |
| | 890,264 | | | Origin Energy Ltd.* | | | 4,613,577 | |
| | 333,992 | | | Orora Ltd. | | | 795,960 | |
| | 1,091,437 | | | Qantas Airways Ltd. | | | 4,236,690 | |
| | 52,454 | | | Ramsay Health Care Ltd. | | | 2,093,711 | |
| | 61,268 | | | Rio Tinto Ltd. | | | 3,333,734 | |
| | 85,918 | | | Rio Tinto plc | | | 4,171,385 | |
| | 1,091,065 | | | Santos Ltd. | | | 5,120,997 | |
| | 328,274 | | | Sonic Healthcare Ltd. | | | 5,253,977 | |
| | 281,142 | | | Star Entertainment Grp Ltd. (The) | | | 948,056 | |
| | 1,755,862 | | | Tabcorp Holdings Ltd. | | | 5,762,193 | |
| | 585,553 | | | TPG Telecom Ltd. | | | 2,981,514 | |
| | 2,540,180 | | | Vicinity Centres, REIT | | | 4,765,060 | |
| | 847,241 | | | Vocus Group Ltd.* | | | 2,067,425 | |
| | 102,529 | | | Wesfarmers Ltd. | | | 3,395,526 | |
| | 895,828 | | | Whitehaven Coal Ltd. | | | 3,094,436 | |
| | 223,073 | | | Woodside Petroleum Ltd. | | | 5,492,120 | |
| | 67,144 | | | WorleyParsons Ltd. | | | 694,486 | |
| | | | | | | | |
| | | | | | | 129,936,743 | |
| | | | | | | | |
| | | | | | | | |
| SHARES | | | INVESTMENTS | | VALUE($) | |
| | | | | | | | |
| | | | Austria — 0.4% | |
| | 50,982 | | | OMV AG | | | 2,831,162 | |
| | 99,176 | | | voestalpine AG | | | 3,519,754 | |
| | | | | | | | |
| | | | | | | 6,350,916 | |
| | | | | | | | |
| | | | Belgium — 1.1% | |
| | 83,555 | | | Colruyt SA | | | 4,858,240 | |
| | 34,245 | | | Groupe Bruxelles Lambert SA | | | 3,184,891 | |
| | 154,634 | | | Proximus SADP | | | 3,939,747 | |
| | 83,593 | | | Umicore SA | | | 3,934,966 | |
| | | | | | | | |
| | | | | | | 15,917,844 | |
| | | | | | | | |
| | | | Chile — 0.3% | |
| | 456,119 | | | Antofagasta plc | | | 4,565,763 | |
| | | | | | | | |
| | | | China — 0.9% | |
| | 353,000 | | | China Mengniu Dairy Co. Ltd.* | | | 1,044,486 | |
| | 219,000 | | | FIH Mobile Ltd.* | | | 20,425 | |
| | 946,600 | | | Nexteer Automotive Group Ltd. | | | 1,334,779 | |
| | 3,230,300 | | | Semiconductor Manufacturing International Corp.* | | | 2,668,349 | |
| | 1,300,000 | | | Tingyi Cayman Islands Holding Corp. | | | 1,926,144 | |
| | 1,590,000 | | | Uni-President China Holdings Ltd. | | | 1,546,813 | |
| | 2,583,000 | | | Want Want China Holdings Ltd. | | | 1,847,930 | |
| | 6,834,400 | | | Xinyi Solar Holdings Ltd. | | | 2,138,283 | |
| | | | | | | | |
| | | | | | | 12,527,209 | |
| | | | | | | | |
| | | | Denmark — 0.9% | |
| | 61,283 | | | Chr Hansen Holding A/S | | | 6,186,034 | |
| | 6,927 | | | DSV A/S | | | 555,716 | |
| | 25,174 | | | H Lundbeck A/S | | | 1,174,158 | |
| | 11,012 | | | ISS A/S | | | 361,647 | |
| | 152,972 | | | William Demant Holding A/S* | | | 5,028,452 | |
| | | | | | | | |
| | | | | | | 13,306,007 | |
| | | | | | | | |
| | | | Finland — 1.9% | |
| | 117,899 | | | Elisa OYJ | | | 4,690,732 | |
| | 223,574 | | | Fortum OYJ | | | 4,706,390 | |
| | 85,886 | | | Kesko OYJ, Class B | | | 5,015,965 | |
| | 71,652 | | | Neste OYJ | | | 5,883,712 | |
| | 30,838 | | | Nokian Renkaat OYJ | | | 980,906 | |
| | 15,411 | | | Orion OYJ, Class B | | | 530,128 | |
| | 159,421 | | | UPM-Kymmene OYJ | | | 5,125,186 | |
| | | | | | | | |
| | | | | | | 26,933,019 | |
| | | | | | | | |
| | | | France — 5.5% | |
| | 35,043 | | | Arkema SA | | | 3,676,488 | |
| | 37,542 | | | Atos SE | | | 3,210,858 | |
| | 20,192 | | | Bouygues SA | | | 735,609 | |
| | 48,392 | | | Capgemini SE | | | 5,908,894 | |
SEE NOTES TO FINANCIAL STATEMENTS.
| | | | | | |
| | | |
| 108 | | | | J.P. MORGAN EXCHANGE-TRADED FUNDS | | OCTOBER 31, 2018 |
| | | | | | | | |
| SHARES | | | INVESTMENTS | | VALUE($) | |
| | Common Stocks — continued | |
| | | | France — continued | |
| | 29,132 | | | Casino Guichard Perrachon SA | | | 1,284,801 | |
| | 16,827 | | | Cie Plastic Omnium SA | | | 467,828 | |
| | 8,470 | | | Covivio, REIT | | | 849,889 | |
| | 693 | | | Dassault Aviation SA | | | 1,149,917 | |
| | 38,392 | | | Dassault Systemes SE | | | 4,806,086 | |
| | 50,514 | | | Eiffage SA | | | 4,933,295 | |
| | 217,718 | | | Electricite de France SA | | | 3,607,161 | |
| | 47,104 | | | Eutelsat Communications SA | | | 954,072 | |
| | 39,119 | | | Faurecia SA | | | 1,896,425 | |
| | 15,707 | | | Gecina SA, REIT | | | 2,303,633 | |
| | 7,921 | | | Ipsen SA | | | 1,098,273 | |
| | 151,530 | | | Lagardere SCA | | | 4,142,031 | |
| | 283,018 | | | Orange SA | | | 4,417,443 | |
| | 5,772 | | | Orpea | | | 710,607 | |
| | 28,310 | | | Pernod Ricard SA | | | 4,316,894 | |
| | 29,642 | | | Safran SA | | | 3,830,571 | |
| | 101,969 | | | SCOR SE | | | 4,712,069 | |
| | 27,056 | �� | | Sodexo SA | | | 2,761,792 | |
| | 28,789 | | | Thales SA | | | 3,676,874 | |
| | 88,808 | | | TOTAL SA | | | 5,210,847 | |
| | 43,625 | | | Vinci SA | | | 3,882,597 | |
| | 180,528 | | | Vivendi SA | | | 4,354,031 | |
| | | | | | | | |
| | | | | | | 78,898,985 | |
| | | | | | | | |
| | | | Germany — 3.9% | | | | |
| | 52,387 | | | Axel Springer SE | | | 3,478,864 | |
| | 44,457 | | | Beiersdorf AG | | | 4,596,736 | |
| | 2,195 | | | CECONOMY AG | | | 11,216 | |
| | 50,746 | | | Deutsche Lufthansa AG (Registered) | | | 1,018,631 | |
| | 125,414 | | | Deutsche Telekom AG (Registered) | | | 2,057,000 | |
| | 133,877 | | | Evonik Industries AG | | | 4,141,590 | |
| | 59,234 | | | Fraport AG Frankfurt Airport Services Worldwide | | | 4,574,381 | |
| | 61,418 | | | Fresenius Medical Care AG & Co. KGaA | | | 4,822,327 | |
| | 44,203 | | | Hannover Rueck SE | | | 5,944,456 | |
| | 13,172 | | | Hella GmbH & Co. KGaA | | | 616,138 | |
| | 233,274 | | | Infineon Technologies AG | | | 4,674,086 | |
| | 12,966 | | | Merck KGaA | | | 1,387,404 | |
| | 46,766 | | | SAP SE | | | 5,007,399 | |
| | 877 | | | Suedzucker AG | | | 13,581 | |
| | 1,136,542 | | | Telefonica Deutschland Holding AG | | | 4,418,221 | |
| | 199,090 | | | TUI AG | | | 3,303,157 | |
| | 157,633 | | | Uniper SE | | | 4,549,030 | |
| | 49,064 | | | United Internet AG (Registered) | | | 2,030,309 | |
| | | | | | | | |
| | | | | | | 56,644,526 | |
| | | | | | | | |
| | | | | | | | |
| SHARES | | | INVESTMENTS | | VALUE($) | |
| | | | | | | | |
| | | | Hong Kong — 5.5% | | | | |
| | 367,200 | | | ASM Pacific Technology Ltd. | | | 3,184,640 | |
| | 1,319,000 | | | Cathay Pacific Airways Ltd. | | | 1,680,506 | |
| | 541,042 | | | CK Hutchison Holdings Ltd. | | | 5,449,442 | |
| | 638,500 | | | CK Infrastructure Holdings Ltd. | | | 4,672,948 | |
| | 530,500 | | | CLP Holdings Ltd. | | | 5,944,484 | |
| | 1,078,000 | | | First Pacific Co. Ltd. | | | 482,413 | |
| | 3,029,367 | | | Hong Kong & China Gas Co. Ltd. | | | 5,786,515 | |
| | 4,084,100 | | | Hutchison Port Holdings Trust | | | 1,004,648 | |
| | 44,200 | | | Jardine Matheson Holdings Ltd. | | | 2,552,260 | |
| | 72,900 | | | Jardine Strategic Holdings Ltd. | | | 2,448,897 | |
| | 3,082,000 | | | Li & Fung Ltd. | | | 611,661 | |
| | 625,000 | | | Link REIT, REIT | | | 5,554,435 | |
| | 263,000 | | | Melco International Development Ltd. | | | 451,383 | |
| | 1,096,500 | | | MTR Corp. Ltd. | | | 5,320,475 | |
| | 1,336,000 | | | New World Development Co. Ltd. | | | 1,699,612 | |
| | 8,633,000 | | | PCCW Ltd. | | | 4,740,117 | |
| | 802,500 | | | Power Assets Holdings Ltd. | | | 5,359,029 | |
| | 539,000 | | | Swire Pacific Ltd., Class A | | | 5,599,506 | |
| | 213,600 | | | Swire Properties Ltd. | | | 729,941 | |
| | 832,000 | | | Techtronic Industries Co. Ltd. | | | 3,917,697 | |
| | 3,052,500 | | | WH Group Ltd. (a) | | | 2,143,663 | |
| | 366,000 | | | Wheelock & Co. Ltd. | | | 1,956,643 | |
| | 4,498,000 | | | Xinyi Glass Holdings Ltd. | | | 4,466,027 | |
| | 1,386,500 | | | Yue Yuen Industrial Holdings Ltd. | | | 3,807,003 | |
| | | | | | | | |
| | | | | | | 79,563,945 | |
| | | | | | | | |
| | | | Italy — 1.2% | | | | |
| | 702,877 | | | Davide Campari-Milano SpA | | | 5,409,513 | |
| | 52,610 | | | Eni SpA | | | 934,340 | |
| | 370,524 | | | Italgas SpA | | | 1,911,736 | |
| | 1,169,700 | | | Parmalat SpA | | | 3,603,621 | |
| | 48,247 | | | Recordati SpA | | | 1,633,338 | |
| | 869,453 | | | Terna Rete Elettrica Nazionale SpA | | | 4,491,153 | |
| | | | | | | | |
| | | | | | | 17,983,701 | |
| | | | | | | | |
| | | | Japan — 25.0% | | | | |
| | 230,600 | | | Alfresa Holdings Corp. | | | 6,150,487 | |
| | 133,600 | | | ANA Holdings, Inc. | | | 4,492,380 | |
| | 127,200 | | | Aozora Bank Ltd. | | | 4,389,215 | |
| | 146,000 | | | Asahi Kasei Corp. | | | 1,751,774 | |
| | 56,500 | | | Astellas Pharma, Inc. | | | 872,937 | |
| | 80,700 | | | Brother Industries Ltd. | | | 1,476,938 | |
| | 151,200 | | | Canon Marketing Japan, Inc. | | | 2,861,164 | |
| | 178,500 | | | Canon, Inc. | | | 5,084,289 | |
| | 266,800 | | | Capcom Co. Ltd. | | | 5,561,436 | |
SEE NOTES TO FINANCIAL STATEMENTS.
| | | | | | | | |
| | | |
| OCTOBER 31, 2018 | | J.P. MORGAN EXCHANGE-TRADED FUNDS | | | | | 109 | |
JPMorgan Diversified Return International Equity ETF
SCHEDULE OF PORTFOLIO INVESTMENTS
AS OF OCTOBER 31, 2018 (continued)
| | | | | | | | |
| SHARES | | | INVESTMENTS | | VALUE($) | |
| | Common Stocks — continued | |
| | | | Japan — continued | | | | |
| | 31,000 | | | Central Japan Railway Co. | | | 5,949,170 | |
| | 396,800 | | | Chubu Electric Power Co., Inc. | | | 5,722,128 | |
| | 398,800 | | | Chugoku Electric Power Co., Inc. (The) | | | 5,129,642 | |
| | 225,700 | | | COMSYS Holdings Corp. | | | 6,281,311 | |
| | 70,300 | | | Cosmo Energy Holdings Co. Ltd. | | | 2,585,536 | |
| | 66,300 | | | Credit Saison Co. Ltd. | | | 1,052,846 | |
| | 558,300 | | | Daiwa Securities Group, Inc. | | | 3,201,688 | |
| | 54,400 | | | Denka Co. Ltd. | | | 1,769,237 | |
| | 124,100 | | | DIC Corp. | | | 3,662,206 | |
| | 172,300 | | | Electric Power Development Co. Ltd. | | | 4,690,932 | |
| | 15,500 | | | FamilyMart UNY Holdings Co. Ltd. | | | 1,796,604 | |
| | 87,500 | | | Fuji Media Holdings, Inc. | | | 1,420,121 | |
| | 113,500 | | | FUJIFILM Holdings Corp. | | | 4,908,918 | |
| | 557,600 | | | Fujikura Ltd. | | | 2,405,385 | |
| | 372,900 | | | Gunma Bank Ltd. (The) | | | 1,688,250 | |
| | 368,800 | | | Hachijuni Bank Ltd. (The) | | | 1,557,759 | |
| | 147,000 | | | Hankyu Hanshin Holdings, Inc. | | | 4,855,505 | |
| | 30,900 | | | Hikari Tsushin, Inc. | | | 5,396,820 | |
| | 21,400 | | | Hitachi Capital Corp. | | | 524,710 | |
| | 300 | | | Hitachi Chemical Co. Ltd. | | | 4,729 | |
| | 96,800 | | | Hitachi High-Technologies Corp. | | | 3,632,847 | |
| | 197,300 | | | Hokuriku Electric Power Co.* | | | 1,837,965 | |
| | 100,500 | | | Idemitsu Kosan Co. Ltd. | | | 4,552,921 | |
| | 59,700 | | | Iida Group Holdings Co. Ltd. | | | 1,086,709 | |
| | 173,500 | | | Inpex Corp. | | | 1,975,577 | |
| | 255,200 | | | Itochu Techno-Solutions Corp. | | | 4,839,626 | |
| | 172,800 | | | Japan Airlines Co. Ltd. | | | 6,132,872 | |
| | 135,200 | | | Japan Petroleum Exploration Co. Ltd. | | | 2,826,100 | |
| | 883,900 | | | JXTG Holdings, Inc. | | | 5,972,497 | |
| | 28,700 | | | Kagome Co. Ltd. | | | 764,092 | |
| | 35,100 | | | Kajima Corp. | | | 451,966 | |
| | 103,400 | | | Kaneka Corp. | | | 4,321,696 | |
| | 215,300 | | | Kansai Electric Power Co., Inc. (The) | | | 3,295,274 | |
| | 60,800 | | | Kawasaki Kisen Kaisha Ltd.* | | | 810,191 | |
| | 235,000 | | | KDDI Corp. | | | 5,686,965 | |
| | 38,900 | | | Keisei Electric Railway Co. Ltd. | | | 1,198,823 | |
| | 97,500 | | | Kirin Holdings Co. Ltd. | | | 2,326,598 | |
| | 372,600 | | | K’s Holdings Corp. | | | 4,707,030 | |
| | 269,700 | | | Kuraray Co. Ltd. | | | 3,704,470 | |
| | 295,300 | | | Kyushu Electric Power Co., Inc. | | | 3,430,487 | |
| | 207,800 | | | Leopalace21 Corp. | | | 865,585 | |
| | 106,000 | | | Lintec Corp. | | | 2,508,694 | |
| | 543,800 | | | Marubeni Corp. | | | 4,409,506 | |
| | 231,800 | | | Matsui Securities Co. Ltd. | | | 2,362,483 | |
| | 316,100 | | | Mebuki Financial Group, Inc. | | | 962,640 | |
| | 196,200 | | | Medipal Holdings Corp. | | | 4,199,877 | |
| | | | | | | | |
| SHARES | | | INVESTMENTS | | VALUE($) | |
| | |
| | | | Japan — continued | | | | |
| | 6,900 | | | Miraca Holdings, Inc. | | | 167,974 | |
| | 32,400 | | | Mitsubishi Corp. | | | 911,908 | |
| | 228,000 | | | Mitsubishi Gas Chemical Co., Inc. | | | 3,827,252 | |
| | 271,300 | | | Mitsubishi Tanabe Pharma Corp. | | | 4,007,355 | |
| | 238,300 | | | Mitsubishi UFJ Lease & Finance Co. Ltd. | | | 1,224,674 | |
| | 171,100 | | | Mitsui & Co. Ltd. | | | 2,858,843 | |
| | 73,000 | | | Mochida Pharmaceutical Co. Ltd. | | | 5,771,322 | |
| | 26,100 | | | Nagoya Railroad Co. Ltd. | | | 630,349 | |
| | 24,900 | | | NH Foods Ltd. | | | 858,698 | |
| | 42,300 | | | Nifco, Inc. | | | 963,996 | |
| | 188,800 | | | Nikon Corp. | | | 3,291,284 | |
| | 205,200 | | | Nippo Corp. | | | 3,364,297 | |
| | 33,900 | | | Nippon Express Co. Ltd. | | | 2,139,379 | |
| | 205,200 | | | Nippon Paper Industries Co. Ltd. | | | 3,717,781 | |
| | 49,300 | | | Nippon Shokubai Co. Ltd. | | | 3,180,713 | |
| | 113,800 | | | Nippon Telegraph & Telephone Corp. | | | 4,692,955 | |
| | 276,700 | | | Nipro Corp. | | | 3,523,560 | |
| | 109,500 | | | Nissan Motor Co. Ltd. | | | 996,205 | |
| | 302,200 | | | Nisshin Seifun Group, Inc. | | | 6,013,178 | |
| | 69,300 | | | Nissin Foods Holdings Co. Ltd. | | | 4,468,428 | |
| | 98,500 | | | Nomura Real Estate Holdings, Inc. | | | 1,850,319 | |
| | 49,800 | | | Nomura Research Institute Ltd. | | | 2,207,811 | |
| | 239,600 | | | NTT DOCOMO, Inc. | | | 5,941,803 | |
| | 121,500 | | | NTT Urban Development Corp. | | | 1,805,698 | |
| | 24,800 | | | Oracle Corp. Japan | | | 1,678,687 | |
| | 287,300 | | | Osaka Gas Co. Ltd. | | | 5,253,568 | |
| | 150,100 | | | Resona Holdings, Inc. | | | 789,531 | |
| | 73,300 | | | Sankyo Co. Ltd. | | | 2,798,648 | |
| | 48,800 | | | Sawai Pharmaceutical Co. Ltd. | | | 2,473,772 | |
| | 119,500 | | | SBI Holdings, Inc. | | | 3,120,505 | |
| | 45,800 | | | SCSK Corp. | | | 1,940,800 | |
| | 74,600 | | | Sega Sammy Holdings, Inc. | | | 957,887 | |
| | 198,700 | | | Sekisui Chemical Co. Ltd. | | | 3,124,739 | |
| | 344,800 | | | Sekisui House Ltd. | | | 5,060,638 | |
| | 80,300 | | | Shikoku Electric Power Co., Inc. | | | 1,007,886 | |
| | 128,500 | | | Shimachu Co. Ltd. | | | 3,368,464 | |
| | 24,700 | | | Shimamura Co. Ltd. | | | 2,077,630 | |
| | 317,600 | | | Showa Shell Sekiyu KK | | | 6,061,767 | |
| | 250,800 | | | SKY Perfect JSAT Holdings, Inc. | | | 1,113,659 | |
| | 136,200 | | | Skylark Holdings Co. Ltd. | | | 2,120,464 | |
| | 1,786,600 | | | Sojitz Corp. | | | 6,008,268 | |
| | 16,300 | | | Sony Corp. | | | 882,103 | |
| | 69,500 | | | Square Enix Holdings Co. Ltd. | | | 2,490,980 | |
| | 89,500 | | | Sumitomo Dainippon Pharma Co. Ltd. | | | 1,869,988 | |
| | 87,800 | | | Sumitomo Mitsui Financial Group, Inc. | | | 3,418,502 | |
| | 103,900 | | | Sumitomo Osaka Cement Co. Ltd. | | | 3,860,191 | |
SEE NOTES TO FINANCIAL STATEMENTS.
| | | | | | |
| | | |
| 110 | | | | J.P. MORGAN EXCHANGE-TRADED FUNDS | | OCTOBER 31, 2018 |
| | | | | | | | |
| SHARES | | | INVESTMENTS | | VALUE($) | |
| | Common Stocks — continued | |
| | | | Japan — continued | | | | |
| | 76,900 | | | Suzuken Co. Ltd. | | | 3,892,325 | |
| | 114,400 | | | Taisei Corp. | | | 4,892,715 | |
| | 31,700 | | | Taisho Pharmaceutical Holdings Co. Ltd. | | | 3,380,061 | |
| | 99,600 | | | Teijin Ltd. | | | 1,726,736 | |
| | 19,400 | | | TIS, Inc. | | | 866,542 | |
| | 94,700 | | | Tobu Railway Co. Ltd. | | | 2,633,857 | |
| | 2,900 | | | Toho Co. Ltd. | | | 94,614 | |
| | 32,900 | | | Toho Gas Co. Ltd. | | | 1,132,818 | |
| | 339,500 | | | Tohoku Electric Power Co., Inc. | | | 4,289,447 | |
| | 39,000 | | | Tokuyama Corp. | | | 872,108 | |
| | 14,200 | | | Tokyo Century Corp. | | | 762,164 | |
| | 272,500 | | | Tokyo Electric Power Co. Holdings, Inc.* | | | 1,394,703 | |
| | 136,000 | | | Tokyu Fudosan Holdings Corp. | | | 766,270 | |
| | 135,200 | | | Toyo Suisan Kaisha Ltd. | | | 4,647,442 | |
| | 102,200 | | | Toyota Industries Corp. | | | 5,020,285 | |
| | 150,500 | | | Tsumura & Co. | | | 4,681,005 | |
| | 169,900 | | | Ube Industries Ltd. | | | 3,700,876 | |
| | 364,900 | | | Yamada Denki Co. Ltd. | | | 1,720,631 | |
| | 278,400 | | | Yamaguchi Financial Group, Inc. | | | 2,931,321 | |
| | 204,700 | | | Yokohama Rubber Co. Ltd. (The) | | | 3,965,329 | |
| | 137,100 | | | Zeon Corp. | | | 1,324,089 | |
| | | | | | | | |
| | | | | | | 360,697,405 | |
| | | | | | | | |
| | | | Jordan — 0.4% | | | | |
| | 243,394 | | | Hikma Pharmaceuticals plc | | | 5,903,511 | |
| | | | | | | | |
| | | | Luxembourg — 0.2% | | | | |
| | 45,555 | | | RTL Group SA | | | 2,923,916 | |
| | | | | | | | |
| | | | Macau — 0.2% | | | | |
| | 607,784 | | | Sands China Ltd. | | | 2,403,486 | |
| | | | | | | | |
| | | | Netherlands — 2.5% | | | | |
| | 771,635 | | | Aegon NV | | | 4,732,165 | |
| | 47,212 | | | ASR Nederland NV | | | 2,143,293 | |
| | 60,321 | | | Heineken Holding NV | | | 5,217,543 | |
| | 126,863 | | | Koninklijke Ahold Delhaize NV | | | 2,903,959 | |
| | 13,014 | | | Koninklijke DSM NV | | | 1,136,237 | |
| | 96,793 | | | Koninklijke Philips NV | | | 3,609,978 | |
| | 111,799 | | | NN Group NV | | | 4,800,440 | |
| | 187,939 | | | Royal Dutch Shell plc, Class A | | | 5,987,382 | |
| | 98,158 | | | Wolters Kluwer NV | | | 5,568,952 | |
| | | | | | | | |
| | | | | | | 36,099,949 | |
| | | | | | | | |
| | | | New Zealand — 0.7% | | | | |
| | 202,317 | | | Fisher & Paykel Healthcare Corp. Ltd. | | | 1,799,681 | |
| | 125,349 | | | Fletcher Building Ltd.* | | | 496,498 | |
| | 2,164,950 | | | Spark New Zealand Ltd. | | | 5,591,237 | |
| | 80,888 | | | Xero Ltd.* | | | 2,293,020 | |
| | | | | | | | |
| | | | | | | 10,180,436 | |
| | | | | | | | |
| | | | | | | | |
| SHARES | | | INVESTMENTS | | VALUE($) | |
| | |
| | | | Norway — 1.6% | | | | |
| | 150,530 | | | Equinor ASA | | | 3,893,655 | |
| | 287,160 | | | Marine Harvest ASA | | | 6,952,229 | |
| | 415,827 | | | Norsk Hydro ASA | | | 2,156,388 | |
| | 447,702 | | | Orkla ASA | | | 3,863,360 | |
| | 307,343 | | | Telenor ASA | | | 5,635,246 | |
| | | | | | | | |
| | | | | | | 22,500,878 | |
| | | | | | | | |
| | | | Portugal — 0.7% | |
| | 1,263,398 | | | EDP — Energias de Portugal SA | | | 4,441,786 | |
| | 287,655 | | | Galp Energia SGPS SA | | | 5,001,816 | |
| | 54,161 | | | Jeronimo Martins SGPS SA | | | 664,771 | |
| | | | | | | | |
| | | | | | | 10,108,373 | |
| | | | | | | | |
| | | | Russia — 0.1% | |
| | 320,377 | | | Evraz plc | | | 2,219,800 | |
| | | | | | | | |
| | | | Singapore — 2.6% | |
| | 1,036,300 | | | Ascendas, REIT | | | 1,886,990 | |
| | 674,900 | | | CapitaLand Commercial Trust, REIT | | | 843,322 | |
| | 2,856,000 | | | CapitaLand Mall Trust, REIT | | | 4,350,009 | |
| | 1,370,300 | | | ComfortDelGro Corp. Ltd. | | | 2,231,208 | |
| | 11,345,200 | | | Golden Agri-Resources Ltd. | | | 2,091,722 | |
| | 1,117,500 | | | Keppel Corp. Ltd. | | | 5,006,904 | |
| | 1,258,900 | | | Sembcorp Industries Ltd. | | | 2,570,145 | |
| | 1,466,400 | | | Singapore Press Holdings Ltd. | | | 2,810,289 | |
| | 1,510,500 | | | Singapore Telecommunications Ltd. | | | 3,450,283 | |
| | 684,400 | | | StarHub Ltd. | | | 929,990 | |
| | 1,634,800 | | | Suntec, REIT | | | 2,092,204 | |
| | 353,800 | | | Venture Corp. Ltd. | | | 3,916,637 | |
| | 2,122,400 | | | Wilmar International Ltd. | | | 4,848,224 | |
| | | | | | | | |
| | | | | | | 37,027,927 | |
| | | | | | | | |
| | | | South Africa — 0.3% | |
| | 201,366 | | | Anglo American plc | | | 4,297,830 | |
| | 180,326 | | | Mediclinic International plc | | | 866,633 | |
| | | | | | | | |
| | | | | | | 5,164,463 | |
| | | | | | | | |
| | | | South Korea — 9.2% | |
| | 28,013 | | | Celltrion Healthcare Co. Ltd.* | | | 1,570,749 | |
| | 10,033 | | | CJ CheilJedang Corp. | | | 2,861,913 | |
| | 22,026 | | | Daelim Industrial Co. Ltd. | | | 1,474,595 | |
| | 14,885 | | | E-MART, Inc. | | | 2,677,776 | |
| | 49,039 | | | GS Engineering & Construction Corp. | | | 1,808,283 | |
| | 87,704 | | | GS Holdings Corp. | | | 3,743,050 | |
| | 16,813 | | | Hankook Tire Co. Ltd. | | | 610,818 | |
| | 174,330 | | | Hanwha Chemical Corp. | | | 2,482,562 | |
| | 47,434 | | | Hanwha Corp. | | | 1,174,846 | |
| | 419 | | | Hyosung Advanced Materials Corp.* | | | 38,648 | |
| | 1,429 | | | Hyosung Chemical Corp.* | | | 164,782 | |
SEE NOTES TO FINANCIAL STATEMENTS.
| | | | | | | | |
| | | |
| OCTOBER 31, 2018 | | J.P. MORGAN EXCHANGE-TRADED FUNDS | | | | | 111 | |
JPMorgan Diversified Return International Equity ETF
SCHEDULE OF PORTFOLIO INVESTMENTS
AS OF OCTOBER 31, 2018 (continued)
| | | | | | | | |
| SHARES | | | INVESTMENTS | | VALUE($) | |
| | Common Stocks — continued | |
| | | | South Korea — continued | |
| | 5,542 | | | Hyosung Corp. | | | 250,449 | |
| | 4,175 | | | Hyosung Heavy Industries Corp.* | | | 155,510 | |
| | 1,458 | | | Hyosung TNC Co. Ltd.* | | | 224,468 | |
| | 29,099 | | | Hyundai Department Store Co. Ltd. | | | 2,225,846 | |
| | 20,890 | | | Hyundai Engineering & Construction Co. Ltd. | | | 844,211 | |
| | 10,959 | | | Hyundai Mipo Dockyard Co. Ltd.* | | | 908,949 | |
| | 5,536 | | | Hyundai Mobis Co. Ltd. | | | 924,744 | |
| | 106,250 | | | Hyundai Steel Co. | | | 3,898,977 | |
| | 300,066 | | | Industrial Bank of Korea | | | 3,918,414 | |
| | 50,217 | | | Kakao Corp. | | | 4,059,246 | |
| | 105,361 | | | Kangwon Land, Inc. | | | 2,667,952 | |
| | 4,128 | | | KCC Corp. | | | 897,687 | |
| | 69,773 | | | Korea Electric Power Corp. | | | 1,666,630 | |
| | 95,273 | | | Korea Gas Corp.* | | | 4,370,574 | |
| | 4,172 | | | Korea Zinc Co. Ltd. | | | 1,391,442 | |
| | 76,701 | | | Korean Air Lines Co. Ltd. | | | 1,856,776 | |
| | 54,476 | | | KT&G Corp. | | | 4,857,696 | |
| | 77,364 | | | LG Corp. | | | 4,507,418 | |
| | 234,165 | | | LG Display Co. Ltd. | | | 3,416,821 | |
| | 347,797 | | | LG Uplus Corp. | | | 4,942,978 | |
| | 12,299 | | | Lotte Chemical Corp. | | | 2,841,593 | |
| | 9,653 | | | Mando Corp. | | | 259,724 | |
| | 22,178 | | | NAVER Corp. | | | 2,233,421 | |
| | 13,436 | | | NCSoft Corp. | | | 5,078,234 | |
| | 9,157 | | | Orion Corp. | | | 766,612 | |
| | 20,684 | | | POSCO | | | 4,734,422 | |
| | 7,947 | | | Samsung Biologics Co. Ltd.* (a) | | | 2,720,095 | |
| | 143,266 | | | Samsung Electronics Co. Ltd. | | | 5,363,276 | |
| | 12,876 | | | Samsung SDS Co. Ltd. | | | 2,190,252 | |
| | 14,409 | | | Shinsegae, Inc. | | | 3,289,891 | |
| | 24,135 | | | SK Holdings Co. Ltd. | | | 5,557,231 | |
| | 76,762 | | | SK Hynix, Inc. | | | 4,623,021 | |
| | 33,804 | | | SK Innovation Co. Ltd. | | | 6,343,997 | |
| | 329,066 | | | SK Networks Co. Ltd. | | | 1,233,814 | |
| | 26,444 | | | SK Telecom Co. Ltd. | | | 6,213,297 | |
| | 85,194 | | | SKC Co. Ltd. | | | 2,491,455 | |
| | 39,974 | | | S-Oil Corp. | | | 4,362,058 | |
| | 323,947 | | | Woori Bank | | | 4,488,606 | |
| | 13,442 | | | Yuhan Corp. | | | 1,981,901 | |
| | | | | | | | |
| | | | | | | 133,367,710 | |
| | | | | | | | |
| | | | Spain — 1.8% | |
| | 17,089 | | | Acciona SA | | | 1,441,479 | |
| | 189,808 | | | Acerinox SA | | | 2,120,900 | |
| | 27,407 | | | Cellnex Telecom SA (a) | | | 681,784 | |
| | 11,291 | | | Corp. Financiera Alba SA | | | 542,724 | |
| | | | | | | | |
| SHARES | | | INVESTMENTS | | VALUE($) | |
| | |
| | | | Spain — continued | |
| | 175,501 | | | Enagas SA | | | 4,653,140 | |
| | 237,630 | | | Endesa SA | | | 4,968,626 | |
| | 43,848 | | | Ferrovial SA | | | 877,882 | |
| | 216,231 | | | Naturgy Energy Group SA | | | 5,314,449 | |
| | 284,915 | | | Repsol SA | | | 5,091,104 | |
| | | | | | | | |
| | | | | | | 25,692,088 | |
| | | | | | | | |
| | | | Sweden — 3.3% | |
| | 181,731 | | | Boliden AB* | | | 4,150,143 | |
| | 104,881 | | | Hexagon AB, Class B | | | 5,133,257 | |
| | 93,497 | | | ICA Gruppen AB | | | 3,307,870 | |
| | 126,005 | | | Investor AB, Class B | | | 5,459,339 | |
| | 24,775 | | | Kinnevik AB, Class B | | | 686,852 | |
| | 317,512 | | | Securitas AB, Class B | | | 5,441,706 | |
| | 201,577 | | | Skanska AB, Class B | | | 3,168,711 | |
| | 92,369 | | | Svenska Cellulosa AB SCA, Class B | | | 873,207 | |
| | 107,666 | | | Swedish Match AB | | | 5,484,365 | |
| | 505,072 | | | Tele2 AB, Class B | | | 5,735,213 | |
| | 1,097,746 | | | Telia Co. AB | | | 4,941,496 | |
| | 176,067 | | | Trelleborg AB, Class B | | | 3,176,672 | |
| | | | | | | | |
| | | | | | | 47,558,831 | |
| | | | | | | | |
| | | | Switzerland — 2.4% | |
| | 25,625 | | | Baloise Holding AG (Registered) | | | 3,662,660 | |
| | 107,756 | | | Clariant AG (Registered)* | | | 2,322,453 | |
| | 182,019 | | | Coca-Cola HBC AG* | | | 5,376,587 | |
| | 621 | | | EMS-Chemie Holding AG (Registered) | | | 342,153 | |
| | 3,984 | | | Flughafen Zurich AG (Registered) | | | 787,369 | |
| | 8,352 | | | Kuehne + Nagel International AG (Registered) | | | 1,160,800 | |
| | 13,905 | | | Lonza Group AG (Registered)* | | | 4,372,280 | |
| | 38,317 | | | Novartis AG (Registered) | | | 3,355,510 | |
| | 31,538 | | | Sonova Holding AG (Registered) | | | 5,143,352 | |
| | 10,730 | | | Swisscom AG (Registered) | | | 4,913,071 | |
| | 21,373 | | | Vifor Pharma AG | | | 3,089,018 | |
| | | | | | | | |
| | | | | | | 34,525,253 | |
| | | | | | | | |
| | | | United Arab Emirates — 0.1% | |
| | 33,526 | | | NMC Health plc | | | 1,511,673 | |
| | | | | | | | |
| | | | United Kingdom — 16.4% | |
| | 155,773 | | | Admiral Group plc | | | 4,004,303 | |
| | 140,396 | | | Ashtead Group plc | | | 3,465,936 | |
| | 83,768 | | | AstraZeneca plc | | | 6,407,386 | |
| | 526,638 | | | Babcock International Group plc | | | 4,106,834 | |
| | 743,687 | | | Barratt Developments plc | | | 4,877,822 | |
| | 109,910 | | | Bellway plc | | | 4,031,236 | |
| | 113,305 | | | Berkeley Group Holdings plc | | | 5,063,974 | |
SEE NOTES TO FINANCIAL STATEMENTS.
| | | | | | |
| | | |
| 112 | | | | J.P. MORGAN EXCHANGE-TRADED FUNDS | | OCTOBER 31, 2018 |
| | | | | | | | |
| SHARES | | | INVESTMENTS | | VALUE($) | |
| | Common Stocks — continued | |
| | | | United Kingdom — continued | |
| | 672,534 | | | BP plc | | | 4,858,198 | |
| | 693,737 | | | British Land Co. plc (The), REIT | | | 5,239,330 | |
| | 807,566 | | | BT Group plc | | | 2,472,772 | |
| | 37,172 | | | Bunzl plc | | | 1,096,571 | |
| | 140,044 | | | Burberry Group plc | | | 3,240,529 | |
| | 3,299,025 | | | Centrica plc | | | 6,196,511 | |
| | 660,104 | | | ConvaTec Group plc (a) | | | 1,364,421 | |
| | 92,480 | | | Croda International plc | | | 5,696,359 | |
| | 19,799 | | | Derwent London plc, REIT | | | 740,358 | |
| | 175,871 | | | Diageo plc | | | 6,080,127 | |
| | 1,009,518 | | | Direct Line Insurance Group plc | | | 4,242,277 | |
| | 807,971 | | | DS Smith plc | | | 4,054,072 | |
| | 192,905 | | | easyJet plc | | | 2,955,263 | |
| | 311,225 | | | GlaxoSmithKline plc | | | 6,027,732 | |
| | 285,037 | | | Halma plc | | | 4,837,188 | |
| | 755,054 | | | Hammerson plc, REIT | | | 4,215,456 | |
| | 253,148 | | | HSBC Holdings plc | | | 2,083,307 | |
| | 216,959 | | | IMI plc | | | 2,750,707 | |
| | 224,241 | | | Inchcape plc | | | 1,548,761 | |
| | 346,645 | | | Informa plc | | | 3,163,336 | |
| | 881,267 | | | Inmarsat plc | | | 5,124,951 | |
| | 77,067 | | | InterContinental Hotels Group plc | | | 4,043,689 | |
| | 348,509 | | | International Consolidated Airlines Group SA | | | 2,686,826 | |
| | 33,812 | | | Intertek Group plc | | | 2,025,891 | |
| | 599,978 | | | Intu Properties plc, REIT | | | 1,500,755 | |
| | 700,340 | | | J Sainsbury plc | | | 2,782,501 | |
| | 360,096 | | | John Wood Group plc | | | 3,282,004 | |
| | 72,260 | | | Johnson Matthey plc | | | 2,739,647 | |
| | 245,610 | | | Land Securities Group plc, REIT | | | 2,671,771 | |
| | 1,419,517 | | | Legal & General Group plc | | | 4,555,056 | |
| | 792,720 | | | Meggitt plc | | | 5,363,231 | |
| | 75,941 | | | Merlin Entertainments plc (a) | | | 313,621 | |
| | 276,056 | | | Micro Focus International plc | | | 4,279,480 | |
| | 223,950 | | | Mondi plc | | | 5,273,765 | |
| | 579,483 | | | National Grid plc | | | 6,121,685 | |
| | 278,185 | | | Pearson plc | | | 3,195,774 | |
| | 507,897 | | | Pennon Group plc | | | 4,838,514 | |
| | 169,976 | | | Persimmon plc | | | 4,974,710 | |
| | 282,038 | | | RELX plc | | | 5,577,769 | |
| | 1,260,306 | | | Rentokil Initial plc | | | 5,082,351 | |
| | 1,008,927 | | | Royal Mail plc | | | 4,631,912 | |
| | 723,882 | | | Sage Group plc (The) | | | 5,033,087 | |
| | 31,837 | | | Schroders plc | | | 1,089,542 | |
| | 729,677 | | | Segro plc, REIT | | | 5,720,576 | |
| | 94,835 | | | Severn Trent plc | | | 2,253,695 | |
| | | | | | | | |
| SHARES | | | INVESTMENTS | | VALUE($) | |
| | |
| | | | United Kingdom — continued | |
| | 352,044 | | | Smith & Nephew plc | | | 5,722,425 | |
| | 273,351 | | | Smiths Group plc | | | 4,872,626 | |
| | 352,300 | | | SSE plc | | | 5,134,922 | |
| | 582,492 | | | Tate & Lyle plc | | | 5,008,312 | |
| | 1,349,482 | | | Taylor Wimpey plc | | | 2,778,621 | |
| | 207,819 | | | United Utilities Group plc | | | 1,925,796 | |
| | 2,526,589 | | | Vodafone Group plc | | | 4,751,346 | |
| | 34,709 | | | Whitbread plc | | | 1,951,603 | |
| | 1,543,365 | | | Wm Morrison Supermarkets plc | | | 4,889,675 | |
| | | | | | | | |
| | | | | | | 237,018,895 | |
| | | | | | | | |
| | | | United States — 0.9% | |
| | 99,508 | | | Carnival plc | | | 5,423,734 | |
| | 18,271 | | | Ferguson plc | | | 1,231,822 | |
| | 107,340 | | | Shire plc | | | 6,478,070 | |
| | | | | | | | |
| | | | | | | 13,133,626 | |
| | | | | | | | |
| | | | Total Common Stocks
(Cost $1,469,940,739) | | | 1,430,666,878 | |
| | | | | | | | |
NO. OF
RIGHTS | | | | | | |
| | Rights — 0.0% (b) | |
| | | | Australia — 0.0% (b) | | | | |
| | 45,676 | | | WorleyParsons Ltd., expiring 11/7/2018 (Strike Price $1.00)*
(Cost $—) | | | — | (c) |
| | | | | | | | |
| | |
| SHARES | | | | | | |
| | Short-Term Investments — 0.5% | |
| | | | Investment Companies — 0.5% | | | | |
| | 6,618,219 | | | JPMorgan U.S. Government Money Market Fund Class Institutional Shares,
2.02% (d) (e)
(Cost $6,618,219) | | | 6,618,219 | |
| | | | | | | | |
| | | | Total Investments — 99.5%
(Cost 1,476,558,958) | | | 1,437,285,097 | |
| | | | Other Assets Less Liabilities — 0.5% | | | 7,047,164 | |
| | | | | | | | |
| | | | NET ASSETS — 100.0% | | | 1,444,332,261 | |
| | | | | | | | |
Percentages indicated are based on net assets.
Abbreviations
| | |
| OYJ | | — Public Limited Company |
| REIT | | — Real Estate Investment Trust |
| SCA | | — Limited partnership with share capital |
SEE NOTES TO FINANCIAL STATEMENTS.
| | | | | | | | |
| | | |
| OCTOBER 31, 2018 | | J.P. MORGAN EXCHANGE-TRADED FUNDS | | | | | 113 | |
JPMorgan Diversified Return International Equity ETF
SCHEDULE OF PORTFOLIO INVESTMENTS
AS OF OCTOBER 31, 2018 (continued)
| | |
| (a) | | — Security exempt from registration pursuant to Regulation S under the Securities Act of 1933, as amended. Regulation S applies to securities offerings that are made outside of the United States and do not involve direct selling efforts in the United States and as such may have restrictions on resale. |
| (b) | | — Amount rounds to less than 0.1% of net assets. |
| (c) | | — Amount rounds to less than 1. |
| (d) | | — Investment in affiliate. Fund is registered under the Investment Company Act of 1940, as amended, and advised by J.P. Morgan Investment Management Inc. |
| (e) | | — The rate shown is the current yield as of October 31, 2018. |
| * | | — Non-income producing security. |
Summary of Investments by Industry, October 31, 2018
The following table represents the portfolio investments of the Fund by industry classifications as a percentage of total investments:
| | | | |
| INDUSTRY | | PERCENTAGE | |
Oil, Gas & Consumable Fuels | | | 7.3 | % |
Diversified Telecommunication Services | | | 5.1 | |
Electric Utilities | | | 5.0 | |
Chemicals | | | 5.0 | |
Pharmaceuticals | | | 3.9 | |
Food Products | | | 3.8 | |
Equity Real Estate Investment Trusts (REITs) | | | 3.8 | |
Metals & Mining | | | 3.3 | |
Household Durables | | | 2.7 | |
Insurance | | | 2.7 | |
Health Care Equipment & Supplies | | | 2.5 | |
Food & Staples Retailing | | | 2.4 | |
Industrial Conglomerates | | | 2.4 | |
Health Care Providers & Services | | | 2.4 | |
Construction & Engineering | | | 2.3 | |
Hotels, Restaurants & Leisure | | | 2.3 | |
Beverages | | | 2.2 | |
Wireless Telecommunication Services | | | 2.0 | |
Banks | | | 1.8 | |
Gas Utilities | | | 1.8 | |
Road & Rail | | | 1.8 | |
Airlines | | | 1.7 | |
IT Services | | | 1.7 | |
Media | | | 1.6 | |
Software | | | 1.6 | |
Auto Components | | | 1.5 | |
Trading Companies & Distributors | | | 1.5 | |
Electronic Equipment, Instruments & Components | | | 1.5 | |
Commercial Services & Supplies | | | 1.4 | |
Entertainment | | | 1.2 | |
Multi-Utilities | | | 1.2 | |
Semiconductors & Semiconductor Equipment | | | 1.2 | |
Specialty Retail | | | 1.2 | |
Technology Hardware, Storage & Peripherals | | | 1.2 | |
Real Estate Management & Development | | | 1.1 | |
Paper & Forest Products | | | 1.0 | |
Aerospace & Defense | | | 1.0 | |
Others (each less than 1.0%) | | | 11.9 | |
SEE NOTES TO FINANCIAL STATEMENTS.
| | | | | | |
| | | |
| 114 | | | | J.P. MORGAN EXCHANGE-TRADED FUNDS | | OCTOBER 31, 2018 |
| | | | | | | | | | | | | | | | | | | | |
| Futures contracts outstanding as of October 31, 2018: | | | | | | | |
| DESCRIPTION | | NUMBER OF
CONTRACTS | | | EXPIRATION
DATE | | | TRADING
CURRENCY | | | NOTIONAL
AMOUNT ($) | | | VALUE AND
UNREALIZED
APPRECIATION
(DEPRECIATION) ($) | |
Long Contracts | | | | | | | | | | | | | | | | | | | | |
MSCI EAFE E-Mini Index | | | 118 | | | | 12/2018 | | | | USD | | | | 10,697,290 | | | | (86,079 | ) |
| | | | | | | | | | | | | | | | | | | | |
| | | | | | | | | | | | | | | | | | | (86,079 | ) |
| | | | | | | | | | | | | | | | | | | | |
Abbreviations
| | |
| EAFE | | — Europe, Australasia, and Far East |
| MSCI | | — Morgan Stanley Capital International |
| USD | | — United States Dollar |
SEE NOTES TO FINANCIAL STATEMENTS.
| | | | | | | | |
| | | |
| OCTOBER 31, 2018 | | J.P. MORGAN EXCHANGE-TRADED FUNDS | | | | | 115 | |
JPMorgan Diversified Return U.S. Equity ETF
SCHEDULE OF PORTFOLIO INVESTMENTS
AS OF OCTOBER 31, 2018
| | | | | | | | |
| SHARES | | | INVESTMENTS | | VALUE($) | |
| | Common Stocks — 98.7% | | | | |
| | | | Aerospace & Defense — 2.1% | |
| | 4,887 | | | Boeing Co. (The) | | | 1,734,201 | |
| | 7,468 | | | Curtiss-Wright Corp. | | | 817,447 | |
| | 5,233 | | | General Dynamics Corp. | | | 903,111 | |
| | 14,734 | | | Harris Corp. | | | 2,191,093 | |
| | 4,260 | | | L3 Technologies, Inc. | | | 807,142 | |
| | 3,265 | | | Lockheed Martin Corp. | | | 959,420 | |
| | 2,794 | | | Northrop Grumman Corp. | | | 731,888 | |
| | 8,176 | | | Raytheon Co. | | | 1,431,127 | |
| | 5,638 | | | Rockwell Collins, Inc. | | | 721,777 | |
| | 10,390 | | | Textron, Inc. | | | 557,216 | |
| | 6,750 | | | United Technologies Corp. | | | 838,418 | |
| | | | | | | | |
| | | | | | | 11,692,840 | |
| | | | | | | | |
| | | | Air Freight & Logistics — 0.3% | |
| | 9,800 | | | CH Robinson Worldwide, Inc. | | | 872,494 | |
| | 3,427 | | | FedEx Corp. | | | 755,105 | |
| | | | | | | | |
| | | | | | | 1,627,599 | |
| | | | | | | | |
| | | | Airlines — 0.3% | |
| | 2,573 | | | Alaska Air Group, Inc. | | | 158,034 | |
| | 12,992 | | | Delta Air Lines, Inc. | | | 711,052 | |
| | 6,578 | | | JetBlue Airways Corp.* | | | 110,050 | |
| | 4,381 | | | Southwest Airlines Co. | | | 215,107 | |
| | 2,460 | | | United Continental Holdings, Inc.* | | | 210,354 | |
| | | | | | | | |
| | | | | | | 1,404,597 | |
| | | | | | | | |
| | | | Auto Components — 0.7% | |
| | 16,626 | | | Aptiv plc | | | 1,276,877 | |
| | 49 | | | Delphi Technologies plc | | | 1,050 | |
| | 819 | | | Garrett Motion, Inc. (Switzerland)* | | | 12,424 | |
| | 84,478 | | | Gentex Corp. | | | 1,778,262 | |
| | 8,261 | | | Lear Corp. | | | 1,097,887 | |
| | | | | | | | |
| | | | | | | 4,166,500 | |
| | | | | | | | |
| | | | Automobiles — 0.6% | |
| | 157,409 | | | Ford Motor Co. | | | 1,503,256 | |
| | 25,187 | | | General Motors Co. | | | 921,592 | |
| | 25,618 | | | Harley-Davidson, Inc. | | | 979,120 | |
| | | | | | | | |
| | | | | | | 3,403,968 | |
| | | | | | | | |
| | | | Banks — 2.9% | |
| | 19,604 | | | Bank of America Corp. | | | 539,110 | |
| | 6,561 | | | Bank of Hawaii Corp. | | | 514,645 | |
| | 32,608 | | | BB&T Corp. | | | 1,603,009 | |
| | 9,291 | | | Citigroup, Inc. | | | 608,189 | |
| | 10,356 | | | Citizens Financial Group, Inc. | | | 386,797 | |
| | 5,896 | | | Comerica, Inc. | | | 480,878 | |
| | 2,848 | | | Cullen/Frost Bankers, Inc. | | | 278,876 | |
| | | | | | | | |
| SHARES | | | INVESTMENTS | | VALUE($) | |
| | | | | | | | |
| | | | Banks — continued | |
| | 55,938 | | | Fifth Third Bancorp | | | 1,509,767 | |
| | 147,692 | | | Huntington Bancshares, Inc. | | | 2,116,426 | |
| | 22,566 | | | KeyCorp | | | 409,799 | |
| | 3,150 | | | M&T Bank Corp. | | | 521,042 | |
| | 38,426 | | | People’s United Financial, Inc. | | | 601,751 | |
| | 5,272 | | | PNC Financial Services Group, Inc. (The) | | | 677,399 | |
| | 1,206 | | | Popular, Inc. (Puerto Rico) | | | 62,724 | |
| | 25,517 | | | Regions Financial Corp. | | | 433,023 | |
| | 32,546 | | | SunTrust Banks, Inc. | | | 2,039,332 | |
| | 1,295 | | | SVB Financial Group* | | | 307,213 | |
| | 3,098 | | | Synovus Financial Corp. | | | 116,361 | |
| | 41,831 | | | TCF Financial Corp. | | | 873,431 | |
| | 29,800 | | | Umpqua Holdings Corp. | | | 572,160 | |
| | 13,220 | | | US Bancorp | | | 691,009 | |
| | 12,354 | | | Wells Fargo & Co. | | | 657,603 | |
| | 8,470 | | | Zions Bancorp N.A. | | | 398,514 | |
| | | | | | | | |
| | | | | | | 16,399,058 | |
| | | | | | | | |
| | | | Beverages — 2.0% | |
| | 37,129 | | | Brown-Forman Corp., Class B | | | 1,720,558 | |
| | 53,240 | | | Coca-Cola Co. (The) | | | 2,549,131 | |
| | 10,226 | | | Constellation Brands, Inc., Class A | | | 2,037,326 | |
| | 44,751 | | | Keurig Dr Pepper, Inc. | | | 1,163,526 | |
| | 12,992 | | | Molson Coors Brewing Co., Class B | | | 831,488 | |
| | 6,390 | | | Monster Beverage Corp.* | | | 337,712 | |
| | 21,414 | | | PepsiCo, Inc. | | | 2,406,505 | |
| | | | | | | | |
| | | | | | | 11,046,246 | |
| | | | | | | | |
| | | | Biotechnology — 1.2% | |
| | 12,725 | | | AbbVie, Inc. | | | 990,641 | |
| | 10,085 | | | Amgen, Inc. | | | 1,944,287 | |
| | 3,722 | | | Biogen, Inc.* | | | 1,132,493 | |
| | 21,293 | | | Gilead Sciences, Inc. | | | 1,451,757 | |
| | 8,227 | | | United Therapeutics Corp.* | | | 912,045 | |
| | 578 | | | Vertex Pharmaceuticals, Inc.* | | | 97,948 | |
| | | | | | | | |
| | | | | | | 6,529,171 | |
| | | | | | | | |
| | | | Building Products — 0.1% | |
| | 11,172 | | | Fortune Brands Home & Security, Inc. | | | 500,841 | |
| | | | | | | | |
| | | | Capital Markets — 2.8% | |
| | 3,448 | | | Ameriprise Financial, Inc. | | | 438,724 | |
| | 13,079 | | | Bank of New York Mellon Corp. (The) | | | 619,029 | |
| | 1,165 | | | BlackRock, Inc. | | | 479,304 | |
| | 6,247 | | | Cboe Global Markets, Inc. | | | 704,974 | |
| | 11,035 | | | Charles Schwab Corp. (The) | | | 510,258 | |
| | 10,513 | | | CME Group, Inc. | | | 1,926,402 | |
| | 8,933 | | | E*TRADE Financial Corp. | | | 441,469 | |
SEE NOTES TO FINANCIAL STATEMENTS.
| | | | | | |
| | | |
| 116 | | | | J.P. MORGAN EXCHANGE-TRADED FUNDS | | OCTOBER 31, 2018 |
| | | | | | | | |
| SHARES | | | INVESTMENTS | | VALUE($) | |
| | Common Stocks — continued | | | | |
| | | | Capital Markets — continued | |
| | 4,691 | | | Eaton Vance Corp. | | | 211,330 | |
| | 9,219 | | | FactSet Research Systems, Inc. | | | 2,062,843 | |
| | 2,261 | | | Goldman Sachs Group, Inc. (The) | | | 509,562 | |
| | 10,755 | | | Intercontinental Exchange, Inc. | | | 828,565 | |
| | 2,671 | | | Invesco Ltd. | | | 57,987 | |
| | 2,549 | | | Moody’s Corp. | | | 370,829 | |
| | 8,917 | | | Morgan Stanley | | | 407,150 | |
| | 4,483 | | | Nasdaq, Inc. | | | 388,721 | |
| | 5,887 | | | Northern Trust Corp. | | | 553,790 | |
| | 5,865 | | | Raymond James Financial, Inc. | | | 449,787 | |
| | 4,401 | | | S&P Global, Inc. | | | 802,390 | |
| | 22,470 | | | SEI Investments Co. | | | 1,201,021 | |
| | 5,736 | | | State Street Corp. | | | 394,350 | |
| | 13,740 | | | T. Rowe Price Group, Inc. | | | 1,332,643 | |
| | 13,176 | | | TD Ameritrade Holding Corp. | | | 681,463 | |
| | | | | | | | |
| | | | | | | 15,372,591 | |
| | | | | | | | |
| | | | Chemicals — 5.5% | |
| | 14,396 | | | Air Products & Chemicals, Inc. | | | 2,222,023 | |
| | 26,293 | | | Ashland Global Holdings, Inc. | | | 1,945,156 | |
| | 20,945 | | | Cabot Corp. | | | 1,019,603 | |
| | 20,191 | | | Celanese Corp. | | | 1,957,316 | |
| | 46,084 | | | CF Industries Holdings, Inc. | | | 2,213,415 | |
| | 34,905 | | | Chemours Co. (The) | | | 1,152,214 | |
| | 23,023 | | | DowDuPont, Inc. | | | 1,241,400 | |
| | 23,182 | | | Eastman Chemical Co. | | | 1,816,310 | |
| | 15,916 | | | Ecolab, Inc. | | | 2,437,535 | |
| | 78,520 | | | Huntsman Corp. | | | 1,718,018 | |
| | 4,950 | | | International Flavors & Fragrances, Inc. | | | 716,067 | |
| | 15,133 | | | Linde plc (United Kingdom) | | | 2,504,057 | |
| | 21,227 | | | LyondellBasell Industries NV, Class A | | | 1,894,934 | |
| | 22,738 | | | Mosaic Co. (The) | | | 703,514 | |
| | 41,257 | | | Olin Corp. | | | 833,391 | |
| | 16,953 | | | PPG Industries, Inc. | | | 1,781,591 | |
| | 16,324 | | | RPM International, Inc. | | | 998,539 | |
| | 12,730 | | | Scotts Miracle-Gro Co. (The) | | | 849,600 | |
| | 2,685 | | | Sherwin-Williams Co. (The) | | | 1,056,467 | |
| | 10,468 | | | Westlake Chemical Corp. | | | 746,368 | |
| | 17,779 | | | WR Grace & Co. | | | 1,151,901 | |
| | | | | | | | |
| | | | | | | 30,959,419 | |
| | | | | | | | |
| | | | Commercial Services & Supplies — 1.0% | |
| | 11,222 | | | Cintas Corp. | | | 2,040,945 | |
| | 25,664 | | | Republic Services, Inc. | | | 1,865,260 | |
| | 20,694 | | | Waste Management, Inc. | | | 1,851,492 | |
| | | | | | | | |
| | | | | | | 5,757,697 | |
| | | | | | | | |
| | | | | | | | |
| SHARES | | | INVESTMENTS | | VALUE($) | |
| | | | | | | | |
| | | | Communications Equipment — 1.1% | |
| | 2,315 | | | Arista Networks, Inc.* | | | 533,260 | |
| | 37,690 | | | Cisco Systems, Inc. | | | 1,724,318 | |
| | 7,119 | | | F5 Networks, Inc.* | | | 1,247,818 | |
| | 37,358 | | | Juniper Networks, Inc. | | | 1,093,469 | |
| | 12,148 | | | Motorola Solutions, Inc. | | | 1,488,859 | |
| | | | | | | | |
| | | | | | | 6,087,724 | |
| | | | | | | | |
| | | | Construction & Engineering — 0.0% (a) | |
| | 2,438 | | | Fluor Corp. | | | 106,931 | |
| | | | | | | | |
| | | | Consumer Finance — 1.1% | |
| | 66,665 | | | Ally Financial, Inc. | | | 1,693,958 | |
| | 6,954 | | | American Express Co. | | | 714,384 | |
| | 7,088 | | | Capital One Financial Corp. | | | 632,958 | |
| | 11,025 | | | Discover Financial Services | | | 768,112 | |
| | 64,598 | | | Santander Consumer USA Holdings, Inc. | | | 1,211,212 | |
| | 51,997 | | | SLM Corp.* | | | 527,250 | |
| | 12,270 | | | Synchrony Financial | | | 354,358 | |
| | | | | | | | |
| | | | | | | 5,902,232 | |
| | | | | | | | |
| | | | Containers & Packaging — 0.5% | |
| | 14,801 | | | Avery Dennison Corp. | | | 1,342,747 | |
| | 1,203 | | | Ball Corp. | | | 53,894 | |
| | 9,839 | | | Bemis Co., Inc. | | | 450,331 | |
| | 15,654 | | | International Paper Co. | | | 710,066 | |
| | | | | | | | |
| | | | | | | 2,557,038 | |
| | | | | | | | |
| | | | Distributors — 0.4% | |
| | 23,981 | | | Genuine Parts Co. | | | 2,348,220 | |
| | | | | | | | |
| | | | Diversified Consumer Services — 0. 0% (a) | |
| | 73 | | | Graham Holdings Co., Class B | | | 42,417 | |
| | 5,387 | | | H&R Block, Inc. | | | 142,971 | |
| | | | | | | | |
| | | | | | | 185,388 | |
| | | | | | | | |
| | | | Diversified Financial Services — 0.2% | |
| | 5,838 | | | Berkshire Hathaway, Inc., Class B* | | | 1,198,425 | |
| | | | | | | | |
| | | | Diversified Telecommunication Services — 1.5% | |
| | 70,970 | | | AT&T, Inc. | | | 2,177,360 | |
| | 93,873 | | | CenturyLink, Inc. | | | 1,937,539 | |
| | 44,147 | | | Verizon Communications, Inc. | | | 2,520,352 | |
| | 51,812 | | | Zayo Group Holdings, Inc.* | | | 1,548,142 | |
| | | | | | | | |
| | | | | | | 8,183,393 | |
| | | | | | | | |
| | | | Electric Utilities — 5.6% | |
| | 29,847 | | | Alliant Energy Corp. | | | 1,282,824 | |
| | 33,389 | | | American Electric Power Co., Inc. | | | 2,449,417 | |
| | 16,342 | | | Avangrid, Inc. | | | 768,238 | |
| | 29,490 | | | Duke Energy Corp. | | | 2,436,759 | |
SEE NOTES TO FINANCIAL STATEMENTS.
| | | | | | | | |
| | | |
| OCTOBER 31, 2018 | | J.P. MORGAN EXCHANGE-TRADED FUNDS | | | | | 117 | |
JPMorgan Diversified Return U.S. Equity ETF
SCHEDULE OF PORTFOLIO INVESTMENTS
AS OF OCTOBER 31, 2018 (continued)
| | | | | | | | |
| SHARES | | | INVESTMENTS | | VALUE($) | |
| | Common Stocks — continued | | | | |
| | | | Electric Utilities — continued | |
| | 14,411 | | | Edison International | | | 999,979 | |
| | 28,179 | | | Entergy Corp. | | | 2,365,627 | |
| | 41,966 | | | Evergy, Inc. | | | 2,349,676 | |
| | 38,356 | | | Eversource Energy | | | 2,426,401 | |
| | 54,799 | | | Exelon Corp. | | | 2,400,744 | |
| | 26,030 | | | FirstEnergy Corp. | | | 970,398 | |
| | 14,074 | | | NextEra Energy, Inc. | | | 2,427,765 | |
| | 41,152 | | | PG&E Corp.* | | | 1,926,325 | |
| | 28,636 | | | Pinnacle West Capital Corp. | | | 2,355,311 | |
| | 80,519 | | | PPL Corp. | | | 2,447,778 | |
| | 30,753 | | | Southern Co. (The) | | | 1,384,808 | |
| | 49,839 | | | Xcel Energy, Inc. | | | 2,442,609 | |
| | | | | | | | |
| | | | | | | 31,434,659 | |
| | | | | | | | |
| | | | Electrical Equipment — 0.6% | |
| | 10,875 | | | AMETEK, Inc. | | | 729,495 | |
| | 11,548 | | | Eaton Corp. plc | | | 827,645 | |
| | 8,656 | | | Emerson Electric Co. | | | 587,569 | |
| | 5,287 | | | Hubbell, Inc. | | | 537,688 | |
| | 5,619 | | | Rockwell Automation, Inc. | | | 925,618 | |
| | | | | | | | |
| | | | | | | 3,608,015 | |
| | | | | | | | |
| | | | Electronic Equipment, Instruments & Components — 0.4% | |
| | 13,245 | | | Amphenol Corp., Class A | | | 1,185,428 | |
| | 21,861 | | | FLIR Systems, Inc. | | | 1,012,383 | |
| | 1,367 | | | Resideo Technologies, Inc.* | | | 28,768 | |
| | | | | | | | |
| | | | | | | 2,226,579 | |
| | | | | | | | |
| | | | Energy Equipment & Services — 0.7% | |
| | 4,806 | | | Apergy Corp.* | | | 187,386 | |
| | 27,386 | | | Helmerich & Payne, Inc. | | | 1,705,874 | |
| | 23,606 | | | Nabors Industries Ltd. | | | 117,322 | |
| | 14,960 | | | National Oilwell Varco, Inc. | | | 550,528 | |
| | 8,020 | | | Patterson-UTI Energy, Inc. | | | 133,453 | |
| | 19,875 | | | Schlumberger Ltd. | | | 1,019,786 | |
| | | | | | | | |
| | | | | | | 3,714,349 | |
| | | | | | | | |
| | | | Entertainment — 1.5% | |
| | 18,109 | | | Activision Blizzard, Inc. | | | 1,250,426 | |
| | 11,015 | | | Electronic Arts, Inc.* | | | 1,002,145 | |
| | 2,541 | | | Netflix, Inc.* | | | 766,823 | |
| | 8,619 | | | Take-Two Interactive Software, Inc.* | | | 1,110,730 | |
| | 34,808 | | | Twenty-First Century Fox, Inc., Class A | | | 1,584,460 | |
| | 25,922 | | | Viacom, Inc., Class B | | | 828,986 | |
| | 18,182 | | | Walt Disney Co. (The) | | | 2,087,839 | |
| | | | | | | | |
| | | | | | | 8,631,409 | |
| | | | | | | | |
| | | | | | | | |
| SHARES | | | INVESTMENTS | | VALUE($) | |
| | | | | | | | |
| | | | Equity Real Estate Investment Trusts (REITs) — 2.1% | |
| | 5,499 | | | Alexandria Real Estate Equities, Inc. | | | 672,143 | |
| | 5,495 | | | American Tower Corp. | | | 856,176 | |
| | 4,759 | | | AvalonBay Communities, Inc. | | | 834,633 | |
| | 669 | | | Boston Properties, Inc. | | | 80,788 | |
| | 1,159 | | | Camden Property Trust | | | 104,623 | |
| | 5,817 | | | Crown Castle International Corp. | | | 632,541 | |
| | 4,506 | | | Digital Realty Trust, Inc. | | | 465,290 | |
| | 2,978 | | | Duke Realty Corp. | | | 82,104 | |
| | 12,054 | | | Equity Residential | | | 783,028 | |
| | 808 | | | Federal Realty Investment Trust | | | 100,232 | |
| | 24,148 | | | Host Hotels & Resorts, Inc. | | | 461,468 | |
| | 5,088 | | | Iron Mountain, Inc. | | | 155,744 | |
| | 922 | | | Liberty Property Trust | | | 38,604 | |
| | 37,335 | | | Medical Properties Trust, Inc. | | | 554,798 | |
| | 71,573 | | | Park Hotels & Resorts, Inc. | | | 2,080,627 | |
| | 9,396 | | | Prologis, Inc. | | | 605,760 | |
| | 30,332 | | | Rayonier, Inc. | | | 916,026 | |
| | 7,708 | | | Senior Housing Properties Trust | | | 123,868 | |
| | 3,618 | | | Simon Property Group, Inc. | | | 663,975 | |
| | 28,933 | | | STORE Capital Corp. | | | 839,925 | |
| | 1,158 | | | Taubman Centers, Inc. | | | 63,702 | |
| | 2,238 | | | Vornado Realty Trust | | | 152,363 | |
| | 7,342 | | | Weingarten Realty Investors | | | 206,457 | |
| | 12,743 | | | Weyerhaeuser Co. | | | 339,346 | |
| | | | | | | | |
| | | | | | | 11,814,221 | |
| | | | | | | | |
| | | | Food & Staples Retailing — 1.4% | | | | |
| | 7,378 | | | Costco Wholesale Corp. | | | 1,686,832 | |
| | 20,316 | | | Kroger Co. (The) | | | 604,604 | |
| | 27,356 | | | Sysco Corp. | | | 1,951,303 | |
| | 19,645 | | | Walgreens Boots Alliance, Inc. | | | 1,567,082 | |
| | 19,650 | | | Walmart, Inc. | | | 1,970,502 | |
| | | | | | | | |
| | | | | | | 7,780,323 | |
| | | | | | | | |
| | | | Food Products — 3.0% | | | | |
| | 43,225 | | | Archer-Daniels-Midland Co. | | | 2,042,381 | |
| | 55,295 | | | Conagra Brands, Inc. | | | 1,968,502 | |
| | 33,540 | | | General Mills, Inc. | | | 1,469,052 | |
| | 22,453 | | | Hershey Co. (The) | | | 2,405,839 | |
| | 60,812 | | | Hormel Foods Corp. (b) | | | 2,653,836 | |
| | 3,733 | | | JM Smucker Co. (The) | | | 404,359 | |
| | 26,767 | | | Kellogg Co. | | | 1,752,703 | |
| | 3,407 | | | Lamb Weston Holdings, Inc. | | | 266,291 | |
SEE NOTES TO FINANCIAL STATEMENTS.
| | | | | | |
| | | |
| 118 | | | | J.P. MORGAN EXCHANGE-TRADED FUNDS | | OCTOBER 31, 2018 |
| | | | | | | | |
| SHARES | | | INVESTMENTS | | VALUE($) | |
| | Common Stocks — continued | | | | |
| | | | Food Products — continued | | | | |
| | 19,175 | | | McCormick & Co., Inc. (Non-Voting) | | | 2,761,200 | |
| | 14,500 | | | Tyson Foods, Inc., Class A | | | 868,840 | |
| | | | | | | | |
| | | | | | | 16,593,003 | |
| | | | | | | | |
| | | | Gas Utilities — 0.4% | | | | |
| | 9,560 | | | Atmos Energy Corp. | | | 889,845 | |
| | 7,282 | | | National Fuel Gas Co. | | | 395,340 | |
| | 17,186 | | | UGI Corp. | | | 911,889 | |
| | | | | | | | |
| | | | | | | 2,197,074 | |
| | | | | | | | |
| | | | Health Care Equipment & Supplies — 4.2% | | | | |
| | 35,865 | | | Abbott Laboratories | | | 2,472,533 | |
| | 4,833 | | | Align Technology, Inc.* | | | 1,069,060 | |
| | 31,887 | | | Baxter International, Inc. | | | 1,993,256 | |
| | 9,148 | | | Becton Dickinson and Co. | | | 2,108,614 | |
| | 11,535 | | | Danaher Corp. | | | 1,146,579 | |
| | 8,141 | | | Edwards Lifesciences Corp.* | | | 1,201,612 | |
| | 22,413 | | | Hill-Rom Holdings, Inc. | | | 1,884,485 | |
| | 7,486 | | | IDEXX Laboratories, Inc.* | | | 1,587,930 | |
| | 3,590 | | | Intuitive Surgical, Inc.* | | | 1,871,036 | |
| | 24,201 | | | Medtronic plc | | | 2,173,734 | |
| | 13,117 | | | Stryker Corp. | | | 2,127,840 | |
| | 19,342 | | | Varian Medical Systems, Inc.* | | | 2,308,855 | |
| | 14,075 | | | Zimmer Biomet Holdings, Inc. | | | 1,598,779 | |
| | | | | | | | |
| | | | | | | 23,544,313 | |
| | | | | | | | |
| | | | Health Care Providers & Services — 4.5% | | | | |
| | 9,389 | | | Aetna, Inc. | | | 1,862,778 | |
| | 11,990 | | | AmerisourceBergen Corp. | | | 1,055,120 | |
| | 7,698 | | | Anthem, Inc. | | | 2,121,338 | |
| | 11,839 | | | Centene Corp.* | | | 1,542,859 | |
| | 10,602 | | | Cigna Corp. | | | 2,266,814 | |
| | 13,862 | | | CVS Health Corp. | | | 1,003,470 | |
| | 6,956 | | | DaVita, Inc.* | | | 468,417 | |
| | 17,818 | | | Express Scripts Holding Co.* | | | 1,727,812 | |
| | 14,504 | | | HCA Healthcare, Inc. | | | 1,936,719 | |
| | 6,274 | | | Humana, Inc. | | | 2,010,252 | |
| | 12,626 | | | Laboratory Corp. of America Holdings* | | | 2,027,104 | |
| | 5,474 | | | McKesson Corp. | | | 682,936 | |
| | 21,401 | | | Quest Diagnostics, Inc. | | | 2,014,048 | |
| | 8,944 | | | UnitedHealth Group, Inc. | | | 2,337,514 | |
| | 18,396 | | | Universal Health Services, Inc., Class B | | | 2,236,218 | |
| | | | | | | | |
| | | | | | | 25,293,399 | |
| | | | | | | | |
| | | | Hotels, Restaurants & Leisure — 2.9% | | | | |
| | 28,339 | | | Carnival Corp. | | | 1,588,118 | |
| | 10,289 | | | Darden Restaurants, Inc. | | | 1,096,293 | |
| | | | | | | | |
| SHARES | | | INVESTMENTS | | VALUE($) | |
| | | | | | | | |
| | | | Hotels, Restaurants & Leisure — continued | |
| | 14,026 | | | Dunkin’ Brands Group, Inc. | | | 1,017,727 | |
| | 18,862 | | | Hilton Worldwide Holdings, Inc. | | | 1,342,409 | |
| | 6,435 | | | International Game Technology plc | | | 119,369 | |
| | 9,556 | | | Las Vegas Sands Corp. | | | 487,643 | |
| | 11,873 | | | Marriott International, Inc., Class A | | | 1,387,835 | |
| | 12,548 | | | McDonald’s Corp. | | | 2,219,741 | |
| | 21,931 | | | MGM Resorts International | | | 585,119 | |
| | 7,391 | | | Royal Caribbean Cruises Ltd. | | | 774,059 | |
| | 36,060 | | | Starbucks Corp. | | | 2,101,216 | |
| | 24,071 | | | Wyndham Destinations, Inc. | | | 863,667 | |
| | 12,291 | | | Yum China Holdings, Inc. (China) | | | 443,459 | |
| | 23,881 | | | Yum! Brands, Inc. | | | 2,159,081 | |
| | | | | | | | |
| | | | | | | 16,185,736 | |
| | | | | | | | |
| | | | Household Durables — 1.5% | | | | |
| | 30,169 | | | DR Horton, Inc. | | | 1,084,877 | |
| | 26,353 | | | Garmin Ltd. | | | 1,743,515 | |
| | 40,937 | | | Leggett & Platt, Inc. | | | 1,486,422 | |
| | 17,886 | | | Lennar Corp., Class A | | | 768,740 | |
| | 761 | | | NVR, Inc.* | | | 1,703,902 | |
| | 64,249 | | | PulteGroup, Inc. | | | 1,578,598 | |
| | | | | | | | |
| | | | | | | 8,366,054 | |
| | | | | | | | |
| | | | Household Products — 1.9% | | | | |
| | 42,320 | | | Church & Dwight Co., Inc. | | | 2,512,538 | |
| | 16,515 | | | Clorox Co. (The) | | | 2,451,652 | |
| | 15,514 | | | Energizer Holdings, Inc. | | | 911,758 | |
| | 20,730 | | | Kimberly-Clark Corp. | | | 2,162,139 | |
| | 28,931 | | | Procter & Gamble Co. (The) | | | 2,565,601 | |
| | | | | | | | |
| | | | | | | 10,603,688 | |
| | | | | | | | |
| | | | Independent Power and Renewable Electricity Producers — 1.3% | |
| | 177,867 | | | AES Corp. | | | 2,593,301 | |
| | 67,650 | | | NRG Energy, Inc. | | | 2,448,253 | |
| | 101,703 | | | Vistra Energy Corp.* | | | 2,301,539 | |
| | | | | | | | |
| | | | | | | 7,343,093 | |
| | | | | | | | |
| | | | Industrial Conglomerates — 0.6% | | | | |
| | 3,926 | | | 3M Co. | | | 746,961 | |
| | 8,200 | | | Honeywell International, Inc. | | | 1,187,524 | |
| | 4,208 | | | Roper Technologies, Inc. | | | 1,190,443 | |
| | | | | | | | |
| | | | | | | 3,124,928 | |
| | | | | | | | |
| | | | Insurance — 2.9% | | | | |
| | 37,982 | | | Aflac, Inc. | | | 1,635,885 | |
| | 7,559 | | | Allstate Corp. (The) | | | 723,547 | |
| | 3,970 | | | American Financial Group, Inc. | | | 397,119 | |
SEE NOTES TO FINANCIAL STATEMENTS.
| | | | | | | | |
| | | |
| OCTOBER 31, 2018 | | J.P. MORGAN EXCHANGE-TRADED FUNDS | | | | | 119 | |
JPMorgan Diversified Return U.S. Equity ETF
SCHEDULE OF PORTFOLIO INVESTMENTS
AS OF OCTOBER 31, 2018 (continued)
| | | | | | | | |
| SHARES | | | INVESTMENTS | | VALUE($) | |
| | Common Stocks — continued | | | | |
| | | | Insurance — continued | | | | |
| | 8,192 | | | Aon plc | | | 1,279,427 | |
| | 8,100 | | | Assurant, Inc. | | | 787,401 | |
| | 6,241 | | | Chubb Ltd. | | | 779,563 | |
| | 12,979 | | | Cincinnati Financial Corp. | | | 1,020,669 | |
| | 14,000 | | | Fidelity National Financial, Inc. | | | 468,300 | |
| | 4,321 | | | Hanover Insurance Group, Inc. (The) | | | 481,273 | |
| | 5,036 | | | Lincoln National Corp. | | | 303,117 | |
| | 11,995 | | | Marsh & McLennan Cos., Inc. | | | 1,016,576 | |
| | 488 | | | Mercury General Corp. | | | 28,943 | |
| | 8,081 | | | MetLife, Inc. | | | 332,856 | |
| | 25,950 | | | Old Republic International Corp. | | | 572,198 | |
| | 10,112 | | | Principal Financial Group, Inc. | | | 475,972 | |
| | 27,566 | | | Progressive Corp. (The) | | | 1,921,350 | |
| | 4,373 | | | Prudential Financial, Inc. | | | 410,100 | |
| | 3,066 | | | Reinsurance Group of America, Inc. | | | 436,506 | |
| | 15,344 | | | Torchmark Corp. | | | 1,299,023 | |
| | 5,855 | | | Travelers Cos., Inc. (The) | | | 732,636 | |
| | 11,241 | | | WR Berkley Corp. | | | 853,192 | |
| | | | | | | | |
| | | | | | | 15,955,653 | |
| | | | | | | | |
| | | | Interactive Media & Services — 0.9% | | | | |
| | 1,207 | | | Alphabet, Inc., Class A* | | | 1,316,330 | |
| | 6,841 | | | Facebook, Inc., Class A* | | | 1,038,395 | |
| | 12,142 | | | IAC/InterActiveCorp* | | | 2,386,996 | |
| | | | | | | | |
| | | | | | | 4,741,721 | |
| | | | | | | | |
| | | | Internet & Direct Marketing Retail — 0.5% | | | | |
| | 818 | | | Amazon.com, Inc.* | | | 1,307,172 | |
| | 525 | | | Booking Holdings, Inc.* | | | 984,154 | |
| | 23,953 | | | eBay, Inc.* | | | 695,356 | |
| | | | | | | | |
| | | | | | | 2,986,682 | |
| | | | | | | | |
| | | | IT Services — 3.9% | | | | |
| | 11,016 | | | Accenture plc, Class A | | | 1,736,342 | |
| | 6,316 | | | Automatic Data Processing, Inc. | | | 910,009 | |
| | 14,812 | | | Broadridge Financial Solutions, Inc. | | | 1,732,115 | |
| | 20,228 | | | Cognizant Technology Solutions Corp., Class A | | | 1,396,339 | |
| | 12,032 | | | DXC Technology Co. | | | 876,291 | |
| | 13,989 | | | Fidelity National Information Services, Inc. | | | 1,456,255 | |
| | 13,926 | | | Fiserv, Inc.* | | | 1,104,332 | |
| | 4,828 | | | Global Payments, Inc. | | | 551,503 | |
| | 8,587 | | | International Business Machines Corp. | | | 991,197 | |
| | 20,138 | | | Leidos Holdings, Inc. | | | 1,304,540 | |
| | 5,504 | | | Mastercard, Inc., Class A | | | 1,087,976 | |
| | 15,346 | | | Paychex, Inc. | | | 1,005,010 | |
| | 8,133 | | | PayPal Holdings, Inc.* | | | 684,717 | |
| | | | | | | | |
| SHARES | | | INVESTMENTS | | VALUE($) | |
| | | | | | | | |
| | | | IT Services — continued | | | | |
| | 5,372 | | | Teradata Corp.* | | | 195,541 | |
| | 20,076 | | | Total System Services, Inc. | | | 1,829,927 | |
| | 15,097 | | | VeriSign, Inc.* | | | 2,151,926 | |
| | 7,031 | | | Visa, Inc., Class A | | | 969,223 | |
| | 32,559 | | | Western Union Co. (The) | | | 587,364 | |
| | 11,620 | | | Worldpay, Inc.* | | | 1,067,181 | |
| | | | | | | | |
| | | | | | | 21,637,788 | |
| | | | | | | | |
| | | | Leisure Products — 0.5% | | | | |
| | 24,110 | | | Hasbro, Inc. | | | 2,211,128 | |
| | 6,476 | | | Polaris Industries, Inc. | | | 576,235 | |
| | | | | | | | |
| | | | | | | 2,787,363 | |
| | | | | | | | |
| | | | Life Sciences Tools & Services — 1.5% | | | | |
| | 14,799 | | | Agilent Technologies, Inc. | | | 958,827 | |
| | 4,073 | | | Illumina, Inc.* | | | 1,267,314 | |
| | 17,373 | | | IQVIA Holdings, Inc.* | | | 2,135,663 | |
| | 8,759 | | | Thermo Fisher Scientific, Inc. | | | 2,046,540 | |
| | 11,836 | | | Waters Corp.* | | | 2,245,171 | |
| | | | | | | | |
| | | | | | | 8,653,515 | |
| | | | | | | | |
| | | | Machinery — 1.4% | | | | |
| | 5,202 | | | Caterpillar, Inc. | | | 631,107 | |
| | 1,731 | | | Crane Co. | | | 150,666 | |
| | 4,280 | | | Cummins, Inc. | | | 585,033 | |
| | 9,609 | | | Dover Corp. | | | 796,009 | |
| | 9,929 | | | Fortive Corp. | | | 737,228 | |
| | 5,326 | | | IDEX Corp. | | | 675,443 | |
| | 5,817 | | | Illinois Tool Works, Inc. | | | 742,075 | |
| | 9,255 | | | Ingersoll-Rand plc | | | 887,925 | |
| | 25,800 | | | ITT, Inc. | | | 1,302,900 | |
| | 8,633 | | | PACCAR, Inc. | | | 493,894 | |
| | 4,389 | | | Parker-Hannifin Corp. | | | 665,504 | |
| | 4,190 | | | Terex Corp. | | | 139,904 | |
| | 9,414 | | | Trinity Industries, Inc. | | | 268,770 | |
| | | | | | | | |
| | | | | | | 8,076,458 | |
| | | | | | | | |
| | | | Media — 1.2% | | | | |
| | 73 | | | Cable One, Inc. | | | 65,389 | |
| | 11,933 | | | CBS Corp. (Non-Voting), Class B | | | 684,357 | |
| | 37,514 | | | Comcast Corp., Class A | | | 1,430,784 | |
| | 785 | | | DISH Network Corp., Class A* | | | 24,131 | |
| | 46,009 | | | Interpublic Group of Cos., Inc. (The) | | | 1,065,568 | |
| | 6,001 | | | John Wiley & Sons, Inc., Class A | | | 325,494 | |
| | 7,836 | | | Liberty Media Corp.-Liberty SiriusXM, Class A* | | | 323,157 | |
| | 19,480 | | | Omnicom Group, Inc. | | | 1,447,754 | |
SEE NOTES TO FINANCIAL STATEMENTS.
| | | | | | |
| | | |
| 120 | | | | J.P. MORGAN EXCHANGE-TRADED FUNDS | | OCTOBER 31, 2018 |
| | | | | | | | |
| SHARES | | | INVESTMENTS | | VALUE($) | |
| | Common Stocks — continued | | | | |
| | | | Media — continued | | | | |
| | 189,432 | | | Sirius XM Holdings, Inc. (b) | | | 1,140,381 | |
| | | | | | | | |
| | | | | | | 6,507,015 | |
| | | | | | | | |
| | | | Metals & Mining — 2.0% | | | | |
| | 35,573 | | | Alcoa Corp.* | | | 1,244,699 | |
| | 101,231 | | | Freeport-McMoRan, Inc. | | | 1,179,341 | |
| | 43,940 | | | Newmont Mining Corp. | | | 1,358,625 | |
| | 18,621 | | | Nucor Corp. | | | 1,100,873 | |
| | 20,431 | | | Reliance Steel & Aluminum Co. | | | 1,612,414 | |
| | 10,590 | | | Royal Gold, Inc. | | | 811,512 | |
| | 29,756 | | | Southern Copper Corp. (Peru) | | | 1,140,845 | |
| | 39,271 | | | Steel Dynamics, Inc. | | | 1,555,132 | |
| | 46,379 | | | United States Steel Corp. | | | 1,230,435 | |
| | | | | | | | |
| | | | | | | 11,233,876 | |
| | | | | | | | |
| | | | Mortgage Real Estate Investment Trusts (REITs) — 0.3% | |
| | 64,522 | | | Annaly Capital Management, Inc. | | | 636,832 | |
| | 44,332 | | | Chimera Investment Corp. | | | 824,575 | |
| | | | | | | | |
| | | | | | | 1,461,407 | |
| | | | | | | | |
| | | | Multiline Retail — 1.6% | | | | |
| | 15,757 | | | Dollar General Corp. | | | 1,755,015 | |
| | 7,715 | | | Dollar Tree, Inc.* | | | 650,374 | |
| | 30,262 | | | Kohl’s Corp. | | | 2,291,741 | |
| | 53,810 | | | Macy’s, Inc. | | | 1,845,145 | |
| | 9,890 | | | Nordstrom, Inc. | | | 650,465 | |
| | 23,485 | | | Target Corp. | | | 1,964,051 | |
| | | | | | | | |
| | | | | | | 9,156,791 | |
| | | | | | | | |
| | | | Multi-Utilities — 3.9% | | | | |
| | 37,869 | | | Ameren Corp. | | | 2,445,580 | |
| | 86,161 | | | CenterPoint Energy, Inc. | | | 2,327,209 | |
| | 48,629 | | | CMS Energy Corp. | | | 2,408,108 | |
| | 29,721 | | | Consolidated Edison, Inc. | | | 2,258,796 | |
| | 33,847 | | | Dominion Energy, Inc. | | | 2,417,353 | |
| | 21,546 | | | DTE Energy Co. | | | 2,421,770 | |
| | 45,590 | | | NiSource, Inc. | | | 1,156,162 | |
| | 45,733 | | | Public Service Enterprise Group, Inc. | | | 2,443,514 | |
| | 39,749 | | | SCANA Corp. | | | 1,591,948 | |
| | 35,435 | | | WEC Energy Group, Inc. | | | 2,423,754 | |
| | | | | | | | |
| | | | | | | 21,894,194 | |
| | | | | | | | |
| | | | Oil, Gas & Consumable Fuels — 4.3% | | | | |
| | 11,186 | | | Apache Corp. | | | 423,166 | |
| | 28,481 | | | Chesapeake Energy Corp.* (b) | | | 99,968 | |
| | 14,280 | | | Chevron Corp. | | | 1,594,362 | |
| | 13,481 | | | CNX Resources Corp.* | | | 210,978 | |
| | | | | | | | |
| SHARES | | | INVESTMENTS | | VALUE($) | |
| | | | | | | | |
| | | | Oil, Gas & Consumable Fuels — continued | |
| | 24,485 | | | ConocoPhillips | | | 1,711,502 | |
| | 5,955 | | | Continental Resources, Inc.* | | | 313,709 | |
| | 14,078 | | | Devon Energy Corp. | | | 456,127 | |
| | 3,911 | | | Diamondback Energy, Inc. | | | 439,440 | |
| | 25,839 | | | Exxon Mobil Corp. | | | 2,058,852 | |
| | 11,855 | | | Hess Corp. | | | 680,477 | |
| | 27,353 | | | HollyFrontier Corp. | | | 1,844,686 | |
| | 46,961 | | | Kinder Morgan, Inc. | | | 799,276 | |
| | 45,333 | | | Marathon Oil Corp. | | | 860,874 | |
| | 42,156 | | | Marathon Petroleum Corp. | | | 2,969,890 | |
| | 14,987 | | | Murphy Oil Corp. | | | 477,486 | |
| | 22,502 | | | Occidental Petroleum Corp. | | | 1,509,209 | |
| | 26,269 | | | ONEOK, Inc. | | | 1,723,246 | |
| | 36,240 | | | PBF Energy, Inc., Class A | | | 1,516,644 | |
| | 15,356 | | | Phillips 66 | | | 1,578,904 | |
| | 15,618 | | | Targa Resources Corp. | | | 806,982 | |
| | 16,384 | | | Valero Energy Corp. | | | 1,492,419 | |
| | 26,473 | | | Williams Cos., Inc. (The) | | | 644,088 | |
| | | | | | | | |
| | | | | | | 24,212,285 | |
| | | | | | | | |
| | | | Paper & Forest Products — 0.2% | | | | |
| | 29,183 | | | Domtar Corp. | | | 1,351,465 | |
| | | | | | | | |
| | | | Personal Products — 0.6% | | | | |
| | 14,822 | | | Estee Lauder Cos., Inc. (The), Class A | | | 2,037,136 | |
| | 7,302 | | | Herbalife Nutrition Ltd.* | | | 388,904 | |
| | 15,992 | | | Nu Skin Enterprises, Inc., Class A | | | 1,122,958 | |
| | | | | | | | |
| | | | | | | 3,548,998 | |
| | | | | | | | |
| | | | Pharmaceuticals — 2.0% | | | | |
| | 31,897 | | | Bristol-Myers Squibb Co. | | | 1,612,074 | |
| | 22,688 | | | Eli Lilly & Co. | | | 2,460,287 | |
| | 17,847 | | | Johnson & Johnson | | | 2,498,402 | |
| | 57,821 | | | Pfizer, Inc. | | | 2,489,772 | |
| | 23,182 | | | Zoetis, Inc. | | | 2,089,857 | |
| | | | | | | | |
| | | | | | | 11,150,392 | |
| | | | | | | | |
| | | | Professional Services — 0.4% | | | | |
| | 816 | | | Dun & Bradstreet Corp. (The) | | | 116,101 | |
| | 1,087 | | | Nielsen Holdings plc | | | 28,240 | |
| | 26,851 | | | Robert Half International, Inc. | | | 1,625,291 | |
| | 1,961 | | | Verisk Analytics, Inc.* | | | 235,006 | |
| | | | | | | | |
| | | | | | | 2,004,638 | |
| | | | | | | | |
| | | | Real Estate Management & Development — 0.1% | |
| | 6,256 | | | CBRE Group, Inc., Class A* | | | 252,054 | |
| | 437 | | | Jones Lang LaSalle, Inc. | | | 57,798 | |
| | | | | | | | |
| | | | | | | 309,852 | |
| | | | | | | | |
SEE NOTES TO FINANCIAL STATEMENTS.
| | | | | | | | |
| | | |
| OCTOBER 31, 2018 | | J.P. MORGAN EXCHANGE-TRADED FUNDS | | | | | 121 | |
JPMorgan Diversified Return U.S. Equity ETF
SCHEDULE OF PORTFOLIO INVESTMENTS
AS OF OCTOBER 31, 2018 (continued)
| | | | | | | | |
| SHARES | | | INVESTMENTS | | VALUE($) | |
| | Common Stocks — continued | | | | |
| | | | Road & Rail — 0.8% | | | | |
| | 9,089 | | | CSX Corp. | | | 625,868 | |
| | 8,164 | | | JB Hunt Transport Services, Inc. | | | 903,020 | |
| | 3,400 | | | Kansas City Southern | | | 346,664 | |
| | 5,841 | | | Norfolk Southern Corp. | | | 980,295 | |
| | 4,896 | | | Ryder System, Inc. | | | 270,798 | |
| | 7,827 | | | Union Pacific Corp. | | | 1,144,464 | |
| | | | | | | | |
| | | | | | | 4,271,109 | |
| | | | | | | | |
| | | | Semiconductors & Semiconductor Equipment — 2.4% | |
| | 15,069 | | | Analog Devices, Inc. | | | 1,261,426 | |
| | 12,495 | | | Applied Materials, Inc. | | | 410,836 | |
| | 4,297 | | | Broadcom, Inc. | | | 960,337 | |
| | 18,803 | | | Cypress Semiconductor Corp. | | | 243,311 | |
| | 331 | | | First Solar, Inc.* | | | 13,836 | |
| | 24,036 | | | Intel Corp. | | | 1,126,808 | |
| | 10,125 | | | KLA-Tencor Corp. | | | 926,842 | |
| | 4,180 | | | Lam Research Corp. | | | 592,431 | |
| | 31,342 | | | Marvell Technology Group Ltd. | | | 514,322 | |
| | 20,944 | | | Maxim Integrated Products, Inc. | | | 1,047,619 | |
| | 19,604 | | | Micron Technology, Inc.* | | | 739,463 | |
| | 3,944 | | | NVIDIA Corp. | | | 831,513 | |
| | 30,968 | | | ON Semiconductor Corp.* | | | 526,456 | |
| | 7,766 | | | Skyworks Solutions, Inc. | | | 673,778 | |
| | 18,641 | | | Teradyne, Inc. | | | 642,182 | |
| | 11,770 | | | Texas Instruments, Inc. | | | 1,092,609 | |
| | 12,403 | | | Versum Materials, Inc. | | | 391,439 | |
| | 15,321 | | | Xilinx, Inc. | | | 1,307,954 | |
| | | | | | | | |
| | | | | | | 13,303,162 | |
| | | | | | | | |
| | | | Software — 2.6% | | | | |
| | 6,117 | | | Adobe, Inc.* | | | 1,503,314 | |
| | 32,219 | | | CA, Inc. | | | 1,429,235 | |
| | 26,712 | | | Cadence Design Systems, Inc.* | | | 1,190,554 | |
| | 18,546 | | | Citrix Systems, Inc.* | | | 1,900,409 | |
| | 8,537 | | | Dell Technologies, Inc., Class V* | | | 771,659 | |
| | 8,956 | | | Intuit, Inc. | | | 1,889,716 | |
| | 20,658 | | | Microsoft Corp. | | | 2,206,481 | |
| | 23,510 | | | Oracle Corp. | | | 1,148,228 | |
| | 9,420 | | | Red Hat, Inc.* | | | 1,616,849 | |
| | 7,622 | | | VMware, Inc., Class A* | | | 1,077,674 | |
| | | | | | | | |
| | | | | | | 14,734,119 | |
| | | | | | | | |
| | | | Specialty Retail — 2.8% | | | | |
| | 12,793 | | | AutoNation, Inc.* (b) | | | 517,861 | |
| | 10,255 | | | Best Buy Co., Inc. | | | 719,491 | |
| | 1,806 | | | Burlington Stores, Inc.* | | | 309,711 | |
| | 12,892 | | | CarMax, Inc.* | | | 875,496 | |
| | | | | | | | |
| SHARES | | | INVESTMENTS | | VALUE($) | |
| | | | | | | | |
| | | | Specialty Retail — continued | | | | |
| | 10,651 | | | Dick’s Sporting Goods, Inc. | | | 376,726 | |
| | 13,941 | | | Foot Locker, Inc. | | | 657,179 | |
| | 14,543 | | | Gap, Inc. (The) | | | 397,024 | |
| | 11,955 | | | Home Depot, Inc. (The) | | | 2,102,645 | |
| | 16,790 | | | Lowe’s Cos., Inc. | | | 1,598,744 | |
| | 12,624 | | | Ross Stores, Inc. | | | 1,249,776 | |
| | 16,861 | | | Tiffany & Co. | | | 1,876,629 | |
| | 17,617 | | | TJX Cos., Inc. (The) | | | 1,935,756 | |
| | 23,010 | | | Tractor Supply Co. | | | 2,114,389 | |
| | 5,605 | | | Urban Outfitters, Inc.* | | | 221,173 | |
| | 11,238 | | | Williams-Sonoma, Inc. (b) | | | 667,312 | |
| | | | | | | | |
| | | | | | | 15,619,912 | |
| | | | | | | | |
| | | | Technology Hardware, Storage & Peripherals — 0.9% | |
| | 7,408 | | | Apple, Inc. | | | 1,621,315 | |
| | 52,505 | | | Hewlett Packard Enterprise Co. | | | 800,701 | |
| | 63,611 | | | HP, Inc. | | | 1,535,570 | |
| | 12,498 | | | NetApp, Inc. | | | 980,968 | |
| | 3,600 | | | Western Digital Corp. | | | 155,052 | |
| | | | | | | | |
| | | | | | | 5,093,606 | |
| | | | | | | | |
| | | | Textiles, Apparel & Luxury Goods — 1.9% | | | | |
| | 12,622 | | | Carter’s, Inc. | | | 1,211,460 | |
| | 30,474 | | | Hanesbrands, Inc. | | | 522,934 | |
| | 24,729 | | | Michael Kors Holdings Ltd.* | | | 1,370,234 | |
| | 23,386 | | | NIKE, Inc., Class B | | | 1,754,885 | |
| | 8,006 | | | PVH Corp. | | | 967,045 | |
| | 14,781 | | | Ralph Lauren Corp. | | | 1,915,765 | |
| | 24,316 | | | Tapestry, Inc. | | | 1,028,810 | |
| | 19,499 | | | VF Corp. | | | 1,616,077 | |
| | | | | | | | |
| | | | | | | 10,387,210 | |
| | | | | | | | |
| | | | Tobacco — 0.6% | | | | |
| | 29,262 | | | Altria Group, Inc. | | | 1,903,200 | |
| | 18,908 | | | Philip Morris International, Inc. | | | 1,665,228 | |
| | | | | | | | |
| | | | | | | 3,568,428 | |
| | | | | | | | |
| | | | Trading Companies & Distributors — 0.5% | | | | |
| | 13,527 | | | Fastenal Co. | | | 695,423 | |
| | 3,351 | | | United Rentals, Inc.* | | | 402,355 | |
| | 5,534 | | | WW Grainger, Inc. | | | 1,571,490 | |
| | | | | | | | |
| | | | | | | 2,669,268 | |
| | | | | | | | |
| | | | Water Utilities — 0.4% | | | | |
| | 27,357 | | | American Water Works Co., Inc. | | | 2,421,915 | |
| | | | | | | | |
| | | | Wireless Telecommunication Services — 0.7% | |
| | 37,897 | | | Telephone & Data Systems, Inc. | | | 1,168,365 | |
SEE NOTES TO FINANCIAL STATEMENTS.
| | | | | | |
| | | |
| 122 | | | | J.P. MORGAN EXCHANGE-TRADED FUNDS | | OCTOBER 31, 2018 |
| | | | | | | | |
| SHARES | | | INVESTMENTS | | VALUE($) | |
| | Common Stocks — continued | | | | |
| | | | Wireless Telecommunication Services — continued | |
| | 36,260 | | | T-Mobile US, Inc.* | | | 2,485,623 | |
| | 9,130 | | | United States Cellular Corp.* | | | 436,140 | |
| | | | | | | | |
| | | | | | | 4,090,128 | |
| | | | | | | | |
| | | | Total Common Stocks
(Cost $518,479,207) | | | 551,719,671 | |
| | | | | | | | |
| | Short-Term Investments — 1.2% | | | | |
| | | | Investment Companies — 1.2% | |
| | 6,889,863 | | | JPMorgan U.S. Government Money Market Fund Class Institutional Shares,
2.02% (c) (d)
(Cost $6,889,863) | | | 6,889,863 | |
| | | | | | | | |
| | Investment of Cash Collateral from Securities Loaned — 0.8% | |
| | 4,709,887 | | | JPMorgan U.S. Government Money Market Fund Class IM Shares,
2.07% (c) (d)
(Cost $4,709,887) | | | 4,709,887 | |
| | | | | | | | |
| | | | Total Investments — 100.7%
(Cost $530,078,957) | | | 563,319,421 | |
| | | | Liabilities in Excess of
Other Assets — (0.7%) | | | (3,957,092 | ) |
| | | | | | | | |
| | | | NET ASSETS — 100.0% | | | 559,362,329 | |
| | | | | | | | |
NOTES TO SCHEDULE OF PORTFOLIO INVESTMENTS:
| | |
| (a) | | — Amount rounds to less than 0.1% of net assets. |
| (b) | | — The security or a portion of this security is on loan at October 31, 2018. The total value of securities on loan at October 31, 2018 was $4,586,251. |
| (c) | | — Investment in affiliate. Fund is registered under the Investment Company Act of 1940, as amended, and advised by J.P. Morgan Investment Management Inc. |
| (d) | | — The rate shown is the current yield as of October 31, 2018. |
| * | | — Non-income producing security. |
| | | | | | | | | | | | | | | | | | |
| Futures contracts outstanding as of October 31, 2018: | |
| DESCRIPTION | | NUMBER OF
CONTRACTS | | EXPIRATION
DATE | | | TRADING
CURRENCY | | | NOTIONAL
AMOUNT ($) | | | VALUE AND
UNREALIZED
APPRECIATION
(DEPRECIATION) ($) | |
Long Contracts | | | | | | | | | | | | | | | | | | |
| S&P 500 E-Mini Index | | 52 | | | 12/2018 | | | | USD | | | | 7,046,520 | | | | (19,448 | ) |
| | | | | | | | | | | | | | | | | | |
| | | | | | | | | | | | | | | | | (19,448 | ) |
| | | | | | | | | | | | | | | | | | |
Abbreviations
| | |
| USD | | — United States Dollar |
SEE NOTES TO FINANCIAL STATEMENTS.
| | | | | | | | |
| | | |
| OCTOBER 31, 2018 | | J.P. MORGAN EXCHANGE-TRADED FUNDS | | | | | 123 | |
JPMorgan Diversified Return U.S. Mid Cap Equity ETF
SCHEDULE OF PORTFOLIO INVESTMENTS
AS OF OCTOBER 31, 2018
| | | | | | | | |
| SHARES | | | INVESTMENTS | | VALUE($) | |
| | Common Stocks — 96.6% | | | | |
| | | | Aerospace & Defense — 1.2% | | | | |
| | 2,405 | | | Harris Corp. | | | 357,648 | |
| | 3,508 | | | Hexcel Corp. | | | 205,288 | |
| | 594 | | | Huntington Ingalls Industries, Inc. | | | 129,777 | |
| | 873 | | | L3 Technologies, Inc. | | | 165,407 | |
| | 1,313 | | | Rockwell Collins, Inc. | | | 168,090 | |
| | 1,641 | | | Spirit AeroSystems Holdings, Inc., Class A | | | 137,861 | |
| | 2,653 | | | Textron, Inc. | | | 142,280 | |
| | | | | | | | |
| | | | | | | 1,306,351 | |
| | | | | | | | |
| | | | Air Freight & Logistics — 0.3% | | | | |
| | 2,295 | | | CH Robinson Worldwide, Inc. | | | 204,324 | |
| | 2,567 | | | Expeditors International of Washington, Inc. | | | 172,451 | |
| | | | | | | | |
| | | | | | | 376,775 | |
| | | | | | | | |
| | | | Airlines — 0.1% | | | | |
| | 614 | | | Alaska Air Group, Inc. | | | 37,712 | |
| | 930 | | | American Airlines Group, Inc. | | | 32,624 | |
| | 2,027 | | | JetBlue Airways Corp.* | | | 33,912 | |
| | 631 | | | United Continental Holdings, Inc.* | | | 53,957 | |
| | | | | | | | |
| | | | | | | 158,205 | |
| | | | | | | | |
| | | | Auto Components — 1.0% | | | | |
| | 2,750 | | | Aptiv plc | | | 211,200 | |
| | 20,885 | | | Gentex Corp. | | | 439,629 | |
| | 6,437 | | | Goodyear Tire & Rubber Co. (The) | | | 135,563 | |
| | 2,265 | | | Lear Corp. | | | 301,019 | |
| | | | | | | | |
| | | | | | | 1,087,411 | |
| | | | | | | | |
| | | | Automobiles — 0.3% | | | | |
| | 5,421 | | | Harley-Davidson, Inc. | | | 207,190 | |
| | 1,895 | | | Thor Industries, Inc. | | | 131,968 | |
| | | | | | | | |
| | | | | | | 339,158 | |
| | | | | | | | |
| | | | Banks — 3.0% | | | | |
| | 1,755 | | | Associated Banc-Corp. | | | 40,681 | |
| | 1,197 | | | Bank of Hawaii Corp. | | | 93,893 | |
| | 2,030 | | | BankUnited, Inc. | | | 67,193 | |
| | 2,459 | | | CIT Group, Inc. | | | 116,507 | |
| | 2,366 | | | Citizens Financial Group, Inc. | | | 88,370 | |
| | 1,307 | | | Comerica, Inc. | | | 106,599 | |
| | 2,881 | | | Commerce Bancshares, Inc. | | | 183,232 | |
| | 1,039 | | | Cullen/Frost Bankers, Inc. | | | 101,739 | |
| | 1,741 | | | East West Bancorp, Inc. | | | 91,298 | |
| | 4,374 | | | Fifth Third Bancorp | | | 118,054 | |
| | 4,479 | | | First Horizon National Corp. | | | 72,291 | |
| | 645 | | | First Republic Bank | | | 58,689 | |
| | 5,451 | | | FNB Corp. | | | 64,485 | |
| | 30,123 | | | Huntington Bancshares, Inc. | | | 431,663 | |
| | | | | | | | |
| SHARES | | | INVESTMENTS | | VALUE($) | |
| | | | | | | | |
| | | | Banks — continued | | | | |
| | 4,869 | | | KeyCorp | | | 88,421 | |
| | 751 | | | M&T Bank Corp. | | | 124,223 | |
| | 1,523 | | | PacWest Bancorp | | | 61,864 | |
| | 7,672 | | | People’s United Financial, Inc. | | | 120,143 | |
| | 1,732 | | | Popular, Inc. (Puerto Rico) | | | 90,081 | |
| | 980 | | | Prosperity Bancshares, Inc. | | | 63,729 | |
| | 6,678 | | | Regions Financial Corp. | | | 113,326 | |
| | 6,269 | | | SunTrust Banks, Inc. | | | 392,816 | |
| | 379 | | | SVB Financial Group* | | | 89,910 | |
| | 3,256 | | | Synovus Financial Corp. | | | 122,295 | |
| | 9,619 | | | TCF Financial Corp. | | | 200,845 | |
| | 1,654 | | | Webster Financial Corp. | | | 97,321 | |
| | 1,907 | | | Western Alliance Bancorp* | | | 91,994 | |
| | 1,697 | | | Zions Bancorp N.A. | | | 79,844 | |
| | | | | | | | |
| | | | | | | 3,371,506 | |
| | | | | | | | |
| | | | Beverages — 0.9% | | | | |
| | 7,686 | | | Brown-Forman Corp., Class B | | | 356,169 | |
| | 13,633 | | | Keurig Dr Pepper, Inc. | | | 354,458 | |
| | 4,480 | | | Molson Coors Brewing Co., Class B | | | 286,720 | |
| | | | | | | | |
| | | | | | | 997,347 | |
| | | | | | | | |
| | | | Biotechnology — 0.5% | | | | |
| | 3,192 | | | Ionis Pharmaceuticals, Inc.* | | | 158,164 | |
| | 3,297 | | | United Therapeutics Corp.* | | | 365,505 | |
| | | | | | | | |
| | | | | | | 523,669 | |
| | | | | | | | |
| | | | Building Products — 0.5% | | | | |
| | 3,355 | | | AO Smith Corp. | | | 152,753 | |
| | 817 | | | Armstrong World Industries, Inc.* | | | 50,450 | |
| | 2,447 | | | Fortune Brands Home & Security, Inc. | | | 109,699 | |
| | 857 | | | Lennox International, Inc. | | | 180,733 | |
| | 1,023 | | | USG Corp. | | | 43,191 | |
| | | | | | | | |
| | | | | | | 536,826 | |
| | | | | | | | |
| | | | Capital Markets — 2.1% | | | | |
| | 628 | | | Affiliated Managers Group, Inc. | | | 71,378 | |
| | 996 | | | Ameriprise Financial, Inc. | | | 126,731 | |
| | 1,078 | | | Cboe Global Markets, Inc. | | | 121,652 | |
| | 2,619 | | | E*TRADE Financial Corp. | | | 129,431 | |
| | 2,157 | | | Eaton Vance Corp. | | | 97,173 | |
| | 1,708 | | | FactSet Research Systems, Inc. | | | 382,182 | |
| | 7,249 | | | Jefferies Financial Services, Inc. | | | 155,636 | |
| | 1,609 | | | Lazard Ltd., Class A | | | 63,942 | |
| | 1,786 | | | LPL Financial Holdings, Inc. | | | 110,018 | |
| | 1,125 | | | Moody’s Corp. | | | 163,665 | |
| | 563 | | | Morningstar, Inc. | | | 70,262 | |
SEE NOTES TO FINANCIAL STATEMENTS.
| | | | | | |
| | | |
| 124 | | | | J.P. MORGAN EXCHANGE-TRADED FUNDS | | OCTOBER 31, 2018 |
| | | | | | | | |
| SHARES | | | INVESTMENTS | | VALUE($) | |
| | Common Stocks — continued | | | | |
| | | | Capital Markets — continued | | | | |
| | 1,123 | | | MSCI, Inc. | | | 168,877 | |
| | 1,860 | | | Nasdaq, Inc. | | | 161,281 | |
| | 1,700 | | | Northern Trust Corp. | | | 159,919 | |
| | 1,593 | | | Raymond James Financial, Inc. | | | 122,167 | |
| | 3,230 | | | SEI Investments Co. | | | 172,644 | |
| | 1,155 | | | T. Rowe Price Group, Inc. | | | 112,023 | |
| | | | | | | | |
| | | | | | | 2,388,981 | |
| | | | | | | | |
| | | | Chemicals — 4.3% | | | | |
| | 1,795 | | | Albemarle Corp. | | | 178,100 | |
| | 4,523 | | | Ashland Global Holdings, Inc. | | | 334,612 | |
| | 10,856 | | | Axalta Coating Systems Ltd.* | | | 267,926 | |
| | 5,827 | | | Cabot Corp. | | | 283,658 | |
| | 3,150 | | | Celanese Corp. | | | 305,361 | |
| | 9,399 | | | CF Industries Holdings, Inc. | | | 451,434 | |
| | 3,788 | | | Eastman Chemical Co. | | | 296,790 | |
| | 1,997 | | | International Flavors & Fragrances, Inc. | | | 288,886 | |
| | 12,845 | | | Mosaic Co. (The) | | | 397,424 | |
| | 349 | | | NewMarket Corp. | | | 134,700 | |
| | 23,146 | | | Platform Specialty Products Corp.* | | | 250,440 | |
| | 7,114 | | | RPM International, Inc. | | | 435,163 | |
| | 4,119 | | | Scotts Miracle-Gro Co. (The) | | | 274,902 | |
| | 10,305 | | | Valvoline, Inc. | | | 205,276 | |
| | 4,584 | | | Westlake Chemical Corp. | | | 326,839 | |
| | 5,189 | | | WR Grace & Co. | | | 336,195 | |
| | | | | | | | |
| | | | | | | 4,767,706 | |
| | | | | | | | |
| | | | Commercial Services & Supplies — 1.1% | | | | |
| | 1,089 | | | Cintas Corp. | | | 198,056 | |
| | 7,611 | | | Copart, Inc.* | | | 372,254 | |
| | 7,312 | | | KAR Auction Services, Inc. | | | 416,345 | |
| | 3,995 | | | Republic Services, Inc. | | | 290,357 | |
| | | | | | | | |
| | | | | | | 1,277,012 | |
| | | | | | | | |
| | | | Communications Equipment — 1.2% | | | | |
| | 691 | | | Arista Networks, Inc.* | | | 159,172 | |
| | 2,002 | | | F5 Networks, Inc.* | | | 350,911 | |
| | 11,463 | | | Juniper Networks, Inc. | | | 335,522 | |
| | 3,820 | | | Motorola Solutions, Inc. | | | 468,179 | |
| | | | | | | | |
| | | | | | | 1,313,784 | |
| | | | | | | | |
| | | | Construction & Engineering — 0.1% | | | | |
| | 3,085 | | | frontdoor, Inc.* | | | 105,044 | |
| | 579 | | | Jacobs Engineering Group, Inc. | | | 43,477 | |
| | 85 | | | Valmont Industries, Inc. | | | 10,567 | |
| | | | | | | | |
| | | | | | | 159,088 | |
| | | | | | | | |
| | | | | | | | |
| SHARES | | | INVESTMENTS | | VALUE($) | |
| | | | | | | | |
| | | | Consumer Finance — 0.7% | | | | |
| | 4,183 | | | Ally Financial, Inc. | | | 106,290 | |
| | 300 | | | Credit Acceptance Corp.* | | | 127,326 | |
| | 2,193 | | | Discover Financial Services | | | 152,786 | |
| | 4,572 | | | Navient Corp. | | | 52,944 | |
| | 10,772 | | | Santander Consumer USA Holdings, Inc. | | | 201,975 | |
| | 8,304 | | | SLM Corp.* | | | 84,203 | |
| | 2,442 | | | Synchrony Financial | | | 70,525 | |
| | | | | | | | |
| | | | | | | 796,049 | |
| | | | | | | | |
| | | | Containers & Packaging — 1.1% | | | | |
| | 1,850 | | | AptarGroup, Inc. | | | 188,626 | |
| | 3,729 | | | Avery Dennison Corp. | | | 338,295 | |
| | 2,439 | | | Bemis Co., Inc. | | | 111,633 | |
| | 7,202 | | | International Paper Co. | | | 326,683 | |
| | 1,649 | | | Packaging Corp. of America | | | 151,394 | |
| | 1,892 | | | Silgan Holdings, Inc. | | | 45,465 | |
| | 2,148 | | | Sonoco Products Co. | | | 117,238 | |
| | | | | | | | |
| | | | | | | 1,279,334 | |
| | | | | | | | |
| | | | Distributors — 0.6% | | | | |
| | 3,662 | | | Genuine Parts Co. | | | 358,583 | |
| | 210 | | | LKQ Corp.* | | | 5,726 | |
| | 2,249 | | | Pool Corp. | | | 327,792 | |
| | | | | | | | |
| | | | | | | 692,101 | |
| | | | | | | | |
| | | | Diversified Consumer Services — 1.1% | | | | |
| | 342 | | | Graham Holdings Co., Class B | | | 198,719 | |
| | 1,652 | | | Grand Canyon Education, Inc.* | | | 206,004 | |
| | 6,336 | | | H&R Block, Inc. | | | 168,158 | |
| | 9,596 | | | Service Corp. International | | | 397,946 | |
| | 6,172 | | | ServiceMaster Global Holdings, Inc.* | | | 264,655 | |
| | | | | | | | |
| | | | | | | 1,235,482 | |
| | | | | | | | |
| | | | Diversified Telecommunication Services — 0.6% | |
| | 19,524 | | | CenturyLink, Inc. | | | 402,975 | |
| | 10,582 | | | Zayo Group Holdings, Inc.* | | | 316,190 | |
| | | | | | | | |
| | | | | | | 719,165 | |
| | | | | | | | |
| | | | Electric Utilities — 4.0% | | | | |
| | 11,346 | | | Alliant Energy Corp. | | | 487,651 | |
| | 7,460 | | | Edison International | | | 517,649 | |
| | 5,833 | | | Entergy Corp. | | | 489,680 | |
| | 8,328 | | | Evergy, Inc. | | | 466,285 | |
| | 7,853 | | | Eversource Energy | | | 496,781 | |
| | 7,035 | | | Hawaiian Electric Industries, Inc. | | | 262,406 | |
| | 8,041 | | | OGE Energy Corp. | | | 290,682 | |
| | 5,900 | | | Pinnacle West Capital Corp. | | | 485,275 | |
SEE NOTES TO FINANCIAL STATEMENTS.
| | | | | | | | |
| | | |
| OCTOBER 31, 2018 | | J.P. MORGAN EXCHANGE-TRADED FUNDS | | | | | 125 | |
JPMorgan Diversified Return U.S. Mid Cap Equity ETF
SCHEDULE OF PORTFOLIO INVESTMENTS
AS OF OCTOBER 31, 2018 (continued)
| | | | | | | | |
| SHARES | | | INVESTMENTS | | VALUE($) | |
| | Common Stocks — continued | | | | |
| | | | Electric Utilities — continued | | | | |
| | 16,489 | | | PPL Corp. | | | 501,266 | |
| | 10,213 | | | Xcel Energy, Inc. | | | 500,539 | |
| | | | | | | | |
| | | | | | | 4,498,214 | |
| | | | | | | | |
| | | | Electrical Equipment — 0.6% | | | | |
| | 3,244 | | | AMETEK, Inc. | | | 217,607 | |
| | 2,124 | | | nVent Electric plc (United Kingdom) | | | 51,868 | |
| | 744 | | | Regal Beloit Corp. | | | 53,345 | |
| | 1,275 | | | Rockwell Automation, Inc. | | | 210,031 | |
| | 2,467 | | | Sensata Technologies Holding plc* | | | 115,702 | |
| | | | | | | | |
| | | | | | | 648,553 | |
| | | | | | | | |
| | | | Electronic Equipment, Instruments & Components — 1.4% | |
| | 3,243 | | | Amphenol Corp., Class A | | | 290,248 | |
| | 5,592 | | | CDW Corp. | | | 503,336 | |
| | 2,677 | | | Dolby Laboratories, Inc., Class A | | | 184,204 | |
| | 3,542 | | | FLIR Systems, Inc. | | | 164,030 | |
| | 3,720 | | | Keysight Technologies, Inc.* | | | 212,338 | |
| | 3,841 | | | National Instruments Corp. | | | 188,094 | |
| | | | | | | | |
| | | | | | | 1,542,250 | |
| | | | | | | | |
| | | | Energy Equipment & Services — 0.8% | | | | |
| | 994 | | | Apergy Corp.* | | | 38,756 | |
| | 5,596 | | | Helmerich & Payne, Inc. | | | 348,575 | |
| | 19,943 | | | Nabors Industries Ltd. | | | 99,116 | |
| | 8,591 | | | National Oilwell Varco, Inc. | | | 316,149 | |
| | 7,977 | | | RPC, Inc. (a) | | | 118,698 | |
| | | | | | | | |
| | | | | | | 921,294 | |
| | | | | | | | |
| | | | Entertainment — 0.7% | | | | |
| | 7,106 | | | Cinemark Holdings, Inc. | | | 295,396 | |
| | 2,133 | | | Take-Two Interactive Software, Inc.* | | | 274,880 | |
| | 6,249 | | | Viacom, Inc., Class B | | | 199,843 | |
| | | | | | | | |
| | | | | | | 770,119 | |
| | | | | | | | |
| | | | Equity Real Estate Investment Trusts (REITs) — 3.9% | |
| | 996 | | | Alexandria Real Estate Equities, Inc. | | | 121,741 | |
| | 633 | | | American Campus Communities, Inc. | | | 25,010 | |
| | 1,070 | | | AvalonBay Communities, Inc. | | | 187,657 | |
| | 4,518 | | | Brandywine Realty Trust | | | 63,523 | |
| | 2,858 | | | Brixmor Property Group, Inc. | | | 46,300 | |
| | 1,299 | | | Camden Property Trust | | | 117,261 | |
| | 12,290 | | | Colony Capital, Inc. | | | 72,142 | |
| | 925 | | | CoreSite Realty Corp. | | | 86,821 | |
| | 351 | | | CubeSmart | | | 10,172 | |
| | 1,296 | | | Digital Realty Trust, Inc. | | | 133,825 | |
| | | | | | | | |
| SHARES | | | INVESTMENTS | | VALUE($) | |
| | | | | | | | |
| | | | Equity Real Estate Investment Trusts (REITs) — continued | |
| | 3,784 | | | Douglas Emmett, Inc. | | | 136,943 | |
| | 5,386 | | | Duke Realty Corp. | | | 148,492 | |
| | 1,031 | | | EPR Properties | | | 70,871 | |
| | 2,866 | | | Equity Commonwealth | | | 85,350 | |
| | 1,397 | | | Equity LifeStyle Properties, Inc. | | | 132,282 | |
| | 302 | | | Essex Property Trust, Inc. | | | 75,736 | |
| | 1,436 | | | Extra Space Storage, Inc. | | | 129,326 | |
| | 183 | | | Federal Realty Investment Trust | | | 22,701 | |
| | 678 | | | Forest City Realty Trust, Inc., Class A | | | 17,059 | |
| | 3,127 | | | Gaming and Leisure Properties, Inc. | | | 105,349 | |
| | 1,785 | | | Highwoods Properties, Inc. | | | 76,112 | |
| | 4,048 | | | Hospitality Properties Trust | | | 103,710 | |
| | 6,193 | | | Host Hotels & Resorts, Inc. | | | 118,348 | |
| | 2,414 | | | Hudson Pacific Properties, Inc. | | | 73,144 | |
| | 2,182 | | | Iron Mountain, Inc. | | | 66,791 | |
| | 1,481 | | | Kilroy Realty Corp. | | | 102,011 | |
| | 1,834 | | | Lamar Advertising Co., Class A | | | 134,469 | |
| | 3,235 | | | Liberty Property Trust | | | 135,449 | |
| | 17,379 | | | Medical Properties Trust, Inc. | | | 258,252 | |
| | 909 | | | Mid-America Apartment Communities, Inc. | | | 88,818 | |
| | 1,123 | | | National Retail Properties, Inc. | | | 52,500 | |
| | 2,357 | | | Omega Healthcare Investors, Inc. | | | 78,606 | |
| | 3,481 | | | Outfront Media, Inc. | | | 61,683 | |
| | 14,598 | | | Park Hotels & Resorts, Inc. | | | 424,364 | |
| | 2,500 | | | Rayonier, Inc. | | | 75,500 | |
| | 101 | | | Retail Value, Inc.* | | | 2,829 | |
| | 5,348 | | | Senior Housing Properties Trust | | | 85,942 | |
| | 935 | | | SITE Centers Corp. | | | 11,622 | |
| | 1,014 | | | Sun Communities, Inc. | | | 101,877 | |
| | 1,296 | | | Taubman Centers, Inc. | | | 71,293 | |
| | 2,294 | | | Uniti Group, Inc. | | | 43,907 | |
| | 390 | | | Vornado Realty Trust | | | 26,551 | |
| | 2,334 | | | Weingarten Realty Investors | | | 65,632 | |
| | 2,077 | | | Welltower, Inc. | | | 137,227 | |
| | 3,410 | | | Weyerhaeuser Co. | | | 90,808 | |
| | 1,076 | | | WP Carey, Inc. | | | 71,027 | |
| | | | | | | | |
| | | | | | | 4,347,033 | |
| | | | | | | | |
| | | | Food & Staples Retailing — 0.2% | | | | |
| | 1,636 | | | Casey’s General Stores, Inc. | | | 206,316 | |
| | | | | | | | |
| | | | Food Products — 3.4% | | | | |
| | 6,483 | | | Campbell Soup Co. (a) | | | 242,529 | |
| | 11,198 | | | Conagra Brands, Inc. | | | 398,649 | |
| | 18,191 | | | Flowers Foods, Inc. | | | 351,268 | |
| | 3,714 | | | Hershey Co. (The) | | | 397,955 | |
| | 9,368 | | | Hormel Foods Corp. | | | 408,820 | |
SEE NOTES TO FINANCIAL STATEMENTS.
| | | | | | |
| | | |
| 126 | | | | J.P. MORGAN EXCHANGE-TRADED FUNDS | | OCTOBER 31, 2018 |
| | | | | | | | |
| SHARES | | | INVESTMENTS | | VALUE($) | |
| | Common Stocks — continued | | | | |
| | | | Food Products — continued | | | | |
| | 2,650 | | | Ingredion, Inc. | | | 268,127 | |
| | 6,455 | | | Kellogg Co. | | | 422,673 | |
| | 5,398 | | | Lamb Weston Holdings, Inc. | | | 421,908 | |
| | 3,922 | | | McCormick & Co., Inc. (Non-Voting) | | | 564,768 | |
| | 9,158 | | | Pilgrim’s Pride Corp.* | | | 161,730 | |
| | 3,265 | | | Tyson Foods, Inc., Class A | | | 195,639 | |
| | | | | | | | |
| | | | | | | 3,834,066 | |
| | | | | | | | |
| | | | Gas Utilities — 1.2% | | | | |
| | 5,268 | | | Atmos Energy Corp. | | | 490,346 | |
| | 6,449 | | | National Fuel Gas Co. | | | 350,116 | |
| | 9,052 | | | UGI Corp. | | | 480,299 | |
| | | | | | | | |
| | | | | | | 1,320,761 | |
| | | | | | | | |
| | | | Health Care Equipment & Supplies — 5.1% | | | | |
| | 1,205 | | | ABIOMED, Inc.* | | | 411,146 | |
| | 1,271 | | | Align Technology, Inc.* | | | 281,145 | |
| | 998 | | | Cantel Medical Corp. | | | 78,992 | |
| | 1,914 | | | Cooper Cos., Inc. (The) | | | 494,405 | |
| | 7,511 | | | DENTSPLY SIRONA, Inc. | | | 260,106 | |
| | 2,629 | | | Edwards Lifesciences Corp.* | | | 388,040 | |
| | 5,026 | | | Hill-Rom Holdings, Inc. | | | 422,586 | |
| | 7,849 | | | Hologic, Inc.* | | | 306,033 | |
| | 799 | | | ICU Medical, Inc.* | | | 203,529 | |
| | 1,930 | | | IDEXX Laboratories, Inc.* | | | 409,392 | |
| | 4,397 | | | ResMed, Inc. | | | 465,730 | |
| | 3,771 | | | STERIS plc | | | 412,208 | |
| | 1,762 | | | Teleflex, Inc. | | | 424,184 | |
| | 3,581 | | | Varian Medical Systems, Inc.* | | | 427,464 | |
| | 3,788 | | | West Pharmaceutical Services, Inc. | | | 401,225 | |
| | 3,230 | | | Zimmer Biomet Holdings, Inc. | | | 366,896 | |
| | | | | | | | |
| | | | | | | 5,753,081 | |
| | | | | | | | |
| | | | Health Care Providers & Services — 4.1% | | | | |
| | 2,465 | | | Acadia Healthcare Co., Inc.* | | | 102,297 | |
| | 2,453 | | | AmerisourceBergen Corp. | | | 215,864 | |
| | 3,669 | | | Cardinal Health, Inc. | | | 185,651 | |
| | 3,353 | | | Centene Corp.* | | | 436,963 | |
| | 760 | | | Chemed Corp. | | | 231,291 | |
| | 5,370 | | | DaVita, Inc.* | | | 361,616 | |
| | 3,461 | | | Encompass Health Corp. | | | 232,925 | |
| | 5,816 | | | Henry Schein, Inc.* | | | 482,728 | |
| | 2,622 | | | Laboratory Corp. of America Holdings* | | | 420,962 | |
| | 6,350 | | | MEDNAX, Inc.* | | | 262,191 | |
| | 3,545 | | | Molina Healthcare, Inc.* | | | 449,400 | |
| | 4,244 | | | Quest Diagnostics, Inc. | | | 399,403 | |
| | 3,073 | | | Universal Health Services, Inc., Class B | | | 373,554 | |
| | | | | | | | |
| SHARES | | | INVESTMENTS | | VALUE($) | |
| | | | | | | | |
| | | | Health Care Providers & Services — continued | |
| | 1,618 | | | WellCare Health Plans, Inc.* | | | 446,552 | |
| | | | | | | | |
| | | | | | | 4,601,397 | |
| | | | | | | | |
| | | | Health Care Technology — 0.2% | | | | |
| | 3,881 | | | Cerner Corp.* | | | 222,304 | |
| | | | | | | | |
| | | | Hotels, Restaurants & Leisure — 3.3% | | | | |
| | 2,903 | | | Aramark | | | 104,276 | |
| | 4,143 | | | Choice Hotels International, Inc. | | | 304,096 | |
| | 3,180 | | | Darden Restaurants, Inc. | | | 338,829 | |
| | 4,387 | | | Dunkin’ Brands Group, Inc. | | | 318,321 | |
| | 16,268 | | | Extended Stay America, Inc. | | | 264,843 | |
| | 4,185 | | | Hilton Worldwide Holdings, Inc. | | | 297,847 | |
| | 4,295 | | | Hyatt Hotels Corp., Class A | | | 297,214 | |
| | 7,307 | | | MGM Resorts International | | | 194,951 | |
| | 3,349 | | | Norwegian Cruise Line Holdings Ltd.* | | | 147,590 | |
| | 1,700 | | | Royal Caribbean Cruises Ltd. | | | 178,041 | |
| | 5,443 | | | Six Flags Entertainment Corp. | | | 293,160 | |
| | 1,362 | | | Vail Resorts, Inc. | | | 342,298 | |
| | 16,086 | | | Wendy’s Co. (The) | | | 277,323 | |
| | 5,463 | | | Wyndham Destinations, Inc. | | | 196,012 | |
| | 5,279 | | | Yum China Holdings, Inc. (China) | | | 190,466 | |
| | | | | | | | |
| | | | | | | 3,745,267 | |
| | | | | | | | |
| | | | Household Durables — 2.0% | | | | |
| | 6,910 | | | DR Horton, Inc. | | | 248,484 | |
| | 7,173 | | | Garmin Ltd. | | | 474,566 | |
| | 9,916 | | | Leggett & Platt, Inc. | | | 360,050 | |
| | 4,684 | | | Lennar Corp., Class A | | | 201,318 | |
| | 1,257 | | | Mohawk Industries, Inc.* | | | 156,786 | |
| | 119 | | | NVR, Inc.* | | | 266,444 | |
| | 13,724 | | | PulteGroup, Inc. | | | 337,199 | |
| | 1,328 | | | Whirlpool Corp. | | | 145,761 | |
| | | | | | | | |
| | | | | | | 2,190,608 | |
| | | | | | | | |
| | | | Household Products — 1.3% | | | | |
| | 8,655 | | | Church & Dwight Co., Inc. | | | 513,847 | |
| | 3,381 | | | Clorox Co. (The) | | | 501,910 | |
| | 5,765 | | | Energizer Holdings, Inc. | | | 338,809 | |
| | 1,283 | | | Spectrum Brands Holdings, Inc. | | | 83,331 | |
| | | | | | | | |
| | | | | | | 1,437,897 | |
| | | | | | | | |
| | | | Independent Power and Renewable Electricity Producers — 0.5% | |
| | 24,656 | | | AES Corp. | | | 359,484 | |
| | 6,728 | | | Vistra Energy Corp.* | | | 152,255 | |
| | | | | | | | |
| | | | | | | 511,739 | |
| | | | | | | | |
SEE NOTES TO FINANCIAL STATEMENTS.
| | | | | | | | |
| | | |
| OCTOBER 31, 2018 | | J.P. MORGAN EXCHANGE-TRADED FUNDS | | | | | 127 | |
JPMorgan Diversified Return U.S. Mid Cap Equity ETF
SCHEDULE OF PORTFOLIO INVESTMENTS
AS OF OCTOBER 31, 2018 (continued)
| | | | | | | | |
| SHARES | | | INVESTMENTS | | VALUE($) | |
| | Common Stocks — continued | | | | |
| | | | Industrial Conglomerates — 0.2% | | | | |
| | 821 | | | Roper Technologies, Inc. | | | 232,261 | |
| | | | | | | | |
| | | | Insurance — 3.3% | | | | |
| | 303 | | | Alleghany Corp. | | | 182,006 | |
| | 2,749 | | | American Financial Group, Inc. | | | 274,983 | |
| | 281 | | | Arch Capital Group Ltd.* | | | 7,972 | |
| | 3,827 | | | Arthur J Gallagher & Co. | | | 283,236 | |
| | 3,291 | | | Aspen Insurance Holdings Ltd. (Bermuda) | | | 137,827 | |
| | 1,770 | | | Assurant, Inc. | | | 172,062 | |
| | 2,387 | | | Assured Guaranty Ltd. | | | 95,432 | |
| | 3,040 | | | Axis Capital Holdings Ltd. | | | 169,602 | |
| | 8,407 | | | Brown & Brown, Inc. | | | 236,909 | |
| | 2,394 | | | Cincinnati Financial Corp. | | | 188,264 | |
| | 155 | | | CNA Financial Corp. | | | 6,722 | |
| | 593 | | | Everest Re Group Ltd. | | | 129,191 | |
| | 3,537 | | | Fidelity National Financial, Inc. | | | 118,313 | |
| | 1,819 | | | First American Financial Corp. | | | 80,636 | |
| | 889 | | | Hanover Insurance Group, Inc. (The) | | | 99,017 | |
| | 1,143 | | | Lincoln National Corp. | | | 68,797 | |
| | 3,864 | | | Loews Corp. | | | 179,908 | |
| | 24 | | | Markel Corp.* | | | 26,238 | |
| | 1,423 | | | Mercury General Corp. | | | 84,398 | |
| | 13,205 | | | Old Republic International Corp. | | | 291,170 | |
| | 2,513 | | | Principal Financial Group, Inc. | | | 118,287 | |
| | 1,188 | | | Reinsurance Group of America, Inc. | | | 169,136 | |
| | 3,061 | | | Torchmark Corp. | | | 259,144 | |
| | 2,394 | | | Unum Group | | | 86,806 | |
| | 3,012 | | | WR Berkley Corp. | | | 228,611 | |
| | | | | | | | |
| | | | | | | 3,694,667 | |
| | | | | | | | |
| | | | Interactive Media & Services — 0.3% | | | | |
| | 1,623 | | | IAC/InterActiveCorp* | | | 319,066 | |
| | | | | | | | |
| | | | IT Services — 3.6% | | | | |
| | 419 | | | Akamai Technologies, Inc.* | | | 30,273 | |
| | 6,966 | | | Amdocs Ltd. | | | 440,739 | |
| | 2,428 | | | Booz Allen Hamilton Holding Corp. | | | 120,283 | |
| | 3,624 | | | Broadridge Financial Solutions, Inc. | | | 423,791 | |
| | 2,191 | | | Conduent, Inc.* | | | 41,848 | |
| | 1,082 | | | CoreLogic, Inc.* | | | 43,951 | |
| | 2,556 | | | DXC Technology Co. | | | 186,153 | |
| | 2,240 | | | Fidelity National Information Services, Inc. | | | 233,184 | |
| | 7,640 | | | First Data Corp., Class A* | | | 143,174 | |
| | 3,127 | | | Fiserv, Inc.* | | | 247,971 | |
| | 2,144 | | | Jack Henry & Associates, Inc. | | | 321,236 | |
| | 5,995 | | | Leidos Holdings, Inc. | | | 388,356 | |
| | 2,610 | | | Paychex, Inc. | | | 170,929 | |
| | | | | | | | |
| SHARES | | | INVESTMENTS | | VALUE($) | |
| | | | | | | | |
| | | | IT Services — continued | | | | |
| | 10,433 | | | Sabre Corp. | | | 257,173 | |
| | 1,031 | | | Teradata Corp.* | | | 37,528 | |
| | 2,196 | | | Total System Services, Inc. | | | 200,165 | |
| | 3,087 | | | VeriSign, Inc.* | | | 440,021 | |
| | 3,903 | | | Western Union Co. (The) | | | 70,410 | |
| | 2,220 | | | Worldpay, Inc.* | | | 203,885 | |
| | | | | | | | |
| | | | | | | 4,001,070 | |
| | | | | | | | |
| | | | Leisure Products — 0.6% | | | | |
| | 4,558 | | | Brunswick Corp. | | | 236,971 | |
| | 2,678 | | | Hasbro, Inc. | | | 245,599 | |
| | 1,754 | | | Polaris Industries, Inc. | | | 156,071 | |
| | | | | | | | |
| | | | | | | 638,641 | |
| | | | | | | | |
| | | | Life Sciences Tools & Services — 2.2% | | | | |
| | 2,940 | | | Agilent Technologies, Inc. | | | 190,483 | |
| | 1,224 | | | Bio-Rad Laboratories, Inc., Class A* | | | 333,968 | |
| | 2,340 | | | Bio-Techne Corp. | | | 392,465 | |
| | 3,729 | | | Bruker Corp. | | | 116,830 | |
| | 3,958 | | | Charles River Laboratories International, Inc.* | | | 482,163 | |
| | 3,855 | | | IQVIA Holdings, Inc.* | | | 473,895 | |
| | 2,413 | | | Waters Corp.* | | | 457,722 | |
| | | | | | | | |
| | | | | | | 2,447,526 | |
| | | | | | | | |
| | | | Machinery — 3.3% | | | | |
| | 3,730 | | | Allison Transmission Holdings, Inc. | | | 164,418 | |
| | 1,325 | | | Crane Co. | | | 115,328 | |
| | 1,052 | | | Cummins, Inc. | | | 143,798 | |
| | 1,984 | | | Dover Corp. | | | 164,355 | |
| | 3,021 | | | Fortive Corp. | | | 224,309 | |
| | 6,548 | | | Graco, Inc. | | | 266,045 | |
| | 2,061 | | | IDEX Corp. | | | 261,376 | |
| | 2,201 | | | Ingersoll-Rand plc | | | 211,164 | |
| | 1,429 | | | ITT, Inc. | | | 72,164 | |
| | 2,071 | | | Lincoln Electric Holdings, Inc. | | | 167,565 | |
| | 1,199 | | | Middleby Corp. (The)* | | | 134,648 | |
| | 940 | | | Nordson Corp. | | | 115,310 | |
| | 1,748 | | | Oshkosh Corp. | | | 98,133 | |
| | 2,184 | | | PACCAR, Inc. | | | 124,947 | |
| | 999 | | | Parker-Hannifin Corp. | | | 151,478 | |
| | 2,123 | | | Pentair plc (United Kingdom) | | | 85,238 | |
| | 2,556 | | | Snap-on, Inc. | | | 393,471 | |
| | 1,082 | | | Terex Corp. | | | 36,128 | |
| | 6,827 | | | Toro Co. (The) | | | 384,565 | |
| | 1,746 | | | Trinity Industries, Inc. | | | 49,848 | |
| | 1,905 | | | WABCO Holdings, Inc.* | | | 204,692 | |
SEE NOTES TO FINANCIAL STATEMENTS.
| | | | | | |
| | | |
| 128 | | | | J.P. MORGAN EXCHANGE-TRADED FUNDS | | OCTOBER 31, 2018 |
| | | | | | | | |
| SHARES | | | INVESTMENTS | | VALUE($) | |
| | Common Stocks — continued | | | | |
| | | | Machinery — continued | | | | |
| | 2,783 | | | Xylem, Inc. | | | 182,509 | |
| | | | | | | | |
| | | | | | | 3,751,489 | |
| | | | | | | | |
| | | | Marine — 0.0% (b) | | | | |
| | 643 | | | Kirby Corp.* | | | 46,257 | |
| | | | | | | | |
| | | | Media — 1.4% | | | | |
| | 9,576 | | | Discovery, Inc., Class A* | | | 310,167 | |
| | 9,327 | | | Interpublic Group of Cos., Inc. (The) | | | 216,013 | |
| | 1,124 | | | John Wiley & Sons, Inc., Class A | | | 60,966 | |
| | 2,313 | | | Liberty Media Corp.-Liberty SiriusXM, Class A* | | | 95,388 | |
| | 3,815 | | | Omnicom Group, Inc. | | | 283,531 | |
| | 53,358 | | | Sirius XM Holdings, Inc. (a) | | | 321,215 | |
| | 5,988 | | | Tribune Media Co., Class A | | | 227,604 | |
| | | | | | | | |
| | | | | | | 1,514,884 | |
| | | | | | | | |
| | | | Metals & Mining — 2.1% | | | | |
| | 8,217 | | | Alcoa Corp.* | | | 287,513 | |
| | 11,856 | | | Newmont Mining Corp. | | | 366,587 | |
| | 5,891 | | | Nucor Corp. | | | 348,276 | |
| | 4,174 | | | Reliance Steel & Aluminum Co. | | | 329,412 | |
| | 4,809 | | | Royal Gold, Inc. | | | 368,514 | |
| | 8,030 | | | Steel Dynamics, Inc. | | | 317,988 | |
| | 12,356 | | | United States Steel Corp. | | | 327,805 | |
| | | | | | | | |
| | | | | | | 2,346,095 | |
| | | | | | | | |
| | | | Mortgage Real Estate Investment Trusts (REITs) — 0.7% | |
| | 8,406 | | | AGNC Investment Corp. | | | 149,963 | |
| | 13,759 | | | Annaly Capital Management, Inc. | | | 135,802 | |
| | 9,270 | | | Chimera Investment Corp. | | | 172,422 | |
| | 15,967 | | | MFA Financial, Inc. | | | 110,651 | |
| | 6,893 | | | Starwood Property Trust, Inc. | | | 149,716 | |
| | 8,342 | | | Two Harbors Investment Corp. | | | 122,544 | |
| | | | | | | | |
| | | | | | | 841,098 | |
| | | | | | | | |
| | | | Multiline Retail — 1.7% | | | | |
| | 4,103 | | | Dollar General Corp. | | | 456,992 | |
| | 2,679 | | | Dollar Tree, Inc.* | | | 225,840 | |
| | 5,304 | | | Kohl’s Corp. | | | 401,672 | |
| | 10,136 | | | Macy’s, Inc. | | | 347,563 | |
| | 7,163 | | | Nordstrom, Inc. | | | 471,111 | |
| | | | | | | | |
| | | | | | | 1,903,178 | |
| | | | | | | | |
| | | | Multi-Utilities — 4.2% | | | | |
| | 7,747 | | | Ameren Corp. | | | 500,301 | |
| | 17,615 | | | CenterPoint Energy, Inc. | | | 475,781 | |
| | 9,944 | | | CMS Energy Corp. | | | 492,427 | |
| | 6,198 | | | Consolidated Edison, Inc. | | | 471,048 | |
| | | | | | | | |
| SHARES | | | INVESTMENTS | | VALUE($) | |
| | | | | | | | |
| | | | Multi-Utilities — continued | | | | |
| | 4,412 | | | DTE Energy Co. | | | 495,909 | |
| | 4,314 | | | MDU Resources Group, Inc. | | | 107,677 | |
| | 8,998 | | | Public Service Enterprise Group, Inc. | | | 480,763 | |
| | 5,000 | | | SCANA Corp. | | | 200,250 | |
| | 4,234 | | | Sempra Energy | | | 466,248 | |
| | 6,630 | | | Vectren Corp. | | | 474,244 | |
| | 7,257 | | | WEC Energy Group, Inc. | | | 496,379 | |
| | | | | | | | |
| | | | | | | 4,661,027 | |
| | | | | | | | |
| | | | Oil, Gas & Consumable Fuels — 3.3% | | | | |
| | 4,771 | | | Apache Corp. | | | 180,487 | |
| | 4,302 | | | Cheniere Energy, Inc.* | | | 259,884 | |
| | 8,707 | | | CNX Resources Corp.* | | | 136,264 | |
| | 5,556 | | | Continental Resources, Inc.* | | | 292,690 | |
| | 5,710 | | | Devon Energy Corp. | | | 185,004 | |
| | 1,752 | | | Diamondback Energy, Inc. | | | 196,855 | |
| | 779 | | | Energen Corp.* | | | 56,065 | |
| | 2,439 | | | Hess Corp. | | | 139,999 | |
| | 4,930 | | | HollyFrontier Corp. | | | 332,479 | |
| | 17,112 | | | Marathon Oil Corp. | | | 324,957 | |
| | 4,634 | | | Murphy Oil Corp. | | | 147,639 | |
| | 6,124 | | | Newfield Exploration Co.* | | | 123,705 | |
| | 5,694 | | | ONEOK, Inc. | | | 373,526 | |
| | 7,455 | | | PBF Energy, Inc., Class A | | | 311,992 | |
| | 93 | | | SM Energy Co. | | | 2,264 | |
| | 4,493 | | | Targa Resources Corp. | | | 232,153 | |
| | 4,629 | | | Whiting Petroleum Corp.* | | | 172,662 | |
| | 10,968 | | | Williams Cos., Inc. (The) | | | 266,851 | |
| | | | | | | | |
| | | | | | | 3,735,476 | |
| | | | | | | | |
| | | | Paper & Forest Products — 0.4% | | | | |
| | 9,593 | | | Domtar Corp. | | | 444,252 | |
| | | | | | | | |
| | | | Personal Products — 0.6% | | | | |
| | 1,253 | | | Coty, Inc., Class A | | | 13,219 | |
| | 6,479 | | | Herbalife Nutrition Ltd.* | | | 345,072 | |
| | 4,606 | | | Nu Skin Enterprises, Inc., Class A | | | 323,433 | |
| | | | | | | | |
| | | | | | | 681,724 | |
| | | | | | | | |
| | | | Pharmaceuticals — 0.9% | | | | |
| | 2,091 | | | Jazz Pharmaceuticals plc* | | | 332,092 | |
| | 9,156 | | | Mylan NV* | | | 286,125 | |
| | 4,826 | | | Perrigo Co. plc | | | 339,268 | |
| | | | | | | | |
| | | | | | | 957,485 | |
| | | | | | | | |
| | | | Professional Services — 0.6% | | | | |
| | 2,204 | | | Dun & Bradstreet Corp. (The) | | | 313,585 | |
| | 2,867 | | | Robert Half International, Inc. | | | 173,540 | |
SEE NOTES TO FINANCIAL STATEMENTS.
| | | | | | | | |
| | | |
| OCTOBER 31, 2018 | | J.P. MORGAN EXCHANGE-TRADED FUNDS | | | | | 129 | |
JPMorgan Diversified Return U.S. Mid Cap Equity ETF
SCHEDULE OF PORTFOLIO INVESTMENTS
AS OF OCTOBER 31, 2018 (continued)
| | | | | | | | |
| SHARES | | | INVESTMENTS | | VALUE($) | |
| | Common Stocks — continued | | | | |
| | | | Professional Services — continued | | | | |
| | 2,840 | | | TransUnion | | | 186,730 | |
| | | | | | | | |
| | | | | | | 673,855 | |
| | | | | | | | |
| | | | Real Estate Management & Development — 0.2% | |
| | 2,506 | | | CBRE Group, Inc., Class A* | | | 100,967 | |
| | 570 | | | Jones Lang LaSalle, Inc. | | | 75,388 | |
| | | | | | | | |
| | | | | | | 176,355 | |
| | | | | | | | |
| | | | Road & Rail — 0.7% | | | | |
| | 1,873 | | | JB Hunt Transport Services, Inc. | | | 207,173 | |
| | 1,291 | | | Kansas City Southern | | | 131,630 | |
| | 2,567 | | | Landstar System, Inc. | | | 256,931 | |
| | 1,113 | | | Old Dominion Freight Line, Inc. | | | 145,157 | |
| | | | | | | | |
| | | | | | | 740,891 | |
| | | | | | | | |
| | | | Semiconductors & Semiconductor Equipment — 2.4% | |
| | 3,728 | | | Analog Devices, Inc. | | | 312,071 | |
| | 15,413 | | | Cypress Semiconductor Corp. | | | 199,444 | |
| | 2,618 | | | KLA-Tencor Corp. | | | 239,652 | |
| | 1,165 | | | Lam Research Corp. | | | 165,115 | |
| | 8,400 | | | Marvell Technology Group Ltd. | | | 137,844 | |
| | 5,375 | | | Maxim Integrated Products, Inc. | | | 268,858 | |
| | 9,243 | | | ON Semiconductor Corp.* | | | 157,131 | |
| | 3,175 | | | Qorvo, Inc.* | | | 233,394 | |
| | 2,226 | | | Skyworks Solutions, Inc. | | | 193,128 | |
| | 5,665 | | | Teradyne, Inc. | | | 195,159 | |
| | 7,391 | | | Versum Materials, Inc. | | | 233,260 | |
| | 3,857 | | | Xilinx, Inc. | | | 329,272 | |
| | | | | | | | |
| | | | | | | 2,664,328 | |
| | | | | | | | |
| | | | Software — 3.8% | | | | |
| | 2,138 | | | ANSYS, Inc.* | | | 319,738 | |
| | 8,041 | | | CA, Inc. | | | 356,699 | |
| | 7,381 | | | Cadence Design Systems, Inc.* | | | 328,971 | |
| | 2,444 | | | CDK Global, Inc. | | | 139,895 | |
| | 4,102 | | | Citrix Systems, Inc.* | | | 420,332 | |
| | 2,987 | | | Dell Technologies, Inc., Class V* | | | 269,995 | |
| | 1,921 | | | LogMeIn, Inc. | | | 165,436 | |
| | 3,416 | | | Manhattan Associates, Inc.* | | | 163,080 | |
| | 4,404 | | | PTC, Inc.* | | | 362,934 | |
| | 2,410 | | | Red Hat, Inc.* | | | 413,652 | |
| | 7,843 | | | SS&C Technologies Holdings, Inc. | | | 401,248 | |
| | 4,795 | | | Synopsys, Inc.* | | | 429,296 | |
| | 1,981 | | | Tyler Technologies, Inc.* | | | 419,298 | |
| | 194 | | | Ultimate Software Group, Inc. (The)* | | | 51,726 | |
| | | | | | | | |
| | | | | | | 4,242,300 | |
| | | | | | | | |
| | | | | | | | |
| SHARES | | | INVESTMENTS | | VALUE($) | |
| | | | | | | | |
| | | | Specialty Retail — 2.7% | | | | |
| | 3,029 | | | AutoNation, Inc.* | | | 122,614 | |
| | 19 | | | AutoZone, Inc.* | | | 13,936 | |
| | 5,204 | | | Best Buy Co., Inc. | | | 365,113 | |
| | 225 | | | Burlington Stores, Inc.* | | | 38,585 | |
| | 2,379 | | | CarMax, Inc.* | | | 161,558 | |
| | 5,269 | | | Dick’s Sporting Goods, Inc. | | | 186,364 | |
| | 2,813 | | | Foot Locker, Inc. | | | 132,605 | |
| | 5,468 | | | Gap, Inc. (The) | | | 149,276 | |
| | 2,778 | | | Penske Automotive Group, Inc. | | | 123,288 | |
| | 3,359 | | | Ross Stores, Inc. | | | 332,541 | |
| | 2,722 | | | Tiffany & Co. | | | 302,959 | |
| | 4,753 | | | Tractor Supply Co. | | | 436,753 | |
| | 8,437 | | | Urban Outfitters, Inc.* | | | 332,924 | |
| | 6,347 | | | Williams-Sonoma, Inc. | | | 376,885 | |
| | | | | | | | |
| | | | | | | 3,075,401 | |
| | | | | | | | |
| | | | Technology Hardware, Storage & Peripherals — 0.2% | |
| | 3,399 | | | NetApp, Inc. | | | 266,787 | |
| | | | | | | | |
| | | | Textiles, Apparel & Luxury Goods — 2.0% | | | | |
| | 3,461 | | | Carter’s, Inc. | | | 332,187 | |
| | 3,300 | | | Columbia Sportswear Co. | | | 297,924 | |
| | 6,144 | | | Michael Kors Holdings Ltd.* | | | 340,439 | |
| | 1,903 | | | PVH Corp. | | | 229,863 | |
| | 3,368 | | | Ralph Lauren Corp. | | | 436,527 | |
| | 5,404 | | | Tapestry, Inc. | | | 228,643 | |
| | 1,947 | | | Under Armour, Inc., Class C* | | | 38,609 | |
| | 4,572 | | | VF Corp. | | | 378,927 | |
| | | | | | | | |
| | | | | | | 2,283,119 | |
| | | | | | | | |
| | | | Trading Companies & Distributors — 0.5% | | | | |
| | 1,894 | | | Fastenal Co. | | | 97,371 | |
| | 1,260 | | | MSC Industrial Direct Co., Inc., Class A | | | 102,136 | |
| | 560 | | | United Rentals, Inc.* | | | 67,239 | |
| | 1,133 | | | Watsco, Inc. | | | 167,888 | |
| | 450 | | | WW Grainger, Inc. | | | 127,786 | |
| | | | | | | | |
| | | | | | | 562,420 | |
| | | | | | | | |
| | | | Transportation Infrastructure — 0.1% | | | | |
| | 2,040 | | | Macquarie Infrastructure Corp. | | | 75,378 | |
| | | | | | | | |
| | | | Water Utilities — 0.7% | | | | |
| | 5,597 | | | American Water Works Co., Inc. | | | 495,502 | |
| | 10,416 | | | Aqua America, Inc. | | | 338,833 | |
| | | | | | | | |
| | | | | | | 834,335 | |
| | | | | | | | |
SEE NOTES TO FINANCIAL STATEMENTS.
| | | | | | |
| | | |
| 130 | | | | J.P. MORGAN EXCHANGE-TRADED FUNDS | | OCTOBER 31, 2018 |
| | | | | | | | |
| SHARES | | | INVESTMENTS | | VALUE($) | |
| | Common Stocks — continued | | | | |
| | | | Wireless Telecommunication Services — 0.5% | |
| | 12,201 | | | Telephone & Data Systems, Inc. | | | 376,157 | |
| | 3,076 | | | United States Cellular Corp.* | | | 146,940 | |
| | | | | | | | |
| | | | | | | 523,097 | |
| | | | | | | | |
| | | | Total Common Stocks
(Cost $103,203,566) | | | 108,211,311 | |
| | | | | | | | |
| | Short-Term Investments — 3.2% | | | | |
| | | | Investment Companies — 3.2% | | | | |
| | 3,620,915 | | | JPMorgan U.S. Government Money Market Fund Class Institutional Shares, 2.02% (c) (d)
(Cost $3,620,915) | | | 3,620,915 | |
| | | | | | | | |
| | Investment of Cash Collateral from Securities Loaned — 0.6% | |
| | 643,332 | | | JPMorgan U.S. Government Money Market Fund Class IM Shares, 2.07% (c) (d)
(Cost $643,332) | | | 643,332 | |
| | | | | | | | |
| | | | Total Investments — 100.4%
(Cost $107,467,813) | | | 112,475,558 | |
| | | | Liabilities in Excess of
Other Assets — (0.4%) | | | (447,378 | ) |
| | | | | | | | |
| | | | NET ASSETS — 100.0% | | | 112,028,180 | |
| | | | | | | | |
Percentages indicated are based on net assets.
| | |
| (a) | | — The security or a portion of this security is on loan at October 31, 2018. The total value of securities on loan at October 31, 2018 was $627,488. |
| (b) | | — Amount rounds to less than 0.1% of net assets. |
| (c) | | — Investment in affiliate. Fund is registered under the Investment Company Act of 1940, as amended, and advised by J.P. Morgan Investment Management Inc. |
| (d) | | — The rate shown is the current yield as of October 31, 2018. |
| * | | — Non-income producing security. |
| | | | | | | | | | | | | | | | | | |
| Futures contracts outstanding as of October 31, 2018: | |
| DESCRIPTION | | NUMBER OF
CONTRACTS | | EXPIRATION
DATE | | | TRADING
CURRENCY | | | NOTIONAL
AMOUNT ($) | | | VALUE AND
UNREALIZED
APPRECIATION
(DEPRECIATION) ($) | |
Long Contracts | | | | | | | | | | | | | | | | | | |
| S&P 500 E-Mini Index | | 26 | | | 12/2018 | | | | USD | | | | 3,523,260 | | | | (19,830 | ) |
| | | | | | | | | | | | | | | | | | |
| | | | | | | | | | | | | | | | | (19,830 | ) |
| | | | | | | | | | | | | | | | | | |
Abbreviations
| | |
| USD | | — United States Dollar |
SEE NOTES TO FINANCIAL STATEMENTS.
| | | | | | | | |
| | | |
| OCTOBER 31, 2018 | | J.P. MORGAN EXCHANGE-TRADED FUNDS | | | | | 131 | |
JPMorgan Diversified Return U.S. Small Cap Equity ETF
SCHEDULE OF PORTFOLIO INVESTMENTS
AS OF OCTOBER 31, 2018
| | | | | | | | |
| SHARES | | | INVESTMENTS | | VALUE($) | |
| | Common Stocks — 98.3% | |
| | | | Aerospace & Defense — 0.7% | |
| | 1,756 | | | AAR Corp. | | | 83,551 | |
| | 2,388 | | | Aerojet Rocketdyne Holdings, Inc.* | | | 84,344 | |
| | 1,208 | | | Aerovironment, Inc.* | | | 108,684 | |
| | 1,163 | | | Cubic Corp. | | | 76,304 | |
| | 1,182 | | | Mercury Systems, Inc.* | | | 55,389 | |
| | 2,159 | | | Moog, Inc., Class A | | | 154,476 | |
| | 906 | | | National Presto Industries, Inc. | | | 112,951 | |
| | | | | | | | |
| | | | | | | 675,699 | |
| | | | | | | | |
| | | | Air Freight & Logistics — 0.3% | |
| | 1,073 | | | Atlas Air Worldwide Holdings, Inc.* | | | 55,388 | |
| | 2,435 | | | Echo Global Logistics, Inc.* | | | 62,604 | |
| | 1,588 | | | Forward Air Corp. | | | 95,264 | |
| | 1,784 | | | Hub Group, Inc., Class A* | | | 81,743 | |
| | | | | | | | |
| | | | | | | 294,999 | |
| | | | | | | | |
| | | | Airlines — 0.3% | |
| | 530 | | | Allegiant Travel Co. | | | 60,494 | |
| | 1,918 | | | Hawaiian Holdings, Inc. | | | 66,382 | |
| | 2,773 | | | SkyWest, Inc. | | | 158,865 | |
| | | | | | | | |
| | | | | | | 285,741 | |
| | | | | | | | |
| | | | Auto Components — 2.7% | |
| | 9,716 | | | American Axle & Manufacturing Holdings, Inc.* | | | 147,392 | |
| | 10,180 | | | Cooper Tire & Rubber Co. | | | 314,460 | |
| | 2,506 | | | Cooper-Standard Holdings, Inc.* | | | 232,181 | |
| | 8,848 | | | Dana, Inc. | | | 137,763 | |
| | 4,936 | | | Dorman Products, Inc.* | | | 389,993 | |
| | 7,731 | | | Fox Factory Holding Corp.* | | | 415,387 | |
| | 5,454 | | | Gentherm, Inc.* | | | 238,013 | |
| | 4,811 | | | LCI Industries | | | 333,643 | |
| | 2,318 | | | Modine Manufacturing Co.* | | | 30,157 | |
| | 2,001 | | | Stoneridge, Inc.* | | | 50,845 | |
| | 6,209 | | | Superior Industries International, Inc. | | | 61,035 | |
| | 5,782 | | | Tenneco, Inc., Class A | | | 199,074 | |
| | | | | | | | |
| | | | | | | 2,549,943 | |
| | | | | | | | |
| | | | Automobiles — 0.2% | |
| | 8,500 | | | Winnebago Industries, Inc. | | | 234,260 | |
| | | | | | | | |
| | | | Banks — 3.0% | |
| | 464 | | | 1st Source Corp. | | | 21,618 | |
| | 1,301 | | | Ameris Bancorp | | | 55,800 | |
| | 2,056 | | | AmeriServ Financial, Inc. | | | 8,717 | |
| | 993 | | | BancFirst Corp. | | | 56,978 | |
| | 1,580 | | | BancorpSouth Bank | | | 45,346 | |
| | 1,604 | | | Bank of NT Butterfield & Son Ltd. (The) (Bermuda) | | | 64,625 | |
| | | | | | | | |
| SHARES | | | INVESTMENTS | | VALUE($) | |
| | | | | | | | |
| | | | Banks — continued | | | | |
| | 1,100 | | | Banner Corp. | | | 63,602 | |
| | 3,165 | | | Brookline Bancorp, Inc. | | | 49,058 | |
| | 356 | | | Capital City Bank Group, Inc. | | | 8,437 | |
| | 1,322 | | | Cathay General Bancorp | | | 49,800 | |
| | 2,140 | | | CenterState Bank Corp. | | | 52,601 | |
| | 286 | | | Chemical Financial Corp. | | | 13,402 | |
| | 1,654 | | | Community Bank System, Inc. | | | 96,577 | |
| | 1,121 | | | Community Trust Bancorp, Inc. | | | 51,017 | |
| | 1,364 | | | CVB Financial Corp. | | | 29,803 | |
| | 1,316 | | | FCB Financial Holdings, Inc., Class A* | | | 51,495 | |
| | 128 | | �� | First Busey Corp. | | | 3,574 | |
| | 1,160 | | | First Financial Bancorp | | | 30,357 | |
| | 1,039 | | | First Financial Bankshares, Inc. (a) | | | 61,291 | |
| | 309 | | | First Financial Corp. | | | 14,171 | |
| | 379 | | | First Merchants Corp. | | | 15,770 | |
| | 1,352 | | | First Midwest Bancorp, Inc. | | | 31,042 | |
| | 3,403 | | | Fulton Financial Corp. | | | 54,482 | |
| | 1,302 | | | Glacier Bancorp, Inc. | | | 55,205 | |
| | 1,888 | | | Great Western Bancorp, Inc. | | | 69,195 | |
| | 1,243 | | | Hancock Whitney Corp. | | | 52,156 | |
| | 2,777 | | | Home BancShares, Inc. | | | 52,874 | |
| | 790 | | | IBERIABANK Corp. | | | 58,847 | |
| | 1,473 | | | Independent Bank Corp. | | | 115,557 | |
| | 8,423 | | | Investors Bancorp, Inc. | | | 94,169 | |
| | 1,892 | | | MB Financial, Inc. | | | 83,986 | |
| | 553 | | | NBT Bancorp, Inc. | | | 20,179 | |
| | 1,145 | | | OFG Bancorp (Puerto Rico) | | | 19,568 | |
| | 3,986 | | | Old National Bancorp | | | 71,150 | |
| | 610 | | | Renasant Corp. | | | 21,277 | |
| | 871 | | | Republic Bancorp, Inc., Class A | | | 39,082 | |
| | 970 | | | S&T Bancorp, Inc. | | | 38,907 | |
| | 357 | | | Sandy Spring Bancorp, Inc. | | | 12,691 | |
| | 2,284 | | | Trustmark Corp. | | | 70,347 | |
| | 920 | | | UMB Financial Corp. | | | 58,742 | |
| | 1,706 | | | Union Bankshares Corp. | | | 58,243 | |
| | 2,896 | | | United Community Banks, Inc. | | | 72,024 | |
| | 8,227 | | | Valley National Bancorp | | | 82,105 | |
| | 10,449 | | | Webster Financial Corp. | | | 614,819 | |
| | 2,648 | | | WesBanco, Inc. | | | 106,185 | |
| | 888 | | | Westamerica Bancorp | | | 51,690 | |
| | | | | | | | |
| | | | | | | 2,848,561 | |
| | | | | | | | |
| | | | Beverages — 1.4% | |
| | 2,254 | | | Boston Beer Co., Inc. (The), Class A* | | | 692,632 | |
| | 1,357 | | | Coca-Cola Bottling Co. Consolidated | | | 234,259 | |
SEE NOTES TO FINANCIAL STATEMENTS.
| | | | | | |
| | | |
| 132 | | | | J.P. MORGAN EXCHANGE-TRADED FUNDS | | OCTOBER 31, 2018 |
| | | | | | | | |
| SHARES | | | INVESTMENTS | | VALUE($) | |
| | Common Stocks — continued | |
| | | | Beverages — continued | |
| | 2,571 | | | MGP Ingredients, Inc. (a) | | | 182,978 | |
| | 2,339 | | | National Beverage Corp.* | | | 216,240 | |
| | | | | | | | |
| | | | | | | 1,326,109 | |
| | | | | | | | |
| | | | Biotechnology — 2.2% | |
| | 1,795 | | | Acceleron Pharma, Inc.* | | | 91,132 | |
| | 6,588 | | | Achillion Pharmaceuticals, Inc.* | | | 18,842 | |
| | 2,703 | | | Acorda Therapeutics, Inc.* | | | 51,654 | |
| | 2,061 | | | Aimmune Therapeutics, Inc.* | | | 54,781 | |
| | 912 | | | AMAG Pharmaceuticals, Inc.* | | | 19,608 | |
| | 4,555 | | | Amicus Therapeutics, Inc.* | | | 50,925 | |
| | 599 | | | Arena Pharmaceuticals, Inc.* | | | 21,360 | |
| | 5,973 | | | Array BioPharma, Inc.* | | | 96,763 | |
| | 978 | | | Blueprint Medicines Corp.* | | | 59,433 | |
| | 1,406 | | | Chimerix, Inc.* | | | 4,907 | |
| | 1,274 | | | Dynavax Technologies Corp.* | | | 12,600 | |
| | 1,082 | | | Eagle Pharmaceuticals, Inc.* | | | 53,278 | |
| | 2,273 | | | Emergent BioSolutions, Inc.* | | | 139,085 | |
| | 1,708 | | | Enanta Pharmaceuticals, Inc.* | | | 131,789 | |
| | 1,464 | | | FibroGen, Inc.* | | | 62,762 | |
| | 1,151 | | | Five Prime Therapeutics, Inc.* | | | 13,973 | |
| | 1,291 | | | Genomic Health, Inc.* | | | 92,578 | |
| | 3,159 | | | Halozyme Therapeutics, Inc.* | | | 49,059 | |
| | 2,269 | | | Heron Therapeutics, Inc.* | | | 62,987 | |
| | 1,875 | | | ImmunoGen, Inc.* | | | 10,181 | |
| | 6,555 | | | Inovio Pharmaceuticals, Inc.* | | | 32,316 | |
| | 1,962 | | | Insys Therapeutics, Inc.* (a) | | | 16,736 | |
| | 3,976 | | | Keryx Biopharmaceuticals, Inc.* | | | 11,053 | |
| | 4,107 | | | Lexicon Pharmaceuticals, Inc.* | | | 32,158 | |
| | 583 | | | Ligand Pharmaceuticals, Inc.* | | | 96,084 | |
| | 438 | | | Loxo Oncology, Inc.* | | | 66,865 | |
| | 5,988 | | | MiMedx Group, Inc.* (a) | | | 34,850 | |
| | 2,774 | | | Momenta Pharmaceuticals, Inc.* | | | 34,703 | |
| | 2,710 | | | Myriad Genetics, Inc.* | | | 122,031 | |
| | 1,576 | | | NewLink Genetics Corp.* | | | 2,979 | |
| | 4,582 | | | Novavax, Inc.* | | | 8,064 | |
| | 14,301 | | | PDL BioPharma, Inc.* | | | 35,609 | |
| | 1,971 | | | PTC Therapeutics, Inc.* | | | 75,923 | |
| | 3,071 | | | Repligen Corp.* | | | 166,510 | |
| | 3,383 | | | Retrophin, Inc.* | | | 86,808 | |
| | 1,646 | | | Sangamo Therapeutics, Inc.* | | | 20,855 | |
| | 1,242 | | | Spark Therapeutics, Inc.* | | | 55,878 | |
| | 3,068 | | | Spectrum Pharmaceuticals, Inc.* | | | 36,509 | |
| | 4,341 | | | Vanda Pharmaceuticals, Inc.* | | | 82,349 | |
| | | | | | | | |
| | | | | | | 2,115,977 | |
| | | | | | | | |
| | | | | | | | |
| SHARES | | | INVESTMENTS | | VALUE($) | |
| | | | | | | | |
| | | | Building Products — 0.9% | |
| | 2,308 | | | Advanced Drainage Systems, Inc. | | | 64,139 | |
| | 1,810 | | | American Woodmark Corp.* | | | 109,396 | |
| | 2,498 | | | Apogee Enterprises, Inc. | | | 90,178 | |
| | 3,551 | | | Builders FirstSource, Inc.* | | | 43,961 | |
| | 1,340 | | | Gibraltar Industries, Inc.* | | | 47,758 | |
| | 3,193 | | | Griffon Corp. | | | 38,699 | |
| | 2,243 | | | JELD-WEN Holding, Inc.* | | | 36,471 | |
| | 1,118 | | | Masonite International Corp.* | | | 61,926 | |
| | 392 | | | NCI Building Systems, Inc.* | | | 4,802 | |
| | 1,403 | | | Patrick Industries, Inc.* | | | 61,045 | |
| | 2,736 | | | Quanex Building Products Corp. | | | 40,548 | |
| | 1,986 | | | Simpson Manufacturing Co., Inc. | | | 113,361 | |
| | 713 | | | Trex Co., Inc.* | | | 43,707 | |
| | 4,633 | | | Universal Forest Products, Inc. | | | 130,975 | |
| | | | | | | | |
| | | | | | | 886,966 | |
| | | | | | | | |
| | | | Capital Markets — 0.1% | |
| | 2,403 | | | Blucora, Inc.* | | | 69,495 | |
| | | | | | | | |
| | | | Chemicals — 3.1% | |
| | 2,262 | | | AdvanSix, Inc.* | | | 62,748 | |
| | 1,796 | | | American Vanguard Corp. | | | 28,916 | |
| | 2,611 | | | Balchem Corp. | | | 244,520 | |
| | 8,734 | | | Ferro Corp.* | | | 147,954 | |
| | 184 | | | Flotek Industries, Inc.* | | | 333 | |
| | 3,321 | | | GCP Applied Technologies, Inc.* | | | 86,246 | |
| | 5,582 | | | HB Fuller Co. | | | 248,176 | |
| | 2,397 | | | Ingevity Corp.* | | | 218,319 | |
| | 1,662 | | | Innophos Holdings, Inc. | | | 48,697 | |
| | 2,724 | | | Innospec, Inc. | | | 182,290 | |
| | 967 | | | KMG Chemicals, Inc. | | | 72,544 | |
| | 1,370 | | | Koppers Holdings, Inc.* | | | 36,647 | |
| | 4,110 | | | Kraton Corp.* | | | 113,189 | |
| | 1,756 | | | LSB Industries, Inc.* | | | 13,346 | |
| | 7,771 | | | Minerals Technologies, Inc. | | | 425,462 | |
| | 4,019 | | | PolyOne Corp. | | | 129,854 | |
| | 5,011 | | | Rayonier Advanced Materials, Inc. | | | 62,036 | |
| | 7,369 | | | Sensient Technologies Corp. | | | 477,953 | |
| | 1,984 | | | Stepan Co. | | | 163,859 | |
| | 1,973 | | | Tredegar Corp. | | | 36,698 | |
| | 2,466 | | | Trinseo SA | | | 132,868 | |
| | 3,970 | | | Tronox Ltd., Class A | | | 45,457 | |
| | | | | | | | |
| | | | | | | 2,978,112 | |
| | | | | | | | |
| | | | Commercial Services & Supplies — 3.9% | |
| | 2,685 | | | ABM Industries, Inc. | | | 82,564 | |
| | 19,155 | | | ACCO Brands Corp. | | | 154,581 | |
SEE NOTES TO FINANCIAL STATEMENTS.
| | | | | | | | |
| | | |
| OCTOBER 31, 2018 | | J.P. MORGAN EXCHANGE-TRADED FUNDS | | | | | 133 | |
JPMorgan Diversified Return U.S. Small Cap Equity ETF
SCHEDULE OF PORTFOLIO INVESTMENTS
AS OF OCTOBER 31, 2018 (continued)
| | | | | | | | |
| SHARES | | | INVESTMENTS | | VALUE($) | |
| | Common Stocks — continued | |
| | | | Commercial Services & Supplies — continued | |
| | 1,408 | | | Brady Corp., Class A | | | 56,728 | |
| | 1,246 | | | Brink’s Co. (The) | | | 82,635 | |
| | 577 | | | Cimpress NV (Netherlands)* | | | 72,119 | |
| | 858 | | | CompX International, Inc. | | | 11,188 | |
| | 5,919 | | | Covanta Holding Corp. | | | 86,950 | |
| | 1,273 | | | Deluxe Corp. | | | 60,098 | |
| | 1,529 | | | Essendant, Inc. | | | 19,479 | |
| | 6,899 | | | Healthcare Services Group, Inc. | | | 280,030 | |
| | 8,628 | | | Herman Miller, Inc. | | | 284,293 | |
| | 6,340 | | | HNI Corp. | | | 240,223 | |
| | 20,110 | | | Interface, Inc. | | | 327,592 | |
| | 2,839 | | | Kimball International, Inc., Class B | | | 46,730 | |
| | 8,854 | | | Knoll, Inc. | | | 175,752 | |
| | 2,357 | | | Matthews International Corp., Class A | | | 98,098 | |
| | 1,544 | | | McGrath RentCorp | | | 82,434 | |
| | 396 | | | Mobile Mini, Inc. | | | 16,284 | |
| | 1,324 | | | MSA Safety, Inc. | | | 138,279 | |
| | 968 | | | Multi-Color Corp. | | | 51,459 | |
| | 11,718 | | | Pitney Bowes, Inc. | | | 77,573 | |
| | 11,371 | | | Rollins, Inc. | | | 673,163 | |
| | 12,567 | | | Steelcase, Inc., Class A | | | 208,612 | |
| | 1,146 | | | Team, Inc.* | | | 22,805 | |
| | 2,647 | | | Tetra Tech, Inc. | | | 174,808 | |
| | 1,235 | | | UniFirst Corp. | | | 184,386 | |
| | 1,159 | | | Viad Corp. | | | 55,505 | |
| | 1,889 | | | Virco Manufacturing Corp. | | | 8,179 | |
| | | | | | | | |
| | | | | | | 3,772,547 | |
| | | | | | | | |
| | | | Communications Equipment — 1.4% | |
| | 1,717 | | | Acacia Communications, Inc.* | | | 59,185 | |
| | 6,589 | | | ADTRAN, Inc. | | | 88,556 | |
| | 2,437 | | | CalAmp Corp.* | | | 48,594 | |
| | 3,227 | | | Ciena Corp.* | | | 100,876 | |
| | 3,015 | | | Comtech Telecommunications Corp. | | | 84,179 | |
| | 7,041 | | | Extreme Networks, Inc.* | | | 39,078 | |
| | 2,723 | | | Finisar Corp.* | | | 45,447 | |
| | 4,986 | | | Harmonic, Inc.* | | | 27,473 | |
| | 14,402 | | | Inseego Corp.* (a) | | | 50,839 | |
| | 1,491 | | | InterDigital, Inc. | | | 105,786 | |
| | 1,049 | | | Lumentum Holdings, Inc.* | | | 57,328 | |
| | 1,481 | | | NETGEAR, Inc.* | | | 82,166 | |
| | 2,163 | | | NetScout Systems, Inc.* | | | 54,637 | |
| | 7,425 | | | Oclaro, Inc.* | | | 61,033 | |
| | 1,934 | | | Plantronics, Inc. | | | 114,048 | |
| | 1,005 | | | Ribbon Communications, Inc.* | | | 6,834 | |
| | 1,917 | | | ViaSat, Inc.* (a) | | | 122,228 | |
| | | | | | | | |
| SHARES | | | INVESTMENTS | | VALUE($) | |
| | | | | | | | |
| | | | Communications Equipment — continued | |
| | 16,191 | | | Viavi Solutions, Inc.* | | | 186,682 | |
| | | | | | | | |
| | | | | | | 1,334,969 | |
| | | | | | | | |
| | | | Construction & Engineering — 0.7% | |
| | 2,062 | | | Aegion Corp.* | | | 39,920 | |
| | 1,001 | | | Argan, Inc. | | | 44,064 | |
| | 2,976 | | | Comfort Systems USA, Inc. | | | 159,157 | |
| | 907 | | | Dycom Industries, Inc.* | | | 61,567 | |
| | 1,493 | | | EMCOR Group, Inc. | | | 105,973 | |
| | 729 | | | Granite Construction, Inc. | | | 33,330 | |
| | 3,738 | | | KBR, Inc. | | | 73,938 | |
| | 1,942 | | | MasTec, Inc.* | | | 84,496 | |
| | 1,994 | | | Tutor Perini Corp.* | | | 30,907 | |
| | | | | | | | |
| | | | | | | 633,352 | |
| | | | | | | | |
| | | | Construction Materials — 0.0% (b) | |
| | 1,007 | | | US Concrete, Inc.* | | | 32,869 | |
| | | | | | | | |
| | | | Consumer Finance — 0.2% | |
| | 1,449 | | | Encore Capital Group, Inc.* | | | 36,819 | |
| | 1,165 | | | EZCORP, Inc., Class A* | | | 11,580 | |
| | 1,001 | | | FirstCash, Inc. | | | 80,480 | |
| | 965 | | | PRA Group, Inc.* | | | 29,761 | |
| | 427 | | | World Acceptance Corp.* | | | 43,336 | |
| | | | | | | | |
| | | | | | | 201,976 | |
| | | | | | | | |
| | | | Containers & Packaging — 0.1% | |
| | 1,865 | | | Greif, Inc., Class A | | | 88,214 | |
| | 1,838 | | | Myers Industries, Inc. | | | 29,151 | |
| | | | | | | | |
| | | | | | | 117,365 | |
| | | | | | | | |
| | | | Distributors — 0.8% | |
| | 1,846 | | | Core-Mark Holding Co., Inc. | | | 70,905 | |
| | 2,864 | | | Funko, Inc., Class A* | | | 53,987 | |
| | 4,159 | | | Pool Corp. | | | 606,174 | |
| | | | | | | | |
| | | | | | | 731,066 | |
| | | | | | | | |
| | | | Diversified Consumer Services — 0.8% | |
| | 3,086 | | | Adtalem Global Education, Inc.* | | | 156,244 | |
| | 2,523 | | | American Public Education, Inc.* | | | 82,578 | |
| | 2,316 | | | Bridgepoint Education, Inc.* | | | 22,233 | |
| | 1,598 | | | Carriage Services, Inc. | | | 30,458 | |
| | 4,965 | | | Chegg, Inc.* | | | 135,445 | |
| | 650 | | | Houghton Mifflin Harcourt Co.* | | | 4,355 | |
| | 353 | | | K12, Inc.* | | | 7,558 | |
| | 4,008 | | | Regis Corp.* | | | 67,495 | |
| | 1,702 | | | Sotheby’s* | | | 71,484 | |
| | 679 | | | Strategic Education, Inc. | | | 85,432 | |
| | 3,232 | | | Universal Technical Institute, Inc.* | | | 8,500 | |
SEE NOTES TO FINANCIAL STATEMENTS.
| | | | | | |
| | | |
| 134 | | | | J.P. MORGAN EXCHANGE-TRADED FUNDS | | OCTOBER 31, 2018 |
| | | | | | | | |
| SHARES | | | INVESTMENTS | | VALUE($) | |
| | Common Stocks — continued | |
| | | | Diversified Consumer Services — continued | |
| | 1,358 | | | Weight Watchers International, Inc.* | | | 89,764 | |
| | | | | | | | |
| | | | | | | 761,546 | |
| | | | | | | | |
| | | | Diversified Telecommunication Services — 2.0% | |
| | 6,812 | | | Alaska Communications Systems Group, Inc.* | | | 9,946 | |
| | 3,367 | | | Cogent Communications Holdings, Inc. | | | 175,017 | |
| | 8,772 | | | IDT Corp., Class B* | | | 61,755 | |
| | 11,958 | | | Intelsat SA* | | | 311,625 | |
| | 33,736 | | | Iridium Communications, Inc.* | | | 668,310 | |
| | 48,177 | | | Vonage Holdings Corp.* | | | 638,827 | |
| | 11,159 | | | Windstream Holdings, Inc.* | | | 45,975 | |
| | | | | | | | |
| | | | | | | 1,911,455 | |
| | | | | | | | |
| | | | Electric Utilities — 3.6% | |
| | 8,026 | | | ALLETE, Inc. | | | 593,924 | |
| | 10,233 | | | El Paso Electric Co. | | | 583,793 | |
| | 6,464 | | | IDACORP, Inc. | | | 602,833 | |
| | 3,690 | | | MGE Energy, Inc. | | | 230,551 | |
| | 4,444 | | | Otter Tail Corp. | | | 200,291 | |
| | 17,211 | | | PNM Resources, Inc. | | | 661,075 | |
| | 10,904 | | | Portland General Electric Co. | | | 491,552 | |
| | 10,790 | | | Spark Energy, Inc., Class A (a) | | | 80,493 | |
| | | | | | | | |
| | | | | | | 3,444,512 | |
| | | | | | | | |
| | | | Electrical Equipment — 0.7% | |
| | 2,234 | | | AZZ, Inc. | | | 99,078 | |
| | 1,618 | | | Encore Wire Corp. | | | 71,516 | |
| | 1,244 | | | EnerSys | | | 98,985 | |
| | 1,154 | | | Generac Holdings, Inc.* | | | 58,542 | |
| | 6,083 | | | LSI Industries, Inc. | | | 26,278 | |
| | 22,788 | | | Sunrun, Inc.* | | | 279,381 | |
| | 836 | | | Vicor Corp.* | | | 33,524 | |
| | | | | | | | |
| | | | | | | 667,304 | |
| | | | | | | | |
| | | | Electronic Equipment, Instruments & Components — 1.6% | |
| | 1,072 | | | Anixter International, Inc.* | | | 70,420 | |
| | 2,323 | | | Badger Meter, Inc. | | | 114,082 | |
| | 1,036 | | | Belden, Inc. | | | 55,996 | |
| | 1,500 | | | Benchmark Electronics, Inc. | | | 32,745 | |
| | 648 | | | CTS Corp. | | | 17,295 | |
| | 3,463 | | | Daktronics, Inc. | | | 25,314 | |
| | 1,865 | | | Fabrinet (Thailand)* | | | 80,792 | |
| | 1,107 | | | II-VI, Inc.* | | | 41,214 | |
| | 3,845 | | | Insight Enterprises, Inc.* | | | 198,748 | |
| | 954 | | | Itron, Inc.* | | | 49,742 | |
| | 1,519 | | | Methode Electronics, Inc. | | | 44,962 | |
| | 2,778 | | | MTS Systems Corp. | | | 131,538 | |
| | | | | | | | |
| SHARES | | | INVESTMENTS | | VALUE($) | |
| | | | | | | | |
| | | | Electronic Equipment, Instruments & Components — continued | |
| | 1,177 | | | Novanta, Inc.* | | | 68,513 | |
| | 2,014 | | | Park Electrochemical Corp. | | | 35,567 | |
| | 1,904 | | | PC Connection, Inc. | | | 63,099 | |
| | 1,785 | | | Plexus Corp.* | | | 104,244 | |
| | 468 | | | Rogers Corp.* | | | 57,592 | |
| | 1,818 | | | ScanSource, Inc.* | | | 70,684 | |
| | 1,767 | | | SYNNEX Corp. | | | 137,137 | |
| | 1,126 | | | Tech Data Corp.* | | | 79,563 | |
| | 2,751 | | | TTM Technologies, Inc.* | | | 32,187 | |
| | 3,548 | | | Vishay Intertechnology, Inc. | | | 64,928 | |
| | | | | | | | |
| | | | | | | 1,576,362 | |
| | | | | | | | |
| | | | Energy Equipment & Services — 1.5% | |
| | 4,214 | | | Archrock, Inc. | | | 43,236 | |
| | 2,589 | | | Bristow Group, Inc.* | | | 28,505 | |
| | 4,137 | | | C&J Energy Services, Inc.* | | | 77,693 | |
| | 2,247 | | | CARBO Ceramics, Inc.* | | | 10,853 | |
| | 3,070 | | | Covia Holdings Corp.* | | | 17,745 | |
| | 7,356 | | | Diamond Offshore Drilling, Inc.* (a) | | | 104,308 | |
| | 736 | | | Geospace Technologies Corp.* | | | 9,369 | |
| | 2,763 | | | Gulf Island Fabrication, Inc. | | | 23,485 | |
| | 13,733 | | | Helix Energy Solutions Group, Inc.* | | | 117,005 | |
| | 609 | | | KLX Energy Services Holdings, Inc.* | | | 17,594 | |
| | 2,720 | | | Matrix Service Co.* | | | 55,298 | |
| | 4,710 | | | McDermott International, Inc.* | | | 36,408 | |
| | 5,428 | | | Newpark Resources, Inc.* | | | 44,564 | |
| | 21,120 | | | Noble Corp. plc* | | | 106,022 | |
| | 4,524 | | | Oceaneering International, Inc.* | | | 85,685 | |
| | 1,847 | | | Oil States International, Inc.* | | | 41,133 | |
| | 7,026 | | | Pioneer Energy Services Corp.* | | | 20,867 | |
| | 7,323 | | | ProPetro Holding Corp.* | | | 129,251 | |
| | 8,131 | | | Rowan Cos. plc, Class A* | | | 129,364 | |
| | 3,386 | | | SEACOR Holdings, Inc.* | | | 162,494 | |
| | 4,766 | | | TETRA Technologies, Inc.* | | | 14,155 | |
| | 3,997 | | | Unit Corp.* | | | 92,451 | |
| | 5,542 | | | US Silica Holdings, Inc. (a) | | | 77,588 | |
| | | | | | | | |
| | | | | | | 1,445,073 | |
| | | | | | | | |
| | | | Entertainment — 0.5% | |
| | 2,511 | | | AMC Entertainment Holdings, Inc., Class A | | | 48,362 | |
| | 5,478 | | | Liberty Media Corp.-Liberty Formula One, Class A* | | | 173,598 | |
| | 1,049 | | | Marcus Corp. (The) | | | 40,932 | |
| | 3,400 | | | Rosetta Stone, Inc.* | | | 70,686 | |
| | 1,569 | | | World Wrestling Entertainment, Inc., Class A | | | 113,893 | |
| | | | | | | | |
| | | | | | | 447,471 | |
| | | | | | | | |
SEE NOTES TO FINANCIAL STATEMENTS.
| | | | | | | | |
| | | |
| OCTOBER 31, 2018 | | J.P. MORGAN EXCHANGE-TRADED FUNDS | | | | | 135 | |
JPMorgan Diversified Return U.S. Small Cap Equity ETF
SCHEDULE OF PORTFOLIO INVESTMENTS
AS OF OCTOBER 31, 2018 (continued)
| | | | | | | | |
| SHARES | | | INVESTMENTS | | VALUE($) | |
| | Common Stocks — continued | |
| | | | Equity Real Estate Investment Trusts (REITs) — 2.1% | |
| | 356 | | | Acadia Realty Trust | | | 9,911 | |
| | 1,277 | | | Agree Realty Corp. | | | 73,134 | |
| | 2,499 | | | American Assets Trust, Inc. | | | 95,862 | |
| | 3,018 | | | CareTrust REIT, Inc. | | | 53,298 | |
| | 398 | | | Chesapeake Lodging Trust | | | 11,697 | |
| | 1,228 | | | CorePoint Lodging, Inc. | | | 20,102 | |
| | 5,228 | | | Cousins Properties, Inc. | | | 43,445 | |
| | 2,891 | | | DiamondRock Hospitality Co. | | | 30,211 | |
| | 721 | | | EastGroup Properties, Inc. | | | 69,064 | |
| | 3,182 | | | First Industrial Realty Trust, Inc. | | | 97,687 | |
| | 3,014 | | | Four Corners Property Trust, Inc. | | | 78,605 | |
| | 3,377 | | | Franklin Street Properties Corp. | | | 23,504 | |
| | 2,206 | | | GEO Group, Inc. (The) | | | 48,775 | |
| | 312 | | | Healthcare Realty Trust, Inc. | | | 8,692 | |
| | 299 | | | Kite Realty Group Trust | | | 4,736 | |
| | 1,706 | | | Lexington Realty Trust | | | 13,256 | |
| | 4,023 | | | LTC Properties, Inc. | | | 172,064 | |
| | 797 | | | Mack-Cali Realty Corp. | | | 16,179 | |
| | 1,117 | | | National Health Investors, Inc. | | | 82,055 | |
| | 1,803 | | | Pebblebrook Hotel Trust | | | 60,779 | |
| | 1,558 | | | Pennsylvania REIT | | | 13,944 | |
| | 4,463 | | | Piedmont Office Realty Trust, Inc., Class A | | | 80,423 | |
| | 1,225 | | | PotlatchDeltic Corp. | | | 44,406 | |
| | 916 | | | PS Business Parks, Inc. | | | 119,630 | |
| | 3,107 | | | Ramco-Gershenson Properties Trust | | | 41,261 | |
| | 423 | | | Retail Opportunity Investments Corp. | | | 7,440 | |
| | 2,994 | | | Rexford Industrial Realty, Inc. | | | 94,820 | |
| | 3,133 | | | RLJ Lodging Trust | | | 60,905 | |
| | 871 | | | Ryman Hospitality Properties, Inc. | | | 67,581 | |
| | 2,509 | | | Sabra Health Care REIT, Inc. | | | 54,320 | |
| | 880 | | | Saul Centers, Inc. | | | 42,029 | |
| | 2,159 | | | Select Income REIT | | | 40,827 | |
| | 2,555 | | | STAG Industrial, Inc. | | | 67,605 | |
| | 3,496 | | | Summit Hotel Properties, Inc. | | | 40,274 | |
| | 1,874 | | | Sunstone Hotel Investors, Inc. | | | 27,117 | |
| | 1,625 | | | Terreno Realty Corp. | | | 60,824 | |
| | 290 | | | Urban Edge Properties | | | 5,942 | |
| | 2,140 | | | Washington REIT | | | 59,642 | |
| | 2,867 | | | Xenia Hotels & Resorts, Inc. | | | 58,917 | |
| | | | | | | | |
| | | | | | | 2,000,963 | |
| | | | | | | | |
| | | | Food & Staples Retailing — 0.6% | |
| | 5,810 | | | Andersons, Inc. (The) | | | 209,160 | |
| | 1,333 | | | Ingles Markets, Inc., Class A | | | 43,909 | |
| | 2,827 | | | Performance Food Group Co.* | | | 82,888 | |
| | 1,254 | | | PriceSmart, Inc. | | | 87,968 | |
| | | | | | | | |
| SHARES | | | INVESTMENTS | | VALUE($) | |
| | | | | | | | |
| | | | Food & Staples Retailing — continued | |
| | 5,518 | | | SpartanNash Co. | | | 98,496 | |
| | 1,981 | | | United Natural Foods, Inc.* | | | 43,047 | |
| | | | | | | | |
| | | | | | | 565,468 | |
| | | | | | | | |
| | | | Food Products — 3.3% | |
| | 6,297 | | | B&G Foods, Inc. (a) | | | 163,974 | |
| | 2,584 | | | Calavo Growers, Inc. (a) | | | 250,648 | |
| | 4,669 | | | Cal-Maine Foods, Inc. | | | 227,240 | |
| | 12,594 | | | Darling Ingredients, Inc.* | | | 260,192 | |
| | 12,150 | | | Dean Foods Co. | | | 97,079 | |
| | 504 | | | Farmer Brothers Co.* | | | 12,152 | |
| | 11,645 | | | Fresh Del Monte Produce, Inc. | | | 384,634 | |
| | 15,068 | | | Hostess Brands, Inc.* | | | 156,707 | |
| | 2,805 | | | J&J Snack Foods Corp. | | | 438,029 | |
| | 4,372 | | | Lancaster Colony Corp. | | | 749,273 | |
| | 2,039 | | | Sanderson Farms, Inc. (a) | | | 200,617 | |
| | 17 | | | Seaboard Corp. | | | 65,705 | |
| | 5,620 | | | Tootsie Roll Industries, Inc. | | | 177,423 | |
| | | | | | | | |
| | | | | | | 3,183,673 | |
| | | | | | | | |
| | | | Gas Utilities — 3.7% | |
| | 16,447 | | | New Jersey Resources Corp. | | | 741,760 | |
| | 5,689 | | | Northwest Natural Holding Co. | | | 368,590 | |
| | 8,166 | | | ONE Gas, Inc. | | | 644,379 | |
| | 21,605 | | | South Jersey Industries, Inc. | | | 638,212 | |
| | 6,972 | | | Southwest Gas Holdings, Inc. | | | 538,726 | |
| | 9,164 | | | Spire, Inc. | | | 665,123 | |
| | | | | | | | |
| | | | | | | 3,596,790 | |
| | | | | | | | |
| | | | Health Care Equipment & Supplies — 5.0% | |
| | 6,497 | | | Accuray, Inc.* | | | 29,172 | |
| | 1,609 | | | Anika Therapeutics, Inc.* | | | 57,538 | |
| | 2,109 | | | Avanos Medical, Inc.* | | | 119,369 | |
| | 1,697 | | | AxoGen, Inc.* | | | 63,281 | |
| | 1,269 | | | Cantel Medical Corp. | | | 100,441 | |
| | 4,143 | | | CONMED Corp. | | | 279,362 | |
| | 3,176 | | | Globus Medical, Inc., Class A* | | | 167,852 | |
| | 3,370 | | | Haemonetics Corp.* | | | 352,064 | |
| | 2,233 | | | ICU Medical, Inc.* | | | 568,812 | |
| | 345 | | | Inogen, Inc.* | | | 65,402 | |
| | 2,567 | | | Integer Holdings Corp.* | | | 191,164 | |
| | 7,187 | | | Invacare Corp. | | | 92,856 | |
| | 1,602 | | | iRhythm Technologies, Inc.* | | | 123,770 | |
| | 1,084 | | | LivaNova plc* | | | 121,397 | |
| | 4,681 | | | Meridian Bioscience, Inc. | | | 75,879 | |
| | 4,532 | | | Merit Medical Systems, Inc.* | | | 258,868 | |
| | 5,604 | | | Natus Medical, Inc.* | | | 167,448 | |
SEE NOTES TO FINANCIAL STATEMENTS.
| | | | | | |
| | | |
| 136 | | | | J.P. MORGAN EXCHANGE-TRADED FUNDS | | OCTOBER 31, 2018 |
| | | | | | | | |
| SHARES | | | INVESTMENTS | | VALUE($) | |
| | Common Stocks — continued | |
| | | | Health Care Equipment & Supplies — continued | |
| | 3,067 | | | Neogen Corp.* | | | 186,228 | |
| | 2,543 | | | Novocure Ltd.* | | | 84,275 | |
| | 2,163 | | | NuVasive, Inc.* | | | 121,496 | |
| | 5,904 | | | NxStage Medical, Inc.* | | | 167,556 | |
| | 4,780 | | | OraSure Technologies, Inc.* | | | 66,442 | |
| | 1,454 | | | Orthofix Medical, Inc.* | | | 88,432 | |
| | 4,328 | | | Quidel Corp.* | | | 278,550 | |
| | 1,470 | | | STAAR Surgical Co.* | | | 58,962 | |
| | 2,036 | | | Surmodics, Inc.* | | | 129,143 | |
| | 1,396 | | | Tactile Systems Technology, Inc.* | | | 91,410 | |
| | 2,837 | | | Varex Imaging Corp.* | | | 73,649 | |
| | 5,836 | | | West Pharmaceutical Services, Inc. | | | 618,149 | |
| | | | | | | | |
| | | | | | | 4,798,967 | |
| | | | | | | | |
| | | | Health Care Providers & Services — 1.7% | |
| | 1,043 | | | Amedisys, Inc.* | | | 114,730 | |
| | 1,899 | | | AMN Healthcare Services, Inc.* | | | 96,127 | |
| | 1,553 | | | BioScrip, Inc.* | | | 4,162 | |
| | 974 | | | BioTelemetry, Inc.* | | | 56,589 | |
| | 649 | | | Chemed Corp. | | | 197,510 | |
| | 1,745 | | | Diplomat Pharmacy, Inc.* | | | 34,621 | |
| | 3,783 | | | Genesis Healthcare, Inc.* | | | 5,826 | |
| | 1,127 | | | HealthEquity, Inc.* | | | 103,459 | |
| | 2,980 | | | LHC Group, Inc.* | | | 272,461 | |
| | 1,232 | | | LifePoint Health, Inc.* | | | 79,908 | |
| | 2,526 | | | Magellan Health, Inc.* | | | 164,342 | |
| | 4,828 | | | Owens & Minor, Inc. | | | 38,141 | |
| | 5,110 | | | Patterson Cos., Inc. | | | 115,384 | |
| | 4,784 | | | Select Medical Holdings Corp.* | | | 79,319 | |
| | 2,155 | | | Tenet Healthcare Corp.* | | | 55,448 | |
| | 6,181 | | | Tivity Health, Inc.* | | | 212,688 | |
| | | | | | | | |
| | | | | | | 1,630,715 | |
| | | | | | | | |
| | | | Health Care Technology — 1.0% | |
| | 8,204 | | | Allscripts Healthcare Solutions, Inc.* | | | 97,709 | |
| | 1,260 | | | Computer Programs & Systems, Inc. | | | 31,500 | |
| | 3,416 | | | HMS Holdings Corp.* | | | 98,449 | |
| | 1,756 | | | Medidata Solutions, Inc.* | | | 123,447 | |
| | 6,564 | | | Omnicell, Inc.* | | | 464,075 | |
| | 1,233 | | | Tabula Rasa HealthCare, Inc.* | | | 91,094 | |
| | 1,023 | | | Teladoc Health, Inc.* | | | 70,935 | |
| | | | | | | | |
| | | | | | | 977,209 | |
| | | | | | | | |
| | | | Hotels, Restaurants & Leisure — 3.3% | |
| | 6,418 | | | Belmond Ltd., Class A (United Kingdom)* | | | 109,876 | |
| | 105 | | | Biglari Holdings, Inc., Class A* | | | 78,750 | |
| | 1,953 | | | BJ’s Restaurants, Inc. | | | 119,485 | |
| | | | | | | | |
| SHARES | | | INVESTMENTS | | VALUE($) | |
| | | | | | | | |
| | | | Hotels, Restaurants & Leisure — continued | |
| | 4,109 | | | Bloomin’ Brands, Inc. | | | 81,975 | |
| | 4,317 | | | Boyd Gaming Corp. | | | 114,660 | |
| | 3,255 | | | Brinker International, Inc. (a) | | | 141,104 | |
| | 3,529 | | | Cheesecake Factory, Inc. (The) | | | 170,592 | |
| | 675 | | | Churchill Downs, Inc. | | | 168,487 | |
| | 1,758 | | | Chuy’s Holdings, Inc.* | | | 42,842 | |
| | 997 | | | Cracker Barrel Old Country Store, Inc. (a) | | | 158,204 | |
| | 1,757 | | | Dave & Buster’s Entertainment, Inc. | | | 104,629 | |
| | 2,405 | | | Dine Brands Global, Inc. | | | 194,901 | |
| | 4,563 | | | Dover Motorsports, Inc. | | | 9,810 | |
| | 4,942 | | | El Pollo Loco Holdings, Inc.* | | | 61,824 | |
| | 3,283 | | | Eldorado Resorts, Inc.* | | | 119,830 | |
| | 1,377 | | | Fiesta Restaurant Group, Inc.* | | | 35,540 | |
| | 1,477 | | | Marriott Vacations Worldwide Corp. | | | 130,700 | |
| | 1,997 | | | Noodles & Co.* | | | 18,832 | |
| | 91 | | | OBH Inc.* | | | 12,967 | |
| | 7,956 | | | Penn National Gaming, Inc.* | | | 193,172 | |
| | 3,068 | | | Planet Fitness, Inc., Class A* | | | 150,608 | |
| | 4,230 | | | Red Robin Gourmet Burgers, Inc.* | | | 127,746 | |
| | 3,702 | | | Red Rock Resorts, Inc., Class A | | | 85,664 | |
| | 2,862 | | | Ruth’s Hospitality Group, Inc. | | | 77,360 | |
| | 2,212 | | | Shake Shack, Inc., Class A* | | | 116,993 | |
| | 4,598 | | | Sonic Corp. | | | 199,001 | |
| | 3,211 | | | Texas Roadhouse, Inc. | | | 194,137 | |
| | 2,377 | | | Wingstop, Inc. | | | 148,848 | |
| | | | | | | | |
| | | | | | | 3,168,537 | |
| | | | | | | | |
| | | | Household Durables — 3.6% | |
| | 2,345 | | | Bassett Furniture Industries, Inc. | | | 46,314 | |
| | 10,886 | | | Ethan Allen Interiors, Inc. | | | 208,358 | |
| | 5,743 | | | Helen of Troy Ltd.* | | | 712,821 | |
| | 2,091 | | | iRobot Corp.* (a) | | | 184,364 | |
| | 8,469 | | | KB Home | | | 169,126 | |
| | 11,269 | | | La-Z-Boy, Inc. | | | 313,278 | |
| | 4,733 | | | LGI Homes, Inc.* (a) | | | 202,525 | |
| | 8,778 | | | M/I Homes, Inc.* | | | 212,164 | |
| | 11,339 | | | MDC Holdings, Inc. | | | 318,626 | |
| | 5,622 | | | Meritage Homes Corp.* | | | 209,420 | |
| | 3,594 | | | Skyline Champion Corp. | | | 85,645 | |
| | 9,743 | | | Taylor Morrison Home Corp., Class A* | | | 161,149 | |
| | 2,205 | | | TopBuild Corp.* | | | 100,592 | |
| | 16,128 | | | TRI Pointe Group, Inc.* | | | 191,923 | |
| | 3,333 | | | Universal Electronics, Inc.* | | | 104,223 | |
| | 18,407 | | | ZAGG, Inc.* | | | 222,909 | |
| | | | | | | | |
| | | | | | | 3,443,437 | |
| | | | | | | | |
SEE NOTES TO FINANCIAL STATEMENTS.
| | | | | | | | |
| | | |
| OCTOBER 31, 2018 | | J.P. MORGAN EXCHANGE-TRADED FUNDS | | | | | 137 | |
JPMorgan Diversified Return U.S. Small Cap Equity ETF
SCHEDULE OF PORTFOLIO INVESTMENTS
AS OF OCTOBER 31, 2018 (continued)
| | | | | | | | |
| SHARES | | | INVESTMENTS | | VALUE($) | |
| | Common Stocks — continued | |
| | | | Household Products — 0.9% | |
| | 4,371 | | | Central Garden & Pet Co.* | | | 141,970 | |
| | 8,015 | | | Central Garden & Pet Co., Class A* | | | 237,645 | |
| | 3,159 | | | WD-40 Co. | | | 527,806 | |
| | | | | | | | |
| | | | | | | 907,421 | |
| | | | | | | | |
| | | | Independent Power and Renewable Electricity
Producers — 1.0% | |
| | 1,743 | | | Atlantica Yield plc (Spain) | | | 34,180 | |
| | 2,455 | | | Clearway Energy, Inc., Class A | | | 47,676 | |
| | 3,550 | | | Clearway Energy, Inc., Class C | | | 69,615 | |
| | 7,939 | | | Ormat Technologies, Inc. | | | 406,239 | |
| | 16,456 | | | Pattern Energy Group, Inc., Class A | | | 294,892 | |
| | 13,165 | | | TerraForm Power, Inc., Class A | | | 148,370 | |
| | | | | | | | |
| | | | | | | 1,000,972 | |
| | | | | | | | |
| | | | Insurance — 1.0% | |
| | 3,420 | | | CNO Financial Group, Inc. | | | 64,638 | |
| | 420 | | | Crawford & Co., Class B | | | 3,868 | |
| | 1,896 | | | Employers Holdings, Inc. | | | 87,140 | |
| | 926 | | | FBL Financial Group, Inc., Class A | | | 63,875 | |
| | 1,531 | | | Horace Mann Educators Corp. | | | 60,138 | |
| | 129 | | | National Western Life Group, Inc., Class A | | | 34,737 | |
| | 1,716 | | | Navigators Group, Inc. (The) | | | 118,661 | |
| | 514 | | | Primerica, Inc. | | | 56,406 | |
| | 317 | | | Protective Insurance Corp., Class B | | | 7,307 | |
| | 1,174 | | | RLI Corp. | | | 86,794 | |
| | 867 | | | Safety Insurance Group, Inc. | | | 72,204 | |
| | 3,648 | | | Selective Insurance Group, Inc. | | | 236,573 | |
| | 1,663 | | | State Auto Financial Corp. | | | 52,867 | |
| | 1,352 | | | Stewart Information Services Corp. | | | 55,811 | |
| | | | | | | | |
| | | | | | | 1,001,019 | |
| | | | | | | | |
| | | | Interactive Media & Services — 0.4% | |
| | 4,752 | | | Cars.com, Inc.* | | | 124,075 | |
| | 13,582 | | | Meet Group, Inc. (The)* | | | 59,897 | |
| | 417 | | | Travelzoo* | | | 3,198 | |
| | 3,693 | | | XO Group, Inc.* | | | 127,815 | |
| | 2,542 | | | Yelp, Inc.* | | | 108,848 | |
| | | | | | | | |
| | | | | | | 423,833 | |
| | | | | | | | |
| | | | Internet & Direct Marketing Retail — 0.9% | |
| | 2,153 | | | Etsy, Inc.* | | | 91,546 | |
| | 1,881 | | | Lands’ End, Inc.* | | | 30,679 | |
| | 1,080 | | | Liquidity Services, Inc.* | | | 6,415 | |
| | 11,317 | | | Nutrisystem, Inc. | | | 402,432 | |
| | 1,731 | | | PetMed Express, Inc. | | | 48,364 | |
| | 1,205 | | | Shutterfly, Inc.* | | | 60,250 | |
| | 2,727 | | | Shutterstock, Inc. | | | 111,480 | |
| | | | | | | | |
| SHARES | | | INVESTMENTS | | VALUE($) | |
| | | | | | | | |
| | | | Internet & Direct Marketing Retail — continued | |
| | 458 | | | Stamps.com, Inc.* | | | 92,594 | |
| | | | | | | | |
| | | | | | | 843,760 | |
| | | | | | | | |
| | | | IT Services — 2.0% | |
| | 1,271 | | | CACI International, Inc., Class A* | | | 226,823 | |
| | 2,943 | | | Computer Task Group, Inc.* | | | 13,920 | |
| | 3,133 | | | CSG Systems International, Inc. | | | 109,968 | |
| | 2,962 | | | EVERTEC, Inc. (Puerto Rico) | | | 77,249 | |
| | 1,189 | | | ExlService Holdings, Inc.* | | | 76,215 | |
| | 4,855 | | | LiveRamp Holdings, Inc.* | | | 221,776 | |
| | 763 | | | ManTech International Corp., Class A | | | 43,705 | |
| | 9,463 | | | MAXIMUS, Inc. | | | 614,811 | |
| | 2,673 | | | Perficient, Inc.* | | | 66,879 | |
| | 1,908 | | | Science Applications International Corp. | | | 132,625 | |
| | 954 | | | Sykes Enterprises, Inc.* | | | 29,259 | |
| | 7,223 | | | Travelport Worldwide Ltd. | | | 108,056 | |
| | 2,432 | | | TTEC Holdings, Inc. | | | 60,605 | |
| | 2,284 | | | Unisys Corp.* | | | 42,049 | |
| | 2,018 | | | Virtusa Corp.* | | | 100,073 | |
| | | | | | | | |
| | | | | | | 1,924,013 | |
| | | | | | | | |
| | | | Leisure Products — 0.9% | |
| | 2,215 | | | American Outdoor Brands Corp.* | | | 30,301 | |
| | 24,558 | | | Callaway Golf Co. | | | 525,541 | |
| | 7,829 | | | JAKKS Pacific, Inc.* | | | 18,868 | |
| | 13,301 | | | Nautilus, Inc.* | | | 162,671 | |
| | 2,392 | | | Sturm Ruger & Co., Inc. | | | 142,061 | |
| | | | | | | | |
| | | | | | | 879,442 | |
| | | | | | | | |
| | | | Life Sciences Tools & Services — 0.4% | |
| | 1,686 | | | Cambrex Corp.* | | | 89,847 | |
| | 1,221 | | | Fluidigm Corp.* | | | 8,791 | |
| | 5,507 | | | Luminex Corp. | | | 158,436 | |
| | 1,389 | | | Medpace Holdings, Inc.* | | | 72,367 | |
| | 1,528 | | | Syneos Health, Inc.* | | | 69,723 | |
| | | | | | | | |
| | | | | | | 399,164 | |
| | | | | | | | |
| | | | Machinery — 3.0% | |
| | 1,720 | | | Actuant Corp., Class A | | | 41,022 | |
| | 2,158 | | | Albany International Corp., Class A | | | 151,017 | |
| | 722 | | | Astec Industries, Inc. | | | 27,154 | |
| | 1,521 | | | Barnes Group, Inc. | | | 86,089 | |
| | 15,742 | | | Briggs & Stratton Corp. | | | 228,731 | |
| | 3,168 | | | Chart Industries, Inc.* | | | 215,582 | |
| | 898 | | | CIRCOR International, Inc. | | | 29,194 | |
| | 4,270 | | | Columbus McKinnon Corp. | | | 156,837 | |
| | 1,448 | | | EnPro Industries, Inc. | | | 90,066 | |
SEE NOTES TO FINANCIAL STATEMENTS.
| | | | | | |
| | | |
| 138 | | | | J.P. MORGAN EXCHANGE-TRADED FUNDS | | OCTOBER 31, 2018 |
| | | | | | | | |
| SHARES | | | INVESTMENTS | | VALUE($) | |
| | Common Stocks — continued | |
| | | | Machinery — continued | |
| | 996 | | | ESCO Technologies, Inc. | | | 60,975 | |
| | 2,054 | | | Federal Signal Corp. | | | 45,167 | |
| | 1,925 | | | Franklin Electric Co., Inc. | | | 81,658 | |
| | 895 | | | Greenbrier Cos., Inc. (The) | | | 42,468 | |
| | 5,316 | | | Hillenbrand, Inc. | | | 254,636 | |
| | 582 | | | John Bean Technologies Corp. | | | 60,511 | |
| | 1,716 | | | Kennametal, Inc. | | | 60,832 | |
| | 507 | | | LB Foster Co., Class A* | | | 9,217 | |
| | 430 | | | Lindsay Corp. | | | 41,117 | |
| | 1,526 | | | LS Starrett Co. (The), Class A | | | 8,271 | |
| | 1,074 | | | Manitowoc Co., Inc. (The)* | | | 19,633 | |
| | 9,733 | | | Meritor, Inc.* | | | 165,364 | |
| | 3,022 | | | Mueller Industries, Inc. | | | 73,586 | |
| | 6,642 | | | Mueller Water Products, Inc., Class A | | | 68,147 | |
| | 791 | | | Proto Labs, Inc.* | | | 94,485 | |
| | 1,259 | | | RBC Bearings, Inc.* | | | 185,929 | |
| | 3,149 | | | Rexnord Corp.* | | | 84,425 | |
| | 704 | | | Standex International Corp. | | | 57,108 | |
| | 1,237 | | | Tennant Co. | | | 75,605 | |
| | 9,408 | | | Titan International, Inc. | | | 66,420 | |
| | 2,010 | | | TriMas Corp.* | | | 59,195 | |
| | 4,189 | | | Wabash National Corp. | | | 63,254 | |
| | 1,578 | | | Watts Water Technologies, Inc., Class A | | | 110,539 | |
| | 1,176 | | | Woodward, Inc. | | | 86,601 | |
| | | | | | | | |
| | | | | | | 2,900,835 | |
| | | | | | | | |
| | | | Marine — 0.1% | |
| | 1,532 | | | Matson, Inc. | | | 53,743 | |
| | | | | | | | |
| | | | Media — 1.3% | |
| | 6,392 | | | Entercom Communications Corp., Class A | | | 41,484 | |
| | 3,175 | | | EW Scripps Co. (The), Class A | | | 53,404 | |
| | 7,932 | | | Gannett Co., Inc. | | | 76,940 | |
| | 4,933 | | | Gray Television, Inc.* | | | 85,390 | |
| | 1,733 | | | Loral Space & Communications, Inc.* | | | 77,396 | |
| | 2,154 | | | Meredith Corp. | | | 111,060 | |
| | 3,200 | | | MSG Networks, Inc., Class A* | | | 81,760 | |
| | 7,971 | | | New York Times Co. (The), Class A | | | 210,434 | |
| | 1,759 | | | Nexstar Media Group, Inc., Class A | | | 131,732 | |
| | 2,723 | | | Scholastic Corp. | | | 118,124 | |
| | 2,336 | | | Sinclair Broadcast Group, Inc., Class A | | | 66,903 | |
| | 15,904 | | | TEGNA, Inc. | | | 183,532 | |
| | | | | | | | |
| | | | | | | 1,238,159 | |
| | | | | | | | |
| | | | Metals & Mining — 1.5% | |
| | 7,678 | | | AK Steel Holding Corp.* | | | 28,409 | |
| | 4,556 | | | Allegheny Technologies, Inc.* | | | 117,955 | |
| | | | | | | | |
| SHARES | | | INVESTMENTS | | VALUE($) | |
| | | | | | | | |
| | | | Metals & Mining — continued | |
| | 2,672 | | | Carpenter Technology Corp. | | | 116,526 | |
| | 4,412 | | | Century Aluminum Co.* | | | 35,031 | |
| | 2,960 | | | Coeur Mining, Inc.* | | | 14,149 | |
| | 6,979 | | | Commercial Metals Co. | | | 133,020 | |
| | 3,697 | | | Compass Minerals International, Inc. | | | 179,342 | |
| | 2,272 | | | Haynes International, Inc. | | | 65,797 | |
| | 21,221 | | | Hecla Mining Co. | | | 50,930 | |
| | 2,717 | | | Kaiser Aluminum Corp. | | | 259,120 | |
| | 1,181 | | | Materion Corp. | | | 67,116 | |
| | 1,294 | | | Olympic Steel, Inc. | | | 24,405 | |
| | 5,950 | | | SunCoke Energy, Inc.* | | | 66,640 | |
| | 3,991 | | | Warrior Met Coal, Inc. | | | 111,748 | |
| | 3,090 | | | Worthington Industries, Inc. | | | 129,409 | |
| | | | | | | | |
| | | | | | | 1,399,597 | |
| | | | | | | | |
| | | | Mortgage Real Estate Investment Trusts (REITs) — 0.6% | |
| | 1,905 | | | AG Mortgage Investment Trust, Inc. | | | 32,956 | |
| | 3,384 | | | ARMOUR Residential REIT, Inc. | | | 73,703 | |
| | 4,463 | | | Blackstone Mortgage Trust, Inc., Class A | | | 150,582 | |
| | 11,766 | | | Capstead Mortgage Corp. | | | 80,715 | |
| | 2,103 | | | Exantas Capital Corp. | | | 23,848 | |
| | 4,425 | | | Ladder Capital Corp. | | | 74,517 | |
| | 9,087 | | | New York Mortgage Trust, Inc. | | | 55,794 | |
| | 3,238 | | | Redwood Trust, Inc. | | | 53,168 | |
| | 4,478 | | | Western Asset Mortgage Capital Corp. | | | 44,646 | |
| | | | | | | | |
| | | | | | | 589,929 | |
| | | | | | | | |
| | | | Multiline Retail — 0.4% | |
| | 2,366 | | | Big Lots, Inc. | | | 98,236 | |
| | 983 | | | Dillard’s, Inc., Class A (a) | | | 69,223 | |
| | 2,194 | | | Ollie’s Bargain Outlet Holdings, Inc.* | | | 203,823 | |
| | | | | | | | |
| | | | | | | 371,282 | |
| | | | | | | | |
| | | | Multi-Utilities — 1.9% | |
| | 11,190 | | | Avista Corp. | | | 575,390 | |
| | 12,025 | | | Black Hills Corp. | | | 715,487 | |
| | 8,668 | | | NorthWestern Corp. | | | 509,332 | |
| | | | | | | | |
| | | | | | | 1,800,209 | |
| | | | | | | | |
| | | | Oil, Gas & Consumable Fuels — 2.5% | |
| | 11,679 | | | Abraxas Petroleum Corp.* | | | 21,489 | |
| | 1,629 | | | Arch Coal, Inc., Class A | | | 156,221 | |
| | 1,633 | | | California Resources Corp.* | | | 51,178 | |
| | 6,185 | | | Callon Petroleum Co.* | | | 61,665 | |
| | 3,226 | | | Carrizo Oil & Gas, Inc.* | | | 58,746 | |
| | 1,891 | | | CONSOL Energy, Inc.* | | | 75,337 | |
| | 4,445 | | | CVR Energy, Inc. | | | 191,135 | |
SEE NOTES TO FINANCIAL STATEMENTS.
| | | | | | | | |
| | | |
| OCTOBER 31, 2018 | | J.P. MORGAN EXCHANGE-TRADED FUNDS | | | | | 139 | |
JPMorgan Diversified Return U.S. Small Cap Equity ETF
SCHEDULE OF PORTFOLIO INVESTMENTS
AS OF OCTOBER 31, 2018 (continued)
| | | | | | | | |
| SHARES | | | INVESTMENTS | | VALUE($) | |
| | Common Stocks — continued | |
| | | | Oil, Gas & Consumable Fuels — continued | |
| | 2,538 | | | Delek US Holdings, Inc. | | | 93,195 | |
| | 16,201 | | | Denbury Resources, Inc.* | | | 55,894 | |
| | 8,312 | | | DHT Holdings, Inc. | | | 41,809 | |
| | 1,321 | | | Frontline Ltd. (Norway)* | | | 9,445 | |
| | 2,502 | | | GasLog Ltd. (Monaco) | | | 51,191 | |
| | 3,799 | | | Golar LNG Ltd. (Bermuda) | | | 101,737 | |
| | 6,780 | | | Green Plains, Inc. | | | 115,531 | |
| | 9,156 | | | Gulfport Energy Corp.* | | | 83,411 | |
| | 9,417 | | | Halcon Resources Corp.* | | | 31,264 | |
| | 4,813 | | | Matador Resources Co.* | | | 138,807 | |
| | 1,282 | | | NACCO Industries, Inc., Class A | | | 44,280 | |
| | 1,245 | | | Nordic American Tankers Ltd. | | | 3,225 | |
| | 3,503 | | | Oasis Petroleum, Inc.* | | | 35,240 | |
| | 4,233 | | | Pacific Ethanol, Inc.* | | | 6,942 | |
| | 4,171 | | | Peabody Energy Corp. | | | 147,862 | |
| | 1,070 | | | Penn Virginia Corp.* | | | 73,595 | |
| | 3,457 | | | Renewable Energy Group, Inc.* (a) | | | 107,444 | |
| | 1,903 | | | REX American Resources Corp.* | | | 141,146 | |
| | 3,312 | | | Sanchez Energy Corp.* (a) | | | 5,498 | |
| | 5,568 | | | Scorpio Tankers, Inc. (Monaco) | | | 9,967 | |
| | 4,962 | | | SemGroup Corp., Class A | | | 91,747 | |
| | 7,292 | | | Ship Finance International Ltd. (Norway) | | | 91,150 | |
| | 20,629 | | | Southwestern Energy Co.* | | | 110,159 | |
| | 9,557 | | | SRC Energy, Inc.* | | | 67,664 | |
| | 11,264 | | | Teekay Tankers Ltd., Class A (Bermuda) | | | 12,503 | |
| | 9,437 | | | Ultra Petroleum Corp.* | | | 11,324 | |
| | 7,626 | | | W&T Offshore, Inc.* | | | 51,399 | |
| | 3,814 | | | WildHorse Resource Development Corp.* | | | 80,895 | |
| | | | | | | | |
| | | | | | | 2,430,095 | |
| | | | | | | | |
| | | | Paper & Forest Products — 0.8% | |
| | 2,230 | | | Boise Cascade Co. | | | 68,662 | |
| | 1,930 | | | Clearwater Paper Corp.* | | | 46,590 | |
| | 4,179 | | | KapStone Paper and Packaging Corp. | | | 146,265 | |
| | 3,451 | | | Louisiana-Pacific Corp. | | | 75,128 | |
| | 7,387 | | | PH Glatfelter Co. | | | 132,227 | |
| | 6,820 | | | Schweitzer-Mauduit International, Inc. | | | 217,695 | |
| | 2,380 | | | Verso Corp., Class A* | | | 66,902 | |
| | | | | | | | |
| | | | | | | 753,469 | |
| | | | | | | | |
| | | | Personal Products — 1.3% | |
| | 2,986 | | | Medifast, Inc. | | | 632,076 | |
| | 635 | | | Nature’s Sunshine Products, Inc.* | | | 5,620 | |
| | 5,177 | | | USANA Health Sciences, Inc.* | | | 605,813 | |
| | | | | | | | |
| | | | | | | 1,243,509 | |
| | | | | | | | |
| | | | | | | | |
| SHARES | | | INVESTMENTS | | VALUE($) | |
| | | | | �� | | | |
| | | | Pharmaceuticals — 0.8% | |
| | 2,088 | | | Amneal Pharmaceuticals, Inc.* | | | 38,524 | |
| | 1,063 | | | ANI Pharmaceuticals, Inc.* | | | 51,587 | |
| | 1,797 | | | Assertio Therapeutics, Inc.* | | | 8,724 | |
| | 3,958 | | | Corcept Therapeutics, Inc.* | | | 46,507 | |
| | 5,291 | | | Horizon Pharma plc* | | | 96,349 | |
| | 5,911 | | | Innoviva, Inc.* | | | 82,518 | |
| | 1,718 | | | Intersect ENT, Inc.* | | | 48,207 | |
| | 1,547 | | | Lannett Co., Inc.* (a) | | | 5,662 | |
| | 1,719 | | | Mallinckrodt plc* | | | 43,078 | |
| | 1,215 | | | MyoKardia, Inc.* | | | 64,322 | |
| | 640 | | | Pacira Pharmaceuticals, Inc.* | | | 31,290 | |
| | 2,016 | | | Paratek Pharmaceuticals, Inc.* (a) | | | 15,019 | |
| | 3,382 | | | Prestige Consumer Healthcare, Inc.* | | | 122,293 | |
| | 1,527 | | | Supernus Pharmaceuticals, Inc.* | | | 72,624 | |
| | 1,980 | | | Theravance Biopharma, Inc.* | | | 48,055 | |
| | | | | | | | |
| | | | | | | 774,759 | |
| | | | | | | | |
| | | | Professional Services — 1.0% | |
| | 750 | | | Acacia Research Corp.* | | | 2,460 | |
| | 1,594 | | | ASGN, Inc.* | | | 106,926 | |
| | 1,435 | | | CRA International, Inc. | | | 60,485 | |
| | 2,215 | | | Forrester Research, Inc. | | | 89,220 | |
| | 1,564 | | | FTI Consulting, Inc.* | | | 108,088 | |
| | 710 | | | Heidrick & Struggles International, Inc. | | | 24,502 | |
| | 863 | | | Huron Consulting Group, Inc.* | | | 47,025 | |
| | 1,599 | | | Insperity, Inc. | | | 175,650 | |
| | 1,120 | | | Kelly Services, Inc., Class A | | | 26,309 | |
| | 1,015 | | | Korn/Ferry International | | | 45,817 | |
| | 3,528 | | | Navigant Consulting, Inc. | | | 76,205 | |
| | 1,688 | | | Resources Connection, Inc. | | | 27,548 | |
| | 1,627 | | | TriNet Group, Inc.* | | | 76,453 | |
| | 631 | | | TrueBlue, Inc.* | | | 14,721 | |
| | 2,066 | | | WageWorks, Inc.* | | | 82,247 | |
| | | | | | | | |
| | | | | | | 963,656 | |
| | | | | | | | |
| | | | Real Estate Management & Development — 0.1% | |
| | 2,266 | | | Kennedy-Wilson Holdings, Inc. | | | 43,009 | |
| | 3,818 | | | Rafael Holdings, Inc., Class B* | | | 31,078 | |
| | | | | | | | |
| | | | | | | 74,087 | |
| | | | | | | | |
| | | | Road & Rail — 1.1% | |
| | 1,822 | | | AMERCO | | | 594,847 | |
| | 2,031 | | | ArcBest Corp. | | | 75,391 | |
| | 2,003 | | | Avis Budget Group, Inc.* | | | 56,324 | |
| | 2,543 | | | Covenant Transportation Group, Inc., Class A* | | | 63,651 | |
| | 3,390 | | | Heartland Express, Inc. | | | 66,003 | |
SEE NOTES TO FINANCIAL STATEMENTS.
| | | | | | |
| | | |
| 140 | | | | J.P. MORGAN EXCHANGE-TRADED FUNDS | | OCTOBER 31, 2018 |
| | | | | | | | |
| SHARES | | | INVESTMENTS | | VALUE($) | |
| | Common Stocks — continued | |
| | | | Road & Rail — continued | |
| | 4,008 | | | Hertz Global Holdings, Inc.* | | | 55,110 | |
| | 1,252 | | | Saia, Inc.* | | | 78,701 | |
| | 3,385 | | | Werner Enterprises, Inc. | | | 108,963 | |
| | | | | | | | |
| | | | | | | 1,098,990 | |
| | | | | | | | |
| | | | Semiconductors & Semiconductor Equipment — 2.0% | |
| | 1,646 | | | Advanced Energy Industries, Inc.* | | | 70,827 | |
| | 2,383 | | | Axcelis Technologies, Inc.* | | | 41,131 | |
| | 2,936 | | | Brooks Automation, Inc. | | | 91,104 | |
| | 2,202 | | | Cabot Microelectronics Corp. | | | 214,959 | |
| | 1,865 | | | CEVA, Inc.* | | | 45,954 | |
| | 1,244 | | | Cirrus Logic, Inc.* | | | 46,575 | |
| | 2,942 | | | Cohu, Inc. | | | 61,194 | |
| | 2,793 | | | Cree, Inc.* | | | 108,424 | |
| | 3,032 | | | Diodes, Inc.* | | | 91,536 | |
| | 731 | | | DSP Group, Inc.* | | | 8,940 | |
| | 3,960 | | | Entegris, Inc. | | | 105,098 | |
| | 2,699 | | | Ichor Holdings Ltd.* (a) | | | 47,907 | |
| | 3,206 | | | Integrated Device Technology, Inc.* | | | 150,073 | |
| | 10,782 | | | Lattice Semiconductor Corp.* | | | 64,800 | |
| | 4,107 | | | MaxLinear, Inc.* | | | 79,717 | |
| | 3,981 | | | Nanometrics, Inc.* | | | 127,631 | |
| | 4,634 | | | NeoPhotonics Corp.* | | | 37,072 | |
| | 4,461 | | | Photronics, Inc.* | | | 43,450 | |
| | 1,614 | | | Power Integrations, Inc. | | | 90,901 | |
| | 6,224 | | | Rambus, Inc.* | | | 54,211 | |
| | 2,143 | | | Semtech Corp.* | | | 96,306 | |
| | 1,357 | | | Silicon Laboratories, Inc.* | | | 110,636 | |
| | 635 | | | Synaptics, Inc.* | | | 23,838 | |
| | 2,565 | | | Ultra Clean Holdings, Inc.* | | | 26,984 | |
| | 1,129 | | | Veeco Instruments, Inc.* | | | 10,737 | |
| | 4,794 | | | Xperi Corp. | | | 62,322 | |
| | | | | | | | |
| | | | | | | 1,912,327 | |
| | | | | | | | |
| | | | Software — 3.9% | |
| | 11,066 | | | 8x8, Inc.* | | | 190,224 | |
| | 9,340 | | | ACI Worldwide, Inc.* | | | 234,341 | |
| | 2,041 | | | Agilysys, Inc.* | | | 33,207 | |
| | 1,666 | | | Alarm.com Holdings, Inc.* | | | 74,104 | |
| | 1,496 | | | Alteryx, Inc., Class A* | | | 79,273 | |
| | 813 | | | Appfolio, Inc., Class A* | | | 46,422 | |
| | 2,812 | | | Apptio, Inc., Class A* | | | 72,831 | |
| | 1,379 | | | Blackbaud, Inc. | | | 98,902 | |
| | 1,938 | | | Bottomline Technologies DE, Inc.* | | | 129,148 | |
| | 2,621 | | | CommVault Systems, Inc.* | | | 152,595 | |
| | 1,892 | | | Coupa Software, Inc.* | | | 122,658 | |
| | | | | | | | |
| SHARES | | | INVESTMENTS | | VALUE($) | |
| | | | | | | | |
| | | | Software — continued | |
| | 2,367 | | | Ebix, Inc. | | | 135,653 | |
| | 1,083 | | | Ellie Mae, Inc.* | | | 71,781 | |
| | 1,624 | | | Envestnet, Inc.* | | | 84,480 | |
| | 1,619 | | | Everbridge, Inc.* | | | 82,294 | |
| | 523 | | | Fair Isaac Corp.* | | | 100,787 | |
| | 3,083 | | | Five9, Inc.* | | | 121,347 | |
| | 554 | | | Globant SA (Argentina)* | | | 28,520 | |
| | 4,068 | | | Hortonworks, Inc.* | | | 72,654 | |
| | 848 | | | HubSpot, Inc.* | | | 115,031 | |
| | 1,633 | | | j2 Global, Inc. | | | 118,948 | |
| | 4,601 | | | LivePerson, Inc.* | | | 103,983 | |
| | 779 | | | MicroStrategy, Inc., Class A* | | | 98,131 | |
| | 1,659 | | | New Relic, Inc.* | | | 148,066 | |
| | 2,235 | | | NextGen Healthcare Information Systems LLC* | | | 33,011 | |
| | 3,118 | | | OneSpan, Inc.* | | | 45,757 | |
| | 1,449 | | | Paylocity Holding Corp.* | | | 95,330 | |
| | 2,456 | | | Pegasystems, Inc. | | | 131,445 | |
| | 5,064 | | | Progress Software Corp. | | | 162,757 | |
| | 1,670 | | | Q2 Holdings, Inc.* | | | 88,894 | |
| | 3,879 | | | Qualys, Inc.* | | | 276,340 | |
| | 867 | | | SPS Commerce, Inc.* | | | 80,709 | |
| | 3,812 | | | TiVo Corp. | | | 41,932 | |
| | 462 | | | Trade Desk, Inc. (The), Class A* | | | 57,080 | |
| | 1,494 | | | Varonis Systems, Inc.* | | | 91,239 | |
| | 2,662 | | | Verint Systems, Inc.* | | | 121,573 | |
| | | | | | | | |
| | | | | | | 3,741,447 | |
| | | | | | | | |
| | | | Specialty Retail — 3.9% | |
| | 2,425 | | | Aaron’s, Inc. | | | 114,290 | |
| | 2,445 | | | Abercrombie & Fitch Co., Class A | | | 48,166 | |
| | 6,313 | | | American Eagle Outfitters, Inc. | | | 145,578 | |
| | 1,537 | | | Asbury Automotive Group, Inc.* | | | 100,059 | |
| | 2,032 | | | At Home Group, Inc.* | | | 55,555 | |
| | 5,077 | | | Barnes & Noble, Inc. | | | 32,137 | |
| | 5,548 | | | Bed Bath & Beyond, Inc. | | | 76,230 | |
| | 3,208 | | | Boot Barn Holdings, Inc.* | | | 79,173 | |
| | 5,240 | | | Buckle, Inc. (The) (a) | | | 106,896 | |
| | 3,249 | | | Build-A-Bear Workshop, Inc.* | | | 27,811 | |
| | 3,541 | | | Caleres, Inc. | | | 121,102 | |
| | 5,177 | | | Camping World Holdings, Inc., Class A (a) | | | 88,786 | |
| | 2,945 | | | Cato Corp. (The), Class A | | | 56,780 | |
| | 7,586 | | | Chico’s FAS, Inc. | | | 58,185 | |
| | 850 | | | Children’s Place, Inc. (The) | | | 126,990 | |
| | 2,569 | | | Citi Trends, Inc. | | | 65,073 | |
| | 1,213 | | | Conn’s, Inc.* | | | 33,697 | |
SEE NOTES TO FINANCIAL STATEMENTS.
| | | | | | | | |
| | | |
| OCTOBER 31, 2018 | | J.P. MORGAN EXCHANGE-TRADED FUNDS | | | | | 141 | |
JPMorgan Diversified Return U.S. Small Cap Equity ETF
SCHEDULE OF PORTFOLIO INVESTMENTS
AS OF OCTOBER 31, 2018 (continued)
| | | | | | | | |
| SHARES | | | INVESTMENTS | | VALUE($) | |
| | Common Stocks — continued | |
| | | | Specialty Retail — continued | |
| | 3,586 | | | DSW, Inc., Class A | | | 95,208 | |
| | 3,155 | | | Express, Inc.* | | | 27,796 | |
| | 1,183 | | | Five Below, Inc.* | | | 134,649 | |
| | 9,879 | | | GameStop Corp., Class A | | | 144,233 | |
| | 2,966 | | | GNC Holdings, Inc., Class A* | | | 10,915 | |
| | 1,574 | | | Group 1 Automotive, Inc. | | | 90,883 | |
| | 4,800 | | | Guess?, Inc. | | | 101,952 | |
| | 2,742 | | | Haverty Furniture Cos., Inc. | | | 55,608 | |
| | 2,532 | | | Hibbett Sports, Inc.* | | | 44,234 | |
| | 2,668 | | | Kirkland’s, Inc.* | | | 26,973 | |
| | 919 | | | Lithia Motors, Inc., Class A | | | 81,865 | |
| | 925 | | | Lumber Liquidators Holdings, Inc.* | | | 11,063 | |
| | 4,379 | | | Monro, Inc. | | | 325,798 | |
| | 2,128 | | | Murphy USA, Inc.* | | | 171,581 | |
| | 13,207 | | | Office Depot, Inc. | | | 33,810 | |
| | 5,215 | | | Party City Holdco, Inc.* | | | 54,601 | |
| | 4,659 | | | Pier 1 Imports, Inc. | | | 7,408 | |
| | 2,842 | | | Rent-A-Center, Inc.* | | | 40,498 | |
| | 507 | | | RH* (a) | | | 58,665 | |
| | 4,714 | | | Shoe Carnival, Inc. | | | 192,001 | |
| | 1,998 | | | Signet Jewelers Ltd. | | | 111,988 | |
| | 4,505 | | | Sleep Number Corp.* | | | 163,847 | |
| | 2,494 | | | Sonic Automotive, Inc., Class A | | | 45,191 | |
| | 2,026 | | | Tailored Brands, Inc. | | | 42,566 | |
| | 2,885 | | | Tile Shop Holdings, Inc. | | | 18,752 | |
| | 14,645 | | | Zumiez, Inc.* | | | 340,643 | |
| | | | | | | | |
| | | | | | | 3,769,236 | |
| | | | | | | | |
| | | | Technology Hardware, Storage & Peripherals — 0.2% | |
| | 2,274 | | | Cray, Inc.* | | | 51,597 | |
| | 3,204 | | | Diebold Nixdorf, Inc. (a) | | | 12,496 | |
| | 2,030 | | | Electronics For Imaging, Inc.* | | | 61,814 | |
| | 3,806 | | | Stratasys Ltd.* | | | 72,542 | |
| | | | | | | | |
| | | | | | | 198,449 | |
| | | | | | | | |
| | | | Textiles, Apparel & Luxury Goods — 2.9% | | | | |
| | 7,532 | | | Columbia Sportswear Co. | | | 679,989 | |
| | 6,314 | | | Crocs, Inc.* | | | 129,689 | |
| | 2,457 | | | Deckers Outdoor Corp.* | | | 312,457 | |
| | 4,240 | | | G-III Apparel Group Ltd.* | | | 169,006 | |
| | 2,677 | | | Movado Group, Inc. | | | 103,091 | |
| | 2,971 | | | Oxford Industries, Inc. | | | 264,359 | |
| | 18,658 | | | Steven Madden Ltd. | | | 583,436 | |
| | 19,214 | | | Vera Bradley, Inc.* | | | 253,433 | |
| | 8,645 | | | Wolverine World Wide, Inc. | | | 304,045 | |
| | | | | | | | |
| | | | | | | 2,799,505 | |
| | | | | | | | |
| | | | | | | | |
| SHARES | | | INVESTMENTS | | VALUE($) | |
| | | | | | | | |
| | | | Thrifts & Mortgage Finance — 0.7% | | | | |
| | 1,946 | | | Axos Financial, Inc.* | | | 59,081 | |
| | 5,666 | | | Capitol Federal Financial, Inc. | | | 70,315 | |
| | 3,824 | | | Dime Community Bancshares, Inc. | | | 61,643 | |
| | 4,687 | | | Kearny Financial Corp. | | | 60,650 | |
| | 5,871 | | | MGIC Investment Corp.* | | | 71,685 | |
| | 4,381 | | | Northwest Bancshares, Inc. | | | 70,709 | |
| | 3,686 | | | OceanFirst Financial Corp. | | | 93,329 | |
| | 3,390 | | | Oritani Financial Corp. | | | 49,528 | |
| | 3,865 | | | TrustCo Bank Corp. | | | 28,949 | |
| | 2,956 | | | Washington Federal, Inc. | | | 83,241 | |
| | | | | | | | |
| | | | | | | 649,130 | |
| | | | | | | | |
| | | | Tobacco — 1.0% | | | | |
| | 6,124 | | | Universal Corp. | | | 415,575 | |
| | 37,701 | | | Vector Group Ltd. | | | 509,717 | |
| | | | | | | | |
| | | | | | | 925,292 | |
| | | | | | | | |
| | | | Trading Companies & Distributors — 1.1% | | | | |
| | 4,188 | | | Aircastle Ltd. | | | 81,373 | |
| | 5,011 | | | Applied Industrial Technologies, Inc. | | | 329,373 | |
| | 584 | | | DXP Enterprises, Inc.* | | | 18,559 | |
| | 1,766 | | | GATX Corp. | | | 132,326 | |
| | 2,048 | | | GMS, Inc.* | | | 33,669 | |
| | 2,366 | | | Kaman Corp. | | | 150,288 | |
| | 892 | | | Lawson Products, Inc.* | | | 29,490 | |
| | 6,845 | | | MRC Global, Inc.* | | | 108,356 | |
| | 1,547 | | | SiteOne Landscape Supply, Inc.* | | | 105,258 | |
| | 1,028 | | | Systemax, Inc. | | | 33,215 | |
| | 1,486 | | | Textainer Group Holdings Ltd.* | | | 17,431 | |
| | 3,076 | | | Titan Machinery, Inc.* | | | 43,833 | |
| | | | | | | | |
| | | | | | | 1,083,171 | |
| | | | | | | | |
| | | | Water Utilities — 1.6% | | | | |
| | 11,232 | | | American States Water Co. | | | 687,623 | |
| | 13,587 | | | California Water Service Group | | | 570,654 | |
| | 1,888 | | | Connecticut Water Service, Inc. | | | 130,498 | |
| | 2,608 | | | SJW Group | | | 158,384 | |
| | | | | | | | |
| | | | | | | 1,547,159 | |
| | | | | | | | |
| | | | Wireless Telecommunication Services — 0.1% | |
| | 2,417 | | | Boingo Wireless, Inc.* | | | 75,725 | |
| | 6,102 | | | Gogo, Inc.*(a) | | | 34,903 | |
| | | | | | | | |
| | | | | | | 110,628 | |
| | | | | | | | |
| | | | Total Common Stocks
(Cost $92,963,657) | | | 94,517,775 | |
| | | | | | | | |
SEE NOTES TO FINANCIAL STATEMENTS.
| | | | | | |
| | | |
| 142 | | | | J.P. MORGAN EXCHANGE-TRADED FUNDS | | OCTOBER 31, 2018 |
| | | | | | | | |
NO. OF
RIGHTS | | | INVESTMENTS | | VALUE($) | |
| | Rights — 0.0% (b) | |
| | | | Chemicals — 0.0% (b) | | | | |
| | 5,865 | | | A Schulman, Inc., CVR*‡ | | | — | (c) |
| | | | | | | | |
| | | | Media — 0.0% (b) | | | | |
| | 1,533 | | | Media General, Inc., CVR*‡ | | | 75 | |
| | | | | | | | |
| | | | Total Rights
(Cost $—) | | | 75 | |
| | | | | | | | |
| | |
| SHARES | | | | | | |
| | Short-Term Investments—1.6% | | | | |
| | | | Investment Companies—1.6% | | | | |
| | 1,505,075 | | | JPMorgan U.S. Government Money Market Fund Class Institutional Shares,
2.02% (d) (e)
(Cost $1,505,075) | | | 1,505,075 | |
| | | | | | | | |
| | Investment of Cash Collateral from Securities Loaned — 2.5% | |
| | 2,431,125 | | | JPMorgan U.S. Government Money Market Fund Class IM Shares, 2.07% (d) (e)
(Cost $2,431,125) | | | 2,431,125 | |
| | | | | | | | |
| | | | Total Investments — 102.4%
(Cost $96,899,857) | | | 98,454,050 | |
| | | | Liabilities in Excess of
Other Assets — (2.4%) | | | (2,318,796 | ) |
| | | | | | | | |
| | | | NET ASSETS — 100.0% | | | 96,135,254 | |
| | | | | | | | |
Percentages indicated are based on net assets.
Abbreviations
| | |
| CVR | | — Contingent Value Rights |
| |
| (a) | | — The security or a portion of this security is on loan at October 31, 2018. The total value of securities on loan at October 31, 2018 was $2,359,957. |
| (b) | | — Amount rounds to less than 0.1% of net assets. |
| (c) | | — Amount rounds to less than 1. |
| (d) | | — Investment in affiliate. Fund is registered under the Investment Company Act of 1940, as amended, and advised by J.P. Morgan Investment Management Inc. |
| (e) | | — The rate shown is the current yield as of October 31, 2018. |
| * | | — Non-income producing security. |
| ‡ | | — Value determined using significant unobservable inputs. |
SEE NOTES TO FINANCIAL STATEMENTS.
| | | | | | | | |
| | | |
| OCTOBER 31, 2018 | | J.P. MORGAN EXCHANGE-TRADED FUNDS | | | | | 143 | |
JPMorgan Diversified Return U.S. Small Cap Equity ETF
SCHEDULE OF PORTFOLIO INVESTMENTS
AS OF OCTOBER 31, 2018 (continued)
| | | | | | | | | | | | | | | | | | | | |
| Futures contracts outstanding as of October 31, 2018: | | | | | | | |
| DESCRIPTION | | NUMBER OF
CONTRACTS | | | EXPIRATION
DATE | | | TRADING
CURRENCY | | | NOTIONAL
AMOUNT ($) | | | VALUE AND
UNREALIZED
APPRECIATION
(DEPRECIATION) ($) | |
Long Contracts | |
Russell 2000 E-Mini Index | | | 20 | | | | 12/2018 | | | | USD | | | | 1,513,100 | | | | (28,586 | ) |
| | | | | | | | | | | | | | | | | | | | |
| | | | | | | | | | | | | | | | | | | (28,586 | ) |
| | | | | | | | | | | | | | | | | | | | |
| | |
| Abbreviations | | |
| USD | | — United States Dollar |
SEE NOTES TO FINANCIAL STATEMENTS.
| | | | | | |
| | | |
| 144 | | | | J.P. MORGAN EXCHANGE-TRADED FUNDS | | OCTOBER 31, 2018 |
JPMorgan U.S. Dividend ETF
SCHEDULE OF PORTFOLIO INVESTMENTS
AS OF OCTOBER 31, 2018
| | | | | | | | |
| SHARES | | | INVESTMENTS | | VALUE($) | |
| | Common Stocks — 95.2% | |
| | | | Aerospace & Defense — 0.6% | |
| | 505 | | | Lockheed Martin Corp. | | | 148,394 | |
| | | | | | | | |
| | | | Air Freight & Logistics — 0.4% | | | | |
| | 1,096 | | | United Parcel Service, Inc., Class B | | | 116,768 | |
| | | | | | | | |
| | | | Airlines — 0.4% | | | | |
| | 1,471 | | | Copa Holdings SA, Class A (Panama) | | | 106,545 | |
| | | | | | | | |
| | | | Automobiles — 1.3% | | | | |
| | 8,533 | | | Ford Motor Co. | | | 81,490 | |
| | 4,049 | | | General Motors Co. | | | 148,153 | |
| | 3,402 | | | Harley-Davidson, Inc. | | | 130,025 | |
| | | | | | | | |
| | | | | | | 359,668 | |
| | | | | | | | |
| | | | Banks — 0.6% | |
| | 1,315 | | | PacWest Bancorp | | | 53,415 | |
| | 6,350 | | | People’s United Financial, Inc. | | | 99,441 | |
| | | | | | | | |
| | | | | | | 152,856 | |
| | | | | | | | |
| | | | Beverages — 1.5% | |
| | 3,964 | | | Coca-Cola Co. (The) | | | 189,796 | |
| | 2,173 | | | Keurig Dr Pepper, Inc. | | | 56,498 | |
| | 14 | | | Molson Coors Brewing Co., Class B | | | 896 | |
| | 1,492 | | | PepsiCo, Inc. | | | 167,671 | |
| | | | | | | | |
| | | | | | | 414,861 | |
| | | | | | | | |
| | | | Biotechnology — 1.6% | |
| | 1,657 | | | AbbVie, Inc. | | | 128,997 | |
| | 881 | | | Amgen, Inc. | | | 169,848 | |
| | 2,188 | | | Gilead Sciences, Inc. | | | 149,178 | |
| | | | | | | | |
| | | | | | | 448,023 | |
| | | | | | | | |
| | | | Capital Markets — 0.1% | |
| | 2,345 | | | BGC Partners, Inc., Class A | | | 24,834 | |
| | | | | | | | |
| | | | Chemicals — 4.2% | | | | |
| | 1,051 | | | Air Products & Chemicals, Inc. | | | 162,222 | |
| | 3,360 | | | CF Industries Holdings, Inc. | | | 161,381 | |
| | 1,797 | | | Eastman Chemical Co. | | | 140,795 | |
| | 431 | | | International Flavors & Fragrances, Inc. | | | 62,348 | |
| | 1,091 | | | Linde plc (United Kingdom) | | | 180,528 | |
| | 1,546 | | | LyondellBasell Industries NV, Class A | | | 138,011 | |
| | 1,705 | | | Mosaic Co. (The) | | | 52,753 | |
| | 943 | | | Olin Corp. | | | 19,049 | |
| | 2,585 | | | RPM International, Inc. | | | 158,124 | |
| | 1,115 | | | Scotts Miracle-Gro Co. (The) | | | 74,415 | |
| | | | | | | | |
| | | | | | | 1,149,626 | |
| | | | | | | | |
| | | | Commercial Services & Supplies — 0.6% | |
| | 1,924 | | | Waste Management, Inc. | | | 172,140 | |
| | | | | | | | |
| | | | | | | | |
| SHARES | | | INVESTMENTS | | VALUE($) | |
| | | | | | | | |
| | | | Containers & Packaging — 1.4% | | | | |
| | 585 | | | Bemis Co., Inc. | | | 26,776 | |
| | 1,360 | | | International Paper Co. | | | 61,690 | |
| | 1,403 | | | Packaging Corp. of America | | | 128,809 | |
| | 3,073 | | | Sonoco Products Co. | | | 167,724 | |
| | 209 | | | WestRock Co. | | | 8,981 | |
| | | | | | | | |
| | | | | | | 393,980 | |
| | | | | | | | |
| | | | Distributors — 0.6% | |
| | 1,748 | | | Genuine Parts Co. | | | 171,164 | |
| | | | | | | | |
| | | | Diversified Consumer Services — 0.5% | | | | |
| | 4,748 | | | H&R Block, Inc. | | | 126,012 | |
| | | | | | | | |
| | | | Diversified Telecommunication Services — 2.0% | |
| | 5,523 | | | AT&T, Inc. | | | 169,445 | |
| | 8,177 | | | CenturyLink, Inc. | | | 168,773 | |
| | 3,263 | | | Verizon Communications, Inc. | | | 186,285 | |
| | 835 | | | Zayo Group Holdings, Inc.* | | | 24,950 | |
| | | | | | | | |
| | | | | | | 549,453 | |
| | | | | | | | |
| | | | Electric Utilities — 10.2% | |
| | 3,671 | | | Alliant Energy Corp. | | | 157,780 | |
| | 2,430 | | | American Electric Power Co., Inc. | | | 178,265 | |
| | 2,235 | | | Avangrid, Inc. | | | 105,067 | |
| | 2,156 | | | Duke Energy Corp. | | | 178,150 | |
| | 2,653 | | | Edison International | | | 184,092 | |
| | 2,086 | | | Entergy Corp. | | | 175,120 | |
| | 2,861 | | | Evergy, Inc. | | | 160,187 | |
| | 2,793 | | | Eversource Energy | | | 176,685 | |
| | 4,003 | | | Exelon Corp. | | | 175,371 | |
| | 4,671 | | | FirstEnergy Corp. | | | 174,135 | |
| | 2,919 | | | Hawaiian Electric Industries, Inc. | | | 108,879 | |
| | 873 | | | NextEra Energy, Inc. | | | 150,593 | |
| | 3,443 | | | OGE Energy Corp. | | | 124,464 | |
| | 965 | | | PG&E Corp.* | | | 45,172 | |
| | 2,220 | | | Pinnacle West Capital Corp. | | | 182,595 | |
| | 5,871 | | | PPL Corp. | | | 178,478 | |
| | 3,983 | | | Southern Co. (The) | | | 179,355 | |
| | 3,328 | | | Xcel Energy, Inc. | | | 163,105 | |
| | | | | | | | |
| | | | | | | 2,797,493 | |
| | | | | | | | |
| | | | Electrical Equipment — 1.7% | |
| | 2,104 | | | Eaton Corp. plc | | | 150,794 | |
| | 2,281 | | | Emerson Electric Co. | | | 154,834 | |
| | 1,272 | | | Hubbell, Inc. | | | 129,362 | |
| | 176 | | | Rockwell Automation, Inc. | | | 28,993 | |
| | | | | | | | |
| | | | | | | 463,983 | |
| | | | | | | | |
SEE NOTES TO FINANCIAL STATEMENTS.
| | | | | | | | |
| | | |
| OCTOBER 31, 2018 | | J.P. MORGAN EXCHANGE-TRADED FUNDS | | | | | 145 | |
JPMorgan U.S. Dividend ETF
SCHEDULE OF PORTFOLIO INVESTMENTS
AS OF OCTOBER 31, 2018 (continued)
| | | | | | | | |
| SHARES | | | INVESTMENTS | | VALUE($) | |
| | Common Stocks — continued | |
| | | | Energy Equipment & Services — 0.6% | |
| | 2,525 | | | Helmerich & Payne, Inc. | | | 157,282 | |
| | | | | | | | |
| | | | Entertainment — 0.9% | | | | |
| | 3,451 | | | Cinemark Holdings, Inc. | | | 143,458 | |
| | 2,748 | | | Viacom, Inc., Class B | | | 87,881 | |
| | | | | | | | |
| | | | | | | 231,339 | |
| | | | | | | | |
| | | | Equity Real Estate Investment Trusts (REITs) — 10.3% | |
| | 3,662 | | | Apple Hospitality REIT, Inc. | | | 59,215 | |
| | 8,813 | | | Brandywine Realty Trust | | | 123,911 | |
| | 3,117 | | | Brixmor Property Group, Inc. | | | 50,495 | |
| | 4,697 | | | Colony Capital, Inc. | | | 27,571 | |
| | 1,015 | | | Corporate Office Properties Trust | | | 26,228 | |
| | 1,406 | | | Digital Realty Trust, Inc. | | | 145,184 | |
| | 3,602 | | | Duke Realty Corp. | | | 99,307 | |
| | 929 | | | EPR Properties | | | 63,859 | |
| | 4,063 | | | Gaming and Leisure Properties, Inc. | | | 136,882 | |
| | 4,373 | | | HCP, Inc. | | | 120,476 | |
| | 776 | | | Healthcare Trust of America, Inc., Class A | | | 20,378 | |
| | 4,587 | | | Hospitality Properties Trust | | | 117,519 | |
| | 4,111 | | | Iron Mountain, Inc. | | | 125,838 | |
| | 8,498 | | | Kimco Realty Corp. | | | 136,733 | |
| | 3,780 | | | Liberty Property Trust | | | 158,269 | |
| | 1,252 | | | Macerich Co. (The) | | | 64,628 | |
| | 3,913 | | | Medical Properties Trust, Inc. | | | 58,147 | |
| | 2,479 | | | National Retail Properties, Inc. | | | 115,893 | |
| | 5,279 | | | Omega Healthcare Investors, Inc. | | | 176,055 | |
| | 751 | | | Outfront Media, Inc. | | | 13,308 | |
| | 1,489 | | | Park Hotels & Resorts, Inc. | | | 43,285 | |
| | 3,138 | | | Rayonier, Inc. | | | 94,768 | |
| | 507 | | | Retail Value, Inc.* | | | 14,201 | |
| | 7,570 | | | Senior Housing Properties Trust | | | 121,650 | |
| | 94 | | | SITE Centers Corp. | | | 1,168 | |
| | 20,833 | | | Spirit Realty Capital, Inc. | | | 162,914 | |
| | 7,979 | | | Uniti Group, Inc. | | | 152,718 | |
| | 763 | | | Ventas, Inc. | | | 44,285 | |
| | 18,595 | | | VEREIT, Inc. | | | 136,301 | |
| | 1,720 | | | Welltower, Inc. | | | 113,640 | |
| | 1,664 | | | WP Carey, Inc. | | | 109,841 | |
| | | | | | | | |
| | | | | | | 2,834,667 | |
| | | | | | | | |
| | | | Food & Staples Retailing — 0.6% | | | | |
| | 2,337 | | | Sysco Corp. | | | 166,698 | |
| | | | | | | | |
| | | | Food Products — 3.1% | | | | |
| | 1,125 | | | Archer-Daniels-Midland Co. | | | 53,156 | |
| | 4,152 | | | Campbell Soup Co. (a) | | | 155,326 | |
| | 4,196 | | | Conagra Brands, Inc. | | | 149,378 | |
| | | | | | | | |
| SHARES | | | INVESTMENTS | | VALUE($) | |
| | | | | | | | |
| | | | Food Products — continued | | | | |
| | 7,258 | | | Flowers Foods, Inc. | | | 140,152 | |
| | 3,335 | | | General Mills, Inc. | | | 146,073 | |
| | 90 | | | JM Smucker Co. (The) | | | 9,749 | |
| | 2,182 | | | Kellogg Co. | | | 142,877 | |
| | 1,009 | | | Kraft Heinz Co. (The) | | | 55,465 | |
| | | | | | | | |
| | | | | | | 852,176 | |
| | | | | | | | |
| | | | Gas Utilities — 0.4% | | | | |
| | 1,807 | | | National Fuel Gas Co. | | | 98,102 | |
| | | | | | | | |
| | | | Health Care Equipment & Supplies — 2.7% | | | | |
| | 2,632 | | | Abbott Laboratories | | | 181,450 | |
| | 669 | | | Becton Dickinson and Co. | | | 154,205 | |
| | 77 | | | Hill-Rom Holdings, Inc. | | | 6,474 | |
| | 1,827 | | | Medtronic plc | | | 164,101 | |
| | 1,307 | | | ResMed, Inc. | | | 138,438 | |
| | 647 | | | Stryker Corp. | | | 104,956 | |
| | | | | | | | |
| | | | | | | 749,624 | |
| | | | | | | | |
| | | | Health Care Providers & Services — 0.9% | | | | |
| | 2,075 | | | Cardinal Health, Inc. | | | 104,995 | |
| | 1,519 | | | Quest Diagnostics, Inc. | | | 142,953 | |
| | | | | | | | |
| | | | | | | 247,948 | |
| | | | | | | | |
| | | | Hotels, Restaurants & Leisure — 3.4% | | | | |
| | 1,504 | | | Darden Restaurants, Inc. | | | 160,251 | |
| | 7,406 | | | Extended Stay America, Inc. | | | 120,570 | |
| | 636 | | | International Game Technology plc | | | 11,798 | |
| | 2,226 | | | Las Vegas Sands Corp. | | | 113,593 | |
| | 1,085 | | | McDonald’s Corp. | | | 191,936 | |
| | 2,391 | | | Six Flags Entertainment Corp. | | | 128,779 | |
| | 9,882 | | | Wendy’s Co. (The) | | | 170,366 | |
| | 1,072 | | | Wyndham Destinations, Inc. | | | 38,463 | |
| | | | | | | | |
| | | | | | | 935,756 | |
| | | | | | | | |
| | | | Household Durables — 1.5% | | | | |
| | 2,560 | | | Garmin Ltd. | | | 169,370 | |
| | 3,394 | | | Leggett & Platt, Inc. | | | 123,236 | |
| | 1,569 | | | Newell Brands, Inc. | | | 24,916 | |
| | 952 | | | Whirlpool Corp. | | | 104,491 | |
| | | | | | | | |
| | | | | | | 422,013 | |
| | | | | | | | |
| | | | Household Products — 1 .8% | | | | |
| | 1,060 | | | Clorox Co. (The) | | | 157,357 | |
| | 1,404 | | | Kimberly-Clark Corp. | | | 146,437 | |
| | 2,119 | | | Procter & Gamble Co. (The) | | | 187,913 | |
| | | | | | | | |
| | | | | | | 491,707 | |
| | | | | | | | |
SEE NOTES TO FINANCIAL STATEMENTS.
| | | | | | |
| | | |
| 146 | | | | J.P. MORGAN EXCHANGE-TRADED FUNDS | | OCTOBER 31, 2018 |
| | | | | | | | |
| SHARES | | | INVESTMENTS | | VALUE($) | |
| | Common Stocks — continued | |
| | | | Independent Power and Renewable Electricity Producers — 0.7% | |
| | 12,964 | | | AES Corp. | | | 189,015 | |
| | | | | | | | |
| | | | Industrial Conglomerates — 0.7% | | | | |
| | 786 | | | 3M Co. | | | 149,544 | |
| | 5,019 | | | General Electric Co. | | | 50,692 | |
| | | | | | | | |
| | | | | | | 200,236 | |
| | | | | | | | |
| | | | Insurance — 0.6% | | | | |
| | 7,861 | | | Old Republic International Corp. | | | 173,335 | |
| | | | | | | | |
| | | | IT Services — 1.0% | | | | |
| | 1,005 | | | International Business Machines Corp. | | | 116,007 | |
| | 2,384 | | | Paychex, Inc. | | | 156,128 | |
| | | | | | | | |
| | | | | | | 272,135 | |
| | | | | | | | |
| | | | Leisure Products — 0.8% | | | | |
| | 1,577 | | | Hasbro, Inc. | | | 144,627 | |
| | 6,140 | | | Mattel, Inc.* | | | 83,381 | |
| | | | | | | | |
| | | | | | | 228,008 | |
| | | | | | | | |
| | | | Machinery — 1.2% | | | | |
| | 1,141 | | | Caterpillar, Inc. | | | 138,426 | |
| | 1,007 | | | Cummins, Inc. | | | 137,647 | |
| | 15 | | | Stanley Black & Decker, Inc. | | | 1,748 | |
| | 1,232 | | | Timken Co. (The) | | | 48,725 | |
| | | | | | | | |
| | | | | | | 326,546 | |
| | | | | | | | |
| | | | Metals & Mining — 1.3% | | | | |
| | 2,790 | | | Nucor Corp. | | | 164,945 | |
| | 1,984 | | | Reliance Steel & Aluminum Co. | | | 156,577 | |
| | 792 | | | Southern Copper Corp. (Peru) | | | 30,365 | |
| | | | | | | | |
| | | | | | | 351,887 | |
| | | | | | | | |
| | | | Mortgage Real Estate Investment Trusts (REITs) — 3.2% | |
| | 8,226 | | | AGNC Investment Corp. | | | 146,752 | |
| | 13,711 | | | Annaly Capital Management, Inc. | | | 135,328 | |
| | 6,936 | | | Chimera Investment Corp. | | | 129,010 | |
| | 17,564 | | | MFA Financial, Inc. | | | 121,718 | |
| | 3,254 | | | New Residential Investment Corp. | | | 58,181 | |
| | 7,076 | | | Starwood Property Trust, Inc. | | | 153,691 | |
| | 9,408 | | | Two Harbors Investment Corp. | | | 138,203 | |
| | | | | | | | |
| | | | | | | 882,883 | |
| | | | | | | | |
| | | | Multiline Retail — 2.4% | | | | |
| | 2,206 | | | Kohl’s Corp. | | | 167,060 | |
| | 4,775 | | | Macy’s, Inc. | | | 163,735 | |
| | 2,187 | | | Nordstrom, Inc. | | | 143,839 | |
| | 2,000 | | | Target Corp. | | | 167,260 | |
| | | | | | | | |
| | | | | | | 641,894 | |
| | | | | | | | |
| | | | | | | | |
| SHARES | | | INVESTMENTS | | VALUE($) | |
| | | | | | | | |
| | | | Multi-Utilities — 7.8% | |
| | 2,703 | | | Ameren Corp. | | | 174,560 | |
| | 6,274 | | | CenterPoint Energy, Inc. | | | 169,461 | |
| | 3,292 | | | CMS Energy Corp. | | | 163,020 | |
| | 2,209 | | | Consolidated Edison, Inc. | | | 167,884 | |
| | 2,464 | | | Dominion Energy, Inc. | | | 175,979 | |
| | 1,569 | | | DTE Energy Co. | | | 176,356 | |
| | 5,984 | | | MDU Resources Group, Inc. | | | 149,361 | |
| | 5,529 | | | NiSource, Inc. | | | 140,215 | |
| | 3,331 | | | Public Service Enterprise Group, Inc. | | | 177,975 | |
| | 4,183 | | | SCANA Corp. | | | 167,529 | |
| | 1,325 | | | Sempra Energy | | | 145,909 | |
| | 1,976 | | | Vectren Corp. | | | 141,343 | |
| | 2,580 | | | WEC Energy Group, Inc. | | | 176,472 | |
| | | | | | | | |
| | | | | | | 2,126,064 | |
| | | | | | | | |
| | | | Oil, Gas & Consumable Fuels — 4.1% | |
| | 1,477 | | | Chevron Corp. | | | 164,907 | |
| | 1,355 | | | Exxon Mobil Corp. | | | 107,966 | |
| | 3,827 | | | Kinder Morgan, Inc. | | | 65,136 | |
| | 2,115 | | | Murphy Oil Corp. | | | 67,384 | |
| | 2,038 | | | Occidental Petroleum Corp. | | | 136,689 | |
| | 2,481 | | | ONEOK, Inc. | | | 162,754 | |
| | 2,985 | | | PBF Energy, Inc., Class A | | | 124,922 | |
| | 3,169 | | | Targa Resources Corp. | | | 163,742 | |
| | 5,652 | | | Williams Cos., Inc. (The) | | | 137,513 | |
| | | | | | | | |
| | | | | | | 1,131,013 | |
| | | | | | | | |
| | | | Paper & Forest Products — 0.6% | |
| | 3,426 | | | Domtar Corp. | | | 158,658 | |
| | | | | | | | |
| | | | | | | | |
| | | | Personal Products — 0.3% | | | | |
| | 3,307 | | | Coty, Inc., Class A | | | 34,889 | |
| | 761 | | | Nu Skin Enterprises, Inc., Class A | | | 53,437 | |
| | | | | | | | |
| | | | | | | 88,326 | |
| | | | | | | | |
| | | | Pharmaceuticals — 3.2% | |
| | 2,713 | | | Bristol-Myers Squibb Co. | | | 137,115 | |
| | 1,664 | | | Eli Lilly & Co. | | | 180,444 | |
| | 1,331 | | | Johnson & Johnson | | | 186,327 | |
| | 2,578 | | | Merck & Co., Inc. | | | 189,766 | |
| | 4,278 | | | Pfizer, Inc. | | | 184,211 | |
| | | | | | | | |
| | | | | | | 877,863 | |
| | | | | | | | |
| | | | Professional Services — 0.5% | |
| | 5,593 | | | Nielsen Holdings plc | | | 145,306 | |
| | | | | | | | |
SEE NOTES TO FINANCIAL STATEMENTS.
| | | | | | | | |
| | | |
| OCTOBER 31, 2018 | | J.P. MORGAN EXCHANGE-TRADED FUNDS | | | | | 147 | |
JPMorgan U.S. Dividend ETF
SCHEDULE OF PORTFOLIO INVESTMENTS
AS OF OCTOBER 31, 2018 (continued)
| | | | | | | | |
| SHARES | | | INVESTMENTS | | VALUE($) | |
| | Common Stocks — continued | |
| | | | Semiconductors & Semiconductor Equipment — 3.8% | |
| | 1,744 | | | Analog Devices, Inc. | | | 145,990 | |
| | 9,529 | | | Cypress Semiconductor Corp. | | | 123,305 | |
| | 3,352 | | | Intel Corp. | | | 157,142 | |
| | 1,484 | | | KLA-Tencor Corp. | | | 135,846 | |
| | 2,757 | | | Maxim Integrated Products, Inc. | | | 137,905 | |
| | 199 | | | Microchip Technology, Inc. | | | 13,090 | |
| | 2,112 | | | QUALCOMM, Inc. | | | 132,824 | |
| | 2,135 | | | Xilinx, Inc. | | | 182,265 | |
| | | | | | | | |
| | | | | | | 1,028,367 | |
| | | | | | | | |
| | | | Software — 1.1% | |
| | 2,928 | | | CA, Inc. | | | 129,886 | |
| | 1,655 | | | Microsoft Corp. | | | 176,771 | |
| | | | | | | | |
| | | | | | | 306,657 | |
| | | | | | | | |
| | | | Specialty Retail — 2.3% | |
| | 107 | | | Best Buy Co., Inc. | | | 7,507 | |
| | 3,063 | | | Foot Locker, Inc. | | | 144,390 | |
| | 5,277 | | | Gap, Inc. (The) | | | 144,062 | |
| | 884 | | | Home Depot, Inc. (The) | | | 155,478 | |
| | 5,481 | | | L Brands, Inc. | | | 177,694 | |
| | | | | | | | |
| | | | | | | 629,131 | |
| | | | | | | | |
| | | | Technology Hardware, Storage & Peripherals — 0.6% | |
| | 1,791 | | | HP, Inc. | | | 43,235 | |
| | 4,671 | | | Xerox Corp. | | | 130,181 | |
| | | | | | | | |
| | | | | | | 173,416 | |
| | | | | | | | |
| | | | Textiles, Apparel & Luxury Goods — 1.5% | |
| | 6,453 | | | Hanesbrands, Inc. | | | 110,734 | |
| | 3,294 | | | Tapestry, Inc. | | | 139,369 | |
| | 1,897 | | | VF Corp. | | | 157,223 | |
| | | | | | | | |
| | | | | | | 407,326 | |
| | | | | | | | |
| | | | Thrifts & Mortgage Finance — 0.5% | |
| | 13,499 | | | New York Community Bancorp, Inc. | | | 129,320 | |
| | | | | | | | |
| | | | Tobacco — 1.4% | | | | |
| | 2,700 | | | Altria Group, Inc. | | | 175,608 | |
| | 2,239 | | | Philip Morris International, Inc. | | | 197,189 | |
| | | | | | | | |
| | | | | | | 372,797 | |
| | | | | | | | |
| | | | Transportation Infrastructure — 0.1% | |
| | 988 | | | Macquarie Infrastructure Corp. | | | 36,507 | |
| | | | | | | | |
| | | | | | | | |
| SHARES | | | INVESTMENTS | | VALUE($) | |
| | | | | | | | |
| | | | Wireless Telecommunication Services — 1.6% | |
| | 17,203 | | | Sprint Corp.* | | | 105,282 | |
| | 5,144 | | | Telephone & Data Systems, Inc. | | | 158,590 | |
| | 2,559 | | | T-Mobile US, Inc.* | | | 175,419 | |
| | | | | | | | |
| | | | | | | 439,291 | |
| | | | | | | | |
| | | | Total Common Stocks
(Cost $26,065,291) | | | 26,099,093 | |
| | | | | | | | |
| | Short-Term Investments — 4.6% | | | | |
| | | | Investment Companies — 4.6% | |
| | 1,248,859 | | | JPMorgan U.S. Government Money Market Fund Class Institutional Shares,
2.02% (b) (c)
(Cost $1,248,859) | | | 1,248,859 | |
| | | | | | | | |
| | Investment of Cash Collateral from Securities Loaned — 0.5% | |
| | 148,580 | | | JPMorgan U.S. Government Money Market Fund, IM Shares, 2.07% (b) (c)
(Cost $148,580) | | | 148,580 | |
| | | | | | | | |
| | | | Total Investments — 100.3%
(Cost $27,462,730) | | | 27,496,532 | |
| | | | Liabilities in Excess of
Other Assets — (0.3%) | | | (85,406 | ) |
| | | | | | | | |
| | | | NET ASSETS — 100.0% | | | 27,411,126 | |
| | | | | | | | |
Percentages indicated are based on net assets.
| | |
| (a) | | — The security or a portion of this security is on loan at October 31, 2018. The total value of securities on loan at October 31, 2018 was $145,312. |
| (b) | | — Investment in affiliate. Fund is registered under the Investment Company Act of 1940, as amended, and advised by J.P. Morgan Investment Management Inc. |
| (c) | | — The rate shown is the current yield as of October 31, 2018. |
| * | | — Non-income producing security. |
SEE NOTES TO FINANCIAL STATEMENTS.
| | | | | | |
| | | |
| 148 | | | | J.P. MORGAN EXCHANGE-TRADED FUNDS | | OCTOBER 31, 2018 |
| | | | | | | | | | | | | | | | | | | | |
| Futures contracts outstanding as of October 31, 2018: | | | | | | | |
| DESCRIPTION | | NUMBER OF
CONTRACTS | | | EXPIRATION
DATE | | | TRADING
CURRENCY | | | NOTIONAL
AMOUNT ($) | | | VALUE AND
UNREALIZED
APPRECIATION
(DEPRECIATION) ($) | |
Long Contracts | |
S&P 500 E-Mini Index | | | 9 | | | | 12/2018 | | | | USD | | | | 1,219,590 | | | | (18,041 | ) |
| | | | | | | | | | | | | | | | | | | | |
| | | | | | | | | | | | | | | | | | | (18,041 | ) |
| | | | | | | | | | | | | | | | | | | | |
Abbreviations
| | | | | | | | | | |
| USD | | — United States Dollar |
SEE NOTES TO FINANCIAL STATEMENTS.
| | | | | | | | |
| | | |
| OCTOBER 31, 2018 | | J.P. MORGAN EXCHANGE-TRADED FUNDS | | | | | 149 | |
JPMorgan U.S. Minimum Volatility ETF
SCHEDULE OF PORTFOLIO INVESTMENTS
AS OF OCTOBER 31, 2018
| | | | | | | | |
| SHARES | | | INVESTMENTS | | VALUE($) | |
| | Common Stocks — 97.2% | |
| | | | Aerospace & Defense — 2.0% | |
| | 958 | | | Harris Corp. | | | 142,464 | |
| | 765 | | | L3 Technologies, Inc. | | | 144,945 | |
| | 451 | | | Lockheed Martin Corp. | | | 132,526 | |
| | 731 | | | Raytheon Co. | | | 127,954 | |
| | | | | | | | |
| | | | | | | 547,889 | |
| | | | | | | | |
| | | | Air Freight & Logistics — 0.5% | |
| | 1,190 | | | United Parcel Service, Inc., Class B | | | 126,783 | |
| | | | | | | | |
| | | | Banks — 0.5% | |
| | 2,640 | | | US Bancorp | | | 137,993 | |
| | | | | | | | |
| | | | Beverages — 2.5% | |
| | 2,594 | | | Brown-Forman Corp., Class B | | | 120,206 | |
| | 3,570 | | | Coca-Cola Co. (The) | | | 170,931 | |
| | 595 | | | Constellation Brands, Inc., Class A | | | 118,542 | |
| | 1,736 | | | Molson Coors Brewing Co., Class B | | | 111,104 | |
| | 1,402 | | | PepsiCo, Inc. | | | 157,557 | |
| | | | | | | | |
| | | | | | | 678,340 | |
| | | | | | | | |
| | | | Biotechnology — 0.5% | |
| | 714 | | | Amgen, Inc. | | | 137,652 | |
| | | | | | | | |
| | | | Chemicals — 4.4% | |
| | 892 | | | Air Products & Chemicals, Inc. | | | 137,680 | |
| | 2,025 | | | Ashland Global Holdings, Inc. | | | 149,810 | |
| | 266 | | | DowDuPont, Inc. | | | 14,343 | |
| | 1,118 | | | Ecolab, Inc. | | | 171,222 | |
| | 1,087 | | | International Flavors & Fragrances, Inc. | | | 157,245 | |
| | 1,020 | | | Linde plc (United Kingdom) | | | 168,779 | |
| | 143 | | | NewMarket Corp. | | | 55,192 | |
| | 1,362 | | | PPG Industries, Inc. | | | 143,133 | |
| | 2,526 | | | RPM International, Inc. | | | 154,515 | |
| | 235 | | | Scotts Miracle-Gro Co. (The) | | | 15,684 | |
| | 625 | | | WR Grace & Co. | | | 40,494 | |
| | | | | | | | |
| | | | | | | 1,208,097 | |
| | | | | | | | |
| | | | Commercial Services & Supplies — 1.5% | |
| | 1,876 | | | Copart, Inc.* | | | 91,755 | |
| | 1,970 | | | Republic Services, Inc. | | | 143,180 | |
| | 534 | | | Rollins, Inc. | | | 31,613 | |
| | 1,754 | | | Waste Management, Inc. | | | 156,930 | |
| | | | | | | | |
| | | | | | | 423,478 | |
| | | | | | | | |
| | | | Communications Equipment — 0.2% | |
| | 509 | | | Motorola Solutions, Inc. | | | 62,383 | |
| | | | | | | | |
| | | | Containers & Packaging — 0.4% | |
| | 998 | | | Avery Dennison Corp. | | | 90,538 | |
| | 583 | | | Bemis Co., Inc. | | | 26,684 | |
| | | | | | | | |
| | | | | | | 117,222 | |
| | | | | | | | |
| | | | | | | | |
| SHARES | | | INVESTMENTS | | VALUE($) | |
| | | | | | | | |
| | | | Distributors — 1.0% | |
| | 1,558 | | | Genuine Parts Co. | | | 152,559 | |
| | 881 | | | Pool Corp. | | | 128,406 | |
| | | | | | | | |
| | | | | | | 280,965 | |
| | | | | | | | |
| | | | Diversified Financial Services — 0.6% | |
| | 817 | | | Berkshire Hathaway, Inc., Class B* | | | 167,714 | |
| | | | | | | | |
| | | | Diversified Telecommunication Services — 1.9% | |
| | 4,403 | | | AT&T, Inc. | | | 135,084 | |
| | 3,019 | | | CenturyLink, Inc. | | | 62,312 | |
| | 3,136 | | | Verizon Communications, Inc. | | | 179,034 | |
| | 4,429 | | | Zayo Group Holdings, Inc.* | | | 132,339 | |
| | | | | | | | |
| | | | | | | 508,769 | |
| | | | | | | | |
| | | | Electric Utilities — 8.8% | |
| | 3,980 | | | Alliant Energy Corp. | | | 171,060 | |
| | 2,377 | | | American Electric Power Co., Inc. | | | 174,377 | |
| | 1,876 | | | Avangrid, Inc. | | | 88,191 | |
| | 2,099 | | | Duke Energy Corp. | | | 173,440 | |
| | 334 | | | Edison International | | | 23,176 | |
| | 1,881 | | | Entergy Corp. | | | 157,910 | |
| | 2,989 | | | Evergy, Inc. | | | 167,354 | |
| | 2,731 | | | Eversource Energy | | | 172,763 | |
| | 3,251 | | | Exelon Corp. | | | 142,426 | |
| | 2,013 | | | FirstEnergy Corp. | | | 75,045 | |
| | 2,282 | | | Hawaiian Electric Industries, Inc. | | | 85,119 | |
| | 1,002 | | | NextEra Energy, Inc. | | | 172,845 | |
| | 4,079 | | | OGE Energy Corp. | | | 147,456 | |
| | 2,171 | | | Pinnacle West Capital Corp. | | | 178,565 | |
| | 4,861 | | | PPL Corp. | | | 147,774 | |
| | 3,895 | | | Southern Co. (The) | | | 175,392 | |
| | 3,549 | | | Xcel Energy, Inc. | | | 173,937 | |
| | | | | | | | |
| | | | | | | 2,426,830 | |
| | | | | | | | |
| | | | Electrical Equipment — 0.5% | |
| | 1,211 | | | Hubbell, Inc. | | | 123,159 | |
| | | | | | | | |
| | | | Energy Equipment & Services — 0.8% | |
| | 2,769 | | | Halliburton Co. | | | 96,029 | |
| | 2,250 | | | Schlumberger Ltd. | | | 115,447 | |
| | | | | | | | |
| | | | | | | 211,476 | |
| | | | | | | | |
| | | | Entertainment — 0.6% | |
| | 1,463 | | | Walt Disney Co. (The) | | | 167,996 | |
| | | | | | | | |
| | | | Equity Real Estate Investment Trusts (REITs) — 2.3% | |
| | 1,042 | | | American Tower Corp. | | | 162,354 | |
| | 2,310 | | | Apple Hospitality REIT, Inc. | | | 37,353 | |
| | 100 | | | Camden Property Trust | | | 9,027 | |
| | 1,430 | | | Crown Castle International Corp. | | | 155,498 | |
| | 1,933 | | | Equity Commonwealth | | | 57,565 | |
SEE NOTES TO FINANCIAL STATEMENTS.
| | | | | | |
| | | |
| 150 | | | | J.P. MORGAN EXCHANGE-TRADED FUNDS | | OCTOBER 31, 2018 |
| | | | | | | | |
| SHARES | | | INVESTMENTS | | VALUE($) | |
| | Common Stocks — continued | |
| | | | Equity Real Estate Investment Trusts (REITs) — continued | |
| | 851 | | | Federal Realty Investment Trust | | | 105,566 | |
| | 1,007 | | | Gaming and Leisure Properties, Inc. | | | 33,926 | |
| | 923 | | | National Retail Properties, Inc. | | | 43,150 | |
| | 514 | | | Regency Centers Corp. | | | 32,567 | |
| | | | | | | | |
| | | | | | | 637,006 | |
| | | | | | | | |
| | | | Food & Staples Retailing — 2.3% | |
| | 731 | | | Costco Wholesale Corp. | | | 167,129 | |
| | 2,978 | | | Kroger Co. (The) | | | 88,625 | |
| | 2,279 | | | Sysco Corp. | | | 162,561 | |
| | 1,450 | | | US Foods Holding Corp.* | | | 42,297 | |
| | 1,679 | | | Walmart, Inc. | | | 168,370 | |
| | | | | | | | |
| | | | | | | 628,982 | |
| | | | | | | | |
| | | | Food Products — 5.8% | |
| | 2,535 | | | Campbell Soup Co. (a) | | | 94,834 | |
| | 5,423 | | | Conagra Brands, Inc. | | | 193,059 | |
| | 3,140 | | | General Mills, Inc. | | | 137,532 | |
| | 1,414 | | | Hershey Co. (The) | | | 151,510 | |
| | 3,733 | | | Hormel Foods Corp. | | | 162,908 | |
| | 1,133 | | | Ingredion, Inc. | | | 114,637 | |
| | 1,190 | | | JM Smucker Co. (The) | | | 128,901 | |
| | 2,062 | | | Kellogg Co. | | | 135,020 | |
| | 1,258 | | | Kraft Heinz Co. (The) | | | 69,152 | |
| | 767 | | | Lamb Weston Holdings, Inc. | | | 59,949 | |
| | 1,365 | | | McCormick & Co., Inc. (Non-Voting) | | | 196,560 | |
| | 3,339 | | | Mondelez International, Inc., Class A | | | 140,171 | |
| | | | | | | | |
| | | | | | | 1,584,233 | |
| | | | | | | | |
| | | | Gas Utilities — 1.2% | |
| | 1,735 | | | Atmos Energy Corp. | | | 161,494 | |
| | 3,107 | | | UGI Corp. | | | 164,857 | |
| | | | | | | | |
| | | | | | | 326,351 | |
| | | | | | | | |
| | | | Health Care Equipment & Supplies — 8.1% | |
| | 2,551 | | | Abbott Laboratories | | | 175,866 | |
| | 2,250 | | | Baxter International, Inc. | | | 140,647 | |
| | 651 | | | Becton Dickinson and Co. | | | 150,056 | |
| | 574 | | | Cooper Cos., Inc. (The) | | | 148,270 | |
| | 45 | | | DENTSPLY SIRONA, Inc. | | | 1,558 | |
| | 1,731 | | | Hill-Rom Holdings, Inc. | | | 145,542 | |
| | 671 | | | IDEXX Laboratories, Inc.* | | | 142,333 | |
| | 304 | | | Intuitive Surgical, Inc.* | | | 158,439 | |
| | 1,662 | | | Medtronic plc | | | 149,281 | |
| | 1,531 | | | ResMed, Inc. | | | 162,164 | |
| | 1,278 | | | STERIS plc | | | 139,698 | |
| | 916 | | | Stryker Corp. | | | 148,594 | |
| | 596 | | | Teleflex, Inc. | | | 143,481 | |
| | | | | | | | |
| SHARES | | | INVESTMENTS | | VALUE($) | |
| | | | | | | | |
| | | | Health Care Equipment & Supplies — continued | |
| | 1,331 | | | Varian Medical Systems, Inc.* | | | 158,881 | |
| | 1,162 | | | West Pharmaceutical Services, Inc. | | | 123,079 | |
| | 1,190 | | | Zimmer Biomet Holdings, Inc. | | | 135,172 | |
| | | | | | | | |
| | | | | | | 2,223,061 | |
| | | | | | | | |
| | | | Health Care Providers & Services — 5.9% | |
| | 721 | | | Aetna, Inc. | | | 143,046 | |
| | 1,669 | | | AmerisourceBergen Corp. | | | 146,872 | |
| | 601 | | | Anthem, Inc. | | | 165,618 | |
| | 85 | | | Cardinal Health, Inc. | | | 4,301 | |
| | 353 | | | Cigna Corp. | | | 75,475 | |
| | 1,414 | | | CVS Health Corp. | | | 102,359 | |
| | 2,205 | | | DaVita, Inc.* | | | 148,485 | |
| | 1,694 | | | Express Scripts Holding Co.* | | | 164,267 | |
| | 1,713 | | | Henry Schein, Inc.* | | | 142,179 | |
| | 882 | | | Laboratory Corp. of America Holdings* | | | 141,605 | |
| | 2,224 | | | MEDNAX, Inc.* | | | 91,829 | |
| | 1,425 | | | Quest Diagnostics, Inc. | | | 134,107 | |
| | 635 | | | UnitedHealth Group, Inc. | | | 165,957 | |
| | | | | | | | |
| | | | | | | 1,626,100 | |
| | | | | | | | |
| | | | Hotels, Restaurants & Leisure — 1.3% | |
| | 1,051 | | | McDonald’s Corp. | | | 185,922 | |
| | 1,962 | | | Yum! Brands, Inc. | | | 177,384 | |
| | | | | | | | |
| | | | | | | 363,306 | |
| | | | | | | | |
| | | | Household Durables — 0.8% | |
| | 1,102 | | | Garmin Ltd. | | | 72,908 | |
| | 3,214 | | | Leggett & Platt, Inc. | | | 116,701 | |
| | 98 | | | Mohawk Industries, Inc.* | | | 12,224 | |
| | 10 | | | NVR, Inc.* | | | 22,390 | |
| | | | | | | | |
| | | | | | | 224,223 | |
| | | | | | | | |
| | | | Household Products — 2.9% | |
| | 2,950 | | | Church & Dwight Co., Inc. | | | 175,141 | |
| | 1,168 | | | Clorox Co. (The) | | | 173,390 | |
| | 2,171 | | | Colgate-Palmolive Co. | | | 129,283 | |
| | 1,359 | | | Kimberly-Clark Corp. | | | 141,744 | |
| | 1,822 | | | Procter & Gamble Co. (The) | | | 161,575 | |
| | 4 | | | Spectrum Brands Holdings, Inc. | | | 260 | |
| | | | | | | | |
| | | | | | | 781,393 | |
| | | | | | | | |
| | | | Independent Power and Renewable Electricity
Producers — 0.5% | |
| | 6,494 | | | Vistra Energy Corp.* | | | 146,959 | |
| | | | | | | | |
| | | | Industrial Conglomerates — 0.5% | |
| | 675 | | | 3M Co. | | | 128,426 | |
| | | | | | | | |
SEE NOTES TO FINANCIAL STATEMENTS.
| | | | | | | | |
| | | |
| OCTOBER 31, 2018 | | J.P. MORGAN EXCHANGE-TRADED FUNDS | | | | | 151 | |
JPMorgan U.S. Minimum Volatility ETF
SCHEDULE OF PORTFOLIO INVESTMENTS
AS OF OCTOBER 31, 2018 (continued)
| | | | | | | | |
| SHARES | | | INVESTMENTS | | VALUE($) | |
| | Common Stocks — continued | |
| | | | Insurance — 6.0% | |
| | 2,181 | | | Aflac, Inc. | | | 93,936 | |
| | 1,586 | | | Allstate Corp. (The) | | | 151,812 | |
| | 1,394 | | | American Financial Group, Inc. | | | 139,442 | |
| | 202 | | | Aon plc | | | 31,548 | |
| | 4,738 | | | Arch Capital Group Ltd.* | | | 134,417 | |
| | 870 | | | Arthur J Gallagher & Co. | | | 64,389 | |
| | 2,231 | | | Brown & Brown, Inc. | | | 62,870 | |
| | 973 | | | Chubb Ltd. | | | 121,537 | |
| | 1,835 | | | Cincinnati Financial Corp. | | | 144,304 | |
| | 411 | | | Everest Re Group Ltd. | | | 89,540 | |
| | 141 | | | Markel Corp.* | | | 154,147 | |
| | 1,914 | | | Marsh & McLennan Cos., Inc. | | | 162,211 | |
| | 1,024 | | | RenaissanceRe Holdings Ltd. (Bermuda) | | | 125,092 | |
| | 77 | | | White Mountains Insurance Group Ltd. | | | 68,274 | |
| | 1,178 | | | WR Berkley Corp. | | | 89,410 | |
| | | | | | | | |
| | | | | | | 1,632,929 | |
| | | | | | | | |
| | | | IT Services — 1.8% | |
| | 2,362 | | | Amdocs Ltd. | | | 149,444 | |
| | 1,162 | | | Automatic Data Processing, Inc. | | | 167,421 | |
| | 626 | | �� | International Business Machines Corp. | | | 72,259 | |
| | 467 | | | Jack Henry & Associates, Inc. | | | 69,971 | |
| | 649 | | | Paychex, Inc. | | | 42,503 | |
| | | | | | | | |
| | | | | | | 501,598 | |
| | | | | | | | |
| | | | Leisure Products — 0.3% | |
| | 921 | | | Hasbro, Inc. | | | 84,465 | |
| | | | | | | | |
| | | | Life Sciences Tools & Services — 2.7% | |
| | 524 | | | Bio-Rad Laboratories, Inc., Class A* | | | 142,973 | |
| | 887 | | | Bio-Techne Corp. | | | 148,768 | |
| | 1,342 | | | IQVIA Holdings, Inc.* | | | 164,972 | |
| | 1,380 | | | QIAGEN NV* | | | 50,094 | |
| | 713 | | | Thermo Fisher Scientific, Inc. | | | 166,592 | |
| | 346 | | | Waters Corp.* | | | 65,633 | |
| | | | | | | | |
| | | | | | | 739,032 | |
| | | | | | | | |
| | | | Machinery — 0.5% | |
| | 659 | | | Snap-on, Inc. | | | 101,447 | |
| | 237 | | | Stanley Black & Decker, Inc. | | | 27,615 | |
| | | | | | | | |
| | | | | | | 129,062 | |
| | | | | | | | |
| | | | Media — 0.3% | |
| | 1,031 | | | Omnicom Group, Inc. | | | 76,624 | |
| | | | | | | | |
| | | | Mortgage Real Estate Investment Trusts (REITs) — 2.1% | |
| | 8,413 | | | AGNC Investment Corp. | | | 150,088 | |
| | 12,387 | | | Annaly Capital Management, Inc. | | | 122,260 | |
| | 1,077 | | | Chimera Investment Corp. | | | 20,032 | |
| | | | | | | | |
| SHARES | | | INVESTMENTS | | VALUE($) | |
| | | | | | | | |
| | | | Mortgage Real Estate Investment Trusts
(REITs) — continued | |
| | 4,443 | | | MFA Financial, Inc. | | | 30,790 | |
| | 7,337 | | | Starwood Property Trust, Inc. | | | 159,360 | |
| | 5,869 | | | Two Harbors Investment Corp. | | | 86,215 | |
| | | | | | | | |
| | | | | | | 568,745 | |
| | | | | | | | |
| | | | Multiline Retail — 0.8% | |
| | 746 | | | Dollar Tree, Inc.* | | | 62,888 | |
| | 1,949 | | | Target Corp. | | | 162,995 | |
| | | | | | | | |
| | | | | | | 225,883 | |
| | | | | | | | |
| | | | Multi-Utilities — 5.9% | |
| | 2,697 | | | Ameren Corp. | | | 174,172 | |
| | 5,110 | | | CenterPoint Energy, Inc. | | | 138,021 | |
| | 3,463 | | | CMS Energy Corp. | | | 171,488 | |
| | 2,160 | | | Consolidated Edison, Inc. | | | 164,160 | |
| | 2,409 | | | Dominion Energy, Inc. | | | 172,051 | |
| | 1,534 | | | DTE Energy Co. | | | 172,422 | |
| | 5,720 | | | NiSource, Inc. | | | 145,059 | |
| | 3,008 | | | Public Service Enterprise Group, Inc. | | | 160,717 | |
| | 1,909 | | | Vectren Corp. | | | 136,551 | |
| | 2,523 | | | WEC Energy Group, Inc. | | | 172,573 | |
| | | | | | | | |
| | | | | | | 1,607,214 | |
| | | | | | | | |
| | | | Oil, Gas & Consumable Fuels — 3.4% | |
| | 1,287 | | | Chevron Corp. | | | 143,693 | |
| | 1,702 | | | ConocoPhillips | | | 118,970 | |
| | 253 | | | EOG Resources, Inc. | | | 26,651 | |
| | 1,772 | | | Exxon Mobil Corp. | | | 141,193 | |
| | 7,032 | | | Kinder Morgan, Inc. | | | 119,685 | |
| | 1,894 | | | Occidental Petroleum Corp. | | | 127,031 | |
| | 1,369 | | | Phillips 66 | | | 140,761 | |
| | 1,316 | | | Valero Energy Corp. | | | 119,874 | |
| | | | | | | | |
| | | | | | | 937,858 | |
| | | | | | | | |
| | | | Personal Products — 0.5% | |
| | 1,067 | | | Estee Lauder Cos., Inc. (The), Class A | | | 146,648 | |
| | | | | | | | |
| | | | Pharmaceuticals — 3.5% | |
| | 2,043 | | | Bristol-Myers Squibb Co. | | | 103,253 | |
| | 1,614 | | | Eli Lilly & Co. | | | 175,022 | |
| | 1,179 | | | Johnson & Johnson | | | 165,048 | |
| | 2,464 | | | Merck & Co., Inc. | | | 181,375 | |
| | 4,107 | | | Pfizer, Inc. | | | 176,848 | |
| | 1,882 | | | Zoetis, Inc. | | | 169,662 | |
| | | | | | | | |
| | | | | | | 971,208 | |
| | | | | | | | |
| | | | Professional Services — 0.6% | |
| | 1,193 | | | Dun & Bradstreet Corp. (The) | | | 169,740 | |
| | | | | | | | |
SEE NOTES TO FINANCIAL STATEMENTS.
| | | | | | |
| | | |
| 152 | | | | J.P. MORGAN EXCHANGE-TRADED FUNDS | | OCTOBER 31, 2018 |
| | | | | | | | |
| SHARES | | | INVESTMENTS | | VALUE($) | |
| | Common Stocks — continued | |
| | | | Road & Rail — 0.4% | |
| | 761 | | | Union Pacific Corp. | | | 111,273 | |
| | | | | | | | |
| | | | Semiconductors & Semiconductor Equipment — 0.5% | |
| | 1,426 | | | Texas Instruments, Inc. | | | 132,376 | |
| | | | | | | | |
| | | | Software — 2.7% | |
| | 917 | | | ANSYS, Inc.* | | | 137,137 | |
| | 1,656 | | | CA, Inc. | | | 73,460 | |
| | 1,020 | | | CDK Global, Inc. | | | 58,385 | |
| | 777 | | | Intuit, Inc. | | | 163,947 | |
| | 1,518 | | | Microsoft Corp. | | | 162,138 | |
| | 1,669 | | | Synopsys, Inc.* | | | 149,425 | |
| | | | | | | | |
| | | | | | | 744,492 | |
| | | | | | | | |
| | | | Specialty Retail — 1.9% | |
| | 187 | | | AutoZone, Inc.* | | | 137,159 | |
| | 759 | | | Home Depot, Inc. (The) | | | 133,493 | |
| | 241 | | | O’Reilly Automotive, Inc.* | | | 77,300 | |
| | 1,551 | | | TJX Cos., Inc. (The) | | | 170,424 | |
| | | | | | | | |
| | | | | | | 518,376 | |
| | | | | | | | |
| | | | Textiles, Apparel & Luxury Goods — 1.1% | |
| | 2,074 | | | NIKE, Inc., Class B | | | 155,633 | |
| | 1,851 | | | VF Corp. | | | 153,411 | |
| | | | | | | | |
| | | | | | | 309,044 | |
| | | | | | | | |
| | | | Thrifts & Mortgage Finance — 0.1% | |
| | 2,700 | | | TFS Financial Corp. | | | 39,717 | |
| | | | | | | | |
| | | | Tobacco — 1.1% | |
| | 2,428 | | | Altria Group, Inc. | | | 157,917 | |
| | 1,540 | | | Philip Morris International, Inc. | | | 135,628 | |
| | | | | | | | |
| | | | | | | 293,545 | |
| | | | | | | | |
| | | | Water Utilities — 1.0% | |
| | 1,948 | | | American Water Works Co., Inc. | | | 172,457 | |
| | 3,389 | | | Aqua America, Inc. | | | 110,244 | |
| | | | | | | | |
| | | | | | | 282,701 | |
| | | | | | | | |
| | | | Wireless Telecommunication Services — 1.7% | |
| | 4,583 | | | Telephone & Data Systems, Inc. | | | 141,294 | |
| | 2,582 | | | T-Mobile US, Inc.* | | | 176,996 | |
| | 2,811 | | | United States Cellular Corp.* | | | 134,281 | |
| | | | | | | | |
| | | | | | | 452,571 | |
| | | | | | | | |
| | | | Total Common Stocks
(Cost $25,464,687) | | | 26,671,887 | |
| | | | | | | | |
| | | | | |
| | | | | | | | |
| SHARES | | | INVESTMENTS | | VALUE($) | |
| | Short-Term Investments — 2.8% | | | | |
| | | | Investment Companies — 2.8% | | | | |
| | 760,666 | | | JPMorgan U.S. Government Money Market Fund Class Institutional Shares,
2.02% (b) (c)
(Cost $760,666) | | | 760,666 | |
| | | | | | | | |
| | Investments of Cash Collateral from Securities Loaned — 0.3% | |
| | 93,840 | | | JPMorgan U.S. Government Money Market Fund, IM Shares, 2.07% (b) (c)
(Cost $93,840) | | | 93,840 | |
| | | | | | | | |
| | | | Total Investments — 100.3%
(Cost $26,319,193) | | | 27,526,393 | |
| | | | Liabilities in Excess of
Other Assets — (0.3%) | | | (80,623 | ) |
| | | | | | | | |
| | | | NET ASSETS — 100.0% | | | 27,445,770 | |
| | | | | | | | |
Percentages indicated are based on net assets.
| | |
| (a) | | — The security or a portion of this security is on loan at October 31, 2018. The total value of securities on loan at October 31, 2018 was $91,776. |
| (b) | | — Investment in affiliate. Fund is registered under the Investment Company Act of 1940, as amended, and advised by J.P. Morgan Investment Management Inc. |
| (c) | | — The rate shown is the current yield as of October 31, 2018. |
| * | | — Non-income producing security. |
SEE NOTES TO FINANCIAL STATEMENTS.
| | | | | | | | |
| | | |
| OCTOBER 31, 2018 | | J.P. MORGAN EXCHANGE-TRADED FUNDS | | | | | 153 | |
JPMorgan U.S. Minimum Volatility ETF
SCHEDULE OF PORTFOLIO INVESTMENTS
AS OF OCTOBER 31, 2018 (continued)
| | | | | | | | | | | | | | | | | | | | |
| Futures contracts outstanding as of October 31, 2018: | | | | | | | |
| DESCRIPTION | | NUMBER OF
CONTRACTS | | | EXPIRATION
DATE | | | TRADING
CURRENCY | | | NOTIONAL
AMOUNT ($) | | | VALUE AND
UNREALIZED
APPRECIATION
(DEPRECIATION) ($) | |
Long Contracts | | | | | | | | | | | | | | | | | | | | |
S&P 500 E-Mini Index | | | 5 | | | | 12/2018 | | | | USD | | | | 677,550 | | | | (4,248 | ) |
| | | | | | | | | | | | | | | | | | | | |
| | | | | | | | | | | | | | | | | | | (4,248 | ) |
| | | | | | | | | | | | | | | | | | | | |
Abbreviations
| | |
| USD | | — United States Dollar |
SEE NOTES TO FINANCIAL STATEMENTS.
| | | | | | |
| | | |
| 154 | | | | J.P. MORGAN EXCHANGE-TRADED FUNDS | | OCTOBER 31, 2018 |
JPMorgan U.S. Momentum Factor ETF
SCHEDULE OF PORTFOLIO INVESTMENTS
AS OF OCTOBER 31, 2018
| | | | | | | | |
| SHARES | | | INVESTMENTS | | VALUE($) | |
| | Common Stocks — 100.0% | |
| | | | Aerospace & Defense — 4.6% | |
| | 1,297 | | | Boeing Co. (The) | | | 460,253 | |
| | 1,081 | | | BWX Technologies, Inc. | | | 63,195 | |
| | 604 | | | Harris Corp. | | | 89,821 | |
| | 568 | | | HEICO Corp. | | | 47,615 | |
| | 307 | | | Huntington Ingalls Industries, Inc. | | | 67,073 | |
| | 401 | | | L3 Technologies, Inc. | | | 75,978 | |
| | 659 | | | Lockheed Martin Corp. | | | 193,647 | |
| | 458 | | | Northrop Grumman Corp. | | | 119,973 | |
| | 787 | | | Raytheon Co. | | | 137,757 | |
| | 325 | | | Teledyne Technologies, Inc.* | | | 71,916 | |
| | | | | | | | |
| | | | | | | 1,327,228 | |
| | | | | | | | |
| | | | Air Freight & Logistics — 0.3% | |
| | 800 | | | XPO Logistics, Inc.* | | | 71,504 | |
| | | | | | | | |
| | | | Auto Components — 0.7% | |
| | 1,393 | | | BorgWarner, Inc. | | | 54,898 | |
| | 2,997 | | | Gentex Corp. | | | 63,087 | |
| | 427 | | | Lear Corp. | | | 56,748 | |
| | 413 | | | Visteon Corp.* | | | 32,644 | |
| | | | | | | | |
| | | | | | | 207,377 | |
| | | | | | | | |
| | | | Banks — 3.5% | |
| | 13,749 | | | Bank of America Corp. | | | 378,097 | |
| | 965 | | | Citigroup, Inc. | | | 63,169 | |
| | 1,001 | | | Comerica, Inc. | | | 81,642 | |
| | 461 | | | Commerce Bancshares, Inc. | | | 29,320 | |
| | 500 | | | First Republic Bank | | | 45,495 | |
| | 305 | | | SVB Financial Group* | | | 72,355 | |
| | 673 | | | Synovus Financial Corp. | | | 25,278 | |
| | 2,824 | | | TCF Financial Corp. | | | 58,965 | |
| | 3,190 | | | US Bancorp | | | 166,741 | |
| | 1,368 | | | Zions Bancorp N.A. | | | 64,364 | |
| | | | | | | | |
| | | | | | | 985,426 | |
| | | | | | | | |
| | | | Beverages — 0.7% | |
| | 585 | | | Constellation Brands, Inc., Class A | | | 116,550 | |
| | 1,730 | | | Monster Beverage Corp.* | | | 91,430 | |
| | | | | | | | |
| | | | | | | 207,980 | |
| | | | | | | | |
| | | | Biotechnology — 1.7% | |
| | 3,375 | | | AbbVie, Inc. | | | 262,744 | |
| | 329 | | | Agios Pharmaceuticals, Inc.* | | | 20,747 | |
| | 429 | | | Bluebird Bio, Inc.* | | | 49,206 | |
| | 697 | | | Neurocrine Biosciences, Inc.* | | | 74,684 | |
| | 586 | | | Sarepta Therapeutics, Inc.* | | | 78,383 | |
| | | | | | | | |
| | | | | | | 485,764 | |
| | | | | | | | |
| | | | | | | | |
| SHARES | | | INVESTMENTS | | VALUE($) | |
| | | | | | | | |
| | | | Building Products — 0.1% | |
| | 19 | | | AO Smith Corp. | | | 865 | |
| | 94 | | | Lennox International, Inc. | | | 19,824 | |
| | | | | | | | |
| | | | | | | 20,689 | |
| | | | | | | | |
| | | | Capital Markets — 3.7% | |
| | 354 | | | BlackRock, Inc. | | | 145,643 | |
| | 1,071 | | | CME Group, Inc. | | | 196,250 | |
| | 1,467 | | | E*TRADE Financial Corp. | | | 72,499 | |
| | 115 | | | FactSet Research Systems, Inc. | | | 25,732 | |
| | 1,131 | | | Interactive Brokers Group, Inc., Class A | | | 55,883 | |
| | 1,010 | | | LPL Financial Holdings, Inc. | | | 62,216 | |
| | 146 | | | MarketAxess Holdings, Inc. | | | 30,612 | |
| | 676 | | | Moody’s Corp. | | | 98,345 | |
| | 530 | | | MSCI, Inc. | | | 79,701 | |
| | 808 | | | S&P Global, Inc. | | | 147,315 | |
| | 1,123 | | | SEI Investments Co. | | | 60,024 | |
| | 986 | | | T. Rowe Price Group, Inc. | | | 95,632 | |
| | | | | | | | |
| | | | | | | 1,069,852 | |
| | | | | | | | |
| | | | Chemicals — 1.8% | |
| | 1,516 | | | CF Industries Holdings, Inc. | | | 72,813 | |
| | 2,263 | | | DowDuPont, Inc. | | | 122,021 | |
| | 265 | | | Eastman Chemical Co. | | | 20,763 | |
| | 850 | | | Ecolab, Inc. | | | 130,178 | |
| | 838 | | | FMC Corp. | | | 65,431 | |
| | 2,169 | | | Huntsman Corp. | | | 47,458 | |
| | 149 | | | LyondellBasell Industries NV, Class A | | | 13,301 | |
| | 580 | | | Westlake Chemical Corp. | | | 41,354 | |
| | | | | | | | |
| | | | | | | 513,319 | |
| | | | | | | | |
| | | | Commercial Services & Supplies — 1.6% | |
| | 476 | | | Cintas Corp. | | | 86,570 | |
| | 1,399 | | | Copart, Inc.* | | | 68,425 | |
| | 1,301 | | | Republic Services, Inc. | | | 94,557 | |
| | 1,248 | | | Rollins, Inc. | | | 73,882 | |
| | 1,477 | | | Waste Management, Inc. | | | 132,147 | |
| | | | | | | | |
| | | | | | | 455,581 | |
| | | | | | | | |
| | | | Communications Equipment — 2.3% | |
| | 319 | | | Arista Networks, Inc.* | | | 73,482 | |
| | 6,959 | | | Cisco Systems, Inc. | | | 318,374 | |
| | 460 | | | F5 Networks, Inc.* | | | 80,629 | |
| | 827 | | | Motorola Solutions, Inc. | | | 101,357 | |
| | 458 | | | Palo Alto Networks, Inc.* | | | 83,832 | |
| | | | | | | | |
| | | | | | | 657,674 | |
| | | | | | | | |
| | | | Construction & Engineering — 0.0% (a) | |
| | 369 | | | frontdoor, Inc.* | | | 12,564 | |
| | | | | | | | |
SEE NOTES TO FINANCIAL STATEMENTS.
| | | | | | | | |
| | | |
| OCTOBER 31, 2018 | | J.P. MORGAN EXCHANGE-TRADED FUNDS | | | | | 155 | |
JPMorgan U.S. Momentum Factor ETF
SCHEDULE OF PORTFOLIO INVESTMENTS
AS OF OCTOBER 31, 2018 (continued)
| | | | | | | | |
| SHARES | | | INVESTMENTS | | VALUE($) | |
| | Common Stocks — continued | |
| | | | Consumer Finance — 0.7% | |
| | 1,403 | | | American Express Co. | | | 144,130 | |
| | 120 | | | Credit Acceptance Corp.* | | | 50,930 | |
| | | | | | | | |
| | | | | | | 195,060 | |
| | | | | | | | |
| | | | Containers & Packaging — 0.3% | |
| | 302 | | | AptarGroup, Inc. | | | 30,792 | |
| | 660 | | | Avery Dennison Corp. | | | 59,875 | |
| | | | | | | | |
| | | | | | | 90,667 | |
| | | | | | | | |
| | | | Distributors — 0.2% | |
| | 465 | | | Pool Corp. | | | 67,774 | |
| | | | | | | | |
| | | | Diversified Consumer Services — 0.5% | |
| | 619 | | | Bright Horizons Family Solutions, Inc.* | | | 71,129 | |
| | 30 | | | Graham Holdings Co., Class B | | | 17,432 | |
| | 563 | | | Service Corp. International | | | 23,348 | |
| | 739 | | | ServiceMaster Global Holdings, Inc.* | | | 31,688 | |
| | | | | | | | |
| | | | | | | 143,597 | |
| | | | | | | | |
| | | | Diversified Financial Services — 2.2% | |
| | 3,011 | | | Berkshire Hathaway, Inc., Class B* | | | 618,098 | |
| | | | | | | | |
| | | | Diversified Telecommunication Services — 2.0% | |
| | 9,361 | | | Verizon Communications, Inc. | | | 534,420 | |
| | 1,357 | | | Zayo Group Holdings, Inc.* | | | 40,547 | |
| | | | | | | | |
| | | | | | | 574,967 | |
| | | | | | | | |
| | | | Electric Utilities — 1.7% | |
| | 877 | | | American Electric Power Co., Inc. | | | 64,337 | |
| | 1,103 | | | Avangrid, Inc. | | | 51,852 | |
| | 2,819 | | | Exelon Corp. | | | 123,500 | |
| | 1,322 | | | NextEra Energy, Inc. | | | 228,045 | |
| | 97 | | | OGE Energy Corp. | | | 3,507 | |
| | | | | | | | |
| | | | | | | 471,241 | |
| | | | | | | | |
| | | | Electronic Equipment, Instruments & Components — 1.0% | |
| | 615 | | | CDW Corp. | | | 55,356 | |
| | 529 | | | Dolby Laboratories, Inc., Class A | | | 36,400 | |
| | 1,282 | | | FLIR Systems, Inc. | | | 59,369 | |
| | 1,358 | | | Keysight Technologies, Inc.* | | | 77,515 | |
| | 323 | | | Zebra Technologies Corp., Class A* | | | 53,715 | |
| | | | | | | | |
| | | | | | | 282,355 | |
| | | | | | | | |
| | | | Entertainment — 2.6% | |
| | 2,267 | | | Activision Blizzard, Inc. | | | 156,537 | |
| | 983 | | | Electronic Arts, Inc.* | | | 89,433 | |
| | 1,541 | | | Live Nation Entertainment, Inc.* | | | 80,594 | |
| | 1,040 | | | Netflix, Inc.* | | | 313,851 | |
| | 705 | | | Take-Two Interactive Software, Inc.* | | | 90,853 | |
| | | | | | | | |
| | | | | | | 731,268 | |
| | | | | | | | |
| | | | | | | | |
| SHARES | | | INVESTMENTS | | VALUE($) | |
| | |
| | | | Equity Real Estate Investment Trusts (REITs) — 1.3% | |
| | 616 | | | Alexandria Real Estate Equities, Inc. | | | 75,294 | |
| | 259 | | | CoreSite Realty Corp. | | | 24,310 | |
| | 786 | | | CyrusOne, Inc. | | | 41,839 | |
| | 345 | | | Equity LifeStyle Properties, Inc. | | | 32,668 | |
| | 419 | | | Life Storage, Inc. | | | 39,453 | |
| | 2,237 | | | Prologis, Inc. | | | 144,219 | |
| | | | | | | | |
| | | | | | | 357,783 | |
| | | | | | | | |
| | | | Food & Staples Retailing — 1.2% | |
| | 908 | | | Costco Wholesale Corp. | | | 207,596 | |
| | 1,820 | | | Sysco Corp. | | | 129,821 | |
| | | | | | | | |
| | | | | | | 337,417 | |
| | | | | | | | |
| | | | Food Products — 0.4% | |
| | 685 | | | Conagra Brands, Inc. | | | 24,386 | |
| | 1,235 | | | Lamb Weston Holdings, Inc. | | | 96,528 | |
| | | | | | | | |
| | | | | | | 120,914 | |
| | | | | | | | |
| | | | Gas Utilities — 0.3% | |
| | 773 | | | Atmos Energy Corp. | | | 71,951 | |
| | | | | | | | |
| | | | Health Care Equipment & Supplies — 4.1% | |
| | 246 | | | ABIOMED, Inc.* | | | 83,935 | |
| | 327 | | | Align Technology, Inc.* | | | 72,332 | |
| | 789 | | | Becton Dickinson and Co. | | | 181,864 | |
| | 3,963 | | | Boston Scientific Corp.* | | | 143,223 | |
| | 436 | | | Hill-Rom Holdings, Inc. | | | 36,659 | |
| | 238 | | | ICU Medical, Inc.* | | | 60,626 | |
| | 430 | | | IDEXX Laboratories, Inc.* | | | 91,212 | |
| | 412 | | | Insulet Corp.* | | | 36,343 | |
| | 346 | | | Intuitive Surgical, Inc.* | | | 180,328 | |
| | 251 | | | Penumbra, Inc.* | | | 34,136 | |
| | 857 | | | ResMed, Inc. | | | 90,773 | |
| | 439 | | | STERIS plc | | | 47,987 | |
| | 293 | | | Teleflex, Inc. | | | 70,537 | |
| | 317 | | | West Pharmaceutical Services, Inc. | | | 33,577 | |
| | | | | | | | |
| | | | | | | 1,163,532 | |
| | | | | | | | |
| | | | Health Care Providers & Services — 5.8% | |
| | 772 | | | Aetna, Inc. | | | 153,165 | |
| | 718 | | | Anthem, Inc. | | | 197,859 | |
| | 851 | | | Centene Corp.* | | | 110,902 | |
| | 230 | | | Chemed Corp. | | | 69,996 | |
| | 974 | | | Encompass Health Corp. | | | 65,550 | |
| | 1,044 | | | HCA Healthcare, Inc. | | | 139,405 | |
| | 473 | | | Humana, Inc. | | | 151,554 | |
| | 499 | | | Laboratory Corp. of America Holdings* | | | 80,115 | |
| | 583 | | | Molina Healthcare, Inc.* | | | 73,907 | |
SEE NOTES TO FINANCIAL STATEMENTS.
| | | | | | |
| | | |
| 156 | | | | J.P. MORGAN EXCHANGE-TRADED FUNDS | | OCTOBER 31, 2018 |
| | | | | | | | |
| SHARES | | | INVESTMENTS | | VALUE($) | |
| | Common Stocks — continued | |
| | | | Health Care Providers & Services — continued | |
| | 2,077 | | | UnitedHealth Group, Inc. | | | 542,824 | |
| | 311 | | | WellCare Health Plans, Inc.* | | | 85,833 | |
| | | | | | | | |
| | | | | | | 1,671,110 | |
| | | | | | | | |
| | | | Health Care Technology — 0.1% | |
| | 265 | | | Veeva Systems, Inc., Class A* | | | 24,208 | |
| | | | | | | | |
| | | | Hotels, Restaurants & Leisure — 4.1% | |
| | 416 | | | Choice Hotels International, Inc. | | | 30,534 | |
| | 799 | | | Darden Restaurants, Inc. | | | 85,134 | |
| | 299 | | | Domino’s Pizza, Inc. | | | 80,368 | |
| | 1,136 | | | Hilton Worldwide Holdings, Inc. | | | 80,849 | |
| | 809 | | | Hyatt Hotels Corp., Class A | | | 55,983 | |
| | 855 | | | International Game Technology plc | | | 15,860 | |
| | 1,460 | | | Las Vegas Sands Corp. | | | 74,504 | |
| | 1,024 | | | Marriott International, Inc., Class A | | | 119,695 | |
| | 1,818 | | | McDonald’s Corp. | | | 321,604 | |
| | 294 | | | Vail Resorts, Inc. | | | 73,888 | |
| | 3,289 | | | Wendy’s Co. (The) | | | 56,702 | |
| | 236 | | | Wyndham Destinations, Inc. | | | 8,468 | |
| | 501 | | | Wynn Resorts Ltd. | | | 50,401 | |
| | 2,144 | | | Yum China Holdings, Inc. (China) | | | 77,356 | |
| | 473 | | | Yum! Brands, Inc. | | | 42,764 | |
| | | | | | | | |
| | | | | | | 1,174,110 | |
| | | | | | | | |
| | | | Household Durables — 0.8% | |
| | 1,817 | | | DR Horton, Inc. | | | 65,339 | |
| | 26 | | | NVR, Inc.* | | | 58,215 | |
| | 2,175 | | | PulteGroup, Inc. | | | 53,440 | |
| | 1,397 | | | Toll Brothers, Inc. | | | 47,023 | |
| | | | | | | | |
| | | | | | | 224,017 | |
| | | | | | | | |
| | | | Household Products — 0.3% | |
| | 1,492 | | | Church & Dwight Co., Inc. | | | 88,580 | |
| | | | | | | | |
| | | | Independent Power and Renewable Electricity Producers — 0.6% | |
| | 2,407 | | | NRG Energy, Inc. | | | 87,109 | |
| | 3,523 | | | Vistra Energy Corp.* | | | 79,726 | |
| | | | | | | | |
| | | | | | | 166,835 | |
| | | | | | | | |
| | | | Insurance — 3.9% | |
| | 1,224 | | | Allstate Corp. (The) | | | 117,161 | |
| | 646 | | | American Financial Group, Inc. | | | 64,619 | |
| | 855 | | | Aon plc | | | 133,534 | |
| | 1,179 | | | Arthur J Gallagher & Co. | | | 87,258 | |
| | 2,308 | | | Brown & Brown, Inc. | | | 65,040 | |
| | 567 | | | CNA Financial Corp. | | | 24,591 | |
| | 1,953 | | | Fidelity National Financial, Inc. | | | 65,328 | |
| | | | | | | | |
| SHARES | | | INVESTMENTS | | VALUE($) | |
| | | | | | | | |
| | | | Insurance — continued | |
| | 1,197 | | | First American Financial Corp. | | | 53,063 | |
| | 124 | | | Hanover Insurance Group, Inc. (The) | | | 13,811 | |
| | 6 | | | Markel Corp.* | | | 6,559 | |
| | 1,569 | | | Marsh & McLennan Cos., Inc. | | | 132,973 | |
| | 1,324 | | | Old Republic International Corp. | | | 29,194 | |
| | 2,135 | | | Progressive Corp. (The) | | | 148,810 | |
| | 455 | | | Reinsurance Group of America, Inc. | | | 64,778 | |
| | 91 | | | Torchmark Corp. | | | 7,704 | |
| | 902 | | | Travelers Cos., Inc. (The) | | | 112,867 | |
| | | | | | | | |
| | | | | | | 1,127,290 | |
| | | | | | | | |
| | | | Interactive Media & Services — 2.4% | |
| | 476 | | | Alphabet, Inc., Class A* | | | 519,116 | |
| | 473 | | | IAC/InterActiveCorp* | | | 92,987 | |
| | 1,364 | | | Match Group, Inc.* (b) | | | 70,546 | |
| | | | | | | | |
| | | | | | | 682,649 | |
| | | | | | | | |
| | | | Internet & Direct Marketing Retail — 2.2% | |
| | 313 | | | Amazon.com, Inc.* | | | 500,177 | |
| | 623 | | | GrubHub, Inc.* | | | 57,777 | |
| | 585 | | | Wayfair, Inc., Class A* | | | 64,520 | |
| | | | | | | | |
| | | | | | | 622,474 | |
| | | | | | | | |
| | | | IT Services — 8.8% | |
| | 950 | | | Booz Allen Hamilton Holding Corp. | | | 47,063 | |
| | 706 | | | Broadridge Financial Solutions, Inc. | | | 82,560 | |
| | 692 | | | Cognizant Technology Solutions Corp., Class A | | | 47,769 | |
| | 1,274 | | | DXC Technology Co. | | | 92,785 | |
| | 517 | | | EPAM Systems, Inc.* | | | 61,766 | |
| | 375 | | | Fidelity National Information Services, Inc. | | | 39,038 | |
| | 1,612 | | | Fiserv, Inc.* | | | 127,832 | |
| | 1,104 | | | GoDaddy, Inc., Class A* | | | 80,780 | |
| | 563 | | | Jack Henry & Associates, Inc. | | | 84,354 | |
| | 152 | | | Leidos Holdings, Inc. | | | 9,847 | |
| | 2,205 | | | Mastercard, Inc., Class A | | | 435,862 | |
| | 1,195 | | | Okta, Inc.* | | | 69,740 | |
| | 3,007 | | | PayPal Holdings, Inc.* | | | 253,159 | |
| | 1,303 | | | Square, Inc., Class A* | | | 95,705 | |
| | 1,021 | | | Total System Services, Inc. | | | 93,064 | |
| | 928 | | | Twilio, Inc., Class A* | | | 69,804 | |
| | 615 | | | VeriSign, Inc.* | | | 87,662 | |
| | 4,149 | | | Visa, Inc., Class A | | | 571,940 | |
| | 416 | | | WEX, Inc.* | | | 73,199 | |
| | 923 | | | Worldpay, Inc.* | | | 84,768 | |
| | | | | | | | |
| | | | | | | 2,508,697 | |
| | | | | | | | |
| | | | Leisure Products — 0.2% | |
| | 659 | | | Hasbro, Inc. | | | 60,437 | |
| | | | | | | | |
SEE NOTES TO FINANCIAL STATEMENTS.
| | | | | | | | |
| | | |
| OCTOBER 31, 2018 | | J.P. MORGAN EXCHANGE-TRADED FUNDS | | | | | 157 | |
JPMorgan U.S. Momentum Factor ETF
SCHEDULE OF PORTFOLIO INVESTMENTS
AS OF OCTOBER 31, 2018 (continued)
| | | | | | | | |
| SHARES | | | INVESTMENTS | | VALUE($) | |
| | Common Stocks — continued | |
| | | | Life Sciences Tools & Services — 0.9% | |
| | 238 | | | Bio-Rad Laboratories, Inc., Class A* | | | 64,938 | |
| | 227 | | | Bio-Techne Corp. | | | 38,073 | |
| | 1,213 | | | Bruker Corp. | | | 38,003 | |
| | 202 | | | Illumina, Inc.* | | | 62,852 | |
| | 431 | | | IQVIA Holdings, Inc.* | | | 52,983 | |
| | | | | | | | |
| | | | | | | 256,849 | |
| | | | | | | | |
| | | | Machinery — 0.3% | |
| | 102 | | | Oshkosh Corp. | | | 5,726 | |
| | 154 | | | Wabtec Corp. | | | 12,631 | |
| | 836 | | | Xylem, Inc. | | | 54,825 | |
| | | | | | | | |
| | | | | | | 73,182 | |
| | | | | | | | |
| | | | Media — 0.1% | |
| | 22 | | | Cable One, Inc. | | | 19,706 | |
| | 159 | | | GCI Liberty, Inc., Class A* | | | 7,526 | |
| | | | | | | | |
| | | | | | | 27,232 | |
| | | | | | | | |
| | | | Metals & Mining — 0.2% | |
| | 1,246 | | | Southern Copper Corp. (Peru) | | | 47,772 | |
| | | | | | | | |
| | | | Mortgage Real Estate Investment Trusts (REITs) — 0.2% | |
| | 2,665 | | | Chimera Investment Corp. | | | 49,569 | |
| | 779 | | | Two Harbors Investment Corp. | | | 11,443 | |
| | | | | | | | |
| | | | | | | 61,012 | |
| | | | | | | | |
| | | | Multiline Retail — 0.3% | |
| | 1,142 | | | Kohl’s Corp. | | | 86,484 | |
| | | | | | | | |
| | | | Multi-Utilities — 0.6% | |
| | 654 | | | DTE Energy Co. | | | 73,510 | |
| | 2,490 | | | NiSource, Inc. | | | 63,146 | |
| | 311 | | | Vectren Corp. | | | 22,246 | |
| | | | | | | | |
| | | | | | | 158,902 | |
| | | | | | | | |
| | | | Oil, Gas & Consumable Fuels — 5.3% | |
| | 2,621 | | | Chevron Corp. | | | 292,635 | |
| | 833 | | | ConocoPhillips | | | 58,227 | |
| | 1,048 | | | Continental Resources, Inc.* | | | 55,209 | |
| | 654 | | | Diamondback Energy, Inc. | | | 73,483 | |
| | 1,360 | | | EOG Resources, Inc. | | | 143,262 | |
| | 1,181 | | | HollyFrontier Corp. | | | 79,647 | |
| | 2,811 | | | Marathon Petroleum Corp. | | | 198,035 | |
| | 2,152 | | | Occidental Petroleum Corp. | | | 144,335 | |
| | 1,459 | | | PBF Energy, Inc., Class A | | | 61,059 | |
| | 1,367 | | | Phillips 66 | | | 140,555 | |
| | 1,418 | | | Targa Resources Corp. | | | 73,268 | |
| | 1,428 | | | Valero Energy Corp. | | | 130,076 | |
| | 4,027 | | | WPX Energy, Inc.* | | | 64,593 | |
| | | | | | | | |
| | | | | | | 1,514,384 | |
| | | | | | | | |
| | | | | | | | |
| SHARES | | | INVESTMENTS | | VALUE($) | |
| | | | | | | | |
| | | | Personal Products — 0.6% | |
| | 839 | | | Estee Lauder Cos., Inc. (The), Class A | | | 115,312 | |
| | 827 | | | Nu Skin Enterprises, Inc., Class A | | | 58,072 | |
| | | | | | | | |
| | | | | | | 173,384 | |
| | | | | | | | |
| | | | Pharmaceuticals — 0.6% | |
| | 1,208 | | | Nektar Therapeutics* | | | 46,725 | |
| | 1,521 | | | Zoetis, Inc. | | | 137,118 | |
| | | | | | | | |
| | | | | | | 183,843 | |
| | | | | | | | |
| | | | Professional Services — 0.9% | |
| | 217 | | | CoStar Group, Inc.* | | | 78,428 | |
| | 1,054 | | | Robert Half International, Inc. | | | 63,798 | |
| | 765 | | | TransUnion | | | 50,299 | |
| | 627 | | | Verisk Analytics, Inc.* | | | 75,140 | |
| | | | | | | | |
| | | | | | | 267,665 | |
| | | | | | | | |
| | | | Road & Rail — 1.0% | |
| | 636 | | | JB Hunt Transport Services, Inc. | | | 70,348 | |
| | 943 | | | Norfolk Southern Corp. | | | 158,264 | |
| | 510 | | | Old Dominion Freight Line, Inc. | | | 66,514 | |
| | | | | | | | |
| | | | | | | 295,126 | |
| | | | | | | | |
| | | | Semiconductors & Semiconductor Equipment — 2.5% | |
| | 1,033 | | | First Solar, Inc.* | | | 43,179 | |
| | 498 | | | KLA-Tencor Corp. | | | 45,587 | |
| | 3,362 | | | Micron Technology, Inc.* | | | 126,815 | |
| | 1,402 | | | NVIDIA Corp. | | | 295,584 | |
| | 2,262 | | | Texas Instruments, Inc. | | | 209,981 | |
| | | | | | | | |
| | | | | | | 721,146 | |
| | | | | | | | |
| | | | Software — 9.4% | |
| | 712 | | | 2U, Inc.* | | | 44,792 | |
| | 1,263 | | | Adobe, Inc.* | | | 310,395 | |
| | 511 | | | ANSYS, Inc.* | | | 76,420 | |
| | 513 | | | Aspen Technology, Inc.* | | | 43,549 | |
| | 909 | | | Atlassian Corp. plc, Class A* | | | 69,002 | |
| | 341 | | | Autodesk, Inc.* | | | 44,074 | |
| | 1,786 | | | Cadence Design Systems, Inc.* | | | 79,602 | |
| | 833 | | | Citrix Systems, Inc.* | | | 85,358 | |
| | 230 | | | Fair Isaac Corp.* | | | 44,323 | |
| | 1,039 | | | Fortinet, Inc.* | | | 85,385 | |
| | 793 | | | Intuit, Inc. | | | 167,323 | |
| | 5,613 | | | Microsoft Corp. | | | 599,525 | |
| | 1,338 | | | Nutanix, Inc., Class A* | | | 55,540 | |
| | 516 | | | Paycom Software, Inc.* | | | 64,603 | |
| | 872 | | | PTC, Inc.* | | | 71,862 | |
| | 862 | | | RealPage, Inc.* | | | 45,686 | |
| | 724 | | | Red Hat, Inc.* | | | 124,267 | |
SEE NOTES TO FINANCIAL STATEMENTS.
| | | | | | |
| | | |
| 158 | | | | J.P. MORGAN EXCHANGE-TRADED FUNDS | | OCTOBER 31, 2018 |
| | | | | | | | |
| SHARES | | | INVESTMENTS | | VALUE($) | |
| | Common Stocks — continued | |
| | | | Software — continued | | | | |
| | 815 | | | RingCentral, Inc., Class A* | | | 63,350 | |
| | 1,877 | | | salesforce.com, Inc.* | | | 257,600 | |
| | 684 | | | ServiceNow, Inc.* | | | 123,831 | |
| | 344 | | | SS&C Technologies Holdings, Inc. | | | 17,599 | |
| | 896 | | | Synopsys, Inc.* | | | 80,219 | |
| | 555 | | | VMware, Inc., Class A* | | | 78,471 | |
| | 1,129 | | | Zendesk, Inc.* | | | 62,061 | |
| | | | | | | | |
| | | | | | | 2,694,837 | |
| | | | | | | | |
| | | | Specialty Retail — 3.2% | |
| | 1,292 | | | Best Buy Co., Inc. | | | 90,647 | |
| | 518 | | | Burlington Stores, Inc.* | | | 88,832 | |
| | 2,524 | | | Home Depot, Inc. (The) | | | 443,921 | |
| | 243 | | | Ross Stores, Inc. | | | 24,057 | |
| | 1,874 | | | TJX Cos., Inc. (The) | | | 205,915 | |
| | 1,507 | | | Urban Outfitters, Inc.* | | | 59,466 | |
| | | | | | | | |
| | | | | | | 912,838 | |
| | | | | | | | |
| | | | Technology Hardware, Storage & Peripherals — 2.5% | |
| | 2,770 | | | Apple, Inc. | | | 606,242 | |
| | 1,269 | | | NetApp, Inc. | | | 99,604 | |
| | | | | | | | |
| | | | | | | 705,846 | |
| | | | | | | | |
| | | | Textiles, Apparel & Luxury Goods — 2.1% | |
| | 566 | | | Columbia Sportswear Co. | | | 51,099 | |
| | 610 | | | Lululemon Athletica, Inc.* | | | 85,845 | |
| | 3,385 | | | NIKE, Inc., Class B | | | 254,010 | |
| | 523 | | | PVH Corp. | | | 63,173 | |
| | 548 | | | Ralph Lauren Corp. | | | 71,026 | |
| | 938 | | | VF Corp. | | | 77,742 | |
| | | | | | | | |
| | | | | | | 602,895 | |
| | | | | | | | |
| | | | Trading Companies & Distributors — 0.5% | |
| | 495 | | | United Rentals, Inc.* | | | 59,434 | |
| | 272 | | | WW Grainger, Inc. | | | 77,240 | |
| | | | | | | | |
| | | | | | | 136,674 | |
| | | | | | | | |
| | | | Wireless Telecommunication Services — 0.1% | |
| | 1,194 | | | Telephone & Data Systems, Inc. | | | 36,811 | |
| | | | | | | | |
| | | | Total Common Stocks
(Cost $27,226,813) | | | 28,548,871 | |
| | | | | | | | |
| | Short-term Investments — 0.2% | | | | |
| | | | Investment Companies — 0.2% | |
| | 63,323 | | | JPMorgan U.S. Government Money Market Fund Class Institutional Shares,
2.02% (c) (d)
(Cost $63,323) | | | 63,323 | |
| | | | | | | | |
| | | | | | | | |
| SHARES | | | INVESTMENTS | | VALUE($) | |
| | Investment of Cash Collateral from Securities Loaned — 0.2% | |
| | 66,300 | | | JPMorgan U.S. Government Money
2.07% (c) (d)
(Cost $66,300) | | | 66,300 | |
| | | | | | | | |
| | | | Total Investments — 100.4%
(Cost $27,356,436) | | | 28,678,494 | |
| | | | Liabilities in Excess of
Other Assets — (0.4%) | | | (103,124 | ) |
| | | | | | | | |
| | | | NET ASSETS — 100.0% | | | 28,575,370 | |
| | | | | | | | |
Percentages indicated are based on net assets.
| | |
| (a) | | — Amount rounds to less than 0.1% of net assets. |
| (b) | | — The security or a portion of this security is on loan at October 31, 2018. The total value of securities on loan at October 31, 2018 was $64,857. |
| (c) | | — Investment in affiliate. Fund is registered under the Investment Company Act of 1940, as amended, and advised by J.P. Morgan Investment Management Inc. |
| (d) | | — The rate shown is the current yield as of October 31, 2018. |
| * | | — Non-income producing security. |
SEE NOTES TO FINANCIAL STATEMENTS.
| | | | | | | | |
| | | |
| OCTOBER 31, 2018 | | J.P. MORGAN EXCHANGE-TRADED FUNDS | | | | | 159 | |
JPMorgan U.S. Quality Factor ETF
SCHEDULE OF PORTFOLIO INVESTMENTS
AS OF OCTOBER 31, 2018
| | | | | | | | |
| SHARES | | | INVESTMENTS | | VALUE($) | |
| | Common Stocks — 96.6% | |
| | | | Aerospace & Defense — 3.0% | |
| | 1,259 | | | Boeing Co. (The) | | | 446,769 | |
| | 445 | | | BWX Technologies, Inc. | | | 26,015 | |
| | 649 | | | Lockheed Martin Corp. | | | 190,708 | |
| | 895 | | | Raytheon Co. | | | 156,661 | |
| | 843 | | | Spirit AeroSystems Holdings, Inc., Class A | | | 70,820 | |
| | | | | | | | |
| | | | | | | 890,973 | |
| | | | | | | | |
| | | | Banks — 1.0% | |
| | 637 | | | Bank of Hawaii Corp. | | | 49,966 | |
| | 800 | | | Commerce Bancshares, Inc. | | | 50,880 | |
| | 3,458 | | | US Bancorp | | | 180,750 | |
| | | | | | | | |
| | | | | | | 281,596 | |
| | | | | | | | |
| | | | Beverages — 2.4% | |
| | 1,352 | | | Brown-Forman Corp., Class B | | | 62,652 | |
| | 6,484 | | | Coca-Cola Co. (The) | | | 310,454 | |
| | 9 | | | Monster Beverage Corp.* | | | 476 | |
| | 2,927 | | | PepsiCo, Inc. | | | 328,936 | |
| | | | | | | | |
| | | | | | | 702,518 | |
| | | | | | | | |
| | | | Biotechnology — 4.2% | |
| | 2,966 | | | AbbVie, Inc. | | | 230,903 | |
| | 1,629 | | | Amgen, Inc. | | | 314,055 | |
| | 564 | | | Biogen, Inc.* | | | 171,608 | |
| | 2,826 | | | Gilead Sciences, Inc. | | | 192,677 | |
| | 909 | | | Ionis Pharmaceuticals, Inc.* | | | 45,041 | |
| | 226 | | | Regeneron Pharmaceuticals, Inc.* | | | 76,668 | |
| | 450 | | | United Therapeutics Corp.* | | | 49,887 | |
| | 798 | | | Vertex Pharmaceuticals, Inc.* | | | 135,229 | |
| | | | | | | | |
| | | | | | | 1,216,068 | |
| | | | | | | | |
| | | | Building Products — 0.1% | |
| | 335 | | | Allegion plc | | | 28,720 | |
| | | | | | | | |
| | | | Capital Markets — 1.8% | |
| | 608 | | | Cboe Global Markets, Inc. | | | 68,613 | |
| | 681 | | | Eaton Vance Corp. | | | 30,679 | |
| | 346 | | | FactSet Research Systems, Inc. | | | 77,421 | |
| | 7 | | | Franklin Resources, Inc. | | | 213 | |
| | 388 | | | MSCI, Inc. | | | 58,347 | |
| | 639 | | | Nasdaq, Inc. | | | 55,408 | |
| | 811 | | | S&P Global, Inc. | | | 147,862 | |
| | 55 | | | SEI Investments Co. | | | 2,940 | |
| | 765 | | | T. Rowe Price Group, Inc. | | | 74,197 | |
| | | | | | | | |
| | | | | | | 515,680 | |
| | | | | | | | |
| | | | Chemicals — 1.9% | |
| | 713 | | | Air Products & Chemicals, Inc. | | | 110,052 | |
| | 941 | | | Linde plc (United Kingdom) | | | 155,707 | |
| | | | | | | | |
| SHARES | | | INVESTMENTS | | VALUE($) | |
| | | | | | | | |
| | | | Chemicals — continued | |
| | 1,155 | | | LyondellBasell Industries NV, Class A | | | 103,107 | |
| | 141 | | | NewMarket Corp. | | | 54,420 | |
| | 901 | | | PPG Industries, Inc. | | | 94,686 | |
| | 459 | | | WR Grace & Co. | | | 29,739 | |
| | | | | | | | |
| | | | | | | 547,711 | |
| | | | | | | | |
| | | | Commercial Services & Supplies — 0.2% | |
| | 1,373 | | | Copart, Inc.* | | | 67,153 | |
| | | | | | | | |
| | | | Communications Equipment — 3.0% | |
| | 323 | | | Arista Networks, Inc.* | | | 74,403 | |
| | 10,892 | | | Cisco Systems, Inc. | | | 498,309 | |
| | 451 | | | F5 Networks, Inc.* | | | 79,051 | |
| | 2,684 | | | Juniper Networks, Inc. | | | 78,561 | |
| | 449 | | | Palo Alto Networks, Inc.* | | | 82,185 | |
| | 638 | | | Ubiquiti Networks, Inc. | | | 59,391 | |
| | | | | | | | |
| | | | | | | 871,900 | |
| | | | | | | | |
| | | | Consumer Finance — 0.7% | |
| | 1,929 | | | American Express Co. | | | 198,166 | |
| | | | | | | | |
| | | | Containers & Packaging — 0.2% | |
| | 504 | | | Avery Dennison Corp. | | | 45,723 | |
| | | | | | | | |
| | | | Diversified Consumer Services — 0.2% | |
| | 2,505 | | | H&R Block, Inc. | | | 66,483 | |
| | | | | | | | |
| | | | Diversified Financial Services — 2.1% | |
| | 2,951 | | | Berkshire Hathaway, Inc., Class B* | | | 605,781 | |
| | | | | | | | |
| | | | Diversified Telecommunication Services — 2.0% | |
| | 8,008 | | | AT&T, Inc. | | | 245,685 | |
| | 5,964 | | | Verizon Communications, Inc. | | | 340,485 | |
| | | | | | | | |
| | | | | | | 586,170 | |
| | | | | | | | |
| | | | Electric Utilities — 1.2% | |
| | 1,172 | | | Edison International | | | 81,325 | |
| | 1,038 | | | NextEra Energy, Inc. | | | 179,055 | |
| | 1,814 | | | PG&E Corp.* | | | 84,913 | |
| | | | | | | | |
| | | | | | | 345,293 | |
| | | | | | | | |
| | | | Electrical Equipment — 0.7% | |
| | 2,027 | | | Emerson Electric Co. | | | 137,593 | |
| | 502 | | | Rockwell Automation, Inc. | | | 82,694 | |
| | | | | | | | |
| | | | | | | 220,287 | |
| | | | | | | | |
| | | | Electronic Equipment, Instruments & Components — 0.1% | |
| | 556 | | | Dolby Laboratories, Inc., Class A | | | 38,259 | |
| | 23 | | | Resideo Technologies, Inc.* | | | 484 | |
| | | | | | | | |
| | | | | | | 38,743 | |
| | | | | | | | |
SEE NOTES TO FINANCIAL STATEMENTS.
| | | | | | |
| | | |
| 160 | | | | J.P. MORGAN EXCHANGE-TRADED FUNDS | | OCTOBER 31, 2018 |
| | | | | | | | |
| SHARES | | | INVESTMENTS | | VALUE($) | |
| | Common Stocks — continued | |
| | | | Energy Equipment & Services — 0.9% | |
| | 750 | | | Halliburton Co. | | | 26,010 | |
| | 2,091 | | | National Oilwell Varco, Inc. | | | 76,949 | |
| | 2,686 | | | RPC, Inc. | | | 39,968 | |
| | 2,123 | | | Schlumberger Ltd. | | | 108,931 | |
| | | | | | | | |
| | | | | | | 251,858 | |
| | | | | | | | |
| | | | Equity Real Estate Investment Trusts (REITs) — 2.8% | |
| | 877 | | | American Tower Corp. | | | 136,645 | |
| | 445 | | | Camden Property Trust | | | 40,170 | |
| | 812 | | | Equity LifeStyle Properties, Inc. | | | 76,888 | |
| | 942 | | | Equity Residential | | | 61,192 | |
| | 433 | | | Federal Realty Investment Trust | | | 53,714 | |
| | 2,137 | | | Gaming and Leisure Properties, Inc. | | | 71,996 | |
| | 803 | | | Lamar Advertising Co., Class A | | | 58,876 | |
| | 440 | | | Public Storage | | | 90,407 | |
| | 882 | | | Simon Property Group, Inc. | | | 161,865 | |
| | 815 | | | Taubman Centers, Inc. | | | 44,833 | |
| | 907 | | | Weingarten Realty Investors | | | 25,505 | |
| | | | | | | | |
| | | | | | | 822,091 | |
| | | | | | | | |
| | | | Food & Staples Retailing — 2.1% | |
| | 1,122 | | | Costco Wholesale Corp. | | | 256,523 | |
| | 3,470 | | | Walmart, Inc. | | | 347,971 | |
| | | | | | | | |
| | | | | | | 604,494 | |
| | | | | | | | |
| | | | Food Products — 0.5% | |
| | 639 | | | Hershey Co. (The) | | | 68,469 | |
| | 1,540 | | | Hormel Foods Corp. | | | 67,205 | |
| | | | | | | | |
| | | | | | | 135,674 | |
| | | | | | | | |
| | | | Gas Utilities — 0.3% | |
| | 1,278 | | | National Fuel Gas Co. | | | 69,383 | |
| | 238 | | | UGI Corp. | | | 12,628 | |
| | | | | | | | |
| | | | | | | 82,011 | |
| | | | | | | | |
| | | | Health Care Equipment & Supplies — 1.8% | |
| | 827 | | | Edwards Lifesciences Corp.* | | | 122,065 | |
| | 418 | | | IDEXX Laboratories, Inc.* | | | 88,666 | |
| | 339 | | | Intuitive Surgical, Inc.* | | | 176,680 | |
| | 776 | | | ResMed, Inc. | | | 82,194 | |
| | 608 | | | Varian Medical Systems, Inc.* | | | 72,577 | |
| | | | | | | | |
| | | | | | | 542,182 | |
| | | | | | | | |
| | | | Health Care Providers & Services — 0.1% | |
| | 566 | | | Premier, Inc., Class A* | | | 25,470 | |
| | | | | | | | |
| | | | Health Care Technology — 0.3% | |
| | 1,389 | | | Cerner Corp.* | | | 79,562 | |
| | 110 | | | Veeva Systems, Inc., Class A* | | | 10,048 | |
| | | | | | | | |
| | | | | | | 89,610 | |
| | | | | | | | |
| | | | | | | | |
| SHARES | | | INVESTMENTS | | VALUE($) | |
| | | | | | | | |
| | | | Hotels, Restaurants & Leisure — 2.3% | |
| | 239 | | | Choice Hotels International, Inc. | | | 17,543 | |
| | 201 | | | Marriott International, Inc., Class A | | | 23,495 | |
| | 1,647 | | | McDonald’s Corp. | | | 291,354 | |
| | 993 | | | Six Flags Entertainment Corp. | | | 53,483 | |
| | 3,697 | | | Starbucks Corp. | | | 215,424 | |
| | 949 | | | Yum! Brands, Inc. | | | 85,799 | |
| | | | | | | | |
| | | | | | | 687,098 | |
| | | | | | | | |
| | | | Household Durables — 0.1% | |
| | 842 | | | Leggett & Platt, Inc. | | | 30,573 | |
| | | | | | | | |
| | | | Household Products — 1.7% | |
| | 805 | | | Church & Dwight Co., Inc. | | | 47,793 | |
| | 564 | | | Clorox Co. (The) | | | 83,726 | |
| | 2,311 | | | Colgate-Palmolive Co. | | | 137,620 | |
| | 1,056 | | | Kimberly-Clark Corp. | | | 110,141 | |
| | 1,290 | | | Procter & Gamble Co. (The) | | | 114,397 | |
| | | | | | | | |
| | | | | | | 493,677 | |
| | | | | | | | |
| | | | Independent Power and Renewable Electricity
Producers — 0.3% | |
| | 2,304 | | | NRG Energy, Inc. | | | 83,382 | |
| | | | | | | | |
| | | | Industrial Conglomerates — 0.9% | |
| | 1,245 | | | 3M Co. | | | 236,874 | |
| | 138 | | | Honeywell International, Inc. | | | 19,985 | |
| | | | | | | | |
| | | | | | | 256,859 | |
| | | | | | | | |
| | | | Insurance — 5.5% | |
| | 2,893 | | | Aflac, Inc. | | | 124,601 | |
| | 1,319 | | | Allstate Corp. (The) | | | 126,255 | |
| | 637 | | | American Financial Group, Inc. | | | 63,719 | |
| | 922 | | | Aon plc | | | 143,998 | |
| | 2,179 | | | Arch Capital Group Ltd.* | | | 61,818 | |
| | 1,224 | | | Arthur J Gallagher & Co. | | | 90,588 | |
| | 2,500 | | | Brown & Brown, Inc. | | | 70,450 | |
| | 973 | | | Chubb Ltd. | | | 121,537 | |
| | 872 | | | Cincinnati Financial Corp. | | | 68,574 | |
| | 324 | | | Erie Indemnity Co., Class A | | | 42,020 | |
| | 48 | | | Markel Corp.* | | | 52,476 | |
| | 1,764 | | | Marsh & McLennan Cos., Inc. | | | 149,499 | |
| | 1,776 | | | Old Republic International Corp. | | | 39,161 | |
| | 2,096 | | | Progressive Corp. (The) | | | 146,091 | |
| | 273 | | | Reinsurance Group of America, Inc. | | | 38,867 | |
| | 918 | | | Torchmark Corp. | | | 77,718 | |
| | 896 | | | Travelers Cos., Inc. (The) | | | 112,116 | |
| | 964 | | | WR Berkley Corp. | | | 73,168 | |
| | | | | | | | |
| | | | | | | 1,602,656 | |
| | | | | | | | |
SEE NOTES TO FINANCIAL STATEMENTS.
| | | | | | | | |
| | | |
| OCTOBER 31, 2018 | | J.P. MORGAN EXCHANGE-TRADED FUNDS | | | | | 161 | |
JPMorgan U.S. Quality Factor ETF
SCHEDULE OF PORTFOLIO INVESTMENTS
AS OF OCTOBER 31, 2018 (continued)
| | | | | | | | |
| SHARES | | | INVESTMENTS | | VALUE($) | |
| | Common Stocks — continued | |
| | | | Interactive Media & Services — 3.7% | |
| | 502 | | | Alphabet, Inc., Class A* | | | 547,471 | |
| | 2,983 | | | Facebook, Inc., Class A* | | | 452,790 | |
| | 1,306 | | | TripAdvisor, Inc.* | | | 68,095 | |
| | | | | | | | |
| | | | | | | 1,068,356 | |
| | | | | | | | |
| | | | Internet & Direct Marketing Retail — 0.8% | |
| | 124 | | | Booking Holdings, Inc.* | | | 232,448 | |
| | | | | | | | |
| | | | IT Services — 8.1% | |
| | 1,515 | | | Accenture plc, Class A | | | 238,794 | |
| | 735 | | | Akamai Technologies, Inc.* | | | 53,104 | |
| | 1,309 | | | Automatic Data Processing, Inc. | | | 188,601 | |
| | 692 | | | Broadridge Financial Solutions, Inc. | | | 80,922 | |
| | 1,814 | | | Cognizant Technology Solutions Corp., Class A | | | 125,220 | |
| | 1,583 | | | Fiserv, Inc.* | | | 125,532 | |
| | 1,666 | | | International Business Machines Corp. | | | 192,306 | |
| | 547 | | | Jack Henry & Associates, Inc. | | | 81,957 | |
| | 2,160 | | | Mastercard, Inc., Class A | | | 426,967 | |
| | 1,481 | | | Paychex, Inc. | | | 96,991 | |
| | 1,082 | | | Teradata Corp.* | | | 39,385 | |
| | 603 | | | VeriSign, Inc.* | | | 85,952 | |
| | 4,066 | | | Visa, Inc., Class A | | | 560,498 | |
| | 3,225 | | | Western Union Co. (The) | | | 58,179 | |
| | | | | | | | |
| | | | | | | 2,354,408 | |
| | | | | | | | |
| | | | Life Sciences Tools & Services — 1.0% | |
| | 1,234 | | | Agilent Technologies, Inc. | | | 79,951 | |
| | 282 | | | Bio-Techne Corp. | | | 47,297 | |
| | 122 | | | Mettler-Toledo International, Inc.* | | | 66,712 | |
| | 482 | | | Waters Corp.* | | | 91,431 | |
| | | | | | | | |
| | | | | | | 285,391 | |
| | | | | | | | |
| | | | Machinery — 1.4% | |
| | 1,477 | | | Allison Transmission Holdings, Inc. | | | 65,106 | |
| | 1,079 | | | Donaldson Co., Inc. | | | 55,331 | |
| | 1,527 | | | Graco, Inc. | | | 62,042 | |
| | 559 | | | IDEX Corp. | | | 70,893 | |
| | 390 | | | Illinois Tool Works, Inc. | | | 49,752 | |
| | 698 | | | Lincoln Electric Holdings, Inc. | | | 56,475 | |
| | 1,092 | | | Toro Co. (The) | | | 61,512 | |
| | | | | | | | |
| | | | | | | 421,111 | |
| | | | | | | | |
| | | | Media — 0.6% | |
| | 35 | | | Cable One, Inc. | | | 31,351 | |
| | 1,194 | | | Omnicom Group, Inc. | | | 88,738 | |
| | 10,642 | | | Sirius XM Holdings, Inc. (a) | | | 64,065 | |
| | | | | | | | |
| | | | | | | 184,154 | |
| | | | | | | | |
| | | | | | | | |
| SHARES | | | INVESTMENTS | | VALUE($) | |
| | | | | | | | |
| | | | Metals & Mining — 0.2% | |
| | 1,723 | | | Newmont Mining Corp. | | | 53,275 | |
| | | | | | | | |
| | | | Mortgage Real Estate Investment Trusts (REITs) — 1.3% | |
| | 4,220 | | | AGNC Investment Corp. | | | 75,285 | |
| | 5,213 | | | Annaly Capital Management, Inc. | | | 51,452 | |
| | 3,545 | | | Chimera Investment Corp. | | | 65,937 | |
| | 5,735 | | | MFA Financial, Inc. | | | 39,744 | |
| | 2,085 | | | New Residential Investment Corp. | | | 37,280 | |
| | 1,678 | | | Starwood Property Trust, Inc. | | | 36,446 | |
| | 4,455 | | | Two Harbors Investment Corp. | | | 65,444 | |
| | | | | | | | |
| | | | | | | 371,588 | |
| | | | | | | | |
| | | | Multiline Retail — 0.9% | |
| | 305 | | | Kohl’s Corp. | | | 23,097 | |
| | 1,223 | | | Nordstrom, Inc. | | | 80,437 | |
| | 1,800 | | | Target Corp. | | | 150,534 | |
| | | | | | | | |
| | | | | | | 254,068 | |
| | | | | | | | |
| | | | Multi-Utilities — 1.2% | |
| | 1,267 | | | Ameren Corp. | | | 81,823 | |
| | 2,626 | | | CenterPoint Energy, Inc. | | | 70,928 | |
| | 1,828 | | | CMS Energy Corp. | | | 90,522 | |
| | 1,557 | | | WEC Energy Group, Inc. | | | 106,499 | |
| | | | | | | | |
| | | | | | | 349,772 | |
| | | | | | | | |
| | | | Oil, Gas & Consumable Fuels — 4.2% | |
| | 2,139 | | | Cabot Oil & Gas Corp. | | | 51,828 | |
| | 581 | | | Chevron Corp. | | | 64,869 | |
| | 2,609 | | | ConocoPhillips | | | 182,369 | |
| | 5,559 | | | Exxon Mobil Corp. | | | 442,941 | |
| | 1,645 | | | Marathon Petroleum Corp. | | | 115,890 | |
| | 2,197 | | | Occidental Petroleum Corp. | | | 147,353 | |
| | 1,075 | | | Phillips 66 | | | 110,532 | |
| | 1,338 | | | Valero Energy Corp. | | | 121,878 | |
| | | | | | | | |
| | | | | | | 1,237,660 | |
| | | | | | | | |
| | | | Personal Products — 0.1% | |
| | 312 | | | Nu Skin Enterprises, Inc., Class A | | | 21,909 | |
| | | | | | | | |
| | | | Pharmaceuticals — 6.8% | |
| | 1,718 | | | Bristol-Myers Squibb Co. | | | 86,828 | |
| | 2,074 | | | Eli Lilly & Co. | | | 224,904 | |
| | 4,400 | | | Johnson & Johnson | | | 615,956 | |
| | 5,795 | | | Merck & Co., Inc. | | | 426,570 | |
| | 12,435 | | | Pfizer, Inc. | | | 535,451 | |
| | 1,246 | | | Zoetis, Inc. | | | 112,327 | |
| | | | | | | | |
| | | | | | | 2,002,036 | |
| | | | | | | | |
SEE NOTES TO FINANCIAL STATEMENTS.
| | | | | | |
| | | |
| 162 | | | | J.P. MORGAN EXCHANGE-TRADED FUNDS | | OCTOBER 31, 2018 |
| | | | | | | | |
| SHARES | | | INVESTMENTS | | VALUE($) | |
| | Common Stocks — continued | |
| | | | Professional Services — 0.3% | |
| | 1,035 | | | Robert Half International, Inc. | | | 62,648 | |
| | 258 | | | Verisk Analytics, Inc.* | | | 30,919 | |
| | | | | | | | |
| | | | | | | 93,567 | |
| | | | | | | | |
| | | | Road & Rail — 1.1% | |
| | 589 | | | Landstar System, Inc. | | | 58,953 | |
| | 1,894 | | | Union Pacific Corp. | | | 276,941 | |
| | | | | | | | |
| | | | | | | 335,894 | |
| | | | | | | | |
| | | | Semiconductors & Semiconductor Equipment — 4.6% | |
| | 1,011 | | | First Solar, Inc.* | | | 42,260 | |
| | 8,827 | | | Intel Corp. | | | 413,810 | |
| | 808 | | | KLA-Tencor Corp. | | | 73,964 | |
| | 618 | | | Lam Research Corp. | | | 87,589 | |
| | 1,588 | | | Maxim Integrated Products, Inc. | | | 79,432 | |
| | 1,407 | | | NVIDIA Corp. | | | 296,638 | |
| | 7 | | | Teradyne, Inc. | | | 241 | |
| | 2,547 | | | Texas Instruments, Inc. | | | 236,438 | |
| | 17 | | | Versum Materials, Inc. | | | 536 | |
| | 1,313 | | | Xilinx, Inc. | | | 112,091 | |
| | | | | | | | |
| | | | | | | 1,342,999 | |
| | | | | | | | |
| | | | Software — 5.3% | |
| | 1,236 | | | Adobe, Inc.* | | | 303,759 | |
| | 68 | | | ANSYS, Inc.* | | | 10,169 | |
| | 893 | | | Atlassian Corp. plc, Class A* | | | 67,788 | |
| | 1,767 | | | Cadence Design Systems, Inc.* | | | 78,755 | |
| | 817 | | | Citrix Systems, Inc.* | | | 83,718 | |
| | 778 | | | Intuit, Inc. | | | 164,158 | |
| | 1,198 | | | Manhattan Associates, Inc.* | | | 57,192 | |
| | 5,501 | | | Microsoft Corp. | | | 587,562 | |
| | 778 | | | Red Hat, Inc.* | | | 133,536 | |
| | 545 | | | VMware, Inc., Class A* | | | 77,058 | |
| | | | | | | | |
| | | | | | | 1,563,695 | |
| | | | | | | | |
| | | | Specialty Retail — 5.1% | |
| | 1,269 | | | Best Buy Co., Inc. | | | 89,033 | |
| | 503 | | | Burlington Stores, Inc.* | | | 86,259 | |
| | 1,206 | | | Foot Locker, Inc. | | | 56,851 | |
| | 2,626 | | | Home Depot, Inc. (The) | | | 461,861 | |
| | 2,103 | | | Lowe’s Cos., Inc. | | | 200,248 | |
| | 338 | | | O’Reilly Automotive, Inc.* | | | 108,414 | |
| | 1,400 | | | Ross Stores, Inc. | | | 138,600 | |
| | 587 | | | Tiffany & Co. | | | 65,333 | |
| | 1,840 | | | TJX Cos., Inc. (The) | | | 202,179 | |
| | 237 | | | Tractor Supply Co. | | | 21,778 | |
| | | | | | | | |
| SHARES | | | INVESTMENTS | | VALUE($) | |
| | | | | | | | |
| | | | Specialty Retail — continued | |
| | 909 | | | Williams-Sonoma, Inc. | | | 53,976 | |
| | | | | | | | |
| | | | | | | 1,484,532 | |
| | | | | | | | |
| | | | Technology Hardware, Storage & Peripherals — 2.0% | |
| | 2,714 | | | Apple, Inc. | | | 593,986 | |
| | | | | | | | |
| | | | Textiles, Apparel & Luxury Goods — 1.4% | |
| | 335 | | | Carter’s, Inc. | | | 32,153 | |
| | 780 | | | Michael Kors Holdings Ltd.* | | | 43,220 | |
| | 3,309 | | | NIKE, Inc., Class B | | | 248,307 | |
| | 971 | | | VF Corp. | | | 80,477 | |
| | | | | | | | |
| | | | | | | 404,157 | |
| | | | | | | | |
| | | | Tobacco — 1.5% | |
| | 4,238 | | | Altria Group, Inc. | | | 275,640 | |
| | 1,987 | | | Philip Morris International, Inc. | | | 174,995 | |
| | | | | | | | |
| | | | | | | 450,635 | |
| | | | | | | | |
| | | | Trading Companies & Distributors — 0.6% | |
| | 691 | | | MSC Industrial Direct Co., Inc., Class A | | | 56,012 | |
| | 375 | | | Watsco, Inc. | | | 55,568 | |
| | 267 | | | WW Grainger, Inc. | | | 75,820 | |
| | | | | | | | |
| | | | | | | 187,400 | |
| | | | | | | | |
| | | | Total Common Stocks
(Cost $26,600,390) | | | 28,229,641 | |
| | | | | | | | |
| | | | | |
| | Short-Term Investments — 2.9% | | | | |
| | | | Investment Companies — 2.9% | | | | |
| | 836,372 | | | JPMorgan U.S. Government Money Market Fund Class Institutional Shares,
2.02% (b) (c)
(Cost $836,372) | | | 836,372 | |
| | | | | | | | |
| | Investment of Cash Collateral from Securities Loaned — 0.2% | |
| | 58,800 | | | JPMorgan U.S. Government Money Market Fund, IM Shares, 2.07% (b) (c)
(Cost $58,800) | | | 58,800 | |
| | | | | | | | |
| | | | Total Investments — 99.7%
(Cost $27,495,562) | | | 29,124,813 | |
| | | | Other Assets Less Liabilities — 0.3% | | | 90,454 | |
| | | | | | | | |
| | | | NET ASSETS — 100.0% | | | 29,215,267 | |
| | | | | | | | |
Percentages indicated are based on net assets.
SEE NOTES TO FINANCIAL STATEMENTS.
| | | | | | | | |
| | | |
| OCTOBER 31, 2018 | | J.P. MORGAN EXCHANGE-TRADED FUNDS | | | | | 163 | |
JPMorgan U.S. Quality Factor ETF
SCHEDULE OF PORTFOLIO INVESTMENTS
AS OF OCTOBER 31, 2018 (continued)
| | |
| (a) | | — The security or a portion of this security is on loan at October 31, 2018. The total value of securities on loan at October 31, 2018 was $57,428. |
| (b) | | — Investment in affiliate. Fund is registered under the Investment Company Act of 1940, as amended, and advised by J.P. Morgan Investment Management Inc. |
| (c) | | — The rate shown is the current yield as of October 31, 2018. |
| * | | — Non-income producing security. |
| | | | | | | | | | | | | | | | | | |
| Futures contracts outstanding as of October 31, 2018: | | | | | | | |
| DESCRIPTION | | NUMBER OF
CONTRACTS | | EXPIRATION
DATE | | | TRADING
CURRENCY | | | NOTIONAL
AMOUNT ($) | | | VALUE AND
UNREALIZED
APPRECIATION
(DEPRECIATION) ($) | |
Long Contracts | | | | | | | | | | | | | | | | | | |
| S&P 500 E-Mini Index | | 7 | | | 12/2018 | | | | USD | | | | 948,570 | | | | (10,682 | ) |
| | | | | | | | | | | | | | | | | | |
| | | | | | | | | | | | | | | | | (10,682 | ) |
| | | | | | | | | | | | | | | | | | |
Abbreviations
| | |
| USD | | — United States Dollar |
SEE NOTES TO FINANCIAL STATEMENTS.
| | | | | | |
| | | |
| 164 | | | | J.P. MORGAN EXCHANGE-TRADED FUNDS | | OCTOBER 31, 2018 |
JPMorgan U.S. Value Factor ETF
SCHEDULE OF PORTFOLIO INVESTMENTS
AS OF OCTOBER 31, 2018
| | | | | | | | |
| SHARES | | | INVESTMENTS | | VALUE($) | |
| | Common Stocks — 97.3% | |
| | | | Aerospace & Defense — 1.4% | |
| | 636 | | | Harris Corp. | | | 94,580 | |
| | 458 | | | L3 Technologies, Inc. | | | 86,777 | |
| | 1,894 | | | United Technologies Corp. | | | 235,254 | |
| | | | | | | | |
| | | | | | | 416,611 | |
| | | | | | | | |
| | | | Airlines — 1.3% | |
| | 837 | | | Alaska Air Group, Inc. | | | 51,409 | |
| | 836 | | | Copa Holdings SA, Class A (Panama) | | | 60,551 | |
| | 2,409 | | | Delta Air Lines, Inc. | | | 131,845 | |
| | 3,199 | | | JetBlue Airways Corp.* | | | 53,519 | |
| | 1,529 | | | Southwest Airlines Co. | | | 75,074 | |
| | | | | | | | |
| | | | | | | 372,398 | |
| | | | | | | | |
| | | | Auto Components — 0.5% | |
| | 3,080 | | | Gentex Corp. | | | 64,834 | |
| | 461 | | | Goodyear Tire & Rubber Co. (The) | | | 9,709 | |
| | 441 | | | Lear Corp. | | | 58,609 | |
| | | | | | | | |
| | | | | | | 133,152 | |
| | | | | | | | |
| | | | Automobiles — 0.7% | |
| | 14,785 | | | Ford Motor Co. | | | 141,197 | |
| | 1,827 | | | Harley-Davidson, Inc. | | | 69,828 | |
| | 46 | | | Thor Industries, Inc. | | | 3,203 | |
| | | | | | | | |
| | | | | | | 214,228 | |
| | | | | | | | |
| | | | Banks — 5.8% | |
| | 2,089 | | | Associated Banc-Corp. | | | 48,423 | |
| | 1,766 | | | Bank of America Corp. | | | 48,565 | |
| | 2,767 | | | BB&T Corp. | | | 136,026 | |
| | 241 | | | BOK Financial Corp. | | | 20,661 | |
| | 1,578 | | | Citizens Financial Group, Inc. | | | 58,938 | |
| | 644 | | | Cullen/Frost Bankers, Inc. | | | 63,060 | |
| | 3,321 | | | Fifth Third Bancorp | | | 89,634 | |
| | 2,893 | | | FNB Corp. | | | 34,224 | |
| | 5,202 | | | Huntington Bancshares, Inc. | | | 74,545 | |
| | 1,390 | | | PacWest Bancorp | | | 56,462 | |
| | 3,569 | | | People’s United Financial, Inc. | | | 55,890 | |
| | 1,406 | | | PNC Financial Services Group, Inc. (The) | | | 180,657 | |
| | 1,464 | | | Popular, Inc. (Puerto Rico) | | | 76,143 | |
| | 5,538 | | | Regions Financial Corp. | | | 93,980 | |
| | 1,666 | | | SunTrust Banks, Inc. | | | 104,391 | |
| | 10,122 | | | Wells Fargo & Co. | | | 538,794 | |
| | | | | | | | |
| | | | | | | 1,680,393 | |
| | | | | | | | |
| | | | Beverages — 0.5% | |
| | 2,361 | | | Keurig Dr Pepper, Inc. | | | 61,386 | |
| | 1,307 | | | Molson Coors Brewing Co., Class B | | | 83,648 | |
| | | | | | | | |
| | | | | | | 145,034 | |
| | | | | | | | |
| | | | | | | | |
| SHARES | | | INVESTMENTS | | VALUE($) | |
| | | | | | | | |
| | | | Biotechnology — 1.4% | |
| | 991 | | | Amgen, Inc. | | | 191,055 | |
| | 2,948 | | | Gilead Sciences, Inc. | | | 200,995 | |
| | | | | | | | |
| | | | | | | 392,050 | |
| | | | | | | | |
| | | | Building Products — 0.5% | |
| | 3,595 | | | Johnson Controls International plc | | | 114,932 | |
| | 509 | | | Owens Corning | | | 24,061 | |
| | | | | | | | |
| | | | | | | 138,993 | |
| | | | | | | | |
| | | | Capital Markets — 1.5% | |
| | 3,066 | | | Bank of New York Mellon Corp. (The) | | | 145,114 | |
| | 986 | | | Goldman Sachs Group, Inc. (The) | | | 222,215 | |
| | 539 | | | Invesco Ltd. | | | 11,701 | |
| | 1,641 | | | Legg Mason, Inc. | | | 46,309 | |
| | | | | | | | |
| | | | | | | 425,339 | |
| | | | | | | | |
| | | | Chemicals — 0.9% | |
| | 136 | | | Cabot Corp. | | | 6,621 | |
| | 926 | | | CF Industries Holdings, Inc. | | | 44,476 | |
| | 927 | | | Eastman Chemical Co. | | | 72,631 | |
| | 488 | | | Huntsman Corp. | | | 10,677 | |
| | 1,227 | | | LyondellBasell Industries NV, Class A | | | 109,534 | |
| | 1,327 | | | Olin Corp. | | | 26,805 | |
| | | | | | | | |
| | | | | | | 270,744 | |
| | | | | | | | |
| | | | Commercial Services & Supplies — 0.6% | |
| | 4,201 | | | ADT, Inc. | | | 32,516 | |
| | 830 | | | KAR Auction Services, Inc. | | | 47,260 | |
| | 1,317 | | | Republic Services, Inc. | | | 95,719 | |
| | | | | | | | |
| | | | | | | 175,495 | |
| | | | | | | | |
| | | | Communications Equipment — 2.3% | |
| | 1,451 | | | ARRIS International plc* | | | 36,086 | |
| | 11,129 | | | Cisco Systems, Inc. | | | 509,152 | |
| | 1,391 | | | CommScope Holding Co., Inc.* | | | 33,468 | |
| | 2,930 | | | Juniper Networks, Inc. | | | 85,761 | |
| | | | | | | | |
| | | | | | | 664,467 | |
| | | | | | | | |
| | | | Construction & Engineering — 0.2% | |
| | 2,049 | | | AECOM* | | | 59,708 | |
| | | | | | | | |
| | | | Consumer Finance — 0.9% | |
| | 2,041 | | | Ally Financial, Inc. | | | 51,862 | |
| | 1,630 | | | Capital One Financial Corp. | | | 145,559 | |
| | 4,903 | | | Navient Corp. | | | 56,777 | |
| | | | | | | | |
| | | | | | | 254,198 | |
| | | | | | | | |
| | | | Containers & Packaging — 1.3% | |
| | 1,470 | | | Bemis Co., Inc. | | | 67,282 | |
| | 4,629 | | | Graphic Packaging Holding Co. | | | 50,965 | |
SEE NOTES TO FINANCIAL STATEMENTS.
| | | | | | | | |
| | | |
| OCTOBER 31, 2018 | | J.P. MORGAN EXCHANGE-TRADED FUNDS | | | | | 165 | |
JPMorgan U.S. Value Factor ETF
SCHEDULE OF PORTFOLIO INVESTMENTS
AS OF OCTOBER 31, 2018 (continued)
| | | | | | | | |
| SHARES | | | INVESTMENTS | | VALUE($) | |
| | Common Stocks — continued | | | | |
| | | | Containers & Packaging — continued | |
| | 768 | | | Packaging Corp. of America | | | 70,510 | |
| | 1,455 | | | Silgan Holdings, Inc. | | | 34,964 | |
| | 1,331 | | | Sonoco Products Co. | | | 72,646 | |
| | 1,668 | | | WestRock Co. | | | 71,674 | |
| | | | | | | | |
| | | | | | | 368,041 | |
| | | | | | | | |
| | | | Distributors — 0.3% | |
| | 866 | | | Genuine Parts Co. | | | 84,799 | |
| | | | | | | | |
| | | | Diversified Consumer Services — 0.3% | |
| | 65 | | | Graham Holdings Co., Class B | | | 37,768 | |
| | 1,601 | | | H&R Block, Inc. | | | 42,491 | |
| | | | | | | | |
| | | | | | | 80,259 | |
| | | | | | | | |
| | | | Diversified Telecommunication Services — 2.0% | |
| | 9,042 | | | AT&T, Inc. | | | 277,409 | |
| | 2,294 | | | CenturyLink, Inc. | | | 47,348 | |
| | 4,690 | | | Verizon Communications, Inc. | | | 267,752 | |
| | | | | | | | |
| | | | | | | 592,509 | |
| | | | | | | | |
| | | | Electric Utilities — 2.4% | |
| | 1,111 | | | Avangrid, Inc. | | | 52,228 | |
| | 2,054 | | | Duke Energy Corp. | | | 169,722 | |
| | 839 | | | Eversource Energy | | | 53,075 | |
| | 3,453 | | | Exelon Corp. | | | 151,276 | |
| | 1,795 | | | Hawaiian Electric Industries, Inc. | | | 66,953 | |
| | 2,130 | | | OGE Energy Corp. | | | 77,000 | |
| | 203 | | | Pinnacle West Capital Corp. | | | 16,697 | |
| | 3,581 | | | PPL Corp. | | | 108,862 | |
| | | | | | | | |
| | | | | | | 695,813 | |
| | | | | | | | |
| | | | Electrical Equipment — 1.4% | |
| | 1,670 | | | Eaton Corp. plc | | | 119,689 | |
| | 2,130 | | | Emerson Electric Co. | | | 144,584 | |
| | 579 | | | Hubbell, Inc. | | | 58,884 | |
| | 1,421 | | | nVent Electric plc (United Kingdom) | | | 34,701 | |
| | 845 | | | Regal Beloit Corp. | | | 60,587 | |
| | | | | | | | |
| | | | | | | 418,445 | |
| | | | | | | | |
| | | | Electronic Equipment, Instruments & Components — 0.8% | |
| | 438 | | | Arrow Electronics, Inc.* | | | 29,657 | |
| | 571 | | | Avnet, Inc. | | | 22,880 | |
| | 643 | | | CDW Corp. | | | 57,876 | |
| | 3,544 | | | Corning, Inc. | | | 113,231 | |
| | | | | | | | |
| | | | | | | 223,644 | |
| | | | | | | | |
| | | | Energy Equipment & Services — 0.3% | |
| | 728 | | | Helmerich & Payne, Inc. | | | 45,347 | |
| | | | | | | | |
| SHARES | | | INVESTMENTS | | VALUE($) | |
| | | | | | | | |
| | | | Energy Equipment & Services — continued | |
| | 4,329 | | | Transocean Ltd.* | | | 47,662 | |
| | | | | | | | |
| | | | | | | 93,009 | |
| | | | | | | | |
| | | | Entertainment — 2.0% | |
| | 1,098 | | | Cinemark Holdings, Inc. | | | 45,644 | |
| | 542 | | | Lions Gate Entertainment Corp., Class A | | | 10,385 | |
| | 2,892 | | | Viacom, Inc., Class B | | | 92,486 | |
| | 3,645 | | | Walt Disney Co. (The) | | | 418,555 | |
| | | | | | | | |
| | | | | | | 567,070 | |
| | | | | | | | |
| | | | Equity Real Estate Investment Trusts (REITs) — 2.4% | |
| | 2,191 | | | Apple Hospitality REIT, Inc. | | | 35,428 | |
| | 2,689 | | | Brandywine Realty Trust | | | 37,807 | |
| | 2,248 | | | Brixmor Property Group, Inc. | | | 36,418 | |
| | 2,973 | | | Colony Capital, Inc. | | | 17,451 | |
| | 1,115 | | | Columbia Property Trust, Inc. | | | 25,032 | |
| | 648 | | | EPR Properties | | | 44,544 | |
| | 2,166 | | | Hospitality Properties Trust | | | 55,493 | |
| | 4,053 | | | Kimco Realty Corp. | | | 65,213 | |
| | 4,265 | | | Medical Properties Trust, Inc. | | | 63,378 | |
| | 2,163 | | | Omega Healthcare Investors, Inc. | | | 72,136 | |
| | 2,288 | | | Park Hotels & Resorts, Inc. | | | 66,512 | |
| | 2,963 | | | Retail Properties of America, Inc., Class A | | | 36,356 | |
| | 2,157 | | | Senior Housing Properties Trust | | | 34,663 | |
| | 1,326 | | | Ventas, Inc. | | | 76,961 | |
| | 572 | | | Weingarten Realty Investors | | | 16,085 | |
| | | | | | | | |
| | | | | | | 683,477 | |
| | | | | | | | |
| | | | Food & Staples Retailing — 1.9% | |
| | 2,495 | | | Walgreens Boots Alliance, Inc. | | | 199,026 | |
| | 3,631 | | | Walmart, Inc. | | | 364,117 | |
| | | | | | | | |
| | | | | | | 563,143 | |
| | | | | | | | |
| | | | Food Products — 1.8% | |
| | 2,415 | | | Archer-Daniels-Midland Co. | | | 114,109 | |
| | 3,306 | | | Flowers Foods, Inc. | | | 63,839 | |
| | 2,606 | | | General Mills, Inc. | | | 114,143 | |
| | 325 | | | Ingredion, Inc. | | | 32,883 | |
| | 839 | | | JM Smucker Co. (The) | | | 90,880 | |
| | 1,359 | | | Pilgrim’s Pride Corp.* | | | 24,000 | |
| | 1,610 | | | Tyson Foods, Inc., Class A | | | 96,471 | |
| | | | | | | | |
| | | | | | | 536,325 | |
| | | | | | | | |
| | | | Health Care Equipment & Supplies — 2.6% | |
| | 1,256 | | | Abbott Laboratories | | | 86,589 | |
| | 1,739 | | | Baxter International, Inc. | | | 108,705 | |
| | 667 | | | Becton Dickinson and Co. | | | 153,743 | |
| | 217 | | | DENTSPLY SIRONA, Inc. | | | 7,515 | |
SEE NOTES TO FINANCIAL STATEMENTS.
| | | | | | |
| | | |
| 166 | | | | J.P. MORGAN EXCHANGE-TRADED FUNDS | | OCTOBER 31, 2018 |
| | | | | | | | |
| SHARES | | | INVESTMENTS | | VALUE($) | |
| | Common Stocks — continued | | | | |
| | | | Health Care Equipment & Supplies — continued | |
| | 595 | | | Hill-Rom Holdings, Inc. | | | 50,027 | |
| | 3,021 | | | Medtronic plc | | | 271,346 | |
| | 664 | | | Zimmer Biomet Holdings, Inc. | | | 75,424 | |
| | | | | | | | |
| | | | | | | 753,349 | |
| | | | | | | | |
| | | | Health Care Providers & Services — 6.5% | |
| | 982 | | | Aetna, Inc. | | | 194,829 | |
| | 315 | | | AmerisourceBergen Corp. | | | 27,720 | |
| | 781 | | | Anthem, Inc. | | | 215,220 | |
| | 1,328 | | | Cardinal Health, Inc. | | | 67,197 | |
| | 788 | | | Cigna Corp. | | | 168,482 | |
| | 2,628 | | | CVS Health Corp. | | | 190,241 | |
| | 1,262 | | | Express Scripts Holding Co.* | | | 122,376 | |
| | 459 | | | Humana, Inc. | | | 147,068 | |
| | 607 | | | McKesson Corp. | | | 75,729 | |
| | 719 | | | MEDNAX, Inc.* | | | 29,688 | |
| | 578 | | | Premier, Inc., Class A* | | | 26,010 | |
| | 799 | | | Quest Diagnostics, Inc. | | | 75,194 | |
| | 1,747 | | | UnitedHealth Group, Inc. | | | 456,578 | |
| | 660 | | | Universal Health Services, Inc., Class B | | | 80,230 | |
| | | | | | | | |
| | | | | | | 1,876,562 | |
| | | | | | | | |
| | | | Health Care Technology — 0.2% | |
| | 1,089 | | | Cerner Corp.* | | | 62,378 | |
| | | | | | | | |
| | | | Hotels, Restaurants & Leisure — 1.0% | |
| | 1,778 | | | Carnival Corp. | | | 99,639 | |
| | 193 | | | Las Vegas Sands Corp. | | | 9,849 | |
| | 2,046 | | | MGM Resorts International | | | 54,587 | |
| | 647 | | | Royal Caribbean Cruises Ltd. | | | 67,760 | |
| | 1,430 | | | Wyndham Destinations, Inc. | | | 51,309 | |
| | | | | | | | |
| | | | | | | 283,144 | |
| | | | | | | | |
| | | | Household Durables — 1.0% | |
| | 1,164 | | | Garmin Ltd. | | | 77,010 | |
| | 914 | | | Leggett & Platt, Inc. | | | 33,187 | |
| | 1,625 | | | Lennar Corp., Class A | | | 69,843 | |
| | 2,907 | | | Newell Brands, Inc. | | | 46,163 | |
| | 2,643 | | | PulteGroup, Inc. | | | 64,939 | |
| | 32 | | | Toll Brothers, Inc. | | | 1,077 | |
| | | | | | | | |
| | | | | | | 292,219 | |
| | | | | | | | |
| | | | Household Products — 1.6% | |
| | 5,195 | | | Procter & Gamble Co. (The) | | | 460,693 | |
| | | | | | | | |
| | | | Industrial Conglomerates — 0.8% | |
| | 619 | | | Carlisle Cos., Inc. | | | 59,789 | |
| | | | | | | | |
| SHARES | | | INVESTMENTS | | VALUE($) | |
| | | | | | | | |
| | | | Industrial Conglomerates — continued | |
| | 17,524 | | | General Electric Co. | | | 176,993 | |
| | | | | | | | |
| | | | | | | 236,782 | |
| | | | | | | | |
| | | | Insurance — 4.2% | |
| | 2,231 | | | Aflac, Inc. | | | 96,089 | |
| | 1,218 | | | Aspen Insurance Holdings Ltd. (Bermuda) | | | 51,010 | |
| | 460 | | | Assurant, Inc. | | | 44,717 | |
| | 1,771 | | | Assured Guaranty Ltd. | | | 70,805 | |
| | 1,067 | | | Axis Capital Holdings Ltd. | | | 59,528 | |
| | 296 | | | Everest Re Group Ltd. | | | 64,487 | |
| | 1,275 | | | First American Financial Corp. | | | 56,521 | |
| | 33 | | | Hanover Insurance Group, Inc. (The) | | | 3,675 | |
| | 1,238 | | | Lincoln National Corp. | | | 74,515 | |
| | 953 | | | Mercury General Corp. | | | 56,522 | |
| | 3,124 | | | MetLife, Inc. | | | 128,678 | |
| | 3,434 | | | Old Republic International Corp. | | | 75,720 | |
| | 1,444 | | | Principal Financial Group, Inc. | | | 67,969 | |
| | 1,398 | | | Prudential Financial, Inc. | | | 131,104 | |
| | 503 | | | Reinsurance Group of America, Inc. | | | 71,612 | |
| | 958 | | | Travelers Cos., Inc. (The) | | | 119,874 | |
| | 1,524 | | | Unum Group | | | 55,260 | |
| | | | | | | | |
| | | | | | | 1,228,086 | |
| | | | | | | | |
| | | | Internet & Direct Marketing Retail — 0.2% | |
| | 2,334 | | | Qurate Retail, Inc.* | | | 51,208 | |
| | | | | | | | |
| | | | IT Services — 2.2% | |
| | 924 | | | Akamai Technologies, Inc.* | | | 66,759 | |
| | 1,171 | | | Amdocs Ltd. | | | 74,089 | |
| | 1,517 | | | Cognizant Technology Solutions Corp., Class A | | | 104,719 | |
| | 984 | | | DXC Technology Co. | | | 71,665 | |
| | 2,207 | | | International Business Machines Corp. | | | 254,754 | |
| | 830 | | | Leidos Holdings, Inc. | | | 53,767 | |
| | | | | | | | |
| | | | | | | 625,753 | |
| | | | | | | | |
| | | | Machinery — 3.3% | |
| | 1,510 | | | Allison Transmission Holdings, Inc. | | | 66,561 | |
| | 765 | | | Crane Co. | | | 66,585 | |
| | 763 | | | Cummins, Inc. | | | 104,294 | |
| | 937 | | | Dover Corp. | | | 77,621 | |
| | 1,132 | | | Ingersoll-Rand plc | | | 108,604 | |
| | 299 | | | Oshkosh Corp. | | | 16,786 | |
| | 1,637 | | | PACCAR, Inc. | | | 93,653 | |
| | 595 | | | Parker-Hannifin Corp. | | | 90,220 | |
| | 1,780 | | | Pentair plc (United Kingdom) | | | 71,467 | |
| | 464 | | | Snap-on, Inc. | | | 71,428 | |
| | 669 | | | Stanley Black & Decker, Inc. | | | 77,952 | |
SEE NOTES TO FINANCIAL STATEMENTS.
| | | | | | | | |
| | | |
| OCTOBER 31, 2018 | | J.P. MORGAN EXCHANGE-TRADED FUNDS | | | | | 167 | |
JPMorgan U.S. Value Factor ETF
SCHEDULE OF PORTFOLIO INVESTMENTS
AS OF OCTOBER 31, 2018 (continued)
| | | | | | | | |
| SHARES | | | INVESTMENTS | | VALUE($) | |
| | Common Stocks — continued | | | | |
| | | | Machinery — continued | |
| | 1,414 | | | Timken Co. (The) | | | 55,924 | |
| | 2,004 | | | Trinity Industries, Inc. | | | 57,214 | |
| | | | | | | | |
| | | | | | | 958,309 | |
| | | | | | | | |
| | | | Media — 3.3% | |
| | 460 | | | Charter Communications, Inc., Class A* | | | 147,370 | |
| | 10,278 | | | Comcast Corp., Class A | | | 392,003 | |
| | 1,918 | | | Discovery, Inc., Class A* (a) | | | 62,124 | |
| | 1,447 | | | DISH Network Corp., Class A* | | | 44,481 | |
| | 3,047 | | | Interpublic Group of Cos., Inc. (The) | | | 70,569 | |
| | 981 | | | John Wiley & Sons, Inc., Class A | | | 53,209 | |
| | 990 | | | Liberty Media Corp.-Liberty SiriusXM, Class C* | | | 40,857 | |
| | 1,169 | | | Omnicom Group, Inc. | | | 86,880 | |
| | 1,893 | | | Tribune Media Co., Class A | | | 71,953 | |
| | | | | | | | |
| | | | | | | 969,446 | |
| | | | | | | | |
| | | | Metals & Mining — 0.8% | |
| | 1,603 | | | Nucor Corp. | | | 94,769 | |
| | 865 | | | Reliance Steel & Aluminum Co. | | | 68,266 | |
| | 1,694 | | | Steel Dynamics, Inc. | | | 67,083 | |
| | | | | | | | |
| | | | | | | 230,118 | |
| | | | | | | | |
| | | | Mortgage Real Estate Investment Trusts (REITs) — 1.6% | |
| | 4,311 | | | AGNC Investment Corp. | | | 76,908 | |
| | 8,438 | | | Annaly Capital Management, Inc. | | | 83,283 | |
| | 3,657 | | | Chimera Investment Corp. | | | 68,020 | |
| | 8,562 | | | MFA Financial, Inc. | | | 59,335 | |
| | 2,190 | | | New Residential Investment Corp. | | | 39,157 | |
| | 3,292 | | | Starwood Property Trust, Inc. | | | 71,502 | |
| | 4,231 | | | Two Harbors Investment Corp. | | | 62,154 | |
| | | | | | | | |
| | | | | | | 460,359 | |
| | | | | | | | |
| | | | Multiline Retail — 1.4% | |
| | 1,146 | | | Kohl’s Corp. | | | 86,787 | |
| | 2,368 | | | Macy’s, Inc. | | | 81,199 | |
| | 1,249 | | | Nordstrom, Inc. | | | 82,147 | |
| | 1,839 | | | Target Corp. | | | 153,795 | |
| | | | | | | | |
| | | | | | | 403,928 | |
| | | | | | | | |
| | | | Multi-Utilities — 0.9% | |
| | 3,170 | | | CenterPoint Energy, Inc. | | | 85,622 | |
| | 1,339 | | | Consolidated Edison, Inc. | | | 101,764 | |
| | 1,690 | | | SCANA Corp. | | | 67,684 | |
| | | | | | | | |
| | | | | | | 255,070 | |
| | | | | | | | |
| | | | Oil, Gas & Consumable Fuels — 5.2% | |
| | 3,757 | | | Chevron Corp. | | | 419,469 | |
| | 462 | | | ConocoPhillips | | | 32,294 | |
| | | | | | | | |
| SHARES | | | INVESTMENTS | | VALUE($) | |
| | | | | | | | |
| | | | Oil, Gas & Consumable Fuels — continued | |
| | 6,244 | | | Exxon Mobil Corp. | | | 497,522 | |
| | 1,121 | | | HollyFrontier Corp. | | | 75,600 | |
| | 5,929 | | | Kinder Morgan, Inc. | | | 100,912 | |
| | 2,550 | | | Marathon Petroleum Corp. | | | 179,648 | |
| | 1,464 | | | PBF Energy, Inc., Class A | | | 61,268 | |
| | 1,403 | | | Valero Energy Corp. | | | 127,799 | |
| | | | | | | | |
| | | | | | | 1,494,512 | |
| | | | | | | | |
| | | | Paper & Forest Products — 0.2% | |
| | 1,371 | | | Domtar Corp. | | | 63,491 | |
| | | | | | | | |
| | | | Personal Products — 0.1% | |
| | 421 | | | Nu Skin Enterprises, Inc., Class A | | | 29,563 | |
| | | | | | | | |
| | | | Pharmaceuticals — 4.9% | |
| | 3,656 | | | Johnson & Johnson | | | 511,803 | |
| | 4,715 | | | Merck & Co., Inc. | | | 347,071 | |
| | 13,082 | | | Pfizer, Inc. | | | 563,311 | |
| | | | | | | | |
| | | | | | | 1,422,185 | |
| | | | | | | | |
| | | | Professional Services — 0.2% | |
| | 211 | | | ManpowerGroup, Inc. | | | 16,097 | |
| | 1,893 | | | Nielsen Holdings plc | | | 49,180 | |
| | | | | | | | |
| | | | | | | 65,277 | |
| | | | | | | | |
| | | | Road & Rail — 1.6% | |
| | 538 | | | Genesee & Wyoming, Inc., Class A* | | | 42,626 | |
| | 757 | | | Kansas City Southern | | | 77,184 | |
| | 950 | | | Norfolk Southern Corp. | | | 159,438 | |
| | 855 | | | Ryder System, Inc. | | | 47,290 | |
| | 963 | | | Union Pacific Corp. | | | 140,810 | |
| | | | | | | | |
| | | | | | | 467,348 | |
| | | | | | | | |
| | | | Semiconductors & Semiconductor Equipment — 7.3% | |
| | 1,193 | | | Analog Devices, Inc. | | | 99,866 | |
| | 630 | | | Applied Materials, Inc. | | | 20,714 | |
| | 1,187 | | | Broadcom, Inc. | | | 265,283 | |
| | 2,518 | | | Cypress Semiconductor Corp. | | | 32,583 | |
| | 10,862 | | | Intel Corp. | | | 509,210 | |
| | 859 | | | KLA-Tencor Corp. | | | 78,633 | |
| | 85 | | | Lam Research Corp. | | | 12,047 | |
| | 2,569 | | | Marvell Technology Group Ltd. | | | 42,157 | |
| | 1,596 | | | Maxim Integrated Products, Inc. | | | 79,832 | |
| | 806 | | | Microchip Technology, Inc. | | | 53,019 | |
| | 2,872 | | | Micron Technology, Inc.* | | | 108,332 | |
| | 442 | | | MKS Instruments, Inc. | | | 32,571 | |
| | 193 | | | NXP Semiconductors NV (Netherlands) | | | 14,473 | |
| | 2,408 | | | ON Semiconductor Corp.* | | | 40,936 | |
| | 3,930 | | | QUALCOMM, Inc. | | | 247,158 | |
SEE NOTES TO FINANCIAL STATEMENTS.
| | | | | | |
| | | |
| 168 | | | | J.P. MORGAN EXCHANGE-TRADED FUNDS | | OCTOBER 31, 2018 |
| | | | | | | | |
| SHARES | | | INVESTMENTS | | VALUE($) | |
| | Common Stocks — continued | | | | |
| | | | Semiconductors & Semiconductor Equipment — continued | |
| | 755 | | | Skyworks Solutions, Inc. | | | 65,504 | |
| | 1,723 | | | Teradyne, Inc. | | | 59,357 | |
| | 2,580 | | | Texas Instruments, Inc. | | | 239,501 | |
| | 1,334 | | | Xilinx, Inc. | | | 113,884 | |
| | | | | | | | |
| | | | | | | 2,115,060 | |
| | | | | | | | |
| | | | Software — 4.0% | |
| | 2,094 | | | CA, Inc. | | | 92,890 | |
| | 710 | | | Dell Technologies, Inc., Class V* | | | 64,177 | |
| | 465 | | | LogMeIn, Inc. | | | 40,046 | |
| | 5,619 | | | Microsoft Corp. | | | 600,165 | |
| | 7,136 | | | Oracle Corp. | | | 348,522 | |
| | 995 | | | Symantec Corp. | | | 18,059 | |
| | | | | | | | |
| | | | | | | 1,163,859 | |
| | | | | | | | |
| | | | Specialty Retail — 1.5% | |
| | 935 | | | AutoNation, Inc.* | | | 37,849 | |
| | 1,296 | | | Best Buy Co., Inc. | | | 90,927 | |
| | 1,187 | | | Dick’s Sporting Goods, Inc. | | | 41,984 | |
| | 1,201 | | | Foot Locker, Inc. | | | 56,615 | |
| | 2,429 | | | Gap, Inc. (The) | | | 66,312 | |
| | 1,636 | | | L Brands, Inc. | | | 53,039 | |
| | 1,144 | | | Penske Automotive Group, Inc. | | | 50,771 | |
| | 756 | | | Williams-Sonoma, Inc. | | | 44,891 | |
| | | | | | | | |
| | | | | | | 442,388 | |
| | | | | | | | |
| | | | Technology Hardware, Storage & Peripherals — 3.6% | |
| | 2,774 | | | Apple, Inc. | | | 607,118 | |
| | 6,970 | | | Hewlett Packard Enterprise Co. | | | 106,293 | |
| | 5,917 | | | HP, Inc. | | | 142,836 | |
| | 73 | | | NCR Corp.* | | | 1,960 | |
| | 1,272 | | | NetApp, Inc. | | | 99,839 | |
| | 401 | | | Western Digital Corp. | | | 17,271 | |
| | 2,237 | | | Xerox Corp. | | | 62,345 | |
| | | | | | | | |
| | | | | | | 1,037,662 | |
| | | | | | | | |
| | | | Textiles, Apparel & Luxury Goods — 1.0% | |
| | 1,881 | | | Hanesbrands, Inc. | | | 32,278 | |
| | 1,010 | | | Michael Kors Holdings Ltd.* | | | 55,964 | |
| | 534 | | | PVH Corp. | | | 64,502 | |
| | 559 | | | Ralph Lauren Corp. | | | 72,452 | |
| | 1,805 | | | Tapestry, Inc. | | | 76,369 | |
| | | | | | | | |
| | | | | | | 301,565 | |
| | | | | | | | |
| | | | Thrifts & Mortgage Finance — 0.2% | |
| | 5,642 | | | New York Community Bancorp, Inc. | | | 54,050 | |
| | | | | | | | |
| | | | | | | | |
| SHARES | | | INVESTMENTS | | VALUE($) | |
| | | | | | | | |
| | | | Trading Companies & Distributors — 0.3% | | | | |
| | 831 | | | MSC Industrial Direct Co., Inc., Class A | | | 67,361 | |
| | 668 | | | WESCO International, Inc.* | | | 33,520 | |
| | | | | | | | |
| | | | | | | 100,881 | |
| | | | | | | | |
| | | | Transportation Infrastructure — 0.2% | |
| | 1,506 | | | Macquarie Infrastructure Corp. | | | 55,647 | |
| | | | | | | | |
| | | | Total Common Stocks
(Cost $27,914,949) | | | 28,210,236 | |
| | | | | | | | |
| | Short-Term Investments — 2.4% | | | | |
| | | | Investment Companies — 2.4% | |
| | 692,762 | | | JPMorgan U.S. Government Money Market Fund Class Institutional Shares, 2.02% (b) (c)
(Cost $692,762) | | | 692,762 | |
| | | | | | | | |
| | Investment of Cash Collateral from Securities Loaned — 0.2% | |
| | 57,600 | | | JPMorgan U.S. Government Money Market Fund, IM Shares, 2.07% (b) (c)
(Cost $57,600) | | | 57,600 | |
| | | | | | | | |
| | | | Total Investments — 99.9%
(Cost $28,665,311) | | | 28,960,598 | |
| | | | Other Assets Less Liabilities — 0.1% | | | 25,911 | |
| | | | | | | | |
| | | | NET ASSETS — 100.0% | | | 28,986,509 | |
| | | | | | | | |
Percentages indicated are based on net assets.
| | |
| (a) | | — The security or a portion of this security is on loan at October 31, 2018. The total value of securities on loan at October 31, 2018 was $56,250. |
| (b) | | — Investment in affiliate. Fund is registered under the Investment Company Act of 1940, as amended, and advised by J.P. Morgan Investment Management Inc. |
| (c) | | — The rate shown is the current yield as of October 31, 2018. |
| * | | — Non-income producing security. |
SEE NOTES TO FINANCIAL STATEMENTS.
| | | | | | | | |
| | | |
| OCTOBER 31, 2018 | | J.P. MORGAN EXCHANGE-TRADED FUNDS | | | | | 169 | |
JPMorgan U.S. Value Factor ETF
SCHEDULE OF PORTFOLIO INVESTMENTS
AS OF OCTOBER 31, 2018 (continued)
| | | | | | | | | | | | | | | | | | |
| Futures contracts outstanding as of October 31, 2018: | |
| DESCRIPTION | | NUMBER OF
CONTRACTS | | EXPIRATION
DATE | | | TRADING
CURRENCY | | | NOTIONAL
AMOUNT ($) | | | VALUE AND
UNREALIZED
APPRECIATION
(DEPRECIATION) ($) | |
Long Contracts | | | | | | | | | | | | | | | | | | |
| S&P 500 E-Mini Index | | 6 | | | 12/2018 | | | | USD | | | | 813,060 | | | | (7,590 | ) |
| | | | | | | | | | | | | | | | | | |
| | | | | | | | | | | | | | | | | (7,590 | ) |
| | | | | | | | | | | | | | | | | | |
Abbreviations
| | |
| USD | | — United States Dollar |
SEE NOTES TO FINANCIAL STATEMENTS.
| | | | | | |
| | | |
| 170 | | | | J.P. MORGAN EXCHANGE-TRADED FUNDS | | OCTOBER 31, 2018 |
STATEMENTS OF ASSETS AND LIABILITIES
AS OF OCTOBER 31, 2018
| | | | | | | | | | | | | | | | |
| | | | |
| | | JPMorgan
BetaBuilders
Canada ETF | | | JPMorgan
BetaBuilders
Developed Asia
ex-Japan ETF | | | JPMorgan
BetaBuilders
Europe ETF | | | JPMorgan
BetaBuilders
Japan ETF | |
ASSETS: | | | | | | | | | | | | | | | | |
Investments in non-affiliates, at value | | $ | 2,026,860,357 | | | $ | 599,895,873 | | | $ | 1,305,192,857 | | | $ | 2,316,232,357 | |
Investments in affiliates, at value | | | 190,063 | | | | 254,772 | | | | 296,502 | | | | 288,800 | |
Investment of cash collateral received from Securities loaned (Note 2.D) | | | 71,875,628 | | | | — | | | | 26,501,735 | | | | 19,499,569 | |
Restricted cash | | | 51,000 | | | | 75,600 | | | | 107,000 | | | | 71,300 | |
Cash | | | 26,732 | | | | 1,604 | | | | 48,443 | | | | 7,952 | |
Foreign currency, at value | | | 9,303,753 | | | | 2,473,205 | | | | 5,836,228 | | | | 2,890,923 | |
Deposits at broker for futures contracts | | | 632,762 | | | | 414,976 | | | | 485,907 | | | | 838,640 | |
Segregated cash balance with Authorized Participant for deposit securities | | | 23,461,377 | | | | 4,968,992 | | | | 21,765 | | | | 18,821,405 | |
Deferred offering costs (Note 2.G) | | | 12,978 | | | | 11,976 | | | | 8,638 | | | | 8,260 | |
Receivables: | | | | | | | | | | | | | | | | |
Investment securities sold | | | 4,182,747 | | | | — | | | | 1,810,456 | | | | 3,244 | |
Fund shares sold | | | 94,503,643 | | | | — | | | | 22,350,042 | | | | 44,997,738 | |
Dividends from non-affiliates | | | 2,558,199 | | | | 342,929 | | | | 1,030,963 | | | | 15,222,089 | |
Dividends from affiliates | | | 539 | | | | 111 | | | | 262 | | | | 2,152 | |
Tax reclaims | | | 161,801 | | | | — | | | | 119,358 | | | | 11,268 | |
Securities lending income (Note 2.D) | | | 26,508 | | | | 988 | | | | 23,569 | | | | 14,118 | |
Variation margin on futures contracts | | | 212,893 | | | | 50,091 | | | | 79,988 | | | | 592,104 | |
Due from Adviser | | | 77,662 | | | | 52,498 | | | | 205,224 | | | | 188,591 | |
Due from Authorized Participant | | | 3,769,395 | | | | — | | | | 21,193 | | | | 17,919,123 | |
| | | | | | | | | | | | | | | | |
Total Assets | | | 2,237,908,037 | | | | 608,543,615 | | | | 1,364,140,130 | | | | 2,437,609,633 | |
| | | | | | | | | | | | | | | | |
| | | | |
LIABILITIES: | | | | | | | | | | | | | | | | |
Payables: | | | | | | | | | | | | | | | | |
Investment securities purchased | | | 97,471,778 | | | | 111 | | | | 22,218,276 | | | | 62,609,589 | |
Collateral received on securities loaned (Note 2.D) | | | 71,875,628 | | | | — | | | | 26,501,735 | | | | 19,499,569 | |
Accrued liabilities: | | | | | | | | | | | | | | | | |
Administration fees | | | 113,430 | | | | 43,042 | | | | 94,318 | | | | 146,017 | |
Custodian, Accounting and Transfer Agent fees | | | 58,172 | | | | 94,662 | | | | 135,019 | | | | 141,961 | |
Trustees’ and Chief Compliance Officer’s fees | | | 102 | | | | 102 | | | | 1,208 | | | | 3,129 | |
Professional Fees | | | 38,446 | | | | 38,446 | | | | 58,388 | | | | 59,175 | |
Collateral upon return of deposit securities | | | 23,461,377 | | | | 4,968,992 | | | | 21,765 | | | | 18,821,405 | |
Other | | | 190,278 | | | | 84,326 | | | | 179,129 | | | | 241,121 | |
| | | | | | | | | | | | | | | | |
Total Liabilities | | | 193,209,211 | | | | 5,229,681 | | | | 49,209,838 | | | | 101,521,966 | |
| | | | | | | | | | | | | | | | |
Net Assets | | $ | 2,044,698,826 | | | $ | 603,313,934 | | | $ | 1,314,930,292 | | | $ | 2,336,087,667 | |
| | | | | | | | | | | | | | | | |
|
NET ASSETS: | |
Paid-in-Capital | | $ | 2,173,863,245 | | | $ | 662,880,023 | | | $ | 1,403,691,225 | | | $ | 2,441,530,853 | |
Total distributable earnings (loss) (a) | | | (129,164,419 | ) | | | (59,566,089 | ) | | | (88,760,933 | ) | | | (105,443,186 | ) |
| | | | | | | | | | | | | | | | |
Total Net Assets | | $ | 2,044,698,826 | | | $ | 603,313,934 | | | $ | 1,314,930,292 | | | $ | 2,336,087,667 | |
| | | | | | | | | | | | | | | | |
|
Outstanding number of shares | |
(unlimited number of shares authorized — par value $0.0001) | | | 90,500,000 | | | | 26,600,000 | | | | 58,200,000 | | | | 102,800,000 | |
| | | | | | | | | | | | | | | | |
Net asset value, per share | | $ | 22.59 | | | $ | 22.68 | | | $ | 22.59 | | | $ | 22.72 | |
| | | | | | | | | | | | | | | | |
| | | | |
Cost of investments in non-affiliates | | $ | 2,159,812,603 | | | $ | 659,637,915 | | | $ | 1,396,379,819 | | | $ | 2,433,472,200 | |
Cost of investments in affiliates | | | 190,063 | | | | 254,772 | | | | 296,502 | | | | 288,800 | |
Cost of foreign currency | | | 9,367,748 | | | | 2,476,586 | | | | 5,899,934 | | | | 2,877,018 | |
Investment securities on loan, at value | | | 63,988,967 | | | | — | | | | 25,217,228 | | | | 17,759,855 | |
Cost of investment of cash collateral | | | 71,875,827 | | | | — | | | | 26,502,535 | | | | 19,499,769 | |
| (a) | Total distributable earnings has been aggregated to conform to the current presentation requirements for the adoption of the Securities and Exchange Commission’s Disclosure Update and Simplification Rule. See Note 8. |
SEE NOTES TO FINANCIAL STATEMENTS.
| | | | | | | | |
| | | |
| OCTOBER 31, 2018 | | J.P. MORGAN EXCHANGE-TRADED FUNDS | | | | | 171 | |
STATEMENTS OF ASSETS AND LIABILITIES
AS OF OCTOBER 31, 2018 (continued)
| | | | | | | | | | | | | | | | |
| | | | |
| | | JPMorgan Diversified
Return Emerging
Markets
Equity ETF | | | JPMorgan Diversified
Return Europe
Currency
Hedged ETF | | | JPMorgan Diversified
Return Europe
Equity ETF | | | JPMorgan Diversified
Return Global
Equity ETF | |
ASSETS: | |
Investments in non-affiliates, at value | | $ | 212,578,189 | | | $ | — | | | $ | 74,166,835 | | | $ | 201,146,419 | |
Investments in affiliates, at value | | | 753,648 | | | | 28,919,164 | | | | — | | | | 627,017 | |
Investment of cash collateral received from Securities loaned (Note 2.D) | | | — | | | | — | | | | — | | | | 924,151 | |
Restricted cash | | | 14,700 | | | | — | | | | 22,800 | | | | 7,700 | |
Cash | | | 310,559 | | | | 23,132 | | | | 305,908 | | | | 983,748 | |
Foreign currency, at value | | | 125,659 | | | | — | | | | 10,412 | | | | 154,973 | |
Deposits at broker for futures contracts | | | 61,000 | | | | — | | | | 24,000 | | | | 106,000 | |
Prepaid Expenses | | | 1,998 | | | | 264 | | | | 711 | | | | 2,148 | |
Receivables: | | | | | | | | | | | | | | | | |
Investment securities sold | | | — | | | | 1,125 | | | | — | | | | — | |
Dividends from non-affiliates | | | 157,976 | | | | — | | | | 61,888 | | | | 495,677 | |
Dividends from affiliates | | | 1,764 | | | | — | | | | — | | | | 311 | |
Tax reclaims | | | — | | | | — | | | | 347,158 | | | | 97,921 | |
Securities lending income (Note 2.D) | | | — | | | | — | | | | — | | | | 9 | |
Variation margin on futures contracts | | | 11,445 | | | | — | | | | 3,798 | | | | 16,985 | |
Unrealized appreciation on forward foreign currency exchange contracts | | | — | | | | 835,882 | | | | — | | | | — | |
Due from Adviser | | | 48,738 | | | | 16,999 | | | | 35,661 | | | | 1,194 | |
| | | | | | | | | | | | | | | | |
Total Assets | | | 214,065,676 | | | | 29,796,566 | | | | 74,979,171 | | | | 204,564,253 | |
| | | | | | | | | | | | | | | | |
| | | | |
LIABILITIES: | | | | | | | | | | | | | | | | |
Payables: | | | | | | | | | | | | | | | | |
Investment securities purchased | | | 16 | | | | 819,887 | | | | — | | | | — | |
Collateral received on securities loaned (Note 2.D) | | | — | | | | — | | | | — | | | | 924,151 | |
Unrealized depreciation on forward foreign currency exchange contracts | | | — | | | | 23,066 | | | | — | | | | — | |
Accrued liabilities: | | | | | | | | | | | | | | | | |
Administration fees | | | 15,660 | | | | 2,106 | | | | 5,545 | | | | 14,952 | |
Custodian, Accounting and Transfer Agent fees | | | 125,484 | | | | 8,134 | | | | 60,753 | | | | 50,444 | |
Trustees’ and Chief Compliance Officer’s fees | | | 4,092 | | | | 521 | | | | 1,404 | | | | 4,864 | |
Deferred foreign capital gains tax | | | 15,344 | | | | — | | | | — | | | | — | |
Professional Fees | | | 73,301 | | | | 36,593 | | | | 77,051 | | | | 80,616 | |
Other | | | 27,527 | | | | 12,021 | | | | 13,630 | | | | 31,962 | |
| | | | | | | | | | | | | | | | |
Total Liabilities | | | 261,424 | | | | 902,328 | | | | 158,383 | | | | 1,106,989 | |
| | | | | | | | | | | | | | | | |
Net Assets | | $ | 213,804,252 | | | $ | 28,894,238 | | | $ | 74,820,788 | | | $ | 203,457,264 | |
| | | | | | | | | | | | | | | | |
|
NET ASSETS: | |
Paid-in-Capital | | $ | 226,565,919 | | | $ | 27,087,053 | | | $ | 74,966,212 | | | $ | 207,895,633 | |
Total distributable earnings (loss) (a) | | | (12,761,667 | ) | | | 1,807,185 | | | | (145,424 | ) | | | (4,438,369 | ) |
| | | | | | | | | | | | | | | | |
Total Net Assets | | $ | 213,804,252 | | | $ | 28,894,238 | | | $ | 74,820,788 | | | $ | 203,457,264 | |
| | | | | | | | | | | | | | | | |
Outstanding number of shares | | | | | | | | | | | | | | | | |
(unlimited number of shares authorized — par value $0.0001) | | | 4,200,000 | | | | 1,050,000 | | | | 1,400,000 | | | | 3,600,000 | |
| | | | | | | | | | | | | | | | |
Net asset value, per share | | $ | 50.91 | | | $ | 27.52 | | | $ | 53.44 | | | $ | 56.52 | |
| | | | | | | | | | | | | | | | |
| | | | |
Cost of investments in non-affiliates | | $ | 216,001,988 | | | $ | — | | | $ | 73,847,159 | | | $ | 204,543,360 | |
Cost of investments in affiliates | | | 753,648 | | | | 28,437,436 | | | | — | | | | 627,017 | |
Cost of foreign currency | | | 126,040 | | | | — | | | | 10,422 | | | | 156,897 | |
Investment securities on loan, at value | | | — | | | | — | | | | — | | | | 905,726 | |
Cost of investment of cash collateral | | | — | | | | — | | | | — | | | | 924,151 | |
| (a) | Total distributable earnings has been aggregated to conform to the current presentation requirements for the adoption of the Securities and Exchange Commission’s Disclosure Update and Simplification Rule. See Note 8. |
SEE NOTES TO FINANCIAL STATEMENTS.
| | | | | | |
| | | |
| 172 | | | | J.P. MORGAN EXCHANGE-TRADED FUNDS | | OCTOBER 31, 2018 |
| | | | | | | | | | | | | | | | |
| | | JPMorgan
Diversified
Return
International
Currency
Hedged ETF | | | JPMorgan
Diversified
Return
International
Equity ETF | | | JPMorgan Diversified
Return U.S.
Equity ETF | | | JPMorgan
Diversified
Return U.S.
Mid Cap
Equity ETF | |
ASSETS: | |
Investments in non-affiliates, at value | | $ | — | | | $ | 1,430,666,878 | | | $ | 551,719,671 | | | $ | 108,211,311 | |
Investments in affiliates, at value | | | 31,392,996 | | | | 6,618,219 | | | | 6,889,863 | | | | 3,620,915 | |
Investment of cash collateral received from Securities loaned (Note 2.D) | | | — | | | | — | | | | 4,709,887 | | | | 643,332 | |
Restricted cash | | | — | | | | 43,200 | | | | 5,800 | | | | 4,500 | |
Cash | | | 26,982 | | | | 1,101,640 | | | | — | | | | — | |
Foreign currency, at value | | | 29 | | | | 22,947 | | | | — | | | | — | |
Deposits at broker for futures contracts | | | — | | | | 585,000 | | | | 344,000 | | | | 172,000 | |
Prepaid Expenses | | | 306 | | | | 13,604 | | | | 4,479 | | | | 859 | |
Receivables: | | | | | | | | | | | | | | | | |
Investment securities sold | | | 5,248 | | | | — | | | | — | | | | — | |
Dividends from non-affiliates | | | — | | | | 4,433,357 | | | | 490,625 | | | | 59,589 | |
Dividends from affiliates | | | — | | | | 10,105 | | | | 5,325 | | | | 1,779 | |
Tax reclaims | | | — | | | | 1,456,731 | | | | — | | | | — | |
Securities lending income (Note 2.D) | | | — | | | | — | | | | 667 | | | | 339 | |
Variation margin on futures contracts | | | — | | | | 89,334 | | | | 64,740 | | | | 32,370 | |
Unrealized appreciation on forward foreign currency exchange contracts | | | 586,744 | | | | — | | | | — | | | | — | |
Due from Adviser | | | 18,448 | | | | — | | | | 30,682 | | | | 14,993 | |
| | | | | | | | | | | | | | | | |
Total Assets | | | 32,030,753 | | | | 1,445,041,015 | | | | 564,265,739 | | | | 112,761,987 | |
| | | | | | | | | | | | | | | | |
| | | | |
LIABILITIES: | | | | | | | | | | | | | | | | |
Payables: | | | | | | | | | | | | | | | | |
Investment securities purchased | | | 550,407 | | | | — | | | | — | | | | — | |
Collateral received on securities loaned (Note 2.D) | | | — | | | | — | | | | 4,709,887 | | | | 643,332 | |
Unrealized depreciation on forward foreign currency exchange contracts | | | 52,235 | | | | — | | | | — | | | | — | |
Accrued liabilities: | | | | | | | | | | | | | | | | |
Investment advisory fees | | | — | | | | 103,969 | | | | — | | | | — | |
Administration fees | | | 2,323 | | | | 109,241 | | | | 40,522 | | | | 7,896 | |
Custodian, Accounting and Transfer Agent fees | | | 8,440 | | | | 158,291 | | | | 18,362 | | | | 14,552 | |
Trustees’ and Chief Compliance Officer’s fees | | | 646 | | | | 28,060 | | | | 8,247 | | | | 1,490 | |
Professional Fees | | | 37,015 | | | | 169,990 | | | | 71,348 | | | | 42,203 | |
Other | | | 12,899 | | | | 139,203 | | | | 55,044 | | | | 24,334 | |
| | | | | | | | | | | | | | | | |
Total Liabilities | | | 663,965 | | | | 708,754 | | | | 4,903,410 | | | | 733,807 | |
| | | | | | | | | | | | | | | | |
Net Assets | | $ | 31,366,788 | | | $ | 1,444,332,261 | | | $ | 559,362,329 | | | $ | 112,028,180 | |
| | | | | | | | | | | | | | | | |
| | | | |
NET ASSETS: | | | | | | | | | | | | | | | | |
Paid-in-Capital | | $ | 29,669,318 | | | $ | 1,492,678,360 | | | $ | 527,790,333 | | | $ | 107,453,704 | |
Total distributable earnings (loss) (a) | | | 1,697,470 | | | | (48,346,099 | ) | | | 31,571,996 | | | | 4,574,476 | |
| | | | | | | | | | | | | | | | |
Total Net Assets | | $ | 31,366,788 | | | $ | 1,444,332,261 | | | $ | 559,362,329 | | | $ | 112,028,180 | |
| | | | | | | | | | | | | | | | |
Outstanding number of shares | | | | | | | | | | | | | | | | |
(unlimited number of shares authorized — par value $0.0001) | | | 1,100,000 | | | | 27,200,000 | | | | 8,000,000 | | | | 1,800,000 | |
| | | | | | | | | | | | | | | | |
Net asset value, per share | | $ | 28.52 | | | $ | 53.10 | | | $ | 69.92 | | | $ | 62.24 | |
| | | | | | | | | | | | | | | | |
| | | | |
Cost of investments in non-affiliates | | $ | — | | | $ | 1,469,940,739 | | | $ | 518,479,207 | | | $ | 103,203,566 | |
Cost of investments in affiliates | | | 30,690,692 | | | | 6,618,219 | | | | 6,889,863 | | | | 3,620,915 | |
Cost of foreign currency | | | 30 | | | | 22,951 | | | | — | | | | — | |
Investment securities on loan, at value | | | — | | | | — | | | | 4,586,251 | | | | 627,488 | |
Cost of investment of cash collateral | | | — | | | | — | | | | 4,709,887 | | | | 643,332 | |
| (a) | Total distributable earnings has been aggregated to conform to the current presentation requirements for the adoption of the Securities and Exchange Commission’s Disclosure Update and Simplification Rule. See Note 8. |
SEE NOTES TO FINANCIAL STATEMENTS.
| | | | | | | | |
| | | |
| OCTOBER 31, 2018 | | J.P. MORGAN EXCHANGE-TRADED FUNDS | | | | | 173 | |
STATEMENTS OF ASSETS AND LIABILITIES
AS OF OCTOBER 31, 2018 (continued)
| | | | | | | | | | | | | | | | |
| | | | |
| | | JPMorgan
Diversified
Return U.S.
Small Cap
Equity ETF | | | JPMorgan U.S.
Dividend ETF | | | JPMorgan
U.S. Minimum
Volatility ETF | | | JPMorgan
U.S. Momentum
Factor ETF | |
ASSETS: | |
Investments in non-affiliates, at value | | $ | 94,517,850 | | | $ | 26,099,093 | | | $ | 26,671,887 | | | $ | 28,548,871 | |
Investments in affiliates, at value | | | 1,505,075 | | | | 1,248,859 | | | | 760,666 | | | | 63,323 | |
Investment of cash collateral received from Securities loaned (Note 2.D) | | | 2,431,125 | | | | 148,580 | | | | 93,840 | | | | 66,300 | |
Restricted cash | | | 10,500 | | | | 600 | | | | — | | | | 800 | |
Deposits at broker for futures contracts | | | 157,000 | | | | 60,000 | | | | 33,000 | | | | — | |
Deferred offering costs (Note 2.G) | | | — | | | | 90 | | | | 126 | | | | 90 | |
Prepaid Expenses | | | 636 | | | | 236 | | | | 240 | | | | 247 | |
Receivables: | | | | | | | | | | | | | | | | |
Dividends from non-affiliates | | | 30,990 | | | | 45,233 | | | | 25,936 | | | | 17,170 | |
Dividends from affiliates | | | 1,935 | | | | 732 | | | | 416 | | | | 111 | |
Securities lending income (Note 2.D) | | | 2,653 | | | | 209 | | | | 123 | | | | 4 | |
Variation margin on futures contracts | | | 1,100 | �� | | | 11,205 | | | | 6,225 | | | | — | |
Due from Adviser | | | 3,025 | | | | 9,430 | | | | 11,294 | | | | 10,220 | |
| | | | | | | | | | | | | | | | |
Total Assets | | | 98,661,889 | | | | 27,624,267 | | | | 27,603,753 | | | | 28,707,136 | |
| | | | | | | | | | | | | | | | |
| | | | |
LIABILITIES: | | | | | | | | | | | | | | | | |
Payables: | | | | | | | | | | | | | | | | |
Collateral received on securities loaned (Note 2.D) | | | 2,431,125 | | | | 148,580 | | | | 93,840 | | | | 66,300 | |
Accrued liabilities: | | | | | | | | | | | | | | | | |
Administration fees | | | 7,147 | | | | 1,957 | | | | 2,011 | | | | 2,056 | |
Custodian, Accounting and Transfer Agent fees | | | 22,653 | | | | 8,538 | | | | 7,950 | | | | 9,177 | |
Trustees’ and Chief Compliance Officer’s fees | | | 917 | | | | 470 | | | | 480 | | | | 486 | |
Professional Fees | | | 47,561 | | | | 42,749 | | | | 42,729 | | | | 42,690 | |
Other | | | 17,232 | | | | 10,847 | | | | 10,973 | | | | 11,057 | |
| | | | | | | | | | | | | | | | |
Total Liabilities | | | 2,526,635 | | | | 213,141 | | | | 157,983 | | | | 131,766 | |
| | | | | | | | | | | | | | | | |
Net Assets | | $ | 96,135,254 | | | $ | 27,411,126 | | | $ | 27,445,770 | | | $ | 28,575,370 | |
| | | | | | | | | | | | | | | | |
|
NET ASSETS: | |
Paid-in-Capital | | $ | 95,216,607 | | | $ | 27,566,350 | | | $ | 26,278,544 | | | $ | 27,532,314 | |
Total distributable earnings (loss) (a) | | | 918,647 | | | | (155,224 | ) | | | 1,167,226 | | | | 1,043,056 | |
| | | | | | | | | | | | | | | | |
Total Net Assets | | $ | 96,135,254 | | | $ | 27,411,126 | | | $ | 27,445,770 | | | $ | 28,575,370 | |
| | | | | | | | | | | | | | | | |
Outstanding number of shares | | | | | | | | | | | | | | | | |
(unlimited number of shares authorized — par value $0.0001) | | | 3,250,000 | | | | 1,100,000 | | | | 1,050,000 | | | | 1,100,000 | |
| | | | | | | | | | | | | | | | |
Net asset value, per share | | $ | 29.58 | | | $ | 24.92 | | | $ | 26.14 | | | $ | 25.98 | |
| | | | | | | | | | | | | | | | |
| | | | |
Cost of investments in non-affiliates | | $ | 92,963,657 | | | $ | 26,065,291 | | | $ | 25,464,687 | | | $ | 27,226,813 | |
Cost of investments in affiliates | | | 1,505,075 | | | | 1,248,859 | | | | 760,666 | | | | 63,323 | |
Investment securities on loan, at value | | | 2,359,957 | | | | 145,312 | | | | 91,776 | | | | 64,857 | |
Cost of investment of cash collateral | | | 2,431,125 | | | | 148,580 | | | | 93,840 | | | | 66,300 | |
| (a) | Total distributable earnings has been aggregated to conform to the current presentation requirements for the adoption of the Securities and Exchange Commission’s Disclosure Update and Simplification Rule. See Note 8. |
SEE NOTES TO FINANCIAL STATEMENTS.
| | | | | | |
| | | |
| 174 | | | | J.P. MORGAN EXCHANGE-TRADED FUNDS | | OCTOBER 31, 2018 |
| | | | | | | | |
| | |
| | | JPMorgan U.S. Quality
Factor ETF | | | JPMorgan
U.S. Value
Factor ETF | |
ASSETS: | |
Investments in non-affiliates, at value | | $ | 28,229,641 | | | $ | 28,210,236 | |
Investments in affiliates, at value | | | 836,372 | | | | 692,762 | |
Investment of cash collateral received from Securities loaned (Note 2.D) | | | 58,800 | | | | 57,600 | |
Restricted cash | | | — | | | | 700 | |
Deposits at broker for futures contracts | | | 47,000 | | | | 40,000 | |
Deferred offering costs (Note 2.G) | | | 90 | | | | 89 | |
Prepaid Expenses | | | 244 | | | | 242 | |
Receivables: | | | | | | | | |
Investment securities sold | | | — | | | | 59,835 | |
Fund shares sold | | | 1,318,644 | | | | — | |
Interest from non-affiliates | | | 26,798 | | | | 29,709 | |
Dividends from affiliates | | | 455 | | | | 553 | |
Securities lending income (Note 2.D) | | | 25 | | | | 12 | |
Variation margin on futures contracts | | | 8,715 | | | | 7,470 | |
Due from Adviser | | | 9,968 | | | | 9,576 | |
| | | | | | | | |
Total Assets | | | 30,536,752 | | | | 29,108,784 | |
| | | | | | | | |
| | |
LIABILITIES: | | | | | | | | |
Payables: | | | | | | | | |
Collateral received on securities loaned (Note 2.D) | | | 58,800 | | | | 57,600 | |
Investment securities purchased | | | 1,198,520 | | | | — | |
Accrued liabilities: | | | | | | | | |
Administration fees | | | 2,052 | | | | 1,991 | |
Custodian, Accounting and Transfer Agent fees | | | 8,006 | | | | 8,380 | |
Trustees’ and Chief Compliance Officer’s fees | | | 481 | | | | 491 | |
Professional Fees | | | 42,657 | | | | 42,765 | |
Other | | | 10,969 | | | | 11,048 | |
| | | | | | | | |
Total Liabilities | | | 1,321,485 | | | | 122,275 | |
| | | | | | | | |
Net Assets | | $ | 29,215,267 | | | $ | 28,986,509 | |
| | | | | | | | |
|
NET ASSETS: | |
Paid-in-Capital | | $ | 27,647,461 | | | $ | 28,786,482 | |
Total distributable earnings (loss) (a) | | | 1,567,806 | | | | 200,027 | |
| | | | | | | | |
Total Net Assets | | $ | 29,215,267 | | | $ | 28,986,509 | |
| | | | | | | | |
Outstanding number of shares | | | | | | | | |
(unlimited number of shares authorized — par value $0.0001) | | | 1,100,000 | | | | 1,150,000 | |
| | | | | | | | |
Net asset value, per share | | $ | 26.56 | | | $ | 25.21 | |
| | | | | | | | |
| | |
Cost of investments in non-affiliates | | $ | 26,600,390 | | | $ | 27,914,949 | |
Cost of investments in affiliates | | | 836,372 | | | | 692,762 | |
Investment securities on loan, at value | | | 57,428 | | | | 56,250 | |
Cost of investment of cash collateral | | | 58,800 | | | | 57,600 | |
| (a) | Total distributable earnings has been aggregated to conform to the current presentation requirements for the adoption of the Securities and Exchange Commission’s Disclosure Update and Simplification Rule. See Note 8. |
SEE NOTES TO FINANCIAL STATEMENTS.
| | | | | | | | |
| | | |
| OCTOBER 31, 2018 | | J.P. MORGAN EXCHANGE-TRADED FUNDS | | | | | 175 | |
STATEMENTS OF OPERATIONS
FOR THE PERIOD ENDED OCTOBER 31, 2018
| | | | | | | | | | | | | | | | |
| | | | |
| | | JPMorgan
BetaBuilders
Canada ETF (a) | | | JPMorgan
BetaBuilders
Developed Asia
ex-Japan ETF (a) | | | JPMorgan
BetaBuilders
Europe ETF (b) | | | JPMorgan
BetaBuilders
Japan ETF (b) | |
INVESTMENT INCOME: | |
Dividend income from non-affiliates | | $ | 10,418,088 | | | $ | 5,159,293 | | | $ | 4,447,345 | | | $ | 17,172,556 | |
Dividend income from affiliates | | | 924 | | | | 12,144 | | | | 1,193 | | | | 3,153 | |
Interest income from non-affiliates | | | 400 | | | | 240 | | | | — | | | | — | |
Interest income from affiliates | | | 488 | | | | 2,479 | | | | — | | | | — | |
Non-cash dividend income from non-affiliates | | | — | | | | — | | | | 524,662 | | | | — | |
Income from securities lending (net) | | | 62,483 | | | | 2,669 | | | | 48,267 | | | | 27,149 | |
Foreign taxes withheld | | | (1,806,704 | ) | | | (44,377 | ) | | | (314,756 | ) | | | (1,716,851 | ) |
| | | | | | | | | | | | | | | | |
Total investment income | | | 8,675,679 | | | | 5,132,448 | | | | 4,706,711 | | | | 15,486,007 | |
| | | | | | | | | | | | | | | | |
| | | | |
EXPENSES: | | | | | | | | | | | | | | | | |
Investment advisory fees (Note 3.A) | | | 590,157 | | | | 232,948 | | | | 271,259 | | | | 1,017,000 | |
Administration fees (Note 3.B) | | | 264,020 | | | | 104,214 | | | | 256,188 | | | | 454,978 | |
Interest expense to non-affiliates | | | 99 | | | | 62 | | | | 1,215 | | | | 101 | |
Interest expense to affiliates | | | — | | | | 511 | | | | 2,162 | | | | 1,020 | |
Professional fees | | | 38,446 | | | | 38,446 | | | | 62,116 | | | | 64,614 | |
Trustees’ and Chief Compliance Officer’s fees | | | 2,139 | | | | 945 | | | | 6,271 | | | | 17,830 | |
Printing and mailing costs | | | 4,000 | | | | 4,000 | | | | 10,239 | | | | 9,607 | |
Registration and filing fees | | | 186,079 | | | | 79,826 | | | | 168,868 | | | | 231,782 | |
Custodian, Accounting and Transfer Agent fees (Note 3.C) | | | 65,672 | | | | 94,662 | | | | 254,376 | | | | 221,263 | |
Insurance expense | | | 41 | | | | 41 | | | | 159 | | | | 80 | |
Offering costs (Note 2.G) | | | 3,940 | | | | 3,635 | | | | 5,251 | | | | 4,990 | |
Other | | | 1,963 | | �� | | 1,657 | | | | 1,129 | | | | 1,870 | |
| | | | | | | | | | | | | | | | |
Total expenses | | | 1,156,556 | | | | 560,947 | | | | 1,039,233 | | | | 2,025,135 | |
| | | | | | | | | | | | | | | | |
Less fee waived (Note 3.D) | | | (504,288 | ) | | | (250,138 | ) | | | (527,447 | ) | | | (881,904 | ) |
Less expense reimbursements from affiliates (Note 3.D) | | | — | | | | — | | | | (20,082 | ) | | | — | |
Less expense reimbursements from non-affiliates (Note 3.C) | | | (58,500 | ) | | | (75,600 | ) | | | (214,000 | ) | | | (124,000 | ) |
| | | | | | | | | | | | | | | | |
Net expenses | | | 593,768 | | | | 235,209 | | | | 277,704 | | | | 1,019,231 | |
| | | | | | | | | | | | | | | | |
Net investment income (loss) | | | 8,081,911 | | | | 4,897,239 | | | | 4,429,007 | | | | 14,466,776 | |
| | | | | | | | | | | | | | | | |
| | | | |
REALIZED/UNREALIZED GAINS (LOSSES): | | | | | | | | | | | | | | | | |
Net realized gain (loss) on transactions from: | | | | | | | | | | | | | | | | |
Investments in non-affiliates | | | (816,344 | ) | | | (287,989 | ) | | | 29,613 | | | | (759,038 | ) |
In-kind redemptions in non-affiliates | | | (349,115 | ) | | | — | | | | — | | | | — | |
Futures | | | (57,994 | ) | | | (153,173 | ) | | | (157,096 | ) | | | (1,329,164 | ) |
Foreign currency transactions | | | (16,346 | ) | | | (16,465 | ) | | | 122,165 | | | | (8,011 | ) |
| | | | | | | | | | | | | | | | |
Net realized gain (loss) | | | (1,239,799 | ) | | | (457,627 | ) | | | (5,318 | ) | | | (2,096,213 | ) |
| | | | | | | | | | | | | | | | |
Change in net unrealized appreciation/depreciation on: | | | | | | | | | | | | | | | | |
Investments in affiliates | | | (199 | ) | | | — | | | | (800 | ) | | | (200 | ) |
Investments in non-affiliates | | | (132,952,246 | ) | | | (59,742,042 | ) | | | (91,186,962 | ) | | | (117,239,843 | ) |
Futures | | | (382,489 | ) | | | (93,729 | ) | | | (19,386 | ) | | | (576,077 | ) |
Foreign currency translations | | | (88,231 | ) | | | (10,166 | ) | | | (85,963 | ) | | | 2,371 | |
| | | | | | | | | | | | | | | | |
Change in net unrealized appreciation/depreciation | | | (133,423,165 | ) | | | (59,845,937 | ) | | | (91,293,111 | ) | | | (117,813,749 | ) |
| | | | | | | | | | | | | | | | |
Net realized/unrealized gains (losses) | | | (134,662,964 | ) | | | (60,303,564 | ) | | | (91,298,429 | ) | | | (119,909,962 | ) |
| | | | | | | | | | | | | | | | |
Change in net assets resulting from operations | | $ | (126,581,053 | ) | | $ | (55,406,325 | ) | | $ | (86,869,422 | ) | | $ | (105,443,186 | ) |
| | | | | | | | | | | | | | | | |
| (a) | Commencement of operations was August 7, 2018. |
| (b) | Commencement of operations was June 15, 2018. |
SEE NOTES TO FINANCIAL STATEMENTS.
| | | | | | |
| | | |
| 176 | | | | J.P. MORGAN EXCHANGE-TRADED FUNDS | | OCTOBER 31, 2018 |
| | | | | | | | | | | | | | | | |
| | | | |
| | | JPMorgan
Diversified
Return Emerging
Markets
Equity ETF | | | JPMorgan
Diversified
Return Europe
Currency
Hedged ETF | | | JPMorgan
Diversified
Return Europe
Equity ETF | | | JPMorgan
Diversified
Return Global
Equity ETF | |
INVESTMENT INCOME: | |
Dividend income from non-affiliates | | $ | 7,474,681 | | | $ | — | | | $ | 2,707,794 | | | $ | 5,744,928 | |
Dividend income from affiliates | | | 8,382 | | | | 1,491,216 | | | | — | | | | 7,601 | |
Interest income from non-affiliates | | | 10 | | | | — | | | | 606 | | | | 137 | |
Interest income from affiliates | | | 1,157 | | | | 6 | | | | — | | | | 483 | |
Non-cash dividend income from non-affiliates | | | — | | | | — | | | | 130,853 | | | | — | |
Income from securities lending (net) | | | — | | | | — | | | | — | | | | 16 | |
Foreign taxes withheld | | | (728,184 | ) | | | — | | | | (300,777 | ) | | | (423,313 | ) |
| | | | | | | | | | | | | | | | |
Total investment income | | | 6,756,046 | | | | 1,491,222 | | | | 2,538,476 | | | | 5,329,852 | |
| | | | | | | | | | | | | | | | |
| | | | |
EXPENSES: | | | | | | | | | | | | | | | | |
Investment advisory fees (Note 3.A) | | | 915,128 | | | | 98,878 | | | | 239,917 | | | | 476,417 | |
Administration fees (Note 3.B) | | | 176,788 | | | | 25,469 | | | | 67,977 | | | | 168,735 | |
Interest expense to affiliates | | | 617 | | | | 29 | | | | 314 | | | | 980 | |
Professional fees | | | 148,930 | | | | 39,050 | | | | 78,139 | | | | 78,588 | |
Trustees’ and Chief Compliance Officer’s fees | | | 27,091 | | | | 4,021 | | | | 10,759 | | | | 27,566 | |
Printing and mailing costs | | | 32,512 | | | | 3,485 | | | | 9,213 | | | | 29,030 | |
Registration and filing fees | | | 21,084 | | | | 4,802 | | | | 13,914 | | | | 27,018 | |
Custodian, Accounting and Transfer Agent fees (Note 3.C) | | | 645,223 | | | | 34,178 | | | | 125,829 | | | | 281,661 | |
Insurance expense | | | 22,180 | | | | 2,810 | | | | 6,353 | | | | 17,645 | |
Other | | | 12,239 | | | | 11,377 | | | | 7,526 | | | | 10,801 | |
| | | | | | | | | | | | | | | | |
Total expenses | | | 2,001,792 | | | | 224,099 | | | | 559,941 | | | | 1,118,441 | |
| | | | | | | | | | | | | | | | |
Less fee waived (Note 3.D) | | | (933,205 | ) | | | (124,347 | ) | | | (207,701 | ) | | | (232,413 | ) |
Less expense reimbursements from affiliates (Note 3.D) | | | — | | | | (90,658 | ) | | | — | | | | — | |
Less expense reimbursements from non-affiliates (Note 3.C) | | | (132,300 | ) | | | — | | | | (28,500 | ) | | | (130,900 | ) |
| | | | | | | | | | | | | | | | |
Net expenses | | | 936,287 | | | | 9,094 | | | | 323,740 | | | | 755,128 | |
| | | | | | | | | | | | | | | | |
Net investment income (loss) | | | 5,819,759 | | | | 1,482,128 | | | | 2,214,736 | | | | 4,574,724 | |
| | | | | | | | | | | | | | | | |
| | | | |
REALIZED/UNREALIZED GAINS (LOSSES): | | | | | | | | | | | | | | | | |
Net realized gain (loss) on transactions from: | | | | | | | | | | | | | | | | |
Investments in non-affiliates | | | (4,348,354 | )(a) | | | — | | | | 50,518 | | | | 336,326 | |
Investments in affiliates | | | — | | | | 232,513 | | | | — | | | | — | |
In-kind redemptions in non-affiliates | | | — | | | | — | | | | 2,787,524 | | | | 799,091 | |
Futures | | | 95,710 | | | | — | | | | (224,991 | ) | | | (6,868 | ) |
Foreign currency transactions | | | (25,605 | ) | | | (53,242 | ) | | | (14,048 | ) | | | (88,601 | ) |
Forward foreign currency exchange contracts | | | — | | | | 1,354,327 | | | | — | | | | — | |
| | | | | | | | | | | | | | | | |
Net realized gain (loss) | | | (4,278,249 | ) | | | 1,533,598 | | | | 2,599,003 | | | | 1,039,948 | |
| | | | | | | | | | | | | | | | |
Change in net unrealized appreciation/depreciation on: | | | | | | | | | | | | | | | | |
Investments in non-affiliates | | | (22,767,552 | )(b) | | | — | | | | (11,428,661 | ) | | | (17,400,980 | ) |
Investments in affiliates | | | — | | | | (4,263,292 | ) | | | — | | | | — | |
Futures | | | 14,197 | | | | — | | | | 6,606 | | | | (17,876 | ) |
Foreign currency translations | | | 1,968 | | | | (10,966 | ) | | | (12,510 | ) | | | (2,017 | ) |
Forward foreign currency exchange contracts | | | — | | | | 296,540 | | | | — | | | | — | |
| | | | | | | | | | | | | | | | |
Change in net unrealized appreciation/depreciation | | | (22,751,387 | ) | | | (3,977,718 | ) | | | (11,434,565 | ) | | | (17,420,873 | ) |
| | | | | | | | | | | | | | | | |
Net realized/unrealized gains (losses) | | | (27,029,636 | ) | | | (2,444,120 | ) | | | (8,835,562 | ) | | | (16,380,925 | ) |
| | | | | | | | | | | | | | | | |
Change in net assets resulting from operations | | $ | (21,209,877 | ) | | $ | (961,992 | ) | | $ | (6,620,826 | ) | | $ | (11,806,201 | ) |
| | | | | | | | | | | | | | | | |
| (a) | Net of foreign capital gains tax of approximately ($31,998). |
| (b) | Net change in foreign capital gains tax of approximately $240,033. |
SEE NOTES TO FINANCIAL STATEMENTS.
| | | | | | | | |
| | | |
| OCTOBER 31, 2018 | | J.P. MORGAN EXCHANGE-TRADED FUNDS | | | | | 177 | |
STATEMENTS OF OPERATIONS
FOR THE PERIOD ENDED OCTOBER 31, 2018 (continued)
| | | | | | | | | | | | | | | | |
| | | JPMorgan
Diversified
Return
International
Currency
Hedged ETF | | | JPMorgan
Diversified
Return
International
Equity ETF | | | JPMorgan
Diversified
Return U.S.
Equity ETF | | | JPMorgan
Diversified
Return U.S.
Mid Cap
Equity ETF | |
INVESTMENT INCOME: | |
Dividend income from non-affiliates | | $ | — | | | $ | 46,500,152 | | | $ | 10,604,789 | | | $ | 1,830,747 | |
Dividend income from affiliates | | | 1,567,544 | | | | 94,206 | | | | 35,964 | | | | 12,628 | |
Interest income from non-affiliates | | | — | | | | 3,501 | | | | — | | | | — | |
Interest income from affiliates | | | — | | | | 958 | | | | — | | | | — | |
Income from securities lending (net) | | | — | | | | — | | | | 878 | | | | 389 | |
Foreign taxes withheld | | | — | | | | (3,664,702 | ) | | | — | | | | — | |
| | | | | | | | | | | | | | | | |
Total investment income | | | 1,567,544 | | | | 42,934,115 | | | | 10,641,631 | | | | 1,843,764 | |
| | | | | | | | | | | | | | | | |
| | | | |
EXPENSES: | | | | | | | | | | | | | | | | |
Investment advisory fees (Note 3.A) | | | 100,105 | | | | 3,473,942 | | | | 1,145,507 | | | | 235,101 | |
Administration fees (Note 3.B) | | | 31,515 | | | | 1,230,380 | | | | 423,343 | | | | 83,267 | |
Interest expense to non-affiliates | | | — | | | | 262 | | | | — | | | | — | |
Interest expense to affiliates | | | 86 | | | | 4,894 | | | | — | | | | — | |
Professional fees | | | 45,248 | | | | 361,918 | | | | 167,043 | | | | 58,759 | |
Trustees’ and Chief Compliance Officer’s fees | | | 5,151 | | | | 189,398 | | | | 62,869 | | | | 12,047 | |
Printing and mailing costs | | | 4,468 | | | | 168,808 | | | | 53,858 | | | | 13,447 | |
Registration and filing fees | | | 8,701 | | | | 75,372 | | | | 41,759 | | | | 12,942 | |
Custodian, Accounting and Transfer Agent fees (Note 3.C) | | | 37,575 | | | | 647,990 | | | | 86,927 | | | | 59,066 | |
Insurance expense | | | 6,615 | | | | 131,782 | | | | 49,954 | | | | 9,691 | |
Other | | | 9,408 | | | | 58,198 | | | | 22,149 | | | | 7,801 | |
| | | | | | | | | | | | | | | | |
Total expenses | | | 248,872 | | | | 6,342,944 | | | | 2,053,409 | | | | 492,121 | |
| | | | | | | | | | | | | | | | |
Less fee waived (Note 3.D) | | | (131,620 | ) | | | (422,800 | ) | | | (1,073,761 | ) | | | (242,982 | ) |
Less expense reimbursements from affiliates (Note 3.D) | | | (104,903 | ) | | | — | | | | — | | | | — | |
Less expense reimbursements from non-affiliates (Note 3.C) | | | — | | | | (187,200 | ) | | | (36,250 | ) | | | (15,000 | ) |
| | | | | | | | | | | | | | | | |
Net expenses | | | 12,349 | | | | 5,732,944 | | | | 943,398 | | | | 234,139 | |
| | | | | | | | | | | | | | | | |
Net investment income (loss) | | | 1,555,195 | | | | 37,201,171 | | | | 9,698,233 | | | | 1,609,625 | |
| | | | | | | | | | | | | | | | |
| | | | |
REALIZED/UNREALIZED GAINS (LOSSES): | | | | | | | | | | | | | | | | |
Net realized gain (loss) on transactions from: | | | | | | | | | | | | | | | | |
Investments in non-affiliates | | | — | | | | (1,096,513 | ) | | | (731,895 | ) | | | (568,638 | ) |
Investments in affiliates | | | 99,303 | | | | — | | | | — | | | | — | |
In-kind redemptions in non-affiliates | | | — | | | | 12,828,242 | | | | 1,603,810 | | | | 1,877,456 | |
In-kind redemptions in affiliates | | | 2,618,926 | | | | — | | | | — | | | | — | |
Futures | | | — | | | | 185,207 | | | | 65,140 | | | | 56,340 | |
Foreign currency transactions | | | (125,506 | ) | | | (440,431 | ) | | | — | | | | — | |
Forward foreign currency exchange contracts | | | 817,698 | | | | — | | | | — | | | | — | |
| | | | | | | | | | | | | | | | |
Net realized gain (loss) | | | 3,410,421 | | | | 11,476,505 | | | | 937,055 | | | | 1,365,158 | |
| | | | | | | | | | | | | | | | |
Change in net unrealized appreciation/depreciation on: | | | | | | | | | | | | | | | | |
Investments in non-affiliates | | | — | | | | (167,694,990 | ) | | | 5,573,193 | | | | (1,277,026 | ) |
Investments in affiliates | | | (5,925,977 | ) | | | — | | | | — | | | | — | |
Futures | | | — | | | | (221,988 | ) | | | (43,056 | ) | | | (19,830 | ) |
Foreign currency translations | | | (3,868 | ) | | | (62,193 | ) | | | — | | | | — | |
Forward foreign currency exchange contracts | | | 73,516 | | | | — | | | | — | | | | — | |
| | | | | | | | | | | | | | | | |
Change in net unrealized appreciation/depreciation | | | (5,856,329 | ) | | | (167,979,171 | ) | | | 5,530,137 | | | | (1,296,856 | ) |
| | | | | | | | | | | | | | | | |
Net realized/unrealized gains (losses) | | | (2,445,908 | ) | | | (156,502,666 | ) | | | 6,467,192 | | | | 68,302 | |
| | | | | | | | | | | | | | | | |
Change in net assets resulting from operations | | $ | (890,713 | ) | | $ | (119,301,495 | ) | | $ | 16,165,425 | | | $ | 1,677,927 | |
| | | | | | | | | | | | | | | | |
SEE NOTES TO FINANCIAL STATEMENTS.
| | | | | | |
| | | |
| 178 | | | | J.P. MORGAN EXCHANGE-TRADED FUNDS | | OCTOBER 31, 2018 |
| | | | | | | | | | | | | | | | |
| | | | |
| | | JPMorgan
Diversified
Return U.S.
Small Cap
Equity ETF | | | JPMorgan U.S.
Dividend ETF (a) | | | JPMorgan
U.S. Minimum
Volatility ETF (a) | | | JPMorgan
U.S. Momentum
Factor ETF (a) | |
INVESTMENT INCOME: | |
Dividend income from non-affiliates | | $ | 1,056,805 | | | $ | 1,028,522 | | | $ | 641,719 | | | $ | 395,221 | |
Dividend income from affiliates | | | 12,755 | | | | 2,657 | | | | 1,935 | | | | 1,260 | |
Income from securities lending (net) | | | 2,739 | | | | 216 | | | | 127 | | | | 5 | |
| | | | | | | | | | | | | | | | |
Total investment income | | | 1,072,299 | | | | 1,031,395 | | | | 643,781 | | | | 396,486 | |
| | | | | | | | | | | | | | | | |
| | | | |
EXPENSES: | | | | | | | | | | | | | | | | |
Investment advisory fees (Note 3.A) | | | 227,440 | | | | 60,332 | | | | 60,404 | | | | 63,136 | |
Administration fees (Note 3.B) | | | 66,664 | | | | 22,297 | | | | 22,323 | | | | 23,333 | |
Professional fees | | | 67,133 | | | | 49,548 | | | | 49,485 | | | | 49,630 | |
Trustees’ and Chief Compliance Officer’s fees | | | 9,037 | | | | 3,489 | | | | 3,482 | | | | 3,613 | |
Printing and mailing costs | | | 11,326 | | | | 5,631 | | | | 5,691 | | | | 5,703 | |
Registration and filing fees | | | 9,770 | | | | 14,993 | | | | 14,990 | | | | 14,988 | |
Custodian, Accounting and Transfer Agent fees (Note 3.C) | | | 75,611 | | | | 35,711 | | | | 33,702 | | | | 36,002 | |
Insurance expense | | | 3,850 | | | | 1,519 | | | | 1,516 | | | | 1,597 | |
Offering costs (Note 2.G) | | | 39 | | | | 3,978 | | | | 5,630 | | | | 3,981 | |
Other | | | 6,470 | | | | 1,855 | | | | 2,045 | | | | 2,113 | |
| | | | | | | | | | | | | | | | |
Total expenses | | | 477,340 | | | | 199,353 | | | | 199,268 | | | | 204,096 | |
| | | | | | | | | | | | | | | | |
Less fee waived (Note 3.D) | | | (217,235 | ) | | | (82,629 | ) | | | (82,727 | ) | | | (86,469 | ) |
Less expense reimbursements from affiliates (Note 3.D) | | | — | | | | (83,688 | ) | | | (84,023 | ) | | | (82,430 | ) |
Less expense reimbursements from non-affiliates (Note 3.C) | | | (33,600 | ) | | | (1,800 | ) | | | (1,200 | ) | | | (2,400 | ) |
| | | | | | | | | | | | | | | | |
Net expenses | | | 226,505 | | | | 31,236 | | | | 31,318 | | | | 32,797 | |
| | | | | | | | | | | | | | | | |
Net investment income (loss) | | | 845,794 | | | | 1,000,159 | | | | 612,463 | | | | 363,689 | |
| | | | | | | | | | | | | | | | |
| | | | |
REALIZED/UNREALIZED GAINS (LOSSES): | | | | | | | | | | | | | | | | |
Net realized gain (loss) on transactions from: | | | | | | | | | | | | | | | | |
investments in non-affiliates | | | (437,078 | ) | | | (259,543 | ) | | | (96,615 | ) | | | (304,570 | ) |
In-kind redemptions in non-affiliates | | | 3,434,321 | | | | — | | | | — | | | | — | |
Futures | | | 35,583 | | | | (2,606 | ) | | | (2,021 | ) | | | — | |
| | | | | | | | | | | | | | | | |
Net realized gain (loss) | | | 3,032,826 | | | | (262,149 | ) | | | (98,636 | ) | | | (304,570 | ) |
| | | | | | | | | | | | | | | | |
Change in net unrealized appreciation/depreciation on: | | | | | | | | | | | | | | | | |
Investments in non-affiliates | | | (3,137,266 | ) | | | 33,802 | | | | 1,207,200 | | | | 1,322,058 | |
Futures | | | (40,500 | ) | | | (18,041 | ) | | | (4,248 | ) | | | — | |
| | | | | | | | | | | | | | | | |
Change in net unrealized appreciation/depreciation | | | (3,177,766 | ) | | | 15,761 | | | | 1,202,952 | | | | 1,322,058 | |
| | | | | | | | | | | | | | | | |
Net realized/unrealized gains (losses) | | | (144,940 | ) | | | (246,388 | ) | | | 1,104,316 | | | | 1,017,488 | |
| | | | | | | | | | | | | | | | |
Change in net assets resulting from operations | | $ | 700,854 | | | $ | 753,771 | | | $ | 1,716,779 | | | $ | 1,381,177 | |
| | | | | | | | | | | | | | | | |
| (a) | Commencement of operations was November 8, 2017. |
SEE NOTES TO FINANCIAL STATEMENTS.
| | | | | | | | |
| | | |
| OCTOBER 31, 2018 | | J.P. MORGAN EXCHANGE-TRADED FUNDS | | | | | 179 | |
STATEMENTS OF OPERATIONS
FOR THE PERIOD ENDED OCTOBER 31, 2018 (continued)
| | | | | | | | |
| | |
| | | JPMorgan
U.S. Quality
Factor ETF (a) | | | JPMorgan
U.S. Value
Factor ETF (a) | |
INVESTMENT INCOME: | |
Dividend income from non-affiliates | | $ | 573,279 | | | $ | 703,417 | |
Dividend income from affiliates | | | 2,036 | | | | 2,592 | |
Income from securities lending (net) | | | 29 | | | | 13 | |
| | | | | | | | |
Total investment income | | | 575,344 | | | | 706,022 | |
| | | | | | | | |
| | |
EXPENSES: | | | | | | | | |
Investment advisory fees (Note 3.A) | | | 62,075 | | | | 61,561 | |
Administration fees (Note 3.B) | | | 22,941 | | | | 22,751 | |
Professional fees | | | 49,499 | | | | 49,668 | |
Trustees’ and Chief Compliance Officer’s fees | | | 3,569 | | | | 3,567 | |
Printing and mailing costs | | | 5,641 | | | | 5,659 | |
Registration and filing fees | | | 14,997 | | | | 14,988 | |
Custodian, Accounting and Transfer Agent fees (Note 3.C) | | | 34,847 | | | | 35,875 | |
Insurance expense | | | 1,578 | | | | 1,567 | |
Offering costs (Note 2.G) | | | 3,971 | | | | 3,984 | |
Other | | | 2,024 | | | | 2,120 | |
| | | | | | | | |
Total expenses | | | 201,142 | | | | 201,740 | |
| | | | | | | | |
Less fee waived (Note 3.D) | | | (85,016 | ) | | | (84,312 | ) |
Less expense reimbursements from affiliates (Note 3.D) | | | (82,133 | ) | | | (83,455 | ) |
Less expense reimbursements from non-affiliates (Note 3.C) | | | (1,800 | ) | | | (2,100 | ) |
| | | | | | | | |
Net expenses | | | 32,193 | | | | 31,873 | |
| | | | | | | | |
Net investment income (loss) | | | 543,151 | | | | 674,149 | |
| | | | | | | | |
| | |
REALIZED/UNREALIZED GAINS (LOSSES): | | | | | | | | |
Net realized gain (loss) on transactions from: | | | | | | | | |
Investments in non-affiliates | | | (100,726 | ) | | | (146,752 | ) |
Futures | | | 3,040 | | | | 1,262 | |
| | | | | | | | |
Net realized gain (loss) | | | (97,686 | ) | | | (145,490 | ) |
| | | | | | | | |
Change in net unrealized appreciation/depreciation on: | | | | | | | | |
Investments in non-affiliates | | | 1,629,251 | | | | 295,287 | |
Futures | | | (10,682 | ) | | | (7,590 | ) |
| | | | | | | | |
Change in net unrealized appreciation/depreciation | | | 1,618,569 | | | | 287,697 | |
| | | | | | | | |
Net realized/unrealized gains (losses) | | | 1,520,883 | | | | 142,207 | |
| | | | | | | | |
Change in net assets resulting from operations | | $ | 2,064,034 | | | $ | 816,356 | |
| | | | | | | | |
| (a) | Commencement of operations was November 8, 2017. |
SEE NOTES TO FINANCIAL STATEMENTS.
| | | | | | |
| | | |
| 180 | | | | J.P. MORGAN EXCHANGE-TRADED FUNDS | | OCTOBER 31, 2018 |
STATEMENTS OF CHANGES IN NET ASSETS
FOR THE PERIODS INDICATED
| | | | | | | | | | | | | | | | |
| | | JPMorgan
BetaBuilders
Canada ETF | | | JPMorgan
BetaBuilders
Developed Asia
ex-Japan ETF | | | JPMorgan
BetaBuilders
Europe ETF | | | JPMorgan
BetaBuilders
Japan ETF | |
| | | Period Ended October 31, 2018 (a) | | | Period Ended
October 31, 2018 (a) | | | Period Ended October 31, 2018 (b) | | | Period Ended October 31, 2018 (b) | |
CHANGE IN NET ASSETS RESULTING FROM OPERATIONS: | | | | | | | | | | | | | | | | |
Net investment income (loss) | | $ | 8,081,911 | | | $ | 4,897,239 | | | $ | 4,429,007 | | | $ | 14,466,776 | |
Net realized gain (loss) | | | (1,239,799 | ) | | | (457,627 | ) | | | (5,318 | ) | | | (2,096,213 | ) |
Change in net unrealized appreciation/depreciation | | | (133,423,165 | ) | | | (59,845,937 | ) | | | (91,293,111 | ) | | | (117,813,749 | ) |
| | | | | | | | | | | | | | | | |
Change in net assets resulting from operations | | | (126,581,053 | ) | | | (55,406,325 | ) | | | (86,869,422 | ) | | | (105,443,186 | ) |
| | | | | | | | | | | | | | | | |
| | | | |
DISTRIBUTIONS TO SHAREHOLDERS: | | | | | | | | | | | | | | | | |
Distributable earnings | | | (2,945,124 | ) | | | (4,159,764 | ) | | | (1,891,512 | ) | | | — | |
| | | | | | | | | | | | | | | | |
| | | | |
CAPITAL TRANSACTIONS: | | | | | | | | | | | | | | | | |
Change in net assets resulting from capital transactions | | | 2,174,225,003 | | | | 662,880,023 | | | | 1,403,691,226 | | | | 2,441,530,853 | |
| | | | | | | | | | | | | | | | |
| | | | |
NET ASSETS: | | | | | | | | | | | | | | | | |
Change in net assets | | | 2,044,698,826 | | | | 603,313,934 | | | | 1,314,930,292 | | | | 2,336,087,667 | |
Beginning of period | | | — | | | | — | | | | — | | | | — | |
| | | | | | | | | | | | | | | | |
End of period | | $ | 2,044,698,826 | | | $ | 603,313,934 | | | $ | 1,314,930,292 | | | $ | 2,336,087,667 | |
| | | | | | | | | | | | | | | | |
| | | | |
CAPITAL SHARE TRANSACTIONS: | | | | | | | | | | | | | | | | |
Proceeds from shares issued | | $ | 2,219,440,596 | | | $ | 662,880,023 | | | $ | 1,403,691,226 | | | $ | 2,441,530,853 | |
Cost of shares redeemed | | | (45,215,593 | ) | | | — | | | | — | | | | — | |
| | | | | | | | | | | | | | | | |
Total change in net assets resulting from capital transactions | | $ | 2,174,225,003 | | | $ | 662,880,023 | | | $ | 1,403,691,226 | | | $ | 2,441,530,853 | |
| | | | | | | | | | | | | | | | |
| | | | |
SHARE TRANSACTIONS: | | | | | | | | | | | | | | | | |
Issued | | | 92,400,000 | | | | 26,600,000 | | | | 58,200,000 | | | | 102,800,000 | |
Redeemed | | | (1,900,000 | ) | | | — | | | | — | | | | — | |
| | | | | | | | | | | | | | | | |
Net increase in shares from share transactions | | | 90,500,000 | | | | 26,600,000 | | | | 58,200,000 | | | | 102,800,000 | |
| | | | | | | | | | | | | | | | |
| (a) | Commencement of operations was August 7, 2018. |
| (b) | Commencement of operations was June 15, 2018. |
SEE NOTES TO FINANCIAL STATEMENTS.
| | | | | | | | |
| | | |
| OCTOBER 31, 2018 | | J.P. MORGAN EXCHANGE-TRADED FUNDS | | | | | 181 | |
STATEMENTS OF CHANGES IN NET ASSETS
FOR THE PERIODS INDICATED (continued)
| | | | | | | | | | | | | | | | |
| | |
JPMorgan Diversified Return Emerging
Markets Equity ETF | | | JPMorgan Diversified Return
Europe Currency Hedged ETF | |
| | | Year Ended
October 31, 2018 | | | Year Ended
October 31, 2017 | | | Year Ended
October 31, 2018 | | | Year Ended
October 31, 2017 | |
CHANGE IN NET ASSETS RESULTING FROM OPERATIONS: | | | | | | | | | | | | | | | | |
Net investment income (loss) | | $ | 5,819,759 | | | $ | 3,452,670 | | | $ | 1,482,128 | | | $ | 644,580 | |
Net realized gain (loss) | | | (4,278,249 | ) | | | 1,036,538 | | | | 1,533,598 | | | | (771,406 | ) |
Change in net unrealized appreciation/depreciation | | | (22,751,387 | ) | | | 19,206,880 | | | | (3,977,718 | ) | | | 5,441,723 | |
| | | | | | | | | | | | | | | | |
Change in net assets resulting from operations | | | (21,209,877 | ) | | | 23,696,088 | | | | (961,992 | ) | | | 5,314,897 | |
| | | | | | | | | | | | | | | | |
| | | | |
DISTRIBUTIONS TO SHAREHOLDERS: | | | | | | | | | | | | | | | | |
Distributable earnings (a) | | | (8,601,176 | ) | | | (771,056 | ) | | | (851,015 | ) | | | (2,340,720 | ) |
| | | | | | | | | | | | | | | | |
| | | | |
CAPITAL TRANSACTIONS: | | | | | | | | | | | | | | | | |
Change in net assets resulting from capital transactions | | | 77,874,259 | | | | 99,006,553 | | | | — | | | | 1,249,800 | |
| | | | | | | | | | | | | | | | |
| | | | |
NET ASSETS: | | | | | | | | | | | | | | | | |
Change in net assets | | | 48,063,206 | | | | 121,931,585 | | | | (1,813,007 | ) | | | 4,223,977 | |
Beginning of period | | | 165,741,046 | | | | 43,809,461 | | | | 30,707,245 | | | | 26,483,268 | |
| | | | | | | | | | | | | | | | |
End of period | | $ | 213,804,252 | | | $ | 165,741,046 | | | $ | 28,894,238 | | | $ | 30,707,245 | |
| | | | | | | | | | | | | | | | |
| | | | |
CAPITAL SHARE TRANSACTIONS: | | | | | | | | | | | | | | | | |
Proceeds from shares issued | | $ | 77,874,259 | | | $ | 99,006,553 | | | $ | — | | | $ | 1,249,800 | |
| | | | | | | | | | | | | | | | |
Total change in net assets resulting from capital transactions | | $ | 77,874,259 | | | $ | 99,006,553 | | | $ | — | | | $ | 1,249,800 | |
| | | | | | | | | | | | | | | | |
| | | | |
SHARE TRANSACTIONS: | | | | | | | | | | | | | | | | |
Issued | | | 1,300,000 | | | | 2,000,000 | | | | — | | | | 50,000 | |
| | | | | | | | | | | | | | | | |
Net increase in shares from share transactions | | | 1,300,000 | | | | 2,000,000 | | | | — | | | | 50,000 | |
| | | | | | | | | | | | | | | | |
| (a) | The prior period distributions have been reclassified to conform to current period presentation for the adoption of the Securities and Exchange Commission’s Disclosure Update and Simplification Rule. See Note 8. Prior periods balances were as follows: |
| | | | | | | | |
| | | JPMorgan Diversified
Return Emerging Markets
Equity ETF | | | JPMorgan Diversified
Return Europe Currency
Hedged ETF | |
From net investment income | | | (771,056 | ) | | | (534,400 | ) |
From net realized gains | | | — | | | | (1,806,320 | ) |
SEE NOTES TO FINANCIAL STATEMENTS.
| | | | | | |
| | | |
| 182 | | | | J.P. MORGAN EXCHANGE-TRADED FUNDS | | OCTOBER 31, 2018 |
| | | | | | | | | | | | | | | | |
| | |
JPMorgan Diversified Return
Europe Equity ETF | | | JPMorgan Diversified Return
Global Equity ETF | |
| | | Year Ended
October 31, 2018 | | | Year Ended
October 31, 2017 | | | Year Ended
October 31, 2018 | | | Year Ended
October 31, 2017 | |
CHANGE IN NET ASSETS RESULTING FROM OPERATIONS: | | | | | | | | | | | | | | | | |
Net investment income (loss) | | $ | 2,214,736 | | | $ | 1,886,817 | | | $ | 4,574,724 | | | $ | 1,650,745 | |
Net realized gain (loss) | | | 2,599,003 | | | | (62,703 | ) | | | 1,039,948 | | | | 2,538,682 | |
Change in net unrealized appreciation/depreciation | | | (11,434,565 | ) | | | 13,101,894 | | | | (17,420,873 | ) | | | 10,668,551 | |
| | | | | | | | | | | | | | | | |
Change in net assets resulting from operations | | | (6,620,826 | ) | | | 14,926,008 | | | | (11,806,201 | ) | | | 14,857,978 | |
| | | | | | | | | | | | | | | | |
| | | | |
DISTRIBUTIONS TO SHAREHOLDERS: | | | | | | | | | | | | | | | | |
Distributable earnings (a) | | | (4,014,806 | ) | | | (1,338,720 | ) | | | (5,818,989 | ) | | | (1,695,420 | ) |
| | | | | | | | | | | | | | | | |
| | | | |
CAPITAL TRANSACTIONS: | | | | | | | | | | | | | | | | |
Change in net assets resulting from capital transactions | | | 5,964,063 | | | | 6,045,436 | | | | 117,387,384 | | | | 12,975,579 | |
| | | | | | | | | | | | | | | | |
| | | | |
NET ASSETS: | | | | | | | | | | | | | | | | |
Change in net assets | | | (4,671,569 | ) | | | 19,632,724 | | | | 99,762,194 | | | | 26,138,137 | |
Beginning of period | | | 79,492,357 | | | | 59,859,633 | | | | 103,695,070 | | | | 77,556,933 | |
| | | | | | | | | | | | | | | | |
End of period | | $ | 74,820,788 | | | $ | 79,492,357 | | | $ | 203,457,264 | | | $ | 103,695,070 | |
| | | | | | | | | | | | | | | | |
| | | | |
CAPITAL SHARE TRANSACTIONS: | | | | | | | | | | | | | | | | |
Proceeds from shares issued | | $ | 17,683,797 | | | $ | 6,045,436 | | | $ | 154,127,556 | | | $ | 23,855,987 | |
Cost of shares redeemed | | | (11,719,734 | ) | | | — | | | | (36,740,172 | ) | | | (10,880,408 | ) |
| | | | | | | | | | | | | | | | |
Total change in net assets resulting from capital transactions | | $ | 5,964,063 | | | $ | 6,045,436 | | | $ | 117,387,384 | | | $ | 12,975,579 | |
| | | | | | | | | | | | | | | | |
| | | | |
SHARE TRANSACTIONS: | | | | | | | | | | | | | | | | |
Issued | | | 300,000 | | | | 100,000 | | | | 2,500,000 | | | | 400,000 | |
Redeemed | | | (200,000 | ) | | | — | | | | (600,000 | ) | | | (200,000 | ) |
| | | | | | | | | | | | | | | | |
Net increase in shares from share transactions | | | 100,000 | | | | 100,000 | | | | 1,900,000 | | | | 200,000 | |
| | | | | | | | | | | | | | | | |
| (a) | The prior period distributions have been reclassified to conform to current period presentation for the adoption of the Securities and Exchange Commission’s Disclosure Update and Simplification Rule. See Note 8. Prior periods balances were as follows: |
| | | | | | | | |
| | | JPMorgan Diversified
Return Europe
Equity ETF | | | JPMorgan Diversified
Return Global
Equity ETF | |
From net investment income | | | (1,338,720 | ) | | | (1,695,420 | ) |
SEE NOTES TO FINANCIAL STATEMENTS.
| | | | | | | | |
| | | |
| OCTOBER 31, 2018 | | J.P. MORGAN EXCHANGE-TRADED FUNDS | | | | | 183 | |
STATEMENTS OF CHANGES IN NET ASSETS
FOR THE PERIODS INDICATED (continued)
| | | | | | | | | | | | | | | | |
| | |
JPMorgan Diversified Return International
Currency Hedged ETF | | | JPMorgan Diversified Return
International Equity ETF | |
| | | Year Ended
October 31, 2018 | | | Year Ended
October 31, 2017 | | | Year Ended
October 31, 2018 | | | Year Ended
October 31, 2017 | |
CHANGE IN NET ASSETS RESULTING FROM OPERATIONS: | | | | | | | | | | | | | | | | |
Net investment income (loss) | | $ | 1,555,195 | | | $ | 519,793 | | | $ | 37,201,171 | | | $ | 20,245,953 | |
Net realized gain (loss) | | | 3,410,421 | | | | (117,698 | ) | | | 11,476,505 | | | | 172,051 | |
Change in net unrealized appreciation/depreciation | | | (5,856,329 | ) | | | 6,562,751 | | | | (167,979,171 | ) | | | 123,143,744 | |
| | | | | | | | | | | | | | | | |
Change in net assets resulting from operations | | | (890,713 | ) | | | 6,964,846 | | | | (119,301,495 | ) | | | 143,561,748 | |
| | | | | | | | | | | | | | | | |
| | | | |
DISTRIBUTIONS TO SHAREHOLDERS: | | | | | | | | | | | | | | | | |
Distributable earnings (a) | | | (1,022,148 | ) | | | (1,349,535 | ) | | | (54,092,274 | ) | | | (9,230,405 | ) |
| | | | | | | | | | | | | | | | |
| | | | |
CAPITAL TRANSACTIONS: | | | | | | | | | | | | | | | | |
Change in net assets resulting from capital transactions | | | (14,994,818 | ) | | | 16,343,042 | | | | 457,839,024 | | | | 555,512,947 | |
| | | | | | | | | | | | | | | | |
| | | | |
NET ASSETS: | | | | | | | | | | | | | | | | |
Change in net assets | | | (16,907,679 | ) | | | 21,958,353 | | | | 284,445,255 | | | | 689,844,290 | |
Beginning of period | | | 48,274,467 | | | | 26,316,114 | | | | 1,159,887,006 | | | | 470,042,716 | |
| | | | | | | | | | | | | | | | |
End of period | | $ | 31,366,788 | | | $ | 48,274,467 | | | $ | 1,444,332,261 | | | $ | 1,159,887,006 | |
| | | | | | | | | | | | | | | | |
CAPITAL SHARE TRANSACTIONS: | | | | | | | | | | | | | | | | |
Proceeds from shares issued | | $ | — | | | $ | 16,343,042 | | | $ | 530,366,203 | | | $ | 581,072,027 | |
Cost of shares redeemed | | | (14,994,818 | ) | | | — | | | | (72,527,179 | ) | | | (25,559,080 | ) |
| | | | | | | | | | | | | | | | |
Total change in net assets resulting from capital transactions | | $ | (14,994,818 | ) | | $ | 16,343,042 | | | $ | 457,839,024 | | | $ | 555,512,947 | |
| | | | | | | | | | | | | | | | |
| | | | |
SHARE TRANSACTIONS: | | | | | | | | | | | | | | | | |
Issued | | | — | | | | 600,000 | | | | 8,900,000 | | | | 10,700,000 | |
Redeemed | | | (500,000 | ) | | | — | | | | (1,300,000 | ) | | | (500,000 | ) |
| | | | | | | | | | | | | | | | |
Net increase in shares from share transactions | | | (500,000 | ) | | | 600,000 | | | | 7,600,000 | | | | 10,200,000 | |
| | | | | | | | | | | | | | | | |
| (a) | The prior period distributions have been reclassified to conform to current period presentation for the adoption of the Securities and Exchange Commission’s Disclosure Update and Simplification Rule. See Note 8. Prior periods balances were as follows: |
| | | | | | | | |
| | | JPMorgan Diversified
Return International Currency
Hedged Equity ETF | | | JPMorgan Diversified
Return International
Equity ETF | |
From net investment income | | | (431,255 | ) | | | (9,230,405 | ) |
From net realized gains | | | (918,280 | ) | | | — | |
SEE NOTES TO FINANCIAL STATEMENTS.
| | | | | | |
| | | |
| 184 | | | | J.P. MORGAN EXCHANGE-TRADED FUNDS | | OCTOBER 31, 2018 |
| | | | | | | | | | | | | | | | |
| | |
JPMorgan Diversified Return
U.S. Equity ETF | | | JPMorgan Diversified Return U.S.
Mid Cap Equity ETF | |
| | | Year Ended
October 31, 2018 | | | Year Ended
October 31, 2017 | | | Year Ended
October 31, 2018 | | | Year Ended
October 31, 2017 | |
CHANGE IN NET ASSETS RESULTING FROM OPERATIONS: | | | | | | | | | | | | | | | | |
Net investment income (loss) | | $ | 9,698,233 | | | $ | 4,296,175 | | | $ | 1,609,625 | | | $ | 824,382 | |
Net realized gain (loss) | | | 937,055 | | | | 9,029,074 | | | | 1,365,158 | | | | 3,575,389 | |
Change in net unrealized appreciation/depreciation | | | 5,530,137 | | | | 28,000,601 | | | | (1,296,856 | ) | | | 5,506,350 | |
| | | | | | | | | | | | | | | | |
Change in net assets resulting from operations | | | 16,165,425 | | | | 41,325,850 | | | | 1,677,927 | | | | 9,906,121 | |
| | | | | | | | | | | | | | | | |
| | | | |
DISTRIBUTIONS TO SHAREHOLDERS: | | | | | | | | | | | | | | | | |
Distributable earnings (a) | | | (12,462,949 | ) | | | (1,329,650 | ) | | | (2,149,261 | ) | | | (396,160 | ) |
| | | | | | | | | | | | | | | | |
| | | | |
CAPITAL TRANSACTIONS: | | | | | | | | | | | | | | | | |
Change in net assets resulting from capital transactions | | | 199,361,082 | | | | 190,764,313 | | | | 50,436,264 | | | | 16,399,401 | |
| | | | | | | | | | | | | | | | |
| | | | |
NET ASSETS: | | | | | | | | | | | | | | | | |
Change in net assets | | | 203,063,558 | | | | 230,760,513 | | | | 49,964,930 | | | | 25,909,362 | |
Beginning of period | | | 356,298,771 | | | | 125,538,258 | | | | 62,063,250 | | | | 36,153,888 | |
| | | | | | | | | | | | | | | | |
End of period | | $ | 559,362,329 | | | $ | 356,298,771 | | | $ | 112,028,180 | | | $ | 62,063,250 | |
| | | | | | | | | | | | | | | | |
| | | | |
CAPITAL SHARE TRANSACTIONS: | | | | | | | | | | | | | | | | |
Proceeds from shares issued | | $ | 206,369,804 | | | $ | 266,609,754 | | | $ | 57,240,549 | | | $ | 34,787,448 | |
Cost of shares redeemed | | | (7,008,722 | ) | | | (75,845,441 | ) | | | (6,804,285 | ) | | | (18,388,047 | ) |
| | | | | | | | | | | | | | | | |
Total change in net assets resulting from capital transactions | | $ | 199,361,082 | | | $ | 190,764,313 | | | $ | 50,436,264 | | | $ | 16,399,401 | |
| | | | | | | | | | | | | | | | |
| | | | |
SHARE TRANSACTIONS: | | | | | | | | | | | | | | | | |
Issued | | | 2,900,000 | | | | 4,200,000 | | | | 900,000 | | | | 600,000 | |
Redeemed | | | (100,000 | ) | | | (1,200,000 | ) | | | (100,000 | ) | | | (300,000 | ) |
| | | | | | | | | | | | | | | | |
Net increase in shares from share transactions | | | 2,800,000 | | | | 3,000,000 | | | | 800,000 | | | | 300,000 | |
| | | | | | | | | | | | | | | | |
| (a) | The prior period distributions have been reclassified to conform to current period presentation for the adoption of the Securities and Exchange Commission’s Disclosure Update and Simplification Rule. See Note 8. Prior periods balances were as follows: |
| | | | | | | | |
| | | JPMorgan Diversified
Return U.S.
Equity ETF | | | JPMorgan Diversified
Return U.S. Mid Cap
Equity ETF | |
From net investment income | | | (1,329,650 | ) | | | (396,160 | ) |
SEE NOTES TO FINANCIAL STATEMENTS.
| | | | | | | | |
| | | |
| OCTOBER 31, 2018 | | J.P. MORGAN EXCHANGE-TRADED FUNDS | | | | | 185 | |
STATEMENTS OF CHANGES IN NET ASSETS
FOR THE PERIODS INDICATED (continued)
| | | | | | | | | | | | |
| | |
JPMorgan Diversified Return U.S.
Small Cap Equity ETF | | | JPMorgan U.S.
Dividend ETF | |
| | | Year Ended
October 31, 2018 | | | Period Ended
October 31, 2017 (a) | | | Period Ended
October 31, 2018 (b) | |
CHANGE IN NET ASSETS RESULTING FROM OPERATIONS: | |
Net investment income (loss) | | $ | 845,794 | | | $ | 338,470 | | | $ | 1,000,159 | |
Net realized gain (loss) | | | 3,032,826 | | | | (295,108 | ) | | | (262,149 | ) |
Change in net unrealized appreciation/depreciation | | | (3,177,766 | ) | | | 4,703,373 | | | | 15,761 | |
| | | | | | | | | | | | |
Change in net assets resulting from operations | | | 700,854 | | | | 4,746,735 | | | | 753,771 | |
| | | | | | | | | | | | |
| | | |
DISTRIBUTIONS TO SHAREHOLDERS: | | | | | | | | | | | | |
Distributable earnings (c) | | | (1,058,143 | ) | | | (36,680 | ) | | | (908,996 | ) |
| | | | | | | | | | | | |
| | | |
CAPITAL TRANSACTIONS: | | | | | | | | | | | | |
Change in net assets resulting from capital transactions | | | 41,481,438 | | | | 50,301,050 | | | | 27,566,351 | |
| | | | | | | | | | | | |
| | | |
NET ASSETS: | | | | | | | | | | | | |
Change in net assets | | | 41,124,149 | | | | 55,011,105 | | | | 27,411,126 | |
Beginning of period | | | 55,011,105 | | | | — | | | | — | |
| | | | | | | | | | | | |
End of period | | $ | 96,135,254 | | | $ | 55,011,105 | | | $ | 27,411,126 | |
| | | | | | | | | | | | |
| | | |
CAPITAL SHARE TRANSACTIONS: | | | | | | | | | | | | |
Proceeds from shares issued | | $ | 51,393,702 | | | $ | 50,301,050 | | | $ | 27,566,351 | |
Cost of shares redeemed | | | (9,912,264 | ) | | | — | | | | — | |
| | | | | | | | | | | | |
Total change in net assets resulting from capital transactions | | $ | 41,481,438 | | | $ | 50,301,050 | | | $ | 27,566,351 | |
| | | | | | | | | | | | |
| | | |
SHARE TRANSACTIONS: | | | | | | | | | | | | |
Issued | | | 1,650,000 | | | | 1,900,000 | | | | 1,100,000 | |
Redeemed | | | (300,000 | ) | | | — | | | | — | |
| | | | | | | | | | | | |
Net increase in shares from share transactions | | | 1,350,000 | | | | 1,900,000 | | | | 1,100,000 | |
| | | | | | | | | | | | |
| (a) | Commencement of operations was November 15, 2016. |
| (b) | Commencement of operations was November 8, 2017. |
| (c) | The prior period distributions have been reclassified to conform to current period presentation for the adoption of the Securities and Exchange Commission’s Disclosure Update and Simplification Rule. See Note 8. Prior periods balances were as follows: |
| | | | |
| | | JPMorgan Diversified
Return U.S. Small Cap
Equity ETF | |
From net investment income | | | (36,680 | ) |
SEE NOTES TO FINANCIAL STATEMENTS.
| | | | | | |
| | | |
| 186 | | | | J.P. MORGAN EXCHANGE-TRADED FUNDS | | OCTOBER 31, 2018 |
| | | | | | | | |
| | |
JPMorgan U.S. Minimum
Volatility ETF | | | JPMorgan U.S. Momentum
Factor ETF | |
| | | Period Ended October 31, 2018 (a) | | | Period Ended October 31, 2018 (a) | |
CHANGE IN NET ASSETS RESULTING FROM OPERATIONS: | | | | | | | | |
Net investment income (loss) | | $ | 612,463 | | | $ | 363,689 | |
Net realized gain (loss) | | | (98,636 | ) | | | (304,570 | ) |
Change in net unrealized appreciation/depreciation | | | 1,202,952 | | | | 1,322,058 | |
| | | | | | | | |
Change in net assets resulting from operations | | | 1,716,779 | | | | 1,381,177 | |
| | | | | | | | |
| | |
DISTRIBUTIONS TO SHAREHOLDERS: | | | | | | | | |
Distributable earnings | | | (549,553 | ) | | | (338,121 | ) |
| | | | | | | | |
| | |
CAPITAL TRANSACTIONS: | | | | | | | | |
Change in net assets resulting from capital transactions | | | 26,278,544 | | | | 27,532,314 | |
| | | | | | | | |
| | |
NET ASSETS: | | | | | | | | |
Change in net assets | | | 27,445,770 | | | | 28,575,370 | |
Beginning of period | | | — | | | | — | |
| | | | | | | | |
End of period | | $ | 27,445,770 | | | $ | 28,575,370 | |
| | | | | | | | |
| | |
CAPITAL SHARE TRANSACTIONS: | | | | | | | | |
Proceeds from shares issued | | $ | 26,278,544 | | | $ | 27,532,314 | |
| | | | | | | | |
Total change in net assets resulting from capital transactions | | $ | 26,278,544 | | | $ | 27,532,314 | |
| | | | | | | | |
| | |
SHARE TRANSACTIONS: | | | | | | | | |
Issued | | | 1,050,000 | | | | 1,100,000 | |
| | | | | | | | |
Net increase in shares from share transactions | | | 1,050,000 | | | | 1,100,000 | |
| | | | | | | | |
| (a) | Commencement of operations was November 8, 2017. |
SEE NOTES TO FINANCIAL STATEMENTS.
| | | | | | | | |
| | | |
| OCTOBER 31, 2018 | | J.P. MORGAN EXCHANGE-TRADED FUNDS | | | | | 187 | |
STATEMENTS OF CHANGES IN NET ASSETS
FOR THE PERIODS INDICATED (continued)
| | | | | | | | |
| | |
JPMorgan U.S. Quality
Factor ETF | | | JPMorgan U.S. Value
Factor ETF | |
| | | Period Ended October 31, 2018 (a) | | | Period Ended October 31, 2018 (a) | |
CHANGE IN NET ASSETS RESULTING FROM OPERATIONS: | |
Net investment income (loss) | | $ | 543,151 | | | $ | 674,149 | |
Net realized gain (loss) | | | (97,686 | ) | | | (145,490 | ) |
Change in net unrealized appreciation/depreciation | | | 1,618,569 | | | | 287,697 | |
| | | | | | | | |
Change in net assets resulting from operations | | | 2,064,034 | | | | 816,356 | |
| | | | | | | | |
| | |
DISTRIBUTIONS TO SHAREHOLDERS: | | | | | | | | |
Distributable earnings | | | (496,228 | ) | | | (616,329 | ) |
| | | | | | | | |
| | |
CAPITAL TRANSACTIONS: | | | | | | | | |
Change in net assets resulting from capital transactions | | | 27,647,461 | | | | 28,786,482 | |
| | | | | | | | |
| | |
NET ASSETS: | | | | | | | | |
Change in net assets | | | 29,215,267 | | | | 28,986,509 | |
Beginning of period | | | — | | | | — | |
| | | | | | | | |
End of period | | $ | 29,215,267 | | | $ | 28,986,509 | |
| | | | | | | | |
| | |
CAPITAL SHARE TRANSACTIONS: | | | | | | | | |
Proceeds from shares issued | | $ | 27,647,461 | | | $ | 28,786,482 | |
| | | | | | | | |
Total change in net assets resulting from capital transactions | | $ | 27,647,461 | | | $ | 28,786,482 | |
| | | | | | | | |
| | |
SHARE TRANSACTIONS: | | | | | | | | |
Issued | | | 1,100,000 | | | | 1,150,000 | |
| | | | | | | | |
Net increase in shares from share transactions | | | 1,100,000 | | | | 1,150,000 | |
| | | | | | | | |
| (a) | Commencement of operations was November 8, 2017 |
SEE NOTES TO FINANCIAL STATEMENTS.
| | | | | | |
| | | |
| 188 | | | | J.P. MORGAN EXCHANGE-TRADED FUNDS | | OCTOBER 31, 2018 |
THIS PAGE IS INTENTIONALLY LEFT BLANK
| | | | | | | | |
| | | |
| OCTOBER 31, 2018 | | J.P. MORGAN EXCHANGE-TRADED FUNDS | | | | | 189 | |
FINANCIAL HIGHLIGHTS
FOR THE PERIODS INDICATED
| | | | | | | | | | | | | | | | | | | | | | | | |
| | | Per share operating performance | |
| | | | | | Investment operations | | | Distributions | |
| | | Net asset
value,
beginning
of period | | | Net
investment
income
(loss) (b) | | | Net realized
and unrealized
gains
(losses) on
investments | | | Total from
investment
operations | | | Net
investment
income | | | Total
distributions | |
JPMorgan BetaBuilders Canada ETF | | | | | | | | | | | | | | | | | | | | | | | | |
August 7, 2018 (a) through October 31, 2018 | | $ | 24.65 | | | $ | 0.14 | | | $ | (2.15 | ) | | $ | (2.01 | ) | | $ | (0.05 | ) | | $ | (0.05 | ) |
| | | | | | |
JPMorgan BetaBuilders Developed Asia ex-Japan ETF | | | | | | | | | | | | | | | | | | | | | | | | |
August 7, 2018 (a) through October 31, 2018 | | | 25.36 | | | | 0.22 | | | | (2.73 | ) | | | (2.51 | ) | | | (0.17 | ) | | | (0.17 | ) |
| | | | | | |
JPMorgan BetaBuilders Europe ETF | | | | | | | | | | | | | | | | | | | | | | | | |
June 15, 2018 (a) through October 31, 2018 | | | 24.79 | | | | 0.13 | | | | (2.30 | ) | | | (2.17 | ) | | | (0.03 | ) | | | (0.03 | ) |
| | | | | | |
JPMorgan BetaBuilders Japan ETF | | | | | | | | | | | | | | | | | | | | | | | | |
June 15, 2018 (a) through October 31, 2018 | | | 24.79 | | | | 0.24 | | | | (2.31 | ) | | | (2.07 | ) | | | — | | | | — | |
| (a) | Commencement of operations. |
| (b) | Calculated based upon average shares outstanding. |
| (c) | Not annualized for periods less than one year. |
| (d) | Includes adjustments in accordance with accounting principles generally accepted in the United States of America and as such, the net asset values for financial reporting purposes and the returns based upon those net asset values may differ from the net asset values and returns for shareholder transactions. |
| (e) | Market price total return is calculated assuming an initial investment made at the beginning of the period market price, reinvestment of all dividends and distributions at market price during the period, and sale at the market price on the last day of the period. The market price presented to calculate the market price total return is the mid-point of the bid/ask spread at the close of business on the Cboe BZX Exchange, Inc. Since the Shares of the Fund did not trade in the secondary market until the day after the Fund’s inception, for the period from the inception to the first day of secondary market trading, the NAV is used as a proxy for the secondary market trading price to calculate the market returns. |
| (f) | Annualized for periods less than one year, unless otherwise indicated. |
| (g) | Certain non-recurring expenses incurred by the Fund were not annualized for the periods indicated. |
SEE NOTES TO FINANCIAL STATEMENTS.
| | | | | | |
| | | |
| 190 | | | | J.P. MORGAN EXCHANGE-TRADED FUNDS | | OCTOBER 31, 2018 |
| | | | | | | | | | | | | | | | | | | | | | | | | | | | | | | | | | |
| | | Ratios/Supplemental data | |
| | | | | | | | | | | | | | | | Ratios to average net assets (f) | | | | |
Net asset
value,
end of
period | | | Market
price,
end of
period | | | Total
return (c)(d) | | | Market
price
total
return (c)(e) | | | Net assets,
end of
period | | | Net
expenses | | | Net
investment
income
(loss) | | | Expenses
without waivers
and reimbursements | | | Portfolio
turnover
rate (c) | |
| | | | | | | | | | | | | | | | | | | | | | | | | | | | | | | | | | |
| | | | | | | | | | | | | | | | | | | | | | | | | | | | | | | | | | |
| $ | 22.59 | | | $ | 22.62 | | | | (8.18 | )% | | | (8.05 | )% | | $ | 2,044,698,826 | | | | 0.19 | %(g) | | | 2.55 | % | | | 0.37 | %(g) | | | 1 | % |
| | | | | | | | |
| | | | | | | | | | | | | | | | | | | | | | | | | | | | | | | | | | |
| | 22.68 | | | | 22.69 | | | | (9.97 | ) | | | (9.93 | ) | | | 603,313,934 | | | | 0.19 | (g) | | | 3.94 | | | | 0.45 | (g) | | | 2 | |
| | | | | | | | |
| | | | | | | | | | | | | | | | | | | | | | | | | | | | | | | | | | |
| | 22.59 | | | | 22.64 | | | | (8.75 | ) | | | (8.55 | ) | | | 1,314,930,292 | | | | 0.09 | (g) | | | 1.45 | | | | 0.34 | (g) | | | 2 | |
| | | | | | | | |
| | | | | | | | | | | | | | | | | | | | | | | | | | | | | | | | | | |
| | 22.72 | | | | 22.68 | | | | (8.35 | ) | | | (8.51 | ) | | | 2,336,087,667 | | | | 0.19 | (g) | | | 2.63 | | | | 0.37 | (g) | | | 5 | |
SEE NOTES TO FINANCIAL STATEMENTS.
| | | | | | | | |
| | | |
| OCTOBER 31, 2018 | | J.P. MORGAN EXCHANGE-TRADED FUNDS | | | | | 191 | |
FINANCIAL HIGHLIGHTS
FOR THE PERIODS INDICATED (continued)
| | | | | | | | | | | | | | | | | | | | | | | | | | | | |
| | | Per share operating performance | |
| | | | | | Investment operations | | | Distributions | |
| | | Net asset
value,
beginning
of period | | | Net
investment
income
(loss) (b) | | | Net realized
and unrealized
gains
(losses) on
investments | | | Total from
investment
operations | | | Net
Investment
Income | | | Net
realized
gain (loss) | | | Total
distributions | |
JPMorgan Diversified Return Emerging Markets Equity ETF | | | | | | | | | | | | | | | | | | | | | | | | | | | | |
Year Ended October 31, 2018 | | $ | 57.15 | | | $ | 1.59 | | | $ | (5.37 | ) | | $ | (3.78 | ) | | $ | (2.46 | ) | | $ | — | | | $ | (2.46 | ) |
Year Ended October 31, 2017 | | | 48.68 | | | | 1.50 | | | | 7.56 | | | | 9.06 | | | | (0.59 | ) | | | — | | | | (0.59 | ) |
Year Ended October 31, 2016 | | | 45.23 | | | | 1.04 | | | | 3.72 | | | | 4.76 | | | | (1.31 | ) | | | — | | | | (1.31 | ) |
January 7, 2015 (a) through October 31, 2015 | | | 50.00 | | | | 1.29 | | | | (6.06 | ) | | | (4.77 | ) | | | — | | | | — | | | | — | |
| | | | | | | |
JPMorgan Diversified Return Europe Currency Hedged ETF | | | | | | | | | | | | | | | | | | | | | | | | | | | | |
Year Ended October 31, 2018 | | | 29.24 | | | | 1.41 | (c) | | | (2.32 | ) | | | (0.91 | ) | | | (0.81 | ) | | | — | | | | (0.81 | ) |
Year Ended October 31, 2017 | | | 26.48 | | | | 0.62 | (c)(k) | | | 4.48 | | | | 5.10 | | | | (0.53 | ) | | | (1.81 | ) | | | (2.34 | ) |
April 1, 2016 (a) through October 31, 2016 | | | 25.00 | | | | (0.07 | )(c) | | | 1.55 | | | | 1.48 | | | | — | | | | — | | | | — | |
| | | | | | | |
JPMorgan Diversified Return Europe Equity ETF | | | | | | | | | | | | | | | | | | | | | | | | | | | | |
Year Ended October 31, 2018 | | | 61.15 | | | | 1.65 | | | | (6.36 | ) | | | (4.71 | ) | | | (3.00 | ) | | | — | | | | (3.00 | ) |
Year Ended October 31, 2017 | | | 49.88 | | | | 1.57 | | | | 10.82 | | | | 12.39 | | | | (1.12 | ) | | | — | | | | (1.12 | ) |
December 18, 2015 (a) through October 31, 2016 | | | 50.00 | | | | 1.39 | | | | (1.51 | ) | | | (0.12 | ) | | | — | (j) | | | — | | | | — | (j) |
| | | | | | | |
JPMorgan Diversified Return Global Equity ETF | | | | | | | | | | | | | | | | | | | | | | | | | | | | |
Year Ended October 31, 2018 | | | 61.00 | | | | 1.42 | | | | (3.93 | ) | | | (2.51 | ) | | | (1.97 | ) | | | — | | | | (1.97 | ) |
Year Ended October 31, 2017 | | | 51.70 | | | | 1.15 | | | | 9.28 | | | | 10.43 | | | | (1.13 | ) | | | — | | | | (1.13 | ) |
Year Ended October 31, 2016 | | | 50.53 | | | | 1.14 | | | | 0.99 | | | | 2.13 | | | | (0.96 | ) | | | — | | | | (0.96 | ) |
Year Ended October 31, 2015 | | | 49.69 | | | | 1.08 | | | | 0.08 | | | | 1.16 | | | | (0.32 | ) | | | — | | | | (0.32 | ) |
June 16, 2014 (a) through October 31, 2014 | | | 50.00 | | | | 0.38 | | | | (0.69 | ) | | | (0.31 | ) | | | — | | | | — | | | | — | |
| (a) | Commencement of operations. |
| (b) | Calculated based upon average shares outstanding. |
| (c) | Net investment income (loss) is affected by the timing of distributions from underlying funds. |
| (d) | Not annualized for periods less than one year. |
| (e) | Includes adjustments in accordance with accounting principles generally accepted in the United States of America and as such, the net asset values for financial reporting purposes and the returns based upon those net asset values may differ from the net asset values and returns for shareholder transactions. |
| (f) | Market price total return is calculated assuming an initial investment made at the beginning of the period market price, reinvestment of all dividends and distributions at market price during the period, and sale at the market price on the last day of the period. The market price presented to calculate the market price total return is the mid-point of the bid/ask spread at the close of business on the NYSE Arca, Inc. Since the Shares of the Fund did not trade in the secondary market until the day after the Fund’s inception, for the period from the inception to the first day of secondary market trading, the NAV is used as a proxy for the secondary market trading price to calculate the market returns. |
| (g) | Annualized for periods less than one year, unless otherwise indicated. |
| (h) | Certain non-recurring expenses incurred by the Fund were not annualized for the periods indicated. |
| (i) | Does not include expenses of underlying funds. |
| (j) | Amount rounds to less than $0.005. |
| (k) | Amount reflects an out of period adjustment related to an expense reimbursement for acquired fund fees. Had the Fund not recorded the out of period adjustment, the net investment income (loss) per share would have been $0.56, the net investment income (loss) ratio would have been 2.10%, the net expense ratio would have been 0.07%, and the total return would have been 20.66%. |
SEE NOTES TO FINANCIAL STATEMENTS.
| | | | | | |
| | | |
| 192 | | | | J.P. MORGAN EXCHANGE-TRADED FUNDS | | OCTOBER 31, 2018 |
| | | | | | | | | | | | | | | | | | | | | | | | | | | | | | | | | | |
| | | Ratios/Supplemental data | |
| | | | | | | | | | | | | | | | Ratios to average net assets (g) | | | | |
Net asset
value,
end of
period | | | Market
price,
end of
period | | | Total
return (d)(e) | | | Market
price
total
return (d)(f) | | | Net assets, end of
period | | | Net
expenses | | | Net
investment
income
(loss) | | | Expenses
without waivers
and reimbursements | | | Portfolio
turnover
rate (d) | |
| | | | | | | | | | | | | | | | | | | | | | | | | | | | | | | | | | |
| $ | 50.91 | | | $ | 50.83 | | | | (6.93 | )% | | | (7.43 | )% | | $ | 213,804,252 | | | | 0.45 | % | | | 2.80 | % | | | 0.96 | % | | | 53 | % |
| | 57.15 | | | | 57.36 | | | | 18.95 | | | | 18.65 | | | | 165,741,046 | | | | 0.45 | | | | 2.85 | | | | 1.06 | | | | 60 | |
| | 48.68 | | | | 48.98 | | | | 11.02 | | | | 11.63 | | | | 43,809,461 | | | | 0.45 | | | | 2.33 | | | | 1.91 | | | | 44 | |
| | 45.23 | | | | 45.27 | | | | (9.54 | ) | | | (9.46 | ) | | | 36,185,674 | | | | 0.45 | (h) | | | 3.18 | | | | 2.07 | (h) | | | 46 | |
| | | | | | | | |
| | | | | | | | | | | | | | | | | | | | | | | | | | | | | | | | | | |
| | 27.52 | | | | 27.68 | | | | (3.18 | ) | | | (2.78 | ) | | | 28,894,238 | | | | 0.03 | (i) | | | 4.95 | (c) | | | 0.75 | (i) | | | 7 | |
| | 29.24 | | | | 29.29 | | | | 20.87 | (k) | | | 20.83 | | | | 30,707,245 | | | | (0.14 | )(i)(k) | | | 2.31 | (c)(k) | | | 0.88 | (i) | | | 12 | |
| | 26.48 | | | | 26.52 | | | | 5.96 | | | | 6.08 | | | | 26,483,268 | | | | 0.49 | (h)(i) | | | (0.49 | )(c) | | | 1.08 | (h)(i) | | | 1 | |
| | | | | | | | |
| | | | | | | | | | | | | | | | | | | | | | | | | | | | | | | | | | |
| | 53.44 | | | | 53.56 | | | | (8.11 | ) | | | (8.33 | ) | | | 74,820,788 | | | | 0.40 | | | | 2.77 | | | | 0.70 | | | | 51 | |
| | 61.15 | | | | 61.42 | | | | 25.42 | | | | 25.80 | | | | 79,492,357 | | | | 0.43 | | | | 2.89 | | | | 0.80 | | | | 18 | |
| | 49.88 | | | | 49.95 | | | | (0.23 | ) | | | (0.09 | ) | | | 59,859,633 | | | | 0.43 | (h) | | | 3.14 | | | | 1.14 | (h) | | | 15 | |
| | | | | | | | |
| | | | | | | | | | | | | | | | | | | | | | | | | | | | | | | | | | |
| | 56.52 | | | | 56.47 | | | | (4.34 | ) | | | (4.65 | ) | | | 203,457,264 | | | | 0.38 | | | | 2.30 | | | | 0.56 | | | | 29 | |
| | 61.00 | | | | 61.14 | | | | 20.61 | | | | 20.40 | | | | 103,695,070 | | | | 0.38 | | | | 2.06 | | | | 0.80 | | | | 26 | |
| | 51.70 | | | | 51.91 | | | | 4.31 | | | | 4.44 | | | | 77,556,933 | | | | 0.38 | | | | 2.26 | | | | 0.93 | | | | 22 | |
| | 50.53 | | | | 50.67 | | | | 2.36 | | | | 1.82 | | | | 50,530,034 | | | | 0.38 | | | | 2.16 | | | | 1.52 | | | | 18 | |
| | 49.69 | | | | 50.09 | | | | (0.62 | ) | | | 0.18 | | | | 24,846,767 | | | | 0.38 | (h) | | | 2.01 | | | | 5.19 | (h) | | | 14 | |
SEE NOTES TO FINANCIAL STATEMENTS.
| | | | | | | | |
| | | |
| OCTOBER 31, 2018 | | J.P. MORGAN EXCHANGE-TRADED FUNDS | | | | | 193 | |
FINANCIAL HIGHLIGHTS
FOR THE PERIODS INDICATED (continued)
| | | | | | | | | | | | | | | | | | | | | | | | | | | | |
| | | Per share operating performance | |
| | | | | | Investment operations | | | Distributions | |
| | | Net asset
value,
beginning
of period | | | Net
investment
income
(loss) (b) | | | Net realized
and unrealized
gains
(losses) on
investments | | | Total from
investment
operations | | | Net
investment
income | | | Net
realized
gain (loss) | | | Total
distributions | |
JPMorgan Diversified Return International Currency Hedged ETF | | | | | | | | | | | | | | | | | | | | | | | | | | | | |
Year Ended October 31, 2018 | | $ | 30.17 | | | $ | 1.26 | (c) | | $ | (2.25 | ) | | $ | (0.99 | ) | | $ | (0.66 | ) | | $ | — | | | $ | (0.66 | ) |
Year Ended October 31, 2017 | | | 26.32 | | | | 0.37 | (c)(l) | | | 4.70 | | | | 5.07 | | | | (0.39 | ) | | | (0.83 | ) | | | (1.22 | ) |
April 1, 2016 (a) through October 31, 2016 | | | 25.00 | | | | (0.07 | )(c) | | | 1.39 | | | | 1.32 | | | | — | | | | — | | | | — | |
| | | | | | | |
JPMorgan Diversified Return International Equity ETF | | | | | | | | | | | | | | | | | | | | | | | | | | | | |
Year Ended October 31, 2018 | | | 59.18 | | | | 1.51 | | | | (5.29 | ) | | | (3.78 | ) | | | (2.30 | ) | | | — | | | | (2.30 | ) |
Year Ended October 31, 2017 | | | 50.00 | | | | 1.43 | | | | 8.57 | | | | 10.00 | | | | (0.82 | ) | | | — | | | | (0.82 | ) |
Year Ended October 31, 2016 | | | 51.17 | | | | 1.28 | | | | (1.37 | )(d) | | | (0.09 | ) | | | (1.08 | ) | | | — | | | | (1.08 | ) |
November 5, 2014 (a) through October 31, 2015 | | | 50.00 | | | | 1.39 | | | | (0.07 | ) | | | 1.32 | | | | (0.15 | ) | | | — | | | | (0.15 | ) |
| | | | | | | |
JPMorgan Diversified Return U.S. Equity ETF | | | | | | | | | | | | | | | | | | | | | | | | | | | | |
Year Ended October 31, 2018 | | | 68.52 | | | | 1.39 | | | | 1.88 | | | | 3.27 | | | | (1.87 | ) | | | — | | | | (1.87 | ) |
Year Ended October 31, 2017 | | | 57.06 | | | | 1.17 | | | | 10.75 | | | | 11.92 | | | | (0.46 | ) | | | — | | | | (0.46 | ) |
Year Ended October 31, 2016 | | | 54.13 | | | | 1.10 | | | | 2.09 | (d) | | | 3.19 | | | | (0.26 | ) | | | — | | | | (0.26 | ) |
September 29, 2015 (a) through October 31, 2015 | | | 50.00 | | | | 0.06 | | | | 4.07 | | | | 4.13 | | | | — | | | | — | | | | — | |
| | | | | | | |
JPMorgan Diversified Return U.S. Mid Cap Equity ETF | | | | | | | | | | | | | | | | | | | | | | | | | | | | |
Year Ended October 31, 2018 | | | 62.06 | | | | 1.06 | | | | 0.59 | | | | 1.65 | | | | (1.47 | ) | | | — | | | | (1.47 | ) |
Year Ended October 31, 2017 | | | 51.65 | | | | 0.89 | | | | 10.02 | | | | 10.91 | | | | (0.50 | ) | | | — | | | | (0.50 | ) |
May 11, 2016 (a) through October 31, 2016 | | | 50.00 | | | | 0.42 | | | | 1.23 | | | | 1.65 | | | | — | | | | — | | | | — | |
| | | | | | | |
JPMorgan Diversified Return U.S. Small Cap Equity ETF | | | | | | | | | | | | | | | | | | | | | | | | | | | | |
Year Ended October 31, 2018 | | | 28.95 | | | | 0.33 | | | | 0.73 | | | | 1.06 | | | | (0.43 | ) | | | — | | | | (0.43 | ) |
November 15, 2016 (a) through October 31, 2017 | | | 25.00 | | | | 0.28 | | | | 3.71 | | | | 3.99 | | | | (0.04 | ) | | | — | | | | (0.04 | ) |
| (a) | Commencement of operations. |
| (b) | Calculated based upon average shares outstanding. |
| (c) | Net investment income (loss) is affected by the timing of distributions from underlying funds. |
| (d) | Calculation of the net realized and unrealized gains (losses) per share do not correlate with the Fund’s net realized and unrealized gains (losses) presented on the Statement of Operations due to the timing of capital transactions in relation to the fluctuating market values of the Fund’s investments. |
| (e) | Not annualized for periods less than one year. |
| (f) | Includes adjustments in accordance with accounting principles generally accepted in the United States of America and as such, the net asset values for financial reporting purposes and the returns based upon those net asset values may differ from the net asset values and returns for shareholder transactions. |
| (g) | Market price total return is calculated assuming an initial investment made at the beginning of the period market price, reinvestment of all dividends and distributions at market price during the period, and sale at the market price on the last day of the period. The market price presented to calculate the market price total return is the mid-point of the bid/ask spread at the close of business on the NYSE Arca, Inc. Since the Shares of the Fund did not trade in the secondary market until the day after the Fund’s inception, for the period from the inception to the first day of secondary market trading, the NAV is used as a proxy for the secondary market trading price to calculate the market returns. |
| (h) | Annualized for periods less than one year, unless otherwise indicated. |
| (i) | Certain non-recurring expenses incurred by the Fund were not annualized for the periods indicated. |
| (j) | Does not include expenses of underlying funds. |
| (k) | Amount rounds to less than 1%. |
| (l) | Amount reflects an out of period adjustment related to an expense reimbursement for acquired fund fees. Had the Fund not recorded the out of period adjustment, the net investment income (loss) per share would have been $0.33, the net investment income (loss) ratio would have been 1.18%, the net expense ratio would have been 0.07%, and the total return would have been 19.84%. |
SEE NOTES TO FINANCIAL STATEMENTS.
| | | | | | |
| | | |
| 194 | | | | J.P. MORGAN EXCHANGE-TRADED FUNDS | | OCTOBER 31, 2018 |
| | | | | | | | | | | | | | | | | | | | | | | | | | | | | | | | | | |
| | | Ratios/Supplemental data | |
| | | | | | | | | | | | | | | | Ratios to average net assets (h) | | | | |
Net asset
value,
end of
period | | | Market
price,
end of
period | | | Total
return (e)(f) | | | Market
price
total
return (e)(g) | | | Net assets,
end of
period | | | Net
expenses | | | Net
investment
income
(loss) | | | Expenses
without waivers
and reimbursements | | | Portfolio
turnover
rate (e) | |
| | | | | | | | | | | | | | | | | | | | | | | | | | | | | | | | | | |
| $ | 28.52 | | | $ | 28.41 | | | | (3.42 | )% | | | (3.28 | )% | | $ | 31,366,788 | | | | 0.03 | %(j) | | | 4.20 | %(c) | | | 0.67 | %(j) | | | 6 | % |
| | 30.17 | | | | 30.02 | | | | 20.04 | (l) | | | 19.30 | | | | 48,274,467 | | | | (0.08 | )(j)(l) | | | 1.33 | (c)(l) | | | 0.76 | (j) | | | 5 | |
| | 26.32 | | | | 26.34 | | | | 5.28 | | | | 5.36 | | | | 26,316,114 | | | | 0.49 | (i)(j) | | | (0.49 | )(c) | | | 1.14 | (i)(j) | | | 4 | |
| | | | | | | | |
| | | | | | | | | | | | | | | | | | | | | | | | | | | | | | | | | | |
| | 53.10 | | | | 52.98 | | | | (6.72 | ) | | | (7.22 | ) | | | 1,444,332,261 | | | | 0.40 | | | | 2.57 | | | | 0.44 | | | | 28 | |
| | 59.18 | | | | 59.36 | | | | 20.35 | | | | 20.30 | | | | 1,159,887,006 | | | | 0.43 | | | | 2.63 | | | | 0.51 | | | | 29 | |
| | 50.00 | | | | 50.17 | | | | (0.15 | ) | | | 0.41 | | | | 470,042,716 | | | | 0.43 | | | | 2.56 | | | | 0.75 | | | | 27 | |
| | 51.17 | | | | 51.05 | | | | 2.65 | | | | 2.40 | | | | 92,113,607 | | | | 0.43 | (i) | | | 2.72 | | | | 1.33 | (i) | | | 20 | |
| | | | | | | | |
| | | | | | | | | | | | | | | | | | | | | | | | | | | | | | | | | | |
| | 69.92 | | | | 69.93 | | | | 4.74 | | | | 4.70 | | | | 559,362,329 | | | | 0.19 | | | | 1.95 | | | | 0.41 | | | | 32 | |
| | 68.52 | | | | 68.55 | | | | 20.99 | | | | 21.02 | | | | 356,298,771 | | | | 0.21 | | | | 1.83 | | | | 0.47 | | | | 27 | |
| | 57.06 | | | | 57.08 | | | | 5.92 | | | | 5.90 | | | | 125,538,258 | | | | 0.29 | | | | 1.95 | | | | 0.90 | | | | 22 | |
| | 54.13 | | | | 54.16 | | | | 8.26 | | | | 8.32 | | | | 10,826,623 | | | | 0.29 | (i) | | | 1.20 | | | | 5.75 | (i) | | | — | (k) |
| | | | | | | | |
| | | | | | | | | | | | | | | | | | | | | | | | | | | | | | | | | | |
| | 62.24 | | | | 62.25 | | | | 2.59 | | | | 2.57 | | | | 112,028,180 | | | | 0.24 | | | | 1.64 | | | | 0.50 | | | | 35 | |
| | 62.06 | | | | 62.08 | | | | 21.25 | | | | 21.31 | | | | 62,063,250 | | | | 0.26 | | | | 1.54 | | | | 0.62 | | | | 31 | |
| | 51.65 | | | | 51.64 | | | | 3.30 | | | | 3.28 | | | | 36,153,888 | | | | 0.34 | (i) | | | 1.69 | | | | 1.02 | (i) | | | 15 | |
| | | | | | | | |
| | | | | | | | | | | | | | | | | | | | | | | | | | | | | | | | | | |
| | 29.58 | | | | 29.58 | | | | 3.61 | | | | 3.43 | | | | 96,135,254 | | | | 0.29 | | | | 1.08 | | | | 0.61 | | | | 30 | |
| | 28.95 | | | | 29.00 | | | | 15.96 | | | | 16.16 | | | | 55,011,105 | | | | 0.31 | (i) | | | 1.08 | | | | 0.97 | (i) | | | 24 | |
| | | | | | | | |
| | | |
| OCTOBER 31, 2018 | | J.P. MORGAN EXCHANGE-TRADED FUNDS | | | | | 195 | |
FINANCIAL HIGHLIGHTS
FOR THE PERIODS INDICATED (continued)
| | | | | | | | | | | | | | | | | | | | | | | | |
| | | | | | Per share operating performance | |
| | | | | | Investment operations | | | Distributions | |
| | | Net asset
value,
beginning
of period | | | Net
investment
income
(loss) (b) | | | Net realized
and unrealized
gains
(losses) on
investments | | | Total from
investment
operations | | | Net
investment
income | | | Total
distributions | |
JPMorgan U.S. Dividend ETF | | | | | | | | | | | | | | | | | | | | | | | | |
November 8, 2017 (a) through October 31, 2018 | | $ | 25.00 | | | $ | 0.96 | | | $ | (0.17 | ) | | $ | 0.79 | | | $ | (0.87 | ) | | $ | (0.87 | ) |
| | | | | | |
JPMorgan U.S. Minimum Volatility ETF | | | | | | | | | | | | | | | | | | | | | | | | |
November 8, 2017 (a) through October 31, 2018 | | | 25.00 | | | | 0.59 | | | | 1.08 | | | | 1.67 | | | | (0.53 | ) | | | (0.53 | ) |
| | | | | | |
JPMorgan U.S. Momentum Factor ETF | | | | | | | | | | | | | | | | | | | | | | | | |
November 8, 2017 (a) through October 31, 2018 | | | 25.00 | | | | 0.35 | | | | 0.95 | | | | 1.30 | | | | (0.32 | ) | | | (0.32 | ) |
| | | | | | |
JPMorgan U.S. Quality Factor ETF | | | | | | | | | | | | | | | | | | | | | | | | |
November 8, 2017 (a) through October 31, 2018 | | | 25.00 | | | | 0.52 | | | | 1.52 | | | | 2.04 | | | | (0.48 | ) | | | (0.48 | ) |
| | | | | | |
JPMorgan U.S. Value Factor ETF | | | | | | | | | | | | | | | | | | | | | | | | |
November 8, 2017 (a) through October 31, 2018 | | | 25.00 | | | | 0.64 | | | | 0.16 | | | | 0.80 | | | | (0.59 | ) | | | (0.59 | ) |
| (a) | Commencement of operations. |
| (b) | Calculated based upon average shares outstanding. |
| (c) | Not annualized for periods less than one year. |
| (d) | Includes adjustments in accordance with accounting principles generally accepted in the United States of America and as such, the net asset values for financial reporting purposes and the returns based upon those net asset values may differ from the net asset values and returns for shareholder transactions. |
| (e) | Market price total return is calculated assuming an initial investment made at the beginning of the period market price, reinvestment of all dividends and distributions at market price during the period, and sale at the market price on the last day of the period. The market price presented to calculate the market price total return is the mid-point of the bid/ask spread at the close of business on the NYSE Arca, Inc. Since the Shares of the Fund did not trade in the secondary market until the day after the Fund’s inception, for the period from the inception to the first day of secondary market trading, the NAV is used as a proxy for the secondary market trading price to calculate the market returns. |
| (f) | Annualized for periods less than one year, unless otherwise indicated. |
| (g) | Certain non-recurring expenses incurred by the Fund were not annualized for the periods indicated. |
SEE NOTES TO FINANCIAL STATEMENTS.
| | | | | | |
| | | |
| 196 | | | | J.P. MORGAN EXCHANGE-TRADED FUNDS | | OCTOBER 31, 2018 |
| | | | | | | | | | | | | | | | | | | | | | | | | | | | | | | | | | |
| | | Ratios/Supplemental data | |
| | | | | | | | | | | | | | | | Ratios to average net assets (f) | | | | |
Net asset
value,
end of
period | | |
Market
price,
end of
period | | | Total
return (c)(d) | | | Market
price
total
return (c)(e) | | | Net assets,
end of
period | | | Net
expenses | | | Net
investment
income
(loss) | | | Expenses
without waivers
and reimbursements | | | Portfolio
turnover
rate (c) | |
| | | | | | | | | | | | | | | | | | | | | | | | | | | | | | | | | | |
| $ | 24.92 | | | $ | 24.90 | | | | 3.08 | % | | | 2.99 | % | | $ | 27,411,126 | | | | 0.12 | %(g) | | | 3.81 | % | | | 0.76 | %(g) | | | 24 | % |
| | | | | | | | |
| | | | | | | | | | | | | | | | | | | | | | | | | | | | | | | | | | |
| | 26.14 | | | | 26.14 | | | | 6.69 | | | | 6.69 | | | | 27,445,770 | | | | 0.12 | (g) | | | 2.33 | | | | 0.76 | (g) | | | 17 | |
| | | | | | | | |
| | | | | | | | | | | | | | | | | | | | | | | | | | | | | | | | | | |
| | 25.98 | | | | 25.99 | | | | 5.17 | | | | 5.21 | | | | 28,575,370 | | | | 0.12 | (g) | | | 1.32 | | | | 0.74 | (g) | | | 44 | |
| | | | | | | | |
| | | | | | | | | | | | | | | | | | | | | | | | | | | | | | | | | | |
| | 26.56 | | | | 26.56 | | | | 8.15 | | | | 8.15 | | | | 29,215,267 | | | | 0.12 | (g) | | | 2.01 | | | | 0.74 | (g) | | | 22 | |
| | | | | | | | |
| | | | | | | | | | | | | | | | | | | | | | | | | | | | | | | | | | |
| | 25.21 | | | | 25.21 | | | | 3.12 | | | | 3.12 | | | | 28,986,509 | | | | 0.12 | (g) | | | 2.52 | | | | 0.75 | (g) | | | 26 | |
| | | | | | | | |
| | | |
| OCTOBER 31, 2018 | | J.P. MORGAN EXCHANGE-TRADED FUNDS | | | | | 197 | |
NOTES TO FINANCIAL STATEMENTS
AS OF OCTOBER 31, 2018
1. Organization
J.P. Morgan Exchange-Traded Fund Trust (the “Trust”) was formed on February 25, 2010, and is governed by a Declaration of Trust as amended and restated February 19, 2014, and is registered under the Investment Company Act of 1940, as amended (the “1940 Act”), as an open-end management investment company.
The following are 18 separate funds of the Trust (each, a “Fund” and collectively, the “Funds”) covered by this report:
| | |
| | | Diversified/Non-Diversified |
| JPMorgan BetaBuilders Canada ETF | | Diversified |
| JPMorgan BetaBuilders Developed Asia ex-Japan ETF | | Diversified |
| JPMorgan BetaBuilders Europe ETF | | Diversified |
| JPMorgan BetaBuilders Japan ETF | | Diversified |
| JPMorgan Diversified Return Emerging Markets Equity ETF | | Diversified |
| JPMorgan Diversified Return Europe Currency Hedged ETF | | Diversified |
| JPMorgan Diversified Return Europe Equity ETF | | Diversified |
| JPMorgan Diversified Return Global Equity ETF | | Diversified |
| JPMorgan Diversified Return International Currency Hedged ETF | | Diversified |
| JPMorgan Diversified Return International Equity ETF | | Diversified |
| JPMorgan Diversified Return U.S. Equity ETF | | Diversified |
| JPMorgan Diversified Return U.S. Mid Cap Equity ETF | | Diversified |
| JPMorgan Diversified Return U.S. Small Cap Equity ETF | | Diversified |
| JPMorgan U.S. Dividend ETF | | Diversified |
| JPMorgan U.S. Minimum Volatility ETF | | Diversified |
| JPMorgan U.S. Momentum Factor ETF | | Diversified |
| JPMorgan U.S. Quality Factor ETF | | Diversified |
| JPMorgan U.S. Value Factor ETF | | Diversified |
JPMorgan BetaBuilders Canada ETF (the “BetaBuilders Canada ETF”) commenced operations on August 7, 2018. The investment objective of the Fund is to seek investment results that closely correspond, before fees and expenses, to the performance of the Morningstar® Canada Target Market Exposure IndexSM.
JPMorgan BetaBuilders Developed Asia ex-Japan ETF (the “BetaBuilders Developed Asia ex-Japan ETF”) commenced operations on August 7, 2018. The investment objective of the Fund is to seek investment results that closely correspond, before fees and expenses, to the performance of the Morningstar® Developed Asia Pacific ex-Japan Target Market Exposure IndexSM.
JPMorgan BetaBuilders Europe ETF (the “BetaBuilders Europe ETF”) commenced operations on June 15, 2018. The investment objective of the Fund is to seek investment results that closely correspond, before fees and expenses, to the performance of the Morningstar® Developed Europe Target Market Exposure IndexSM.
JPMorgan BetaBuilders Japan ETF (the “BetaBuilders Japan ETF”) commenced operations on June 15, 2018. The investment objective of the Fund is to seek investment results that closely correspond, before fees and expenses, to the performance of the Morningstar® Japan Target Market Exposure IndexSM.
The JPMorgan Diversified Return Emerging Markets Equity ETF (the “Emerging Markets Equity ETF”) commenced operations on January 7, 2015. The investment objective of the Fund is to seek investment results that closely correspond, before fees and expenses, to the performance of the JP Morgan Diversified Factor Emerging Markets Equity Index (formerly FTSE Emerging Diversified Factor Index).
The JPMorgan Diversified Return Europe Currency Hedged ETF (the “Europe Currency Hedged ETF”) commenced operations on April 1, 2016. The investment objective of the Fund is to seek investment results that closely correspond, before fees and expenses, to the performance of the JP Morgan Diversified Factor Europe Currency Hedged (USD) Index (formerly FTSE Developed Europe Diversified Factor 100% Hedged to USD Index).
The JPMorgan Diversified Return Europe Equity ETF (the “Europe Equity ETF”) commenced operations on December 18, 2015. The investment objective of the Fund is to seek investment results that closely correspond, before fees and expenses, to the performance of the JP Morgan Diversified Factor Europe Equity Index (formerly FTSE Developed Europe Diversified Factor Index).
The JPMorgan Diversified Return Global Equity ETF (the “Global Equity ETF”) commenced operations on June 16, 2014. The investment objective of the Fund is to seek investment results that closely correspond, before fees and expenses, to the performance of the JP Morgan Diversified Factor Global Developed Equity Index (formerly FTSE Developed Diversified Factor Index).
The JPMorgan Diversified Return International Currency Hedged ETF (the “International Currency Hedged ETF”) commenced operations on April 1, 2016. The investment objective of the Fund is to seek investment results that closely correspond, before fees and expenses, to the performance of the JP Morgan Diversified Factor International Currency Hedged (USD) Index (formerly FTSE Developed ex North America Diversified Factor 100% Hedged to USD Index).
| | | | | | |
| | | |
| 198 | | | | J.P. MORGAN EXCHANGE-TRADED FUNDS | | OCTOBER 31, 2018 |
The JPMorgan Diversified Return International Equity ETF (the “International Equity ETF”) commenced operations on November 5, 2014. The investment objective of the Fund is to seek investment results that closely correspond, before fees and expenses, to the performance of the JP Morgan Diversified Factor International Equity Index (formerly FTSE Developed ex North America Diversified Factor Index).
The JPMorgan Diversified Return U.S. Equity ETF (the “U.S. Equity ETF”) commenced operations on September 29, 2015. The investment objective of the Fund is to seek investment results that closely correspond, before fees and expenses, to the performance of the JP Morgan Diversified Factor US Equity Index (formerly Russell 1000 Diversified Factor Index).
The JPMorgan Diversified Return U.S. Mid Cap Equity ETF (the “U.S. Mid Cap Equity ETF”) commenced operations on May 11, 2016. The investment objective of the Fund is to seek investment results that closely correspond, before fees and expenses, to the performance of the JP Morgan Diversified Factor US Mid Cap Equity Index (formerly Russell Midcap Diversified Factor Index).
The JPMorgan Diversified Return U.S. Small Cap Equity ETF (the “U.S. Small Cap Equity ETF”) commenced operations on November 15, 2016. The investment objective of the Fund is to seek investment results that closely correspond, before fees and expenses, to the performance of the JP Morgan Diversified Factor US Small Cap Equity Index (formerly Russell 2000 Diversified Factor Index).
JPMorgan U.S. Dividend ETF (the “U.S. Dividend ETF”) commenced operations on November 8, 2017. The investment objective of the Fund is to seek investment results that closely correspond, before fees and expenses, to the performance of the JP Morgan US Dividend Index.
JPMorgan U.S. Minimum Volatility ETF (the “U.S. Minimum Volatility ETF”) commenced operations on November 8, 2017. The investment objective of the Fund is to seek investment results that closely correspond, before fees and expenses, to the performance of the JP Morgan US Minimum Volatility Index.
JPMorgan U.S. Momentum Factor ETF (the “U.S. Momentum Factor ETF”) commenced operations on November 8, 2017. The investment objective of the Fund is to seek investment results that closely correspond, before fees and expenses, to the performance of the JP Morgan US Momentum Factor Index.
JPMorgan U.S. Quality Factor ETF (the “U.S. Quality Factor ETF”) commenced operations on November 8, 2017. The investment objective of the Fund is to seek investment results that closely correspond, before fees and expenses, to the performance of the JP Morgan US Quality Factor Index.
JPMorgan U.S. Value Factor ETF (the “U.S. Value Factor ETF”) commenced operations on November 8, 2017. The investment objective of the Fund is to seek investment results that closely correspond, before fees and expenses, to the performance of the JP Morgan US Value Factor Index.
J.P. Morgan Investment Management Inc. (“JPMIM”), an indirect, wholly-owned subsidiary of JPMorgan Chase & Co. (“JPMorgan”), acts as the Adviser (the “Adviser”) and Administrator (the “Administrator”) to the Funds.
Shares of each Fund are listed and traded on the NYSE Arca, Inc., except shares of BetaBuilders Canada ETF, BetaBuilders Developed Asia ex-Japan ETF, BetaBuilders Europe ETF and BetaBuilders Japan ETF are listed and traded on Cboe BZX Exchange, Inc. Market prices for the Funds’ shares may be different from their net asset value (“NAV”). The Funds issue and redeem their shares on a continuous basis, through JPMorgan Distribution Services, Inc. (the “Distributor” or “JPMDS”), an indirect, wholly-owned subsidiary of JPMorgan, at NAV in large blocks of shares, referred to as “Creation Units” as shown in the table below:
| | | | |
| | | Shares per
Creation Unit | |
| BetaBuilders Canada ETF | | | 100,000 | |
| BetaBuilders Developed Asia ex-Japan ETF | | | 200,000 | |
| BetaBuilders Europe ETF | | | 200,000 | |
| BetaBuilders Japan ETF | | | 400,000 | |
| Emerging Markets Equity ETF | | | 100,000 | |
| Europe Currency Hedged ETF | | | 50,000 | |
| Europe Equity ETF | | | 100,000 | |
| Global Equity ETF | | | 100,000 | |
| International Currency Hedged ETF | | | 50,000 | |
| International Equity ETF | | | 100,000 | |
| U.S. Equity ETF | | | 100,000 | |
| U.S. Mid Cap Equity ETF | | | 100,000 | |
| U.S. Small Cap Equity ETF | | | 50,000 | |
| U.S. Dividend ETF | | | 50,000 | |
| U.S. Minimum Volatility ETF | | | 50,000 | |
| U.S. Momentum Factor ETF | | | 50,000 | |
| U.S. Quality Factor ETF | | | 50,000 | |
| U.S. Value Factor ETF | | | 50,000 | |
| | | | | | | | |
| | | |
| OCTOBER 31, 2018 | | J.P. MORGAN EXCHANGE-TRADED FUNDS | | | | | 199 | |
NOTES TO FINANCIAL STATEMENTS
AS OF OCTOBER 31, 2018 (continued)
Creation Units are issued and redeemed principally in-kind for a basket of securities. A cash amount may be substituted in Funds with sizeable exposure to market or sponsor restricted securities. Shares are generally traded in the secondary market in amounts less than a Creation Unit at market prices that change throughout the day. Only individuals or institutions that have entered into an authorized participant agreement with the Distributor may do business directly with the Funds (each, an “Authorized Participant”).
2. Significant Accounting Policies
The following is a summary of significant accounting policies followed by the Funds in the preparation of their financial statements. The Funds are investment companies and, thus, follow the investment company accounting and reporting guidance of the Financial Accounting Standards Board Accounting Standards Codification Topic 946 — Investment Companies, which is part of U.S. generally accepted accounting principles (“GAAP”). The preparation of financial statements in conformity with GAAP requires management to make estimates and assumptions that affect the reported amounts of assets and liabilities and disclosure of contingent assets and liabilities at the date of the financial statements and the reported amounts of increases and decreases in net assets from operations during the reporting period. Actual results could differ from those estimates.
A. Valuation of Investments — The valuation of investments is in accordance with GAAP and the Funds’ valuation policies set forth by and under the supervision and responsibility of the Board of Trustees (the “Board”), which established the following approach to valuation, as described more fully below: (i) investments for which market quotations are readily available shall be valued at their market value, and (ii) all other investments for which market quotations are not readily available shall be valued at their fair value as determined in good faith by the Board.
The Administrator has established the J.P. Morgan Asset Management Americas Valuation Committee (“AVC”) to assist the Board with the oversight and monitoring of the valuation of the Funds’ investments. The Administrator implements the valuation policies of the Funds’ investments, as directed by the Board. The AVC oversees and carries out the policies for the valuation of investments held in the Funds. This includes monitoring the appropriateness of fair values based on results of ongoing valuation oversight including, but not limited to, consideration of macro or security specific events, market events and pricing vendor and broker due diligence. The Administrator is responsible for discussing and assessing the potential impacts to the fair values on an ongoing basis, and at least on a quarterly basis with the AVC and the Board.
A market-based approach is primarily used to value the Funds’ investments. Investments for which market quotations are not readily available are fair valued by approved affiliated and unaffiliated pricing vendors or third party broker-dealers (collectively referred to as “Pricing Services”) or may be internally fair valued using methods set forth by the valuation policies approved by the Board. This may include related or comparable assets or liabilities, recent transactions, market multiples, book values and other relevant information for the investment to determine the fair value of the investment. An income-based valuation approach may be used in which the anticipated future cash flows of the investment are discounted to calculate the fair value. Discounts may also be applied due to the nature or duration of any restrictions on the disposition of the investments. Valuations may be based upon current market prices of securities that are comparable in coupon, rating, maturity and industry. It is possible that the estimated values may differ significantly from the values that would have been used, had a ready market for the investments existed, and such differences could be material.
Equities and other exchange-traded instruments are valued at the last sale price or official market closing price on the primary exchange on which the instrument is traded before the NAVs of the Funds are calculated on a valuation date. Certain foreign equity instruments, as well as certain derivatives with equity reference obligations, are valued by applying international fair value factors provided by approved Pricing Services. The factors seek to adjust the local closing price for movements of local markets post closing, but prior to the time the NAVs are calculated.
Investments in open-end investment companies, excluding Exchange-Traded Funds (“ETFs”), (the “Underlying Funds”) are valued at each Underlying Fund’s NAV per share as of the report date.
Futures contracts are generally valued on the basis of available market quotations. Forward foreign currency exchange contracts are valued utilizing market quotations from approved Pricing Services.
Valuations reflected in this report are as of the report date. As a result, changes in valuation due to market events and/or issuer related events after the report date and prior to issuance of the report are not reflected herein.
The various inputs that are used in determining the valuation of the Funds’ investments are summarized into the three broad levels listed below.
| • | | Level 1 — Unadjusted inputs using quoted prices in active markets for identical investments. |
| • | | Level 2 — Other significant observable inputs including, but not limited to, quoted prices for similar investments, inputs other than quoted prices that are observable for investments (such as interest rates, prepayment speeds, credit risk, etc.) or other market corroborated inputs. |
| • | | Level 3 — Significant inputs based on the best information available in the circumstances, to the extent observable inputs are not available (including the Funds’ assumptions in determining the fair value of investments). |
A financial instrument’s level within the fair value hierarchy is based on the lowest level of any input, both individually and in the aggregate, that is significant to the fair value measurement. The inputs or methodology used for valuing instruments are not necessarily an indication of the risk associated with investing in those instruments.
| | | | | | |
| | | |
| 200 | | | | J.P. MORGAN EXCHANGE-TRADED FUNDS | | OCTOBER 31, 2018 |
The following tables represent each valuation input as presented on the Schedules of Portfolio Investments (“SOIs”):
BetaBuilders Canada ETF
| | | | | | | | | | | | | | | | |
| | | Level 1
Quoted prices | | | Level 2
Other significant
observable inputs | | | Level 3
Significant
unobservable inputs | | | Total | |
Investments in Securities | | | | | | | | | | | | | | | | |
Common Stocks (b) | | $ | 2,026,860,357 | | | $ | — | | | $ | — | | | $ | 2,026,860,357 | |
Short-Term Investments | | | | | | | | | | | | | | | | |
Investment Company | | | 190,063 | | | | — | | | | — | | | | 190,063 | |
Investments of cash collateral from securities loaned | �� | | 71,875,628 | | | | — | | | | — | | | | 71,875,628 | |
| | | | | | | | | | | | | | | | |
Total Investments in Securities | | $ | 2,098,926,048 | | | $ | — | | | $ | — | | | $ | 2,098,926,048 | |
| | | | | | | | | | | | | | | | |
Depreciation in Other Financial Instruments | | | | | | | | | | | | | | | | |
Futures Contracts | | $ | (382,489 | ) | | $ | — | | | $ | — | | | $ | (382,489 | ) |
| | | | | | | | | | | | | | | | |
BetaBuilders Developed Asia Pacific ex-Japan ETF
| | | | | | | | | | | | | | | | |
| | | Level 1
Quoted prices | | | Level 2
Other significant
observable inputs | | | Level 3
Significant
unobservable inputs | | | Total | |
Investments in Securities | | | | | | | | | | | | | | | | |
Common Stocks | | | | | | | | | | | | | | | | |
Australia | | $ | 4,278,218 | | | $ | 338,605,176 | | | $ | — | | | $ | 342,883,394 | |
China | | | — | | | | 785,579 | | | | — | | | | 785,579 | |
Hong Kong | | | 835,712 | | | | 162,401,510 | | | | — | | | | 163,237,222 | |
Ireland | | | — | | | | 2,267,255 | | | | — | | | | 2,267,255 | |
Macau | | | — | | | | 5,950,418 | | | | — | | | | 5,950,418 | |
New Zealand | | | — | | | | 12,410,545 | | | | — | | | | 12,410,545 | |
Singapore | | | 165,960 | | | | 71,664,914 | | | | — | | | | 71,830,874 | |
Taiwan | | | — | | | | 244,665 | | | | — | | | | 244,665 | |
Other Common Stocks | | | 285,921 | | | | — | | | | — | | | | 285,921 | |
| | | | | | | | | | | | | | | | |
Total Common Stocks | | | 5,565,811 | | | | 594,330,062 | | | | — | | | | 599,895,873 | |
| | | | | | | | | | | | | | | | |
Short-Term Investments | | | | | | | | | | | | | | | | |
Investment Company | | | 254,772 | | | | — | | | | — | | | | 254,772 | |
| | | | | | | | | | | | | | | | |
Total Investments in Securities | | $ | 5,820,583 | | | $ | 594,330,062 | | | $ | — | | | $ | 600,150,645 | |
| | | | | | | | | | | | | | | | |
Appreciation in Other Financial Instruments | | | | | | | | | | | | | | | | |
Futures Contracts | | $ | 2,349 | | | $ | 2,008 | | | $ | — | | | $ | 4,357 | |
| | | | | | | | | | | | | | | | |
Depreciation in Other Financial Instruments | | | | | | | | | | | | | | | | |
Futures Contracts | | $ | — | | | $ | (98,086 | ) | | $ | — | | | $ | (98,086 | ) |
| | | | | | | | | | | | | | | | |
BetaBuilders Europe ETF
| | | | | | | | | | | | | | | | |
| | | Level 1
Quoted prices | | | Level 2
Other significant
observable inputs | | | Level 3
Significant
unobservable inputs | | | Total | |
Investments in Securities | | | | | | | | | | | | | | | | |
Common Stocks | | | | | | | | | | | | | | | | |
Australia | | $ | — | | | $ | 14,733,746 | | | $ | — | | | $ | 14,733,746 | |
Austria | | | 888,855 | | | | 5,880,711 | | | | — | | | | 6,769,566 | |
Belgium | | | — | | | | 24,626,423 | | | | — | | | | 24,626,423 | |
Chile | | | — | | | | 520,832 | | | | — | | | | 520,832 | |
Colombia | | | — | | | | 513,082 | | | | — | | | | 513,082 | |
Denmark | | | 1,299,269 | | | | 32,862,441 | | | | — | | | | 34,161,710 | |
Finland | | | — | | | | 28,555,588 | | | | — | | | | 28,555,588 | |
France | | | 1,150,501 | | | | 210,070,518 | | | | — | | | | 211,221,019 | |
| | | | | | | | |
| | | |
| OCTOBER 31, 2018 | | J.P. MORGAN EXCHANGE-TRADED FUNDS | | | | | 201 | |
NOTES TO FINANCIAL STATEMENTS
AS OF OCTOBER 31, 2018 (continued)
BetaBuilders Europe ETF (continued)
| | | | | | | | | | | | | | | | |
| | | Level 1
Quoted prices | | | Level 2
Other significant
observable inputs | | | Level 3
Significant
unobservable inputs | | | Total | |
Germany | | $ | 51,217 | | | $ | 177,755,137 | | | $ | — | | | $ | 177,806,354 | |
Ghana | | | — | | | | 598,352 | | | | — | | | | 598,352 | |
Ireland | | | 5,564,072 | | | | 6,457,157 | | | | — | | | | 12,021,229 | |
Italy | | | 215,449 | | | | 42,878,747 | | | | — | | | | 43,094,196 | |
Jersey | | | — | | | | 1,112,793 | | | | — | | | | 1,112,793 | |
Jordan | | | — | | | | 507,802 | | | | — | | | | 507,802 | |
Luxembourg | | | 1,242,755 | | | | 4,687,757 | | | | — | | | | 5,930,512 | |
Mexico | | | — | | | | 301,162 | | | | — | | | | 301,162 | |
Netherlands | | | 731,028 | | | | 92,737,778 | | | | — | | | | 93,468,806 | |
Norway | | | — | | | | 17,655,884 | | | | — | | | | 17,655,884 | |
Portugal | | | 1,293,140 | | | | 2,538,761 | | | | — | | | | 3,831,901 | |
Russia | | | — | | | | 686,649 | | | | — | | | | 686,649 | |
South Africa | | | — | | | | 5,937,541 | | | | — | | | | 5,937,541 | |
Spain | | | 260,183 | | | | 59,123,279 | | | | — | | | | 59,383,462 | |
Sweden | | | 504,766 | | | | 56,219,052 | | | | — | | | | 56,723,818 | |
Switzerland | | | 1,277,268 | | | | 182,391,041 | | | | — | | | | 183,668,309 | |
United Arab Emirates | | | — | | | | 579,581 | | | | — | | | | 579,581 | |
United Kingdom | | | 8,879,395 | | | | 298,256,518 | | | | — | | | | 307,135,913 | |
United States | | | — | | | | 13,646,627 | | | | — | | | | 13,646,627 | |
| | | | | | | | | | | | | | | | |
Total Common Stocks | | | 23,357,898 | | | | 1,281,834,959 | | | | — | | | | 1,305,192,857 | |
| | | | | | | | | | | | | | | | |
Short-Term Investments | | | | | | | | | | | | | | | | |
Investment Company | | | 296,502 | | | | — | | | | — | | | | 296,502 | |
Investments of cash collateral from securities loaned | | | 26,501,735 | | | | — | | | | — | | | | 26,501,735 | |
| | | | | | | | | | | | | | | | |
Total Investments in Securities | | $ | 50,156,135 | | | $ | 1,281,834,959 | | | $ | — | | | $ | 1,331,991,094 | |
| | | | | | | | | | | | | | | | |
Appreciation in Other Financial Instruments | | | | | | | | | | | | | | | | |
Futures Contracts | | $ | 33,855 | | | $ | — | | | $ | — | | | $ | 33,855 | |
| | | | | | | | | | | | | | | | |
Depreciation in Other Financial Instruments | | | | | | | | | | | | | | | | |
Futures Contracts | | $ | (53,241 | ) | | $ | — | | | $ | — | | | $ | (53,241 | ) |
| | | | | | | | | | | | | | | | |
BetaBuilders Japan ETF
| | | | | | | | | | | | | | | | |
| | | Level 1
Quoted prices | | | Level 2
Other significant
observable inputs | | | Level 3
Significant
unobservable inputs | | | Total | |
Investments in Securities | | | | | | | | | | | | | | | | |
Common Stocks (b) | | $ | — | | | $ | 2,316,232,357 | | | $ | — | | | $ | 2,316,232,357 | |
Short-Term Investments | | | | | | | | | | | | | | | | |
Investment Company | | | 288,800 | | | | — | | | | — | | | | 288,800 | |
Investments of cash collateral from securities loaned | | | 19,499,569 | | | | — | | | | — | | | | 19,499,569 | |
| | | | | | | | | | | | | | | | |
Total Investments in Securities | | $ | 19,788,369 | | | $ | 2,316,232,357 | | | $ | — | | | $ | 2,336,020,726 | |
| | | | | | | | | | | | | | | | |
Depreciation in Other Financial Instruments | | | | | | | | | | | | | | | | |
Futures Contracts | | $ | (576,077 | ) | | $ | — | | | $ | — | | | $ | (576,077 | ) |
| | | | | | | | | | | | | | | | |
| | | | | | |
| | | |
| 202 | | | | J.P. MORGAN EXCHANGE-TRADED FUNDS | | OCTOBER 31, 2018 |
Emerging Markets Equity ETF
| | | | | | | | | | | | | | | | |
| | | Level 1
Quoted prices | | | Level 2
Other significant
observable inputs | | | Level 3
Significant
unobservable inputs | | | Total | |
Investments in Securities | | | | | | | | | | | | | | | | |
Common Stocks | | | | | | | | | | | | | | | | |
China | | $ | 3,719,872 | | | $ | 41,536,762 | | | $ | — | (a) | | $ | 45,256,634 | |
Czech Republic | | | — | | | | 813,869 | | | | — | | | | 813,869 | |
Egypt | | | 362,004 | | | | 29,613 | | | | — | | | | 391,617 | |
Greece | | | 93,553 | | | | 768,940 | | | | — | | | | 862,493 | |
Hong Kong | | | — | | | | 1,490,031 | | | | — | | | | 1,490,031 | |
Hungary | | | — | | | | 804,902 | | | | — | | | | 804,902 | |
India | | | — | | | | 19,611,627 | | | | 9,286 | | | | 19,620,913 | |
Indonesia | | | — | | | | 8,366,773 | | | | — | | | | 8,366,773 | |
Kuwait | | | 412,373 | | | | 402,328 | | | | — | | | | 814,701 | |
Malaysia | | | 357,395 | | | | 13,627,279 | | | | — | | | | 13,984,674 | |
Pakistan | | | — | | | | 36,167 | | | | — | | | | 36,167 | |
Philippines | | | 362,074 | | | | 2,305,565 | | | | — | | | | 2,667,639 | |
Qatar | | | 179,126 | | | | 3,170,884 | | | | — | | | | 3,350,010 | |
Russia | | | — | | | | 13,381,199 | | | | — | | | | 13,381,199 | |
Singapore | | | — | | | | 21,159 | | | | — | | | | 21,159 | |
South Africa | | | 2,535,103 | | | | 10,751,372 | | | | — | | | | 13,286,475 | |
Taiwan | | | — | | | | 32,731,911 | | | | — | | | | 32,731,911 | |
Thailand | | | 6,750,805 | | | | 8,275,506 | | | | — | | | | 15,026,311 | |
Turkey | | | — | | | | 2,112,792 | | | | — | | | | 2,112,792 | |
United Arab Emirates | | | 587,287 | | | | 2,339,518 | | | | — | | | | 2,926,805 | |
United Kingdom | | | — | | | | 195,585 | | | | — | | | | 195,585 | |
Other Common Stocks | | | 34,433,761 | | | | — | | | | — | | | | 34,433,761 | |
| | | | | | | | | | | | | | | | |
Total Common Stocks | | | 49,793,353 | | | | 162,773,782 | | | | 9,286 | | | | 212,576,421 | |
| | | | | | | | | | | | | | | | |
Rights | | | | | | | | | | | | | | | | |
Taiwan | | | 1,355 | | | | — | | | | — | | | | 1,355 | |
Other Rights | | | — | | | | 413 | | | | — | | | | 413 | |
| | | | | | | | | | | | | | | | |
Total | | | 1,355 | | | | 413 | | | | — | | | | 1,768 | |
| | | | | | | | | | | | | | | | |
Short-Term Investments | | | | | | | | | | | | | | | | |
Investment Companies | | | 753,648 | | | | — | | | | — | | | | 753,648 | |
| | | | | | | | | | | | | | | | |
Total Investments in Securities | | $ | 50,548,356 | | | $ | 162,774,195 | | | $ | 9,286 | | | $ | 213,331,837 | |
| | | | | | | | | | | | | | | | |
Appreciation in Other Financial Instruments | | | | | | | | | | | | | | | | |
Futures Contracts | | $ | 14,197 | | | $ | — | | | $ | — | | | $ | 14,197 | |
| | | | | | | | | | | | | | | | |
Europe Currency Hedged ETF
| | | | | | | | | | | | | | | | |
| | | Level 1
Quoted prices | | | Level 2
Other significant
observable inputs | | | Level 3
Significant
unobservable inputs | | | Total | |
Total Investments in Securities (b) | | $ | 28,919,164 | | | $ | — | | | $ | — | | | $ | 28,919,164 | |
| | | | | | | | | | | | | | | | |
Appreciation in Other Financial Instruments | |
Forward Foreign Currency Exchange Contracts | | $ | — | | | $ | 835,882 | | | $ | — | | | $ | 835,882 | |
| | | | | | | | | | | | | | | | |
Depreciation in Other Financial Instruments | | | | | | | | | | | | | | | | |
Forward Foreign Currency Exchange Contracts | | $ | — | | | $ | (23,066 | ) | | $ | — | | | $ | (23,066 | ) |
| | | | | | | | | | | | | | | | |
| | | | | | | | |
| | | |
| OCTOBER 31, 2018 | | J.P. MORGAN EXCHANGE-TRADED FUNDS | | | | | 203 | |
NOTES TO FINANCIAL STATEMENTS
AS OF OCTOBER 31, 2018 (continued)
Europe Equity ETF
| | | | | | | | | | | | | | | | |
| | | Level 1
Quoted prices | | | Level 2
Other significant
observable inputs | | | Level 3
Significant
unobservable inputs | | | Total | |
Investments in Securities | | | | | | | | | | | | | | | | |
Common Stocks | | | | | | | | | | | | | | | | |
Australia | | $ | — | | | $ | 535,695 | | | $ | — | | | $ | 535,695 | |
Austria | | | 54,836 | | | | 582,819 | | | | — | | | | 637,655 | |
Belgium | | | — | | | | 1,628,403 | | | | — | | | | 1,628,403 | |
Chile | | | — | | | | 177,798 | | | | — | | | | 177,798 | |
Denmark | | | 121,981 | | | | 3,056,347 | | | | — | | | | 3,178,328 | |
Finland | | | — | | | | 3,330,162 | | | | — | | | | 3,330,162 | |
France | | | 102,879 | | | | 11,103,855 | | | | — | | | | 11,206,734 | |
Germany | | | 245,721 | | | | 8,960,055 | | | | — | | | | 9,205,776 | |
Ireland | | | — | | | | 376,521 | | | | — | | | | 376,521 | |
Italy | | | — | | | | 3,410,219 | | | | — | | | | 3,410,219 | |
Jersey | | | — | | | | 247,838 | | | | — | | | | 247,838 | |
Jordan | | | — | | | | 232,581 | | | | — | | | | 232,581 | |
Kazakhstan | | | — | | | | 111,658 | | | | — | | | | 111,658 | |
Luxembourg | | | 311,162 | | | | 624,589 | | | | — | | | | 935,751 | |
Netherlands | | | 75,978 | | | | 3,579,724 | | | | — | | | | 3,655,702 | |
Norway | | | — | | | | 1,976,869 | | | | — | | | | 1,976,869 | |
Poland | | | — | | | | 135,098 | | | | — | | | | 135,098 | |
Portugal | | | 294,890 | | | | 361,202 | | | | — | | | | 656,092 | |
Russia | | | — | | | | 258,752 | | | | — | | | | 258,752 | |
South Africa | | | — | | | | 302,457 | | | | — | | | | 302,457 | |
Spain | | | — | | | | 3,917,417 | | | | — | | | | 3,917,417 | |
Sweden | | | 125,314 | | | | 4,487,510 | | | | — | | | | 4,612,824 | |
Switzerland | | | — | | | | 7,021,816 | | | | — | | | | 7,021,816 | |
United Arab Emirates | | | — | | | | 239,335 | | | | — | | | | 239,335 | |
United Kingdom | | | 291,316 | | | | 15,032,676 | | | | — | | | | 15,323,992 | |
United States | | | — | | | | 851,362 | | | | — | | | | 851,362 | |
| | | | | | | | | | | | | | | | |
Total Common Stocks | | | 1,624,077 | | | | 72,542,758 | | | | — | | | | 74,166,835 | |
| | | | | | | | | | | | | | | | |
Total Investments in Securities | | $ | 1,624,077 | | | $ | 72,542,758 | | | $ | — | | | $ | 74,166,835 | |
| | | | | | | | | | | | | | | | |
Appreciation in Other Financial Instruments | | | | | | | | | | | | | | | | |
Futures Contracts | | $ | 6,606 | | | $ | — | | | $ | — | | | $ | 6,606 | |
| | | | | | | | | | | | | | | | |
Global Equity ETF
| | | | | | | | | | | | | | | | |
| | | Level 1
Quoted prices | | | Level 2
Other significant
observable inputs | | | Level 3
Significant
unobservable inputs | | | Total | |
Investments in Securities | | | | | | | | | | | | | | | | |
Common Stocks | | | | | | | | | | | | | | | | |
Australia | | $ | 143,822 | | | $ | 16,575,094 | | | $ | — | | | $ | 16,718,916 | |
Austria | | | — | | | | 482,745 | | | | — | | | | 482,745 | |
Belgium | | | — | | | | 1,731,276 | | | | — | | | | 1,731,276 | |
Chile | | | — | | | | 12,262 | | | | — | | | | 12,262 | |
China | | | — | | | | 978,106 | | | | — | | | | 978,106 | |
Denmark | | | — | | | | 1,579,136 | | | | — | | | | 1,579,136 | |
Finland | | | — | | | | 2,329,218 | | | | — | | | | 2,329,218 | |
France | | | — | | | | 7,727,966 | | | | — | | | | 7,727,966 | |
Germany | | | — | | | | 6,159,746 | | | | — | | | | 6,159,746 | |
Hong Kong | | | — | | | | 8,170,422 | | | | — | | | | 8,170,422 | |
Italy | | | 273,979 | | | | 1,558,874 | | | | — | | | | 1,832,853 | |
Japan | | | — | | | | 45,231,535 | | | | — | | | | 45,231,535 | |
Macau | | | — | | | | 773,180 | | | | — | | | | 773,180 | |
| | | | | | |
| | | |
| 204 | | | | J.P. MORGAN EXCHANGE-TRADED FUNDS | | OCTOBER 31, 2018 |
Global Equity ETF (continued)
| | | | | | | | | | | | | | | | |
| | | Level 1
Quoted prices | | | Level 2
Other significant
observable inputs | | | Level 3
Significant
unobservable inputs | | | Total | |
Netherlands | | $ | 203,063 | | | $ | 3,414,360 | | | $ | — | | | $ | 3,617,423 | |
New Zealand | | | — | | | | 700,126 | | | | — | | | | 700,126 | |
Norway | | | — | | | | 2,116,284 | | | | — | | | | 2,116,284 | |
Portugal | | | 465,555 | | | | 415,927 | | | | — | | | | 881,482 | |
Singapore | | | — | | | | 4,363,952 | | | | — | | | | 4,363,952 | |
South Africa | | | — | | | | 304,271 | | | | — | | | | 304,271 | |
South Korea | | | 356,653 | | | | 16,734,565 | | | | — | | | | 17,091,218 | |
Spain | | | — | | | | 3,913,451 | | | | — | | | | 3,913,451 | |
Sweden | | | 442,455 | | | | 4,562,385 | | | | — | | | | 5,004,840 | |
Switzerland | | | — | | | | 4,125,344 | | | | — | | | | 4,125,344 | |
United Kingdom | | | 529,913 | | | | 5,658,056 | | | | — | | | | 6,187,969 | |
United States | | | 50,733,598 | | | | 126,780 | | | | — | | | | 50,860,378 | |
Other Common Stocks | | | 8,252,320 | | | | — | | | | — | | | | 8,252,320 | |
| | | | | | | | | | | | | | | | |
Total Common Stocks | | | 61,401,358 | | | | 139,745,061 | | | | — | | | | 201,146,419 | |
| | | | | | | | | | | | | | | | |
Rights | | | — | | | | — | (a) | | | — | | | | — | (a) |
Short-Term Investments | | | | | | | | | | | | | | | | |
Investment Companies | | | 627,017 | | | | — | | | | — | | | | 627,017 | |
Investments of cash collateral from securities loaned | | | 924,151 | | | | — | | | | — | | | | 924,151 | |
| | | | | | | | | | | | | | | | |
Total Investments in Securities | | $ | 62,952,526 | | | $ | 139,745,061 | | | $ | — | | | $ | 202,697,587 | |
| | | | | | | | | | | | | | | | |
Depreciation in Other Financial Instruments | | | | | | | | | | | | | | | | |
Futures Contracts | | $ | (17,876 | ) | | $ | — | | | $ | — | | | $ | (17,876 | ) |
| | | | | | | | | | | | | | | | |
International Currency Hedged ETF
| | | | | | | | | | | | | | | | |
| | | Level 1
Quoted prices | | | Level 2
Other significant
observable inputs | | | Level 3
Significant
unobservable inputs | | | Total | |
Total Investments in Securities (b) | | $ | 31,392,996 | | | $ | — | | | $ | — | | | $ | 31,392,996 | |
| | | | | | | | | | | | | | | | |
Appreciation in Other Financial Instruments | | | | | | | | | | | | | | | | |
Forward Foreign Currency Exchange Contracts | | $ | — | | | $ | 586,744 | | | $ | — | | | $ | 586,744 | |
| | | | | | | | | | | | | | | | |
Depreciation in Other Financial Instruments | | | | | | | | | | | | | | | | |
Forward Foreign Currency Exchange Contracts | | $ | — | | | $ | (52,235 | ) | | $ | — | | | $ | (52,235 | ) |
| | | | | | | | | | | | | | | | |
International Equity ETF
| | | | | | | | | | | | | | | | |
| | | Level 1
Quoted prices | | | Level 2
Other significant
observable inputs | | | Level 3
Significant
unobservable inputs | | | Total | |
Investments in Securities | | | | | | | | | | | | | | | | |
Common Stocks | | | | | | | | | | | | | | | | |
Australia | | $ | — | | | $ | 129,936,743 | | | $ | — | | | $ | 129,936,743 | |
Austria | | | — | | | | 6,350,916 | | | | — | | | | 6,350,916 | |
Belgium | | | — | | | | 15,917,844 | | | | — | | | | 15,917,844 | |
Chile | | | — | | | | 4,565,763 | | | | — | | | | 4,565,763 | |
China | | | — | | | | 12,527,209 | | | | — | | | | 12,527,209 | |
Denmark | | | — | | | | 13,306,007 | | | | — | | | | 13,306,007 | |
Finland | | | — | | | | 26,933,019 | | | | — | | | | 26,933,019 | |
France | | | 1,149,917 | | | | 77,749,068 | | | | — | | | | 78,898,985 | |
Germany | | | — | | | | 56,644,526 | | | | — | | | | 56,644,526 | |
Hong Kong | | | — | | | | 79,563,945 | | | | — | | | | 79,563,945 | |
| | | | | | | | |
| | | |
| OCTOBER 31, 2018 | | J.P. MORGAN EXCHANGE-TRADED FUNDS | | | | | 205 | |
NOTES TO FINANCIAL STATEMENTS
AS OF OCTOBER 31, 2018 (continued)
International Equity ETF (continued)
| | | | | | | | | | | | | | | | |
| | | Level 1
Quoted prices | | | Level 2
Other significant
observable inputs | | | Level 3
Significant
unobservable inputs | | | Total | |
Italy | | $ | 3,603,621 | | | $ | 14,380,080 | | | $ | — | | | $ | 17,983,701 | |
Japan | | | — | | | | 360,697,405 | | | | — | | | | 360,697,405 | |
Jordan | | | — | | | | 5,903,511 | | | | — | | | | 5,903,511 | |
Luxembourg | | | — | | | | 2,923,916 | | | | — | | | | 2,923,916 | |
Macau | | | — | | | | 2,403,486 | | | | — | | | | 2,403,486 | |
Netherlands | | | — | | | | 36,099,949 | | | | — | | | | 36,099,949 | |
New Zealand | | | — | | | | 10,180,436 | | | | — | | | | 10,180,436 | |
Norway | | | — | | | | 22,500,878 | | | | — | | | | 22,500,878 | |
Portugal | | | 4,441,786 | | | | 5,666,587 | | | | — | | | | 10,108,373 | |
Russia | | | — | | | | 2,219,800 | | | | — | | | | 2,219,800 | |
Singapore | | | — | | | | 37,027,927 | | | | — | | | | 37,027,927 | |
South Africa | | | — | | | | 5,164,463 | | | | — | | | | 5,164,463 | |
South Korea | | | 610,818 | | | | 132,756,892 | | | | — | | | | 133,367,710 | |
Spain | | | — | | | | 25,692,088 | | | | — | | | | 25,692,088 | |
Sweden | | | — | | | | 47,558,831 | | | | — | | | | 47,558,831 | |
Switzerland | | | — | | | | 34,525,253 | | | | — | | | | 34,525,253 | |
United Arab Emirates | | | — | | | | 1,511,673 | | | | — | | | | 1,511,673 | |
United Kingdom | | | — | | | | 237,018,895 | | | | — | | | | 237,018,895 | |
United States | | | — | | | | 13,133,626 | | | | — | | | | 13,133,626 | |
| | | | | | | | | | | | | | | | |
Total Common Stocks | | | 9,806,142 | | | | 1,420,860,736 | | | | — | | | | 1,430,666,878 | |
| | | | | | | | | | | | | | | | |
Rights | | | — | | | | — | (a) | | | — | | | | — | (a) |
Short-Term Investments | | | | | | | | | | | | | | | | |
Investment Company | | | 6,618,219 | | | | — | | | | — | | | | 6,618,219 | |
| | | | | | | | | | | | | | | | |
Total Investments in Securities | | $ | 16,424,361 | | | $ | 1,420,860,736 | | | $ | — | | | $ | 1,437,285,097 | |
| | | | | | | | | | | | | | | | |
Depreciation in Other Financial Instruments | | | | | | | | | | | | | | | | |
Futures Contracts | | $ | (86,079 | ) | | $ | — | | | $ | — | | | $ | (86,079 | ) |
| | | | | | | | | | | | | | | | |
U.S. Equity ETF
| | | | | | | | | | | | | | | | |
| | | Level 1
Quoted prices | | | Level 2
Other significant
observable inputs | | | Level 3
Significant
unobservable inputs | | | Total | |
Investments in Securities | | | | | | | | | | | | | | | | |
Common Stocks (b) | | $ | 551,719,671 | | | $ | — | | | $ | — | | | $ | 551,719,671 | |
Short-Term Investments | | | | | | | | | | | | | | | | |
Investment Companies | | | 6,889,863 | | | | — | | | | — | | | | 6,889,863 | |
Investment of Cash Collateral from Securities Loaned | | | 4,709,887 | | | | — | | | | — | | | | 4,709,887 | |
| | | | | | | | | | | | | | | | |
Total Investments in Securities | | $ | 563,319,421 | | | $ | — | | | $ | — | | | $ | 563,319,421 | |
| | | | | | | | | | | | | | | | |
Depreciation in Other Financial Instruments | | | | | | | | | | | | | | | | |
Futures Contracts | | $ | (19,448 | ) | | $ | — | | | $ | — | | | $ | (19,448 | ) |
| | | | | | | | | | | | | | | | |
| | | | | | |
| | | |
| 206 | | | | J.P. MORGAN EXCHANGE-TRADED FUNDS | | OCTOBER 31, 2018 |
U.S. Mid Cap Equity ETF
| | | | | | | | | | | | | | | | |
| | | Level 1
Quoted prices | | | Level 2
Other significant
observable inputs | | | Level 3
Significant
unobservable inputs | | | Total | |
Investments in Securities | | | | | | | | | | | | | | | | |
Common Stocks (b) | | $ | 108,211,311 | | | $ | — | | | $ | — | | | $ | 108,211,311 | |
Short-Term Investments | | | | | | | | | | | | | | | | |
Investment Companies | | | 3,620,915 | | | | — | | | | — | | | | 3,620,915 | |
Investment of Cash Collateral from Securities Loaned | | | 643,332 | | | | — | | | | — | | | | 643,332 | |
| | | | | | | | | | | | | | | | |
Total Investments in Securities | | $ | 112,475,558 | | | $ | — | | | $ | — | | | $ | 112,475,558 | |
| | | | | | | | | | | | | | | | |
Depreciation in Other Financial Instruments | | | | | | | | | | | | | | | | |
Futures Contracts | | $ | (19,830 | ) | | $ | — | | | $ | — | | | $ | (19,830 | ) |
| | | | | | | | | | | | | | | | |
U.S. Small Cap Equity ETF
| | | | | | | | | | | | | | | | |
| | | Level 1
Quoted prices | | | Level 2
Other significant
observable inputs | | | Level 3
Significant
unobservable inputs | | | Total | |
Investments in Securities | | | | | | | | | | | | | | | | |
Common Stocks (b) | | $ | 94,517,775 | | | $ | — | | | $ | — | | | $ | 94,517,775 | |
Rights | | | | | | | | | | | | | | | | |
Chemicals | | | — | | | | — | | | | — | (a) | | | — | (a) |
Media | | | — | | | | — | | | | 75 | | | | 75 | |
| | | | | | | | | | | | | | | | |
Total Rights | | | — | | | | — | | | | 75 | | | | 75 | |
| | | | | | | | | | | | | | | | |
Short-Term Investments | | | | | | | | | | | | | | | | |
Investment Companies | | | 1,505,075 | | | | — | | | | — | | | | 1,505,075 | |
Investment of Cash Collateral from Securities Loaned | | | 2,431,125 | | | | — | | | | — | | | | 2,431,125 | |
| | | | | | | | | | | | | | | | |
Total Investments in Securities | | $ | 98,453,975 | | | $ | — | | | $ | 75 | | | $ | 98,454,050 | |
| | | | | | | | | | | | | | | | |
Depreciation in Other Financial Instruments | | | | | | | | | | | | | | | | |
Futures Contracts | | $ | (28,586 | ) | | $ | — | | | $ | — | | | $ | (28,586 | ) |
| | | | | | | | | | | | | | | | |
U.S. Dividend ETF
| | | | | | | | | | | | | | | | |
| | | Level 1
Quoted prices | | | Level 2
Other significant
observable inputs | | | Level 3
Significant
unobservable inputs | | | Total | |
Investments in Securities | | | | | | | | | | | | | | | | |
Common Stocks (b) | | $ | 26,099,093 | | | $ | — | | | $ | — | | | $ | 26,099,093 | |
Short-Term Investments | | | | | | | | | | | | | | | | |
Investment Companies | | | 1,248,859 | | | | — | | | | — | | | | 1,248,859 | |
Investment of Cash Collateral from Securities Loaned | | | 148,580 | | | | — | | | | — | | | | 148,580 | |
| | | | | | | | | | | | | | | | |
Total Investments in Securities | | $ | 27,496,532 | | | $ | — | | | $ | — | | | $ | 27,496,532 | |
| | | | | | | | | | | | | | | | |
Depreciation in Other Financial Instruments | | | | | | | | | | | | | | | | |
Futures Contracts | | $ | (18,041 | ) | | $ | — | | | $ | — | | | $ | (18,041 | ) |
| | | | | | | | | | | | | | | | |
| | | | | | | | |
| | | |
| OCTOBER 31, 2018 | | J.P. MORGAN EXCHANGE-TRADED FUNDS | | | | | 207 | |
NOTES TO FINANCIAL STATEMENTS
AS OF OCTOBER 31, 2018 (continued)
U.S. Minimum Volatility ETF
| | | | | | | | | | | | | | | | |
| | | Level 1
Quoted prices | | | Level 2
Other significant
observable inputs | | | Level 3
Significant
unobservable inputs | | | Total | |
Investments in Securities | | | | | | | | | | | | | | | | |
Common Stocks (b) | | $ | 26,671,887 | | | $ | — | | | $ | — | | | $ | 26,671,887 | |
Short-Term Investments | | | | | | | | | | | | | | | | |
Investment Companies | | | 760,666 | | | | — | | | | — | | | | 760,666 | |
Investment of Cash Collateral from Securities Loaned | | | 93,840 | | | | — | | | | — | | | | 93,840 | |
| | | | | | | | | | | | | | | | |
Total Investments in Securities | | $ | 27,526,393 | | | $ | — | | | $ | — | | | $ | 27,526,393 | |
| | | | | | | | | | | | | | | | |
Depreciation in Other Financial Instruments | | | | | | | | | | | | | | | | |
Futures Contracts | | $ | (4,248 | ) | | $ | — | | | $ | — | | | $ | (4,248 | ) |
| | | | | | | | | | | | | | | | |
U.S. Momentum Factor ETF
| | | | | | | | | | | | | | | | |
| | | Level 1
Quoted prices | | | Level 2
Other significant
observable inputs | | | Level 3
Significant
unobservable inputs | | | Total | |
Investments in Securities | | | | | | | | | | | | | | | | |
Common Stocks (b) | | $ | 28,548,871 | | | $ | — | | | $ | — | | | $ | 28,548,871 | |
Short-Term Investments | | | | | | | | | | | | | | | | |
Investment Companies | | | 63,323 | | | | — | | | | — | | | | 63,323 | |
Investment of Cash Collateral from Securities Loaned | | | 66,300 | | | | — | | | | — | | | | 66,300 | |
| | | | | | | | | | | | | | | | |
Total Investments in Securities | | $ | 28,678,494 | | | $ | — | | | $ | — | | | $ | 28,678,494 | |
| | | | | | | | | | | | | | | | |
U.S. Quality Factor ETF
| | | | | | | | | | | | | | | | |
| | | Level 1
Quoted prices | | | Level 2
Other significant
observable inputs | | | Level 3
Significant
unobservable inputs | | | Total | |
Investments in Securities | | | | | | | | | | | | | | | | |
Common Stocks (b) | | $ | 28,229,641 | | | $ | — | | | $ | — | | | $ | 28,229,641 | |
Short-Term Investments | | | | | | | | | | | | | | | | |
Investment Companies | | | 836,372 | | | | — | | | | — | | | | 836,372 | |
Investment of Cash Collateral from Securities Loaned | | | 58,800 | | | | — | | | | — | | | | 58,800 | |
| | | | | | | | | | | | | | | | |
Total Investments in Securities | | $ | 29,124,813 | | | $ | — | | | $ | — | | | $ | 29,124,813 | |
| | | | | | | | | | | | | | | | |
Depreciation in Other Financial Instruments | | | | | | | | | | | | | | | | |
Futures Contracts | | $ | (10,682 | ) | | $ | — | | | $ | — | | | $ | (10,682 | ) |
| | | | | | | | | | | | | | | | |
U.S. Value Factor ETF
| | | | | | | | | | | | | | | | |
| | | Level 1
Quoted prices | | | Level 2
Other significant
observable inputs | | | Level 3
Significant
unobservable inputs | | | Total | |
Investments in Securities | | | | | | | | | | | | | | | | |
Common Stocks (b) | | $ | 28,210,236 | | | $ | — | | | $ | — | | | $ | 28,210,236 | |
Short-Term Investments | | | | | | | | | | | | | | | | |
Investment Companies | | | 692,762 | | | | — | | | | — | | | | 692,762 | |
Investment of Cash Collateral from Securities Loaned | | | 57,600 | | | | — | | | | — | | | | 57,600 | |
| | | | | | | | | | | | | | | | |
Total Investments in Securities | | $ | 28,960,598 | | | $ | — | | | $ | — | | | $ | 28,960,598 | |
| | | | | | | | | | | | | | | | |
Depreciation in Other Financial Instruments | | | | | | | | | | | | | | | | |
Futures Contracts | | $ | (7,590 | ) | | $ | — | | | $ | — | | | $ | (7,590 | ) |
| | | | | | | | | | | | | | | | |
| (a) | Amount rounds to less than 1. |
| (b) | All portfolio holdings designated as level 1 are disclosed individually on the SOI. Please refer to the SOI for industry specifics of portfolio holdings. |
| | | | | | |
| | | |
| 208 | | | | J.P. MORGAN EXCHANGE-TRADED FUNDS | | OCTOBER 31, 2018 |
There were no transfers among any levels for the period ended October 31, 2018.
B. Restricted Securities — Certain securities held by the Funds may be subject to legal or contractual restrictions on resale. Restricted securities generally are resold in transactions exempt from registration under the Securities Act of 1933, as amended (the “Securities Act”). Disposal of these securities may involve time-consuming negotiations and expense. Prompt sale at the current valuation may be difficult and could adversely affect the NAVs of the Funds.
As of October 31, 2018, the Funds had no investments in restricted securities other than securities sold to the Funds under Rule 144A and Regulation S under the Securities Act.
C. Derivatives — All Funds, except U.S. Momentum Factor ETF, used derivative instruments including futures and forward foreign currency exchange contracts, in connection with their respective investment strategies. Derivative instruments may be used as substitutes for securities in which the Funds can invest, to hedge portfolio investments or to generate income or gain to the Funds. Derivatives may also be used to manage duration, sector and yield curve exposures and credit and spread volatility.
The Funds may be subject to various risks from the use of derivatives including the risk that changes in the value of a derivative may not correlate perfectly with the underlying asset, rate or index; counterparty credit risk related to derivatives counterparties’ failure to perform under contract terms; liquidity risk related to the lack of a liquid market for these contracts allowing a Fund to close out its position(s); and documentation risk relating to disagreement over contract terms. Investing in certain derivatives also results in a form of leverage and as such, the Funds’ risk of loss associated with these instruments may exceed their value, as recorded on the Statements of Assets and Liabilities (“SAL”).
The Funds are party to various derivative contracts governed by International Swaps and Derivatives Association master agreements (“ISDA agreements”). The Funds’ ISDA agreements, which are separately negotiated with each dealer counterparty, may contain provisions allowing, absent other considerations, a counterparty to exercise rights, to the extent not otherwise waived, against the Funds in the event the Funds’ net assets decline over time by a pre-determined percentage or fall below a pre-determined floor. The ISDA agreements may also contain provisions allowing, absent other conditions, the Funds to exercise rights, to the extent not otherwise waived, against a counterparty (e.g., decline in a counterparty’s credit rating below a specified level). Such rights for both a counterparty and the Funds often include the ability to terminate (i.e., close out) open contracts at prices which may favor a counterparty, which could have an adverse effect on the Funds. The ISDA agreements give the Funds and a counterparty the right, upon an event of default, to close out all transactions traded under such agreements and to net amounts owed or due across all transactions and offset such net payable or receivable with collateral posted to a segregated account by one party to the other.
Counterparty credit risk may be mitigated to the extent a counterparty posts collateral for mark to market gains to the Funds.
Notes C(1) — C(3) below describe the various derivatives used by the Funds.
(1). Futures Contracts — All funds, except Europe Currency Hedged ETF, International Currency Hedged ETF and U.S. Momentum Factor ETF, used index futures contracts to obtain long and short exposure to the underlying commodities markets, to gain or reduce exposure to the stock market, to gain or reduce exposure to particular countries or regions, maintain liquidity, minimize transaction costs or to manage and hedge interest rate risk associated with portfolio investments.
Futures contracts provide for the delayed delivery of the underlying instrument at a fixed price or are settled for a cash amount based on the change in the value of the underlying instrument at a specific date in the future. Upon entering into a futures contract, the Funds are required to deposit with the broker, cash or securities in an amount equal to a certain percentage of the contract amount, which is referred to as the initial margin deposit. Subsequent payments, referred to as variation margin, are made or received by the Funds periodically and are based on changes in the market value of open futures contracts. Changes in the market value of open futures contracts are recorded as Change in net unrealized appreciation/depreciation on the Statements of Operations (“SOP”). Realized gains or losses, representing the difference between the value of the contract at the time it was opened and the value at the time it was closed, are reported on the SOP at the closing or expiration of the futures contract. Securities deposited as initial margin are designated in the SOIs and cash deposited, which is considered restricted, is recorded on the SAL. A receivable from and/or a payable to brokers for the daily variation margin is also recorded on the SAL.
The use of futures contracts exposes the Funds to equity price risk. The Funds may be subject to the risk that the change in the value of the futures contract may not correlate perfectly with the underlying instrument. Use of long futures contracts subjects the Funds to risk of loss in excess of the amounts shown on the SAL, up to the notional amount of the futures contracts. Use of short futures contracts subjects the Funds to unlimited risk of loss. The Funds may enter into futures contracts only on exchanges or boards of trade. The exchange or board of trade acts as the counterparty to each futures transaction; therefore, the Funds’ credit risk is limited to failure of the exchange or board of trade. Under some circumstances, futures exchanges may establish daily limits on the amount that the price of a futures contract can vary from the previous day’s settlement price, which could effectively prevent liquidation of positions.
The Funds’ futures contracts are not subject to master netting arrangements (the right to close out all transactions traded with a counterparty and net amounts owed or due across transactions).
(2). Forward Foreign Currency Exchange Contracts — The Europe Currency Hedged ETF and International Currency Hedged ETF may be exposed to foreign currency risks associated with some or all of the portfolio investments and used forward foreign currency exchange contracts to hedge or manage certain of these exposures as part of an investment strategy. The Funds also bought forward foreign currency exchange contracts to gain
| | | | | | | | |
| | | |
| OCTOBER 31, 2018 | | J.P. MORGAN EXCHANGE-TRADED FUNDS | | | | | 209 | |
NOTES TO FINANCIAL STATEMENTS
AS OF OCTOBER 31, 2018 (continued)
exposure to currencies. Forward foreign currency exchange contracts represent obligations to purchase or sell foreign currency on a specified future date at a price fixed at the time the contracts are entered into. Non-deliverable forward foreign currency exchange contracts are settled with the counterparty in U.S. Dollar without the delivery of foreign currency.
The values of the forward foreign currency exchange contracts are adjusted daily based on the applicable exchange rate of the underlying currency. Changes in the value of these contracts are recorded as unrealized appreciation or depreciation until the contract settlement date. When the forward foreign currency exchange contract is closed, the Funds record a realized gain or loss equal to the difference between the value at the time the contract was opened and the value at the time it was closed. The Funds also record a realized gain or loss when a forward foreign currency exchange contract offsets another forward foreign currency exchange contract with the same counterparty upon settlement.
These Funds’ forward foreign currency exchange contracts are subject to master netting arrangements (the right to close out all transactions with a counterparty and net amounts owed or due across transactions).
The Funds may be required to post or receive collateral for non-deliverable forward foreign currency exchange contracts.
(3). Summary of Derivatives Information
The following tables present the value of derivatives held as of October 31, 2018, by their primary underlying risk exposure and respective location on the SAL:
BetaBuilders Canada ETF
| | | | | | |
| Derivative Contracts | | Statements of Assets and Liabilities Location | | | |
| Gross Assets: | | | | Futures
Contracts | |
| Equity contracts | | Payables, Net assets — Unrealized Depreciation | | $ | (382,489 | ) |
| | | | | | |
BetaBuilders Developed Asia ex-Japan ETF
| | | | | | |
| Derivative Contracts | | Statements of Assets and Liabilities Location | | | |
| Gross Assets: | | | | Futures
Contracts | |
| Equity contracts | | Receivables, Net assets — Unrealized Appreciation | | $ | 4,357 | |
| | | | | | |
| Equity contracts | | Payables, Net assets — Unrealized Depreciation | | | (98,086 | ) |
| | | | | | |
BetaBuilders Europe ETF
| | | | | | |
| Derivative Contracts | | Statements of Assets and Liabilities Location | | | |
| Gross Assets: | | | | Futures
Contracts | |
| Equity contracts | | Receivables, Net assets — Unrealized Appreciation | | $ | 33,855 | |
| | | | | | |
| Equity contracts | | Payables, Net assets — Unrealized Depreciation | | | (53,241 | ) |
| | | | | | |
BetaBuilders Japan ETF
| | | | | | |
| Derivative Contracts | | Statements of Assets and Liabilities Location | | | |
| Gross Assets: | | | | Futures
Contracts | |
| Equity contracts | | Payables, Net assets — Unrealized Depreciation | | $ | (576,077 | ) |
| | | | | | |
Emerging Markets Equity ETF
| | | | | | |
| Derivative Contracts | | Statements of Assets and Liabilities Location | | | |
| Gross Assets: | | | | Futures
Contracts | |
| Equity contracts | | Receivables, Net assets — Unrealized Appreciation | | $ | 14,197 | |
| | | | | | |
| | | | | | |
| | | |
| 210 | | | | J.P. MORGAN EXCHANGE-TRADED FUNDS | | OCTOBER 31, 2018 |
Europe Currency Hedged ETF
| | | | | | |
| Derivative Contracts | | Statements of Assets and Liabilities Location | | | |
| Gross Assets: | | | | Forward Foreign
Currency Exchange
Contracts | |
| Foreign exchange contracts | | Receivables | | $ | 835,882 | |
| | | | | | |
| Foreign exchange contracts | | Payables | | | (23,066 | ) |
| | | | | | |
Europe Equity ETF
| | | | | | |
| Derivative Contracts | | Statements of Assets and Liabilities Location | | | |
| Gross Assets: | | | | Futures
Contracts | |
| Equity contracts | | Receivables, Net assets — Unrealized Appreciation | | $ | 6,606 | |
| | | | | | |
Global Equity ETF
| | | | | | |
| Derivative Contracts | | Statements of Assets and Liabilities Location | | | |
| Gross Assets: | | | | Futures
Contracts | |
| Equity contracts | | Payables, Net assets — Unrealized Depreciation | | $ | (17,876 | ) |
| | | | | | |
International Currency Hedged ETF
| | | | | | |
| Derivative Contracts | | Statements of Assets and Liabilities Location | | | |
| Gross Assets: | | | | Forward Foreign
Currency Exchange
Contracts | |
Foreign exchange contracts | | Receivables | | $ | 586,744 | |
| | | | | | |
Foreign exchange contracts | | Payables | | | (52,235 | ) |
| | | | | | |
International Equity ETF
| | | | | | |
| Derivative Contracts | | Statements of Assets and Liabilities Location | | | |
| Gross Assets: | | | | Futures
Contracts | |
| Equity contracts | | Payables, Net assets — Unrealized Depreciation | | $ | (86,079 | ) |
| | | | | | |
U.S. Equity ETF
| | | | | | |
| Derivative Contracts | | Statements of Assets and Liabilities Location | | | |
| Gross Assets: | | | | Futures
Contracts | |
| Equity contracts | | Payables, Net assets — Unrealized Depreciation | | $ | (19,448 | ) |
| | | | | | |
U.S. Mid Cap Equity ETF
| | | | | | |
| Derivative Contracts | | Statements of Assets and Liabilities Location | | | |
| Gross Assets: | | | | Futures
Contracts | |
| Equity contracts | | Payables, Net assets — Unrealized Depreciation | | $ | (19,830 | ) |
| | | | | | |
U.S. Small Cap Equity ETF
| | | | | | |
| Derivative Contracts | | Statements of Assets and Liabilities Location | | | |
| Gross Assets: | | | | Futures
Contracts | |
| Equity contracts | | Payables, Net assets — Unrealized Depreciation | | $ | (28,586 | ) |
| | | | | | |
| | | | | | | | |
| | | |
| OCTOBER 31, 2018 | | J.P. MORGAN EXCHANGE-TRADED FUNDS | | | | | 211 | |
NOTES TO FINANCIAL STATEMENTS
AS OF OCTOBER 31, 2018 (continued)
U.S. Dividend ETF
| | | | | | |
| Derivative Contracts | | Statements of Assets and Liabilities Location | | | |
| Gross Assets: | | | | Futures
Contracts | |
| Equity contracts | | Payables, Net assets — Unrealized Depreciation | | $ | (18,041 | ) |
| | | | | | |
U.S. Minimum Volatility ETF
| | | | | | |
| Derivative Contracts | | Statements of Assets and Liabilities Location | | | |
| Gross Assets: | | | | Futures
Contracts | |
| Equity contracts | | Payables, Net assets — Unrealized Depreciation | | $ | (4,248 | ) |
| | | | | | |
U.S. Quality Factor ETF
| | | | | | |
| Derivative Contracts | | Statements of Assets and Liabilities Location | | | |
| Gross Assets: | | | | Futures
Contracts | |
| Equity contracts | | Payables, Net assets — Unrealized Depreciation | | $ | (10,682 | ) |
| | | | | | |
U.S. Value Factor ETF
| | | | | | |
| Derivative Contracts | | Statements of Assets and Liabilities Location | | | |
| Gross Assets: | | | | Futures
Contracts | |
| Equity contracts | | Payables, Net assets — Unrealized Depreciation | | $ | (7,590 | ) |
| | | | | | |
The following tables present the Funds’ gross derivative assets and liabilities by counterparty net of amounts available for offset under netting arrangements and any related collateral received or posted by the Funds as of October 31, 2018.
Europe Currency Hedged ETF
| | | | | | | | | | | | | | | | |
| Counterparty | | Gross Amount of
Derivative Assets
Subject to Netting
Arrangements
Presented in the
Statement of Assets and
Liabilities (a) | | | Derivatives
Available
for offset | | | Collateral
Received | | | Net Amount Due
from Counterparty
(not less than zero) | |
Barclays Bank plc | | $ | 438,386 | | | $ | (1,606 | ) | | $ | — | | | $ | 436,780 | |
BNP Paribas | | | 85,558 | | | | (3,937 | ) | | | — | | | | 81,621 | |
Citibank, NA | | | 156,579 | | | | (1,831 | ) | | | — | | | | 154,748 | |
Goldman Sachs International | | | 107,127 | | | | (8,786 | ) | | | — | | | | 98,341 | |
Merrill Lynch International | | | 35,328 | | | | (6,053 | ) | | | — | | | | 29,275 | |
National Australia Bank Ltd. | | | 853 | | | | — | | | | — | | | | 853 | |
Royal Bank of Canada | | | 6,064 | | | | (578 | ) | | | — | | | | 5,486 | |
Societe Generale | | | 5,865 | | | | (275 | ) | | | — | | | | 5,590 | |
TD Bank Financial Group | | | 122 | | | | — | | | | — | | | | 122 | |
| | | | | | | | | | | | | | | | |
Total | | $ | 835,882 | | | $ | (23,066 | ) | | $ | — | | | $ | 812,816 | |
| | | | | | | | | | | | | | | | |
| | | | |
| Counterparty | | Gross Amount of Derivative Liabilities
Subject to Netting
Arrangements
Presented in the
Statement of Assets and
Liabilities (a) | | | Derivatives
Available
for Offset | | | Collateral
Pledged | | | Net Amount Due
to Counterparty | |
Barclays Bank plc | | $ | 1,606 | | | $ | (1,606) | | | $ | — | | | $ | — | |
BNP Paribas | | | 3,937 | | | | (3,937 | ) | | | — | | | | — | |
Citibank, NA | | | 1,831 | | | | (1,831 | ) | | | — | | | | — | |
Goldman Sachs International | | | 8,786 | | | | (8,786 | ) | | | — | | | | — | |
Merrill Lynch International | | | 6,053 | | | | (6,053 | ) | | | — | | | | — | |
Royal Bank of Canada | | | 578 | | | | (578 | ) | | | — | | | | — | |
Societe Generale | | | 275 | | | | (275 | ) | | | — | | | | — | |
| | | | | | | | | | | | | | | | |
Total | | $ | 23,066 | | | $ | (23,066) | | | $ | — | | | $ | — | |
| | | | | | | | | | | | | | | | |
| | | | | | |
| | | |
| 212 | | | | J.P. MORGAN EXCHANGE-TRADED FUNDS | | OCTOBER 31, 2018 |
International Currency Hedged ETF
| | | | | | | | | | | | | | | | |
| Counterparty | | Gross Amount of
Derivative Assets
Subject to Netting
Arrangements
Presented in the
Statement of Assets and
Liabilities (a) | | | Derivatives
Available
for offset | | | Collateral
Received | | | Net Amount Due
from Counterparty
(not less than zero) | |
Barclays Bank plc | | $ | 177,740 | | | $ | (2,319 | ) | | $ | — | | | $ | 175,421 | |
BNP Paribas SA | | | 50,776 | | | | (1,453 | ) | | | — | | | | 49,323 | |
Citibank, NA | | | 144,009 | | | | (2,965 | ) | | | — | | | | 141,044 | |
Goldman Sachs International | | | 1,739 | | | | (837 | ) | | | — | | | | 902 | |
HSBC Bank, NA | | | 64359 | | | | (747 | ) | | | — | | | | 63,612 | |
Merrill Lynch International | | | 104,783 | | | | (5,641 | ) | | | — | | | | 99,142 | |
National Australia Bank Ltd. | | | 11,478 | | | | (4,498 | ) | | | — | | | | 6,980 | |
Royal Bank of Canada | | | 1,514 | | | | (189 | ) | | | — | | | | 1,325 | |
Societe Generale | | | 966 | | | | (680 | ) | | | — | | | | 286 | |
State Street Corp. | | | 28,115 | | | | (28,115 | ) | | | — | | | | — | |
UBS AG | | | 1,265 | | | | (238 | ) | | | — | | | | 1,027 | |
| | | | | | | | | | | | | | | | |
Total | | $ | 586,744 | | | $ | (47,682 | ) | | $ | — | | | $ | 539,062 | |
| | | | | | | | | | | | | | | | |
| | | | |
| Counterparty | | Gross Amount of
Derivative Liabilities Subject to Netting
Arrangements
Presented in the
Statement of Assets and
Liabilities (a) | | | Derivatives
Available
for Offset | | | Collateral
Pledged | | | Net Amount Due
to Counterparty | |
Barclays Bank plc | | $ | 2,319 | | | $ | (2,319 | ) | | $ | — | | | $ | — | |
BNP Paribas SA | | | 1,453 | | | | (1,453 | ) | | | — | | | | — | |
Citibank, NA | | | 2,965 | | | | (2,965 | ) | | | — | | | | — | |
Goldman Sachs International | | | 837 | | | | (837 | ) | | | — | | | | — | |
HSBC Bank, NA | | | 747 | | | | (747 | ) | | | — | | | | — | |
Merrill Lynch International | | | 5,641 | | | | (5,641 | ) | | | — | | | | — | |
National Australia Bank Ltd. | | | 4,498 | | | | (4,498 | ) | | | — | | | | — | |
Royal Bank of Canada | | | 189 | | | | (189 | ) | | | — | | | | — | |
Societe Generale | | | 680 | | | | (680 | ) | | | — | | | | — | |
State Street Corp. | | | 32,668 | | | | (28,115 | ) | | | — | | | | 4,553 | |
UBS AG | | | 238 | | | | (238 | ) | | | — | | | | — | |
| | | | | | | | | | | | | | | | |
Total | | $ | 52,235 | | | $ | (47,682 | ) | | $ | — | | | $ | 4,553 | |
| | | | | | | | | | | | | | | | |
| (a) | For financial reporting purposes, the Fund does not offset derivative assets and derivative liabilities subject to master netting arrangements on the SAL. |
The following tables present the effect of derivatives on the SOP for the period ended October 31, 2018, by primary underlying risk exposure:
BetaBuilders Canada ETF
| | | | |
| Amount of Realized Gain (Loss) on Derivatives Recognized on the Statements of Operations | |
| Derivative Contracts | | Futures
Contracts | |
Equity contracts | | $ | (57,994 | ) |
| | | | |
| | | | |
| Amount of Change in Unrealized Appreciation (Depreciation) on Derivatives Recognized on the Statements of Operations | |
| Derivative Contracts | | Futures
Contracts | |
Equity contracts | | $ | (382,489 | ) |
| | | | |
| | | | | | | | |
| | | |
| OCTOBER 31, 2018 | | J.P. MORGAN EXCHANGE-TRADED FUNDS | | | | | 213 | |
NOTES TO FINANCIAL STATEMENTS
AS OF OCTOBER 31, 2018 (continued)
BetaBuilders Developed Asia ex-Japan ETF
| | | | |
| Amount of Realized Gain (Loss) on Derivatives Recognized on the Statements of Operations | |
| Derivative Contracts | | Futures
Contracts | |
Equity contracts | | $ | (153,173 | ) |
| | | | |
| | | | |
| Amount of Change in Unrealized Appreciation (Depreciation) on Derivatives Recognized on the Statements of Operations | |
| Derivative Contracts | | Futures
Contracts | |
Equity contracts | | $ | (93,729 | ) |
| | | | |
BetaBuilders Europe ETF
| | | | |
| Amount of Realized Gain (Loss) on Derivatives Recognized on the Statements of Operations | |
| Derivative Contracts | | Futures
Contracts | |
Equity contracts | | $ | (157,096 | ) |
| | | | |
| | | | |
| Amount of Change in Unrealized Appreciation (Depreciation) on Derivatives Recognized on the Statements of Operations | |
| Derivative Contracts | | Futures
Contracts | |
Equity contracts | | $ | (19,386 | ) |
| | | | |
| | | | |
BetaBuilders Japan ETF | |
| Amount of Realized Gain (Loss) on Derivatives Recognized on the Statements of Operations | |
| Derivative Contracts | | Futures
Contracts | |
Equity contracts | | $ | (1,329,164 | ) |
| | | | |
| | | | |
| Amount of Change in Unrealized Appreciation (Depreciation) on Derivatives Recognized on the Statements of Operations | |
| Derivative Contracts | | Futures
Contracts | |
Equity contracts | | $ | (576,077 | ) |
| | | | |
Emerging Markets Equity ETF
| | | | |
| Amount of Realized Gain (Loss) on Derivatives Recognized on the Statements of Operations | |
| Derivative Contracts | | Futures
Contracts | |
Equity contracts | | $ | 95,710 | |
| | | | |
| | | | |
| Amount of Change in Unrealized Appreciation (Depreciation) on Derivatives Recognized on the Statements of Operations | |
| Derivative Contracts | | Futures
Contracts | |
Equity contracts | | $ | 14,197 | |
| | | | |
| | | | | | |
| | | |
| 214 | | | | J.P. MORGAN EXCHANGE-TRADED FUNDS | | OCTOBER 31, 2018 |
Europe Currency Hedged ETF
| | | | |
| Amount of Realized Gain (Loss) on Derivatives Recognized on the Statements of Operations | |
| Derivative Contracts | | Forward Foreign
Currency Exchange
Contracts | |
Foreign exchange contracts | | $ | 1,354,327 | |
| | | | |
| | | | |
| Amount of Change in Unrealized Appreciation (Depreciation) on Derivatives Recognized on the Statements of Operations | |
| Derivative Contracts | | Forward Foreign
Currency Exchange
Contracts | |
Foreign exchange contracts | | $ | 296,540 | |
| | | | |
Europe Equity ETF
| | | | |
| Amount of Realized Gain (Loss) on Derivatives Recognized on the Statements of Operations | |
| Derivative Contracts | | Futures
Contracts | |
Equity contracts | | $ | (224,991 | ) |
| | | | |
| Amount of Change in Unrealized Appreciation (Depreciation) on Derivatives Recognized on the Statements of Operations | |
| Derivative Contracts | | Futures
Contracts | |
Equity contracts | | $ | 6,606 | |
| | | | |
Global Equity ETF
| | | | |
| Amount of Realized Gain (Loss) on Derivatives Recognized on the Statements of Operations | |
| Derivative Contracts | | Futures
Contracts | |
Equity contracts | | $ | (6,868 | ) |
| | | | |
| Amount of Change in Unrealized Appreciation (Depreciation) on Derivatives Recognized on the Statements of Operations | |
| Derivative Contracts | | Futures
Contracts | |
Equity contracts | | $ | (17,876 | ) |
| | | | |
International Currency Hedged ETF
| | | | |
| Amount of Realized Gain (Loss) on Derivatives Recognized on the Statements of Operations | |
| Derivative Contracts | | Forward Foreign
Currency Exchange
Contracts | |
Foreign exchange contracts | | $ | 817,698 | |
| | | | |
Amount of Change in Unrealized Appreciation (Depreciation) on Derivatives Recognized on the Statements of Operations | |
| Derivative Contracts | | Forward Foreign
Currency Exchange
Contracts | |
Foreign exchange contracts | | $ | 73,516 | |
| | | | |
| | | | | | | | |
| | | |
| OCTOBER 31, 2018 | | J.P. MORGAN EXCHANGE-TRADED FUNDS | | | | | 215 | |
NOTES TO FINANCIAL STATEMENTS
AS OF OCTOBER 31, 2018 (continued)
International Equity ETF
| | | | |
| Amount of Realized Gain (Loss) on Derivatives Recognized on the Statements of Operations | |
| Derivative Contracts | | Futures
Contracts | |
Equity contracts | | $ | 185,207 | |
| | | | |
| | | | |
| Amount of Change in Unrealized Appreciation (Depreciation) on Derivatives Recognized on the Statements of Operations | |
| Derivative Contracts | | Futures
Contracts | |
Equity contracts | | $ | (221,988 | ) |
| | | | |
U.S. Equity ETF
| | | | |
| Amount of Realized Gain (Loss) on Derivatives Recognized on the Statements of Operations | |
| Derivative Contracts | | Futures
Contracts | |
Equity contracts | | $ | 65,140 | |
| | | | |
| | | | |
| Amount of Change in Unrealized Appreciation (Depreciation) on Derivatives Recognized on the Statements of Operations | |
| Derivative Contracts | | Futures
Contracts | |
Equity contracts | | $ | (43,056 | ) |
| | | | |
U.S. Mid Cap Equity ETF
| | | | |
| Amount of Realized Gain (Loss) on Derivatives Recognized on the Statements of Operations | |
| Derivative Contracts | | Futures
Contracts | |
Equity contracts | | $ | 56,340 | |
| | | | |
| | | | |
| Amount of Change in Unrealized Appreciation (Depreciation) on Derivatives Recognized on the Statements of Operations | |
| Derivative Contracts | | Futures
Contracts | |
Equity contracts | | $ | (19,830 | ) |
| | | | |
U.S. Small Cap Equity ETF
| | | | |
| Amount of Realized Gain (Loss) on Derivatives Recognized on the Statements of Operations | |
| Derivative Contracts | | Futures
Contracts | |
Equity contracts | | $ | 35,583 | |
| | | | |
| | | | |
| Amount of Change in Unrealized Appreciation (Depreciation) on Derivatives Recognized on the Statements of Operations | |
| Derivative Contracts | | Futures
Contracts | |
Equity contracts | | $ | (40,500 | ) |
| | | | |
U.S. Dividend ETF
| | | | |
| Amount of Realized Gain (Loss) on Derivatives Recognized on the Statements of Operations | |
| Derivative Contracts | | Futures
Contracts | |
Equity contracts | | $ | (2,606 | ) |
| | | | |
| | | | |
| Amount of Change in Unrealized Appreciation (Depreciation) on Derivatives Recognized on the Statements of Operations | |
| Derivative Contracts | | Futures
Contracts | |
Equity contracts | | $ | (18,041 | ) |
| | | | |
| | | | | | |
| | | |
| 216 | | | | J.P. MORGAN EXCHANGE-TRADED FUNDS | | OCTOBER 31, 2018 |
U.S. Minimum Volatility ETF
| | | | |
| Amount of Realized Gain (Loss) on Derivatives Recognized on the Statements of Operations | |
| Derivative Contracts | | Futures
Contracts | |
Equity contracts | | $ | (2,021 | ) |
| | | | |
| | | | |
| Amount of Change in Unrealized Appreciation (Depreciation) on Derivatives Recognized on the Statements of Operations | |
| Derivative Contracts | | Futures
Contracts | |
Equity contracts | | $ | (4,248 | ) |
| | | | |
U.S. Quality Factor ETF
| | | | |
| Amount of Realized Gain (Loss) on Derivatives Recognized on the Statements of Operations | |
| Derivative Contracts | | Futures
Contracts | |
Equity contracts | | $ | 3,040 | |
| | | | |
| | | | |
| Amount of Change in Unrealized Appreciation (Depreciation) on Derivatives Recognized on the Statements of Operations | |
| Derivative Contracts | | Futures
Contracts | |
Equity contracts | | $ | (10,682 | ) |
| | | | |
U.S. Value Factor ETF
| | | | |
| Amount of Realized Gain (Loss) on Derivatives Recognized on the Statements of Operations | |
| Derivative Contracts | | Futures
Contracts | |
Equity contracts | | $ | 1,262 | |
| | | | |
| | | | |
| Amount of Change in Unrealized Appreciation (Depreciation) on Derivatives Recognized on the Statements of Operations | |
| Derivative Contracts | | Futures
Contracts | |
Equity contracts | | $ | (7,590 | ) |
| | | | |
Derivatives Volume
The table below discloses the volume of the Funds’ futures contracts and forward foreign currency exchange contracts activity for the period ended October 31, 2018. Please refer to the tables in the Summary of Derivatives Information for derivative-related gains and losses associated with volume activity.
| | | | | | | | | | | | | | | | | | | | | | | | |
| | | BetaBuilders
Canada ETF | | | BetaBuilders
Developed Asia
ex-Japan ETF | | | BetaBuilders
Europe ETF | | | BetaBuilders
Japan ETF | | | Emerging
Markets
Equity ETF | | | Europe
Currency
Hedged ETF | |
Futures Contracts: | | | | | | | | | | | | | | | | | | | | | | | | |
Average Notional Balance Long | | $ | 7,917,477 | (a) | | $ | 3,919,978 | (a) | | $ | 5,688,364 | (b) | | $ | 10,941,741 | (b) | | $ | 523,752 | | | $ | — | |
Ending Notional Balance Long | | | 16,674,070 | | | | 3,106,427 | | | | 9,389,222 | | | | 17,888,067 | | | | 1,004,430 | | | | — | |
Forward Foreign Currency Exchange Contracts: | | | | | | | | | | | | | | | | | | | | | | | | |
Average Settlement Value Purchased | | | — | | | | — | | | | — | | | | — | | | | — | | | | 7,838,855 | |
Average Settlement Value Sold | | | — | | | | — | | | | — | | | | — | | | | — | | | | 42,325,547 | |
Ending Settlement Value Purchased | | | — | | | | — | | | | — | | | | — | | | | — | | | | 2,899,745 | |
Ending Settlement Value Sold | | | — | | | | — | | | | — | | | | — | | | | — | | | | 62,253,075 | |
| | | | | | | | |
| | | |
| OCTOBER 31, 2018 | | J.P. MORGAN EXCHANGE-TRADED FUNDS | | | | | 217 | |
NOTES TO FINANCIAL STATEMENTS
AS OF OCTOBER 31, 2018 (continued)
| | | | | | | | | | | | | | | | | | | | | | | | |
| | | Europe
Equity ETF | | | Global
Equity ETF | | | International
Currency
Hedged ETF | | | International
Equity ETF | | | U.S.
Equity ETF | | | U.S. Mid Cap
Equity ETF | |
Futures Contracts: | | | | | | | | | | | | | | | | | | | | | | | | |
Average Notional Balance Long | | $ | 831,396 | | | $ | 414,840 | | | $ | — | | | $ | 5,170,460 | | | $ | 1,491,406 | | | $ | 584,472 | |
Ending Notional Balance Long | | | 342,854 | | | | 1,992,520 | | | | — | | | | 10,697,290 | | | | 7,046,520 | | | | 3,523,260 | |
Forward Foreign Currency Exchange Contracts: | | | | | | | | | | | | | | | | | | | | | | | | |
Average Settlement Value Purchased | | | — | | | | — | | | | 11,429,570 | | | | — | | | | — | | | | — | |
Average Settlement Value Sold | | | — | | | | — | | | | 53,397,140 | | | | — | | | | — | | | | — | |
Ending Settlement Value Purchased | | | — | | | | — | | | | 3,304,753 | | | | — | | | | — | | | | — | |
Ending Settlement Value Sold | | | — | | | | — | | | | 68,112,734 | | | | — | | | | — | | | | — | |
| | | | | | | | | | | | | | | | | | | | |
| | | U.S. Small
Cap Equity
ETF | | | U.S.
Dividend ETF | | | U.S. Minimum
Volatility ETF | | | U.S.
Quality
Factor ETF | | | U.S. Value
Factor ETF | |
Futures Contracts: | | | | | | | | | | | | | | | | | | | | |
Average Notional Balance Long | | $ | 524,763 | | | $ | 148,633 | (c) | | $ | 67,803 | (c) | | $ | 90,388 | (c) | | $ | 103,416 | (c) |
Ending Notional Balance Long | | | 1,513,100 | | | | 1,219,590 | | | | 677,550 | | | | 948,570 | | | | 813,060 | |
Forward Foreign Currency Exchange Contracts: | | | | | | | | | | | | | | | | | | | | |
Average Settlement Value Purchased | | | — | | | | — | | | | — | | | | — | | | | — | |
Average Settlement Value Sold | | | — | | | | — | | | | — | | | | — | | | | — | |
Ending Settlement Value Purchased | | | — | | | | — | | | | — | | | | — | | | | — | |
Ending Settlement Value Sold | | | — | | | | — | | | | — | | | | — | | | | — | |
| (a) | For the period August 7, 2018 through October 31, 2018. |
| (b) | For the period June 15, 2018 through October 31, 2018. |
| (c) | For the period November 8, 2017 through October 31, 2018. |
The Funds’ derivatives contracts held at October 31, 2018 are not accounted for as hedging instruments under GAAP.
D. Securities Lending — Since the inception of the BetaBuilders Canada ETF, BetaBuilders Europe ETF, Beta Builders Japan ETF and BetaBuilders Developed Asia ex-Japan ETF and effective October 5, 2018, the Emerging Markets Equity ETF, Europe Equity ETF, Global Equity ETF, International Equity ETF, U.S. Equity ETF, U.S. Mid Cap Equity ETF, U.S. Small Cap Equity ETF, U.S. Dividend ETF, U.S. Minimum Volatility ETF, U.S. Momentum Factor ETF, U.S. Quality Factor ETF and U.S. Value Factor ETF became authorized to engage in securities lending in order to generate additional income. The Funds are able to lend to approved borrowers. Citibank N. A. (“Citibank”) serves as lending agent for the Funds, pursuant to a Securities Lending Agency Agreement (the “Securities Lending Agency Agreement”). Securities loaned are collateralized by cash equal to at least 100% of the market value plus accrued interest on the securities lent, which is invested in the IM Shares of JPMorgan U.S. Government Money Market Fund, the IM Shares of JPMorgan Prime Money Market Fund and/or the Agency SL Shares of the JPMorgan Securities Lending Money Market Fund. The Funds retain loan fees and the interest on cash collateral investments but are required to pay the borrower a rebate for the use of cash collateral. In cases where the lent security is of high value to borrowers, there may be a negative rebate (i.e., a net payment from the borrower to the Funds). Upon termination of a loan, the Funds are required to return to the borrower an amount equal to the cash collateral, plus any rebate owed to the borrowers. The remaining maturities of the securities lending transactions are considered overnight and continuous. Loans are subject to termination by the Fund or the borrower at any time.
The net income earned on the securities lending (after payment of rebates and Citibank’s fee) is included on the SOP as Income from securities lending (net). The Funds also receive payments from the borrower during the period of the loan, equivalent to dividends and interest earned on the securities loaned, which are recorded as Dividend or Interest income, respectively, on the SOP.
| | | | |
| | | Dividend Income | |
BetaBuilders Canada ETF | | $ | 109,003 | |
BetaBuilders Developed Asia ex-Japan ETF | | | 1,620 | |
BetaBuilders Europe ETF | | | 42,467 | |
BetaBuilders Japan ETF | | | 46,842 | |
Global Equity ETF | | | 155 | |
U.S. Equity ETF | | | 4,713 | |
U.S. Mid Cap Equity ETF | | | 1,137 | |
U.S. Small Cap Equity ETF | | | 1,927 | |
U.S. Dividend ETF | | | 164 | |
U.S. Minimum Volatility ETF | | | 104 | |
U.S. Momentum Factor ETF | | | 15 | |
U.S. Quality Factor ETF | | | 77 | |
U.S. Value Factor ETF | | | 20 | |
| | | | | | |
| | | |
| 218 | | | | J.P. MORGAN EXCHANGE-TRADED FUNDS | | OCTOBER 31, 2018 |
Under the Securities Lending Agency Agreement, Citibank marks to market the loaned securities on a daily basis. In the event the cash received from the borrower is less than 102% of the value of the loaned securities (105% for loans of non-U.S. securities), Citibank requests additional cash from the borrower so as to maintain a collateralization level of at least 102% of the value of the loaned securities plus accrued interest (105% for loans of non-U.S. securities).
The value of securities out on loan is recorded as an asset on the SAL. The value of the cash collateral received is recorded as a liability on the SAL and details of Collateral Investments are disclosed in the SOIs. At October 31, 2018, the value of outstanding securities on loan and the value of Collateral Investments were as follows:
| | | | | | | | | | | | |
| | | Value of
Securities on Loan | | | Cash Collateral
Posted by Borrower | | | Total value of
Collateral
Investments | |
BetaBuilders Canada ETF | | $ | 63,988,967 | | | $ | 71,875,628 | | | $ | 71,875,628 | |
BetaBuilders Europe ETF | | | 25,217,228 | | | | 26,501,735 | | | | 26,501,735 | |
BetaBuilders Japan ETF | | | 17,759,855 | | | | 19,499,569 | | | | 19,499,569 | |
Global Equity ETF | | | 905,726 | | | | 924,151 | | | | 924,151 | |
U.S. Equity ETF | | | 4,586,251 | | | | 4,709,887 | | | | 4,709,887 | |
U.S. Mid Cap Equity ETF | | | 627,488 | | | | 643,332 | | | | 643,332 | |
U.S. Small Cap Equity ETF | | | 2,359,957 | | | | 2,431,125 | | | | 2,431,125 | |
U.S. Dividend ETF | | | 145,312 | | | | 148,580 | | | | 148,580 | |
U.S. Minimum Volatility ETF | | | 91,776 | | | | 93,840 | | | | 93,840 | |
U.S. Momentum Factor ETF | | | 64,857 | | | | 66,300 | | | | 66,300 | |
U.S. Quality Factor ETF | | | 57,428 | | | | 58,800 | | | | 58,800 | |
U.S. Value Factor ETF | | | 56,250 | | | | 57,600 | | | | 57,600 | |
The Funds bear the risk of loss associated with the Collateral Investments and are not entitled to additional collateral from the borrower to cover any such losses. To the extent that the value of the Collateral Investments declines below the amount owed to a borrower, the Fund may incur losses that exceed the amount it earned on lending the security. Upon termination of a loan, the Funds may use leverage (borrow money) to repay the borrower for cash collateral posted if the Adviser does not believe that it is prudent to sell the Collateral Investments to fund the payment of this liability.
The following table presents the Funds’ value of the securities on loan with Citibank, NA, net of amounts available for offset under the master netting arrangements and any related collated received or posted by the Funds as of October 31, 2018.
| | | | | | | | | | | | |
| | | Investment Securities
On Loan, at value,
Presented in the
Statement of Assets
and Liabilities | | | Cash Collateral
Posted by Borrower | | | Net Amount Due
to Counterparty
(not less than zero) | |
BetaBuilders Canada ETF | | $ | 63,988,967 | | | $ | (63,988,967 | ) | | $ | — | |
BetaBuilders Europe ETF | | | 25,217,228 | | | | (25,217,228 | ) | | | — | |
BetaBuilders Japan ETF | | | 17,759,855 | | | | (17,759,855 | ) | | | — | |
Global Equity ETF | | | 905,726 | | | | (905,726 | ) | | | — | |
U.S. Equity ETF | | | 4,586,251 | | | | (4,586,251 | ) | | | — | |
U.S. Mid Cap Equity ETF | | | 627,488 | | | | (627,488 | ) | | | — | |
U.S. Small Cap Equity ETF | | | 2,359,957 | | | | (2,359,957 | ) | | | — | |
U.S. Dividend ETF | | | 145,312 | | | | (145,312 | ) | | | — | |
U.S. Minimum Volatility ETF | | | 91,776 | | | | (91,776 | ) | | | — | |
U.S. Momentum Factor ETF | | | 64,857 | | | | (64,857 | ) | | | — | |
U.S. Quality Factor ETF | | | 57,428 | | | | (57,428 | ) | | | — | |
U.S. Value Factor ETF | | | 56,250 | | | | (56,250 | ) | | | — | |
Securities lending also involves counterparty risks, including the risk that the loaned securities may not be returned in a timely manner or at all. Subject to certain conditions, Citibank has agreed to indemnify the Fund from losses resulting from a borrower’s failure to return a loaned security.
| | | | | | | | |
| | | |
| OCTOBER 31, 2018 | | J.P. MORGAN EXCHANGE-TRADED FUNDS | | | | | 219 | |
NOTES TO FINANCIAL STATEMENTS
AS OF OCTOBER 31, 2018 (continued)
JPMIM voluntarily waived investment advisory fees charged to the Fund to reduce the impact of the investment in the JPMorgan U.S. Government Money Market Fund and JPMorgan Prime Money Market Fund from 0.16% to 0.06%. JPMIM waived fees associated with the Fund’s investment in JPMorgan U.S. Government Money Market Fund and JPMorgan Prime Money Market Fund as follows:
| | | | |
BetaBuilders Canada ETF | | | 4,403 | |
BetaBuilders Developed Asia ex-Japan ETF | | | 77 | |
BetaBuilders Europe ETF | | | 1,652 | |
BetaBuilders Japan ETF | | | 1,722 | |
Global Equity ETF | | | 7 | |
U.S. Equity ETF | | | 210 | |
U.S. Mid Cap Equity ETF | | | 50 | |
U.S. Small Cap Equity ETF | | | 86 | |
U.S. Dividend ETF | | | 7 | |
U.S. Minimum Volatility ETF | | | 5 | |
U.S. Momentum Factor ETF | | | 1 | |
U.S. Quality Factor ETF | | | 3 | |
U.S. Value Factor ETF | | | 1 | |
The above waiver is included in the determination of earnings on cash collateral investment and in the calculation of Citibank’s compensation and is included in the SOP as income from securities lending (net).
The Emerging Markets Equity ETF, Europe Equity ETF and International Equity ETF did not lend out any securities during the period ended October 31, 2018.
E. Investment Transactions with Affiliates — The Funds invested in Underlying Funds which are advised by the Adviser. An issuer who is under common control with the Funds may be considered an affiliate. For the purposes of the financial statements, the Funds assume the issuers listed in the table below to be affiliated issuers. Underlying Funds’ distributions may be reinvested into the Underlying Funds. Reinvestment amounts are included in the purchase cost amounts in the table below.
BetaBuilders Canada ETF
| | | | | | | | | | | | | | | | | | | | | | | | | | | | | | | | | | | | |
| | | For the period ended October 31, 2018 | |
| Security Description | | Value at
August 7,
2018 (c) | | | Purchases at Cost | | | Proceeds
from
Sales | | | Net Realized
Gain (Loss) | | | Change in
Unrealized
Appreciation/
(Depreciation) | | | Value at
October 31,
2018 | | | Shares at
October 31,
2018 | | | Dividend
Income | | | Capital Gain
Distributions | |
JPMorgan Prime Money Market Fund Class IM Shares, 1.88%(a)(b) | | $ | — | | | $ | 225,000,000 | | | $ | 223,000,000 | | | $ | (6,899 | )* | | $ | (199 | ) | | $ | 1,992,902 | | | | 1,992,504 | | | $ | 65,810 | * | | $ | — | |
JPMorgan Securities Lending Money Market Fund Class Agency SL Shares, 2.27%(a)(b) | | | — | | | | 55,000,000 | | | | 5,000,000 | | | | (300 | )* | | | — | | | | 49,999,700 | | | | 50,004,700 | | | | 7,483 | * | | | — | |
JPMorgan U.S. Government Money Market Fund Class IM Shares, 2.07% (a)(b) | | | — | | | | 162,010,159 | | | | 142,127,133 | | | | — | | | | — | | | | 19,883,026 | | | | 19,883,026 | | | | 35,710 | * | | | — | |
JPMorgan U.S. Government Money Market Fund Class Institutional Shares, 2.02% | | | — | | | | 3,593,084 | | | | 3,403,021 | | | | — | | | | — | | | | 190,063 | | | | 190,063 | | | | 924 | | | | — | |
| | | | | | | | | | | | | | | | | | | | | | | | | | | | | | | | | | | | |
Total | | $ | — | | | $ | 445,603,243 | | | $ | 373,530,154 | | | $ | (7,199 | ) | | $ | (199 | ) | | $ | 72,065,691 | | | | | | | $ | 109,927 | | | $ | — | |
| | | | | | | | | | | | | | | | | | | | | | | | | | | | | | | | | | | | |
| | | | | | |
| | | |
| 220 | | | | J.P. MORGAN EXCHANGE-TRADED FUNDS | | OCTOBER 31, 2018 |
BetaBuilders Developed Asia ex-Japan ETF
| | | | | | | | | | | | | | | | | | | | | | | | | | | | | | | | | | | | |
| | | For the period ended October 31, 2018 | |
| Security Description | | Value at August 7,
2018 (c) | | | Purchases
at Cost | | | Proceeds
from
Sales | | | Net Realized
Gain (Loss) | | | Change in
Unrealized
Appreciation/
(Depreciation) | | | Value at
October 31,
2018 | | | Shares at
October 31,
2018 | | | Dividend
Income | | | Capital Gain
Distributions | |
JPMorgan U.S. Government Money Market Fund Class Institutional Shares, 2.02% (a)(b) | | $ | — | | | $ | 59,805,720 | | | $ | 59,550,948 | | | $ | — | | | $ | — | | | $ | 254,772 | | | | 254,772 | | | $ | 12,144 | | | $ | — | |
JPMorgan U.S. Government Money Market Fund Class IM Shares, 2.07% (a)(b) | | | — | | | | 1,195,447 | | | | 1,195,447 | | | | — | | | | — | | | | — | | | | — | | | | 1,620 | * | | | — | |
| | | | | | | | | | | | | | | | | | | | | | | | | | | | | | | | | | | | |
Total | | $ | — | | | $ | 61,001,167 | | | $ | 60,746,395 | | | $ | — | | | $ | — | | | $ | 254,772 | | | | | | | $ | 13,764 | | | $ | — | |
| | | | | | | | | | | | | | | | | | | | | | | | | | | | | | | | | | | | |
BetaBuilders Europe ETF
| | | | | | | | | | | | | | | | | | | | | | | | | | | | | | | | | | | | |
| | | For the period ended October 31, 2018 | |
| Security Description | | Value at
June 15,
2018 (c) | | | Purchases
at Cost | | | Proceeds
from
Sales | | | Net Realized
Gain (Loss) | | | Change in
Unrealized
Appreciation/
(Depreciation) | | | Value at
October 31,
2018 | | | Shares at
October 31,
2018 | | | Dividend
Income | | | Capital Gain
Distributions | |
JPMorgan Prime Money Market Fund Class IM Shares, 1.88% (a)(b) | | $ | — | | | $ | 28,000,000 | | | $ | 25,000,000 | | | $ | (400 | )* | | $ | (300 | ) | | $ | 2,999,300 | | | | 2,998,700 | | | $ | 20,324 | * | | $ | — | |
JPMorgan Securities Lending Money Market Fund Class Agency SL Shares, 2.27% (a)(b) | | | — | | | | 18,000,000 | | | | — | | | | — | | | | (500 | ) | | | 17,999,500 | | | | 18,001,300 | | | | 5,076 | * | | | — | |
JPMorgan U.S. Government Money Market Fund Class IM Shares, 2.07% (a)(b) | | | — | | | | 28,579,583 | | | | 23,076,648 | | | | — | | | | — | | | | 5,502,935 | | | | 5,502,935 | | | | 17,067 | * | | | — | |
JPMorgan U.S. Government Money Market Fund Class Institutional Shares, 2.02% (a)(b) | | | — | | | | 6,875,711 | | | | 6,579,209 | | | | — | | | | — | | | | 296,502 | | | | 296,502 | | | | 1,193 | | | | — | |
| | | | | | | | | | | | | | | | | | | | | | | | | | | | | | | | | | | | |
Total | | $ | — | | | $ | 81,455,294 | | | $ | 54,655,857 | | | $ | (400 | ) | | $ | (800 | ) | | $ | 26,798,237 | | | | | | | $ | 43,660 | | | $ | — | |
| | | | | | | | | | | | | | | | | | | | | | | | | | | | | | | | | | | | |
BetaBuilders Japan ETF
| | | | | | | | | | | | | | | | | | | | | | | | | | | | | | | | | | | | |
| | | For the period ended October 31, 2018 | |
| Security Description | | Value at
June 15,
2018 (c) | | | Purchases
at Cost | | | Proceeds
from
Sales | | | Net Realized
Gain (Loss) | | | Change in
Unrealized
Appreciation/
(Depreciation) | | | Value at
October 31,
2018 | | | Shares at
October 31,
2018 | | | Dividend
Income | | | Capital Gain
Distributions | |
JPMorgan Prime Money Market Fund Class IM Shares, 1.88% (a)(b) | | $ | — | | | $ | 29,000,000 | | | $ | 28,999,100 | | | $ | (900 | )* | | $ | — | | | $ | — | | | $ | — | | | $ | 24,331 | * | | $ | — | |
JPMorgan Securities Lending Money Market Fund Class Agency SL Shares, 2.27% (a)(b) | | | — | | | | 17,000,000 | | | | 4,000,000 | | | | — | | | | (200 | ) | | | 12,999,800 | | | | 13,001,100 | | | | 6,924 | * | | | — | |
JPMorgan U.S. Government Money Market Fund Class IM Shares, 2.07% (a)(b) | | | — | | | | 32,290,057 | | | | 25,790,288 | | | | — | | | | — | | | | 6,499,769 | | | | 6,499,769 | | | | 15,587 | * | | | — | |
JPMorgan U.S. Government Money Market Fund Class Institutional Shares, 2.02% (a)(b) | | | — | | | | 35,310,535 | | | | 35,021,735 | | | | — | | | | — | | | | 288,800 | | | | 288,800 | | | | 3,153 | | | | — | |
| | | | | | | | | | | | | | | | | | | | | | | | | | | | | | | | | | | | |
Total | | $ | — | | | $ | 113,600,592 | | | $ | 93,811,123 | | | $ | (900 | ) | | $ | (200 | ) | | $ | 19,788,369 | | | | | | | $ | 49,995 | | | $ | — | |
| | | | | | | | | | | | | | | | | | | | | | | | | | | | | | | | | | | | |
| | | | | | | | |
| | | |
| OCTOBER 31, 2018 | | J.P. MORGAN EXCHANGE-TRADED FUNDS | | | | | 221 | |
NOTES TO FINANCIAL STATEMENTS
AS OF OCTOBER 31, 2018 (continued)
Diversified Return Emerging Markets Equity ETF
| | | | | | | | | | | | | | | | | | | | | | | | | | | | | | | | | | | | |
| | | For the year ended October 31, 2018 | |
| Security Description | | Value at
October 31,
2017 | | | Purchases
at Cost | | | Proceeds
from
Sales | | | Net Realized
Gain (Loss) | | | Change in
Unrealized
Appreciation/
(Depreciation) | | | Value at
October 31,
2018 | | | Shares at
October 31,
2018 | | | Dividend
Income | | | Capital Gain
Distributions | |
JPMorgan U.S. Government Money Market Fund Class Institutional Shares, 2.02% (a)(b) | | $ | — | | | $ | 27,108,597 | | | $ | 26,354,949 | | | $ | — | | | $ | — | | | $ | 753,648 | | | | 753,648 | | | $ | 8,382 | | | $ | — | |
| | | | | | | | | | | | | | | | | | | | | | | | | | | | | | | | | | | | |
Diversified Return Europe Currency Hedged ETF
| | | | | | | | | | | | | | | | | | | | | | | | | | | | | | | | | | | | |
| | | For the year ended October 31, 2018 | |
| Security Description | | Value at
October 31,
2017 | | | Purchases
at Cost | | | Proceeds
from
Sales | | | Net Realized
Gain (Loss) | | | Change in
Unrealized
Appreciation/
(Depreciation) | | | Value at
October 31,
2018 | | | Shares at
October 31,
2018 | | | Dividend
Income | | | Capital Gain
Distributions | |
JPMorgan Diversified Return Europe Equity ETF Shares (a) | | $ | 30,739,404 | | | $ | 4,206,967 | | | $ | 1,996,428 | | | $ | 232,513 | | | $ | (4,263,292 | ) | | $ | 28,919,164 | | | | 539,865 | | | $ | 1,491,216 | | | $ | — | |
| | | | | | | | | | | | | | | | | | | | | | | | | | | | | | | | | | | | |
Diversified Return Global Equity ETF
| | | | | | | | | | | | | | | | | | | | | | | | | | | | | | | | | | | | |
| | | For the year ended October 31, 2018 | |
| Security Description | | Value at
October 31,
2017 | | | Purchases
at Cost | | | Proceeds
from
Sales | | | Net Realized
Gain (Loss) | | | Change in
Unrealized
Appreciation/
(Depreciation) | | | Value at
October 31,
2018 | | | Shares at
October 31,
2018 | | | Dividend
Income | | | Capital Gain
Distributions | |
JPMorgan U.S. Government Money Market Fund Class IM Shares, 2.07% (a)(b) | | $ | — | | | $ | 1,270,987 | | | $ | 346,836 | | | $ | — | | | $ | — | | | $ | 924,151 | | | | 924,151 | | | $ | 155 | * | | $ | — | |
JPMorgan U.S. Government Money Market Fund Class Institutional Shares, 2.02% (a)(b) | | | 516,620 | | | | 15,481,092 | | | | 15,370,695 | | | | — | | | | — | | | | 627,017 | | | | 627,017 | | | | 7,601 | | | | — | |
| | | | | | | | | | | | | | | | | | | | | | | | | | | | | | | | | | | | |
Total | | $ | 516,620 | | | $ | 16,752,079 | | | $ | 15,717,531 | | | $ | — | | | $ | — | | | $ | 1,551,168 | | | | | | | $ | 7,756 | | | $ | — | |
| | | | | | | | | | | | | | | | | | | | | | | | | | | | | | | | | | | | |
Diversified Return International Currency Hedged ETF
| | | | | | | | | | | | | | | | | | | | | | | | | | | | | | | | | | | | |
| | | For the year ended October 31, 2018 | |
| Security Description | | Value at
October 31,
2017 | | | Purchases
at Cost | | | Proceeds
from
Sales | | | Net Realized
Gain (Loss) | | | Change in
Unrealized
Appreciation/
(Depreciation) | | | Value at October 31, 2018 | | | Shares at
October 31,
2018 | | | Dividend
Income | | | Capital Gain
Distributions | |
JPMorgan Diversified Return International Equity ETF Shares (a) | | $ | 48,144,483 | | | $ | 3,738,176 | | | $ | 17,281,915 | | | $ | 2,718,229 | | | $ | (5,925,977 | ) | | $ | 31,392,996 | | | | 592,880 | | | $ | 1,567,544 | | | $ | — | |
| | | | | | | | | | | | | | | | | | | | | | | | | | | | | | | | | | | | |
Diversified Return International Equity ETF
| | | | | | | | | | | | | | | | | | | | | | | | | | | | | | | | | | | | |
| | | For the year ended October 31, 2018 | |
| Security Description | | Value at
October 31,
2017 | | | Purchases at Cost | | | Proceeds
from
Sales | | | Net Realized
Gain (Loss) | | | Change in
Unrealized
Appreciation/
(Depreciation) | | | Value at
October 31,
2018 | | | Shares at
October 31,
2018 | | | Dividend
Income | | | Capital Gain
Distributions | |
JPMorgan U.S. Government Money Market Fund Class Institutional Shares, 2.02% (a)(b) | | $ | 15,795,486 | | | $ | 108,473,271 | | | $ | 117,650,538 | | | $ | — | | | $ | — | | | $ | 6,618,219 | | | | 6,618,219 | | | $ | 94,206 | | | $ | — | |
| | | | | | | | | | | | | | | | | | | | | | | | | | | | | | | | | | | | |
| | | | | | |
| | | |
| 222 | | | | J.P. MORGAN EXCHANGE-TRADED FUNDS | | OCTOBER 31, 2018 |
Diversified Return U.S. Equity ETF
| | | | | | | | | | | | | | | | | | | | | | | | | | | | | | | | | | | | |
| | | For the year ended October 31, 2018 | |
| Security Description | | Value at
October 31,
2017 | | | Purchases
at Cost | | | Proceeds
from
Sales | | | Net Realized
Gain (Loss) | | | Change in
Unrealized
Appreciation/
(Depreciation) | | | Value at
October 31,
2018 | | | Shares at
October 31,
2018 | | | Dividend
Income | | | Capital Gain
Distributions | |
JPMorgan U.S. Government Money Market Fund Class IM Shares, 2.07% (a)(b) | | $ | — | | | $ | 6,503,136 | | | $ | 1,793,249 | | | $ | — | | | $ | — | | | $ | 4,709,887 | | | | 4,709,887 | | | $ | 4,713 | * | | $ | — | |
JPMorgan U.S. Government Money Market Fund Class Institutional Shares, 2.02% (a)(b) | | | 1,543,961 | | | | 33,489,728 | | | | 28,143,826 | | | | — | | | | — | | | | 6,889,863 | | | | 6,889,863 | | | | 35,964 | | | | — | |
| | | | | | | | | | | | | | | | | | | | | | | | | | | | | | | | | | | | |
Total | | $ | 1,543,961 | | | $ | 39,992,864 | | | $ | 29,937,075 | | | $ | — | | | $ | — | | | $ | 11,599,750 | | | | | | | $ | 40,677 | | | $ | — | |
| | | | | | | | | | | | | | | | | | | | | | | | | | | | | | | | | | | | |
Diversified Return U.S. Mid Cap Equity ETF
| | | | | | | | | | | | | | | | | | | | | | | | | | | | | | | | | | | | |
| | | For the year ended October 31, 2018 | |
| Security Description | | Value at
October 31,
2017 | | | Purchases
at Cost | | | Proceeds
from
Sales | | | Net Realized
Gain (Loss) | | | Change in
Unrealized
Appreciation/
(Depreciation) | | | Value at
October 31,
2018 | | | Shares at
October 31,
2018 | | | Dividend
Income | | | Capital Gain
Distributions | |
JPMorgan U.S. Government Money Market Fund Class IM Shares, 2.07% (a)(b) | | $ | — | | | $ | 2,001,091 | | | $ | 1,357,759 | | | $ | — | | | $ | — | | | $ | 643,332 | | | | 643,332 | | | $ | 1,137 | * | | $ | — | |
JPMorgan U.S. Government Money Market Fund Class Institutional Shares, 2.02% (a)(b) | | | 192,796 | | | | 13,573,981 | | | | 10,145,862 | | | | — | | | | — | | | | 3,620,915 | | | | 3,620,915 | | | | 12,628 | | | | — | |
| | | | | | | | | | | | | | | | | | | | | | | | | | | | | | | | | | | | |
Total | | $ | 192,796 | | | $ | 15,575,072 | | | $ | 11,503,621 | | | $ | — | | | $ | — | | | $ | 4,264,247 | | | | | | | $ | 13,765 | | | $ | — | |
| | | | | | | | | | | | | | | | | | | | | | | | | | | | | | | | | | | | |
Diversified Return U.S. Small Cap Equity ETF
| | | | | | | | | | | | | | | | | | | | | | | | | | | | | | | | | | | | |
| | | For the year ended October 31, 2018 | |
| Security Description | | Value at
October 31,
2017 | | | Purchases
at Cost | | | Proceeds
from
Sales | | | Net Realized
Gain (Loss) | | | Change in
Unrealized
Appreciation/
(Depreciation) | | | Value at
October 31,
2018 | | | Shares at
October 31,
2018 | | | Dividend
Income | | | Capital Gain
Distributions | |
JPMorgan U.S. Government Money Market Fund Class IM Shares, 2.07% (a)(b) | | $ | — | | | $ | 3,983,700 | | | $ | 1,552,575 | | | $ | — | | | $ | — | | | $ | 2,431,125 | | | | 2,431,125 | | | $ | 1,927 | * | | $ | — | |
JPMorgan U.S. Government Money Market Fund Class Institutional Shares, 2.02% (a)(b) | | | 461,963 | | | | 8,701,066 | | | | 7,657,954 | | | | — | | | | — | | | | 1,505,075 | | | | 1,505,075 | | | | 12,755 | | | | — | |
| | | | | | | | | | | | | | | | | | | | | | | | | | | | | | | | | | | | |
Total | | $ | 461,963 | | | $ | 12,684,766 | | | $ | 9,210,529 | | | $ | — | | | $ | — | | | $ | 3,936,200 | | | | | | | $ | 14,682 | | | $ | — | |
| | | | | | | | | | | | | | | | | | | | | | | | | | | | | | | | | | | | |
| | | | | | | | |
| | | |
| OCTOBER 31, 2018 | | J.P. MORGAN EXCHANGE-TRADED FUNDS | | | | | 223 | |
NOTES TO FINANCIAL STATEMENTS
AS OF OCTOBER 31, 2018 (continued)
U.S. Dividend ETF
| | | | | | | | | | | | | | | | | | | | | | | | | | | | | | | | | | | | |
| | | For the period ended October 31, 2018 | |
| Security Description | | Value at
November 8,
2017 (c) | | | Purchases
at Cost | | | Proceeds
from
Sales | | | Net Realized
Gain (Loss) | | | Change in
Unrealized
Appreciation/
(Depreciation) | | | Value at
October 31,
2018 | | | Shares at
October 31,
2018 | | | Dividend
Income | | | Capital Gain
Distributions | |
JPMorgan U.S. Government Money Market Fund Class IM Shares, 2.07% (a)(b) | | $ | — | | | $ | 457,000 | | | $ | 308,420 | | | $ | — | | | $ | — | | | $ | 148,580 | | | | 148,580 | | | $ | 164 | * | | $ | — | |
JPMorgan U.S. Government Money Market Fund Class Institutional Shares, 2.02% (a)(b) | | | — | | | | 3,566,104 | | | | 2,317,245 | | | | — | | | | — | | | | 1,248,859 | | | | 1,248,859 | | | | 2,657 | | | | — | |
| | | | | | | | | | | | | | | | | | | | | | | | | | | | | | | | | | | | |
Total | | $ | — | | | $ | 4,023,104 | | | $ | 2,625,665 | | | $ | — | | | $ | — | | | $ | 1,397,439 | | | | | | | $ | 2,821 | | | $ | — | |
| | | | | | | | | | | | | | | | | | | | | | | | | | | | | | | | | | | | |
U.S. Minimum Volatility ETF
| | | | | | | | | | | | | | | | | | | | | | | | | | | | | | | | | | | | |
| | | For the period ended October 31, 2018 | |
| Security Description | | Value at
November 8,
2017 (c) | | | Purchases
at Cost | | | Proceeds
from
Sales | | | Net Realized
Gain (Loss) | | | Change in
Unrealized
Appreciation/
(Depreciation) | | | Value at
October 31,
2018 | | | Shares at
October 31,
2018 | | | Dividend
Income | | | Capital Gain
Distributions | |
JPMorgan U.S. Government Money Market Fund Class IM Shares, 2.07% (a)(b) | | $ | — | | | $ | 287,520 | | | $ | 193,680 | | | $ | — | | | $ | — | | | $ | 93,840 | | | | 93,840 | | | $ | 104 | * | | $ | — | |
JPMorgan U.S. Government Money Market Fund Class Institutional Shares, 2.02% (a)(b) | | | — | | | | 2,278,709 | | | | 1,518,043 | | | | — | | | | — | | | | 760,666 | | | | 760,666 | | | | 1,935 | | | | — | |
| | | | | | | | | | | | | | | | | | | | | | | | | | | | | | | | | | | | |
Total | | $ | — | | | $ | 2,566,229 | | | $ | 1,711,723 | | | $ | — | | | $ | — | | | $ | 854,506 | | | | | | | $ | 2,039 | | | $ | — | |
| | | | | | | | | | | | | | | | | | | | | | | | | | | | | | | | | | | | |
U.S. Momentum Factor ETF
| | | | | | | | | | | | | | | | | | | | | | | | | | | | | | | | | | | | |
| | | For the period ended October 31, 2018 | |
| Security Description | | Value at
November 8,
2017 (c) | | | Purchases
at Cost | | | Proceeds
from
Sales | | | Net Realized
Gain (Loss) | | | Change in
Unrealized
Appreciation/
(Depreciation) | | | Value at
October 31,
2018 | | | Shares at
October 31,
2018 | | | Dividend
Income | | | Capital Gain
Distributions | |
JPMorgan U.S. Government Money Market Fund Class IM Shares, 2.07% (a)(b) | | $ | — | | | $ | 135,900 | | | $ | 69,600 | | | $ | — | | | $ | — | | | $ | 66,300 | | | | 66,300 | | | $ | 15 | * | | $ | — | |
JPMorgan U.S. Government Money Market Fund Class Institutional Shares, 2.02% (a)(b) | | | — | | | | 1,227,370 | | | | 1,164,047 | | | | — | | | | — | | | | 63,323 | | | | 63,323 | | | | 1,260 | | | | — | |
| | | | | | | | | | | | | | | | | | | | | | | | | | | | | | | | | | | | |
Total | | $ | — | | | $ | 1,363,270 | | | $ | 1,233,647 | | | $ | — | | | $ | — | | | $ | 129,623 | | | | | | | $ | 1,275 | | | $ | — | |
| | | | | | | | | | | | | | | | | | | | | | | | | | | | | | | | | | | | |
U.S. Quality Factor ETF
| | | | | | | | | | | | | | | | | | | | | | | | | | | | | | | | | | | | |
| | | For the period ended October 31, 2018 | |
| Security Description | | Value at
November 8,
2017 (c) | | | Purchases
at Cost | | | Proceeds
from
Sales | | | Net
Realized
Gain
(Loss) | | | Change in
Unrealized
Appreciation/
(Depreciation) | | | Value at
October 31,
2018 | | | Shares at
October 31,
2018 | | | Dividend
Income | | | Capital Gain
Distributions | |
JPMorgan U.S. Government Money Market Fund Class IM Shares, 2.07%(a)(b) | | $ | — | | | $ | 171,731 | | | $ | 112,931 | | | $ | — | | | $ | — | | | $ | 58,800 | | | | 58,800 | | | $ | 77 | * | | $ | — | |
JPMorgan U.S. Government Money Market Fund Class Institutional Shares, 2.02% (a)(b) | | | — | | | | 2,241,831 | | | | 1,405,459 | | | | — | | | | — | | | | 836,372 | | | | 836,372 | | | | 2,036 | | | | — | |
| | | | | | | | | | | | | | | | | | | | | | | | | | | | | | | | | | | | |
Total | | $ | — | | | $ | 2,413,562 | | | $ | 1,518,390 | | | $ | — | | | $ | — | | | $ | 895,172 | | | | | | | $ | 2,113 | | | $ | — | |
| | | | | | | | | | | | | | | | | | | | | | | | | | | | | | | | | | | | |
| | | | | | |
| | | |
| 224 | | | | J.P. MORGAN EXCHANGE-TRADED FUNDS | | OCTOBER 31, 2018 |
U.S. Value Factor ETF
| | | | | | | | | | | | | | | | | | | | | | | | | | | | | | | | | | | | |
| | | For the period ended October 31, 2018 | |
| Security Description | | Value at
November 8,
2017 (c) | | | Purchases
at Cost | | | Proceeds
from
Sales | | | Net Realized
Gain (Loss) | | | Change in
Unrealized
Appreciation/
(Depreciation) | | | Value at
October 31,
2018 | | | Shares at
October 31,
2018 | | | Dividend
Income | | | Capital Gain
Distributions | |
JPMorgan U.S. Government Money Market Fund Class IM Shares, 2.07% (a)(b) | | $ | — | | | $ | 92,931 | | | $ | 35,331 | | | $ | — | | | $ | — | | | $ | 57,600 | | | | 57,600 | | | $ | 20 | * | | $ | — | |
JPMorgan U.S. Government Money Market Fund Class Institutional Shares, 2.02% (a)(b) | | | — | | | | 2,711,204 | | | | 2,018,442 | | | | — | | | | — | | | | 692,762 | | | | 692,762 | | | | 2,592 | | | | — | |
| | | | | | | | | | | | | | | | | | | | | | | | | | | | | | | | | | | | |
Total | | $ | — | | | $ | 2,804,135 | | | $ | 2,053,773 | | | $ | — | | | $ | — | | | $ | 750,362 | | | | | | | $ | 2,612 | | | $ | — | |
| | | | | | | | | | | | | | | | | | | | | | | | | | | | | | | | | | | | |
| * | Amount is included in the SOP as income from securities lending (net). |
| (a) | Investment in affiliate. Fund is registered under the Investment Company Act of 1940, as amended, and advised by J.P. Morgan Investment Management Inc. |
| (b) | The rate shown is the current yield as of October 31, 2018. |
| (c) | Commencement of operations. |
F. Foreign Currency Translation — The books and records of the Funds are maintained in U.S. dollars. Foreign currency amounts are translated into U.S. dollars at the prevailing exchange rates of such currencies against the U.S. dollar. The market value of investment securities and other assets and liabilities are translated at the exchange rate as of the valuation date. Purchases and sales of investment securities, income and expenses are translated at the exchange rate prevailing on the respective dates of such transactions.
The Funds do not isolate the effect of changes in foreign exchange rates from changes in market prices of securities held. Accordingly, such changes are included within Change in net unrealized appreciation/depreciation on investments on the SOP.
Reported realized foreign currency gains and losses arise from the disposition of foreign currency, currency gains or losses realized between the trade and settlement dates on securities transactions, and the difference between the amounts of dividends, interest and foreign withholding taxes recorded on each Fund’s books on the transaction date and the U.S. dollar equivalent of the amounts actually received or paid. These reported realized foreign currency gains and losses are included in Net realized gain (loss) on foreign currency transactions on the SOP. Unrealized foreign currency gains and losses arise from changes (due to changes in exchange rates) in the value of foreign currency and other assets and liabilities denominated in foreign currencies, which are held at year end are included in Change in net unrealized appreciation/ depreciation on foreign currency translations on the SOP.
G. Offering and Organizational Costs — Total offering costs incurred in connection with the offering of shares of the Funds are amortized on a straight line basis over 12 months from the date the Funds commenced operations. For the period ended October 31, 2018, total offering costs incurred were:
| | | | |
BetaBuilders Canada ETF | | $ | 16,918 | |
BetaBuilders Developed Asia ex-Japan ETF | | | 15,611 | |
BetaBuilders Europe ETF | | | 13,889 | |
BetaBuilders Japan ETF | | | 13,250 | |
U.S. Dividend ETF | | | 4,068 | |
U.S. Minimum Volatility ETF | | | 5,756 | |
U.S. Momentum Factor ETF | | | 4,071 | |
U.S. Quality Factor ETF | | | 4,061 | |
U.S. Value Factor ETF | | | 4,073 | |
Costs paid in connection with the organization of the Funds, if any, were recorded as an expense at the time the Funds commenced operations and are included as part of Professional fees on the SOP. For the period ended October 31, 2018, total offering costs expensed were:
| | | | |
BetaBuilders Canada ETF | | $ | 3,940 | |
BetaBuilders Developed Asia ex-Japan ETF | | | 3,635 | |
BetaBuilders Europe ETF | | | 5,251 | |
BetaBuilders Japan ETF | | | 4,990 | |
U.S. Small Cap Equity ETF | | | 39 | |
U.S. Dividend ETF | | | 3,978 | |
U.S. Minimum Volatility ETF | | | 5,630 | |
U.S. Momentum Factor ETF | | | 3,981 | |
U.S. Quality Factor ETF | | | 3,971 | |
U.S. Value Factor ETF | | | 3,984 | |
| | | | | | | | |
| | | |
| OCTOBER 31, 2018 | | J.P. MORGAN EXCHANGE-TRADED FUNDS | | | | | 225 | |
NOTES TO FINANCIAL STATEMENTS
AS OF OCTOBER 31, 2018 (continued)
H. Security Transactions and Investment Income — Investment transactions are accounted for on the trade date (the date the order to buy or sell is executed). Securities gains and losses are calculated on a specifically identified cost basis. Interest income is determined on the basis of coupon interest accrued using the effective interest method which adjusts for amortization of premiums and accretion of discounts. Dividend income net of foreign taxes withheld, if any, and distributions of net investment income and realized capital gains from the Underlying Funds and ETFs, if any, are recorded on the ex-dividend date or when a Fund first learns of the dividend.
To the extent such information is publicly available, the Funds record distributions received in excess of income earned from underlying investments as a reduction of cost of investments and/or realized gain. Such amounts are based on estimates if actual amounts are not available and actual amounts of income, realized gain and return of capital may differ from the estimated amounts. The Funds adjust the estimated amounts of the components of distributions (and consequently their net investment income) as necessary once the issuers provide information about the actual composition of the distributions.
I. Allocation of Expenses — Expenses directly attributable to a fund are charged directly to that fund, while the expenses attributable to more than one fund of the Trust are allocated among the respective funds.
J. Federal Income Taxes — Each Fund is treated as a separate taxable entity for Federal income tax purposes. Each Fund’s policy is to comply with the provisions of the Internal Revenue Code (the “Code”), applicable to regulated investment companies and to distribute to shareholders all of its distributable net investment income and net realized capital gains on investments. Accordingly, no provision for Federal income tax is necessary. Management has reviewed the Funds’ tax positions for all open tax years and has determined that as of October 31, 2018, no liability for income tax is required in the Funds’ financial statements for net unrecognized tax benefits. However, management’s conclusions may be subject to future review based on changes in, or the interpretation of, the accounting standards or tax laws and regulations. Each of the Funds’ Federal tax returns for the prior three fiscal years, or since inception if shorter, remains subject to examination by the Internal Revenue Service.
K. Foreign Taxes — The Funds may be subject to foreign taxes on income, gains on investments or currency purchases/repatriation, a portion of which may be recoverable. The Funds will accrue such taxes and recoveries as applicable, based upon their current interpretation of tax rules and regulations that exist in the markets in which they invest. When a capital gain tax is determined to apply, the Fund records an estimated deferred tax liability in an amount that would be payable if the securities were disposed of on the valuation date.
L. Distributions to Shareholders — Prior to March 12, 2018, distributions from net investment income, if any, were generally declared and paid annually. Effective March 12, 2018, distributions from net investment income, if any, are generally declared and paid quarterly for all Funds except the Europe Currency Hedged ETF and the International Currency Hedged ETF which generally declare and pay any net investment income annually.
Net realized capital gains, if any, are distributed by each Fund at least annually. The amount of distributions from net investment income and net realized capital gains is determined in accordance with Federal income tax regulations, which may differ from GAAP. To the extent these “book/tax” differences are permanent in nature (i.e., that they result from other than timing of recognition — “temporary differences”), such amounts are reclassified within the capital accounts based on their Federal tax-basis treatment.
The following amounts were reclassified within the capital accounts:
| | | | | | | | | | | | |
| | | Paid-in-Capital | | | Accumulated
undistributed
(distributions
in excess of)
net investment
income | | | Accumulated
net realized
gains (losses) | |
BetaBuilders Canada ETF | | $ | (361,758 | ) | | $ | (16,346 | ) | | $ | 378,104 | |
BetaBuilders Developed Asia ex-Japan ETF | | | — | | | | (16,172 | ) | | | 16,172 | |
BetaBuilders Europe ETF | | | (1 | ) | | | 153,226 | | | | (153,225 | ) |
BetaBuilders Japan ETF | | | — | | | | 76,862 | | | | (76,862 | ) |
Emerging Markets Equity ETF | | | — | | | | (33,783 | ) | | | 33,783 | |
Europe Currency Hedged ETF | | | | | | | (9,672 | ) | | | 9,672 | |
Europe Equity ETF | | | 2,751,625 | | | | 5,956 | | | | (2,757,581 | ) |
Global Equity ETF | | | 600,469 | | | | 27,544 | | | | (628,013 | ) |
International Currency Hedged ETF | | | 2,532,623 | | | | (86,902 | ) | | | (2,445,721 | ) |
International Equity ETF | | | 11,801,692 | | | | 689,721 | | | | (12,491,413 | ) |
U.S. Equity ETF | | | 1,547,727 | | | | (45,618 | ) | | | (1,502,109 | ) |
U.S. Mid Cap Equity ETF | | | 1,881,362 | | | | (8,662 | ) | | | (1,872,700 | ) |
U.S. Small Cap Equity ETF | | | 3,434,119 | | | | (45,787 | ) | | | (3,388,332 | ) |
U.S. Dividend ETF | | | (1 | ) | | | (6,126 | ) | | | 6,127 | |
U.S. Minimum Volatility ETF | | | — | | | | — | | | | — | |
U.S. Momentum Factor ETF | | | — | | | | — | | | | — | |
U.S. Quality Factor ETF | | | — | | | | (167 | ) | | | 167 | |
U.S. Value Factor ETF | | | — | | | | (1,074 | ) | | | 1,074 | |
The reclassifications for the Funds relate primarily to foreign currency gains or losses, investments in passive foreign investment companies (“PFICs”), non-taxable dividends and redemptions in-kind.
| | | | | | |
| | | |
| 226 | | | | J.P. MORGAN EXCHANGE-TRADED FUNDS | | OCTOBER 31, 2018 |
3. Fees and Other Transactions with Affiliates
A. Investment Advisory Fee — Pursuant to an Investment Advisory Agreement, the Adviser supervises the investments of each Fund and for such services is paid a fee. The fee is accrued daily and paid monthly based on each Fund’s respective average daily net assets. The annual rate for each Fund is as follows:
| | | | |
BetaBuilders Canada ETF | | | 0.19 | % |
BetaBuilders Developed Asia ex-Japan ETF | | | 0.19 | % |
BetaBuilders Europe ETF | | | 0.09 | % |
BetaBuilders Japan ETF | | | 0.19 | % |
Emerging Markets Equity ETF | | | 0.44 | % |
Europe Currency Hedged ETF | | | 0.33 | % |
Europe Equity ETF | | | 0.30 | % |
Global Equity ETF | | | 0.24 | % |
International Currency Hedged ETF | | | 0.27 | % |
International Equity ETF | | | 0.24 | % |
U.S. Equity ETF | | | 0.23 | % |
U.S. Mid Cap Equity ETF | | | 0.24 | % |
U.S. Small Cap Equity ETF | | | 0.29 | % |
U.S. Dividend ETF | | | 0.23 | % |
U.S. Minimum Volatility ETF | | | 0.23 | % |
U.S. Momentum Factor ETF | | | 0.23 | % |
U.S. Quality Factor ETF | | | 0.23 | % |
U.S. Value Factor ETF | | | 0.23 | % |
The Adviser waived Investment Advisory fees and/or reimbursed expenses as outlined in Note 3.D.
B. Administration Fee — Pursuant to an Administration Agreement, the Administrator provides certain administration services to the Funds. In consideration of these services, the Administrator receives a fee accrued daily and paid monthly at an annual rate of 0.085% of the average daily net assets of each Fund in the Trust covered by the Administration Agreement (excluding certain funds of funds and money market funds).
The Administrator waived Administration fees as outlined in Note 3.D.
JPMorgan Chase Bank, N.A. (“JPMCB”), a wholly-owned subsidiary of JPMorgan, serves as the Funds’ sub-administrator (the “Sub-administrator”). For its services as Sub-administrator, JPMCB receives a portion of the fees payable to the Administrator.
C. Custodian, Accounting and Transfer Agent Fees — JPMCB provides custody, accounting and transfer agency services to the Funds. The amounts paid directly to JPMCB by the Funds for custody services are included in the Custodian, Accounting and Transfer Agent fees on the SOP. Interest income earned on cash balances at the custodian, if any, is included in Interest income from affiliates on the SOP. Prior to March 1, 2018, payments to the custodian were reduced by credits earned by the Fund, based on uninvested cash balances held by the custodian. Such earnings credits, if any, are included in the Custodian, Accounting and Transfer Agent fees on the SOP. With respect to the transfer agency services provided by JPMCB for each creation or redemption transaction, the Authorized Participant will generally be responsible for such associated expenses; during the period, the Funds paid no transfer agency fees to JPMCB.
Additionally, Authorized Participants generally pay transaction fees associated with the creation and redemption of fund shares. These fees are used to offset certain custodian charges incurred by the Fund for these transactions.
For the period ended October 31, 2018, the amount of transaction fees paid by the Authorized Participants to the Funds that were used to reimburse Custodian and Transfer Agent fees were as follows:
| | | | |
BetaBuilders Canada ETF | | $ | 58,500 | |
BetaBuilders Developed Asia ex-Japan ETF | | | 75,600 | |
BetaBuilders Europe ETF | | | 214,000 | |
BetaBuilders Japan ETF | | | 124,000 | |
Emerging Markets Equity ETF | | | 132,300 | |
Europe Equity ETF | | | 28,500 | |
Global Equity ETF | | | 130,900 | |
International Equity ETF | | | 187,200 | |
U.S. Equity ETF | | | 36,250 | |
U.S. Mid Cap Equity ETF | | | 15,000 | |
U.S. Small Cap Equity ETF | | | 33,600 | |
U.S. Dividend ETF | | | 1,800 | |
U.S. Minimum Volatility ETF | | | 1,200 | |
U.S. Momentum Factor ETF | | | 2,400 | |
U.S. Quality Factor ETF | | | 1,800 | |
U.S. Value Factor ETF | | | 2,100 | |
| | | | | | | | |
| | | |
| OCTOBER 31, 2018 | | J.P. MORGAN EXCHANGE-TRADED FUNDS | | | | | 227 | |
NOTES TO FINANCIAL STATEMENTS
AS OF OCTOBER 31, 2018 (continued)
Such amounts are included in expense reimbursements from non-affiliates in the SOP.
Restricted cash on the SAL is cash received from Authorized Participants for the reimbursement of creation and/or redemption of Fund shares.
Interest expense paid to the custodian related to cash overdrafts, if any, is included in Interest expense to affiliates on the SOP.
D. Waivers and Reimbursements — The Adviser has contractually agreed to waive fees and/or reimburse the Funds to the extent that total annual operating expenses, (excluding acquired fund fees and expenses, except with respect to Diversified Return Europe Equity Currency Hedged ETF and Diversified Return International Currency Hedged ETF where the expense limitation agreement includes acquired fund fees and expenses, dividend expenses related to short sales, interest, taxes, expenses related to litigation and potential litigation, and extraordinary expenses), exceed the percentages of the Funds’ respective average daily net assets as shown in the below table:
| | | | |
| | | Expense Cap | |
BetaBuilders Canada ETF | | | 0.19 | % |
BetaBuilders Developed Asia ex-Japan ETF | | | 0.19 | % |
BetaBuilders Europe ETF | | | 0.09 | % |
BetaBuilders Japan ETF | | | 0.19 | % |
Emerging Markets Equity ETF | | | 0.45 | % |
Europe Currency Hedged ETF | | | 0.38 | %* |
Europe Equity ETF | | | 0.38 | %** |
Global Equity ETF | | | 0.38 | % |
International Currency Hedged ETF | | | 0.38 | %* |
International Equity ETF | | | 0.38 | %** |
U.S. Equity ETF | | | 0.19 | % |
U.S. Mid Cap Equity ETF | | | 0.24 | % |
U.S. Small Cap Equity ETF | | | 0.29 | % |
U.S. Dividend ETF | | | 0.12 | % |
U.S. Minimum Volatility ETF | | | 0.12 | % |
U.S. Momentum Factor ETF | | | 0.12 | % |
U.S. Quality Factor ETF | | | 0.12 | % |
U.S. Value Factor ETF | | | 0.12 | % |
| * | Prior to May 1, 2018, the contractual expense limitation for Europe Currency Hedged ETF and International Currency Hedged ETF was 0.49%. |
| ** | Prior to May 1, 2018, the contractual expense limitation for Europe Equity ETF and International Equity ETF was 0.43%. |
The expense limitation agreements were in effect for the period ended October 31, 2018 and are in place until at least February 28, 2022, except for the U.S. Dividend ETF, U.S. Minimum Volatility ETF, U.S. Momentum Factor ETF, U.S. Quality Factor ETF and U.S. Value Factor ETF for which expense limitation agreements are in place until at least November 3, 2020 and BetaBuilders Canada ETF, BetaBuilders Developed Asia ex-Japan ETF, BetaBuilders Europe ETF and BetaBuilders Japan ETF for which expense limitation agreements are in place until at least June 30, 2021.
For the period ended October 31, 2018, the Funds’ service providers waived fees and/or reimbursed expenses for each of the Funds as follows. None of these parties expect the Funds to repay any such waived fees and/or reimbursed expenses in future years.
| | | | | | | | | | | | | | | | |
| | | Contractual Waivers | | | | |
| | | Investment
Advisory Fees | | | Administration
Fees | | | Total | | | Contractual
Reimbursements | |
BetaBuilders Canada ETF | | $ | 302,549 | | | $ | 201,698 | | | $ | 504,247 | | | $ | — | |
BetaBuilders Developed Asia ex-Japan ETF | | | 149,239 | | | | 99,493 | | | | 248,732 | | | | — | |
BetaBuilders Europe ETF | | | 271,149 | | | | 256,188 | | | | 527,337 | | | | 20,082 | |
BetaBuilders Japan ETF | | | 529,075 | | | | 352,718 | | | | 881,793 | | | | — | |
Emerging Markets Equity ETF | | | 755,290 | | | | 176,788 | | | | 932,078 | | | | — | |
Europe Currency Hedged ETF | | | 98,878 | | | | 25,469 | | | | 124,347 | | | | 90,658 | |
Europe Equity ETF | | | 139,724 | | | | 67,977 | | | | 207,701 | | | | — | |
Global Equity ETF | | | 138,721 | | | | 92,482 | | | | 231,203 | | | | — | |
International Currency Hedged ETF | | | 100,105 | | | | 31,515 | | | | 131,620 | | | | 104,903 | |
International Equity ETF | | | 247,574 | | | | 165,050 | | | | 412,624 | | | | — | |
U.S. Equity ETF | | | 646,492 | | | | 423,343 | | | | 1,069,835 | | | | — | |
U.S. Mid Cap Equity ETF | | | 158,426 | | | | 83,267 | | | | 241,693 | | | | — | |
U.S. Small Cap Equity ETF | | | 149,310 | | | | 66,664 | | | | 215,974 | | | | — | |
U.S. Dividend ETF | | | 60,082 | | | | 22,297 | | | | 82,379 | | | | 83,688 | |
U.S. Minimum Volatility ETF | | | 60,200 | | | | 22,323 | | | | 82,523 | | | | 84,023 | |
U.S. Momentum Factor ETF | | | 62,983 | | | | 23,333 | | | | 86,316 | | | | 82,430 | |
U.S. Quality Factor ETF | | | 61,866 | | | | 22,941 | | | | 84,807 | | | | 82,133 | |
U.S. Value Factor ETF | | | 61,301 | | | | 22,751 | | | | 84,052 | | | | 83,455 | |
Additionally, the Funds may invest in one or more money market funds advised by the Adviser or its affiliates (affiliated money market funds). The Adviser, Administrator and/or JPMDS, as shareholder servicing agent, have contractually agreed to waive fees and/or reimburse expenses in an amount sufficient to offset the respective net fees each collects from the affiliated money market fund on the applicable Funds’ investment in such affiliated money market fund.
| | | | | | |
| | | |
| 228 | | | | J.P. MORGAN EXCHANGE-TRADED FUNDS | | OCTOBER 31, 2018 |
The amounts of these waivers resulting from investments in these money market funds for the period ended October 31, 2018 were as follows:
| | | | |
BetaBuilders Canada ETF | | $ | 41 | |
BetaBuilders Developed Asia ex-Japan ETF | | | 1,406 | |
BetaBuilders Europe ETF | | | 110 | |
BetaBuilders Japan ETF | | | 111 | |
Emerging Markets Equity ETF | | | 1,127 | |
Global Equity ETF | | | 1,210 | |
International Equity ETF | | | 10,176 | |
U.S. Equity ETF | | | 3,926 | |
U.S. Mid Cap Equity ETF | | | 1,289 | |
U.S. Small Cap Equity ETF | | | 1,261 | |
U.S. Dividend ETF | | | 250 | |
U.S. Minimum Volatility ETF | | | 204 | |
U.S. Momentum Factor ETF | | | 153 | |
U.S. Quality Factor ETF | | | 209 | |
U.S. Value Factor ETF | | | 260 | |
The Europe Currency Hedged ETF and International Currency Hedged ETF invest in Underlying ETFs and, as a result, bear a portion of the expenses incurred by these Underlying ETFs. These expenses are reflected in the fees waived shown on the SOP and are included in the ratios to average net assets shown in the Financial Highlights.
The amounts of these waivers resulting from investments in Underlying ETFs for the year ended October 31, 2018 were as follows:
| | | | |
Europe Currency Hedged ETF | | | 120,870 | |
International Currency Hedged ETF | | | 150,600 | |
E. Distribution Services — The Distributor or its agent distributes Creation Units for each Fund on an agency basis. The Distributor does not maintain a secondary market in shares of each Fund. JPMDS receives no fees for their distribution services under their respective distribution agreements with the Trust (the “Distribution Agreements”). Although the Trust does not pay any fees under the Distribution Agreements, JPMIM pays JPMDS for certain distribution related services.
F. Other — Certain officers of the Trust are affiliated with the Adviser, the Administrator and the JPMDS. Such officers, with the exception of the Chief Compliance Officer, receive no compensation from the Funds for serving in their respective roles.
The Board appointed a Chief Compliance Officer to the Funds in accordance with Federal securities regulations. Each Fund, along with other affiliated funds, makes reimbursement payments, on a pro-rata basis, to the Administrator for a portion of the fees associated with the Office of the Chief Compliance Officer. Such fees are included in Trustees’ and Chief Compliance Officer’s fees on the SOP.
The Funds may use related party broker-dealers. For the period ended October 31, 2018, the Funds did not incur any brokerage commissions with broker dealers affiliated with the Adviser.
The Securities and Exchange Commission (“SEC”) has granted an exemptive order permitting the Funds to engage in principal transactions with J.P. Morgan Securities, Inc., an affiliated broker, involving taxable money market instruments, subject to certain conditions.
4. Investment Transactions
During the period ended October 31, 2018, purchases and sales of investments (excluding short-term investments) were as follows:
| | | | | | | | |
| | | Purchases
(excluding U.S.
Government) | | | Sales
(excluding U.S.
Government) | |
BetaBuilders Canada ETF (a) | | $ | 8,209,025 | | | $ | 14,727,876 | |
BetaBuilders Developed Asia ex-Japan ETF (a) | | | 177,283,905 | | | | 9,793,488 | |
BetaBuilders Europe ETF(b) | | | 23,811,851 | | | | 17,280,324 | |
BetaBuilders Japan ETF (b) | | | 73,883,645 | | | | 65,149,252 | |
Emerging Markets Equity ETF | | | 155,827,823 | | | | 109,936,557 | |
Europe Currency Hedged ETF | | | 4,206,967 | | | | 1,996,428 | |
Europe Equity ETF | | | 39,786,088 | | | | 41,981,221 | |
Global Equity ETF | | | 70,763,360 | | | | 56,441,887 | |
International Currency Hedged ETF | | | 3,738,176 | | | | 2,110,381 | |
International Equity ETF | | | 472,463,036 | | | | 400,750,710 | |
U.S. Equity ETF | | | 157,236,191 | | | | 159,318,992 | |
U.S. Mid Cap Equity ETF | | | 33,611,785 | | | | 34,596,629 | |
U.S. Small Cap Equity ETF | | | 23,514,627 | | | | 23,686,539 | |
U.S. Dividend ETF (c) | | | 6,315,247 | | | | 6,827,465 | |
U.S. Minimum Volatility ETF (c) | | | 4,625,962 | | | | 4,639,044 | |
U.S. Momentum Factor ETF (c) | | | 12,927,572 | | | | 12,207,457 | |
U.S. Quality Factor ETF (c) | | | 6,130,209 | | | | 6,472,271 | |
U.S. Value Factor ETF (c) | | | 6,945,485 | | | | 7,045,605 | |
| | | | | | | | |
| | | |
| OCTOBER 31, 2018 | | J.P. MORGAN EXCHANGE-TRADED FUNDS | | | | | 229 | |
NOTES TO FINANCIAL STATEMENTS
AS OF OCTOBER 31, 2018 (continued)
During the period ended October 31, 2018, there were no purchases or sales of U.S. Government securities.
For the period ended October 31, 2018, in-kind transactions associated with creations and redemptions were:
| | | | | | | | |
| | | In-Kind
Creations | | | In-Kind
Redemptions | |
BetaBuilders Canada ETF (a) | | $ | 2,212,547,537 | | | $ | 45,050,626 | |
BetaBuilders Developed Asia ex-Japan ETF (a) | | | 492,444,025 | | | | — | |
BetaBuilders Europe ETF (b) | | | 1,390,183,298 | | | | — | |
BetaBuilders Japan ETF (b) | | | 2,425,496,842 | | | | — | |
Emerging Markets Equity ETF | | | 28,649,812 | | | | — | |
Europe Equity ETF | | | 17,210,798 | | | | 11,321,745 | |
Global Equity ETF | | | 133,388,516 | | | | 32,635,668 | |
International Currency Hedged ETF | | | — | | | | 15,171,535 | |
International Equity ETF | | | 443,230,506 | | | | 62,476,316 | |
U.S. Equity ETF | | | 203,465,919 | | | | 6,911,063 | |
U.S. Mid Cap Equity ETF | | | 54,191,425 | | | | 6,689,167 | |
U.S. Small Cap Equity ETF | | | 50,368,115 | | | | 9,670,327 | |
U.S. Dividend ETF (c) | | | 26,997,946 | | | | — | |
U.S. Minimum Volatility ETF (c) | | | 25,687,817 | | | | — | |
U.S. Momentum Factor ETF (c) | | | 26,820,420 | | | | — | |
U.S. Quality Factor ETF (c) | | | 27,054,772 | | | | — | |
U.S. Value Factor ETF (c) | | | 28,178,719 | | | | — | |
| (a) | Commencement of operations was August 7, 2018. |
| (b) | Commencement of operations was June 15, 2018. |
| (c) | Commencement of operations was November 8, 2017. |
5. Federal Income Tax Matters
For Federal income tax purposes, the estimated cost and unrealized appreciation (depreciation) in value of investments held at October 31, 2018 were as follows:
| | | | | | | | | | | | | | | | |
| | | Aggregate
Cost | | | Gross
Unrealized
Appreciation
| | | Gross
Unrealized
Depreciation | | | Net Unrealized
Appreciation
(Depreciation) | |
BetaBuilders Canada ETF | | $ | 2,231,967,144 | | | $ | 5,219,475 | | | $ | (138,643,060 | ) | | $ | (133,423,585 | ) |
BetaBuilders Developed Asia ex-Japan ETF | | | 660,322,106 | | | | 1,499,833 | | | | (61,765,023 | ) | | | (60,265,190 | ) |
BetaBuilders Europe ETF | | | 1,423,437,291 | | | | 12,573,803 | | | | (104,039,386 | ) | | | (91,465,583 | ) |
BetaBuilders Japan ETF | | | 2,455,483,496 | | | | 23,524,625 | | | | (143,563,472 | ) | | | (120,038,847 | ) |
Emerging Markets Equity ETF | | | 218,146,996 | | | | 15,298,676 | | | | (20,099,638 | ) | | | (4,800,962 | ) |
Europe Currency Hedged ETF | | | 29,310,392 | | | | 459,673 | | | | (38,085 | ) | | | 421,588 | |
Europe Equity ETF | | | 74,198,114 | | | | 4,864,021 | | | | (4,888,694 | ) | | | (24,673 | ) |
Global Equity ETF | | | 206,887,659 | | | | 12,192,019 | | | | (16,399,967 | ) | | | (4,207,948 | ) |
International Currency Hedged ETF | | | 31,195,332 | | | | 804,063 | | | | (71,890 | ) | | | 732,173 | |
International Equity ETF | | | 1,486,427,465 | | | | 82,854,171 | | | | (132,082,618 | ) | | | (49,228,447 | ) |
U.S. Equity ETF | | | 530,980,595 | | | | 52,738,486 | | | | (20,419,108 | ) | | | 32,319,378 | |
U.S. Mid Cap Equity ETF | | | 107,546,439 | | | | 8,807,959 | | | | (3,898,670 | ) | | | 4,909,289 | |
U.S. Small Cap Equity ETF | | | 97,202,334 | | | | 8,263,595 | | | | (7,040,465 | ) | | | 1,223,130 | |
U.S. Dividend ETF | | | 27,453,402 | | | | 1,527,238 | | | | (1,502,149 | ) | | | 25,089 | |
U.S. Minimum Volatility ETF | | | 26,324,915 | | | | 2,128,663 | | | | (931,433 | ) | | | 1,197,230 | |
U.S. Momentum Factor ETF | | | 27,356,507 | | | | 2,707,210 | | | | (1,385,223 | ) | | | 1,321,987 | |
U.S. Quality Factor ETF | | | 27,484,766 | | | | 2,536,821 | | | | (907,456 | ) | | | 1,629,365 | |
U.S. Value Factor ETF | | | 28,705,609 | | | | 1,800,675 | | | | (1,553,276 | ) | | | 247,399 | |
The difference between book and tax basis appreciation (depreciation) on investments is primarily attributed to wash sale loss deferrals, investments in passive foreign investment companies (“PFICs”), investments in real estate investment trusts (“REITs”) and mark-to-market of futures contracts.
| | | | | | |
| | | |
| 230 | | | | J.P. MORGAN EXCHANGE-TRADED FUNDS | | OCTOBER 31, 2018 |
The Tax character of distributions paid during the year ended October 31, 2018 was as follows:
| | | | | | | | | | | | | | | | |
| | | Ordinary
Income* | | | Net
Long-Term
Capital Gains | | | Return of
Capital | | | Total
Distributions
Paid | |
BetaBuilders Canada ETF | | $ | 2,945,124 | | | $ | — | | | $ | — | | | $ | 2,945,124 | |
BetaBuilders Developed Asia ex-Japan ETF | | | 4,159,764 | | | | — | | | | — | | | | 4,159,764 | |
BetaBuilders Europe ETF | | | 1,891,512 | | | | — | | | | — | | | | 1,891,512 | |
BetaBuilders Japan ETF | | | — | | | | — | | | | — | | | | — | |
Emerging Markets Equity ETF | | | 8,601,176 | | | | — | | | | — | | | | 8,601,176 | |
Europe Currency Hedged ETF | | | 851,015 | | | | | | | | | | | | 851,015 | |
Europe Equity ETF | | | 4,014,806 | | | | — | | | | — | | | | 4,014,806 | |
Global Equity ETF | | | 5,818,989 | | | | — | | | | — | | | | 5,818,989 | |
International Currency Hedged ETF | | | 1,022,148 | | | | — | | | | — | | | | 1,022,148 | |
International Equity ETF | | | 54,092,274 | | | | — | | | | — | | | | 54,092,274 | |
U.S. Equity ETF | | | 12,462,949 | | | | | | | | | | | | 12,462,949 | |
U.S. Mid Cap Equity ETF | | | 2,149,261 | | | | — | | | | — | | | | 2,149,261 | |
U.S. Small Cap Equity ETF | | | 1,058,143 | | | | — | | | | — | | | | 1,058,143 | |
U.S. Dividend ETF | | | 908,996 | | | | — | | | | — | | | | 908,996 | |
U.S. Minimum Volatility ETF | | | 549,553 | | | | — | | | | — | | | | 549,553 | |
U.S. Momentum Factor ETF | | | 338,121 | | | | — | | | | — | | | | 338,121 | |
U.S. Quality Factor ETF | | | 496,228 | | | | — | | | | — | | | | 496,228 | |
U.S. Value Factor ETF | | | 616,329 | | | | — | | | | — | | | | 616,329 | |
| * | Short-term gain distributions are treated as ordinary income for income tax purposes. |
The tax character of distributions paid during the year ended October 31, 2017 was as follows:
| | | | | | | | | | | | |
| | | Ordinary
Income* | | | Net
Long-Term
Capital Gains | | | Total
Distributions
Paid | |
Emerging Markets Equity ETF | | $ | 771,056 | | | $ | — | | | $ | 771,056 | |
Europe Currency Hedged ETF | | | 1,256,932 | | | | 1,083,788 | | | | 2,340,720 | |
Europe Equity ETF | | | 1,338,720 | | | | — | | | | 1,338,720 | |
Global Equity ETF | | | 1,695,420 | | | | — | | | | 1,695,420 | |
International Currency Hedged ETF | | | 801,634 | | | | 547,901 | | | | 1,349,535 | |
International Equity ETF | | | 9,230,405 | | | | — | | | | 9,230,405 | |
U.S. Equity ETF | | | 1,329,650 | | | | — | | | | 1,329,650 | |
U.S. Mid Cap Equity ETF | | | 396,160 | | | | — | | | | 396,160 | |
U.S. Small Cap Equity ETF | | | 36,680 | | | | — | | | | 36,680 | |
| * | Short-term gain distributions are treated as ordinary income for income tax purposes. |
As of October 31, 2018, the estimated components of net assets (excluding paid-in-capital) on a tax basis were as follows:
| | | | | | | | | | | | | | | | |
| | | Current
Distributable
Ordinary
Income | | | Current
Distributable
Long-Term
Capital Gain | | | Tax Basis
Capital Loss
Carryover | | | Unrealized
Appreciation
(Depreciation) | |
BetaBuilders Canada ETF | | $ | 5,115,838 | | | $ | — | | | $ | (772,844 | ) | | $ | (133,511,816 | ) |
BetaBuilders Developed Asia ex-Japan ETF | | | 858,464 | | | | — | | | | (149,273 | ) | | | (60,275,356 | ) |
BetaBuilders Europe ETF | | | 2,791,412 | | | | — | | | | — | | | | (91,552,347 | ) |
BetaBuilders Japan ETF | | | 15,509,433 | | | | — | | | | (917,863 | ) | | | (120,036,476 | ) |
Emerging Markets Equity ETF | | | 613,687 | | | | — | | | | (8,573,723 | ) | | | (4,801,629 | ) |
Europe Currency Hedged ETF | | | 781,770 | | | | 614,789 | | | | — | | | | 410,623 | |
Europe Equity ETF | | | 35,141 | | | | — | | | | (149,231 | ) | | | (31,332 | ) |
Global Equity ETF | | | 179,948 | | | | — | | | | (404,849 | ) | | | (4,213,478 | ) |
International Currency Hedged ETF | | | 675,618 | | | | 293,544 | | | | — | | | | 728,304 | |
International Equity ETF | | | 3,968,246 | | | | — | | | | (3,014,624 | ) | | | (49,299,723 | ) |
U.S. Equity ETF | | | 860,128 | | | | — | | | | (1,607,722 | ) | | | 32,319,378 | |
U.S. Mid Cap Equity ETF | | | 141,032 | | | | — | | | | (475,898 | ) | | | 4,909,289 | |
U.S. Small Cap Equity ETF | | | 43,567 | | | | — | | | | (348,136 | ) | | | 1,223,130 | |
U.S. Dividend ETF | | | 85,030 | | | | — | | | | (265,350 | ) | | | 25,088 | |
U.S. Minimum Volatility ETF | | | 62,906 | | | | — | | | | (92,913 | ) | | | 1,197,231 | |
U.S. Momentum Factor ETF | | | 25,567 | | | | — | | | | (304,497 | ) | | | 1,321,987 | |
U.S. Quality Factor ETF | | | 46,753 | | | | — | | | | (108,318 | ) | | | 1,629,365 | |
U.S. Value Factor ETF | | | 56,746 | | | | — | | | | (104,119 | ) | | | 247,400 | |
| | | | | | | | |
| | | |
| OCTOBER 31, 2018 | | J.P. MORGAN EXCHANGE-TRADED FUNDS | | | | | 231 | |
NOTES TO FINANCIAL STATEMENTS
AS OF OCTOBER 31, 2018 (continued)
For the Funds the cumulative timing differences primarily consist of wash sale loss deferrals, capital Loss Carryover, mark-to-market of futures contracts, mark to market of forward foreign currency contracts and investments in passive foreign investment companies (“PFICs”).
As of October 31, 2018, the following Funds had net capital loss carryforwards as follows:
| | | | | | | | |
| | | Capital Loss Carryforward Character | |
| | | Short-Term | | | Long-Term | |
BetaBuilders Canada ETF | | $ | (772,844 | ) | | $ | — | |
BetaBuilders Developed Asia ex-Japan ETF | | | (149,273 | ) | | | — | |
BetaBuilders Japan ETF | | | (917,863 | ) | | | — | |
Emerging Markets Equity ETF | | | (8,430,347 | ) | | | (143,376 | ) |
Europe Equity ETF | | | (149,231 | ) | | | — | |
Global Equity ETF | | | (404,849 | ) | | | | |
International Equity ETF | | | (3,014,624 | ) | | | — | |
U.S. Equity ETF | | | (1,607,722 | ) | | | — | |
U.S. Mid Cap Equity ETF | | | (475,898 | ) | | | — | |
U.S. Small Cap Equity ETF | | | (348,136 | ) | | | — | |
U.S. Dividend ETF | | | (265,350 | ) | | | — | |
U.S. Minimum Volatility ETF | | | (91,144 | ) | | | (1,769 | ) |
U.S. Momentum Factor ETF | | | (304,497 | ) | | | — | |
U.S. Quality Factor ETF | | | (108,318 | ) | | | — | |
U.S. Value Factor ETF | | | (104,119 | ) | | | — | |
During the year ended October 31, 2018, the following Funds utilized capital loss carryforwards as follows:
| | | | | | | | |
| | | Short-Term | | | Long-Term | |
Emerging Markets Equity ETF | | $ | 1,583,336 | | | | 469,956 | |
Europe Currency Hedged ETF | | | 503,280 | | | | 565,820 | |
Europe Equity ETF | | | 84,108 | | | | — | |
Global Equity ETF | | | 428,239 | | | | 351,978 | |
International Currency Hedged ETF | | | 218,381 | | | | 207,560 | |
International Equity ETF | | | — | | | | 4,472,246 | |
U.S. Equity ETF | | | — | | | | 243,462 | |
6. Capital Share Transactions
The Trust issues and redeems shares of the Funds only in Creation Units through the Distributor at NAV. Capital shares transactions detail can be found in the Statements of Changes in Net Assets.
Shares of the Funds may only be purchased or redeemed by Authorized Participants. Such Authorized Participants may from time to time hold, of record or beneficially, a substantial percentage of the Funds’ shares outstanding, act as executing or clearing broker for investment transactions on behalf of the Funds. An Authorized Participant is either (1) a “Participating Party” or other participant in the clearing process through the Continuous Net Settlement System of the National Securities Clearing Corporation (“NSCC”); or (2) a DTC Participant; which, in either case, must have executed an agreement with the Distributor.
Creation Units of a Fund may be created in advance of receipt by the Trust of all or a portion of the applicable basket of equity securities and other instruments (“Deposit Instruments”) and cash as described in the Funds’ registration statement. In these instances, the initial Deposit Instruments and cash must be deposited in an amount equal to the sum of the cash amount, plus at least 105%, for BetaBuilders Canada ETF, BetaBuilders Developed Asia Pacific ex-Japan ETF, BetaBuilders Europe ETF, BetaBuilders Japan ETF, Europe Currency Hedged ETF, Europe Equity ETF, Global Equity ETF, International Currency Hedged ETF and International Equity ETF, and plus at least 110% for Emerging Markets Equity ETF of the market value of undelivered Deposit Instruments. A transaction fee may be imposed to offset transfer and other transaction costs associated with the purchase or redemption of Creation Units.
7. Risks, Concentrations and Indemnifications
In the normal course of business, the Funds enter into contracts that contain a variety of representations which provide general indemnifications. Each Fund’s maximum exposure under these arrangements is unknown. The amount of exposure would depend on future claims that may be brought against each Fund. However, based on experience, the Funds expect the risk of loss to be remote.
As of October 31, 2018, the Adviser owns shares representing more than 10% of net assets of following Funds:
| | | | |
| | | %
of Ownership | |
Europe Currency Hedged ETF | | | 92 | % |
Europe Equity ETF | | | 37 | |
| | | | | | |
| | | |
| 232 | | | | J.P. MORGAN EXCHANGE-TRADED FUNDS | | OCTOBER 31, 2018 |
| | | | |
| | | %
of Ownership | |
International Currency Hedged ETF | | | 87 | % |
U.S. Small Cap Equity ETF | | | 29 | |
U.S. Dividend ETF | | | 90 | |
U.S. Minimum Volatility ETF | | | 95 | |
U.S. Momentum Factor ETF | | | 91 | |
U.S. Quality Factor ETF | | | 91 | |
U.S. Value Factor ETF | | | 87 | |
As of October 31, 2018, the Europe Currency Hedged ETF owned approximately 39% of the shares outstanding of the Europe Equity ETF.
Significant shareholder transactions by the Adviser may impact the Funds’ performance.
Because of the Funds’ investments in Underlying Funds and ETFs, the Funds indirectly pay a portion of the expenses incurred by the Underlying Funds and ETFs. As a result, the cost of investing in the Funds may be higher than the cost of investing in a mutual fund that invests directly in individual securities and financial instruments. The Funds are also subject to certain risks related to the Underlying Funds’ and ETFs’ investments in securities and financial instruments such as fixed income securities, including high yield, asset-backed and mortgage-related securities; equity securities, foreign and emerging markets securities, commodities and real estate securities. These securities are subject to risks specific to their structure, sector or market.
Europe Currency Hedged ETF and International Currency Hedged ETF invest in affiliated ETFs. ETFs are pooled investment vehicles whose ownership interests are purchased and sold on a securities exchange. ETFs may be structured as investment companies, depositary receipts or other pooled investment vehicles and may be passively or actively managed. Passively managed ETFs generally seek to track the performance of a particular market index, including broad-based market indices, as well as indices relating to particular sectors, markets, regions or industries. Actively managed ETFs do not seek to track the performance of a particular market index. The price movement of an index-based ETF may not track the underlying index and may result in a loss. In addition, ETFs may trade at a price below or above their NAV (also known as a discount or premium, respectively).
In addition, the Underlying Funds and ETFs may use derivative instruments in connection with their individual investment strategies including futures, forward foreign currency exchange contracts, options, swaps and other derivatives, which are also subject to specific risks related to their structure, sector or market and may be riskier than investments in other types of securities. Specific risks and concentrations present in the Underlying Funds and ETFs are disclosed within their individual financial statements and registration statements, as appropriate.
Derivatives may be riskier than other types of investments because they may be more sensitive to changes in economic and market conditions and could result in losses that significantly exceed the Funds’ original investment. Derivatives also expose the Funds to counterparty risk (the risk that the derivative counterparty will not fulfill its contractual obligations), including credit risk of the derivative counterparty.
The BetaBuilders Canada ETF, BetaBuilders Developed Asia ex-Japan ETF, BetaBuilders Europe ETF, BetaBuilders Japan ETF, Emerging Markets Equity ETF, Europe Currency Hedged ETF, Europe Equity ETF, Global Equity ETF, International Currency Hedged ETF and International Equity ETF may have elements of risk not typically associated with investments in the United States of America due to concentrated investments in a limited number of countries or regions, which may vary throughout the period depending on the Funds. Such concentrations may subject each Fund to additional risks resulting from political or economic conditions in such countries or regions and the possible imposition of adverse governmental laws or currency exchange restrictions could cause the securities and their markets to be less liquid and their prices to be more volatile than those of comparable U.S. securities.
Investing in securities of foreign countries may include certain risks and considerations not typically associated with investing in U.S. securities. These risks include revaluation of currencies, high rates of inflation, repatriation restrictions on income and currencies, and future and adverse political, social and economic developments.
As of October 31, 2018, the following Funds had non-U.S. country allocations representing greater than 10% of total investments as follows:
| | | | | | | | | | | | | | | | | | | | | | | | | | | | | | | | | | | | | | | | | | | | |
| Fund Name | | Australia | | | Canada | | | China | | | France | | | Germany | | | Hong
Kong | | | Japan | | | Singapore | | | Switzerland | | | Taiwan | | | United
Kingdom | |
BetaBuilders Canada ETF | | | — | % | | | 93.6 | % | | | — | % | | | — | % | | | — | % | | | — | % | | | — | % | | | — | % | | | — | % | | | — | % | | | — | % |
BetaBuilders Developed Asia ex-Japan ETF | | | 57.1 | | | | — | | | | — | | | | — | | | | — | | | | 27.2 | | | | — | | | | 12.0 | | | | — | | | | — | | | | — | |
BetaBuilders Europe ETF | | | — | | | | — | | | | — | | | | 15.9 | | | | 13.4 | | | | — | | | | — | | | | — | | | | 13.8 | | | | — | | | | 23.1 | |
BetaBuilders Japan ETF | | | — | | | | — | | | | — | | | | — | | | | — | | | | — | | | | 99.2 | | | | — | | | | — | | | | — | | | | — | |
Emerging Markets Equity ETF | | | — | | | | — | | | | 21.2 | | | | — | | | | — | | | | — | | | | — | | | | — | | | | — | | | | 15.3 | | | | — | |
Europe Equity ETF | | | — | | | | — | | | | — | | | | 15.1 | | | | 12.4 | | | | — | | | | — | | | | — | | | | — | | | | — | | | | 20.7 | |
Global Equity ETF | | | — | | | | — | | | | — | | | | — | | | | — | | | | — | | | | 22.3 | | | | — | | | | — | | | | — | | | | — | |
International Equity ETF | | | — | | | | — | | | | — | | | | — | | | | — | | | | — | | | | 25.1 | | | | — | | | | — | | | | — | | | | 16.5 | |
| | | | | | | | |
| | | |
| OCTOBER 31, 2018 | | J.P. MORGAN EXCHANGE-TRADED FUNDS | | | | | 233 | |
NOTES TO FINANCIAL STATEMENTS
AS OF OCTOBER 31, 2018 (continued)
As of October 31, 2018, a significant portion of each Fund’s net assets noted in the table above consisted of securities that were denominated in foreign currencies. Changes in currency exchange rates will affect the value of, and investment income from, such securities.
Disruptions to creations and redemptions, the existence of significant market volatility or potential lack of an active trading market for the Shares (including through a trading halt), as well as other factors, may result in Shares trading significantly above (at a premium) or below (at a discount) to the NAV or to the intraday value of the Fund’s holdings. During such periods, investors may incur significant losses if shares are sold.
The Funds may not track the return of the underlying index for a number of reasons and therefore may not achieve its investment objective. For example, each Fund incurs a number of operating expenses not applicable to its underlying index, and incurs costs in buying and selling securities, especially when rebalancing the Fund’s securities holdings to reflect changes in the composition of the underlying index. In addition, a Fund’s return may differ from the return of its underlying index as a result of, among other things, pricing differences and the inability to purchase certain securities included in the underlying index due to regulatory or other restrictions. To the extent of the previously outlined items, each Fund’s return differs from the return of the underlying index.
The Europe Currency Hedged ETF and International Currency Hedged ETF are also subject to counterparty credit risk, which is the risk that a counterparty fails to perform on agreements with the Funds such as forward foreign currency exchange contracts.
8. New Accounting Pronouncements
In August 2018, the Financial Accounting Standard Board (“FASB”) issued Accounting Standard Update (“ASU”) 2018-13 (“ASU 2018-13”), Fair Value Measurement (Topic 820): Disclosure Framework — Changes to the Disclosure Requirements for Fair Value Measurement, which adds, removes, and modifies certain aspects of the fair value disclosure. ASU 2018-13 amendments are the result of a broader disclosure project, FASB Concepts Statement Conceptual Framework for Financial Reporting — Chapter 8: Notes to Financial Statements, to improve the effectiveness of the fair value disclosure requirements. ASU 2018-13 is effective for the fiscal years, and interim periods within those fiscal years, beginning after December 15, 2019; early adoption is permitted. Management is currently evaluating the implications of these changes.
In August 2018, the SEC adopted their Disclosure Update and Simplification Rule (the “Rule”). The Rule is part of the SEC’s overall project to improve disclosure effectiveness by amending certain disclosure requirements that have become redundant, duplicative, overlapping, outdated, or superseded in light of other SEC disclosure requirements, U.S. GAAP, or changes in the information environment. The amendments are intended to facilitate the disclosure of information to investors and simplify compliance without significantly altering the total mix of information provided to investors. We have evaluated the implications of these changes and the amendments are included in the financial statements, which had no effect on the Funds’ net assets or results of operation.
9. Subsequent Event
During the period November 1, 2018 through December 21, 2018, Europe Currency Hedged ETF and Europe Equity ETF had net redemptions of $19,908,565 and $40,755,248, respectively. These amounts represented approximately 69% and 54%, respectively, of the Funds’ net assets as of October 31, 2018.
| | | | | | |
| | | |
| 234 | | | | J.P. MORGAN EXCHANGE-TRADED FUNDS | | OCTOBER 31, 2018 |
REPORT OF INDEPENDENT REGISTERED PUBLIC ACCOUNTING FIRM
To the Board of Trustees of J.P. Morgan Exchange-Traded Fund Trust and Shareholders of JPMorgan BetaBuilders Canada ETF, JPMorgan BetaBuilders Developed Asia ex-Japan ETF, JPMorgan BetaBuilders Europe ETF, JPMorgan BetaBuilders Japan ETF, JPMorgan Diversified Return Emerging Markets Equity ETF, JPMorgan Diversified Return Europe Currency Hedged ETF, JPMorgan Diversified Return Europe Equity ETF, JPMorgan Diversified Return Global Equity ETF, JPMorgan Diversified Return International Currency Hedged ETF, JPMorgan Diversified Return International Equity ETF, JPMorgan Diversified Return U.S. Equity ETF, JPMorgan Diversified Return U.S. Mid Cap Equity ETF, JPMorgan Diversified Return U.S. Small Cap Equity ETF, JPMorgan U.S. Dividend ETF, JPMorgan U.S. Minimum Volatility ETF, JPMorgan U.S. Momentum Factor ETF, JPMorgan U.S. Quality Factor ETF and JPMorgan U.S. Value Factor ETF
Opinions on the Financial Statements
We have audited the accompanying statements of assets and liabilities, including the schedules of portfolio investments, of each of the funds listed in the table below (eighteen of the funds constituting J.P Morgan Exchange-Traded Fund Trust, hereafter collectively referred to as the “Funds”) as of October 31, 2018, the related statements of operations and of changes in net assets for each of the periods indicated in the table below, including the related notes, and the financial highlights for each of the periods indicated therein (collectively referred to as the “financial statements”).
| | |
JPMorgan BetaBuilders Canada ETF JPMorgan BetaBuilders Developed Asia ex-Japan ETF | | Statement of operations and statement of changes in net assets for the period August 7, 2018 (commencement of operations) through October 31, 2018 |
JPMorgan BetaBuilders Europe ETF JPMorgan BetaBuilders Japan ETF | | Statement of operations and statement of changes in net assets for the period June 15, 2018 (commencement of operations) through October 31, 2018 |
JPMorgan Diversified Return Emerging Markets Equity ETF JPMorgan Diversified Return Europe Currency Hedged ETF JPMorgan Diversified Return Europe Equity ETF JPMorgan Diversified Return Global Equity ETF JPMorgan Diversified Return International Currency Hedged ETF JPMorgan Diversified Return International Equity ETF JPMorgan Diversified Return U.S. Equity ETF JPMorgan Diversified Return U.S. Mid Cap Equity ETF | | Statement of operations for the year ended October 31, 2018 and statement of changes in net assets for each of the two years in the period ended October 31, 2018 |
| JPMorgan Diversified Return U.S. Small Cap Equity ETF | | Statement of operations for the year ended October 31, 2018 and statement of changes in net assets for the year ended October 31, 2018 and the period November 15, 2016 (commencement of operations) through October 31, 2017 |
JPMorgan U.S. Dividend ETF JPMorgan U.S. Minimum Volatility ETF JPMorgan U.S. Momentum Factor ETF JPMorgan U.S. Quality Factor ETF JPMorgan U.S. Value Factor ETF | | Statement of operations and statement of changes in net assets for the period November 8, 2017 (commencement of operations) through October 31, 2018 |
In our opinion, the financial statements present fairly, in all material respects, the financial position of each of the Funds as of October 31, 2018, the results of each of their operations and the changes in each of their net assets for each of the periods indicated in the table above, and each of the financial highlights for each of the periods indicated therein, in conformity with accounting principles generally accepted in the United States of America.
Basis for Opinions
These financial statements are the responsibility of the Funds’ management. Our responsibility is to express an opinion on the Funds’ financial statements based on our audits. We are a public accounting firm registered with the Public Company Accounting Oversight Board (United States) (“PCAOB”) and are required to be independent with respect to the Funds in accordance with the U.S. federal securities laws and the applicable rules and regulations of the Securities and Exchange Commission and the PCAOB.
We conducted our audits of these financial statements in accordance with the standards of the PCAOB. Those standards require that we plan and perform the audit to obtain reasonable assurance about whether the financial statements are free of material misstatement, whether due to error or fraud.
| | | | | | | | |
| | | |
| OCTOBER 31, 2018 | | J.P. MORGAN EXCHANGE-TRADED FUNDS | | | | | 235 | |
REPORT OF INDEPENDENT REGISTERED PUBLIC ACCOUNTING FIRM
(continued)
Our audits included performing procedures to assess the risks of material misstatement of the financial statements, whether due to error or fraud, and performing procedures that respond to those risks. Such procedures included examining, on a test basis, evidence regarding the amounts and disclosures in the financial statements. Our audits also included evaluating the accounting principles used and significant estimates made by management, as well as evaluating the overall presentation of the financial statements. Our procedures included confirmation of securities owned as of October 31, 2018 by correspondence with the custodian, transfer agent and brokers; when replies were not received from brokers, we performed other auditing procedures. We believe that our audits provide a reasonable basis for our opinions.
/s/PricewaterhouseCoopers LLP
New York, New York
December 21, 2018
We have served as the auditor of one or more investment companies in the JPMorgan Funds complex since 1993.
| | | | | | |
| | | |
| 236 | | | | J.P. MORGAN EXCHANGE-TRADED FUNDS | | OCTOBER 31, 2018 |
TRUSTEES
(Unaudited)
The Funds’ Statements of Additional Information includes additional information about the Funds’ Trustees and is available, without charge, upon request by calling 1-844-457-6383 or on the J.P. Morgan Funds’ website at www.jpmorganfunds.com.
| | | | | | | | |
Name (Year of Birth;
Positions With
the Funds since) | | Principal Occupation
During Past 5 Years | | Number of
Funds in Fund
Complex Overseen
by Trustee (1) | | | Other Directorships Held
During the Past 5 Years |
Independent Trustees | | | | | | | | |
| | | |
Gary L. French (1951);
Trustee of the Trust since 2014 | | Real Estate Investor (2011–present); Consultant to the Mutual Fund Industry (2011-Present); Senior Consultant for The Regulatory Fundamentals Group LLC (2011–2017); Senior Vice President–Fund Administration, State Street Corporation (2002–2010). | | | 34 | | | Independent Trustee, The China Fund, Inc. (2013-present); Exchange Traded Concepts Trust II (2012-2014); Exchange Traded Concepts Trust I (2011-2014). |
| | | |
| Robert J. Grassi (1957); Trustee of the Trust since 2014 | | Sole Proprietor, Academy Hills Advisors LLC (2012-present); Pension Director, Corning Incorporated (2002-2012). | | | 34 | | | None. |
| | | |
| Thomas P. Lemke (1954); Trustee of the Trust since 2014 | | Retired; Executive Vice President and General Counsel, Legg Mason (2005-2013). | | | 34 | | | SEI family of funds (Independent Trustee of Advisors’ Inner Circle Fund III (20 portfolios) (from February 2014 to Present); Independent Trustee of Winton Diversified Opportunities Fund (from December 2014 to Present); Independent Trustee of Gallery Trust (from August 2015 to Present); Independent Trustee of Schroder Series Trust (from 2017 to Present) Independent Trustee of Schroder Global Series Trust (from February 2017 to Present); Independent Trustee of O’Connor EQUUS (May 2014-April 2016), Independent Trustee of Winton Series Trust (December 2014-March 2017); Independent Trustee of AXA Premier VIP Trust (2014-June 2017); Independent Director of The Victory Funds (or their predecessor funds) (35 portfolios) (2014-March 2015). |
| | | |
| Lawrence R. Maffia (1950); Trustee of the Trust since 2014 | | Retired; Director and President, ICI Mutual Insurance Company (2006-2013). | | | 34 | | | Director, ICI Mutual Insurance Company (1999-2013). |
| | | |
| Emily A. Youssouf (1951); Trustee of the Trust since 2014 | | Clinical Professor, NYU Schack Institute of Real Estate (2009-present); Board Member (2005-present), Chair of Capital Committee (2006-2016), Chair of Audit Committee (2005-present), and Chair of IT Committee (2016-present), NYC Health and Hospitals Corporation; Board Member and Member of the Audit Committee and Related Parties Committee (2013-present) and Member of the Risk Management Committee (2017-present), PennyMac Financial Services, Inc. | | | 34 | | | Trustee, NYC School Construction Authority (2009-present); Board Member, NYS Job Development Authority (2008-present); Trustee (2015-present) and Chair of the Audit and Finance Committee (2015-present) of the Transit Center Foundation; Vice Chair (2011-2013) and Board Member (2013-2014) of New York City Housing Authority. |
Interested Trustee | | | | | | | | |
| | | |
| Robert Deutsch (2) (1957); Chairman and Trustee of the Trust since 2014 | | Retired; Head of the Global ETF Business for JPMorgan Asset Management (2013-2017); Head of the Global Liquidity Business for JPMorgan Asset Management (2003-2013). | | | 34 | | | Board of Directors of the JUST Capital Foundation (2017–present). |
| (1) | A Fund Complex means two or more registered investment companies that hold themselves out to investors as related companies for purposes of investment and investor services or have a common investment adviser or have an investment adviser that is an affiliated person of the investment adviser of any of the other registered investment companies. Twenty nine series of the Trust have commenced operations. |
| (2) | Mr. Deutsch is an interested trustee because he was an employee of the Adviser until August 2017. |
The contact address for each of the Trustees is 270 Park Avenue, New York, NY 10017.
| | | | | | | | |
| | | |
| OCTOBER 31, 2018 | | J.P. MORGAN EXCHANGE-TRADED FUNDS | | | | | 237 | |
OFFICERS
(Unaudited)
| | |
Name (Year of Birth),
Positions Held with
the Trusts (Since) | | Principal Occupations During Past 5 Years |
| |
Joanna Gallegos (1975), President and Principal Executive Officer (2017) | | Managing Director, Head of J.P. Morgan Asset Management’s U.S. Exchange Traded Funds business. Previously, Head of J.P. Morgan Asset Management’s ETF Product Development team from August 2013 to July 2017; Managing Director of the Strategic Initiatives Group in BlackRock’s iShares Exchange Traded Funds division from 2010 to 2013. |
| |
Lauren A. Paino (1973), Treasurer and Principal Financial Officer (2015)* | | Executive Director, J.P. Morgan Investment Management Inc. (formerly JPMorgan Funds Management, Inc.) since August 2013; Director, Credit Suisse Asset Management from 2000 to 2013. |
| |
Brian S. Shlissel (1964), Vice President (2016) | | Managing Director and Chief Administrative Officer for J.P. Morgan pooled vehicles, J.P. Morgan Investment Management Inc. (formerly JPMorgan Funds Management, Inc.) (from 2014 to present); Managing Director and Head of Mutual Fund Services, Allianz Global Investors; President and Chief Executive Officer, Allianz Global Investors Mutual Funds and PIMCO Closed-End Funds (from 1999 to 2014). |
| |
Paul Shield (1960), Vice President and Assistant Treasurer (2016) | | Managing Director and head of Business Management for JPMorgan Asset Management’s Exchange Traded Fund platform since 2013. Senior Global Product Manager of Alternative Investments for BNY Mellon from 2011 to 2013 and Global Product Head for Exchange Traded Funds at JPMorgan Chase Bank from 2008 to 2011. |
| |
| Elizabeth A. Davin (1964), Secretary (2018)** | | Executive Director and Assistant General Counsel, JPMorgan Chase. Ms. Davin has been with JPMorgan Chase (formerly Bank One Corporation) since 2004. |
| |
Stephen M. Ungerman (1953), Chief Compliance Officer (2014) | | Managing Director, JPMorgan Chase & Co.; Mr. Ungerman has been with JPMorgan Chase & Co. since 2000. |
| |
Jessica K. Ditullio (1962), Assistant Secretary (2014)** | | Executive Director and Assistant General Counsel, JPMorgan Chase. Ms. Ditullio has been with JPMorgan Chase (formerly Bank One Corporation) since 1990. |
| |
Carmine Lekstutis (1980), Assistant Secretary (2014) | | Executive Director and Assistant General Counsel, JPMorgan Chase since February 2015; formerly Vice President and Assistant General Counsel, JPMorgan Chase from 2011 to February 2015. |
| |
Gregory S. Samuels (1980), Assistant Secretary (2014) | | Executive Director and Assistant General Counsel, JPMorgan Chase since February 2014; formerly Vice President and Assistant General Counsel, JPMorgan Chase since 2010. |
| |
Pamela L. Woodley (1971), Assistant Secretary (2014) | | Vice President and Assistant General Counsel, JPMorgan Chase since November 2004. |
| |
| Zachary E. Vonnegut-Gabovitch (1986), Assistant Secretary (2017) | | Vice President and Assistant General Counsel, JPMorgan Chase since September 2016; Associate, Morgan Lewis & Bockius (law firm) from 2012 to 2016. |
| |
| Frederick J. Cavaliere (1978), Assistant Treasurer (2015)* | | Executive Director, J.P. Morgan Investment Management Inc. since February 2016; formerly, Vice President, J.P. Morgan Investment Management Inc. (formerly JPMorgan Funds Management, Inc.) since September 2010 to February 2016. Mr. Cavaliere has been with JPMorgan since May 2006. |
| |
Michael M. D’Ambrosio (1969), Assistant Treasurer (2014) | | Managing Director, J.P. Morgan Investment Management Inc. (formerly JPMorgan Funds Management, Inc.) since May 2014; formerly Executive Director, J.P. Morgan Investment Management Inc. (formerly JPMorgan Funds Management, Inc.) from 2012 to May 2014. |
| |
Jason Ronca (1978), Assistant Treasurer (2014)*** | | Executive Director, Assistant Treasurer and ETF Platform Manager for J.P. Morgan Asset Management since February 2017; formerly Vice President, Assistant Treasurer and ETF Platform Manager for J.P. Morgan Asset Management from May 2014 to February 2017. ETF Product Manager for Corporate Investment Bank responsible for setting the strategy and control agenda for the ETF servicing business from 2010 to May 2014; Prior to 2010, a Vice President in Fund Accounting within J.P. Morgan Investor Services, supporting a series of U.S. registered mutual funds. |
The contact address for each of officers, unless otherwise noted, is 270 Park Avenue, New York, NY 10017.
| * | | The contact address for the officer is 4 New York Plaza, New York, NY 10004. |
| ** | | The contact address for the officer is 1111 Polaris Parkway, Columbus, OH 43240. |
| *** | | The contact address for the officer is 50 Rowes Wharf, Floor 3, Boston, MA 02110. |
| | | | | | |
| | | |
| 238 | | | | J.P. MORGAN EXCHANGE-TRADED FUNDS | | OCTOBER 31, 2018 |
SCHEDULE OF SHAREHOLDER EXPENSES
(Unaudited)
Hypothetical $1,000 Investment
As a shareholder of the Funds, you incur ongoing costs, investment advisory fees, administration fees and other Fund expenses, in addition to brokerage commissions on your purchases and sales of Fund shares. The examples below are intended to help you understand your ongoing costs (in dollars) of investing in the Fund and to compare these ongoing costs with the ongoing costs of investing in other funds. The examples assume that you had a $1,000 investment at the beginning of the reporting period May 1, 2018 and continued to hold your shares at the end of the reporting period, October 31, 2018.
Actual Expenses
For the Fund in the table below, the first line provides information about actual account values and actual expenses. You may use the information in this line, together with the amount you invested, to estimate the expenses that you paid over the period. Simply divide your account value by $1,000 (for example, an $8,600 account value divided by $1,000 = 8.6), then
multiply the result by the number under the heading entitled “Expenses Paid During the Period” to estimate the expenses you paid on your account during this period.
Hypothetical Example for Comparison Purposes
The second line in the table below provides information about hypothetical account values and hypothetical expenses based on the Fund’s actual expense ratio and an assumed rate of return of 5% per year before expenses, which is not the Fund’s actual return. The hypothetical account values and expenses may not be used to estimate the actual ending account balance or expenses you paid for the period. You may use this information to compare the ongoing costs of investing in the Fund and other Funds. To do so, compare this 5% hypothetical example with the 5% hypothetical examples that appear in the shareholder reports of other funds. The examples also assume all dividends and distributions have been reinvested.
| | | | | | | | | | | | | | | | |
| | | Beginning
Account Value | | | Ending
Account Value
October 31, 2018 | | | Annualized
Expense
Ratio | | | Expenses
Paid During
the Period | |
BetaBuilders Canada ETF | | | | | | | | | | | | | | | | |
ETF Shares | | | | | | | | | | | | | | | | |
Actual (2) | | $ | 1,000.00 | | | $ | 918.20 | | | | 0.19 | % | | $ | 0.42 | |
Hypothetical (1) | | | 1,000.00 | | | | 1,024.26 | | | | 0.19 | | | | 0.44 | |
| | | | |
BetaBuilders Developed Asia ex-Japan ETF | | | | | | | | | | | | | | | | |
ETF Shares | | | | | | | | | | | | | | | | |
Actual (2) | | $ | 1,000.00 | | | $ | 900.30 | | | | 0.19 | % | | $ | 0.42 | |
Hypothetical (1) | | | 1,000.00 | | | | 1,024.25 | | | | 0.19 | | | | 0.45 | |
| | | | |
BetaBuilders Europe ETF | | | | | | | | | | | | | | | | |
ETF Shares | | | | | | | | | | | | | | | | |
Actual (3) | | $ | 1,000.00 | | | $ | 912.50 | | | | 0.09 | % | | $ | 0.32 | |
Hypothetical (1) | | | 1,000.00 | | | | 1,024.75 | | | | 0.09 | | | | 0.34 | |
| | | | |
BetaBuilders Japan ETF | | | | | | | | | | | | | | | | |
ETF Shares | | | | | | | | | | | | | | | | |
Actual (3) | | $ | 1,000.00 | | | $ | 916.50 | | | | 0.19 | % | | $ | 0.67 | |
Hypothetical (1) | | | 1,000.00 | | | | 1,024.26 | | | | 0.19 | | | | 0.71 | |
| | | | |
Emerging Markets Equity ETF | | | | | | | | | | | | | | | | |
ETF Shares | | | | | | | | | | | | | | | | |
Actual (1) | | $ | 1,000.00 | | | $ | 886.30 | | | | 0.45 | % | | $ | 2.14 | |
Hypothetical (1) | | | 1,000.00 | | | | 1,022.94 | | | | 0.45 | | | | 2.29 | |
| | | | |
Europe Currency Hedged ETF | | | | | | | | | | | | | | | | |
ETF Shares | | | | | | | | | | | | | | | | |
Actual (1) | | $ | 1,000.00 | | | $ | 962.90 | | | | — | % | | $ | — | |
Hypothetical (1) | | | 1,000.00 | | | | 1,025.21 | | | | — | | | | — | |
| | | | |
Europe Equity ETF | | | | | | | | | | | | | | | | |
ETF Shares | | | | | | | | | | | | | | | | |
Actual (1) | | $ | 1,000.00 | | | $ | 895.90 | | | | 0.38 | % | | $ | 1.82 | |
Hypothetical (1) | | | 1,000.00 | | | | 1,023.29 | | | | 0.38 | | | | 1.94 | |
| | | | |
Global Equity ETF | | | | | | | | | | | | | | | | |
ETF Shares | | | | | | | | | | | | | | | | |
Actual (1) | | $ | 1,000.00 | | | $ | 921.50 | | | | 0.38 | % | | $ | 1.84 | |
Hypothetical (1) | | | 1,000.00 | | | | 1,023.29 | | | | 0.38 | | | | 1.94 | |
| | | | | | | | |
| | | |
| OCTOBER 31, 2018 | | J.P. MORGAN EXCHANGE-TRADED FUNDS | | | | | 239 | |
SCHEDULE OF SHAREHOLDER EXPENSES
(Unaudited) (continued)
Hypothetical $1,000 Investment
| | | | | | | | | | | | | | | | |
| | | Beginning
Account Value | | | Ending
Account Value
October 31, 2018 | | | Annualized
Expense
Ratio | | | Expenses
Paid During
the Period | |
International Currency Hedged ETF | | | | | | | | | | | | | | | | |
ETF Shares | | | | | | | | | | | | | | | | |
Actual (1) | | $ | 1,000.00 | | | $ | 948.50 | | | | — | % | | $ | — | |
Hypothetical (1) | | | 1,000.00 | | | | 1,025.21 | | | | — | | | | — | |
| | | | |
International Equity ETF | | | | | | | | | | | | | | | | |
ETF Shares | | | | | | | | | | | | | | | | |
Actual (1) | | $ | 1,000.00 | | | $ | 896.50 | | | | 0.38 | % | | $ | 1.82 | |
Hypothetical (1) | | | 1,000.00 | | | | 1,023.29 | | | | 0.38 | | | | 1.94 | |
| | | | |
U.S. Equity ETF | | | | | | | | | | | | | | | | |
ETF Shares | | | | | | | | | | | | | | | | |
Actual (1) | | $ | 1,000.00 | | | $ | 1,013.90 | | | | 0.19 | % | | $ | 0.96 | |
Hypothetical (1) | | | 1,000.00 | | | | 1,024.25 | | | | 0.19 | | | | 0.97 | |
| | | | |
U.S. Mid Cap Equity ETF | | | | | | | | | | | | | | | | |
ETF Shares | | | | | | | | | | | | | | | | |
Actual (1) | | $ | 1,000.00 | | | $ | 994.30 | | | | 0.24 | % | | $ | 1.21 | |
Hypothetical (1) | | | 1,000.00 | | | | 1,024.00 | | | | 0.24 | | | | 1.22 | |
| | | | |
U.S. Small Cap Equity ETF | | | | | | | | | | | | | | | | |
ETF Shares | | | | | | | | | | | | | | | | |
Actual (1) | | $ | 1,000.00 | | | $ | 1,012.60 | | | | 0.29 | % | | $ | 1.46 | |
Hypothetical (1) | | | 1,000.00 | | | | 1,023.74 | | | | 0.29 | | | | 1.48 | |
| | | | |
U.S. Dividend ETF | | | | | | | | | | | | | | | | |
ETF Shares | | | | | | | | | | | | | | | | |
Actual (1) | | $ | 1,000.00 | | | $ | 1,021.60 | | | | 0.12 | % | | $ | 0.60 | |
Hypothetical (1) | | | 1,000.00 | | | | 1,024.60 | | | | 0.12 | | | | 0.61 | |
| | | | |
U.S. Minimum Volatility ETF | | | | | | | | | | | | | | | | |
ETF Shares | | | | | | | | | | | | | | | | |
Actual (1) | | $ | 1,000.00 | | | $ | 1,046.40 | | | | 0.12 | % | | $ | 0.60 | |
Hypothetical (1) | | | 1,000.00 | | | | 1,024.60 | | | | 0.12 | | | | 0.61 | |
| | | | |
U.S. Momentum Factor ETF | | | | | | | | | | | | | | | | |
ETF Shares | | | | | | | | | | | | | | | | |
Actual (1) | | $ | 1,000.00 | | | $ | 1,004.50 | | | | 0.12 | % | | $ | 0.60 | |
Hypothetical (1) | | | 1,000.00 | | | | 1,024.60 | | | | 0.12 | | | | 0.61 | |
| | | | |
U.S. Quality Factor ETF | | | | | | | | | | | | | | | | |
ETF Shares | | | | | | | | | | | | | | | | |
Actual (1) | | $ | 1,000.00 | | | $ | 1,047.30 | | | | 0.12 | % | | $ | 0.60 | |
Hypothetical (1) | | | 1,000.00 | | | | 1,024.60 | | | | 0.12 | | | | 0.61 | |
| | | | |
U.S. Value Factor ETF | | | | | | | | | | | | | | | | |
ETF Shares | | | | | | | | | | | | | | | | |
Actual (1) | | $ | 1,000.00 | | | $ | 1,008.20 | | | | 0.12 | % | | $ | 0.60 | |
Hypothetical (1) | | | 1,000.00 | | | | 1,024.60 | | | | 0.12 | | | | 0.61 | |
| (1) | Expenses are equal to the Fund’s annualized expense ratio, multiplied by the average account value over the period, multiplied by 184/365 (to reflect the one-half year period |
| (2) | Expenses are equal to the Fund’s annualized expense ratio, multiplied by the average account value over the period, multiplied by 85/365 (to reflect the actual period). The Fund commenced operations on August 7, 2018. |
| (3) | Expenses are equal to the Fund’s annualized expense ratio, multiplied by the average account value over the period, multiplied by 136/365 (to reflect the actual period). The Fund commenced operations on June 15, 2018. |
| | | | | | |
| | | |
| 240 | | | | J.P. MORGAN EXCHANGE-TRADED FUNDS | | OCTOBER 31, 2018 |
TAX LETTER
(Unaudited)
Certain tax information for the J.P. Morgan Funds is required to be provided to shareholders based upon the Funds’ income and distributions for the taxable year ended October 31, 2018. The information and distributions reported in this letter may differ from the information and taxable distributions reported to the shareholders for the calendar year ending December 31, 2018. The information necessary to complete your income tax returns for the calendar year ending December 31, 2018 will be provided under separate cover.
Dividends Received Deduction (DRD)
Each Fund listed below had the following percentage, or maximum allowable percentage, of ordinary income distributions eligible for the dividends received deduction for corporate shareholders for the fiscal year ended October 31, 2018:
| | | | |
| | | Dividends
Received
Deduction | |
Global Equity ETF | | | 15.96 | % |
Europe Currency Hedged ETF | | | 100.00 | |
International Currency Hedged ETF | | | 100.00 | |
U.S. Equity ETF | | | 76.48 | |
U.S. Mid Cap Equity ETF | | | 69.24 | |
U.S. Small Cap Equity ETF | | | 89.43 | |
U.S. Dividend ETF | | | 80.95 | |
U.S. Minimum Volatility ETF | | | 93.95 | |
U.S. Momentum Factor ETF | | | 100.00 | |
U.S. Quality Factor ETF | | | 100.00 | |
U.S. Value Factor ETF | | | 94.63 | |
Qualified Dividend Income (QDI)
Each Fund listed below had the following amount, or maximum allowable amount, of ordinary income distributions treated as qualified dividends for the fiscal year ended October 31, 2018:
| | | | |
| | | Qualified
Dividend
Income | |
BetaBuilders Canada ETF | | $ | 4,749,130 | |
BetaBuilders Developed Asia ex-Japan ETF | | | 3,466,515 | |
BetaBuilders Europe ETF | | | 2,199,507 | |
BetaBuilders Japan ETF | | | 1,715,621 | |
Emerging Markets Equity ETF | | | 2,842,883 | |
Europe Currency Hedged ETF | | | 851,015 | |
Europe Equity ETF | | | 2,740,411 | |
Global Equity ETF | | | 4,719,535 | |
International Currency Hedged ETF | | | 1,022,148 | |
International Equity ETF | | | 39,194,777 | |
U.S. Equity ETF | | | 9,930,989 | |
U.S. Mid Cap Equity ETF | | | 1,550,229 | |
U.S. Small Cap Equity ETF | | | 956,335 | |
U.S. Dividend ETF | | | 760,898 | |
U.S. Minimum Volatility ETF | | | 533,516 | |
U.S. Momentum Factor ETF | | | 338,121 | |
U.S. Quality Factor ETF | | | 496,228 | |
U.S. Value Factor ETF | | | 616,329 | |
Foreign Source Income and Foreign Tax Credit Pass Through
For the fiscal year ended October 31, 2018, the following Funds intend to elect to pass through to shareholders taxes paid to foreign countries. Gross income and foreign tax expenses are as follows or amounts as finally determined:
| | | | | | | | |
| | | Gross
Income | | | Foreign Tax
Pass Through | |
BetaBuilders Canada ETF | | $ | 10,515,557 | | | $ | 1,804,006 | |
BetaBuilders Developed Asia
ex-Japan ETF | | | 5,159,293 | | | | 44,306 | |
BetaBuilders Europe ETF | | | 5,027,361 | | | | 307,995 | |
BetaBuilders Japan ETF | | | 17,172,556 | | | | 1,715,621 | |
Emerging Markets Equity ETF | | | 7,482,579 | | | | 733,454 | |
Europe Equity ETF | | | 2,838,152 | | | | 300,363 | |
Global Equity ETF | | | 4,543,110 | | | | 424,190 | |
International Equity ETF | | | 46,613,379 | | | | 3,571,308 | |
| | | | | | | | |
| | | |
| OCTOBER 31, 2018 | | J.P. MORGAN EXCHANGE-TRADED FUNDS | | | | | 241 | |
BOARD APPROVAL OF INITIAL INVESTMENT ADVISORY AGREEMENTS
(Unaudited)
JPMorgan BetaBuilders Canada ETF, JPMorgan BetaBuilders Developed Asia ex-Japan ETF, JPMorgan BetaBuilders Europe ETF and JPMorgan BetaBuilders Japan ETF
On March 13-14, 2018, the Board of Trustees held an in-person meeting and approved the initial investment advisory agreements (each an “Advisory Agreement” and collectively, the “Advisory Agreements”) for the JPMorgan BetaBuilders Canada ETF, JPMorgan BetaBuilders Developed Asia ex-Japan ETF, JPMorgan BetaBuilders Europe ETF and JPMorgan BetaBuilders Japan ETF (the “Funds”). The Advisory Agreements were approved by a majority of the Trustees who are not “Interested Persons” (as defined in the 1940 Act) of any party to the Advisory Agreements or any of their affiliates. In connection with the approval of the Advisory Agreements, the Trustees reviewed written materials prepared by the Adviser and received oral presentations from Adviser personnel. Before voting on the proposed Advisory Agreements, the Trustees reviewed the Advisory Agreements with representatives of the Adviser and with counsel to the Trust and independent legal counsel to the Trustees and received a memorandum from independent legal counsel discussing the legal standards for their consideration of the proposed Advisory Agreements. The Trustees also discussed the proposed Advisory Agreements in executive session with independent legal counsel at which no representatives of the Adviser were present. Set forth below is a summary of the material factors evaluated by the Trustees in determining whether to approve each Advisory Agreement.
The Trustees considered information provided with respect to each Fund and the approval of each Advisory Agreement. Each Trustee attributed his or her own evaluation of the significance of the various factors, and no factor alone was considered determinative. The Trustees determined that the proposed compensation to be received by the Adviser from each Fund under the applicable Advisory Agreement was fair and reasonable and that the initial approval of the Advisory Agreements was in the best interests of each Fund and its potential shareholders.
The factors summarized below were considered and discussed by the Trustees in reaching their conclusions:
Nature, Extent and Quality of Services Provided by the Adviser
In connection with the approval of the initial Advisory Agreements, the Trustees considered the materials furnished specifically in connection with the approval of each Advisory Agreement, as well as other relevant information furnished for the Trustees. The Trustees considered the background and experience of the Adviser’s senior management and investment personnel of the Adviser. In addition, the Trustees reviewed the qualifications, backgrounds and responsibilities of the portfolio management team primarily responsible for the day-to-day management of each Fund. The Trustees also considered the investment strategy for each Fund, and the infrastructure supporting the portfolio management teams. In addition, the
Trustees considered information about the structure and distribution strategy of the Funds, how they fit within the Trust’s other fund offerings, and how each will be positioned against peer funds, as identified by management. The Trustees also considered the services provided by the Adviser in its role as each Fund’s administrator.
The Trustees also considered their knowledge of the nature and quality of the services provided by the Adviser and its affiliates gained from their experience as Trustees of the Trust and in the financial industry generally. In addition, they considered the overall reputation and capabilities of the Adviser and its affiliates, the commitment of the Adviser to provide high quality service to each Fund, their overall confidence in the Adviser’s integrity and the Adviser’s responsiveness to requests for additional information, questions or concerns raised by them.
Based upon these considerations and other factors, the Trustees concluded that they were satisfied with the nature, extent and quality of services to be provided to each Fund by the Adviser.
Fall-Out Benefits
The Trustees reviewed information regarding potential “fall-out” or ancillary benefits received by the Adviser and its affiliates as a result of their relationship with the Trust. Additionally, the Trustees considered that any fall-out or ancillary benefits would be comparable to those related to the other funds in the complex.
The Trustees also considered the benefits the Adviser receives as the result of its role as each Fund’s administrator and JPMorgan Chase Bank, N.A.’s roles as custodian, fund accountant and transfer agent for each Fund.
Economies of Scale
The Trustees considered the extent to which each Fund will benefit from economies of scale. The Trustees noted that neither the proposed investment advisory fee schedule nor the proposed administration agreement for the Funds contain breakpoints. The Trustees considered whether it would be appropriate to add advisory fee breakpoints and the Trustees concluded that the current fee structure for each Fund was reasonable in light of the fee waivers and expense limitations that the Adviser has in place, limiting the overall net expense ratio of each Fund to competitive levels. With respect to fees for administrative services, the Trustees also considered the fact that each Fund would benefit from the economies of scale present in the broader J.P. Morgan fund complex, as the Funds were able to negotiate an administration fee at a level consistent with the lower effective rate currently paid by the J.P. Morgan mutual funds, which includes breakpoints. The Trustees also took into consideration management’s belief that because of such economies of scale, each Fund’s administration fee is lower than what it would have to pay if it was not part of the J.P. Morgan fund complex.
| | | | | | |
| | | |
| 242 | | | | J.P. MORGAN EXCHANGE-TRADED FUNDS | | OCTOBER 31, 2018 |
Investment Performance
The Trustees considered each Fund’s investment strategy and processes, the portfolio management team and competitive positioning against identified peer funds, and concluded that the prospects for competitive future performance were acceptable.
Advisory Fees and Expense Ratios
The Trustees considered the contractual advisory fee rate and administration fee rate that will be paid by each Fund to the Adviser and compared the combined rate to information prepared by Broadridge Investor Communications Solutions Inc., using data from Lipper Inc. (together, “Broadridge/Lipper”), independent providers of investment company data, concerning management fee rates paid by other funds in the same Broadridge/Lipper category as each Fund. The Trustees also compared the advisory fees for certain of the Funds to the fees charged to mutual funds with similar investment objectives or
in similar asset classes managed by the Adviser. The Trustees also considered the fees paid to JPMorgan Chase Bank, N.A., an affiliate of the Adviser, for custody, transfer agency and other related services for each Fund. The Trustees also reviewed information about other projected expenses and the expense ratio for each Fund. The Trustees considered the projected fee waiver and/or expense reimbursement arrangements proposed for each Fund and considered the net advisory fee rate and total expense ratio after taking into account any projected waivers and/or reimbursements.
The Trustees noted that each Fund’s estimated net advisory fee and total expense ratio were in line with identified peer funds. The Trustees also noted that because the Funds were not yet operational, no profitability information was available. After considering the factors identified above, in light of the information, the Trustees concluded that each Fund’s advisory fee and total expense ratio were reasonable.
| | | | | | | | |
| | | |
| OCTOBER 31, 2018 | | J.P. MORGAN EXCHANGE-TRADED FUNDS | | | | | 243 | |
J.P. Morgan Exchange-Traded Funds are distributed by JPMorgan Distribution Services, Inc, an indirect, wholly-owned subsidiary of JPMorgan Chase & Co.
Contact J.P. Morgan Exchange-Traded Funds at 1-844-457-6383 (844-4JPM ETF) for a fund prospectus. You can also visit us at www.jpmorganfunds.com. Investors should carefully consider the investment objectives and risks as well as charges and expenses of the fund before investing. The prospectus contains this and other information about the fund. Read the prospectus carefully before investing.
Investors may obtain information about the Securities Investor Protection Corporation (SIPC), including the SIPC brochure by visiting www.sipc.org or by calling SIPC at 202-371-8300.
The Fund files a complete schedule of its fund holdings for the first and third quarters of its fiscal year with the SEC on Form N-Q. The Fund’s Forms N-Q is available on the SEC’s website at http://www.sec.gov. Shareholders may request the Form N-Q without charge by calling 1-844-457-6383 or by visiting the J.P. Morgan Funds’ website at www.jpmorganfunds.com.
A description of each Fund’s policies and procedures with respect to the disclosure of each Fund’s holdings is available in the prospectus and Statement of Additional Information.
A copy of proxy policies and procedures is available without charge upon request by calling 1-844-457-6383 and on the Fund’s website at www.jpmorganfunds.com. A description of such policies and procedures is on the SEC’s website at www.sec.gov. The Trustees have delegated the authority to vote proxies for securities owned by the Fund to the Adviser. A copy of the Fund’s voting record for the most recent 12-month period ended June 30 is available on the SEC’s website at www.sec.gov or at the Fund’s website at www.jpmorganfunds.com no later than August 31 of each year. The Fund’s proxy voting record will include, among other things, a brief description of the matter voted on for each fund security, and will state how each vote was cast, for example, for or against the proposal.


J.P. Morgan Asset Management is the marketing name for the asset management businesses of JPMorgan Chase & Co. Those businesses include, but are not limited to, J.P. Morgan Investment Management Inc., Security Capital Research & Management Incorporated and J.P. Morgan Alternative Asset Management, Inc.
| | | | |
| | © JPMorgan Chase & Co., 2018. All rights reserved. October 2018. | | AN-ETF-1018 |
Annual Report
J.P. Morgan Exchange-Traded Funds
October 31, 2018
JPMorgan Diversified Alternatives ETF
JPMorgan Event Driven ETF
JPMorgan Long/Short ETF
JPMorgan Managed Futures Strategy ETF
Beginning on January 1, 2021, as permitted by regulations adopted by the Securities and Exchange Commission, paper copies of the Fund’s annual and semi-annual shareholder reports will no longer be sent by mail, unless you specifically request paper copies of the reports. Instead, the reports will be made available on the Fund’s website www.jpmorganfunds.com and you will be notified by mail each time a report is posted and provided with a website to access the report. If you already elected to receive shareholder reports electronically, you will not be affected by this change and you need not take any action.
You may elect to receive shareholder reports and other communications from the Fund electronically anytime by contacting your financial intermediary (such as a broker dealer, bank, or retirement plan).
Alternatively, you may elect to receive paper copies of all future reports free of charge by contacting your financial intermediary. Your election to receive paper reports will apply to all funds held within your account(s).
CONTENTS
Investments in the Fund are not bank deposits or obligations of, or guaranteed or endorsed by, any bank and are not insured or guaranteed by the FDIC, the Federal Reserve Board or any other government agency. You could lose money if you sell when the Fund’s share price is lower than when you invested.
Past performance is no guarantee of future performance. The general market views expressed in this report are opinions based on market and other conditions through the end of the reporting period and are subject to change without notice. These views are not intended to predict the future performance of the Fund or the securities markets. References to specific securities and their issuers are for illustrative purposes only and are not intended to be, and should not be interpreted as, recommendations to purchase or sell such securities. Such views are not meant as investment advice and may not be relied on as an indication of trading intent on behalf of the Fund.
Prospective investors should refer to the Fund’s prospectus for a discussion of the Fund’s investment objectives, strategies and risks. Call J.P. Morgan Exchange-Traded Funds at (844) 457-6383 for a prospectus containing more complete information about the Fund, including management fees and other expenses. Please read it carefully before investing.
Shares are bought and sold throughout the day on an exchange at market price (not at net asset value) through a brokerage account, and are not individually subscribed and redeemed from the Fund. Shares may only be subscribed and redeemed directly from the Fund by Authorized Participants, in very large creation/redemption units. Brokerage commissions will reduce returns.
PRESIDENT’S LETTER
DECEMBER 15, 2018 (Unaudited)
Dear Shareholder,
This past year has been a monumental one for JPMorgan’s Exchange-Traded Funds. We’ve expanded our investment lineup to 31 funds, including the launch of our BetaBuilders® ETF suite, which provides investors with market-capitalization weighted exposure to select regions or asset classes. Additionally, our business was recently awarded “The industry’s fastest-growing ETF manager”1 climbing to $16.3 billion in assets under management by mid-December 2018 from $2.9 billion at the end of last year.
| | |
 | | “Our range of investment solutions can help you navigate a changing financial market landscape.” — Joanna M. Gallegos |
During the twelve months ended October 31, 2018, U.S. equity markets outperformed other developed equity markets, as well as emerging markets equity. Record corporate profits, low unemployment rates and high levels of both consumer and business confidence helped propel U.S. equity prices higher. However, we have also seen the return of equity market volatility. Globally, bond markets largely underperformed equity markets. In the U.S., we expect the U.S. Federal Reserve to continue to lift interest rates in 2019, which is likely to create headwinds for fixed income investors.
Our alternative beta ETF, JPMorgan Managed Futures Strategy ETF (JPMF), which provides broad exposure to managed futures strategies, may provide an additional source of diversification in a rising interest rate environment. JPMF earned Best New Alternatives ETF at the fifth annual ETF.com Awards held in March 2018.2
We are proud to bring J.P. Morgan’s experience and capabilities to the ETF market place. Our range of investment solutions can help you navigate a changing financial market landscape. We are committed to building solutions that address your needs and help you build stronger portfolios. Thank you for your belief in our Firm and our process.
Sincerely,

Joanna M. Gallegos
President, J.P. Morgan Exchange-Traded Funds
J.P Morgan Asset Management
1-844-4JPM-ETF or jpmorgan.com/etfs for more information
| 1 | | Ignites.com as of 11/28/18 |
| 2 | | ETF.com Award winners are selected by a majority vote of the ETF.com Awards Selection Committee, a group of independent ETF experts. Voting was completed by Jan. 20, 2018, and results were announced at the ETF.com U.S. Awards Dinner on March 22, 2018. |
| | | | | | | | |
| | | |
| AUGUST 31, 2017 | | JPMORGAN EXCHANGE-TRADED FUNDS | | | | | 1 | |
Market Overview
Twelve Months Ended October 31, 2018 (Unaudited)
U.S. equity markets outperformed other developed market equity as well as emerging markets equity during the reporting period. Record corporate profits, low unemployment rates and high levels of both consumer and business confidence helped propel U.S. equity prices higher. Globally, bond markets largely underperformed equity markets. For the twelve months ended October 31, 2018, the MSCI World Index returned 1.16%.
After reaching record highs in the final months of 2017, the S&P 500 Index closed in record high territory 14 times in January 2018. However, a sharp sell-off in both equity and bond markets in early February 2018 spread to other markets and lifted market volatility from historic lows. While global equity and bond prices rebounded somewhat in subsequent months, it wasn’t until August 2018 that the S&P 500 Index returned to record highs. U.S. equity market volatility remained elevated in September and October 2018. For the twelve month reporting period, the S&P 500 Index returned 7.35%.
Meanwhile, economic growth in the European Union (EU) decelerated during the reporting period amid weakness in European exports and consumer confidence. Geo-political events, including a newly elected populist government in Italy and continued uncertainty over the final terms of a so-called Brexit agreement also weighed down equity and bond prices across the EU. Investor fears that the U.K. would leave the EU without an exit agreement also weighed on equity prices in London. For the reporting period, the MSCI EAFE Index returned -6.39%.
In emerging markets, a slowdown in credit growth in China and investor concerns about global trade tensions hurt equity prices. A stronger U.S. dollar and rising U.S. interest rates put further pressure on emerging markets, particularly those nations most reliant on foreign lending. For the reporting period, the MSCI Emerging Markets Index returned -12.19%, while the Bloomberg Barclays Emerging Markets Debt Index returned -3.39%.
| | | | | | |
| | | |
| 2 | | | | J.P. MORGAN EXCHANGE-TRADED FUNDS | | OCTOBER 31, 2018 |
JPMorgan Diversified Alternatives ETF
FUND COMMENTARY
Twelve Months Ended October 31, 2018 (Unaudited)
| | | | |
| REPORTING PERIOD RETURN: | | | |
| JPMorgan Diversified Alternatives ETF | | | | |
| Net Asset Value* | | | (6.79)% | |
| Market Price** | | | (6.75)% | |
| ICE BofAML 3-Month US Treasury Bill Index | | | 1.68% | |
| |
| Net Assets as of 10/31/2018 | | $ | 201,628,562 | |
INVESTMENT OBJECTIVE***
The JPMorgan Diversified Alternatives ETF (the “Fund”) seeks to provide long-term total return.
INVESTMENT APPROACH
The Fund seeks to achieve its investment objective by allocating assets across a variety of strategies commonly employed by hedge funds, including Equity Long/Short, Event Driven and Macro/Managed Futures strategies. The Fund seeks to achieve the efficiency of rules-based investing with the diversification benefits of alternative strategies without replicating an index.
The Fund uses derivatives, including swaps, futures and forward contracts, in implementing its strategies, and under normal market conditions, the Fund’s managers seek to obtain a significant portion of the Fund’s exposure through the use of derivatives, in addition to its exposure through direct investments. Derivatives, which are instruments that have a value based on another instrument, exchange rate or index, are primarily used as an efficient means of implementing a particular strategy in order to gain exposure to a desired strategy.
HOW DID THE FUND PERFORM?
For the twelve months ended October 31, 2018, the Fund posted a negative absolute performance and underperformed the ICE BofAML 3-Month US Treasury Bill Index (the “Index”).
The Fund’s allocation to alternative investment strategies, which are not held in the Index, detracted from performance relative to the Index. References to the Index are for informational purposes and are not an indication of how the Fund is managed. The use of the Index does not imply the Fund is
being managed like the Index and does not imply low risk or low volatility, but rather is disclosed to allow for comparison of the Fund’s performance to that of a well-known and widely recognized index.
On an absolute basis, the Fund’s allocations to the value, momentum and size factors within the Equity Long/Short sub-strategy, which were implemented primarily through the use of equity securities and total return swaps contracts, detracted from performance. From a return perspective, the value factor was the worst performing factor during the reporting period and extended a decline that began at the start of 2017.
The Fund’s allocations to the relative value fixed income and commodity-based return factors, which seek to balance out long and short positions so that there is no aggregate exposure to the asset(s), detracted from absolute performance during the reporting period. The Fund’s directional fixed income-based, commodity-based and equity-based factors within the Macro/Managed Futures sub-strategy, which seek to benefit from positive or negative exposure to an asset through the use of futures contracts, also detracted from absolute performance. The Fund’s exposure to event driven factors, which seek to benefit by exploiting pricing inefficiencies associated with corporate changes through the use of both long equity investments and derivative instruments, was a leading contributor to absolute performance.
HOW WAS THE FUND POSITIONED?
At the end of the reporting period, the Fund’s largest allocation was to the Macro/Managed Futures sub-strategy, while the smallest allocation was to the Event Driven sub-strategy.
| | | | | | | | |
| | | |
| OCTOBER 31, 2018 | | J.P. MORGAN EXCHANGE-TRADED FUNDS | | | | | 3 | |
JPMorgan Diversified Alternatives ETF
FUND COMMENTARY
Twelve Months Ended October 31, 2018 (Unaudited) (continued)
| | | | |
RISK ALLOCATION AS OF OCTOBER 31, 2018 | |
| Strategy | | % of Risk
Allocation**** | |
| Equity Long/Short (1) | | | 34 | % |
| Event Driven (2) | | | 24 | |
| Macro/Managed Futures (3) | | | 42 | |
| | | | | | | | |
| TOP TEN LONG HOLDINGS OF THE PORTFOLIO (a) | |
| | 1. | | | Vectren Corp. | | | 1.7 | % |
| | 2. | | | Dun & Bradstreet Corp. (The) | | | 1.7 | |
| | 3. | | | USG Corp. | | | 1.7 | |
| | 4. | | | Twenty-First Century Fox, Inc., Class A | | | 1.6 | |
| | 5. | | | Express Scripts Holding Co. | | | 1.6 | |
| | 6. | | | Energen Corp. | | | 1.6 | |
| | 7. | | | Aspen Insurance Holdings Ltd. | | | 1.6 | |
| | 8. | | | Rockwell Collins, Inc. | | | 1.5 | |
| | 9. | | | Esterline Technologies Corp. | | | 1.5 | |
| | 10. | | | LifePoint Health, Inc. | | | 1.5 | |
| | | | | | | | |
| TOP TEN SHORT HOLDINGS OF THE PORTFOLIO (a) | |
| | 1. | | | Diamondback Energy, Inc. | | | 1.6 | % |
| | 2. | | | Sirius XM Holdings, Inc. | | | 1.2 | |
| | 3. | | | Enbridge, Inc. | | | 1.1 | |
| | 4. | | | Dominion Energy, Inc. | | | 1.0 | |
| | 5. | | | Cigna Corp. | | | 1.0 | |
| | 6. | | | Twilio, Inc., Class A | | | 1.0 | |
| | 7. | | | Amcor Ltd. | | | 0.7 | |
| | 8. | | | Fifth Third Bancorp | | | 0.7 | |
| | 9. | | | Nippon Steel & Sumitomo Metal Corp. | | | 0.5 | |
| | 10. | | | CVS Health Corp. | | | 0.4 | |
| * | | The return shown is based on net asset value calculated for shareholder transactions and may differ from the return shown in the financial highlights, which reflects adjustments made to the net asset value in accordance with accounting principles generally accepted in the United States of America. The net asset value was $24.29 as of October 31, 2018. |
| ** | | Market price return is calculated assuming an initial investment made at the market price at the beginning of the period, reinvestment of all dividends and distributions at market price during the period, and sale at the market price on the last day of the period. The price used to calculate the market price return is the midpoint of the bid/ask spread at the close of business on the NYSE Arca. The midpoint price was $24.33 as of October 31, 2018. |
| *** | | The adviser seeks to achieve the Fund’s objective. There can be no guarantee it will be achieved. |
| **** | | Risk allocations are calculated as the standard deviation (volatility of an asset class) divided by the overall volatility of the Fund. Risk, as measured by standard deviation, shows how widely a set of values varies from the mean. It is a historical measure of the volatility of returns earned by the Fund. The percentages above represent the current risk allocation based on the Fund’s holdings as of October 31, 2018 and are not representative of the targeted equal risk allocation across asset classes over the long term. Holdings and allocations may vary over time. |
| (1) | | Equity Long/Short strategies involve simultaneously investing in equities (i.e., investing long) that the adviser believes are attractive based on relevant return factors and selling equities (selling short) that the advisor believes are unattractive based on the relevant return factors. |
| (2) | | Event Driven strategies seek to profit from investing in securities of companies that the Fund’s adviser believes will be impacted by pending or anticipated corporate or special situation events. Within the strategy, the adviser looks for specific events or catalysts that will affect future pricing of a security. For example, merger arbitrage strategies seek to capitalize on price discrepancies and returns generated by a corporate transaction. |
| (3) | | Macro/Managed Futures strategies aim to exploit macro-economic imbalances across the globe. The macro based strategies may be implemented through a broad range of asset classes including, but not limited to, equities, fixed income, currency and commodities. |
| (a) | | Percentages indicated are based upon total investments plus the current value of the total net long and short positions within each Total Return Basket Swap as of October 31, 2018. The Fund’s portfolio composition is subject to change. |
| | | | | | |
| | | |
| 4 | | | | J.P. MORGAN EXCHANGE-TRADED FUNDS | | OCTOBER 31, 2018 |
| | | | | | | | | | | | |
AVERAGE ANNUAL TOTAL RETURNS AS OF OCTOBER 31, 2018 (Unaudited) | |
| | | INCEPTION DATE | | | 1 YEAR | | | SINCE
INCEPTION | |
| JPMorgan Diversified Alternatives ETF | | | | | | | | | | | | |
| Net Asset Value | | | September 12, 2016 | | | | (6.72 | )% | | | (0.95 | )% |
| Market Price | | | | | | | (6.75 | )% | | | (0.87 | )% |
LIFE OF FUND PERFORMANCE (09/12/16 TO 10/31/18)
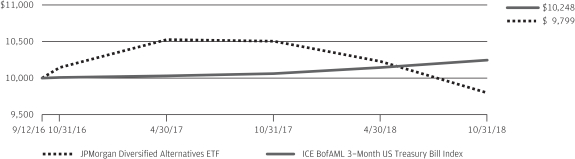
The performance quoted is past performance and is not a guarantee of future results. Exchange-traded funds are subject to certain market risks. Investment returns and principal value of an investment will fluctuate so that an investor’s shares, when sold or redeemed, may be worth more or less than their original cost. Current performance may be higher or lower than the performance data shown. For up-to-date, month-end performance information please call 1-844-457-6383.
Fund commenced operations on September 12, 2016.
The graph illustrates comparative performance for $10,000 invested in shares of the JPMorgan Diversified Alternatives ETF and the ICE BofAML 3-Month US Treasury Bill Index from September 12, 2016 to October 31, 2018. The performance of the Fund assumes reinvestment of all dividends and capital gain distributions, if any. The performance of the ICE BofAML 3-Month US Treasury Bill Index does not reflect the deduction of expenses and has been adjusted to reflect reinvestment of all dividends and capital gain distributions of the securities included in the benchmark, if applicable. The ICE BofAML 3-Month US Treasury Bill Index is comprised of a single issue purchased at the beginning of
the month and held for a full month. Each month the index is rebalanced and the issue selected is the outstanding Treasury Bill that matures closest to, but not beyond, 3 months from the rebalancing date. Investors cannot invest directly in an index. The Fund is not an index fund. The Fund is actively managed and does not seek to replicate the performance of a specified index.
The performance of the Fund reflects the deduction of Fund expenses and assumes reinvestment of all dividends and capital gain distributions, if any. Fund performance reflects the waiver of the Fund’s fees and reimbursement of expenses since the inception date. Without these waivers and reimbursements, performance would have been lower. Also, performance shown in this section does not reflect the deduction of taxes that a shareholder may pay on Fund distributions or redemption or sale of Fund shares.
The returns shown are based on net asset values calculated for shareholder transactions and may differ from the returns shown in the financial highlights, which reflect adjustments made to the net asset values in accordance with accounting principles generally accepted in the United States of America.
| | | | | | | | |
| | | |
| OCTOBER 31, 2018 | | J.P. MORGAN EXCHANGE-TRADED FUNDS | | | | | 5 | |
JPMorgan Event Driven ETF
FUND COMMENTARY
Period November 29, 2017 (Fund Inception Date) Through October 31, 2018 (Unaudited)
| | | | |
| REPORTING PERIOD RETURN: | | | |
| JPMorgan Event Driven ETF | | | | |
| Net Asset Value* | | | 0.18% | |
| Market Price** | | | 0.62% | |
| ICE BofAML 3-Month US Treasury Bill Index | | | 1.60% | |
| |
| Net Assets as of 10/31/2018 | | $ | 26,284,405 | |
INVESTMENT OBJECTIVE***
The JPMorgan Event Driven ETF (the “Fund”) seeks to provide long-term total return.
INVESTMENT APPROACH
The Fund employs a rules-based, bottom-up approach to building a diversified portfolio that seeks to capture returns by primarily investing in companies that the Fund’s adviser believes will be positively impacted by corporate or special situation events. The Fund seeks to profit by exploiting pricing inefficiencies associated with corporate change, through long and short equity positions across developed markets, achieved through the use of equities and derivative instruments.
HOW DID THE FUND PERFORM?
For the period from inception on November 29, 2017 to October 31, 2018, the Fund posted a positive absolute performance and underperformed the ICE BofAML 3-Month US Treasury Bill Index (the “Index”).
Relative to the Index, the Fund’s allocation to alternative investment strategies, which are not held in the Index, detracted from performance. References to the Index are for informational purposes and are not an indication of how the Fund is managed. The use of the Index does not imply the Fund
is being managed like the Index and does not imply low risk or low volatility, but rather is disclosed to allow for comparison of the Fund’s performance to that of a well-known and widely recognized index.
In absolute terms, the Fund’s exposure to the spinoffs factor, which seeks to benefit from a change in market valuation associated with corporate subsidiary spinoffs, detracted from absolute performance. The Fund’s exposures to merger arbitrage and share buybacks were leading contributors to performance. Merger arbitrage involves exploiting differences between the share price of target companies in mergers, relative to the share price announced in the merger agreement. The share buybacks factor seeks to benefit from the relative outperformance by companies that have bought back a significant proportion of their shares outstanding.
HOW WAS THE FUND POSITIONED?
At the end of the reporting period, the Fund’s largest allocation in notional exposure terms was to the merger arbitrage factor. From a sector perspective, the Fund’s largest positions were in the consumer discretionary and health care sectors and its smallest positions were in the real estate and consumer staples sectors.
| | | | | | |
| | | |
| 6 | | | | J.P. MORGAN EXCHANGE-TRADED FUNDS | | OCTOBER 31, 2018 |
| | | | | | | | |
| TOP TEN LONG HOLDINGS OF THE PORTFOLIO (a) | |
| | 1. | | | U.S. Treasury Bills, 2.29%, 2/28/2019 | | | 4.0 | % |
| | 2. | | | U.S. Treasury Bills, 2.45%, 6/20/2019 | | | 4.0 | |
| | 3. | | | U.S. Treasury Bills, 2.52%, 7/18/2019 | | | 4.0 | |
| | 4. | | | U.S. Treasury Bills, 2.40%, 4/25/2019 | | | 4.0 | |
| | 5. | | | Sky plc | | | 1.8 | |
| | 6. | | | Express Scripts Holding Co. | | | 1.3 | |
| | 7. | | | Aspen Insurance Holdings Ltd. | | | 1.2 | |
| | 8. | | | Aetna, Inc. | | | 1.2 | |
| | 9. | | | Dun & Bradstreet Corp. (The) | | | 1.2 | |
| | 10. | | | NxStage Medical, Inc. | | | 1.2 | |
| | | | | | | | |
| TOP TEN SHORT HOLDINGS OF THE PORTFOLIO (a) | |
| | 1. | | | Diamondback Energy, Inc. | | | 1.1 | % |
| | 2. | | | Dominion Energy, Inc. | | | 1.1 | |
| | 3. | | | Sirius XM Holdings, Inc. | | | 0.9 | |
| | 4. | | | Enbridge, Inc. | | | 0.8 | |
| | 5. | | | Twilio, Inc., Class A | | | 0.8 | |
| | 6. | | | Cigna Corp. | | | 0.7 | |
| | 7. | | | Amcor Ltd. | | | 0.6 | |
| | 8. | | | Fifth Third Bancorp | | | 0.5 | |
| | 9. | | | Nippon Steel & Sumitomo Metal Corp. | | | 0.3 | |
| | 10. | | | Husky Energy, Inc. | | | 0.3 | |
| * | | The return shown is based on net asset value calculated for shareholder transactions and may differ from the return shown in the financial highlights, which reflects adjustments made to the net asset value in accordance with accounting principles generally accepted in the United States of America. The net asset value was $25.03 as of October 31, 2018. |
| ** | | Market price return is calculated assuming an initial investment made at the inception date net asset value, reinvestment of all dividends and distributions at market price during the period, and sale at the market price on the last day of the period. The price used to calculate the market price return is the midpoint of the bid/ask spread at the close of business on the NYSE Arca. The midpoint price was $25.14 as of October 31, 2018. |
| *** | | The adviser seeks to achieve the Fund’s objective. There can be no guarantee it will be achieved. |
| (a) | | Percentages indicated are based upon total investments plus the current value of the total net long and short positions within each Total Return Basket Swap as of October 31, 2018. The Fund’s portfolio composition is subject to change. |
| | | | | | | | |
| | | |
| OCTOBER 31, 2018 | | J.P. MORGAN EXCHANGE-TRADED FUNDS | | | | | 7 | |
JPMorgan Event Driven ETF
FUND COMMENTARY
Period November 29, 2017 (Fund Inception Date) Through October 31, 2018 (Unaudited) (continued)
| | | | | | | | |
TOTAL RETURNS AS OF OCTOBER 31, 2018 (Unaudited) | |
| | | INCEPTION DATE | | | CUMULATIVE SINCE
INCEPTION | |
| JPMorgan Event Driven ETF | | | | | | | | |
| Net Asset Value | | | November 29, 2017 | | | | 0.18% | |
| Market Price | | | | | | | 0.62% | |
LIFE OF FUND PERFORMANCE (11/29/17 TO 10/31/18)
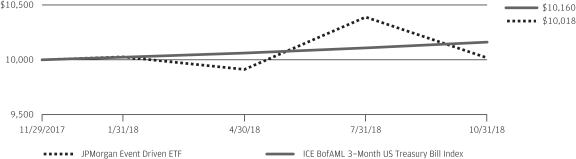
The performance quoted is past performance and is not a guarantee of future results. Exchange-traded funds are subject to certain market risks. Investment returns and principal value of an investment will fluctuate so that an investor’s shares, when sold or redeemed, may be worth more or less than their original cost. Current performance may be higher or lower than the performance data shown. For up-to-date, month-end performance information please call 1-844-457-6383.
Fund commenced operations on November 29, 2017.
The graph illustrates comparative performance for $10,000 invested in shares of the JPMorgan Event Driven ETF and the ICE BofAML 3-Month US Treasury Bill Index from November 29, 2017 to October 31, 2018. The performance of the Fund assumes reinvestment of all dividends and capital gain distributions, if any. The performance of the ICE BofAML 3-Month US Treasury Bill Index does not reflect the deduction of expenses and has been adjusted to reflect reinvestment of all dividends and capital gain distributions of the securities included in the benchmark, if applicable. The ICE BofAML 3-Month US Treasury Bill Index is comprised of a single issue purchased at the beginning of the
month and held for a full month. Each month the index is rebalanced and the issue selected is the outstanding Treasury Bill that matures closest to, but not beyond, 3 months from the rebalancing date. Investors cannot invest directly in an index. The Fund is not an index fund. The Fund is actively managed and does not seek to replicate the performance of a specified index.
The performance of the Fund reflects the deduction of Fund expenses and assumes reinvestment of all dividends and capital gain distributions, if any. Fund performance reflects the waiver of the Fund’s fees and reimbursement of expenses since the inception date. Without these waivers and reimbursements, performance would have been lower. Also, performance shown in this section does not reflect the deduction of taxes that a shareholder may pay on Fund distributions or redemption or sale of Fund shares.
The returns shown are based on net asset values calculated for shareholder transactions and may differ from the returns shown in the financial highlights, which reflect adjustments made to the net asset values in accordance with accounting principles generally accepted in the United States of America.
| | | | | | |
| | | |
| 8 | | | | J.P. MORGAN EXCHANGE-TRADED FUNDS | | OCTOBER 31, 2018 |
JPMorgan Long/Short ETF
FUND COMMENTARY
Period January 23, 2018 (Fund Inception Date) Through October 31, 2018 (Unaudited)
| | | | |
| REPORTING PERIOD RETURN: | | | |
| JPMorgan Long/Short ETF | | | | |
| Net Asset Value* | | | (10.64)% | |
| Market Price** | | | (10.00)% | |
| ICE BofAML 3-Month US Treasury Bill Index | | | 1.39% | |
| |
| Net Assets as of 10/31/2018 | | $ | 23,456,272 | |
INVESTMENT OBJECTIVE***
The JPMorgan Long/Short ETF (the “Fund”) seeks to provide long-term total return.
INVESTMENT APPROACH
The Fund seeks to achieve its investment objective by taking advantage of pricing inefficiencies between equity securities by maintaining long and short exposures to equity factors such as value, quality, momentum and size. The Fund utilizes an equity long/short strategy, which involves simultaneously investing in equities (investing long) that the portfolio managers believe are attractive and selling equities (selling short) that they believe are unattractive. The Fund’s managers seek to obtain a significant portion of the Fund’s exposure through the use of derivatives, in addition to its exposure through direct investments.
HOW DID THE FUND PERFORM?
For the period from inception on January 23, 2018 to October 31, 2018, the Fund posted a negative absolute performance and underperformed its broad-based market benchmark, the ICE BofAML 3-Month US Treasury Bill Index (the “Index”).
Relative to the Index, the Fund’s allocation to alternative investment strategies, which are not employed by the Index, detracted from performance. References to the Index are for informational purposes and are not an indication of how the
Fund is managed. The use of the Index does not imply the Fund is being managed like the Index and does not imply low risk or low volatility, but rather is disclosed to allow for comparison of the Fund’s performance to that of a well-known and widely recognized index.
In terms of absolute performance, the Fund’s allocations to the value, momentum and size factors, which were implemented primarily through the use of equity securities and total return swaps contracts, were leading detractors from performance. From a return perspective, the value factor was the worst performing factor over the period and continued a decline that began at the start of 2017, before the Fund’s inception date.
The Fund’s allocation to the time-series momentum factor, which relies on a security’s recent past performance as an indicator of near future performance and which was implemented through the use of futures contracts, also detracted from absolute performance during the reporting period.
The Fund’s quality factor, which seeks to hold higher quality equity securities and sell lower quality securities, was a positive contributor to absolute performance.
HOW WAS THE FUND POSITIONED?
At the end of the reporting period, the Fund’s exposures were balanced across equity value, momentum and quality factors. In addition, the Fund had a slightly long overall exposure to developed market equities on an aggregate basis.
| | | | | | | | |
| | | |
| OCTOBER 31, 2018 | | J.P. MORGAN EXCHANGE-TRADED FUNDS | | | | | 9 | |
JPMorgan Long/Short ETF
FUND COMMENTARY
Period January 23, 2018 (Fund Inception Date) Through October 31, 2018 (Unaudited) (continued)
| | | | | | | | |
| TOP TEN LONG HOLDINGS OF THE PORTFOLIO (a) | |
| | 1. | | | U.S. Treasury Bills, 2.38%, 7/18/2019 | | | 8.9 | % |
| | 2. | | | Japan Government Bond, 0.10%, 07/15/2019 | | | 2.0 | |
| | 3. | | | Suzuken Co. Ltd. | | | 0.8 | |
| | 4. | | | Mellanox Technologies Ltd. | | | 0.8 | |
| | 5. | | | Valmet OYJ | | | 0.8 | |
| | 6. | | | Popular, Inc. | | | 0.8 | |
| | 7. | | | Merck KGaA | | | 0.8 | |
| | 8. | | | Computershare Ltd. | | | 0.8 | |
| | 9. | | | ITOCHU Corp. | | | 0.8 | |
| | 10. | | | Neste OYJ | | | 0.8 | |
| | | | | | | | |
| TOP TEN SHORT HOLDINGS OF THE PORTFOLIO (a) | |
| | 1. | | | Cray, Inc. | | | 0.7 | % |
| | 2. | | | Cboe Global Markets, Inc. | | | 0.7 | |
| | 3. | | | Instructure, Inc. | | | 0.7 | |
| | 4. | | | Vulcan Materials Co. | | | 0.7 | |
| | 5. | | | Rohm Co. Ltd. | | | 0.7 | |
| | 6. | | | Suez | | | 0.7 | |
| | 7. | | | BT Group plc | | | 0.7 | |
| | 8. | | | Seven Bank Ltd. | | | 0.7 | |
| | 9. | | | Keane Group, Inc. | | | 0.7 | |
| | 10. | | | California Water Service Group | | | 0.7 | |
| * | | The return shown is based on net asset value calculated for shareholder transactions and may differ from the return shown in the financial highlights, which reflects adjustments made to the net asset value in accordance with accounting principles generally accepted in the United States of America. The net asset value was $22.34 as of October 31, 2018. |
| ** | | Market price return is calculated assuming an initial investment made at the inception date net asset value, reinvestment of all dividends and distributions at market price during the period, and sale at the market price on the last day of the period. The price used to calculate the market price return is the midpoint of the bid/ask spread at the close of business on the NYSE Arca. The midpoint price was $22.50 as of October 31, 2018. |
| *** | | The adviser seeks to achieve the Fund’s objective. There can be no guarantee it will be achieved. |
| (a) | | Percentages indicated are based upon total investments plus the current value of the total net long and short positions within each Total Return Basket Swap as of October 31, 2018. The Fund’s portfolio composition is subject to change. |
| | | | | | |
| | | |
| 10 | | | | J.P. MORGAN EXCHANGE-TRADED FUNDS | | OCTOBER 31, 2018 |
| | | | | | | | |
TOTAL RETURNS AS OF OCTOBER 31, 2018 (Unaudited) | |
| | | INCEPTION DATE | | | CUMULATIVE SINCE
INCEPTION | |
| JPMorgan Long/Short ETF | | | | | | | | |
| Net Asset Value | | | January 23, 2018 | | | | (10.64 | )% |
| Market Price | | | | | | | (10.00 | )% |
LIFE OF FUND PERFORMANCE (1/23/18 TO 10/31/18)
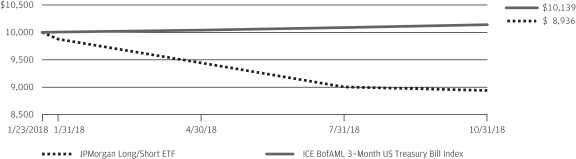
The performance quoted is past performance and is not a guarantee of future results. Exchange-traded funds are subject to certain market risks. Investment returns and principal value of an investment will fluctuate so that an investor’s shares, when sold or redeemed, may be worth more or less than their original cost. Current performance may be higher or lower than the performance data shown. For up-to-date, month-end performance information please call 1-844-457-6383.
Fund commenced operations on January 23, 2018.
The graph illustrates comparative performance for $10,000 invested in shares of the JPMorgan Long/Short ETF and the ICE BofAML 3-Month US Treasury Bill Index from January 23, 2018 to October 31, 2018. The performance of the Fund assumes reinvestment of all dividends and capital gain distributions, if any. The performance of the ICE BofAML 3-Month US Treasury Bill Index does not reflect the deduction of expenses and has been adjusted to reflect reinvestment of all dividends and capital gain distributions of the securities included in the benchmark, if applicable. The ICE BofAML 3-Month US Treasury Bill Index is comprised of a single issue purchased at the beginning of the month and held for a
full month. Each month the index is rebalanced and the issue selected is the outstanding Treasury Bill that matures closest to, but not beyond, 3 months from the rebalancing date. Investors cannot invest directly in an index. The Fund is not an index fund. The Fund is actively managed and does not seek to replicate the performance of a specified index.
The performance of the Fund reflects the deduction of Fund expenses and assumes reinvestment of all dividends and capital gain distributions, if any. Fund performance reflects the waiver of the Fund’s fees and reimbursement of expenses since the inception date. Without these waivers and reimbursements, performance would have been lower. Also, performance shown in this section does not reflect the deduction of taxes that a shareholder may pay on Fund distributions or redemption or sale of Fund shares.
The returns shown are based on net asset values calculated for shareholder transactions and may differ from the returns shown in the financial highlights, which reflect adjustments made to the net asset values in accordance with accounting principles generally accepted in the United States of America.
| | | | | | | | |
| | | |
| OCTOBER 31, 2018 | | J.P. MORGAN EXCHANGE-TRADED FUNDS | | | | | 11 | |
JPMorgan Managed Futures Strategy ETF
FUND COMMENTARY
Period December 5, 2017 (Fund Inception Date) Through October 31, 2018 (Unaudited)
| | | | |
| REPORTING PERIOD RETURN: | |
| JPMorgan Managed Futures Strategy ETF | | | | |
| Net Asset Value* | | | (5.45)% | |
| Market Price** | | | (5.09)% | |
| ICE BofAML 3-Month US Treasury Bill Index | | | 1.58% | |
| |
| Net Assets as of 10/31/2018 | | $ | 50,797,949 | |
INVESTMENT OBJECTIVE***
The JPMorgan Managed Futures Strategy ETF (the “Fund”) seeks to provide long-term total return.
INVESTMENT APPROACH
The Fund seeks to achieve its investment objective by investing globally to take advantage of opportunities across a broad range of asset classes, including equities, fixed income, currency and commodities based on the portfolio managers’ assessment of their relative attractiveness. The Fund’s portfolio managers seek to identify a set of investment return sources with distinct risk and return profiles that have a low correlation to one another and to traditional markets (each a “return factor”).
The Fund uses derivatives, including swaps, futures, options and forward contracts, in implementing its strategies, and under normal market conditions, the Fund’s managers seek to obtain a significant portion of the Fund’s exposure through the use of derivatives, in addition to its exposure through direct investments. Derivatives, which are instruments that have a value based on another instrument, exchange rate or index, are primarily used as an efficient means of implementing a particular strategy in order to gain exposure to a desired return factor.
HOW DID THE FUND PERFORM?
For the period from inception on December 5, 2017 to October 31, 2018, the Fund posted a negative absolute performance and underperformed its broad-based market benchmark, the ICE BofAML 3-Month US Treasury Bill Index (the “Index”).
The Fund’s allocation to alternative investment strategies, which are not held in the Index, detracted from performance relative to the Index. References to the Index are for informational purposes and are not an indication of how the Fund is managed. The use of the Index does not imply the Fund is
being managed like the Index and does not imply low risk or low volatility, but rather is disclosed to allow for comparison of the Fund’s performance to that of a well-known and widely recognized index.
On an absolute basis, leading detractors from Fund performance included the Fund’s allocations to relative value fixed income and commodity-based return factors, which seek to balance out long and short positions so that there is no aggregate exposure to the asset(s). The Fund’s directional fixed income-based, commodity-based and equity-based return factors, which seek to benefit from positive or negative exposure to an asset primarily through the use of futures contracts, were also leading detractors from performance. The Fund’s allocations to currency factors, implemented through currency forward contracts, was a leading contributor to absolute performance.
HOW WAS THE FUND POSITIONED?
At the end of the reporting period, the Fund’s largest allocations were to relative value commodity-based and directional fixed income-based, commodity-based and equity-based return factors.
| * | | The return shown is based on net asset value calculated for shareholder transactions and may differ from the return shown in the financial highlights, which reflects adjustments made to the net asset value in accordance with accounting principles generally accepted in the United States of America. The net asset value was $23.63 as of October 31, 2018. |
| ** | | Market price return is calculated assuming an initial investment made at the inception date net asset value, reinvestment of all dividends and distributions at market price during the period, and sale at the market price on the last day of the period. The price used to calculate the market price return is the midpoint of the bid/ask spread at the close of business on the NYSE Arca. The midpoint price was $23.72 as of October 31, 2018. |
| *** | | The adviser seeks to achieve the Fund’s objective. There can be no guarantee it will be achieved. |
| | | | | | |
| | | |
| 12 | | | | J.P. MORGAN EXCHANGE-TRADED FUNDS | | OCTOBER 31, 2018 |
| | | | | | | | |
TOTAL RETURNS AS OF OCTOBER 31, 2018 (Unaudited) | |
| | | INCEPTION DATE | | | CUMULATIVE SINCE
INCEPTION | |
| JPMorgan Managed Futures Strategy ETF | | | | | | | | |
| Net Asset Value | | | December 5, 2017 | | | | (5.45 | )% |
| Market Price | | | | | | | (5.09 | )% |
LIFE OF FUND PERFORMANCE (12/5/17 TO 10/31/18)
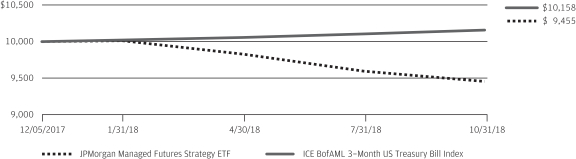
The performance quoted is past performance and is not a guarantee of future results. Exchange-traded funds are subject to certain market risks. Investment returns and principal value of an investment will fluctuate so that an investor’s shares, when sold or redeemed, may be worth more or less than their original cost. Current performance may be higher or lower than the performance data shown. For up-to-date, month-end performance information please call 1-844-457-6383.
Fund commenced operations on December 5, 2017.
The graph illustrates comparative performance for $10,000 invested in shares of the JPMorgan Managed Futures Strategy ETF and the ICE BofAML 3-Month US Treasury Bill Index from December 5, 2017 to October 31, 2018. The performance of the Fund assumes reinvestment of all dividends and capital gain distributions, if any. The performance of the ICE BofAML 3-Month US Treasury Bill Index does not reflect the deduction of expenses and has been adjusted to reflect reinvestment of all dividends and capital gain distributions of the securities included in the benchmark, if applicable. The ICE BofAML 3-Month US Treasury Bill Index is comprised of a single issue purchased at the beginning
of the month and held for a full month. Each month the index is rebalanced and the issue selected is the outstanding Treasury Bill that matures closest to, but not beyond, 3 months from the rebalancing date. Investors cannot invest directly in an index. The Fund is not an index fund. The Fund is actively managed and does not seek to replicate the performance of a specified index.
The performance of the Fund reflects the deduction of Fund expenses and assumes reinvestment of all dividends and capital gain distributions, if any. Fund performance reflects the waiver of the Fund’s fees and reimbursement of expenses since the inception date. Without these waivers and reimbursements, performance would have been lower. Also, performance shown in this section does not reflect the deduction of taxes that a shareholder may pay on Fund distributions or redemption or sale of Fund shares.
The returns shown are based on net asset values calculated for shareholder transactions and may differ from the returns shown in the financial highlights, which reflect adjustments made to the net asset values in accordance with accounting principles generally accepted in the United States of America.
| | | | | | | | |
| | | |
| OCTOBER 31, 2018 | | J.P. MORGAN EXCHANGE-TRADED FUNDS | | | | | 13 | |
JPMorgan Diversified Alternatives ETF
CONSOLIDATED SCHEDULE OF PORTFOLIO INVESTMENTS
AS OF OCTOBER 31, 2018
| | | | | | | | |
| INVESTMENTS | | SHARES | | | VALUE($) | |
Common Stocks — 58.1% | |
Aerospace & Defense — 3.4% | |
Boeing Co. (The) | | | 838 | | | | 297,373 | |
Esterline Technologies Corp.* | | | 25,957 | | | | 3,046,313 | |
Rockwell Collins, Inc. | | | 24,096 | | | | 3,084,770 | |
Spirit AeroSystems Holdings, Inc., Class A | | | 5,000 | | | | 420,050 | |
| | | | | | | | |
| | | | | | | 6,848,506 | |
| | | | | | | | |
Auto Components — 0.3% | |
Cooper-Standard Holdings, Inc.* | | | 2,383 | | | | 220,785 | |
Gentex Corp. | | | 11,001 | | | | 231,571 | |
Lear Corp. | | | 1,765 | | | | 234,568 | |
| | | | | | | | |
| | | | | | | 686,924 | |
| | | | | | | | |
Banks — 1.0% | |
BankUnited, Inc. | | | 8,780 | | | | 290,618 | |
CIT Group, Inc. | | | 9,200 | | | | 435,896 | |
Customers Bancorp, Inc.* | | | 8,600 | | | | 176,214 | |
Enterprise Financial Services Corp. | | | 6,584 | | | | 286,075 | |
First Interstate BancSystem, Inc., Class A | | | 6,867 | | | | 284,706 | |
Popular, Inc. (Puerto Rico) | | | 5,420 | | | | 281,894 | |
Synovus Financial Corp. | | | 7,732 | | | | 290,414 | |
| | | | | | | | |
| | | | | | | 2,045,817 | |
| | | | | | | | |
Building Products — 1.8% | |
Continental Building Products, Inc.* | | | 10,358 | | | | 288,056 | |
USG Corp. | | | 79,003 | | | | 3,335,507 | |
| | | | | | | | |
| | | | | | | 3,623,563 | |
| | | | | | | | |
Capital Markets — 0.5% | |
Jefferies Financial Services, Inc. | | | 18,400 | | | | 395,048 | |
Virtus Investment Partners, Inc. | | | 2,903 | | | | 288,384 | |
Waddell & Reed Financial, Inc., Class A | | | 14,487 | | | | 276,267 | |
| | | | | | | | |
| | | | | | | 959,699 | |
| | | | | | | | |
Chemicals — 1.2% | |
CF Industries Holdings, Inc. | | | 6,192 | | | | 297,402 | |
Eastman Chemical Co. | | | 3,624 | | | | 283,940 | |
Huntsman Corp. | | | 13,340 | | | | 291,879 | |
Kraton Corp.* | | | 10,302 | | | | 283,717 | |
LyondellBasell Industries NV, Class A | | | 3,225 | | | | 287,896 | |
Platform Specialty Products Corp.* | | | 62,800 | | | | 679,496 | |
Westlake Chemical Corp. | | | 4,049 | | | | 288,694 | |
| | | | | | | | |
| | | | | | | 2,413,024 | |
| | | | | | | | |
Commercial Services & Supplies — 1.1% | |
Brady Corp., Class A | | | 7,018 | | | | 282,755 | |
Deluxe Corp. | | | 5,687 | | | | 268,483 | |
Essendant, Inc. | | | 36,159 | | | | 460,666 | |
Interface, Inc. | | | 17,474 | | | | 284,652 | |
KAR Auction Services, Inc. | | | 4,976 | | | | 283,333 | |
Knoll, Inc. | | | 14,356 | | | | 284,967 | |
Quad/Graphics, Inc. | | | 10,905 | | | | 168,264 | |
Steelcase, Inc., Class A | | | 17,212 | | | | 285,719 | |
| | | | | | | | |
| | | | | | | 2,318,839 | |
| | | | | | | | |
| | | | | | | | |
| INVESTMENTS | | SHARES | | | VALUE($) | |
| | | | | | | | |
Communications Equipment — 0.9% | |
Cisco Systems, Inc. | | | 6,424 | | | | 293,898 | |
Juniper Networks, Inc. | | | 9,675 | | | | 283,187 | |
Mitel Networks Corp.* | | | 78,231 | | | | 858,977 | |
Motorola Solutions, Inc. | | | 2,402 | | | | 294,389 | |
| | | | | | | | |
| | | | | | | 1,730,451 | |
| | | | | | | | |
Construction & Engineering — 0.3% | |
EMCOR Group, Inc. | | | 3,835 | | | | 272,208 | |
Jacobs Engineering Group, Inc. | | | 3,863 | | | | 290,073 | |
| | | | | | | | |
| | | | | | | 562,281 | |
| | | | | | | | |
Consumer Finance — 0.3% | |
Ally Financial, Inc. | | | 11,429 | | | | 290,411 | |
Santander Consumer USA Holdings, Inc. | | | 16,072 | | | | 301,350 | |
| | | | | | | | |
| | | | | | | 591,761 | |
| | | | | | | | |
Containers & Packaging — 0.4% | |
Greif, Inc., Class A | | | 6,091 | | | | 288,104 | |
Sealed Air Corp. | | | 13,200 | | | | 427,152 | |
| | | | | | | | |
| | | | | | | 715,256 | |
| | | | | | | | |
Diversified Consumer Services — 0.1% | |
H&R Block, Inc. | | | 8,644 | | | | 229,412 | |
| | | | | | | | |
Diversified Financial Services — 0.1% | |
FGL Holdings* | | | 36,765 | | | | 290,443 | |
| | | | | | | | |
Diversified Telecommunication Services — 0.1% | |
Vonage Holdings Corp.* | | | 22,323 | | | | 296,003 | |
| | | | | | | | |
Electric Utilities — 0.4% | |
ALLETE, Inc. | | | 3,766 | | | | 278,684 | |
FirstEnergy Corp. | | | 7,693 | | | | 286,795 | |
IDACORP, Inc. | | | 2,996 | | | | 279,407 | |
| | | | | | | | |
| | | | | | | 844,886 | |
| | | | | | | | |
Electrical Equipment — 0.6% | |
Eaton Corp. plc | | | 4,071 | | | | 291,769 | |
Generac Holdings, Inc.* | | | 5,689 | | | | 288,603 | |
Regal Beloit Corp. | | | 4,079 | | | | 292,464 | |
Sensata Technologies Holding plc* | | | 5,912 | | | | 277,273 | |
| | | | | | | | |
| | | | | | | 1,150,109 | |
| | | | | | | | |
Electronic Equipment, Instruments & Components — 0.7% | |
Fabrinet (Thailand)* | | | 6,617 | | | | 286,649 | |
FLIR Systems, Inc. | | | 6,178 | | | | 286,103 | |
Littelfuse, Inc. | | | 1,694 | | | | 306,885 | |
TTM Technologies, Inc.* | | | 21,168 | | | | 247,666 | |
Vishay Intertechnology, Inc. | | | 16,108 | | | | 294,776 | |
| | | | | | | | |
| | | | | | | 1,422,079 | |
| | | | | | | | |
Energy Equipment & Services — 0.3% | |
Diamond Offshore Drilling, Inc.* | | | 20,457 | | | | 290,080 | |
National Oilwell Varco, Inc. | | | 7,714 | | | | 283,875 | |
Seadrill Ltd. (United Kingdom)* | | | 6,500 | | | | 132,340 | |
| | | | | | | | |
| | | | | | | 706,295 | |
| | | | | | | | |
SEE NOTES TO CONSOLIDATED FINANCIAL STATEMENTS.
| | | | | | |
| | | |
| 14 | | | | J.P. MORGAN EXCHANGE-TRADED FUNDS | | OCTOBER 31, 2018 |
| | | | | | | | |
| INVESTMENTS | | SHARES | | | VALUE($) | |
Common Stocks — continued | |
Entertainment — 2.1% | |
Madison Square Garden Co. (The), Class A* | | | 2,300 | | | | 636,226 | |
Twenty-First Century Fox, Inc., Class A | | | 70,997 | | | | 3,231,783 | |
Viacom, Inc., Class B | | | 9,049 | | | | 289,387 | |
| | | | | | | | |
| | | | | | | 4,157,396 | |
| | | | | | | | |
Food & Staples Retailing — 0.4% | |
Sysco Corp. | | | 3,788 | | | | 270,198 | |
Walgreens Boots Alliance, Inc. | | | 3,458 | | | | 275,845 | |
Walmart, Inc. | | | 2,753 | | | | 276,071 | |
| | | | | | | | |
| | | | | | | 822,114 | |
| | | | | | | | |
Food Products — 0.8% | |
Cal-Maine Foods, Inc. | | | 5,857 | | | | 285,060 | |
Campbell Soup Co. | | | 3,500 | | | | 130,935 | |
Flowers Foods, Inc. | | | 14,487 | | | | 279,744 | |
Ingredion, Inc. | | | 2,757 | | | | 278,953 | |
JM Smucker Co. (The) | | | 2,717 | | | | 294,306 | |
TreeHouse Foods, Inc.* | | | 6,105 | | | | 278,144 | |
| | | | | | | | |
| | | | | | | 1,547,142 | |
| | | | | | | | |
Health Care Equipment & Supplies — 2.1% | |
Baxter International, Inc. | | | 3,966 | | | | 247,915 | |
Becton Dickinson and Co. | | | 1,202 | | | | 277,061 | |
Danaher Corp. | | | 9,219 | | | | 916,369 | |
K2M Group Holdings, Inc.* | | | 30,806 | | | | 843,468 | |
NxStage Medical, Inc.* | | | 56,000 | | | | 1,589,280 | |
STERIS plc | | | 2,647 | | | | 289,343 | |
| | | | | | | | |
| | | | | | | 4,163,436 | |
| | | | | | | | |
Health Care Providers & Services — 3.4% | |
Aetna, Inc. | | | 4,368 | | | | 866,611 | |
Amedisys, Inc.* | | | 3,400 | | | | 374,000 | |
Chemed Corp. | | | 903 | | | | 274,810 | |
Encompass Health Corp. | | | 4,223 | | | | 284,208 | |
Express Scripts Holding Co.* | | | 5,164 | | | | 500,753 | |
Humana, Inc. | | | 928 | | | | 297,341 | |
LifePoint Health, Inc.* | | | 46,479 | | | | 3,014,628 | |
MEDNAX, Inc.* | | | 3,400 | | | | 140,386 | |
Premier, Inc., Class A* | | | 6,475 | | | | 291,375 | |
Quest Diagnostics, Inc. | | | 3,084 | | | | 290,235 | |
UnitedHealth Group, Inc. | | | 1,109 | | | | 289,837 | |
WellCare Health Plans, Inc.* | | | 1,015 | | | | 280,130 | |
| | | | | | | | |
| | | | | | | 6,904,314 | |
| | | | | | | | |
Health Care Technology — 0.3% | |
athenahealth, Inc.* | | | 5,274 | | | | 672,646 | |
| | | | | | | | |
Hotels, Restaurants & Leisure — 1.6% | |
Brinker International, Inc. | | | 10,900 | | | | 472,515 | |
Hyatt Hotels Corp., Class A | | | 9,862 | | | | 682,451 | |
Jack in the Box, Inc. | | | 4,900 | | | | 386,757 | |
Royal Caribbean Cruises Ltd. | | | 2,258 | | | | 236,480 | |
Sonic Corp. | | | 29,656 | | | | 1,283,512 | |
Wyndham Destinations, Inc. | | | 6,607 | | | | 237,059 | |
| | | | | | | | |
| | | | | | | 3,298,774 | |
| | | | | | | | |
| | | | | | | | |
| INVESTMENTS | | SHARES | | | VALUE($) | |
| | | | | | | | |
Household Durables — 0.4% | |
PulteGroup, Inc. | | | 9,234 | | | | 226,879 | |
Toll Brothers, Inc. | | | 6,926 | | | | 233,129 | |
Whirlpool Corp. | | | 3,500 | | | | 384,160 | |
| | | | | | | | |
| | | | | | | 844,168 | |
| | | | | | | | |
Household Products — 0.1% | |
Energizer Holdings, Inc. | | | 4,916 | | | | 288,913 | |
| | | | | | | | |
Independent Power and Renewable Electricity Producers — 0.4% | |
Clearway Energy, Inc., Class C | | | 14,612 | | | | 286,541 | |
NRG Energy, Inc. | | | 8,016 | | | | 290,099 | |
Vistra Energy Corp.* | | | 12,776 | | | | 289,121 | |
| | | | | | | | |
| | | | | | | 865,761 | |
| | | | | | | | |
Insurance — 3.4% | |
Aflac, Inc. | | | 6,857 | | | | 295,331 | |
Ambac Financial Group, Inc.* | | | 13,466 | | | | 277,130 | |
AmTrust Financial Services, Inc. | | | 118,210 | | | | 1,695,132 | |
Aspen Insurance Holdings Ltd. (Bermuda) | | | 75,344 | | | | 3,155,407 | |
Assured Guaranty Ltd. | | | 10,500 | | | | 419,790 | |
Navigators Group, Inc. (The) | | | 9,040 | | | | 625,116 | |
Old Republic International Corp. | | | 13,024 | | | | 287,179 | |
Stewart Information Services Corp. | | | 401 | | | | 16,553 | |
| | | | | | | | |
| | | | | | | 6,771,638 | |
| | | | | | | | |
Interactive Media & Services — 0.3% | |
Match Group, Inc.* | | | 5,741 | | | | 296,924 | |
XO Group, Inc.* | | | 10,711 | | | | 370,708 | |
| | | | | | | | |
| | | | | | | 667,632 | |
| | | | | | | | |
Internet & Direct Marketing Retail — 0.1% | |
Nutrisystem, Inc. | | | 3,400 | | | | 120,904 | |
| | | | | | | | |
IT Services — 1.8% | |
Accenture plc, Class A | | | 1,852 | | | | 291,912 | |
Amdocs Ltd. | | | 4,727 | | | | 299,077 | |
Broadridge Financial Solutions, Inc. | | | 2,507 | | | | 293,169 | |
Cognizant Technology Solutions Corp., Class A | | | 4,306 | | | | 297,243 | |
CSG Systems International, Inc. | | | 8,314 | | | | 291,821 | |
EVERTEC, Inc. (Puerto Rico) | | | 12,729 | | | | 331,972 | |
ManTech International Corp., Class A | | | 5,126 | | | | 293,617 | |
Mastercard, Inc., Class A | | | 1,526 | | | | 301,645 | |
MAXIMUS, Inc. | | | 4,355 | | | | 282,944 | |
Total System Services, Inc. | | | 3,223 | | | | 293,777 | |
Visa, Inc., Class A | | | 2,157 | | | | 297,343 | |
Western Union Co. (The) | | | 15,810 | | | | 285,212 | |
| | | | | | | | |
| | | | | | | 3,559,732 | |
| | | | | | | | |
Leisure Products — 0.4% | |
Amer Sports OYJ (Finland)* | | | 19,413 | | | | 721,616 | |
| | | | | | | | |
Life Sciences Tools & Services — 0.7% | |
Agilent Technologies, Inc. | | | 4,666 | | | | 302,310 | |
Cambrex Corp.* | | | 5,300 | | | | 282,437 | |
Charles River Laboratories International, Inc.* | | | 2,386 | | | | 290,663 | |
SEE NOTES TO CONSOLIDATED FINANCIAL STATEMENTS.
| | | | | | | | |
| | | |
| OCTOBER 31, 2018 | | J.P. MORGAN EXCHANGE-TRADED FUNDS | | | | | 15 | |
JPMorgan Diversified Alternatives ETF
CONSOLIDATED SCHEDULE OF PORTFOLIO INVESTMENTS
AS OF OCTOBER 31, 2018 (continued)
| | | | | | | | |
| INVESTMENTS | | SHARES | | | VALUE($) | |
Common Stocks — continued | |
Life Sciences Tools & Services — continued | |
ICON plc* | | | 2,108 | | | | 291,073 | |
Medpace Holdings, Inc.* | | | 5,985 | | | | 311,818 | |
| | | | | | | | |
| | | | | | | 1,478,301 | |
| | | | | | | | |
Machinery — 1.6% | |
Allison Transmission Holdings, Inc. | | | 16,078 | | | | 708,718 | |
Caterpillar, Inc. | | | 2,438 | | | | 295,778 | |
Crane Co. | | | 3,299 | | | | 287,145 | |
Cummins, Inc. | | | 2,131 | | | | 291,287 | |
Greenbrier Cos., Inc. (The) | | | 5,954 | | | | 282,517 | |
Hillenbrand, Inc. | | | 5,996 | | | | 287,209 | |
Ingersoll-Rand plc | | | 2,934 | | | | 281,488 | |
Terex Corp. | | | 13,200 | | | | 440,748 | |
Trinity Industries, Inc. | | | 2,200 | | | | 62,810 | |
Watts Water Technologies, Inc., Class A | | | 4,103 | | | | 287,415 | |
| | | | | | | | |
| | | | | | | 3,225,115 | |
| | | | | | | | |
Marine — 0.1% | |
DryShips, Inc. (Greece) | | | 24,000 | | | | 139,920 | |
| | | | | | | | |
Media — 1.3% | |
Fairfax Media Ltd. (Australia) | | | 2,577,228 | | | | 1,172,887 | |
Interpublic Group of Cos., Inc. (The) | | | 12,239 | | | | 283,455 | |
John Wiley & Sons, Inc., Class A | | | 5,292 | | | | 287,038 | |
Omnicom Group, Inc. | | | 3,829 | | | | 284,571 | |
Schibsted ASA, Class A (Norway) | | | 8,326 | | | | 288,163 | |
Sinclair Broadcast Group, Inc., Class A | | | 10,221 | | | | 292,730 | |
| | | | | | | | |
| | | | | | | 2,608,844 | |
| | | | | | | | |
Metals & Mining — 0.5% | |
Alcoa Corp.* | | | 8,387 | | | | 293,461 | |
Sandstorm Gold Ltd. (Canada)* | | | 18,700 | | | | 69,178 | |
Schnitzer Steel Industries, Inc., Class A | | | 10,587 | | | | 284,790 | |
Steel Dynamics, Inc. | | | 7,344 | | | | 290,822 | |
| | | | | | | | |
| | | | | | | 938,251 | |
| | | | | | | | |
Multiline Retail — 0.3% | |
Kohl’s Corp. | | | 3,048 | | | | 230,825 | |
Macy’s, Inc. | | | 6,437 | | | | 220,725 | |
Target Corp. | | | 2,681 | | | | 224,212 | |
| | | | | | | | |
| | | | | | | 675,762 | |
| | | | | | | | |
Multi-Utilities — 3.5% | |
Avista Corp. | | | 34,683 | | | | 1,783,400 | |
Innogy SE (Germany)* | | | 37,559 | | | | 1,566,367 | |
MDU Resources Group, Inc. | | | 11,334 | | | | 282,897 | |
Vectren Corp. | | | 46,740 | | | | 3,343,312 | |
| | | | | | | | |
| | | | | | | 6,975,976 | |
| | | | | | | | |
Oil, Gas & Consumable Fuels — 1.7% | |
Chevron Corp. | | | 2,584 | | | | 288,504 | |
ConocoPhillips | | | 4,210 | | | | 294,279 | |
CONSOL Energy, Inc.* | | | 7,034 | | | | 280,234 | |
Delek US Holdings, Inc. | | | 7,956 | | | | 292,144 | |
HollyFrontier Corp. | | | 4,527 | | | | 305,301 | |
Murphy Oil Corp. | | | 9,153 | | | | 291,615 | |
| | | | | | | | |
| INVESTMENTS | | SHARES | | | VALUE($) | |
| | | | | | | | |
Oil, Gas & Consumable Fuels — continued | |
Peabody Energy Corp. | | | 24,269 | | | | 860,336 | |
Phillips 66 | | | 2,716 | | | | 279,259 | |
Valero Energy Corp. | | | 3,179 | | | | 289,575 | |
WildHorse Resource Development Corp.* | | | 9,004 | | | | 190,975 | |
| | | | | | | | |
| | | | | | | 3,372,222 | |
| | | | | | | | |
Paper & Forest Products — 1.9% | |
Domtar Corp. | | | 6,275 | | | | 290,595 | |
KapStone Paper and Packaging Corp. | | | 83,369 | | | | 2,917,915 | |
Louisiana-Pacific Corp. | | | 13,452 | | | | 292,850 | |
Verso Corp., Class A* | | | 10,120 | | | | 284,473 | |
| | | | | | | | |
| | | | | | | 3,785,833 | |
| | | | | | | | |
Personal Products — 0.6% | |
Herbalife Nutrition Ltd.* | | | 12,837 | | | | 683,699 | |
Nu Skin Enterprises, Inc., Class A | | | 3,979 | | | | 279,405 | |
USANA Health Sciences, Inc.* | | | 2,394 | | | | 280,146 | |
| | | | | | | | |
| | | | | | | 1,243,250 | |
| | | | | | | | |
Pharmaceuticals — 2.8% | |
Bristol-Myers Squibb Co. | | | 5,726 | | | | 289,392 | |
Eli Lilly & Co. | | | 6,600 | | | | 715,704 | |
Endocyte, Inc.* | | | 80,736 | | | | 1,909,406 | |
Green Organic Dutchman Holdings Ltd. (The) (Canada)* | | | 108,600 | | | | 255,733 | |
Horizon Pharma plc* | | | 15,629 | | | | 284,604 | |
Jazz Pharmaceuticals plc* | | | 1,841 | | | | 292,387 | |
Johnson & Johnson | | | 2,035 | | | | 284,880 | |
Novartis AG (Registered) (Switzerland) | | | 8,563 | | | | 749,882 | |
Pfizer, Inc. | | | 6,678 | | | | 287,555 | |
STADA Arzneimittel AG (Germany) | | | 2,118 | | | | 195,838 | |
Taro Pharmaceutical Industries Ltd.* | | | 2,917 | | | | 290,271 | |
| | | | | | | | |
| | | | | | | 5,555,652 | |
| | | | | | | | |
Professional Services — 2.3% | |
Dun & Bradstreet Corp. (The) | | | 23,465 | | | | 3,338,600 | |
FTI Consulting, Inc.* | | | 4,077 | | | | 281,761 | |
ICF International, Inc. | | | 3,869 | | | | 284,913 | |
Korn/Ferry International | | | 6,511 | | | | 293,907 | |
Nielsen Holdings plc | | | 6,100 | | | | 158,478 | |
Robert Half International, Inc. | | | 4,804 | | | | 290,786 | |
| | | | | | | | |
| | | | | | | 4,648,445 | |
| | | | | | | | |
Real Estate Management & Development — 0.5% | |
Hemfosa Fastigheter AB (Sweden) | | | 13,439 | | | | 166,030 | |
NTT Urban Development Corp. (Japan) | | | 58,400 | | | | 867,924 | |
| | | | | | | | |
| | | | | | | 1,033,954 | |
| | | | | | | | |
Road & Rail — 0.6% | |
ArcBest Corp. | | | 7,998 | | | | 296,886 | |
Norfolk Southern Corp. | | | 2,500 | | | | 419,575 | |
Union Pacific Corp. | | | 2,800 | | | | 409,416 | |
| | | | | | | | |
| | | | | | | 1,125,877 | |
| | | | | | | | |
SEE NOTES TO CONSOLIDATED FINANCIAL STATEMENTS.
| | | | | | |
| | | |
| 16 | | | | J.P. MORGAN EXCHANGE-TRADED FUNDS | | OCTOBER 31, 2018 |
| | | | | | | | |
| INVESTMENTS | | SHARES | | | VALUE($) | |
Common Stocks — continued | |
Semiconductors & Semiconductor Equipment — 2.6% | |
Applied Materials, Inc. | | | 8,834 | | | | 290,462 | |
Entegris, Inc. | | | 10,719 | | | | 284,482 | |
First Solar, Inc.* | | | 7,200 | | | | 300,960 | |
Ichor Holdings Ltd.* | | | 25,000 | | | | 443,750 | |
Integrated Device Technology, Inc.* | | | 32,573 | | | | 1,524,742 | |
Intel Corp. | | | 6,038 | | | | 283,062 | |
Lam Research Corp. | | | 2,056 | | | | 291,397 | |
Maxim Integrated Products, Inc. | | | 5,495 | | | | 274,860 | |
Mellanox Technologies Ltd. (Israel)* | | | 3,476 | | | | 294,382 | |
MKS Instruments, Inc. | | | 3,966 | | | | 292,255 | |
Rudolph Technologies, Inc.* | | | 13,573 | | | | 282,183 | |
Teradyne, Inc. | | | 8,543 | | | | 294,306 | |
Texas Instruments, Inc. | | | 3,080 | | | | 285,916 | |
| | | | | | | | |
| | | | | | | 5,142,757 | |
| | | | | | | | |
Software — 1.2% | |
Avaya Holdings Corp.* | | | 6,000 | | | | 98,520 | |
Citrix Systems, Inc.* | | | 2,820 | | | | 288,965 | |
Intuit, Inc. | | | 1,412 | | | | 297,932 | |
Microsoft Corp. | | | 2,761 | | | | 294,902 | |
Oracle Corp. | | | 5,897 | | | | 288,010 | |
Progress Software Corp. | | | 9,180 | | | | 295,045 | |
Red Hat, Inc.* | | | 1,334 | | | | 228,968 | |
Synopsys, Inc.* | | | 3,262 | | | | 292,047 | |
VMware, Inc., Class A* | | | 2,066 | | | | 292,112 | |
| | | | | | | | |
| | | | | | | 2,376,501 | |
| | | | | | | | |
Specialty Retail — 2.5% | |
Abercrombie & Fitch Co., Class A | | | 11,238 | | | | 221,389 | |
American Eagle Outfitters, Inc. | | | 9,138 | | | | 210,722 | |
Best Buy Co., Inc. | | | 3,261 | | | | 228,792 | |
Caleres, Inc. | | | 6,573 | | | | 224,797 | |
Chico’s FAS, Inc. | | | 27,736 | | | | 212,735 | |
Children’s Place, Inc. (The) | | | 1,471 | | | | 219,767 | |
Dick’s Sporting Goods, Inc. | | | 17,471 | | | | 617,949 | |
DSW, Inc., Class A | | | 8,446 | | | | 224,241 | |
Express, Inc.* | | | 47,300 | | | | 416,713 | |
Foot Locker, Inc. | | | 4,726 | | | | 222,784 | |
Michaels Cos., Inc. (The)* | | | 26,400 | | | | 418,440 | |
Rent-A-Center, Inc.* | | | 56,038 | | | | 798,542 | |
Signet Jewelers Ltd. | | | 4,122 | | | | 231,038 | |
Tailored Brands, Inc. | | | 10,635 | | | | 223,441 | |
Urban Outfitters, Inc.* | | | 5,705 | | | | 225,119 | |
Williams-Sonoma, Inc. | | | 3,716 | | | | 220,656 | |
Zumiez, Inc.* | | | 9,439 | | | | 219,551 | |
| | | | | | | | |
| | | | | | | 5,136,676 | |
| | | | | | | | |
Technology Hardware, Storage & Peripherals — 0.7% | |
Apple, Inc. | | | 1,294 | | | | 283,205 | |
Hewlett Packard Enterprise Co. | | | 19,183 | | | | 292,541 | |
HP, Inc. | | | 12,100 | | | | 292,094 | |
| | | | | | | | |
| INVESTMENTS | | SHARES | | | VALUE($) | |
| | | | | | | | |
Technology Hardware, Storage & Peripherals — continued | |
NetApp, Inc. | | | 3,632 | | | | 285,076 | |
Seagate Technology plc | | | 7,372 | | | | 296,575 | |
| | | | | | | | |
| | | | | | | 1,449,491 | |
| | | | | | | | |
Textiles, Apparel & Luxury Goods — 1.2% | |
Columbia Sportswear Co. | | | 2,457 | | | | 221,818 | |
Deckers Outdoor Corp.* | | | 5,283 | | | | 671,839 | |
Movado Group, Inc. | | | 5,824 | | | | 224,282 | |
Oxford Industries, Inc. | | | 2,619 | | | | 233,039 | |
Ralph Lauren Corp. | | | 1,754 | | | | 227,336 | |
VF Corp. | | | 7,600 | | | | 629,888 | |
Wolverine World Wide, Inc. | | | 6,236 | | | | 219,320 | |
| | | | | | | | |
| | | | | | | 2,427,522 | |
| | | | | | | | |
Thrifts & Mortgage Finance — 0.1% | |
Northwest Bancshares, Inc. | | | 16,729 | | | | 270,006 | |
| | | | | | | | |
Trading Companies & Distributors — 0.3% | |
HD Supply Holdings, Inc.* | | | 7,666 | | | | 288,012 | |
WESCO International, Inc.* | | | 2,500 | | | | 125,450 | |
WW Grainger, Inc. | | | 999 | | | | 283,686 | |
| | | | | | | | |
| | | | | | | 697,148 | |
| | | | | | | | |
Total Common Stocks
(Cost $118,683,885) | | | | | | | 117,149,037 | |
| | | | | | | | |
Short-Term Investments — 35.1% | |
Investment Companies — 35.1% | |
JPMorgan U.S. Government Money Market Fund Class Institutional Shares, 2.02% (a) (b)
(Cost $70,832,553) | | | 70,832,553 | | | | 70,832,553 | |
| | | | | | | | |
Total Investments — 93.2%
(Cost $189,516,438) | | | | | | | 187,981,590 | |
Other Assets Less Liabilities — 6.8% | | | | | | | 13,646,972 | |
| | | | | | | | |
NET ASSETS — 100.0% | | | | | | | 201,628,562 | |
| | | | | | | | |
Percentages indicated are based on net assets.
Abbreviations
| | |
|
| OYJ | | — Public Limited Company |
| (a) | | — Investment in affiliate. Fund is registered under the Investment Company Act of 1940, as amended, and advised by J.P. Morgan Investment Management Inc. |
| (b) | | — The rate shown is the current yield as of October 31, 2018. |
| * | | — Non-income producing security. |
SEE NOTES TO CONSOLIDATED FINANCIAL STATEMENTS.
| | | | | | | | |
| | | |
| OCTOBER 31, 2018 | | J.P. MORGAN EXCHANGE-TRADED FUNDS | | | | | 17 | |
JPMorgan Diversified Alternatives ETF
CONSOLIDATED SCHEDULE OF PORTFOLIO INVESTMENTS
AS OF OCTOBER 31, 2018 (continued)
| | | | | | | | | | | | | | | | | | | | |
| Futures contracts outstanding as of October 31, 2018: | |
| DESCRIPTION | | NUMBER OF
CONTRACTS | | | EXPIRATION
DATE | | | TRADING
CURRENCY | | | NOTIONAL
AMOUNT($) | | | VALUE AND
UNREALIZED
APPRECIATION
(DEPRECIATION)($) | |
Long Contracts | | | | | |
CAC 40 10 Euro Index | | | 8 | | | | 11/2018 | | | | EUR | | | | 459,811 | | | | (8,520 | ) |
LME Nickel Base Metal | | | 15 | | | | 11/2018 | | | | USD | | | | 1,029,645 | | | | (84,884 | ) |
LME Zinc Base Metal | | | 38 | | | | 11/2018 | | | | USD | | | | 2,419,413 | | | | (36,523 | ) |
WTI Crude Oil | | | 46 | | | | 11/2018 | | | | USD | | | | 2,994,600 | | | | (338,922 | ) |
Australia 10 Year Bond | | | 409 | | | | 12/2018 | | | | AUD | | | | 37,482,226 | | | | (121,345 | ) |
Australia 3 Year Bond | | | 128 | | | | 12/2018 | | | | AUD | | | | 10,100,936 | | | | (4,435 | ) |
Canada 10 Year Bond | | | 10 | | | | 12/2018 | | | | CAD | | | | 1,003,760 | | | | (525 | ) |
Cotton No. 2 | | | 102 | | | | 12/2018 | | | | USD | | | | 3,919,860 | | | | (423,402 | ) |
Euro-Bobl | | | 40 | | | | 12/2018 | | | | EUR | | | | 5,955,473 | | | | (2,157 | ) |
Euro-Bund | | | 17 | | | | 12/2018 | | | | EUR | | | | 3,085,622 | | | | (450 | ) |
Euro-Buxl | | | 7 | | | | 12/2018 | | | | EUR | | | | 1,401,926 | | | | 937 | |
FTSE 100 Index | | | 2 | | | | 12/2018 | | | | GBP | | | | 181,134 | | | | (4,829 | ) |
Lean Hogs | | | 60 | | | | 12/2018 | | | | USD | | | | 1,402,800 | | | | (23,047 | ) |
Live Cattle | | | 45 | | | | 12/2018 | | | | USD | | | | 2,105,100 | | | | (3,743 | ) |
LME Aluminum Base Metal | | | 10 | | | | 12/2018 | | | | USD | | | | 489,625 | | | | (27,875 | ) |
LME Zinc Base Metal | | | 14 | | | | 12/2018 | | | | USD | | | | 880,163 | | | | (29,255 | ) |
Natural Gas | | | 37 | | | | 12/2018 | | | | USD | | | | 1,229,510 | | | | (10,233 | ) |
S&P 500 E-Mini Index | | | 19 | | | | 12/2018 | | | | USD | | | | 2,574,690 | | | | (155,519 | ) |
SPI 200 Index | | | 18 | | | | 12/2018 | | | | AUD | | | | 1,853,448 | | | | (101,092 | ) |
U.S. Treasury 10 Year Note | | | 275 | | | | 12/2018 | | | | USD | | | | 32,583,203 | | | | (472,949 | ) |
WTI Crude Oil | | | 7 | | | | 12/2018 | | | | USD | | | | 456,680 | | | | (60,119 | ) |
Feeder Cattle | | | 56 | | | | 01/2019 | | | | USD | | | | 4,203,500 | | | | (33,865 | ) |
LME Aluminum Base Metal | | | 2 | | | | 01/2019 | | | | USD | | | | 97,425 | | | | (2,812 | ) |
100 oz Gold | | | 10 | | | | 02/2019 | | | | USD | | | | 1,223,700 | | | | 27,603 | |
Copper | | | 16 | | | | 05/2019 | | | | USD | | | | 1,075,600 | | | | (42,455 | ) |
| | | | | | | | | | | | | | | | | | | | |
| | | | | | | | (1,960,416 | ) |
| | | | | | | | | | | | | | | | | | | | |
Short Contracts | | | | | |
IBEX 35 Index | | | (24 | ) | | | 11/2018 | | | | EUR | | | | (2,413,426 | ) | | | 14,217 | |
LME Zinc Base Metal | | | (29 | ) | | | 11/2018 | | | | USD | | | | (1,846,394 | ) | | | (38,138 | ) |
Natural Gas | | | (54 | ) | | | 11/2018 | | | | USD | | | | (1,773,360 | ) | | | (145,060 | ) |
100 oz Gold | | | (22 | ) | | | 12/2018 | | | | USD | | | | (2,680,260 | ) | | | 14,112 | |
Canada 10 Year Bond | | | (43 | ) | | | 12/2018 | | | | CAD | | | | (4,316,168 | ) | | | 67,260 | |
Cocoa | | | (5 | ) | | | 12/2018 | | | | USD | | | | (111,700 | ) | | | 2,525 | |
Coffee ‘C’ | | | (25 | ) | | | 12/2018 | | | | USD | | | | (1,056,563 | ) | | | 18,394 | |
Copper | | | (15 | ) | | | 12/2018 | | | | USD | | | | (995,625 | ) | | | 9,023 | |
Corn | | | (66 | ) | | | 12/2018 | | | | USD | | | | (1,198,725 | ) | | | 145,093 | |
Cotton No. 2 | | | (3 | ) | | | 12/2018 | | | | USD | | | | (115,290 | ) | | | 2,466 | |
DAX Index | | | (6 | ) | | | 12/2018 | | | | EUR | | | | (1,940,654 | ) | | | 84,292 | |
EURO STOXX 50 Index | | | (44 | ) | | | 12/2018 | | | | EUR | | | | (1,585,801 | ) | | | 16,667 | |
Euro-Bund | | | (52 | ) | | | 12/2018 | | | | EUR | | | | (9,438,372 | ) | | | 6,721 | |
Euro-Schatz | | | (126 | ) | | | 12/2018 | | | | EUR | | | | (15,981,815 | ) | | | (30,733 | ) |
FTSE/MIB Index | | | (13 | ) | | | 12/2018 | | | | EUR | | | | (1,395,767 | ) | | | 106,378 | |
SEE NOTES TO CONSOLIDATED FINANCIAL STATEMENTS.
| | | | | | |
| | | |
| 18 | | | | J.P. MORGAN EXCHANGE-TRADED FUNDS | | OCTOBER 31, 2018 |
| | | | | | | | | | | | | | | | | | | | |
| DESCRIPTION | | NUMBER OF
CONTRACTS | | | EXPIRATION
DATE | | | TRADING
CURRENCY | | | NOTIONAL
AMOUNT($) | | | VALUE AND
UNREALIZED
APPRECIATION
(DEPRECIATION)($) | |
Hang Seng Index | | | (8 | ) | | | 12/2018 | | | | HKD | | | | (1,275,412 | ) | | | 20,234 | |
Japan 10 Year Bond | | | (25 | ) | | | 12/2018 | | | | JPY | | | | (33,354,013 | ) | | | (74,599 | ) |
Lean Hogs | | | (15 | ) | | | 12/2018 | | | | USD | | | | (350,700 | ) | | | (6,044 | ) |
LME Aluminum Base Metal | | | (10 | ) | | | 12/2018 | | | | USD | | | | (489,625 | ) | | | 29,525 | |
LME Nickel Base Metal | | | (4 | ) | | | 12/2018 | | | | USD | | | | (275,196 | ) | | | 37,020 | |
Long Gilt | | | (157 | ) | | | 12/2018 | | | | GBP | | | | (24,564,920 | ) | | | (14,569 | ) |
Natural Gas | | | (35 | ) | | | 12/2018 | | | | USD | | | | (1,163,050 | ) | | | (27,210 | ) |
S&P 500 E-Mini Index | | | (161 | ) | | | 12/2018 | | | | USD | | | | (21,817,110 | ) | | | 1,348,851 | |
Silver | | | (24 | ) | | | 12/2018 | | | | USD | | | | (1,713,600 | ) | | | 80,981 | |
SPI 200 Index | | | (18 | ) | | | 12/2018 | | | | AUD | | | | (1,853,448 | ) | | | 107,947 | |
U.S. Treasury 10 Year Note | | | (46 | ) | | | 12/2018 | | | | USD | | | | (5,450,281 | ) | | | (8,164 | ) |
U.S. Treasury 2 Year Note | | | (185 | ) | | | 12/2018 | | | | USD | | | | (38,968,515 | ) | | | 104,527 | |
U.S. Treasury 5 Year Note | | | (77 | ) | | | 12/2018 | | | | USD | | | | (8,654,680 | ) | | | 39,471 | |
U.S. Treasury Long Bond | | | (21 | ) | | | 12/2018 | | | | USD | | | | (2,904,563 | ) | | | 21,781 | |
Wheat | | | (4 | ) | | | 12/2018 | | | | USD | | | | (100,100 | ) | | | 1,263 | |
LME Aluminum Base Metal | | | (10 | ) | | | 01/2019 | | | | USD | | | | (487,125 | ) | | | 23,621 | |
LME Zinc Base Metal | | | (11 | ) | | | 01/2019 | | | | USD | | | | (686,744 | ) | | | 47,319 | |
Soybean | | | (60 | ) | | | 01/2019 | | | | USD | | | | (2,555,250 | ) | | | 57,986 | |
Lean Hogs | | | (33 | ) | | | 02/2019 | | | | USD | | | | (862,290 | ) | | | (18,627 | ) |
Live Cattle | | | (18 | ) | | | 02/2019 | | | | USD | | | | (879,840 | ) | | | (29,013 | ) |
Sugar No. 11 | | | (36 | ) | | | 02/2019 | | | | USD | | | | (531,821 | ) | | | 20,388 | |
Coffee ‘C’ | | | (43 | ) | | | 03/2019 | | | | USD | | | | (1,877,756 | ) | | | (169,911 | ) |
Corn | | | (66 | ) | | | 03/2019 | | | | USD | | | | (1,239,975 | ) | | | (24,407 | ) |
Wheat | | | (65 | ) | �� | | 03/2019 | | | | USD | | | | (1,677,000 | ) | | | 144,346 | |
Sugar No. 11 | | | (265 | ) | | | 04/2019 | | | | USD | | | | (3,947,440 | ) | | | (431,370 | ) |
Coffee ‘C’ | | | (42 | ) | | | 05/2019 | | | | USD | | | | (1,874,250 | ) | | | (165,108 | ) |
Corn | | | (43 | ) | | | 05/2019 | | | | USD | | | | (825,063 | ) | | | (16,402 | ) |
| | | | | | | | | | | | | | | | | | | | |
| | | | | | | | | | | | | | | | | | | 1,373,053 | |
| | | | | | | | | | | | | | | | | | | | |
| | | | | | | | | | | | | | | | | | | (587,363 | ) |
| | | | | | | | | | | | | | | | | | | | |
Abbreviations
| | |
| AUD | | — Australian Dollar |
| CAC | | — Continuous Assisted Quotation |
| CAD | | — Canadian Dollar |
| DAX | | — Deutscher Aktien Index |
| EUR | | — Euro |
| FTSE | | — Financial Times and the London Stock Exchange |
| GBP | | — British Pound |
| HKD | | — Hong Kong Dollar |
| | |
| IBEX | | — International Business Exchange |
| JPY | | — Japanese Yen |
| LME | | — London Metal Exchange |
| MIB | | — Milan, Italian Stock Exchange |
| SPI | | — Australian Securities Exchange |
| USD | | — United States Dollar |
| WTI | | — West Texas Intermediate |
SEE NOTES TO CONSOLIDATED FINANCIAL STATEMENTS.
| | | | | | | | |
| | | |
| OCTOBER 31, 2018 | | J.P. MORGAN EXCHANGE-TRADED FUNDS | | | | | 19 | |
JPMorgan Diversified Alternatives ETF
CONSOLIDATED SCHEDULE OF PORTFOLIO INVESTMENTS
AS OF OCTOBER 31, 2018 (continued)
| | | | | | | | | | | | | | | | | | | | |
| Forward foreign currency exchange contracts outstanding as of October 31, 2018: | |
| CURRENCY PURCHASED | | | CURRENCY SOLD | | | COUNTERPARTY | | SETTLEMENT
DATE | | | UNREALIZED
APPRECIATION
(DEPRECIATION)($) | |
| USD | | | 1,166,226 | | | AUD | | | 1,617,030 | | | HSBC Bank, NA | | | 11/5/2018 | | | | 21,088 | |
| AUD | | | 1,212,274 | | | USD | | | 858,392 | | | HSBC Bank, NA | | | 11/19/2018 | | | | 239 | |
| IDR | | | 33,008,950,592 | | | USD | | | 2,129,747 | | | Goldman Sachs International** | | | 11/19/2018 | | | | 34,848 | |
| INR | | | 164,902,591 | | | USD | | | 2,201,402 | | | Merrill Lynch International** | | | 11/19/2018 | | | | 21,265 | |
| JPY | | | 164,754,985 | | | USD | | | 1,459,765 | | | State Street Corp. | | | 11/19/2018 | | | | 2,159 | |
| TRY | | | 13,743,244 | | | USD | | | 2,185,663 | | | BNP Paribas | | | 11/19/2018 | | | | 246,905 | |
| USD | | | 2,377,233 | | | AUD | | | 3,337,930 | | | Citibank, NA | | | 11/19/2018 | | | | 13,041 | |
| USD | | | 802,688 | | | CAD | | | 1,043,441 | | | Citibank, NA | | | 11/19/2018 | | | | 9,838 | |
| USD | | | 1,637,750 | | | CHF | | | 1,631,780 | | | Citibank, NA | | | 11/19/2018 | | | | 15,085 | |
| USD | | | 11,135,122 | | | CHF | | | 11,030,424 | | | State Street Corp. | | | 11/19/2018 | | | | 166,312 | |
| USD | | | 2,238,464 | | | CZK | | | 50,440,688 | | | Merrill Lynch International | | | 11/19/2018 | | | | 35,003 | |
| USD | | | 2,085,626 | | | EUR | | | 1,796,062 | | | Citibank, NA | | | 11/19/2018 | | | | 48,590 | |
| USD | | | 12,255,836 | | | EUR | | | 10,662,054 | | | HSBC Bank, NA | | | 11/19/2018 | | | | 163,276 | |
| USD | | | 409,516 | | | EUR | | | 360,150 | | | TD Bank Financial Group | | | 11/19/2018 | | | | 1,046 | |
| USD | | | 8,276,764 | | | GBP | | | 6,329,519 | | | Citibank, NA | | | 11/19/2018 | | | | 180,385 | |
| USD | | | 2,154,122 | | | HUF | | | 611,182,231 | | | Citibank, NA | | | 11/19/2018 | | | | 19,680 | |
| USD | | | 2,246,864 | | | ILS | | | 8,162,983 | | | Citibank, NA | | | 11/19/2018 | | | | 49,303 | |
| USD | | | 870,662 | | | JPY | | | 98,030,929 | | | BNP Paribas | | | 11/19/2018 | | | | 803 | |
| USD | | | 398,966 | | | NOK | | | 3,280,776 | | | Deutsche Bank AG | | | 11/19/2018 | | | | 9,502 | |
| USD | | | 2,239,173 | | | THB | | | 73,503,300 | | | Merrill Lynch International | | | 11/19/2018 | | | | 21,043 | |
| USD | | | 2,195,910 | | | TWD | | | 67,774,551 | | | Goldman Sachs International** | | | 11/19/2018 | | | | 4,172 | |
| ZAR | | | 32,189,776 | | | USD | | | 2,140,342 | | | Merrill Lynch International | | | 11/19/2018 | | | | 37,051 | |
| USD | | | 1,145,976 | | | AUD | | | 1,617,030 | | | BNP Paribas | | | 12/5/2018 | | | | 465 | |
| | | | | | | | | | | | | | | | | | | | |
| Total unrealized appreciation | | | | 1,101,099 | |
| | | | | | | | | | | | | | | | | | | | |
| CAD | | | 1,043,441 | | | USD | | | 797,850 | | | Goldman Sachs International | | | 11/19/2018 | | | | (5,000 | ) |
| CAD | | | 7,280,782 | | | USD | | | 5,609,581 | | | HSBC Bank, NA | | | 11/19/2018 | | | | (77,339 | ) |
| CHF | | | 377,067 | | | USD | | | 379,125 | | | Merrill Lynch International | | | 11/19/2018 | | | | (4,164 | ) |
| EUR | | | 347,136 | | | USD | | | 399,137 | | | Royal Bank of Canada | | | 11/19/2018 | | | | (5,426 | ) |
| NOK | | | 96,991,362 | | | USD | | | 11,712,440 | | | State Street Corp. | | | 11/19/2018 | | | | (198,496 | ) |
| SEK | | | 4,127,737 | | | USD | | | 453,880 | | | Citibank, NA | | | 11/19/2018 | | | | (2,198 | ) |
| USD | | | 2,486,673 | | | AUD | | | 3,518,771 | | | State Street Corp. | | | 11/19/2018 | | | | (5,606 | ) |
| USD | | | 402,522 | | | EUR | | | 355,169 | | | State Street Corp. | | | 11/19/2018 | | | | (299 | ) |
| USD | | | 1,169,358 | | | JPY | | | 131,930,085 | | | TD Bank Financial Group | | | 11/19/2018 | | | | (1,300 | ) |
| USD | | | 5,274,179 | | | NZD | | | 8,191,938 | | | State Street Corp. | | | 11/19/2018 | | | | (72,401 | ) |
| USD | | | 191,973 | | | TRY | | | 1,122,931 | | | Barclays Bank plc | | | 11/19/2018 | | | | (6,787 | ) |
| MXN | | | 41,257,487 | | | USD | | | 2,152,517 | | | Citibank, NA | | | 11/20/2018 | | | | (127,650 | ) |
| MXN | | | 4,840,073 | | | USD | | | 238,628 | | | HSBC Bank, NA | | | 11/20/2018 | | | | (1,084 | ) |
| | | | | | | | | | | | | | | | | | | | |
| Total unrealized depreciation | | | | (507,750 | ) |
| | | | | | | | | | | | | | | | | | | | |
| Net unrealized appreciation | | | | 593,349 | |
| | | | | | | | | | | | | | | | | | | | |
| ** | Non-deliverable forward. |
Abbreviations
| | |
| AUD | | — Australian Dollar |
| CAD | | — Canadian Dollar |
| CHF | | — Swiss Franc |
| CZK | | — Czech Republic Krona |
| EUR | | — Euro |
| GBP | | — British Pound |
| HUF | | — Hungarian Forint |
| IDR | | — Indonesian Rupiah |
| ILS | | — Israeli Shekel |
| INR | | — India Rupee |
| | |
| JPY | | — Japanese Yen |
| MXN | | — Mexican Peso |
| NOK | | — Norwegian Krone |
| NZD | | — New Zealand Dollar |
| SEK | | — Swedish Krona |
| THB | | — Thai Baht |
| TRY | | — New Turkish Lira |
| TWD | | — Taiwan Dollar |
| USD | | — United States Dollar |
| ZAR | | — South African Rand |
SEE NOTES TO CONSOLIDATED FINANCIAL STATEMENTS.
| | | | | | |
| | | |
| 20 | | | | J.P. MORGAN EXCHANGE-TRADED FUNDS | | OCTOBER 31, 2018 |
| | | | | | | | | | | | | | | | | | | | |
| OTC Total Return Basket Swaps Outstanding at October 31, 2018 | |
| COUNTERPARTY | | DESCRIPTION | | TERMINATION
DATE | | NOTIONAL
VALUE (1) | | | NET UNREALIZED
APPRECIATION
(DEPRECIATION) (2) | | | NET CASH
AND OTHER
RECEIVABLES
(PAYABLES) | | | VALUE | |
| Bank of America | | The Fund receives the total return on a portfolio of short equity positions and pays or receives the net of one month LIBOR on short positions, which is denominated in USD based on the local currencies of the positions within the swaps. | | 11/18/2019 | | $ | (8,326,059 | ) | | $ | — | | | $ | — | | | $ | — | |
| | | | | | | | | | | | | | | | | | | | |
| | | | | | | | | | | | | | | | |
| REFERENCE ENTITY | | SHARES | | | NOTIONAL
VALUE($) (1) | | | NET UNREALIZED
APPRECIATION
(DEPRECIATION)($) (2) | | | PERCENTAGE
OF NET
ASSETS (%) | |
Short Positions | | | | | | | | | | | | | | | | |
| | | | |
Common Stocks | | | | | | | | | | | | | | | | |
Aerospace & Defense | | | | | | | | | | | | | |
TransDigm Group, Inc.* | | | (597 | ) | | | (197,159 | ) | | | — | | | | 0.0 | (a) |
| | | | | | | | | | | | | | | | |
Airlines | | | | | | | | | | | | | |
Spirit Airlines, Inc.* | | | (3,938 | ) | | | (204,382 | ) | | | — | | | | 0.0 | (a) |
| | | | | | | | | | | | | | | | |
Auto Components | | | | | | | | | | | | | |
Veoneer, Inc.* | | | (899 | ) | | | (30,188 | ) | | | — | | | | 0.0 | (a) |
| | | | | | | | | | | | | | | | |
Banks | | | | | | | | | | | | | |
Signature Bank | | | (1,794 | ) | | | (197,161 | ) | | | — | | | | 0.0 | (a) |
| | | | | | | | | | | | | | | | |
Beverages | | | | | | | | | | | | | |
National Beverage Corp.* | | | (173 | ) | | | (15,994 | ) | | | — | | | | 0.0 | (a) |
| | | | | | | | | | | | | | | | |
Commercial Services & Supplies | | | | | | | | | | | | | |
Covanta Holding Corp. | | | (13,260 | ) | | | (194,789 | ) | | | — | | | | 0.0 | (a) |
Healthcare Services Group, Inc. | | | (4,330 | ) | | | (175,755 | ) | | | — | | | | 0.0 | (a) |
| | | | | | | | | | | | | | | | |
| | | (17,590 | ) | | | (370,544 | ) | | | — | | | | 0.0 | (a) |
| | | | | | | | | | | | | | | | |
Communications Equipment | | | | | | | | | | | | | |
Acacia Communications, Inc.* | | | (1,085 | ) | | | (37,400 | ) | | | — | | | | 0.0 | (a) |
Infinera Corp.* | | | (27,781 | ) | | | (153,907 | ) | | | — | | | | 0.0 | (a) |
Lumentum Holdings, Inc.* | | | (6,597 | ) | | | (360,526 | ) | | | — | | | | 0.0 | (a) |
ViaSat, Inc.* | | | (3,157 | ) | | | (201,290 | ) | | | — | | | | 0.0 | (a) |
| | | | | | | | | | | | | | | | |
| | | (38,620 | ) | | | (753,123 | ) | | | — | | | | 0.0 | (a) |
| | | | | | | | | | | | | | | | |
Consumer Finance | | | | | | | | | | | | | |
LendingClub Corp.* | | | (40,899 | ) | | | (132,104 | ) | | | — | | | | 0.0 | (a) |
| | | | | | | | | | | | | | | | |
Distributors | | | | | | | | | | | | | |
Core-Mark Holding Co., Inc. | | | (4,266 | ) | | | (163,857 | ) | | | — | | | | 0.0 | (a) |
| | | | | | | | | | | | | | | | |
Energy Equipment & Services | | | | | | | | | | | | | |
Weatherford International plc* | | | (64,035 | ) | | | (86,447 | ) | | | — | | | | 0.0 | (a) |
| | | | | | | | | | | | | | | | |
Entertainment | | | | | | | | | | | | | |
Netflix, Inc.* | | | (449 | ) | | | (135,499 | ) | | | — | | | | 0.0 | (a) |
| | | | | | | | | | | | | | | | |
Food & Staples Retailing | | | | | | | | | | | | | |
Casey’s General Stores, Inc. | | | (1,564 | ) | | | (197,236 | ) | | | — | | | | 0.0 | (a) |
| | | | | | | | | | | | | | | | |
Health Care Equipment & Supplies | | | | | | | | | | | | | |
Insulet Corp.* | | | (1,911 | ) | | | (168,569 | ) | | | — | | | | 0.0 | (a) |
Nevro Corp.* | | | (2,876 | ) | | | (140,234 | ) | | | — | | | | 0.0 | (a) |
Wright Medical Group NV* | | | (3,097 | ) | | | (83,557 | ) | | | — | | | | 0.0 | (a) |
| | | | | | | | | | | | | | | | |
| | | (7,884 | ) | | | (392,360 | ) | | | — | | | | 0.0 | (a) |
| | | | | | | | | | | | | | | | |
Health Care Technology | | | | | | | | | | | | | |
Evolent Health, Inc.* | | | (2,181 | ) | | | (48,418 | ) | | | — | | | | 0.0 | (a) |
| | | | | | | | | | | | | | | | |
Hotels, Restaurants & Leisure | | | | | | | | | | | | | |
Eldorado Resorts, Inc.* | | | (1,785 | ) | | | (65,153 | ) | | | — | | | | 0.0 | (a) |
| | | | | | | | | | | | | | | | |
SEE NOTES TO CONSOLIDATED FINANCIAL STATEMENTS.
| | | | | | | | |
| | | |
| OCTOBER 31, 2018 | | J.P. MORGAN EXCHANGE-TRADED FUNDS | | | | | 21 | |
JPMorgan Diversified Alternatives ETF
CONSOLIDATED SCHEDULE OF PORTFOLIO INVESTMENTS
AS OF OCTOBER 31, 2018 (continued)
| | | | | | | | | | | | | | | | |
| REFERENCE ENTITY | | SHARES | | | NOTIONAL
VALUE($) (1) | | | NET UNREALIZED
APPRECIATION
(DEPRECIATION)($) (2) | | | PERCENTAGE
OF NET
ASSETS (%) | |
Short Positions — continued | |
| | |
Common Stocks — continued | | | | | | | | | |
Household Durables | | | | | | | | | | | | | |
iRobot Corp.* | | | (1,578 | ) | | | (139,132 | ) | | | — | | | | 0.0 | (a) |
| | | | | | | | | | | | | | | | |
Interactive Media & Services | | | | | | | | | | | | | |
Snap, Inc.* | | | (16,330 | ) | | | (107,941 | ) | | | — | | | | 0.0 | (a) |
| | | | | | | | | | | | | | | | |
Internet & Direct Marketing Retail | | | | | | | | | | | | | |
Overstock.com, Inc.* | | | (2,958 | ) | | | (59,515 | ) | | | — | | | | 0.0 | (a) |
Wayfair, Inc.* | | | (1,269 | ) | | | (139,958 | ) | | | — | | | | 0.0 | (a) |
| | | | | | | | | | | | | | | | |
| | | (4,227 | ) | | | (199,473 | ) | | | — | | | | 0.0 | (a) |
| | | | | | | | | | | | | | | | |
IT Services | | | | | | | | | | | | | |
GTT Communications, Inc.* | | | (4,565 | ) | | | (163,884 | ) | | | — | | | | 0.0 | (a) |
| | | | | | | | | | | | | | | | |
Media | | | | | | | | | | | | | |
Liberty Broadband Corp.* | | | (1,701 | ) | | | (141,064 | ) | | | — | | | | 0.0 | (a) |
| | | | | | | | | | | | | | | | |
Metals & Mining | | | | | | | | | | | | | |
Coeur Mining, Inc.* | | | (27,070 | ) | | | (129,395 | ) | | | — | | | | 0.0 | (a) |
Compass Minerals International, Inc. | | | (3,188 | ) | | | (154,650 | ) | | | — | | | | 0.0 | (a) |
TimkenSteel Corp.* | | | (3,824 | ) | | | (44,473 | ) | | | — | | | | 0.0 | (a) |
| | | | | | | | | | | | | | | | |
| | | (34,082 | ) | | | (328,518 | ) | | | — | | | | 0.0 | |
| | | | | | | | | | | | | | | | |
Multi-Utilities | | | | | | | | | | | | | |
Dominion Energy, Inc. | | | (969 | ) | | | (69,206 | ) | | | — | | | | 0.0 | (a) |
NiSource, Inc. | | | (8,318 | ) | | | (210,945 | ) | | | — | | | | (0.0 | )(a) |
Sempra Energy | | | (1,884 | ) | | | (207,466 | ) | | | — | | | | 0.0 | (a) |
| | | | | | | | | | | | | | | | |
| | | (11,171 | ) | | | (487,617 | ) | | | — | | | | (0.0 | )(a) |
| | | | | | | | | | | | | | | | |
Oil, Gas & Consumable Fuels | | | | | | | | | | | | | |
Cheniere Energy, Inc.* | | | (3,448 | ) | | | (208,293 | ) | | | — | | | | 0.0 | (a) |
Chesapeake Energy Corp.* | | | (47,567 | ) | | | (166,960 | ) | | | — | | | | 0.0 | (a) |
Extraction Oil & Gas, Inc.* | | | (21,716 | ) | | | (173,511 | ) | | | — | | | | 0.0 | (a) |
Parsley Energy, Inc.* | | | (6,916 | ) | | | (161,973 | ) | | | — | | | | 0.0 | (a) |
| | | | | | | | | | | | | | | | |
| | | (79,647 | ) | | | (710,737 | ) | | | — | | | | 0.0 | (a) |
| | | | | | | | | | | | | | | | |
Pharmaceuticals | | | | | | | | | | | | | |
Aerie Pharmaceuticals, Inc.* | | | (2,955 | ) | | | (157,147 | ) | | | — | | | | 0.0 | (a) |
Medicines Co. (The)* | | | (3,356 | ) | | | (78,060 | ) | | | — | | | | 0.0 | (a) |
Nektar Therapeutics* | | | (3,345 | ) | | | (129,385 | ) | | | — | | | | 0.0 | (a) |
Pacira Pharmaceuticals, Inc.* | | | (4,277 | ) | | | (209,102 | ) | | | — | | | | 0.0 | (a) |
WaVe Life Sciences Ltd.* | | | (930 | ) | | | (43,422 | ) | | | — | | | | 0.0 | (a) |
| | | | | | | | | | | | | | | | |
| | | (14,863 | ) | | | (617,116 | ) | | | — | | | | 0.0 | (a) |
| | | | | | | | | | | | | | | | |
Road & Rail | | | | | | | | | | | | | |
AMERCO | | | (577 | ) | | | (188,379 | ) | | | — | | | | 0.0 | (a) |
| | | | | | | | | | | | | | | | |
Semiconductors & Semiconductor Equipment | | | | | | | | | | | | | |
Advanced Micro Devices, Inc.* | | | (6,348 | ) | | | (115,597 | ) | | | — | | | | 0.0 | (a) |
MACOM Technology Solutions Holdings, Inc.* | | | (9,369 | ) | | | (131,822 | ) | | | — | | | | 0.0 | (a) |
| | | | | | | | | | | | | | | | |
| | | (15,717 | ) | | | (247,419 | ) | | | — | | | | 0.0 | (a) |
| | | | | | | | | | | | | | | | |
Software | | | | | | | | | | | | | |
Appian Corp.* | | | (8,425 | ) | | | (216,607 | ) | | | — | | | | 0.0 | (a) |
Autodesk, Inc.* | | | (1,615 | ) | | | (208,739 | ) | | | — | | | | 0.0 | (a) |
Benefitfocus, Inc.* | | | (381 | ) | | | (13,537 | ) | | | — | | | | 0.0 | (a) |
HubSpot, Inc.* | | | (1,619 | ) | | | (219,617 | ) | | | — | | | | 0.0 | (a) |
MINDBODY, Inc.* | | | (4,740 | ) | | | (150,922 | ) | | | — | | | | 0.0 | (a) |
Nutanix, Inc.* | | | (3,914 | ) | | | (162,470 | ) | | | — | | | | 0.0 | (a) |
SEE NOTES TO CONSOLIDATED FINANCIAL STATEMENTS.
| | | | | | |
| | | |
| 22 | | | | J.P. MORGAN EXCHANGE-TRADED FUNDS | | OCTOBER 31, 2018 |
| | | | | | | | | | | | | | | | |
| REFERENCE ENTITY | | SHARES | | | NOTIONAL
VALUE($) (1) | | | NET UNREALIZED
APPRECIATION
(DEPRECIATION)($) (2) | | | PERCENTAGE
OF NET
ASSETS (%) | |
Short Positions — continued | |
| | |
Common Stocks — continued | | | | | | | | | |
Software — continued | | | | | | | | | | | | | |
PROS Holdings, Inc.* | | | (4,744 | ) | | | (156,172 | ) | | | — | | | | 0.0 | (a) |
| | | | | | | | | | | | | | | | |
| | | (25,438 | ) | | | (1,128,064 | ) | | | — | | | | 0.0 | (a) |
| | | | | | | | | | | | | | | | |
Specialty Retail | | | | | | | | | | | | | |
CarMax, Inc.* | | | (2,075 | ) | | | (140,913 | ) | | | — | | | | 0.0 | (a) |
| | | | | | | | | | | | | | | | |
Technology Hardware, Storage & Peripherals | | | | | | | | | | | | | |
Pure Storage, Inc.* | | | (9,150 | ) | | | (184,647 | ) | | | — | | | | 0.0 | (a) |
| | | | | | | | | | | | | | | | |
Trading Companies & Distributors | | | | | | | | | | | | | |
SiteOne Landscape Supply, Inc.* | | | (2,326 | ) | | | (158,261 | ) | | | — | | | | 0.0 | (a) |
| | | | | | | | | | | | | | | | |
Water Utilities | | | | | | | | | | | | | |
American Water Works Co., Inc. | | | (2,156 | ) | | | (190,871 | ) | | | — | | | | 0.0 | (a) |
California Water Service Group | | | (4,819 | ) | | | (202,398 | ) | | | — | | | | 0.0 | (a) |
| | | | | | | | | | | | | | | | |
| | | (6,975 | ) | | | (393,269 | ) | | | — | | | | 0.0 | (a) |
| | | | | | | | | | | | | | | | |
Total Short Positions of Total Return Basket Swap | | | (417,096 | ) | | | (8,326,059 | ) | | | — | | | | 0.0 | (a) |
| | | | | | | | | | | | | | | | |
| | | | | | | | | | | | | | | | | | | | |
| COUNTERPARTY | | DESCRIPTION | | TERMINATION
DATE | | NOTIONAL
VALUE (1) | | | NET UNREALIZED
APPRECIATION
(DEPRECIATION) (2) | | | NET CASH
AND OTHER
RECEIVABLES
(PAYABLES) | | | VALUE | |
Bank of America | | The Fund receives the total return on a portfolio of long and short equity positions and pays or receives the net of one month LIBOR on long positions and short positions respectively, plus or minus a specified spread (rates range from 0.00% to 0.25%), which is denominated in GBP based on the local currencies of the positions within the swaps. | | 3/29/2019 | | $ | (561,678 | ) | | $ | 47,557 | | | $ | — | | | $ | 47,557 | |
| | | | | | | | | | | | | | | | | | | | |
| | | | | | | | | | | | | | | | |
| REFERENCE ENTITY | | SHARES | | | NOTIONAL
VALUE($) (1) | | | NET UNREALIZED
APPRECIATION
(DEPRECIATION)($) (2) | | | PERCENTAGE
OF NET
ASSETS (%) | |
Long Positions | | | | | |
| | | |
Common Stocks | | | | | | | | | | | | | |
Aerospace & Defense | | | | | | | | | | | | | |
Meggitt plc | | | 2,371 | | | | 16,041 | | | | (180 | ) | | | (0.0 | )(a) |
| | | | | | | | | | | | | | | | |
Air Freight & Logistics | | | | | | | | | | | | | |
Royal Mail plc | | | 13,264 | | | | 60,894 | | | | (1,162 | ) | | | (0.0 | )(a) |
| | | | | | | | | | | | | | | | |
Airlines | | | | | | | | | | | | | |
International Consolidated Airlines Group SA | | | 37,508 | | | | 289,167 | | | | 11,787 | | | | 0.0 | (a) |
Wizz Air Holdings plc* (b) | | | 703 | | | | 23,058 | | | | 46 | | | | 0.0 | (a) |
| | | | | | | | | | | | | | | | |
| | | 38,211 | | | | 312,225 | | | | 11,833 | | | | 0.0 | (a) |
| | | | | | | | | | | | | | | | |
Distributors | | | | | | | | | | | | | |
Inchcape plc | | | 12,283 | | | | 84,835 | | | | 7,486 | | | | 0.0 | (a) |
| | | | | | | | | | | | | | | | |
Energy Equipment & Services | | | | | | | | | | | | | |
Hunting plc | | | 3,891 | | | | 33,386 | | | | (490 | ) | | | (0.0 | )(a) |
Petrofac Ltd. | | | 20,109 | | | | 147,872 | | | | (2,780 | ) | | | (0.0 | )(a) |
| | | | | | | | | | | | | | | | |
| | | 24,000 | | | | 181,258 | | | | (3,270 | ) | | | (0.0 | )(a) |
| | | | | | | | | | | | | | | | |
SEE NOTES TO CONSOLIDATED FINANCIAL STATEMENTS.
| | | | | | | | |
| | | |
| OCTOBER 31, 2018 | | J.P. MORGAN EXCHANGE-TRADED FUNDS | | | | | 23 | |
JPMorgan Diversified Alternatives ETF
CONSOLIDATED SCHEDULE OF PORTFOLIO INVESTMENTS
AS OF OCTOBER 31, 2018 (continued)
| | | | | | | | | | | | | | | | |
| REFERENCE ENTITY | | SHARES | | | NOTIONAL
VALUE($) (1) | | | NET UNREALIZED
APPRECIATION
(DEPRECIATION)($) (2) | | | PERCENTAGE
OF NET
ASSETS (%) | |
Long Positions — continued | |
| | |
Common Stocks — continued | | | | | | | | | |
Equity Real Estate Investment Trusts (REITs) | | | | | | | | | | | | | |
UNITE Group plc (The) | | | 2,063 | | | | 22,462 | | | | 50 | | | | 0.0 | (a) |
| | | | | | | | | | | | | | | | |
Food & Staples Retailing | | | | | | | | | | | | | |
Wm Morrison Supermarkets plc | | | 6,351 | | | | 20,121 | | | | (58 | ) | | | (0.0 | )(a) |
| | | | | | | | | | | | | | | | |
Food Products | | | | | | | | | | | | | |
Tate & Lyle plc | | | 2,295 | | | | 19,733 | | | | (11 | ) | | | (0.0 | )(a) |
| | | | | | | | | | | | | | | | |
Hotels, Restaurants & Leisure | | | | | | | | | | | | | |
Carnival plc | | | 1,641 | | | | 89,443 | | | | 238 | | | | 0.0 | (a) |
William Hill plc | | | 27,207 | | | | 73,138 | | | | 2,819 | | | | 0.0 | (a) |
| | | | | | | | | | | | | | | | |
| | | 28,848 | | | | 162,581 | | | | 3,057 | | | | 0.0 | (a) |
| | | | | | | | | | | | | | | | |
Household Durables | | | | | | | | | | | | | |
Berkeley Group Holdings plc | | | 1,899 | | | | 84,873 | | | | 2,968 | | | | 0.0 | (a) |
Bovis Homes Group plc | | | 18,762 | | | | 231,898 | | | | (3,937 | ) | | | (0.0 | )(a) |
Persimmon plc | | | 866 | | | | 25,345 | | | | (56 | ) | | | (0.0 | )(a) |
Redrow plc | | | 9,543 | | | | 64,434 | | | | (40 | ) | | | (0.0 | )(a) |
Taylor Wimpey plc | | | 11,977 | | | | 24,661 | | | | (26 | ) | | | (0.0 | )(a) |
| | | | | | | | | | | | | | | | |
| | | 43,047 | | | | 431,211 | | | | (1,091 | ) | | | (0.0 | )(a) |
| | | | | | | | | | | | | | | | |
Machinery | | | | | | | | | | | | | |
Bodycote plc | | | 5,279 | | | | 53,609 | | | | 2,708 | | | | 0.0 | (a) |
Vesuvius plc | | | 6,418 | | | | 44,529 | | | | (495 | ) | | | (0.0 | )(a) |
| | | | | | | | | | | | | | | | |
| | | 11,697 | | | | 98,138 | | | | 2,213 | | | | 0.0 | (a) |
| | | | | | | | | | | | | | | | |
Media | | | | | | | | | | | | | |
Pearson plc | | | 24,777 | | | | 284,637 | | | | 8,106 | | | | 0.0 | (a) |
Metals & Mining | | | | | | | | | | | | | |
Anglo American plc | | | 13,506 | | | | 288,264 | | | | 4,841 | | | | 0.0 | (a) |
Antofagasta plc | | | 3,844 | | | | 38,479 | | | | (584 | ) | | | (0.0 | )(a) |
BHP Billiton plc | | | 13,918 | | | | 277,646 | | | | 1,822 | | | | 0.0 | (a) |
Centamin plc | | | 70,154 | | | | 89,088 | | | | (2,121 | ) | | | (0.0 | )(a) |
Rio Tinto plc | | | 2,595 | | | | 125,989 | | | | 1,670 | | | | 0.0 | (a) |
| | | | | | | | | | | | | | | | |
| | | 104,017 | | | | 819,466 | | | | 5,628 | | | | 0.0 | (a) |
| | | | | | | | | | | | | | | | |
Multi-Utilities | | | | | | | | | | | | | |
Centrica plc | | | 6,876 | | | | 12,915 | | | | (21 | ) | | | (0.0 | )(a) |
| | | | | | | | | | | | | | | | |
Oil, Gas & Consumable Fuels | | | | | | | | | | | | | |
Royal Dutch Shell plc | | | 584 | | | | 19,046 | | | | (47 | ) | | | (0.0 | )(a) |
Tullow Oil plc* | | | 5,626 | | | | 16,141 | | | | (247 | ) | | | (0.0 | )(a) |
| | | | | | | | | | | | | | | | |
| | | 6,210 | | | | 35,187 | | | | (294 | ) | | | (0.0 | )(a) |
| | | | | | | | | | | | | | | | |
Total Long Positions of Total Return Basket Swap | | | 326,310 | | | | 2,561,704 | | | | 32,286 | | | | 0.0 | (a) |
| | | | | | | | | | | | | | | | |
| |
Short Positions | | | | | |
| | | |
Common Stocks | | | | | | | | | | | | | |
Aerospace & Defense | | | | | | | | | | | | | |
Rolls-Royce Holdings plc* | | | (19,235 | ) | | | (206,280 | ) | | | 7,599 | | | | 0.0 | (a) |
Rolls-Royce Holdings plc* (Preference) | | | (767,280 | ) | | | (981 | ) | | | (983 | ) | | | 0.0 | (a) |
| | | | | | | | | | | | | | | | |
| | | (786,515 | ) | | | (207,261 | ) | | | 6,616 | | | | 0.0 | (a) |
| | | | | | | | | | | | | | | | |
Banks | | | | | | | | | | | | | |
Metro Bank plc* | | | (2,239 | ) | | | (63,539 | ) | | | (379 | ) | | | (0.0 | )(a) |
Standard Chartered plc | | | (29,320 | ) | | | (205,495 | ) | | | 496 | | | | 0.0 | (a) |
| | | | | | | | | | | | | | | | |
| | | (31,559 | ) | | | (269,034 | ) | | | 117 | | | | 0.0 | (a) |
| | | | | | | | | | | | | | | | |
SEE NOTES TO CONSOLIDATED FINANCIAL STATEMENTS.
| | | | | | |
| | | |
| 24 | | | | J.P. MORGAN EXCHANGE-TRADED FUNDS | | OCTOBER 31, 2018 |
| | | | | | | | | | | | | | | | |
| REFERENCE ENTITY | | SHARES | | | NOTIONAL
VALUE($) (1) | | | NET UNREALIZED
APPRECIATION
(DEPRECIATION)($) (2) | | | PERCENTAGE
OF NET
ASSETS (%) | |
Short Positions — continued | | | | | |
| | | |
Common Stocks — continued | | | | | | | | | | | | | |
Capital Markets | | | | | | | | | | | | | |
St James’s Place plc | | | (15,957 | ) | | | (206,216 | ) | | | 6,189 | | | | 0.0 | (a) |
| | | | | | | | | | | | | | | | |
Chemicals | | | | | | | | | | | | | |
Johnson Matthey plc | | | (5,509 | ) | | | (208,867 | ) | | | 2,811 | | | | 0.0 | (a) |
| | | | | | | | | | | | | | | | |
Containers & Packaging | | | | | | | | | | | | | |
DS Smith plc | | | (7,235 | ) | | | (36,302 | ) | | | 196 | | | | 0.0 | (a) |
RPC Group plc | | | (3,000 | ) | | | (29,242 | ) | | | 49 | | | | 0.0 | (a) |
| | | | | | | | | | | | | | | | |
| | | (10,235 | ) | | | (65,544 | ) | | | 245 | | | | 0.0 | (a) |
| | | | | | | | | | | | | | | | |
Diversified Telecommunication Services | | | | | | | | | | | | | |
BT Group plc | | | (5,550 | ) | | | (16,994 | ) | | | (40 | ) | | | (0.0 | )(a) |
Inmarsat plc | | | (4,995 | ) | | | (29,048 | ) | | | 175 | | | | 0.0 | (a) |
| | | | | | | | | | | | | | | | |
| | | (10,545 | ) | | | (46,042 | ) | | | 135 | | | | 0.0 | (a) |
| | | | | | | | | | | | | | | | |
Electrical Equipment | | | | | | | | | | | | | |
Melrose Industries plc | | | (21,668 | ) | | | (46,642 | ) | | | 345 | | | | 0.0 | (a) |
| | | | | | | | | | | | | | | | |
Energy Equipment & Services | | | | | | | | | | | | | |
John Wood Group plc | | | (2,493 | ) | | | (22,722 | ) | | | 305 | | | | 0.0 | (a) |
| | | | | | | | | | | | | | | | |
Health Care Providers & Services | | | | | | | | | | | | | |
NMC Health plc | | | (341 | ) | | | (15,375 | ) | | | 225 | | | | 0.0 | (a) |
| | | | | | | | | | | | | | | | |
Hotels, Restaurants & Leisure | | | | | | | | | | | | | |
Compass Group plc | | | (8,357 | ) | | | (164,372 | ) | | | (2,242 | ) | | | (0.0 | )(a) |
InterContinental Hotels Group plc | | | (3,216 | ) | | | (168,743 | ) | | | 3,733 | | | | 0.0 | (a) |
Merlin Entertainments plc(b) | | | (38,540 | ) | | | (159,163 | ) | | | 2,258 | | | | 0.0 | (a) |
| | | | | | | | | | | | | | | | |
| | | (50,113 | ) | | | (492,278 | ) | | | 3,749 | | | | 0.0 | (a) |
| | | | | | | | | | | | | | | | |
Household Durables | | | | | | | | | | | | | |
Crest Nicholson Holdings plc | | | (5,597 | ) | | | (24,381 | ) | | | (1,278 | ) | | | (0.0 | )(a) |
| | | | | | | | | | | | | | | | |
Industrial Conglomerates | | | | | | | | | | | | | |
DCC plc | | | (2,421 | ) | | | (207,506 | ) | | | (1,097 | ) | | | (0.0 | )(a) |
| | | | | | | | | | | | | | | | |
Insurance | | | | | | | | | | | | | |
Lancashire Holdings Ltd. | | | (27,640 | ) | | | (208,373 | ) | | | (4,917 | ) | | | (0.0 | )(a) |
| | | | | | | | | | | | | | | | |
Machinery | | | | | | | | | | | | | |
Weir Group plc (The) | | | (10,195 | ) | | | (206,311 | ) | | | 4,850 | | | | 0.0 | (a) |
| | | | | | | | | | | | | | | | |
Media | | | | | | | | | | | | | |
ITV plc | | | (108,681 | ) | | | (206,306 | ) | | | 4,738 | | | | 0.0 | (a) |
| | | | | | | | | | | | | | | | |
Metals & Mining | | | | | | | | | | | | | |
Fresnillo plc | | | (18,651 | ) | | | (202,253 | ) | | | 9,628 | | | | 0.0 | (a) |
| | | | | | | | | | | | | | | | |
Multiline Retail | | | | | | | | | | | | | |
B&M European Value Retail SA | | | (31,015 | ) | | | (165,039 | ) | | | (10,032 | ) | | | (0.0 | )(a) |
| | | | | | | | | | | | | | | | |
Professional Services | | | | | | | | | | | | | |
Capita plc* | | | (18,074 | ) | | | (29,601 | ) | | | 190 | | | | 0.0 | (a) |
| | | | | | | | | | | | | | | | |
Real Estate Management & Development | | | | | | | | | | | | | |
Capital & Counties Properties plc | | | (7,618 | ) | | | (24,306 | ) | | | 19 | | | | 0.0 | (a) |
| | | | | | | | | | | | | | | | |
Software | | | | | | | | | | | | | |
AVEVA Group plc | | | (1,095 | ) | | | (36,628 | ) | | | 285 | | | | 0.0 | (a) |
| | | | | | | | | | | | | | | | |
Specialty Retail | | | | | | | | | | | | | |
Kingfisher plc | | | (8,395 | ) | | | (27,260 | ) | | | (1,453 | ) | | | (0.0 | )(a) |
| | | | | | | | | | | | | | | | |
Tobacco | | | | | | | | | | | | | |
British American Tobacco plc | | | (4,739 | ) | | | (205,437 | ) | | | (6,399 | ) | | | (0.0 | )(a) |
| | | | | | | | | | | | | | | | |
Total Short Positions of Total Return Basket Swap | | | (1,179,056 | ) | | | (3,123,382 | ) | | | 15,271 | | | | 0.0 | (a) |
| | | | | | | | | | | | | | | | |
Total of Long and Short Positions of Total Return Basket Swap | | | (852,746 | ) | | | (561,678 | ) | | | 47,557 | | | | 0.0 | (a) |
| | | | | | | | | | | | | | | | |
SEE NOTES TO CONSOLIDATED FINANCIAL STATEMENTS.
| | | | | | | | |
| | | |
| OCTOBER 31, 2018 | | J.P. MORGAN EXCHANGE-TRADED FUNDS | | | | | 25 | |
JPMorgan Diversified Alternatives ETF
CONSOLIDATED SCHEDULE OF PORTFOLIO INVESTMENTS
AS OF OCTOBER 31, 2018 (continued)
| | | | | | | | | | | | | | | | | | | | |
| COUNTERPARTY | | DESCRIPTION | | TERMINATION
DATE | | NOTIONAL
VALUE (1) | | | NET UNREALIZED
APPRECIATION
(DEPRECIATION) (2) | | | NET CASH
AND OTHER
RECEIVABLES
(PAYABLES) | | | VALUE | |
Bank of America | | The Fund receives the total return on a portfolio of short equity positions and pays or receives the net of one month BA on short positions, which is denominated in CAD based on the local currencies of the positions within the swaps. | | 11/18/2019 | | $ | (2,078,684 | ) | | $ | — | | | $ | — | | | $ | — | |
| | | | | | | | | | | | | | | | | | | | |
| | | | | | | | | | | | | | | | |
| REFERENCE ENTITY | | SHARES | | | NOTIONAL
VALUE($) (1) | | | NET UNREALIZED
APPRECIATION
(DEPRECIATION)($) (2) | | | PERCENTAGE
OF NET
ASSETS (%) | |
Short Positions | | | | | |
| | | |
Common Stocks | | | | | | | | | | | | | |
Aerospace & Defense | | | | | | | | | | | | | |
Bombardier, Inc.* | | | (86,070 | ) | | | (208,563 | ) | | | — | | | | 0.0 | (a) |
| | | | | | | | | | | | | | | | |
Capital Markets | | | | | | | | | | | | | |
Thomson Reuters Corp. | | | (302 | ) | | | (14,056 | ) | | | — | | | | 0.0 | (a) |
| | | | | | | | | | | | | | | | |
Construction & Engineering | | | | | | | | | | | | | |
SNC-Lavalin Group, Inc. | | | (802 | ) | | | (28,633 | ) | | | — | | | | 0.0 | (a) |
| | | | | | | | | | | | | | | | |
Diversified Financial Services | | | | | | | | | | | | | |
Onex Corp. | | | (293 | ) | | | (19,263 | ) | | | — | | | | 0.0 | (a) |
| | | | | | | | | | | | | | | | |
Entertainment | | | | | | | | | | | | | |
Cineplex, Inc. | | | (1,937 | ) | | | (53,397 | ) | | | — | | | | 0.0 | (a) |
| | | | | | | | | | | | | | | | |
Food Products | | | | | | | | | | | | | |
Saputo, Inc. | | | (468 | ) | | | (14,259 | ) | | | — | | | | 0.0 | (a) |
| | | | | | | | | | | | | | | | |
Gas Utilities | | | | | | | | | | | | | |
AltaGas Ltd. | | | (6,055 | ) | | | (76,122 | ) | | | — | | | | 0.0 | (a) |
| | | | | | | | | | | | | | | | |
Independent Power and Renewable Electricity Producers | | | | | | | | | | | | | |
Northland Power, Inc. | | | (13,568 | ) | | | (208,707 | ) | | | — | | | | 0.0 | (a) |
| | | | | | | | | | | | | | | | |
Metals & Mining | | | | | | | | | | | | | |
Agnico Eagle Mines Ltd. | | | (5,339 | ) | | | (188,586 | ) | | | — | | | | 0.0 | (a) |
B2Gold Corp.* | | | (79,315 | ) | | | (195,810 | ) | | | — | | | | 0.0 | (a) |
First Quantum Minerals Ltd. | | | (23,260 | ) | | | (232,167 | ) | | | — | | | | 0.0 | (a) |
Franco-Nevada Corp. | | | (3,325 | ) | | | (207,666 | ) | | | — | | | | 0.0 | (a) |
Goldcorp, Inc. | | | (20,908 | ) | | | (188,838 | ) | | | — | | | | 0.0 | (a) |
Kinross Gold Corp.* | | | (7,718 | ) | | | (20,050 | ) | | | — | | | | 0.0 | (a) |
Yamana Gold, Inc. | | | (11,474 | ) | | | (26,060 | ) | | | — | | | | 0.0 | (a) |
| | | | | | | | | | | | | | | | |
| | | (151,339 | ) | | | (1,059,177 | ) | | | — | | | | 0.0 | (a) |
| | | | | | | | | | | | | | | | |
Oil, Gas & Consumable Fuels | | | | | | | | | | | | | |
ARC Resources Ltd. | | | (3,545 | ) | | | (33,014 | ) | | | — | | | | 0.0 | (a) |
Paramount Resources Ltd.* | | | (28,128 | ) | | | (205,546 | ) | | | — | | | | 0.0 | (a) |
Pembina Pipeline Corp. | | | (561 | ) | | | (18,145 | ) | | | — | | | | 0.0 | (a) |
PrairieSky Royalty Ltd. | | | (2,195 | ) | | | (33,347 | ) | | | — | | | | 0.0 | (a) |
Seven Generations Energy Ltd.* | | | (2,216 | ) | | | (23,752 | ) | | | — | | | | 0.0 | (a) |
TransCanada Corp. | | | (607 | ) | | | (22,889 | ) | | | — | | | | (0.0 | (a) |
Whitecap Resources, Inc. | | | (12,227 | ) | | | (59,814 | ) | | | — | | | | 0.0 | (a) |
| | | | | | | | | | | | | | | | |
| | | (49,479 | ) | | | (396,507 | ) | | | — | | | | (0.0 | )(a) |
| | | | | | | | | | | | | | | | |
Total Short Positions of Total Return Basket Swap | | | (310,313 | ) | | | (2,078,684 | ) | | | — | | | | 0.0 | (a) |
| | | | | | | | | | | | | | | | |
SEE NOTES TO CONSOLIDATED FINANCIAL STATEMENTS.
| | | | | | |
| | | |
| 26 | | | | J.P. MORGAN EXCHANGE-TRADED FUNDS | | OCTOBER 31, 2018 |
| | | | | | | | | | | | | | | | | | | | |
| COUNTERPARTY | | DESCRIPTION | | TERMINATION
DATE | | NOTIONAL
VALUE (1) | | | NET UNREALIZED
APPRECIATION
(DEPRECIATION) (2) | | | NET CASH
AND OTHER
RECEIVABLES
(PAYABLES) | | | VALUE | |
Bank of America | | The Fund receives the total return on a portfolio of short equity positions and pays or receives the net of one month EURIBOR on short positions, which is denominated in EUR based on the local currencies of the positions within the swaps. | | 3/29/2019 | | $ | (6,978,359 | ) | | $ | 75,900 | | | $ | — | | | $ | 75,900 | |
| | | | | | | | | | | | | | | | | | | | |
| | | | | | | | | | | | | | | | |
| REFERENCE ENTITY | | SHARES | | | NOTIONAL
VALUE($) (1) | | | NET UNREALIZED
APPRECIATION
(DEPRECIATION)($) (2) | | | PERCENTAGE
OF NET
ASSETS (%) | |
Short Positions | | | | | |
| | | |
Common Stocks | | | | | | | | | | | | | |
Air Freight & Logistics | | | | | | | | | | | | | |
Deutsche Post AG | | | (6,148 | ) | | | (194,125 | ) | | | (632 | ) | | | (0.0 | )(a) |
| | | | | | | | | | | | | | | | |
Auto Components | | | | | | | | | | | | | |
Brembo SpA | | | (3,995 | ) | | | (44,228 | ) | | | (1,435 | ) | | | (0.0 | )(a) |
Nokian Renkaat OYJ | | | (1,558 | ) | | | (49,558 | ) | | | (180 | ) | | | (0.0 | )(a) |
| | | | | | | | | | | | | | | | |
| | | (5,553 | ) | | | (93,786 | ) | | | (1,615 | ) | | | (0.0 | )(a) |
| | | | | | | | | | | | | | | | |
Automobiles | | | | | | | | | | | | | |
Daimler AG (Registered) | | | (2,721 | ) | | | (161,183 | ) | | | (7,145 | ) | | | (0.0 | )(a) |
| | | | | | | | | | | | | | | | |
Banks | | | | | | | | | | | | | |
Bankia SA | | | (66,022 | ) | | | (207,379 | ) | | | 13,416 | | | | 0.0 | (a) |
Commerzbank AG* | | | (3,623 | ) | | | (34,114 | ) | | | 326 | | | | 0.0 | (a) |
| | | | | | | | | | | | | | | | |
| | | (69,645 | ) | | | (241,493 | ) | | | 13,742 | | | | 0.0 | (a) |
| | | | | | | | | | | | | | | | |
Capital Markets | | | | | | | | | | | | | |
Banca Generali SpA | | | (2,142 | ) | | | (41,243 | ) | | | 291 | | | | 0.0 | (a) |
Deutsche Bank AG (Registered) | | | (21,073 | ) | | | (205,962 | ) | | | 19,815 | | | | 0.0 | (a) |
| | | | | | | | | | | | | | | | |
| | | (23,215 | ) | | | (247,205 | ) | | | 20,106 | | | | 0.0 | (a) |
| | | | | | | | | | | | | | | | |
Chemicals | | | | | | | | | | | | | |
K+S AG (Registered) | | | (1,568 | ) | | | (29,199 | ) | | | 43 | | | | 0.0 | (a) |
LANXESS AG | | | (3,388 | ) | | | (209,710 | ) | | | 9,454 | | | | 0.0 | (a) |
Lenzing AG | | | (2,321 | ) | | | (210,536 | ) | | | 7,326 | | | | 0.0 | (a) |
OCI NV* | | | (4,862 | ) | | | (138,143 | ) | | | 9,821 | | | | 0.0 | (a) |
Symrise AG | | | (2,401 | ) | | | (201,125 | ) | | | (5,838 | ) | | | (0.0 | )(a) |
Umicore SA | | | (864 | ) | | | (40,671 | ) | | | 516 | | | | 0.0 | (a) |
| | | | | | | | | | | | | | | | |
| | | (15,404 | ) | | | (829,384 | ) | | | 21,322 | | | | 0.0 | (a) |
| | | | | | | | | | | | | | | | |
Commercial Services & Supplies | | | | | | | | | | | | | |
Elis SA | | | (418 | ) | | | (8,429 | ) | | | 30 | | | | 0.0 | (a) |
| | | | | | | | | | | | | | | | |
Construction & Engineering | | | | | | | | | | | | | |
Boskalis Westminster | | | (7,131 | ) | | | (205,036 | ) | | | (5,592 | ) | | | (0.0 | )(a) |
| | | | | | | | | | | | | | | | |
Construction Materials | | | | | | | | | | | | | |
Imerys SA | | | (3,210 | ) | | | (197,874 | ) | | | (3,589 | ) | | | (0.0 | )(a) |
| | | | | | | | | | | | | | | | |
Containers & Packaging | | | | | | | | | | | | | |
Huhtamaki OYJ | | | (7,669 | ) | | | (215,019 | ) | | | 11,007 | | | | 0.0 | (a) |
| | | | | | | | | | | | | | | | |
Diversified Financial Services | | | | | | | | | | | | | |
Wendel SA | | | (97 | ) | | | (12,569 | ) | | | (26 | ) | | | (0.0 | )(a) |
| | | | | | | | | | | | | | | | |
Diversified Telecommunication Services | | | | | | | | | | | | | |
Cellnex Telecom SA (b) | | | (508 | ) | | | (12,637 | ) | | | (5 | ) | | | (0.0 | )(a) |
Iliad SA | | | (1,392 | ) | | | (160,895 | ) | | | 13,448 | | | | 0.0 | (a) |
| | | | | | | | | | | | | | | | |
| | | (1,900 | ) | | | (173,532 | ) | | | 13,443 | | | | 0.0 | (a) |
| | | | | | | | | | | | | | | | |
SEE NOTES TO CONSOLIDATED FINANCIAL STATEMENTS.
| | | | | | | | |
| | | |
| OCTOBER 31, 2018 | | J.P. MORGAN EXCHANGE-TRADED FUNDS | | | | | 27 | |
JPMorgan Diversified Alternatives ETF
CONSOLIDATED SCHEDULE OF PORTFOLIO INVESTMENTS
AS OF OCTOBER 31, 2018 (continued)
| | | | | | | | | | | | | | | | |
| REFERENCE ENTITY | | SHARES | | | NOTIONAL
VALUE($) (1) | | | NET UNREALIZED
APPRECIATION
(DEPRECIATION)($) (2) | | | PERCENTAGE
OF NET
ASSETS (%) | |
Short Positions — continued | | | | | |
| | | |
Common Stocks — continued | | | | | | | | | | | | | |
Electrical Equipment | | | | | | | | | | | | | |
Nexans SA | | | (7,230 | ) | | | (208,645 | ) | | | (7,808 | ) | | | (0.0 | )(a) |
Siemens Gamesa Renewable Energy SA* | | | (3,715 | ) | | | (41,144 | ) | | | 120 | | | | 0.0 | (a) |
| | | | | | | | | | | | | | | | |
| | | (10,945 | ) | | | (249,789 | ) | | | (7,688 | ) | | | (0.0 | )(a) |
| | | | | | | | | | | | | | | | |
Food & Staples Retailing | | | | | | | | | | | | | |
Jeronimo Martins SGPS SA | | | (16,565 | ) | | | (203,318 | ) | | | 13,583 | | | | 0.0 | (a) |
| | | | | | | | | | | | | | | | |
Food Products | | | | | | | | | | | | | |
Glanbia plc | | | (12,153 | ) | | | (214,869 | ) | | | (19,563 | ) | | | (0.0 | )(a) |
| | | | | | | | | | | | | | | | |
Gas Utilities | | | | | | | | | | | | | |
Rubis SCA | | | (3,993 | ) | | | (206,015 | ) | | | (3,107 | ) | | | (0.0 | )(a) |
| | | | | | | | | | | | | | | | |
Hotels, Restaurants & Leisure | | | | | | | | | | | | | |
Elior Group SA (b) | | | (11,820 | ) | | | (170,023 | ) | | | (10,125 | ) | | | (0.0 | )(a) |
Paddy Power Betfair plc | | | (1,927 | ) | | | (166,315 | ) | | | (10,826 | ) | | | (0.0 | )(a) |
| | | | | | | | | | | | | | | | |
| | | (13,747 | ) | | | (336,338 | ) | | | (20,951 | ) | | | (0.0 | )(a) |
| | | | | | | | | | | | | | | | |
Household Durables | | | | | | | | | | | | | |
Neinor Homes SA* (b) | | | (10,171 | ) | | | (163,699 | ) | | | 6,983 | | | | 0.0 | (a) |
| | | | | | | | | | | | | | | | |
Industrial Conglomerates | | | | | | | | | | | | | |
Siemens AG (Registered) | | | (1,805 | ) | | | (207,479 | ) | | | 29 | | | | 0.0 | (a) |
| | | | | | | | | | | | | | | | |
Internet & Direct Marketing Retail | | | | | | | | | | | | | |
Delivery Hero SE* (b) | | | (591 | ) | | | (23,797 | ) | | | (63 | ) | | | (0.0 | )(a) |
Zalando SE* (b) | | | (2,824 | ) | | | (109,162 | ) | | | 184 | | | | 0.0 | (a) |
| | | | | | | | | | | | | | | | |
| | | (3,415 | ) | | | (132,959 | ) | | | 121 | | | | 0.0 | (a) |
| | | | | | | | | | | | | | | | |
IT Services | | | | | | | | | | | | | |
Bechtle AG | | | (418 | ) | | | (37,121 | ) | | | (58 | ) | | | (0.0 | )(a) |
| | | | | | | | | | | | | | | | |
Life Sciences Tools & Services | | | | | | | | | | | | | |
Eurofins Scientific SE | | | (410 | ) | | | (206,617 | ) | | | (13,126 | ) | | | (0.0 | )(a) |
MorphoSys AG* | | | (1,689 | ) | | | (156,396 | ) | | | 6,983 | | | | 0.0 | (a) |
| | | | | | | | | | | | | | | | |
| | | (2,099 | ) | | | (363,013 | ) | | | (6,143 | ) | | | (0.0 | )(a) |
| | | | | | | | | | | | | | | | |
Machinery | | | | | | | | | | | | | |
Alstom SA* | | | (4,809 | ) | | | (210,022 | ) | | | (70 | ) | | | (0.0 | )(a) |
ANDRITZ AG | | | (4,136 | ) | | | (214,369 | ) | | | 2,511 | | | | 0.0 | (a) |
Duerr AG | | | (1,165 | ) | | | (41,514 | ) | | | (5,191 | ) | | | (0.0 | )(a) |
GEA Group AG | | | (5,920 | ) | | | (179,885 | ) | | | (2,926 | ) | | | (0.0 | )(a) |
IMA Industria Macchine Automatiche SpA | | | (3,209 | ) | | | (192,434 | ) | | | 22,487 | | | | 0.0 | (a) |
Outotec OYJ* | | | (22,033 | ) | | | (85,220 | ) | | | (618 | ) | | | (0.0 | )(a) |
| | | | | | | | | | | | | | | | |
| | | (41,272 | ) | | | (923,444 | ) | | | 16,193 | | | | 0.0 | (a) |
| | | | | | | | | | | | | | | | |
Media | | | | | | | | | | | | | |
Altice Europe NV* | | | (58,750 | ) | | | (139,769 | ) | | | 9,384 | | | | 0.0 | (a) |
JCDecaux SA | | | (6,300 | ) | | | (206,815 | ) | | | 2,005 | | | | 0.0 | (a) |
Telenet Group Holding NV | | | (4,210 | ) | | | (203,968 | ) | | | 18,232 | | | | 0.1 | |
| | | | | | | | | | | | | | | | |
| | | (69,260 | ) | | | (550,552 | ) | | | 29,621 | | | | 0.1 | |
| | | | | | | | | | | | | | | | |
Metals & Mining | | | | | | | | | | | | | |
Bekaert SA | | | (1,192 | ) | | | (25,745 | ) | | | (59 | ) | | | (0.0 | )(a) |
Salzgitter AG | | | (5,232 | ) | | | (209,112 | ) | | | (2,736 | ) | | | (0.0 | )(a) |
thyssenkrupp AG | | | (9,420 | ) | | | (197,454 | ) | | | 15,669 | | | | 0.0 | (a) |
| | | | | | | | | | | | | | | | |
| | | (15,844 | ) | | | (432,311 | ) | | | 12,874 | | | | 0.0 | (a) |
| | | | | | | | | | | | | | | | |
SEE NOTES TO CONSOLIDATED FINANCIAL STATEMENTS.
| | | | | | |
| | | |
| 28 | | | | J.P. MORGAN EXCHANGE-TRADED FUNDS | | OCTOBER 31, 2018 |
| | | | | | | | | | | | | | | | |
| REFERENCE ENTITY | | SHARES | | | NOTIONAL
VALUE($) (1) | | | NET UNREALIZED
APPRECIATION
(DEPRECIATION)($) (2) | | | PERCENTAGE
OF NET
ASSETS (%) | |
Short Positions — continued | | | | | |
| | | |
Common Stocks — continued | | | | | | | | | | | | | |
Multi-Utilities | | | | | | | | | | | | | |
E.ON SE | | | (2,404 | ) | | | (23,247 | ) | | | 46 | | | | 0.0 | (a) |
RWE AG | | | (2,193 | ) | | | (42,663 | ) | | | 244 | | | | 0.0 | (a) |
| | | | | | | | | | | | | | | | |
| | | (4,597 | ) | | | (65,910 | ) | | | 290 | | | | 0.0 | (a) |
| | | | | | | | | | | | | | | | |
Pharmaceuticals | | | | | | | | | | | | | |
Orion OYJ | | | (514 | ) | | | (17,681 | ) | | | 135 | | | | 0.0 | (a) |
| | | | | | | | | | | | | | | | |
Professional Services | | | | | | | | | | | | | |
Bureau Veritas SA | | | (1,124 | ) | | | (25,357 | ) | | | (2 | ) | | | (0.0 | )(a) |
| | | | | | | | | | | | | | | | |
Semiconductors & Semiconductor Equipment | | | | | | | | | | | | | |
SOITEC* | | | (366 | ) | | | (26,079 | ) | | | 212 | | | | 0.0 | (a) |
| | | | | | | | | | | | | | | | |
Specialty Retail | | | | | | | | | | | | | |
Industria de Diseno Textil SA | | | (1,162 | ) | | | (32,751 | ) | | | 272 | | | | 0.0 | (a) |
| | | | | | | | | | | | | | | | |
Transportation Infrastructure | | | | | | | | | | | | | |
Aeroports de Paris | | | (55 | ) | | | (11,503 | ) | | | (80 | ) | | | (0.0 | )(a) |
Getlink | | | (15,784 | ) | | | (198,536 | ) | | | (7,872 | ) | | | (0.0 | )(a) |
| | | | | | | | | | | | | | | | |
| | | (15,839 | ) | | | (210,039 | ) | | | (7,952 | ) | | | (0.0 | )(a) |
| | | | | | | | | | | | | | | | |
Total Short Positions of Total Return Basket Swap | | | (368,400 | ) | | | (6,978,359 | ) | | | 75,900 | | | | 0.1 | (a) |
| | | | | | | | | | | | | | | | |
| | | | | | | | | | | | | | | | | | | | |
| COUNTERPARTY | | DESCRIPTION | | TERMINATION
DATE | | NOTIONAL
VALUE (1) | | | NET UNREALIZED
APPRECIATION
(DEPRECIATION) (2) | | | NET CASH
AND OTHER
RECEIVABLES
(PAYABLES) | | | VALUE | |
Bank of America | | The Fund receives the total return on a portfolio of long and short equity positions and pays or receives the net of one month LIBOR on long positions and short positions respectively, plus or minus a specified spread (rates range from 0.00% to 0.25%), which is denominated in CHF based on the local currencies of the positions within the swaps. | | 3/29/2019 | | $ | 1,099,401 | | | $ | 50,338 | | | $ | — | | | $ | 50,338 | |
| | | | | | | | | | | | | | | | | | | | |
| | | | | | | | | | | | | | | | |
| REFERENCE ENTITY | | SHARES | | | NOTIONAL
VALUE($) (1) | | | NET UNREALIZED
APPRECIATION
(DEPRECIATION)($) (2) | | | PERCENTAGE
OF NET
ASSETS (%) | |
Long Positions | | | | | |
| | | |
Common Stocks | | | | | | | | | | | | | |
Diversified Telecommunication Services | | | | | | | | | | | | | |
Sunrise Communications Group AG* (b) | | | 1,778 | | | | 156,503 | | | | (5,069 | ) | | | (0.0 | )(a) |
| | | | | | | | | | | | | | | | |
Health Care Equipment & Supplies | | | | | | | | | | | | | |
Sonova Holding AG (Registered) | | | 344 | | | | 56,101 | | | | (314 | ) | | | (0.0 | )(a) |
| | | | | | | | | | | | | | | | |
Insurance | | | | | | | | | | | | | |
Swiss Life Holding AG (Registered)* | | | 734 | | | | 276,876 | | | | 15,603 | | | | 0.0 | (a) |
| | | | | | | | | | | | | | | | |
Machinery | | | | | | | | | | | | | |
Bucher Industries AG (Registered) | | | 1,040 | | | | 286,822 | | | | (10,888 | ) | | | (0.0 | )(a) |
Georg Fischer AG (Registered) | | | 73 | | | | 67,915 | | | | 3,552 | | | | 0.0 | (a) |
OC Oerlikon Corp. AG (Registered)* | | | 24,172 | | | | 287,676 | | | | 6,073 | | | | 0.0 | (a) |
| | | | | | | | | | | | | | | | |
| | | 25,285 | | | | 642,413 | | | | (1,263 | ) | | | (0.0 | )(a) |
| | | | | | | | | | | | | | | | |
Pharmaceuticals | | | | | | | | | | | | | |
Galenica AG* (b) | | | 5,432 | | | | 291,202 | | | | 9,126 | | | | 0.0 | (a) |
| | | | | | | | | | | | | | | | |
SEE NOTES TO CONSOLIDATED FINANCIAL STATEMENTS.
| | | | | | | | |
| | | |
| OCTOBER 31, 2018 | | J.P. MORGAN EXCHANGE-TRADED FUNDS | | | | | 29 | |
JPMorgan Diversified Alternatives ETF
CONSOLIDATED SCHEDULE OF PORTFOLIO INVESTMENTS
AS OF OCTOBER 31, 2018 (continued)
| | | | | | | | | | | | | | | | |
| REFERENCE ENTITY | | SHARES | | | NOTIONAL
VALUE($) (1) | | | NET UNREALIZED
APPRECIATION
(DEPRECIATION)($) (2) | | | PERCENTAGE
OF NET
ASSETS (%) | |
Long Positions — continued | | | | | |
| | | |
Common Stocks — continued | | | | | | | | | | | | | |
Pharmaceuticals — continued | | | | | | | | | | | | | |
Roche Holding AG | | | 92 | | | | 22,398 | | | | 89 | | | | 0.0 | (a) |
| | | | | | | | | | | | | | | | |
| | | 5,524 | | | | 313,600 | | | | 9,215 | | | | 0.0 | (a) |
| | | | | | | | | | | | | | | | |
Real Estate Management & Development | | | | | | | | | | | | | |
PSP Swiss Property AG (Registered) | | | 184 | | | | 17,754 | | | | (26 | ) | | | (0.0 | )(a) |
Swiss Prime Site AG (Registered)* | | | 254 | | | | 20,610 | | | | (9 | ) | | | (0.0 | )(a) |
| | | | | | | | | | | | | | | | |
| | | 438 | | | | 38,364 | | | | (35 | ) | | | (0.0 | )(a) |
| | | | | | | | | | | | | | | | |
Total Long Positions of Total Return Basket Swap | | | 34,103 | | | | 1,483,857 | | | | 18,137 | | | | 0.0 | (a) |
| | | | | | | | | | | | | | | | |
| |
Short Positions | | | | | |
| | | |
Common Stocks | | | | | | | | | | | | | |
Chemicals | | | | | | | | | | | | | |
Clariant AG (Registered)* | | | (714 | ) | | | (15,389 | ) | | | (19 | ) | | | (0.0 | )(a) |
EMS-Chemie Holding AG (Registered) | | | (44 | ) | | | (24,242 | ) | | | 6 | | | | 0.0 | (a) |
| | | | | | | | | | | | | | | | |
| | | (758 | ) | | | (39,631 | ) | | | (13 | ) | | | (0.0 | )(a) |
| | | | | | | | | | | | | | | | |
Household Durables | | | | | | | | | | | | | |
Forbo Holding AG (Registered) | | | (111 | ) | | | (162,925 | ) | | | 1,651 | | | | 0.0 | (a) |
| | | | | | | | | | | | | | | | |
Machinery | | | | | | | | | | | | | |
Schindler Holding AG | | | (178 | ) | | | (37,534 | ) | | | (80 | ) | | | (0.0 | )(a) |
| | | | | | | | | | | | | | | | |
Marine | | | | | | | | | | | | | |
Kuehne + Nagel International AG (Registered) | | | (100 | ) | | | (13,898 | ) | | | 37 | | | | 0.0 | (a) |
| | | | | | | | | | | | | | | | |
Semiconductors & Semiconductor Equipment | | | | | | | | | | | | | |
ams AG* | | | (3,349 | ) | | | (130,468 | ) | | | 30,606 | | | | 0.0 | (a) |
| | | | | | | | | | | | | | | | |
Total Short Positions of Total Return Basket Swap | | | (4,496 | ) | | | (384,456 | ) | | | 32,201 | | | | 0.0 | (a) |
| | | | | | | | | | | | | | | | |
Total of Long and Short Positions of Total Return Basket Swap | | | 29,607 | | | | 1,099,401 | | | | 50,338 | | | | 0.0 | (a) |
| | | | | | | | | | | | | | | | |
| | | | | | | | | | | | | | | | | | | | |
| COUNTERPARTY | | DESCRIPTION | | TERMINATION
DATE | | NOTIONAL
VALUE (1) | | | NET UNREALIZED
APPRECIATION
(DEPRECIATION) (2) | | | NET CASH
AND OTHER
RECEIVABLES
(PAYABLES) | | | VALUE | |
Bank of America | | The Fund receives the total return on a portfolio of long and short equity positions and pays or receives the net of one month LIBOR on long positions and short positions respectively, plus or minus a specified spread (rates range from (3.50)% to 0.35%), which is denominated in JPY based on the local currencies of the positions within the swaps. | | 12/11/2018 –
11/19/2019 | | $ | (5,421,379 | ) | | $ | 151,098 | | | $ | — | | | $ | 151,098 | |
| | | | | | | | | | | | | | | | | | | | |
| | | | | | | | | | | | | | | | |
| REFERENCE ENTITY | | SHARES | | | NOTIONAL
VALUE($) (1) | | | NET UNREALIZED
APPRECIATION
(DEPRECIATION)($) (2) | | | PERCENTAGE
OF NET
ASSETS (%) | |
Long Positions | | | | | | | | | | | | | | | | |
| | | | |
Common Stocks | | | | | | | | | | | | | | | | |
Chemicals | | | | | | | | | | | | | | | | |
Mitsubishi Chemical Holdings Corp. | | | 10,900 | | | | 84,970 | | | | (4,319 | ) | | | (0.0 | )(a) |
Mitsubishi Gas Chemical Co., Inc. | | | 4,100 | | | | 68,823 | | | | (3,740 | ) | | | (0.0 | )(a) |
| | | | | | | | | | | | | | | | |
| | | 15,000 | | | | 153,793 | | | | (8,059 | ) | | | (0.0 | )(a) |
| | | | | | | | | | | | | | | | |
SEE NOTES TO CONSOLIDATED FINANCIAL STATEMENTS.
| | | | | | |
| | | |
| 30 | | | | J.P. MORGAN EXCHANGE-TRADED FUNDS | | OCTOBER 31, 2018 |
| | | | | | | | | | | | | | | | |
| REFERENCE ENTITY | | SHARES | | | NOTIONAL
VALUE($) (1) | | | NET UNREALIZED
APPRECIATION
(DEPRECIATION)($) (2) | | | PERCENTAGE
OF NET
ASSETS (%) | |
Long Positions — continued | | | | | |
| | | |
Common Stocks — continued | | | | | | | | | | | | | |
Construction & Engineering | | | | | | | | | | | | | | | | |
Taisei Corp. | | | 2,200 | | | | 94,091 | | | | (3,982 | ) | | | (0.0 | )(a) |
| | | | | | | | | | | | | | | | |
Diversified Telecommunication Services | | | | | | | | | | | | | | | | |
Nippon Telegraph & Telephone Corp. | | | 600 | | | | 24,743 | | | | (1,818 | ) | | | (0.0 | )(a) |
| | | | | | | | | | | | | | | | |
Interactive Media & Services | | | | | | | | | | | | | | | | |
Mixi, Inc. | | | 2,800 | | | | 61,180 | | | | (2,793 | ) | | | (0.0 | )(a) |
| | | | | | | | | | | | | | | | |
Oil, Gas & Consumable Fuels | | | | | | | | | | | | | | | | |
JXTG Holdings, Inc. | | | 14,700 | | | | 99,327 | | | | (4,843 | ) | | | (0.0 | )(a) |
| | | | | | | | | | | | | | | | |
Pharmaceuticals | | | | | | | | | | | | | | | | |
Astellas Pharma, Inc. | | | 8,800 | | | | 135,962 | | | | (11,322 | ) | | | (0.0 | )(a) |
Shionogi & Co. Ltd. | | | 2,700 | | | | 172,648 | | | | (3,755 | ) | | | (0.0 | )(a) |
| | | | | | | | | | | | | | | | |
| | | 11,500 | | | | 308,610 | | | | (15,077 | ) | | | (0.0 | )(a) |
| | | | | | | | | | | | | | | | |
Trading Companies & Distributors | | | | | | | | | | | | | | | | |
Sumitomo Corp. | | | 8,700 | | | | 131,950 | | | | (4,292 | ) | | | (0.0 | )(a) |
| | | | | | | | | | | | | | | | |
Wireless Telecommunication Services | | | | | | | | | | | | | | | | |
NTT DOCOMO, Inc. | | | 5,200 | | | | 128,954 | | | | (5,268 | ) | | | (0.0 | )(a) |
| | | | | | | | | | | | | | | | |
Total Long Positions of Total Return Basket Swap | | | 60,700 | | | | 1,002,648 | | | | (46,132 | ) | | | 0.0 | (a) |
| | | | | | | | | | | | | | | | |
| | | | |
Short Positions | | | | | | | | | | | | | | | | |
| | | | |
Common Stocks | | | | | | | | | | | | | | | | |
Auto Components | | | | | | | | | | | | | | | | |
Toyo Tire & Rubber Co. Ltd. | | | (1,600 | ) | | | (26,691 | ) | | | (1,562 | ) | | | (0.0 | )(a) |
| | | | | | | | | | | | | | | | |
Banks | | | | | | | | | | | | | | | | |
Japan Post Bank Co. Ltd. | | | (16,800 | ) | | | (195,867 | ) | | | (5,428 | ) | | | (0.0 | )(a) |
| | | | | | | | | | | | | | | | |
Chemicals | | | | | | | | | | | | | | | | |
Air Water, Inc. | | | (11,900 | ) | | | (192,769 | ) | | | (5,969 | ) | | | (0.0 | )(a) |
Kansai Paint Co. Ltd. | | | (9,600 | ) | | | (141,852 | ) | | | 6,527 | | | | 0.0 | (a) |
Toray Industries, Inc. | | | (27,600 | ) | | | (195,775 | ) | | | 5,094 | | | | 0.0 | (a) |
| | | | | | | | | | | | | | | | |
| | | (49,100 | ) | | | (530,396 | ) | | | 5,652 | | | | 0.0 | (a) |
| | | | | | | | | | | | | | | | |
Commercial Services & Supplies | | | | | | | | | | | | | | | | |
Park24 Co. Ltd. | | | (7,700 | ) | | | (202,573 | ) | | | 18,529 | | | | 0.0 | (a) |
| | | | | | | | | | | | | | | | |
Construction & Engineering | | | | | | | | | | | | | | | | |
JGC Corp. | | | (9,000 | ) | | | (174,212 | ) | | | 17,617 | | | | 0.0 | (a) |
| | | | | | | | | | | | | | | | |
Consumer Finance | | | | | | | | | | | | | | | | |
Aiful Corp.* | | | (67,200 | ) | | | (177,232 | ) | | | 18,111 | | | | 0.0 | (a) |
| | | | | | | | | | | | | | | | |
Electric Utilities | | | | | | | | | | | | | | | | |
Hokkaido Electric Power Co., Inc. | | | (34,300 | ) | | | (200,185 | ) | | | 18,075 | | | | 0.0 | (a) |
| | | | | | | | | | | | | | | | |
Electronic Equipment, Instruments & Components | | | | | | | | | | | | | | | | |
Alps Electric Co. Ltd. | | | (7,800 | ) | | | (183,868 | ) | | | 6,440 | | | | 0.0 | (a) |
Murata Manufacturing Co. Ltd. | | | (1,200 | ) | | | (186,762 | ) | | | (13,305 | ) | | | (0.0 | )(a) |
| | | | | | | | | | | | | | | | |
| | | (9,000 | ) | | | (370,630 | ) | | | (6,865 | ) | | | (0.0 | )(a) |
| | | | | | | | | | | | | | | | |
Food & Staples Retailing | | | | | | | | | | | | | |
Aeon Co. Ltd. | | | (8,500 | ) | | | (195,094 | ) | | | 2,463 | | | | 0.0 | (a) |
Tsuruha Holdings, Inc. | | | (1,700 | ) | | | (177,429 | ) | | | 4,420 | | | | 0.0 | (a) |
| | | | | | | | | | | | | | | | |
| | | (10,200 | ) | | | (372,523 | ) | | | 6,883 | | | | 0.0 | (a) |
| | | | | | | | | | | | | | | | |
Food Products | | | | | | | | | | | | | |
Nissin Foods Holdings Co. Ltd. | | | (3,100 | ) | | | (199,886 | ) | | | 2,870 | | | | 0.0 | (a) |
Yamazaki Baking Co. Ltd.* | | | (10,700 | ) | | | (192,869 | ) | | | (880 | ) | | | (0.0 | )(a) |
| | | | | | | | | | | | | | | | |
| | | (13,800 | ) | | | (392,755 | ) | | | 1,990 | | | | 0.0 | (a) |
| | | | | | | | | | | | | | | | |
SEE NOTES TO CONSOLIDATED FINANCIAL STATEMENTS.
| | | | | | | | |
| | | |
| OCTOBER 31, 2018 | | J.P. MORGAN EXCHANGE-TRADED FUNDS | | | | | 31 | |
JPMorgan Diversified Alternatives ETF
CONSOLIDATED SCHEDULE OF PORTFOLIO INVESTMENTS
AS OF OCTOBER 31, 2018 (continued)
| | | | | | | | | | | | | | | | |
| REFERENCE ENTITY | | SHARES | | | NOTIONAL
VALUE($) (1) | | | NET UNREALIZED
APPRECIATION
(DEPRECIATION)($) (2) | | | PERCENTAGE
OF NET
ASSETS (%) | |
| | | | |
Short Positions — continued | | | | | | | | | | | | | | | | |
| | | | |
Common Stocks — continued | | | | | | | | | | | | | | | | |
Hotels, Restaurants & Leisure | | | | | | | | | | | | | |
HIS Co. Ltd. | | | (5,000 | ) | | | (152,282 | ) | | | 7,277 | | | | 0.0 | (a) |
Kyoritsu Maintenance Co. Ltd. | | | (3,200 | ) | | | (142,166 | ) | | | (7,881 | ) | | | (0.0 | )(a) |
Resorttrust, Inc. | | | (1,900 | ) | | | (29,261 | ) | | | (1,481 | ) | | | (0.0 | )(a) |
| | | | | | | | | | | | | | | | |
| | | (10,100 | ) | | | (323,709 | ) | | | (2,085 | ) | | | (0.0 | )(a) |
| | | | | | | | | | | | | | | | |
Household Durables | | | | | | | | | | | | | |
Fujitsu General Ltd. | | | (2,500 | ) | | | (37,450 | ) | | | (1,971 | ) | | | (0.0 | )(a) |
| | | | | | | | | | | | | | | | |
Industrial Conglomerates | | | | | | | | | | | | | |
Keihan Holdings Co. Ltd. | | | (5,900 | ) | | | (223,882 | ) | | | (1,917 | ) | | | (0.0 | )(a) |
Toshiba Corp.* | | | (6,900 | ) | | | (206,811 | ) | | | (2,565 | ) | | | (0.0 | )(a) |
| | | | | | | | | | | | | | | | |
| | | (12,800 | ) | | | (430,693 | ) | | | (4,482 | ) | | | (0.0 | )(a) |
| | | | | | | | | | | | | | | | |
Insurance | | | | | | | | | | | | | |
Japan Post Insurance Co. Ltd. | | | (8,100 | ) | | | (192,916 | ) | | | 6,650 | | | | 0.0 | (a) |
| | | | | | | | | | | | | | | | |
Interactive Media & Services | | | | | | | | | | | | | |
LINE Corp.* | | | (4,700 | ) | | | (149,845 | ) | | | 17,395 | | | | 0.0 | (a) |
Yahoo Japan Corp. | | | (64,800 | ) | | | (202,163 | ) | | | 14,918 | | | | 0.0 | (a) |
| | | | | | | | | | | | | | | | |
| | | (69,500 | ) | | | (352,008 | ) | | | 32,313 | | | | 0.0 | (a) |
| | | | | | | | | | | | | | | | |
IT Services | | | | | | | | | | | | | |
GMO internet, Inc. | | | (9,300 | ) | | | (132,901 | ) | | | 621 | | | | 0.0 | (a) |
| | | | | | | | | | | | | | | | |
Machinery | | | | | | | | | | | | | |
FANUC Corp. | | | (1,200 | ) | | | (208,761 | ) | | | (4,668 | ) | | | (0.0 | )(a) |
Nabtesco Corp. | | | (8,500 | ) | | | (186,582 | ) | | | (9,466 | ) | | | (0.0 | )(a) |
| | | | | | | | | | | | | | | | |
| | | (9,700 | ) | | | (395,343 | ) | | | (14,134 | ) | | | (0.0 | )(a) |
| | | | | | | | | | | | | | | | |
Marine | | | | | | | | | | | | | |
Kawasaki Kisen Kaisha Ltd.* | | | (10,000 | ) | | | (133,255 | ) | | | 19,712 | | | | 0.0 | (a) |
Mitsui OSK Lines Ltd. | | | (7,100 | ) | | | (172,562 | ) | | | 3,813 | | | | 0.0 | (a) |
Nippon Yusen KK | | | (11,300 | ) | | | (182,223 | ) | | | 8,355 | | | | 0.0 | (a) |
| | | | | | | | | | | | | | | | |
| | | (28,400 | ) | | | (488,040 | ) | | | 31,880 | | | | 0.0 | (a) |
| | | | | | | | | | | | | | | | |
Metals & Mining | | | | | | | | | | | | | |
Dowa Holdings Co. Ltd. | | | (6,500 | ) | | | (189,171 | ) | | | (4,028 | ) | | | (0.0 | )(a) |
| | | | | | | | | | | | | | | | |
Multiline Retail | | | | | | | | | | | | | |
Marui Group Co. Ltd. | | | (7,200 | ) | | | (155,029 | ) | | | 1,214 | | | | 0.0 | (a) |
| | | | | | | | | | | | | | | | |
Road & Rail | | | | | | | | | | | | | |
Keio Corp. | | | (3,700 | ) | | | (200,962 | ) | | | 48 | | | | 0.0 | (a) |
Odakyu Electric Railway Co. Ltd. | | | (8,400 | ) | | | (177,582 | ) | | | 11,806 | | | | 0.0 | (a) |
Tokyu Corp. | | | (12,700 | ) | | | (209,810 | ) | | | 3,142 | | | | 0.0 | (a) |
| | | | | | | | | | | | | | | | |
| | | (24,800 | ) | | | (588,354 | ) | | | 14,996 | | | | 0.0 | (a) |
| | | | | | | | | | | | | | | | |
Semiconductors & Semiconductor Equipment | | | | | | | | | | | | | |
Renesas Electronics Corp.* | | | (29,100 | ) | | | (153,298 | ) | | | 14,078 | | | | 0.0 | (a) |
| | | | | | | | | | | | | | | | |
Trading Companies & Distributors | | | | | | | | | | | | | |
MonotaRO Co. Ltd. | | | (7,300 | ) | | | (160,940 | ) | | | 35,089 | | | | 0.1 | |
| | | | | | | | | | | | | | | | |
Transportation Infrastructure | | | | | | | | | | | | | |
Mitsubishi Logistics Corp. | | | (7,900 | ) | | | (181,111 | ) | | | 14,087 | | | | 0.0 | (a) |
| | | | | | | | | | | | | | | | |
Total Short Positions of Total Return Basket Swap | | | (451,900 | ) | | | (6,424,027 | ) | | | 197,230 | | | | 0.1 | |
| | | | | | | | | | | | | | | | |
Total of Long and Short Positions of Total Return Basket Swap | | | (391,200 | ) | | | (5,421,379 | ) | | | 151,098 | | | | 0.1 | |
| | | | | | | | | | | | | | | | |
SEE NOTES TO CONSOLIDATED FINANCIAL STATEMENTS.
| | | | | | |
| | | |
| 32 | | | | J.P. MORGAN EXCHANGE-TRADED FUNDS | | OCTOBER 31, 2018 |
| | | | | | | | | | | | | | | | | | | | |
| COUNTERPARTY | | DESCRIPTION | | TERMINATION
DATE | | NOTIONAL
VALUE (1) | | | NET UNREALIZED
APPRECIATION
(DEPRECIATION) (2) | | | NET CASH
AND OTHER
RECEIVABLES
(PAYABLES) | | | VALUE | |
Bank of America | | The Fund receives the total return on a portfolio of long and short equity positions and pays or receives the net of one month BBR on long positions and short positions respectively, plus or minus a specified spread (rates range from (0.35)% to 0.00%), which is denominated in AUD based on the local currencies of the positions within the swaps. | | 11/18/2019 | | $ | 311,653 | | | $ | (1,560 | ) | | $ | — | | | $ | (1,560 | ) |
| | | | | | | | | | | | | | | | | | | | |
| | | | | | | | | | | | | | | | |
| REFERENCE ENTITY | | SHARES | | | NOTIONAL
VALUE($) (1) | | | NET UNREALIZED
APPRECIATION
(DEPRECIATION)($) (2) | | | PERCENTAGE
OF NET
ASSETS (%) | |
Long Positions | | | | | |
| | | |
Common Stocks | | | | | | | | | | | | | |
Food & Staples Retailing | | | | | | | | | | | | | |
Metcash Ltd. | | | 39,581 | | | | 77,360 | | | | 279 | | | | 0.0 | (a) |
| | | | | | | | | | | | | | | | |
Media | | | | | | | | | | | | | |
Nine Entertainment Co. Holdings Ltd. | | | 86,032 | | | | 103,322 | | | | 361 | | | | 0.0 | (a) |
| | | | | | | | | | | | | | | | |
Metals & Mining | | | | | | | | | | | | | |
Sandfire Resources NL | | | 46,206 | | | | 218,479 | | | | 886 | | | | 0.0 | (a) |
| | | | | | | | | | | | | | | | |
Oil, Gas & Consumable Fuels | | | | | | | | | | | | | |
Beach Energy Ltd. | | | 223,950 | | | | 278,951 | | | | (167 | ) | | | (0.0 | )(a) |
Santos Ltd. | | | 54,393 | | | | 255,298 | | | | (465 | ) | | | (0.0 | )(a) |
Whitehaven Coal Ltd. | | | 26,081 | | | | 90,091 | | | | 515 | | | | 0.0 | (a) |
| | | | | | | | | | | | | | | | |
| | | 304,424 | | | | 624,340 | | | | (117 | ) | | | (0.0 | )(a) |
| | | | | | | | | | | | | | | | |
Total Long Positions of Total Return Basket Swap | | | 476,243 | | | | 1,023,501 | | | | 1,409 | | | | 0.0 | (a) |
| | | | | | | | | | | | | | | | |
| |
Short Positions | | | | | |
| | | |
Common Stocks | | | | | | | | | | | | | |
Building Products | | | | | | | | | | | | | |
Reliance Worldwide Corp. Ltd. | | | (59,257 | ) | | | (211,105 | ) | | | (20,329 | ) | | | (0.0 | )(a) |
| | | | | | | | | | | | | | | | |
Chemicals | | | | | | | | | | | | | |
Nufarm Ltd. | | | (42,066 | ) | | | (170,109 | ) | | | 3,831 | | | | 0.0 | (a) |
| | | | | | | | | | | | | | | | |
Hotels, Restaurants & Leisure | | | | | | | | | | | | | |
Domino’s Pizza Enterprises Ltd. | | | (3,517 | ) | | | (134,795 | ) | | | 364 | | | | 0.0 | (a) |
Star Entertainment Grp Ltd. (The) | | | (7,686 | ) | | | (25,919 | ) | | | (268 | ) | | | (0.0 | )(a) |
| | | | | | | | | | | | | | | | |
| | | (11,203 | ) | | | (160,714 | ) | | | 96 | | | | 0.0 | (a) |
| | | | | | | | | | | | | | | | |
IT Services | | | | | | | | | | | | | |
NEXTDC Ltd.* | | | (40,648 | ) | | | (169,920 | ) | | | 13,433 | | | | 0.0 | (a) |
| | | | | | | | | | | | | | | | |
Total Short Positions of Total Return Basket Swap | | | (153,174 | ) | | | (711,848 | ) | | | (2,969 | ) | | | 0.0 | (a) |
| | | | | | | | | | | | | | | | |
Total of Long and Short Positions of Total Return Basket Swap | | | 323,069 | | | | 311,653 | | | | (1,560 | ) | | | 0.0 | (a) |
| | | | | | | | | | | | | | | | |
SEE NOTES TO CONSOLIDATED FINANCIAL STATEMENTS.
| | | | | | | | |
| | | |
| OCTOBER 31, 2018 | | J.P. MORGAN EXCHANGE-TRADED FUNDS | | | | | 33 | |
JPMorgan Diversified Alternatives ETF
CONSOLIDATED SCHEDULE OF PORTFOLIO INVESTMENTS
AS OF OCTOBER 31, 2018 (continued)
| | | | | | | | | | | | | | | | | | | | |
| COUNTERPARTY | | DESCRIPTION | | TERMINATION
DATE | | NOTIONAL
VALUE (1) | | | NET UNREALIZED
APPRECIATION
(DEPRECIATION) (2) | | | NET CASH
AND OTHER
RECEIVABLES
(PAYABLES) | | | VALUE | |
Bank of America | | The Fund receives the total return on a portfolio of long equity positions and pays or receives the net of one month LIBOR on long positions, plus or minus a specified spread (rates range from 0.00% to 0.25%), which is denominated in GBP based on the local currencies of the positions within the swaps. | | 3/29/2019 | | $ | 1,068,570 | | | $ | 46,670 | | | $ | — | | | $ | 46,670 | |
| | | | | | | | | | | | | | | | | | | | |
| | | | | | | | | | | | | | | | |
| REFERENCE ENTITY | | SHARES | | | NOTIONAL
VALUE($) (1) | | | NET UNREALIZED
APPRECIATION
(DEPRECIATION)($) (2) | | | PERCENTAGE
OF NET
ASSETS (%) | |
Long Positions | | | | | |
| | | |
Common Stocks | | | | | | | | | | | | | |
Biotechnology | | | | | | | | | | | | | |
Shire plc | | | 14,161 | | | | 854,629 | | | | 35,988 | | | | 0.0 | (a) |
| | | | | | | | | | | | | | | | |
Capital Markets | | | | | | | | | | | | | |
NEX Group plc | | | 14,752 | | | | 213,941 | | | | 10,682 | | | | 0.0 | (a) |
Sole Realisation Co. plc*‡ | | | 153 | | | | — | | | | — | | | | 0.0 | |
| | | | | | | | | | | | | | | | |
| | | 14,905 | | | | 213,941 | | | | 10,682 | | | | 0.0 | (a) |
| | | | | | | | | | | | | | | | |
Total Long Positions of Total Return Basket Swap | | | 29,066 | | | | 1,068,570 | | | | 46,670 | | | | 0.0 | (a) |
| | | | | | | | | | | | | | | | |
| | | | | | | | | | | | | | | | | | | | |
| COUNTERPARTY | | DESCRIPTION | | TERMINATION
DATE | | NOTIONAL
VALUE (1) | | | NET UNREALIZED
APPRECIATION
(DEPRECIATION) (2) | | | NET CASH
AND OTHER
RECEIVABLES
(PAYABLES) | | | VALUE | |
Bank of America | | The Fund receives the total return on a portfolio of long and short equity positions and pays or receives the net of one month BA on long positions and short positions respectively, which is denominated in CAD based on the local currencies of the positions within the swaps. | | 12/18/2019 | | $ | 25,835 | | | $ | (565 | ) | | $ | — | | | $ | (565 | ) |
| | | | | | | | | | | | | | | | | | | | |
| | | | | | | | | | | | | | | | |
| REFERENCE ENTITY | | SHARES | | | NOTIONAL
VALUE($) (1) | | | NET UNREALIZED
APPRECIATION
(DEPRECIATION)($) (2) | | | PERCENTAGE
OF NET
ASSETS (%) | |
Long Position | | | | | |
| | | |
Common Stocks | | | | | | | | | | | | | |
Oil, Gas & Consumable Fuels | | | | | | | | | | | | | |
Enbridge Income Fund Holdings, Inc. | | | 7,737 | | | | 179,078 | | | | (1,249 | ) | | | (0.0 | )(a) |
| | | | | | | | | | | | | | | | |
| |
Short Position | | | | | |
| | | |
Common Stocks | | | | | | | | | | | | | |
Oil, Gas & Consumable Fuels | | | | | | | | | | | | | |
Enbridge, Inc. | | | (4,918 | ) | | | (153,243 | ) | | | 684 | | | | 0.0 | (a) |
| | | | | | | | | | | | | | | | |
Total of Long and Short Positions of Total Return Basket Swap | | | 2,819 | | | | 25,835 | | | | (565 | ) | | | 0.0 | (a) |
| | | | | | | | | | | | | | | | |
SEE NOTES TO CONSOLIDATED FINANCIAL STATEMENTS.
| | | | | | |
| | | |
| 34 | | | | J.P. MORGAN EXCHANGE-TRADED FUNDS | | OCTOBER 31, 2018 |
| | | | | | | | | | | | | | | | | | | | |
| COUNTERPARTY | | DESCRIPTION | | TERMINATION
DATE | | NOTIONAL
VALUE (1) | | | NET UNREALIZED
APPRECIATION
(DEPRECIATION) (2) | | | NET CASH
AND OTHER
RECEIVABLES
(PAYABLES) | | | VALUE | |
Bank of America | | The Fund receives the total return on a portfolio of short equity positions and pays or receives the net of one month LIBOR on short positions, plus or minus a specified spread (rates range from (0.35)% to 0.00%), which is denominated in JPY based on the local currencies of the positions within the swaps. | | 5/27/2019 | | $ | (489,223 | ) | | $ | 2,806 | | | $ | — | | | $ | 2,806 | |
| | | | | | | | | | | | | | | | | | | | |
| | | | | | | | | | | | | | | | |
| REFERENCE ENTITY | | SHARES | | | NOTIONAL
VALUE($) (1) | | | NET UNREALIZED
APPRECIATION
(DEPRECIATION)($) (2) | | | PERCENTAGE
OF NET
ASSETS (%) | |
Short Position | | | | | |
| | | |
Common Stocks | | | | | | | | | | | | | |
Pharmaceuticals | | | | | | | | | | | | | |
Takeda Pharmaceutical Co. Ltd. | | | (11,800 | ) | | | (489,223 | ) | | | 2,806 | | | | 0.0 | (a) |
| | | | | | | | | | | | | | | | |
| | | | | | | | | | | | | | | | | | | | |
| COUNTERPARTY | | DESCRIPTION | | TERMINATION
DATE | | NOTIONAL
VALUE (1) | | | NET UNREALIZED
APPRECIATION
(DEPRECIATION) (2) | | | NET CASH
AND OTHER
RECEIVABLES
(PAYABLES) | | | VALUE | |
Bank of America | | The Fund receives the total return on a portfolio of long equity positions and pays or receives the net of one month BBR on long positions, which is denominated in AUD based on the local currencies of the positions within the swaps. | | 11/18/2019 | | $ | 658,861 | | | $ | 2,694 | | | $ | — | | | $ | 2,694 | |
| | | | | | | | | | | | | | | | | | | | |
| | | | | | | | | | | | | | | | |
| REFERENCE ENTITY | | SHARES | | | NOTIONAL
VALUE($) (1) | | | NET UNREALIZED
APPRECIATION
(DEPRECIATION)($) (2) | | | PERCENTAGE
OF NET
ASSETS (%) | |
Long Position | | | | | |
| | | |
Common Stocks | | | | | | | | | | | | | |
Health Care Providers & Services | | | | | | | | | | | | | |
Healthscope Ltd. | | | 439,143 | | | | 658,861 | | | | 2,694 | | | | 0.0 | (a) |
| | | | | | | | | | | | | | | | |
| | | | | | | | | | | | | | | | | | | | |
| COUNTERPARTY | | DESCRIPTION | | TERMINATION
DATE | | NOTIONAL
VALUE (1) | | | NET UNREALIZED
APPRECIATION
(DEPRECIATION) (2) | | | NET CASH
AND OTHER
RECEIVABLES
(PAYABLES) | | | VALUE | |
Bank of America | | The Fund receives the total return on a portfolio of long equity positions and pays or receives the net of one month LIBOR on long positions, which is denominated in USD based on the local currencies of the positions within the swaps. | | 11/18/2019 | | $ | 65 | | | $ | (334 | ) | | $ | — | | | $ | (334 | ) |
| | | | | | | | | | | | | | | | | | | | |
| | | | | | | | | | | | | | | | |
| REFERENCE ENTITY | | SHARES | | | NOTIONAL
VALUE($) (1) | | | NET UNREALIZED
APPRECIATION
(DEPRECIATION)($) (2) | | | PERCENTAGE
OF NET
ASSETS (%) | |
Long Position | | | | | |
| | | |
Common Stocks | | | | | | | | | | | | | |
Media | | | | | | | | | | | | | |
Media General, Inc. CVR‡ | | | 1,329 | | | | 65 | | | | (334 | ) | | | 0.0 | (a) |
| | | | | | | | | | | | | | | | |
SEE NOTES TO CONSOLIDATED FINANCIAL STATEMENTS.
| | | | | | | | |
| | | |
| OCTOBER 31, 2018 | | J.P. MORGAN EXCHANGE-TRADED FUNDS | | | | | 35 | |
JPMorgan Diversified Alternatives ETF
CONSOLIDATED SCHEDULE OF PORTFOLIO INVESTMENTS
AS OF OCTOBER 31, 2018 (continued)
| | | | | | | | | | | | | | | | | | | | |
| COUNTERPARTY | | DESCRIPTION | | TERMINATION
DATE | | NOTIONAL
VALUE (1) | | | NET UNREALIZED
APPRECIATION
(DEPRECIATION) (2) | | | NET CASH
AND OTHER
RECEIVABLES
(PAYABLES) | | | VALUE | |
UBS | | The Fund receives the total return on a portfolio of short equity positions and pays or receives the net of one month LIBOR on short positions respectively, plus or minus a specified spread (rates range from 0.00% to 0.25%), which is denominated in USD based on the local currencies of the positions within the swaps. | | 9/12/2019 | | $ | (29,442,419 | ) | | $ | 664,398 | | | $ | 2,242,982 | | | $ | 2,907,380 | |
| | | | | | | | | | | | | | | | | | | | |
| | | | | | | | | | | | | | | | |
| REFERENCE ENTITY | | SHARES | | | NOTIONAL
VALUE($) (1) | | | NET UNREALIZED
APPRECIATION
(DEPRECIATION)($) (2) | | | PERCENTAGE
OF NET
ASSETS (%) | |
Short Positions | | | | | |
| | | |
Common Stocks | | | | | | | | | | | | | |
Aerospace & Defense | | | | | | | | | | | | | |
Cubic Corp. | | | (3,143 | ) | | | (206,212 | ) | | | 5,563 | | | | 0.0 | (a) |
Kratos Defense & Security Solutions, Inc.* | | | (16,424 | ) | | | (205,793 | ) | | | 15,767 | | | | 0.0 | (a) |
Mercury Systems, Inc.* | | | (4,588 | ) | | | (214,994 | ) | | | (195 | ) | | | (0.0 | )(a) |
TransDigm Group, Inc.* | | | (57 | ) | | | (18,824 | ) | | | (30 | ) | | | (0.0 | )(a) |
Triumph Group, Inc. | | | (11,522 | ) | | | (210,276 | ) | | | 1,208 | | | | 0.0 | (a) |
| | | | | | | | | | | | | | | | |
| | | (35,734 | ) | | | (856,099 | ) | | | 22,313 | | | | 0.0 | (a) |
| | | | | | | | | | | | | | | | |
Air Freight & Logistics | | | | | | | | | | | | | |
Air Transport Services Group, Inc.* | | | (10,753 | ) | | | (210,759 | ) | | | 8,736 | | | | 0.0 | (a) |
United Parcel Service, Inc. | | | (1,914 | ) | | | (203,917 | ) | | | 15,676 | | | | 0.0 | (a) |
| | | | | | | | | | | | | | | | |
| | | (12,667 | ) | | | (414,676 | ) | | | 24,412 | | | | 0.0 | (a) |
| | | | | | | | | | | | | | | | |
Airlines | | | | | | | | | | | | | |
American Airlines Group, Inc. | | | (5,994 | ) | | | (210,269 | ) | | | (19,349 | ) | | | (0.0 | )(a) |
| | | | | | | | | | | | | | | | |
Auto Components | | | | | | | | | | | | | |
Cooper Tire & Rubber Co. | | | (5,207 | ) | | | (160,844 | ) | | | (32,513 | ) | | | (0.0 | )(a) |
Gentherm, Inc.* | | | (3,761 | ) | | | (164,130 | ) | | | (17,980 | ) | | | (0.0 | )(a) |
Veoneer, Inc.* | | | (4,068 | ) | | | (136,604 | ) | | | 21,948 | | | | 0.0 | (a) |
| | | | | | | | | | | | | | | | |
| | | (13,036 | ) | | | (461,578 | ) | | | (28,545 | ) | | | (0.0 | )(a) |
| | | | | | | | | | | | | | | | |
Banks | | | | | | | | | | | | | |
First Republic Bank | | | (2,307 | ) | | | (209,914 | ) | | | (2,330 | ) | | | (0.0 | )(a) |
| | | | | | | | | | | | | | | | |
Beverages | | | | | | | | | | | | | |
Brown-Forman Corp. | | | (4,466 | ) | | | (206,954 | ) | | | 4,924 | | | | 0.0 | (a) |
Coca-Cola Bottling Co. Consolidated | | | (1,201 | ) | | | (207,329 | ) | | | (6,030 | ) | | | (0.0 | )(a) |
National Beverage Corp.* | | | (1,993 | ) | | | (184,253 | ) | | | 15,884 | | | | 0.0 | (a) |
| | | | | | | | | | | | | | | | |
| | | (7,660 | ) | | | (598,536 | ) | | | 14,778 | | | | 0.0 | (a) |
| | | | | | | | | | | | | | | | |
Capital Markets | | | | | | | | | | | | | |
Cboe Global Markets, Inc. | | | (1,856 | ) | | | (209,450 | ) | | | (17,725 | ) | | | (0.0 | )(a) |
MarketAxess Holdings, Inc. | | | (956 | ) | | | (200,444 | ) | | | (14,292 | ) | | | (0.0 | )(a) |
WisdomTree Investments, Inc. | | | (26,430 | ) | | | (205,361 | ) | | | (11,629 | ) | | | (0.0 | )(a) |
| | | | | | | | | | | | | | | | |
| | | (29,242 | ) | | | (615,255 | ) | | | (43,646 | ) | | | (0.0 | )(a) |
| | | | | | | | | | | | | | | | |
Chemicals | | | | | | | | | | | | | |
Albemarle Corp. | | | (2,139 | ) | | | (212,232 | ) | | | (7,148 | ) | | | (0.0 | )(a) |
GCP Applied Technologies, Inc.* | | | (7,700 | ) | | | (199,969 | ) | | | (11,165 | ) | | | (0.0 | )(a) |
International Flavors & Fragrances, Inc. | | | (1,423 | ) | | | (205,851 | ) | | | (11,100 | ) | | | (0.0 | )(a) |
NewMarket Corp. | | | (536 | ) | | | (206,875 | ) | | | (2,846 | ) | | | (0.0 | )(a) |
PQ Group Holdings, Inc.* | | | (13,415 | ) | | | (215,311 | ) | | | 536 | | | | 0.0 | (a) |
RPM International, Inc. | | | (3,332 | ) | | | (203,818 | ) | | | (5,263 | ) | | | (0.0 | )(a) |
SEE NOTES TO CONSOLIDATED FINANCIAL STATEMENTS.
| | | | | | |
| | | |
| 36 | | | | J.P. MORGAN EXCHANGE-TRADED FUNDS | | OCTOBER 31, 2018 |
| | | | | | | | | | | | | | | | |
| REFERENCE ENTITY | | SHARES | | | NOTIONAL
VALUE($) (1) | | | NET UNREALIZED
APPRECIATION
(DEPRECIATION)($) (2) | | | PERCENTAGE
OF NET
ASSETS (%) | |
Short Positions — continued | | | | | |
| | | |
Common Stocks — continued | | | | | | | | | | | | | |
Chemicals — continued | | | | | | | | | | | | | |
Valvoline, Inc. | | | (10,320 | ) | | | (205,574 | ) | | | 221 | | | | 0.0 | (a) |
| | | | | | | | | | | | | | | | |
| | | (38,865 | ) | | | (1,449,630 | ) | | | (36,765 | ) | | | (0.0 | )(a) |
| | | | | | | | | | | | | | | | |
Commercial Services & Supplies | | | | | | | | | | | | | |
ABM Industries, Inc. | | | (6,688 | ) | | | (205,656 | ) | | | 7,141 | | | | 0.0 | (a) |
Brink’s Co. (The) | | | (3,171 | ) | | | (210,301 | ) | | | (9,302 | ) | | | (0.0 | )(a) |
Covanta Holding Corp. | | | (979 | ) | | | (14,381 | ) | | | (32 | ) | | | (0.0 | )(a) |
Healthcare Services Group, Inc. | | | (592 | ) | | | (24,029 | ) | | | 492 | | | | 0.0 | (a) |
| | | | | | | | | | | | | | | | |
| | | (11,430 | ) | | | (454,367 | ) | | | (1,701 | ) | | | (0.0 | )(a) |
| | | | | | | | | | | | | | | | |
Communications Equipment | | | | | | | | | | | | | |
Acacia Communications, Inc.* | | | (4,954 | ) | | | (170,764 | ) | | | 21,401 | | | | 0.0 | (a) |
ADTRAN, Inc. | | | (15,142 | ) | | | (203,508 | ) | | | 5,575 | | | | 0.0 | (a) |
Extreme Networks, Inc.* | | | (40,654 | ) | | | (225,630 | ) | | | (14,522 | ) | | | (0.0 | )(a) |
Finisar Corp.* | | | (12,588 | ) | | | (210,094 | ) | | | 11,329 | | | | 0.0 | (a) |
Infinera Corp.* | | | (10,548 | ) | | | (58,436 | ) | | | 355 | | | | 0.0 | (a) |
ViaSat, Inc.* | | | (199 | ) | | | (12,688 | ) | | | (61 | ) | | | (0.0 | )(a) |
| | | | | | | | | | | | | | | | |
| | | (84,085 | ) | | | (881,120 | ) | | | 24,077 | | | | 0.0 | (a) |
| | | | | | | | | | | | | | | | |
Construction Materials | | | | | | | | | | | | | |
Martin Marietta Materials, Inc. | | | (1,239 | ) | | | (212,216 | ) | | | (10,174 | ) | | | (0.0 | )(a) |
Summit Materials, Inc.* | | | (16,306 | ) | | | (220,131 | ) | | | 4,790 | | | | 0.0 | (a) |
Vulcan Materials Co. | | | (2,100 | ) | | | (212,394 | ) | | | (12,445 | ) | | | (0.0 | )(a) |
| | | | | | | | | | | | | | | | |
| | | (19,645 | ) | | | (644,741 | ) | | | (17,829 | ) | | | (0.0 | )(a) |
| | | | | | | | | | | | | | | | |
Consumer Finance | | | | | | | | | | | | | |
LendingClub Corp.* | | | (25,472 | ) | | | (82,275 | ) | | | 5,449 | | | | 0.0 | (a) |
| | | | | | | | | | | | | | | | |
Diversified Telecommunication Services | | | | | | | | | |
Cincinnati Bell, Inc.* | | | (14,807 | ) | | | (210,112 | ) | | | (14,251 | ) | | | (0.0 | )(a) |
Zayo Group Holdings, Inc.* | | | (7,014 | ) | | | (209,578 | ) | | | 12,300 | | | | 0.0 | (a) |
| | | | | | | | | | | | | | | | |
| | | (21,821 | ) | | | (419,690 | ) | | | (1,951 | ) | | | (0.0 | )(a) |
| | | | | | | | | | | | | | | | |
Electronic Equipment, Instruments & Components | | | | | | | | | | | | | |
Cognex Corp. | | | (4,950 | ) | | | (212,058 | ) | | | 4,083 | | | | 0.0 | (a) |
Fitbit, Inc.* | | | (47,001 | ) | | | (222,315 | ) | | | 3,759 | | | | 0.0 | (a) |
II-VI, Inc.* | | | (5,750 | ) | | | (214,072 | ) | | | 13,136 | | | | 0.0 | (a) |
| | | | | | | | | | | | | | | | |
| | | (57,701 | ) | | | (648,445 | ) | | | 20,978 | | | | 0.0 | (a) |
| | | | | | | | | | | | | | | | |
Energy Equipment & Services | | | | | | | | | | | | | |
Baker Hughes a GE Co. | | | (7,621 | ) | | | (203,404 | ) | | | 25,724 | | | | 0.0 | (a) |
C&J Energy Services, Inc.* | | | (11,573 | ) | | | (217,341 | ) | | | 15,434 | | | | 0.0 | (a) |
Ensco plc | | | (29,805 | ) | | | (212,808 | ) | | | 26,837 | | | | 0.0 | (a) |
Forum Energy Technologies, Inc.* | | | (23,634 | ) | | | (211,761 | ) | | | 5,862 | | | | 0.0 | (a) |
Keane Group, Inc.* | | | (17,764 | ) | | | (223,293 | ) | | | (6,395 | ) | | | (0.0 | )(a) |
Patterson-UTI Energy, Inc. | | | (13,417 | ) | | | (223,259 | ) | | | (4,830 | ) | | | (0.0 | )(a) |
Select Energy Services, Inc.* | | | (21,685 | ) | | | (207,309 | ) | | | 7,787 | | | | 0.0 | (a) |
Weatherford International plc* | | | (100,840 | ) | | | (136,134 | ) | | | 28,978 | | | | 0.0 | (a) |
| | | | | | | | | | | | | | | | |
| | | (226,339 | ) | | | (1,635,309 | ) | | | 99,397 | | | | 0.0 | (a) |
| | | | | | | | | | | | | | | | |
Entertainment | | | | | | | | | | | | | |
Netflix, Inc.* | | | (278 | ) | | | (83,895 | ) | | | 1,281 | | | | 0.0 | (a) |
| | | | | | | | | | | | | | | | |
Equity Real Estate Investment Trusts (REITs) | | | | | | | | | | | | | |
Alexander & Baldwin, Inc. | | | (10,099 | ) | | | (197,334 | ) | | | 6,362 | | | | 0.0 | (a) |
| | | | | | | | | | | | | | | | |
SEE NOTES TO CONSOLIDATED FINANCIAL STATEMENTS.
| | | | | | | | |
| | | |
| OCTOBER 31, 2018 | | J.P. MORGAN EXCHANGE-TRADED FUNDS | | | | | 37 | |
JPMorgan Diversified Alternatives ETF
CONSOLIDATED SCHEDULE OF PORTFOLIO INVESTMENTS
AS OF OCTOBER 31, 2018 (continued)
| | | | | | | | | | | | | | | | |
| REFERENCE ENTITY | | SHARES | | | NOTIONAL
VALUE($) (1) | | | NET UNREALIZED
APPRECIATION
(DEPRECIATION)($) (2) | | | PERCENTAGE
OF NET
ASSETS (%) | |
Short Positions — continued | | | | | |
| | | |
Common Stocks — continued | | | | | | | | | | | | | |
Food & Staples Retailing | | | | | | | | | | | | | |
PriceSmart, Inc. | | | (3,043 | ) | | | (213,466 | ) | | | 17,971 | | | | 0.0 | (a) |
| | | | | | | | | | | | | | | | |
Food Products | | | | | | | | | | | | | |
Kraft Heinz Co. (The) | | | (3,560 | ) | | | (195,693 | ) | | | 2,029 | | | | 0.0 | (a) |
| | | | | | | | | | | | | | | | |
Gas Utilities | | | | | | | | | | | | | |
Southwest Gas Holdings, Inc. | | | (2,747 | ) | | | (212,260 | ) | | | 5,686 | | | | 0.0 | (a) |
Spire, Inc. | | | (2,810 | ) | | | (203,950 | ) | | | 3,962 | | | | 0.0 | (a) |
| | | | | | | | | | | | | | | | |
| | | (5,557 | ) | | | (416,210 | ) | | | 9,648 | | | | 0.0 | (a) |
| | | | | | | | | | | | | | | | |
Health Care Equipment & Supplies | | | | | | | | | | | | | |
Heska Corp.* | | | (1,991 | ) | | | (199,538 | ) | | | (259 | ) | | | (0.0 | )(a) |
Hologic, Inc.* | | | (5,243 | ) | | | (204,425 | ) | | | 11,063 | | | | 0.0 | (a) |
Insulet Corp.* | | | (522 | ) | | | (46,046 | ) | | | (193 | ) | | | (0.0 | )(a) |
iRhythm Technologies, Inc.* | | | (2,595 | ) | | | (200,490 | ) | | | 14,091 | | | | 0.0 | (a) |
Nevro Corp.* | | | (1,398 | ) | | | (68,166 | ) | | | 3,695 | | | | 0.0 | (a) |
Penumbra, Inc.* | | | (1,552 | ) | | | (211,072 | ) | | | 7,512 | | | | 0.0 | (a) |
ViewRay, Inc.* | | | (24,600 | ) | | | (212,790 | ) | | | (14,802 | ) | | | (0.0 | )(a) |
Wright Medical Group NV* | | | (4,580 | ) | | | (123,568 | ) | | | 5,464 | | | | 0.0 | (a) |
| | | | | | | | | | | | | | | | |
| | | (42,481 | ) | | | (1,266,095 | ) | | | 26,571 | | | | 0.0 | (a) |
| | | | | | | | | | | | | | | | |
Health Care Technology | | | | | | | | | | | | | |
Evolent Health, Inc.* | | | (7,093 | ) | | | (157,465 | ) | | | 19,577 | | | | 0.0 | (a) |
Medidata Solutions, Inc.* | | | (2,950 | ) | | | (207,385 | ) | | | 1,741 | | | | 0.0 | (a) |
Omnicell, Inc.* | | | (2,895 | ) | | | (204,676 | ) | | | (17,602 | ) | | | (0.0 | )(a) |
Teladoc Health, Inc.* | | | (3,125 | ) | | | (216,688 | ) | | | (3,469 | ) | | | (0.0 | )(a) |
| | | | | | | | | | | | | | | | |
| | | (16,063 | ) | | | (786,214 | ) | | | 247 | | | | 0.0 | (a) |
| | | | | | | | | | | | | | | | |
Hotels, Restaurants & Leisure | | | | | | | | | | | | | |
Caesars Entertainment Corp.* | | | (20,343 | ) | | | (174,746 | ) | | | 20,475 | | | | 0.0 | (a) |
Eldorado Resorts, Inc.* | | | (2,955 | ) | | | (107,858 | ) | | | 31,796 | | | | 0.0 | (a) |
Golden Entertainment, Inc.* | | | (9,281 | ) | | | (168,636 | ) | | | 21,577 | | | | 0.0 | (a) |
| | | | | | | | | | | | | | | | |
| | | (32,579 | ) | | | (451,240 | ) | | | 73,848 | | | | 0.0 | (a) |
| | | | | | | | | | | | | | | | |
Household Durables | | | | | | | | | | | | | |
Installed Building Products, Inc.* | | | (5,373 | ) | | | (163,661 | ) | | | 2,687 | | | | 0.0 | (a) |
iRobot Corp.* | | | (470 | ) | | | (41,440 | ) | | | 1,217 | | | | 0.0 | (a) |
Mohawk Industries, Inc.* | | | (1,334 | ) | | | (166,390 | ) | | | 28,568 | | | | 0.0 | (a) |
| | | | | | | | | | | | | | | | |
| | | (7,177 | ) | | | (371,491 | ) | | | 32,472 | | | | 0.0 | (a) |
| | | | | | | | | | | | | | | | |
Household Products | | | | | | | | | | | | | |
Spectrum Brands Holdings, Inc. | | | (3,201 | ) | | | (207,905 | ) | | | 4,167 | | | | 0.0 | (a) |
| | | | | | | | | | | | | | | | |
Independent Power and Renewable Electricity Producers | | | | | | | | | | | | | |
Ormat Technologies, Inc. | | | (3,839 | ) | | | (196,442 | ) | | | 954 | | | | 0.0 | (a) |
TerraForm Power, Inc. | | | (18,087 | ) | | | (203,840 | ) | | | (1,628 | ) | | | (0.0 | )(a) |
| | | | | | | | | | | | | | | | |
| | | (21,926 | ) | | | (400,282 | ) | | | (674 | ) | | | (0.0 | )(a) |
| | | | | | | | | | | | | | | | |
Insurance | | | | | | | | | | | | | |
Alleghany Corp. | | | (355 | ) | | | (213,242 | ) | | | 2,091 | | | | 0.0 | (a) |
Arch Capital Group Ltd.* | | | (7,451 | ) | | | (211,385 | ) | | | (5,588 | ) | | | (0.0 | )(a) |
Markel Corp.* | | | (189 | ) | | | (206,622 | ) | | | 5,791 | | | | 0.0 | (a) |
ProAssurance Corp. | | | (4,668 | ) | | | (205,019 | ) | | | 683 | | | | 0.0 | (a) |
Willis Towers Watson plc | | | (1,440 | ) | | | (206,150 | ) | | | (6,379 | ) | | | (0.0 | )(a) |
| | | | | | | | | | | | | | | | |
| | | (14,103 | ) | | | (1,042,418 | ) | | | (3,402 | ) | | | (0.0 | )(a) |
| | | | | | | | | | | | | | | | |
SEE NOTES TO CONSOLIDATED FINANCIAL STATEMENTS.
| | | | | | |
| | | |
| 38 | | | | J.P. MORGAN EXCHANGE-TRADED FUNDS | | OCTOBER 31, 2018 |
| | | | | | | | | | | | | | | | |
| REFERENCE ENTITY | | SHARES | | | NOTIONAL
VALUE($) (1) | | | NET UNREALIZED
APPRECIATION
(DEPRECIATION)($) (2) | | | PERCENTAGE
OF NET
ASSETS (%) | |
Short Positions — continued | | | | | |
| | | |
Common Stocks — continued | | | | | | | | | | | | | |
Interactive Media & Services | | | | | | | | | | | | | |
Snap, Inc.* | | | (15,978 | ) | | | (105,615 | ) | | | 1,822 | | | | 0.0 | (a) |
TrueCar, Inc.* | | | (17,793 | ) | | | (202,484 | ) | | | 5,008 | | | | 0.0 | (a) |
| | | | | | | | | | | | | | | | |
| | | (33,771 | ) | | | (308,099 | ) | | | 6,830 | | | | 0.0 | (a) |
| | | | | | | | | | | | | | | | |
Internet & Direct Marketing Retail | | | | | | | | | | | | | |
Groupon, Inc.* | | | (50,371 | ) | | | (164,713 | ) | | | (3,224 | ) | | | (0.0 | )(a) |
Overstock.com, Inc.* | | | (5,349 | ) | | | (107,622 | ) | | | 27,066 | | | | 0.0 | (a) |
Wayfair, Inc.* | | | (285 | ) | | | (31,433 | ) | | | 175 | | | | 0.0 | (a) |
| | | | | | | | | | | | | | | | |
| | | (56,005 | ) | | | (303,768 | ) | | | 24,017 | | | | 0.0 | (a) |
| | | | | | | | | | | | | | | | |
IT Services | | | | | | | | | | | | | |
Gartner, Inc.* | | | (1,461 | ) | | | (215,527 | ) | | | (3,413 | ) | | | (0.0 | )(a) |
GTT Communications, Inc.* | | | (17 | ) | | | (610 | ) | | | 1 | | | | 0.0 | (a) |
InterXion Holding NV* | | | (3,628 | ) | | | (213,580 | ) | | | 6,764 | | | | 0.0 | (a) |
Twilio, Inc.* | | | (2,362 | ) | | | (177,670 | ) | | | (8,243 | ) | | | (0.0 | )(a) |
| | | | | | | | | | | | | | | | |
| | | (7,468 | ) | | | (607,387 | ) | | | (4,891 | ) | | | (0.0 | )(a) |
| | | | | | | | | | | | | | | | |
Leisure Products | | | | | | | | | | | | | |
Mattel, Inc.* | | | (11,993 | ) | | | (162,865 | ) | | | 5,731 | | | | 0.0 | (a) |
| | | | | | | | | | | | | | | | |
Machinery | | | | | | | | | | | | | |
Albany International Corp. | | | (3,093 | ) | | | (216,448 | ) | | | (705 | ) | | | (0.0 | )(a) |
CIRCOR International, Inc.* | | | (6,589 | ) | | | (214,208 | ) | | | 23,803 | | | | 0.0 | (a) |
Evoqua Water Technologies Corp.* | | | (23,031 | ) | | | (221,098 | ) | | | 62,582 | | | | 0.1 | |
Gardner Denver Holdings, Inc.* | | | (8,009 | ) | | | (216,724 | ) | | | (26,195 | ) | | | (0.0 | )(a) |
John Bean Technologies Corp. | | | (2,051 | ) | | | (213,242 | ) | | | 874 | | | | 0.0 | (a) |
Mueller Water Products, Inc. | | | (20,130 | ) | | | (206,534 | ) | | | 10,268 | | | | 0.0 | (a) |
REV Group, Inc. | | | (19,747 | ) | | | (215,440 | ) | | | 24,993 | | | | 0.0 | (a) |
Wabtec Corp. | | | (2,427 | ) | | | (199,062 | ) | | | 33,861 | | | | 0.0 | (a) |
| | | | | | | | | | | | | | | | |
| | | (85,077 | ) | | | (1,702,756 | ) | | | 129,481 | | | | 0.1 | |
| | | | | | | | | | | | | | | | |
Media | | | | | | | | | | | | | |
Altice USA, Inc. | | | (13,516 | ) | | | (220,446 | ) | | | 14,085 | | | | 0.0 | (a) |
Charter Communications, Inc.* | | | (657 | ) | | | (210,483 | ) | | | (3,174 | ) | | | (0.0 | )(a) |
EW Scripps Co. (The) | | | (12,568 | ) | | | (211,394 | ) | | | 232 | | | | 0.0 | (a) |
GCI Liberty, Inc.* | | | (4,257 | ) | | | (201,484 | ) | | | (10,100 | ) | | | (0.0 | )(a) |
Liberty Broadband Corp.* | | | (850 | ) | | | (70,490 | ) | | | (2,584 | ) | | | (0.0 | )(a) |
Liberty Global plc* | | | (8,483 | ) | | | (217,419 | ) | | | (3,027 | ) | | | (0.0 | )(a) |
New York Times Co. (The) | | | (8,009 | ) | | | (211,438 | ) | | | (8,691 | ) | | | (0.0 | )(a) |
| | | | | | | | | | | | | | | | |
| | | (48,340 | ) | | | (1,343,154 | ) | | | (13,259 | ) | | | (0.0 | )(a) |
| | | | | | | | | | | | | | | | |
Metals & Mining | | | | | | | | | | | | | |
AK Steel Holding Corp.* | | | (59,355 | ) | | | (219,614 | ) | | | 39,567 | | | | 0.1 | |
Coeur Mining, Inc.* | | | (15,675 | ) | | | (74,927 | ) | | | 7,467 | | | | 0.0 | (a) |
Compass Minerals International, Inc. | | | (1,198 | ) | | | (58,115 | ) | | | (879 | ) | | | (0.0 | )(a) |
Constellium NV* | | | (23,554 | ) | | | (213,399 | ) | | | 16,231 | | | | 0.0 | (a) |
Hecla Mining Co. | | | (84,448 | ) | | | (202,675 | ) | | | 33,894 | | | | 0.0 | (a) |
TimkenSteel Corp.* | | | (13,932 | ) | | | (162,029 | ) | | | 9,613 | | | | 0.0 | (a) |
| | | | | | | | | | | | | | | | |
| | | (198,162 | ) | | | (930,759 | ) | | | 105,893 | | | | 0.1 | |
| | | | | | | | | | | | | | | | |
Multi-Utilities | | | | | | | | | | | | | |
Dominion Energy, Inc. | | | (2,396 | ) | | | (171,122 | ) | | | 1,941 | | | | 0.0 | (a) |
| | | | | | | | | | | | | | | | |
Oil, Gas & Consumable Fuels | | | | | | | | | | | | | |
Concho Resources, Inc.* | | | (1,530 | ) | | | (212,808 | ) | | | (2,391 | ) | | | (0.0 | )(a) |
Extraction Oil & Gas, Inc.* | | | (5,404 | ) | | | (43,178 | ) | | | 13,456 | | | | 0.0 | (a) |
SEE NOTES TO CONSOLIDATED FINANCIAL STATEMENTS.
| | | | | | | | |
| | | |
| OCTOBER 31, 2018 | | J.P. MORGAN EXCHANGE-TRADED FUNDS | | | | | 39 | |
JPMorgan Diversified Alternatives ETF
CONSOLIDATED SCHEDULE OF PORTFOLIO INVESTMENTS
AS OF OCTOBER 31, 2018 (continued)
| | | | | | | | | | | | | | | | |
| REFERENCE ENTITY | | SHARES | | | NOTIONAL
VALUE($) (1) | | | NET UNREALIZED
APPRECIATION
(DEPRECIATION)($) (2) | | | PERCENTAGE
OF NET
ASSETS (%) | |
Short Positions — continued | | | | | |
| | | |
Common Stocks — continued | | | | | | | | | | | | | |
Oil, Gas & Consumable Fuels — continued | | | | | | | | | | | | | |
Golar LNG Ltd. | | | (7,884 | ) | | | (211,133 | ) | | | 5,851 | | | | 0.0 | (a) |
Matador Resources Co.* | | | (7,203 | ) | | | (207,735 | ) | | | 19,453 | | | | 0.0 | (a) |
Parsley Energy, Inc.* | | | (1,894 | ) | | | (44,357 | ) | | | 1,966 | | | | 0.0 | (a) |
QEP Resources, Inc.* | | | (24,383 | ) | | | (217,253 | ) | | | 29,592 | | | | 0.0 | (a) |
SemGroup Corp. | | | (11,229 | ) | | | (207,624 | ) | | | 22,817 | | | | 0.0 | (a) |
| | | | | | | | | | | | | | | | |
| | | (59,527 | ) | | | (1,144,088 | ) | | | 90,744 | | | | 0.0 | (a) |
| | | | | | | | | | | | | | | | |
Pharmaceuticals | | | | | | | | | | | | | |
Aerie Pharmaceuticals, Inc.* | | | (1,067 | ) | | | (56,743 | ) | | | 4,213 | | | | 0.0 | (a) |
Collegium Pharmaceutical, Inc.* | | | (12,575 | ) | | | (201,829 | ) | | | 10,689 | | | | 0.0 | (a) |
Intra-Cellular Therapies, Inc.* | | | (12,575 | ) | | | (213,523 | ) | | | 16,706 | | | | 0.0 | (a) |
Medicines Co. (The)* | | | (5,395 | ) | | | (125,488 | ) | | | 21,472 | | | | 0.0 | (a) |
Nektar Therapeutics* | | | (2,193 | ) | | | (84,825 | ) | | | (4,460 | ) | | | (0.0 | )(a) |
Revance Therapeutics, Inc.* | | | (9,114 | ) | | | (198,412 | ) | | | 22,785 | | | | 0.0 | (a) |
Theravance Biopharma, Inc.* | | | (8,343 | ) | | | (202,485 | ) | | | 36,268 | | | | 0.1 | |
WaVe Life Sciences Ltd.* | | | (3,764 | ) | | | (175,741 | ) | | | 8,017 | | | | 0.0 | (a) |
Zogenix, Inc.* | | | (4,912 | ) | | | (205,125 | ) | | | (12,920 | ) | | | (0.0 | )(a) |
| | | | | | | | | | | | | | | | |
| | | (59,938 | ) | | | (1,464,171 | ) | | | 102,770 | | | | 0.1 | |
| | | | | | | | | | | | | | | | |
Real Estate Management & Development | | | | | | | | | | | | | | | | |
Redfin Corp.* | | | (8,853 | ) | | | (136,779 | ) | | | 9,119 | | | | 0.0 | (a) |
| | | | | | | | | | | | | | | | |
Road & Rail | | | | | | | | | | | | | | | | |
AMERCO | | | (64 | ) | | | (20,895 | ) | | | 291 | | | | 0.0 | (a) |
Heartland Express, Inc. | | | (10,692 | ) | | | (208,173 | ) | | | 2,670 | | | | 0.0 | (a) |
Hertz Global Holdings, Inc.* | | | (14,871 | ) | | | (204,476 | ) | | | 15,188 | | | | 0.0 | (a) |
| | | | | | | | | | | | | | | | |
| | | (25,627 | ) | | | (433,544 | ) | | | 18,149 | | | | 0.0 | (a) |
| | | | | | | | | | | | | | | | |
Semiconductors & Semiconductor Equipment | | | | | | | | | | | | | | | | |
Advanced Micro Devices, Inc.* | | | (5,730 | ) | | | (104,343 | ) | | | 5,923 | | | | 0.0 | (a) |
Cree, Inc.* | | | (5,219 | ) | | | (202,602 | ) | | | (6,054 | ) | | | (0.0 | )(a) |
MACOM Technology Solutions Holdings, Inc.* | | | (5,620 | ) | | | (79,074 | ) | | | (1,395 | ) | | | (0.0 | )(a) |
MaxLinear, Inc.* | | | (12,213 | ) | | | (237,054 | ) | | | (24,543 | ) | | | (0.0 | )(a) |
Power Integrations, Inc. | | | (3,771 | ) | | | (212,383 | ) | | | (7,485 | ) | | | (0.0 | )(a) |
Universal Display Corp. | | | (1,921 | ) | | | (236,302 | ) | | | (13,242 | ) | | | (0.0 | )(a) |
| | | | | | | | | | | | | | | | |
| | | (34,474 | ) | | | (1,071,758 | ) | | | (46,796 | ) | | | (0.0 | )(a) |
| | | | | | | | | | | | | | | | |
Software | | | | | | | | | | | | | | | | |
Benefitfocus, Inc.* | | | (5,670 | ) | | | (201,455 | ) | | | (20,129 | ) | | | (0.0 | )(a) |
Box, Inc.* | | | (11,885 | ) | | | (213,930 | ) | | | 7,075 | | | | 0.0 | (a) |
Cloudera, Inc.* | | | (15,691 | ) | | | (215,908 | ) | | | (7,167 | ) | | | (0.0 | )(a) |
FireEye, Inc.* | | | (11,976 | ) | | | (221,436 | ) | | | (9,581 | ) | | | (0.0 | )(a) |
Instructure, Inc.* | | | (6,081 | ) | | | (227,065 | ) | | | (32,973 | ) | | | (0.0 | )(a) |
MINDBODY, Inc.* | | | (1,726 | ) | | | (54,956 | ) | | | (110 | ) | | | (0.0 | )(a) |
Nutanix, Inc.* | | | (1,268 | ) | | | (52,635 | ) | | | (4,425 | ) | | | (0.0 | )(a) |
PROS Holdings, Inc.* | | | (1,321 | ) | | | (43,487 | ) | | | (1,325 | ) | | | (0.0 | )(a) |
| | | | | | | | | | | | | | | | |
| | | (55,618 | ) | | | (1,230,872 | ) | | | (68,635 | ) | | | (0.0 | )(a) |
| | | | | | | | | | | | | | | | |
Specialty Retail | | | | | | | | | | | | | | | | |
CarMax, Inc.* | | | (351 | ) | | | (23,836 | ) | | | 316 | | | | 0.0 | (a) |
Floor & Decor Holdings, Inc.* | | | (6,496 | ) | | | (166,168 | ) | | | 7,316 | | | | 0.0 | (a) |
L Brands, Inc. | | | (5,111 | ) | | | (165,698 | ) | | | (8,280 | ) | | | (0.0 | )(a) |
Murphy USA, Inc.* | | | (1,965 | ) | | | (158,438 | ) | | | (1,825 | ) | | | (0.0 | )(a) |
National Vision Holdings, Inc.* | | | (3,993 | ) | | | (165,430 | ) | | | 1,318 | | | | 0.0 | (a) |
SEE NOTES TO CONSOLIDATED FINANCIAL STATEMENTS.
| | | | | | |
| | | |
| 40 | | | | J.P. MORGAN EXCHANGE-TRADED FUNDS | | OCTOBER 31, 2018 |
| | | | | | | | | | | | | | | | |
| REFERENCE ENTITY | | SHARES | | | NOTIONAL
VALUE($) (1) | | | NET UNREALIZED
APPRECIATION
(DEPRECIATION)($) (2) | | | PERCENTAGE
OF NET
ASSETS (%) | |
Short Positions — continued | | | | | |
| | | |
Common Stocks — continued | | | | | | | | | | | | | |
Specialty Retail — continued | | | | | | | | | | | | | | | | |
Ulta Beauty, Inc.* | | | (619 | ) | | | (169,928 | ) | | | (434 | ) | | | (0.0 | )(a) |
| | | | | | | | | | | | | | | | |
| | | (18,535 | ) | | | (849,498 | ) | | | (1,589 | ) | | | (0.0 | )(a) |
| | | | | | | | | | | | | | | | |
Technology Hardware, Storage & Peripherals | | | | | | | | | | | | | | | | |
Cray, Inc.* | | | (10,149 | ) | | | (230,281 | ) | | | (24,678 | ) | | | (0.0 | )(a) |
Pure Storage, Inc.* | | | (1,625 | ) | | | (32,792 | ) | | | 168 | | | | 0.0 | (a) |
| | | | | | | | | | | | | | | | |
| | | (11,774 | ) | | | (263,073 | ) | | | (24,510 | ) | | | (0.0 | )(a) |
| | | | | | | | | | | | | | | | |
Textiles, Apparel & Luxury Goods | | | | | | | | | | | | | | | | |
Skechers U.S.A., Inc.* | | | (5,796 | ) | | | (165,592 | ) | | | (10,468 | ) | | | (0.0 | )(a) |
| | | | | | | | | | | | | | | | |
Thrifts & Mortgage Finance | | | | | | | | | | | | | | | | |
Kearny Financial Corp. | | | (15,530 | ) | | | (200,958 | ) | | | 2,485 | | | | 0.0 | (a) |
LendingTree, Inc.* | | | (1,069 | ) | | | (215,607 | ) | | | 11,633 | | | | 0.0 | (a) |
| | | | | | | | | | | | | | | | |
| | | (16,599 | ) | | | (416,565 | ) | | | 14,118 | | | | 0.0 | (a) |
| | | | | | | | | | | | | | | | |
Tobacco | | | | | | | | | | | | | | | | |
Philip Morris International, Inc. | | | (2,213 | ) | | | (194,899 | ) | | | (1,217 | ) | | | (0.0 | )(a) |
Vector Group Ltd. | | | (15,111 | ) | | | (204,301 | ) | | | (4,685 | ) | | | (0.0 | )(a) |
| | | | | | | | | | | | | | | | |
| | | (17,324 | ) | | | (399,200 | ) | | | (5,902 | ) | | | (0.0 | )(a) |
| | | | | | | | | | | | | | | | |
Trading Companies & Distributors | | | | | | | | | | | | | | | | |
Herc Holdings, Inc.* | | | (6,605 | ) | | | (211,756 | ) | | | 1,442 | | | | 0.0 | (a) |
MRC Global, Inc.* | | | (13,551 | ) | | | (214,512 | ) | | | 15,648 | | | | 0.0 | (a) |
NOW, Inc.* | | | (16,383 | ) | | | (210,358 | ) | | | 33,310 | | | | 0.0 | (a) |
SiteOne Landscape Supply, Inc.* | | | (972 | ) | | | (66,135 | ) | | | (2,249 | ) | | | (0.0 | )(a) |
| | | | | | | | | | | | | | | | |
| | | (37,511 | ) | | | (702,761 | ) | | | 48,151 | | | | 0.0 | (a) |
| | | | | | | | | | | | | | | | |
Transportation Infrastructure | | | | | | | | | | | | | | | | |
Macquarie Infrastructure Corp. | | | (5,487 | ) | | | (202,745 | ) | | | 25,831 | | | | 0.0 | (a) |
| | | | | | | | | | | | | | | | |
Water Utilities | | | | | | | | | | | | | | | | |
American Water Works Co., Inc. | | | (148 | ) | | | (13,102 | ) | | | 129 | | | | 0.0 | (a) |
Aqua America, Inc. | | | (6,290 | ) | | | (204,614 | ) | | | 27,736 | | | | 0.0 | (a) |
| | | | | | | | | | | | | | | | |
| | | (6,438 | ) | | | (217,716 | ) | | | 27,865 | | | | 0.0 | (a) |
| | | | | | | | | | | | | | | | |
Total Short Positions of Total Return Basket Swap | | | (1,558,778 | ) | | | (29,442,419 | ) | | | 664,398 | | | | 0.3 | |
| | | | | | | | | | | | | | | | |
| | | | | | | | | | | | | | | | | | | | |
| COUNTERPARTY | | DESCRIPTION | | TERMINATION
DATE | | NOTIONAL
VALUE (1) | | | NET UNREALIZED
APPRECIATION
(DEPRECIATION) (2) | | | NET CASH
AND OTHER
RECEIVABLES
(PAYABLES) | | | VALUE | |
UBS | | The Fund receives the total return on a portfolio of long and short equity positions and pays or receives the net of one month LIBOR on long positions and short positions respectively, plus or minus a specified spread (rates range from 0.00% to 0.25%), which is denominated in EUR based on the local currencies of the positions within the swaps. | | 9/12/2019 | | $ | 12,867,906 | | | $ | (98,441 | ) | | $ | (109,022 | ) | | $ | (207,463 | ) |
| | | | | | | | | | | | | | | | | | | | |
SEE NOTES TO CONSOLIDATED FINANCIAL STATEMENTS.
| | | | | | | | |
| | | |
| OCTOBER 31, 2018 | | J.P. MORGAN EXCHANGE-TRADED FUNDS | | | | | 41 | |
JPMorgan Diversified Alternatives ETF
CONSOLIDATED SCHEDULE OF PORTFOLIO INVESTMENTS
AS OF OCTOBER 31, 2018 (continued)
| | | | | | | | | | | | | | | | |
| REFERENCE ENTITY | | SHARES | | | NOTIONAL
VALUE($) (1) | | | NET UNREALIZED
APPRECIATION
(DEPRECIATION)($) (2) | | | PERCENTAGE
OF NET
ASSETS (%) | |
Long Positions | | | | | |
| | | |
Common Stocks | | | | | | | | | | | | | |
Aerospace & Defense | | | | | | | | | | | | | |
Dassault Aviation SA | | | 174 | | | | 288,724 | | | | (744 | ) | | | (0.0 | )(a) |
| | | | | | | | | | | | | | | | |
Auto Components | | | | | | | | | | | | | |
Cie Plastic Omnium SA | | | 8,287 | | | | 230,397 | | | | (11,727 | ) | | | (0.0 | )(a) |
Faurecia SA | | | 4,564 | | | | 221,255 | | | | 4,122 | | | | 0.0 | (a) |
| | | | | | | | | | | | | | | | |
| | | 12,851 | | | | 451,652 | | | | (7,605 | ) | | | (0.0 | )(a) |
| | | | | | | | | | | | | | | | |
Automobiles | | | | | | | | | | | | | |
Peugeot SA | | | 9,340 | | | | 222,019 | | | | 6,388 | | | | 0.0 | (a) |
| | | | | | | | | | | | | | | | |
Capital Markets | | | | | | | | | | | | | |
AURELIUS Equity Opportunities SE & Co. KGaA | | | 6,161 | | | | 286,553 | | | | (920 | ) | | | (0.0 | )(a) |
| | | | | | | | | | | | | | | | |
Chemicals | | | | | | | | | | | | | |
Arkema SA | | | 2,710 | | | | 284,316 | | | | (8,544 | ) | | | (0.0 | )(a) |
Covestro AG (b) | | | 4,466 | | | | 288,007 | | | | (5,925 | ) | | | (0.0 | )(a) |
| | | | | | | | | | | | | | | | |
| | | 7,176 | | | | 572,323 | | | | (14,469 | ) | | | (0.0 | )(a) |
| | | | | | | | | | | | | | | | |
Construction & Engineering | | | | | | | | | | | | | |
ACS Actividades de Construccion y Servicios SA | | | 7,508 | | | | 281,110 | | | | (818 | ) | | | (0.0 | )(a) |
Eiffage SA | | | 2,915 | | | | 284,684 | | | | (12,292 | ) | | | (0.0 | )(a) |
HOCHTIEF AG | | | 1,911 | | | | 283,188 | | | | (5,089 | ) | | | (0.0 | )(a) |
Maire Tecnimont SpA | | | 66,086 | | | | 288,885 | | | | 7,947 | | | | 0.0 | (a) |
| | | | | | | | | | | | | | | | |
| | | 78,420 | | | | 1,137,867 | | | | (10,252 | ) | | | (0.0 | )(a) |
| | | | | | | | | | | | | | | | |
Diversified Telecommunication Services | | | | | | | | | | | | | |
Deutsche Telekom AG (Registered) | | | 17,498 | | | | 286,996 | | | | (1,378 | ) | | | (0.0 | )(a) |
DNA OYJ | | | 15,125 | | | | 296,406 | | | | (27,417 | ) | | | (0.0 | )(a) |
Orange SA | | | 17,938 | | | | 279,983 | | | | (3,502 | ) | | | (0.0 | )(a) |
| | | | | | | | | | | | | | | | |
| | | 50,561 | | | | 863,385 | | | | (32,297 | ) | | | (0.0 | )(a) |
| | | | | | | | | | | | | | | | |
Electric Utilities | | | | | | | | | | | | | |
Endesa SA | | | 12,926 | | | | 270,271 | | | | 3,718 | | | | 0.0 | (a) |
Red Electrica Corp. SA | | | 13,786 | | | | 285,459 | | | | 4,975 | | | | 0.0 | (a) |
Terna Rete Elettrica Nazionale SpA | | | 53,649 | | | | 277,123 | | | | 4,982 | | | | 0.0 | (a) |
Verbund AG | | | 7,111 | | | | 286,234 | | | | (9,062 | ) | | | (0.0 | )(a) |
| | | | | | | | | | | | | | | | |
| | | 87,472 | | | | 1,119,087 | | | | 4,613 | | | | 0.0 | (a) |
| | | | | | | | | | | | | | | | |
Electrical Equipment | | | | | | | | | | | | | |
Schneider Electric SE | | | 3,937 | | | | 284,689 | | | | 8,328 | | | | 0.0 | (a) |
Signify NV (b) | | | 11,628 | | | | 286,450 | | | | 237 | | | | 0.0 | (a) |
| | | | | | | | | | | | | | | | |
| | | 15,565 | | | | 571,139 | | | | 8,565 | | | | 0.0 | (a) |
| | | | | | | | | | | | | | | | |
Food & Staples Retailing | | | | | | | | | | | | | |
Koninklijke Ahold Delhaize NV | | | 12,421 | | | | 284,323 | | | | 4,034 | | | | 0.0 | (a) |
| | | | | | | | | | | | | | | | |
Gas Utilities | | | | | | | | | |
Italgas SpA | | | 54,838 | | | | 282,939 | | | | 1,848 | | | | 0.0 | (a) |
| | | | | | | | | | | | | | | | |
Health Care Equipment & Supplies | | | | | | | | | |
Koninklijke Philips NV | | | 7,756 | | | | 289,267 | | | | (21,510 | ) | | | (0.0 | )(a) |
| | | | | | | | | | | | | | | | |
Independent Power and Renewable Electricity Producers | | | | | | | | | | | | | |
ERG SpA | | | 15,161 | | | | 282,815 | | | | (16,559 | ) | | | (0.0 | )(a) |
Uniper SE | | | 9,543 | | | | 275,395 | | | | (14,735 | ) | | | (0.0 | )(a) |
| | | | | | | | | | | | | | | | |
| | | 24,704 | | | | 558,210 | | | | (31,294 | ) | | | (0.0 | )(a) |
| | | | | | | | | | | | | | | | |
Industrial Conglomerates | | | | | | | | | | | | | |
Rheinmetall AG | | | 3,345 | | | | 289,489 | | | | (2,471 | ) | | | (0.0 | )(a) |
| | | | | | | | | | | | | | | | |
SEE NOTES TO CONSOLIDATED FINANCIAL STATEMENTS.
| | | | | | |
| | | |
| 42 | | | | J.P. MORGAN EXCHANGE-TRADED FUNDS | | OCTOBER 31, 2018 |
| | | | | | | | | | | | | | | | |
| REFERENCE ENTITY | | SHARES | | | NOTIONAL
VALUE($) (1) | | | NET UNREALIZED
APPRECIATION
(DEPRECIATION)($) (2) | | | PERCENTAGE
OF NET
ASSETS (%) | |
Long Positions — continued | | | | | |
| | | |
Common Stocks — continued | | | | | | | | | | | | | |
Insurance | | | | | | | | | | | | | |
Aegon NV | | | 47,598 | | | | 291,902 | | | | 4,846 | | | | 0.0 | (a) |
Ageas | | | 5,717 | | | | 286,050 | | | | 3,634 | | | | 0.0 | (a) |
ASR Nederland NV | | | 6,003 | | | | 272,520 | | | | (4,344 | ) | | | (0.0 | )(a) |
NN Group NV | | | 6,305 | | | | 270,725 | | | | (6,426 | ) | | | (0.0 | )(a) |
Poste Italiane SpA (b) | | | 40,041 | | | | 287,310 | | | | 8,016 | | | | 0.0 | (a) |
UnipolSai Assicurazioni SpA | | | 130,533 | | | | 284,986 | | | | 5,068 | | | | 0.0 | (a) |
| | | | | | | | | | | | | | | | |
| | | 236,197 | | | | 1,693,493 | | | | 10,794 | | | | 0.0 | (a) |
| | | | | | | | | | | | | | | | |
IT Services | | | | | | | | | | | | | |
Amadeus IT Group SA | | | 3,584 | | | | 288,600 | | | | (3,579 | ) | | | (0.0 | )(a) |
CANCOM SE | | | 7,389 | | | | 301,277 | | | | 2,991 | | | | 0.0 | (a) |
| | | | | | | | | | | | | | | | |
| | | 10,973 | | | | 589,877 | | | | (588 | ) | | | (0.0 | )(a) |
| | | | | | | | | | | | | | | | |
Machinery | | | | | | | | | | | | | |
Fincantieri SpA | | | 194,893 | | | | 283,937 | | | | (8,782 | ) | | | (0.0 | )(a) |
Valmet OYJ | | | 12,730 | | | | 289,847 | | | | 15,598 | | | | 0.0 | (a) |
| | | | | | | | | | | | | | | | |
| | | 207,623 | | | | 573,784 | | | | 6,816 | | | | 0.0 | (a) |
| | | | | | | | | | | | | | | | |
Media | | | | | | | | | | | | | |
Eutelsat Communications SA | | | 13,410 | | | | 271,614 | | | | (54,492 | ) | | | (0.1 | ) |
Mediaset Espana Comunicacion SA | | | 41,680 | | | | 283,417 | | | | 1,608 | | | | 0.0 | (a) |
ProSiebenSat.1 Media SE | | | 12,339 | | | | 284,926 | | | | (5,620 | ) | | | (0.0 | )(a) |
Publicis Groupe SA | | | 4,874 | | | | 282,141 | | | | (12,908 | ) | | | (0.0 | )(a) |
| | | | | | | | | | | | | | | | |
| | | 72,303 | | | | 1,122,098 | | | | (71,412 | ) | | | (0.1 | ) |
| | | | | | | | | | | | | | | | |
Metals & Mining | | | | | | | | | | | | | |
Aurubis AG | | | 4,753 | | | | 288,505 | | | | (5,259 | ) | | | (0.0 | )(a) |
Eramet | | | 3,078 | | | | 283,350 | | | | 11,670 | | | | 0.0 | (a) |
| | | | | | | | | | | | | | | | |
| | | 7,831 | | | | 571,855 | | | | 6,411 | | | | 0.0 | (a) |
| | | | | | | | | | | | | | | | |
Multi-Utilities | | | | | | | | | | | | | |
A2A SpA | | | 178,062 | | | | 286,921 | | | | (3,351 | ) | | | (0.0 | )(a) |
Engie SA | | | 21,588 | | | | 286,844 | | | | 954 | | | | 0.0 | (a) |
Hera SpA | | | 103,602 | | | | 285,929 | | | | (961 | ) | | | (0.0 | )(a) |
Iren SpA | | | 129,066 | | | | 279,655 | | | | (1,212 | ) | | | (0.0 | )(a) |
| | | | | | | | | | | | | | | | |
| | | 432,318 | | | | 1,139,349 | | | | (4,570 | ) | | | (0.0 | )(a) |
| | | | | | | | | | | | | | | | |
Oil, Gas & Consumable Fuels | | | | | | | | | | | | | |
Enagas SA | | | 10,602 | | | | 281,096 | | | | 4,105 | | | | 0.0 | (a) |
Eni SpA | | | 15,697 | | | | 278,775 | | | | 6,864 | | | | 0.0 | (a) |
Galp Energia SGPS SA | | | 16,444 | | | | 285,932 | | | | (6,257 | ) | | | (0.0 | )(a) |
Neste OYJ | | | 3,464 | | | | 284,446 | | | | 3,197 | | | | 0.0 | (a) |
OMV AG | | | 5,381 | | | | 298,821 | | | | (936 | ) | | | (0.0 | )(a) |
Repsol SA | | | 16,037 | | | | 286,563 | | | | (8,288 | ) | | | (0.0 | )(a) |
Saras SpA | | | 145,664 | | | | 284,271 | | | | (5,013 | ) | | | (0.0 | )(a) |
TOTAL SA | | | 4,813 | | | | 282,405 | | | | (5,569 | ) | | | (0.0 | )(a) |
| | | | | | | | | | | | | | | | |
| | | 218,102 | | | | 2,282,309 | | | | (11,897 | ) | | | (0.0 | )(a) |
| | | | | | | | | | | | | | | | |
Paper & Forest Products | | | | | | | | | | | | | |
Ence Energia y Celulosa SA | | | 32,534 | | | | 273,280 | | | | (3,217 | ) | | | (0.0 | )(a) |
UPM-Kymmene OYJ | | | 8,941 | | | | 287,442 | | | | (13,261 | ) | | | (0.0 | )(a) |
| | | | | | | | | | | | | | | | |
| | | 41,475 | | | | 560,722 | | | | (16,478 | ) | | | (0.0 | )(a) |
| | | | | | | | | | | | | | | | |
SEE NOTES TO CONSOLIDATED FINANCIAL STATEMENTS.
| | | | | | | | |
| | | |
| OCTOBER 31, 2018 | | J.P. MORGAN EXCHANGE-TRADED FUNDS | | | | | 43 | |
JPMorgan Diversified Alternatives ETF
CONSOLIDATED SCHEDULE OF PORTFOLIO INVESTMENTS
AS OF OCTOBER 31, 2018 (continued)
| | | | | | | | | | | | | | | | |
| REFERENCE ENTITY | | SHARES | | | NOTIONAL
VALUE($) (1) | | | NET UNREALIZED
APPRECIATION
(DEPRECIATION)($) (2) | | | PERCENTAGE
OF NET
ASSETS (%) | |
Long Positions — continued | | | | | |
| | | |
Common Stocks — continued | | | | | | | | | | | | | |
Pharmaceuticals | | | | | | | | | | | | | |
Bayer AG (Registered) | | | 3,741 | | | | 286,757 | | | | (41,817 | ) | | | (0.0 | )(a) |
Merck KGaA | | | 2,588 | | | | 276,924 | | | | 5,298 | | | | 0.0 | (a) |
Sanofi | | | 3,278 | | | | 292,924 | | | | 3,970 | | | | 0.0 | (a) |
UCB SA | | | 3,314 | | | | 278,310 | | | | 3,877 | | | | 0.0 | (a) |
| | | | | | | | | | | | | | | | |
| | | 12,921 | | | | 1,134,915 | | | | (28,672 | ) | | | (0.0 | )(a) |
| | | | | | | | | | | | | | | | |
Real Estate Management & Development | | | | | | | | | | | | | |
Grand City Properties SA | | | 11,858 | | | | 286,677 | | | | 617 | | | | 0.0 | (a) |
LEG Immobilien AG | | | 2,591 | | | | 283,220 | | | | (9,629 | ) | | | (0.0 | )(a) |
Nexity SA | | | 5,877 | | | | 281,043 | | | | (10,195 | ) | | | (0.0 | )(a) |
TAG Immobilien AG | | | 12,529 | | | | 285,813 | | | | (2,763 | ) | | | (0.0 | )(a) |
| | | | | | | | | | | | | | | | |
| | | 32,855 | | | | 1,136,753 | | | | (21,970 | ) | | | (0.0 | )(a) |
| | | | | | | | | | | | | | | | |
Semiconductors & Semiconductor Equipment | | | | | | | | | | | | | |
BE Semiconductor Industries NV | | | 13,675 | | | | 292,344 | | | | 9,722 | | | | 0.0 | (a) |
Siltronic AG | | | 3,114 | | | | 285,195 | | | | (29,053 | ) | | | (0.0 | )(a) |
| | | | | | | | | | | | | | | | |
| | | 16,789 | | | | 577,539 | | | | (19,331 | ) | | | (0.0 | )(a) |
| | | | | | | | | | | | | | | | |
Textiles, Apparel & Luxury Goods | | | | | | | | | | | | | |
Christian Dior SE | | | 599 | | | | 231,734 | | | | 8,890 | | | | 0.0 | (a) |
| | | | | | | | | | | | | | | | |
Total Long Positions of Total Return Basket Swap | | | 1,660,770 | | | | 18,831,405 | | | | (238,121 | ) | | | (0.1 | ) |
| | | | | | | | | | | | | | | | |
| |
Short Positions | | | | | |
| | | |
Common Stocks | | | | | | | | | | | | | |
Air Freight & Logistics | | | | | | | | | | | | | |
bpost SA | | | (13,823 | ) | | | (209,786 | ) | | | (4,996 | ) | | | (0.0 | )(a) |
| | | | | | | | | | | | | | | | |
Auto Components | | | | | | | | | | | | | |
Brembo SpA | | | (10,284 | ) | | | (113,853 | ) | | | 328 | | | | 0.0 | (a) |
Gestamp Automocion SA (b) | | | (26,304 | ) | | | (166,780 | ) | | | (192 | ) | | | (0.0 | )(a) |
Nokian Renkaat OYJ | | | (3,925 | ) | | | (124,848 | ) | | | 22,978 | | | | 0.0 | (a) |
| | | | | | | | | | | | | | | | |
| | | (40,513 | ) | | | (405,481 | ) | | | 23,114 | | | | 0.0 | (a) |
| | | | | | | | | | | | | | | | |
Banks | | | | | | | | | | | | | |
Commerzbank AG* | | | (18,203 | ) | | | (171,398 | ) | | | 7,057 | | | | 0.0 | (a) |
| | | | | | | | | | | | | | | | |
Capital Markets | | | | | | | | | | | | | |
Banca Generali SpA | | | (8,460 | ) | | | (162,892 | ) | | | 26,447 | | | | 0.0 | (a) |
| | | | | | | | | | | | | | | | |
Chemicals | | | | | | | | | | | | | |
K+S AG (Registered) | | | (9,492 | ) | | | (176,760 | ) | | | 10,440 | | | | 0.0 | (a) |
OCI NV* | | | (2,481 | ) | | | (70,492 | ) | | | 5,383 | | | | 0.0 | (a) |
Umicore SA | | | (3,520 | ) | | | (165,697 | ) | | | (103 | ) | | | (0.0 | )(a) |
| | | | | | | | | | | | | | | | |
| | | (15,493 | ) | | | (412,949 | ) | | | 15,720 | | | | 0.0 | (a) |
| | | | | | | | | | | | | | | | |
Commercial Services & Supplies | | | | | | | | | | | | | |
Elis SA | | | (9,857 | ) | | | (198,758 | ) | | | (8,008 | ) | | | (0.0 | )(a) |
| | | | | | | | | | | | | | | | |
Diversified Financial Services | | | | | | | | | | | | | |
Wendel SA | | | (1,492 | ) | | | (193,328 | ) | | | (2,132 | ) | | | (0.0 | )(a) |
| | | | | | | | | | | | | | | | |
Diversified Telecommunication Services | | | | | | | | | | | | | |
Cellnex Telecom SA (b) | | | (7,923 | ) | | | (197,095 | ) | | | (2,485 | ) | | | (0.0 | )(a) |
Iliad SA | | | (388 | ) | | | (44,847 | ) | | | 4,133 | | | | 0.0 | (a) |
| | | | | | | | | | | | | | | | |
| | | (8,311 | ) | | | (241,942 | ) | | | 1,648 | | | | 0.0 | (a) |
| | | | | | | | | | | | | | | | |
Electrical Equipment | | | | | | | | | | | | | |
Siemens Gamesa Renewable Energy SA* | | | (15,192 | ) | | | (168,251 | ) | | | 579 | | | | 0.0 | (a) |
| | | | | | | | | | | | | | | | |
SEE NOTES TO CONSOLIDATED FINANCIAL STATEMENTS.
| | | | | | |
| | | |
| 44 | | | | J.P. MORGAN EXCHANGE-TRADED FUNDS | | OCTOBER 31, 2018 |
| | | | | | | | | | | | | | | | |
| REFERENCE ENTITY | | SHARES | | | NOTIONAL
VALUE($) (1) | | | NET UNREALIZED
APPRECIATION
(DEPRECIATION)($) (2) | | | PERCENTAGE
OF NET
ASSETS (%) | |
Short Positions — continued | | | | | |
| | | |
Common Stocks — continued | | | | | | | | | | | | | |
Energy Equipment & Services | | | | | | | | | | | | | |
CGG SA* | | | (85,005 | ) | | | (205,629 | ) | | | 10,322 | | | | 0.0 | (a) |
| | | | | | | | | | | | | | | | |
Food Products | | | | | | | | | | | | | |
Kerry Group plc | | | (2,013 | ) | | | (206,342 | ) | | | (1,595 | ) | | | (0.0 | )(a) |
| | | | | | | | | | | | | | | | |
Health Care Providers & Services | | | | | | | | | | | | | |
Orpea | | | (1,673 | ) | | | (205,968 | ) | | | (5,357 | ) | | | (0.0 | )(a) |
| | | | | | | | | | | | | | | | |
Hotels, Restaurants & Leisure | | | | | | | | | | | | | |
Sodexo SA | | | (1,588 | ) | | | (162,098 | ) | | | (5,378 | ) | | | (0.0 | )(a) |
| | | | | | | | | | | | | | | | |
Internet & Direct Marketing Retail | | | | | | | | | | | | | |
Delivery Hero SE* (b) | | | (3,664 | ) | | | (147,531 | ) | | | 2,267 | | | | 0.0 | (a) |
Rocket Internet SE* (b) | | | (5,545 | ) | | | (160,103 | ) | | | (7,631 | ) | | | (0.0 | )(a) |
Zalando SE* (b) | | | (1,344 | ) | | | (51,953 | ) | | | (2,455 | ) | | | (0.0 | )(a) |
| | | | | | | | | | | | | | | | |
| | | (10,553 | ) | | | (359,587 | ) | | | (7,819 | ) | | | (0.0 | )(a) |
| | | | | | | | | | | | | | | | |
IT Services | | | | | | | | | | | | | |
Bechtle AG | | | (1,952 | ) | | | (173,352 | ) | | | 11,132 | | | | 0.0 | (a) |
Indra Sistemas SA* | | | (21,083 | ) | | | (208,372 | ) | | | 7,411 | | | | 0.0 | (a) |
| | | | | | | | | | | | | | | | |
| | | (23,035 | ) | | | (381,724 | ) | | | 18,543 | | | | 0.0 | (a) |
| | | | | | | | | | | | | | | | |
Life Sciences Tools & Services | | | | | | | | | | | | | |
MorphoSys AG* | | | (571 | ) | | | (52,873 | ) | | | 2,601 | | | | 0.0 | (a) |
| | | | | | | | | | | | | | | | |
Machinery | | | | | | | | | | | | | |
Duerr AG | | | (4,780 | ) | | | (170,332 | ) | | | (5,089 | ) | | | (0.0 | )(a) |
GEA Group AG | | | (848 | ) | | | (25,767 | ) | | | 136 | | | | 0.0 | (a) |
Outotec OYJ* | | | (36,934 | ) | | | (142,854 | ) | | | 64,223 | | | | 0.0 | (a) |
| | | | | | | | | | | | | | | | |
| | | (42,562 | ) | | | (338,953 | ) | | | 59,270 | | | | 0.0 | (a) |
| | | | | | | | | | | | | | | | |
Media | | | | | | | | | | | | | |
Altice Europe NV* | | | (27,345 | ) | | | (65,055 | ) | | | 8,301 | | | | 0.0 | (a) |
| | | | | | | | | | | | | | | | |
Metals & Mining | | | | | | | | | | | | | |
AMG Advanced Metallurgical Group NV | | | (4,437 | ) | | | (211,107 | ) | | | (7,668 | ) | | | (0.0 | )(a) |
Bekaert SA | | | (8,345 | ) | | | (180,232 | ) | | | 1,876 | | | | 0.0 | (a) |
thyssenkrupp AG | | | (486 | ) | | | (10,187 | ) | | | 920 | | | | 0.0 | (a) |
| | | | | �� | | | | | | | | | | | |
| | | (13,268 | ) | | | (401,526 | ) | | | (4,872 | ) | | | (0.0 | )(a) |
| | | | | | | | | | | | | | | | |
Multi-Utilities | | | | | | | | | | | | | |
E.ON SE | | | (18,929 | ) | | | (183,044 | ) | | | (1,789 | ) | | | (0.0 | )(a) |
RWE AG | | | (8,264 | ) | | | (160,770 | ) | | | 4,217 | | | | 0.0 | (a) |
Suez | | | (13,757 | ) | | | (198,435 | ) | | | 535 | | | | 0.0 | (a) |
| | | | | | | | | | | | | | | | |
| | | (40,950 | ) | | | (542,249 | ) | | | 2,963 | | | | 0.0 | (a) |
| | | | | | | | | | | | | | | | |
Pharmaceuticals | | | | | | | | | | | | | |
Orion OYJ | | | (5,427 | ) | | | (186,685 | ) | | | 3,043 | | | | 0.0 | (a) |
| | | | | | | | | | | | | | | | |
Professional Services | | | | | | | | | | | | | |
Bureau Veritas SA | | | (8,078 | ) | | | (182,240 | ) | | | (5,031 | ) | | | (0.0 | )(a) |
| | | | | | | | | | | | | | | | |
Semiconductors & Semiconductor Equipment | | | | | | | | | | | | | |
SOITEC* | | | (2,517 | ) | | | (179,348 | ) | | | 7,392 | | | | 0.0 | (a) |
| | | | | | | | | | | | | | | | |
Specialty Retail | | | | | | | | | | | | | |
Industria de Diseno Textil SA | | | (4,722 | ) | | | (133,088 | ) | | | (1,457 | ) | | | (0.0 | )(a) |
| | | | | | | | | | | | | | | | |
Transportation Infrastructure | | | | | | | | | | | | | |
Aeroports de Paris | | | (934 | ) | | | (195,349 | ) | | | (675 | ) | | | (0.0 | )(a) |
| | | | | | | | | | | | | | | | |
Total Short Positions of Total Return Basket Swap | | | (401,585 | ) | | | (5,963,499 | ) | | | 139,680 | | | | 0.0 | (a) |
| | | | | | | | | | | | | | | | |
Total of Long and Short Positions of Total Return Basket Swap | | | 1,259,185 | | | | 12,867,906 | | | | (98,441 | ) | | | (0.1 | ) |
| | | | | | | | | | | | | | | | |
SEE NOTES TO CONSOLIDATED FINANCIAL STATEMENTS.
| | | | | | | | |
| | | |
| OCTOBER 31, 2018 | | J.P. MORGAN EXCHANGE-TRADED FUNDS | | | | | 45 | |
JPMorgan Diversified Alternatives ETF
CONSOLIDATED SCHEDULE OF PORTFOLIO INVESTMENTS
AS OF OCTOBER 31, 2018 (continued)
| | | | | | | | | | | | | | | | | | | | |
| COUNTERPARTY | | DESCRIPTION | | TERMINATION
DATE | | NOTIONAL
VALUE (1) | | | NET UNREALIZED
APPRECIATION
(DEPRECIATION) (2) | | | NET CASH
AND OTHER
RECEIVABLES
(PAYABLES) | | | VALUE | |
| UBS | | The Fund receives the total return on a portfolio of long and short equity positions and pays or receives the net of one month LIBOR on long positions and short positions respectively, plus or minus a specified spread (rates range from 0.00% to 0.25%), which is denominated in JPY based on the local currencies of the positions within the swaps. | | 9/12/2019 | | $ | 8,910,956 | | | $ | (484,795 | ) | | $ | 767,983 | | | $ | 283,188 | |
| | | | | | | | | | | | | | | | | | | | |
| | | | | | | | | | | | | | | | |
| REFERENCE ENTITY | | SHARES | | | NOTIONAL
VALUE($) (1) | | | NET UNREALIZED
APPRECIATION
(DEPRECIATION)($) (2) | | | PERCENTAGE
OF NET
ASSETS (%) | |
Long Positions | | | | | |
| | | |
Common Stocks | | | | | | | | | | | | | |
Auto Components | | | | | | | | | | | | | |
Keihin Corp. | | | 11,200 | | | | 220,527 | | | | (2,222 | ) | | | (0.0 | )(a) |
Showa Corp. | | | 13,500 | | | | 185,779 | | | | 1,314 | | | | 0.0 | (a) |
TS Tech Co. Ltd. | | | 7,500 | | | | 215,851 | | | | (342 | ) | | | (0.0 | )(a) |
| | | | | | | | | | | | | | | | |
| | | 32,200 | | | | 622,157 | | | | (1,250 | ) | | | (0.0 | )(a) |
| | | | | | | | | | | | | | | | |
Beverages | | | | | | | | | | | | | |
Kirin Holdings Co. Ltd. | | | 11,000 | | | | 262,488 | | | | 3,547 | | | | 0.0 | (a) |
| | | | | | | | | | | | | | | | |
Chemicals | | | | | | | | | | | | | |
Asahi Kasei Corp. | | | 22,700 | | | | 272,365 | | | | (27,698 | ) | | | (0.0 | )(a) |
Daicel Corp. | | | 24,600 | | | | 260,244 | | | | (6,110 | ) | | | (0.0 | )(a) |
KH Neochem Co. Ltd.* | | | 7,300 | | | | 207,326 | | | | (34,225 | ) | | | (0.1 | ) |
Mitsubishi Chemical Holdings Corp. | | | 23,600 | | | | 183,971 | | | | (12,633 | ) | | | (0.0 | )(a) |
Mitsubishi Gas Chemical Co., Inc. | | | 9,300 | | | | 156,111 | | | | (10,680 | ) | | | (0.0 | )(a) |
Sumitomo Bakelite Co. Ltd. | | | 6,000 | | | | 216,644 | | | | (14,307 | ) | | | (0.0 | )(a) |
Sumitomo Chemical Co. Ltd. | | | 54,000 | | | | 270,507 | | | | (13,014 | ) | | | (0.0 | )(a) |
Tokuyama Corp. | | | 9,700 | | | | 216,909 | | | | (27,729 | ) | | | (0.0 | )(a) |
Tosoh Corp. | | | 19,300 | | | | 254,100 | | | | (27,663 | ) | | | (0.0 | )(a) |
Ube Industries Ltd. | | | 10,800 | | | | 235,253 | | | | (19,913 | ) | | | (0.0 | )(a) |
| | | | | | | | | | | | | | | | |
| | | 187,300 | | | | 2,273,430 | | | | (193,972 | ) | | | (0.1 | ) |
| | | | | | | | | | | | | | | | |
Construction & Engineering | | | | | | | | | | | | | |
Hazama Ando Corp. | | | 37,400 | | | | 258,261 | | | | (6,361 | ) | | | (0.0 | )(a) |
Kyowa Exeo Corp. | | | 9,700 | | | | 261,470 | | | | (6,883 | ) | | | (0.0 | )(a) |
Kyudenko Corp. | | | 7,100 | | | | 258,323 | | | | (3,621 | ) | | | (0.0 | )(a) |
Maeda Corp. | | | 21,900 | | | | 247,463 | | | | (9,059 | ) | | | (0.0 | )(a) |
Sumitomo Mitsui Construction Co. Ltd.* | | | 42,600 | | | | 267,246 | | | | (9,207 | ) | | | (0.0 | )(a) |
Taisei Corp. | | | 4,100 | | | | 175,351 | | | | (6,414 | ) | | | (0.0 | )(a) |
| | | | | | | | | | | | | | | | |
| | | 122,800 | | | | 1,468,114 | | | | (41,545 | ) | | | (0.0 | )(a) |
| | | | | | | | | | | | | | | | |
Diversified Financial Services | | | | | | | | | | | | | |
Mitsubishi UFJ Lease & Finance Co. Ltd. | | | 48,800 | | | | 250,794 | | | | (20,557 | ) | | | (0.0 | )(a) |
ORIX Corp. | | | 18,000 | | | | 293,238 | | | | (551 | ) | | | (0.0 | )(a) |
| | | | | | | | | | | | | | | | |
| | | 66,800 | | | | 544,032 | | | | (21,108 | ) | | | (0.0 | )(a) |
| | | | | | | | | | | | | | | | |
Diversified Telecommunication Services | | | | | | | | | | | | | |
Nippon Telegraph & Telephone Corp. | | | 5,900 | | | | 243,308 | | | | (22,853 | ) | | | (0.0 | )(a) |
| | | | | | | | | | | | | | | | |
Electric Utilities | | | | | | | | | | | | | |
Chubu Electric Power Co., Inc. | | | 19,200 | | | | 276,877 | | | | (8,479 | ) | | | (0.0 | )(a) |
Kansai Electric Power Co., Inc. (The) | | | 17,900 | | | | 273,968 | | | | 11 | | | | 0.0 | (a) |
Tokyo Electric Power Co. Holdings, Inc.* | | | 51,800 | | | | 265,122 | | | | 4,252 | | | | 0.0 | (a) |
| | | | | | | | | | | | | | | | |
| | | 88,900 | | | | 815,967 | | | | (4,216 | ) | | | (0.0 | )(a) |
| | | | | | | | | | | | | | | | |
SEE NOTES TO CONSOLIDATED FINANCIAL STATEMENTS.
| | | | | | |
| | | |
| 46 | | | | J.P. MORGAN EXCHANGE-TRADED FUNDS | | OCTOBER 31, 2018 |
| | | | | | | | | | | | | | | | |
| REFERENCE ENTITY | | SHARES | | | NOTIONAL
VALUE($) (1) | | | NET UNREALIZED
APPRECIATION
(DEPRECIATION)($) (2) | | | PERCENTAGE
OF NET
ASSETS (%) | |
Long Positions — continued | | | | | |
| | | |
Common Stocks — continued | | | | | | | | | | | | | |
Electronic Equipment, Instruments & Components | | | | | | | | | | | | | |
Japan Aviation Electronics Industry Ltd.* | | | 17,000 | | | | 225,113 | | | | (51,305 | ) | | | (0.0 | )(a) |
Maruwa Co. Ltd. | | | 4,100 | | | | 231,712 | | | | (9,838 | ) | | | (0.0 | )(a) |
| | | | | | | | | | | | | | | | |
| | | 21,100 | | | | 456,825 | | | | (61,143 | ) | | | (0.0 | )(a) |
| | | | | | | | | | | | | | | | |
Entertainment | | | | | | | | | | | | | |
Capcom Co. Ltd. | | | 11,300 | | | | 235,548 | | | | (28,255 | ) | | | (0.0 | )(a) |
GungHo Online Entertainment, Inc.* | | | 141,400 | | | | 255,632 | | | | (17,791 | ) | | | (0.0 | )(a) |
| | | | | | | | | | | | | | | | |
| | | 152,700 | | | | 491,180 | | | | (46,046 | ) | | | (0.0 | )(a) |
| | | | | | | | | | | | | | | | |
Food & Staples Retailing | | | | | | | | | | | | | |
Matsumotokiyoshi Holdings Co. Ltd. | | | 7,000 | | | | 253,077 | | | | 1,394 | | | | 0.0 | (a) |
| | | | | | | | | | | | | | | | |
Food Products | | | | | | | | | | | | | |
Fuji Oil Holdings, Inc. | | | 8,800 | | | | 253,815 | | | | (10,707 | ) | | | (0.0 | )(a) |
| | | | | | | | | | | | | | | | |
Health Care Providers & Services | | | | | | | | | | | | | |
Alfresa Holdings Corp. | | | 10,200 | | | | 272,051 | | | | (618 | ) | | | (0.0 | )(a) |
Medipal Holdings Corp. | | | 12,900 | | | | 276,139 | | | | 4,306 | | | | 0.0 | (a) |
Suzuken Co. Ltd. | | | 5,800 | | | | 293,569 | | | | 22,139 | | | | 0.0 | (a) |
| | | | | | | | | | | | | | | | |
| | | 28,900 | | | | 841,759 | | | | 25,827 | | | | 0.0 | (a) |
| | | | | | | | | | | | | | | | |
Hotels, Restaurants & Leisure | | | | | | | | | | | | | |
Round One Corp. | | | 14,900 | | | | 176,726 | | | | (16,467 | ) | | | (0.0 | )(a) |
| | | | | | | | | | | | | | | | |
Household Durables | | | | | | | | | | | | | |
Nikon Corp. | | | 10,600 | | | | 184,786 | | | | (5,501 | ) | | | (0.0 | )(a) |
Sony Corp. | | | 4,200 | | | | 227,291 | | | | (11,772 | ) | | | (0.0 | )(a) |
Token Corp.* | | | 3,300 | | | | 213,768 | | | | 3,296 | | | | 0.0 | (a) |
| | | | | | | | | | | | | | | | |
| | | 18,100 | | | | 625,845 | | | | (13,977 | ) | | | (0.0 | )(a) |
| | | | | | | | | | | | | | | | |
Interactive Media & Services | | | | | | | | | | | | | |
Mixi, Inc. | | | 9,400 | | | | 205,389 | | | | (14,251 | ) | | | (0.0 | )(a) |
| | | | | | | | | | | | | | | | |
IT Services | | | | | | | | | | | | | |
NET One Systems Co. Ltd. | | | 12,100 | | | | 253,329 | | | | (8,417 | ) | | | (0.0 | )(a) |
Nihon Unisys Ltd. | | | 11,000 | | | | 241,057 | | | | (31,935 | ) | | | (0.0 | )(a) |
| | | | | | | | | | | | | | | | |
| | | 23,100 | | | | 494,386 | | | | (40,352 | ) | | | (0.0 | )(a) |
| | | | | | | | | | | | | | | | |
Machinery | | | | | | | | | | | | | |
DMG Mori Co. Ltd. | | | 17,200 | | | | 248,165 | | | | (21,452 | ) | | | (0.0 | )(a) |
Hitachi Construction Machinery Co. Ltd. | | | 9,200 | | | | 244,264 | | | | (41,898 | ) | | | (0.1 | ) |
Japan Steel Works Ltd. (The) | | | 12,200 | | | | 257,815 | | | | (15,625 | ) | | | (0.0 | )(a) |
OKUMA Corp. | | | 5,700 | | | | 284,604 | | | | (10,591 | ) | | | (0.0 | )(a) |
Star Micronics Co. Ltd.* | | | 19,200 | | | | 272,745 | | | | (24,609 | ) | | | (0.0 | )(a) |
Takeuchi Manufacturing Co. Ltd.* | | | 13,000 | | | | 268,868 | | | | (15,227 | ) | | | (0.0 | )(a) |
| | | | | | | | | | | | | | | | |
| | | 76,500 | | | | 1,576,461 | | | | (129,402 | ) | | | (0.1 | ) |
| | | | | | | | | | | | | | | | |
Oil, Gas & Consumable Fuels | | | | | | | | | | | | | |
Cosmo Energy Holdings Co. Ltd. | | | 7,000 | | | | 257,450 | | | | (25,327 | ) | | | (0.0 | )(a) |
JXTG Holdings, Inc. | | | 26,800 | | | | 181,087 | | | | (10,262 | ) | | | (0.0 | )(a) |
| | | | | | | | | | | | | | | | |
| | | 33,800 | | | | 438,537 | | | | (35,589 | ) | | | (0.0 | )(a) |
| | | | | | | | | | | | | | | | |
Pharmaceuticals | | | | | | | | | | | | | |
Astellas Pharma, Inc. | | | 9,400 | | | | 145,232 | | | | (10,570 | ) | | | (0.0 | )(a) |
Kaken Pharmaceutical Co. Ltd. | | | 5,700 | | | | 285,803 | | | | (13,877 | ) | | | (0.0 | )(a) |
Shionogi & Co. Ltd. | | | 1,800 | | | | 115,099 | | | | (3,163 | ) | | | (0.0 | )(a) |
Sumitomo Dainippon Pharma Co. Ltd. | | | 12,800 | | | | 267,439 | | | | (30,247 | ) | | | (0.1 | ) |
Taisho Pharmaceutical Holdings Co. Ltd. | | | 2,600 | | | | 277,229 | | | | (17,420 | ) | | | (0.0 | )(a) |
| | | | | | | | | | | | | | | | |
| | | 32,300 | | | | 1,090,802 | | | | (75,277 | ) | | | (0.1 | ) |
| | | | | | | | | | | | | | | | |
SEE NOTES TO CONSOLIDATED FINANCIAL STATEMENTS.
| | | | | | | | |
| | | |
| OCTOBER 31, 2018 | | J.P. MORGAN EXCHANGE-TRADED FUNDS | | | | | 47 | |
JPMorgan Diversified Alternatives ETF
CONSOLIDATED SCHEDULE OF PORTFOLIO INVESTMENTS
AS OF OCTOBER 31, 2018 (continued)
| | | | | | | | | | | | | | | | |
| REFERENCE ENTITY | | SHARES | | | NOTIONAL
VALUE($) (1) | | | NET UNREALIZED
APPRECIATION
(DEPRECIATION)($) (2) | | | PERCENTAGE
OF NET
ASSETS (%) | |
Long Positions — continued | | | | | |
| | | |
Common Stocks — continued | | | | | | | | | | | | | |
Road & Rail | | | | | | | | | | | | | |
Central Japan Railway Co. | | | 1,400 | | | | 268,672 | | | | (4,963 | ) | | | (0.0 | )(a) |
Sankyu, Inc. | | | 5,800 | | | | 273,381 | | | | (28,506 | ) | | | (0.0 | )(a) |
Seino Holdings Co. Ltd. | | | 16,500 | | | | 228,498 | | | | (375 | ) | | | (0.0 | )(a) |
| | | | | | | | | | | | | | | | |
| | | 23,700 | | | | 770,551 | | | | (33,844 | ) | | | (0.0 | )(a) |
| | | | | | | | | | | | | | | | |
Semiconductors & Semiconductor Equipment | | | | | | | | | | | | | |
Advantest Corp. | | | 13,400 | | | | 247,371 | | | | (16,134 | ) | | | (0.0 | )(a) |
| | | | | | | | | | | | | | | | |
Specialty Retail | | | | | | | | | | | | | |
Aoyama Trading Co. Ltd. | | | 7,700 | | | | 232,952 | | | | (4,580 | ) | | | (0.0 | )(a) |
Shimachu Co. Ltd. | | | 6,800 | | | | 178,253 | | | | (10,481 | ) | | | (0.0 | )(a) |
| | | | | | | | | | | | | | | | |
| | | 14,500 | | | | 411,205 | | | | (15,061 | ) | | | (0.0 | )(a) |
| | | | | | | | | | | | | | | | |
Technology Hardware, Storage & Peripherals | | | | | | | | | | | | | |
Brother Industries Ltd. | | | 14,600 | | | | 267,203 | | | | (9,859 | ) | | | (0.0 | )(a) |
| | | | | | | | | | | | | | | | |
Trading Companies & Distributors | | | | | | | | | | | | | |
ITOCHU Corp. | | | 14,300 | | | | 265,207 | | | | (8,279 | ) | | | (0.0 | )(a) |
Kanamoto Co. Ltd. | | | 7,800 | | | | 260,643 | | | | (9,833 | ) | | | (0.0 | )(a) |
Marubeni Corp. | | | 32,500 | | | | 263,532 | | | | (15,420 | ) | | | (0.0 | )(a) |
Mitsubishi Corp. | | | 9,100 | | | | 256,122 | | | | (18,801 | ) | | | (0.1 | ) |
Mitsui & Co. Ltd. | | | 15,700 | | | | 262,325 | | | | (14,200 | ) | | | (0.0 | )(a) |
Sojitz Corp. | | | 83,700 | | | | 281,480 | | | | (16,867 | ) | | | (0.0 | )(a) |
Sumitomo Corp. | | | 9,700 | | | | 147,117 | | | | (5,890 | ) | | | (0.0 | )(a) |
| | | | | | | | | | | | | | | | |
| | | 172,800 | | | | 1,736,426 | | | | (89,290 | ) | | | (0.1 | ) |
| | | | | | | | | | | | | | | | |
Wireless Telecommunication Services | | | | | | | | | | | | | |
KDDI Corp. | | | 10,600 | | | | 256,518 | | | | (24,668 | ) | | | (0.0 | )(a) |
NTT DOCOMO, Inc. | | | 6,300 | | | | 156,233 | | | | (7,870 | ) | | | (0.0 | )(a) |
| | | | | | | | | | | | | | | | |
| | | 16,900 | | | | 412,751 | | | | (32,538 | ) | | | (0.0 | )(a) |
| | | | | | | | | | | | | | | | |
Total Long Positions of Total Return Basket Swap | | | 1,197,400 | | | | 16,979,805 | | | | (894,113 | ) | | | (0.4 | ) |
| | | | | | | | | | | | | | | | |
| |
Short Positions | | | | | |
| | | |
Common Stocks | | | | | | | | | | | | | |
Auto Components | | | | | | | | | | | | | |
Toyo Tire & Rubber Co. Ltd. | | | (7,900 | ) | | | (131,784 | ) | | | 305 | | | | 0.0 | (a) |
| | | | | | | | | | | | | | | | |
Banks | | | | | | | | | | | | | |
Seven Bank Ltd. | | | (71,600 | ) | | | (223,768 | ) | | | (2,928 | ) | | | (0.0 | )(a) |
| | | | | | | | | | | | | | | | |
Building Products | | | | | | | | | | | | | |
TOTO Ltd. | | | (4,800 | ) | | | (171,726 | ) | | | 25,196 | | | | 0.0 | (a) |
| | | | | | | | | | | | | | | | |
Chemicals | | | | | | | | | | | | | |
Hitachi Chemical Co. Ltd. | | | (11,100 | ) | | | (174,959 | ) | | | 19,433 | | | | 0.0 | (a) |
Kansai Paint Co. Ltd. | | | (2,600 | ) | | | (38,418 | ) | | | 2,551 | | | | 0.0 | (a) |
Nippon Paint Holdings Co. Ltd. | | | (6,300 | ) | | | (196,792 | ) | | | 9,627 | | | | 0.0 | (a) |
Tokyo Ohka Kogyo Co. Ltd.* | | | (6,300 | ) | | | (168,732 | ) | | | 2,206 | | | | 0.0 | (a) |
| | | | | | | | | | | | | | | | |
| | | (26,300 | ) | | | (578,901 | ) | | | 33,817 | | | | 0.0 | (a) |
| | | | | | | | | | | | | | | | |
Commercial Services & Supplies | | | | | | | | | | | | | |
Sohgo Security Services Co. Ltd. | | | (4,500 | ) | | | (200,435 | ) | | | (5,145 | ) | | | (0.0 | )(a) |
Toppan Printing Co. Ltd. | | | (14,500 | ) | | | (204,993 | ) | | | 6,860 | | | | 0.0 | (a) |
| | | | | | | | | | | | | | | | |
| | | (19,000 | ) | | | (405,428 | ) | | | 1,715 | | | | 0.0 | (a) |
| | | | | | | | | | | | | | | | |
Construction & Engineering | | | | | | | | | | | | | |
Chiyoda Corp. | | | (25,300 | ) | | | (125,892 | ) | | | 55,864 | | | | 0.1 | |
| | | | | | | | | | | | | | | | |
SEE NOTES TO CONSOLIDATED FINANCIAL STATEMENTS.
| | | | | | |
| | | |
| 48 | | | | J.P. MORGAN EXCHANGE-TRADED FUNDS | | OCTOBER 31, 2018 |
| | | | | | | | | | | | | | | | |
| REFERENCE ENTITY | | SHARES | | | NOTIONAL
VALUE($) (1) | | | NET UNREALIZED
APPRECIATION
(DEPRECIATION)($) (2) | | | PERCENTAGE
OF NET
ASSETS (%) | |
Short Positions — continued | |
| | |
Common Stocks — continued | | | | | | | | | |
Containers & Packaging | | | | | | | | | | | | | |
FP Corp. | | | (3,900 | ) | | | (199,865 | ) | | | 5,523 | | | | 0.0 | (a) |
| | | | | | | | | | | | | | | | |
Electrical Equipment | | | | | | | | | | | | | |
GS Yuasa Corp. | | | (8,100 | ) | | | (166,270 | ) | | | 10,867 | | | | 0.0 | (a) |
Mabuchi Motor Co. Ltd. | | | (5,600 | ) | | | (199,200 | ) | | | (333 | ) | | | (0.0 | )(a) |
| | | | | | | | | | | | | | | | |
| | | (13,700 | ) | | | (365,470 | ) | | | 10,534 | | | | 0.0 | (a) |
| | | | | | | | | | | | | | | | |
Electronic Equipment, Instruments & Components | | | | | | | | | | | | | |
Hirose Electric Co. Ltd. | | | (1,800 | ) | | | (171,554 | ) | | | (2,041 | ) | | | (0.0 | )(a) |
Murata Manufacturing Co. Ltd. | | | (300 | ) | | | (46,691 | ) | | | (2,673 | ) | | | (0.0 | )(a) |
| | | | | | | | | | | | | | | | |
| | | (2,100 | ) | | | (218,245 | ) | | | (4,714 | ) | | | (0.0 | )(a) |
| | | | | | | | | | | | | | | | |
Food & Staples Retailing | | | | | | | | | | | | | |
Cosmos Pharmaceutical Corp. | | | (900 | ) | | | (183,957 | ) | | | 2,945 | | | | 0.0 | (a) |
| | | | | | | | | | | | | | | | |
Food Products | | | | | | | | | | | | | |
Calbee, Inc. | | | (6,200 | ) | | | (205,699 | ) | | | (3,099 | ) | | | (0.0 | )(a) |
Ezaki Glico Co. Ltd. | | | (3,900 | ) | | | (194,416 | ) | | | 4,696 | | | | 0.0 | (a) |
Kewpie Corp. | | | (8,300 | ) | | | (190,789 | ) | | | (2,005 | ) | | | (0.0 | )(a) |
| | | | | | | | | | | | | | | | |
| | | (18,400 | ) | | | (590,904 | ) | | | (408 | ) | | | (0.0 | )(a) |
| | | | | | | | | | | | | | | | |
Hotels, Restaurants & Leisure | | | | | | | | | | | | | |
Resorttrust, Inc. | | | (8,600 | ) | | | (132,444 | ) | | | (612 | ) | | | (0.0 | )(a) |
Toridoll Holdings Corp.* | | | (7,500 | ) | | | (127,033 | ) | | | 9,603 | | | | 0.0 | (a) |
| | | | | | | | | | | | | | | | |
| | | (16,100 | ) | | | (259,477 | ) | | | 8,991 | | | | 0.0 | (a) |
| | | | | | | | | | | | | | | | |
Household Durables | | | | | | | | | | | | | |
Fujitsu General Ltd. | | | (8,200 | ) | | | (122,835 | ) | | | 5,169 | | | | 0.0 | (a) |
Panasonic Corp. | | | (13,700 | ) | | | (147,021 | ) | | | 3,832 | | | | 0.0 | (a) |
| | | | | | | | | | | | | | | | |
| | | (21,900 | ) | | | (269,856 | ) | | | 9,001 | | | | 0.0 | (a) |
| | | | | | | | | | | | | | | | |
Industrial Conglomerates | | | | | | | | | | | | | |
Seibu Holdings, Inc. | | | (10,800 | ) | | | (195,940 | ) | | | 3,102 | | | | 0.0 | (a) |
| | | | | | | | | | | | | | | | |
Insurance | | | | | | | | | | | | | |
T&D Holdings, Inc. | | | (11,700 | ) | | | (187,033 | ) | | | 12,592 | | | | 0.0 | (a) |
| | | | | | | | | | | | | | | | |
Interactive Media & Services | | | | | | | | | | | | | |
LINE Corp.* | | | (1,000 | ) | | | (31,882 | ) | | | 4,118 | | | | 0.0 | (a) |
| | | | | | | | | | | | | | | | |
IT Services | | | | | | | | | | | | | |
GMO internet, Inc. | | | (2,500 | ) | | | (35,726 | ) | | | 763 | | | | 0.0 | (a) |
Itochu Techno-Solutions Corp. | | | (9,200 | ) | | | (174,469 | ) | | | 15,102 | | | | 0.0 | (a) |
| | | | | | | | | | | | | | | | |
| | | (11,700 | ) | | | (210,195 | ) | | | 15,865 | | | | 0.0 | (a) |
| | | | | | | | | | | | | | | | |
Leisure Products | | | | | | | | | | | | | |
Bandai Namco Holdings, Inc. | | | (4,000 | ) | | | (142,299 | ) | | | 8,449 | | | | 0.0 | (a) |
| | | | | | | | | | | | | | | | |
Machinery | | | | | | | | | | | | | |
Daifuku Co. Ltd. | | | (4,000 | ) | | | (171,785 | ) | | | 12,047 | | | | 0.0 | (a) |
Kawasaki Heavy Industries Ltd. | | | (7,500 | ) | | | (177,738 | ) | | | 32,409 | | | | 0.1 | |
MISUMI Group, Inc. | | | (8,100 | ) | | | (162,330 | ) | | | 19,672 | | | | 0.0 | (a) |
Mitsui E&S Holdings Co. Ltd.* | | | (11,100 | ) | | | (186,393 | ) | | | 19,654 | | | | 0.0 | (a) |
Miura Co. Ltd. | | | (6,300 | ) | | | (153,858 | ) | | | 21,345 | | | | 0.0 | (a) |
NGK Insulators Ltd. | | | (12,400 | ) | | | (174,519 | ) | | | 11,828 | | | | 0.0 | (a) |
| | | | | | | | | | | | | | | | |
| | | (49,400 | ) | | | (1,026,623 | ) | | | 116,955 | | | | 0.1 | |
| | | | | | | | | | | | | | | | |
Marine | | | | | | | | | | | | | |
Kawasaki Kisen Kaisha Ltd.* | | | (3,300 | ) | | | (43,974 | ) | | | 911 | | | | 0.0 | (a) |
| | | | | | | | | | | | | | | | |
SEE NOTES TO CONSOLIDATED FINANCIAL STATEMENTS.
| | | | | | | | |
| | | |
| OCTOBER 31, 2018 | | J.P. MORGAN EXCHANGE-TRADED FUNDS | | | | | 49 | |
JPMorgan Diversified Alternatives ETF
CONSOLIDATED SCHEDULE OF PORTFOLIO INVESTMENTS
AS OF OCTOBER 31, 2018 (continued)
| | | | | | | | | | | | | | | | |
| REFERENCE ENTITY | | SHARES | | | NOTIONAL
VALUE($) (1) | | | NET UNREALIZED
APPRECIATION
(DEPRECIATION)($) (2) | | | PERCENTAGE
OF NET
ASSETS (%) | |
Short Positions — continued | |
| | |
Common Stocks — continued | | | | | | | | | |
Metals & Mining | | | | | | | | | | | | | |
Hitachi Metals Ltd. | | | (16,300 | ) | | | (191,671 | ) | | | 3,722 | | | | 0.0 | (a) |
Mitsubishi Materials Corp. | | | (6,800 | ) | | | (188,257 | ) | | | 7,672 | | | | 0.0 | (a) |
UACJ Corp. | | | (8,300 | ) | | | (180,926 | ) | | | 10,619 | | | | 0.0 | (a) |
| | | | | | | | | | | | | | | | |
| | | (31,400 | ) | | | (560,854 | ) | | | 22,013 | | | | 0.0 | (a) |
| | | | | | | | | | | | | | | | |
Multiline Retail | | | | | | | | | | | | | |
Don Quijote Holdings Co. Ltd. | | | (2,600 | ) | | | (155,317 | ) | | | 2,449 | | | | 0.0 | (a) |
Takashimaya Co. Ltd. | | | (10,000 | ) | | | (157,377 | ) | | | (1,995 | ) | | | (0.0 | )(a) |
| | | | | | | | | | | | | | | | |
| | | (12,600 | ) | | | (312,694 | ) | | | 454 | | | | 0.0 | (a) |
| | | | | | | | | | | | | | | | |
Paper & Forest Products | | | | | | | | | | | | | |
Nippon Paper Industries Co. Ltd. | | | (11,000 | ) | | | (199,296 | ) | | | (3,607 | ) | | | (0.0 | )(a) |
| | | | | | | | | | | | | | | | |
Pharmaceuticals | | | | | | | | | | | | | |
Nippon Shinyaku Co. Ltd. | | | (3,100 | ) | | | (178,099 | ) | | | 15,441 | | | | 0.0 | (a) |
Ono Pharmaceutical Co. Ltd. | | | (7,200 | ) | | | (163,394 | ) | | | 19,043 | | | | 0.0 | (a) |
| | | | | | | | | | | | | | | | |
| | | (10,300 | ) | | | (341,493 | ) | | | 34,484 | | | | 0.0 | (a) |
| | | | | | | | | | | | | | | | |
Professional Services | | | | | | | | | | | | | |
Persol Holdings Co. Ltd. | | | (8,400 | ) | | | (159,362 | ) | | | 15,451 | | | | 0.0 | (a) |
| | | | | | | | | | | | | | | | |
Road & Rail | | | | | | | | | | | | | |
Keikyu Corp. | | | (13,500 | ) | | | (199,799 | ) | | | 11,544 | | | | 0.0 | (a) |
| | | | | | | | | | | | | | | | |
Semiconductors & Semiconductor Equipment | | | | | | | | | | | | | |
Renesas Electronics Corp.* | | | (200 | ) | | | (1,053 | ) | | | 136 | | | | 0.0 | (a) |
Rohm Co. Ltd. | | | (2,700 | ) | | | (189,822 | ) | | | (9,908 | ) | | | (0.0 | )(a) |
| | | | | | | | | | | | | | | | |
| | | (2,900 | ) | | | (190,875 | ) | | | (9,772 | ) | | | (0.0 | )(a) |
| | | | | | | | | | | | | | | | |
Specialty Retail | | | | | | | | | | | | | |
Nitori Holdings Co. Ltd. | | | (1,100 | ) | | | (143,631 | ) | | | 4,536 | | | | 0.0 | (a) |
| | | | | | | | | | | | | | | | |
Technology Hardware, Storage & Peripherals | | | | | | | | | | | | | |
Seiko Epson Corp. | | | (12,400 | ) | | | (199,779 | ) | | | 10,287 | | | | 0.0 | (a) |
| | | | | | | | | | | | | | | | |
Wireless Telecommunication Services | | | | | | | | | | | | | |
SoftBank Group Corp. | | | (2,500 | ) | | | (197,847 | ) | | | 16,095 | | | | 0.0 | (a) |
| | | | | | | | | | | | | | | | |
Total Short Positions of Total Return Basket Swap | | | (429,900 | ) | | | (8,068,849 | ) | | | 409,318 | | | | 0.2 | |
| | | | | | | | | | | | | | | | |
Total of Long and Short Positions of Total Return Basket Swap | | | 767,500 | | | | 8,910,956 | | | | (484,795 | ) | | | (0.2 | ) |
| | | | | | | | | | | | | | | | |
| | | | | | | | | | | | | | | | | | | | |
| COUNTERPARTY | | DESCRIPTION | | TERMINATION
DATE | | NOTIONAL
VALUE (1) | | | NET UNREALIZED
APPRECIATION
(DEPRECIATION) (2) | | | NET CASH
AND OTHER
RECEIVABLES
(PAYABLES) | | | VALUE | |
| UBS | | The Fund receives the total return on a portfolio of long and short equity positions and pays or receives the net of one day LIBID and one month LIBOR on long positions and short positions respectively, plus or minus a specified spread (rates range from 0.00% to 0.25%), which is denominated in GBP based on the local currencies of the positions within the swaps. | | 9/12/2019 | | $ | 2,554,275 | | | $ | (20,675 | ) | | $ | (118,629 | ) | | $ | (139,304 | ) |
| | | | | | | | | | | | | | | | | | | | |
SEE NOTES TO CONSOLIDATED FINANCIAL STATEMENTS.
| | | | | | |
| | | |
| 50 | | | | J.P. MORGAN EXCHANGE-TRADED FUNDS | | OCTOBER 31, 2018 |
| | | | | | | | | | | | | | | | |
| REFERENCE ENTITY | | SHARES | | | NOTIONAL
VALUE($) (1) | | | NET UNREALIZED
APPRECIATION
(DEPRECIATION)($) (2) | | | PERCENTAGE
OF NET
ASSETS (%) | |
Long Positions | |
|
Common Stocks | |
Aerospace & Defense | |
Meggitt plc | | | 40,225 | | | | 272,146 | | | | 1,942 | | | | 0.0 | (a) |
| | | | | | | | | | | | | | | | |
Air Freight & Logistics | |
Royal Mail plc | | | 48,790 | | | | 223,991 | | | | 5,804 | | | | 0.0 | (a) |
| | | | | | | | | | | | | | | | |
Airlines | |
Wizz Air Holdings plc* (b) | | | 7,868 | | | | 258,062 | | | | 10,784 | | | | 0.0 | (a) |
| | | | | | | | | | | | | | | | |
Distributors | |
Inchcape plc | | | 21,590 | | | | 149,115 | | | | (409 | ) | | | (0.0 | )(a) |
| | | | | | | | | | | | | | | | |
Energy Equipment & Services | |
Hunting plc | | | 29,690 | | | | 254,752 | | | | (15,679 | ) | | | (0.0 | )(a) |
Petrofac Ltd. | | | 19,100 | | | | 140,452 | | | | (2,866 | ) | | | (0.0 | )(a) |
| | | | | | | | | | | | | | | | |
| | | 48,790 | | | | 395,204 | | | | (18,545 | ) | | | (0.0 | )(a) |
| | | | | | | | | | | | | | | | |
Equity Real Estate Investment Trusts (REITs) | |
UNITE Group plc (The) | | | 24,402 | | | | 265,694 | | | | (3,133 | ) | | | (0.0 | )(a) |
| | | | | | | | | | | | | | | | |
Food & Staples Retailing | |
J Sainsbury plc | | | 69,528 | | | | 276,240 | | | | 5,517 | | | | 0.0 | (a) |
Wm Morrison Supermarkets plc | | | 84,505 | | | | 267,728 | | | | (1,467 | ) | | | (0.0 | )(a) |
| | | | | | | | | | | | | | | | |
| | | 154,033 | | | | 543,968 | | | | 4,050 | | | | 0.0 | (a) |
| | | | | | | | | | | | | | | | |
Food Products | |
Tate & Lyle plc | | | 31,151 | | | | 267,839 | | | | 6,099 | | | | 0.0 | (a) |
| | | | | | | | | | | | | | | | |
Hotels, Restaurants & Leisure | |
Carnival plc | | | 2,633 | | | | 143,513 | | | | (3,534 | ) | | | (0.0 | )(a) |
William Hill plc | | | 52,989 | | | | 142,444 | | | | (13,662 | ) | | | (0.0 | )(a) |
| | | | | | | | | | | | | | | | |
| | | 55,622 | | | | 285,957 | | | | (17,196 | ) | | | (0.0 | )(a) |
| | | | | | | | | | | | | | | | |
Household Durables | |
Berkeley Group Holdings plc | | | 3,230 | | | | 144,359 | | | | 6,544 | | | | 0.0 | (a) |
Persimmon plc | | | 6,985 | | | | 204,431 | | | | 7,117 | | | | 0.0 | (a) |
Redrow plc | | | 23,163 | | | | 156,397 | | | | (97 | ) | | | (0.0 | )(a) |
Taylor Wimpey plc | | | 99,541 | | | | 204,958 | | | | 4,500 | | | | 0.0 | (a) |
| | | | | | | | | | | | | | | | |
| | | 132,919 | | | | 710,145 | | | | 18,064 | | | | 0.0 | (a) |
| | | | | | | | | | | | | | | | |
Machinery | |
Bodycote plc | | | 22,086 | | | | 224,288 | | | | (850 | ) | | | (0.0 | )(a) |
Vesuvius plc | | | 34,459 | | | | 239,080 | | | | (7,446 | ) | | | (0.0 | )(a) |
| | | | | | | | | | | | | | | | |
| | | 56,545 | | | | 463,368 | | | | (8,296 | ) | | | (0.0 | )(a) |
| | | | | | | | | | | | | | | | |
Metals & Mining | |
Antofagasta plc | | | 25,415 | | | | 254,405 | | | | 4,961 | | | | 0.0 | (a) |
Centamin plc | | | 154,714 | | | | 196,471 | | | | (7,085 | ) | | | (0.0 | )(a) |
Rio Tinto plc | | | 3,392 | | | | 164,684 | | | | 2,728 | | | | 0.0 | (a) |
| | | | | | | | | | | | | | | | |
| | | 183,521 | | | | 615,560 | | | | 604 | | | | 0.0 | (a) |
| | | | | | | | | | | | | | | | |
Multi-Utilities | | | | | | | | | | | | | |
Centrica plc | | | 139,793 | | | | 262,571 | | | | (431 | ) | | | (0.0 | )(a) |
| | | | | | | | | | | | | | | | |
Oil, Gas & Consumable Fuels | | | | | | | | | | | | | |
BP plc | | | 39,849 | | | | 287,858 | | | | 5,196 | | | | 0.0 | (a) |
Royal Dutch Shell plc | | | 8,233 | | | | 268,502 | | | | 1,926 | | | | 0.0 | (a) |
Tullow Oil plc* | | | 94,429 | | | | 270,923 | | | | (13,826 | ) | | | (0.0 | )(a) |
| | | | | | | | | | | | | | | | |
| | | 142,511 | | | | 827,283 | | | | (6,704 | ) | | | (0.0 | )(a) |
| | | | | | | | | | | | | | | | |
Pharmaceuticals | | | | | | | | | | | | | |
Hikma Pharmaceuticals plc | | | 11,601 | | | | 281,382 | | | | 16,774 | | | | 0.0 | (a) |
| | | | | | | | | | | | | | | | |
Total Long Positions of Total Return Basket Swap | | | 1,099,361 | | | | 5,822,285 | | | | 9,407 | | | | 0.0 | (a) |
| | | | | | | | | | | | | | | | |
SEE NOTES TO CONSOLIDATED FINANCIAL STATEMENTS.
| | | | | | | | |
| | | |
| OCTOBER 31, 2018 | | J.P. MORGAN EXCHANGE-TRADED FUNDS | | | | | 51 | |
JPMorgan Diversified Alternatives ETF
CONSOLIDATED SCHEDULE OF PORTFOLIO INVESTMENTS
AS OF OCTOBER 31, 2018 (continued)
| | | | | | | | | | | | | | | | |
| REFERENCE ENTITY | | SHARES | | | NOTIONAL
VALUE($) (1) | | | NET UNREALIZED
APPRECIATION
(DEPRECIATION)($) (2) | | | PERCENTAGE
OF NET
ASSETS (%) | |
| |
Short Positions | | | | | |
| | | |
Common Stocks | | | | | | | | | | | | | |
Banks | | | | | | | | | | | | | |
Metro Bank plc* | | | (5,140 | ) | | | (145,863 | ) | | | 18,556 | | | | 0.0 | (a) |
| | | | | | | | | | | | | | | | |
Containers & Packaging | | | | | | | | | | | | | |
DS Smith plc | | | (32,991 | ) | | | (165,535 | ) | | | 5,123 | | | | 0.0 | (a) |
RPC Group plc | | | (18,548 | ) | | | (180,791 | ) | | | 2,657 | | | | 0.0 | (a) |
| | | | | | | | | | | | | | | | |
| | | (51,539 | ) | | | (346,326 | ) | | | 7,780 | | | | 0.0 | (a) |
| | | | | | | | | | | | | | | | |
Diversified Telecommunication Services | | | | | | | | | | | | | |
BT Group plc | | | (62,768 | ) | | | (192,196 | ) | | | 4,315 | | | | 0.0 | (a) |
Inmarsat plc | | | (29,927 | ) | | | (174,038 | ) | | | 19,196 | | | | 0.0 | (a) |
| | | | | | | | | | | | | | | | |
| | | (92,695 | ) | | | (366,234 | ) | | | 23,511 | | | | 0.0 | (a) |
| | | | | | | | | | | | | | | | |
Electrical Equipment | | | | | | | | | | | | | |
Melrose Industries plc | | | (76,482 | ) | | | (164,635 | ) | | | (4,079 | ) | | | (0.0 | )(a) |
| | | | | | | | | | | | | | | | |
Energy Equipment & Services | | | | | | | | | | | | | |
John Wood Group plc | | | (20,251 | ) | | | (184,573 | ) | | | 5,528 | | | | 0.0 | (a) |
| | | | | | | | | | | | | | | | |
Health Care Providers & Services | | | | | | | | | | | | | |
NMC Health plc | | | (4,389 | ) | | | (197,898 | ) | | | (21,958 | ) | | | (0.0 | )(a) |
Spire Healthcare Group plc (b) | | | (137,804 | ) | | | (206,790 | ) | | | (8,155 | ) | | | (0.0 | )(a) |
| | | | | | | | | | | | | | | | |
| | | (142,193 | ) | | | (404,688 | ) | | | (30,113 | ) | | | (0.0 | )(a) |
| | | | | | | | | | | | | | | | |
Household Durables | | | | | | | | | | | | | |
Crest Nicholson Holdings plc | | | (32,371 | ) | | | (141,011 | ) | | | (17,022 | ) | | | (0.0 | )(a) |
| | | | | | | | | | | | | | | | |
Metals & Mining | | | | | | | | | | | | | |
Fresnillo plc | | | (566 | ) | | | (6,138 | ) | | | 375 | | | | 0.0 | (a) |
| | | | | | | | | | | | | | | | |
Multi-Utilities | | | | | | | | | | | | | |
National Grid plc | | | (19,490 | ) | | | (205,893 | ) | | | (1,889 | ) | | | (0.0 | )(a) |
| | | | | | | | | | | | | | | | |
Professional Services | | | | | | | | | | | | | |
Capita plc* | | | (108,685 | ) | | | (177,999 | ) | | | (5,972 | ) | | | (0.0 | )(a) |
| | | | | | | | | | | | | | | | |
Real Estate Management & Development | | | | | | | | | | | | | |
Capital & Counties Properties plc | | | (57,534 | ) | | | (183,571 | ) | | | (7,998 | ) | | | (0.0 | )(a) |
| | | | | | | | | | | | | | | | |
Software | | | | | | | | | | | | | |
AVEVA Group plc | | | (5,231 | ) | | | (174,978 | ) | | | 3,445 | | | | 0.0 | (a) |
Sage Group plc (The) | | | (30,482 | ) | | | (211,938 | ) | | | 5,155 | | | | 0.0 | (a) |
| | | | | | | | | | | | | | | | |
| | | (35,713 | ) | | | (386,916 | ) | | | 8,600 | | | | 0.0 | (a) |
| | | | | | | | | | | | | | | | |
Specialty Retail | | | | | | | | | | | | | |
Kingfisher plc | | | (41,680 | ) | | | (135,342 | ) | | | (2,929 | ) | | | (0.0 | )(a) |
| | | | | | | | | | | | | | | | |
Trading Companies & Distributors | | | | | | | | | | | | | |
Travis Perkins plc | | | (15,170 | ) | | | (214,257 | ) | | | (25,285 | ) | | | (0.0 | )(a) |
| | | | | | | | | | | | | | | | |
Water Utilities | | | | | | | | | | | | | |
Severn Trent plc | | | (8,608 | ) | | | (204,564 | ) | | | 855 | | | | 0.0 | (a) |
| | | | | | | | | | | | | | | | |
Total Short Positions of Total Return Basket Swap | | | (708,117 | ) | | | (3,268,010 | ) | | | (30,082 | ) | | | 0.0 | (a) |
| | | | | | | | | | | | | | | | |
Total of Long and Short Positions of Total Return Basket Swap | | | 391,244 | | | | 2,554,275 | | | | (20,675 | ) | | | 0.0 | (a) |
| | | | | | | | | | | | | | | | |
SEE NOTES TO CONSOLIDATED FINANCIAL STATEMENTS.
| | | | | | |
| | | |
| 52 | | | | J.P. MORGAN EXCHANGE-TRADED FUNDS | | OCTOBER 31, 2018 |
| | | | | | | | | | | | | | | | | | | | | | |
| COUNTERPARTY | | DESCRIPTION | | TERMINATION
DATE | | | NOTIONAL
VALUE (1) | | | NET UNREALIZED
APPRECIATION
(DEPRECIATION) (2) | | | NET CASH
AND OTHER
RECEIVABLES
(PAYABLES) | | | VALUE | |
UBS | | The Fund receives the total return on a portfolio of long and short equity positions and pays or receives the net of one day CORRA and one month CDOR on long positions and short positions respectively, plus or minus a specified spread (rates range from 0.00% to 0.15%), which is denominated in CAD based on the local currencies of the positions within the swaps. | | | 9/12/2019 | | | $ | 2,463,093 | | | $ | (11,315 | ) | | $ | (519,209 | ) | | $ | (530,524 | ) |
| | | | | | | | | | | | | | | | | | | | | | |
| | | | | | | | | | | | | | | | |
| REFERENCE ENTITY | | SHARES | | | NOTIONAL
VALUE($) (1) | | | NET UNREALIZED
APPRECIATION
(DEPRECIATION)($) (2) | | | PERCENTAGE
OF NET
ASSETS (%) | |
Long Positions | | | | | |
| | | |
Common Stocks | | | | | | | | | | | | | |
Auto Components | | | | | | | | | | | | | |
Magna International, Inc. | | | 4,531 | | | | 223,065 | | | | 9,717 | | | | 0.0 | (a) |
Banks | | | | | | | | | | | | | |
Canadian Imperial Bank of Commerce | | | 3,355 | | | | 289,716 | | | | (5,254 | ) | | | (0.0 | )(a) |
Chemicals | | | | | | | | | | | | | |
Methanex Corp. | | | 4,431 | | | | 286,940 | | | | (33,243 | ) | | | (0.0 | )(a) |
Food & Staples Retailing | | | | | | | | | | | | | |
Empire Co. Ltd. | | | 15,858 | | | | 288,503 | | | | 11,894 | | | | 0.0 | (a) |
IT Services | | | | | | | | | | | | | |
CGI Group, Inc.* | | | 4,797 | | | | 296,248 | | | | 8,754 | | | | 0.0 | (a) |
Leisure Products | | | | | | | | | | | | | |
BRP, Inc. | | | 5,839 | | | | 234,899 | | | | (17,665 | ) | | | (0.0 | )(a) |
Metals & Mining | | | | | | | | | | | | | |
Hudbay Minerals, Inc. | | | 79,693 | | | | 312,973 | | | | (32,215 | ) | | | (0.0 | )(a) |
Teck Resources Ltd. | | | 14,897 | | | | 307,909 | | | | (1,125 | ) | | | (0.0 | )(a) |
| | | | | | | | | | | | | | | | |
| | | 94,590 | | | | 620,882 | | | | (33,340 | ) | | | (0.0 | )(a) |
| | | | | | | | | | | | | | | | |
Oil, Gas & Consumable Fuels | | | | | | | | | | | | | |
Enerplus Corp. | | | 31,346 | | | | 291,685 | | | | (29,979 | ) | | | (0.1 | ) |
Imperial Oil Ltd. | | | 9,106 | | | | 284,431 | | | | (14,703 | ) | | | (0.0 | )(a) |
Parex Resources, Inc.* | | | 19,860 | | | | 289,199 | | | | (23,340 | ) | | | (0.0 | )(a) |
Suncor Energy, Inc. | | | 8,647 | | | | 290,061 | | | | (12,557 | ) | | | (0.0 | )(a) |
| | | | | | | | | | | | | | | | |
| | | 68,959 | | | | 1,155,376 | | | | (80,579 | ) | | | (0.1 | ) |
| | | | | | | | | | | | | | | | |
Paper & Forest Products | | | | | | | | | | | | | |
Canfor Corp.* | | | 19,551 | | | | 280,838 | | | | (12,599 | ) | | | (0.0 | )(a) |
Interfor Corp.* | | | 26,268 | | | | 290,525 | | | | (25,360 | ) | | | (0.0 | )(a) |
Norbord, Inc. | | | 11,646 | | | | 296,978 | | | | (3,722 | ) | | | (0.0 | )(a) |
West Fraser Timber Co. Ltd. | | | 5,649 | | | | 283,813 | | | | 9,098 | | | | 0.0 | (a) |
| | | | | | | | | | | | | | | | |
| | | 63,114 | | | | 1,152,154 | | | | (32,583 | ) | | | (0.0 | )(a) |
| | | | | | | | | | | | | | | | |
Real Estate Management & Development | | | | | | | | | | | | | |
First Capital Realty, Inc. | | | 19,513 | | | | 291,113 | | | | 10,132 | | | | 0.0 | (a) |
| | | | | | | | | | | | | | | | |
Textiles, Apparel & Luxury Goods | | | | | | | | | | | | | |
Gildan Activewear, Inc. | | | 7,871 | | | | 235,272 | | | | 4,127 | | | | 0.0 | (a) |
| | | | | | | | | | | | | | | | |
Thrifts & Mortgage Finance | | | | | | | | | | | | | |
Genworth MI Canada, Inc. | | | 9,427 | | | | 309,424 | | | | 23,893 | | | | 0.0 | (a) |
| | | | | | | | | | | | | | | | |
Total Long Positions of Total Return Basket Swap | | | 302,285 | | | | 5,383,592 | | | | (134,147 | ) | | | (0.1 | ) |
| | | | | | | | | | | | | | | | |
SEE NOTES TO CONSOLIDATED FINANCIAL STATEMENTS.
| | | | | | | | |
| | | |
| OCTOBER 31, 2018 | | J.P. MORGAN EXCHANGE-TRADED FUNDS | | | | | 53 | |
JPMorgan Diversified Alternatives ETF
CONSOLIDATED SCHEDULE OF PORTFOLIO INVESTMENTS
AS OF OCTOBER 31, 2018 (continued)
| | | | | | | | | | | | | | | | |
| REFERENCE ENTITY | | SHARES | | | NOTIONAL
VALUE($) (1) | | | NET UNREALIZED
APPRECIATION
(DEPRECIATION)($) (2) | | | PERCENTAGE
OF NET
ASSETS (%) | |
| |
Short Positions | | | | | |
| | | |
Common Stocks | | | | | | | | | | | | | |
Capital Markets | | | | | | | | | | | | | |
Thomson Reuters Corp. | | | (4,227 | ) | | | (196,732 | ) | | | 188 | | | | 0.0 | (a) |
| | | | | | | | | | | | | | | | |
Construction & Engineering | | | | | | | | | | | | | |
SNC-Lavalin Group, Inc. | | | (5,053 | ) | | | (180,403 | ) | | | 3,459 | | | | 0.0 | (a) |
| | | | | | | | | | | | | | | | |
Diversified Financial Services | | | | | | | | | | | | | |
Onex Corp. | | | (2,917 | ) | | | (191,778 | ) | | | (6,411 | ) | | | (0.0 | )(a) |
| | | | | | | | | | | | | | | | |
Entertainment | | | | | | | | | | | | | |
Cineplex, Inc. | | | (5,412 | ) | | | (149,190 | ) | | | (441 | ) | | | (0.0 | )(a) |
| | | | | | | | | | | | | | | | |
Food Products | | | | | | | | | | | | | |
Saputo, Inc. | | | (6,386 | ) | | | (194,571 | ) | | | (7,063 | ) | | | (0.0 | )(a) |
| | | | | | | | | | | | | | | | |
Gas Utilities | | | | | | | | | | | | | |
AltaGas Ltd. | | | (10,322 | ) | | | (129,765 | ) | | | 31,090 | | | | 0.0 | (a) |
| | | | | | | | | | | | | | | | |
Metals & Mining | | | | | | | | | | | | | |
Agnico Eagle Mines Ltd. | | | (496 | ) | | | (17,520 | ) | | | 737 | | | | 0.0 | (a) |
Goldcorp, Inc. | | | (2,117 | ) | | | (19,120 | ) | | | 3,875 | | | | 0.0 | (a) |
Kinross Gold Corp.* | | | (70,015 | ) | | | (181,892 | ) | | | 17,122 | | | | 0.0 | (a) |
Yamana Gold, Inc. | | | (76,825 | ) | | | (174,490 | ) | | | 31,090 | | | | 0.0 | (a) |
| | | | | | | | | | | | | | | | |
| | | (149,453 | ) | | | (393,022 | ) | | | 52,824 | | | | 0.0 | (a) |
| | | | | | | | | | | | | | | | |
Multi-Utilities | | | | | | | | | | | | | |
Algonquin Power & Utilities Corp. | | | (20,670 | ) | | | (206,315 | ) | | | 927 | | | | 0.0 | (a) |
Canadian Utilities Ltd. | | | (8,606 | ) | | | (204,159 | ) | | | (6,821 | ) | | | (0.0 | )(a) |
| | | | | | | | | | | | | | | | |
| | | (29,276 | ) | | | (410,474 | ) | | | (5,894 | ) | | | (0.0 | )(a) |
| | | | | | | | | | | | | | | | |
Oil, Gas & Consumable Fuels | | | | | | | | | | | | | |
ARC Resources Ltd. | | | (19,154 | ) | | | (178,380 | ) | | | 8,949 | | | | 0.0 | (a) |
Pembina Pipeline Corp. | | | (5,854 | ) | | | (189,345 | ) | | | 6,992 | | | | 0.0 | (a) |
PrairieSky Royalty Ltd. | | | (11,299 | ) | | | (171,659 | ) | | | 15,860 | | | | 0.1 | |
Seven Generations Energy Ltd.* | | | (18,345 | ) | | | (196,626 | ) | | | 2,715 | | | | 0.0 | (a) |
TransCanada Corp. | | | (4,883 | ) | | | (184,125 | ) | | | 11,129 | | | | 0.0 | (a) |
Whitecap Resources, Inc. | | | (31,568 | ) | | | (154,429 | ) | | | 9,435 | | | | 0.0 | (a) |
| | | | | | | | | | | | | | | | |
| | | (91,103 | ) | | | (1,074,564 | ) | | | 55,080 | | | | 0.1 | |
| | | | | | | | | | | | | | | | |
Total Short Positions of Total Return Basket Swap | | | (304,149 | ) | | | (2,920,499 | ) | | | 122,832 | | | | 0.1 | |
| | | | | | | | | | | | | | | | |
Total of Long and Short Positions of Total Return Basket Swap | | | (1,864 | ) | | | 2,463,093 | | | | (11,315 | ) | | | 0.0 | (a) |
| | | | | | | | | | | | | | | | |
| | | | | | | | | | | | | | | | | | | | | | |
| COUNTERPARTY | | DESCRIPTION | | TERMINATION
DATE | | | NOTIONAL
VALUE (1) | | | NET UNREALIZED
APPRECIATION
(DEPRECIATION) (2) | | | NET CASH
AND OTHER
RECEIVABLES
(PAYABLES) | | | VALUE | |
UBS | | The Fund receives the total return on a portfolio of long and short equity positions and pays or receives the net of one month LIBOR on long positions and short positions respectively, plus or minus a specified spread (rates range from 0.00% to 0.25%), which is denominated in CHF based on the local currencies of the positions within the swaps. | | | 9/12/2019 | | | $ | 413,029 | | | $ | 17,892 | | | $ | (54,937 | ) | | $ | (37,045 | ) |
| | | | | | | | | | | | | | | | | | | | | | |
SEE NOTES TO CONSOLIDATED FINANCIAL STATEMENTS.
| | | | | | |
| | | |
| 54 | | | | J.P. MORGAN EXCHANGE-TRADED FUNDS | | OCTOBER 31, 2018 |
| | | | | | | | | | | | | | | | |
| REFERENCE ENTITY | | SHARES | | | NOTIONAL
VALUE($) (1) | | | NET UNREALIZED
APPRECIATION
(DEPRECIATION)($) (2) | | | PERCENTAGE
OF NET
ASSETS (%) | |
Long Positions | | | | | |
| | | |
Common Stocks | | | | | | | | | | | | | |
Diversified Telecommunication Services | | | | | | | | | | | | | |
Sunrise Communications Group AG* (b) | | | 1,427 | | | | 125,607 | | | | (4,867 | ) | | | (0.0 | )(a) |
| | | | | | | | | | | | | | | | |
Food Products | | | | | | | | | | | | | |
Barry Callebaut AG (Registered) | | | 141 | | | | 275,595 | | | | 3,251 | | | | 0.0 | (a) |
| | | | | | | | | | | | | | | | |
Health Care Equipment & Supplies | | | | | | | | | | | | | |
Sonova Holding AG (Registered) | | | 1,423 | | | | 232,069 | | | | 7,120 | | | | 0.0 | (a) |
| | | | | | | | | | | | | | | | |
Machinery | | | | | | | | | | | | | |
Georg Fischer AG (Registered) | | | 233 | | | | 216,771 | | | | (916 | ) | | | (0.0 | )(a) |
| | | | | | | | | | | | | | | | |
Pharmaceuticals | | | | | | | | | | | | | |
Roche Holding AG | | | 1,092 | | | | 265,856 | | | | 6,262 | | | | 0.0 | (a) |
| | | | | | | | | | | | | | | | |
Real Estate Management & Development | | | | | | | | | | | | | |
PSP Swiss Property AG (Registered) | | | 2,794 | | | | 269,585 | | | | 3,662 | | | | 0.0 | (a) |
Swiss Prime Site AG (Registered)* | | | 3,266 | | | | 265,014 | | | | 3,635 | | | | 0.0 | (a) |
| | | | | | | | | | | | | | | | |
| | | 6,060 | | | | 534,599 | | | | 7,297 | | | | 0.0 | (a) |
| | | | | | | | | | | | | | | | |
Total Long Positions of Total Return Basket Swap | | | 10,376 | | | | 1,650,497 | | | | 18,147 | | | | 0.0 | (a) |
| | | | | | | | | | | | | | | | |
| |
Short Positions | | | | | |
| | | |
Common Stocks | | | | | | | | | | | | | |
Air Freight & Logistics | |
Panalpina Welttransport Holding AG (Registered) | | | (1,710 | ) | | | (208,963 | ) | | | 4,009 | | | | 0.0 | (a) |
| | | | | | | | | | | | | | | | |
Chemicals | |
Clariant AG (Registered)* | | | (8,962 | ) | | | (193,157 | ) | | | 2,960 | | | | 0.0 | (a) |
EMS-Chemie Holding AG (Registered) | | | (335 | ) | | | (184,575 | ) | | | (4,581 | ) | | | (0.0 | )(a) |
| | | | | | | | | | | | | | | | |
| | | (9,297 | ) | | | (377,732 | ) | | | (1,621 | ) | | | (0.0 | )(a) |
| | | | | | | | | | | | | | | | |
Machinery | |
Schindler Holding AG | | | (826 | ) | | | (174,174 | ) | | | 8,771 | | | | 0.0 | (a) |
| | | | | | | | | | | | | | | | |
Marine | |
Kuehne + Nagel International AG (Registered) | | | (1,385 | ) | | | (192,494 | ) | | | (6,856 | ) | | | (0.0 | )(a) |
| | | | | | | | | | | | | | | | |
Professional Services | |
DKSH Holding AG | | | (3,019 | ) | | | (203,541 | ) | | | (4,956 | ) | | | (0.0 | )(a) |
| | | | | | | | | | | | | | | | |
Semiconductors & Semiconductor Equipment | |
ams AG* | | | (2,068 | ) | | | (80,564 | ) | | | 398 | | | | 0.0 | (a) |
| | | | | | | | | | | | | | | | |
Total Short Positions of Total Return Basket Swap | | | (18,305 | ) | | | (1,237,468 | ) | | | (255 | ) | | | 0.0 | (a) |
| | | | | | | | | | | | | | | | |
Total of Long and Short Positions of Total Return Basket Swap | | | (7,929 | ) | | | 413,029 | | | | 17,892 | | | | 0.0 | (a) |
| | | | | | | | | | | | | | | | |
| | | | | | | | | | | | | | | | | | | | | | |
| COUNTERPARTY | | DESCRIPTION | | TERMINATION
DATE | | | NOTIONAL
VALUE (1) | | | NET UNREALIZED
APPRECIATION
(DEPRECIATION) (2) | | | NET CASH
AND OTHER
RECEIVABLES
(PAYABLES) | | | VALUE | |
UBS | | The Fund receives the total return on a portfolio of long and short equity positions and pays or receives the net of one month BBSW on long positions and short positions respectively, plus or minus a specified spread (rates range from 0.00% to 0.25%), which is denominated in AUD based on the local currencies of the positions within the swaps. | | | 9/12/2019 | | | $ | 591,922 | | | $ | (43,665 | ) | | $ | (108,395 | ) | | $ | (152,060 | ) |
| | | | | | | | | | | | | | | | | | | | | | |
SEE NOTES TO CONSOLIDATED FINANCIAL STATEMENTS.
| | | | | | | | |
| | | |
| OCTOBER 31, 2018 | | J.P. MORGAN EXCHANGE-TRADED FUNDS | | | | | 55 | |
JPMorgan Diversified Alternatives ETF
CONSOLIDATED SCHEDULE OF PORTFOLIO INVESTMENTS
AS OF OCTOBER 31, 2018 (continued)
| | | | | | | | | | | | | | | | |
| REFERENCE ENTITY | | SHARES | | | NOTIONAL
VALUE($) (1) | | | NET UNREALIZED
APPRECIATION
(DEPRECIATION)($) (2) | | | PERCENTAGE
OF NET
ASSETS (%) | |
Long Positions | | | | | |
| | | |
Common Stocks | | | | | | | | | | | | | |
Airlines | | | | | | | | | | | | | |
Qantas Airways Ltd. | | | 59,893 | | | | 232,490 | | | | (4,195 | ) | | | (0.0 | )(a) |
| | | | | | | | | | | | | | | | |
Food & Staples Retailing | | | | | | | | | | | | | |
Metcash Ltd. | | | 89,086 | | | | 174,115 | | | | (8,823 | ) | | | (0.0 | )(a) |
| | | | | | | | | | | | | | | | |
IT Services | | | | | | | | | | | | | |
Computershare Ltd. | | | 19,186 | | | | 269,423 | | | | (5,300 | ) | | | (0.0 | )(a) |
| | | | | | | | | | | | | | | | |
Media | | | | | | | | | | | | | |
Nine Entertainment Co. Holdings Ltd. | | | 125,170 | | | | 150,326 | | | | (17,212 | ) | | | (0.0 | )(a) |
| | | | | | | | | | | | | | | | |
Metals & Mining | | | | | | | | | | | | | |
Alumina Ltd. | | | 148,296 | | | | 269,132 | | | | (1,723 | ) | | | (0.0 | )(a) |
Iluka Resources Ltd. | | | 41,151 | | | | 236,339 | | | | (15,669 | ) | | | (0.0 | )(a) |
Sandfire Resources NL | | | 7,882 | | | | 37,269 | | | | (620 | ) | | | (0.0 | )(a) |
| | | | | | | | | | | | | | | | |
| | | 197,329 | | | | 542,740 | | | | (18,012 | ) | | | (0.0 | )(a) |
| | | | | | | | | | | | | | | | |
Oil, Gas & Consumable Fuels | | | | | | | | | | | | | |
Whitehaven Coal Ltd. | | | 49,481 | | | | 170,921 | | | | (23,919 | ) | | | (0.0 | )(a) |
Woodside Petroleum Ltd. | | | 11,575 | | | | 284,980 | | | | (10,074 | ) | | | (0.0 | )(a) |
| | | | | | | | | | | | | | | | |
| | | 61,056 | | | | 455,901 | | | | (33,993 | ) | | | (0.0 | )(a) |
| | | | | | | | | | | | | | | | |
Total Long Positions of Total Return Basket Swap | | | 551,720 | | | | 1,824,995 | | | | (87,535 | ) | | | 0.0 | (a) |
| | | | | | | | | | | | | | | | |
| |
Short Positions | | | | | |
| | | |
Common Stocks | | | | | | | | | | | | | |
Chemicals | | | | | | | | | | | | | |
Orica Ltd. | | | (16,433 | ) | | | (200,217 | ) | | | (6,012 | ) | | | (0.0 | )(a) |
| | | | | | | | | | | | | | | | |
Construction Materials | | | | | | | | | | | | | |
Boral Ltd. | | | (43,679 | ) | | | (174,007 | ) | | | 18,095 | | | | 0.0 | (a) |
| | | | | | | | | | | | | | | | |
Containers & Packaging | | | | | | | | | |
Amcor Ltd. | | | (19,990 | ) | | | (188,630 | ) | | | (1,487 | ) | | | (0.0 | )(a) |
| | | | | | | | | | | | | | | | |
Diversified Financial Services | | | | | | | | | |
Challenger Ltd. | | | (23,587 | ) | | | (171,781 | ) | | | 20,463 | | | | 0.0 | (a) |
| | | | | | | | | | | | | | | | |
Hotels, Restaurants & Leisure | | | | | | | | | |
Domino’s Pizza Enterprises Ltd. | | | (900 | ) | | | (34,494 | ) | | | 92 | | | | 0.0 | (a) |
Star Entertainment Grp Ltd. (The) | | | (38,221 | ) | | | (128,887 | ) | | | 2,928 | | | | 0.0 | (a) |
Tabcorp Holdings Ltd. | | | (47,061 | ) | | | (154,440 | ) | | | 6,519 | | | | 0.0 | (a) |
| | | | | | | | | | | | | | | | |
| | | (86,182 | ) | | | (317,821 | ) | | | 9,539 | | | | 0.0 | (a) |
| | | | | | | | | | | | | | | | |
Transportation Infrastructure | | | | | | | | | |
Qube Holdings Ltd. | | | (103,866 | ) | | | (180,617 | ) | | | 3,272 | | | | 0.0 | (a) |
| | | | | | | | | | | | | | | | |
Total Short Positions of Total Return Basket Swap | | | (293,737 | ) | | | (1,233,073 | ) | | | 43,870 | | | | 0.0 | (a) |
| | | | | | | | | | | | | | | | |
Total of Long and Short Positions of Total Return Basket Swap | | | 257,983 | | | | 591,922 | | | | (43,665 | ) | | | 0.0 | (a) |
| | | | | | | | | | | | | | | | |
| | | | | | | | | | | | | | | | | | | | | | |
| COUNTERPARTY | | DESCRIPTION | | TERMINATION
DATE | | | NOTIONAL
VALUE (1) | | | NET UNREALIZED
APPRECIATION
(DEPRECIATION) (2) | | | NET CASH
AND OTHER
RECEIVABLES
(PAYABLES) | | | VALUE | |
UBS | | The Fund receives the total return on a portfolio of long and short equity positions and pays or receives the net of one month LIBOR on long and short positions respectively, plus or minus a specified spread (rates range from 0.00% to 0.25%), which is denominated in USD based on the local currencies of the positions within the swaps. | | | 9/12/2019 | | | $ | 26,417,585 | | | $ | (495,603 | ) | | $ | (1,193,030 | ) | | $ | (1,688,633 | ) |
| | | | | | | | | | | | | | | | | | | | | | |
SEE NOTES TO CONSOLIDATED FINANCIAL STATEMENTS.
| | | | | | |
| | | |
| 56 | | | | J.P. MORGAN EXCHANGE-TRADED FUNDS | | OCTOBER 31, 2018 |
| | | | | | | | | | | | | | | | |
| REFERENCE ENTITY | | SHARES | | | NOTIONAL
VALUE($) (1) | | | NET UNREALIZED
APPRECIATION
(DEPRECIATION)($) (2) | | | PERCENTAGE
OF NET
ASSETS (%) | |
Long Positions | | | | | |
| | | |
Common Stocks | | | | | | | | | | | | | |
Aerospace & Defense | | | | | | | | | | | | | |
Engility Holdings, Inc.* | | | 19,547 | | | | 606,543 | | | | (11,142 | ) | | | (0.0 | )(a) |
| | | | | | | | | | | | | | | | |
Automobiles | | | | | | | | | | | | | |
Fiat Chrysler Automobiles NV* | | | 26,400 | | | | 398,904 | | | | (10,032 | ) | | | (0.0 | )(a) |
| | | | | | | | | | | | | | | | |
Banks | | | | | | | | | | | | | |
Green Bancorp, Inc. | | | 26,651 | | | | 493,044 | | | | (62,097 | ) | | | (0.0 | )(a) |
Guaranty Bancorp | | | 7,425 | | | | 193,198 | | | | (12,029 | ) | | | (0.0 | )(a) |
MB Financial, Inc. | | | 38,990 | | | | 1,730,766 | | | | 25,344 | | | | 0.0 | (a) |
| | | | | | | | | | | | | | | | |
| | | 73,066 | | | | 2,417,008 | | | | (48,782 | ) | | | (0.0 | )(a) |
| | | | | | | | | | | | | | | | |
Biotechnology | | | | | | | | | | | | | |
Amgen, Inc. | | | 2,400 | | | | 462,696 | | | | (23,832 | ) | | | (0.0 | )(a) |
Celgene Corp.* | | | 5,900 | | | | 422,440 | | | | (54,775 | ) | | | (0.0 | )(a) |
Ironwood Pharmaceuticals, Inc.* | | | 39,200 | | | | 513,520 | | | | (145,349 | ) | | | (0.1 | ) |
Spark Therapeutics, Inc.* | | | 3,200 | | | | 143,968 | | | | (9,062 | ) | | | (0.0 | )(a) |
| | | | | | | | | | | | | | | | |
| | | 50,700 | | | | 1,542,624 | | | | (233,018 | ) | | | (0.1 | ) |
| | | | | | | | | | | | | | | | |
Building Products | | | | | | | | | | | | | |
Apogee Enterprises, Inc. | | | 3,500 | | | | 126,350 | | | | (5,040 | ) | | | (0.0 | )(a) |
| | | | | | | | | | | | | | | | |
Capital Markets | | | | | | | | | | | | | |
BGC Partners, Inc. | | | 58,700 | | | | 621,633 | | | | (19,648 | ) | | | (0.0 | )(a) |
| | | | | | | | | | | | | | | | |
Chemicals | | | | | | | | | | | | | |
KMG Chemicals, Inc. | | | 14,736 | | | | 1,105,495 | | | | 6,631 | | | | 0.0 | (a) |
| | | | | | | | | | | | | | | | |
Commercial Services & Supplies | | | | | | | | | | | | | |
KAR Auction Services, Inc. | | | 11,900 | | | | 677,586 | | | | 1,071 | | | | 0.0 | (a) |
LSC Communications, Inc. | | | 3,700 | | | | 34,891 | | | | (314 | ) | | | (0.0 | )(a) |
| | | | | | | | | | | | | | | | |
| | | 15,600 | | | | 712,477 | | | | 757 | | | | 0.0 | (a) |
| | | | | | | | | | | | | | | | |
Communications Equipment | | | | | | | | | | | | | |
NETGEAR, Inc.* | | | 11,600 | | | | 643,568 | | | | 1,390 | | | | 0.0 | (a) |
NetScout Systems, Inc.* | | | 15,800 | | | | 399,108 | | | | 17,222 | | | | 0.0 | (a) |
Oclaro, Inc.* | | | 197,185 | | | | 1,620,861 | | | | (88,733 | ) | | | (0.0 | )(a) |
| | | | | | | | | | | | | | | | |
| | | 224,585 | | | | 2,663,537 | | | | (70,121 | ) | | | (0.0 | )(a) |
| | | | | | | | | | | | | | | | |
Containers & Packaging | | | | | | | | | | | | | |
Bemis Co., Inc. | | | 34,932 | | | | 1,598,838 | | | | 9,047 | | | | 0.0 | (a) |
| | | | | | | | | | | | | | | | |
Diversified Financial Services | | | | | | | | | | | | | |
Voya Financial, Inc. | | | 10,300 | | | | 450,728 | | | | (28,127 | ) | | | (0.0 | )(a) |
| | | | | | | | | | | | | | | | |
Electronic Equipment, Instruments & Components | | | | | | | | | | | | | |
Electro Scientific Industries, Inc.* | | | 23,200 | | | | 672,800 | | | | 10,458 | | | | 0.0 | (a) |
Keysight Technologies, Inc.* | | | 8,500 | | | | 485,180 | | | | 2,064 | | | | 0.0 | (a) |
Orbotech Ltd.* | | | 28,412 | | | | 1,589,367 | | | | 33,086 | | | | 0.0 | (a) |
| | | | | | | | | | | | | | | | |
| | | 60,112 | | | | 2,747,347 | | | | 45,608 | | | | 0.0 | (a) |
| | | | | | | | | | | | | | | | |
Energy Equipment & Services | | | | | | | | | | | | | |
Basic Energy Services, Inc.* | | | 2,131 | | | | 16,558 | | | | (2,664 | ) | | | (0.0 | )(a) |
| | | | | | | | | | | | | | | | |
Entertainment | | | | | | | | | | | | | |
Pandora Media, Inc.* | | | 271,112 | | | | 2,304,452 | | | | (20,114 | ) | | | (0.0 | )(a) |
| | | | | | | | | | | | | | | | |
Food & Staples Retailing | | | | | | | | | | | | | |
Kroger Co. (The) | | | 13,400 | | | | 398,784 | | | | 32,160 | | | | 0.0 | (a) |
| | | | | | | | | | | | | | | | |
Health Care Providers & Services | | | | | | | | | | | | | |
Aetna, Inc. | | | 9,973 | | | | 1,978,643 | | | | (28,329 | ) | | | (0.0 | )(a) |
DaVita, Inc.* | | | 6,500 | | | | 437,710 | | | | (10,465 | ) | | | (0.0 | )(a) |
Express Scripts Holding Co.* | | | 32,955 | | | | 3,195,647 | | | | 26,594 | | | | 0.0 | (a) |
SEE NOTES TO CONSOLIDATED FINANCIAL STATEMENTS.
| | | | | | | | |
| | | |
| OCTOBER 31, 2018 | | J.P. MORGAN EXCHANGE-TRADED FUNDS | | | | | 57 | |
JPMorgan Diversified Alternatives ETF
CONSOLIDATED SCHEDULE OF PORTFOLIO INVESTMENTS
AS OF OCTOBER 31, 2018 (continued)
| | | | | | | | | | | | | | | | |
| REFERENCE ENTITY | | SHARES | | | NOTIONAL
VALUE($) (1) | | | NET UNREALIZED
APPRECIATION
(DEPRECIATION)($) (2) | | | PERCENTAGE
OF NET
ASSETS (%) | |
Long Positions — continued | |
| | |
Common Stocks — continued | | | | | | | | | |
Health Care Providers & Services — continued | | | | | | | | | | | | | |
Henry Schein, Inc.* | | | 9,200 | | | | 763,600 | | | | (2,668 | ) | | | (0.0 | )(a) |
| | | | | | | | | | | | | | | | |
| | | 58,628 | | | | 6,375,600 | | | | (14,868 | ) | | | (0.0 | )(a) |
| | | | | | | | | | | | | | | | |
Hotels, Restaurants & Leisure | | | | | | | | | | | | | |
Hilton Worldwide Holdings, Inc. | | | 6,200 | | | | 441,254 | | | | (3,862 | ) | | | (0.0 | )(a) |
Sonic Corp. | | | 14,100 | | | | 610,248 | | | | 282 | | | | 0.0 | (a) |
| | | | | | | | | | | | | | | | |
| | | 20,300 | | | | 1,051,502 | | | | (3,580 | ) | | | (0.0 | )(a) |
| | | | | | | | | | | | | | | | |
Insurance | | | | | | | | | | | | | |
Stewart Information Services Corp. | | | 13,923 | | | | 574,741 | | | | (20,351 | ) | | | (0.0 | )(a) |
| | | | | | | | | | | | | | | | |
IT Services | | | | | | | | | | | | | |
Travelport Worldwide Ltd. | | | 8,000 | | | | 119,680 | | | | (2,880 | ) | | | (0.0 | )(a) |
| | | | | | | | | | | | | | | | |
Leisure Products | | | | | | | | | | | | | |
Brunswick Corp. | | | 12,200 | | | | 634,278 | | | | (79,292 | ) | | | (0.1 | ) |
| | | | | | | | | | | | | | | | |
Machinery | | | | | | | | | | | | | |
American Railcar Industries, Inc.* | | | 4,038 | | | | 282,297 | | | | 36 | | | | 0.0 | (a) |
Trinity Industries, Inc. | | | 22,200 | | | | 633,810 | | | | (114,910 | ) | | | (0.1 | ) |
| | | | | | | | | | | | | | | | |
| | | 26,238 | | | | 916,107 | | | | (114,874 | ) | | | (0.1 | ) |
| | | | | | | | | | | | | | | | |
Media | | | | | | | | | | | | | |
AMC Networks, Inc.* | | | 7,300 | | | | 427,634 | | | | (1,898 | ) | | | (0.0 | )(a) |
| | | | | | | | | | | | | | | | |
Multi-Utilities | | | | | | | | | | | | | |
SCANA Corp. | | | 46,680 | | | | 1,869,534 | | | | (9,803 | ) | | | (0.0 | )(a) |
| | | | | | | | | | | | | | | | |
Oil, Gas & Consumable Fuels | | | | | | | | | | | | | |
Antero Resources Corp.* | | | 6,600 | | | | 104,874 | | | | (14,850 | ) | | | (0.0 | )(a) |
Arch Coal, Inc. | | | 4,300 | | | | 412,370 | | | | 12,298 | | | | 0.0 | (a) |
Energen Corp.* | | | 43,988 | | | | 3,165,816 | | | | (379,056 | ) | | | (0.2 | ) |
EQT Corp. | | | 19,100 | | | | 648,827 | | | | (150,057 | ) | | | (0.1 | ) |
| | | | | | | | | | | | | | | | |
| | | 73,988 | | | | 4,331,887 | | | | (531,665 | ) | | | (0.3 | ) |
| | | | | | | | | | | | | | | | |
Semiconductors & Semiconductor Equipment | | | | | | | | | | | | | |
Applied Materials, Inc. | | | 13,100 | | | | 430,728 | | | | (7,472 | ) | | | (0.0 | )(a) |
| | | | | | | | | | | | | | | | |
Software | | | | | | | | | | | | | |
CommVault Systems, Inc.* | | | 2,000 | | | | 116,440 | | | | (4,260 | ) | | | (0.0 | )(a) |
Imperva, Inc.* | | | 38,207 | | | | 2,114,757 | | | | (382 | ) | | | (0.0 | )(a) |
Red Hat, Inc.* | | | 16,675 | | | | 2,862,097 | | | | 36,034 | | | | 0.0 | (a) |
SendGrid, Inc.* | | | 58,614 | | | | 2,128,861 | | | | 118,088 | | | | 0.1 | |
| | | | | | | | | | | | | | | | |
| | | 115,496 | | | | 7,222,155 | | | | 149,480 | | | | 0.1 | |
| | | | | | | | | | | | | | | | |
Specialty Retail | | | | | | | | | | | | | |
Asbury Automotive Group, Inc.* | | | 1,800 | | | | 117,180 | | | | 10,908 | | | | 0.0 | (a) |
Children’s Place, Inc. (The) | | | 3,500 | | | | 522,900 | | | | 55,230 | | | | 0.1 | |
Shoe Carnival, Inc. | | | 10,100 | | | | 411,373 | | | | 23,230 | | | | 0.0 | (a) |
Sleep Number Corp.* | | | 12,500 | | | | 454,625 | | | | 42,625 | | | | 0.0 | (a) |
| | | | | | | | | | | | | | | | |
| | | 27,900 | | | | 1,506,078 | | | | 131,993 | | | | 0.1 | |
| | | | | | | | | | | | | | | | |
Technology Hardware, Storage & Peripherals | | | | | | | | | | | | | |
Stratasys Ltd.* | | | 25,100 | | | | 478,406 | | | | (31,626 | ) | | | (0.0 | )(a) |
| | | | | | | | | | | | | | | | |
Thrifts & Mortgage Finance | | | | | | | | | | | | | |
Beneficial Bancorp, Inc. | | | 13,702 | | | | 214,162 | | | | (8,495 | ) | | | (0.0 | )(a) |
| | | | | | | | | | | | | | | | |
Total Long Positions of Total Return Basket Swap | | | 1,341,376 | | | | 43,863,770 | | | | (899,816 | ) | | | (0.4 | ) |
| | | | | | | | | | | | | | | | |
SEE NOTES TO CONSOLIDATED FINANCIAL STATEMENTS.
| | | | | | |
| | | |
| 58 | | | | J.P. MORGAN EXCHANGE-TRADED FUNDS | | OCTOBER 31, 2018 |
| | | | | | | | | | | | | | | | |
| REFERENCE ENTITY | | SHARES | | | NOTIONAL
VALUE($) (1) | | | NET UNREALIZED
APPRECIATION
(DEPRECIATION)($) (2) | | | PERCENTAGE
OF NET
ASSETS (%) | |
| |
Short Positions | | | | | |
| | | |
Common Stocks | | | | | | | | | | | | | |
Banks | | | | | | | | | | | | | |
Fifth Third Bancorp | | | (53,708 | ) | | | (1,449,579 | ) | | | (31,151 | ) | | | (0.0 | )(a) |
Independent Bank Group, Inc. | | | (3,308 | ) | | | (191,566 | ) | | | 12,174 | | | | 0.0 | (a) |
Veritex Holdings, Inc.* | | | (20,843 | ) | | | (491,061 | ) | | | 61,904 | | | | 0.0 | (a) |
| | | | | | | | | | | | | | | | |
| | | (77,859 | ) | | | (2,132,206 | ) | | | 42,927 | | | | 0.0 | (a) |
| | | | | | | | | | | | | | | | |
Capital Markets | | | | | | | | | | | | | |
CME Group, Inc. | | | (4,010 | ) | | | (734,792 | ) | | | (5,293 | ) | | | (0.0 | )(a) |
| | | | | | | | | | | | | | | | |
Commercial Services & Supplies | | | | | | | | | | | | | |
Quad/Graphics, Inc. | | | (1,700 | ) | | | (26,231 | ) | | | 136 | | | | 0.0 | (a) |
| | | | | | | | | | | | | | | | |
Communications Equipment | | | | | | | | | | | | | |
Lumentum Holdings, Inc.* | | | (5,818 | ) | | | (317,954 | ) | | | 44,042 | | | | 0.0 | (a) |
| | | | | | | | | | | | | | | | |
Energy Equipment & Services | | | | | | | | | | | | | |
Key Energy Services, Inc.* | | | (1,610 | ) | | | (14,571 | ) | | | 402 | | | | 0.0 | (a) |
| | | | | | | | | | | | | | | | |
Health Care Providers & Services | | | | | | | | | | | | | |
Cigna Corp. | | | (9,185 | ) | | | (1,963,845 | ) | | | (9,832 | ) | | | (0.0 | )(a) |
CVS Health Corp. | | | (11,894 | ) | | | (861,007 | ) | | | 24,223 | | | | 0.0 | (a) |
| | | | | | | | | | | | | | | | |
| | | (21,079 | ) | | | (2,824,852 | ) | | | 14,391 | | | | 0.0 | (a) |
| | | | | | | | | | | | | | | | |
Insurance | | | | | | | | | | | | | |
Fidelity National Financial, Inc. | | | (8,291 | ) | | | (277,334 | ) | | | 12,365 | | | | 0.0 | (a) |
| | | | | | | | | | | | | | | | |
IT Services | | | | | | | | | | | | | |
Science Applications International Corp. | | | (8,708 | ) | | | (605,293 | ) | | | 13,497 | | | | 0.0 | (a) |
Twilio, Inc.* | | | (25,781 | ) | | | (1,939,247 | ) | | | (109,885 | ) | | | (0.0 | )(a) |
| | | | | | | | | | | | | | | | |
| | | (34,489 | ) | | | (2,544,540 | ) | | | (96,388 | ) | | | (0.0 | )(a) |
| | | | | | | | | | | | | | | | |
Media | | | | | | | | | | | | | |
Sirius XM Holdings, Inc. | | | (386,649 | ) | | | (2,327,627 | ) | | | (16,745 | ) | | | (0.0 | )(a) |
| | | | | | | | | | | | | | | | |
Multi-Utilities | | | | | | | | | | | | | |
Dominion Energy, Inc. | | | (27,885 | ) | | | (1,991,547 | ) | | | 22,587 | | | | 0.0 | (a) |
| | | | | | | | | | | | | | | | |
Oil, Gas & Consumable Fuels | | | | | | | | | | | | | |
Diamondback Energy, Inc. | | | (28,054 | ) | | | (3,152,147 | ) | | | 381,598 | | | | 0.2 | |
| | | | | | | | | | | | | | | | |
Semiconductors & Semiconductor Equipment | | | | | | | | | | | | | |
Cabot Microelectronics Corp. | | | (2,918 | ) | | | (284,855 | ) | | | (4,231 | ) | | | (0.0 | )(a) |
KLA-Tencor Corp. | | | (7,032 | ) | | | (643,709 | ) | | | (1,101 | ) | | | (0.0 | )(a) |
| | | | | | | | | | | | | | | | |
| | | (9,950 | ) | | | (928,564 | ) | | | (5,332 | ) | | | (0.0 | )(a) |
| | | | | | | | | | | | | | | | |
Thrifts & Mortgage Finance | | | | | | | | | | | | | |
WSFS Financial Corp. | | | (4,087 | ) | | | (173,820 | ) | | | 9,523 | | | | 0.0 | (a) |
| | | | | | | | | | | | | | | | |
Total Short Positions of Total Return Basket Swap | | | (611,481 | ) | | | (17,446,185 | ) | | | 404,213 | | | | 0.2 | |
| | | | | | | | | | | | | | | | |
Total of Long and Short Positions of Total Return Basket Swap | | | 729,895 | | | | 26,417,585 | | | | (495,603 | ) | | | (0.2 | ) |
| | | | | | | | | | | | | | | | |
| | | | | | | | | | | | | | | | | | | | | | |
| COUNTERPARTY | | DESCRIPTION | | TERMINATION
DATE | | | NOTIONAL
VALUE (1) | | | NET UNREALIZED
APPRECIATION
(DEPRECIATION) (2) | | | NET CASH
AND OTHER
RECEIVABLES
(PAYABLES) | | | VALUE | |
UBS | | The Fund receives the total return on a portfolio of long equity positions and pays or receives the net of one month LIBOR on long positions positions respectively, plus or minus a specified spread (rates range from 0.00% to 0.25%), which is denominated in GBP based on the local currencies of the positions within the swaps. | | | 9/12/2019 | | | $ | 1,739,368 | | | $ | 66,566 | | | $ | 196,040 | | | $ | 262,606 | |
| | | | | | | | | | | | | | | | | | | | | | |
SEE NOTES TO CONSOLIDATED FINANCIAL STATEMENTS.
| | | | | | | | |
| | | |
| OCTOBER 31, 2018 | | J.P. MORGAN EXCHANGE-TRADED FUNDS | | | | | 59 | |
JPMorgan Diversified Alternatives ETF
CONSOLIDATED SCHEDULE OF PORTFOLIO INVESTMENTS
AS OF OCTOBER 31, 2018 (continued)
| | | | | | | | | | | | | | | | |
| REFERENCE ENTITY | | SHARES | | | NOTIONAL
VALUE($) (1) | | | NET UNREALIZED
APPRECIATION
(DEPRECIATION)($) (2) | | | PERCENTAGE
OF NET
ASSETS (%) | |
Long Positions | | | | | | | | | | | | | | | | |
| | | | |
Common Stocks | | | | | | | | | | | | | | | | |
Capital Markets | | | | | | | | | | | | | | | | |
NEX Group plc | | | 76,474 | | | | 1,109,064 | | | | 55,376 | | | | 0.0 | (a) |
Sole Realisation Co. plc*‡ | | | 698 | | | | — | | | | (638 | ) | | | (0.0 | )(a) |
| | | | | | | | | | | | | | | | |
| | | 77,172 | | | | 1,109,064 | | | | 54,738 | | | | 0.0 | (a) |
| | | | | | | | | | | | | | | | |
Insurance | | | | | | | | | | | | | | | | |
Prudential plc | | | 31,478 | | | | 630,304 | | | | 11,828 | | | | 0.0 | (a) |
| | | | | | | | | | | | | | | | |
Total Long Positions of Total Return Basket Swap | | | 108,650 | | | | 1,739,368 | | | | 66,566 | | | | 0.0 | (a) |
| | | | | | | | | | | | | | | | |
| | | | | | | | | | | | | | | | | | | | | | |
| COUNTERPARTY | | DESCRIPTION | | TERMINATION
DATE | | | NOTIONAL
VALUE (1) | | | NET UNREALIZED
APPRECIATION
(DEPRECIATION) (2) | | | NET CASH
AND OTHER
RECEIVABLES
(PAYABLES) | | | VALUE | |
UBS | | The Fund receives the total return on a portfolio of long and short equity positions and pays or receives the net of one month LIBOR on long positions and short positions respectively, plus or minus a specified spread (rates range from 0.00% to 0.25%), which is denominated in JPY based on the local currencies of the positions within the swaps. | | | 9/12/2019 | | | $ | 708,884 | | | $ | 4,878 | | | $ | (1,365 | ) | | $ | 3,513 | |
| | | | | | | | | | | | | | | | | | | | | | |
| | | | | | | | | | | | | | | | |
| REFERENCE ENTITY | | SHARES | | | NOTIONAL
VALUE($) (1) | | | NET UNREALIZED
APPRECIATION
(DEPRECIATION)($) (2) | | | PERCENTAGE
OF NET
ASSETS (%) | |
Long Positions | | | | | |
| | | |
Common Stocks | | | | | | | | | | | | | |
Household Durables | | | | | | | | | | | | | |
Clarion Co. Ltd.* | | | 32,100 | | | | 703,746 | | | | 4,660 | | | | 0.0 | (a) |
| | | | | | | | | | | | | | | | |
Metals & Mining | | | | | | | | | | | | | |
Nisshin Steel Co. Ltd. | | | 69,500 | | | | 907,156 | | | | (52,972 | ) | | | (0.0 | )(a) |
| | | | | | | | | | | | | | | | |
Total Long Positions of Total Return Basket Swap | | | 101,600 | | | | 1,610,902 | | | | (48,312 | ) | | | 0.0 | (a) |
| | | | | | | | | | | | | | | | |
| |
Short Position | | | | | |
| | | |
Common Stocks | | | | | | | | | | | | | |
Metals & Mining | | | | | | | | | | | | | |
Nippon Steel & Sumitomo Metal Corp. | | | (48,900 | ) | | | (902,018 | ) | | | 53,190 | | | | 0.0 | (a) |
| | | | | | | | | | | | | | | | |
Total of Long and Short Positions of Total Return Basket Swap | | | 52,700 | | | | 708,884 | | | | 4,878 | | | | 0.0 | (a) |
| | | | | | | | | | | | | | | | |
| | | | | | | | | | | | | | | | | | | | | | |
| COUNTERPARTY | | DESCRIPTION | | TERMINATION
DATE | | | NOTIONAL
VALUE (1) | | | NET UNREALIZED
APPRECIATION
(DEPRECIATION) (2) | | | NET CASH
AND OTHER
RECEIVABLES
(PAYABLES) | | | VALUE | |
UBS | | The Fund receives the total return on a portfolio of long and short equity positions and pays or receives the net of one month BBSW on long positions and short positions respectively, plus or minus a specified spread (rates range from 0.00% to 0.25%), which is denominated in AUD based on the local currencies of the positions within the swaps. | |
| 9/12/2019 –
4/6/2021 |
| | $ | 439,701 | | | $ | (105,711 | ) | | $ | (81,541 | ) | | $ | (187,252 | ) |
| | | | | | | | | | | | | | | | | | | | | | |
SEE NOTES TO CONSOLIDATED FINANCIAL STATEMENTS.
| | | | | | |
| | | |
| 60 | | | | J.P. MORGAN EXCHANGE-TRADED FUNDS | | OCTOBER 31, 2018 |
| | | | | | | | | | | | | | | | |
| REFERENCE ENTITY | | SHARES | | | NOTIONAL
VALUE($) (1) | | | NET UNREALIZED
APPRECIATION
(DEPRECIATION)($) (2) | | | PERCENTAGE
OF NET
ASSETS (%) | |
Long Positions | | | | | |
| | | |
Common Stocks | | | | | | | | | | | | | |
Food & Staples Retailing | | | | | | | | | | | | | |
Wesfarmers Ltd. | | | 19,705 | | | | 652,585 | | | | (7,433 | ) | | | (0.0 | )(a) |
| | | | | | | | | | | | | | | | |
Metals & Mining | | | | | | | | | | | | | |
South32 Ltd. | | | 213,265 | | | | 550,043 | | | | (31,432 | ) | | | (0.0 | )(a) |
| | | | | | | | | | | | | | | | |
Software | | | | | | | | | | | | | |
MYOB Group Ltd. | | | 298,031 | | | | 712,718 | | | | (34,381 | ) | | | (0.1 | ) |
| | | | | | | | | | | | | | | | |
Total Long Positions of Total Return Basket Swap | | | 531,001 | | | | 1,915,346 | | | | (73,246 | ) | | | (0.1 | ) |
| | | | | | | | | | | | | | | | |
| |
Short Positions | | | | | |
| | | |
Common Stocks | | | | | | | | | | | | | |
Containers & Packaging | | | | | | | | | | | | | |
Amcor Ltd. | | | (156,381 | ) | | | (1,475,645 | ) | | | (32,465 | ) | | | (0.0 | )(a) |
| | | | | | | | | | | | | | | | |
Total of Long and Short Positions of Total Return Basket Swap | | | 374,620 | | | | 439,701 | | | | (105,711 | ) | | | (0.1 | ) |
| | | | | | | | | | | | | | | | |
| | | | | | | | | | | | | | | | | | | | | | |
| COUNTERPARTY | | DESCRIPTION | | TERMINATION
DATE | | | NOTIONAL
VALUE (1) | | | NET UNREALIZED
APPRECIATION
(DEPRECIATION) (2) | | | NET CASH
AND OTHER
RECEIVABLES
(PAYABLES) | | | VALUE | |
UBS | | The Fund receives the total return on a portfolio of long and short equity positions and pays or receives the net of one day CORRA and one month CDOR on long positions and short positions respectively, plus or minus a specified spread (rates range from 0.00% to 0.15%), which is denominated in CAD based on the local currencies of the positions within the swaps. | | | 9/12/2019 | | | $ | 565,550 | | | $ | 25,141 | | | $ | 51,932 | | | $ | 77,073 | |
| | | | | | | | | | | | | | | | | | | | | | |
| | | | | | | | | | | | | | | | |
| REFERENCE ENTITY | | SHARES | | | NOTIONAL
VALUE($) (1) | | | NET UNREALIZED
APPRECIATION
(DEPRECIATION)($) (2) | | | PERCENTAGE
OF NET
ASSETS (%) | |
Long Positions | | | | | |
| | | |
Common Stocks | | | | | | | | | | | | | |
Energy Equipment & Services | | | | | | | | | | | | | |
Trinidad Drilling Ltd.* | | | 171,869 | | | | 216,721 | | | | (12,044 | ) | | | (0.0 | )(a) |
| | | | | | | | | | | | | | | | |
Oil, Gas & Consumable Fuels | | | | | | | | | | | | | |
Enbridge Income Fund Holdings, Inc. | | | 96,724 | | | | 2,238,733 | | | | (88,971 | ) | | | (0.1 | ) |
MEG Energy Corp.* | | | 154,300 | | | | 1,234,213 | | | | (5,595 | ) | | | (0.0 | )(a) |
| | | | | | | | | | | | | | | | |
| | | 251,024 | | | | 3,472,946 | | | | (94,566 | ) | | | (0.1 | ) |
| | | | | | | | | | | | | | | | |
Total Long Positions of Total Return Basket Swap | | | 422,893 | | | | 3,689,667 | | | | (106,610 | ) | | | (0.1 | ) |
| | | | | | | | | | | | | | | | |
| |
Short Positions | | | | | |
| | | |
Common Stocks | | | | | | | | | | | | | |
Energy Equipment & Services | | | | | | | | | | | | | |
Precision Drilling Corp.* | | | (75,716 | ) | | | (182,899 | ) | | | 31,312 | | | | 0.0 | (a) |
| | | | | | | | | | | | | | | | |
Oil, Gas & Consumable Fuels | | | | | | | | | | | | | |
Enbridge, Inc. | | | (71,092 | ) | | | (2,215,195 | ) | | | 72,613 | | | | 0.1 | |
Husky Energy, Inc. | | | (51,358 | ) | | | (726,023 | ) | | | 27,826 | | | | 0.0 | (a) |
| | | | | | | | | | | | | | | | |
| | | (122,450 | ) | | | (2,941,218 | ) | | | 100,439 | | | | 0.1 | |
| | | | | | | | | | | | | | | | |
Total Short Positions of Total Return Basket Swap | | | (198,166 | ) | | | (3,124,117 | ) | | | 131,751 | | | | 0.1 | |
| | | | | | | | | | | | | | | | |
Total of Long and Short Positions of Total Return Basket Swap | | | 224,727 | | | | 565,550 | | | | 25,141 | | | | 0.0 | (a) |
| | | | | | | | | | | | | | | | |
SEE NOTES TO CONSOLIDATED FINANCIAL STATEMENTS.
| | | | | | | | |
| | | |
| OCTOBER 31, 2018 | | J.P. MORGAN EXCHANGE-TRADED FUNDS | | | | | 61 | |
JPMorgan Diversified Alternatives ETF
CONSOLIDATED SCHEDULE OF PORTFOLIO INVESTMENTS
AS OF OCTOBER 31, 2018 (continued)
| | | | | | | | | | | | | | | | | | | | | | |
| COUNTERPARTY | | DESCRIPTION | | TERMINATION
DATE | | | NOTIONAL
VALUE (1) | | | NET UNREALIZED
APPRECIATION
(DEPRECIATION) (2) | | | NET CASH
AND OTHER
RECEIVABLES
(PAYABLES) | | | VALUE | |
UBS | | The Fund receives the total return on a portfolio of long equity positions and pays or receives the net of one month LIBOR on long positions positions respectively, plus or minus a specified spread (rates range from 0.00% to 0.25%), which is denominated in EUR based on the local currencies of the positions within the swaps. | | | 9/12/2019 | | | $ | 4,898,661 | | | $ | (21,839 | ) | | $ | (92,066 | ) | | $ | (113,905 | ) |
| | | | | | | | | | | | | | | | | | | | | | |
| | | | | | | | | | | | | | | | |
| REFERENCE ENTITY | | SHARES | | | NOTIONAL
VALUE($) (1) | | | NET UNREALIZED
APPRECIATION
(DEPRECIATION)($) (2) | | | PERCENTAGE
OF NET
ASSETS (%) | |
Long Positions | | | | | |
| | | |
Common Stocks | | | | | | | | | | | | | |
Electric Utilities | | | | | | | | | | | | | |
EDP — Energias de Portugal SA | | | 523,616 | | | | 1,840,901 | | | | (20,451 | ) | | | (0.0 | )(a) |
| | | | | | | | | | | | | | | | |
Pharmaceuticals | | | | | | | | | | | | | |
STADA Arzneimittel AG | | | 2,810 | | | | 259,822 | | | | (207 | ) | | | (0.0 | )(a) |
| | | | | | | | | | | | | | | | |
Software | | | | | | | | | | | | | |
Gemalto NV* | | | 49,052 | | | | 2,797,938 | | | | (1,181 | ) | | | (0.0 | )(a) |
| | | | | | | | | | | | | | | | |
Total Long Positions of Total Return Basket Swap | | | 575,478 | | | | 4,898,661 | | | | (21,839 | ) | | | 0.0 | (a) |
| | | | | | | | | �� | | | | | | | |
Abbreviations
| | |
| AUD | | — Australian Dollar |
| BA | | — Banker’s Acceptance Rate |
| BBR | | — Bank Base Rate |
| BBSW | | — ASX Australia Bank Bill Short Term Rates |
| CAD | | — Canadian Dollar |
| CDOR | | — Canadian Dollar Offered Rate |
| CHF | | — Swiss Franc |
| CORRA | | — Canadian Overnight Repo Rate Average |
| CVR | | — Contingent Value Rights |
| EUR | | — Euro |
| EURIBOR | | — Euro Interbank Offered Rate |
| GBP | | — British Pound |
| JPY | | — Japanese Yen |
| LIBID | | — London Interbank Bid Rate |
| LIBOR | | — London Interbank Offered Rate |
| OYJ | | — Public Limited Company |
| | |
| SCA | | — Limited partnership with share capital |
| USD | | — United States Dollar |
| |
| (a) | | — Amount rounds to less than 0.1% of net assets. |
| (b) | | — Security exempt from registration pursuant to Regulation S under the Securities Act of 1933, as amended. Regulation S applies to securities offerings that are made outside of the United States and do not involve direct selling efforts in the United States and as such may have restrictions on resale. |
| * | | — Non-income producing security. |
| ‡ | | — Value determined using significant unobservable inputs. |
| (1) | | — Notional value represents market value, as of October 31, 2018, of these positions based on the securities’ last sale or closing price on the principal exchange on which the securities are traded. |
| (2) | | — Unrealized appreciation (depreciation) represents the unrealized gain(loss) of the positions subsequent to the swap reset. |
SEE NOTES TO CONSOLIDATED FINANCIAL STATEMENTS.
| | | | | | |
| | | |
| 62 | | | | J.P. MORGAN EXCHANGE-TRADED FUNDS | | OCTOBER 31, 2018 |
The following reference rates, and their values as of period-end, are used for security descriptions:
| | | | | | |
| | | | | VALUE | |
BA | | | | | 2.08 | % |
BBR | | | | | 1.85 | % |
BBSW | | | | | 1.85 | % |
CDOR | | | | | 2.08 | % |
CHF LIBOR | | | | | (0.78 | )% |
CORRA | | | | | 1.76 | % |
EUR LIBOR | | | | | (0.40 | )% |
EURIBOR | | | | | (0.37 | )% |
GBP LIBOR | | | | | 0.73 | % |
JPY LIBOR | | | | | (0.10 | )% |
USD LIBOR | | | | | 2.31 | % |
Summary of total swap contracts outstanding as of October 31, 2018:
| | | | | | | | |
| | | NET UPFRONT
PAYMENTS
(RECEIPTS)($) | | | VALUE($) | |
Assets | |
Total return basket swaps contracts outstanding | | | – | | | | 3,910,823 | |
| | | | | | | | |
|
Liabilities | |
Total return basket swaps contracts outstanding | | | – | | | | (3,058,645 | ) |
| | | | | | | | |
SEE NOTES TO CONSOLIDATED FINANCIAL STATEMENTS.
| | | | | | | | |
| | | |
| OCTOBER 31, 2018 | | J.P. MORGAN EXCHANGE-TRADED FUNDS | | | | | 63 | |
JPMorgan Event Driven ETF
SCHEDULE OF PORTFOLIO INVESTMENTS
AS OF OCTOBER 31, 2018
| | | | | | | | |
| INVESTMENTS | | SHARES | | | VALUE($) | |
Common Stocks — 57.4% | |
Aerospace & Defense — 3.5% | | | | | | | | |
Esterline Technologies Corp.* | | | 3,414 | | | | 400,667 | |
Rockwell Collins, Inc. | | | 2,886 | | | | 369,466 | |
Spirit AeroSystems Holdings, Inc., Class A | | | 2,000 | | | | 168,020 | |
| | | | | | | | |
| | | | | | | 938,153 | |
| | | | | | | | |
Auto Components — 0.5% | | | | | | | | |
Visteon Corp.* | | | 1,500 | | | | 118,560 | |
| | | | | | | | |
Banks — 1.1% | | | | | | | | |
CIT Group, Inc. | | | 3,100 | | | | 146,878 | |
Commonwealth Bank of Australia (Australia) | | | 3,006 | | | | 147,808 | |
| | | | | | | | |
| | | | | | | 294,686 | |
| | | | | | | | |
Biotechnology — 0.3% | | | | | | | | |
Spark Therapeutics, Inc.* | | | 1,900 | | | | 85,481 | |
| | | | | | | | |
Building Products — 2.6% | | | | | | | | |
Advanced Drainage Systems, Inc. | | | 6,100 | | | | 169,519 | |
Apogee Enterprises, Inc. | | | 3,800 | | | | 137,180 | |
USG Corp. | | | 9,477 | | | | 400,119 | |
| | | | | | | | |
| | | | | | | 706,818 | |
| | | | | | | | |
Capital Markets — 1.1% | | | | | | | | |
Greenhill & Co., Inc. | | | 6,100 | | | | 134,505 | |
Jefferies Financial Services, Inc. | | | 7,200 | | | | 154,584 | |
| | | | | | | | |
| | | | | | | 289,089 | |
| | | | | | | | |
Commercial Services & Supplies — 0.2% | | | | | |
Essendant, Inc. | | | 4,885 | | | | 62,235 | |
| | | | | | | | |
Communications Equipment — 0.4% | | | | | | | | |
Mitel Networks Corp.* | | | 9,715 | | | | 106,671 | |
| | | | | | | | |
Electronic Equipment, Instruments & Components — 0.7% | |
Electro Scientific Industries, Inc.* | | | 3,000 | | | | 87,000 | |
Keysight Technologies, Inc.* | | | 1,800 | | | | 102,744 | |
| | | | | | | | |
| | | | | | | 189,744 | |
| | | | | | | | |
Energy Equipment & Services — 0.2% | | | | | | | | |
Seadrill Ltd. (United Kingdom)* | | | 2,400 | | | | 48,864 | |
| | | | | | | | |
Entertainment — 2.0% | | | | | | | | |
Madison Square Garden Co. (The), Class A* | | | 500 | | | | 138,310 | |
Twenty-First Century Fox, Inc., Class A | | | 8,530 | | | | 388,286 | |
| | | | | | | | |
| | | | | | | 526,596 | |
| | | | | | | | |
Food Products — 0.6% | | | | | | | | |
Campbell Soup Co. | | | 3,900 | | | | 145,899 | |
| | | | | | | | |
Health Care Equipment & Supplies — 2.6% | |
Danaher Corp. | | | 1,600 | | | | 159,040 | |
K2M Group Holdings, Inc.* | | | 4,150 | | | | 113,627 | |
NxStage Medical, Inc.* | | | 14,351 | | | | 407,281 | |
| | | | | | | | |
| | | | | | | 679,948 | |
| | | | | | | | |
Health Care Providers & Services — 2.5% | |
Amedisys, Inc.* | | | 1,300 | | | | 143,000 | |
LifePoint Health, Inc.* | | | 6,226 | | | | 403,818 | |
MEDNAX, Inc.* | | | 3,000 | | | | 123,870 | |
| | | | | | | | |
| | | | | | | 670,688 | |
| | | | | | | | |
| | | | | | | | |
| INVESTMENTS | | SHARES | | | VALUE($) | |
| | | | | | | | |
Health Care Technology — 0.3% | | | | | | | | |
athenahealth, Inc.* | | | 669 | | | | 85,324 | |
| | | | | | | | |
Hotels, Restaurants & Leisure — 3.1% | | | | | | | | |
Hyatt Hotels Corp., Class A | | | 2,200 | | | | 152,240 | |
Jack in the Box, Inc. | | | 3,600 | | | | 284,148 | |
MGM Resorts International | | | 6,000 | | | | 160,080 | |
Sonic Corp. | | | 4,800 | | | | 207,744 | |
| | | | | | | | |
| | | | | | | 804,212 | |
| | | | | | | | |
Household Durables — 1.3% | | | | | | | | |
Clarion Co. Ltd. (Japan) | | | 4,400 | | | | 96,463 | |
Newell Brands, Inc. | | | 5,400 | | | | 85,752 | |
Whirlpool Corp. | | | 1,400 | | | | 153,664 | |
| | | | | | | | |
| | | | | | | 335,879 | |
| | | | | | | | |
Insurance — 4.1% | | | | | | | | |
AmTrust Financial Services, Inc. | | | 15,765 | | | | 226,070 | |
Aspen Insurance Holdings Ltd. (Bermuda) | | | 10,135 | | | | 424,454 | |
Assured Guaranty Ltd. | | | 4,100 | | | | 163,918 | |
Navigators Group, Inc. (The) | | | 1,211 | | | | 83,741 | |
Stewart Information Services Corp. | | | 100 | | | | 4,128 | |
White Mountains Insurance Group Ltd. | | | 200 | | | | 177,334 | |
| | | | | | | | |
| | | | | | | 1,079,645 | |
| | | | | | | | |
Interactive Media & Services — 0.2% | | | | | | | | |
XO Group, Inc.* | | | 1,460 | | | | 50,531 | |
| | | | | | | | |
Internet & Direct Marketing Retail — 0.5% | |
Nutrisystem, Inc. | | | 3,800 | | | | 135,128 | |
| | | | | | | | |
IT Services — 1.1% | | | | | | | | |
Cardtronics plc, Class A* | | | 6,100 | | | | 165,676 | |
Travelport Worldwide Ltd. | | | 9,400 | | | | 140,624 | |
| | | | | | | | |
| | | | | | | 306,300 | |
| | | | | | | | |
Leisure Products — 0.4% | | | | | | | | |
Amer Sports OYJ (Finland)* | | | 2,648 | | | | 98,431 | |
| | | | | | | | |
Machinery — 1.3% | | | | | | | | |
Allison Transmission Holdings, Inc. | | | 3,400 | | | | 149,872 | |
American Railcar Industries, Inc. | | | 560 | | | | 39,149 | |
Tennant Co. | | | 2,400 | | | | 146,688 | |
| | | | | | | | |
| | | | | | | 335,709 | |
| | | | | | | | |
Marine — 0.2% | | | | | | | | |
DryShips, Inc. (Greece) | | | 6,000 | | | | 34,980 | |
| | | | | | | | |
Media — 0.8% | | | | | | | | |
Fairfax Media Ltd. (Australia) | | | 337,793 | | | | 153,728 | |
Schibsted ASA, Class A (Norway) | | | 1,680 | | | | 58,145 | |
| | | | | | | | |
| | | | | | | 211,873 | |
| | | | | | | | |
Multi-Utilities — 3.7% | | | | | | | | |
Avista Corp. | | | 7,219 | | | | 371,201 | |
Innogy SE (Germany)* | | | 4,786 | | | | 199,596 | |
Vectren Corp. | | | 5,426 | | | | 388,122 | |
| | | | | | | | |
| | | | | | | 958,919 | |
| | | | | | | | |
SEE NOTES TO FINANCIAL STATEMENTS.
| | | | | | |
| | | |
| 64 | | | | J.P. MORGAN EXCHANGE-TRADED FUNDS | | OCTOBER 31, 2018 |
| | | | | | | | |
| INVESTMENTS | | SHARES | | | VALUE($) | |
Common Stocks — continued | |
Oil, Gas & Consumable Fuels — 2.8% | | | | | | | | |
Antero Resources Corp.* | | | 8,300 | | | | 131,887 | |
CNX Resources Corp.* | | | 9,400 | | | | 147,110 | |
Peabody Energy Corp. | | | 7,900 | | | | 280,055 | |
Range Resources Corp. | | | 9,800 | | | | 155,330 | |
| | | | | | | | |
| | | | | | | 714,382 | |
| | | | | | | | |
Paper & Forest Products — 1.4% | | | | | | | | |
KapStone Paper and Packaging Corp. | | | 10,851 | | | | 379,785 | |
| | | | | | | | |
Personal Products — 0.6% | | | | | | | | |
Herbalife Nutrition Ltd.* | | | 3,000 | | | | 159,780 | |
| | | | | | | | |
Pharmaceuticals — 2.7% | | | | | | | | |
Eli Lilly & Co. | | | 1,700 | | | | 184,348 | |
Endocyte, Inc.* | | | 11,323 | | | | 267,789 | |
Green Organic Dutchman Holdings Ltd. (The) (Canada)* | | | 27,300 | | | | 64,286 | |
Novartis AG (Registered) (Switzerland) | | | 2,152 | | | | 188,456 | |
| | | | | | | | |
| | | | | | | 704,879 | |
| | | | | | | | |
Professional Services — 2.3% | | | | | | | | |
Dun & Bradstreet Corp. (The) | | | 2,882 | | | | 410,051 | |
Nielsen Holdings plc | | | 6,600 | | | | 171,468 | |
| | | | | | | | |
| | | | | | | 581,519 | |
| | | | | | | | |
Real Estate Management & Development — 0.5% | |
Hemfosa Fastigheter AB (Sweden) | | | 2,697 | | | | 33,320 | |
NTT Urban Development Corp. (Japan) | | | 8,100 | | | | 120,380 | |
| | | | | | | | |
| | | | | | | 153,700 | |
| | | | | | | | |
Road & Rail — 1.2% | | | | | | | | |
Norfolk Southern Corp. | | | 1,000 | | | | 167,830 | |
Union Pacific Corp. | | | 1,100 | | | | 160,842 | |
| | | | | | | | |
| | | | | | | 328,672 | |
| | | | | | | | |
Semiconductors & Semiconductor Equipment — 1.9% | |
Canadian Solar, Inc. (Canada)* | | | 11,300 | | | | 161,590 | |
Ichor Holdings Ltd.* | | | 6,700 | | | | 118,925 | |
Integrated Device Technology, Inc.* | | | 4,411 | | | | 206,479 | |
| | | | | | | | |
| | | | | | | 486,994 | |
| | | | | | | | |
Software — 4.1% | | | | | | | | |
CommVault Systems, Inc.* | | | 2,200 | | | | 128,084 | |
Imperva, Inc.* | | | 5,269 | | | | 291,639 | |
MYOB Group Ltd. (Australia) | | | 41,450 | | | | 99,124 | |
Red Hat, Inc.* | | | 2,284 | | | | 392,026 | |
Symantec Corp. | | | 8,225 | | | | 149,284 | |
| | | | | | | | |
| | | | | | | 1,060,157 | |
| | | | | | | | |
Specialty Retail — 2.9% | | | | | | | | |
Asbury Automotive Group, Inc.* | | | 2,300 | | | | 149,730 | |
Dick’s Sporting Goods, Inc. | | | 4,400 | | | | 155,628 | |
Express, Inc.* | | | 14,600 | | | | 128,626 | |
Michaels Cos., Inc. (The)* | | | 10,400 | | | | 164,840 | |
Rent-A-Center, Inc.* | | | 10,162 | | | | 144,808 | |
| | | | | | | | |
| | | | | | | 743,632 | |
| | | | | | | | |
| | | | | | | | |
| INVESTMENTS | | SHARES | | | VALUE($) | |
| | | | | | | | |
Textiles, Apparel & Luxury Goods — 1.2% | |
Deckers Outdoor Corp.* | | | 1,400 | | | | 178,038 | |
VF Corp. | | | 1,700 | | | | 140,896 | |
| | | | | | | | |
| | | | | | | 318,934 | |
| | | | | | | | |
Trading Companies & Distributors — 0.5% | |
WESCO International, Inc.* | | | 2,800 | | | | 140,504 | |
| | | | | | | | |
Total Common Stocks
(Cost $15,835,891) | | | | | | | 15,073,301 | |
| | | | | | | | |
| | |
| | | PRINCIPAL
AMOUNT($) | | | | |
Foreign Government Securities — 1.0% | |
Japan Government Bond (Japan) 0.10%, 7/15/2019
(Cost $274,261) | | | JPY 30,900,000 | | | | 274,350 | |
| | | | | | | | |
| | |
| | | SHARES | | | | |
Short-Term Investments — 42.2% | |
Investment Companies — 21.3% | | | | | | | | |
JPMorgan U.S. Government Money Market Fund Class Institutional Shares, 2.02% (a) (b)
(Cost $5,600,338) | | | 5,600,338 | | | | 5,600,338 | |
| | | | | | | | |
| | |
| | | PRINCIPAL
AMOUNT($) | | | | |
U.S. Treasury Obligations — 20.9% | |
U.S. Treasury Bills | | | | | | | | |
2.29%, 2/28/2019 (c) | | | 1,385,000 | | | | 1,374,447 | |
2.40%, 4/25/2019 (c) | | | 1,390,000 | | | | 1,373,699 | |
2.45%, 6/20/2019 (c) | | | 1,396,000 | | | | 1,373,852 | |
2.52%, 7/18/2019 (c) | | | 1,399,000 | | | | 1,373,787 | |
| | | | | | | | |
Total U.S. Treasury Obligations
(Cost $5,497,126) | | | | | | | 5,495,785 | |
| | | | | | | | |
Total Short-Term Investments
(Cost $11,097,464) | | | | | | | 11,096,123 | |
| | | | | | | | |
Total Investments — 100.6%
(Cost $27,207,616) | | | | | | | 26,443,774 | |
Liabilities in Excess of
Other Assets — (0.6%) | | | | | | | (159,369 | ) |
| | | | | | | | |
Net Assets — 100.0% | | | | | | | 26,284,405 | |
| | | | | | | | |
Percentages indicated are based on net assets.
| | |
Abbreviations |
| OYJ | | — Public Limited Company |
| JPY | | — Japanese Yen |
| |
| (a) | | — Investment in affiliate. Fund is registered under the Investment Company Act of 1940, as amended, and advised by J.P. Morgan Investment Management Inc. |
| (b) | | — The rate shown is the current yield as of October 31, 2018. |
| (c) | | — The rate shown is the effective yield as of October 31, 2018. |
| * | | — Non-income producing security. |
SEE NOTES TO FINANCIAL STATEMENTS.
| | | | | | | | |
| | | |
| OCTOBER 31, 2018 | | J.P. MORGAN EXCHANGE-TRADED FUNDS | | | | | 65 | |
JPMorgan Event Driven ETF
SCHEDULE OF PORTFOLIO INVESTMENTS
AS OF OCTOBER 31, 2018 (continued)
| | | | | | | | | | | | | | | | | | | | |
| Futures contracts outstanding as of October 31, 2018: | |
| DESCRIPTION | | NUMBER OF
CONTRACTS | | | EXPIRATION
DATE | | | TRADING
CURRENCY | | | NOTIONAL
AMOUNT($) | | | VALUE AND
UNREALIZED
APPRECIATION
(DEPRECIATION)($) | |
Short Contracts | | | | | |
SPI 200 Index | | | (3 | ) | | | 12/2018 | | | | AUD | | | | (308,908 | ) | | | 18,000 | |
| | | | | | | | | | | | | | | | | | | | |
| | | | | | | | 18,000 | |
| | | | | | | | | | | | | | | | | | | | |
Abbreviations
| | |
| AUD | | — Australian Dollar |
| SPI | | — Australian Securities Exchange |
| | | | | | | | | | | | | | | | | | | | |
| Forward foreign currency exchange contracts outstanding as of October 31, 2018: | |
| CURRENCY PURCHASED | | | CURRENCY SOLD | | | COUNTERPARTY | | SETTLEMENT
DATE | | | UNREALIZED
APPRECIATION
(DEPRECIATION)($) | |
| USD | | | 468,428 | | | AUD | | | 657,731 | | | Citibank, NA | | | 11/19/2018 | | | | 2,570 | |
| USD | | | 275,382 | | | CAD | | | 357,979 | | | Citibank, NA | | | 11/19/2018 | | | | 3,375 | |
| USD | | | 163,408 | | | CHF | | | 161,458 | | | Citibank, NA | | | 11/19/2018 | | | | 2,851 | |
| USD | | | 304,956 | | | EUR | | | 262,617 | | | Citibank, NA | | | 11/19/2018 | | | | 7,105 | |
| USD | | | 281,812 | | | JPY | | | 30,900,000 | | | State Street Corp. | | | 7/16/2019 | | | | 1,712 | |
| | | | | | | | | | | | | | | | | | | | |
| Total unrealized appreciation | | | | 17,613 | |
| | | | | | | | | | | | | | | | | | | | |
| CAD | | | 233,522 | | | JPY | | | 20,128,878 | | | Goldman Sachs International | | | 11/19/2018 | | | | (1,171 | ) |
| | | | | | | | | | | | | | | | | | | | |
| Total unrealized depreciation | | | | (1,171 | ) |
| | | | | | | | | | | | | | | | | | | | |
| Net unrealized appreciation | | | | 16,442 | |
| | | | | | | | | | | | | | | | | | | | |
Abbreviations
| | |
| AUD | | — Australian Dollar |
| CAD | | — Canadian Dollar |
| CHF | | — Swiss Franc |
| | |
| EUR | | — Euro |
| JPY | | — Japanese Yen |
| USD | | — United States Dollar |
| | | | | | | | | | | | | | | | | | | | |
| Over the Counter (“OTC”) Total Return Basket Swaps Outstanding at October 31, 2018 | |
| COUNTERPARTY | | DESCRIPTION | | TERMINATION
DATE | | NOTIONAL
VALUE (1) | | | NET UNREALIZED
APPRECIATION
(DEPRECIATION) (2) | | | NET CASH
AND OTHER
RECEIVABLES
(PAYABLES) | | | VALUE | |
| Bank of America | | The Fund receives the total return on a portfolio of long and short equity positions and pays or receives the net of one month LIBOR on long positions and short positions respectively, plus or minus a specified spread (rates range from 0.00% to 0.25%), which is denominated in USD based on the local currencies of the positions within the swaps. | | 12/31/2018 | | $ | 3,172,333 | | | $ | (155,807 | ) | | $ | (3,555 | ) | | $ | (159,362 | ) |
| | | | | | | | | | | | | | | | | | | | |
SEE NOTES TO FINANCIAL STATEMENTS.
| | | | | | |
| | | |
| 66 | | | | J.P. MORGAN EXCHANGE-TRADED FUNDS | | OCTOBER 31, 2018 |
| | | | | | | | | | | | | | | | |
| REFERENCE ENTITY | | SHARES | | | NOTIONAL
VALUE($) (1) | | | NET UNREALIZED
APPRECIATION
(DEPRECIATION)($) (2) | | | PERCENTAGE
OF NET
ASSETS (%) | |
Long Positions | | | | | | | | | | | | | | | | |
| | | | |
Common Stocks | | | | | | | | | | | | | | | | |
Automobiles | | | | | | | | | | | | | | | | |
Fiat Chrysler Automobiles NV* | | | 7,000 | | | | 105,770 | | | | (6,930 | ) | | | (0.0 | )(a) |
| | | | | | | | | | | | | | | | |
Banks | | | | | | | | | | | | | | | | |
Customers Bancorp, Inc.* | | | 2,000 | | | | 40,980 | | | | (5,580 | ) | | | (0.0 | )(a) |
| | | | | | | | | | | | | | | | |
Capital Markets | | | | | | | | | | | | | | | | |
BGC Partners, Inc. | | | 11,400 | | | | 120,726 | | | | (5,130 | ) | | | (0.0 | )(a) |
| | | | | | | | | | | | | | | | |
Chemicals | | | | | | | | | | | | | | | | |
Platform Specialty Products Corp.* | | | 15,200 | | | | 164,464 | | | | (3,344 | ) | | | (0.0 | )(a) |
| | | | | | | | | | | | | | | | |
Commercial Services & Supplies | | | | | | | | | | | | | | | | |
KAR Auction Services, Inc. | | | 2,900 | | | | 165,126 | | | | 2,204 | | | | 0.0 | (a) |
| | | | | | | | | | | | | | | | |
Communications Equipment | | | | | | | | | | | | | | | | |
NETGEAR, Inc.* | | | 2,700 | | | | 149,796 | | | | (1,458 | ) | | | (0.0 | )(a) |
Oclaro, Inc.* | | | 22,818 | | | | 187,564 | | | | (4,792 | ) | | | (0.0 | )(a) |
| | | | | | | | | | | | | | | | |
| | | 25,518 | | | | 337,360 | | | | (6,250 | ) | | | (0.0 | )(a) |
| | | | | | | | | | | | | | | | |
Containers & Packaging | | | | | | | | | | | | | | | | |
Sealed Air Corp. | | | 4,300 | | | | 139,148 | | | | (16,211 | ) | | | (0.1 | ) |
| | | | | | | | | | | | | | | | |
Electronic Equipment, Instruments & Components | | | | | | | | | | | | | | | | |
Orbotech Ltd.* | | | 3,210 | | | | 179,568 | | | | 289 | | | | 0.0 | (a) |
| | | | | | | | | | | | | | | | |
Health Care Providers & Services | | | | | | | | | | | | | | | | |
Aetna, Inc. | | | 2,069 | | | | 410,490 | | | | (10,366 | ) | | | (0.0 | )(a) |
Express Scripts Holding Co.* | | | 4,667 | | | | 452,559 | | | | 9,801 | | | | 0.0 | (a) |
Henry Schein, Inc.* | | | 2,300 | | | | 190,900 | | | | (7,728 | ) | | | (0.0 | )(a) |
| | | | | | | | | | | | | | | | |
| | | 9,036 | | | | 1,053,949 | | | | (8,293 | ) | | | (0.0 | )(a) |
| | | | | | | | | | | | | | | | |
Hotels, Restaurants & Leisure | | | | | | | | | | | | | | | | |
Brinker International, Inc. | | | 3,800 | | | | 164,730 | | | | (10,754 | ) | | | (0.1 | ) |
Sonic Corp. | | | 4,776 | | | | 206,705 | | | | (143 | ) | | | (0.0 | )(a) |
| | | | | | | | | | | | | | | | |
| | | 8,576 | | | | 371,435 | | | | (10,897 | ) | | | (0.1 | ) |
| | | | | | | | | | | | | | | | |
Leisure Products | | | | | | | | | | | | | | | | |
Brunswick Corp. | | | 2,500 | | | | 129,975 | | | | (19,300 | ) | | | (0.1 | ) |
| | | | | | | | | | | | | | | | |
Machinery | | | | | | | | | | | | | | | | |
Terex Corp. | | | 4,400 | | | | 146,916 | | | | (17,952 | ) | | | (0.1 | ) |
Trinity Industries, Inc. | | | 4,400 | | | | 125,620 | | | | (39,160 | ) | | | (0.1 | ) |
| | | | | | | | | | | | | | | | |
| | | 8,800 | | | | 272,536 | | | | (57,112 | ) | | | (0.2 | ) |
| | | | | | | | | | | | | | | | |
Multi-Utilities | | | | | | | | | | | | | | | | |
SCANA Corp. | | | 7,885 | | | | 315,794 | | | | 789 | | | | 0.0 | (a) |
| | | | | | | | | | | | | | | | |
Oil, Gas & Consumable Fuels | | | | | | | | | | | | | | | | |
Arch Coal, Inc. | | | 1,900 | | | | 182,210 | | | | 10,982 | | | | 0.0 | (a) |
EQT Corp. | | | 3,100 | | | | 105,307 | | | | (36,208 | ) | | | (0.1 | ) |
| | | | | | | | | | | | | | | | |
| | | 5,000 | | | | 287,517 | | | | (25,226 | ) | | | (0.1 | ) |
| | | | | | | | | | | | | | | | |
Software | | | | | | | | | | | | | | | | |
Avaya Holdings Corp.* | | | 2,500 | | | | 41,050 | | | | (7,825 | ) | | | (0.0 | )(a) |
| | | | | | | | | | | | | | | | |
Specialty Retail | | | | | | | | | | | | | | | | |
Sleep Number Corp.* | | | 4,600 | | | | 167,302 | | | | 15,778 | | | | 0.0 | (a) |
| | | | | | | | | | | | | | | | |
Technology Hardware, Storage & Peripherals | | | | | | | | | | | | | | | | |
Stratasys Ltd.* | | | 6,600 | | | | 125,796 | | | | (9,636 | ) | | | (0.0 | )(a) |
| | | | | | | | | | | | | | | | |
Total Long Positions of Total Return Basket Swap | | | 127,025 | | | | 4,018,496 | | | | (162,674 | ) | | | (0.6 | ) |
| | | | | | | | | | | | | | | | |
SEE NOTES TO FINANCIAL STATEMENTS.
| | | | | | | | |
| | | |
| OCTOBER 31, 2018 | | J.P. MORGAN EXCHANGE-TRADED FUNDS | | | | | 67 | |
JPMorgan Event Driven ETF
SCHEDULE OF PORTFOLIO INVESTMENTS
AS OF OCTOBER 31, 2018 (continued)
| | | | | | | | | | | | | | | | |
| REFERENCE ENTITY | | SHARES | | | NOTIONAL
VALUE($) (1) | | | NET UNREALIZED
APPRECIATION
(DEPRECIATION)($) (2) | | | PERCENTAGE
OF NET
ASSETS (%) | |
Short Positions | | | | | | | | | | | | | | | | |
| | | | |
Common Stocks | | | | | | | | | | | | | | | | |
Capital Markets | | | | | | | | | | | | | | | | |
CME Group, Inc. | | | (446 | ) | | | (81,725 | ) | | | (1,334 | ) | | | (0.0 | )(a) |
| | | | | | | | | | | | | | | | |
Communications Equipment | | | | | | | | | | | | | | | | |
Lumentum Holdings, Inc.* | | | (1,436 | ) | | | (78,477 | ) | | | 1,336 | | | | 0.0 | (a) |
| | | | | | | | | | | | | | | | |
Health Care Providers & Services | | | | | | | | | | | | | | | | |
Cigna Corp. | | | (1,124 | ) | | | (240,323 | ) | | | (4,316 | ) | | | (0.0 | )(a) |
| | | | | | | | | | | | | | | | |
Multi-Utilities | | | | | | | | | | | | | | | | |
Dominion Energy, Inc. | | | (5,222 | ) | | | (372,955 | ) | | | 9,347 | | | | 0.0 | (a) |
| | | | | | | | | | | | | | | | |
Semiconductors & Semiconductor Equipment | | | | | | | | | | | | | | | | |
KLA-Tencor Corp. | | | (794 | ) | | | (72,683 | ) | | | 1,834 | | | | 0.0 | (a) |
| | | | | | | | | | | | | | | | |
Total Short Positions of Total Return Basket Swap | | | (9,022 | ) | | | (846,163 | ) | | | 6,867 | | | | 0.0 | (a) |
| | | | | | | | | | | | | | | | |
Total of Long and Short Positions of Total Return Basket Swap | | | 118,003 | | | | 3,172,333 | | | | (155,807 | ) | | | (0.6 | ) |
| | | | | | | | | | | | | | | | |
| | | | | | | | | | | | | | | | | | | | |
| COUNTERPARTY | | DESCRIPTION | | TERMINATION
DATE | | NOTIONAL
VALUE (1) | | | NET UNREALIZED
APPRECIATION
(DEPRECIATION) (2) | | | NET CASH
AND OTHER
RECEIVABLES
(PAYABLES) | | | VALUE | |
| Bank of America | | The Fund receives the total return on a portfolio of long equity positions and pays or receives the net of one month LIBOR on long positions, plus or minus a specified spread (rates range from 0.00% to 0.25%), which is denominated in GBP based on the local currencies of the positions within the swaps. | | 5/31/2019 | | $ | 369,874 | | | $ | 15,489 | | | $ | 20 | | | $ | 15,509 | |
| | | | | | | | | | | | | | | | | | | | |
| | | | | | | | | | | | | | | | |
| REFERENCE ENTITY | | SHARES | | | NOTIONAL
VALUE($) (1) | | | NET UNREALIZED
APPRECIATION
(DEPRECIATION)($) (2) | | | PERCENTAGE
OF NET
ASSETS (%) | |
Long Positions | | | | | | | | | | | | | | | | |
| | | | |
Common Stocks | | | | | | | | | | | | | | | | |
Biotechnology | | | | | | | | | | | | | | | | |
Shire plc | | | 1,771 | | | | 106,882 | | | | 8,369 | | | | 0.0 | (a) |
| | | | | | | | | | | | | | | | |
Capital Markets | | | | | | | | | | | | | | | | |
NEX Group plc | | | 10,140 | | | | 147,055 | | | | 13,318 | | | | 0.1 | |
| | | | | | | | | | | | | | | | |
Insurance | | | | | | | | | | | | | | | | |
Prudential plc | | | 5,790 | | | | 115,937 | | | | (6,198 | ) | | | (0.0 | )(a) |
| | | | | | | | | | | | | | | | |
Total Long Positions of Total Return Basket Swap | | | 17,701 | | | | 369,874 | | | | 15,489 | | | | 0.1 | |
| | | | | | | | | | | | | | | | |
SEE NOTES TO FINANCIAL STATEMENTS.
| | | | | | |
| | | |
| 68 | | | | J.P. MORGAN EXCHANGE-TRADED FUNDS | | OCTOBER 31, 2018 |
| | | | | | | | | | | | | | | | | | | | |
| COUNTERPARTY | | DESCRIPTION | | TERMINATION
DATE | | NOTIONAL
VALUE (1) | | | NET UNREALIZED
APPRECIATION
(DEPRECIATION) (2) | | | NET CASH
AND OTHER
RECEIVABLES
(PAYABLES) | | | VALUE | |
| Bank of America | | The Fund receives the total return on a portfolio of long and short equity positions and pays or receives the net of one month BA on long positions and short positions respectively, plus or minus a specified spread (rates range from 0.00% to 0.50%), which is denominated in CAD based on the local currencies of the positions within the swaps. | | 12/31/2018 —
11/26/2019 | | $ | 89,520 | | | $ | 4,529 | | | $ | (96 | ) | | $ | 4,433 | |
| | | | | | | | | | | | | | | | | | | | |
| | | | | | | | | | | | | | | | |
| REFERENCE ENTITY | | SHARES | | | NOTIONAL
VALUE($) (1) | | | NET UNREALIZED
APPRECIATION
(DEPRECIATION)($) (2) | | | PERCENTAGE
OF NET
ASSETS (%) | |
Long Positions | | | | | | | | | | | | | | | | |
| | | | |
Common Stocks | | | | | | | | | | | | | | | | |
Metals & Mining | | | | | | | | | | | | | | | | |
Sandstorm Gold Ltd.* | | | 5,400 | | | | 19,977 | | | | (615 | ) | | | (0.0 | )(a) |
| | | | | | | | | | | | | | | | |
Oil, Gas & Consumable Fuels | | | | | | | | | | | | | | | | |
MEG Energy Corp.* | | | 21,131 | | | | 169,022 | | | | 918 | | | | 0.0 | (a) |
| | | | | | | | | | | | | | | | |
Total Long Positions of Total Return Basket Swap | | | 26,531 | | | | 188,999 | | | | 303 | | | | 0.0 | (a) |
| | | | | | | | | | | | | | | | |
| | | | |
Short Position | | | | | | | | | | | | | | | | |
| | | | |
Common Stocks | | | | | | | | | | | | | | | | |
Oil, Gas & Consumable Fuels | | | | | | | | | | | | | | | | |
Husky Energy, Inc. | | | (7,037 | ) | | | (99,479 | ) | | | 4,226 | | | | 0.0 | (a) |
| | | | | | | | | | | | | | | | |
Total of Long and Short Positions of Total Return Basket Swap | | | 19,494 | | | | 89,520 | | | | 4,529 | | | | 0.0 | (a) |
| | | | | | | | | | | | | | | | |
| | | | | | | | | | | | | | | | | | | | |
| COUNTERPARTY | | DESCRIPTION | | TERMINATION
DATE | | NOTIONAL
VALUE (1) | | | NET UNREALIZED
APPRECIATION
(DEPRECIATION) (2) | | | NET CASH
AND OTHER
RECEIVABLES
(PAYABLES) | | | VALUE | |
| Bank of America | | The Fund receives the total return on a portfolio of long equity positions and pays or receives the net of one month BBR on long positions, plus or minus a specified spread (rates range from 0.00% to 0.35%), which is denominated in AUD based on the local currencies of the positions within the swaps. | | 1/1/2019 | | $ | 309,162 | | | $ | (19,487 | ) | | $ | 2,751 | | | $ | (16,736 | ) |
| | | | | | | | | | | | | | | | | | | | |
| | | | | | | | | | | | | | | | |
| REFERENCE ENTITY | | SHARES | | | NOTIONAL
VALUE($) (1) | | | NET UNREALIZED
APPRECIATION
(DEPRECIATION)($) (2) | | | PERCENTAGE
OF NET
ASSETS (%) | |
Long Positions | | | | | | | | | | | | | | | | |
| | | | |
Common Stocks | | | | | | | | | | | | | | | | |
Food & Staples Retailing | | | | | | | | | | | | | | | | |
Wesfarmers Ltd. | | | 4,642 | | | | 153,732 | | | | (7,192 | ) | | | (0.0 | )(a) |
| | | | | | | | | | | | | | | | |
Metals & Mining | | | | | | | | | | | | | | | | |
South32 Ltd. | | | 60,264 | | | | 155,430 | | | | (12,295 | ) | | | (0.1 | ) |
| | | | | | | | | | | | | | | | |
Total Long Positions of Total Return Basket Swap | | | 64,906 | | | | 309,162 | | | | (19,487 | ) | | | (0.1 | ) |
| | | | | | | | | | | | | | | | |
SEE NOTES TO FINANCIAL STATEMENTS.
| | | | | | | | |
| | | |
| OCTOBER 31, 2018 | | J.P. MORGAN EXCHANGE-TRADED FUNDS | | | | | 69 | |
JPMorgan Event Driven ETF
SCHEDULE OF PORTFOLIO INVESTMENTS
AS OF OCTOBER 31, 2018 (continued)
| | | | | | | | | | | | | | | | | | | | |
| COUNTERPARTY | | DESCRIPTION | | TERMINATION
DATE | | NOTIONAL
VALUE (1) | | | NET UNREALIZED
APPRECIATION
(DEPRECIATION) (2) | | | NET CASH
AND OTHER
RECEIVABLES
(PAYABLES) | | | VALUE | |
| Bank of America | | The Fund receives the total return on a portfolio of long equity positions and pays or receives the net of one month EURIBOR on long positions, plus or minus a specified spread (rates range from 0.00% to 0.25%), which is denominated in EUR based on the local currencies of the positions within the swaps. | | 6/28/2019 | | $ | 726,513 | | | $ | 1,492 | | | $ | 33 | | | $ | 1,525 | |
| | | | | | | | | | | | | | | | | | | | |
| | | | | | | | | | | | | | | | |
| REFERENCE ENTITY | | SHARES | | | NOTIONAL
VALUE($) (1) | | | NET UNREALIZED
APPRECIATION
(DEPRECIATION)($) (2) | | | PERCENTAGE
OF NET
ASSETS (%) | |
Long Positions | | | | | | | | | | | | | | | | |
| | | | |
Common Stocks | | | | | | | | | | | | | | | | |
Pharmaceuticals | | | | | | | | | | | | | | | | |
STADA Arzneimittel AG | | | 3,903 | | | | 360,885 | | | | (560 | ) | | | (0.0 | )(a) |
| | | | | | | | | | | | | | | | |
Software | | | | | | | | | | | | | | | | |
Gemalto NV* | | | 6,410 | | | | 365,628 | | | | 2,052 | | | | 0.0 | (a) |
| | | | | | | | | | | | | | | | |
Total Long Positions of Total Return Basket Swap | | | 10,313 | | | | 726,513 | | | | 1,492 | | | | 0.0 | (a) |
| | | | | | | | | | | | | | | | |
| | | | | | | | | | | | | | | | | | | | | | |
| COUNTERPARTY | | DESCRIPTION | | TERMINATION
DATE | | | NOTIONAL
VALUE (1) | | | NET UNREALIZED
APPRECIATION
(DEPRECIATION) (2) | | | NET CASH
AND OTHER
RECEIVABLES
(PAYABLES) | | | VALUE | |
Bank of America | | The Fund receives the total return on a portfolio of short equity positions and pays or receives the net of one month LIBOR on short positions, plus or minus a specified spread (rates range from (0.35)% to 0.00%), which is denominated in JPY based on the local currencies of the positions within the swaps. | | | 5/27/2019 | | | $ | (62,189 | ) | | $ | (1,838 | ) | | $ | (1,223 | ) | | $ | (3,061 | ) |
| | | | | | | | | | | | | | | | | | | | | | |
| | | | | | | | | | | | | | | | |
| REFERENCE ENTITY | | SHARES | | | NOTIONAL
VALUE($) (1) | | | NET UNREALIZED
APPRECIATION
(DEPRECIATION)($) (2) | | | PERCENTAGE
OF NET
ASSETS (%) | |
Short Position | | | | | | | | | | | | | | | | |
| | | | |
Common Stocks | | | | | | | | | | | | | | | | |
Pharmaceuticals | | | | | | | | | | | | | | | | |
Takeda Pharmaceutical Co. Ltd. | | | (1,500 | ) | | | (62,189 | ) | | | (1,838 | ) | | | (0.0 | )(a) |
| | | | | | | | | | | | | | | | |
| | | | | | | | | | | | | | | | | | | | | | |
| COUNTERPARTY | | DESCRIPTION | | TERMINATION
DATE | | | NOTIONAL
VALUE (1) | | | NET UNREALIZED
APPRECIATION
(DEPRECIATION) (2) | | | NET CASH
AND OTHER
RECEIVABLES
(PAYABLES) | | | VALUE | |
Bank of America | | The Fund receives the total return on a portfolio and pays or receives the net of one month STIBOR, plus or minus a specified spread (rates range from 0.00% to 0.25%), which is denominated in SEK based on the local currencies of the positions within the swaps. | | | 7/31/2019 | | | $ | — | | | $ | — | | | $ | (594 | ) | | $ | (594 | ) |
| | | | | | | | | | | | | | | | | | | | | | |
SEE NOTES TO FINANCIAL STATEMENTS.
| | | | | | |
| | | |
| 70 | | | | J.P. MORGAN EXCHANGE-TRADED FUNDS | | OCTOBER 31, 2018 |
| | | | | | | | | | | | | | | | | | | | | | |
| COUNTERPARTY | | DESCRIPTION | | TERMINATION
DATE | | | NOTIONAL
VALUE (1) | | | NET UNREALIZED
APPRECIATION
(DEPRECIATION) (2) | | | NET CASH
AND OTHER
RECEIVABLES
(PAYABLES) | | | VALUE | |
Goldman Sachs | | The Fund receives the total return on a portfolio of long equity positions and pays or receives the net of one day SONIA and one month LIBOR on long positions, plus or minus a specified spread (rates range from (5.75)% to 0.30%), which is denominated in GBP based on the local currencies of the positions within the swaps. | | | 6/7/2028 | | | $ | 644,831 | | | $ | 2,659 | | | $ | 69,227 | | | $ | 71,886 | |
| | | | | | | | | | | | | | | | | | | | | | |
| | | | | | | | | | | | | | | | |
| REFERENCE ENTITY | | SHARES | | | NOTIONAL
VALUE($) (1) | | | NET UNREALIZED
APPRECIATION
(DEPRECIATION)($) (2) | | | PERCENTAGE
OF NET
ASSETS (%) | |
Long Positions | | | | | | | | | | | | | | | | |
| | | | |
Common Stocks | | | | | | | | | | | | | | | | |
Capital Markets | | | | | | | | | | | | | | | | |
NEX Group plc | | | 1,861 | | | | 26,989 | | | | 2,445 | | | | 0.0 | (a) |
| | | | | | | | | | | | | | | | |
Media | | | | | | | | | | | | | | | | |
Sky plc | | | 27,997 | | | | 617,842 | | | | 214 | | | | 0.0 | (a) |
| | | | | | | | | | | | | | | | |
Total Long Positions of Total Return Basket Swap | | | 29,858 | | | | 644,831 | | | | 2,659 | | | | 0.0 | (a) |
| | | | | | | | | | | | | | | | |
| | | | | | | | | | | | | | | | | | | | | | |
| COUNTERPARTY | | DESCRIPTION | | TERMINATION
DATE | | | NOTIONAL
VALUE (1) | | | NET UNREALIZED
APPRECIATION
(DEPRECIATION) (2) | | | NET CASH
AND OTHER
RECEIVABLES
(PAYABLES) | | | VALUE | |
Goldman Sachs | | The Fund receives the total return on a portfolio of long and short equity positions and pays or receives the net of one day FEDEF and one month LIBOR on long positions and short positions respectively, plus or minus a specified spread (rates range from (1.81)% to 0.25%), which is denominated in USD based on the local currencies of the positions within the swaps. | |
| 5/24/2028 —
11/2/2028 |
| | $ | 2,697,908 | | | $ | (99,447 | ) | | $ | (52,588 | ) | | $ | (152,035 | ) |
| | | | | | | | | | | | | | | | | | | | | | |
| | | | | | | | | | | | | | | | |
| REFERENCE ENTITY | | SHARES | | | NOTIONAL
VALUE($) (1) | | | NET UNREALIZED
APPRECIATION
(DEPRECIATION)($) (2) | | | PERCENTAGE
OF NET
ASSETS (%) | |
Long Positions | | | | | | | | | | | | | | | | |
| | | | |
Common Stocks | | | | | | | | | | | | | | | | |
Aerospace & Defense | | | | | | | | | | | | | | | | |
Engility Holdings, Inc.* | | | 2,626 | | | | 81,485 | | | | (4,096 | ) | | | (0.0 | )(a) |
| | | | | | | | | | | | | | | | |
Banks | | | | | | | | | | | | | | | | |
Green Bancorp, Inc. | | | 3,558 | | | | 65,823 | | | | (15,975 | ) | | | (0.1 | ) |
Guaranty Bancorp | | | 944 | | | | 24,563 | | | | (3,539 | ) | | | (0.0 | )(a) |
MB Financial, Inc. | | | 4,965 | | | | 220,396 | | | | (7,746 | ) | | | (0.0 | )(a) |
| | | | | | | | | | | | | | | | |
| | | 9,467 | | | | 310,782 | | | | (27,260 | ) | | | (0.1 | ) |
| | | | | | | | | | | | | | | | |
SEE NOTES TO FINANCIAL STATEMENTS.
| | | | | | | | |
| | | |
| OCTOBER 31, 2018 | | J.P. MORGAN EXCHANGE-TRADED FUNDS | | | | | 71 | |
JPMorgan Event Driven ETF
SCHEDULE OF PORTFOLIO INVESTMENTS
AS OF OCTOBER 31, 2018 (continued)
| | | | | | | | | | | | | | | | |
| REFERENCE ENTITY | | SHARES | | | NOTIONAL
VALUE($) (1) | | | NET UNREALIZED
APPRECIATION
(DEPRECIATION)($) (2) | | | PERCENTAGE
OF NET
ASSETS (%) | |
Long Positions — continued | | | | | | | | | | | | | | | | |
| | | | |
Common Stocks — continued | | | | | | | | | | | | | | | | |
Biotechnology | | | | | | | | | | | | | | | | |
Amgen, Inc. | | | 900 | | | | 173,511 | | | | (7,569 | ) | | | (0.0 | )(a) |
Celgene Corp.* | | | 1,800 | | | | 128,880 | | | | (22,734 | ) | | | (0.1 | ) |
Ironwood Pharmaceuticals, Inc.* | | | 8,800 | | | | 115,280 | | | | (34,935 | ) | | | (0.2 | ) |
| | | | | | | | | | | | | | | | |
| | | 11,500 | | | | 417,671 | | | | (65,238 | ) | | | (0.3 | ) |
| | | | | | | | | | | | | | | | |
Chemicals | | | | | | | | | | | | | | | | |
KMG Chemicals, Inc. | | | 1,956 | | | | 146,739 | | | | 2,132 | | | | 0.0 | (a) |
| | | | | | | | | | | | | | | | |
Commercial Services & Supplies | | | | | | | | | | | | | | | | |
LSC Communications, Inc. | | | 481 | | | | 4,536 | | | | (53 | ) | | | (0.0 | )(a) |
| | | | | | | | | | | | | | | | |
Communications Equipment | | | | | | | | | | | | | | | | |
NetScout Systems, Inc.* | | | 7,000 | | | | 176,820 | | | | 23,871 | | | | 0.1 | |
Oclaro, Inc.* | | | 3,358 | | | | 27,603 | | | | (705 | ) | | | (0.0 | )(a) |
| | | | | | | | | | | | | | | | |
| | | 10,358 | | | | 204,423 | | | | 23,166 | | | | 0.1 | |
| | | | | | | | | | | | | | | | |
Containers & Packaging | | | | | | | | | | | | | | | | |
Bemis Co., Inc. | | | 4,549 | | | | 208,208 | | | | 1,899 | | | | 0.0 | (a) |
| | | | | | | | | | | | | | | | |
Diversified Financial Services | | | | | | | | | | | | | | | | |
Voya Financial, Inc. | | | 3,200 | | | | 140,032 | | | | (18,208 | ) | | | (0.1 | ) |
| | | | | | | | | | | | | | | | |
Electronic Equipment, Instruments & Components | | | | | | | | | | | | | | | | |
Orbotech Ltd.* | | | 525 | | | | 29,368 | | | | 47 | | | | 0.0 | (a) |
SYNNEX Corp. | | | 3 | | | | 233 | | | | (35 | ) | | | (0.0 | )(a) |
| | | | | | | | | | | | | | | | |
| | | 528 | | | | 29,601 | | | | 12 | | | | 0.0 | (a) |
| | | | | | | | | | | | | | | | |
Energy Equipment & Services | | | | | | | | | | | | | | | | |
Basic Energy Services, Inc.* | | | 822 | | | | 6,387 | | | | (2,425 | ) | | | (0.0 | )(a) |
| | | | | | | | | | | | | | | | |
Entertainment | | | | | | | | | | | | | | | | |
Pandora Media, Inc.* | | | 37,430 | | | | 318,155 | | | | (5,894 | ) | | | (0.0 | )(a) |
| | | | | | | | | | | | | | | | |
Food & Staples Retailing | | | | | | | | | | | | | | | | |
Kroger Co. (The) | | | 5,300 | | | | 157,728 | | | | 10,759 | | | | 0.0 | (a) |
| | | | | | | | | | | | | | | | |
Health Care Providers & Services | | | | | | | | | | | | | | | | |
DaVita, Inc.* | | | 2,400 | | | | 161,616 | | | | (13,608 | ) | | | (0.1 | ) |
| | | | | | | | | | | | | | | | |
Hotels, Restaurants & Leisure | | | | | | | | | | | | | | | | |
Hilton Worldwide Holdings, Inc. | | | 2,200 | | | | 156,574 | | | | (4,906 | ) | | | (0.0 | )(a) |
Papa John’s International, Inc. | | | 3,100 | | | | 169,074 | | | | 1,643 | | | | 0.0 | (a) |
| | | | | | | | | | | | | | | | |
| | | 5,300 | | | | 325,648 | | | | (3,263 | ) | | | (0.0 | )(a) |
| | | | | | | | | | | | | | | | |
Industrial Conglomerates | | | | | | | | | | | | | | | | |
General Electric Co. | | | 11,500 | | | | 116,150 | | | | (36,570 | ) | | | (0.2 | ) |
| | | | | | | | | | | | | | | | |
Insurance | | | | | | | | | | | | | | | | |
Stewart Information Services Corp. | | | 1,884 | | | | 77,771 | | | | (4,916 | ) | | | (0.0 | )(a) |
| | | | | | | | | | | | | | | | |
Media | | | | | | | | | | | | | | | | |
AMC Networks, Inc.* | | | 2,700 | | | | 158,166 | | | | 2,511 | | | | 0.0 | (a) |
| | | | | | | | | | | | | | | | |
Oil, Gas & Consumable Fuels | | | | | | | | | | | | | | | | |
Energen Corp.* | | | 5,407 | | | | 389,142 | | | | (57,476 | ) | | | (0.2 | ) |
Gulfport Energy Corp.* | | | 15,400 | | | | 140,294 | | | | (29,876 | ) | | | (0.1 | ) |
| | | | | | | | | | | | | | | | |
| | | 20,807 | | | | 529,436 | | | | (87,352 | ) | | | (0.3 | ) |
| | | | | | | | | | | | | | | | |
Semiconductors & Semiconductor Equipment | | | | | | | | | | | | | | | | |
Applied Materials, Inc. | | | 3,900 | | | | 128,232 | | | | (6,045 | ) | | | (0.0 | )(a) |
| | | | | | | | | | | | | | | | |
SEE NOTES TO FINANCIAL STATEMENTS.
| | | | | | |
| | | |
| 72 | | | | J.P. MORGAN EXCHANGE-TRADED FUNDS | | OCTOBER 31, 2018 |
| | | | | | | | | | | | | | | | |
| REFERENCE ENTITY | | SHARES | | | NOTIONAL
VALUE($) (1) | | | NET UNREALIZED
APPRECIATION
(DEPRECIATION)($) (2) | | | PERCENTAGE
OF NET
ASSETS (%) | |
Long Positions — continued | | | | | | | | | | | | | | | | |
| | | | |
Common Stocks — continued | | | | | | | | | | | | | | | | |
Software | | | | | | | | | | | | | | | | |
SendGrid, Inc.* | | | 7,511 | | | | 272,800 | | | | 16,101 | | | | 0.1 | |
| | | | | | | | | | | | | | | | |
Specialty Retail | | | | | | | | | | | | | | | | |
Children’s Place, Inc. (The) | | | 1,300 | | | | 194,220 | | | | 28,561 | | | | 0.1 | |
Shoe Carnival, Inc. | | | 4,000 | | | | 162,920 | | | | 15,320 | | | | 0.1 | |
| | | | | | | | | | | | | | | | |
| | | 5,300 | | | | 357,140 | | | | 43,881 | | | | 0.2 | |
| | | | | | | | | | | | | | | | |
Thrifts & Mortgage Finance | | | | | | | | | | | | | | | | |
Beneficial Bancorp, Inc. | | | 1,818 | | | | 28,415 | | | | (2,835 | ) | | | (0.0 | )(a) |
| | | | | | | | | | | | | | | | |
Total Long Positions of Total Return Basket Swap | | | 151,337 | | | | 4,181,121 | | | | (177,302 | ) | | | (0.7 | ) |
| | | | | | | | | | | | | | | | |
| | | | |
Short Positions | | | | | | | | | | | | | | | | |
| | | | |
Common Stocks | | | | | | | | | | | | | | | | |
Banks | | | | | | | | | | | | | | | | |
Fifth Third Bancorp | | | (6,839 | ) | | | (184,585 | ) | | | 6,633 | | | | 0.0 | (a) |
Independent Bank Group, Inc. | | | (420 | ) | | | (24,322 | ) | | | 3,566 | | | | 0.0 | (a) |
Veritex Holdings, Inc.* | | | (2,782 | ) | | | (65,544 | ) | | | 16,247 | | | | 0.1 | |
| | | | | | | | | | | | | | | | |
| | | (10,041 | ) | | | (274,451 | ) | | | 26,446 | | | | 0.1 | |
| | | | | | | | | | | | | | | | |
Capital Markets | | | | | | | | | | | | | | | | |
CME Group, Inc. | | | (81 | ) | | | (14,842 | ) | | | (243 | ) | | | (0.0 | )(a) |
| | | | | | | | | | | | | | | | |
Commercial Services & Supplies | | | | | | | | | | | | | | | | |
Quad/Graphics, Inc. | | | (298 | ) | | | (4,598 | ) | | | 28 | | | | 0.0 | (a) |
| | | | | | | | | | | | | | | | |
Communications Equipment | | | | | | | | | | | | | | | | |
Lumentum Holdings, Inc.* | | | (211 | ) | | | (11,531 | ) | | | 196 | | | | 0.0 | (a) |
| | | | | | | | | | | | | | | | |
Energy Equipment & Services | | | | | | | | | | | | | | | | |
Key Energy Services, Inc.* | | | (596 | ) | | | (5,394 | ) | | | 1,037 | | | | 0.0 | (a) |
| | | | | | | | | | | | | | | | |
Insurance | | | | | | | | | | | | | | | | |
Fidelity National Financial, Inc. | | | (1,148 | ) | | | (38,401 | ) | | | 4,588 | | | | 0.0 | (a) |
| | | | | | | | | | | | | | | | |
IT Services | | | | | | | | | | | | | | | | |
Science Applications International Corp. | | | (1,169 | ) | | | (81,257 | ) | | | 4,232 | | | | 0.0 | (a) |
Twilio, Inc.* | | | (3,606 | ) | | | (271,244 | ) | | | (16,175 | ) | | | (0.0 | )(a) |
| | | | | | | | | | | | | | | | |
| | | (4,775 | ) | | | (352,501 | ) | | | (11,943 | ) | | | (0.0 | )(a) |
| | | | | | | | | | | | | | | | |
Media | | | | | | | | | | | | | | | | |
Sirius XM Holdings, Inc. | | | (53,380 | ) | | | (321,348 | ) | | | (2,548 | ) | | | (0.0 | )(a) |
| | | | | | | | | | | | | | | | |
Oil, Gas & Consumable Fuels | | | | | | | | | | | | | | | | |
Diamondback Energy, Inc. | | | (3,448 | ) | | | (387,417 | ) | | | 58,340 | | | | 0.2 | |
| | | | | | | | | | | | | | | | |
Semiconductors & Semiconductor Equipment | | | | | | | | | | | | | | | | |
Cabot Microelectronics Corp. | | | (387 | ) | | | (37,779 | ) | | | (1,312 | ) | | | (0.0 | )(a) |
KLA-Tencor Corp. | | | (130 | ) | | | (11,900 | ) | | | 301 | | | | 0.0 | (a) |
| | | | | | | | | | | | | | | | |
| | | (517 | ) | | | (49,679 | ) | | | (1,011 | ) | | | (0.0 | )(a) |
| | | | | | | | | | | | | | | | |
Thrifts & Mortgage Finance | | | | | | | | | | | | | | | | |
WSFS Financial Corp. | | | (542 | ) | | | (23,051 | ) | | | 2,965 | | | | 0.0 | (a) |
| | | | | | | | | | | | | | | | |
Total Short Positions of Total Return Basket Swap | | | (75,037 | ) | | | (1,483,213 | ) | | | 77,855 | | | | 0.3 | |
| | | | | | | | | | | | | | | | |
Total of Long and Short Positions of Total Return Basket Swap | | | 76,300 | | | | 2,697,908 | | | | (99,447 | ) | | | (0.4 | ) |
| | | | | | | | | | | | | | | | |
SEE NOTES TO FINANCIAL STATEMENTS.
| | | | | | | | |
| | | |
| OCTOBER 31, 2018 | | J.P. MORGAN EXCHANGE-TRADED FUNDS | | | | | 73 | |
JPMorgan Event Driven ETF
SCHEDULE OF PORTFOLIO INVESTMENTS
AS OF OCTOBER 31, 2018 (continued)
| | | | | | | | | | | | | | | | | | | | | | |
| COUNTERPARTY | | DESCRIPTION | | TERMINATION
DATE | | | NOTIONAL
VALUE (1) | | | NET UNREALIZED
APPRECIATION
(DEPRECIATION) (2) | | | NET CASH
AND OTHER
RECEIVABLES
(PAYABLES) | | | VALUE | |
Goldman Sachs | | The Fund receives the total return on a portfolio of long equity positions and pays or receives the net of one day EONIA on long positions, plus or minus a specified spread of 0.30%, which is denominated in EUR based on the local currencies of the positions within the swaps. | | | 5/17/2028 | | | $ | 233,681 | | | $ | (2,760 | ) | | $ | (11,144 | ) | | $ | (13,904 | ) |
| | | | | | | | | | | | | | | | | | | | | | |
| | | | | | | | | | | | | | | | |
| REFERENCE ENTITY | | SHARES | | | NOTIONAL
VALUE($) (1) | | | NET UNREALIZED
APPRECIATION
(DEPRECIATION)($) (2) | | | PERCENTAGE
OF NET
ASSETS (%) | |
Long Position | | | | | | | | | | | | | | | | |
| | | | |
Common Stocks | | | | | | | | | | | | | | | | |
Electric Utilities | | | | | | | | | | | | | | | | |
EDP — Energias de Portugal SA | | | 66,467 | | | | 233,681 | | | | (2,760 | ) | | | (0.0 | )(a) |
| | | | | | | | | | | | | | | | |
| | | | | | | | | | | | | | | | | | | | | | |
| COUNTERPARTY | | DESCRIPTION | | TERMINATION
DATE | | | NOTIONAL
VALUE (1) | | | NET UNREALIZED
APPRECIATION
(DEPRECIATION) (2) | | | NET CASH
AND OTHER
RECEIVABLES
(PAYABLES) | | | VALUE | |
Goldman Sachs | | The Fund receives the total return on a portfolio of long and short equity positions and pays or receives the net of one day BOJ TONAR on long positions and short positions respectively, plus or minus a specified spread (rates range from (0.30)% to 0.60%), which is denominated in JPY based on the local currencies of the positions within the swaps. | | | 5/23/2028 | | | $ | (43 | ) | | $ | 34 | | | $ | 163 | | | $ | 197 | |
| | | | | | | | | | | | | | | | | | | | | | |
| | | | | | | | | | | | | | | | |
| REFERENCE ENTITY | | SHARES | | | NOTIONAL
VALUE($) (1) | | | NET UNREALIZED
APPRECIATION
(DEPRECIATION)($) (2) | | | PERCENTAGE
OF NET
ASSETS (%) | |
Long Position | | | | | | | | | | | | | | | | |
| | | | |
Common Stocks | | | | | | | | | | | | | | | | |
Metals & Mining | | | | | | | | | | | | | | | | |
Nisshin Steel Co. Ltd. | | | 8,900 | | | | 116,168 | | | | (13,926 | ) | | | (0.1 | ) |
| | | | | | | | | | | | | | | | |
| | | | |
Short Position | | | | | | | | | | | | | | | | |
| | | | |
Common Stocks | | | | | | | | | | | | | | | | |
Metals & Mining | | | | | | | | | | | | | | | | |
Nippon Steel & Sumitomo Metal Corp. | | | (6,300 | ) | | | (116,211 | ) | | | 13,960 | | | | 0.1 | |
| | | | | | | | | | | | | | | | |
Total of Long and Short Positions of Total Return Basket Swap | | | 2,600 | | | | (43 | ) | | | 34 | | | | 0.0 | (a) |
| | | | | | | | | | | | | | | | |
SEE NOTES TO FINANCIAL STATEMENTS.
| | | | | | |
| | | |
| 74 | | | | J.P. MORGAN EXCHANGE-TRADED FUNDS | | OCTOBER 31, 2018 |
| | | | | | | | | | | | | | | | | | | | | | |
| COUNTERPARTY | | DESCRIPTION | | TERMINATION
DATE | | | NOTIONAL
VALUE (1) | | | NET UNREALIZED
APPRECIATION
(DEPRECIATION) (2) | | | NET CASH
AND OTHER
RECEIVABLES
(PAYABLES) | | | VALUE | |
Goldman Sachs | | The Fund receives the total return on a portfolio of long and short equity positions and pays or receives the net of one day CORRA and one month BA on long positions and short positions respectively, plus or minus a specified spread (rates range from (0.25)% to 0.25%), which is denominated in CAD based on the local currencies of the positions within the swaps. | |
| 5/23/2028 —
10/10/2028 |
| | $ | 10,490 | | | $ | 744 | | | $ | 10,331 | | | $ | 11,075 | |
| | | | | | | | | | | | | | | | | | | | | | |
| | | | | | | | | | | | | | | | |
| REFERENCE ENTITY | | SHARES | | | NOTIONAL
VALUE($) (1) | | | NET UNREALIZED
APPRECIATION
(DEPRECIATION)($) (2) | | | PERCENTAGE
OF NET
ASSETS (%) | |
Long Positions | | | | | | | | | | | | | | | | |
| | | | |
Common Stocks | | | | | | | | | | | | | | | | |
Energy Equipment & Services | | | | | | | | | | | | | | | | |
Trinidad Drilling Ltd.* | | | 23,751 | | | | 29,949 | | | | (3,164 | ) | | | (0.0 | )(a) |
| | | | | | | | | | | | | | | | |
Oil, Gas & Consumable Fuels | | | | | | | | | | | | | | | | |
Enbridge Income Fund Holdings, Inc. | | | 12,288 | | | | 284,413 | | | | (13,322 | ) | | | (0.1 | ) |
| | | | | | | | | | | | | | | | |
Total Long Positions of Total Return Basket Swap | | | 36,039 | | | | 314,362 | | | | (16,486 | ) | | | (0.1 | ) |
| | | | | | | | | | | | | | | | |
| | | | |
Short Positions | | | | | | | | | | | | | | | | |
| | | | |
Common Stocks | | | | | | | | | | | | | | | | |
Energy Equipment & Services | | | | | | | | | | | | | | | | |
Precision Drilling Corp.* | | | (10,463 | ) | | | (25,274 | ) | | | 6,367 | | | | 0.0 | (a) |
| | | | | | | | | | | | | | | | |
Oil, Gas & Consumable Fuels | | | | | | | | | | | | | | | | |
Enbridge, Inc. | | | (8,941 | ) | | | (278,598 | ) | | | 10,863 | | | | 0.1 | |
| | | | | | | | | | | | | | | | |
Total Short Positions of Total Return Basket Swap | | | (19,404 | ) | | | (303,872 | ) | | | 17,230 | | | | 0.1 | |
| | | | | | | | | | | | | | | | |
Total of Long and Short Positions of Total Return Basket Swap | | | 16,635 | | | | 10,490 | | | | 744 | | | | 0.0 | (a) |
| | | | | | | | | | | | | | | | |
| | | | | | | | | | | | | | | | | | | | | | |
| COUNTERPARTY | | DESCRIPTION | | TERMINATION
DATE | | | NOTIONAL
VALUE (1) | | | NET UNREALIZED
APPRECIATION
(DEPRECIATION) (2) | | | NET CASH
AND OTHER
RECEIVABLES
(PAYABLES) | | | VALUE | |
Goldman Sachs | | The Fund receives the total return on a portfolio of long and short equity positions and pays or receives the net of one day OIS-RBA on long positions and short positions respectively, plus or minus a specified spread (rates range from (0.30)% to 0.30%), which is denominated in AUD based on the local currencies of the positions within the swaps. | |
| 5/3/2028 —
10/16/2028 |
| | $ | (134,163 | ) | | $ | (3,548 | ) | | $ | 331 | | | $ | (3,217 | ) |
| | | | | | | | | | | | | | | | | | | | | | |
SEE NOTES TO FINANCIAL STATEMENTS.
| | | | | | | | |
| | | |
| OCTOBER 31, 2018 | | J.P. MORGAN EXCHANGE-TRADED FUNDS | | | | | 75 | |
JPMorgan Event Driven ETF
SCHEDULE OF PORTFOLIO INVESTMENTS
AS OF OCTOBER 31, 2018 (continued)
| | | | | | | | | | | | | | | | |
| REFERENCE ENTITY | | SHARES | | | NOTIONAL
VALUE($) (1) | | | NET UNREALIZED
APPRECIATION
(DEPRECIATION)($) (2) | | | PERCENTAGE
OF NET
ASSETS (%) | |
Long Position | | | | | | | | | | | | | | | | |
| | | | |
Common Stocks | | | | | | | | | | | | | | | | |
Health Care Providers & Services | | | | | | | | | | | | | | | | |
Healthscope Ltd. | | | 55,039 | | | | 82,577 | | | | 1,077 | | | | 0.0 | (a) |
| | | | | | | | | | | | | | | | |
| | | | |
Short Position | | | | | | | | | | | | | | | | |
| | | | |
Common Stocks | | | | | | | | | | | | | | | | |
Containers & Packaging | | | | | | | | | | | | | | | | |
Amcor Ltd. | | | (22,969 | ) | | | (216,740 | ) | | | (4,625 | ) | | | (0.0 | )(a) |
| | | | | | | | | | | | | | | | |
Total of Long and Short Positions of Total Return Basket Swap | | | 32,070 | | | | (134,163 | ) | | | (3,548 | ) | | | 0.0 | (a) |
| | | | | | | | | | | | | | | | |
The following reference rates, and their values as of period-end, are used for security descriptions:
| | | | | | |
| | | | | VALUE | |
BA | | | | | 2.08 | % |
BBR | | | | | 1.85 | % |
BOJ TONAR | | | | | (0.10 | )% |
CORRA | | | | | 1.76 | % |
EONIA | | | | | (0.34 | )% |
EURIBOR | | | | | (0.37 | )% |
FEDEF | | | | | 2.20 | % |
GBP LIBOR | | | | | 0.73 | % |
JPY LIBOR | | | | | (0.10 | )% |
OIS-RBA | | | | | 1.50 | % |
SONIA | | | | | 0.70 | % |
STIBOR | | | | | (0.46 | )% |
USD LIBOR | | | | | 2.31 | % |
Summary of total swap contracts outstanding as of October 31, 2018:
| | | | | | | | |
| | | NET UPFRONT
PAYMENTS
(RECEIPTS)($) | | | VALUE($) | |
Assets | |
Total return basket swaps contracts outstanding | | | — | | | | 104,625 | |
| | | | | | | | |
|
Liabilities | |
| |
Total return basket swaps contracts outstanding | | | — | | | | (348,909 | ) |
| | | | | | | | |
SEE NOTES TO FINANCIAL STATEMENTS.
| | | | | | |
| | | |
| 76 | | | | J.P. MORGAN EXCHANGE-TRADED FUNDS | | OCTOBER 31, 2018 |
Abbreviations
| | |
| AUD | | — Australian Dollar |
| BA | | — Banker’s Acceptance Rate |
| BBR | | — Bank Base Rate |
| BOJ | | — Bank of Japan |
| CAD | | — Canadian Dollar |
| CORRA | | — Canadian Overnight Repo Rate Average |
| EONIA | | — Euro Over Night Index Average |
| EUR | | — Euro |
| EURIBOR | | — Euro Interbank Offered Rate |
| FEDEF | | — US Federal Fund Effective Rate (Continuous Series) |
| GBP | | — British Pound |
| JPY | | — Japanese Yen |
| LIBOR | | — London Interbank Offered Rate |
| OIS-RBA | | — Overnight Indexed Swap-Reserve Bank of Australia |
| SEK | | — Swedish Krona |
| | |
| SONIA | | — Sterling Overnight Index Average |
| STIBOR | | — Stockholm Interbank Offered Rate |
| TONAR | | — Tokyo Overnight Average Rate |
| USD | | — United States Dollar |
| |
| (a) | | — Amount rounds to less than 0.1% of net assets. |
| * | | — Non-income producing security. |
| (1) | | — Notional value represents market value, as of October 31, 2018, of these positions based on the securities’ last sale or closing price on the principal exchange on which the securities are traded. |
| (2) | | — Unrealized appreciation (depreciation) represents the unrealized gain(loss) of the positions subsequent to the swap reset. |
SEE NOTES TO FINANCIAL STATEMENTS.
| | | | | | | | |
| | | |
| OCTOBER 31, 2018 | | J.P. MORGAN EXCHANGE-TRADED FUNDS | | | | | 77 | |
JPMorgan Long/Short ETF
SCHEDULE OF PORTFOLIO INVESTMENTS
AS OF OCTOBER 31, 2018
| | | | | | | | |
| INVESTMENTS | | SHARES | | | VALUE($) | |
Common Stocks — 62.9% | |
Aerospace & Defense — 0.4% | |
Boeing Co. (The) | | | 232 | | | | 82,328 | |
| | | | | | | | |
Auto Components — 0.8% | | | | | | | | |
Cooper-Standard Holdings, Inc.* | | | 698 | | | | 64,670 | |
Gentex Corp. | | | 3,003 | | | | 63,213 | |
Lear Corp. | | | 454 | | | | 60,336 | |
| | | | | | | | |
| | | | | | | 188,219 | |
| | | | | | | | |
Banks — 1.6% | | | | | | | | |
BankUnited, Inc. | | | 2,236 | | | | 74,012 | |
Enterprise Financial Services Corp. | | | 1,513 | | | | 65,740 | |
First Interstate BancSystem, Inc., Class A | | | 1,876 | | | | 77,779 | |
Popular, Inc. (Puerto Rico) | | | 1,732 | | | | 90,081 | |
Synovus Financial Corp. | | | 2,000 | | | | 75,120 | |
| | | | | | | | |
| | | | | | | 382,732 | |
| | | | | | | | |
Building Products — 0.3% | | | | | | | | |
Continental Building Products, Inc.* | | | 2,697 | | | | 75,004 | |
| | | | | | | | |
Capital Markets — 0.6% | | | | | | | | |
Virtus Investment Partners, Inc. | | | 747 | | | | 74,207 | |
Waddell & Reed Financial, Inc., Class A | | | 3,781 | | | | 72,104 | |
| | | | | | | | |
| | | | | | | 146,311 | |
| | | | | | | | |
Chemicals — 1.8% | | | | | | | | |
CF Industries Holdings, Inc. | | | 1,491 | | | | 71,613 | |
Eastman Chemical Co. | | | 1,005 | | | | 78,742 | |
Huntsman Corp. | | | 3,670 | | | | 80,299 | |
Kraton Corp.* | | | 2,244 | | | | 61,800 | |
LyondellBasell Industries NV, Class A | | | 766 | | | | 68,381 | |
Westlake Chemical Corp. | | | 893 | | | | 63,671 | |
| | | | | | | | |
| | | | | | | 424,506 | |
| | | | | | | | |
Commercial Services & Supplies — 2.3% | |
Brady Corp., Class A | | | 1,841 | | | | 74,174 | |
Deluxe Corp. | | | 1,286 | | | | 60,712 | |
Herman Miller, Inc. | | | 2,355 | | | | 77,597 | |
Interface, Inc. | | | 3,859 | | | | 62,863 | |
KAR Auction Services, Inc. | | | 1,385 | | | | 78,862 | |
Knoll, Inc. | | | 3,371 | | | | 66,914 | |
Quad/Graphics, Inc. | | | 2,673 | | | | 41,245 | |
Steelcase, Inc., Class A | | | 4,792 | | | | 79,547 | |
| | | | | | | | |
| | | | | | | 541,914 | |
| | | | | | | | |
Communications Equipment — 1.1% | | | | | | | | |
Cisco Systems, Inc. | | | 1,851 | | | | 84,683 | |
Juniper Networks, Inc. | | | 2,827 | | | | 82,746 | |
Motorola Solutions, Inc. | | | 703 | | | | 86,160 | |
| | | | | | | | |
| | | | | | | 253,589 | |
| | | | | | | | |
Construction & Engineering — 0.7% | | | | | | | | |
EMCOR Group, Inc. | | | 1,069 | | | | 75,878 | |
Jacobs Engineering Group, Inc. | | | 1,055 | | | | 79,220 | |
| | | | | | | | |
| | | | | | | 155,098 | |
| | | | | | | | |
Consumer Finance — 0.6% | | | | | | | | |
Ally Financial, Inc. | | | 2,959 | | | | 75,188 | |
Santander Consumer USA Holdings, Inc. | | | 3,841 | | | | 72,019 | |
| | | | | | | | |
| | | | | | | 147,207 | |
| | | | | | | | |
| | | | | | | | |
| INVESTMENTS | | SHARES | | | VALUE($) | |
| | | | | | | | |
Containers & Packaging — 0.3% | | | | | | | | |
Greif, Inc., Class A | | | 1,468 | | | | 69,436 | |
| | | | | | | | |
Diversified Consumer Services — 0.3% | | | | | | | | |
H&R Block, Inc. | | | 2,205 | | | | 58,521 | |
| | | | | | | | |
Diversified Financial Services — 0.3% | | | | | | | | |
FGL Holdings* | | | 9,656 | | | | 76,282 | |
| | | | | | | | |
Diversified Telecommunication Services — 0.4% | | | | | |
Vonage Holdings Corp.* | | | 6,245 | | | | 82,809 | |
| | | | | | | | |
Electric Utilities — 1.0% | | | | | | | | |
ALLETE, Inc. | | | 1,019 | | | | 75,406 | |
FirstEnergy Corp. | | | 2,034 | | | | 75,828 | |
IDACORP, Inc. | | | 897 | | | | 83,654 | |
| | | | | | | | |
| | | | | | | 234,888 | |
| | | | | | | | |
Electrical Equipment — 1.6% | | | | | | | | |
Eaton Corp. plc | | | 1,063 | | | | 76,185 | |
EnerSys | | | 1,038 | | | | 82,594 | |
Generac Holdings, Inc.* | | | 1,415 | | | | 71,783 | |
Regal Beloit Corp. | | | 998 | | | | 71,557 | |
Sensata Technologies Holding plc* | | | 1,628 | | | | 76,353 | |
| | | | | | | | |
| | | | | | | 378,472 | |
| | | | | | | | |
Electronic Equipment, Instruments & Components — 1.6% | |
Fabrinet (Thailand)* | | | 1,798 | | | | 77,889 | |
FLIR Systems, Inc. | | | 1,502 | | | | 69,558 | |
Littelfuse, Inc. | | | 451 | | | | 81,703 | |
TTM Technologies, Inc.* | | | 5,523 | | | | 64,619 | |
Vishay Intertechnology, Inc. | | | 4,317 | | | | 79,001 | |
| | | | | | | | |
| | | | | | | 372,770 | |
| | | | | | | | |
Energy Equipment & Services — 0.6% | | | | | | | | |
Diamond Offshore Drilling, Inc.* | | | 4,464 | | | | 63,299 | |
National Oilwell Varco, Inc. | | | 1,942 | | | | 71,466 | |
| | | | | | | | |
| | | | | | | 134,765 | |
| | | | | | | | |
Entertainment — 0.3% | | | | | | | | |
Viacom, Inc., Class B | | | 2,378 | | | | 76,048 | |
| | | | | | | | |
Food & Staples Retailing — 1.0% | | | | | | | | |
Sysco Corp. | | | 1,112 | | | | 79,319 | |
Walgreens Boots Alliance, Inc. | | | 1,014 | | | | 80,887 | |
Walmart, Inc. | | | 807 | | | | 80,926 | |
| | | | | | | | |
| | | | | | | 241,132 | |
| | | | | | | | |
Food Products — 1.7% | | | | | | | | |
Cal-Maine Foods, Inc. | | | 1,777 | | | | 86,487 | |
Flowers Foods, Inc. | | | 4,092 | | | | 79,016 | |
Ingredion, Inc. | | | 769 | | | | 77,807 | |
JM Smucker Co. (The) | | | 758 | | | | 82,107 | |
TreeHouse Foods, Inc.* | | | 1,652 | | | | 75,265 | |
| | | | | | | | |
| | | | | | | 400,682 | |
| | | | | | | | |
Health Care Equipment & Supplies — 1.3% | |
Baxter International, Inc. | | | 1,105 | | | | 69,074 | |
Becton Dickinson and Co. | | | 333 | | | | 76,756 | |
Danaher Corp. | | | 804 | | | | 79,918 | |
STERIS plc | | | 739 | | | | 80,780 | |
| | | | | | | | |
| | | | | | | 306,528 | |
| | | | | | | | |
SEE NOTES TO FINANCIAL STATEMENTS.
| | | | | | |
| | | |
| 78 | | | | J.P. MORGAN EXCHANGE-TRADED FUNDS | | OCTOBER 31, 2018 |
| | | | | | | | |
| INVESTMENTS | | SHARES | | | VALUE($) | |
Common Stocks — continued | |
Health Care Providers & Services — 2.4% | |
Chemed Corp. | | | 251 | | | | 76,387 | |
Encompass Health Corp. | | | 1,189 | | | | 80,020 | |
Humana, Inc. | | | 260 | | | | 83,307 | |
Premier, Inc., Class A* | | | 1,762 | | | | 79,290 | |
Quest Diagnostics, Inc. | | | 782 | | | | 73,594 | |
UnitedHealth Group, Inc. | | | 326 | | | | 85,200 | |
WellCare Health Plans, Inc.* | | | 268 | | | | 73,965 | |
| | | | | | | | |
| | | | | | | 551,763 | |
| | | | | | | | |
Hotels, Restaurants & Leisure — 0.8% | | | | | | | | |
Hyatt Hotels Corp., Class A | | | 921 | | | | 63,733 | |
Royal Caribbean Cruises Ltd. | | | 490 | | | | 51,318 | |
Wyndham Destinations, Inc. | | | 1,767 | | | | 63,400 | |
| | | | | | | | |
| | | | | | | 178,451 | |
| | | | | | | | |
Household Durables — 0.6% | | | | | | | | |
PulteGroup, Inc. | | | 2,835 | | | | 69,656 | |
Toll Brothers, Inc. | | | 2,135 | | | | 71,864 | |
| | | | | | | | |
| | | | | | | 141,520 | |
| | | | | | | | |
Household Products — 0.3% | | | | | | | | |
Energizer Holdings, Inc. | | | 1,307 | | | | 76,812 | |
| | | | | | | | |
Independent Power and Renewable Electricity Producers — 1.0% | |
Clearway Energy, Inc., Class C | | | 4,004 | | | | 78,518 | |
NRG Energy, Inc. | | | 2,272 | | | | 82,224 | |
Vistra Energy Corp.* | | | 3,643 | | | | 82,441 | |
| | | | | | | | |
| | | | | | | 243,183 | |
| | | | | | | | |
Insurance — 1.0% | | | | | | | | |
Aflac, Inc. | | | 1,701 | | | | 73,262 | |
Ambac Financial Group, Inc.* | | | 3,958 | | | | 81,456 | |
Old Republic International Corp. | | | 3,605 | | | | 79,490 | |
| | | | | | | | |
| | | | | | | 234,208 | |
| | | | | | | | |
Interactive Media & Services — 0.7% | | | | | | | | |
Cars.com, Inc.* | | | 3,167 | | | | 82,690 | |
Match Group, Inc.* | | | 1,402 | | | | 72,512 | |
| | | | | | | | |
| | | | | | | 155,202 | |
| | | | | | | | |
IT Services — 5.0% | | | | | | | | |
Accenture plc, Class A | | | 501 | | | | 78,968 | |
Akamai Technologies, Inc.* | | | 1,038 | | | | 74,995 | |
Amdocs Ltd. | | | 1,164 | | | | 73,646 | |
Broadridge Financial Solutions, Inc. | | | 681 | | | | 79,636 | |
CACI International, Inc., Class A* | | | 463 | | | | 82,627 | |
Cognizant Technology Solutions Corp., Class A | | | 1,026 | | | | 70,825 | |
CSG Systems International, Inc. | | | 1,944 | | | | 68,234 | |
EVERTEC, Inc. (Puerto Rico) | | | 3,127 | | | | 81,552 | |
Fidelity National Information Services, Inc. | | | 756 | | | | 78,700 | |
ManTech International Corp., Class A | | | 1,282 | | | | 73,433 | |
Mastercard, Inc., Class A | | | 408 | | | | 80,649 | |
MAXIMUS, Inc. | | | 1,287 | | | | 83,616 | |
Total System Services, Inc. | | | 932 | | | | 84,952 | |
Visa, Inc., Class A | | | 602 | | | | 82,986 | |
Western Union Co. (The) | | | 3,891 | | | | 70,194 | |
| | | | | | | | |
| | | | | | | 1,165,013 | |
| | | | | | | | |
| | | | | | | | |
| INVESTMENTS | | SHARES | | | VALUE($) | |
| | | | | | | | |
Life Sciences Tools & Services — 1.7% | | | | | | | | |
Agilent Technologies, Inc. | | | 1,301 | | | | 84,292 | |
Cambrex Corp.* | | | 1,408 | | | | 75,032 | |
Charles River Laboratories International, Inc.* | | | 664 | | | | 80,888 | |
ICON plc* | | | 589 | | | | 81,329 | |
Medpace Holdings, Inc.* | | | 1,397 | | | | 72,784 | |
| | | | | | | | |
| | | | | | | 394,325 | |
| | | | | | | | |
Machinery — 2.5% | | | | | | | | |
Allison Transmission Holdings, Inc. | | | 1,548 | | | | 68,236 | |
Caterpillar, Inc. | | | 592 | | | | 71,821 | |
Crane Co. | | | 823 | | | | 71,634 | |
Cummins, Inc. | | | 609 | | | | 83,244 | |
Greenbrier Cos., Inc. (The) | | | 1,447 | | | | 68,660 | |
Hillenbrand, Inc. | | | 1,668 | | | | 79,897 | |
Ingersoll-Rand plc | | | 790 | | | | 75,793 | |
Watts Water Technologies, Inc., Class A | | | 994 | | | | 69,630 | |
| | | | | | | | |
| | | | | | | 588,915 | |
| | | | | | | | |
Media — 1.6% | | | | | | | | |
Discovery, Inc., Class A* | | | 2,404 | | | | 77,866 | |
Interpublic Group of Cos., Inc. (The) | | | 3,269 | | | | 75,710 | |
John Wiley & Sons, Inc., Class A | | | 1,414 | | | | 76,695 | |
Omnicom Group, Inc. | | | 1,026 | | | | 76,252 | |
Sinclair Broadcast Group, Inc., Class A | | | 2,723 | | | | 77,987 | |
| | | | | | | | |
| | | | | | | 384,510 | |
| | | | | | | | |
Metals & Mining — 0.9% | | | | | | | | |
Alcoa Corp.* | | | 1,945 | | | | 68,055 | |
Schnitzer Steel Industries, Inc., Class A | | | 2,899 | | | | 77,983 | |
Steel Dynamics, Inc. | | | 1,741 | | | | 68,944 | |
| | | | | | | | |
| | | | | | | 214,982 | |
| | | | | | | | |
Multiline Retail — 0.7% | | | | | | | | |
Kohl’s Corp. | | | 731 | | | | 55,358 | |
Macy’s, Inc. | | | 1,683 | | | | 57,710 | |
Target Corp. | | | 682 | | | | 57,036 | |
| | | | | | | | |
| | | | | | | 170,104 | |
| | | | | | | | |
Multi-Utilities — 0.3% | | | | | | | | |
MDU Resources Group, Inc. | | | 2,869 | | | | 71,610 | |
| | | | | | | | |
Oil, Gas & Consumable Fuels — 3.0% | | | | | | | | |
Chevron Corp. | | | 679 | | | | 75,810 | |
ConocoPhillips | | | 1,179 | | | | 82,412 | |
CONSOL Energy, Inc.* | | | 1,982 | | | | 78,963 | |
Delek US Holdings, Inc. | | | 2,151 | | | | 78,985 | |
HollyFrontier Corp. | | | 1,161 | | | | 78,298 | |
Murphy Oil Corp. | | | 2,609 | | | | 83,123 | |
Peabody Energy Corp. | | | 1,942 | | | | 68,844 | |
Phillips 66 | | | 794 | | | | 81,639 | |
Valero Energy Corp. | | | 885 | | | | 80,614 | |
| | | | | | | | |
| | | | | | | 708,688 | |
| | | | | | | | |
Paper & Forest Products — 0.9% | | | | | | | | |
Domtar Corp. | | | 1,720 | | | | 79,653 | |
Louisiana-Pacific Corp. | | | 3,151 | | | | 68,597 | |
Verso Corp., Class A* | | | 2,632 | | | | 73,986 | |
| | | | | | | | |
| | | | | | | 222,236 | |
| | | | | | | | |
SEE NOTES TO FINANCIAL STATEMENTS.
| | | | | | | | |
| | | |
| OCTOBER 31, 2018 | | J.P. MORGAN EXCHANGE-TRADED FUNDS | | | | | 79 | |
JPMorgan Long/Short ETF
SCHEDULE OF PORTFOLIO INVESTMENTS
AS OF OCTOBER 31, 2018 (continued)
| | | | | | | | |
| INVESTMENTS | | SHARES | | | VALUE($) | |
Common Stocks — continued | |
Personal Products — 1.0% | | | | | | | | |
Herbalife Nutrition Ltd.* | | | 1,593 | | | | 84,843 | |
Nu Skin Enterprises, Inc., Class A | | | 1,116 | | | | 78,366 | |
USANA Health Sciences, Inc.* | | | 668 | | | | 78,169 | |
| | | | | | | | |
| | | | | | | 241,378 | |
| | | | | | | | |
Pharmaceuticals — 2.1% | | | | | | | | |
Bristol-Myers Squibb Co. | | | 1,472 | | | | 74,395 | |
Horizon Pharma plc* | | | 4,573 | | | | 83,274 | |
Jazz Pharmaceuticals plc* | | | 502 | | | | 79,728 | |
Johnson & Johnson | | | 565 | | | | 79,094 | |
Pfizer, Inc. | | | 1,838 | | | | 79,144 | |
Taro Pharmaceutical Industries Ltd.* | | | 851 | | | | 84,683 | |
| | | | | | | | |
| | | | | | | 480,318 | |
| | | | | | | | |
Professional Services — 1.3% | | | | | | | | |
FTI Consulting, Inc.* | | | 1,223 | | | | 84,522 | |
ICF International, Inc. | | | 1,143 | | | | 84,170 | |
Korn/Ferry International | | | 1,666 | | | | 75,203 | |
Robert Half International, Inc. | | | 1,135 | | | | 68,702 | |
| | | | | | | | |
| | | | | | | 312,597 | |
| | | | | | | | |
Road & Rail — 0.3% | | | | | | | | |
ArcBest Corp. | | | 1,724 | | | | 63,995 | |
| | | | | | | | |
Semiconductors & Semiconductor Equipment — 3.2% | | | | | |
Applied Materials, Inc. | | | 2,114 | | | | 69,508 | |
Entegris, Inc. | | | 2,754 | | | | 73,091 | |
First Solar, Inc.* | | | 1,558 | | | | 65,124 | |
Intel Corp. | | | 1,766 | | | | 82,790 | |
Lam Research Corp. | | | 467 | | | | 66,188 | |
Maxim Integrated Products, Inc. | | | 1,353 | | | | 67,677 | |
Mellanox Technologies Ltd. (Israel)* | | | 1,130 | | | | 95,700 | |
MKS Instruments, Inc. | | | 994 | | | | 73,248 | |
Rudolph Technologies, Inc.* | | | 3,991 | | | | 82,973 | |
Texas Instruments, Inc. | | | 718 | | | | 66,652 | |
| | | | | | | | |
| | | | | | | 742,951 | |
| | | | | | | | |
Software — 2.7% | | | | | | | | |
Citrix Systems, Inc.* | | | 753 | | | | 77,160 | |
Intuit, Inc. | | | 388 | | | | 81,868 | |
LogMeIn, Inc. | | | 931 | | | | 80,178 | |
Microsoft Corp. | | | 766 | | | | 81,816 | |
Oracle Corp. | | | 1,758 | | | | 85,861 | |
Progress Software Corp. | | | 2,085 | | | | 67,012 | |
Synopsys, Inc.* | | | 911 | | | | 81,562 | |
VMware, Inc., Class A* | | | 542 | | | | 76,633 | |
| | | | | | | | |
| | | | | | | 632,090 | |
| | | | | | | | |
Specialty Retail — 3.9% | | | | | | | | |
Abercrombie & Fitch Co., Class A | | | 3,698 | | | | 72,851 | |
American Eagle Outfitters, Inc. | | | 2,941 | | | | 67,819 | |
Best Buy Co., Inc. | | | 892 | | | | 62,583 | |
Caleres, Inc. | | | 1,942 | | | | 66,416 | |
Chico’s FAS, Inc. | | | 8,700 | | | | 66,729 | |
Children’s Place, Inc. (The) | | | 416 | | | | 62,150 | |
Dick’s Sporting Goods, Inc. | | | 1,898 | | | | 67,132 | |
DSW, Inc., Class A | | | 2,484 | | | | 65,950 | |
| | | | | | | | |
| INVESTMENTS | | SHARES | | | VALUE($) | |
| | | | | | | | |
Specialty Retail — continued | | | | | | | | |
Foot Locker, Inc. | | | 1,341 | | | | 63,215 | |
Signet Jewelers Ltd. | | | 1,214 | | | | 68,045 | |
Tailored Brands, Inc. | | | 2,472 | | | | 51,937 | |
Urban Outfitters, Inc.* | | | 1,415 | | | | 55,836 | |
Williams-Sonoma, Inc. | | | 1,090 | | | | 64,724 | |
Zumiez, Inc.* | | | 2,938 | | | | 68,338 | |
| | | | | | | | |
| | | | | | | 903,725 | |
| | | | | | | | |
Technology Hardware, Storage & Peripherals — 1.7% | |
Apple, Inc. | | | 364 | | | | 79,665 | |
Hewlett Packard Enterprise Co. | | | 5,076 | | | | 77,409 | |
HP, Inc. | | | 3,573 | | | | 86,252 | |
NetApp, Inc. | | | 1,014 | | | | 79,589 | |
Seagate Technology plc | | | 1,731 | | | | 69,638 | |
| | | | | | | | |
| | | | | | | 392,553 | |
| | | | | | | | |
Textiles, Apparel & Luxury Goods — 1.7% | | | | | |
Columbia Sportswear Co. | | | 719 | | | | 64,911 | |
Deckers Outdoor Corp.* | | | 585 | | | | 74,395 | |
Movado Group, Inc. | | | 1,704 | | | | 65,621 | |
Oxford Industries, Inc. | | | 771 | | | | 68,604 | |
Ralph Lauren Corp. | | | 499 | | | | 64,675 | |
Wolverine World Wide, Inc. | | | 1,866 | | | | 65,627 | |
| | | | | | | | |
| | | | | | | 403,833 | |
| | | | | | | | |
Thrifts & Mortgage Finance — 0.3% | |
Northwest Bancshares, Inc. | | | 4,912 | | | | 79,280 | |
| | | | | | | | |
Trading Companies & Distributors — 0.7% | |
HD Supply Holdings, Inc.* | | | 2,120 | | | | 79,649 | |
WW Grainger, Inc. | | | 293 | | | | 83,203 | |
| | | | | | | | |
| | | | | | | 162,852 | |
| | | | | | | | |
Total Common Stocks
(Cost $15,510,576) | | | | | | | 14,746,335 | |
| | | | | | | | |
| | |
| | | PRINCIPAL
AMOUNT($) | | | | |
Foreign Government Securities — 1.0% | |
Japan Government Bond (Japan) 0.10%, 7/15/2019
(Cost $232,545) | | | JPY 26,200,000 | | | | 232,620 | |
| | | | | | | | |
| | |
| | | SHARES | | | | |
Short-Term Investments — 29.9% | | | | |
Investment Companies — 21.6% | | | | | | | | |
JPMorgan U.S. Government Money Market Fund Class Institutional Shares, 2.02% (a) (b)
(Cost $5,057,344) | | | 5,057,344 | | | | 5,057,344 | |
| | | | | | | | |
SEE NOTES TO FINANCIAL STATEMENTS.
| | | | | | |
| | | |
| 80 | | | | J.P. MORGAN EXCHANGE-TRADED FUNDS | | OCTOBER 31, 2018 |
| | | | | | | | |
| INVESTMENTS | | PRINCIPAL
AMOUNT($) | | | VALUE($) | |
Short-Term Investments — continued | | | | |
U.S. Treasury Obligations — 8.3% | | | | |
U.S. Treasury Bills 2.38%, 7/18/2019 (c)
(Cost $1,966,510) | | | 2,000,000 | | | | 1,963,956 | |
| | | | | | | | |
Total Short-Term Investments
(Cost $7,023,854) | | | | | | | 7,021,300 | |
| | | | | | | | |
Total Investments — 93.8%
(Cost $22,766,975) | | | | | | | 22,000,255 | |
Other Assets Less Liabilities — 6.2% | | | | | | | 1,456,017 | |
| | | | | | | | |
Net Assets — 100.0% | | | | | | | 23,456,272 | |
| | | | | | | | |
Percentages indicated are based on net assets.
Abbreviations
| | | | | | | | | | |
| JPY | | — Japanese Yen |
| |
| * | | — Non-income producing security. |
| (a) | | — Investment in affiliate. Fund is registered under the Investment Company Act of 1940, as amended, and advised by J.P. Morgan Investment Management Inc. |
| (b) | | — The rate shown is the current yield as of October 31, 2018. |
| (c) | | — The rate shown is the effective yield as of October 31, 2018. |
| | | | | | | | | | | | | | | | | | | | |
| Futures contracts outstanding as of October 31, 2018: | |
| DESCRIPTION | | NUMBER OF
CONTRACTS | | | EXPIRATION
DATE | | | TRADING
CURRENCY | | | NOTIONAL
AMOUNT($) | | | VALUE AND
UNREALIZED
APPRECIATION
(DEPRECIATION)($) | |
Long Contracts | | | | | | | | | | | | | | | | | | | | |
| CAC 40 10 Euro Index | | | 2 | | | | 11/2018 | | | | EUR | | | | 114,953 | | | | (2,130 | ) |
| S&P 500 E-Mini Index | | | 5 | | | | 12/2018 | | | | USD | | | | 677,550 | | | | (46,230 | ) |
| SPI 200 Index | | | 5 | | | | 12/2018 | | | | AUD | | | | 514,847 | | | | (29,953 | ) |
| | | | | | | | | | | | | | | | | | | | |
| | | | | | | | | | | | | | | | | | | (78,313 | ) |
| | | | | | | | | | | | | | | | | | | | |
Short Contracts | | | | | | | | | | | | | | | | | | | | |
| IBEX 35 Index | | | (6) | | | | 11/2018 | | | | EUR | | | | (603,357 | ) | | | 4,440 | |
| DAX Index | | | (2) | | | | 12/2018 | | | | EUR | | | | (646,885 | ) | | | 21,818 | |
| EURO STOXX 50 Index | | | (12) | | | | 12/2018 | | | | EUR | | | | (432,491 | ) | | | 5,470 | |
| FTSE/MIB Index | | | (3) | | | | 12/2018 | | | | EUR | | | | (322,100 | ) | | | 37,982 | |
| Hang Seng Index | | | (2) | | | | 12/2018 | | | | HKD | | | | (318,853 | ) | | | 5,062 | |
| | | | | | | | | | | | | | | | | | | | |
| | | | | | | | | | | | | | | | | | | 74,772 | |
| | | | | | | | | | | | | | | | | | | | |
| | | | | | | | | | | | | | | | | | | (3,541 | ) |
| | | | | | | | | | | | | | | | | | | | |
Abbreviations
| | |
| AUD | | — Australian Dollar |
| CAC | | — Continuous Assisted Quotation |
| DAX | | — Deutscher Aktien Index |
| EUR | | — Euro |
| FTSE | | — Financial Times and the London Stock Exchange |
| | |
| HKD | | — Hong Kong Dollar |
| IBEX | | — Madrid Stock Exchange |
| MIB | | — Milan, Italian Stock Exchange |
| SPI | | — Australian Securities Exchange |
| USD | | — United States Dollar |
SEE NOTES TO FINANCIAL STATEMENTS.
| | | | | | | | |
| | | |
| OCTOBER 31, 2018 | | J.P. MORGAN EXCHANGE-TRADED FUNDS | | | | | 81 | |
JPMorgan Long/Short ETF
SCHEDULE OF PORTFOLIO INVESTMENTS
AS OF OCTOBER 31, 2018 (continued)
| | | | | | | | | | | | | | | | | | | | |
| Forward foreign currency exchange contracts outstanding as of October 31, 2018: | |
| CURRENCY PURCHASED | | | CURRENCY SOLD | | | COUNTERPARTY | | SETTLEMENT
DATE | | | UNREALIZED
APPRECIATION
(DEPRECIATION)($) | |
| USD | | | 115,942 | | | CAD | | | 150,423 | | | Citibank, NA | | | 11/19/2018 | | | | 1,644 | |
| USD | | | 120,995 | | | EUR | | | 104,197 | | | Citibank, NA | | | 11/19/2018 | | | | 2,819 | |
| USD | | | 118,072 | | | GBP | | | 89,159 | | | Citibank, NA | | | 11/19/2018 | | | | 4,025 | |
| USD | | | 121,600 | | | JPY | | | 13,618,866 | | | Citibank, NA | | | 11/19/2018 | | | | 756 | |
| USD | | | 238,948 | | | JPY | | | 26,200,000 | | | State Street Corp. | | | 7/16/2019 | | | | 1,451 | |
| | | | | | | | | | | | | | | | | | | | |
| Total unrealized appreciation | | | | 10,695 | |
| | | | | | | | | | | | | | | | | | | | |
| CAD | | | 162,280 | | | USD | | | 125,269 | | | Merrill Lynch International | | | 11/19/2018 | | | | (1,962 | ) |
| GBP | | | 89,159 | | | USD | | | 118,087 | | | Citibank, NA | | | 11/19/2018 | | | | (4,040 | ) |
| JPY | | | 13,618,866 | | | USD | | | 121,284 | | | TD Bank Financial Group | | | 11/19/2018 | | | | (439 | ) |
| | | | | | | | | | | | | | | | | | | | |
| Total unrealized depreciation | | | | (6,441 | ) |
| | | | | | | | | | | | | | | | | | | | |
| Net unrealized appreciation | | | | 4,254 | |
| | | | | | | | | | | | | | | | | | | | |
Abbreviations
| | |
| CAD | | — Canadian Dollar |
| EUR | | — Euro |
| GBP | | — British Pound |
| JPY | | — Japanese Yen |
| USD | | — United States Dollar |
SEE NOTES TO FINANCIAL STATEMENTS.
| | | | | | |
| | | |
| 82 | | | | J.P. MORGAN EXCHANGE-TRADED FUNDS | | OCTOBER 31, 2018 |
| | | | | | | | | | | | | | | | | | | | |
| Over the Counter (“OTC”) Total Return Basket Swaps Outstanding at October 31, 2018 | |
| COUNTERPARTY | | DESCRIPTION | | TERMINATION
DATE | | NOTIONAL
VALUE (1) | | | NET UNREALIZED
APPRECIATION
(DEPRECIATION) (2) | | | NET CASH
AND OTHER
RECEIVABLES
(PAYABLES) | | | VALUE | |
| Bank of America | | The Fund receives the total return on a portfolio of long and short equity positions and pays or receives the net of one month LIBOR on long positions and short positions respectively, plus or minus a specified spread (rates range from 0.00% to 0.25%), which is denominated in GBP based on the local currencies of the positions within the swaps. | | 2/28/2019 —
7/31/2019 | | $ | 182,359 | | | $ | 8,972 | | | $ | 4,455 | | | $ | 13,427 | |
| | | | | | | | | | | | | | | | | | | | |
| | | | | | | | | | | | | | | | |
| REFERENCE ENTITY | | SHARES | | | NOTIONAL
VALUE($) (1) | | | NET UNREALIZED
APPRECIATION
(DEPRECIATION)($) (2) | | | PERCENTAGE
OF NET
ASSETS (%) | |
Long Positions | | | | | | | | | | | | | | | | |
| | | | |
Common Stocks | | | | | | | | | | | | | | | | |
Airlines | | | | | | | | | | | | | | | | |
International Consolidated Airlines Group SA | | | 10,734 | | | | 82,754 | | | | 1,526 | | | | 0.0 | (a) |
Wizz Air Holdings plc* (b) | | | 1,753 | | | | 57,496 | | | | 4,635 | | | | 0.0 | (a) |
| | | | | | | | | | | | | | | | |
| | | 12,487 | | | | 140,250 | | | | 6,161 | | | | 0.0 | (a) |
| | | | | | | | | | | | | | | | |
Distributors | | | | | | | | | | | | | | | | |
Inchcape plc | | | 2,963 | | | | 20,465 | | | | 1,806 | | | | 0.0 | (a) |
| | | | | | | | | | | | | | | | |
Energy Equipment & Services | | | | | | | | | | | | | | | | |
Petrofac Ltd. | | | 9,386 | | | | 69,020 | | | | (6,464 | ) | | | (0.0 | )(a) |
| | | | | | | | | | | | | | | | |
Equity Real Estate Investment Trusts (REITs) | | | | | | | | | | | | | | | | |
UNITE Group plc (The) | | | 7,387 | | | | 80,431 | | | | 440 | | | | 0.0 | (a) |
| | | | | | | | | | | | | | | | |
Hotels, Restaurants & Leisure | | | | | | | | | | | | | | | | |
Carnival plc | | | 1,144 | | | | 62,354 | | | | (1,714 | ) | | | (0.0 | )(a) |
William Hill plc | | | 13,807 | | | | 37,116 | | | | (4,046 | ) | | | (0.0 | )(a) |
| | | | | | | | | | | | | | | | |
| | | 14,951 | | | | 99,470 | | | | (5,760 | ) | | | (0.0 | )(a) |
| | | | | | | | | | | | | | | | |
Household Durables | | | | | | | | | | | | | | | | |
Berkeley Group Holdings plc | | | 1,475 | | | | 65,922 | | | | 1,759 | | | | 0.0 | (a) |
Bovis Homes Group plc | | | 5,174 | | | | 63,950 | | | | (1,972 | ) | | | (0.0 | )(a) |
Persimmon plc | | | 2,196 | | | | 64,271 | | | | 1,198 | | | | 0.0 | (a) |
Redrow plc | | | 9,633 | | | | 65,042 | | | | (2,750 | ) | | | (0.0 | )(a) |
Taylor Wimpey plc | | | 31,505 | | | | 64,870 | | | | (470 | ) | | | (0.0 | )(a) |
| | | | | | | | | | | | | | | | |
| | | 49,983 | | | | 324,055 | | | | (2,235 | ) | | | (0.0 | )(a) |
| | | | | | | | | | | | | | | | |
Media | | | | | | | | | | | | | | | | |
Pearson plc | | | 6,771 | | | | 77,785 | | | | 6,813 | | | | 0.0 | (a) |
| | | | | | | | | | | | | | | | |
Metals & Mining | | | | | | | | | | | | | | | | |
Anglo American plc | | | 3,551 | | | | 75,790 | | | | 1,587 | | | | 0.0 | (a) |
BHP Billiton plc | | | 3,692 | | | | 73,651 | | | | (660 | ) | | | (0.0 | )(a) |
Centamin plc | | | 35,270 | | | | 44,789 | | | | 3,964 | | | | 0.0 | (a) |
Rio Tinto plc | | | 1,481 | | | | 71,904 | | | | 2,893 | | | | 0.0 | (a) |
| | | | | | | | | | | | | | | | |
| | | 43,994 | | | | 266,134 | | | | 7,784 | | | | 0.0 | (a) |
| | | | | | | | | | | | | | | | |
Multi-Utilities | | | | | | | | | | | | | | | | |
Centrica plc | | | 41,577 | | | | 78,093 | | | | (3,131 | ) | | | (0.0 | )(a) |
| | | | | | | | | | | | | | | | |
Total Long Positions of Total Return Basket Swap | | | 189,499 | | | | 1,155,703 | | | | 5,414 | | | | 0.0 | (a) |
| | | | | | | | | | | | | | | | |
SEE NOTES TO FINANCIAL STATEMENTS.
| | | | | | | | |
| | | |
| OCTOBER 31, 2018 | | J.P. MORGAN EXCHANGE-TRADED FUNDS | | | | | 83 | |
JPMorgan Long/Short ETF
SCHEDULE OF PORTFOLIO INVESTMENTS
AS OF OCTOBER 31, 2018 (continued)
| | | | | | | | | | | | | | | | |
| REFERENCE ENTITY | | SHARES | | | NOTIONAL
VALUE($) (1) | | | NET UNREALIZED
APPRECIATION
(DEPRECIATION)($) (2) | | | PERCENTAGE
OF NET
ASSETS (%) | |
| | | | |
Short Positions | | | | | | | | | | | | | | | | |
| | | | |
Common Stocks | | | | | | | | | | | | | | | | |
Aerospace & Defense | | | | | | | | | | | | | | | | |
Rolls-Royce Holdings plc* | | | (5,691 | ) | | | (61,031 | ) | | | 3,483 | | | | 0.0 | (a) |
Rolls-Royce Holdings plc (Preference)* | | | (261,786 | ) | | | (334 | ) | | | (335 | ) | | | (0.0 | )(a) |
| | | | | | | | | | | | | | | | |
| | | (267,477 | ) | | | (61,365 | ) | | | 3,148 | | | | 0.0 | (a) |
| | | | | | | | | | | | | | | | |
Banks | | | | | | | | | | | | | | | | |
Metro Bank plc* | | | (431 | ) | | | (12,231 | ) | | | (242 | ) | | | (0.0 | )(a) |
Standard Chartered plc | | | (10,065 | ) | | | (70,543 | ) | | | 2,837 | | | | 0.0 | (a) |
| | | | | | | | | | | | | | | | |
| | | (10,496 | ) | | | (82,774 | ) | | | 2,595 | | | | 0.0 | (a) |
| | | | | | | | | | | | | | | | |
Capital Markets | | | | | | | | | | | | | | | | |
St James’s Place plc | | | (4,650 | ) | | | (60,093 | ) | | | 4,481 | | | | 0.0 | (a) |
| | | | | | | | | | | | | | | | |
Chemicals | | | | | | | | | | | | | | | | |
Johnson Matthey plc | | | (1,862 | ) | | | (70,595 | ) | | | 3,688 | | | | 0.0 | (a) |
| | | | | | | | | | | | | | | | |
Containers & Packaging | | | | | | | | | | | | | | | | |
DS Smith plc | | | (3,549 | ) | | | (17,808 | ) | | | (1,329 | ) | | | (0.0 | )(a) |
| | | | | | | | | | | | | | | | |
Electrical Equipment | | | | | | | | | | | | | | | | |
Melrose Industries plc | | | (8,392 | ) | | | (18,065 | ) | | | (1,478 | ) | | | (0.0 | )(a) |
| | | | | | | | | | | | | | | | |
Hotels, Restaurants & Leisure | | | | | | | | | | | | | | | | |
Compass Group plc | | | (2,857 | ) | | | (56,194 | ) | | | (197 | ) | | | (0.0 | )(a) |
InterContinental Hotels Group plc | | | (1,071 | ) | | | (56,195 | ) | | | 1,033 | | | | 0.0 | (a) |
Merlin Entertainments plc(b) | | | (13,382 | ) | | | (55,265 | ) | | | 5,579 | | | | 0.0 | (a) |
| | | | | | | | | | | | | | | | |
| | | (17,310 | ) | | | (167,654 | ) | | | 6,415 | | | | 0.0 | (a) |
| | | | | | | | | | | | | | | | |
Household Durables | | | | | | | | | | | | | | | | |
Crest Nicholson Holdings plc | | | (3,667 | ) | | | (15,974 | ) | | | (837 | ) | | | (0.0 | )(a) |
| | | | | | | | | | | | | | | | |
Industrial Conglomerates | | | | | | | | | | | | | | | | |
DCC plc | | | (785 | ) | | | (67,283 | ) | | | (3,438 | ) | | | (0.0 | )(a) |
| | | | | | | | | | | | | | | | |
Insurance | | | | | | | | | | | | | | | | |
Lancashire Holdings Ltd. | | | (9,302 | ) | | | (70,126 | ) | | | (1,707 | ) | | | (0.0 | )(a) |
| | | | | | | | | | | | | | | | |
Machinery | | | | | | | | | | | | | | | | |
Weir Group plc (The) | | | (3,755 | ) | | | (75,988 | ) | | | (1,754 | ) | | | (0.0 | )(a) |
| | | | | | | | | | | | | | | | |
Media | | | | | | | | | | | | | | | | |
ITV plc | | | (34,741 | ) | | | (65,948 | ) | | | 2,838 | | | | 0.0 | (a) |
| | | | | | | | | | | | | | | | |
Metals & Mining | | | | | | | | | | | | | | | | |
Fresnillo plc | | | (5,053 | ) | | | (54,795 | ) | | | (5,244 | ) | | | (0.0 | )(a) |
| | | | | | | | | | | | | | | | |
Multiline Retail | | | | | | | | | | | | | | | | |
B&M European Value Retail SA | | | (10,912 | ) | | | (58,066 | ) | | | (3,276 | ) | | | (0.0 | )(a) |
| | | | | | | | | | | | | | | | |
Professional Services | | | | | | | | | | | | | | | | |
Capita plc* | | | (8,361 | ) | | | (13,693 | ) | | | (1,026 | ) | | | (0.0 | )(a) |
| | | | | | | | | | | | | | | | |
Specialty Retail | | | | | | | | | | | | | | | | |
Kingfisher plc | | | (3,520 | ) | | | (11,430 | ) | | | (609 | ) | | | (0.0 | )(a) |
| | | | | | | | | | | | | | | | |
Tobacco | | | | | | | | | | | | | | | | |
British American Tobacco plc | | | (1,423 | ) | | | (61,687 | ) | | | 1,091 | | | | 0.0 | (a) |
| | | | | | | | | | | | | | | | |
Total Short Positions of Total Return Basket Swap | | | (395,255 | ) | | | (973,344 | ) | | | 3,558 | | | | 0.0 | (a) |
| | | | | | | | | | | | | | | | |
Total of Long and Short Positions of Total Return Basket Swap | | | (205,756 | ) | | | 182,359 | | | | 8,972 | | | | 0.0 | (a) |
| | | | | | | | | | | | | | | | |
SEE NOTES TO FINANCIAL STATEMENTS.
| | | | | | |
| | | |
| 84 | | | | J.P. MORGAN EXCHANGE-TRADED FUNDS | | OCTOBER 31, 2018 |
| | | | | | | | | | | | | | | | | | | | |
| COUNTERPARTY | | DESCRIPTION | | TERMINATION
DATE | | NOTIONAL
VALUE (1) | | | NET UNREALIZED
APPRECIATION
(DEPRECIATION) (2) | | | NET CASH
AND OTHER
RECEIVABLES
(PAYABLES) | | | VALUE | |
| Bank of America | | The Fund receives the total return on a portfolio of short equity positions and pays or receives the net of one month LIBOR on short positions, which is denominated in USD based on the local currencies of the positions within the swaps. | | 2/25/2019 | | $ | (5,972,178 | ) | | $ | 159,359 | | | $ | 44,649 | | | $ | 204,008 | |
| | | | | | | | | | | | | | | | | | | | |
| | | | | | | | | | | | | | | | |
| REFERENCE ENTITY | | SHARES | | | NOTIONAL
VALUE($) (1) | | | NET UNREALIZED
APPRECIATION
(DEPRECIATION)($) (2) | | | PERCENTAGE
OF NET
ASSETS (%) | |
Short Positions | | | | | | | | | | | | | | | | |
| | | | |
Common Stocks | | | | | | | | | | | | | | | | |
Aerospace & Defense | | | | | | | | | | | | | | | | |
TransDigm Group, Inc.* | | | (205 | ) | | | (67,701 | ) | | | 2,011 | | | | 0.0 | (a) |
Triumph Group, Inc. | | | (788 | ) | | | (14,381 | ) | | | (794 | ) | | | (0.0 | )(a) |
| | | | | | | | | | | | | | | | |
| | | (993 | ) | | | (82,082 | ) | | | 1,217 | | | | 0.0 | (a) |
| | | | | | | | | | | | | | | | |
Airlines | | | | | | | | | | | | | |
American Airlines Group, Inc. | | | (563 | ) | | | (19,750 | ) | | | (2,435 | ) | | | (0.0 | )(a) |
Spirit Airlines, Inc.* | | | (1,456 | ) | | | (75,566 | ) | | | (10,177 | ) | | | (0.0 | )(a) |
| | | | | | | | | | | | | | | | |
| | | (2,019 | ) | | | (95,316 | ) | | | (12,612 | ) | | | (0.0 | )(a) |
| | | | | | | | | | | | | | | | |
Auto Components | | | | | | | | | | | | | |
Cooper Tire & Rubber Co. | | | (347 | ) | | | (10,719 | ) | | | (2,077 | ) | | | (0.0 | )(a) |
Gentherm, Inc.* | | | (1,425 | ) | | | (62,187 | ) | | | (5,730 | ) | | | (0.0 | )(a) |
Veoneer, Inc.* | | | (1,462 | ) | | | (49,094 | ) | | | 7,704 | | | | 0.0 | (a) |
| | | | | | | | | | | | | | | | |
| | | (3,234 | ) | | | (122,000 | ) | | | (103 | ) | | | (0.0 | )(a) |
| | | | | | | | | | | | | | | | |
Banks | | | | | | | | | | | | | |
Signature Bank | | | (631 | ) | | | (69,347 | ) | | | 3,553 | | | | 0.0 | (a) |
| | | | | | | | | | | | | | | | |
Beverages | | | | | | | | | | | | | |
Coca-Cola Bottling Co. Consolidated | | | (422 | ) | | | (72,850 | ) | | | (2,322 | ) | | | (0.0 | )(a) |
| | | | | | | | | | | | | | | | |
Capital Markets | | | | | | | | | | | | | |
WisdomTree Investments, Inc. | | | (1,895 | ) | | | (14,724 | ) | | | (2,033 | ) | | | (0.0 | )(a) |
| | | | | | | | | | | | | | | | |
Chemicals | | | | | | | | | | | | | |
NewMarket Corp. | | | (185 | ) | | | (71,402 | ) | | | (1,976 | ) | | | (0.0 | )(a) |
RPM International, Inc. | | | (1,171 | ) | | | (71,630 | ) | | | (1,904 | ) | | | (0.0 | )(a) |
Valvoline, Inc. | | | (3,329 | ) | | | (66,314 | ) | | | (1,132 | ) | | | (0.0 | )(a) |
| | | | | | | | | | | | | | | | |
| | | (4,685 | ) | | | (209,346 | ) | | | (5,012 | ) | | | (0.0 | )(a) |
| | | | | | | | | | | | | | | | |
Commercial Services & Supplies | | | | | | | | | | | | | |
Brink’s Co. (The) | | | (1,114 | ) | | | (73,881 | ) | | | (3,288 | ) | | | (0.0 | )(a) |
Covanta Holding Corp. | | | (4,548 | ) | | | (66,810 | ) | | | 6,549 | | | | 0.0 | (a) |
Healthcare Services Group, Inc. | | | (1,827 | ) | | | (74,158 | ) | | | 749 | | | | 0.0 | (a) |
| | | | | | | | | | | | | | | | |
| | | (7,489 | ) | | | (214,849 | ) | | | 4,010 | | | | 0.0 | (a) |
| | | | | | | | | | | | | | | | |
Communications Equipment | | | | | | | | | | | | | |
ADTRAN, Inc. | | | (1,253 | ) | | | (16,841 | ) | | | 50 | | | | 0.0 | (a) |
Infinera Corp.* | | | (8,904 | ) | | | (49,328 | ) | | | 2,037 | | | | 0.0 | (a) |
ViaSat, Inc.* | | | (1,079 | ) | | | (68,797 | ) | | | (2,039 | ) | | | (0.0 | )(a) |
| | | | | | | | | | | | | | | | |
| | | (11,236 | ) | | | (134,966 | ) | | | 48 | | | | 0.0 | (a) |
| | | | | | | | | | | | | | | | |
SEE NOTES TO FINANCIAL STATEMENTS.
| | | | | | | | |
| | | |
| OCTOBER 31, 2018 | | J.P. MORGAN EXCHANGE-TRADED FUNDS | | | | | 85 | |
JPMorgan Long/Short ETF
SCHEDULE OF PORTFOLIO INVESTMENTS
AS OF OCTOBER 31, 2018 (continued)
| | | | | | | | | | | | | | | | |
| REFERENCE ENTITY | | SHARES | | | NOTIONAL
VALUE($) (1) | | | NET UNREALIZED
APPRECIATION
(DEPRECIATION)($) (2) | | | PERCENTAGE
OF NET
ASSETS (%) | |
Short Positions — continued | | | | | | | | | | | | | | | | |
| | | | |
Common Stocks — continued | | | | | | | | | | | | | | | | |
Construction Materials | | | | | | | | | | | | | |
Martin Marietta Materials, Inc. | | | (435 | ) | | | (74,507 | ) | | | 775 | | | | 0.0 | (a) |
Summit Materials, Inc.* | | | (1,492 | ) | | | (20,142 | ) | | | (1,433 | ) | | | (0.0 | )(a) |
Vulcan Materials Co. | | | (778 | ) | | | (78,687 | ) | | | 681 | | | | 0.0 | (a) |
| | | | | | | | | | | | | | | | |
| | | (2,705 | ) | | | (173,336 | ) | | | 23 | | | | 0.0 | (a) |
| | | | | | | | | | | | | | | | |
Consumer Finance | | | | | | | | | | | | | |
LendingClub Corp.* | | | (20,341 | ) | | | (65,701 | ) | | | 7,705 | | | | 0.0 | (a) |
| | | | | | | | | | | | | | | | |
Distributors | | | | | | | | | | | | | |
Core-Mark Holding Co., Inc. | | | (1,052 | ) | | | (40,407 | ) | | | (4,545 | ) | | | (0.0 | )(a) |
| | | | | | | | | | | | | | | | |
Diversified Telecommunication Services | | | | | | | | | | | | | |
Cincinnati Bell, Inc.* | | | (880 | ) | | | (12,487 | ) | | | (352 | ) | | | (0.0 | )(a) |
| | | | | | | | | | | | | | | | |
Electronic Equipment, Instruments & Components | | | | | | | | | | | | | |
Cognex Corp. | | | (444 | ) | | | (19,021 | ) | | | (521 | ) | | | (0.0 | )(a) |
II-VI, Inc.* | | | (1,863 | ) | | | (69,360 | ) | | | (686 | ) | | | (0.0 | )(a) |
| | | | | | | | | | | | | | | | |
| | | (2,307 | ) | | | (88,381 | ) | | | (1,207 | ) | | | (0.0 | )(a) |
| | | | | | | | | | | | | | | | |
Energy Equipment & Services | | | | | | | | | | | | | |
Baker Hughes a GE Co. | | | (2,241 | ) | | | (59,812 | ) | | | 11,720 | | | | 0.1 | |
Forum Energy Technologies, Inc.* | | | (8,069 | ) | | | (72,298 | ) | | | 5,522 | | | | 0.0 | (a) |
Select Energy Services, Inc.* | | | (6,794 | ) | | | (64,951 | ) | | | 2,454 | | | | 0.0 | (a) |
Weatherford International plc* | | | (22,027 | ) | | | (29,737 | ) | | | 27,534 | | | | 0.1 | |
| | | | | | | | | | | | | | | | |
| | | (39,131 | ) | | | (226,798 | ) | | | 47,230 | | | | 0.2 | |
| | | | | | | | | | | | | | | | |
Entertainment | | | | | | | | | | | | | |
Netflix, Inc.* | | | (216 | ) | | | (65,185 | ) | | | 3,812 | | | | 0.0 | (a) |
| | | | | | | | | | | | | | | | |
Food & Staples Retailing | | | | | | | | | | | | | |
Casey’s General Stores, Inc. | | | (531 | ) | | | (66,964 | ) | | | (1,795 | ) | | | (0.0 | )(a) |
PriceSmart, Inc. | | | (917 | ) | | | (64,328 | ) | | | 7,015 | | | | 0.0 | (a) |
| | | | | | | | | | | | | | | | |
| | | (1,448 | ) | | | (131,292 | ) | | | 5,220 | | | | 0.0 | (a) |
| | | | | | | | | | | | | | | | |
Health Care Equipment & Supplies | | | | | | | | | | | | | |
Heska Corp.* | | | (682 | ) | | | (68,350 | ) | | | (2,428 | ) | | | (0.0 | )(a) |
Insulet Corp.* | | | (803 | ) | | | (70,833 | ) | | | (859 | ) | | | (0.0 | )(a) |
iRhythm Technologies, Inc.* | | | (159 | ) | | | (12,284 | ) | | | 342 | | | | 0.0 | (a) |
Nevro Corp.* | | | (994 | ) | | | (48,468 | ) | | | 875 | | | | 0.0 | (a) |
Wright Medical Group NV* | | | (2,391 | ) | | | (64,509 | ) | | | (454 | ) | | | (0.0 | )(a) |
| | | | | | | | | | | | | | | | |
| | | (5,029 | ) | | | (264,444 | ) | | | (2,524 | ) | | | (0.0 | )(a) |
| | | | | | | | | | | | | | | | |
Hotels, Restaurants & Leisure | | | | | | | | | | | | | |
Caesars Entertainment Corp.* | | | (5,529 | ) | | | (47,494 | ) | | | 2,002 | | | | 0.0 | (a) |
Eldorado Resorts, Inc.* | | | (331 | ) | | | (12,082 | ) | | | 612 | | | | 0.0 | (a) |
| | | | | | | | | | | | | | | | |
| | | (5,860 | ) | | | (59,576 | ) | | | 2,614 | | | | 0.0 | (a) |
| | | | | | | | | | | | | | | | |
Household Durables | | | | | | | | | | | | | |
Installed Building Products, Inc.* | | | (649 | ) | | | (19,769 | ) | | | (380 | ) | | | (0.0 | )(a) |
iRobot Corp.* | | | (626 | ) | | | (55,194 | ) | | | (1,041 | ) | | | (0.0 | )(a) |
Mohawk Industries, Inc.* | | | (99 | ) | | | (12,348 | ) | | | 2,315 | | | | 0.0 | (a) |
| | | | | | | | | | | | | | | | |
| | | (1,374 | ) | | | (87,311 | ) | | | 894 | | | | 0.0 | (a) |
| | | | | | | | | | | | | | | | |
Independent Power and Renewable Electricity Producers | | | | | | | | | | | | | |
Ormat Technologies, Inc. | | | (1,348 | ) | | | (68,977 | ) | | | (42 | ) | | | (0.0 | )(a) |
TerraForm Power, Inc. | | | (5,954 | ) | | | (67,102 | ) | | | (2,024 | ) | | | (0.0 | )(a) |
| | | | | | | | | | | | | | | | |
| | | (7,302 | ) | | | (136,079 | ) | | | (2,066 | ) | | | (0.0 | )(a) |
| | | | | | | | | | | | | | | | |
SEE NOTES TO FINANCIAL STATEMENTS.
| | | | | | |
| | | |
| 86 | | | | J.P. MORGAN EXCHANGE-TRADED FUNDS | | OCTOBER 31, 2018 |
| | | | | | | | | | | | | | | | |
| REFERENCE ENTITY | | SHARES | | | NOTIONAL
VALUE($) (1) | | | NET UNREALIZED
APPRECIATION
(DEPRECIATION)($) (2) | | | PERCENTAGE
OF NET
ASSETS (%) | |
Short Positions — continued | | | | | | | | | | | | | | | | |
| | | | |
Common Stocks — continued | | | | | | | | | | | | | | | | |
Interactive Media & Services | | | | | | | | | | | | | |
Snap, Inc.* | | | (10,231 | ) | | | (67,627 | ) | | | 257 | | | | 0.0 | (a) |
TrueCar, Inc.* | | | (1,423 | ) | | | (16,194 | ) | | | (533 | ) | | | (0.0 | )(a) |
| | | | | | | | | | | | | | | | |
| | | (11,654 | ) | | | (83,821 | ) | | | (276 | ) | | | (0.0 | )(a) |
| | | | | | | | | | | | | | | | |
Internet & Direct Marketing Retail | | | | | | | | | | | | | |
Groupon, Inc.* | | | (17,657 | ) | | | (57,739 | ) | | | (1,197 | ) | | | (0.0 | )(a) |
Wayfair, Inc.* | | | (377 | ) | | | (41,579 | ) | | | 3,506 | | | | 0.0 | (a) |
| | | | | | | | | | | | | | | | �� |
| | | (18,034 | ) | | | (99,318 | ) | | | 2,309 | | | | 0.0 | (a) |
| | | | | | | | | | | | | | | | |
IT Services | | | | | | | | | | | | | |
Gartner, Inc.* | | | (430 | ) | | | (63,433 | ) | | | (366 | ) | | | (0.0 | )(a) |
GTT Communications, Inc.* | | | (1,701 | ) | | | (61,066 | ) | | | 3,317 | | | | 0.0 | (a) |
Twilio, Inc.* | | | (212 | ) | | | (15,947 | ) | | | (2,205 | ) | | | (0.0 | )(a) |
| | | | | | | | | | | | | | | | |
| | | (2,343 | ) | | | (140,446 | ) | | | 746 | | | | 0.0 | (a) |
| | | | | | | | | | | | | | | | |
Leisure Products | | | | | | | | | | | | | |
Mattel, Inc.* | | | (4,068 | ) | | | (55,243 | ) | | | 881 | | | | 0.0 | (a) |
| | | | | | | | | | | | | | | | |
Machinery | | | | | | | | | | | | | |
CIRCOR International, Inc.* | | | (561 | ) | | | (18,238 | ) | | | 630 | | | | 0.0 | (a) |
Evoqua Water Technologies Corp.* | | | (1,351 | ) | | | (12,970 | ) | | | 5,581 | | | | 0.0 | (a) |
Gardner Denver Holdings, Inc.* | | | (2,812 | ) | | | (76,093 | ) | | | (9,338 | ) | | | (0.0 | )(a) |
Wabtec Corp. | | | (705 | ) | | | (57,824 | ) | | | 12,352 | | | | 0.0 | (a) |
| | | | | | | | | | | | | | | | |
| | | (5,429 | ) | | | (165,125 | ) | | | 9,225 | | | | 0.0 | (a) |
| | | | | | | | | | | | | | | | |
Media | | | | | | | | | | | | | |
Altice USA, Inc. | | | (1,116 | ) | | | (18,202 | ) | | | (109 | ) | | | (0.0 | )(a) |
Charter Communications, Inc.* | | | (51 | ) | | | (16,339 | ) | | | (634 | ) | | | (0.0 | )(a) |
EW Scripps Co. (The) | | | (1,157 | ) | | | (19,461 | ) | | | (820 | ) | | | (0.0 | )(a) |
GCI Liberty, Inc.* | | | (1,497 | ) | | | (70,853 | ) | | | (3,843 | ) | | | (0.0 | )(a) |
Liberty Broadband Corp.* | | | (849 | ) | | | (70,407 | ) | | | (2,977 | ) | | | (0.0 | )(a) |
Liberty Global plc* | | | (1,020 | ) | | | (26,143 | ) | | | (1,878 | ) | | | (0.0 | )(a) |
New York Times Co. (The) | | | (2,599 | ) | | | (68,613 | ) | | | (3,124 | ) | | | (0.0 | )(a) |
| | | | | | | | | | | | | | | | |
| | | (8,289 | ) | | | (290,018 | ) | | | (13,385 | ) | | | (0.0 | )(a) |
| | | | | | | | | | | | | | | | |
Metals & Mining | | | | | | | | | | | | | |
AK Steel Holding Corp.* | | | (14,308 | ) | | | (52,940 | ) | | | 12,448 | | | | 0.1 | |
Coeur Mining, Inc.* | | | (9,203 | ) | | | (43,990 | ) | | | 3,773 | | | | 0.0 | (a) |
Compass Minerals International, Inc. | | | (1,075 | ) | | | (52,148 | ) | | | 16,921 | | | | 0.1 | |
Constellium NV* | | | (1,536 | ) | | | (13,916 | ) | | | (452 | ) | | | (0.0 | )(a) |
Hecla Mining Co. | | | (21,483 | ) | | | (51,559 | ) | | | 8,378 | | | | 0.0 | (a) |
TimkenSteel Corp.* | | | (5,252 | ) | | | (61,081 | ) | | | 9,549 | | | | 0.0 | (a) |
| | | | | | | | | | | | | | | | |
| | | (52,857 | ) | | | (275,634 | ) | | | 50,617 | | | | 0.2 | |
| | | | | | | | | | | | | | | | |
Multi-Utilities | | | | | | | | | | | | | |
Dominion Energy, Inc. | | | (1,053 | ) | | | (75,205 | ) | | | 1,885 | | | | 0.0 | (a) |
NiSource, Inc. | | | (2,889 | ) | | | (73,265 | ) | | | (809 | ) | | | (0.0 | )(a) |
Sempra Energy | | | (650 | ) | | | (71,578 | ) | | | 3,471 | | | | 0.0 | (a) |
| | | | | | | | | | | | | | | | |
| | | (4,592 | ) | | | (220,048 | ) | | | 4,547 | | | | 0.0 | (a) |
| | | | | | | | | | | | | | | | |
Oil, Gas & Consumable Fuels | | | | | | | | | | | | | |
Cheniere Energy, Inc.* | | | (989 | ) | | | (59,745 | ) | | | 3,402 | | | | 0.0 | (a) |
Concho Resources, Inc.* | | | (490 | ) | | | (68,154 | ) | | | (1,393 | ) | | | (0.0 | )(a) |
Extraction Oil & Gas, Inc.* | | | (7,106 | ) | | | (56,777 | ) | | | 13,632 | | | | 0.0 | (a) |
Parsley Energy, Inc.* | | | (2,360 | ) | | | (55,271 | ) | | | 14,656 | | | | 0.1 | |
SEE NOTES TO FINANCIAL STATEMENTS.
| | | | | | | | |
| | | |
| OCTOBER 31, 2018 | | J.P. MORGAN EXCHANGE-TRADED FUNDS | | | | | 87 | |
JPMorgan Long/Short ETF
SCHEDULE OF PORTFOLIO INVESTMENTS
AS OF OCTOBER 31, 2018 (continued)
| | | | | | | | | | | | | | | | |
| REFERENCE ENTITY | | SHARES | | | NOTIONAL
VALUE($) (1) | | | NET UNREALIZED
APPRECIATION
(DEPRECIATION)($) (2) | | | PERCENTAGE
OF NET
ASSETS (%) | |
Short Positions — continued | | | | | | | | | | | | | | | | |
| | | | |
Common Stocks — continued | | | | | | | | | | | | | | | | |
Oil, Gas & Consumable Fuels — continued | | | | | | | | | | | | | |
QEP Resources, Inc.* | | | (6,204 | ) | | | (55,278 | ) | | | 14,766 | | | | 0.1 | |
| | | | | | | | | | | | | | | | |
| | | (17,149 | ) | | | (295,225 | ) | | | 45,063 | | | | 0.2 | |
| | | | | | | | | | | | | | | | |
Pharmaceuticals | | | | | | | | | | | | | |
Aerie Pharmaceuticals, Inc.* | | | (1,008 | ) | | | (53,605 | ) | | | (1,603 | ) | | | (0.0 | )(a) |
Intra-Cellular Therapies, Inc.* | | | (759 | ) | | | (12,888 | ) | | | (644 | ) | | | (0.0 | )(a) |
Medicines Co. (The)* | | | (1,837 | ) | | | (42,729 | ) | | | 6,889 | | | | 0.0 | (a) |
Nektar Therapeutics* | | | (1,740 | ) | | | (67,303 | ) | | | 9,152 | | | | 0.0 | (a) |
Pacira Pharmaceuticals, Inc.* | | | (1,457 | ) | | | (71,233 | ) | | | (4,837 | ) | | | (0.0 | )(a) |
Revance Therapeutics, Inc.* | | | (590 | ) | | | (12,844 | ) | | | (29 | ) | | | (0.0 | )(a) |
Zogenix, Inc.* | | | (1,723 | ) | | | (71,953 | ) | | | (4,634 | ) | | | (0.0 | )(a) |
| | | | | | | | | | | | | | | | |
| | | (9,114 | ) | | | (332,555 | ) | | | 4,294 | | | | 0.0 | (a) |
| | | | | | | | | | | | | | | | |
Road & Rail | | | | | | | | | | | | | |
AMERCO | | | (197 | ) | | | (64,316 | ) | | | 2,086 | | | | 0.0 | (a) |
Hertz Global Holdings, Inc.* | | | (4,677 | ) | | | (64,309 | ) | | | 4,468 | | | | 0.0 | (a) |
| | | | | | | | | | | | | | | | |
| | | (4,874 | ) | | | (128,625 | ) | | | 6,554 | | | | 0.0 | (a) |
| | | | | | | | | | | | | | | | |
Semiconductors & Semiconductor Equipment | | | | | | | | | | | | | |
Advanced Micro Devices, Inc.* | | | (2,826 | ) | | | (51,462 | ) | | | 18,017 | | | | 0.1 | |
MACOM Technology Solutions Holdings, Inc.* | | | (3,536 | ) | | | (49,752 | ) | | | 5,728 | | | | 0.0 | (a) |
MaxLinear, Inc.* | | | (3,259 | ) | | | (63,257 | ) | | | (9,386 | ) | | | (0.0 | )(a) |
Power Integrations, Inc. | | | (1,195 | ) | | | (67,302 | ) | | | (2,782 | ) | | | (0.0 | )(a) |
| | | | | | | | | | | | | | | | |
| | | (10,816 | ) | | | (231,773 | ) | | | 11,577 | | | | 0.1 | |
| | | | | | | | | | | | | | | | |
Software | | | | | | | | | | | | | |
Appian Corp.* | | | (2,949 | ) | | | (75,819 | ) | | | (7,702 | ) | | | (0.0 | )(a) |
Autodesk, Inc.* | | | (423 | ) | | | (54,673 | ) | | | 1,798 | | | | 0.0 | (a) |
Box, Inc.* | | | (3,822 | ) | | | (68,796 | ) | | | 2,745 | | | | 0.0 | (a) |
Cloudera, Inc.* | | | (5,038 | ) | | | (69,323 | ) | | | (2,471 | ) | | | (0.0 | )(a) |
HubSpot, Inc.* | | | (451 | ) | | | (61,178 | ) | | | (4,077 | ) | | | (0.0 | )(a) |
Instructure, Inc.* | | | (2,131 | ) | | | (79,571 | ) | | | (11,583 | ) | | | (0.1 | ) |
MINDBODY, Inc.* | | | (2,151 | ) | | | (68,488 | ) | | | 3,987 | | | | 0.0 | (a) |
Nutanix, Inc.* | | | (1,817 | ) | | | (75,423 | ) | | | (5,098 | ) | | | (0.0 | )(a) |
PROS Holdings, Inc.* | | | (1,853 | ) | | | (61,001 | ) | | | (3,428 | ) | | | (0.0 | )(a) |
| | | | | | | | | | | | | | | | |
| | | (20,635 | ) | | | (614,272 | ) | | | (25,829 | ) | | | (0.1 | ) |
| | | | | | | | | | | | | | | | |
Specialty Retail | | | | | | | | | | | | | |
CarMax, Inc.* | | | (818 | ) | | | (55,550 | ) | | | 544 | | | | 0.0 | (a) |
Floor & Decor Holdings, Inc.* | | | (621 | ) | | | (15,885 | ) | | | 503 | | | | 0.0 | (a) |
L Brands, Inc. | | | (381 | ) | | | (12,352 | ) | | | (967 | ) | | | (0.0 | )(a) |
National Vision Holdings, Inc.* | | | (246 | ) | | | (10,192 | ) | | | 54 | | | | 0.0 | (a) |
| | | | | | | | | | | | | | | | |
| | | (2,066 | ) | | | (93,979 | ) | | | 134 | | | | 0.0 | (a) |
| | | | | | | | | | | | | | | | |
Technology Hardware, Storage & Peripherals | | | | | | | | | | | | | |
Pure Storage, Inc.* | | | (3,222 | ) | | | (65,020 | ) | | | 5,238 | | | | 0.0 | (a) |
| | | | | | | | | | | | | | | | |
Textiles, Apparel & Luxury Goods | | | | | | | | | | | | | |
Skechers U.S.A., Inc.* | | | (2,039 | ) | | | (58,254 | ) | | | (3,811 | ) | | | (0.0 | )(a) |
| | | | | | | | | | | | | | | | |
Tobacco | | | | | | | | | | | | | |
Philip Morris International, Inc. | | | (556 | ) | | | (48,967 | ) | | | (1,918 | ) | | | (0.0 | )(a) |
| | | | | | | | | | | | | | | | |
Trading Companies & Distributors | | | | | | | | | | | | | |
Herc Holdings, Inc.* | | | (2,024 | ) | | | (64,889 | ) | | | (140 | ) | | | (0.0 | )(a) |
MRC Global, Inc.* | | | (4,289 | ) | | | (67,895 | ) | | | 6,164 | | | | 0.0 | (a) |
SEE NOTES TO FINANCIAL STATEMENTS.
| | | | | | |
| | | |
| 88 | | | | J.P. MORGAN EXCHANGE-TRADED FUNDS | | OCTOBER 31, 2018 |
| | | | | | | | | | | | | | | | |
| REFERENCE ENTITY | | SHARES | | | NOTIONAL
VALUE($) (1) | | | NET UNREALIZED
APPRECIATION
(DEPRECIATION)($) (2) | | | PERCENTAGE
OF NET
ASSETS (%) | |
Short Positions — continued | | | | | | | | | | | | | | | | |
| | | | |
Common Stocks — continued | | | | | | | | | | | | | | | | |
Trading Companies & Distributors — continued | | | | | | | | | | | | | |
NOW, Inc.* | | | (4,089 | ) | | | (52,503 | ) | | | 13,535 | | | | 0.1 | |
SiteOne Landscape Supply, Inc.* | | | (1,041 | ) | | | (70,830 | ) | | | (2,303 | ) | | | (0.0 | )(a) |
| | | | | | | | | | | | | | | | |
| | | (11,443 | ) | | | (256,117 | ) | | | 17,256 | | | | 0.1 | |
| | | | | | | | | | | | | | | | |
Water Utilities | | | | | | | | | | | | | |
American Water Works Co., Inc. | | | (848 | ) | | | (75,073 | ) | | | 1,662 | | | | 0.0 | (a) |
California Water Service Group | | | (1,814 | ) | | | (76,188 | ) | | | 925 | | | | 0.0 | (a) |
| | | | | | | | | | | | | | | | |
| | | (2,662 | ) | | | (151,261 | ) | | | 2,587 | | | | 0.0 | (a) |
| | | | | | | | | | | | | | | | |
Total Short Positions of Total Return Basket Swap | | | (312,091 | ) | | | (5,972,178 | ) | | | 159,359 | | | | 0.7 | |
| | | | | | | | | | | | | | | | |
| | | | | | | | | | | | | | | | | | | | |
| COUNTERPARTY | | DESCRIPTION | | TERMINATION
DATE | | NOTIONAL
VALUE (1) | | | NET UNREALIZED
APPRECIATION
(DEPRECIATION) (2) | | | NET CASH
AND OTHER
RECEIVABLES
(PAYABLES) | | | VALUE | |
| Bank of America | | The Fund receives the total return on a portfolio of long and short equity positions and pays or receives the net of one month BA on long positions and short positions respectively, plus or minus a specified spread (rates range from 0.00% to 0.50%), which is denominated in CAD based on the local currencies of the positions within the swaps. | | 2/25/2019 | | $ | 4,121 | | | $ | 11,203 | | | $ | (1,930 | ) | | $ | 9,273 | |
| | | | | | | | | | | | | | | | | | | | |
| | | | | | | | | | | | | | | | |
| REFERENCE ENTITY | | SHARES | | | NOTIONAL
VALUE($) (1) | | | NET UNREALIZED
APPRECIATION
(DEPRECIATION)($) (2) | | | PERCENTAGE OF NET ASSETS (%) | |
Long Positions | | | | | |
| | | |
Common Stocks | | | | | | | | | | | | | |
Auto Components | | | | | | | | | | | | | |
Magna International, Inc. | | | 917 | | | | 45,145 | | | | 2,005 | | | | 0.0 | (a) |
| | | | | | | | | | | | | | | | |
Chemicals | | | | | | | | | | | | | |
Methanex Corp. | | | 1,034 | | | | 66,959 | | | | (9,503 | ) | | | (0.0 | )(a) |
| | | | | | | | | | | | | | | | |
IT Services | | | | | | | | | | | | | |
CGI Group, Inc.* | | | 1,305 | | | | 80,593 | | | | 3,888 | | | | 0.0 | (a) |
| | | | | | | | | | | | | | | | |
Oil, Gas & Consumable Fuels | | | | | | | | | | | | | |
Parex Resources, Inc.* | | | 4,887 | | | | 71,164 | | | | (3,708 | ) | | | (0.0 | )(a) |
| | | | | | | | | | | | | | | | |
Paper & Forest Products | | | | | | | | | | | | | |
Canfor Corp.* | | | 3,811 | | | | 54,743 | | | | (6,836 | ) | | | (0.0 | )(a) |
Norbord, Inc. | | | 2,470 | | | | 62,986 | | | | (5,213 | ) | | | (0.0 | )(a) |
West Fraser Timber Co. Ltd. | | | 1,331 | | | | 66,871 | | | | (58 | ) | | | (0.0 | )(a) |
| | | | | | | | | | | | | | | | |
| | | 7,612 | | | | 184,600 | | | | (12,107 | ) | | | (0.0 | )(a) |
| | | | | | | | | | | | | | | | |
Thrifts & Mortgage Finance | | | | | | | | | | | | | |
Genworth MI Canada, Inc. | | | 2,412 | | | | 79,169 | | | | 6,043 | | | | 0.0 | (a) |
| | | | | | | | | | | | | | | | |
Total Long Positions of Total Return Basket Swap | | | 18,167 | | | | 527,630 | | | | (13,382 | ) | | | 0.0 | (a) |
| | | | | | | | | | | | | | | | |
SEE NOTES TO FINANCIAL STATEMENTS.
| | | | | | | | |
| | | |
| OCTOBER 31, 2018 | | J.P. MORGAN EXCHANGE-TRADED FUNDS | | | | | 89 | |
JPMorgan Long/Short ETF
SCHEDULE OF PORTFOLIO INVESTMENTS
AS OF OCTOBER 31, 2018 (continued)
| | | | | | | | | | | | | | | | |
| REFERENCE ENTITY | | SHARES | | | NOTIONAL
VALUE($) (1) | | | NET UNREALIZED
APPRECIATION
(DEPRECIATION)($) (2) | | | PERCENTAGE OF NET ASSETS (%) | |
Short Positions | | | | | |
| | | |
Common Stocks | | | | | | | | | | | | | |
Aerospace & Defense | | | | | | | | | | | | | |
Bombardier, Inc.* | | | (25,519 | ) | | | (61,837 | ) | | | 11,759 | | | | 0.0 | (a) |
| | | | | | | | | | | | | | | | |
Entertainment | | | | | | | | | | | | | |
Cineplex, Inc. | | | (742 | ) | | | (20,454 | ) | | | (181 | ) | | | (0.0 | )(a) |
| | | | | | | | | | | | | | | | |
Independent Power and Renewable Electricity Producers | | | | | | | | | | | | | |
Northland Power, Inc. | | | (3,970 | ) | | | (61,068 | ) | | | 315 | | | | 0.0 | (a) |
| | | | | | | | | | | | | | | | |
Metals & Mining | | | | | | | | | | | | | |
Agnico Eagle Mines Ltd. | | | (1,666 | ) | | | (58,847 | ) | | | (1,540 | ) | | | (0.0 | )(a) |
B2Gold Corp.* | | | (29,185 | ) | | | (72,051 | ) | | | (1,597 | ) | | | (0.0 | )(a) |
First Quantum Minerals Ltd. | | | (7,513 | ) | | | (74,990 | ) | | | (9,730 | ) | | | (0.0 | )(a) |
Franco-Nevada Corp. | | | (1,004 | ) | | | (62,706 | ) | | | (1,194 | ) | | | (0.0 | )(a) |
Goldcorp, Inc. | | | (5,595 | ) | | | (50,533 | ) | | | 5,609 | | | | 0.0 | (a) |
| | | | | | | | | | | | | | | | |
| | | (44,963 | ) | | | (319,127 | ) | | | (8,452 | ) | | | (0.0 | )(a) |
| | | | | | | | | | | | | | | | |
Oil, Gas & Consumable Fuels | | | | | | | | | | | | | |
Paramount Resources Ltd.* | | | (6,580 | ) | | | (48,084 | ) | | | 21,192 | | | | 0.1 | |
Whitecap Resources, Inc. | | | (2,645 | ) | | | (12,939 | ) | | | (48 | ) | | | (0.0 | )(a) |
| | | | | | | | | | | | | | | | |
| | | (9,225 | ) | | | (61,023 | ) | | | 21,144 | | | | 0.1 | |
| | | | | | | | | | | | | | | | |
Total Short Positions of Total Return Basket Swap | | | (84,419 | ) | | | (523,509 | ) | | | 24,585 | | | | 0.1 | |
| | | | | | | | | | | | | | | | |
Total of Long and Short Positions of Total Return Basket Swap | | | (66,252 | ) | | | 4,121 | | | | 11,203 | | | | 0.1 | |
| | | | | | | | | | | | | | | | |
| | | | | | | | | | | | | | | | | | | | |
| COUNTERPARTY | | DESCRIPTION | | TERMINATION
DATE | | NOTIONAL
VALUE (1) | | | NET UNREALIZED
APPRECIATION
(DEPRECIATION) (2) | | | NET CASH
AND OTHER
RECEIVABLES
(PAYABLES) | | | VALUE | |
| Bank of America | | The Fund receives the total return on a portfolio of long and short equity positions and pays or receives the net of one month EURIBOR on long positions and short positions respectively, plus or minus a specified spread (rates range from 0.00% to 0.25%), which is denominated in EUR based on the local currencies of the positions within the swaps. | | 2/28/2019 –
7/31/2019 | | $ | 983,884 | | | $ | (17,505 | ) | | $ | 39,533 | | | $ | 22,028 | |
| | | | | | | | | | | | | | | | | | | | |
| | | | | | | | | | | | | | | | |
| REFERENCE ENTITY | | SHARES | | | NOTIONAL
VALUE($) (1) | | | NET UNREALIZED
APPRECIATION
(DEPRECIATION)($) (2) | | | PERCENTAGE
OF NET
ASSETS (%) | |
Long Positions | | | | | |
| | | |
Common Stocks | | | | | | | | | | | | | |
Aerospace & Defense | | | | | | | | | | | | | |
Dassault Aviation SA | | | 49 | | | | 81,307 | | | | (208 | ) | | | (0.0 | )(a) |
| | | | | | | | | | | | | | | | |
Auto Components | | | | | | | | | | | | | |
Cie Plastic Omnium SA | | | 868 | | | | 24,132 | | | | 706 | | | | 0.0 | (a) |
Faurecia SA | | | 1,099 | | | | 53,278 | | | | (1,889 | ) | | | (0.0 | )(a) |
| | | | | | | | | | | | | | | | |
| | | 1,967 | | | | 77,410 | | | | (1,183 | ) | | | (0.0 | )(a) |
| | | | | | | | | | | | | | | | |
Automobiles | | | | | | | | | | | | | |
Peugeot SA | | | 2,741 | | | | 65,156 | | | | 2,248 | | | | 0.0 | (a) |
| | | | | | | | | | | | | | | | |
SEE NOTES TO FINANCIAL STATEMENTS.
| | | | | | |
| | | |
| 90 | | | | J.P. MORGAN EXCHANGE-TRADED FUNDS | | OCTOBER 31, 2018 |
| | | | | | | | | | | | | | | | |
| REFERENCE ENTITY | | SHARES | | | NOTIONAL
VALUE($) (1) | | | NET UNREALIZED
APPRECIATION
(DEPRECIATION)($) (2) | | | PERCENTAGE
OF NET
ASSETS (%) | |
Long Positions — continued | | | | | |
| | | |
Common Stocks — continued | | | | | | | | | | | | | |
Chemicals | | | | | | | | | | | | | |
Covestro AG (b) | | | 1,234 | | | | 79,579 | | | | (4,447 | ) | | | (0.0 | )(a) |
| | | | | | | | | | | | | | | | |
Construction & Engineering | | | | | | | | | | | | | |
Eiffage SA | | | 734 | | | | 71,684 | | | | (4,188 | ) | | | (0.0 | )(a) |
Maire Tecnimont SpA | | | 16,885 | | | | 73,810 | | | | 2,733 | | | | 0.0 | (a) |
| | | | | | | | | | | | | | | | |
| | | 17,619 | | | | 145,494 | | | | (1,455 | ) | | | (0.0 | )(a) |
| | | | | | | | | | | | | | | | |
Diversified Telecommunication Services | | | | | | | | | | | | | |
Deutsche Telekom AG (Registered) | | | 5,174 | | | | 84,862 | | | | 1,154 | | | | 0.0 | (a) |
DNA OYJ | | | 3,612 | | | | 70,785 | | | | (6,712 | ) | | | (0.0 | )(a) |
| | | | | | | | | | | | | | | | |
| | | 8,786 | | | | 155,647 | | | | (5,558 | ) | | | (0.0 | )(a) |
| | | | | | | | | | | | | | | | |
Electric Utilities | | | | | | | | | | | | | |
Endesa SA | | | 3,665 | | | | 76,632 | | | | (1,521 | ) | | | (0.0 | )(a) |
Verbund AG | | | 1,796 | | | | 72,293 | | | | (2,646 | ) | | | (0.0 | )(a) |
| | | | | | | | | | | | | | | | |
| | | 5,461 | | | | 148,925 | | | | (4,167 | ) | | | (0.0 | )(a) |
| | | | | | | | | | | | | | | | |
Electrical Equipment | | | | | | | | | | | | | |
Signify NV (b) | | | 2,847 | | | | 70,134 | | | | 1,736 | | | | 0.0 | (a) |
| | | | | | | | | | | | | | | | |
Health Care Equipment & Supplies | | | | | | | | | | | | | |
Koninklijke Philips NV | | | 1,929 | | | | 71,944 | | | | (6,352 | ) | | | (0.0 | )(a) |
| | | | | | | | | | | | | | | | |
Industrial Conglomerates | | | | | | | | | | | | | |
Rheinmetall AG | | | 219 | | | | 18,953 | | | | 1,170 | | | | 0.0 | (a) |
| | | | | | | | | | | | | | | | |
Insurance | | | | | | | | | | | | | |
Ageas | | | 1,558 | | | | 77,955 | | | | 1,107 | | | | 0.0 | (a) |
ASR Nederland NV | | | 1,641 | | | | 74,497 | | | | 697 | | | | 0.0 | (a) |
Poste Italiane SpA(b) | | | 1,769 | | | | 12,693 | | | | 675 | | | | 0.0 | (a) |
| | | | | | | | | | | | | | | | |
| | | 4,968 | | | | 165,145 | | | | 2,479 | | | | 0.0 | (a) |
| | | | | | | | | | | | | | | | |
IT Services | | | | | | | | | | | | | |
Amadeus IT Group SA | | | 851 | | | | 68,526 | | | | (741 | ) | | | (0.0 | )(a) |
| | | | | | | | | | | | | | | | |
Machinery | | | | | | | | | | | | | |
Fincantieri SpA | | | 47,457 | | | | 69,140 | | | | (324 | ) | | | (0.0 | )(a) |
Valmet OYJ | | | 3,962 | | | | 90,210 | | | | 2,150 | | | | 0.0 | (a) |
| | | | | | | | | | | | | | | | |
| | | 51,419 | | | | 159,350 | | | | 1,826 | | | | 0.0 | (a) |
| | | | | | | | | | | | | | | | |
Media | | | | | | | | | | | | | |
Eutelsat Communications SA | | | 3,106 | | | | 62,911 | | | | (15,591 | ) | | | (0.1 | ) |
Mediaset Espana Comunicacion SA | | | 3,883 | | | | 26,404 | | | | 574 | | | | 0.0 | (a) |
ProSiebenSat.1 Media SE | | | 3,333 | | | | 76,964 | | | | (3,347 | ) | | | (0.0 | )(a) |
Publicis Groupe SA | | | 315 | | | | 18,234 | | | | (273 | ) | | | (0.0 | )(a) |
| | | | | | | | | | | | | | | | |
| | | 10,637 | | | | 184,513 | | | | (18,637 | ) | | | (0.1 | ) |
| | | | | | | | | | | | | | | | |
Metals & Mining | | | | | | | | | | | | | |
Aurubis AG | | | 1,301 | | | | 78,970 | | | | 179 | | | | 0.0 | (a) |
Eramet | | | 182 | | | | 16,754 | | | | 2,776 | | | | 0.0 | (a) |
| | | | | | | | | | | | | | | | |
| | | 1,483 | | | | 95,724 | | | | 2,955 | | | | 0.0 | (a) |
| | | | | | | | | | | | | | | | |
Multi-Utilities | | | | | | | | | | | | | |
A2A SpA | | | 46,716 | | | | 75,276 | | | | (3,388 | ) | | | (0.1 | ) |
Engie SA | | | 5,253 | | | | 69,797 | | | | (2,712 | ) | | | (0.0 | )(a) |
Hera SpA | | | 26,304 | | | | 72,596 | | | | (1,991 | ) | | | (0.0 | )(a) |
Iren SpA | | | 31,829 | | | | 68,966 | | | | (2,081 | ) | | | (0.0 | )(a) |
| | | | | | | | | | | | | | | | |
| | | 110,102 | | | | 286,635 | | | | (10,172 | ) | | | (0.1 | ) |
| | | | | | | | | | | | | | | | |
SEE NOTES TO FINANCIAL STATEMENTS.
| | | | | | | | |
| | | |
| OCTOBER 31, 2018 | | J.P. MORGAN EXCHANGE-TRADED FUNDS | | | | | 91 | |
JPMorgan Long/Short ETF
SCHEDULE OF PORTFOLIO INVESTMENTS
AS OF OCTOBER 31, 2018 (continued)
| | | | | | | | | | | | | | | | |
| REFERENCE ENTITY | | SHARES | | | NOTIONAL
VALUE($) (1) | | | NET UNREALIZED
APPRECIATION
(DEPRECIATION)($) (2) | | | PERCENTAGE
OF NET
ASSETS (%) | |
Long Positions — continued | | | | | |
| | | |
Common Stocks — continued | | | | | | | | | | | | | |
Oil, Gas & Consumable Fuels | | | | | | | | | | | | | |
Enagas SA | | | 3,007 | | | | 79,726 | | | | (302 | ) | | | (0.0 | )(a) |
Eni SpA | | | 4,404 | | | | 78,214 | | | | (2,447 | ) | | | (0.0 | )(a) |
Neste OYJ | | | 1,054 | | | | 86,549 | | | | 19 | | | | 0.0 | (a) |
OMV AG | | | 1,501 | | | | 83,355 | | | | (913 | ) | | �� | (0.0 | )(a) |
Repsol SA | | | 4,222 | | | | 75,442 | | | | (6,352 | ) | | | (0.1 | ) |
TOTAL SA | | | 1,343 | | | | 78,801 | | | | (5,121 | ) | | | (0.0 | )(a) |
| | | | | | | | | | | | | | | | |
| | | 15,531 | | | | 482,087 | | | | (15,116 | ) | | | (0.1 | ) |
| | | | | | | | | | | | | | | | |
Paper & Forest Products | | | | | | | | | | | | | |
Ence Energia y Celulosa SA | | | 9,546 | | | | 80,185 | | | | (523 | ) | | | (0.0 | )(a) |
UPM-Kymmene OYJ | | | 2,029 | | | | 65,230 | | | | (5,644 | ) | | | (0.0 | )(a) |
| | | | | | | | | | | | | | | | |
| | | 11,575 | | | | 145,415 | | | | (6,167 | ) | | | (0.0 | )(a) |
| | | | | | | | | | | | | | | | |
Pharmaceuticals | | | | | | | | | | | | | |
Bayer AG (Registered) | | | 906 | | | | 69,447 | | | | (7,578 | ) | | | (0.0 | )(a) |
Merck KGaA | | | 826 | | | | 88,385 | | | | 4,442 | | | | 0.0 | (a) |
| | | | | | | | | | | | | | | | |
| | | 1,732 | | | | 157,832 | | | | (3,136 | ) | | | (0.0 | )(a) |
| | | | | | | | | | | | | | | | |
Real Estate Management & Development | | | | | | | | | | | | | |
Grand City Properties SA | | | 3,167 | | | | 76,565 | | | | 223 | | | | 0.0 | (a) |
LEG Immobilien AG | | | 742 | | | | 81,107 | | | | (759 | ) | | | (0.0 | )(a) |
Nexity SA | | | 288 | | | | 13,772 | | | | 81 | | | | 0.0 | (a) |
TAG Immobilien AG | | | 3,659 | | | | 83,470 | | | | 78 | | | | 0.0 | (a) |
| | | | | | | | | | | | | | | | |
| | | 7,856 | | | | 254,914 | | | | (377 | ) | | | (0.0 | )(a) |
| | | | | | | | | | | | | | | | |
Semiconductors & Semiconductor Equipment | | | | | | | | | | | | | |
BE Semiconductor Industries NV | | | 1,296 | | | | 27,706 | | | | 3,636 | | | | 0.0 | (a) |
Siltronic AG | | | 697 | | | | 63,834 | | | | (4,889 | ) | | | (0.0 | )(a) |
| | | | | | | | | | | | | | | | |
| | | 1,993 | | | | 91,540 | | | | (1,253 | ) | | | (0.0 | )(a) |
| | | | | | | | | | | | | | | | |
Textiles, Apparel & Luxury Goods | | | | | | | | | | | | | |
Christian Dior SE | | | 41 | | | | 15,862 | | | | 738 | | | | 0.0 | (a) |
| | | | | | | | | | | | | | | | |
Total Long Positions of Total Return Basket Swap | | | 261,040 | | | | 3,022,092 | | | | (65,817 | ) | | | (0.3 | ) |
| | | | | | | | | | | | | | | | |
| |
Short Positions | | | | | |
| | | |
Common Stocks | | | | | | | | | | | | | |
Air Freight & Logistics | | | | | | | | | | | | | |
Deutsche Post AG | | | (2,159 | ) | | | (68,171 | ) | | | (222 | ) | | | (0.0 | )(a) |
| | | | | | | | | | | | | | | | |
Auto Components | | | | | | | | | | | | | |
Brembo SpA | | | (1,545 | ) | | | (17,104 | ) | | | (555 | ) | | | (0.0 | )(a) |
Nokian Renkaat OYJ | | | (399 | ) | | | (12,692 | ) | | | 1,170 | | | | 0.0 | (a) |
| | | | | | | | | | | | | | | | |
| | | (1,944 | ) | | | (29,796 | ) | | | 615 | | | | 0.0 | (a) |
| | | | | | | | | | | | | | | | |
Automobiles | | | | | | | | | | | | | |
Daimler AG (Registered) | | | (957 | ) | | | (56,689 | ) | | | (2,513 | ) | | | (0.0 | )(a) |
| | | | | | | | | | | | | | | | |
Banks | | | | | | | | | | | | | |
Bankia SA | | | (21,204 | ) | | | (66,603 | ) | | | 11,251 | | | | 0.1 | |
| | | | | | | | | | | | | | | | |
Capital Markets | | | | | | | | | | | | | |
Banca Generali SpA | | | (963 | ) | | | (18,542 | ) | | | 504 | | | | 0.0 | (a) |
Deutsche Bank AG (Registered) | | | (6,047 | ) | | | (59,102 | ) | | | 6,583 | | | | 0.0 | (a) |
| | | | | | | | | | | | | | | | |
| | | (7,010 | ) | | | (77,644 | ) | | | 7,087 | | | | 0.0 | (a) |
| | | | | | | | | | | | | | | | |
SEE NOTES TO FINANCIAL STATEMENTS.
| | | | | | |
| | | |
| 92 | | | | J.P. MORGAN EXCHANGE-TRADED FUNDS | | OCTOBER 31, 2018 |
| | | | | | | | | | | | | | | | |
| REFERENCE ENTITY | | SHARES | | | NOTIONAL
VALUE($) (1) | | | NET UNREALIZED
APPRECIATION
(DEPRECIATION)($) (2) | | | PERCENTAGE
OF NET
ASSETS (%) | |
Short Positions — continued | | | | | |
| | | |
Common Stocks — continued | | | | | | | | | | | | | |
Chemicals | | | | | | | | | | | | | |
LANXESS AG | | | (1,115 | ) | | | (69,016 | ) | | | 5,600 | | | | 0.0 | (a) |
Lenzing AG | | | (745 | ) | | | (67,578 | ) | | | (1,374 | ) | | | (0.0 | )(a) |
OCI NV* | | | (2,154 | ) | | | (61,201 | ) | | | 7,311 | | | | 0.0 | (a) |
Symrise AG | | | (818 | ) | | | (68,522 | ) | | | (1,071 | ) | | | (0.0 | )(a) |
Umicore SA | | | (312 | ) | | | (14,687 | ) | | | (916 | ) | | | (0.0 | )(a) |
| | | | | | | | | | | | | | | | |
| | | (5,144 | ) | | | (281,004 | ) | | | 9,550 | | | | 0.0 | (a) |
| | | | | | | | | | | | | | | | |
Commercial Services & Supplies | | | | | | | | | | | | | |
Elis SA | | | (768 | ) | | | (15,486 | ) | | | (1,313 | ) | | | (0.0 | )(a) |
| | | | | | | | | | | | | | | | |
Construction & Engineering | | | | | | | | | | | | | |
Boskalis Westminster | | | (2,121 | ) | | | (60,985 | ) | | | (2,183 | ) | | | (0.0 | )(a) |
| | | | | | | | | | | | | | | | |
Construction Materials | | | | | | | | | | | | | |
Imerys SA | | | (1,126 | ) | | | (69,410 | ) | | | (1,259 | ) | | | (0.0 | )(a) |
| | | | | | | | | | | | | | | | |
Containers & Packaging | | | | | | | | | | | | | |
Huhtamaki OYJ | | | (2,096 | ) | | | (58,766 | ) | | | 2,429 | | | | 0.0 | (a) |
| | | | | | | | | | | | | | | | |
Diversified Telecommunication Services | | | | | | | | | | | | | |
Iliad SA | | | (311 | ) | | | (35,947 | ) | | | 343 | | | | 0.0 | (a) |
| | | | | | | | | | | | | | | | |
Electrical Equipment | | | | | | | | | | | | | |
Nexans SA | | | (2,078 | ) | | | (59,968 | ) | | | (383 | ) | | | (0.0 | )(a) |
| | | | | | | | | | | | | | | | |
Energy Equipment & Services | | | | | | | | | | | | | |
CGG SA* | | | (6,753 | ) | | | (16,336 | ) | | | (1,874 | ) | | | (0.0 | )(a) |
| | | | | | | | | | | | | | | | |
Food & Staples Retailing | | | | | | | | | | | | | |
Jeronimo Martins SGPS SA | | | (5,238 | ) | | | (64,291 | ) | | | 4,742 | | | | 0.0 | (a) |
| | | | | | | | | | | | | | | | |
Food Products | | | | | | | | | | | | | |
Glanbia plc | | | (4,247 | ) | | | (75,089 | ) | | | (6,293 | ) | | | (0.0 | )(a) |
| | | | | | | | | | | | | | | | |
Gas Utilities | | | | | | | | | | | | | |
Rubis SCA | | | (1,400 | ) | | | (72,232 | ) | | | (1,089 | ) | | | (0.0 | )(a) |
| | | | | | | | | | | | | | | | |
Hotels, Restaurants & Leisure | | | | | | | | | | | | | |
Elior Group SA(b) | | | (4,222 | ) | | | (60,731 | ) | | | (1,841 | ) | | | (0.0 | )(a) |
| | | | | | | | | | | | | | | | |
Household Durables | | | | | | | | | | | | | |
Neinor Homes SA*(b) | | | (3,228 | ) | | | (51,953 | ) | | | 3,623 | | | | 0.0 | (a) |
| | | | | | | | | | | | | | | | |
Industrial Conglomerates | | | | | | | | | | | | | |
Siemens AG (Registered) | | | (532 | ) | | | (61,152 | ) | | | 636 | | | | 0.0 | (a) |
| | | | | | | | | | | | | | | | |
Internet & Direct Marketing Retail | | | | | | | | | | | | | |
Zalando SE*(b) | | | (836 | ) | | | (32,316 | ) | | | (2,517 | ) | | | (0.0 | )(a) |
| | | | | | | | | | | | | | | | |
Life Sciences Tools & Services | | | | | | | | | | | | | |
Eurofins Scientific SE | | | (133 | ) | | | (67,024 | ) | | | (5,372 | ) | | | (0.0 | )(a) |
| | | | | | | | | | | | | | | | |
Machinery | | | | | | | | | | | | | |
Alstom SA* | | | (1,650 | ) | | | (72,060 | ) | | | (913 | ) | | | (0.0 | )(a) |
ANDRITZ AG | | | (1,301 | ) | | | (67,431 | ) | | | 1,936 | | | | 0.0 | (a) |
Duerr AG | | | (405 | ) | | | (14,432 | ) | | | (1,804 | ) | | | (0.0 | )(a) |
GEA Group AG | | | (1,373 | ) | | | (41,720 | ) | | | 461 | | | | 0.0 | (a) |
IMA Industria Macchine Automatiche SpA | | | (1,030 | ) | | | (61,766 | ) | | | 12,506 | | | | 0.0 | (a) |
Outotec OYJ* | | | (8,942 | ) | | | (34,586 | ) | | | 16,806 | | | | 0.1 | |
| | | | | | | | | | | | | | | | |
| | | (14,701 | ) | | | (291,995 | ) | | | 28,992 | | | | 0.1 | |
| | | | | | | | | | | | | | | | |
SEE NOTES TO FINANCIAL STATEMENTS.
| | | | | | | | |
| | | |
| OCTOBER 31, 2018 | | J.P. MORGAN EXCHANGE-TRADED FUNDS | | | | | 93 | |
JPMorgan Long/Short ETF
SCHEDULE OF PORTFOLIO INVESTMENTS
AS OF OCTOBER 31, 2018 (continued)
| | | | | | | | | | | | | | | | |
| REFERENCE ENTITY | | SHARES | | | NOTIONAL
VALUE($) (1) | | | NET UNREALIZED
APPRECIATION
(DEPRECIATION)($) (2) | | | PERCENTAGE
OF NET
ASSETS (%) | |
Short Positions — continued | | | | | |
| | | |
Common Stocks — continued | | | | | | | | | | | | | |
Media | | | | | | | | | | | | | |
Altice Europe NV* | | | (11,142 | ) | | | (26,507 | ) | | | 532 | | | | 0.0 | (a) |
JCDecaux SA | | | (2,069 | ) | | | (67,921 | ) | | | 677 | | | | 0.0 | (a) |
Telenet Group Holding NV | | | (1,000 | ) | | | (48,448 | ) | | | 1,934 | | | | 0.0 | (a) |
| | | | | | | | | | | | | | | | |
| | | (14,211 | ) | | | (142,876 | ) | | | 3,143 | | | | 0.0 | (a) |
| | | | | | | | | | | | | | | | |
Metals & Mining | | | | | | | | | | | | | |
AMG Advanced Metallurgical Group NV | | | (298 | ) | | | (14,178 | ) | | | (1,859 | ) | | | (0.0 | )(a) |
Salzgitter AG | | | (1,643 | ) | | | (65,667 | ) | | | (1,009 | ) | | | (0.0 | )(a) |
thyssenkrupp AG | | | (2,715 | ) | | | (56,910 | ) | | | 6,428 | | | | 0.0 | (a) |
| | | | | | | | | | | | | | | | |
| | | (4,656 | ) | | | (136,755 | ) | | | 3,560 | | | | 0.0 | (a) |
| | | | | | | | | | | | | | | | |
Specialty Retail | | | | | | | | | | | | | |
Industria de Diseno Textil SA | | | (585 | ) | | | (16,488 | ) | | | (163 | ) | | | (0.0 | )(a) |
| | | | | | | | | | | | | | | | |
Transportation Infrastructure | | | | | | | | | | | | | |
Getlink | | | (5,446 | ) | | | (68,501 | ) | | | (637 | ) | | | (0.0 | )(a) |
| | | | | | | | | | | | | | | | |
Total Short Positions of Total Return Basket Swap | | | (113,106 | ) | | | (2,038,208 | ) | | | 48,312 | | | | 0.2 | |
| | | | | | | | | | | | | | | | |
Total of Long and Short Positions of Total Return Basket Swap | | | 147,934 | | | | 983,884 | | | | (17,505 | ) | | | (0.1 | ) |
| | | | | | | | | | | | | | | | |
| | | | | | | | | | | | | | | | | | | | |
| COUNTERPARTY | | DESCRIPTION | | TERMINATION
DATE | | NOTIONAL
VALUE (1) | | | NET UNREALIZED
APPRECIATION
(DEPRECIATION) (2) | | | NET CASH
AND OTHER
RECEIVABLES
(PAYABLES) | | | VALUE | |
| Bank of America | | The Fund receives the total return on a portfolio of long and short equity positions and pays or receives the net of one month LIBOR on long positions and short positions respectively, plus or minus a specified spread (rates range from 0.00% to 0.25%), which is denominated in CHF based on the local currencies of the positions within the swaps. | | 7/31/2019 —
4/30/2020 | | $ | 425,516 | | | $ | 10,358 | | | $ | 1,544 | | | $ | 11,902 | |
| | | | | | | | | | | | | | | | | | | | |
| | | | | | | | | | | | | | | | |
REFERENCE ENTITY | | SHARES | | | NOTIONAL
VALUE($) (1) | | | NET UNREALIZED
APPRECIATION
(DEPRECIATION)($) (2) | | | PERCENTAGE
OF NET
ASSETS (%) | |
Long Positions | | | | | |
| | | |
Common Stocks | | | | | | | | | | | | | |
Diversified Telecommunication Services | | | | | | | | | | | | | |
Sunrise Communications Group AG*(b) | | | 943 | | | | 83,005 | | | | 623 | | | | 0.0 | (a) |
| | | | | | | | | | | | | | | | |
Health Care Equipment & Supplies | | | | | | | | | | | | | |
Sonova Holding AG (Registered) | | | 97 | | | | 15,819 | | | | 885 | | | | 0.0 | (a) |
| | | | | | | | | | | | | | | | |
Insurance | | | | | | | | | | | | | |
Swiss Life Holding AG (Registered)* | | | 215 | | | | 81,101 | | | | 4,570 | | | | 0.0 | (a) |
| | | | | | | | | | | | | | | | |
Machinery | | | | | | | | | | | | | |
Bucher Industries AG (Registered) | | | 257 | | | | 70,878 | | | | (3,507 | ) | | | (0.0 | )(a) |
Georg Fischer AG (Registered) | | | 22 | | | | 20,467 | | | | 1,306 | | | | 0.0 | (a) |
OC Oerlikon Corp. AG (Registered)* | | | 6,238 | | | | 74,240 | | | | (1,972 | ) | | | (0.0 | )(a) |
| | | | | | | | | | | | | | | | |
| | | 6,517 | | | | 165,585 | | | | (4,173 | ) | | | (0.0 | )(a) |
| | | | | | | | | | | | | | | | |
SEE NOTES TO FINANCIAL STATEMENTS.
| | | | | | |
| | | |
| 94 | | | | J.P. MORGAN EXCHANGE-TRADED FUNDS | | OCTOBER 31, 2018 |
| | | | | | | | | | | | | | | | |
REFERENCE ENTITY | | SHARES | | | NOTIONAL
VALUE($) (1) | | | NET UNREALIZED
APPRECIATION
(DEPRECIATION)($) (2) | | | PERCENTAGE
OF NET
ASSETS (%) | |
Long Positions — continued | | | | | |
| | | |
Common Stocks — continued | | | | | | | | | | | | | |
Pharmaceuticals | | | | | | | | | | | | | |
Galenica AG* (b) | | | 1,503 | | | | 80,574 | | | | 548 | | | | 0.0 | (a) |
| | | | | | | | | | | | | | | | |
Real Estate Management & Development | | | | | | | | | | | | | |
Swiss Prime Site AG (Registered)* | | | 914 | | | | 74,165 | | | | 1,980 | | | | 0.0 | (a) |
| | | | | | | | | | | | | | | | |
Total Long Positions of Total Return Basket Swap | | | 10,189 | | | | 500,249 | | | | 4,433 | | | | 0.0 | (a) |
| | | | | | | | | | | | | | | | |
| |
Short Positions | | | | | |
| | | |
Common Stocks | | | | | | | | | | | | | |
Household Durables | | | | | | | | | | | | | |
Forbo Holding AG (Registered) | | | (33 | ) | | | (48,437 | ) | | | 270 | | | | 0.0 | (a) |
| | | | | | | | | | | | | | | | |
Semiconductors & Semiconductor Equipment | | | | | | | | | | | | | |
ams AG* | | | (675 | ) | | | (26,296 | ) | | | 5,655 | | | | 0.0 | (a) |
| | | | | | | | | | | | | | | | |
Total Short Positions of Total Return Basket Swap | | | (708 | ) | | | (74,733 | ) | | | 5,925 | | | | 0.0 | (a) |
| | | | | | | | | | | | | | | | |
Total of Long and Short Positions of Total Return Basket Swap | | | 9,481 | | | | 425,516 | | | | 10,358 | | | | 0.0 | (a) |
| | | | | | | | | | | | | | | | |
| | | | | | | | | | | | | | | | | | | | |
| COUNTERPARTY | | DESCRIPTION | | TERMINATION
DATE | | NOTIONAL
VALUE (1) | | | NET UNREALIZED
APPRECIATION
(DEPRECIATION) (2) | | | NET CASH
AND OTHER
RECEIVABLES
(PAYABLES) | | | VALUE | |
| Bank of America | | The Fund receives the total return on a portfolio of long and short equity positions and pays or receives the net of one month LIBOR on long positions and short positions respectively, plus or minus a specified spread (rates range from (4.00)% to 0.35%), which is denominated in JPY based on the local currencies of the positions within the swaps. | | 2/25/2019 | | $ | (236,065 | ) | | $ | 12,868 | | | $ | (21,187 | ) | | $ | (8,319 | ) |
| | | | | | | | | | | | | | | | | | | | |
| | | | | | | | | | | | | | | | |
| REFERENCE ENTITY | | SHARES | | | NOTIONAL
VALUE($) (1) | | | NET UNREALIZED
APPRECIATION
(DEPRECIATION)($) (2) | | | PERCENTAGE
OF NET
ASSETS (%) | |
Long Positions | | | | | |
| | | |
Common Stocks | | | | | | | | | | | | | |
Auto Components | | | | | | | | | | | | | |
TS Tech Co. Ltd. | | | 1,300 | | | | 37,414 | | | | (3,991 | ) | | | (0.0 | )(a) |
| | | | | | | | | | | | | | | | |
Beverages | | | | | | | | | | | | | |
Kirin Holdings Co. Ltd. | | | 3,100 | | | | 73,974 | | | | (3,980 | ) | | | (0.0 | )(a) |
| | | | | | | | | | | | | | | | |
Chemicals | | | | | | | | | | | | | |
Mitsubishi Chemical Holdings Corp. | | | 9,700 | | | | 75,615 | | | | (12,701 | ) | | | (0.1 | ) |
Mitsubishi Gas Chemical Co., Inc. | | | 3,700 | | | | 62,109 | | | | (10,980 | ) | | | (0.1 | ) |
Sumitomo Bakelite Co. Ltd. | | | 1,600 | | | | 57,772 | | | | (5,672 | ) | | | (0.0 | )(a) |
Tosoh Corp. | | | 5,300 | | | | 69,779 | | | | (6,331 | ) | | | (0.0 | )(a) |
| | | | | | | | | | | | | | | | |
| | | 20,300 | | | | 265,275 | | | | (35,684 | ) | | | (0.2 | ) |
| | | | | | | | | | | | | | | | |
Construction & Engineering | | | | | | | | | | | | | |
Taisei Corp. | | | 1,800 | | | | 76,983 | | | | (4,916 | ) | | | (0.0 | )(a) |
| | | | | | | | | | | | | | | | |
SEE NOTES TO FINANCIAL STATEMENTS.
| | | | | | | | |
| | | |
| OCTOBER 31, 2018 | | J.P. MORGAN EXCHANGE-TRADED FUNDS | | | | | 95 | |
JPMorgan Long/Short ETF
SCHEDULE OF PORTFOLIO INVESTMENTS
AS OF OCTOBER 31, 2018 (continued)
| | | | | | | | | | | | | | | | |
| REFERENCE ENTITY | | SHARES | | | NOTIONAL
VALUE($) (1) | | | NET UNREALIZED
APPRECIATION
(DEPRECIATION)($) (2) | | | PERCENTAGE
OF NET
ASSETS (%) | |
Long Positions — continued | | | | | |
| | | |
Common Stocks — continued | | | | | | | | | | | | | |
Diversified Telecommunication Services | | | | | | | | | | | | | |
Nippon Telegraph & Telephone Corp. | | | 1,800 | | | | 74,230 | | | | (5,462 | ) | | | (0.0 | )(a) |
| | | | | | | | | | | | | | | | |
Entertainment | | | | | | | | | | | | | |
GungHo Online Entertainment, Inc.* | | | 20,000 | | | | 36,157 | | | | (1,985 | ) | | | (0.0 | )(a) |
| | | | | | | | | | | | | | | | |
Food & Staples Retailing | | | | | | | | | | | | | |
Matsumotokiyoshi Holdings Co. Ltd. | | | 2,200 | | | | 79,539 | | | | (7,613 | ) | | | (0.0 | )(a) |
| | | | | | | | | | | | | | | | |
Interactive Media & Services | | | | | | | | | | | | | |
Mixi, Inc. | | | 2,500 | | | | 54,625 | | | | (6,520 | ) | | | (0.0 | )(a) |
| | | | | | | | | | | | | | | | |
Oil, Gas & Consumable Fuels | | | | | | | | | | | | | |
JXTG Holdings, Inc. | | | 11,600 | | | | 78,381 | | | | (9,901 | ) | | | (0.1 | ) |
| | | | | | | | | | | | | | | | |
Pharmaceuticals | | | | | | | | | | | | | |
Astellas Pharma, Inc. | | | 5,100 | | | | 78,796 | | | | (8,764 | ) | | | (0.1 | ) |
Shionogi & Co. Ltd. | | | 1,300 | | | | 83,127 | | | | (1,922 | ) | | | (0.0 | )(a) |
| | | | | | | | | | | | | | | | |
| | | 6,400 | | | | 161,923 | | | | (10,686 | ) | | | (0.1 | ) |
| | | | | | | | | | | | | | | | |
Road & Rail | | | | | | | | | | | | | |
Sankyu, Inc. | | | 1,400 | | | | 65,988 | | | | (14,755 | ) | | | (0.1 | ) |
| | | | | | | | | | | | | | | | |
Technology Hardware, Storage & Peripherals | | | | | | | | | | | | | |
Brother Industries Ltd. | | | 4,500 | | | | 82,357 | | | | (5,854 | ) | | | (0.0 | )(a) |
| | | | | | | | | | | | | | | | |
Trading Companies & Distributors | | | | | | | | | | | | | |
ITOCHU Corp. | | | 4,700 | | | | 87,166 | | | | (6,516 | ) | | | (0.0 | )(a) |
Marubeni Corp. | | | 9,100 | | | | 73,789 | | | | (11,016 | ) | | | (0.1 | ) |
Sumitomo Corp. | | | 5,100 | | | | 77,350 | | | | (9,015 | ) | | | (0.0 | )(a) |
| | | | | | | | | | | | | | | | |
| | | 18,900 | | | | 238,305 | | | | (26,547 | ) | | | (0.1 | ) |
| | | | | | | | | | | | | | | | |
Wireless Telecommunication Services | | | | | | | | | | | | | |
NTT DOCOMO, Inc. | | | 3,200 | | | | 79,356 | | | | (5,463 | ) | | | (0.0 | )(a) |
| | | | | | | | | | | | | | | | |
Total Long Positions of Total Return Basket Swap | | | 99,000 | | | | 1,404,507 | | | | (143,357 | ) | | | (0.6 | ) |
| | | | | | | | | | | | | | | | |
| |
Short Positions | | | | | |
| | | |
Common Stocks | | | | | | | | | | | | | |
Chemicals | | | | | | | | | | | | | |
Kansai Paint Co. Ltd. | | | (3,300 | ) | | | (48,762 | ) | | | 5,981 | | | | 0.1 | |
Toray Industries, Inc. | | | (9,400 | ) | | | (66,677 | ) | | | 3,165 | | | | 0.0 | (a) |
| | | | | | | | | | | | | | | | |
| | | (12,700 | ) | | | (115,439 | ) | | | 9,146 | | | | 0.1 | |
| | | | | | | | | | | | | | | | |
Construction & Engineering | | | | | | | | | | | | | |
JGC Corp. | | | (3,000 | ) | | | (58,071 | ) | | | 8,586 | | | | 0.0 | (a) |
| | | | | | | | | | | | | | | | |
Consumer Finance | | | | | | | | | | | | | |
Aiful Corp.* | | | (22,600 | ) | | | (59,605 | ) | | | 7,353 | | | | 0.0 | (a) |
| | | | | | | | | | | | | | | | |
Electric Utilities | | | | | | | | | | | | | |
Hokkaido Electric Power Co., Inc. | | | (11,600 | ) | | | (67,701 | ) | | | 6,158 | | | | 0.0 | (a) |
| | | | | | | | | | | | | | | | |
Electrical Equipment | | | | | | | | | | | | | |
GS Yuasa Corp. | | | (2,700 | ) | | | (55,423 | ) | | | 6,518 | | | | 0.0 | (a) |
| | | | | | | | | | | | | | | | |
Electronic Equipment, Instruments & Components | | | | | | | | | | | | | |
Alps Electric Co. Ltd. | | | (1,400 | ) | | | (33,002 | ) | | | 3,205 | | | | 0.0 | (a) |
Murata Manufacturing Co. Ltd. | | | (400 | ) | | | (62,254 | ) | | | (2,768 | ) | | | (0.0 | )(a) |
| | | | | | | | | | | | | | | | |
| | | (1,800 | ) | | | (95,256 | ) | | | 437 | | | | 0.0 | (a) |
| | | | | | | | | | | | | | | | |
SEE NOTES TO FINANCIAL STATEMENTS.
| | | | | | |
| | | |
| 96 | | | | J.P. MORGAN EXCHANGE-TRADED FUNDS | | OCTOBER 31, 2018 |
| | | | | | | | | | | | | | | | |
| REFERENCE ENTITY | | SHARES | | | NOTIONAL
VALUE($) (1) | | | NET UNREALIZED
APPRECIATION
(DEPRECIATION)($) (2) | | | PERCENTAGE
OF NET
ASSETS (%) | |
Short Positions — continued | | | | | |
| | | |
Common Stocks — continued | | | | | | | | | | | | | |
Food & Staples Retailing | | | | | | | | | | | | | |
Aeon Co. Ltd. | | | (2,900 | ) | | | (66,561 | ) | | | 2,804 | | | | 0.0 | (a) |
Tsuruha Holdings, Inc. | | | (600 | ) | | | (62,622 | ) | | | 7,916 | | | | 0.1 | |
| | | | | | | | | | | | | | | | |
| | | (3,500 | ) | | | (129,183 | ) | | | 10,720 | | | | 0.1 | |
| | | | | | | | | | | | | | | | |
Food Products | | | | | | | | | | | | | |
Nissin Foods Holdings Co. Ltd. | | | (1,100 | ) | | | (70,927 | ) | | | 4,292 | | | | 0.0 | (a) |
| | | | | | | | | | | | | | | | |
Hotels, Restaurants & Leisure | | | | | | | | | | | | | |
HIS Co. Ltd. | | | (1,400 | ) | | | (42,639 | ) | | | 1,993 | | | | 0.0 | (a) |
| | | | | | | | | | | | | | | | |
Industrial Conglomerates | | | | | | | | | | | | | |
Keihan Holdings Co. Ltd. | | | (2,000 | ) | | | (75,893 | ) | | | 2,575 | | | | 0.0 | (a) |
Toshiba Corp.* | | | (2,400 | ) | | | (71,934 | ) | | | (963 | ) | | | (0.0 | )(a) |
| | | | | | | | | | | | | | | | |
| | | (4,400 | ) | | | (147,827 | ) | | | 1,612 | | | | 0.0 | (a) |
| | | | | | | | | | | | | | | | |
Interactive Media & Services | | | | | | | | | | | | | |
LINE Corp.* | | | (700 | ) | | | (22,317 | ) | | | 2,825 | | | | 0.0 | (a) |
Yahoo Japan Corp. | | | (19,300 | ) | | | (60,212 | ) | | | 6,539 | | | | 0.1 | |
| | | | | | | | | | | | | | | | |
| | | (20,000 | ) | | | (82,529 | ) | | | 9,364 | | | | 0.1 | |
| | | | | | | | | | | | | | | | |
IT Services | | | | | | | | | | | | | |
GMO internet, Inc. | | | (3,300 | ) | | | (47,158 | ) | | | 4,551 | | | | 0.0 | (a) |
| | | | | | | | | | | | | | | | |
Machinery | | | | | | | | | | | | | |
FANUC Corp. | | | (400 | ) | | | (69,587 | ) | | | 2,821 | | | | 0.0 | (a) |
| | | | | | | | | | | | | | | | |
Marine | | | | | | | | | | | | | |
Kawasaki Kisen Kaisha Ltd.* | | | (3,400 | ) | | | (45,307 | ) | | | 20,171 | | | | 0.1 | |
Mitsui OSK Lines Ltd. | | | (2,400 | ) | | | (58,331 | ) | | | 11,403 | | | | 0.1 | |
Nippon Yusen KK | | | (3,900 | ) | | | (62,891 | ) | | | 9,330 | | | | 0.0 | (a) |
| | | | | | | | | | | | | | | | |
| | | (9,700 | ) | | | (166,529 | ) | | | 40,904 | | | | 0.2 | |
| | | | | | | | | | | | | | | | |
Multiline Retail | | | | | | | | | | | | | |
Don Quijote Holdings Co. Ltd. | | | (900 | ) | | | (53,763 | ) | | | 848 | | | | 0.0 | (a) |
Marui Group Co. Ltd. | | | (2,000 | ) | | | (43,064 | ) | | | 2,190 | | | | 0.0 | (a) |
| | | | | | | | | | | | | | | | |
| | | (2,900 | ) | | | (96,827 | ) | | | 3,038 | | | | 0.0 | (a) |
| | | | | | | | | | | | | | | | |
Road & Rail | | | | | | | | | | | | | |
Keio Corp. | | | (1,300 | ) | | | (70,608 | ) | | | 2,467 | | | | 0.0 | (a) |
Odakyu Electric Railway Co. Ltd. | | | (2,900 | ) | | | (61,308 | ) | | | 7,422 | | | | 0.1 | |
Tokyu Corp. | | | (3,700 | ) | | | (61,126 | ) | | | 4,264 | | | | 0.0 | (a) |
| | | | | | | | | | | | | | | | |
| | | (7,900 | ) | | | (193,042 | ) | | | 14,153 | | | | 0.1 | |
| | | | | | | | | | | | | | | | |
Semiconductors & Semiconductor Equipment | | | | | | | | | | | | | |
Renesas Electronics Corp.* | | | (4,900 | ) | | | (25,813 | ) | | | 4,724 | | | | 0.0 | (a) |
| | | | | | | | | | | | | | | | |
Trading Companies & Distributors | | | | | | | | | | | | | |
MonotaRO Co. Ltd. | | | (2,500 | ) | | | (55,117 | ) | | | 12,022 | | | | 0.1 | |
| | | | | | | | | | | | | | | | |
Transportation Infrastructure | | | | | | | | | | | | | |
Mitsubishi Logistics Corp. | | | (2,700 | ) | | | (61,899 | ) | | | 7,833 | | | | 0.0 | (a) |
| | | | | | | | | | | | | | | | |
Total Short Positions of Total Return Basket Swap | | | (119,100 | ) | | | (1,640,572 | ) | | | 156,225 | | | | 0.7 | |
| | | | | | | | | | | | | | | | |
Total of Long and Short Positions of Total Return Basket Swap | | | (20,100 | ) | | | (236,065 | ) | | | 12,868 | | | | 0.1 | |
| | | | | | | | | | | | | | | | |
SEE NOTES TO FINANCIAL STATEMENTS.
| | | | | | | | |
| | | |
| OCTOBER 31, 2018 | | J.P. MORGAN EXCHANGE-TRADED FUNDS | | | | | 97 | |
JPMorgan Long/Short ETF
SCHEDULE OF PORTFOLIO INVESTMENTS
AS OF OCTOBER 31, 2018 (continued)
| | | | | | | | | | | | | | | | | | | | |
| COUNTERPARTY | | DESCRIPTION | | TERMINATION
DATE | | NOTIONAL
VALUE (1) | | | NET UNREALIZED
APPRECIATION
(DEPRECIATION) (2) | | | NET CASH
AND OTHER
RECEIVABLES
(PAYABLES) | | | VALUE | |
| Bank of America | | The Fund receives the total return on a portfolio of long and short equity positions and pays or receives the net of one month BBR on long positions and short positions respectively, plus or minus a specified spread (rates range from (0.35)% to 0.35%), which is denominated in AUD based on the local currencies of the positions within the swaps. | | 2/25/2019 | | $ | 99,080 | | | $ | (26,725 | ) | | $ | (1,477 | ) | | $ | (28,202 | ) |
| | | | | | | | | | | | | | | | | | | | |
| | | | | | | | | | | | | | | | |
| REFERENCE ENTITY | | SHARES | | | NOTIONAL
VALUE($) (1) | | | NET UNREALIZED
APPRECIATION
(DEPRECIATION)($) (2) | | | PERCENTAGE
OF NET
ASSETS (%) | |
Long Positions | | | | | |
| | | |
Common Stocks | | | | | | | | | | | | | |
Food & Staples Retailing | | | | | | | | | | | | | |
Metcash Ltd. | | | 37,412 | | | | 73,120 | | | | (5,025 | ) | | | (0.0 | )(a) |
| | | | | | | | | | | | | | | | |
Metals & Mining | | | | | | | | | | | | | |
Sandfire Resources NL | | | 14,754 | | | | 69,763 | | | | (3,458 | ) | | | (0.0 | )(a) |
| | | | | | | | | | | | | | | | |
Oil, Gas & Consumable Fuels | | | | | | | | | | | | | |
Beach Energy Ltd. | | | 62,678 | | | | 78,072 | | | | (9,804 | ) | | | (0.0 | )(a) |
Whitehaven Coal Ltd. | | | 21,030 | | | | 72,643 | | | | (10,757 | ) | | | (0.1 | ) |
| | | | | | | | | | | | | | | | |
| | | 83,708 | | | | 150,715 | | | | (20,561 | ) | | | (0.1 | ) |
| | | | | | | | | | | | | | | | |
Total Long Positions of Total Return Basket Swap | | | 135,874 | | | | 293,598 | | | | (29,044 | ) | | | (0.1 | ) |
| | | | | | | | | | | | | | | | |
| |
Short Positions | | | | | |
| | | |
Common Stocks | | | | | | | | | | | | | |
Building Products | | | | | | | | | | | | | |
Reliance Worldwide Corp. Ltd. | | | (20,793 | ) | | | (74,076 | ) | | | (5,499 | ) | | | (0.0 | )(a) |
| | | | | | | | | | | | | | | | |
Chemicals | | | | | | | | | | | | | |
Nufarm Ltd. | | | (14,282 | ) | | | (57,755 | ) | | | 1,684 | | | | 0.0 | (a) |
| | | | | | | | | | | | | | | | |
IT Services | | | | | | | | | | | | | |
NEXTDC Ltd.* | | | (14,996 | ) | | | (62,687 | ) | | | 6,134 | | | | 0.0 | (a) |
| | | | | | | | | | | | | | | | |
Total Short Positions of Total Return Basket Swap | | | (50,071 | ) | | | (194,518 | ) | | | 2,319 | | | | 0.0 | (a) |
| | | | | | | | | | | | | | | | |
Total of Long and Short Positions of Total Return Basket Swap | | | 85,803 | | | | 99,080 | | | | (26,725 | ) | | | (0.1 | ) |
| | | | | | | | | | | | | | | | |
| | | | | | | | | | | | | | | | | | | | |
| COUNTERPARTY | | DESCRIPTION | | TERMINATION
DATE | | NOTIONAL
VALUE (1) | | | NET UNREALIZED
APPRECIATION
(DEPRECIATION) (2) | | | NET CASH
AND OTHER
RECEIVABLES
(PAYABLES) | | | VALUE | |
| Goldman Sachs | | The Fund receives the total return on a portfolio of long and short equity positions and pays or receives the net of one day SONIA and one month LIBOR on long positions and short positions respectively, plus or minus a specified spread (rates range from (2.25) % to 0.30%), which is denominated in GBP based on the local currencies of the positions within the swaps. | | 11/14/2018 —
9/29/2028 | | $ | (43,295 | ) | | $ | 220 | | | $ | 27,260 | | | $ | 27,480 | |
| | | | | | | | | | | | | | | | | | | | |
SEE NOTES TO FINANCIAL STATEMENTS.
| | | | | | |
| | | |
| 98 | | | | J.P. MORGAN EXCHANGE-TRADED FUNDS | | OCTOBER 31, 2018 |
| | | | | | | | | | | | | | | | |
| REFERENCE ENTITY | | SHARES | | | NOTIONAL
VALUE($) (1) | | | NET UNREALIZED
APPRECIATION
(DEPRECIATION)($) (2) | | | PERCENTAGE
OF NET
ASSETS (%) | |
Long Positions | | | | | |
| | | |
Common Stocks | | | | | | | | | | | | | |
Aerospace & Defense | | | | | | | | | | | | | |
Meggitt plc | | | 11,110 | | | | 75,166 | | | | 2,680 | | | | 0.0 | (a) |
| | | | | | | | | | | | | | | | |
Air Freight & Logistics | | | | | | | | | | | | | |
Royal Mail plc | | | 14,805 | | | | 67,969 | | | | 2,653 | | | | 0.0 | (a) |
| | | | | | | | | | | | | | | | |
Airlines | | | | | | | | | |
Wizz Air Holdings plc* (b) | | | 412 | | | | 13,513 | | | | 1,089 | | | | 0.0 | (a) |
| | | | | | | | | | | | | | | | |
Distributors | | | | | | | | | |
Inchcape plc | | | 6,937 | | | | 47,911 | | | | (6,642 | ) | | | (0.0 | )(a) |
| | | | | | | | | | | | | | | | |
Energy Equipment & Services | | | | | | | | | |
Hunting plc | | | 8,282 | | | | 71,063 | | | | (8,028 | ) | | | (0.0 | )(a) |
| | | | | | | | | | | | | | | | |
Food & Staples Retailing | | | | | | | | | |
J Sainsbury plc | | | 19,551 | | | | 77,677 | | | | (242 | ) | | | (0.0 | )(a) |
Wm Morrison Supermarkets plc | | | 23,697 | | | | 75,077 | | | | 377 | | | | 0.0 | (a) |
| | | | | | | | | | | | | | | | |
| | | 43,248 | | | | 152,754 | | | | 135 | | | | 0.0 | (a) |
| | | | | | | | | | | | | | | | |
Food Products | | | | | | | | | |
Tate & Lyle plc | | | 9,234 | | | | 79,395 | | | | 2,751 | | | | 0.0 | (a) |
| | | | | | | | | | | | | | | | |
Hotels, Restaurants & Leisure | | | | | | | | | |
William Hill plc | | | 5,215 | | | | 14,019 | | | | (1,528 | ) | | | (0.0 | )(a) |
| | | | | | | | | | | | | | | | |
Machinery | | | | | | | | | |
Bodycote plc | | | 7,433 | | | | 75,484 | | | | 8 | | | | 0.0 | (a) |
Vesuvius plc | | | 9,673 | | | | 67,112 | | | | (3,598 | ) | | | (0.0 | )(a) |
| | | | | | | | | | | | | | | | |
| | | 17,106 | | | | 142,596 | | | | (3,590 | ) | | | (0.0 | )(a) |
| | | | | | | | | | | | | | | | |
Metals & Mining | | | | | | | | | |
Antofagasta plc | | | 7,673 | | | | 76,807 | | | | 289 | | | | 0.0 | (a) |
Centamin plc | | | 22,169 | | | | 28,152 | | | | 2,491 | | | | 0.0 | (a) |
Rio Tinto plc | | | 99 | | | | 4,807 | | | | 193 | | | | 0.0 | (a) |
| | | | | | | | | | | | | | | | |
| | | 29,941 | | | | 109,766 | | | | 2,973 | | | | 0.0 | (a) |
| | | | | | | | | | | | | | | | |
Oil, Gas & Consumable Fuels | | | | | | | | | |
BP plc | | | 11,148 | | | | 80,530 | | | | (708 | ) | | | (0.0 | )(a) |
Royal Dutch Shell plc | | | 2,314 | | | | 75,466 | | | | (1,508 | ) | | | (0.0 | )(a) |
Tullow Oil plc* | | | 23,820 | | | | 68,341 | | | | (8,434 | ) | | | (0.1 | ) |
| | | | | | | | | | | | | | | | |
| | | 37,282 | | | | 224,337 | | | | (10,650 | ) | | | (0.1 | ) |
| | | | | | | | | | | | | | | | |
Pharmaceuticals | | | | | | | | | |
Hikma Pharmaceuticals plc | | | 3,280 | | | | 79,556 | | | | 3,255 | | | | 0.0 | (a) |
| | | | | | | | | | | | | | | | |
Total Long Positions of Total Return Basket Swap | | | 186,852 | | | | 1,078,045 | | | | (14,902 | ) | | | (0.1 | ) |
| | | | | | | | | | | | | | | | |
| |
Short Positions | | | | | |
| | | |
Common Stocks | | | | | | | | | | | | | |
Banks | | | | | | | | | | | | | |
Metro Bank plc* | | | (1,647 | ) | | | (46,739 | ) | | | 10,341 | | | | 0.1 | |
| | | | | | | | | | | | | | | | |
Containers & Packaging | | | | | | | | | | | | | |
DS Smith plc | | | (11,188 | ) | | | (56,137 | ) | | | 3,831 | | | | 0.0 | (a) |
RPC Group plc | | | (6,301 | ) | | | (61,417 | ) | | | 2,158 | | | | 0.0 | (a) |
| | | | | | | | | | | | | | | | |
| | | (17,489 | ) | | | (117,554 | ) | | | 5,989 | | | | 0.0 | (a) |
| | | | | | | | | | | | | | | | |
SEE NOTES TO FINANCIAL STATEMENTS.
| | | | | | | | |
| | | |
| OCTOBER 31, 2018 | | J.P. MORGAN EXCHANGE-TRADED FUNDS | | | | | 99 | |
JPMorgan Long/Short ETF
SCHEDULE OF PORTFOLIO INVESTMENTS
AS OF OCTOBER 31, 2018 (continued)
| | | | | | | | | | | | | | | | |
| REFERENCE ENTITY | | SHARES | | | NOTIONAL
VALUE($) (1) | | | NET UNREALIZED
APPRECIATION
(DEPRECIATION)($) (2) | | | PERCENTAGE
OF NET
ASSETS (%) | |
Short Positions — continued | | | | | |
| | | |
Common Stocks — continued | | | | | | | | | | | | | |
Diversified Telecommunication Services | | | | | | | | | | | | | |
BT Group plc | | | (25,092 | ) | | | (76,832 | ) | | | (856 | ) | | | (0.0 | )(a) |
Inmarsat plc | | | (10,239 | ) | | | (59,544 | ) | | | 7,355 | | | | 0.0 | (a) |
| | | | | | | | | | | | | | | | |
| | | (35,331 | ) | | | (136,376 | ) | | | 6,499 | | | | 0.0 | (a) |
| | | | | | | | | | | | | | | | |
Electrical Equipment | | | | | | | | | | | | | |
Melrose Industries plc | | | (25,537 | ) | | | (54,971 | ) | | | 1,997 | | | | 0.0 | (a) |
| | | | | | | | | | | | | | | | |
Energy Equipment & Services | | | | | | | | | | | | | |
John Wood Group plc | | | (6,865 | ) | | | (62,569 | ) | | | 4,132 | | | | 0.0 | (a) |
| | | | | | | | | | | | | | | | |
Health Care Providers & Services | | | | | | | | | | | | | |
NMC Health plc | | | (1,488 | ) | | | (67,093 | ) | | | (7,419 | ) | | | (0.0 | )(a) |
Spire Healthcare Group plc (b) | | | (48,428 | ) | | | (72,672 | ) | | | 3,928 | | | | 0.0 | (a) |
| | | | | | | | | | | | | | | | |
| | | (49,916 | ) | | | (139,765 | ) | | | (3,491 | ) | | | (0.0 | )(a) |
| | | | | | | | | | | | | | | | |
Hotels, Restaurants & Leisure | | | | | | | | | | | | | |
Merlin Entertainments plc (b) | | | (230 | ) | | | (950 | ) | | | 173 | | | | 0.0 | (a) |
| | | | | | | | | | | | | | | | |
Household Durables | | | | | | | | | | | | | |
Crest Nicholson Holdings plc | | | (9,700 | ) | | | (42,254 | ) | | | (627 | ) | | | (0.0 | )(a) |
| | | | | | | | | | | | | | | | |
Metals & Mining | | | | | | | | | | | | | |
Fresnillo plc | | | (1,395 | ) | | | (15,128 | ) | | | (1,448 | ) | | | (0.0 | )(a) |
| | | | | | | | | | | | | | | | |
Multi-Utilities | | | | | | | | | | | | | |
National Grid plc | | | (6,804 | ) | | | (71,878 | ) | | | (1,666 | ) | | | (0.0 | )(a) |
| | | | | | | | | | | | | | | | |
Professional Services | | | | | | | | | | | | | |
Capita plc* | | | (36,863 | ) | | | (60,372 | ) | | | (1,147 | ) | | | (0.0 | )(a) |
| | | | | | | | | | | | | | | | |
Real Estate Management & Development | | | | | | | | | | | | | |
Capital & Counties Properties plc | | | (19,772 | ) | | | (63,085 | ) | | | (1,552 | ) | | | (0.0 | )(a) |
| | | | | | | | | | | | | | | | |
Software | | | | | | | | | | | | | |
AVEVA Group plc | | | (1,775 | ) | | | (59,374 | ) | | | (1,220 | ) | | | (0.0 | )(a) |
Sage Group plc (The) | | | (9,769 | ) | | | (67,923 | ) | | | 1,576 | | | | 0.0 | (a) |
| | | | | | | | | | | | | | | | |
| | | (11,544 | ) | | | (127,297 | ) | | | 356 | | | | 0.0 | (a) |
| | | | | | | | | | | | | | | | |
Specialty Retail | | | | | | | | | | | | | |
Kingfisher plc | | | (14,140 | ) | | | (45,915 | ) | | | 1,370 | | | | 0.0 | (a) |
| | | | | | | | | | | | | | | | |
Trading Companies & Distributors | | | | | | | | | | | | | |
Travis Perkins plc | | | (4,658 | ) | | | (65,788 | ) | | | (6,565 | ) | | | (0.0 | )(a) |
| | | | | | | | | | | | | | | | |
Water Utilities | | | | | | | | | | | | | |
Severn Trent plc | | | (2,975 | ) | | | (70,699 | ) | | | 761 | | | | 0.0 | (a) |
| | | | | | | | | | | | | | | | |
Total Short Positions of Total Return Basket Swap | | | (244,866 | ) | | | (1,121,340 | ) | | | 15,122 | | | | 0.1 | |
| | | | | | | | | | | | | | | | |
Total of Long and Short Positions of Total Return Basket Swap | | | (58,014 | ) | | | (43,295 | ) | | | 220 | | | | 0.0 | (a) |
| | | | | | | | | | | | | | | | |
SEE NOTES TO FINANCIAL STATEMENTS.
| | | | | | |
| | | |
| 100 | | | | J.P. MORGAN EXCHANGE-TRADED FUNDS | | OCTOBER 31, 2018 |
| | | | | | | | | | | | | | | | | | | | |
| COUNTERPARTY | | DESCRIPTION | | TERMINATION
DATE | | NOTIONAL VALUE (1) | | | NET UNREALIZED
APPRECIATION
(DEPRECIATION) (2) | | | NET CASH
AND OTHER
RECEIVABLES
(PAYABLES) | | | VALUE | |
| Goldman Sachs | | The Fund receives the total return on a portfolio of short equity positions and pays or receives the net of one day FEDEF on short positions, plus or minus a specified spread (rates range from (7.27)% to (0.20)%), which is denominated in USD based on the local currencies of the positions within the swaps. | | 5/24/2028 —
10/26/2028 | | $ | (5,811,114 | ) | | $ | 174,364 | | | $ | 507,792 | | | $ | 682,156 | |
| | | | | | | | | | | | | | | | | | | | |
| | | | | | | | | | | | | | | | |
| REFERENCE ENTITY | | SHARES | | | NOTIONAL
VALUE($) (1) | | | NET UNREALIZED
APPRECIATION
(DEPRECIATION)($) (2) | | | PERCENTAGE
OF NET
ASSETS (%) | |
Short Positions | | | | | |
| | | |
Common Stocks | | | | | | | | | | | | | |
Aerospace & Defense | | | | | | | | | | | | | |
Cubic Corp. | | | (1,068 | ) | | | (70,072 | ) | | | 2,445 | | | | 0.0 | (a) |
Kratos Defense & Security Solutions, Inc.* | | | (4,647 | ) | | | (58,227 | ) | | | 3,020 | | | | 0.0 | (a) |
Mercury Systems, Inc.* | | | (1,268 | ) | | | (59,418 | ) | | | 6,201 | | | | 0.1 | |
Triumph Group, Inc. | | | (3,025 | ) | | | (55,206 | ) | | | 3,298 | | | | 0.0 | (a) |
| | | | | | | | | | | | | | | | |
| | | (10,008 | ) | | | (242,923 | ) | | | 14,964 | | | | 0.1 | |
| | | | | | | | | | | | | | | | |
Air Freight & Logistics | | | | | | | | | | | | | |
Air Transport Services Group, Inc.* | | | (3,304 | ) | | | (64,758 | ) | | | 5,915 | | | | 0.0 | (a) |
United Parcel Service, Inc. | | | (651 | ) | | | (69,358 | ) | | | 6,581 | | | | 0.1 | |
| | | | | | | | | | | | | | | | |
| | | (3,955 | ) | | | (134,116 | ) | | | 12,496 | | | | 0.1 | |
| | | | | | | | | | | | | | | | |
Airlines | | | | | | | | | | | | | |
American Airlines Group, Inc. | | | (1,679 | ) | | | (58,899 | ) | | | (5,826 | ) | | | (0.0 | )(a) |
| | | | | | | | | | | | | | | | |
Auto Components | | | | | | | | | | | | | |
Cooper Tire & Rubber Co. | | | (1,865 | ) | | | (57,610 | ) | | | (11,862 | ) | | | (0.0 | )(a) |
| | | | | | | | | | | | | | | | |
Banks | | | | | | | | | | | | | |
First Republic Bank | | | (740 | ) | | | (67,333 | ) | | | 1,398 | | | | 0.0 | (a) |
| | | | | | | | | | | | | | | | |
Beverages | | | | | | | | | | | | | |
Brown-Forman Corp. | | | (1,400 | ) | | | (64,876 | ) | | | 1,288 | | | | 0.0 | (a) |
National Beverage Corp.* | | | (680 | ) | | | (62,866 | ) | | | 5,630 | | | | 0.0 | (a) |
| | | | | | | | | | | | | | | | |
| | | (2,080 | ) | | | (127,742 | ) | | | 6,918 | | | | 0.0 | (a) |
| | | | | | | | | | | | | | | | |
Capital Markets | | | | | | | | | | | | | |
Cboe Global Markets, Inc. | | | (708 | ) | | | (79,898 | ) | | | (7,710 | ) | | | (0.0 | )(a) |
MarketAxess Holdings, Inc. | | | (352 | ) | | | (73,804 | ) | | | (8,047 | ) | | | (0.1 | ) |
WisdomTree Investments, Inc. | | | (8,171 | ) | | | (63,488 | ) | | | (3,104 | ) | | | (0.0 | )(a) |
| | | | | | | | | | | | | | | | |
| | | (9,231 | ) | | | (217,190 | ) | | | (18,861 | ) | | | (0.1 | ) |
| | | | | | | | | | | | | | | | |
Chemicals | | | | | | | | | | | | | |
Albemarle Corp. | | | (678 | ) | | | (67,271 | ) | | | (2,407 | ) | | | (0.0 | )(a) |
GCP Applied Technologies, Inc.* | | | (2,614 | ) | | | (67,885 | ) | | | (2,718 | ) | | | (0.0 | )(a) |
International Flavors & Fragrances, Inc. | | | (506 | ) | | | (73,198 | ) | | | (5,394 | ) | | | (0.1 | ) |
PQ Group Holdings, Inc.* | | | (4,313 | ) | | | (69,224 | ) | | | (2,114 | ) | | | (0.0 | )(a) |
| | | | | | | | | | | | | | | | |
| | | (8,111 | ) | | | (277,578 | ) | | | (12,633 | ) | | | (0.1 | ) |
| | | | | | | | | | | | | | | | |
Commercial Services & Supplies | | | | | | | | | | | | | |
ABM Industries, Inc. | | | (2,056 | ) | | | (63,222 | ) | | | 3,331 | | | | 0.0 | (a) |
| | | | | | | | | | | | | | | | |
SEE NOTES TO FINANCIAL STATEMENTS.
| | | | | | | | |
| | | |
| OCTOBER 31, 2018 | | J.P. MORGAN EXCHANGE-TRADED FUNDS | | | | | 101 | |
JPMorgan Long/Short ETF
SCHEDULE OF PORTFOLIO INVESTMENTS
AS OF OCTOBER 31, 2018 (continued)
| | | | | | | | | | | | | | | | |
| REFERENCE ENTITY | | SHARES | | | NOTIONAL
VALUE($) (1) | | | NET UNREALIZED
APPRECIATION
(DEPRECIATION)($) (2) | | | PERCENTAGE
OF NET
ASSETS (%) | |
Short Positions — continued | | | | | |
| | | |
Common Stocks — continued | | | | | | | | | | | | | |
Communications Equipment | | | | | | | | | | | | | |
Acacia Communications, Inc.* | | | (1,687 | ) | | | (58,151 | ) | | | 3,441 | | | | 0.0 | (a) |
ADTRAN, Inc. | | | (3,784 | ) | | | (50,857 | ) | | | 13,698 | | | | 0.0 | (a) |
Extreme Networks, Inc.* | | | (11,975 | ) | | | (66,461 | ) | | | (8,023 | ) | | | (0.0 | )(a) |
Finisar Corp.* | | | (4,036 | ) | | | (67,361 | ) | | | (767 | ) | | | (0.0 | )(a) |
Infinera Corp.* | | | (3,137 | ) | | | (17,379 | ) | | | 910 | | | | 0.0 | (a) |
| | | | | | | | | | | | | | | | |
| | | (24,619 | ) | | | (260,209 | ) | | | 9,259 | | | | 0.0 | (a) |
| | | | | | | | | | | | | | | | |
Construction Materials | | | | | | | | | | | | | |
Summit Materials, Inc.* | | | (3,888 | ) | | | (52,488 | ) | | | 10,886 | | | | 0.0 | (a) |
| | | | | | | | | | | | | | | | |
Distributors | | | | | | | | | | | | | |
Core-Mark Holding Co., Inc. | | | (569 | ) | | | (21,855 | ) | | | (2,458 | ) | | | (0.0 | )(a) |
| | | | | | | | | | | | | | | | |
Diversified Telecommunication Services | | | | | | | | | | | | | |
Cincinnati Bell, Inc.* | | | (4,445 | ) | | | (63,075 | ) | | | 2,800 | | | | 0.0 | (a) |
Zayo Group Holdings, Inc.* | | | (1,983 | ) | | | (59,252 | ) | | | 3,292 | | | | 0.0 | (a) |
| | | | | | | | | | | | | | | | |
| | | (6,428 | ) | | | (122,327 | ) | | | 6,092 | | | | 0.0 | (a) |
| | | | | | | | | | | | | | | | |
Electronic Equipment, Instruments & Components | | | | | | | | | | | | | |
Cognex Corp. | | | (1,201 | ) | | | (51,451 | ) | | | 3,327 | | | | 0.0 | (a) |
Fitbit, Inc.* | | | (12,276 | ) | | | (58,065 | ) | | | (982 | ) | | | (0.0 | )(a) |
| | | | | | | | | | | | | | | | |
| | | (13,477 | ) | | | (109,516 | ) | | | 2,345 | | | | 0.0 | (a) |
| | | | | | | | | | | | | | | | |
Energy Equipment & Services | | | | | | | | | | | | | |
C&J Energy Services, Inc.* | | | (3,142 | ) | | | (59,007 | ) | | | 5,215 | | | | 0.0 | (a) |
Ensco plc | | | (8,269 | ) | | | (59,041 | ) | | | 12,238 | | | | 0.1 | |
Keane Group, Inc.* | | | (6,077 | ) | | | (76,388 | ) | | | (1,519 | ) | | | (0.0 | )(a) |
Patterson-UTI Energy, Inc. | | | (3,949 | ) | | | (65,711 | ) | | | 435 | | | | 0.0 | (a) |
Weatherford International plc* | | | (6,869 | ) | | | (9,273 | ) | | | 8,586 | | | | 0.0 | (a) |
| | | | | | | | | | | | | | | | |
| | | (28,306 | ) | | | (269,420 | ) | | | 24,955 | | | | 0.1 | |
| | | | | | | | | | | | | | | | |
Equity Real Estate Investment Trusts (REITs) | | | | | | | | | | | | | |
Alexander & Baldwin, Inc. | | | (3,241 | ) | | | (63,329 | ) | | | 3,630 | | | | 0.0 | (a) |
| | | | | | | | | | | | | | | | |
Food Products | | | | | | | | | | | | | |
Kraft Heinz Co. (The) | | | (1,236 | ) | | | (67,943 | ) | | | 952 | | | | 0.0 | (a) |
| | | | | | | | | | | | | | | | |
Gas Utilities | | | | | | | | | | | | | |
Southwest Gas Holdings, Inc. | | | (946 | ) | | | (73,097 | ) | | | 3,936 | | | | 0.0 | (a) |
Spire, Inc. | | | (1,029 | ) | | | (74,685 | ) | | | 1,934 | | | | 0.0 | (a) |
| | | | | | | | | | | | | | | | |
| | | (1,975 | ) | | | (147,782 | ) | | | 5,870 | | | | 0.0 | (a) |
| | | | | | | | | | | | | | | | |
Health Care Equipment & Supplies | | | | | | | | | | | | | |
Hologic, Inc.* | | | (1,783 | ) | | | (69,519 | ) | | | 2,799 | | | | 0.0 | (a) |
iRhythm Technologies, Inc.* | | | (722 | ) | | | (55,782 | ) | | | 2,844 | | | | 0.0 | (a) |
Nevro Corp.* | | | (267 | ) | | | (13,019 | ) | | | 235 | | | | 0.0 | (a) |
Penumbra, Inc.* | | | (446 | ) | | | (60,656 | ) | | | (2,230 | ) | | | (0.0 | )(a) |
ViewRay, Inc.* | | | (8,643 | ) | | | (74,762 | ) | | | (5,383 | ) | | | (0.0 | )(a) |
| | | | | | | | | | | | | | | | |
| | | (11,861 | ) | | | (273,738 | ) | | | (1,735 | ) | | | (0.0 | )(a) |
| | | | | | | | | | | | | | | | |
Health Care Technology | | | | | | | | | | | | | |
Evolent Health, Inc.* | | | (2,410 | ) | | | (53,502 | ) | | | 7,784 | | | | 0.0 | (a) |
Medidata Solutions, Inc.* | | | (912 | ) | | | (64,114 | ) | | | (4,123 | ) | | | (0.0 | )(a) |
Omnicell, Inc.* | | | (983 | ) | | | (69,498 | ) | | | (6,930 | ) | | | (0.0 | )(a) |
Teladoc Health, Inc.* | | | (863 | ) | | | (59,840 | ) | | | (5,100 | ) | | | (0.0 | )(a) |
| | | | | | | | | | | | | | | | |
| | | (5,168 | ) | | | (246,954 | ) | | | (8,369 | ) | | | (0.0 | )(a) |
| | | | | | | | | | | | | | | | |
SEE NOTES TO FINANCIAL STATEMENTS.
| | | | | | |
| | | |
| 102 | | | | J.P. MORGAN EXCHANGE-TRADED FUNDS | | OCTOBER 31, 2018 |
| | | | | | | | | | | | | | | | |
| REFERENCE ENTITY | | SHARES | | | NOTIONAL
VALUE($) (1) | | | NET UNREALIZED
APPRECIATION
(DEPRECIATION)($) (2) | | | PERCENTAGE
OF NET
ASSETS (%) | |
Short Positions — continued | | | | | |
| | | |
Common Stocks — continued | | | | | | | | | | | | | |
Hotels, Restaurants & Leisure | | | | | | | | | | | | | |
Caesars Entertainment Corp.* | | | (580 | ) | | | (4,982 | ) | | | 296 | | | | 0.0 | (a) |
Eldorado Resorts, Inc.* | | | (1,069 | ) | | | (39,019 | ) | | | 9,856 | | | | 0.1 | |
Golden Entertainment, Inc.* | | | (3,079 | ) | | | (55,945 | ) | | | 8,223 | | | | 0.0 | (a) |
| | | | | | | | | | | | | | | | |
| | | (4,728 | ) | | | (99,946 | ) | | | 18,375 | | | | 0.1 | |
| | | | | | | | | | | | | | | | |
Household Durables | | | | | | | | | | | | | |
Installed Building Products, Inc.* | | | (1,147 | ) | | | (34,938 | ) | | | 6,859 | | | | 0.0 | (a) |
Mohawk Industries, Inc.* | | | (283 | ) | | | (35,298 | ) | | | 9,877 | | | | 0.1 | |
| | | | | | | | | | | | | | | | |
| | | (1,430 | ) | | | (70,236 | ) | | | 16,736 | | | | 0.1 | |
| | | | | | | | | | | | | | | | |
Household Products | | | | | | | | | | | | | |
Spectrum Brands Holdings, Inc. | | | (964 | ) | | | (62,612 | ) | | | 2,930 | | | | 0.0 | (a) |
| | | | | | | | | | | | | | | | |
Insurance | | | | | | | | | | | | | |
Alleghany Corp. | | | (120 | ) | | | (72,082 | ) | | | 2,602 | | | | 0.0 | (a) |
Arch Capital Group Ltd.* | | | (2,548 | ) | | | (72,287 | ) | | | (714 | ) | | | (0.0 | )(a) |
Markel Corp.* | | | (65 | ) | | | (71,060 | ) | | | 4,278 | | | | 0.0 | (a) |
ProAssurance Corp. | | | (1,449 | ) | | | (63,640 | ) | | | 2,434 | | | | 0.0 | (a) |
Willis Towers Watson plc | | | (488 | ) | | | (69,862 | ) | | | (1,815 | ) | | | (0.0 | )(a) |
| | | | | | | | | | | | | | | | |
| | | (4,670 | ) | | | (348,931 | ) | | | 6,785 | | | | 0.0 | (a) |
| | | | | | | | | | | | | | | | |
Interactive Media & Services | | | | | | | | | | | | | |
TrueCar, Inc.* | | | (4,833 | ) | | | (55,000 | ) | | | 5,751 | | | | 0.0 | (a) |
| | | | | | | | | | | | | | | | |
IT Services | | | | | | | | | | | | | |
InterXion Holding NV* | | | (1,123 | ) | | | (66,111 | ) | | | 2,718 | | | | 0.0 | (a) |
Twilio, Inc.* | | | (809 | ) | | | (60,853 | ) | | | (5,825 | ) | | | (0.0 | )(a) |
| | | | | | | | | | | | | | | | |
| | | (1,932 | ) | | | (126,964 | ) | | | (3,107 | ) | | | (0.0 | )(a) |
| | | | | | | | | | | | | | | | |
Machinery | | | | | | | | | | | | | |
Albany International Corp. | | | (866 | ) | | | (60,603 | ) | | | 1,541 | | | | 0.0 | (a) |
CIRCOR International, Inc.* | | | (1,437 | ) | | | (46,717 | ) | | | 13,651 | | | | 0.1 | |
Evoqua Water Technologies Corp.* | | | (3,484 | ) | | | (33,446 | ) | | | 23,831 | | | | 0.1 | |
John Bean Technologies Corp. | | | (573 | ) | | | (59,575 | ) | | | 2,693 | | | | 0.0 | (a) |
Mueller Water Products, Inc. | | | (6,062 | ) | | | (62,196 | ) | | | 5,395 | | | | 0.0 | (a) |
REV Group, Inc. | | | (6,052 | ) | | | (66,027 | ) | | | 11,358 | | | | 0.1 | |
| | | | | | | | | | | | | | | | |
| | | (18,474 | ) | | | (328,564 | ) | | | 58,469 | | | | 0.3 | |
| | | | | | | | | | | | | | | | |
Media | | | | | | | | | | | | | |
Altice USA, Inc. | | | (2,835 | ) | | | (46,239 | ) | | | 4,508 | | | | 0.0 | (a) |
Charter Communications, Inc.* | | | (167 | ) | | | (53,502 | ) | | | (1,710 | ) | | | (0.0 | )(a) |
EW Scripps Co. (The) | | | (2,938 | ) | | | (49,417 | ) | | | (1,351 | ) | | | (0.0 | )(a) |
Liberty Global plc* | | | (1,696 | ) | | | (43,468 | ) | | | (780 | ) | | | (0.0 | )(a) |
| | | | | | | | | | | | | | | | |
| | | (7,636 | ) | | | (192,626 | ) | | | 667 | | | | 0.0 | (a) |
| | | | | | | | | | | | | | | | |
Metals & Mining | | | | | | | | | | | | | |
AK Steel Holding Corp.* | | | (150 | ) | | | (555 | ) | | | 131 | | | | 0.0 | (a) |
Coeur Mining, Inc.* | | | (4,563 | ) | | | (21,811 | ) | | | 1,871 | | | | 0.0 | (a) |
Constellium NV* | | | (5,663 | ) | | | (51,307 | ) | | | 7,418 | | | | 0.1 | |
Hecla Mining Co. | | | (2,118 | ) | | | (5,083 | ) | | | 826 | | | | 0.0 | (a) |
TimkenSteel Corp.* | | | (675 | ) | | | (7,851 | ) | | | 1,668 | | | | 0.0 | (a) |
| | | | | | | | | | | | | | | | |
| | | (13,169 | ) | | | (86,607 | ) | | | 11,914 | | | | 0.1 | |
| | | | | | | | | | | | | | | | |
Oil, Gas & Consumable Fuels | | | | | | | | | | | | | |
Extraction Oil & Gas, Inc.* | | | (1,477 | ) | | | (11,801 | ) | | | 3,840 | | | | 0.0 | (a) |
Golar LNG Ltd. | | | (2,436 | ) | | | (65,236 | ) | | | (2,533 | ) | | | (0.0 | )(a) |
SEE NOTES TO FINANCIAL STATEMENTS.
| | | | | | | | |
| | | |
| OCTOBER 31, 2018 | | J.P. MORGAN EXCHANGE-TRADED FUNDS | | | | | 103 | |
JPMorgan Long/Short ETF
SCHEDULE OF PORTFOLIO INVESTMENTS
AS OF OCTOBER 31, 2018 (continued)
| | | | | | | | | | | | | | | | |
| REFERENCE ENTITY | | SHARES | | | NOTIONAL
VALUE($) (1) | | | NET UNREALIZED
APPRECIATION
(DEPRECIATION)($) (2) | | | PERCENTAGE
OF NET
ASSETS (%) | |
Short Positions — continued | | | | | |
| | | |
Common Stocks — continued | | | | | | | | | | | | | |
Oil, Gas & Consumable Fuels — continued | | | | | | | | | | | | | |
Matador Resources Co.* | | | (2,284 | ) | | | (65,871 | ) | | | 7,582 | | | | 0.1 | |
SemGroup Corp. | | | (2,986 | ) | | | (55,211 | ) | | | 7,525 | | | | 0.0 | (a) |
| | | | | | | | | | | | | | | | |
| | | (9,183 | ) | | | (198,119 | ) | | | 16,414 | | | | 0.1 | |
| | | | | | | | | | | | | | | | |
Pharmaceuticals | | | | | | | | | | | | | |
Collegium Pharmaceutical, Inc.* | | | (4,688 | ) | | | (75,242 | ) | | | 5,392 | | | | 0.0 | (a) |
Intra-Cellular Therapies, Inc.* | | | (3,378 | ) | | | (57,358 | ) | | | 5,473 | | | | 0.0 | (a) |
Medicines Co. (The)* | | | (371 | ) | | | (8,630 | ) | | | 1,391 | | | | 0.0 | (a) |
Nektar Therapeutics* | | | (62 | ) | | | (2,398 | ) | | | 617 | | | | 0.0 | (a) |
Revance Therapeutics, Inc.* | | | (2,476 | ) | | | (53,903 | ) | | | 3,664 | | | | 0.0 | (a) |
Theravance Biopharma, Inc.* | | | (2,261 | ) | | | (54,875 | ) | | | 13,746 | | | | 0.1 | |
WaVe Life Sciences Ltd.* | | | (1,277 | ) | | | (59,623 | ) | | | (6,755 | ) | | | (0.0 | )(a) |
| | | | | | | | | | | | | | | | |
| | | (14,513 | ) | | | (312,029 | ) | | | 23,528 | | | | 0.1 | |
| | | | | | | | | | | | | | | | |
Real Estate Management & Development | | | | | | | | | | | | | |
Redfin Corp.* | | | (4,284 | ) | | | (66,188 | ) | | | (43 | ) | | | (0.0 | )(a) |
| | | | | | | | | | | | | | | | |
Road & Rail | | | | | | | | | | | | | |
Heartland Express, Inc. | | | (3,424 | ) | | | (66,665 | ) | | | (4,930 | ) | | | (0.0 | )(a) |
| | | | | | | | | | | | | | | | |
Semiconductors & Semiconductor Equipment | | | | | | | | | | | | | |
Cree, Inc.* | | | (1,775 | ) | | | (68,905 | ) | | | (7,420 | ) | | | (0.0 | )(a) |
MACOM Technology Solutions Holdings, Inc.* | | | (1,338 | ) | | | (18,826 | ) | | | (441 | ) | | | (0.0 | )(a) |
MaxLinear, Inc.* | | | (214 | ) | | | (4,154 | ) | | | (617 | ) | | | (0.0 | )(a) |
Universal Display Corp. | | | (576 | ) | | | (70,854 | ) | | | (8,738 | ) | | | (0.1 | ) |
| | | | | | | | | | | | | | | | |
| | | (3,903 | ) | | | (162,739 | ) | | | (17,216 | ) | | | (0.1 | ) |
| | | | | | | | | | | | | | | | |
Software | | | | | | | | | | | | | |
Autodesk, Inc.* | | | (20 | ) | | | (2,585 | ) | | | 85 | | | | 0.0 | (a) |
FireEye, Inc.* | | | (4,081 | ) | | | (75,458 | ) | | | (9,142 | ) | | | (0.0 | )(a) |
PROS Holdings, Inc.* | | | (33 | ) | | | (1,086 | ) | | | (61 | ) | | | (0.0 | )(a) |
| | | | | | | | | | | | | | | | |
| | | (4,134 | ) | | | (79,129 | ) | | | (9,118 | ) | | | (0.0 | )(a) |
| | | | | | | | | | | | | | | | |
Specialty Retail | | | | | | | | | | | | | |
Floor & Decor Holdings, Inc.* | | | (1,493 | ) | | | (38,191 | ) | | | 3,105 | | | | 0.0 | (a) |
L Brands, Inc. | | | (1,523 | ) | | | (49,376 | ) | | | (5,940 | ) | | | (0.0 | )(a) |
Murphy USA, Inc.* | | | (604 | ) | | | (48,700 | ) | | | (990 | ) | | | (0.0 | )(a) |
National Vision Holdings, Inc.* | | | (1,085 | ) | | | (44,952 | ) | | | (1,378 | ) | | | (0.0 | )(a) |
Ulta Beauty, Inc.* | | | (189 | ) | | | (51,884 | ) | | | (1,207 | ) | | | (0.0 | )(a) |
| | | | | | | | | | | | | | | | |
| | | (4,894 | ) | | | (233,103 | ) | | | (6,410 | ) | | | (0.0 | )(a) |
| | | | | | | | | | | | | | | | |
Technology Hardware, Storage & Peripherals | | | | | | | | | | | | | |
Cray, Inc.* | | | (3,612 | ) | | | (81,956 | ) | | | (12,064 | ) | | | (0.0 | )(a) |
| | | | | | | | | | | | | | | | |
Thrifts & Mortgage Finance | | | | | | | | | | | | | |
Kearny Financial Corp. | | | (5,260 | ) | | | (68,064 | ) | | | 4,261 | | | | 0.0 | (a) |
LendingTree, Inc.* | | | (336 | ) | | | (67,768 | ) | | | 2,852 | | | | 0.0 | (a) |
| | | | | | | | | | | | | | | | |
| | | (5,596 | ) | | | (135,832 | ) | | | 7,113 | | | | 0.0 | (a) |
| | | | | | | | | | | | | | | | |
Tobacco | | | | | | | | | | | | | |
Philip Morris International, Inc. | | | (331 | ) | | | (29,151 | ) | | | (1,142 | ) | | | (0.0 | )(a) |
Vector Group Ltd. | | | (4,860 | ) | | | (65,708 | ) | | | (2,284 | ) | | | (0.0 | )(a) |
| | | | | | | | | | | | | | | | |
| | | (5,191 | ) | | | (94,859 | ) | | | (3,426 | ) | | | (0.0 | )(a) |
| | | | | | | | | | | | | | | | |
Transportation Infrastructure | | | | | | | | | | | | | |
Macquarie Infrastructure Corp. | | | (1,634 | ) | | | (60,376 | ) | | | 10,409 | | | | 0.0 | (a) |
| | | | | | | | | | | | | | | | |
SEE NOTES TO FINANCIAL STATEMENTS.
| | | | | | |
| | | |
| 104 | | | | J.P. MORGAN EXCHANGE-TRADED FUNDS | | OCTOBER 31, 2018 |
| | | | | | | | | | | | | | | | |
| REFERENCE ENTITY | | SHARES | | | NOTIONAL
VALUE($) (1) | | | NET UNREALIZED
APPRECIATION
(DEPRECIATION)($) (2) | | | PERCENTAGE
OF NET
ASSETS (%) | |
Short Positions — continued | | | | | |
| | | |
Common Stocks — continued | | | | | | | | | | | | | |
Water Utilities | | | | | | | | | | | | | |
Aqua America, Inc. | | | (2,043 | ) | | | (66,459 | ) | | | 10,235 | | | | 0.0 | (a) |
| | | | | | | | | | | | | | | | |
Total Short Positions of Total Return Basket Swap | | | (260,740 | ) | | | (5,811,114 | ) | | | 174,364 | | | | 0.8 | |
| | | | | | | | | | | | | | | | |
| | | | | | | | | | | | | | | | | | | | |
| COUNTERPARTY | | DESCRIPTION | | TERMINATION
DATE | | NOTIONAL
VALUE (1) | | | NET UNREALIZED
APPRECIATION
(DEPRECIATION) (2) | | | NET CASH
AND OTHER
RECEIVABLES
(PAYABLES) | | | VALUE | |
| Goldman Sachs | | The Fund receives the total return on a portfolio of long and short equity positions and pays or receives the net of one day CORRA and one month BA on long positions and short positions respectively, plus or minus a specified spread (rates range from (0.40)% to 0.25%), which is denominated in CAD based on the local currencies of the positions within the swaps. | | 5/25/2028 —
10/26/2028 | | $ | (377,960 | ) | | $ | 30,660 | | | $ | (16,971 | ) | | $ | 13,689 | |
| | | | | | | | | | | | | | | | | | | | |
| | | | | | | | | | | | | | | | |
| REFERENCE ENTITY | | SHARES | | | NOTIONAL
VALUE($) (1) | | | NET UNREALIZED
APPRECIATION
(DEPRECIATION)($) (2) | | | PERCENTAGE
OF NET
ASSETS (%) | |
Long Positions | | | | | |
| | | |
Common Stocks | | | | | | | | | | | | | |
Auto Components | | | | | | | | | | | | | |
Magna International, Inc. | | | 217 | | | | 10,683 | | | | 475 | | | | 0.0 | (a) |
| | | | | | | | | | | | | | | | |
Banks | | | | | | | | | | | | | |
Canadian Imperial Bank of Commerce | | | 937 | | | | 80,913 | | | | (3,488 | ) | | | (0.0 | )(a) |
| | | | | | | | | | | | | | | | |
Food & Staples Retailing | | | | | | | | | | | | | |
Empire Co. Ltd. | | | 4,075 | | | | 74,136 | | | | 2,784 | | | | 0.0 | (a) |
| | | | | | | | | | | | | | | | |
Leisure Products | | | | | | | | | | | | | |
BRP, Inc. | | | 1,538 | | | | 61,873 | | | | (988 | ) | | | (0.0 | )(a) |
| | | | | | | | | | | | | | | | |
Metals & Mining | | | | | | | | | | | | | |
Hudbay Minerals, Inc. | | | 18,641 | | | | 73,208 | | | | (14,712 | ) | | | (0.1 | ) |
Teck Resources Ltd. | | | 3,564 | | | | 73,665 | | | | (750 | ) | | | (0.0 | )(a) |
| | | | | | | | | | | | | | | | |
| | | 22,205 | | | | 146,873 | | | | (15,462 | ) | | | (0.1 | ) |
| | | | | | | | | | | | | | | | |
Oil, Gas & Consumable Fuels | | | | | | | | | | | | | |
Imperial Oil Ltd. | | | 2,571 | | | | 80,306 | | | | (3,346 | ) | | | (0.0 | )(a) |
Suncor Energy, Inc. | | | 2,026 | | | | 67,962 | | | | (7,205 | ) | | | (0.0 | )(a) |
| | | | | | | | | | | | | | | | |
| | | 4,597 | | | | 148,268 | | | | (10,551 | ) | | | (0.0 | )(a) |
| | | | | | | | | | | | | | | | |
Paper & Forest Products | | | | | | | | | | | | | |
Canfor Corp.* | | | 1,432 | | | | 20,570 | | | | 61 | | | | 0.0 | (a) |
Interfor Corp.* | | | 5,579 | | | | 61,704 | | | | (10,440 | ) | | | (0.0 | )(a) |
Norbord, Inc. | | | 639 | | | | 16,294 | | | | 284 | | | | 0.0 | (a) |
West Fraser Timber Co. Ltd. | | | 294 | | | | 14,771 | | | | 148 | | | | 0.0 | (a) |
| | | | | | | | | | | | | | | | |
| | | 7,944 | | | | 113,339 | | | | (9,947 | ) | | | (0.0 | )(a) |
| | | | | | | | | | | | | | | | |
Real Estate Management & Development | | | | | | | | | | | | | |
First Capital Realty, Inc. | | | 5,444 | | | | 81,219 | | | | 2,628 | | | | 0.0 | (a) |
| | | | | | | | | | | | | | | | |
SEE NOTES TO FINANCIAL STATEMENTS.
| | | | | | | | |
| | | |
| OCTOBER 31, 2018 | | J.P. MORGAN EXCHANGE-TRADED FUNDS | | | | | 105 | |
JPMorgan Long/Short ETF
SCHEDULE OF PORTFOLIO INVESTMENTS
AS OF OCTOBER 31, 2018 (continued)
| | | | | | | | | | | | | | | | |
| REFERENCE ENTITY | | SHARES | | | NOTIONAL
VALUE($) (1) | | | NET UNREALIZED
APPRECIATION
(DEPRECIATION)($) (2) | | | PERCENTAGE
OF NET
ASSETS (%) | |
Long Positions — continued | | | | | |
| | | |
Common Stocks — continued | | | | | | | | | | | | | |
Textiles, Apparel & Luxury Goods | | | | | | | | | | | | | |
Gildan Activewear, Inc. | | | 2,087 | | | | 62,382 | | | | 3,760 | | | | 0.0 | (a) |
| | | | | | | | | | | | | | | | |
Total Long Positions of Total Return Basket Swap | | | 49,044 | | | | 779,686 | | | | (30,789 | ) | | | (0.1 | ) |
| | | | | | | | | | | | | | | | |
| |
Short Positions | | | | | |
| | | |
Common Stocks | | | | | | | | | | | | | |
Capital Markets | | | | | | | | | | | | | |
Thomson Reuters Corp. | | | (1,504 | ) | | | (69,999 | ) | | | (2,996 | ) | | | (0.0 | )(a) |
| | | | | | | | | | | | | | | | |
Construction & Engineering | | | | | | | | | | | | | |
SNC-Lavalin Group, Inc. | | | (1,723 | ) | | | (61,514 | ) | | | (2,843 | ) | | | (0.0 | )(a) |
| | | | | | | | | | | | | | | | |
Diversified Financial Services | | | | | | | | | | | | | |
Onex Corp. | | | (1,048 | ) | | | (68,901 | ) | | | (610 | ) | | | (0.0 | )(a) |
| | | | | | | | | | | | | | | | |
Entertainment | | | | | | | | | | | | | |
Cineplex, Inc. | | | (1,840 | ) | | | (50,722 | ) | | | (3,344 | ) | | | (0.0 | )(a) |
| | | | | | | | | | | | | | | | |
Food Products | | | | | | | | | | | | | |
Saputo, Inc. | | | (2,171 | ) | | | (66,146 | ) | | | (2,717 | ) | | | (0.0 | )(a) |
| | | | | | | | | | | | | | | | |
Gas Utilities | | | | | | | | | | | | | |
AltaGas Ltd. | | | (4,348 | ) | | | (54,662 | ) | | | 16,502 | | | | 0.0 | (a) |
| | | | | | | | | | | | | | | | |
Metals & Mining | | | | | | | | | | | | | |
Agnico Eagle Mines Ltd. | | | (166 | ) | | | (5,864 | ) | | | (154 | ) | | | (0.0 | )(a) |
Goldcorp, Inc. | | | (1,602 | ) | | | (14,469 | ) | | | 1,606 | | | | 0.0 | (a) |
Kinross Gold Corp.* | | | (23,779 | ) | | | (61,775 | ) | | | 5,274 | | | | 0.0 | (a) |
Yamana Gold, Inc. | | | (26,413 | ) | | | (59,991 | ) | | | 5,834 | | | | 0.0 | (a) |
| | | | | | | | | | | | | | | | |
| | | (51,960 | ) | | | (142,099 | ) | | | 12,560 | | | | 0.0 | (a) |
| | | | | | | | | | | | | | | | |
Multi-Utilities | | | | | | | | | | | | | |
Algonquin Power & Utilities Corp. | | | (7,535 | ) | | | (75,210 | ) | | | (1,512 | ) | | | (0.0 | )(a) |
Canadian Utilities Ltd. | | | (2,934 | ) | | | (69,603 | ) | | | (3,673 | ) | | | (0.0 | )(a) |
| | | | | | | | | | | | | | | | |
| | | (10,469 | ) | | | (144,813 | ) | | | (5,185 | ) | | | (0.0 | )(a) |
| | | | | | | | | | | | | | | | |
Oil, Gas & Consumable Fuels | | | | | | | | | | | | | |
ARC Resources Ltd. | | | (6,450 | ) | | | (60,068 | ) | | | 10,087 | | | | 0.1 | |
Enbridge, Inc. | | | (2,134 | ) | | | (66,495 | ) | | | 2,593 | | | | 0.0 | (a) |
Encana Corp. | | | (5,779 | ) | | | (58,999 | ) | | | 8,233 | | | | 0.0 | (a) |
Pembina Pipeline Corp. | | | (2,184 | ) | | | (70,641 | ) | | | 2,546 | | | | 0.0 | (a) |
PrairieSky Royalty Ltd. | | | (3,776 | ) | | | (57,366 | ) | | | 6,303 | | | | 0.0 | (a) |
Seven Generations Energy Ltd.* | | | (6,407 | ) | | | (68,672 | ) | | | 8,552 | | | | 0.1 | |
TransCanada Corp. | | | (1,666 | ) | | | (62,821 | ) | | | 3,767 | | | | 0.0 | (a) |
Whitecap Resources, Inc. | | | (10,983 | ) | | | (53,728 | ) | | | 8,001 | | | | 0.0 | (a) |
| | | | | | | | | | | | | | | | |
| | | (39,379 | ) | | | (498,790 | ) | | | 50,082 | | | | 0.2 | |
| | | | | | | | | | | | | | | | |
Total Short Positions of Total Return Basket Swap | | | (114,442 | ) | | | (1,157,646 | ) | | | 61,449 | | | | 0.2 | |
| | | | | | | | | | | | | | | | |
Total of Long and Short Positions of Total Return Basket Swap | | | (65,398 | ) | | | (377,960 | ) | | | 30,660 | | | | 0.1 | |
| | | | | | | | | | | | | | | | |
SEE NOTES TO FINANCIAL STATEMENTS.
| | | | | | |
| | | |
| 106 | | | | J.P. MORGAN EXCHANGE-TRADED FUNDS | | OCTOBER 31, 2018 |
| | | | | | | | | | | | | | | | | | | | |
| COUNTERPARTY | | DESCRIPTION | | TERMINATION
DATE | | NOTIONAL
VALUE (1) | | | NET UNREALIZED
APPRECIATION
(DEPRECIATION) (2) | | | NET CASH
AND OTHER
RECEIVABLES
(PAYABLES) | | | VALUE | |
| Goldman Sachs | | The Fund receives the total return on a portfolio of long and short equity positions and pays or receives the net of one day EONIA and one month EURIBOR on long positions and short positions respectively, plus or minus a specified spread (rates range from (6.00)% to 0.30%), which is denominated in EUR based on the local currencies of the positions within the swaps. | | 5/25/2028 —
10/27/2028 | | $ | (73,003 | ) | | $ | (21,248 | ) | | $ | 124,422 | | | $ | 103,174 | |
| | | | | | | | | | | | | | | | | | | | |
| | | | | | | | | | | | | | | | |
| REFERENCE ENTITY | | SHARES | | | NOTIONAL
VALUE($) (1) | | | NET UNREALIZED
APPRECIATION
(DEPRECIATION)($) (2) | | | PERCENTAGE
OF NET
ASSETS (%) | |
Long Positions | | | | | |
| | | |
Common Stocks | | | | | | | | | | | | | |
Auto Components | | | | | | | | | | | | | |
Cie Plastic Omnium SA | | | 1,302 | | | | 36,199 | | | | (4,342 | ) | | | (0.0 | )(a) |
Faurecia SA | | | 235 | | | | 11,392 | | | | (890 | ) | | | (0.0 | )(a) |
| | | | | | | | | | | | | | | | |
| | | 1,537 | | | | 47,591 | | | | (5,232 | ) | | | (0.0 | )(a) |
| | | | | | | | | | | | | | | | |
Capital Markets | | | | | | | | | | | | | |
AURELIUS Equity Opportunities SE & Co. KGaA | | | 1,599 | | | | 74,371 | | | | 533 | | | | 0.0 | (a) |
| | | | | | | | | | | | | | | | |
Chemicals | | | | | | | | | | | | | |
Arkema SA | | | 679 | | | | 71,236 | | | | (5,440 | ) | | | (0.0 | )(a) |
| | | | | | | | | | | | | | | | |
Construction & Engineering | | | | | | | | | | | | | |
ACS Actividades de Construccion y Servicios SA | | | 1,891 | | | | 70,802 | | | | (4,885 | ) | | | (0.0 | )(a) |
HOCHTIEF AG | | | 492 | | | | 72,908 | | | | (3,611 | ) | | | (0.0 | )(a) |
| | | | | | | | | | | | | | | | |
| | | 2,383 | | | | 143,710 | | | | (8,496 | ) | | | (0.0 | )(a) |
| | | | | | | | | | | | | | | | |
Diversified Telecommunication Services | | | | | | | | | | | | | |
Orange SA | | | 5,013 | | | | 78,245 | | | | (382 | ) | | | (0.0 | )(a) |
| | | | | | | | | | | | | | | | |
Electric Utilities | | | | | | | | | | | | | |
Red Electrica Corp. SA | | | 3,865 | | | | 80,030 | | | | (1,648 | ) | | | (0.0 | )(a) |
Terna Rete Elettrica Nazionale SpA | | | 15,293 | | | | 78,996 | | | | (268 | ) | | | (0.0 | )(a) |
| | | | | | | | | | | | | | | | |
| | | 19,158 | | | | 159,026 | | | | (1,916 | ) | | | (0.0 | )(a) |
| | | | | | | | | | | | | | | | |
Electrical Equipment | | | | | | | | | | | | | |
Schneider Electric SE | | | 997 | | | | 72,094 | | | | 1,248 | | | | 0.0 | (a) |
Signify NV (b) | | | 260 | | | | 6,405 | | | | 159 | | | | 0.0 | (a) |
| | | | | | | | | | | | | | | | |
| | | 1,257 | | | | 78,499 | | | | 1,407 | | | | 0.0 | (a) |
| | | | | | | | | | | | | | | | |
Food & Staples Retailing | | | | | | | | | | | | | |
Koninklijke Ahold Delhaize NV | | | 3,298 | | | | 75,493 | | | | 2,385 | | | | 0.0 | (a) |
| | | | | | | | | | | | | | | | |
Gas Utilities | | | | | | | | | | | | | |
Italgas SpA | | | 14,731 | | | | 76,005 | | | | 365 | | | | 0.0 | (a) |
| | | | | | | | | | | | | | | | |
Independent Power and Renewable Electricity Producers | | | | | | | | | | | | | |
ERG SpA | | | 3,688 | | | | 68,797 | | | | (1,966 | ) | | | (0.0 | )(a) |
Uniper SE | | | 2,681 | | | | 77,369 | | | | 581 | | | | 0.0 | (a) |
| | | | | | | | | | | | | | | | |
| | | 6,369 | | | | 146,166 | | | | (1,385 | ) | | | (0.0 | )(a) |
| | | | | | | | | | | | | | | | |
Industrial Conglomerates | | | | | | | | | | | | | |
Rheinmetall AG | | | 699 | | | | 60,494 | | | | (1,308 | ) | | | (0.0 | )(a) |
| | | | | | | | | | | | | | | | |
SEE NOTES TO FINANCIAL STATEMENTS.
| | | | | | | | |
| | | |
| OCTOBER 31, 2018 | | J.P. MORGAN EXCHANGE-TRADED FUNDS | | | | | 107 | |
JPMorgan Long/Short ETF
SCHEDULE OF PORTFOLIO INVESTMENTS
AS OF OCTOBER 31, 2018 (continued)
| | | | | | | | | | | | | | | | |
| REFERENCE ENTITY | | SHARES | | | NOTIONAL
VALUE($) (1) | | | NET UNREALIZED
APPRECIATION
(DEPRECIATION)($) (2) | | | PERCENTAGE
OF NET
ASSETS (%) | |
Long Positions — continued | | | | | |
| | | |
Common Stocks — continued | | | | | | | | | | | | | |
Insurance | | | | | | | | | | | | | |
Aegon NV | | | 12,093 | | | | 74,162 | | | | (2,865 | ) | | | (0.0 | )(a) |
NN Group NV | | | 1,915 | | | | 82,226 | | | | (3,158 | ) | | | (0.1 | ) |
Poste Italiane SpA (b) | | | 9,162 | | | | 65,741 | | | | (1,268 | ) | | | (0.0 | )(a) |
UnipolSai Assicurazioni SpA | | | 32,380 | | | | 70,694 | | | | (2,373 | ) | | | (0.0 | )(a) |
| | | | | | | | | | | | | | | | |
| | | 55,550 | | | | 292,823 | | | | (9,664 | ) | | | (0.1 | ) |
| | | | | | | | | | | | | | | | |
Media | | | | | | | | | | | | | |
Mediaset Espana Comunicacion SA | | | 7,483 | | | | 50,883 | | | | (1,118 | ) | | | (0.0 | )(a) |
Publicis Groupe SA | | | 948 | | | | 54,877 | | | | 111 | | | | 0.0 | (a) |
| | | | | | | | | | | | | | | | |
| | | 8,431 | | | | 105,760 | | | | (1,007 | ) | | | (0.0 | )(a) |
| | | | | | | | | | | | | | | | |
Metals & Mining | | | | | | | | | | | | | |
Eramet | | | 771 | | | | 70,976 | | | | (497 | ) | | | (0.0 | )(a) |
| | | | | | | | | | | | | | | | |
Oil, Gas & Consumable Fuels | | | | | | | | | | | | | |
Galp Energia SGPS SA | | | 4,194 | | | | 72,926 | | | | (5,617 | ) | | | (0.0 | )(a) |
Saras SpA | | | 36,514 | | | | 71,259 | | | | (961 | ) | | | (0.0 | )(a) |
| | | | | | | | | | | | | | | | |
| | | 40,708 | | | | 144,185 | | | | (6,578 | ) | | | (0.0 | )(a) |
| | | | | | | | | | | | | | | | |
Pharmaceuticals | | | | | | | | | | | | | |
Sanofi | | | 920 | | | | 82,212 | | | | 2,342 | | | | 0.0 | (a) |
UCB SA | | | 995 | | | | 83,560 | | | | (1,715 | ) | | | (0.0 | )(a) |
| | | | | | | | | | | | | | | | |
| | | 1,915 | | | | 165,772 | | | | 627 | | | | 0.0 | (a) |
| | | | | | | | | | | | | | | | |
Real Estate Management & Development | | | | | | | | | | | | | |
Nexity SA | | | 1,307 | | | | 62,502 | | | | (3,512 | ) | | | (0.0 | )(a) |
| | | | | | | | | | | | | | | | |
Semiconductors & Semiconductor Equipment | | | | | | | | | | | | | |
BE Semiconductor Industries NV | | | 2,928 | | | | 62,595 | | | | 8,215 | | | | 0.0 | (a) |
Siltronic AG | | | 111 | | | | 10,166 | | | | (1,203 | ) | | | (0.0 | )(a) |
| | | | | | | | | | | | | | | | |
| | | 3,039 | | | | 72,761 | | | | 7,012 | | | | 0.0 | (a) |
| | | | | | | | | | | | | | | | |
Textiles, Apparel & Luxury Goods | | | | | | | | | | | | | |
Christian Dior SE | | | 125 | | | | 48,358 | | | | 2,646 | | | | 0.0 | (a) |
| | | | | | | | | | | | | | | | |
Total Long Positions of Total Return Basket Swap | | | 168,569 | | | | 1,973,973 | | | | (30,442 | ) | | | (0.1 | ) |
| | | | | | | | | | | | | | | | |
| |
Short Positions | | | | | |
| | | |
Common Stocks | | | | | | | | | | | | | |
Air Freight & Logistics | | | | | | | | | | | | | |
bpost SA | | | (4,080 | ) | | | (61,920 | ) | | | (1,964 | ) | | | (0.0 | )(a) |
| | | | | | | | | | | | | | | | |
Auto Components | | | | | | | | | | | | | |
Brembo SpA | | | (3,493 | ) | | | (38,671 | ) | | | 1,442 | | | | 0.0 | (a) |
Gestamp Automocion SA (b) | | | (9,059 | ) | | | (57,438 | ) | | | 19 | | | | 0.0 | (a) |
Nokian Renkaat OYJ | | | (1,144 | ) | | | (36,389 | ) | | | 5,894 | | | | 0.0 | (a) |
| | | | | | | | | | | | | | | | |
| | | (13,696 | ) | | | (132,498 | ) | | | 7,355 | | | | 0.0 | (a) |
| | | | | | | | | | | | | | | | |
Banks | | | | | | | | | | | | | |
Commerzbank AG* | | | (6,179 | ) | | | (58,181 | ) | | | 2,603 | | | | 0.0 | (a) |
| | | | | | | | | | | | | | | | |
Capital Markets | | | | | | | | | | | | | |
Banca Generali SpA | | | (2,406 | ) | | | (46,326 | ) | | | 10,367 | | | | 0.0 | (a) |
| | | | | | | | | | | | | | | | |
Chemicals | | | | | | | | | | | | | |
Umicore SA | | | (1,195 | ) | | | (56,252 | ) | | | (1,006 | ) | | | (0.0 | )(a) |
| | | | | | | | | | | | | | | | |
SEE NOTES TO FINANCIAL STATEMENTS.
| | | | | | |
| | | |
| 108 | | | | J.P. MORGAN EXCHANGE-TRADED FUNDS | | OCTOBER 31, 2018 |
| | | | | | | | | | | | | | | | |
| REFERENCE ENTITY | | SHARES | | | NOTIONAL
VALUE($) (1) | | | NET UNREALIZED
APPRECIATION
(DEPRECIATION)($) (2) | | | PERCENTAGE
OF NET
ASSETS (%) | |
Short Positions — continued | | | | | |
| | | |
Common Stocks — continued | | | | | | | | | | | | | |
Commercial Services & Supplies | | | | | | | | | | | | | |
Elis SA | | | (2,927 | ) | | | (59,020 | ) | | | (592 | ) | | | (0.0 | )(a) |
| | | | | | | | | | | | | | | | |
Diversified Financial Services | | | | | | | | | | | | | |
Wendel SA | | | (507 | ) | | | (65,695 | ) | | | 1,147 | | | | 0.0 | (a) |
| | | | | | | | | | | | | | | | |
Diversified Telecommunication Services | | | | | | | | | | | | | |
Cellnex Telecom SA (b) | | | (2,782 | ) | | | (69,206 | ) | | | (2,906 | ) | | | (0.0 | )(a) |
Iliad SA | | | (220 | ) | | | (25,429 | ) | | | 242 | | | | 0.0 | (a) |
| | | | | | | | | | | | | | | | |
| | | (3,002 | ) | | | (94,635 | ) | | | (2,664 | ) | | | (0.0 | )(a) |
| | | | | | | | | | | | | | | | |
Electrical Equipment | | | | | | | | | | | | | |
Nexans SA | | | (499 | ) | | | (14,400 | ) | | | 141 | | | | 0.0 | (a) |
Siemens Gamesa Renewable Energy SA* | | | (6,286 | ) | | | (69,618 | ) | | | (1,368 | ) | | | (0.0 | )(a) |
| | | | | | | | | | | | | | | | |
| | | (6,785 | ) | | | (84,018 | ) | | | (1,227 | ) | | | (0.0 | )(a) |
| | | | | | | | | | | | | | | | |
Energy Equipment & Services | | | | | | | | | | | | | |
CGG SA* | | | (23,786 | ) | | | (57,539 | ) | | | 5,212 | | | | 0.0 | (a) |
| | | | | | | | | | | | | | | | |
Food Products | | | | | | | | | | | | | |
Kerry Group plc | | | (699 | ) | | | (71,651 | ) | | | (1,226 | ) | | | (0.0 | )(a) |
| | | | | | | | | | | | | | | | |
Health Care Providers & Services | | | | | | | | | | | | | |
Orpea | | | (521 | ) | | | (64,142 | ) | | | (5,624 | ) | | | (0.0 | )(a) |
| | | | | | | | | | | | | | | | |
Hotels, Restaurants & Leisure | | | | | | | | | | | | | |
Paddy Power Betfair plc | | | (675 | ) | | | (58,258 | ) | | | (3,792 | ) | | | (0.0 | )(a) |
Sodexo SA | | | (510 | ) | | | (52,059 | ) | | | (1,887 | ) | | | (0.0 | )(a) |
| | | | | | | | | | | | | | | | |
| | | (1,185 | ) | | | (110,317 | ) | | | (5,679 | ) | | | (0.0 | )(a) |
| | | | | | | | | | | | | | | | |
Internet & Direct Marketing Retail | | | | | | | | | | | | | |
Delivery Hero SE* (b) | | | (1,240 | ) | | | (49,929 | ) | | | (574 | ) | | | (0.0 | )(a) |
Rocket Internet SE* (b) | | | (1,948 | ) | | | (56,245 | ) | | | (2,681 | ) | | | (0.0 | )(a) |
Zalando SE* (b) | | | (636 | ) | | | (24,585 | ) | | | (1,430 | ) | | | (0.0 | )(a) |
| | | | | | | | | | | | | | | | |
| | | (3,824 | ) | | | (130,759 | ) | | | (4,685 | ) | | | (0.0 | )(a) |
| | | | | | | | | | | | | | | | |
IT Services | | | | | | | | | | | | | |
Bechtle AG | | | (662 | ) | | | (58,790 | ) | | | (319 | ) | | | (0.0 | )(a) |
Indra Sistemas SA* | | | (6,881 | ) | | | (68,008 | ) | | | 2,544 | | | | 0.0 | (a) |
| | | | | | | | | | | | | | | | |
| | | (7,543 | ) | | | (126,798 | ) | | | 2,225 | | | | 0.0 | (a) |
| | | | | | | | | | | | | | | | |
Life Sciences Tools & Services | | | | | | | | | | | | | |
MorphoSys AG* | | | (674 | ) | | | (62,410 | ) | | | (2,262 | ) | | | (0.0 | )(a) |
| | | | | | | | | | | | | | | | |
Machinery | | | | | | | | | | | | | |
Duerr AG | | | (1,691 | ) | | | (60,258 | ) | | | 2,731 | | | | 0.0 | (a) |
GEA Group AG | | | (624 | ) | | | (18,961 | ) | | | 209 | | | | 0.0 | (a) |
Outotec OYJ* | | | (4,047 | ) | | | (15,653 | ) | | | 5,564 | | | | 0.0 | (a) |
| | | | | | | | | | | | | | | | |
| | | (6,362 | ) | | | (94,872 | ) | | | 8,504 | | | | 0.0 | (a) |
| | | | | | | | | | | | | | | | |
Media | | | | | | | | | | | | | |
Altice Europe NV* | | | (17,018 | ) | | | (40,487 | ) | | | 6,525 | | | | 0.0 | (a) |
Telenet Group Holding NV | | | (293 | ) | | | (14,195 | ) | | | 379 | | | | 0.0 | (a) |
| | | | | | | | | | | | | | | | |
| | | (17,311 | ) | | | (54,682 | ) | | | 6,904 | | | | 0.0 | (a) |
| | | | | | | | | | | | | | | | |
Metals & Mining | | | | | | | | | | | | | |
AMG Advanced Metallurgical Group NV | | | (1,262 | ) | | | (60,044 | ) | | | (6,804 | ) | | | (0.0 | )(a) |
Bekaert SA | | | (2,849 | ) | | | (61,531 | ) | | | 6,265 | | | | 0.0 | (a) |
thyssenkrupp AG | | | (219 | ) | | | (4,591 | ) | | | 519 | | | | 0.0 | (a) |
| | | | | | | | | | | | | | | | |
| | | (4,330 | ) | | | (126,166 | ) | | | (20 | ) | | | (0.0 | )(a) |
| | | | | | | | | | | | | | | | |
SEE NOTES TO FINANCIAL STATEMENTS.
| | | | | | | | |
| | | |
| OCTOBER 31, 2018 | | J.P. MORGAN EXCHANGE-TRADED FUNDS | | | | | 109 | |
JPMorgan Long/Short ETF
SCHEDULE OF PORTFOLIO INVESTMENTS
AS OF OCTOBER 31, 2018 (continued)
| | | | | | | | | | | | | | | | |
| REFERENCE ENTITY | | SHARES | | | NOTIONAL
VALUE($) (1) | | | NET UNREALIZED
APPRECIATION
(DEPRECIATION)($) (2) | | | PERCENTAGE
OF NET
ASSETS (%) | |
Short Positions — continued | | | | | |
| | | |
Common Stocks — continued | | | | | | | | | | | | | |
Multi-Utilities | | | | | | | | | | | | | |
E.ON SE | | | (6,585 | ) | | | (63,677 | ) | | | (1,097 | ) | | | (0.0 | )(a) |
RWE AG | | | (2,860 | ) | | | (55,639 | ) | | | (263 | ) | | | (0.0 | )(a) |
Suez | | | (5,351 | ) | | | (77,185 | ) | | | 1,750 | | | | 0.0 | (a) |
| | | | | | | | | | | | | | | | |
| | | (14,796 | ) | | | (196,501 | ) | | | 390 | | | | 0.0 | (a) |
| | | | | | | | | | | | | | | | |
Pharmaceuticals | | | | | | | | | | | | | |
Orion OYJ | | | (1,841 | ) | | | (63,329 | ) | | | 856 | | | | 0.0 | (a) |
| | | | | | | | | | | | | | | | |
Professional Services | | | | | | | | | | | | | |
Bureau Veritas SA | | | (2,739 | ) | | | (61,792 | ) | | | (522 | ) | | | (0.0 | )(a) |
| | | | | | | | | | | | | | | | |
Semiconductors & Semiconductor Equipment | | | | | | | | | | | | | |
SOITEC* | | | (850 | ) | | | (60,566 | ) | | | (6,906 | ) | | | (0.0 | )(a) |
| | | | | | | | | | | | | | | | |
Specialty Retail | | | | | | | | | | | | | |
Industria de Diseno Textil SA | | | (1,411 | ) | | | (39,769 | ) | | | 17 | | | | 0.0 | (a) |
| | | | | | | | | | | | | �� | | | |
Transportation Infrastructure | | | | | | | | | | | | | |
Aeroports de Paris | | | (321 | ) | | | (67,138 | ) | | | (2,009 | ) | | | (0.0 | )(a) |
| | | | | | | | | | | | | | | | |
Total Short Positions of Total Return Basket Swap | | | (128,970 | ) | | | (2,046,976 | ) | | | 9,194 | | | | 0.0 | (a) |
| | | | | | | | | | | | | | | | |
Total of Long and Short Positions of Total Return Basket Swap | | | 39,599 | | | | (73,003 | ) | | | (21,248 | ) | | | (0.1 | ) |
| | | | | | | | | | | | | | | | |
| | | | | | | | | | | | | | | | | | | | |
| COUNTERPARTY | | DESCRIPTION | | TERMINATION
DATE | | NOTIONAL
VALUE (1) | | | NET UNREALIZED
APPRECIATION
(DEPRECIATION) (2) | | | NET CASH
AND OTHER
RECEIVABLES
(PAYABLES) | | | VALUE | |
| Goldman Sachs | | The Fund receives the total return on a portfolio of long and short equity positions and pays or receives the net of one day LIBOR and one month LIBOR on long positions and short positions respectively, plus or minus a specified spread (rates range from (0.85) % to 0.30%), which is denominated in CHF based on the local currencies of the positions within the swaps. | | 5/26/2028 —
9/29/2028 | | $ | (82,338 | ) | | $ | 3,358 | | | $ | 9,118 | | | $ | 12,476 | |
| | | | | | | | | | | | | | | | | | | | |
| | | | | | | | | | | | | | | | |
| REFERENCE ENTITY | | SHARES | | | NOTIONAL
VALUE($) (1) | | | NET UNREALIZED
APPRECIATION
(DEPRECIATION)($) (2) | | | PERCENTAGE
OF NET
ASSETS (%) | |
Long Positions | | | | | |
| | | |
Common Stocks | | | | | | | | | | | | | |
Food Products | | | | | | | | | | | | | |
Barry Callebaut AG (Registered) | | | 41 | | | | 80,138 | | | | 5,213 | | | | 0.0 | (a) |
| | | | | | | | | | | | | | | | |
Health Care Equipment & Supplies | | | | | | | | | | | | | |
Sonova Holding AG (Registered) | | | 399 | | | | 65,071 | | | | 636 | | | | 0.0 | (a) |
| | | | | | | | | | | | | | | | |
Machinery | | | | | | | | | | | | | |
Georg Fischer AG (Registered) | | | 64 | | | | 59,542 | | | | (3,664 | ) | | | (0.0 | )(a) |
| | | | | | | | | | | | | | | | |
Pharmaceuticals | | | | | | | | | | | | | |
Roche Holding AG | | | 347 | | | | 84,480 | | | | 237 | | | | 0.0 | (a) |
| | | | | | | | | | | | | | | | |
Real Estate Management & Development | | | | | | | | | | | | | |
PSP Swiss Property AG (Registered) | | | 890 | | | | 85,873 | | | | 4,258 | | | | 0.0 | (a) |
| | | | | | | | | | | | | | | | |
Total Long Positions of Total Return Basket Swap | | | 1,741 | | | | 375,104 | | | | 6,680 | | | | 0.0 | (a) |
| | | | | | | | | | | | | | | | |
SEE NOTES TO FINANCIAL STATEMENTS.
| | | | | | |
| | | |
| 110 | | | | J.P. MORGAN EXCHANGE-TRADED FUNDS | | OCTOBER 31, 2018 |
| | | | | | | | | | | | | | | | |
| REFERENCE ENTITY | | SHARES | | | NOTIONAL
VALUE($) (1) | | | NET UNREALIZED
APPRECIATION
(DEPRECIATION)($) (2) | | | PERCENTAGE
OF NET
ASSETS (%) | |
Short Positions | | | | | |
| | | |
Common Stocks | | | | | | | | | | | | | |
Air Freight & Logistics | | | | | | | | | | | | | |
Panalpina Welttransport Holding AG (Registered) | | | (595 | ) | | | (72,709 | ) | | | 184 | | | | 0.0 | (a) |
| | | | | | | | | | | | | | | | |
Chemicals | | | | | | | | | | | | | |
Clariant AG (Registered)* | | | (3,221 | ) | | | (69,422 | ) | | | 2,661 | | | | 0.0 | (a) |
EMS-Chemie Holding AG (Registered) | | | (115 | ) | | | (63,362 | ) | | | (2,210 | ) | | | (0.0 | )(a) |
| | | | | | | | | | | | | | | | |
| | | (3,336 | ) | | | (132,784 | ) | | | 451 | | | | 0.0 | (a) |
| | | | | | | | | | | | | | | | |
Machinery | | | | | | | | | | | | | |
Schindler Holding AG | | | (336 | ) | | | (70,850 | ) | | | 3,782 | | | | 0.0 | (a) |
| | | | | | | | | | | | | | | | |
Marine | | | | | | | | | | | | | |
Kuehne + Nagel International AG (Registered) | | | (475 | ) | | | (66,018 | ) | | | 866 | | | | 0.0 | (a) |
| | | | | | | | | | | | | | | | |
Professional Services | | | | | | | | | | | | | |
DKSH Holding AG | | | (1,017 | ) | | | (68,566 | ) | | | (5,208 | ) | | | (0.0 | )(a) |
| | | | | | | | | | | | | | | | |
Semiconductors & Semiconductor Equipment | | | | | | | | | | | | | |
ams AG* | | | (1,194 | ) | | | (46,515 | ) | | | (3,397 | ) | | | (0.0 | )(a) |
| | | | | | | | | | | | | | | | |
Total Short Positions of Total Return Basket Swap | | | (6,953 | ) | | | (457,442 | ) | | | (3,322 | ) | | | 0.0 | (a) |
| | | | | | | | | | | | | | | | |
Total of Long and Short Positions of Total Return Basket Swap | | | (5,212 | ) | | | (82,338 | ) | | | 3,358 | | | | 0.0 | (a) |
| | | | | | | | | | | | | | | | |
| | | | | | | | | | | | | | | | | | | | |
| COUNTERPARTY | | DESCRIPTION | | TERMINATION
DATE | | NOTIONAL
VALUE (1) | | | NET UNREALIZED
APPRECIATION
(DEPRECIATION) (2) | | | NET CASH
AND OTHER
RECEIVABLES
(PAYABLES) | | | VALUE | |
| Goldman Sachs | | The Fund receives the total return on a portfolio of long and short equity positions and pays or receives the net of one day BOJ TONAR and one month LIBOR on long positions and short positions respectively, plus or minus a specified spread (rates range from (2.50) % to 0.60%), which is denominated in JPY based on the local currencies of the positions within the swaps. | | 5/26/2028 —
10/30/2028 | | $ | 300,163 | | | $ | (92,573 | ) | | $ | 92,183 | | | $ | (390 | ) |
| | | | | | | | | | | | | | | | | | | | |
| | | | | | | | | | | | | | | | |
| REFERENCE ENTITY | | SHARES | | | NOTIONAL
VALUE($) (1) | | | NET UNREALIZED
APPRECIATION
(DEPRECIATION)($) (2) | | | PERCENTAGE
OF NET
ASSETS (%) | |
Long Positions | | | | | |
| | | |
Common Stocks | | | | | | | | | | | | | |
Auto Components | | | | | | | | | | | | | |
Keihin Corp. | | | 3,200 | | | | 63,008 | | | | (1,951 | ) | | | (0.0 | )(a) |
TS Tech Co. Ltd. | | | 900 | | | | 25,902 | | | | (656 | ) | | | (0.0 | )(a) |
| | | | | | | | | | | | | | | | |
| | | 4,100 | | | | 88,910 | | | | (2,607 | ) | | | (0.0 | )(a) |
| | | | | | | | | | | | | | | | |
Chemicals | | | | | | | | | | | | | |
Asahi Kasei Corp. | | | 5,400 | | | | 64,792 | | | | (12,371 | ) | | | (0.1 | ) |
Daicel Corp. | | | 7,200 | | | | 76,169 | | | | (1,788 | ) | | | (0.0 | )(a) |
KH Neochem Co. Ltd.* | | | 2,400 | | | | 68,162 | | | | (17,390 | ) | | | (0.1 | ) |
Mitsubishi Gas Chemical Co., Inc. | | | 800 | | | | 13,429 | | | | 312 | | | | 0.0 | (a) |
Sumitomo Bakelite Co. Ltd. | | | 600 | | | | 21,664 | | | | 675 | | | | 0.0 | (a) |
Sumitomo Chemical Co. Ltd. | | | 15,000 | | | | 75,141 | | | | (8,036 | ) | | | (0.0 | )(a) |
Tokuyama Corp. | | | 3,200 | | | | 71,557 | | | | (9,547 | ) | | | (0.0 | )(a) |
SEE NOTES TO FINANCIAL STATEMENTS.
| | | | | | | | |
| | | |
| OCTOBER 31, 2018 | | J.P. MORGAN EXCHANGE-TRADED FUNDS | | | | | 111 | |
JPMorgan Long/Short ETF
SCHEDULE OF PORTFOLIO INVESTMENTS
AS OF OCTOBER 31, 2018 (continued)
| | | | | | | | | | | | | | | | |
| REFERENCE ENTITY | | SHARES | | | NOTIONAL
VALUE($) (1) | | | NET UNREALIZED
APPRECIATION
(DEPRECIATION)($) (2) | | | PERCENTAGE
OF NET
ASSETS (%) | |
Long Positions — continued | | | | | |
| | | |
Common Stocks — continued | | | | | | | | | | | | | |
Chemicals — continued | | | | | | | | | | | | | |
Ube Industries Ltd. | | | 3,000 | | | | 65,348 | | | | (9,632 | ) | | | (0.0 | )(a) |
| | | | | | | | | | | | | | | | |
| | | 37,600 | | | | 456,262 | | | | (57,777 | ) | | | (0.2 | ) |
| | | | | | | | | | | | | | | | |
Construction & Engineering | | | | | | | | | | | | | |
Hazama Ando Corp. | | | 10,500 | | | | 72,507 | | | | (6,094 | ) | | | (0.0 | )(a) |
Kyowa Exeo Corp. | | | 2,700 | | | | 72,780 | | | | (6,864 | ) | | | (0.1 | ) |
Kyudenko Corp. | | | 2,000 | | | | 72,767 | | | | (5,943 | ) | | | (0.0 | )(a) |
Maeda Corp. | | | 6,400 | | | | 72,318 | | | | (2,647 | ) | | | (0.0 | )(a) |
Sumitomo Mitsui Construction Co. Ltd.* | | | 11,900 | | | | 74,653 | | | | (6,504 | ) | | | (0.0 | )(a) |
| | | | | | | | | | | | | | | | |
| | | 33,500 | | | | 365,025 | | | | (28,052 | ) | | | (0.1 | ) |
| | | | | | | | | | | | | | | | |
Diversified Financial Services | | | | | | | | | | | | | |
Mitsubishi UFJ Lease & Finance Co. Ltd. | | | 13,700 | | | | 70,407 | | | | (11,402 | ) | | | (0.1 | ) |
ORIX Corp. | | | 4,900 | | | | 79,826 | | | | (1,251 | ) | | | (0.0 | )(a) |
| | | | | | | | | | | | | | | | |
| | | 18,600 | | | | 150,233 | | | | (12,653 | ) | | | (0.1 | ) |
| | | | | | | | | | | | | | | | |
Electric Utilities | | | | | | | | | | | | | |
Chubu Electric Power Co., Inc. | | | 5,300 | | | | 76,430 | | | | (5,278 | ) | | | (0.0 | )(a) |
Kansai Electric Power Co., Inc. (The) | | | 5,600 | | | | 85,711 | | | | (656 | ) | | | (0.0 | )(a) |
Tokyo Electric Power Co. Holdings, Inc.* | | | 15,200 | | | | 77,796 | | | | 1,248 | | | | 0.0 | (a) |
| | | | | | | | | | | | | | | | |
| | | 26,100 | | | | 239,937 | | | | (4,686 | ) | | | (0.0 | )(a) |
| | | | | | | | | | | | | | | | |
Electronic Equipment, Instruments & Components | | | | | | | | | | | | | |
Japan Aviation Electronics Industry Ltd.* | | | 5,000 | | | | 66,210 | | | | (16,445 | ) | | | (0.1 | ) |
Maruwa Co. Ltd. | | | 1,200 | | | | 67,818 | | | | (3,861 | ) | | | (0.0 | )(a) |
| | | | | | | | | | | | | | | | |
| | | 6,200 | | | | 134,028 | | | | (20,306 | ) | | | (0.1 | ) |
| | | | | | | | | | | | | | | | |
Entertainment | | | | | | | | | | | | | |
Capcom Co. Ltd. | | | 3,400 | | | | 70,873 | | | | (9,848 | ) | | | (0.1 | ) |
GungHo Online Entertainment, Inc.* | | | 18,500 | | | | 33,445 | | | | (1,836 | ) | | | (0.0 | )(a) |
| | | | | | | | | | | | | | | | |
| | | 21,900 | | | | 104,318 | | | | (11,684 | ) | | | (0.1 | ) |
| | | | | | | | | | | | | | | | |
Food Products | | | | | | | | | | | | | |
Fuji Oil Holdings, Inc. | | | 2,500 | | | | 72,106 | | | | (5,395 | ) | | | (0.0 | )(a) |
| | | | | | | | | | | | | | | | |
Health Care Providers & Services | | | | | | | | | | | | | |
Alfresa Holdings Corp. | | | 3,000 | | | | 80,015 | | | | (1,266 | ) | | | (0.0 | )(a) |
Medipal Holdings Corp. | | | 3,800 | | | | 81,343 | | | | (402 | ) | | | (0.0 | )(a) |
Suzuken Co. Ltd. | | | 1,900 | | | | 96,169 | | | | 4,364 | | | | 0.0 | (a) |
| | | | | | | | | | | | | | | | |
| | | 8,700 | | | | 257,527 | | | | 2,696 | | | | 0.0 | (a) |
| | | | | | | | | | | | | | | | |
Hotels, Restaurants & Leisure | | | | | | | | | | | | | |
Round One Corp. | | | 4,800 | | | | 56,932 | | | | (1,937 | ) | | | (0.0 | )(a) |
| | | | | | | | | | | | | | | | |
Household Durables | | | | | | | | | | | | | |
Nikon Corp. | | | 3,200 | | | | 55,785 | | | | (3,009 | ) | | | (0.0 | )(a) |
Sony Corp. | | | 1,000 | | | | 54,117 | | | | (4,156 | ) | | | (0.0 | )(a) |
Token Corp.* | | | 1,000 | | | | 64,778 | | | | 999 | | | | 0.0 | (a) |
| | | | | | | | | | | | | | | | |
| | | 5,200 | | | | 174,680 | | | | (6,166 | ) | | | (0.0 | )(a) |
| | | | | | | | | | | | | | | | |
Interactive Media & Services | | | | | | | | | | | | | |
Mixi, Inc. | | | 700 | | | | 15,295 | | | | (1,825 | ) | | | (0.0 | )(a) |
| | | | | | | | | | | | | | | | |
IT Services | | | | | | | | | | | | | |
NET One Systems Co. Ltd. | | | 3,400 | | | | 71,183 | | | | (2,627 | ) | | | (0.0 | )(a) |
Nihon Unisys Ltd. | | | 3,300 | | | | 72,317 | | | | (10,886 | ) | | | (0.1 | ) |
| | | | | | | | | | | | | | | | |
| | | 6,700 | | | | 143,500 | | | | (13,513 | ) | | | (0.1 | ) |
| | | | | | | | | | | | | | | | |
SEE NOTES TO FINANCIAL STATEMENTS.
| | | | | | |
| | | |
| 112 | | | | J.P. MORGAN EXCHANGE-TRADED FUNDS | | OCTOBER 31, 2018 |
| | | | | | | | | | | | | | | | |
| REFERENCE ENTITY | | SHARES | | | NOTIONAL
VALUE($) (1) | | | NET UNREALIZED
APPRECIATION
(DEPRECIATION)($) (2) | | | PERCENTAGE
OF NET
ASSETS (%) | |
Long Positions — continued | | | | | |
| | | |
Common Stocks — continued | | | | | | | | | | | | | |
Machinery | | | | | | | | | | | | | |
DMG Mori Co. Ltd. | | | 4,800 | | | | 69,255 | | | | (7,708 | ) | | | (0.0 | )(a) |
Hitachi Construction Machinery Co. Ltd. | | | 2,400 | | | | 63,721 | | | | (14,787 | ) | | | (0.1 | ) |
Japan Steel Works Ltd. (The) | | | 3,300 | | | | 69,737 | | | | (6,264 | ) | | | (0.0 | )(a) |
OKUMA Corp. | | | 1,500 | | | | 74,896 | | | | (5,469 | ) | | | (0.0 | )(a) |
Star Micronics Co. Ltd.* | | | 5,100 | | | | 72,448 | | | | (17,538 | ) | | | (0.1 | ) |
Takeuchi Manufacturing Co. Ltd.* | | | 3,600 | | | | 74,456 | | | | (16,254 | ) | | | (0.1 | ) |
| | | | | | | | | | | | | | | | |
| | | 20,700 | | | | 424,513 | | | | (68,020 | ) | | | (0.3 | ) |
| | | | | | | | | | | | | | | | |
Oil, Gas & Consumable Fuels | | | | | | | | | | | | | |
Cosmo Energy Holdings Co. Ltd. | | | 1,900 | | | | 69,879 | | | | (11,712 | ) | | | (0.1 | ) |
| | | | | | | | | | | | | | | | |
Pharmaceuticals | | | | | | | | | | | | | |
Kaken Pharmaceutical Co. Ltd. | | | 1,600 | | | | 80,225 | | | | (4,048 | ) | | | (0.0 | )(a) |
Sumitomo Dainippon Pharma Co. Ltd. | | | 3,800 | | | | 79,396 | | | | (11,355 | ) | | | (0.1 | ) |
Taisho Pharmaceutical Holdings Co. Ltd. | | | 700 | | | | 74,639 | | | | (8,382 | ) | | | (0.0 | )(a) |
| | | | | | | | | | | | | | | | |
| | | 6,100 | | | | 234,260 | | | | (23,785 | ) | | | (0.1 | ) |
| | | | | | | | | | | | | | | | |
Road & Rail | | | | | | | | | | | | | |
Central Japan Railway Co. | | | 400 | | | | 76,764 | | | | (7,099 | ) | | | (0.0 | )(a) |
Seino Holdings Co. Ltd. | | | 5,300 | | | | 73,396 | | | | (3,537 | ) | | | (0.0 | )(a) |
| | | | | | | | | | | | | | | | |
| | | 5,700 | | | | 150,160 | | | | (10,636 | ) | | | (0.0 | )(a) |
| | | | | | | | | | | | | | | | |
Semiconductors & Semiconductor Equipment | | | | | | | | | | | | | |
Advantest Corp. | | | 3,800 | | | | 70,150 | | | | (3,372 | ) | | | (0.0 | )(a) |
| | | | | | | | | | | | | | | | |
Specialty Retail | | | | | | | | | | | | | |
Aoyama Trading Co. Ltd. | | | 2,100 | | | | 63,532 | | | | (972 | ) | | | (0.0 | )(a) |
Shimachu Co. Ltd. | | | 2,000 | | | | 52,428 | | | | (10,404 | ) | | | (0.1 | ) |
| | | | | | | | | | | | | | | | |
| | | 4,100 | | | | 115,960 | | | | (11,376 | ) | | | (0.1 | ) |
| | | | | | | | | | | | | | | | |
Trading Companies & Distributors | | | | | | | | | | | | | |
Kanamoto Co. Ltd. | | | 2,300 | | | | 76,856 | | | | (6,494 | ) | | | (0.0 | )(a) |
Mitsubishi Corp. | | | 2,600 | | | | 73,178 | | | | (10,034 | ) | | | (0.1 | ) |
Mitsui & Co. Ltd. | | | 4,900 | | | | 81,872 | | | | (8,916 | ) | | | (0.0 | )(a) |
Sojitz Corp. | | | 22,900 | | | | 77,012 | | | | (7,270 | ) | | | (0.0 | )(a) |
| | | | | | | | | | | | | | | | |
| | | 32,700 | | | | 308,918 | | | | (32,714 | ) | | | (0.1 | ) |
| | | | | | | | | | | | | | | | |
Wireless Telecommunication Services | | | | | | | | | | | | | |
KDDI Corp. | | | 3,000 | | | | 72,600 | | | | (6,966 | ) | | | (0.0 | )(a) |
| | | | | | | | | | | | | | | | |
Total Long Positions of Total Return Basket Swap | | | 254,600 | | | | 3,705,193 | | | | (332,486 | ) | | | (1.4 | ) |
| | | | | | | | | | | | | | | | |
| |
Short Positions | | | | | |
| | | |
Common Stocks | | | | | | | | | | | | | |
Auto Components | | | | | | | | | | | | | |
Toyo Tire & Rubber Co. Ltd. | | | (3,400 | ) | | | (56,717 | ) | | | 1,015 | | | | 0.0 | (a) |
| | | | | | | | | | | | | | | | |
Banks | | | | | | | | | | | | | |
Japan Post Bank Co. Ltd. | | | (5,900 | ) | | | (68,786 | ) | | | (1,906 | ) | | | (0.0 | )(a) |
Seven Bank Ltd. | | | (24,500 | ) | | | (76,569 | ) | | | (1,432 | ) | | | (0.0 | )(a) |
| | | | | | | | | | | | | | | | |
| | | (30,400 | ) | | | (145,355 | ) | | | (3,338 | ) | | | (0.0 | )(a) |
| | | | | | | | | | | | | | | | |
Building Products | | | | | | | | | | | | | |
TOTO Ltd. | | | (1,600 | ) | | | (57,242 | ) | | | 10,406 | | | | 0.1 | |
| | | | | | | | | | | | | | | | |
Chemicals | | | | | | | | | | | | | |
Air Water, Inc. | | | (4,000 | ) | | | (64,796 | ) | | | 5,811 | | | | 0.0 | (a) |
SEE NOTES TO FINANCIAL STATEMENTS.
| | | | | | | | |
| | | |
| OCTOBER 31, 2018 | | J.P. MORGAN EXCHANGE-TRADED FUNDS | | | | | 113 | |
JPMorgan Long/Short ETF
SCHEDULE OF PORTFOLIO INVESTMENTS
AS OF OCTOBER 31, 2018 (continued)
| | | | | | | | | | | | | | | | |
| REFERENCE ENTITY | | SHARES | | | NOTIONAL
VALUE($) (1) | | | NET UNREALIZED
APPRECIATION
(DEPRECIATION)($) (2) | | | PERCENTAGE
OF NET
ASSETS (%) | |
Short Positions — continued | | | | | |
| | | |
Common Stocks — continued | | | | | | | | | | | | | |
Chemicals — continued | | | | | | | | | | | | | |
Hitachi Chemical Co. Ltd. | | | (3,900 | ) | | | (61,472 | ) | | | 9,442 | | | | 0.1 | |
Kansai Paint Co. Ltd. | | | (1,300 | ) | | | (19,209 | ) | | | (318 | ) | | | (0.0 | )(a) |
Nippon Paint Holdings Co. Ltd. | | | (2,200 | ) | | | (68,721 | ) | | | 4,155 | | | | 0.0 | (a) |
Tokyo Ohka Kogyo Co. Ltd.* | | | (2,600 | ) | | | (69,636 | ) | | | 2,649 | | | | 0.0 | (a) |
| | | | | | | | | | | | | | | | |
| | | (14,000 | ) | | | (283,834 | ) | | | 21,739 | | | | 0.1 | |
| | | | | | | | | | | | | | | | |
Commercial Services & Supplies | | | | | | | | | | | | | |
Park24 Co. Ltd. | | | (2,300 | ) | | | (60,509 | ) | | | 11,117 | | | | 0.1 | |
Sohgo Security Services Co. Ltd. | | | (1,500 | ) | | | (66,811 | ) | | | (636 | ) | | | (0.0 | )(a) |
Toppan Printing Co. Ltd. | | | (4,300 | ) | | | (60,791 | ) | | | 8,214 | | | | 0.0 | (a) |
| | | | | | | | | | | | | | | | |
| | | (8,100 | ) | | | (188,111 | ) | | | 18,695 | | | | 0.1 | |
| | | | | | | | | | | | | | | | |
Construction & Engineering | | | | | | | | | | | | | |
Chiyoda Corp. | | | (8,600 | ) | | | (42,793 | ) | | | 22,443 | | | | 0.1 | |
| | | | | | | | | | | | | | | | |
Containers & Packaging | | | | | | | | | | | | | |
FP Corp. | | | (1,300 | ) | | | (66,622 | ) | | | 6,163 | | | | 0.0 | (a) |
| | | | | | | | | | | | | | | | |
Electrical Equipment | | | | | | | | | | | | | |
GS Yuasa Corp. | | | (600 | ) | | | (12,316 | ) | | | (28 | ) | | | (0.0 | )(a) |
Mabuchi Motor Co. Ltd. | | | (2,000 | ) | | | (71,143 | ) | | | 702 | | | | 0.0 | (a) |
| | | | | | | | | | | | | | | | |
| | | (2,600 | ) | | | (83,459 | ) | | | 674 | | | | 0.0 | (a) |
| | | | | | | | | | | | | | | | |
Electronic Equipment, Instruments & Components | | | | | | | | | | | | | |
Alps Electric Co. Ltd. | | | (1,300 | ) | | | (30,645 | ) | | | 2,976 | | | | 0.0 | (a) |
Hirose Electric Co. Ltd. | | | (700 | ) | | | (66,715 | ) | | | 4,144 | | | | 0.0 | (a) |
Murata Manufacturing Co. Ltd. | | | (100 | ) | | | (15,564 | ) | | | (1,682 | ) | | | (0.0 | )(a) |
| | | | | | | | | | | | | | | | |
| | | (2,100 | ) | | | (112,924 | ) | | | 5,438 | | | | 0.0 | (a) |
| | | | | | | | | | | | | | | | |
Food & Staples Retailing | | | | | | | | | | | | | |
Cosmos Pharmaceutical Corp. | | | (300 | ) | | | (61,319 | ) | | | 4,847 | | | | 0.0 | (a) |
| | | | | | | | | | | | | | | | |
Food Products | | | | | | | | | | | | | |
Calbee, Inc. | | | (2,100 | ) | | | (69,672 | ) | | | 1,113 | | | | 0.0 | (a) |
Ezaki Glico Co. Ltd. | | | (1,400 | ) | | | (69,790 | ) | | | 946 | | | | 0.0 | (a) |
Kewpie Corp. | | | (2,900 | ) | | | (66,661 | ) | | | 835 | | | | 0.0 | (a) |
Yamazaki Baking Co. Ltd.* | | | (3,800 | ) | | | (68,496 | ) | | | (312 | ) | | | (0.0 | )(a) |
| | | | | | | | | | | | | | | | |
| | | (10,200 | ) | | | (274,619 | ) | | | 2,582 | | | | 0.0 | (a) |
| | | | | | | | | | | | | | | | |
Hotels, Restaurants & Leisure | | | | | | | | | | | | | |
HIS Co. Ltd. | | | (300 | ) | | | (9,137 | ) | | | 22 | | | | 0.0 | (a) |
Kyoritsu Maintenance Co. Ltd. | | | (1,200 | ) | | | (53,312 | ) | | | 875 | | | | 0.0 | (a) |
Resorttrust, Inc. | | | (3,700 | ) | | | (56,982 | ) | | | 754 | | | | 0.0 | (a) |
Toridoll Holdings Corp.* | | | (2,200 | ) | | | (37,263 | ) | | | 2,875 | | | | 0.0 | (a) |
| | | | | | | | | | | | | | | | |
| | | (7,400 | ) | | | (156,694 | ) | | | 4,526 | | | | 0.0 | (a) |
| | | | | | | | | | | | | | | | |
Household Durables | | | | | | | | | | | | | |
Fujitsu General Ltd. | | | (3,800 | ) | | | (56,924 | ) | | | 3,852 | | | | 0.0 | (a) |
Panasonic Corp. | | | (4,400 | ) | | | (47,218 | ) | | | 3,610 | | | | 0.0 | (a) |
| | | | | | | | | | | | | | | | |
| | | (8,200 | ) | | | (104,142 | ) | | | 7,462 | | | | 0.0 | (a) |
| | | | | | | | | | | | | | | | |
Industrial Conglomerates | | | | | | | | | | | | | |
Seibu Holdings, Inc. | | | (3,700 | ) | | | (67,128 | ) | | | 5,027 | | | | 0.0 | (a) |
| | | | | | | | | | | | | | | | |
Insurance | | | | | | | | | | | | | |
Japan Post Insurance Co. Ltd. | | | (2,800 | ) | | | (66,687 | ) | | | 1,200 | | | | 0.0 | (a) |
T&D Holdings, Inc. | | | (4,100 | ) | | | (65,542 | ) | | | 6,700 | | | | 0.1 | |
| | | | | | | | | | | | | | | | |
| | | (6,900 | ) | | | (132,229 | ) | | | 7,900 | | | | 0.1 | |
| | | | | | | | | | | | | | | | |
SEE NOTES TO FINANCIAL STATEMENTS.
| | | | | | |
| | | |
| 114 | | | | J.P. MORGAN EXCHANGE-TRADED FUNDS | | OCTOBER 31, 2018 |
| | | | | | | | | | | | | | | | |
| REFERENCE ENTITY | | SHARES | | | NOTIONAL
VALUE($) (1) | | | NET UNREALIZED
APPRECIATION
(DEPRECIATION)($) (2) | | | PERCENTAGE
OF NET
ASSETS (%) | |
Short Positions — continued | | | | | |
| | | |
Common Stocks — continued | | | | | | | | | | | | | |
Interactive Media & Services | | | | | | | | | | | | | |
LINE Corp.* | | | (1,000 | ) | | | (31,882 | ) | | | 4,035 | | | | 0.0 | (a) |
| | | | | | | | | | | | | | | | |
IT Services | | | | | | | | | | | | | |
GMO internet, Inc. | | | (700 | ) | | | (10,003 | ) | | | 965 | | | | 0.0 | (a) |
Itochu Techno-Solutions Corp. | | | (3,100 | ) | | | (58,789 | ) | | | 5,565 | | | | 0.0 | (a) |
| | | | | | | | | | | | | | | | |
| | | (3,800 | ) | | | (68,792 | ) | | | 6,530 | | | | 0.0 | (a) |
| | | | | | | | | | | | | | | | |
Leisure Products | | | | | | | | | | | | | |
Bandai Namco Holdings, Inc. | | | (1,500 | ) | | | (53,362 | ) | | | 846 | | | | 0.0 | (a) |
| | | | | | | | | | | | | | | | |
Machinery | | | | | | | | | | | | | |
Daifuku Co. Ltd. | | | (1,600 | ) | | | (68,714 | ) | | | 5,573 | | | | 0.0 | (a) |
Kawasaki Heavy Industries Ltd. | | | (2,500 | ) | | | (59,246 | ) | | | 12,371 | | | | 0.1 | |
MISUMI Group, Inc. | | | (3,200 | ) | | | (64,131 | ) | | | 11,282 | | | | 0.0 | (a) |
Mitsui E&S Holdings Co. Ltd.* | | | (3,800 | ) | | | (63,810 | ) | | | 6,932 | | | | 0.0 | (a) |
Miura Co. Ltd. | | | (2,700 | ) | | | (65,939 | ) | | | 12,674 | | | | 0.1 | |
Nabtesco Corp. | | | (3,000 | ) | | | (65,853 | ) | | | (3,341 | ) | | | (0.0 | )(a) |
NGK Insulators Ltd. | | | (4,200 | ) | | | (59,111 | ) | | | 6,332 | | | | 0.0 | (a) |
| | | | | | | | | | | | | | | | |
| | | (21,000 | ) | | | (446,804 | ) | | | 51,823 | | | | 0.2 | |
| | | | | | | | | | | | | | | | |
Marine | | | | | | | | | | | | | |
Kawasaki Kisen Kaisha Ltd.* | | | (1,300 | ) | | | (17,323 | ) | | | 359 | | | | 0.0 | (a) |
| | | | | | | | | | | | | | | | |
Metals & Mining | | | | | | | | | | | | | |
Dowa Holdings Co. Ltd. | | | (2,300 | ) | | | (66,938 | ) | | | (1,425 | ) | | | (0.0 | )(a) |
Hitachi Metals Ltd. | | | (5,500 | ) | | | (64,674 | ) | | | 1,107 | | | | 0.0 | (a) |
Mitsubishi Materials Corp. | | | (2,300 | ) | | | (63,675 | ) | | | 5,774 | | | | 0.0 | (a) |
UACJ Corp. | | | (2,800 | ) | | | (61,035 | ) | | | 6,659 | | | | 0.1 | |
| | | | | | | | | | | | | | | | |
| | | (12,900 | ) | | | (256,322 | ) | | | 12,115 | | | | 0.1 | |
| | | | | | | | | | | | | | | | |
Multiline Retail | | | | | | | | | | | | | |
Marui Group Co. Ltd. | | | (500 | ) | | | (10,766 | ) | | | (126 | ) | | | (0.0 | )(a) |
Takashimaya Co. Ltd. | | | (3,700 | ) | | | (58,229 | ) | | | 1,171 | | | | 0.0 | (a) |
| | | | | | | | | | | | | | | | |
| | | (4,200 | ) | | | (68,995 | ) | | | 1,045 | | | | 0.0 | (a) |
| | | | | | | | | | | | | | | | |
Paper & Forest Products | | | | | | | | | | | | | |
Nippon Paper Industries Co. Ltd. | | | (3,700 | ) | | | (67,036 | ) | | | 965 | | | | 0.0 | (a) |
| | | | | | | | | | | | | | | | |
Pharmaceuticals | | | | | | | | | | | | | |
Nippon Shinyaku Co. Ltd. | | | (1,100 | ) | | | (63,196 | ) | | | 7,255 | | | | 0.0 | (a) |
Ono Pharmaceutical Co. Ltd. | | | (2,900 | ) | | | (65,812 | ) | | | 11,999 | | | | 0.1 | |
| | | | | | | | | | | | | | | | |
| | | (4,000 | ) | | | (129,008 | ) | | | 19,254 | | | | 0.1 | |
| | | | | | | | | | | | | | | | |
Professional Services | | | | | | | | | | | | | |
Persol Holdings Co. Ltd. | | | (3,300 | ) | | | (62,606 | ) | | | 9,941 | | | | 0.1 | |
| | | | | | | | | | | | | | | | |
Road & Rail | | | | | | | | | | | | | |
Keikyu Corp. | | | (4,600 | ) | | | (68,080 | ) | | | 7,710 | | | | 0.0 | (a) |
| | | | | | | | | | | | | | | | |
Semiconductors & Semiconductor Equipment | | | | | | | | | | | | | |
Renesas Electronics Corp.* | | | (7,800 | ) | | | (41,090 | ) | | | 2,942 | | | | 0.0 | (a) |
Rohm Co. Ltd. | | | (1,100 | ) | | | (77,335 | ) | | | (4,453 | ) | | | (0.0 | )(a) |
| | | | | | | | | | | | | | | | |
| | | (8,900 | ) | | | (118,425 | ) | | | (1,511 | ) | | | (0.0 | )(a) |
| | | | | | | | | | | | | | | | |
Specialty Retail | | | | | | | | | | | | | |
Nitori Holdings Co. Ltd. | | | (400 | ) | | | (52,229 | ) | | | 1,047 | | | | 0.0 | (a) |
| | | | | | | | | | | | | | | | |
Technology Hardware, Storage & Peripherals | | | | | | | | | | | | | |
Seiko Epson Corp. | | | (4,200 | ) | | | (67,667 | ) | | | 2,740 | | | | 0.0 | (a) |
| | | | | | | | | | | | | | | | |
SEE NOTES TO FINANCIAL STATEMENTS.
| | | | | | | | |
| | | |
| OCTOBER 31, 2018 | | J.P. MORGAN EXCHANGE-TRADED FUNDS | | | | | 115 | |
JPMorgan Long/Short ETF
SCHEDULE OF PORTFOLIO INVESTMENTS
AS OF OCTOBER 31, 2018 (continued)
| | | | | | | | | | | | | | | | |
| REFERENCE ENTITY | | SHARES | | | NOTIONAL
VALUE($) (1) | | | NET UNREALIZED
APPRECIATION
(DEPRECIATION)($) (2) | | | PERCENTAGE
OF NET
ASSETS (%) | |
Short Positions — continued | | | | | |
| | | |
Common Stocks — continued | | | | | | | | | | | | | |
Wireless Telecommunication Services | | | | | | | | | | | | | |
SoftBank Group Corp. | | | (800 | ) | | | (63,311 | ) | | | 7,435 | | | | 0.0 | (a) |
| | | | | | | | | | | | | | | | |
Total Short Positions of Total Return Basket Swap | | | (184,400 | ) | | | (3,405,030 | ) | | | 239,913 | | | | 1.0 | |
| | | | | | | | | | | | | | | | |
Total of Long and Short Positions of Total Return Basket Swap | | | 70,200 | | | | 300,163 | | | | (92,573 | ) | | | (0.4 | ) |
| | | | | | | | | | | | | | | | |
| | | | | | | | | | | | | | | | | | | | |
| COUNTERPARTY | | DESCRIPTION | | TERMINATION
DATE | | NOTIONAL
VALUE (1) | | | NET UNREALIZED
APPRECIATION
(DEPRECIATION) (2) | | | NET CASH
AND OTHER
RECEIVABLES
(PAYABLES) | | | VALUE | |
| Goldman Sachs | | The Fund receives the total return on a portfolio of long and short equity positions and pays or receives the net of one day OIS-RBA and one month BBR on long positions and short positions respectively, plus or minus a specified spread (rates range from (1.25)% to 0.30%), which is denominated in AUD based on the local currencies of the positions within the swaps. | | 11/14/2018 —
10/27/2028 | | $ | 69,921 | | | $ | (21,113 | ) | | $ | (6,438 | ) | | $ | (27,551 | ) |
| | | | | | | | | | | | | | | | | | | | |
| | | | | | | | | | | | | | | | |
| REFERENCE ENTITY | | SHARES | | | NOTIONAL
VALUE($) (1) | | | NET UNREALIZED
APPRECIATION
(DEPRECIATION)($) (2) | | | PERCENTAGE
OF NET
ASSETS (%) | |
Long Positions | | | | | |
| | | |
Common Stocks | | | | | | | | | | | | | |
Airlines | | | | | | | | | | | | | |
Qantas Airways Ltd. | | | 19,866 | | | | 77,115 | | | | (667 | ) | | | (0.0 | )(a) |
| | | | | | | | | | | | | | | | |
IT Services | | | | | | | | | | | | | |
Computershare Ltd. | | | 6,215 | | | | 87,275 | | | | (2,201 | ) | | | (0.0 | )(a) |
| | | | | | | | | | | | | | | | |
Media | | | | | | | | | | | | | |
Nine Entertainment Co. Holdings Ltd. | | | 61,767 | | | | 74,181 | | | | (13,338 | ) | | | (0.1 | ) |
| | | | | | | | | | | | | | | | |
Metals & Mining | | | | | | | | | | | | | |
Alumina Ltd. | | | 40,384 | | | | 73,290 | | | | (5,350 | ) | | | (0.0 | )(a) |
Iluka Resources Ltd. | | | 11,544 | | | | 66,300 | | | | (8,337 | ) | | | (0.1 | ) |
| | | | | | | | | | | | | | | | |
| | | 51,928 | | | | 139,590 | | | | (13,687 | ) | | | (0.1 | ) |
| | | | | | | | | | | | | | | | |
Oil, Gas & Consumable Fuels | | | | | | | | | | | | | |
Santos Ltd. | | | 15,905 | | | | 74,651 | | | | 17 | | | | 0.0 | (a) |
Woodside Petroleum Ltd. | | | 3,227 | | | | 79,450 | | | | (7,464 | ) | | | (0.0 | )(a) |
| | | | | | | | | | | | | | | | |
| | | 19,132 | | | | 154,101 | | | | (7,447 | ) | | | (0.0 | )(a) |
| | | | | | | | | | | | | | | | |
Total Long Positions of Total Return Basket Swap | | | 158,908 | | | | 532,262 | | | | (37,340 | ) | | | (0.2 | ) |
| | | | | | | | | | | | | | | | |
| |
Short Positions | | | | | |
| | | |
Common Stocks | | | | | | | | | | | | | |
Chemicals | | | | | | | | | | | | | |
Orica Ltd. | | | (5,584 | ) | | | (68,035 | ) | | | (1,768 | ) | | | (0.0 | )(a) |
| | | | | | | | | | | | | | | | |
Construction Materials | | | | | | | | | | | | | |
Boral Ltd. | | | (14,845 | ) | | | (59,139 | ) | | | 10,252 | | | | 0.1 | |
| | | | | | | | | | | | | | | | |
SEE NOTES TO FINANCIAL STATEMENTS.
| | | | | | |
| | | |
| 116 | | | | J.P. MORGAN EXCHANGE-TRADED FUNDS | | OCTOBER 31, 2018 |
| | | | | | | | | | | | | | | | |
| REFERENCE ENTITY | | SHARES | | | NOTIONAL
VALUE($) (1) | | | NET UNREALIZED
APPRECIATION
(DEPRECIATION)($) (2) | | | PERCENTAGE
OF NET
ASSETS (%) | |
Short Positions — continued | | | | | |
| | | |
Common Stocks — continued | | | | | | | | | | | | | |
Containers & Packaging | | | | | | | | | | | | | |
Amcor Ltd. | | | (6,754 | ) | | | (63,732 | ) | | | (985 | ) | | | (0.0 | )(a) |
| | | | | | | | | | | | | | | | |
Diversified Financial Services | | | | | | | | | | | | | |
Challenger Ltd. | | | (7,924 | ) | | | (57,709 | ) | | | 3,492 | | | | 0.0 | (a) |
| | | | | | | | | | | | | | | | |
Hotels, Restaurants & Leisure | | | | | | | | | | | | | |
Domino’s Pizza Enterprises Ltd. | | | (1,343 | ) | | | (51,473 | ) | | | (1,724 | ) | | | (0.0 | )(a) |
Star Entertainment Grp Ltd. (The) | | | (14,859 | ) | | | (50,107 | ) | | | 2,722 | | | | 0.0 | (a) |
Tabcorp Holdings Ltd. | | | (15,513 | ) | | | (50,909 | ) | | | 1,374 | | | | 0.0 | (a) |
| | | | | | | | | | | | | | | | |
| | | (31,715 | ) | | | (152,489 | ) | | | 2,372 | | | | 0.0 | (a) |
| | | | | | | | | | | | | | | | |
Transportation Infrastructure | | | | | | | | | | | | | |
Qube Holdings Ltd. | | | (35,215 | ) | | | (61,237 | ) | | | 2,864 | | | | 0.0 | (a) |
| | | | | | | | | | | | | | | | |
Total Short Positions of Total Return Basket Swap | | | (102,037 | ) | | | (462,341 | ) | | | 16,227 | | | | 0.1 | |
| | | | | | | | | | | | | | | | |
Total of Long and Short Positions of Total Return Basket Swap | | | 56,871 | | | | 69,921 | | | | (21,113 | ) | | | (0.1 | ) |
| | | | | | | | | | | | | | | | |
Abbreviations
| | |
| AUD | | — Australian Dollar |
| BA | | — Banker’s Acceptance Rate |
| BBR | | — Bank Base Rate |
| BOJ | | — Bank of Japan |
| CAD | | — Canadian Dollar |
| CHF | | — Swiss Franc |
| CORRA | | — Canadian Overnight Repo Rate Average |
| EONIA | | — Euro Over Night Index Average |
| EUR | | — Euro |
| EURIBOR | | — Euro Interbank Offered Rate |
| FEDEF | | — US Federal Fund Effective Rate (Continuous Series) |
| GBP | | — British Pound |
| JPY | | — Japanese Yen |
| LIBOR | | — London Interbank Offered Rate |
| OIS-RBA | | — Overnight Indexed Swap-Reserve Bank of Australia |
| SONIA | | — Sterling Overnight Index Average |
| | |
| TONAR | | — Tokyo Overnight Average Rate |
| USD | | — United States Dollar |
| (a) | | — Amount rounds to less than 0.1% of net assets. |
| (b) | | — Security exempt from registration pursuant to Regulation S under the Securities Act of 1933, as amended. Regulation S applies to securities offerings that are made outside of the United States and do not involve direct selling efforts in the United States and as such may have restrictions on resale. |
| * | | — Non-income producing security. |
| (1) | | — Notional value represents market value, as of October 31, 2018, of these positions based on the securities’ last sale or closing price on the principal exchange on which the securities are traded. |
| (2) | | — Unrealized appreciation (depreciation) represents the unrealized gain(loss) of the positions subsequent to the swap reset. |
SEE NOTES TO FINANCIAL STATEMENTS.
| | | | | | | | |
| | | |
| OCTOBER 31, 2018 | | J.P. MORGAN EXCHANGE-TRADED FUNDS | | | | | 117 | |
JPMorgan Long/Short ETF
SCHEDULE OF PORTFOLIO INVESTMENTS
AS OF OCTOBER 31, 2018 (continued)
The following reference rates, and their values as of period-end, are used for security descriptions:
| | | | | | |
| | | | | Value | |
| 1 day CHF LIBOR | | | | | (0.78 | )% |
| 1 month CHF LIBOR | | | | | (0.78 | )% |
| BA | | | | | 2.08 | % |
| BBR | | | | | 1.85 | % |
| BOJ TONAR | | | | | (0.10 | )% |
| CORRA | | | | | 1.76 | % |
| EONIA | | | | | (0.34 | )% |
| EURIBOR | | | | | (0.37 | )% |
| FEDEF | | | | | 2.20 | % |
| GBP LIBOR | | | | | 0.73 | % |
| JPY LIBOR | | | | | (0.10 | )% |
| OIS-RBA | | | | | 1.50 | % |
| SONIA | | | | | 0.70 | % |
| USD LIBOR | | | | | 2.31 | % |
| | | | | | | | |
| Summary of total swap contracts outstanding as of October 31, 2018: | |
| | | Net Upfront Payments (Receipts)($) | | | Value($) | |
Assets | |
Total return basket swaps contracts outstanding | | | – | | | | 1,099,613 | |
| | | | | | | | |
|
Liabilities | |
| |
Total return basket swaps contracts outstanding | | | – | | | | (64,462 | ) |
| | | | | | | | |
SEE NOTES TO FINANCIAL STATEMENTS.
| | | | | | |
| | | |
| 118 | | | | J.P. MORGAN EXCHANGE-TRADED FUNDS | | OCTOBER 31, 2018 |
JPMorgan Managed Futures Strategy ETF
CONSOLIDATED SCHEDULE OF PORTFOLIO INVESTMENTS
AS OF OCTOBER 31, 2018
| | | | | | | | |
| INVESTMENTS | | SHARES | | | VALUE($) | |
Short-Term Investments — 83.7% | | | | | |
Investment Companies — 83.7% | | | | | | | | |
JPMorgan U.S. Government Money Market Fund Class Institutional Shares, 2.02% (a) (b)
(Cost $42,503,224) | | | 42,503,224 | | | | 42,503,224 | |
| | | | | | | | |
Total Investments — 83.7%
(Cost 42,503,224) | | | | | | | 42,503,224 | |
Other Assets Less Liabilities — 16.3% | | | | | | | 8,294,725 | |
| | | | | | | | |
Net Assets — 100.0% | | | | | | | 50,797,949 | |
| | | | | | | | |
Percentages indicated are based on net assets.
| | |
| (a) | | Investmentin affiliate. Fund is registered under the Investment Company Act of 1940, as amended, and advised by J.P. Morgan Investment Management Inc. |
| (b) | | Therate shown is the current yield as of October 31, 2018. |
| | | | | | | | | | | | | | | | | | | | |
| Futures contracts outstanding as of October 31, 2018: | |
| Description | | Number of
Contracts | | | Expiration
Date | | | Trading
Currency | | | Notional
Amount($) | | | Value and
Unrealized
Appreciation
(Depreciation)($) | |
Long Contracts | |
CAC 40 10 Euro Index | | | 7 | | | | 11/2018 | | | | EUR | | | | 402,334 | | | | (7,455 | ) |
LME Nickel Base Metal | | | 4 | | | | 11/2018 | | | | USD | | | | 274,572 | | | | (23,742 | ) |
LME Zinc Base Metal | | | 28 | | | | 11/2018 | | | | USD | | | | 1,782,725 | | | | (38,271 | ) |
WTI Crude Oil | | | 26 | | | | 11/2018 | | | | USD | | | | 1,692,600 | | | | (200,249 | ) |
Australia 10 Year Bond | | | 243 | | | | 12/2018 | | | | AUD | | | | 22,269,391 | | | | (71,863 | ) |
Australia 3 Year Bond | | | 108 | | | | 12/2018 | | | | AUD | | | | 8,522,665 | | | | (3,856 | ) |
Canada 10 Year Bond | | | 6 | | | | 12/2018 | | | | CAD | | | | 602,256 | | | | (315 | ) |
Cotton No. 2 | | | 50 | | | | 12/2018 | | | | USD | | | | 1,921,500 | | | | (186,371 | ) |
Euro-Bobl | | | 32 | | | | 12/2018 | | | | EUR | | | | 4,764,379 | | | | (1,566 | ) |
Euro-Bund | | | 13 | | | | 12/2018 | | | | EUR | | | | 2,359,593 | | | | (426 | ) |
Euro-Buxl | | | 6 | | | | 12/2018 | | | | EUR | | | | 1,201,651 | | | | 803 | |
FTSE 100 Index | | | 1 | | | | 12/2018 | | | | GBP | | | | 90,567 | | | | (2,414 | ) |
Lean Hogs | | | 36 | | | | 12/2018 | | | | USD | | | | 841,680 | | | | (13,926 | ) |
Live Cattle | | | 31 | | | | 12/2018 | | | | USD | | | | 1,450,180 | | | | 879 | |
LME Aluminum Base Metal | | | 8 | | | | 12/2018 | | | | USD | | | | 391,700 | | | | (22,300 | ) |
LME Nickel Base Metal | | | 1 | | | | 12/2018 | | | | USD | | | | 68,799 | | | | (5,607 | ) |
LME Zinc Base Metal | | | 8 | | | | 12/2018 | | | | USD | | | | 502,950 | | | | (16,874 | ) |
Natural Gas | | | 31 | | | | 12/2018 | | | | USD | | | | 1,030,130 | | | | (9,980 | ) |
S&P 500 E-Mini Index | | | 15 | | | | 12/2018 | | | | USD | | | | 2,032,650 | | | | (138,435 | ) |
SPI 200 Index | | | 15 | | | | 12/2018 | | | | AUD | | | | 1,544,540 | | | | (89,858 | ) |
U.S. Treasury 10 Year Note | | | 150 | | | | 12/2018 | | | | USD | | | | 17,772,656 | | | | (270,268 | ) |
WTI Crude Oil | | | 4 | | | | 12/2018 | | | | USD | | | | 260,960 | | | | (34,351 | ) |
Feeder Cattle | | | 37 | | | | 01/2019 | | | | USD | | | | 2,777,313 | | | | (23,497 | ) |
LME Aluminum Base Metal | | | 2 | | | | 01/2019 | | | | USD | | | | 97,425 | | | | (2,813 | ) |
100 oz Gold | | | 7 | | | | 02/2019 | | | | USD | | | | 856,590 | | | | 19,321 | |
Copper | | | 9 | | | | 05/2019 | | | | USD | | | | 605,025 | | | | (25,137 | ) |
| | | | | | | | | | | | | | | | | | | | |
| | | | | | | | | | | | | | | | | | | (1,168,571 | ) |
| | | | | | | | | | | | | | | | | | | | |
| | | | | |
Short Contracts | | | | | | | | | | | | | | | | | | | | |
IBEX 35 Index | | | (19 | ) | | | 11/2018 | | | | EUR | | | | (1,910,629 | ) | | | 14,617 | |
LME Zinc Base Metal | | | (17 | ) | | | 11/2018 | | | | USD | | | | (1,082,369 | ) | | | (42,551 | ) |
SEE NOTES TO FINANCIAL STATEMENTS.
| | | | | | | | |
| | | |
| OCTOBER 31, 2018 | | J.P. MORGAN EXCHANGE-TRADED FUNDS | | | | | 119 | |
JPMorgan Managed Futures Strategy ETF
CONSOLIDATED SCHEDULE OF PORTFOLIO INVESTMENTS
AS OF OCTOBER 31, 2018 (continued)
| | | | | | | | | | | | | | | | | | | | |
| Description | | Number of
Contracts | | | Expiration
Date | | | Trading
Currency | | | Notional
Amount($) | | | Value and
Unrealized
Appreciation
(Depreciation)($) | |
Natural Gas | | | (32 | ) | | | 11/2018 | | | | USD | | | | (1,050,880 | ) | | | (87,640 | ) |
100 oz Gold | | | (18 | ) | | | 12/2018 | | | | USD | | | | (2,192,940 | ) | | | 9,532 | |
Canada 10 Year Bond | | | (35 | ) | | | 12/2018 | | | | CAD | | | | (3,513,160 | ) | | | 49,609 | |
Cocoa | | | (4 | ) | | | 12/2018 | | | | USD | | | | (89,360 | ) | | | 2,418 | |
Coffee ‘C’ | | | (20 | ) | | | 12/2018 | | | | USD | | | | (845,250 | ) | | | 15,465 | |
Copper | | | (12 | ) | | | 12/2018 | | | | USD | | | | (796,500 | ) | | | 7,318 | |
Corn | | | (53 | ) | | | 12/2018 | | | | USD | | | | (962,613 | ) | | | 68,769 | |
Cotton No. 2 | | | (3 | ) | | | 12/2018 | | | | USD | | | | (115,290 | ) | | | 2,486 | |
DAX Index | | | (5 | ) | | | 12/2018 | | | | EUR | | | | (1,617,212 | ) | | | 64,758 | |
EURO STOXX 50 Index | | | (36 | ) | | | 12/2018 | | | | EUR | | | | (1,297,473 | ) | | | 14,254 | |
Euro-Bund | | | (28 | ) | | | 12/2018 | | | | EUR | | | | (5,082,200 | ) | | | 3,650 | |
Euro-Schatz | | | (102 | ) | | | 12/2018 | | | | EUR | | | | (12,937,660 | ) | | | (26,721 | ) |
FTSE/MIB Index | | | (10 | ) | | | 12/2018 | | | | EUR | | | | (1,073,667 | ) | | | 88,988 | |
Hang Seng Index | | | (7 | ) | | | 12/2018 | | | | HKD | | | | (1,115,985 | ) | | | 17,706 | |
Japan 10 Year Bond | | | (15 | ) | | | 12/2018 | | | | JPY | | | | (20,012,408 | ) | | | (50,679 | ) |
Lean Hogs | | | (12 | ) | | | 12/2018 | | | | USD | | | | (280,560 | ) | | | (5,475 | ) |
Live Cattle | | | (6 | ) | | | 12/2018 | | | | USD | | | | (280,680 | ) | | | 4,602 | |
LME Aluminum Base Metal | | | (8 | ) | | | 12/2018 | | | | USD | | | | (391,700 | ) | | | 23,769 | |
LME Nickel Base Metal | | | (4 | ) | | | 12/2018 | | | | USD | | | | (275,196 | ) | | | 36,054 | |
Long Gilt | | | (87 | ) | | | 12/2018 | | | | GBP | | | | (13,612,408 | ) | | | (13,060 | ) |
Natural Gas | | | (21 | ) | | | 12/2018 | | | | USD | | | | (697,830 | ) | | | (16,340 | ) |
Silver | | | (19 | ) | | | 12/2018 | | | | USD | | | | (1,356,600 | ) | | | 69,029 | |
U.S. Treasury 10 Year Note | | | (38 | ) | | | 12/2018 | | | | USD | | | | (4,502,406 | ) | | | (8,709 | ) |
U.S. Treasury 2 Year Note | | | (150 | ) | | | 12/2018 | | | | USD | | | | (31,596,094 | ) | | | 87,146 | |
U.S. Treasury 5 Year Note | | | (63 | ) | | | 12/2018 | | | | USD | | | | (7,081,102 | ) | | | 31,665 | |
U.S. Treasury Long Bond | | | (16 | ) | | | 12/2018 | | | | USD | | | | (2,213,000 | ) | | | 18,948 | |
Wheat | | | (3 | ) | | | 12/2018 | | | | USD | | | | (75,075 | ) | | | 966 | |
LME Aluminum Base Metal | | | (9 | ) | | | 01/2019 | | | | USD | | | | (438,413 | ) | | | 21,274 | |
LME Zinc Base Metal | | | (9 | ) | | | 01/2019 | | | | USD | | | | (561,881 | ) | | | 38,716 | |
Soybean | | | (33 | ) | | | 01/2019 | | | | USD | | | | (1,405,387 | ) | | | 33,565 | |
Lean Hogs | | | (20 | ) | | | 02/2019 | | | | USD | | | | (522,600 | ) | | | (12,039 | ) |
Live Cattle | | | (11 | ) | | | 02/2019 | | | | USD | | | | (537,680 | ) | | | (18,502 | ) |
Sugar No. 11 | | | (30 | ) | | | 02/2019 | | | | USD | | | | (443,184 | ) | | | (15,367 | ) |
Coffee ‘C’ | | | (13 | ) | | | 03/2019 | | | | USD | | | | (567,694 | ) | | | (54,395 | ) |
Corn | | | (39 | ) | | | 03/2019 | | | | USD | | | | (732,713 | ) | | | (15,215 | ) |
Wheat | | | (39 | ) | | | 03/2019 | | | | USD | | | | (1,006,200 | ) | | | 87,472 | |
Sugar No. 11 | | | (128 | ) | | | 04/2019 | | | | USD | | | | (1,906,688 | ) | | | (217,766 | ) |
Coffee ‘C’ | | | (25 | ) | | | 05/2019 | | | | USD | | | | (1,115,625 | ) | | | (104,231 | ) |
Corn | | | (26 | ) | | | 05/2019 | | | | USD | | | | (498,875 | ) | | | (10,477 | ) |
| | | | | | | | | | | | | | | | | | | | |
| | | | | | | | | | | | | | | | | | | 113,609 | |
| | | | | | | | | | | | | | | | | | | | |
| | | | | | | | | | | | | | | | | | | (1,054,962 | ) |
| | | | | | | | | | | | | | | | | | | | |
Abbreviations
| | |
| AUD | | — Australian Dollar |
| CAC | | — Continuous Assisted Quotation |
| CAD | | — Canadian Dollar |
| DAX | | — Deutscher Aktien Index |
| EUR | | — Euro |
| FTSE | | — Financial Times and the London Stock Exchange |
| GBP | | — British Pound |
| HKD | | — Hong Kong Dollar |
| | |
| IBEX | | — Madrid Stock Exchange |
| JPY | | — Japanese Yen |
| LME | | — London Metal Exchange |
| MIB | | — Milan, Italian Stock Exchange |
| SPI | | — Australian Securities Exchange |
| USD | | — United States Dollar |
| WTI | | — West Texas Intermediate |
SEE NOTES TO FINANCIAL STATEMENTS.
| | | | | | |
| | | |
| 120 | | | | J.P. MORGAN EXCHANGE-TRADED FUNDS | | OCTOBER 31, 2018 |
| | | | | | | | | | | | | | | | | | | | |
| Forward foreign currency exchange contracts outstanding as of October 31, 2018: | |
| Currency Purchased | | | Currency Sold | | | Counterparty | | Settlement
Date | | | Unrealized
Appreciation
(Depreciation)($) | |
IDR | | | 5,054,508,697 | | | USD | | | 326,118 | | | Goldman Sachs International** | | | 11/19/2018 | | | | 5,336 | |
INR | | | 25,771,566 | | | USD | | | 344,043 | | | Merrill Lynch International** | | | 11/19/2018 | | | | 3,323 | |
TRY | | | 2,145,475 | | | USD | | | 341,207 | | | BNP Paribas | | | 11/19/2018 | | | | 38,545 | |
USD | | | 447,913 | | | AUD | | | 628,925 | | | Citibank, NA | | | 11/19/2018 | | | | 2,457 | |
USD | | | 2,839,769 | | | CHF | | | 2,813,068 | | | State Street Corp. | | | 11/19/2018 | | | | 42,414 | |
USD | | | 349,811 | | | CZK | | | 7,882,513 | | | Merrill Lynch International | | | 11/19/2018 | | | | 5,470 | |
USD | | | 334,684 | | | EUR | | | 288,218 | | | Citibank, NA | | | 11/19/2018 | | | | 7,797 | |
USD | | | 4,751,644 | | | EUR | | | 4,138,295 | | | Merrill Lynch International | | | 11/19/2018 | | | | 58,122 | |
USD | | | 3,909,386 | | | GBP | | | 2,989,636 | | | Citibank, NA | | | 11/19/2018 | | | | 85,205 | |
USD | | | 329,209 | | | HUF | | | 93,405,279 | | | Citibank, NA | | | 11/19/2018 | | | | 3,008 | |
USD | | | 343,385 | | | ILS | | | 1,247,539 | | | Citibank, NA | | | 11/19/2018 | | | | 7,535 | |
USD | | | 106,734 | | | NOK | | | 869,154 | | | Barclays Bank plc | | | 11/19/2018 | | | | 3,556 | |
USD | | | 342,209 | | | THB | | | 11,233,374 | | | Merrill Lynch International | | | 11/19/2018 | | | | 3,216 | |
USD | | | 335,604 | | | TWD | | | 10,358,067 | | | Goldman Sachs International** | | | 11/19/2018 | | | | 638 | |
ZAR | | | 4,929,274 | | | USD | | | 327,754 | | | Merrill Lynch International | | | 11/19/2018 | | | | 5,674 | |
USD | | | 533,984 | | | JPY | | | 58,550,000 | | | State Street Corp. | | | 7/16/2019 | | | | 3,243 | |
| | | | | | | | | | | | | | | | | | | | |
Total unrealized appreciation | | | | | | | 275,539 | |
| | | | | | | | | | | | | | | | | | | | |
CAD | | | 1,460,954 | | | USD | | | 1,125,475 | | | State Street Corp. | | | 11/19/2018 | | | | (15,381 | ) |
EUR | | | 109,200 | | | USD | | | 127,105 | | | TD Bank Financial Group | | | 11/19/2018 | | | | (3,254 | ) |
GBP | | | 81,476 | | | USD | | | 107,938 | | | Barclays Bank plc | | | 11/19/2018 | | | | (3,719 | ) |
NOK | | | 44,691,340 | | | USD | | | 5,398,497 | | | State Street Corp. | | | 11/19/2018 | | | | (93,142 | ) |
SEK | | | 7,640,592 | | | USD | | | 840,149 | | | Citibank, NA | | | 11/19/2018 | | | | (4,068 | ) |
USD | | | 233,653 | | | AUD | | | 329,976 | | | Barclays Bank plc | | | 11/19/2018 | | | | (63 | ) |
USD | | | 1,801,738 | | | AUD | | | 2,549,552 | | | State Street Corp. | | | 11/19/2018 | | | | (4,062 | ) |
USD | | | 111,601 | | | EUR | | | 98,472 | | | State Street Corp. | | | 11/19/2018 | | | | (83 | ) |
USD | | | 112,189 | | | GBP | | | 87,895 | | | TD Bank Financial Group | | | 11/19/2018 | | | | (242 | ) |
USD | | | 211,084 | | | JPY | | | 23,824,165 | | | TD Bank Financial Group | | | 11/19/2018 | | | | (316 | ) |
USD | | | 1,619,652 | | | NZD | | | 2,515,670 | | | State Street Corp. | | | 11/19/2018 | | | | (22,234 | ) |
MXN | | | 6,305,395 | | | USD | | | 328,970 | | | Citibank, NA | | | 11/20/2018 | | | | (19,509 | ) |
JPY | | | 58,668,118 | | | USD | | | 541,210 | | | Australia & New Zealand Banking Group Ltd. | | | 7/16/2019 | | | | (9,397 | ) |
| | | | | | | | | | | | | | | | | | | | |
Total unrealized depreciation | | | | | | | (175,470 | ) |
| | | | | | | | | | | | | | | | | | | | |
Net unrealized appreciation | | | | | | | | | | | | | 100,069 | |
| | | | | | | | | | | | | | | | | | | | |
| ** | — Non-deliverable forward. |
Abbreviations
| | |
| AUD | | — Australian Dollar |
| CAD | | — Canadian Dollar |
| CHF | | — Swiss Franc |
| CZK | | — Czech Republic Krona |
| EUR | | — Euro |
| GBP | | — British Pound |
| HUF | | — Hungarian Forint |
| IDR | | — Indonesian Rupiah |
| ILS | | — Israeli Shekel |
| INR | | — India Rupee |
| | |
| JPY | | — Japanese Yen |
| MXN | | — Mexican Peso |
| NOK | | — Norwegian Krone |
| NZD | | — New Zealand Dollar |
| SEK | | — Swedish Krona |
| THB | | — Thai Baht |
| TRY | | — New Turkish Lira |
| TWD | | — Taiwan Dollar |
| USD | | — United States Dollar |
| ZAR | | — South African Rand |
SEE NOTES TO FINANCIAL STATEMENTS.
| | | | | | | | |
| | | |
| OCTOBER 31, 2018 | | J.P. MORGAN EXCHANGE-TRADED FUNDS | | | | | 121 | |
STATEMENTS OF ASSETS AND LIABILITIES
AS OF OCTOBER 31, 2018
| | | | | | | | | | | | | | | | |
| | | JPMorgan
Diversified
Alternatives
ETF (1) | | | JPMorgan Event Driven ETF | | | JPMorgan
Long/Short
ETF | | | JPMorgan
Managed
Futures
Strategy
ETF (1) | |
ASSETS: | | | | | | | | | | | | | | | | |
Investments in non-affiliates, at value | | $ | 117,149,037 | | | $ | 20,843,436 | | | $ | 16,942,911 | | | $ | — | |
Investments in affiliates, at value | | | 70,832,553 | | | | 5,600,338 | | | | 5,057,344 | | | | 42,503,224 | |
Restricted cash | | | 1,400 | | | | — | | | | — | | | | — | |
Restricted cash for OTC derivatives | | | — | | | | 270,000 | | | | — | | | | — | |
Cash | | | 2,882,413 | | | | — | | | | — | | | | 2,173,179 | |
Foreign currency, at value | | | 2,996,945 | | | | 123,397 | | | | 201,913 | | | | 1,436,977 | |
Deposits at broker for futures contracts | | | 7,443,000 | | | | 17,000 | | | | 284,000 | | | | 4,682,000 | |
Deferred offering costs | | | — | | | | 1,133 | | | | 8,227 | | | | 3,567 | |
Prepaid Expenses | | | 26,832 | | | | 24,052 | | | | 30,787 | | | | 464 | |
Receivables: | | | | | | | | | | | | | | | | |
Investment securities sold | | | 381,853 | | | | 61,636 | | | | 19,464 | | | | — | |
Fund shares sold | | | 4,867,333 | | | | — | | | | — | | | | — | |
Interest from non-affiliates | | | 30,220 | | | | 1,707 | | | | 7,160 | | | | — | |
Dividends from affiliates | | | 115,300 | | | | 13,441 | | | | 11,424 | | | | 72,900 | |
Tax reclaims | | | 8,496 | | | | 863 | | | | 119 | | | | — | |
Variation margin on futures contracts | | | — | | | | — | | | | 60 | | | | 8,618 | |
Unrealized appreciation on forward foreign currency exchange contracts | | | 1,101,099 | | | | 17,613 | | | | 10,695 | | | | 275,539 | |
Outstanding swap contracts, at value | | | 3,910,823 | | | | 104,625 | | | | 1,099,613 | | | | — | |
Due from counterparty for swap contracts | | | 1,972,294 | | | | — | | | | — | | | | — | |
Due from custodian | | | 561,447 | | | | — | | | | — | | | | — | |
Due from Adviser | | | — | | | | 21,575 | | | | 21,575 | | | | — | |
| | | | | | | | | | | | | | | | |
Total Assets | | | 214,281,045 | | | | 27,100,816 | | | | 23,695,292 | | | | 51,156,468 | |
| | | | | | | | | | | | | | | | |
| | | | |
LIABILITIES: | | | | | | | | | | | | | | | | |
Payables: | | | | | | | | | | | | | | | | |
Investment securities purchased | | | 6,972,314 | | | | 283,455 | | | | — | | | | — | |
Variation margin on futures contracts | | | 229,094 | | | | 5,962 | | | | — | | | | — | |
Unrealized depreciation on forward foreign currency exchange contracts | | | 507,750 | | | | 1,171 | | | | 6,441 | | | | 175,470 | |
Outstanding swap contracts, at value | | | 3,058,645 | | | | 348,909 | | | | 64,462 | | | | — | |
Due to broker for OTC swap contracts | | | 1,570,000 | | | | — | | | | — | | | | — | |
Accrued liabilities: | | | | | | | | | | | | | | | | |
Investment advisory fees | | | 94,606 | | | | 13,588 | | | | 6,682 | | | | — | |
Administration fees | | | 15,541 | | | | 1,928 | | | | 1,688 | | | | 4,021 | |
Custodian, Accounting and Transfer Agent fees | | | 34,846 | | | | 11,018 | | | | 12,510 | | | | 15,328 | |
Trustees’ and Chief Compliance Officer’s fees | | | 3,620 | | | | 465 | | | | 494 | | | | 952 | |
Professional Fees | | | 164,875 | | | | 132,824 | | | | 129,376 | | | | 105,446 | |
Due to Adviser | | | — | | | | — | | | | — | | | | 32,340 | |
Other | | | 1,192 | | | | 17,091 | | | | 17,367 | | | | 24,962 | |
| | | | | | | | | | | | | | | | |
Total Liabilities | | | 12,652,483 | | | | 816,411 | | | | 239,020 | | | | 358,519 | |
| | | | | | | | | | | | | | | | |
Net Assets | | $ | 201,628,562 | | | $ | 26,284,405 | | | $ | 23,456,272 | | | $ | 50,797,949 | |
| | | | | | | | | | | | | | | | |
| | | | |
NET ASSETS: | | | | | | | | | | | | | | | | |
Paid-in-Capital | | $ | 205,654,482 | | | $ | 26,295,466 | | | $ | 25,436,939 | | | $ | 52,555,573 | |
Total distributable earnings (loss) (a) | | | (4,025,920 | ) | | | (11,061 | ) | | | (1,980,667 | ) | | | (1,757,624 | ) |
| | | | | | | | | | | | | | | | |
Total Net Assets | | $ | 201,628,562 | | | $ | 26,284,405 | | | $ | 23,456,272 | | | $ | 50,797,949 | |
| | | | | | | | | | | | | | | | |
| | | | |
Outstanding number of shares
(unlimited number of shares authorized — par value $0.0001) | | | 8,300,000 | | | | 1,050,000 | | | | 1,050,000 | | | | 2,150,000 | |
| | | | | | | | | | | | | | | | |
Net asset value, per share | | $ | 24.29 | | | $ | 25.03 | | | $ | 22.34 | | | $ | 23.63 | |
| | | | | | | | | | | | | | | | |
| | | | |
Cost of investments in non-affiliates | | $ | 118,683,885 | | | $ | 21,607,278 | | | $ | 17,709,631 | | | $ | — | |
Cost of investments in affiliates | | | 70,832,553 | | | | 5,600,338 | | | | 5,057,344 | | | | 42,503,224 | |
Cost of foreign currency | | | 3,005,411 | | | | 123,555 | | | | 202,145 | | | | 1,440,542 | |
| (1) | Consolidated Statement of Assets and Liabilities. |
| (a) | Total distributable earnings has been aggregated to conform to the current presentation requirements for the adoption of the Securities and Exchange Commission’s Disclosure Update and Simplification Rule. See Note 8. |
SEE NOTES TO FINANCIAL STATEMENTS.
| | | | | | |
| | | |
| 122 | | | | J.P. MORGAN EXCHANGE-TRADED FUNDS | | OCTOBER 31, 2018 |
STATEMENTS OF OPERATIONS
FOR THE PERIOD ENDED OCTOBER 31, 2018
| | | | | | | | | | | | | | | | |
| | | JPMorgan
Diversified
Alternatives
ETF (1) | | | JPMorgan
Event
Driven
ETF (a) | | | JPMorgan Long/Short
ETF (b) | | | JPMorgan
Managed
Futures Strategy
ETF (c)(1) | |
INVESTMENT INCOME: | |
Dividend income from non-affiliates | | $ | 1,639,778 | | | $ | 121,286 | | | $ | 194,980 | | | $ | 9,632 | |
Dividend income from affiliates | | | 1,119,297 | | | | 209,002 | | | | 112,179 | | | | 586,535 | |
Interest income from non-affiliates | | | 52,802 | | | | 8,677 | | | | 15,713 | | | | 17,834 | |
Interest income from affiliates | | | 1,244 | | | | — | | | | 160 | | | | 4,205 | |
Foreign taxes withheld | | | (20,300 | ) | | | (2,959 | ) | | | — | | | | — | |
| | | | | | | | | | | | | | | | |
Total investment income | | | 2,792,821 | | | | 336,006 | | | | 323,032 | | | | 618,206 | |
| | | | | | | | | | | | | | | | |
| | | | |
EXPENSES: | | | | | | | | | | | | | | | | |
Investment advisory fees (Note 3.A) | | | 1,260,315 | | | | 182,942 | | | | 111,098 | | | | 257,119 | |
Administration fees (Note 3.B) | | | 181,746 | | | | 20,734 | | | | 15,739 | | | | 44,485 | |
Interest expense to non-affiliates | | | 11,707 | | | | — | | | | 470 | | | | 6,578 | |
Interest expense to affiliates (Note 3.C) | | | 3,350 | | | | 419 | | | | 222 | | | | 1,865 | |
Professional fees | | | 217,623 | | | | 148,538 | | | | 135,836 | | | | 151,187 | |
Trustees’ and Chief Compliance Officer’s fees | | | 89,327 | | | | 2,856 | | | | 2,554 | | | | 42,650 | |
Printing and mailing costs | | | 33,369 | | | | 18,757 | | | | 4,217 | | | | 4,863 | |
Registration and filing fees | | | 23,606 | | | | 21,403 | | | | 20,270 | | | | 27,031 | |
Custodian, Accounting and Transfer Agent fees (Note 3.C) | | | 138,643 | | | | 39,534 | | | | 39,371 | | | | 61,821 | |
Insurance expense | | | 15,945 | | | | 1,506 | | | | 1,431 | | | | 2,956 | |
Offering costs (Note 2.G) | | | — | | | | 13,140 | | | | 27,953 | | | | 32,588 | |
Other | | | 60,340 | | | | 2,454 | | | | 2,521 | | | | 9,616 | |
| | | | | | | | | | | | | | | | |
Total expenses | | | 2,035,971 | | | | 452,283 | | | | 361,682 | | | | 642,759 | |
| | | | | | | | | | | | | | | | |
Less fee waived (Note 3.D) | | | (535,717 | ) | | | (203,676 | ) | | | (126,837 | ) | | | (301,604 | ) |
Less expense reimbursements from affiliates (Note 3.D) | | | — | | | | (67,671 | ) | | | (119,527 | ) | | | (130,002 | ) |
Less earnings credits | | | (204 | ) | | | — | | | | — | | | | — | |
Less expense reimbursements from non-affiliates (Note 3.C) | | | (8,000 | ) | | | (400 | ) | | | (400 | ) | | | — | |
| | | | | | | | | | | | | | | | |
Net expenses | | | 1,492,050 | | | | 180,536 | | | | 114,918 | | | | 211,153 | |
| | | | | | | | | | | | | | | | |
Net investment income (loss) | | | 1,300,771 | | | | 155,470 | | | | 208,114 | | | | 407,053 | |
| | | | | | | | | | | | | | | | |
| | | | |
REALIZED/UNREALIZED GAINS (LOSSES): | | | | | | | | | | | | | | | | |
Net realized gain (loss) on transactions from: | | | | | | | | | | | | | | | | |
Investments in non-affiliates | | | 1,317,972 | | | | 88,653 | | | | (595,504 | ) | | | 6,209 | |
Futures | | | (5,809,056 | ) | | | (210,996 | ) | | | (614,436 | ) | | | (2,306,767 | ) |
Foreign currency transactions | | | (38,752 | ) | | | (7,326 | ) | | | (17,547 | ) | | | 9,694 | |
Forward foreign currency exchange contracts | | | (656,248 | ) | | | 20,048 | | | | 2,817 | | | | (56,560 | ) |
Swaps | | | (6,024,348 | ) | | | 930,667 | | | | (2,068,628 | ) | | | — | |
| | | | | | | | | | | | | | | | |
Net realized gain (loss) | | | (11,210,432 | ) | | | 821,046 | | | | (3,293,298 | ) | | | (2,347,424 | ) |
| | | | | | | | | | | | | | | | |
Change in net unrealized appreciation/depreciation on: | | | | | | | | | | | | | | | | |
Investments in non-affiliates | | | (4,903,168 | ) | | | (763,842 | ) | | | (766,720 | ) | | | — | |
Futures | | | (422,997 | ) | | | 18,000 | | | | (3,541 | ) | | | (1,054,962 | ) |
Foreign currency translations | | | (21,917 | ) | | | 29 | | | | (386 | ) | | | (682 | ) |
Forward foreign currency exchange contracts | | | 751,785 | | | | 16,442 | | | | 4,254 | | | | 100,069 | |
Swaps | | | 848,802 | | | | (244,284 | ) | | | 1,035,151 | | | | — | |
| | | | | | | | | | | | | | | | |
Change in net unrealized appreciation/depreciation | | | (3,747,495 | ) | | | (973,655 | ) | | | 268,758 | | | | (955,575 | ) |
| | | | | | | | | | | | | | | | |
Net realized/unrealized gains (losses) | | | (14,957,927 | ) | | | (152,609 | ) | | | (3,024,540 | ) | | | (3,302,999 | ) |
| | | | | | | | | | | | | | | | |
Change in net assets resulting from operations | | $ | (13,657,156 | ) | | $ | 2,861 | | | $ | (2,816,426 | ) | | $ | (2,895,946 | ) |
| | | | | | | | | | | | | | | | |
| (a) | Commencement of operations was November 29, 2017. |
| (b) | Commencement of operations was January 23, 2018. |
| (c) | Commencement of operations was December 5, 2017. |
| (1) | Consolidated Statement of Operations. |
SEE NOTES TO FINANCIAL STATEMENTS.
| | | | | | | | |
| | | |
| OCTOBER 31, 2018 | | J.P. MORGAN EXCHANGE-TRADED FUNDS | | | | | 123 | |
STATEMENTS OF CHANGES IN NET ASSETS
FOR THE PERIODS INDICATED
| | | | | | | | | | | | |
| | | JPMorgan Diversified
Alternatives ETF (1) | | | JPMorgan Event
Driven ETF | |
| | | Year Ended
October 31, 2018 | | | Year Ended
October 31, 2017 | | | Period Ended
October 31, 2018 (a) | |
CHANGE IN NET ASSETS RESULTING FROM OPERATIONS: | |
Net investment income (loss) | | $ | 1,300,771 | | | $ | 219,103 | | | $ | 155,470 | |
Net realized gain (loss) | | | (11,210,432 | ) | | | (1,206,770 | ) | | | 821,046 | |
Change in net unrealized appreciation/depreciation | | | (3,747,495 | ) | | | 3,139,492 | | | | (973,655 | ) |
| | | | | | | | | | | | |
Change in net assets resulting from operations | | | (13,657,156 | ) | | | 2,151,825 | | | | 2,861 | |
| | | | | | | | | | | | |
| | | |
DISTRIBUTIONS TO SHAREHOLDERS: (b) | | | | | | | | | | | | |
Distributable earnings | | | (868 | ) | | | (457,632 | ) | | | (13,930 | ) |
| | | | | | | | | | | | |
| | | |
CAPITAL TRANSACTIONS: | | | | | | | | | | | | |
Change in net assets resulting from capital transactions | | | 61,503,845 | | | | 100,111,115 | | | | 26,295,474 | |
| | | | | | | | | | | | |
| | | |
NET ASSETS: | | | | | | | | | | | | |
Change in net assets | | | 47,845,821 | | | | 101,805,308 | | | | 26,284,405 | |
Beginning of period | | | 153,782,741 | | | | 51,977,433 | | | | — | |
| | | | | | | | | | | | |
End of period | | $ | 201,628,562 | | | $ | 153,782,741 | | | $ | 26,284,405 | |
| | | | | | | | | | | | |
| | | |
CAPITAL SHARE TRANSACTIONS: | | | | | | | | | | | | |
Proceeds from shares issued | | $ | 80,126,851 | | | $ | 100,111,115 | | | $ | 26,295,474 | |
Cost of shares redeemed | | | (18,623,006 | ) | | | — | | | | — | |
| | | | | | | | | | | | |
Total change in net assets resulting from capital transactions | | $ | 61,503,845 | | | $ | 100,111,115 | | | $ | 26,295,474 | |
| | | | | | | | | | | | |
| | | |
SHARE TRANSACTIONS: | | | | | | | | | | | | |
Issued | | | 3,150,000 | | | | 3,850,000 | | | | 1,050,000 | |
Redeemed | | | (750,000 | ) | | | — | | | | — | |
| | | | | | | | | | | | |
Net increase in shares from share transactions | | | 2,400,000 | | | | 3,850,000 | | | | 1,050,000 | |
| | | | | | | | | | | | |
| (a) | Commencement of operations was November 29, 2017. |
| (b) | The prior period distributions for JPMorgan Diversified Alternatives ETF have been reclassified to conform to current period presentation for the adoption of the Securities and Exchange Commission’s Disclosure Update and Simplification Rule. See Note 8. Prior period balances were as follows: |
| | | | |
| | | JPMorgan
Diversified
Alternatives ETF | |
From net investment income | | | (444,087 | ) |
From net realized gains | | | (13,545 | ) |
| (1) | Consolidated Statement of Changes in Net Assets. |
SEE NOTES TO FINANCIAL STATEMENTS.
| | | | | | |
| | | |
| 124 | | | | J.P. MORGAN EXCHANGE-TRADED FUNDS | | OCTOBER 31, 2018 |
| | | | | | | | |
| | | JPMorgan Long/Short
ETF | | | JPMorgan Managed
Futures Strategy ETF (1) | |
| | | Period Ended
October 31, 2018 (a) | | | Period Ended
October 31, 2018 (b) | |
CHANGE IN NET ASSETS RESULTING FROM OPERATIONS: | |
Net investment income (loss) | | $ | 208,114 | | | $ | 407,053 | |
Net realized gain (loss) | | | (3,293,298 | ) | | | (2,347,424 | ) |
Change in net unrealized appreciation/depreciation | | | 268,758 | | | | (955,575 | ) |
| | | | | | | | |
Change in net assets resulting from operations | | | (2,816,426 | ) | | | (2,895,946 | ) |
| | | | | | | | |
| | |
DISTRIBUTIONS TO SHAREHOLDERS: | | | | | | | | |
Distributable earnings | | | — | | | | (14,260 | ) |
| | | | | | | | |
| | |
CAPITAL TRANSACTIONS: | | | | | | | | |
Change in net assets resulting from capital transactions | | | 26,272,698 | | | | 53,708,155 | |
| | | | | | | | |
| | |
NET ASSETS: | | | | | | | | |
Change in net assets | | | 23,456,272 | | | | 50,797,949 | |
Beginning of period | | | — | | | | — | |
| | | | | | | | |
End of period | | $ | 23,456,272 | | | $ | 50,797,949 | |
| | | | | | | | |
| | |
CAPITAL SHARE TRANSACTIONS: | | | | | | | | |
Proceeds from shares issued | | $ | 26,272,698 | | | $ | 53,708,155 | |
| | | | | | | | |
Total change in net assets resulting from capital transactions | | $ | 26,272,698 | | | $ | 53,708,155 | |
| | | | | | | | |
| | |
SHARE TRANSACTIONS: | | | | | | | | |
Issued | | | 1,050,000 | | | | 2,150,000 | |
| | | | | | | | |
Net increase in shares from share transactions | | | 1,050,000 | | | | 2,150,000 | |
| | | | | | | | |
| (a) | Commencement of operations was January 23, 2018. |
| (b) | Commencement of operations was December 5, 2017. |
| (1) | Consolidated Statement of Changes in Net Assets. |
SEE NOTES TO FINANCIAL STATEMENTS.
| | | | | | | | |
| | | |
| OCTOBER 31, 2018 | | J.P. MORGAN EXCHANGE-TRADED FUNDS | | | | | 125 | |
FINANCIAL HIGHLIGHTS
FOR THE PERIODS INDICATED
| | | | | | | | | | | | | | | | | | | | | | | | | | | | |
| | | Per share operating performance | |
| | | | | | Investment operations | | | Distributions | |
| | | Net asset
value,
beginning
of period | | | Net
investment
income
(loss) (b) | | | Net realized
and unrealized
gains
(losses) on
investments | | | Total from
investment
operations | | | Net
investment
income | | | Net
realized
gain | | | Total
distributions | |
| | | | | | | |
JPMorgan Diversified Alternatives ETF (1) | | | | | | | | | | | | | | | | | | | | | | | | | | | | |
Year Ended October 31, 2018 | | $ | 26.06 | | | $ | 0.17 | | | $ | (1.94 | ) | | $ | (1.77 | ) | | $ | — | (h) | | $ | — | | | $ | — | (h) |
Year Ended October 31, 2017 | | | 25.35 | | | | 0.07 | | | | 0.86 | | | | 0.93 | | | | (0.21 | ) | | | (0.01 | ) | | | (0.22 | ) |
September 12, 2016 (a) through October 31, 2016 | | | 25.00 | | | | (0.02 | ) | | | 0.37 | | | | 0.35 | | | | — | | | | — | | | | — | |
| | | | | | | |
JPMorgan Event Driven ETF | | | | | | | | | | | | | | | | | | | | | | | | | | | | |
November 29, 2017 (a) through October 31, 2018 | | | 25.00 | | | | 0.15 | | | | (0.11 | ) | | | 0.04 | | | | (0.01 | ) | | | — | | | | (0.01 | ) |
| | | | | | | |
JPMorgan Long/Short ETF | | | | | | | | | | | | | | | | | | | | | | | | | | | | |
January 23, 2018 (a) through October 31, 2018 | | | 25.00 | | | | 0.20 | | | | (2.86 | ) | | | (2.66 | ) | | | — | | | | — | | | | — | |
| | | | | | | |
JPMorgan Managed Futures Strategy ETF (1) | | | | | | | | | | | | | | | | | | | | | | | | | | | | |
December 5, 2017 (a) through October 31, 2018 | | | 25.00 | | | | 0.19 | | | | (1.55 | ) | | | (1.36 | ) | | | (0.01 | ) | | | — | | | | (0.01 | ) |
| (a) | Commencement of operations. |
| (b) | Calculated based upon average shares outstanding. |
| (c) | Not annualized for periods less than one year. |
| (d) | Includes adjustments in accordance with accounting principles generally accepted in the United States of America and as such, the net asset values for financial reporting purposes and the returns based upon those net asset values may differ from the net asset values and returns for shareholder transactions. |
| (e) | Market price total return is calculated assuming an initial investment made at the beginning of the period market price, reinvestment of all dividends and distributions at market price during the period, and sale at the market price on the last day of the period. The market price presented to calculate the market price total return is the mid-point of the bid/ask spread at the close of business on the NYSE Arca, Inc. Since the Shares of the Fund did not trade in the secondary market until the day after the Fund’s inception, for the period from the inception to the first day of secondary market trading, the NAV is used as a proxy for the secondary market trading price to calculate the market returns. |
| (f) | Annualized for periods less than one year, unless otherwise indicated. |
| (g) | Certain non-recurring expenses incurred by the Fund were not annualized for the period indicated. |
| (h) | Amount rounds to less than $0.01. |
| (i) | Portfolio turnover is calculated by dividing the lesser of total purchases or sales of portfolio securities for the reporting period by the monthly average of portfolio securities owned during the reporting period. Excluded from both the numerator and denominator are amounts relating to derivatives and securities whose maturities or expiration dates at the time of acquisition were one year or less. |
| (1) | Consolidated Financial Highlights. |
SEE NOTES TO FINANCIAL STATEMENTS.
| | | | | | |
| | | |
| 126 | | | | J.P. MORGAN EXCHANGE-TRADED FUNDS | | OCTOBER 31, 2018 |
| | | | | | | | | | | | | | | | | | | | | | | | | | | | | | | | | | |
| | | Ratios/Supplemental data | |
| | | | | | | | | | | | | | | | Ratios to average net assets (f) | | | | |
Net asset
value,
end of
period | | | Market
price,
end of
period | | | Total
return (c)(d) | | | Market
price
total
return (c)(e) | | | Net assets,
end of
period | | | Net
expenses | | | Net
investment
income
(loss) | | | Expenses
without waivers
and reimbursements | | | Portfolio
turnover
rate (c) | |
| | | | | | | | |
| | | | | | | | | | | | | | | | | | | | | | | | | | | | | | | | | | |
| $ | 24.29 | | | $ | 24.33 | | | | (6.79 | )% | | | (6.75 | )% | | $ | 201,628,562 | | | | 0.79 | % | | | 0.69 | % | | | 1.08 | % | | | 145 | % |
| | 26.06 | | | | 26.09 | | | | 3.68 | | | | 3.51 | | | | 153,782,741 | | | | 0.76 | | | | 0.25 | | | | 1.31 | | | | 107 | |
| | 25.35 | | | | 25.42 | | | | 1.44 | | | | 1.68 | | | | 51,977,433 | | | | 0.85 | (g) | | | 0.47 | | | | 6.65 | (g) | | | 5 | |
| | | | | | | | |
| | | | | | | | | | | | | | | | | | | | | | | | | | | | | | | | | | |
| | 25.03 | | | | 25.14 | | | | 0.18 | | | | 0.62 | % | | | 26,284,405 | | | | 0.74 | (g) | | | 0.64 | | | | 1.85 | (g) | | | 141 | |
| | | | | | | | |
| | | | | | | | | | | | | | | | | | | | | | | | | | | | | | | | | | |
| | 22.34 | | | | 22.50 | | | | (10.64 | ) | | | (10.00 | )% | | | 23,456,272 | | | | 0.60 | (g) | | | 1.15 | | | | 1.95 | (g) | | | 99 | |
| | | | | | | | |
| | | | | | | | | | | | | | | | | | | | | | | | | | | | | | | | | | |
| | 23.63 | | | | 23.72 | | | | (5.45 | ) | | | (5.09 | )% | | | 50,797,949 | | | | 0.45 | (g) | | | 0.88 | | | | 1.35 | (g) | | | — | (i) |
SEE NOTES TO FINANCIAL STATEMENTS.
| | | | | | | | |
| | | |
| OCTOBER 31, 2018 | | J.P. MORGAN EXCHANGE-TRADED FUNDS | | | | | 127 | |
NOTES TO FINANCIAL STATEMENTS
AS OF OCTOBER 31, 2018
1. Organization
J.P. Morgan Exchange-Traded Fund Trust (the “Trust”) was formed on February 25, 2010, and is governed by a Declaration of Trust as amended and restated February 19, 2014, and is registered under the Investment Company Act of 1940, as amended (the “1940 Act”), as an open-end management investment company.
The following are 4 separate funds of the Trust (each, a “Fund” and collectively, the “Funds”) covered by this report:
| | |
| | | Diversified/Non-Diversified |
| JPMorgan Diversified Alternatives ETF | | Diversified |
| JPMorgan Event Driven ETF | | Diversified |
| JPMorgan Long/Short ETF | | Diversified |
| JPMorgan Managed Futures Strategy ETF | | Non-Diversified |
JPMorgan Diversified Alternatives ETF (the “Diversified Alternatives ETF”) commenced operations on September 12, 2016. The investment objective of the Fund is to seek to provide long-term total return.
JPMorgan Event Driven ETF (the “Event Driven ETF”) commenced operations on November 29, 2017. The investment objective of the Fund is to seek to provide long-term total return.
JPMorgan Long/Short ETF (the “Long/Short ETF”) commenced operations on January 23, 2018. The investment objective of the Fund is to seek to provide long-term total return.
JPMorgan Managed Futures Strategy ETF (the “Managed Futures Strategy ETF”) commenced operations on December 5, 2017. The investment objective of the Fund is to seek to provide long-term total return.
J.P. Morgan Investment Management Inc. (“JPMIM”), an indirect, wholly-owned subsidiary of JPMorgan Chase & Co. (“JPMorgan”), acts as Adviser (the “Adviser”) and Administrator (the “Administrator”) to the Funds.
Shares of the Funds are listed and traded on the NYSE Arca, Inc. Market prices for the Funds’ shares may be different from their net asset value (“NAV”). The Funds issue and redeem their shares on a continuous basis, through JPMorgan Distribution Services, Inc. (the “Distributor” or “JPMDS”), an indirect, wholly-owned subsidiary of JPMorgan, at NAV in large blocks of shares, typically 50,000 shares referred to as “Creation Units.” Creation Units are issued and redeemed principally in cash. Shares are generally traded in the secondary market in amounts less than a Creation Unit at market prices that change throughout the day. Only individuals or institutions that have entered into an authorized participant agreement with the Distributor may do business directly with the Funds (each, an “Authorized Participant”).
Basis for Consolidation
Diversified Alternatives Fund CS Ltd. and Managed Futures Fund CS Ltd. (each, a “Subsidiary;” collectively, the “Subsidiaries”), are Cayman Islands exempted companies, incorporated on August 17, 2015 and August 17, 2017, respectively, are currently wholly-owned subsidiaries of the Diversified Alternatives ETF and Managed Futures Strategy ETF, respectively. Each Subsidiary acts as an investment vehicle for its respective Fund in order to effect certain investments on behalf of such Fund consistent with the Fund’s investment objectives and policies as described in the Fund’s prospectus. The consolidated financial statements for these Funds include the accounts of the Funds and the Subsidiaries. Subsequent references to the Funds within the Notes to Consolidated Financial Statements collectively refer to the Funds and the Subsidiaries. All significant intercompany balances and transactions have been eliminated in consolidation.
2. Significant Accounting Policies
The following is a summary of significant accounting policies followed by the Funds in the preparation of their consolidated financial statements/financial statements. The Funds are investment companies and, thus, follow the investment company accounting and reporting guidance of the Financial Accounting Standards Board Accounting Standards Codification Topic 946 — Investment Companies, which is part of U.S. generally accepted accounting principles (“GAAP”). The preparation of financial statements in conformity with GAAP requires management to make estimates and assumptions that affect the reported amounts of assets and liabilities and disclosure of contingent assets and liabilities at the date of the financial statements and the reported amounts of increases and decreases in net assets from operations during the reporting period. Actual results could differ from those estimates.
A. Valuation of Investments — The valuation of investments is in accordance with GAAP and the Funds’ valuation policies set forth by and under the supervision and responsibility of the Board of Trustees (the “Board”), which established the following approach to valuation, as described more fully below: (i) investments for which market quotations are readily available shall be valued at their market value, and (ii) all other investments for which market quotations are not readily available shall be valued at their fair value as determined in good faith by the Board.
The Administrator has established the J.P. Morgan Asset Management Americas Valuation Committee (“AVC”) to assist the Board with the oversight and monitoring of the valuation of the Funds’ investments. The Administrator implements the valuation policies of the Funds’ investments, as directed by the Board. The AVC oversees and carries out the policies for the valuation of investments held in the Funds. This includes monitoring the appropriateness of fair values based on results of ongoing valuation oversight including, but not limited to, consideration of macro or security specific events, market events and pricing vendor and broker due diligence. The Administrator is responsible for discussing and assessing the potential impacts to the fair values on an ongoing basis, and at least on a quarterly basis with the AVC and the Board.
| | | | | | |
| | | |
| 128 | | | | J.P. MORGAN EXCHANGE-TRADED FUNDS | | OCTOBER 31, 2018 |
A market-based approach is primarily used to value the Funds’ investments. Investments for which market quotations are not readily available are fair valued by approved affiliated and unaffiliated pricing vendors or third party broker-dealers (collectively referred to as “Pricing Services”) or may be internally fair valued using methods set forth by the valuation policies approved by the Board. This may include related or comparable assets or liabilities, recent transactions, market multiples, book values and other relevant information for the investment to determine the fair value of the investment. An income-based valuation approach may be used in which the anticipated future cash flows of the investment are discounted to calculate the fair value. Discounts may also be applied due to the nature or duration of any restrictions on the disposition of the investments. Valuations may be based upon current market prices of securities that are comparable in coupon, rating, maturity and industry. It is possible that the estimated values may differ significantly from the values that would have been used, had a ready market for the investments existed, and such differences could be material.
Equities and other exchange-traded instruments are valued at the last sale price or official market closing price on the primary exchange on which the instruments are traded before the NAVs of the Funds are calculated on a valuation date. Certain foreign equity instruments, as well as certain derivatives with equity reference obligations, are valued by applying international fair value factors provided by approved Pricing Services. The factors seek to adjust the local closing price for movements of local markets post closing, but prior to the time the NAVs are calculated.
Fixed income instruments are valued based on prices received from Pricing Services. The Pricing Services use multiple valuation techniques to determine the valuation of fixed income instruments. In instances where sufficient market activity exists, the Pricing Services may utilize a market based approach through which trades or quotes from market makers are used to determine the valuation of these instruments. In instances where sufficient market activity may not exist, the Pricing Services also utilize proprietary valuation models which may consider market transactions in comparable securities and the various relationships between securities in determining fair value and/or market characteristics in order to estimate the relevant cash flows, which are then discounted to calculate the fair values.
Investments in open-end investment companies, excluding Exchange-Traded Funds (“ETFs”) (the “Underlying Funds”) are valued at each Underlying Fund’s NAV per share as of the report date.
Futures contracts are generally valued on the basis of available market quotations. Forward foreign currency exchange contracts, swaps and other derivatives are valued utilizing market quotations from approved Pricing Services.
Valuations reflected in this report are as of the report date. As a result, changes in valuation due to market events and/or issuer related events after the report date and prior to issuance of the report are not reflected herein.
The various inputs that are used in determining the valuation of the Funds’ investments are summarized into the three broad levels listed below.
| • | | Level 1 — Unadjusted inputs using quoted prices in active markets for identical investments. |
| • | | Level 2 — Other significant observable inputs including, but not limited to, quoted prices for similar investments, inputs other than quoted prices that are observable for investments (such as interest rates, prepayment speeds, credit risk, etc.) or other market corroborated inputs. |
| • | | Level 3 — Significant inputs based on the best information available in the circumstances, to the extent observable inputs are not available (including the Funds’ assumptions in determining the fair value of investments). |
A financial instrument’s level within the fair value hierarchy is based on the lowest level of any input, both individually and in the aggregate, that is significant to the fair value measurement. The inputs or methodology used for valuing instruments are not necessarily an indication of the risk associated with investing in those instruments.
The following tables represent each valuation input as presented on the Consolidated Schedules of Portfolio Investments/Schedules of Portfolio Investments (“CSOIs/SOIs”):
Diversified Alternatives ETF
| | | | | | | | | | | | | | | | |
| | | Level 1
Quoted prices | | | Level 2
Other significant
observable inputs | | | Level 3 Significant
unobservable inputs | | | Total | |
Investments in Securities | | | | | | | | | | | | | | | | |
Common Stocks | | | | | | | | | | | | | | | | |
Leisure Products | | $ | — | | | $ | 721,616 | | | $ | — | | | $ | 721,616 | |
Media | | | 1,147,794 | | | | 1,461,050 | | | | — | | | | 2,608,844 | |
Pharmaceuticals | | | 4,609,932 | | | | 945,720 | | | | — | | | | 5,555,652 | |
Real Estate Management & Development | | | — | | | | 1,033,954 | | | | — | | | | 1,033,954 | |
Other Common Stocks | | | 107,228,971 | | | | — | | | | — | | | | 107,228,971 | |
| | | | | | | | | | | | | | | | |
Total Common Stocks | | | 112,986,697 | | | | 4,162,340 | | | | — | | | | 117,149,037 | |
| | | | | | | | | | | | | | | | |
Short-Term Investments | | | | | | | | | |
Investment Companies | | | 70,832,553 | | | | — | | | | — | | | | 70,832,553 | |
| | | | | | | | | | | | | | | | |
Total Investments in Securities | | $ | 183,819,250 | | | $ | 4,162,340 | | | $ | — | | | $ | 187,981,590 | |
| | | | | | | | | | | | | | | | |
| | | | | | | | |
| | | |
| OCTOBER 31, 2018 | | J.P. MORGAN EXCHANGE-TRADED FUNDS | | | | | 129 | |
NOTES TO FINANCIAL STATEMENTS
AS OF OCTOBER 31, 2018 (continued)
Diversified Alternatives ETF (continued)
| | | | | | | | | | | | | | | | |
| | | Level 1
Quoted prices | | | Level 2
Other significant
observable inputs | | | Level 3 Significant
unobservable inputs | | | Total | |
Appreciation in Other Financial Instruments | | | | | | | | | | | | | | | | |
Forward Foreign Currency Exchange Contracts | | $ | — | | | $ | 1,101,099 | | | $ | — | | | $ | 1,101,099 | |
Futures | | | 2,352,172 | | | | 248,776 | | | | — | | | | 2,600,948 | |
Swaps | | | — | | | | 1,155,938 | | | | — | | | | 1,155,938 | |
| | | | | | | | | | | | | | | | |
Total Appreciation in Other Financial Instruments | | $ | 2,352,172 | | | $ | 2,505,813 | | | $ | — | | | $ | 4,857,985 | |
| | | | | | | | | | | | | | | | |
Depreciation in Other Financial Instruments | | | | | | | | | |
Forward Foreign Currency Exchange Contracts | | $ | — | | | $ | (507,750 | ) | | $ | — | | | $ | (507,750 | ) |
Futures | | | (3,087,219 | ) | | | (101,092 | ) | | | — | | | | (3,188,311 | ) |
Swaps | | | — | | | | (1,283,531 | ) | | | (972 | ) | | | (1,284,503 | ) |
| | | | | | | | | | | | | | | | |
Total Depreciation in Other Financial Instruments | | $ | (3,087,219 | ) | | $ | (1,892,373 | ) | | $ | (972 | ) | | $ | (4,980,564 | ) |
| | | | | | | | | | | | | | | | |
Event Driven ETF
| | | | | | | | | | | | | | | | |
| | | Level 1
Quoted prices | | | Level 2
Other significant
observable inputs | | | Level 3 Significant
unobservable inputs | | | Total | |
Investments in Securities | | | | | | | | | | | | | | | | |
Common Stocks | | | | | | | | | | | | | | | | |
Banks | | $ | 146,878 | | | $ | 147,808 | | | $ | — | | | $ | 294,686 | |
Household Durables | | | 239,416 | | | | 96,463 | | | | — | | | | 335,879 | |
Leisure Products | | | — | | | | 98,431 | | | | — | | | | 98,431 | |
Media | | | — | | | | 211,873 | | | | — | | | | 211,873 | |
Pharmaceuticals | | | 516,423 | | | | 188,456 | | | | — | | | | 704,879 | |
Real Estate Management & Development | | | — | | | | 153,700 | | | | — | | | | 153,700 | |
Software | | | 961,033 | | | | 99,124 | | | | — | | | | 1,060,157 | |
Other Common Stocks | | | 12,213,696 | | | | — | | | | — | | | | 12,213,696 | |
| | | | | | | | | | | | | | | | |
Total Common Stocks | | | 14,077,446 | | | | 995,855 | | | | — | | | | 15,073,301 | |
| | | | | | | | | | | | | | | | |
Debt Securities | | | | | | | | | |
Foreign Government Securities | | | — | | | | 274,350 | | | | — | | | | 274,350 | |
Short-Term Investments | | | | | | | | | |
Investment Companies | | | 5,600,338 | | | | — | | | | — | | | | 5,600,338 | |
U.S. Treasury Obligations | | | — | | | | 5,495,785 | | | | — | | | | 5,495,785 | |
| | | | | | | | | | | | | | | | |
Total Investments in Securities | | $ | 19,677,784 | | | $ | 6,765,990 | | | $ | — | | | $ | 26,443,774 | |
| | | | | | | | | | | | | | | | |
Appreciation in Other Financial Instruments | | | | | | | | | | | | | | | | |
Forward Foreign Currency Exchange Contracts | | $ | — | | | $ | 17,613 | | | $ | — | | | $ | 17,613 | |
Futures | | | — | | | | 18,000 | | | | — | | | | 18,000 | |
Swaps | | | — | | | | 24,947 | | | | — | | | | 24,947 | |
| | | | | | | | | | | | | | | | |
Total Appreciation in Other Financial Instruments | | $ | — | | | $ | 60,560 | | | $ | — | | | $ | 60,560 | |
| | | | | | | | | | | | | | | | |
Depreciation in Other Financial Instruments | | | | | | | | | | | | | | | | |
Forward Foreign Currency Exchange Contracts | | $ | — | | | $ | (1,171 | ) | | $ | — | | | $ | (1,171 | ) |
Swaps | | | — | | | | (282,887 | ) | | | — | | | | (282,887 | ) |
| | | | | | | | | | | | | | | | |
Total Depreciation in Other Financial Instruments | | $ | — | | | $ | (284,058 | ) | | $ | — | | | $ | (284,058 | ) |
| | | | | | | | | | | | | | | | |
| | | | | | |
| | | |
| 130 | | | | J.P. MORGAN EXCHANGE-TRADED FUNDS | | OCTOBER 31, 2018 |
Long/Short ETF
| | | | | | | | | | | | | | | | |
| | | Level 1
Quoted prices | | | Level 2
Other significant
observable inputs | | | Level 3 Significant
unobservable inputs | | | Total | |
Investments in Securities | | | | | | | | | | | | | | | | |
Common Stocks | | $ | 14,746,335 | | | $ | — | | | $ | — | | | $ | 14,746,335 | |
| | | | | | | | | | | | | | | | |
Total Common Stocks | | | 14,746,335 | | | | — | | | | — | | | | 14,746,335 | |
| | | | | | | | | | | | | | | | |
Debt Securities | | | | | | | | | |
Foreign Government Securities | | | — | | | | 232,620 | | | | — | | | | 232,620 | |
Short-Term Investments | | | | | | | | | |
Investment Companies | | | 5,057,344 | | | | — | | | | — | | | | 5,057,344 | |
U.S. Treasury Obligations | | | — | | | | 1,963,956 | | | | — | | | | 1,963,956 | |
| | | | | | | | | | | | | | | | |
Total Investments in Securities | | $ | 19,803,679 | | | $ | 2,196,576 | | | $ | — | | | $ | 22,000,255 | |
| | | | | | | | | | | | | | | | |
Appreciation in Other Financial Instruments | | | | | | | | | | | | | | | | |
Forward Foreign Currency Exchange Contracts | | $ | — | | | $ | 10,695 | | | $ | — | | | $ | 10,695 | |
Futures Contracts | | | 27,288 | | | | 47,484 | | | | — | | | | 74,772 | |
Swaps | | | — | | | | 411,362 | | | | — | | | | 411,362 | |
| | | | | | | | | | | | | | | | |
Total Appreciation in Other Financial Instruments | | $ | 27,288 | | | $ | 469,541 | | | $ | — | | | $ | 496,829 | |
| | | | | | | | | | | | | | | | |
Depreciation in Other Financial Instruments | | | | | | | | | | | | | | | | |
Forward Foreign Currency Exchange Contracts | | $ | — | | | $ | (6,441 | ) | | $ | — | | | $ | (6,441 | ) |
Futures Contracts | | | (48,360 | ) | | | (29,953 | ) | | | — | | | | (78,313 | ) |
Swaps | | | — | | | | (179,164 | ) | | | — | | | | (179,164 | ) |
| | | | | | | | | | | | | | | | |
Total Depreciation in Other Financial Instruments | | $ | (48,360 | ) | | $ | (215,558 | ) | | $ | — | | | $ | (263,918 | ) |
| | | | | | | | | | | | | | | | |
Managed Futures Strategy ETF
| | | | | | | | | | | | | | | | |
| | | Level 1
Quoted prices | | | Level 2
Other significant
observable inputs | | | Level 3 Significant
unobservable inputs | | | Total | |
Short-Term Investments | | $ | 42,503,224 | | | $ | — | | | $ | — | | | $ | 42,503,224 | |
| | | | | | | | | | | | | | | | |
Appreciation in Other Financial Instruments | | | | | | | | | |
Forward Foreign Currency Exchange Contracts | | $ | — | | | $ | 275,539 | | | $ | — | | | $ | 275,539 | |
Futures Contracts | | | 712,468 | | | | 121,311 | | | | — | | | | 833,779 | |
| | | | | | | | | | | | | | | | |
Total Appreciation in Other Financial Instruments | | $ | 712,468 | | | $ | 396,850 | | | $ | — | | | $ | 1,109,318 | |
| | | | | | | | | | | | | | | | |
Depreciation in Other Financial Instruments | | | | | | | | | |
Forward Foreign Currency Exchange Contracts | | $ | — | | | $ | (175,470 | ) | | $ | — | | | $ | (175,470 | ) |
Futures Contracts | | | (1,798,883 | ) | | | (89,858 | ) | | | — | | | | (1,888,741 | ) |
| | | | | | | | | | | | | | | | |
Total Depreciation in Other Financial Instruments | | $ | (1,798,883 | ) | | $ | (265,328 | ) | | $ | — | | | $ | (2,064,211 | ) |
| | | | | | | | | | | | | | | | |
B. Restricted Securities — Certain securities held by the Funds may be subject to legal or contractual restrictions on resale. Restricted securities generally are resold in transactions exempt from registration under the Securities Act of 1933, as amended (the “Securities Act”). Disposal of these securities may involve time-consuming negotiations and expense. Prompt sale at the current valuation may be difficult and could adversely affect the NAVs of the Funds.
As of October 31, 2018, the Funds had no investments in restricted securities other than securities sold to the Funds under Rule 144A and/or Regulation S under the Securities Act.
C. Derivatives — The Funds used derivative instruments including futures, forward foreign currency exchange contracts and swaps, in connection with their respective investment strategies. Derivative instruments may be used as substitutes for securities in which the Funds can invest, to hedge portfolio investments or to generate income or gain to the Funds. Derivatives may also be used to manage duration, sector and yield curve exposures and credit and spread volatility.
The Funds may be subject to various risks from the use of derivatives including the risk that changes in the value of a derivative may not correlate perfectly with the underlying asset, rate or index; counterparty credit risk related to derivatives counterparties’ failure to perform under contract terms; liquidity risk related to the lack of a liquid market for these contracts allowing a Fund to close out its position(s); and documentation risk relating to disagreement over contract terms. Investing in certain derivatives also results in a form of leverage and as such, the Funds’ risk of loss
| | | | | | | | |
| | | |
| OCTOBER 31, 2018 | | J.P. MORGAN EXCHANGE-TRADED FUNDS | | | | | 131 | |
NOTES TO FINANCIAL STATEMENTS
AS OF OCTOBER 31, 2018 (continued)
associated with these instruments may exceed their value, as recorded on the Consolidated Statements of Assets and Liabilities/Statements of Assets and Liabilities (CSAL/SAL).
The Funds are party to various derivative contracts governed by International Swaps and Derivatives Association master agreements (“ISDA agreements”). The Funds’ ISDA agreements, which are separately negotiated with each dealer counterparty, may contain provisions allowing, absent other considerations, a counterparty to exercise rights, to the extent not otherwise waived, against the Funds in the event the Funds’ net assets decline over time by a pre-determined percentage or fall below a pre-determined floor. The ISDA agreements may also contain provisions allowing, absent other conditions, the Funds to exercise rights, to the extent not otherwise waived, against a counterparty (e.g., decline in a counterparty’s credit rating below a specified level). Such rights for both a counterparty and the Funds often include the ability to terminate (i.e., close out) open contracts at prices which may favor a counterparty, which could have an adverse effect on the Funds. The ISDA agreements give the Funds and a counterparty the right, upon an event of default, to close out all transactions traded under such agreements and to net amounts owed or due across all transactions and offset such net payable or receivable with collateral posted to a segregated account by one party to the other.
Counterparty credit risk may be mitigated to the extent a counterparty posts collateral for mark to market gains to the Funds.
Notes C(1) — C(3) below describe the various derivatives used by the Funds.
(1). Futures Contracts — The Funds used index, commodities and treasury futures contracts to obtain long and short exposure to the underlying commodities markets, to gain or reduce exposure to the stock market, to gain or reduce exposure to particular countries or regions, maintain liquidity, minimize transaction costs or to manage and hedge interest rate risk associated with portfolio investments.
Futures contracts provide for the delayed delivery of the underlying instrument at a fixed price or are settled for a cash amount based on the change in the value of the underlying instrument at a specific date in the future. Upon entering into a futures contract, the Funds are required to deposit with the broker, cash or securities in an amount equal to a certain percentage of the contract amount, which is referred to as the initial margin deposit. Subsequent payments, referred to as variation margin, are made or received by the Funds periodically and are based on changes in the market value of open futures contracts. Changes in the market value of open futures contracts are recorded as Change in net unrealized appreciation/depreciation on the Consolidated Statement of Operations/Statement of Operations (“CSOP/SOP”). Realized gains or losses, representing the difference between the value of the contract at the time it was opened and the value at the time it was closed, are reported on the CSOP/SOP at the closing or expiration of the futures contract. Securities deposited as initial margin are designated in the CSOI/SOIs and cash deposited, which is considered restricted, is recorded on the CSAL/SAL. A receivable from and/or a payable to brokers for the daily variation margin is also recorded on the CSAL/SAL.
The use of futures contracts exposes the Funds to interest rate risk, commodities risk and equity price risk. The Funds may be subject to the risk that the change in the value of the futures contract may not correlate perfectly with the underlying instrument. Use of long futures contracts subjects the Funds to risk of loss in excess of the amounts shown on the CSAL/SAL, up to the notional amount of the futures contracts. Use of short futures contracts subjects the Funds to unlimited risk of loss. The Funds may enter into futures contracts only on exchanges or boards of trade. The exchange or board of trade acts as the counterparty to each futures transaction; therefore, the Funds’ credit risk is limited to failure of the exchange or board of trade. Under some circumstances, futures exchanges may establish daily limits on the amount that the price of a futures contract can vary from the previous day’s settlement price, which could effectively prevent liquidation of positions.
The Funds’ futures contracts are not subject to master netting arrangements (the right to close out all transactions traded with a counterparty and net amounts owed or due across transactions).
(2). Forward Foreign Currency Exchange Contracts — The Funds may be exposed to foreign currency risks associated with some or all of the portfolio investments and used forward foreign currency exchange contracts to hedge or manage certain of these exposures as part of an investment strategy. The Funds also bought forward foreign currency exchange contracts to gain exposure to currencies. Forward foreign currency exchange contracts represent obligations to purchase or sell foreign currency on a specified future date at a price fixed at the time the contracts are entered into. Non-deliverable forward foreign currency exchange contracts are settled with the counterparty in U.S. dollars without the delivery of foreign currency.
The values of the forward foreign currency exchange contracts are adjusted daily based on the applicable exchange rate of the underlying currency. Changes in the value of these contracts are recorded as unrealized appreciation or depreciation until the contract settlement date. When the forward foreign currency exchange contract is closed, the Funds record a realized gain or loss equal to the difference between the value at the time the contract was opened and the value at the time it was closed. The Funds also record a realized gain or loss when a forward foreign currency exchange contract offsets another forward foreign currency exchange contract with the same counterparty upon settlement.
These Funds’ forward foreign currency exchange contracts are subject to master netting arrangements (the right to close out all transactions with a counterparty and net amounts owed or due across transactions).
The Funds may be required to post or receive collateral for non-deliverable forward foreign currency exchange contracts.
(3). Swaps — The Diversified Alternatives ETF, Event Driven ETF and Long/Short ETF engaged in various swap transactions, including total return swaps and total return basket swaps, to manage credit and total return risks within their respective portfolios. The Funds also used swaps as alternatives to direct investments. Swap transactions are negotiated contracts over the counter (“OTC swaps”) between a fund and a counterparty or are
| | | | | | |
| | | |
| 132 | | | | J.P. MORGAN EXCHANGE-TRADED FUNDS | | OCTOBER 31, 2018 |
centrally cleared (“centrally cleared swaps”) through a central clearinghouse managed by a Futures Commission Merchant (“FCM”), that exchange investment cash flows, assets, foreign currencies or market-linked returns at specified, future intervals.
Upfront payments made and/or received are recorded as assets or liabilities, respectively, on the CSAL/SAL and amortized over the term of the swap. The value of an OTC swap agreement is recorded as either an asset or a liability on the CSAL/SAL at the beginning of the measurement period. Upon entering into a centrally cleared swap, the Funds are required to deposit with the FCM cash or securities, which is referred to as initial margin deposit. Securities deposited as initial margin are designated on the CSOIs/SOIs, while cash deposited, which is considered restricted, is recorded on the CSAL/SAL. Daily changes in valuation of centrally cleared swaps, if any, are recorded as a variation margin receivable or payable on the CSAL/SAL. The change in the value of swaps, including accruals of periodic amounts of interest to be paid or received on swaps, is reported as Change in net unrealized appreciation/depreciation on the CSOP/SOP. A realized gain or loss is recorded upon payment or receipt of a periodic payment or payment made upon termination of a swap agreement.
The Funds may be required to post or receive collateral based on the net value of the Funds’ outstanding OTC swap contracts with the counterparty in the form of cash or securities. Daily movement of collateral is subject to minimum threshold amounts. Collateral posted by the Funds is held in a segregated account at the Funds’ custodian bank. For certain counterparties cash collateral posted or received by the Funds is reported on the CSAL/SAL as Restricted cash for OTC derivatives.
The Funds’ swap contracts (excluding centrally cleared swaps) are subject to master netting arrangements.
Total Return Basket Swaps
The Diversified Alternatives ETF, Event Driven ETF and Long/Short ETF entered into total return basket swap agreements to obtain exposure to a portfolio of long and short securities. This is a highly specialized activity and a significant aspect of each Fund’s investment strategy.
Under the terms of the agreements, each swap is designed to function as a portfolio of direct investments in long and short equity positions. This means that a Fund has the ability to trade in and out of long and short positions within each swap and will receive all of the economic benefits and risks equivalent to direct investments in these positions such as: capital appreciation (depreciation), corporate actions and dividends received and paid, all of which are reflected in each swap value. Each swap value also includes interest charges and credits related to the notional values of the long and short positions and cash balances within each swap. These interest charges and credits are based on defined market rates based on the local currencies of the positions in the portfolio plus or minus a specified spread and are referred to herein as “financing costs” and net dividends. Positions within each swap, accrued financing costs and net dividends, are part of the periodic reset. During a reset, any unrealized gains (losses) on positions, accrued financing costs, and net dividends become available for cash settlement between the Fund and the swap counterparty are recorded as Due from/to counterparty for swap contracts on the CSAL/SAL and as Net realized gain (loss) on transactions from swaps on the CSOP/SOP.
Each swap involves additional risks than if a Fund had invested in the underlying positions directly including: the risk that changes in the value of each swap may not correlate perfectly with the underlying long and short securities; counterparty risk related to the counterparty’s failure to perform under contract terms; liquidity risk related to the lack of a liquid market for each swap contract, which may limit the ability of a Fund to close out its positions; and, documentation risk relating to disagreement over contract terms. The total return basket swaps consist of securities that are denominated in foreign currencies. Changes in currency exchange rates will affect the value of, and investment income from, such securities. The Funds’ activities in each total return basket swap are concentrated with a single counterparty. Investing in swaps results in a form of leverage (i.e., a Fund’s risk of loss associated with these instruments may exceed their value as recorded on the CSAL/SAL).
The value of each swap is derived from a combination of (i) the net value of the underlying positions, which are valued daily using the last sale or closing prices on the principal exchange on which the underlying securities are traded; (ii) financing costs; (iii) the value of dividends; (iv) cash balances within the swap; and (v) other factors, as applicable. The value of each swap is reflected on the CSAL/SAL as Outstanding swap contracts, at value. Changes in the value of each swap are recognized as Change in net unrealized appreciation/depreciation of swaps on the CSOP/SOP.
| | | | | | | | |
| | | |
| OCTOBER 31, 2018 | | J.P. MORGAN EXCHANGE-TRADED FUNDS | | | | | 133 | |
NOTES TO FINANCIAL STATEMENTS
AS OF OCTOBER 31, 2018 (continued)
(4). Summary of Derivatives Information
The following tables present the value of derivatives held as of October 31, 2018, by their primary underlying risk exposure and respective location on the CSAL/SAL:
Diversified Alternatives ETF
| | | | | | | | | | | | | | | | | | |
| Derivative Contracts | | CSAL Location | | | | | | | | | | | | |
| Gross Assets: | | | | Futures
Contracts (a) | | | Forward Foreign
Currency Exchange
Contracts | | | OTC Swaps | | | Total | |
Commodity contracts | | Receivables, Net assets — Unrealized Appreciation | | $ | 661,665 | | | $ | — | | | $ | — | | | $ | 661,665 | |
Interest rate contracts | | Receivables, Net assets — Unrealized Appreciation | | | 240,697 | | | | — | | | | — | | | | 240,697 | |
Equity contracts | | Receivables, Net assets — Unrealized Appreciation | | | 1,698,586 | | | | — | | | | 3,910,823 | | | | 5,609,409 | |
Foreign exchange contracts | | Receivables | | | — | | | | 1,101,099 | | | | — | | | | 1,101,099 | |
| | | | | | | | | | | | | | | | | | |
Total | | | | $ | 2,600,948 | | | $ | 1,101,099 | | | $ | 3,910,823 | | | $ | 7,612,870 | |
| | | | | | | | | | | | | | | | | | |
| | | | | |
Gross Liabilities: | | | | | | | | | | | | | | |
Commodity contracts | | Payables, Net assets — Unrealized Depreciation | | $ | (2,188,425 | ) | | $ | — | | | $ | — | | | $ | (2,188,425 | ) |
Interest rate contracts | | Payables, Net assets — Unrealized Depreciation | | | (729,926 | ) | | | — | | | | — | | | | (729,926 | ) |
Equity contracts | | Payables, Net assets — Unrealized Depreciation | | | (269,960 | ) | | | — | | | | (3,058,645 | ) | | | (3,328,605 | ) |
Foreign exchange contracts | | Payables | | | — | | | | (507,750 | ) | | | — | | | | (507,750 | ) |
| | | | | | | | | | | | | | | | | | |
Total | | | | $ | (3,188,311 | ) | | $ | (507,750 | ) | | $ | (3,058,645 | ) | | $ | (6,754,706 | ) |
| | | | | | | | | | | | | | | | | | |
Event Driven ETF
| | | | | | | | | | | | | | | | | | |
| Derivative Contracts | | SAL Location | | | | | | | | | | | | |
| Gross Assets: | | | | Futures
Contracts (a) | | | Forward Foreign
Currency Exchange
Contracts | | | OTC Swaps | | | Total | |
Equity contracts | | Receivables, Net assets — Unrealized Appreciation | | $ | 18,000 | | | $ | — | | | $ | 104,625 | | | $ | 122,625 | |
Foreign exchange contracts | | Receivables | | | — | | | | 17,613 | | | | — | | | | 17,613 | |
| | | | | | | | | | | | | | | | | | |
Total | | | | $ | 18,000 | | | $ | 17,613 | | | $ | 104,625 | | | $ | 140,238 | |
| | | | | | | | | | | | | | | | | | |
| | | | | |
Gross Liabilities: | | | | | | | | | | | | | | |
Equity contracts | | Payables, Net assets — Unrealized Depreciation | | $ | — | | | $ | — | | | $ | (348,909 | ) | | $ | (348,909 | ) |
Foreign exchange contracts | | Payables | | | — | | | | (1,171 | ) | | | — | | | | (1,171 | ) |
| | | | | | | | | | | | | | | | | | |
Total | | | | $ | — | | | $ | (1,171 | ) | | $ | (348,909 | ) | | $ | (350,080 | ) |
| | | | | | | | | | | | | | | | | | |
Long/Short ETF
| | | | | | | | | | | | | | | | | | |
| Derivative Contracts | | SAL Location | | | | | | | | | | | | |
| Gross Assets: | | | | Futures
Contracts (a) | | | Forward Foreign
Currency Exchange
Contracts | | | OTC Swaps | | | Total | |
Equity contracts | | Receivables, Net assets — Unrealized Appreciation | | $ | 74,772 | | | $ | — | | | $ | 1,099,613 | | | $ | 1,174,385 | |
Foreign exchange contracts | | Receivables | | | — | | | | 10,695 | | | | — | | | | 10,695 | |
| | | | | | | | | | | | | | | | | | |
Total | | | | $ | 74,772 | | | $ | 10,695 | | | $ | 1,099,613 | | | $ | 1,185,080 | |
| | | | | | | | | | | | | | | | | | |
| | | | | |
Gross Liabilities: | | | | | | | | | | | | | | |
Equity contracts | | Payables, Net assets — Unrealized Depreciation | | $ | (78,313 | ) | | $ | — | | | $ | (64,462 | ) | | $ | (142,775 | ) |
Foreign exchange contracts | | Payables | | | — | | | | (6,441 | ) | | | — | | | | (6,441 | ) |
| | | | | | | | | | | | | | | | | | |
Total | | | | $ | (78,313 | ) | | $ | (6,441 | ) | | $ | (64,462 | ) | | $ | (149,216 | ) |
| | | | | | | | | | | | | | | | | | |
| | | | | | |
| | | |
| 134 | | | | J.P. MORGAN EXCHANGE-TRADED FUNDS | | OCTOBER 31, 2018 |
Managed Futures Strategy ETF
| | | | | | | | | | | | | | |
| Derivative Contracts | | CSAL Location | | | | | | | | | |
| Gross Assets: | | | | Futures
Contracts (a) | | | Forward Foreign
Currency Exchange
Contracts | | | Total | |
Commodity contracts | | Receivables, Net assets — Unrealized Appreciation | | $ | 441,635 | | | $ | — | | | $ | 441,635 | |
Equity contracts | | Receivables, Net assets — Unrealized Appreciation | | | 200,323 | | | | — | | | | 200,323 | |
Interest rate contracts | | Receivables, Net assets — Unrealized Appreciation | | | 191,821 | | | | — | | | | 191,821 | |
Foreign exchange contracts | | Receivables | | | — | | | | 275,539 | | | | 275,539 | |
| | | | | | | | | | | | | | |
Total | | | | $ | 833,779 | | | $ | 275,539 | | | $ | 1,109,318 | |
| | | | | | | | | | | | | | |
| | | | |
Gross Liabilities: | | | | | | | | | | | |
Commodity contracts | | Payables, Net assets — Unrealized Depreciation | | $ | (1,203,116 | ) | | $ | — | | | $ | (1,203,116 | ) |
Equity contracts | | Payables, Net assets — Unrealized Depreciation | | | (238,162 | ) | | | — | | | | (238,162 | ) |
Interest rate contracts | | Payables, Net assets — Unrealized Depreciation | | | (447,463 | ) | | | — | | | | (447,463 | ) |
Foreign exchange contracts | | Payables | | | — | | | | (175,470 | ) | | | (175,470 | ) |
| | | | | | | | | | | | | | |
Total | | | | $ | (1,888,741 | ) | | $ | (175,470 | ) | | $ | (2,064,211 | ) |
| | | | | | | | | | | | | | |
| (a) | This amount represents the cumulative appreciation/depreciation of futures contracts as reported on the CSOI/SOI. The CSAL/SAL only reflects the current day variation margin receivable/payable from/to brokers. |
The following tables present each Fund’s gross derivative assets and liabilities by counterparty net of amounts available for offset under netting arrangements and any related collateral received or posted by the Fund as of October 31, 2018.
Diversified Alternatives ETF
| | | | | | | | | | | | | | | | |
| Counterparty | | Gross Amount of
Derivative Assets
Subject to Netting
Arrangements
Presented on the
CSAL (a) | | | Derivatives
Available
for Offset | | | Collateral
Received | | | Net Amount Due
from Counterparty
(not less than zero) | |
Bank of America | | $ | 377,063 | | | $ | (2,459 | ) | | $ | (374,604 | ) | | $ | — | |
BNP Paribas | | | 248,173 | | | | — | | | | — | | | | 248,173 | |
Citibank, NA | | | 335,922 | | | | (129,848 | ) | | | — | | | | 206,074 | |
Deutsche Bank AG | | | 9,502 | | | | — | | | | — | | | | 9,502 | |
Goldman Sachs International | | | 39,020 | | | | (5,000 | ) | | | — | | | | 34,020 | |
HSBC Bank, NA | | | 184,603 | | | | (78,423 | ) | | | — | | | | 106,180 | |
Merrill Lynch International | | | 114,362 | | | | (4,164 | ) | | | — | | | | 110,198 | |
State Street Corp. | | | 168,471 | | | | (168,471 | ) | | | — | | | | — | |
TD Bank Financial Group | | | 1,046 | | | | (1,046 | ) | | | — | | | | — | |
UBS | | | 3,533,760 | | | | (3,056,186 | ) | | | — | | | | 477,574 | |
| | | | | | | | | | | | | | | | |
Total | | $ | 5,011,922 | | | $ | (3,445,597 | ) | | $ | (374,604 | ) | | $ | 1,191,721 | |
| | | | | | | | | | | | | | | | |
| | | | |
| Counterparty | | Gross Amount of
Derivative Liabilities
Subject to Netting
Arrangements
Presented on the
CSAL (a) | | | Derivatives
Available
for Offset | | | Collateral
Posted | | | Net Amount Due
to Counterparty
(not less than zero) | |
Bank of America | | $ | 2,459 | | | $ | (2,459 | ) | | $ | — | | | $ | — | |
Barclays Bank plc | | | 6,787 | | | | — | | | | — | | | | 6,787 | |
Citibank, NA | | | 129,848 | | | | (129,848 | ) | | | — | | | | — | |
Goldman Sachs International | | | 5,000 | | | | (5,000 | ) | | | — | | | | — | |
HSBC Bank, NA | | | 78,423 | | | | (78,423 | ) | | | — | | | | — | |
Merrill Lynch International | | | 4,164 | | | | (4,164 | ) | | | — | | | | — | |
Royal Bank of Canada | | | 5,426 | | | | — | | | | — | | | | 5,426 | |
State Street Corp. | | | 276,802 | | | | (168,471 | ) | | | — | | | | 108,331 | |
TD Bank Financial Group | | | 1,300 | | | | (1,046 | ) | | | — | | | | 254 | |
UBS | | | 3,056,186 | | | | (3,056,186 | ) | | | — | | | | — | |
| | | | | | | | | | | | | | | | |
Total | | $ | 3,566,395 | | | $ | (3,445,597 | ) | | $ | — | | | $ | 120,798 | |
| | | | | | | | | | | | | | | | |
| | | | | | | | |
| | | |
| OCTOBER 31, 2018 | | J.P. MORGAN EXCHANGE-TRADED FUNDS | | | | | 135 | |
NOTES TO FINANCIAL STATEMENTS
AS OF OCTOBER 31, 2018 (continued)
Event Driven ETF
| | | | | | | | | | | | | | | | |
| Counterparty | | Gross Amount of
Derivative Assets
Subject to Netting
Arrangements
Presented on the
SAL (a) | | | Derivatives
Available
for Offset | | | Collateral
Received | | | Net Amount Due
from Counterparty
(not less than zero) | |
Bank of America | | $ | 21,467 | | | $ | (21,467 | ) | | $ | — | | | $ | — | |
Citibank, NA | | | 15,901 | | | | — | | | | — | | | | 15,901 | |
Goldman Sachs International | | | 83,158 | | | | (83,158 | ) | | | — | | | | — | |
State Street Corp. | | | 1,712 | | | | — | | | | — | | | | 1,712 | |
| | | | | | | | | | | | | | | | |
Total | | $ | 122,238 | | | $ | (104,625 | ) | | $ | — | | | $ | 17,613 | |
| | | | | | | | | | | | | | | | |
| | | | |
| Counterparty | | Gross Amount of
Derivative Liabilities Subject to Netting
Arrangements Presented on the
SAL (a) | | | Derivatives
Available
for Offset | | | Collateral
Posted | | | Net Amount Due
to Counterparty
(not less than zero) | |
Bank of America | | $ | 179,753 | | | $ | (21,467 | ) | | $ | (158,286 | ) | | $ | — | |
Goldman Sachs International | | | 170,327 | | | | (83,158 | ) | | | — | | | | 87,169 | |
| | | | | | | | | | | | | | | | |
Total | | $ | 350,080 | | | $ | (104,625 | ) | | $ | (158,286 | ) | | $ | 87,169 | |
| | | | | | | | | | | | | | | | |
Long/Short ETF
| | | | | | | | | | | | | | | | |
| Counterparty | | Gross Amount of
Derivative Assets
Subject to Netting
Arrangements
Presented on the
SAL (a) | | | Derivatives
Available
for Offset | | | Collateral
Received | | | Net Amount Due
from Counterparty
(not less than zero) | |
Bank of America | | $ | 260,638 | | | $ | (36,521 | ) | | $ | (224,117 | ) | | $ | — | |
Citibank, NA | | | 9,244 | | | | (4,040 | ) | | | — | | | | 5,204 | |
Goldman Sachs International | | | 838,975 | | | | (27,941 | ) | | | (300,000 | ) | | | 511,034 | |
State Street Corp. | | | 1,451 | | | | — | | | | — | | | | 1,451 | |
| | | | | | | | | | | | | | | | |
Total | | $ | 1,110,308 | | | $ | (68,502 | ) | | $ | (524,117 | ) | | $ | 517,689 | |
| | | | | | | | | | | | | | | | |
| | | | |
| Counterparty | | Gross Amount of
Derivative Liabilities
Subject to Netting
Arrangements
Presented on the
SAL (a) | | | Derivatives
Available
for Offset | | | Collateral
Posted | | | Net Amount Due
to Counterparty
(not less than zero) | |
Bank of America | | $ | 36,521 | | | $ | (36,521 | ) | | $ | — | | | $ | — | |
Citibank, NA | | | 4,040 | | | | (4,040 | ) | | | — | | | | — | |
Goldman Sachs International | | | 27,941 | | | | (27,941 | ) | | | — | | | | — | |
Merrill Lynch International | | | 1,962 | | | | — | | | | — | | | | 1,962 | |
TD Bank Financial Group | | | 439 | | | | — | | | | — | | | | 439 | |
| | | | | | | | | | | | | | | | |
Total | | $ | 70,903 | | | $ | (68,502 | ) | | $ | — | | | $ | 2,401 | |
| | | | | | | | | | | | | | | | |
| | | | | | |
| | | |
| 136 | | | | J.P. MORGAN EXCHANGE-TRADED FUNDS | | OCTOBER 31, 2018 |
Managed Futures Strategy ETF
| | | | | | | | | | | | | | | | |
| Counterparty | | Gross Amount of
Derivative Assets
Subject to Netting
Arrangements
Presented on the
SAL (a) | | | Derivatives
Available
for Offset | | | Collateral
Received | | | Net Amount Due
from Counterparty
(not less than zero) | |
Barclays Bank plc | | $ | 3,556 | | | $ | (3,556 | ) | | $ | — | | | $ | — | |
BNP Paribas | | | 38,545 | | | | — | | | | — | | | | 38,545 | |
Citibank, NA | | | 106,002 | | | | (23,577 | ) | | | — | | | | 82,425 | |
Goldman Sachs International | | | 5,974 | | | | — | | | | — | | | | 5,974 | |
Merrill Lynch International | | | 75,805 | | | | — | | | | — | | | | 75,805 | |
State Street Corp. | | | 45,657 | | | | (45,657 | ) | | | — | | | | — | |
| | | | | | | | | | | | | | | | |
Total | | $ | 275,539 | | | $ | (72,790 | ) | | $ | — | | | $ | 202,749 | |
| | | | | | | | | | | | | | | | |
| | | | |
| Counterparty | | Gross Amount of
Derivative Liabilities
Subject to Netting
Arrangements
Presented on the
SAL (a) | | | Derivatives
Available
for Offset | | | Collateral
Posted | | | Net Amount Due
to Counterparty
(not less than zero) | |
Australia & New Zealand Banking Group Ltd. | | $ | 9,397 | | | $ | — | | | $ | — | | | $ | 9,397 | |
Barclays Bank plc | | | 3,782 | | | | (3,556 | ) | | | — | | | | 226 | |
Citibank, NA | | | 23,577 | | | | (23,577 | ) | | | — | | | | — | |
State Street Corp. | | | 134,902 | | | | (45,657 | ) | | | — | | | | 89,245 | |
TD Bank Financial Group | | | 3,812 | | | | — | | | | — | | | | 3,812 | |
| | | | | | | | | | | | | | | | |
Total | | $ | 175,470 | | | $ | (72,790 | ) | | $ | — | | | $ | 102,680 | |
| | | | | | | | | | | | | | | | |
| (a) | For financial reporting purposes, the Fund does not offset derivative assets and derivative liabilities subject to master netting arrangements on the Statements of Assets and Liabilities. |
The following tables present the effect of derivatives on the CSOP/SOP for the period ended October 31, 2018, by primary underlying risk exposure:
Diversified Alternatives ETF
| | | | | | | | | | | | | | | | | | | | |
| Amount of Realized Gain (Loss) on Derivatives Recognized on the CSOP | |
| Derivative Contracts | | | | | Futures
Contracts | | | Forward Foreign
Currency Exchange
Contracts | | | Swaps | | | Total | |
Commodity contracts | | | | | | $ | (767,903 | ) | | $ | — | | | $ | — | | | $ | (767,903 | ) |
Equity contracts | | | | | | | (2,804,284 | ) | | | — | | | | (6,024,348 | ) | | | (8,828,632 | ) |
Interest rate contracts | | | | | | | (2,236,869 | ) | | | — | | | | — | | | | (2,236,869 | ) |
Foreign exchange contracts | | | | | | | — | | | | (656,248 | ) | | | — | | | | (656,248 | ) |
| | | | | | | | | | | | | | | | | | | | |
Total | | | | | | $ | (5,809,056 | ) | | $ | (656,248 | ) | | $ | (6,024,348 | ) | | $ | (12,489,652 | ) |
| | | | | | | | | | | | | | | | | | | | |
|
| Amount of Change in Unrealized Appreciation (Depreciation) on Derivatives Recognized on the CSOP | |
| Derivative Contracts | | | | | Futures
Contracts | | | Forward Foreign
Currency Exchange
Contracts | | | Swaps | | | Total | |
Commodity contracts | | | | | | $ | (1,872,002 | ) | | $ | — | | | $ | — | | | $ | (1,872,002 | ) |
Equity contracts | | | | | | | 1,568,408 | | | | — | | | | 848,802 | | | | 2,417,210 | |
Interest rate contracts | | | | | | | (119,403 | ) | | | — | | | | — | | | | (119,403 | ) |
Foreign exchange contracts | | | | | | | — | | | | 751,785 | | | | — | | | | 751,785 | |
| | | | | | | | | | | | | | | | | | | | |
Total | | | | | | $ | (422,997 | ) | | $ | 751,785 | | | $ | 848,802 | | | $ | 1,177,590 | |
| | | | | | | | | | | | | | | | | | | | |
| | | | | | | | |
| | | |
| OCTOBER 31, 2018 | | J.P. MORGAN EXCHANGE-TRADED FUNDS | | | | | 137 | |
NOTES TO FINANCIAL STATEMENTS
AS OF OCTOBER 31, 2018 (continued)
Event Driven ETF
| | | | | | | | | | | | | | | | | | | | |
| Amount of Realized Gain (Loss) on Derivatives Recognized on the Statements of Operations | |
| Derivative Contracts | | | | | Futures
Contracts | | | Forward Foreign
Currency Exchange
Contracts | | | Swaps | | | Total | |
Equity contracts | | | | | | $ | (210,996 | ) | | $ | — | | | $ | 930,667 | | | $ | 719,671 | |
Foreign exchange contracts | | | | | | | — | | | | 20,048 | | | | — | | | | 20,048 | |
| | | | | | | | | | | | | | | | | | | | |
Total | | | | | | $ | (210,996 | ) | | $ | 20,048 | | | $ | 930,667 | | | $ | 739,719 | |
| | | | | | | | | | | | | | | | | | | | |
|
| Amount of Change in Unrealized Appreciation (Depreciation) on Derivatives Recognized on the Statements of Operations | |
| Derivative Contracts | | | | | Futures
Contracts | | | Forward Foreign
Currency Exchange
Contracts | | | Swaps | | | Total | |
Equity contracts | | | | | | $ | 18,000 | | | $ | — | | | $ | (244,284 | ) | | $ | (226,284 | ) |
Foreign exchange contracts | | | | | | | — | | | | 16,442 | | | | — | | | | 16,442 | |
| | | | | | | | | | | | | | | | | | | | |
Total | | | | | | $ | 18,000 | | | $ | 16,442 | | | $ | (244,284 | ) | | $ | (209,842 | ) |
| | | | | | | | | | | | | | | | | | | | |
Long/Short ETF
| | | | | | | | | | | | | | | | | | | | |
| Amount of Realized Gain (Loss) on Derivatives Recognized on the Statements of Operations | |
| Derivative Contracts | | | | | Futures
Contracts | | | Forward Foreign
Currency Exchange
Contracts | | | Swaps | | | Total | |
Equity contracts | | | | | | $ | (614,436 | ) | | $ | — | | | $ | (2,068,628 | ) | | $ | (2,683,064 | ) |
Foreign exchange contracts | | | | | | | — | | | | 2,817 | | | | — | | | | 2,817 | |
| | | | | | | | | | | | | | | | | | | | |
Total | | | | | | $ | (614,436 | ) | | $ | 2,817 | | | $ | (2,068,628 | ) | | $ | (2,680,247 | ) |
| | | | | | | | | | | | | | | | | | | | |
|
| Amount of Change in Unrealized Appreciation (Depreciation) on Derivatives Recognized on the Statements of Operations | |
| Derivative Contracts | | | | | Futures
Contracts | | | Forward Foreign
Currency Exchange
Contracts | | | Swaps | | | Total | |
Equity contracts | | | | | | $ | (3,541 | ) | | $ | — | | | $ | 1,035,151 | | | $ | 1,031,610 | |
Foreign exchange contracts | | | | | | | — | | | | 4,254 | | | | — | | | | 4,254 | |
| | | | | | | | | | | | | | | | | | | | |
Total | | | | | | $ | (3,541 | ) | | $ | 4,254 | | | $ | 1,035,151 | | | $ | 1,035,864 | |
| | | | | | | | | | | | | | | | | | | | |
Managed Futures Strategy ETF
| | | | | | | | | | | | | | | | |
| Amount of Realized Gain (Loss) on Derivatives Recognized on the CSOP | |
| Derivative Contracts | | | | | Futures
Contracts | | | Forward Foreign
Currency Exchange
Contracts | | | Total | |
Commodity contracts | | | | | | $ | (430,078 | ) | | $ | — | | | $ | (430,078 | ) |
Equity contracts | | | | | | | (565,851 | ) | | | — | | | | (565,851 | ) |
Interest rate contracts | | | | | | | (1,310,838 | ) | | | — | | | | (1,310,838 | ) |
Foreign exchange contracts | | | | | | | — | | | | (56,560 | ) | | | (56,560 | ) |
| | | | | | | | | | | | | | | | |
Total | | | | | | $ | (2,306,767 | ) | | $ | (56,560 | ) | | $ | (2,363,327 | ) |
| | | | | | | | | | | | | | | | |
|
| Amount of Change in Unrealized Appreciation (Depreciation) on Derivatives Recognized on the CSOP | |
| Derivative Contracts | | | | | Futures
Contracts | | | Forward Foreign
Currency Exchange
Contracts | | | Total | |
Commodity contracts | | | | | | $ | (761,481 | ) | | $ | — | | | $ | (761,481 | ) |
Equity contracts | | | | | | | (37,839 | ) | | | — | | | | (37,839 | ) |
Interest rate contracts | | | | | | | (255,642 | ) | | | — | | | | (255,642 | ) |
Foreign exchange contracts | | | | | | | — | | | | 100,069 | | | | 100,069 | |
| | | | | | | | | | | | | | | | |
Total | | | | | | $ | (1,054,962 | ) | | $ | 100,069 | | | $ | (954,893 | ) |
| | | | | | | | | | | | | | | | |
| | | | | | |
| | | |
| 138 | | | | J.P. MORGAN EXCHANGE-TRADED FUNDS | | OCTOBER 31, 2018 |
Derivatives Volume
The table below discloses the volume of the Funds’ futures contracts and forward foreign currency exchange contracts activity for the period ended October 31, 2018. Please refer to the tables in the Summary of Derivatives Information for derivative-related gains and losses associated with volume activity.
| | | | | | | | | | | | | | | | |
| | | Diversified
Alternatives
ETF | | | Event Driven
ETF | | | Long/Short
ETF | | | Managed
Futures
Strategy ETF | |
Futures Contracts — Equity | | | | | | | | | | | | | | | | |
Average Notional Balance Long | | $ | 9,320,426 | | | | — | | | $ | 2,893,005 | (b) | | $ | 7,911,184 | (c) |
Average Notional Balance Short | | | 19,967,672 | | | $ | 1,411,607 | (a) | | | 985,288 | (d) | | | 2,547,562 | (d) |
Ending Notional Balance Long | | | 5,069,083 | | | | — | | | | 1,307,350 | | | | 4,070,091 | |
Ending Notional Balance Short | | | 32,281,618 | | | | 308,908 | | | | 2,323,686 | | | | 7,014,966 | |
| | | | |
Futures Contracts — Interest Rate | | | | | | | | | | | | | | | | |
Average Notional Balance Long | | | 120,861,876 | | | | — | | | | — | | | | 75,369,314 | (c) |
Average Notional Balance Short | | | 133,250,072 | | | | — | | | | — | | | | 90,004,237 | (c) |
Ending Notional Balance Long | | | 91,613,147 | | | | — | | | | — | | | | 57,492,591 | |
Ending Notional Balance Short | | | 143,633,327 | | | | — | | | | — | | | | 100,550,439 | |
| | | | |
Futures Contracts — Commodities | | | | | | | | | | | | | | | | |
Average Notional Balance Long | | | 23,505,232 | | | | — | | | | — | | | | 13,326,036 | (c) |
Average Notional Balance Short | | | 23,794,274 | | | | — | | | | — | | | | 13,763,446 | (c) |
Ending Notional Balance Long | | | 23,527,620 | | | | — | | | | — | | | | 14,554,149 | |
Ending Notional Balance Short | | | 31,314,742 | | | | — | | | | — | | | | 20,229,782 | |
| | | | |
Forward Foreign Currency Exchange Contracts: | | | | | | | | | | | | | | | | |
Average Settlement Value Purchased | | | 36,909,828 | | | | 102,825 | (e) | | | 216,526 | (b) | | | 13,008,569 | (c) |
Average Settlement Value Sold | | | 53,966,428 | | | | 855,600 | (a) | | | 332,630 | (b) | | | 20,296,559 | (c) |
Ending Settlement Value Purchased | | | 32,718,469 | | | | 178,610 | | | | 364,639 | | | | 9,808,466 | |
Ending Settlement Value Sold | | | 63,161,603 | | | | 1,493,987 | | | | 715,557 | | | | 18,714,249 | |
| | | | |
Total Return Basket Swaps | | | | | | | | | | | | | | | | |
Average Notional Balance Long | | | 112,916,246 | | | | 15,313,047 | (a) | | | 17,564,592 | (b) | | | — | |
Average Notional Balance Short | | | 95,626,536 | | | | 3,192,602 | (a) | | | 25,944,887 | (b) | | | — | |
Ending Notional Balance Long | | | 120,739,817 | | | | 11,185,783 | | | | 15,348,043 | | | | — | |
Ending Notional Balance Short | | | 103,751,061 | | | | 3,127,867 | | | | 25,878,951 | | | | — | |
| (a) | For the period November 29, 2017 through October 31, 2018. |
| (b) | For the period January 23, 2018 through October 31, 2018. |
| (c) | For the period December 5, 2017 through October 31, 2018. |
| (d) | For the period March 1, 2018 through October 31, 2018. |
| (e) | For the period February 1, 2018 through October 31, 2018. |
The Funds’ derivatives contracts held at October 31, 2018 are not accounted for as hedging instruments under GAAP.
D. Securities Lending — Effective October 5, 2018, the Event Driven ETF and Long/Short ETF became authorized to engage in securities lending in order to generate additional income. Event Driven ETF and Long/Short ETF are able to lend to approved borrowers. Citibank N. A. (“Citibank”) serves as lending agent for both of these funds, pursuant to a Securities Lending Agency Agreement (the “Securities Lending Agency Agreement”). Securities loaned are collateralized by cash equal to at least 100% of the market value plus accrued interest on the securities lent, which is invested in an affiliated money market fund. Event Driven ETF and Long/Short ETF retain loan fees and the interest on cash collateral investments but are required to pay the borrower a rebate for the use of cash collateral. In cases where the lent security is of high value to borrowers, there may be a negative rebate (i.e., a net payment from the borrower to the Funds). Upon termination of a loan, Event Driven ETF and Long/Short ETF are required to return to the borrower an amount equal to the cash collateral, plus any rebate owed to the borrowers. The remaining maturities of the securities lending transactions are considered overnight and continuous. Loans are subject to termination by the Fund or the borrower at any time.
The net income earned on the securities lending (after payment of rebates and Citibank’s fee) is included on the SOP as Income from securities lending (net). Event Driven ETF and Long/Short ETF also receive payments from the borrower during the period of the loan, equivalent to dividends and interest earned on the securities loaned, which are recorded as Dividend or Interest income, respectively, on the SOP.
Under the Securities Lending Agency Agreement, Citibank marks to market the loaned securities on a daily basis. In the event the cash received from the borrower is less than 102% of the value of the loaned securities (105% for loans of non-U.S. securities), Citibank requests additional cash from the borrower so as to maintain a collateralization level of at least 102% of the value of the loaned securities plus accrued interest (105% for loans of non-U.S. securities).
| | | | | | | | |
| | | |
| OCTOBER 31, 2018 | | J.P. MORGAN EXCHANGE-TRADED FUNDS | | | | | 139 | |
NOTES TO FINANCIAL STATEMENTS
AS OF OCTOBER 31, 2018 (continued)
The value of securities out on loan is recorded as an asset on the SAL. The value of the cash collateral received is recorded as a liability on the SAL and details of Collateral Investments are disclosed in the SOIs.
The Event Driven ETF and Long/Short ETF bear the risk of loss associated with the Collateral Investments and are not entitled to additional collateral from the borrower to cover any such losses. To the extent that the value of the Collateral Investments declines below the amount owed to a borrower, Event Driven ETF and Long/Short ETF may incur losses that exceed the amount it earned on lending the security. Upon termination of a loan, Event Driven ETF and Long/Short ETF may use leverage (borrow money) to repay the borrower for cash collateral posted if the Adviser does not believe that it is prudent to sell the Collateral Investments to fund the payment of this liability. Securities lending activity is not subject to master netting arrangements.
Securities lending also involves counterparty risks, including the risk that the loaned securities may not be returned in a timely manner or at all. Subject to certain conditions, Citibank has agreed to indemnify Event Driven ETF and Long/Short ETF from losses resulting from a borrower’s failure to return a loaned security.
The Event Driven ETF and Long/Short ETF did not lend out any securities during the period October 5, 2018 through October 31, 2018.
E. Investment Transactions with Affiliates — The Funds invested in Underlying Funds which are advised by the Adviser. An issuer which is under common control with a Fund may be considered an affiliate. For the purposes of the financial statements, the Funds assume the issuers listed in the table below to be affiliated issuers. Underlying Funds’ distributions may be reinvested into the Underlying Funds. Reinvestment amounts are included in the purchase cost amounts in the tables below.
Diversified Alternatives ETF
| | | | | | | | | | | | | | | | | | | | | | | | | | | | | | | | | | | | |
| | | For the year ended October 31, 2018 | |
Security
Description | | Value at
October 31,
2017 | | | Purchases
at Cost | | | Proceeds
from Sales | | | Net Realized
Gain (Loss) | | | Change
in Unrealized
Appreciation/
(Depreciation) | | | Value at
October 31,
2018 | | | Shares at
October 31,
2018 | | | Dividend
Income | | | Capital Gain
Distributions | |
JPMorgan U.S. Government Money Market Fund Class Institutional Shares, 2.02% (b) (c) | | $ | 79,678,128 | | | $ | 131,869,190 | | | $ | 140,714,765 | | | $ | — | | | $ | — | | | $ | 70,832,553 | | | | 70,832,553 | | | $ | 1,119,297 | | | $ | — | |
| | | | | | | | | | | | | | | | | | | | | | | | | | | | | | | | | | | | |
Event Driven ETF
| | | | | | | | | | | | | | | | | | | | | | | | | | | | | | | | | | | | |
| | | For the period ended October 31, 2018 | |
| Security Description | | Value at
November 29,
2017 (a) | | | Purchases
at Cost | | | Proceeds
from Sales | | | Net Realized
Gain (Loss) | | | Change
in Unrealized
Appreciation/
(Depreciation) | | | Value at
October 31,
2018 | | | Shares at
October 31,
2018 | | | Dividend
Income | | | Capital Gain
Distributions | |
JPMorgan U.S. Government Money Market Fund Class Institutional Shares, 2.02% (b) (c) | | $ | — | | | $ | 60,301,344 | | | $ | 54,701,006 | | | $ | — | | | $ | — | | | $ | 5,600,338 | | | | 5,600,338 | | | $ | 209,002 | | | $ | — | |
| | | | | | | | | | | | | | | | | | | | | | | | | | | | | | | | | | | | |
Long/Short ETF
| | | | | | | | | | | | | | | | | | | | | | | | | | | | | | | | | | | | |
| | | For the period ended October 31, 2018 | |
| Security Description | | Value at
January 23,
2018 (a) | | | Purchases
at Cost | | | Proceeds
from Sales | | | Net Realized
Gain (Loss) | | | Change
in Unrealized
Appreciation/
(Depreciation) | | | Value at
October 31,
2018 | | | Shares at
October 31,
2018 | | | Dividend
Income | | | Capital Gain
Distributions | |
JPMorgan U.S. Government Money Market Fund Class Institutional Shares, 2.02% (b) (c) | | $ | — | | | $ | 33,808,401 | | | $ | 28,751,057 | | | $ | — | | | $ | — | | | $ | 5,057,344 | | | | 5,057,344 | | | $ | 112,179 | | | $ | — | |
| | | | | | | | | | | | | | | | | | | | | | | | | | | | | | | | | | | | |
| | | | | | |
| | | |
| 140 | | | | J.P. MORGAN EXCHANGE-TRADED FUNDS | | OCTOBER 31, 2018 |
Managed Futures Strategy ETF
| | | | | | | | | | | | | | | | | | | | | | | | | | | | | | | | | | | | |
| | | For the period ended October 31, 2018 | |
| Security Description | | Value at
December 5,
2017 (a) | | | Purchases
at Cost | | | Proceeds
from Sales | | | Net Realized
Gain (Loss) | | | Change
in Unrealized
Appreciation/
(Depreciation) | | | Value at
October 31,
2018 | | | Shares at
October 31,
2018 | | | Dividend
Income | | | Capital Gain
Distributions | |
JPMorgan U.S. Government Money Market Fund Class Institutional Shares, 2.02% (b) (c) | | $ | — | | | $ | 75,987,826 | | | $ | 33,484,602 | | | $ | — | | | $ | — | | | $ | 42,503,224 | | | $ | 42,503,224 | | | $ | 586,535 | | | $ | — | |
| | | | | | | | | | | | | | | | | | | | | | | | | | | | | | | | | | | | |
| (a) | Commencement of operations. |
| (b) | Investment in affiliate. Fund is registered under the Investment Company Act of 1940, as amended, and advised by J.P. Morgan Investment Management Inc. |
| (c) | The rate shown is the current yield as of October 31, 2018. |
F. Foreign Currency Translation — The books and records of the Funds are maintained in U.S. dollars. Foreign currency amounts are translated into U.S. dollars at the prevailing exchange rates of such currencies against the U.S. dollar. The market value of investment securities and other assets and liabilities are translated at the exchange rate as of the valuation date. Purchases and sales of investment securities, income and expenses are translated at the exchange rate prevailing on the respective dates of such transactions.
The Funds do not isolate the effect of changes in foreign exchange rates from changes in market prices of securities held. Accordingly, such changes are included within Change in net unrealized appreciation/depreciation on investments on the CSOP/SOP.
Reported realized foreign currency gains and losses arise from the disposition of foreign currency, currency gains or losses realized between the trade and settlement dates on securities transactions, and the difference between the amounts of dividends, interest and foreign withholding taxes recorded on each Fund’s books on the transaction date and the U.S. dollar equivalent of the amounts actually received or paid. These reported realized foreign currency gains and losses are included in Net realized gain (loss) on foreign currency transactions on the CSOP/SOP. Unrealized foreign currency gains and losses arise from changes (due to changes in exchange rates) in the value of foreign currency and other assets and liabilities denominated in foreign currencies, which are held at year end and are included in Change in net unrealized appreciation/ depreciation on foreign currency translations on the CSOP/SOP.
G. Offering and Organizational Costs — Total offering costs incurred in connection with the offering of shares of the Funds are amortized on a straight line basis over 12 months from the date the Funds commenced operations. For the period ended October 31, 2018, total offering costs incurred were:
| | | | |
Event Driven ETF (a) | | $ | 14,273 | |
Long/Short ETF (b) | | | 36,180 | |
Managed Futures Strategy ETF (c) | | | 36,155 | |
Costs paid in connection with the organization of the Funds, if any, were recorded as an expense at the time the Funds commenced operations and are included as offering costs on the CSOP/SOP. For the period ended October 31, 2018, total offering costs amortized were:
| | | | |
Event Driven ETF (a) | | $ | 13,140 | |
Long/Short ETF (b) | | | 27,953 | |
Managed Futures Strategy ETF (c) | | | 32,588 | |
| (a) | Commencement of operations was November 29, 2017. |
| (b) | Commencement of operations was January 23, 2018. |
| (c) | Commencement of operations was December 5, 2017. |
H. Security Transactions and Investment Income — Investment transactions are accounted for on the trade date (the date the order to buy or sell is executed). Securities gains and losses are calculated on a specifically identified cost basis. Interest income is determined on the basis of coupon interest accrued using the effective interest method which adjusts for amortization of premiums and accretion of discounts. Dividend income net of foreign taxes withheld, if any, distributions of net investment income and realized capital gains from the Underlying Funds and ETFs, if any, and dividend expense on securities sold short, are recorded on the ex-dividend date or when a Fund first learns of the dividend.
To the extent such information is publicly available, the Funds record distributions received in excess of income earned from underlying investments as a reduction of cost of investments and/or realized gain. Such amounts are based on estimates if actual amounts are not available and actual amounts of income, realized gain and return of capital may differ from the estimated amounts. The Funds adjust the estimated amounts of the components of distributions (and consequently their net investment income) as necessary once the issuers provide information about the actual composition of the distributions.
| | | | | | | | |
| | | |
| OCTOBER 31, 2018 | | J.P. MORGAN EXCHANGE-TRADED FUNDS | | | | | 141 | |
NOTES TO FINANCIAL STATEMENTS
AS OF OCTOBER 31, 2018 (continued)
I. Allocation of Expenses — Expenses directly attributable to a fund are charged directly to that fund, while the expenses attributable to more than one fund of the Trust are allocated among the respective funds.
J. Federal Income Taxes — Each Fund is treated as a separate taxable entity for Federal income tax purposes. Each Fund’s policy is to comply with the provisions of the Internal Revenue Code (the “Code”), applicable to regulated investment companies and to distribute to shareholders all of its distributable net investment income and net realized capital gains on investments. Accordingly, no provision for Federal income tax is necessary. Management has reviewed the Funds’ tax positions for all open tax years and has determined that as of October 31, 2018, no liability for income tax is required in the Funds’ financial statements for net unrecognized tax benefits. However, management’s conclusions may be subject to future review based on changes in, or the interpretation of, the accounting standards or tax laws and regulations. Each of the Funds’ Federal tax returns for the prior three fiscal years, or since inception if shorter, remains subject to examination by the Internal Revenue Service.
For Federal income tax purposes, taxable income of each Fund and its Subsidiary are separately calculated. The Subsidiary is classified as a controlled foreign corporation under the Code and its taxable income, including net gains, is included as ordinary income in the calculation of each Fund’s taxable income. Net losses of the Subsidiary are not deductible by each Fund either in the current period or carried forward to future periods.
K. Foreign Taxes — The Funds may be subject to foreign taxes on income, gains on investments or currency purchases/repatriation, a portion of which may be recoverable. The Funds will accrue such taxes and recoveries as applicable, based upon their current interpretation of tax rules and regulations that exist in the markets in which they invest. When a capital gain tax is determined to apply, the Fund records an estimated deferred tax liability in an amount that would be payable if the securities were disposed of on the valuation date.
L. Distributions to Shareholders — Distributions from net investment income, if any, are generally declared and paid annually. Net realized capital gains, if any, are distributed by each Fund at least annually. The amount of distributions from net investment income and net realized capital gains is determined in accordance with Federal income tax regulations, which may differ from GAAP. To the extent these “book/tax” differences are permanent in nature (i.e., that they result from other than timing of recognition — “temporary differences”), such amounts are reclassified within the capital accounts based on their Federal tax-basis treatment.
The following amounts were reclassified within the capital accounts:
| | | | | | | | | | | | |
| | | Paid-in-Capital | | | Accumulated
undistributed
(distributions
in excess of) net investment
income | | | Accumulated
net realized
gains (losses) | |
Diversified Alternatives ETF | | $ | (7,027,632 | ) | | $ | (2,252,875 | ) | | $ | 9,280,507 | |
Event Driven ETF | | | (8 | ) | | | 944,000 | | | | (943,992 | ) |
Long/Short ETF | | | (835,759 | ) | | | (1,247,596 | ) | | | 2,083,355 | |
Managed Futures Strategy ETF | | | (1,152,582 | ) | | | (316,909 | ) | | | 1,469,491 | |
The reclassifications for the Fund’s related primarily to investments in Subsidiary, foreign currency gain/loss, investments in swap contracts and net operating losses.
3. Fees and Other Transactions with Affiliates
A. Investment Advisory Fee — Pursuant to an Investment Advisory Agreement, the Adviser supervises the investments of each Fund and Subsidiary and for such services is paid a fee. The fee is accrued daily and paid monthly based on each Fund’s respective average daily net assets. The annual rate for each Fund is as follows:
| | | | |
Diversified Alternatives ETF | | | 0.60 | % |
Event Driven ETF | | | 0.75 | % |
Long/Short ETF | | | 0.60 | % |
Managed Futures Strategy ETF | | | 0.50 | % |
Each Subsidiary has entered into separate contracts with the Adviser and its affiliates to provide investment advisory and other services to the Subsidiary. The fee for services to the Subsidiary is accrued daily and paid monthly at an annual rate of 0.60% for the Diversified Alternatives ETF and 0.50% for the Managed Futures Strategy ETF of the Subsidiary’s average daily net assets. The Adviser has agreed to waive the advisory fee that it receives from the Fund in an amount equal to the advisory fee paid to the Adviser by the Subsidiary. This waiver will continue in effect so long as the Fund invests in the Subsidiary and may not be terminated without approval by the Fund’s Board.
The Adviser waived Investment Advisory fees and/or reimbursed expenses as outlined in Note 3.D.
B. Administration Fee — Pursuant to an Administration Agreement, the Administrator provides certain administration services to the Funds and the Subsidiaries. In consideration of these services, the Administrator receives a fee accrued daily and paid monthly at an annual rate of 0.085% of the average daily net assets of each Fund in the Trust covered by the Administration Agreement (excluding certain funds of funds and money market funds). In consideration for services rendered to each Subsidiary, the Administrator receives a fee accrued daily and paid monthly at an annualized rate of 0.10% of the average daily net assets of the Subsidiary.
| | | | | | |
| | | |
| 142 | | | | J.P. MORGAN EXCHANGE-TRADED FUNDS | | OCTOBER 31, 2018 |
The Administrator waived Administration fees as outlined in Note 3.D.
JPMorgan Chase Bank, N.A. (“JPMCB”), a wholly-owned subsidiary of JPMorgan, serves as the Funds’ sub-administrator (the “Sub-administrator”). For its services as Sub-administrator, JPMCB receives a portion of the fees payable to the Administrator.
C. Custodian, Accounting and Transfer Agent Fees — JPMCB provides portfolio custody, accounting and transfer agency services to the Funds. The amounts paid directly to JPMCB by the Funds for custody services are included in the Custodian, Accounting and Transfer Agent fees on the CSOP/SOP. Interest income earned on cash balances at the custodian, if any, is included in Interest income from affiliates on the CSOP/SOP. Prior to March 1, 2018, payments to the custodian were reduced by credits earned by the Fund, based on uninvested cash balances held by the custodian. Such earnings credits, if any, are included in the Custodian, Accounting and Transfer Agent fees on the CSOP/SOP. With respect to the transfer agency services provided by JPMCB for each creation or redemption transaction, the Authorized Participant will generally be responsible for such associated expenses; during the period, the Funds paid no transfer agency fees to JPMCB.
Additionally, Authorized Participants generally pay transaction fees associated with the creation and redemption of Fund shares. These fees are used to offset certain custodian charges incurred by the Fund for these transactions.
For the period ended October 31, 2018, the amount of transaction fees paid by the Authorized Participants that were used to reimburse Custodian and Transfer Agent fees were as follows:
| | | | |
Diversified Alternatives ETF | | $ | 8,000 | |
Event Driven ETF | | | 400 | |
Long/Short ETF | | | 400 | |
Managed Futures Strategy ETF | | | — | |
Such amounts are included in expense reimbursements from non-affiliates in the CSOP/SOP.
Restricted cash on the CSAL/SAL is cash received from Authorized Participants for the reimbursement of creation and/or redemption of Fund shares.
Interest expense paid to the custodian related to cash overdrafts, if any, is included in Interest expense to affiliates on the CSOP/SOP.
D. Waivers and Reimbursements — The Adviser, Administrator and JPMDS have contractually agreed to waive fees and/or reimburse the Funds to the extent that total annual operating expenses, inclusive of each Subsidiary (excluding acquired fund fees and expenses other than certain money market fund fees as described below, dividend and interest expenses related to short sales, interest, taxes, expenses related to litigation and potential litigation, and extraordinary expenses), exceed the percentages of the Funds’ respective average daily net assets as shown in the below table:
| | | | |
| | | Expense Cap | |
Diversified Alternatives ETF | | | 0.85 | % |
Event Driven ETF | | | 0.85 | % |
Long/Short ETF | | | 0.69 | % |
Managed Futures Strategy ETF | | | 0.59 | % |
The expense limitation agreements were in effect for the period ended October 31, 2018 and are in place until at least February 28, 2022 for the Diversified Alternatives ETF, November 30, 2020 for the Event Driven ETF, January 31, 2021 for the Long/Short ETF and December 31, 2020 for the Managed Futures Strategy ETF.
For the period ended October 31, 2018, the Funds’ service providers waived fees and/or reimbursed expenses for each of the Funds as follows. None of these parties expect the Funds to repay any such waived fees and/or reimbursed expenses in future years.
| | | | | | | | | | | | | | | | |
| | | Contractual Waivers | | | | |
| | | Investment
Advisory Fees | | | Administration
Fees | | | Total | | | Contractual
Reimbursements | |
Diversified Alternatives ETF | | $ | 244,492 | | | $ | 162,994 | | | $ | 407,486 | | | $ | — | |
Event Driven ETF | | | 155,744 | | | | 20,734 | | | | 176,478 | | | | 67,671 | |
Long/Short ETF | | | 97,589 | | | | 15,739 | | | | 113,328 | | | | 119,527 | |
Managed Futures Strategy ETF | | | 186,827 | | | | 44,485 | | | | 231,312 | | | | 130,002 | |
Additionally, the Funds may invest in one or more money market funds advised by the Adviser or its affiliates (affiliated money market funds). The Adviser, Administrator and/or JPMDS, as shareholder servicing agent, have contractually agreed to waive fees and/or reimburse expenses in an amount sufficient to offset the respective net fees each collects from the affiliated money market fund on the applicable Funds’ investment in such affiliated money market fund.
The amounts of these waivers resulting from investments in these money market funds for the period ended October 31, 2018 were as follows:
| | | | |
Diversified Alternatives ETF | | $ | 128,231 | |
Event Driven ETF | | | 27,198 | |
Long/Short ETF | | | 13,509 | |
Managed Futures Strategy ETF | | | 70,292 | |
| | | | | | | | |
| | | |
| OCTOBER 31, 2018 | | J.P. MORGAN EXCHANGE-TRADED FUNDS | | | | | 143 | |
NOTES TO FINANCIAL STATEMENTS
AS OF OCTOBER 31, 2018 (continued)
The Diversified Alternatives ETF and Managed Futures Strategy ETF invest in Subsidiaries and, as a result, bear a portion of the expenses incurred by these Subsidiaries. These expenses are reflected in the fees waived shown on the CSOP and are included in the ratios to average net assets shown in the Financial Highlights.
The amounts of these waivers resulting from investments in Subsidiaries for the period ended October 31, 2018 were as follows:
| | | | |
Diversified Alternatives ETF | | $ | 299,576 | |
Managed Futures Strategy ETF (a) | | | 152,844 | |
| (a) | Commencement of operations was December 5, 2017. |
E. Distribution Services — The Distributor or its agent distributes Creation Units for each Fund on an agency basis. The Distributor does not maintain a secondary market in shares of each Fund. JPMDS receives no fees for their distribution services under their respective distribution agreements with the Trust (the “Distribution Agreements”). Although the Trust does not pay any fees under the Distribution Agreements, JPMIM pays JPMDS for certain distribution related services.
F. Other — Certain officers of the Trust are affiliated with the Adviser, the Administrator and JPMDS. Such officers, with the exception of the Chief Compliance Officer, receive no compensation from the Funds for serving in their respective roles.
The Board appointed a Chief Compliance Officer to the Funds in accordance with Federal securities regulations. Each Fund, along with other affiliated funds, makes reimbursement payments, on a pro-rata basis, to the Administrator for a portion of the fees associated with the Office of the Chief Compliance Officer. Such fees are included in Trustees’ and Chief Compliance Officer’s fees on the CSOP/SOP.
The Funds may use related party broker-dealers. For the period ended October 31, 2018, the Funds did not incur any brokerage commissions with broker dealers affiliated with the Adviser.
The Securities and Exchange Commission (“SEC”) has granted an exemptive order permitting the Funds to engage in principal transactions with J.P. Morgan Securities, Inc., an affiliated broker, involving taxable money market instruments, subject to certain conditions.
4. Investment Transactions
During the period ended October 31, 2018, purchases and sales of investments (excluding short-term investments) were as follows:
| | | | | | | | |
| | | Purchases
(excluding U.S.
Government) | | | Sales
(excluding U.S.
Government) | |
Diversified Alternatives ETF | | $ | 230,511,371 | | | $ | 178,344,676 | |
Event Driven ETF (a) | | | 32,977,717 | | | | 17,228,657 | |
Long/Short ETF (b) | | | 30,765,163 | | | | 14,654,146 | |
Managed Futures Strategy ETF (c) | | | — | | | | — | |
| (a) | Commencement of operations was November 29, 2017. |
| (b) | Commencement of operations was January 23, 2018. |
| (c) | Commencement of operations was December 5, 2017. |
During the period ended October 31, 2018, there were no purchases or sales of U.S. Government securities.
5. Federal Income Tax Matters
For Federal income tax purposes, the estimated cost and unrealized appreciation (depreciation) in value of investment securities, including each Subsidiary, held at October 31, 2018 were as follows:
| | | | | | | | | | | | | | | | |
| | | Aggregate Cost | | | Gross Unrealized Appreciation | | | Gross Unrealized (Depreciation) | | | Net Unrealized Appreciation (Depreciation) | |
Diversified Alternatives ETF | | $ | 198,165,909 | | | $ | 10,165,587 | | | $ | (14,728,202 | ) | | $ | (4,562,615 | ) |
Event Driven ETF | | | 26,983,129 | | | | 479,212 | | | | (1,228,409 | ) | | | (749,197 | ) |
Long/Short ETF | | | 23,805,155 | | | | 1,132,755 | | | | (1,901,791 | ) | | | (769,036 | ) |
Managed Futures Strategy ETF | | | 48,053,728 | | | | 961,473 | | | | (2,339,321 | ) | | | (1,377,848 | ) |
The difference between book and tax basis appreciation (depreciation) on investments is primarily attributed to mark to market of futures contracts, mark to market of forward foreign currency contracts, investment in Subsidiary, investments in swap contracts and wash sale loss deferrals.
The Federal income tax unrealized appreciation (depreciation) in value of investment securities includes unrealized depreciation of the Diversified Alternatives ETF’s investment in its Subsidiary of $(2,920,026) and Managed Futures Strategy ETF’s investment in its Subsidiary of $(1,333,932), when if realized is not deductible for income tax purposes.
| | | | | | |
| | | |
| 144 | | | | J.P. MORGAN EXCHANGE-TRADED FUNDS | | OCTOBER 31, 2018 |
The Tax character of distributions paid during the period ended October 31, 2018 was as follows:
| | | | | | | | | | | | | | | | |
| | | Ordinary
Income* | | | Net
Long-Term
Capital Gains | | | Return of
Capital | | | Total
Distributions
Paid | |
Diversified Alternatives ETF | | $ | 868 | | | $ | — | | | $ | — | | | $ | 868 | |
Event Driven ETF | | | 13,930 | | | | — | | | | — | | | | 13,930 | |
Long/Short ETF | | | — | | | | — | | | | — | | | | — | |
Managed Futures Strategy ETF | | | 14,260 | | | | — | | | | — | | | | 14,260 | |
| * | Short-term gain distributions are treated as ordinary income for income tax purposes. |
| The | tax character of distributions paid during the year ended October 31, 2017 was as follows: |
| | | | | | | | |
| | | Ordinary
Income* | | | Total
Distributions
Paid | |
Diversified Alternatives ETF | | $ | 447,993 | | | $ | 457,632 | |
| * | Short-term gain distributions are treated as ordinary income for tax purposes. |
As of October 31, 2018, the estimated components of net assets (excluding paid-in-capital) on a tax basis were as follows:
| | | | | | | | | | | | | | | | |
| | | Current
Distributable
Ordinary
Income | | | Current
Distributable
Long-Term
Capital Gain | | | Tax Basis
Capital Loss
Carryover | | | Unrealized
Appreciation
(Depreciation) | |
Diversified Alternatives ETF | | $ | — | | | $ | — | | | $ | (1,756,223 | ) | | $ | (2,269,698 | ) |
Event Driven ETF | | | 858,294 | | | | — | | | | (120,780 | ) | | | (748,574 | ) |
Long/Short ETF | | | — | | | | — | | | | (1,211,171 | ) | | | (769,497 | ) |
Managed Futures Strategy ETF | | | 223,417 | | | | — | | | | (1,568,586 | ) | | | (412,456 | ) |
For the Funds, the cumulative timing differences primarily consist of wash sale loss deferrals, capital loss carryover, mark to market of forward foreign currency contracts, late year ordinary loss deferrals, mark to market of futures contracts, straddle loss deferrals and investments in swap contracts.
During the year ended October 31, 2018 the Diversified Alternatives Fund CS Ltd. and Managed Futures Fund CS Ltd. had approximately $2,284,794 and $1,152,519 of losses for tax purposes. The Subsidiaries’ loss for the current year are not available to offset their future taxable income.
As of October 31, 2018, the Funds had net capital loss carryforwards, with no expiration dates, as follows:
| | | | | | | | |
| | | Capital Loss Carryforward Character | |
| | | Short-Term | | | Long-Term | |
Diversified Alternatives ETF | | $ | (1,134,347 | ) | | $ | (621,876 | ) |
Event Driven ETF | | | — | | | | (120,780 | ) |
Long/Short ETF | | | (1,005,692 | ) | | | (205,479 | ) |
Managed Futures Strategy ETF | | | (695,169 | ) | | | (873,417 | ) |
6. Capital Share Transactions
The Trust issues and redeems shares of the Funds only in Creation Units through the Distributor at NAV. Capital shares transactions detail can be found in the Statements of Changes in Net Assets.
Shares of the Funds may only be purchased or redeemed by Authorized Participants. Such Authorized Participants may from time to time hold, of record or beneficially, a substantial percentage of the Funds’ shares outstanding, act as executing or clearing broker for investment transactions on behalf of the Funds. An Authorized Participant is either (1) a “Participating Party” or other participant in the clearing process through the Continuous Net Settlement System of the National Securities Clearing Corporation (“NSCC”); or (2) a DTC Participant; which, in either case, must have executed an agreement with the Distributor.
Creation Units of a Fund may be created in advance of receipt by the Trust of all or a portion of the applicable basket of equity securities and other instruments (“Deposit Instruments”) and cash as described in the Funds’ registration statement. In these instances, the initial Deposit Instruments and cash must be deposited in an amount equal to the sum of the cash amount. A transaction fee may be imposed to offset transfer and other transaction costs associated with the purchase or redemption of Creation Units.
Authorized Participants transacting in Creation Units for cash may also pay a variable fee to compensate the relevant fund for market impact expenses relating to investing in portfolio securities. Such variable fees, if any, are included in “Proceeds from shares issued” in the Statements of Changes in Net Assets.
| | | | | | | | |
| | | |
| OCTOBER 31, 2018 | | J.P. MORGAN EXCHANGE-TRADED FUNDS | | | | | 145 | |
NOTES TO FINANCIAL STATEMENTS
AS OF OCTOBER 31, 2018 (continued)
7. Risks, Concentrations and Indemnifications
In the normal course of business, the Funds enter into contracts that contain a variety of representations which provide general indemnifications. Each Fund’s maximum exposure under these arrangements is unknown. The amount of exposure would depend on future claims that may be brought against each Fund. However, based on experience, the Funds expect the risk of loss to be remote.
As of October 31, 2018, the Adviser owns shares representing more than 10% of net assets of following Funds:
| | | | |
| | | %
Ownership | |
Diversified Alternatives ETF | | | 42 | % |
Event Driven ETF | | | 95 | |
Long/Short ETF | | | 95 | |
Managed Futures Strategy ETF | | | 92 | |
Significant shareholder transactions by the Adviser may impact the Funds’ performance.
By investing in each Subsidiary, the Diversified Alternatives ETF and Managed Futures Strategy ETF are indirectly exposed to the risks associated with the Subsidiary’s investments. The derivatives and other investments held by the Subsidiary are generally similar to those that are permitted to be held by the Fund and are subject to the same risks that apply to similar investments if held directly by the Fund.
The Funds will employ various alternative investment strategies that involve the use of complicated investment techniques. There is no guarantee that these strategies will succeed and their use may subject the Funds to greater volatility and loss.
Derivatives, including swap agreements, commodity options, forwards, futures and options on futures, may be riskier than other types of investments because they may be more sensitive to changes in economic or market conditions than other types of investments and could result in losses that significantly exceed the Funds’ original investment. Many derivatives create leverage thereby causing a Fund to be more volatile than it would be if it had not used derivatives. Derivatives also expose the Funds to counterparty risk and to the credit risk of the derivative counterparty.
The Funds are also subject to counterparty credit risk, which is the risk that a counterparty fails to perform on agreements with a Fund such as swap and option contracts, credit linked notes, exchange-traded notes and forward foreign currency exchange contracts.
Disruptions to creations and redemptions, the existence of significant market volatility or potential lack of an active trading market for the Shares (including through a trading halt), as well as other factors, may result in Shares trading significantly above (at a premium) or below (at a discount) to the NAV or to the intraday value of the Fund’s holdings. During such periods, investors may incur significant losses if shares are sold.
Since the Managed Futures Strategy ETF is non-diversified, it may invest a greater percentage of its assets in a particular issuer or group of issuers than a diversified fund would. This increased investment in fewer issuers may result in the Fund’s shares being more sensitive to economic results of those issuing the securities.
8. New Accounting Pronouncements
In August 2018, the Financial Accounting Standard Board (“FASB”) issued Accounting Standard Update (“ASU”) 2018-13 (“ASU 2018-13”), Fair Value Measurement (Topic 820): Disclosure Framework — Changes to the Disclosure Requirements for Fair Value Measurement, which adds, removes, and modifies certain aspects of the fair value disclosure. ASU 2018-13 amendments are the result of a broader disclosure project, FASB Concepts Statement Conceptual Framework for Financial Reporting — Chapter 8: Notes to Financial Statements, to improve the effectiveness of the fair value disclosure requirements. ASU 2018-13 is effective for the fiscal years, and interim periods within those fiscal years, beginning after December 15, 2019; early adoption is permitted. We have evaluated the implications of these changes and the amendments are included in the financial statements, which had no effect to the Fund’s net assets or results of operation.
In August 2018, the SEC adopted their Disclosure Update and Simplification Rule (the “Rule”). The Rule is part of the SEC’s overall project to improve disclosure effectiveness by amending certain disclosure requirements that have become redundant, duplicative, overlapping, outdated, or superseded in light of other SEC disclosure requirements, U.S. GAAP, or changes in the information environment. The amendments are intended to facilitate the disclosure of information to investors and simplify compliance without significantly altering the total mix of information provided to investors. We have evaluated the implications of these changes and the amendments are included in the financial statements, which had no effect on the Funds’ net assets or results of operation.
| | | | | | |
| | | |
| 146 | | | | J.P. MORGAN EXCHANGE-TRADED FUNDS | | OCTOBER 31, 2018 |
REPORT OF INDEPENDENT REGISTERED PUBLIC ACCOUNTING FIRM
To the Board of Trustees of J.P. Morgan Exchange-Traded Fund Trust and the Shareholders of JPMorgan Diversified Alternatives ETF, JPMorgan Event Driven ETF, JPMorgan Long/Short ETF and JPMorgan Managed Futures Strategy ETF
Opinions on the Financial Statements
We have audited the financial statements and financial highlights of each of the funds listed in the table below (four of the funds constituting J.P. Morgan Exchange-Traded Fund Trust, hereafter collectively referred to as the “Funds”) as of October 31, 2018, and for the periods listed in the table below, including the related notes (collectively referred to as the “financial statements”).
| | |
| JPMorgan Diversified Alternatives ETF | | • Consolidated statement of assets and liabilities, including the consolidated schedule of portfolio investments as of October 31, 2018 • Consolidated statement of operations for the year ended October 31, 2018 • Consolidated statements of changes in net assets for each of the two years in the period ended October 31, 2018 • Consolidated financial highlights for each of the two years in the period ended October 31, 2018 and for the period September 12, 2016 (commencement of operations) through October 31, 2016 |
| JPMorgan Event Driven ETF | | • Statement of assets and liabilities, including the schedule of portfolio investments as of October 31, 2018 • Statements of operations and changes in net assets and the financial highlights for the period November 29, 2017 (commencement of operations) through October 31, 2018 |
| JPMorgan Long/Short ETF | | • Statement of assets and liabilities, including the schedule of portfolio investments as of October 31, 2018 • Statements of operations and changes in net assets and the financial highlights for the period January 23, 2018 (commencement of operations) through October 31, 2018 |
| JPMorgan Managed Futures Strategy ETF | | • Consolidated statement of assets and liabilities, including the consolidated schedule of portfolio investments as of October 31, 2018 • Consolidated statements of operations and changes in net assets and the consolidated financial highlights for the period December 5, 2017 (commencement of operations) through October 31, 2018 |
In our opinion, the financial statements present fairly, in all material respects, the financial position of each of the Funds as of October 31, 2018, the results of each of their operations, the changes in each of their net assets and each of the financial highlights for each of the periods indicated in the table above in conformity with accounting principles generally accepted in the United States of America.
Basis for Opinions
These financial statements are the responsibility of the Funds’ management. Our responsibility is to express an opinion on the Funds’ financial statements based on our audits. We are a public accounting firm registered with the Public Company Accounting Oversight Board (United States) (“PCAOB”) and are required to be independent with respect to the Funds in accordance with the U.S. federal securities laws and the applicable rules and regulations of the Securities and Exchange Commission and the PCAOB.
We conducted our audits of these financial statements in accordance with the standards of the PCAOB. Those standards require that we plan and perform the audit to obtain reasonable assurance about whether the financial statements are free of material misstatement, whether due to error or fraud.
Our audits included performing procedures to assess the risks of material misstatement of the financial statements, whether due to error or fraud, and performing procedures that respond to those risks. Such procedures included examining, on a test basis, evidence regarding the amounts and disclosures in the financial statements. Our audits also included evaluating the accounting principles used and significant estimates made by management, as well as evaluating the overall presentation of the financial statements. Our procedures included confirmation of securities owned as of October 31, 2018 by correspondence with the custodian, transfer agent and brokers; when replies were not received from brokers, we performed other auditing procedures. We believe that our audits provide a reasonable basis for our opinions.
/s/PricewaterhouseCoopers LLP
New York, New York
December 21, 2018
We have served as the auditor of one or more investment companies in the JPMorgan Funds complex since 1993.
| | | | | | | | |
| | | |
| OCTOBER 31, 2018 | | J.P. MORGAN EXCHANGE-TRADED FUNDS | | | | | 147 | |
TRUSTEES
(Unaudited)
The Funds’ Statements of Additional Information includes additional information about the Funds’ Trustees and is available, without charge, upon request by calling 1-844-457-6383 or on the J.P. Morgan Funds’ website at www.jpmorganfunds.com.
| | | | | | | | |
Name (Year of Birth;
Positions With
the Funds since) | | Principal Occupation
During Past 5 Years | | Number of
Funds in Fund
Complex Overseen
by Trustee (1) | | | Other Directorships Held
During the Past 5 Years |
Independent Trustees | | | | | | | | |
| | | |
Gary L. French (1951);
Trustee of the Trust since 2014 | | Real Estate Investor (2011–present); Consultant to the Mutual Fund Industry (2011-Present); Senior Consultant for The Regulatory Fundamentals Group LLC (2011–2017); Senior Vice President–Fund Administration, State Street Corporation (2002–2010). | | | 34 | | | Independent Trustee, The China Fund, Inc. (2013-present); Exchange Traded Concepts Trust II (2012-2014); Exchange Traded Concepts Trust I (2011-2014). |
| | | |
| Robert J. Grassi (1957); Trustee of the Trust since 2014 | | Sole Proprietor, Academy Hills Advisors LLC (2012-present); Pension Director, Corning Incorporated (2002-2012). | | | 34 | | | None. |
| | | |
| Thomas P. Lemke (1954); Trustee of the Trust since 2014 | | Retired; Executive Vice President and General Counsel, Legg Mason (2005-2013). | | | 34 | | | SEI family of funds (Independent Trustee of Advisors’ Inner Circle Fund III (20 portfolios) (from February 2014 to Present); Independent Trustee of Winton Diversified Opportunities Fund (from December 2014 to Present); Independent Trustee of Gallery Trust (from August 2015 to Present); Independent Trustee of Schroder Series Trust (from 2017 to Present) Independent Trustee of Schroder Global Series Trust (from February 2017 to Present); Independent Trustee of O’Connor EQUUS (May 2014–April 2016), Independent Trustee of Winton Series Trust (December 2014–March 2017); Independent Trustee of AXA Premier VIP Trust (2014–June 2017); Independent Director of The Victory Funds (or their predecessor funds) (35 portfolios) (2014–March 2015). |
| | | |
| Lawrence R. Maffia (1950); Trustee of the Trust since 2014 | | Retired; Director and President, ICI Mutual Insurance Company (2006-2013). | | | 34 | | | Director, ICI Mutual Insurance Company (1999-2013). |
| | | |
| Emily A. Youssouf (1951); Trustee of the Trust since 2014 | | Clinical Professor, NYU Schack Institute of Real Estate (2009-present); Board Member (2005-present), Chair of Capital Committee (2006-2016), Chair of Audit Committee (2005-present), and Chair of IT Committee (2016-present), NYC Health and Hospitals Corporation; Board Member and Member of the Audit Committee and Related Parties Committee (2013-present) and Member of the Risk Management Committee (2017-present), PennyMac Financial Services, Inc. | | | 34 | | | Trustee, NYC School Construction Authority (2009-present); Board Member, NYS Job Development Authority (2008-present); Trustee (2015-present) and Chair of the Audit and Finance Committee (2015-present) of the Transit Center Foundation; Vice Chair (2011-2013) and Board Member (2013-2014) of New York City Housing Authority. |
Interested Trustee | | | | | | | | |
| | | |
| Robert Deutsch (2) (1957); Chairman and Trustee of the Trust since 2014 | | Retired; Head of the Global ETF Business for JPMorgan Asset Management (2013-2017); Head of the Global Liquidity Business for JPMorgan Asset Management (2003-2013). | | | 34 | | | Board of Directors of the JUST Capital Foundation (2017–present). |
| (1) | A Fund Complex means two or more registered investment companies that hold themselves out to investors as related companies for purposes of investment and investor services or have a common investment adviser or have an investment adviser that is an affiliated person of the investment adviser of any of the other registered investment companies. Twenty nine series of the Trust have commenced operations. |
| (2) | Mr. Deutsch is an interested trustee because he was an employee of the Adviser until August 2017. |
The contact address for each of the Trustees is 270 Park Avenue, New York, NY 10017.
| | | | | | |
| | | |
| 148 | | | | J.P. MORGAN EXCHANGE-TRADED FUNDS | | OCTOBER 31, 2018 |
OFFICERS
(Unaudited)
| | |
Name (Year of Birth), Positions Held with the Trusts (Since) | | Principal Occupations During Past 5 Years |
| |
Joanna Gallegos (1975),
President and Principal Executive Officer (2017) | | Managing Director, Head of J.P. Morgan Asset Management’s U.S. Exchange Traded Funds business. Previously, Head of J.P. Morgan Asset Management’s ETF Product Development team from August 2013 to July 2017; Managing Director of the Strategic Initiatives Group in BlackRock’s iShares Exchange Traded Funds division from 2010 to 2013. |
| |
Lauren A. Paino (1973),
Treasurer and Principal Financial Officer (2015)* | | Executive Director, J.P. Morgan Investment Management Inc. (formerly JPMorgan Funds Management, Inc.) since August 2013; Director, Credit Suisse Asset Management from 2000 to 2013. |
| |
Brian S. Shlissel (1964), Vice President (2016) | | Managing Director and Chief Administrative Officer for J.P. Morgan pooled vehicles, J.P. Morgan Investment Management Inc. (formerly JPMorgan Funds Management, Inc.) (from 2014 to present); Managing Director and Head of Mutual Fund Services, Allianz Global Investors; President and Chief Executive Officer, Allianz Global Investors Mutual Funds and PIMCO Closed-End Funds (from 1999 to 2014). |
| |
Paul Shield (1960),
Vice President and Assistant Treasurer (2016) | | Managing Director and head of Business Management for JPMorgan Asset Management’s Exchange Traded Fund platform since 2013. Senior Global Product Manager of Alternative Investments for BNY Mellon from 2011 to 2013 and Global Product Head for Exchange Traded Funds at JPMorgan Chase Bank from 2008 to 2011. |
| |
Elizabeth A. Davin (1964),
Secretary (2018)** | | Executive Director and Assistant General Counsel, JPMorgan Chase. Ms. Davin has been with JPMorgan Chase (formerly Bank One Corporation) since 2004. |
| |
| Stephen M. Ungerman (1953), Chief Compliance Officer (2014) | | Managing Director, JPMorgan Chase & Co.; Mr. Ungerman has been with JPMorgan Chase & Co. since 2000. |
| |
| Jessica K. Ditullio (1962), Assistant Secretary (2014)** | | Executive Director and Assistant General Counsel, JPMorgan Chase. Ms. Ditullio has been with JPMorgan Chase (formerly Bank One Corporation) since 1990. |
| |
Carmine Lekstutis (1980),
Assistant Secretary (2014) | | Executive Director and Assistant General Counsel, JPMorgan Chase since February 2015; formerly Vice President and Assistant General Counsel, JPMorgan Chase from 2011 to February 2015. |
| |
Gregory S. Samuels (1980),
Assistant Secretary (2014) | | Executive Director and Assistant General Counsel, JPMorgan Chase since February 2014; formerly Vice President and Assistant General Counsel, JPMorgan Chase since 2010. |
| |
Pamela L. Woodley (1971),
Assistant Secretary (2014) | | Vice President and Assistant General Counsel, JPMorgan Chase since November 2004. |
| |
Zachary E. Vonnegut-Gabovitch (1986),
Assistant Secretary (2017) | | Vice President and Assistant General Counsel, JPMorgan Chase since September 2016; Associate, Morgan Lewis & Bockius (law firm) from 2012 to 2016. |
| |
| Frederick J. Cavaliere (1978), Assistant Treasurer (2015)* | | Executive Director, J.P. Morgan Investment Management Inc. since February 2016; formerly, Vice President, J.P. Morgan Investment Management Inc. (formerly JPMorgan Funds Management, Inc.) since September 2010 to February 2016. Mr. Cavaliere has been with JPMorgan since May 2006. |
| |
| Michael M. D’Ambrosio (1969), Assistant Treasurer (2014) | | Managing Director, J.P. Morgan Investment Management Inc. (formerly JPMorgan Funds Management, Inc.) since May 2014; formerly Executive Director, J.P. Morgan Investment Management Inc. (formerly JPMorgan Funds Management, Inc.) from 2012 to May 2014. |
| |
Jason Ronca (1978),
Assistant Treasurer (2014)*** | | Executive Director, Assistant Treasurer and ETF Platform Manager for J.P. Morgan Asset Management since February 2017; formerly Vice President, Assistant Treasurer and ETF Platform Manager for J.P. Morgan Asset Management from May 2014 to February 2017. ETF Product Manager for Corporate Investment Bank responsible for setting the strategy and control agenda for the ETF servicing business from 2010 to May 2014; Prior to 2010, a Vice President in Fund Accounting within J.P. Morgan Investor Services, supporting a series of U.S. registered mutual funds. |
The contact address for each of officers, unless otherwise noted, is 270 Park Avenue, New York, NY 10017.
| * | | The contact address for the officer is 4 New York Plaza, New York, NY 10004. |
| ** | | The contact address for the officer is 1111 Polaris Parkway, Columbus, OH 43240. |
| *** | | The contact address for the officer is 50 Rowes Wharf Floor 3, Boston, MA 02110. |
| | | | | | | | |
| | | |
| OCTOBER 31, 2018 | | J.P. MORGAN EXCHANGE-TRADED FUNDS | | | | | 149 | |
SCHEDULE OF SHAREHOLDER EXPENSES
(Unaudited)
Hypothetical $1,000 Investment
As a shareholder of the Fund, you incur ongoing costs, including investment advisory fees, administration fee and other Fund expenses. The examples below are intended to help you understand your ongoing costs (in dollars) of investing in the Fund and to compare these ongoing costs with the ongoing costs of investing in other funds. The examples assume that you had a $1,000 investment at the beginning of the reporting period, May 1, 2018 and continued to hold your shares at the end of the reporting period, October 31, 2018.
Actual Expenses
For the Fund in the table below, the first line provides information about actual account values and actual expenses. You may use the information in this line, together with the amount you invested, to estimate the expenses that you paid over the period. Simply divide your account value by $1,000 (for example, an $8,600 account value divided by $1,000 = 8.6), then multiply the result by the number under the heading entitled
“Expenses Paid During the Period” to estimate the expenses you paid on your account during this period.
Hypothetical Example for Comparison Purposes
The second line in the table below provides information about hypothetical account values and hypothetical expenses based on the Fund’s actual expense ratio and an assumed rate of return of 5% per year before expenses, which is not the Fund’s actual return. The hypothetical account values and expenses may not be used to estimate the actual ending account balance or expenses you paid for the period. You may use this information to compare the ongoing costs of investing in the Fund and other Funds. To do so, compare this 5% hypothetical example with the 5% hypothetical examples that appear in the shareholder reports of other funds. The examples also assume all dividends and distributions have been reinvested. The examples do not take into account brokerage commissions that you pay when purchasing or selling shares of the Fund.
| | | | | | | | | | | | | | | | |
| | | Beginning Account Value May 1, 2018 | | | Ending Account Value
October 31, 2018 | | | Annualized Expense Ratio | | | Expenses Paid During
the Period | |
Diversified Alternatives ETF | | | | | | | | | | | | | | | | |
Actual (1) | | $ | 1,000.00 | | | $ | 958.20 | | | | 0.70 | % | | $ | 3.46 | |
Hypothetical (1) | | | 1,000.00 | | | | 1,021.68 | | | | 0.70 | | | | 3.57 | |
| | | | |
Event Driven ETF | | | | | | | | | | | | | | | | |
Actual (1) | | $ | 1,000.00 | | | $ | 1,010.50 | | | | 0.73 | % | | $ | 3.70 | |
Hypothetical (1) | | | 1,000.00 | | | | 1,021.53 | | | | 0.73 | | | | 3.72 | |
| | | | |
Long/Short ETF | | | | | | | | | | | | | | | | |
Actual (1) | | $ | 1,000.00 | | | $ | 946.20 | | | | 0.62 | % | | $ | 3.04 | |
Hypothetical (1) | | | 1,000.00 | | | | 1,022.02 | | | | 0.62 | | | | 3.16 | |
| | | | |
Managed Futures Strategy ETF | | | | | | | | | | | | | | | | |
Actual (1) | | $ | 1,000.00 | | | $ | 961.70 | | | | 0.39 | % | | $ | 1.93 | |
Hypothetical (1) | | | 1,000.00 | | | | 1,023.24 | | | | 0.39 | | | | 1.99 | |
| (1) | Expenses are equal to the Fund’s annualized expense ratio, multiplied by the average account value over the period, multiplied by 184/365 (to reflect the actual period). |
| | | | | | |
| | | |
| 150 | | | | J.P. MORGAN EXCHANGE-TRADED FUNDS | | OCTOBER 31, 2018 |
TAX LETTER
(Unaudited)
Certain tax information for the J.P. Morgan Funds is required to be provided to shareholders based upon the Funds’ income and distributions for the taxable year ended October 31, 2018. The information and distributions reported in this letter may differ from the information and taxable distributions reported to the shareholders for the calendar year ending December 31, 2018. The information necessary to complete your income tax returns for the calendar year ending December 31, 2018 will be provided under separate cover.
Dividends Received Deduction (DRD)
The Fund listed below had the following percentage, or maximum allowable percentage, of ordinary income distributions eligible for the dividends received deductions for corporate shareholders for the fiscal year ended October 31, 2018:
| | | | |
| | | Dividends
Received
Deduction | |
Event Driven ETF | | | 100.00 | % |
Qualified Dividend Income (QDI)
The Fund listed below had the following amount, or maximum allowable amount, of ordinary income distributions treated as qualified dividends for the fiscal year ended October 31, 2018:
| | | | |
| | | Qualified Dividend Income | |
Event Driven ETF | | $ | 13,930 | |
| | | | | | | | |
| | | |
| OCTOBER 31, 2018 | | J.P. MORGAN EXCHANGE-TRADED FUNDS | | | | | 151 | |
J.P. Morgan Exchange-Traded Funds are distributed by JPMorgan Distribution Services, Inc., an indirect, wholly-owned subsidiary of JPMorgan Chase & Co.
Contact J.P. Morgan Exchange-Traded Funds at 1-844-457-6383 (844-4JPM ETF) for a fund prospectus. You can also visit us at www.jpmorganfunds.com. Investors should carefully consider the investment objectives and risks as well as charges and expenses of the fund before investing. The prospectus contains this and other information about the fund. Read the prospectus carefully before investing.
Investors may obtain information about the Securities Investor Protection Corporation (SIPC), including the SIPC brochure by visiting www.sipc.org or by calling SIPC at 202-371-8300.
The Fund files a complete schedule of its fund holdings for the first and third quarters of its fiscal year with the SEC on Form N-Q. The Fund’s Forms N-Q is available on the SEC’s website at http://www.sec.gov. Shareholders may request the Form N-Q without charge by calling 1-844-457-6383 or by visiting the J.P. Morgan Funds’ website at www.jpmorganfunds.com.
A description of each Fund’s policies and procedures with respect to the disclosure of each Fund’s holdings is available in the prospectus and Statement of Additional Information.
A copy of proxy policies and procedures is available without charge upon request by calling 1-844-457-6383 and on the Fund’s website at www.jpmorganfunds.com. A description of such policies and procedures is on the SEC’s website at www.sec.gov. The Trustees have delegated the authority to vote proxies for securities owned by the Fund to the Adviser. A copy of the Fund’s voting record for the most recent 12-month period ended June 30 is available on the SEC’s website at www.sec.gov or at the Fund’s website at www.jpmorganfunds.com no later than August 31 of each year. The Fund’s proxy voting record will include, among other things, a brief description of the matter voted on for each fund security, and will state how each vote was cast, for example, for or against the proposal.


J.P. Morgan Asset Management is the marketing name for the asset management businesses of JPMorgan Chase & Co. Those businesses include, but are not limited to, J.P. Morgan Investment Management Inc., Security Capital Research & Management Incorporated and J.P. Morgan Alternative Asset Management, Inc.
| | | | |
| | © JPMorgan Chase & Co., 2018. All rights reserved. October 2018. | | AN-DAETF-1018 |
ITEM 2. CODE OF ETHICS.
Disclose whether, as of the end of the period covered by the report, the registrant has adopted a code of ethics that applies to the registrant’s principal executive officer, principal financial officer, principal accounting officer or controller, or persons performing similar functions, regardless of whether these individuals are employed by the registrant or a third party. If the registrant has not adopted such a code of ethics, explain why it has not done so.
The registrant must briefly describe the nature of any amendment, during the period covered by the report, to a provision of its code of ethics that applies to the registrant’s principal executive officer, principal financial officer, principal accounting officer or controller, or persons performing similar functions, regardless of whether these individuals are employed by the registrant or a third party, and that relates to any element of the code of ethics definition enumerated in paragraph (b) of this Item. The registrant must file a copy of any such amendment as an exhibit pursuant to Item 13(a)(1), unless the registrant has elected to satisfy paragraph (f) of this Item by positing its code of ethics on its website pursuant to paragraph (f)(2) of this Item, or by undertaking to provide its code of ethics to any person without charge, upon request, pursuant to paragraph (f)(3) of this Item.
If the registrant has, during the period covered by the report, granted a waiver, including an implicit waiver, from a provision of the code of ethics that applies to the registrant’s principal executive officer, principal financial officer, principal accounting officer or controller, or persons performing similar functions, regardless of whether these individuals are employed by the registrant or third party, that relates to one or more items set forth in paragraph (b) of this Item, the registrant must briefly describe the nature of the waiver, the name of the person to whom the waiver was granted, and the date of the waiver.
The Registrant has adopted a code of ethics that applies to the Registrant’s principal executive officer and principal financial officer. There were no amendments to the code of ethics or waivers granted with respect to the code of ethics in the period covered by the report.
ITEM 3. AUDIT COMMITTEE FINANCIAL EXPERT.
(a) (1) Disclose that the registrant’s board of directors has determined that the registrant either:
(i) Has at least one audit committee financial expert serving on its audit committee; or
(ii) Does not have an audit committee financial expert serving on its audit committee.
The Registrant’s Board of Trustees has determined that the Registrant has at least one audit committee financial expert serving on its audit committee. The Securities and Exchange Commission has stated that the designation or identification of a person as an audit committee financial expert pursuant to this Item 3 of Form N-CSR does not impose on such person any duties, obligations or liabilities that are greater than the duties, obligations and liabilities imposed on such person as a member of the Audit Committee and the Board of Trustees in the absence of such designation or identification.
(2) If the registrant provides the disclosure required by paragraph (a)(1)(i) of this Item, it must disclose the name of the audit committee financial expert and whether that person is “independent.” In order to be considered “independent” for purposes of this Item, a member of an audit committee may not, other than in his or her capacity as a member of the audit committee, the board of directors, or any other board committee:
(i) Accept directly or indirectly any consulting, advisory, or other compensatory fee from the issuer; or
(ii) Be an “interested person” of the investment company as defined in Section 2(a)(19) of the Act (15 U.S.C. 80a-2(a)(19)).
The audit committee financial experts are Gary L. French, Robert J. Grassi, Thomas P. Lemke, Lawrence R. Maffia, and EmilyA. Youssouf, each of which is not an “interested person” of the Registrant and is also “independent” as defined by the U.S. Securities and Exchange Commission for purposes of audit committee financial expert determinations.
(3) If the registrant provides the disclosure required by paragraph (a)(1)(ii) of this Item, it must explain why it does not have an audit committee financial expert.
Not applicable.
ITEM 4. PRINCIPAL ACCOUNTANT FEES AND SERVICES.
(a) Disclose, under the caption Audit Fees, the aggregate fees billed for each of the last two fiscal years for professional services rendered by the principal accountant for the audit of the registrant’s annual financial statements or services that are normally provided by the accountant in connection with statutory and regulatory filings or engagements for those fiscal years.
AUDIT FEES
2018 – $732,999
2017 – $404,380
(b) Disclose, under the caption Audit-Related Fees, the aggregate fees billed in each of the last two fiscal years for assurance and related services by the principal accountant that are reasonably related to the performance of the audit of the registrant’s financial statements and are not reported under paragraph (a) of this Item. Registrants shall describe the nature of the services comprising the fees disclosed under this category.
AUDIT-RELATED FEES
2018 – $142,410
2017 – $76,752
Audit-related fees consist of security count procedures performed as required under Rule 17f-2 of the Investment Company Act of 1940 during the Registrant’s fiscal year.
(c) Disclose, under the caption Tax Fees, the aggregate fees billed in each of the last two fiscal years for professional services rendered by the principal accountant for tax compliance, tax advice, and tax planning. Registrants shall describe the nature of the services comprising the fees disclosed under this category.
TAX FEES
2018 – $267,970
2017 – $132,675
The tax fees consist of fees billed in connection with preparing the federal regulated investment company income tax returns for the Registrant for the tax years ended October 31, 2018 and 2017, respectively.
For the last fiscal year, no tax fees were required to be approved pursuant to paragraph (c)(7)(ii) of Rule 2-01 of Regulation S-X.
(d) Disclose, under the caption All Other Fees, the aggregate fees billed in each of the last two fiscal years for products and services provided by the principal accountant, other than the services reported in paragraphs (a) through (c) of this Item. Registrants shall describe the nature of the services comprising the fees disclosed under this category.
ALL OTHER FEES
2018 – $0
2017 – $0
(e)(1) Disclose the audit committee’s pre-approval policies and procedures described in paragraph (c)(7) of Rule 2-01 of Regulation S-X.
Pursuant to the Registrant’s Audit Committee Charter and written policies and procedures for the pre-approval of audit and non-audit services (the “Pre-approval Policy”), the Audit Committee pre-approves all audit and non-audit services performed by the Registrant’s independent public registered accounting firm for the Registrant. In addition, the Audit Committee pre-approves the auditor’s engagement for non-audit services with the Registrant’s investment adviser (not including a sub-adviser whose role is primarily portfolio management and is sub-contracted or overseen by another investment adviser) and any Service Affiliate in accordance with paragraph (c)(7)(ii) of Rule 2-01 of Regulation S-X, if the engagement relates directly to the operations and financial reporting of the Registrant. Proposed services may be
pre-approved either 1) without consideration of specific case-by-case services or 2) require the specific pre-approval of the Audit Committee. Therefore, initially the Pre-approval Policy listed a number of audit and non-audit services that have been approved by the Audit Committee, or which were not subject to pre-approval under the transition provisions of Sarbanes-Oxley Act of 2002 (the “Pre-approval List”). The Audit Committee annually reviews and pre-approves the services included on the Pre-approval List that may be provided by the independent public registered accounting firm without obtaining additional specific pre-approval of individual services from the Audit Committee. The Audit Committee adds to, or subtracts from, the list of general pre-approved services from time to time, based on subsequent determinations. All other audit and non-audit services not on the Pre-approval List must be specifically pre-approved by the Audit Committee.
One or more members of the Audit Committee may be appointed as the Committee’s delegate for the purposes of considering whether to approve such services. Any pre-approvals granted by the delegate will be reported, for informational purposes only, to the Audit Committee at its next scheduled meeting. The Audit Committee’s responsibilities to pre-approve services performed by the independent public registered accounting firm are not delegated to management.
(2) Disclose the percentage of services described in each of paragraphs (b) through (d) of this Item that were approved by the audit committee pursuant to paragraph (c)(7)(i)(C) of Rule 2-01 of Regulation S-X.
2018 – 0.0%
2017 – 0.0%
(f) If greater than 50 percent, disclose the percentage of hours expended on the principal accountant’s engagement to audit the registrant’s financial statements for the most recent fiscal year that were attributed to work performed by persons other than the principal accountant’s full-time, permanent employees.
Not applicable.
(g) Disclose the aggregate non-audit fees billed by the registrant’s accountant for services rendered to the registrant, and rendered to the registrant’s investment adviser (not including any sub-adviser whose role is primarily portfolio management and is subcontracted with or overseen by another investment adviser), and any entity controlling, controlled by, or under common control with the adviser that provides ongoing services to the registrant for each of the last two fiscal years of the registrant.
The aggregate non-audit fees billed by the independent registered public accounting firm for services rendered to the Registrant, and rendered to Service Affiliates, for the last two calendar year ends were:
2018 – $32.9 million
2017 – $28.9 million
(h) Disclose whether the registrant’s audit committee of the board of directors has considered whether the provision of non-audit services that were rendered to the registrant’s investment adviser (not including any subadviser whose role is primarily portfolio management and is subcontracted with or overseen by another investment adviser), and any entity controlling, controlled by, or under common control with the investment adviser that provides ongoing services to the registrant that were not pre-approved pursuant to paragraph (c)(7)(ii) of Rule 2-01 of Regulation S-X is compatible with maintaining the principal accountant’s independence.
The Registrant’s Audit Committee has considered whether the provision of the non-audit services that were rendered to Service Affiliates that were not pre-approved (not requiring pre-approval) is compatible with maintaining the independent public registered accounting firm’s independence. All services provided by the independent public registered accounting firm to the Registrant or to Service Affiliates that were required to be pre-approved were pre-approved as required.
ITEM 5. AUDIT COMMITTEE OF LISTED REGISTRANTS.
(a) If the registrant is a listed issuer as defined in Rule 10A-3 under the Exchange Act (17CFR 240.10A-3), state whether or not the registrant has a separately-designated standing audit committee established in accordance with Section 3(a)(58)(A) of the Exchange Act (15 U.S.C. 78c(a)(58)(A)). If the registrant has such a committee, however designated, identify each committee member. If the entire board of directors is acting as the registrant’s audit committee as specified in Section 3(a)(58)(B) of the Exchange Act (15 U.S.C. 78c(a)(58)(B)), so state.
The registrant has a separately designated Audit Committee established in accordance with Section 3(a)(58)(A) of the Exchange Act. The members of the Audit Committee are Gary L. French, Robert J. Grassi, Thomas P. Lemke, Lawrence R. Maffia, and Emily A. Youssouf.
(b) If applicable, provide the disclosure required by Rule 10A-3(d) under the Exchange Act (17CFR 240.10A-3(d)) regarding an exemption from the listing standards for all audit committees.
Not applicable.
ITEM 6. SCHEDULE OF INVESTMENTS.
File Schedule I – Investments in securities of unaffiliated issuers as of the close of the reporting period as set forth in Section 210.12-12 of Regulation S-X, unless the schedule is included as part of the report to shareholders filed under Item 1 of this Form.
Included in Item 1.
ITEM 7. DISCLOSURE OF PROXY VOTING POLICIES AND PROCEDURES FOR CLOSED-END MANAGEMENT INVESTMENT COMPANIES.
A closed-end management investment company that is filing an annual report on this Form N-CSR must, unless it invests exclusively in non-voting securities, describe the policies and procedures that it uses to determine how to vote proxies relating to portfolio securities, including the procedures that the company uses when a vote presents a conflict between the interests of its shareholders, on the one hand, and those of the company’s investment adviser; principal underwriter; or any affiliated person (as defined in Section 2(a)(3) of the Investment Company Act of 1940 (15 U.S.C. 80a-2(a)(3)) and the rules thereunder) of the company, its investment adviser, or its principal underwriter, on the other. Include any policies and procedures of the company’s investment adviser, or any other third party, that the company uses, or that are used on the company’s behalf, to determine how to vote proxies relating to portfolio securities.
Not applicable.
ITEM 8. PORTFOLIO MANAGERS OF CLOSED-END MANAGEMENT INVESTMENT COMPANIES.
Not applicable.
ITEM 9. PURCHASE OF EQUITY SECURITIES BY CLOSED-END MANAGEMENT INVESTMENT COMPANY AND AFFILIATED PURCHASERS.
(a) If the registrant is a closed-end management investment company, provide the information specified in paragraph (b) of this Item with respect to any purchase made by or on behalf of the registrant or any “affiliated purchaser,” as defined in Rule 10b-18(a)(3) under the Exchange Act (17 CFR 240.10b-18(a)(3)), of shares or other units of any class of the registrant’s equity securities that is registered by the registrant pursuant to Section 12 of the Exchange Act (15 U.S.C. 781).
Not applicable.
ITEM 10. SUBMISSION OF MATTERS TO A VOTE OF SECURITY HOLDERS.
Describe any material changes to the procedures by which shareholders may recommend nominees to the registrant’s board of directors, where those changes were implemented after the registrant last provided disclosure in response to the requirements of Item 7(d)(2)(ii)(G) of Schedule 14A (17 CFR 240.14a-101), or this Item.
No material changes to report.
ITEM 11. CONTROLS AND PROCEDURES.
(a) Disclose the conclusions of the registrant’s principal executive and principal financial officers, or persons performing similar functions, regarding the effectiveness of the registrant’s disclosure controls and procedures (as defined in Rule 30a-3(c) under the Act (17 CFR 270.30a-3(c))) as of a date within 90 days of the filing date of the report that includes the disclosure required by this paragraph, based on the evaluation of these controls and procedures required by Rule 30a-3(b) under the Act (17 CFR 270.30a-3(b)) and Rules 13a-15(b) or 15d-15(b) under the Exchange Act (17 CFR 240.13a-15(b) or 240.15d-15(b)).
The Registrant’s principal executive and principal financial officers have concluded, based on their evaluation of the Registrant’s disclosure controls and procedures as of a date within 90 days of the filing date of this report, that the Registrant’s disclosure controls and procedures are reasonably designed to ensure that information required to be disclosed by the Registrant on Form N-CSR is recorded, processed, summarized and reported within the required time periods and that information required to be disclosed by the Registrant in the reports that it files or submits on Form N-CSR is accumulated and communicated to the Registrant’s management, including its principal executive and principal financial officers, as appropriate to allow timely decisions regarding required disclosure.
(b) Disclose any change in the registrant’s internal control over financial reporting (as defined in Rule 30a-3(d) under the Act (17 CFR 270.30a-3(d)) that occurred during the registrant’s second fiscal quarter of the period covered by this report that has materially affected, or is reasonably likely to materially affect, the registrant’s internal control over financial reporting.
There were no changes in the Registrant’s internal control over financial reporting that occurred during the last fiscal quarter covered by this report that have materially affected, or are reasonably likely to materially affect, the Registrant’s internal control over financial reporting.
ITEM 12. DISCLOSURE OF SECURITIES LENDING ACTIVITIES FOR CLOSED-END MANAGEMENT INVESTMENT COMPANIES.
Not applicable.
ITEM 13. EXHIBITS.
(a) File the exhibits listed below as part of this Form. Letter or number the exhibits in the sequence indicated.
(a)(1) Any code of ethics, or amendment thereto, that is the subject of the disclosure required by Item 2, to the extent that the registrant intends to satisfy the Item 2 requirements through filing of an exhibit.
Code of Ethics applicable to its Principal Executive and Principal Financial Officers pursuant to Section 406 of the Sarbanes-Oxley Act of 2002 attached hereto.
(a)(2) A separate certification for each principal executive officer and principal financial officer of the registrant as required by Rule 30a-2(a) under the Act (17 CFR 270.30a-2).
Certifications pursuant to Rule 30a-2(a) under the Investment Company Act of 1940 are attached hereto.
(a)(3) Any written solicitation to purchase securities under Rule 23c-1 under the Act (17 CFR 270.23c-1) sent or given during the period covered by the report by or on behalf of the registrant to 10 or more persons.
Not applicable.
(b) A separate or combined certification for each principal executive officer and principal officer of the registrant as required by Rule 30a-2(b) under the Act of 1940.
Certifications pursuant to Rule 30a-2(b) under the Investment Company Act of 1940 are attached hereto.
SIGNATURES
Pursuant to the requirements of the Securities Exchange Act of 1934 and the Investment Company Act of 1940, the registrant has duly caused this report to be signed on its behalf by the undersigned, thereunto duly authorized.
J.P. Morgan Exchange-Traded Fund Trust
| | |
| By: | | /s/ Joanna M. Gallegos |
| | Joanna M. Gallegos |
| | President and Principal Executive Officer |
| | December 28, 2018 |
Pursuant to the requirements of the Securities Exchange Act of 1934 and the Investment Company Act of 1940, this report has been signed below by the following persons on behalf of the registrant and in the capacities and on the dates indicated.
| | |
| By: | | /s/ Joanna M. Gallegos |
| | Joanna M. Gallegos |
| | President and Principal Executive Officer |
| | December 28, 2018 |
| | |
| By: | | /s/ Lauren A. Paino |
| | Lauren A. Paino |
| | Treasurer and Principal Financial Officer |
| | December 28, 2018 |
