UNITED STATES
SECURITIES AND EXCHANGE COMMISSION
Washington, D.C. 20549
FORM N-CSR
CERTIFIED SHAREHOLDER REPORT OF REGISTERED
MANAGEMENT INVESTMENT COMPANIES
Investment Company Act file number:811-22903
J.P. Morgan Exchange-Traded Fund Trust
(Exact name of registrant as specified in charter)
277 Park Avenue
New York, NY 10172
(Address of principal executive offices) (Zip code)
Gregory S. Samuels
J.P. Morgan Investment Management Inc.
277 Park Avenue
New York, NY 10172
(Name and Address of Agent for Service)
With copies to:
| | | | | | |
| | Elizabeth A. Davin, Esq. | | Jon S. Rand, Esq. | | |
| | JPMorgan Chase & Co. | | Dechert LLP | | |
| | 1111 Polaris Parkway | | 1095 Avenue of the Americas | | |
| | Columbus, OH 43240 | | New York, NY 10036 | | |
Registrant’s telephone number, including area code: (800)480-4111
Date of fiscal year end: Last day of February
Date of reporting period: March 1, 2018 through February 28, 2019
Form N-CSR is to be used by management investment companies to file reports with the Commission not later than 10 days after the transmission to stockholders of any report that is required to be transmitted to stockholders under Rule 30e-1 under the Investment Company Act of 1940 (17 CFR 270.30e-1). The Commission may use the information provided on Form N-CSR in its regulatory, disclosure review, inspection, and policymaking roles.
A registrant is required to disclose the information specified by Form N-CSR, and the Commission will make this information public. A registrant is not required to respond to the collection of information contained in Form N-CSR unless the Form displays a currently valid Office of Management and Budget (“OMB”) control number. Please direct comments concerning the accuracy of the information collection burden estimate and any suggestions for reducing the burden to Secretary, Securities and Exchange Commission, 450 Fifth Street, NW, Washington, DC 20549-0609. The OMB has reviewed this collection of information under the clearance requirements of 44 U.S.C. Section 3507.
ITEM 1. REPORTS TO STOCKHOLDERS.
The following is a copy of the report transmitted to shareholders pursuant to Rule30e-1 under the Investment Company Act of 1940 (17 CFR270.30e-1).
Annual Report
J.P. Morgan Exchange-Traded Funds
February 28, 2019
JPMorgan Core Plus Bond ETF
JPMorgan Corporate Bond Research Enhanced ETF
JPMorgan Disciplined High Yield ETF
JPMorgan Global Bond Opportunities ETF
JPMorgan Municipal ETF
JPMorgan U.S. Aggregate Bond ETF
JPMorgan Ultra-Short Income ETF
JPMorgan Ultra-Short Municipal Income ETF
JPMorgan USD Emerging Markets Sovereign Bond ETF
Beginning on January 1, 2021, as permitted by regulations adopted by the Securities and Exchange Commission, paper copies of the Funds’ annual and semi-annual shareholder reports will no longer be sent by mail, unless you specifically request paper copies of the reports. Instead, the reports will be made available on the Funds’ website www.jpmorganfunds.com and you will be notified by mail each time a report is posted and provided with a website to access the report. If you already elected to receive shareholder reports electronically, you will not be affected by this change and you need not take any action.
You may elect to receive shareholder reports and other communications from the Funds’ electronically anytime by contacting your financial intermediary (such as a broker dealer, bank, or retirement plan).
Alternatively, you may elect to receive paper copies of all future reports free of charge by contacting your financial intermediary. Your election to receive paper reports will apply to all funds held within your account(s).
CONTENTS
Investments in a Fund are not bank deposits or obligations of, or guaranteed or endorsed by, any bank and are not insured or guaranteed by the FDIC, the Federal Reserve Board or any other government agency. You could lose money if you sell when a Fund’s share price is lower than when you invested.
Past performance is no guarantee of future performance. The general market views expressed in this report are opinions based on market and other conditions through the end of the reporting period and are subject to change without notice. These views are not intended to predict the future performance of a Fund or the securities markets. References to specific securities and their issuers are for illustrative purposes only and are not intended to be, and should not be interpreted as, recommendations to purchase or sell such securities. Such views are not meant as investment advice and may not be relied on as an indication of trading intent on behalf of the Fund.
Prospective investors should refer to the Funds’ prospectuses for a discussion of the Funds’ investment objectives, strategies and risks. Call J.P. Morgan Exchange-Traded Funds at (844)457-6383 for a prospectus containing more complete information about a Fund, including management fees and other expenses. Please read it carefully before investing.
Shares are bought and sold throughout the day on an exchange at market price (not at net asset value) through a brokerage account, and are not individually subscribed and redeemed from a Fund. Shares may only be subscribed and redeemed directly from a Fund by Authorized Participants, in very large creation/redemption units. Brokerage commissions will reduce returns.
PRESIDENT’S LETTER
APRIL 5, 2019 (Unaudited)
Dear Shareholder,
JPMorgan Exchange-Traded Funds have seen tremendous growth over the past twelve months. In 2018, we were named “The industry’s fastest-growing ETF manager,”1 having accumulated assets under management of $21.3 billion as of April 2, 2019, up from $2.9 billion at the end of 2017. This success was recently recognized at the sixth annual ETF.com awards,2 where J.P. Morgan Asset Management won four accolades, including “ETF Issuer of the Year” and “ETF of the Year” for our JPMorgan BetaBuilders® Japan ETF (BBJP). Building on the success of our BetaBuilders® suite and in line with our mission to provide accessible portfolio solutions, we launched two additional BetaBuilders® ETFs in March, BetaBuilders®1-5 Year U.S. Aggregate Bond ETF (BBSA) and BetaBuilders® U.S. Equity ETF (BBUS), bringing our roster to 32 strategies.
| | |
 | | ” J.P. Morgan’s suite of research-driven fixed income ETFs can help investors navigate risk and improve returns while building stronger fixed income portfolios.” |
The performance of U.S. bond markets continued to lag behind gains in U.S. equity during the reporting period. While equity prices were generally supported by record corporate profits, low interest rates and the continued expansion of the U.S. economy, investor expectations for accelerating inflation and future interest rates increases weighed down prices for corporate debt and U.S. Treasury bonds for most of the reporting period.
Notably, investors sold off equity and bonds in the fourth quarter of 2018 amid concerns about U.S.-China trade tensions, slowing economic growth in China and Europe and a political impasse in Washington, D.C. that led to the partial shutdown of the federal government.
However, prices for both equity and bonds rebounded in the first two months of 2019. A budget agreementre-opened federal government operations in January and the U.S. Federal Reserve (the “Fed”) said it would take a “patient” approach toward future interest rate increases. At the same time, inflation remained below the Fed’s target level despite a tightening job market and emerging signs of wage growth in the U.S.
J.P. Morgan’s suite of research-driven fixed income ETFs can help investors navigate risk and improve returns while building stronger fixed income portfolios. Leveraging the intellectual capital and deep investment resources of one of the world’s largest fixed income and liquidity managers, we have built an ETF fixed income solution suite that covers core, core complements and extended sectors. Most notably, the JPMorgan Ultra Short Income ETF (JPST) has accumulated more than $6 billion in assets under management since launching two years ago, and offers investors a compelling solution for those looking to manage interest rate risk while preserving yield. The recent launch of the JPMorgan Ultra Short Municipal Income ETF (JMST) also offers investors a complementary value proposition to JPST for non-taxable investments.
We are proud to bring a range of investment solutions to help you navigate a changing financial market landscape. We are committed to building solutions that address your needs and help you build stronger portfolios. Thank you for your belief in our Firm and our process.
Sincerely,

Ogden H. Hammond
Interim President, J.P. Morgan Exchange-Traded Funds
J.P Morgan Asset Management
1-844-4JPM-ETF or jpmorgan.com/etfs for more information
| 1 | “Ten Fastest (and Slowest) Growing ETF Providers” Ignites.com, Nov. 28, 2018. |
| 2 | ETF.com Award winners are selected by a majority vote of the ETF.com Awards Selection Committee, a group of independent ETF experts. Voting was completed by Jan. 14, 2019, and results were announced March 28, 2019. |
| | | | | | | | |
| | | |
| FEBRUARY 28, 2019 | | J.P. MORGAN EXCHANGE-TRADED FUNDS | | | | | 1 | |
J.P. Morgan Exchange-Traded Funds
MARKET OVERVIEW
TWELVE MONTHS ENDED FEBRUARY 28, 2019 (Unaudited)
The performance of U.S. bond markets continued to lag behind gains in U.S. equity for most of the reporting period. Equity prices were generally supported by record corporate profits, low interest rates and the continued expansion of the U.S. economy. Conversely, investor expectations for accelerating inflation and future increases in interest rates weighed down prices for corporate debt and U.S. Treasury bonds for most of the reporting period.
Notably, investors sold off both equity and bonds in the fourth quarter of 2018 amid concerns about U.S.-China trade tensions, slowing economic growth in China and Europe and a political impasse in Washington, D.C. that led to the partial shutdown of the federal government.
However, prices for both equity and bonds rebounded somewhat in the first two months of 2019. A budget agreementre-opened federal government operations in January, and the U.S. Federal Reserve (the “Fed”) said it would take a “patient” approach toward future interest rate increases. At the same time, inflation remained below the Fed’s target level despite a tightening job market and emerging signs of wage growth in the U.S.
Overall, high yield bonds (also known as “junk bonds”) outperformed both investment grade corporate debt and U.S. Treasury bonds during the reporting period.
| | | | | | |
| | | |
| 2 | | | | J.P. MORGAN EXCHANGE-TRADED FUNDS | | FEBRUARY 28, 2019 |
JPMorgan Core Plus Bond ETF
FUND COMMENTARY
PERIOD JANUARY 28, 2019 (FUND INCEPTION DATE) THROUGH FEBRUARY 28, 2019 (Unaudited)
| | | | |
| REPORTING PERIOD RETURN: | | | |
JPMorgan Core Plus Bond ETF | | | | |
| Net Asset Value* | | | 0.97% | |
| Market Price** | | | 1.21% | |
| Bloomberg Barclays U.S. Aggregate Bond Index | | | 0.65% | |
| Net Assets as of 2/28/2019 | | $ | 25,178,102 | |
| |
| Duration as of 2/28/2019 | | | 5.74 Years | |
INVESTMENT OBJECTIVE***
The JPMorgan Core Plus Bond ETF (the “Fund”) seeks to provide a high level of current income by investing primarily in a diversified portfolio of high, medium and low-grade debt securities.
INVESTMENT APPROACH
The Fund invests primarily in investment grade bonds, with the flexibility to invest up to 35% in high yield debt (also known as “junk bonds”). Up to 35% of the Fund’s assets may be invested in foreign securities. The portfolio managers allocate the Fund’s assets among a range of sectors based on strategic positioning and other tactical considerations. In buying and selling investments for the Fund, the adviser looks for market sectors and securities that it believes will perform well over time. The adviser selects individual securities after performing a risk/reward analysis that includes an evaluation of interest rate risk, credit risk, currency risk, legal provisions and the structure of the transactions
HOW DID THE FUND PERFORM?
For the period from inception on January 28, 2019 to February 28, 2019, the Fund outperformed the Bloomberg Barclays U.S. Aggregate Bond Index (the “Index”).
The Fund’s out-of-Index allocation to high yield corporate bonds was a leading contributor to relative performance. The Fund’s overweight positions and security selection in short-dated securitized credit sectors, including asset-backed securities and commercial mortgage-backed securities also contributed to relative performance.
Relative to the Index, the Fund’s security selection within the U.S. Treasury bond sector detracted from performance. Agency mortgage-backed securities had negative performance for the reporting period and the Fund’s modest overweight position in the sector also detracted from relative performance.
HOW WAS THE FUND POSITIONED?
The Fund’s portfolio managers focused on security selection and relative value, which seeks to take advantage of pricing discrepancies between individual securities or market sectors. The managers employed macro-economic analysis to
determine asset allocations and positioning on the yield curve. The yield curve shows the relationship between yields and maturity dates for a set of similar bonds at a given point in time. The Fund’s portfolio managers used bottom-up research and top-down macro perspective to construct a diversified portfolio of fixed income securities. As a result of this process, the Fund’s largest sector allocations at the end of the reporting period were in mortgage-backed securities and U.S. Treasuries and its smallest allocations were in emerging markets debt and commercial mortgage-backed securities.
| | | | |
PORTFOLIO COMPOSITION**** | |
Corporate Bonds | | | 24.6 | % |
Mortgage-Backed Securities | | | 17.4 | |
U.S. Treasury Obligations | | | 14.2 | |
Asset-Backed Securities | | | 13.8 | |
Collateralized Mortgage Obligations | | | 6.9 | |
Commercial Mortgage-Backed Securities | | | 2.3 | |
Convertible Bond | | | 0.0 | (a) |
Short-Term Investments | | | 20.8 | |
| (a) | | Amount rounds to less than 0.1%. |
| * | | The return shown is based on net asset value calculated for shareholder transactions and may differ from the return shown in the financial highlights, which reflects adjustments made to the net asset value in accordance with accounting principles generally accepted in the United States of America. The net asset value was $50.36 as of February 28, 2019. |
| ** | | Market price return is calculated assuming an initial investment made at the inception date net asset value, reinvestment of all dividends and distributions at market price during the period, and sale at the market price on the last day of the period. The price used to calculate the market price return is the midpoint of the bid/ask spread at the close of business on the Cboe BZX Exchange, Inc. The midpoint price was $50.48 as of February 28, 2019. |
| *** | | The adviser seeks to achieve the Fund’s objective. There can be no guarantee it will be achieved. |
| **** | | Percentages indicated are based on total investments as of February 28, 2019. The Fund’s composition is subject to change. |
| | | | | | | | |
| | | |
| FEBRUARY 28, 2019 | | J.P. MORGAN EXCHANGE-TRADED FUNDS | | | | | 3 | |
JPMorgan Core Plus Bond ETF
FUND COMMENTARY
PERIOD JANUARY 28, 2019 (FUND INCEPTION DATE) THROUGH FEBRUARY 28, 2019 (Unaudited) (continued)
| | | | | | | | |
TOTAL RETURNSAS OF FEBRUARY 28, 2019 (Unaudited) | |
| | | INCEPTION DATE | | | CUMULATIVE
SINCE
INCEPTION | |
JPMorgan Core Plus Bond ETF | | | | | | | | |
Net Asset Value | | | January 28, 2019 | | | | 0.97% | |
Market Price | | | | | | | 1.21% | |
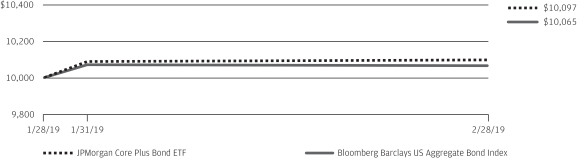
LIFE OF FUND PERFORMANCE(1/28/19 TO 2/28/19)
The performance quoted is past performance and is not a guarantee of future results. Exchange-traded funds are subject to certain market risks. Investment returns and principal value of an investment will fluctuate so that an investor’s shares, when sold or redeemed, may be worth more or less than their original cost. Current performance may be higher or lower than the performance data shown. For up-to-date, month-end performance information please call 1-844-457-6383.
Fund commenced operations on January 28, 2019.
The graph illustrates comparative performance for $10,000 invested in shares of the JPMorgan Core Plus Bond ETF and the Bloomberg Barclays US Aggregate Index from January 28, 2019 to February 28, 2019. The performance of the Fund reflects the deduction of Fund expenses and assumes reinvestment of all dividends and capital gain distributions, if any. The performance of the Bloomberg Barclays US Aggregate Index does not reflect the deduction of expenses associated with an exchange-traded fund and has been adjusted to reflect reinvestment of all dividends and capital gain distributions of the
securities included in the Index, if applicable. The Bloomberg Barclays US Aggregate Bond Index is an unmanaged index that represents securities that are SEC-registered, taxable, and dollar denominated. The index covers the U.S. investment grade fixed rate bond market, with index components for government and corporate securities, mortgage pass-through securities, and asset-backed securities. Investors cannot invest directly in an index.
Fund performance reflects the waiver of the Fund’s fees and reimbursement of expenses for certain periods since the inception date. Without these waivers and reimbursements, performance would have been lower. Also, performance shown in this section does not reflect the deduction of taxes that a shareholder may pay on Fund distributions or redemption or sale of Fund shares.
The returns shown are based on net asset values calculated for shareholder transactions and may differ from the returns shown in the financial highlights, which reflect adjustments made to the net asset values in accordance with accounting principles generally accepted in the United States of America.
| | | | | | |
| | | |
| 4 | | | | J.P. MORGAN EXCHANGE-TRADED FUNDS | | FEBRUARY 28, 2019 |
JPMorgan Corporate Bond Research Enhanced ETF
FUND COMMENTARY
PERIOD DECEMBER 12, 2018 (FUND INCEPTION DATE) THROUGH FEBRUARY 28, 2019 (Unaudited)
| | | | |
| REPORTING PERIOD RETURN: | |
| JPMorgan Corporate Bond Research Enhanced ETF | | | | |
| Net Asset Value* | | | 3.26% | |
| Market Price** | | | 3.48% | |
| Bloomberg Barclays U.S. Corporate Bond Index | | | 3.21% | |
| |
| Net Assets as of 2/28/2019 | | $ | 25,595,493 | |
| Duration as of 2/28/2019 | | | 7.29 Years | |
INVESTMENT OBJECTIVE***
The JPMorgan Corporate Bond Research Enhanced ETF (the “Fund”) seeks to provide total return from a portfolio of investment grade corporate bonds.
INVESTMENT APPROACH
The Fund invests primarily in investment grade bonds and uses fundamental credit research for enhanced security selection and sector allocation. The Fund seeks to outperform the Bloomberg Barclays U.S. Corporate Bond Index while maintaining similar risk characteristics.
HOW DID THE FUND PERFORM?
For the period from inception on December 12, 2018 to February 28, 2019, the Fund outperformed the Bloomberg Barclays U.S. Corporate Bond Index (the “Index”).
Relative to the Index, the Fund’s security selection within the capital goods and health care sectors was a leading contributor to performance during the reporting period. Within the capital goods sector, General Electric Co. was the largest contributor to performance as the company’s bonds benefitted from news of the sale of its biopharmaceutical business and general investor optimism about the company’s turnaround plans. In the health care sector, the Fund benefitted from security selection in company bonds rated BBB, which outperformed higher rated bonds.
The Fund’s underweight position in the pharmaceutical sector detracted from relative performance as bonds of select companies within the sector benefitted from a broader rise in the corporate bond market in the first two months of 2019. The Fund’s underweight position in the communications sector — specifically media — also detracted from relative performance.
HOW WAS THE FUND POSITIONED?
During the reporting period, the Fund’s portfolio managers sought to invest in companies that they believed were attractive from a fundamental and relative value analysis, while seeking to underweight companies that were unattractive based on their analysis. From a sector perspective, the Fund remained largely in line with the sector weightings in the Index.
| | | | |
PORTFOLIO COMPOSITION**** | |
Corporate Bonds | | | 96.7 | % |
U.S. Treasury Obligations | | | 2.1 | |
Short-Term Investments | | | 1.2 | |
| * | | The return shown is based on net asset value calculated for shareholder transactions and may differ from the return shown in the financial highlights, which reflects adjustments made to the net asset value in accordance with accounting principles generally accepted in the United States of America. The net asset value was $51.19 as of February 28, 2019. |
| ** | | Market price return is calculated assuming an initial investment made at the inception date net asset value, reinvestment of all dividends and distributions at market price during the period, and sale at the market price on the last day of the period. The price used to calculate the market price return is the midpoint of the bid/ask spread at the close of business on the NYSE Arca, Inc. The midpoint price was $51.30 as of February 28, 2019. |
| *** | | The adviser seeks to achieve the Fund’s objective. There can be no guarantee it will be achieved. |
| **** | | Percentages indicated are based on total investments as of February 28, 2019. The Fund’s composition is subject to change. |
| | | | | | | | |
| | | |
| FEBRUARY 28, 2019 | | J.P. MORGAN EXCHANGE-TRADED FUNDS | | | | | 5 | |
JPMorgan Corporate Bond Research Enhanced ETF
FUND COMMENTARY
PERIOD DECEMBER 12, 2018 (FUND INCEPTION DATE) THROUGH FEBRUARY 28, 2019 (Unaudited) (continued)
| | | | | | | | |
TOTAL RETURNSAS OF FEBRUARY 28, 2019 (Unaudited) | |
| | | INCEPTION DATE | | | CUMULATIVE
SINCE
INCEPTION | |
JPMorgan Corporate Bond Research Enhanced ETF | | | | | | | | |
Net Asset Value | | | December 12, 2018 | | | | 3.26% | |
Market Price | | | | | | | 3.48% | |
LIFE OF FUND PERFORMANCE(12/12/18 TO 2/28/19)

The performance quoted is past performance and is not a guarantee of future results. Exchange-traded funds are subject to certain market risks. Investment returns and principal value of an investment will fluctuate so that an investor’s shares, when sold or redeemed, may be worth more or less than their original cost. Current performance may be higher or lower than the performance data shown. For up-to-date, month-end performance information please call 1-844-457-6383.
Fund commenced operations on December 12, 2018.
The graph illustrates comparative performance for $10,000 invested in shares of the JPMorgan Corporate Bond Research Enhanced ETF and the Bloomberg Barclays US Corporate Bond Index from December 12, 2018 to February 28, 2019. The performance of the Fund reflects the deduction of Fund expenses and assumes reinvestment of all dividends and capital gain distributions, if any. The performance of the Bloomberg Barclays US Corporate Bond Index does not reflect the deduction of expenses associated with an exchange-traded fund and has been adjusted to reflect reinvestment of all dividends and capital gain
distributions of the securities included in the Index, if applicable. The Bloomberg Barclays US Corporate Bond Index broadly measures the investment grade, fixed-rate, taxable, corporate bond market. It includes USD denominated securities publicly issued by U.S. and non-U.S. industrial, utility, and financial issuers that meet specified maturity, liquidity, and quality requirements. Securities in the index roll up to the U.S. Credit and U.S. Aggregate Indices.
Fund performance reflects the waiver of the Fund’s fees and reimbursement of expenses for certain periods since the inception date. Without these waivers and reimbursements, performance would have been lower. Also, performance shown in this section does not reflect the deduction of taxes that a shareholder may pay on Fund distributions or redemption or sale of Fund shares.
The returns shown are based on net asset values calculated for shareholder transactions and may differ from the returns shown in the financial highlights, which reflect adjustments made to the net asset values in accordance with accounting principles generally accepted in the United States of America.
| | | | | | |
| | | |
| 6 | | | | J.P. MORGAN EXCHANGE-TRADED FUNDS | | FEBRUARY 28, 2019 |
JPMorgan Disciplined High Yield ETF
FUND COMMENTARY
TWELVE MONTHS ENDED FEBRUARY 28, 2019 (Unaudited)
| | | | |
| REPORTING PERIOD RETURN: | | | |
JPMorgan Disciplined High Yield ETF | | | | |
| Net Asset Value* | | | 4.66% | |
| Market Price** | | | 4.00% | |
| ICE BofAML U.S. High Yield Index | | | 4.26% | |
| Bloomberg Barclays U.S. Aggregate Bond Index | | | 3.17% | |
| |
| Net Assets as of 2/28/2019 | | $ | 154,570,385 | |
| Duration as of 2/28/2019 | | | 3.93 Years | |
INVESTMENT OBJECTIVE***
The JPMorgan Disciplined High Yield ETF (the “Fund”) seeks to provide a high level of income. Capital appreciation is a secondary objective.
INVESTMENT APPROACH
The Fund invests in a diversified portfolio of high-yield securities (also called “junk bonds”). Issuers may be domestic or foreign, but the Fund only invests in U.S. dollar-denominated investments.
HOW DID THE FUND PERFORM?
For the twelve months ended February 28, 2019, the Fund posted positive absolute performance and outperformed both the ICE BofAML U.S. High Yield Index (the “Benchmark”) and the Bloomberg Barclays U.S. Aggregate Bond Index.
During the reporting period, bonds rated CCC and lower significantly underperformed bonds rated BB and single-B as prices for lower rated bonds generally fell in the fourth quarter of 2018. Relative to the Benchmark, the Fund’s overweight position in bonds rated BB and its lack of holdings in bonds rated CCC helped performance during the reporting period. Bonds issued by publicly traded companies outperformed bonds issued by privately held companies during the reporting period. The Fund did not invest in bonds issued by privately held companies, which helped performance relative to the Benchmark.
To maintain sufficient liquidity, the Fund did not invest in bond issues of less than $500 million or in bond issuers with less than $1 billion in total bonds outstanding, which also contributed to relative performance.
HOW WAS THE FUND POSITIONED?
The Fund’s managers believe that bonds rated CCC generally have materially higher volatility and default risk than bonds rated BB and single-B, while providing inadequate incremental return over a market cycle to justify the higher volatility. In addition, the managers believe bonds issued by private
companies have had a materially higher probability of default than similarly-rated bonds issued by public companies. As such, the Fund did not invest in bonds rated CCC or bonds issued by private companies. Relative to the Benchmark, the Fund was overweight in bonds rated BB and underweight in bonds rated B and CCC.
| | | | |
PORTFOLIO COMPOSITION**** | |
| Communication Services | | | 21.7 | % |
| Energy | | | 14.1 | |
| Consumer Discretionary | | | 12.3 | |
| Health Care | | | 9.1 | |
| Industrials | | | 8.5 | |
| Materials | | | 7.9 | |
| Information Technology | | | 6.8 | |
| Financials | | | 6.6 | |
| Real Estate | | | 3.4 | |
| Investment of cash collateral from securities loaned | | | 2.7 | |
| Utilities | | | 2.6 | |
| Consumer Staples | | | 2.6 | |
| Short-Term Investments | | | 1.7 | |
| * | | The return shown is based on net asset value calculated for shareholder transactions and may differ from the return shown in the financial highlights, which reflects adjustments made to the net asset value in accordance with accounting principles generally accepted in the United States of America. The net asset value was $49.86 as of February 28, 2019. |
| ** | | Market price return is calculated assuming an initial investment made at the market price at the beginning of the period, reinvestment of all dividends and distributions at market price during the period, and sale at the market price on the last day of the period. The price used to calculate the market price return is the midpoint of the bid/ask spread at the close of business on the Cboe BZX Exchange, Inc. The midpoint price was $49.82 as of February 28, 2019. |
| *** | | The adviser seeks to achieve the Fund’s objective. There can be no guarantee it will be achieved. |
| **** | | Percentages indicated are based on total investments as of February 28, 2019. The Fund’s composition is subject to change. |
| | | | | | | | |
| | | |
| FEBRUARY 28, 2019 | | J.P. MORGAN EXCHANGE-TRADED FUNDS | | | | | 7 | |
JPMorgan Disciplined High Yield ETF
FUND COMMENTARY
TWELVE MONTHS ENDED FEBRUARY 28, 2019 (Unaudited) (continued)
| | | | | | | | | | | | |
AVERAGE ANNUAL TOTAL RETURNSAS OF FEBRUARY 28, 2019 (Unaudited) | |
| | | INCEPTION DATE | | | 1 YEAR | | | SINCE
INCEPTION | |
JPMorgan Disciplined High Yield ETF | | | | | | | | | | | | |
Net Asset Value | | | September 14, 2016 | | | | 4.66 | % | | | 4.86 | % |
Market Price | | | | | | | 4.00 | % | | | 4.81 | % |
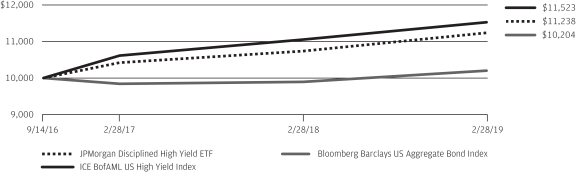
LIFE OF FUND PERFORMANCE(9/14/16 TO 2/28/19)
The performance quoted is past performance and is not a guarantee of future results. Exchange-traded funds are subject to certain market risks. Investment returns and principal value of an investment will fluctuate so that an investor’s shares, when sold or redeemed, may be worth more or less than their original cost. Current performance may be higher or lower than the performance data shown. Forup-to-date,month-end performance information please call1-844-457-6383.
Fund commenced operations on September 14, 2016.
The graph illustrates comparative performance for $10,000 invested in shares of the JPMorgan Disciplined High Yield ETF, the ICE BofAML US High Yield Index and the Bloomberg Barclays US Aggregate Bond Index from September 14, 2016 to February 28, 2019. The performance of the Fund reflects the deduction of Fund expenses and assumes reinvestment of all dividends and capital gain distributions, if any. The performance of the ICE BofAML US High Yield Index and the Bloomberg Barclays US Aggregate Index does not reflect the deduction of expenses associated with an exchange-traded fund and has been adjusted to reflect reinvestment of all dividends and capital gain distributions of the securities included in the Index, if applicable. The ICE BofAML US High Yield Index is
an unmanaged index, which measures the performance of U.S. dollar denominated below investment grade corporate debt publicly issued in the U.S. domestic market. The Bloomberg Barclays US Aggregate Bond Index is an unmanaged index that represents securities that areSEC-registered, taxable, and dollar denominated. The index covers the U.S. investment grade fixed rate bond market, with index components for government and corporate securities, mortgage pass-through securities, and asset-backed securities. Investors cannot invest directly in an index.
Fund performance reflects the partial waiver of the Fund’s fees and reimbursement of expenses for certain periods since the inception date. Without these waivers and reimbursements, performance would have been lower. Also, performance shown in this section does not reflect the deduction of taxes that a shareholder may pay on Fund distributions or redemption or sale of Fund shares.
The returns shown are based on net asset values calculated for shareholder transactions and may differ from the returns shown in the financial highlights, which reflect adjustments made to the net asset values in accordance with accounting principles generally accepted in the United States of America.
| | | | | | |
| | | |
| 8 | | | | J.P. MORGAN EXCHANGE-TRADED FUNDS | | FEBRUARY 28, 2019 |
JPMorgan Global Bond Opportunities ETF
FUND COMMENTARY
TWELVE MONTHS ENDED FEBRUARY 28, 2019 (Unaudited)
| | | | |
REPORTING PERIOD RETURN: | | | |
JPMorgan Global Bond Opportunities ETF | | | | |
Net Asset Value* | | | 2.06% | |
Market Price**. | | | 2.13% | |
Bloomberg Barclays Multiverse Index | | | (0.48)% | |
| |
Net Assets as of 2/28/2019 | | $ | 180,357,231 | |
Duration as of 2/28/2019 | | | 4.04 Years | |
INVESTMENT OBJECTIVE***
The JPMorgan Global Bond Opportunities ETF (the “Fund”) seeks to provide total return.
INVESTMENT APPROACH
The Fund invests across sectors in developed and emerging markets without benchmark constraints. The Fund is flexible and opportunistic and the Fund’s adviser has broad discretion to shift the Fund’s exposures to strategies, sectors, countries or currencies based on changing market conditions and its view of the best mix of investment opportunities.
HOW DID THE FUND PERFORM?
For the twelve months ended February 28, 2019, the Fund posted a return of 2.06%. The Fund is managed with an unconstrained orientation and is not managed relative to a benchmark index. While the Fund is not managed to a benchmark, its return is compared to the Bloomberg Barclays Multiverse Index, which returned-0.48% for the reporting period.
The Fund’s allocations to corporate high yield bonds (also known as “junk bonds”) and securitized debt products were the leading contributors to absolute performance. High yield bonds benefitted from investors seeking higher yields, positive investor sentiment and low default rates. Securitized debt benefitted from lower volatility relative to other sectors and continued economic growth in the U.S.
The Fund’s exposure to foreign currency was a leading detractor from absolute performance, most notably through exposure to the Russian ruble in the second quarter of 2018 following U.S. economic sanctions on Russia. The Fund’s exposure to the Turkish lira and the Argentine peso also detracted from the Fund’s absolute performance.
HOW WAS THE FUND POSITIONED?
During the reporting period, the Fund invested opportunistically across different markets and sectors. The Fund’s managers applied a flexible investment approach and did not manage to a benchmark. This allowed the Fund to shift its allocations based on changing market conditions. The Fund had exposure to a broad range of asset classes during the reporting period, including high yield and investment grade corporate bonds, agency andnon-agency mortgage-backed securities,
asset-backed securities, commercial mortgage-backed securities, emerging markets debt, convertible bonds and foreign government securities. At the end of the reporting period, the Fund’s largest allocations were in U.S. high yield bonds, investment grade corporate bonds and emerging markets local currency debt. The Fund’s smallest allocations were innon-agency mortgage-backed securities, convertible bonds and collateralized loan obligations.
| | | | |
SUMMARY OF INVESTMENTS BY COUNTRY**** | |
| United States | | | 46.5 | % |
| United Kingdom | | | 3.6 | |
| France | | | 3.6 | |
| Spain | | | 3.6 | |
| Portugal | | | 3.5 | |
| Indonesia | | | 2.2 | |
| South Africa | | | 2.0 | |
| Canada | | | 1.8 | |
| Italy | | | 1.7 | |
| Netherlands | | | 1.5 | |
| Germany | | | 1.5 | |
| Mexico | | | 1.5 | |
| Ireland | | | 1.4 | |
| Luxembourg | | | 1.4 | |
| Greece | | | 1.4 | |
| Australia | | | 1.4 | |
| Sweden | | | 1.2 | |
| Brazil | | | 1.2 | |
| Switzerland | | | 1.2 | |
| Malaysia | | | 1.0 | |
| Others (each less than 1.0%) | | | 9.7 | |
| Short-Term Investments | | | 7.1 | |
| * | | The return shown is based on net asset value calculated for shareholder transactions and may differ from the return shown in the financial highlights, which reflects adjustments made to the net asset value in accordance with accounting principles generally accepted in the United States of America. The net asset value was $48.75 as of February 28, 2019. |
| ** | | Market price return is calculated assuming an initial investment made at the market price at the beginning of the period, reinvestment of all dividends and distributions at market price during the period, and sale at the market price on the last day of the period. The price used to calculate the market price return is the midpoint of the bid/ask spread at the close of business on the Cboe BZX Exchange, Inc. The midpoint price was $48.83 as of February 28, 2019. |
| *** | | The adviser seeks to achieve the Fund’s objective. There can be no guarantee it will be achieved. |
| **** | | Percentages indicated are based on total investments as of February 28, 2019. The Fund’s composition is subject to change. |
| | | | | | | | |
| | | |
| FEBRUARY 28, 2019 | | J.P. MORGAN EXCHANGE-TRADED FUNDS | | | | | 9 | |
JPMorgan Global Bond Opportunities ETF
FUND COMMENTARY
TWELVE MONTHS ENDED FEBRUARY 28, 2019 (Unaudited) (continued)
| | | | | | | | |
AVERAGE ANNUAL TOTAL RETURNSAS OF FEBRUARY 28, 2019 (Unaudited) |
| | | | | | | | | | | | |
| | | INCEPTION DATE | | | 1 YEAR | | | SINCE
INCEPTION | |
JPMorgan Global Bond Opportunities ETF | | | | | | | | | | | | |
Net Asset Value | | | April 5, 2017 | | | | 2.06 | % | | | 3.07 | % |
Market Price | | | | | | | 2.13 | % | | | 3.16 | % |
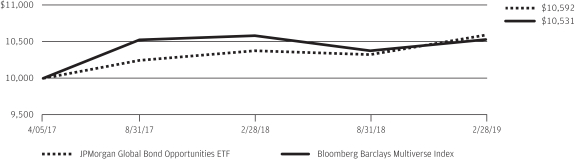
LIFE OF FUND PERFORMANCE(4/5/17 TO 2/28/19)
The performance quoted is past performance and is not a guarantee of future results. Exchange-traded funds are subject to certain market risks. Investment returns and principal value of an investment will fluctuate so that an investor’s shares, when sold or redeemed, may be worth more or less than their original cost. Current performance may be higher or lower than the performance data shown. Forup-to-date,month-end performance information please call1-844-457-6383.
Fund commenced operations on April 5, 2017.
The graph illustrates comparative performance for $10,000 invested in shares of the JPMorgan Global Bond Opportunities ETF and the Bloomberg Barclays Multiverse Index from April 5, 2017 to February 28, 2019. The performance of the Fund reflects the deduction of Fund expenses and assumes reinvestment of all dividends and capital gain distributions, if any. The performance of the Bloomberg Barclays Multiverse Index does not reflect the deduction of expenses associated with an exchange-traded fund and has been adjusted to reflect reinvestment of all dividends and capital gain distributions of the securities included in the Index, if applicable.
The Bloomberg Barclays Multiverse Index is an unmanaged index, which measure the global fixed-income bond market that combines the Bloomberg Barclays Global Aggregate Index and the Bloomberg Barclays Global High Yield Index. The Bloomberg Barclays Global Aggregate Index measures global investment grade debt from twenty-four different local currency markets. The Bloomberg Barclays Global High-Yield Index measures the global high-yield fixed income markets. Investors cannot invest directly in an index.
Fund performance reflects the partial waiver of the Fund’s fees and reimbursement of expenses for certain periods since the inception date. Without these waivers and reimbursements, performance would have been lower. Also, performance shown in this section does not reflect the deduction of taxes that a shareholder may pay on Fund distributions or redemption or sale of Fund shares.
The returns shown are based on net asset values calculated for shareholder transactions and may differ from the returns shown in the financial highlights, which reflect adjustments made to the net asset values in accordance with accounting principles generally accepted in the United States of America.
| | | | | | |
| | | |
| 10 | | | | J.P. MORGAN EXCHANGE-TRADED FUNDS | | FEBRUARY 28, 2019 |
JPMorgan Municipal ETF
FUND COMMENTARY
PERIOD OCTOBER 29, 2018 (FUND INCEPTION DATE) THROUGH FEBRUARY 28, 2019 (Unaudited)
| | | | |
REPORTING PERIOD RETURN: | | | |
JPMorgan Municipal ETF | | | | |
Net Asset Value* | | | 4.74% | |
Market Price** | | | 4.92% | |
Bloomberg Barclays U.S.1-15 Year Blend(1-17) Municipal Bond Index | | | 3.32% | |
| |
Net Assets as of 2/28/2019 | | $ | 31,153,558 | |
Duration as of 2/28/2019 | | | 6.25 Years | |
INVESTMENT OBJECTIVE***
The JPMorgan Municipal ETF (the “Fund”) seeks to provide monthly dividends, which are excluded from gross income, and to protect the value of your investment by investing primarily in municipal obligations. For purposes of the Fund’s investment objective, “gross income” means gross income for federal income tax purposes.
INVESTMENT APPROACH
The Fund invests primarily in a diversified portfolio of intermediate-term municipal bonds, the income from which is exempt from federal income tax. The Fund seeks to maintain an average weighted maturity between three and ten years.
HOW DID THE FUND PERFORM?
For the period from inception on October 29, 2018 to February 28, 2019, the Fund outperformed the Bloomberg Barclays U.S.1-15 Year Blend(1-17) Municipal Bond Index (the “Index”).
Relative to the Index, the Fund’s longer overall duration was a leading contributor to performance as interest rates fell during the reporting period. Generally, a portfolio of bonds with a longer duration will experience a larger increase in price when interest rates fall. During the reporting period, lower rated bonds generally outperformed higher rated bonds during the reporting period and the Fund Fund’s underweight position in bonds rated AAA and its overweight in bonds rated BBB contributed to relative performance. The Fund’s overweight positions in local general obligation bonds and leasing sectors also helped relative performance.
The Fund’s overweight allocation to the electric sector and its underweight allocations to state general obligation bonds and the special tax sector were leading detractors from relative performance.
HOW WAS THE FUND POSITIONED?
At the end of the reporting period, the Fund’s largest allocations were in revenue bonds and general obligation bonds, while its smallest allocation was inpre-refunded bonds. In terms of quality, the Fund’s largest allocations were to bonds rated AA andsingle-A, while its smallest allocations were in unrated bonds and bonds rated BB. The Fund’s overall duration was 6.3 years compared with 4.8 years for the Index.
| | | | |
PORTFOLIO COMPOSITION**** | |
| Municipal Bonds | | | 96.7 | % |
| Short-Term Investments | | | 3.3 | |
| * | | The return shown is based on net asset value calculated for shareholder transactions and may differ from the return shown in the financial highlights, which reflects adjustments made to the net asset value in accordance with accounting principles generally accepted in the United States of America. The net asset value was $51.92 as of February 28, 2019. |
| ** | | Market price return is calculated assuming an initial investment made at the inception date net asset value, reinvestment of all dividends and distributions at market price during the period, and sale at the market price on the last day of the period. The price used to calculate the market price return is the midpoint of the bid/ask spread at the close of business on the Cboe BZX Exchange, Inc. The midpoint price was $52.01 as of February 28, 2019. |
| *** | | The adviser seeks to achieve the Fund’s objective. There can be no guarantee it will be achieved. |
| **** | | Percentages indicated are based on total investments as of February 28, 2019. The Fund’s composition is subject to change. |
| | | | | | | | |
| | | |
| FEBRUARY 28, 2019 | | J.P. MORGAN EXCHANGE-TRADED FUNDS | | | | | 11 | |
JPMorgan Municipal ETF
FUND COMMENTARY
PERIOD OCTOBER 29, 2018 (FUND INCEPTION DATE) THROUGH FEBRUARY 28, 2019 (Unaudited) (continued)
| | | | |
TOTAL RETURNSAS OF FEBRUARY 28, 2019 (Unaudited) |
| | | | | | | | |
| | | INCEPTION DATE | | | CUMULATIVE
SINCE
INCEPTION | |
JPMorgan Municipal ETF | | | | | | | | |
Net Asset Value | | | October 29, 2018 | | | | 4.74 | % |
Market Price | | | | | | | 4.92 | % |
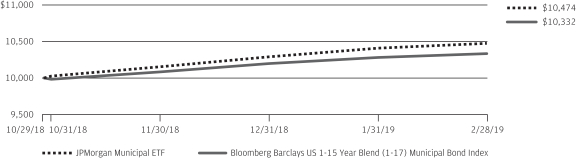
LIFE OF FUND PERFORMANCE(10/29/18 TO 2/28/19)
The performance quoted is past performance and is not a guarantee of future results. Exchange-traded funds are subject to certain market risks. Investment returns and principal value of an investment will fluctuate so that an investor’s shares, when sold or redeemed, may be worth more or less than their original cost. Current performance may be higher or lower than the performance data shown. For up-to-date, month-end performance information please call 1-844-457-6383.
Fund commenced operations on October 29, 2018.
The graph illustrates comparative performance for $10,000 invested in shares of the JPMorgan Municipal ETF and the Bloomberg Barclays US 1-15 Year Blend (1-17) Municipal Bond Index from October 29, 2018 to February 28, 2019. The performance of the Fund reflects the deduction of Fund expenses and assumes reinvestment of all dividends and capital gain distributions, if any. The performance of the Bloomberg Barclays US 1-15 Year Blend (1-17) Municipal Bond Index does not reflect the deduction of expenses associated with an
exchange-traded fund and has been adjusted to reflect reinvestment of all dividends and capital gain distributions of the securities included in the Index, if applicable. The Bloomberg Barclays US 1-15 Year Blend (1-17) Municipal Bond Index represents the performance of municipal bonds with maturities from 1 to 17 years.
Fund performance reflects the waiver of the Fund’s fees and reimbursement of expenses for certain periods since the inception date. Without these waivers and reimbursements, performance would have been lower. Also, performance shown in this section does not reflect the deduction of taxes that a shareholder may pay on Fund distributions or redemption or sale of Fund shares.
The returns shown are based on net asset values calculated for shareholder transactions and may differ from the returns shown in the financial highlights, which reflect adjustments made to the net asset values in accordance with accounting principles generally accepted in the United States of America.
| | | | | | |
| | | |
| 12 | | | | J.P. MORGAN EXCHANGE-TRADED FUNDS | | FEBRUARY 28, 2019 |
JPMorgan U.S. Aggregate Bond ETF
FUND COMMENTARY
PERIOD DECEMBER 12, 2018 (FUND INCEPTION DATE) THROUGH FEBRUARY 28, 2019 (Unaudited)
| | | | |
| REPORTING PERIOD RETURN: | | | |
JPMorgan U.S. Aggregate Bond ETF | | | | |
| Net Asset Value* | | | 1.90% | |
| Market Price** | | | 1.98% | |
| Bloomberg Barclays U.S. Aggregate Index | | | 2.07% | |
| |
| Net Assets as of 2/28/2019 | | $ | 98,730,082 | |
| Duration as of 2/28/2019 | | | 5.79 Years | |
INVESTMENT OBJECTIVE***
The JPMorgan U.S. Aggregate Bond ETF (the “Fund”) seeks to provide long-term total return.
INVESTMENT APPROACH
The Fund invests in a diversified portfolio of high-quality fixed income securities, including corporate bonds, U.S. Treasury obligations and other U.S. government and agency securities, and asset-backed, mortgage-related and mortgage-backed securities. With respect to corporate sub-sectors, the Fund applies a multi-factor credit screening process that seeks exposure to corporate debt issuers with attractive value, quality and momentum characteristics.
HOW DID THE FUND PERFORM?
For the period from inception on December 12, 2018 to February 28, 2019, the Fund underperformed the Bloomberg Barclays U.S. Aggregate Index (the “Index”).
Relative to the Benchmark, the Fund’s overweight allocation to bonds rated AAA detracted from performance, while the Fund’s overweight allocation to bonds rated BBB made a positive contribution to relative performance. During the reporting period, interest rates generally declined and lower quality bonds outperformed higher quality bonds.
HOW WAS THE FUND POSITIONED?
During the reporting period, the Fund applied a multi-factor credit screening process to the corporate sub-sectors of the Index that sought exposure to corporate debt issuers that the Fund’s portfolio managers believed had attractive value, quality and momentum characteristics. The Fund’s and the Index’s
largest allocations at the end of the reporting period were in government bonds and agency mortgage-backed securities and its smallest allocations were in asset-backed securities and municipal bonds.
| | | | |
PORTFOLIO COMPOSITION**** | |
| U.S. Treasury Obligations | | | 38.6 | % |
| Mortgage-Backed Securities | | | 28.1 | |
| Corporate Bonds | | | 25.4 | |
| Foreign Government Securities | | | 2.0 | |
| Commercial Mortgage-Backed Securities | | | 1.9 | |
| Supranational | | | 1.5 | |
| U.S. Government Agency Securities | | | 1.1 | |
| Others (each less than 1.0%) | | | 1.1 | |
| Short-Term Investments | | | 0.3 | |
| * | | The return shown is based on net asset value calculated for shareholder transactions and may differ from the return shown in the financial highlights, which reflects adjustments made to the net asset value in accordance with accounting principles generally accepted in the United States of America. The net asset value was $25.32 as of February 28, 2019. |
| ** | | Market price return is calculated assuming an initial investment made at the inception date net asset value, reinvestment of all dividends and distributions at market price during the period, and sale at the market price on the last day of the period. The price used to calculate the market price return is the midpoint of the bid/ask spread at the close of business on the NYSE Arca, Inc. The midpoint price was $25.34 as of February 28, 2019. |
| *** | | The adviser seeks to achieve the Fund’s objective. There can be no guarantee it will be achieved. |
| **** | | Percentages indicated are based on total investments as of February 28, 2019. The Fund’s composition is subject to change. |
| | | | | | | | |
| | | |
| FEBRUARY 28, 2019 | | J.P. MORGAN EXCHANGE-TRADED FUNDS | | | | | 13 | |
JPMorgan U.S. Aggregate Bond ETF
FUND COMMENTARY
PERIOD DECEMBER 12, 2018 (FUND INCEPTION DATE) THROUGH FEBRUARY 28, 2019 (Unaudited) (continued)
| | | | | | | | |
TOTAL RETURNSAS OF FEBRUARY 28, 2019 (Unaudited) | |
| | | INCEPTION DATE | | | CUMULATIVE
SINCE
INCEPTION | |
JPMorgan U.S. Aggregate Bond ETF | | | | | | | | |
Net Asset Value | | | December 12, 2018 | | | | 1.90% | |
Market Price | | | | | | | 1.98% | |
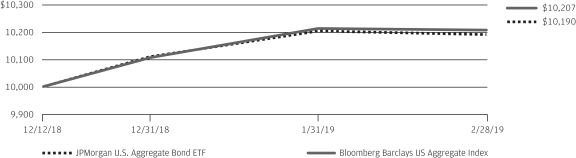
LIFE OF FUND PERFORMANCE(12/12/18 TO 2/28/19)
The performance quoted is past performance and is not a guarantee of future results. Exchange-traded funds are subject to certain market risks. Investment returns and principal value of an investment will fluctuate so that an investor’s shares, when sold or redeemed, may be worth more or less than their original cost. Current performance may be higher or lower than the performance data shown. For up-to-date, month-end performance information please call 1-844-457-6383.
Fund commenced operations on December 12, 2018.
The graph illustrates comparative performance for $10,000 invested in shares of the JPMorgan U.S. Aggregate Bond ETF and the Bloomberg Barclays US Aggregate Index from December 12, 2018 to February 28, 2019. The performance of the Fund reflects the deduction of Fund expenses and assumes reinvestment of all dividends and capital gain distributions, if any. The performance of the Bloomberg Barclays US Aggregate Index does not reflect the deduction of expenses associated with an exchange-traded fund and has been adjusted to reflect reinvestment of all dividends and capital gain
distributions of the securities included in the Index, if applicable. The Bloomberg Barclays US Aggregate Bond Index is an unmanaged index that represents securities that are SEC-registered, taxable, and dollar denominated. The index covers the U.S. investment grade fixed rate bond market, with index components for government and corporate securities, mortgage pass-through securities, and asset-backed securities. Investors cannot invest directly in an index.
Fund performance reflects the waiver of the Fund’s fees and reimbursement of expenses for certain periods since the inception date. Without these waivers and reimbursements, performance would have been lower. Also, performance shown in this section does not reflect the deduction of taxes that a shareholder may pay on Fund distributions or redemption or sale of Fund shares.
The returns shown are based on net asset values calculated for shareholder transactions and may differ from the returns shown in the financial highlights, which reflect adjustments made to the net asset values in accordance with accounting principles generally accepted in the United States of America.
| | | | | | |
| | | |
| 14 | | | | J.P. MORGAN EXCHANGE-TRADED FUNDS | | FEBRUARY 28, 2019 |
JPMorgan Ultra-Short Income ETF
FUND COMMENTARY
TWELVE MONTHS ENDED FEBRUARY 28, 2019 (Unaudited)
| | | | |
| REPORTING PERIOD RETURNS: | |
| JPMorgan Ultra-Short Income ETF | | | | |
| Net Asset Value* | | | 2.68% | |
| Market Price** | | | 2.66% | |
| ICE BofAML U.S.3-Month Treasury Bill Index | | | 2.04% | |
| Net Assets as of 2/28/2019 | | $ | 5,703,062,275 | |
| |
| Duration as of 2/28/2019 | | | 0.44 Years | |
INVESTMENT OBJECTIVE***
The JPMorgan Ultra-Short Income ETF (the “Fund”) seeks to provide current income while seeking to maintain a low volatility of principal.
INVESTMENT APPROACH
The Fund primarily invests mainly in investment-grade, U.S. dollar-denominated short-term fixed, variable and floating-rate debt. The Fund seeks to maintain a duration of one year or less, although under certain market conditions, the Fund’s duration may be longer than one year. Duration measures the price sensitivity of a portfolio of bonds to relative changes in interest rates. Generally, bonds with longer duration will experience a larger decrease or increase in price as interest rates rise or fall, respectively, versus bonds with shorter duration. The Fund’s adviser has broad discretion to shift the Fund’s exposure to strategies and sectors based on changing market conditions and its view of the best mix of investment opportunities.
HOW DID THE FUND PERFORM?
For the twelve months ended February 28, 2019, the Fund outperformed the ICE BofAML U.S.3-Month Treasury Bill Index (the “Index”).
The Fund’s allocations to money market securities and investment grade corporate bonds were leading contributors to both absolute performance and performance relative to the Index during the reporting period. The Fund’s allocations to high quality collateralized loan obligations, asset-backed securities and commercial mortgage-backed securities also contributed to absolute and relative performance.
While the Fund’s longer overall duration relative to the Index was a modest detractor from relative performance, the enhanced yield from longer-dated securities contributed to absolute performance.
HOW WAS THE FUND POSITIONED?
During the reporting period, the Fund’s portfolio management team positioned the Fund according to its belief that interest rates would continue to move higher at a measured pace and that corporate credit fundamentals remained favorable, despite
geopolitical risks and the potential impact of further escalation in international trade tensions. The team also added a small allocation to U.S. Treasury bonds in an effort to protect against potential market volatility from trade uncertainty. In descending order, the Fund’s largest allocations were in corporate bonds, money market securities, collateralized loan obligations, asset-backed securities and U.S. Treasury.
| | | | |
PORTFOLIO COMPOSITION BY SECTOR**** | |
| Financials | | | 48.7 | % |
| Asset-Backed Securities | | | 10.7 | |
| Communication Services | | | 3.8 | |
| Consumer Discretionary | | | 3.7 | |
| Industrials | | | 3.2 | |
| Utilities | | | 2.9 | |
| Consumer Staples | | | 2.3 | |
| Certificates of Deposit | | | 2.0 | |
| Health Care | | | 2.0 | |
| U.S. Treasury Obligations | | | 1.7 | |
| Real Estate | | | 1.5 | |
| Energy | | | 1.4 | |
| Others (each less than 1.0%) | | | 1.3 | |
| Short-Term Investments | | | 14.8 | |
| * | | The return shown is based on net asset value calculated for shareholder transactions and may differ from the return shown in the financial highlights, which reflects adjustments made to the net asset value in accordance with accounting principles generally accepted in the United States of America. The net asset value was $50.20 as of February 28, 2019. |
| ** | | Market price return is calculated assuming an initial investment made at the market price at the beginning of the period, reinvestment of all dividends and distributions at market price during the period, and sale at the market price on the last day of the period. The price used to calculate the market price return is the midpoint of the bid/ask spread at the close of business on the Cboe BZX Exchange, Inc. The midpoint price was $50.23 as of February 28, 2019. |
| *** | | The adviser seeks to achieve the Fund’s objective. There can be no guarantee it will be achieved. |
| **** | | Percentages indicated are based on total investments as of February 28, 2019. The Fund’s composition is subject to change. |
| | | | | | | | |
| | | |
| FEBRUARY 28, 2019 | | J.P. MORGAN EXCHANGE-TRADED FUNDS | | | | | 15 | |
JPMorgan Ultra-Short Income ETF
FUND COMMENTARY
TWELVE MONTHS ENDED FEBRUARY 28, 2019 (Unaudited) (continued)
| | | | | | | | |
AVERAGE ANNUAL TOTAL RETURNSAS OF FEBRUARY 28, 2019 (Unaudited) |
| | | | | | | | | | | | |
| | | INCEPTION DATE | | | 1 YEAR | | | SINCE
INCEPTION | |
JPMorgan Ultra-Short Income ETF | | | | | | | | | | | | |
Net Asset Value | | | May 17, 2017 | | | | 2.68 | % | | | 2.20 | % |
Market Price | | | | | | | 2.66 | % | | | 2.23 | % |
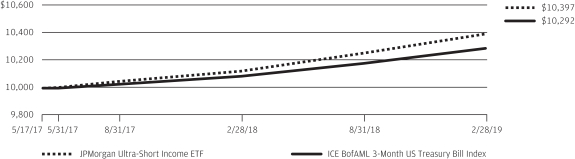
LIFE OF FUND PERFORMANCE(5/17/17 TO 2/28/19)
The performance quoted is past performance and is not a guarantee of future results. Exchange-traded funds are subject to certain market risks. Investment returns and principal value of an investment will fluctuate so that an investor’s shares, when sold or redeemed, may be worth more or less than their original cost. Current performance may be higher or lower than the performance data shown. Forup-to-date,month-end performance information please call1-844-457-6383.
Fund commenced operations on May 17, 2017.
The graph illustrates comparative performance for $10,000 invested in shares of the JPMorgan Ultra-Short Income ETF and the ICE BofAML 3-Month US Treasury Bill Index from May 17, 2017 to February 28, 2019. The performance of the Fund reflects the deduction of Fund expenses and assumes reinvestment of all dividends and capital gain distributions, if any. The performance of the ICE BofAML 3-Month US Treasury Bill Index does not reflect the deduction of expenses associated with an exchange-traded fund and has been adjusted to reflect reinvestment of all dividends and capital gain distributions of the
securities included in the Index, if applicable. The ICE BofAML 3-Month US Treasury Bill Index is comprised of a single issue purchased at the beginning of the month and held for a full month. The index is rebalanced monthly and the issue selected is the outstanding Treasury Bill that matures closest to, but not beyond 3 months from the rebalancing date. Investors cannot invest directly in an index.
Fund performance reflects the partial waiver of the Fund’s fees and reimbursement of expenses for certain periods since the inception date. Without these waivers and reimbursements, performance would have been lower. Also, performance shown in this section does not reflect the deduction of taxes that a shareholder may pay on Fund distributions or redemption or sale of Fund shares.
The returns shown are based on net asset values calculated for shareholder transactions and may differ from the returns shown in the financial highlights, which reflect adjustments made to the net asset values in accordance with accounting principles generally accepted in the United States of America.
| | | | | | |
| | | |
| 16 | | | | J.P. MORGAN EXCHANGE-TRADED FUNDS | | FEBRUARY 28, 2019 |
JPMorgan Ultra-Short Municipal Income ETF
FUND COMMENTARY
PERIOD OCTOBER 16, 2018 (FUND INCEPTION DATE) THROUGH FEBRUARY 28, 2019 (Unaudited)
| | | | |
| REPORTING PERIOD RETURN: | | | |
JPMorgan Ultra-Short Municipal Income ETF | | | | |
| Net Asset Value* | | | 1.16% | |
| Market Price** | | | 1.22% | |
| Bloomberg Barclays 1-Year Municipal Bond Index | | | 1.31% | |
| |
| Net Assets as of 2/28/2019 | | $ | 57,799,591 | |
| Duration as of 2/28/2019 | | | 0.62 Years | |
INVESTMENT OBJECTIVE***
The JPMorgan Ultra-Short Municipal Income ETF (the “Fund”) seeks as high a level of current income exempt from federal income tax as is consistent with relative stability of principal.
INVESTMENT APPROACH
The Fund invests primarily in investment grade fixed, variable and floating rate municipal securities, the income from which is exempt from federal income tax. The Fund seeks to maintain an average weighted maturity of two years or less.
HOW DID THE FUND PERFORM?
For the period from inception on October 16, 2018 to February 28, 2019, the Fund underperformed to the Bloomberg Barclays 1 Year Municipal Bond Index (the “Index”).
During the reporting period, lower quality bonds generally outperformed higher rated bonds and the Fund’s underweight position in bonds rated BBB was a leading detractor from performance relative to the Index. The Fund’s underweight position in state general obligation bonds and its overweight positions in special tax and education bonds also detracted from relative performance.
The Fund’s allocation to bonds with maturities of more than two years, which were not held in the Index, was a leading contributor to relative performance as interest rates fell during the reporting period. The Fund’s exposure to floating rate bonds and its underweight positions in the water & sewer and transportation sectors also helped relative performance.
HOW WAS THE FUND POSITIONED?
At the end of the reporting period, the Fund’s overall duration was 0.6 years vs. 1.4 years for the Index. Duration measures the price sensitivity of a portfolio of bonds relative to changes in interest rates. Generally, bonds with shorter duration experience smaller increase in price as interest rates fall, relative to longer duration bonds.
| | | | |
PORTFOLIO COMPOSITION**** | |
| Municipal Bonds | | | 99.8 | % |
| Short-Term Investments | | | 0.2 | |
| * | | The return shown is based on net asset value calculated for shareholder transactions and may differ from the return shown in the financial highlights, which reflects adjustments made to the net asset value in accordance with accounting principles generally accepted in the United States of America. The net asset value was $50.26 as of February 28, 2019. |
| ** | | Market price return is calculated assuming an initial investment made at the inception date net asset value, reinvestment of all dividends and distributions at market price during the period, and sale at the market price on the last day of the period. The price used to calculate the market price return is the midpoint of the bid/ask spread at the close of business on the Cboe BZX Exchange, Inc. The midpoint price was $50.29 as of February 28, 2019. |
| *** | | The adviser seeks to achieve the Fund’s objective. There can be no guarantee it will be achieved. |
| **** | | Percentages indicated are based on total investments as of February 28, 2019. The Fund’s composition is subject to change. |
| | | | | | | | |
| | | |
| FEBRUARY 28, 2019 | | J.P. MORGAN EXCHANGE-TRADED FUNDS | | | | | 17 | |
JPMorgan Ultra-Short Municipal Income ETF
FUND COMMENTARY
PERIOD OCTOBER 16, 2018 (FUND INCEPTION DATE) THROUGH FEBRUARY 28, 2019 (Unaudited) (continued)
| | | | | | | | |
TOTAL RETURNSAS OF FEBRUARY 28, 2019 (Unaudited) | |
| | | INCEPTION DATE | | | CUMULATIVE
SINCE
INCEPTION | |
JPMorgan Ultra-Short Municipal Income ETF | | | | | | | | |
Net Asset Value | | | October 16, 2018 | | | | 1.16% | |
Market Price | | | | | | | 1.22% | |
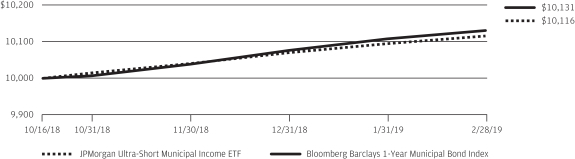
LIFE OF FUND PERFORMANCE(10/16/18 TO 2/28/19)
The performance quoted is past performance and is not a guarantee of future results. Exchange-traded funds are subject to certain market risks. Investment returns and principal value of an investment will fluctuate so that an investor’s shares, when sold or redeemed, may be worth more or less than their original cost. Current performance may be higher or lower than the performance data shown. For up-to-date, month-end performance information please call 1-844-457-6383.
Fund commenced operations on October 16, 2018.
The graph illustrates comparative performance for $10,000 invested in shares of the JPMorgan Ultra-Short Municipal Income ETF and the Bloomberg Barclays1-Year Municipal Bond Index from October 16, 2018 to February 28, 2019. The performance of the Fund reflects the deduction of Fund expenses and assumes reinvestment of all dividends and capital gain distributions, if any. The performance of the Bloomberg Barclays 1-Year Municipal Bond Index does not reflect the deduction of expenses associated with an exchange-traded fund and has been adjusted to reflect reinvestment of all dividends and capital gain
distributions of the securities included in the Index, if applicable. The
Bloomberg Barclays 1 Year Municipal Bond Index is an unmanaged index that includes bonds with a minimum credit rating of BAA3, are issued as part of a deal of at least $50 million, have an amount outstanding of at least $5 million, and have maturities of 1 to 2 years. The performance of the index does not reflect the deduction of expenses associated with a mutual fund, such as investment management fees. By contrast, the performance of the Fund reflects the deduction of the mutual fund expenses, including sales charges if applicable. An individual cannot invest directly in an index.
Fund performance reflects the waiver of the Fund’s fees and reimbursement of expenses for certain periods since the inception date. Without these waivers and reimbursements, performance would have been lower. Also, performance shown in this section does not reflect the deduction of taxes that a shareholder may pay on Fund distributions or redemption or sale of Fund shares.
The returns shown are based on net asset values calculated for shareholder transactions and may differ from the returns shown in the financial highlights, which reflect adjustments made to the net asset values in accordance with accounting principles generally accepted in the United States of America.
| | | | | | |
| | | |
| 18 | | | | J.P. MORGAN EXCHANGE-TRADED FUNDS | | FEBRUARY 28, 2019 |
JPMorgan USD Emerging Markets Sovereign Bond ETF
FUND COMMENTARY
TWELVE MONTHS ENDED FEBRUARY 28, 2019 (Unaudited)
| | | | |
| REPORTING PERIOD RETURN: | | | |
JPMorgan USD Emerging Markets Sovereign Bond ETF | | | | |
| Net Asset Value* | | | 2.29% | |
| Market Price** | | | 2.23% | |
| JPMorgan Emerging Markets Risk-Aware Bond Index | | | 2.86% | |
| |
| Net Assets as of 2/28/2019 | | $ | 61,776,747 | |
| Duration as of 2/28/2019 | | | 6.91 Years | |
INVESTMENT OBJECTIVE***
The JPMorgan USD Emerging Markets Sovereign Bond ETF (the “Fund”) seeks investment results that closely correspond, before fees and expenses, to the performance of the JPMorgan Emerging Markets Risk-Aware Bond Index (the “Underlying Index”).
INVESTMENT APPROACH
The Fund is passively managed to the Underlying Index, which is comprised of liquid, U.S. dollar-denominated sovereign and quasi-sovereign fixed and floating rate debt securities from emerging markets. The Underlying Index utilizes a rules-based, proprietary methodology that filters for liquidity and country risk and allocates risk across credit ratings. The Underlying Index methodology includes monthly rebalancing within countries and semi-annual rebalancing across countries. The Fund also employs optimization techniques that seek to minimize tracking error to the Underlying Index.
HOW DID THE FUND PERFORM?
For the twelve months ended February 28, 2019, the Fund performed in line with the Underlying Index. The majority of
the Fund’s deviation against the Underlying Index was due to operating expenses, fees and tax management of the Fund’s portfolio.
The Fund’s and the Underlying Index’s exposures to Turkey and Ecuador were leading detractors from absolute performance. The Underlying Index’s liquidity filter also detracted from absolute performance as less liquid bond issues outperformed other issues of emerging markets sovereign and quasi-sovereign debt.
The Fund and the Underlying Index had no exposure to Argentina and Venezuela, which was a positive contributor to absolute performance.
HOW WAS THE FUND POSITIONED?
The Fund invested at least 80% of its assets in securities included in the Underlying Index. During the reporting period, the Fund’s and Underlying Index’s largest allocations were to Turkey and Brazil and their smallest allocations were to India and Morocco.
| | | | | | | | |
| | | |
| FEBRUARY 28, 2019 | | J.P. MORGAN EXCHANGE-TRADED FUNDS | | | | | 19 | |
JPMorgan USD Emerging Markets Sovereign Bond ETF
FUND COMMENTARY
TWELVE MONTHS ENDED FEBRUARY 28, 2019 (Unaudited) (continued)
| | | | |
PORTFOLIO COMPOSITION BY COUNTRY**** | |
| Turkey | | | 7.0 | % |
| Brazil | | | 6.5 | |
| South Africa | | | 5.7 | |
| Egypt | | | 4.6 | |
| Ecuador | | | 4.5 | |
| Ukraine | | | 4.5 | |
| Dominican Republic | | | 4.4 | |
| Mexico | | | 4.1 | |
| Indonesia | | | 3.6 | |
| Sri Lanka | | | 3.3 | |
| Russia | | | 3.0 | |
| Philippines | | | 2.8 | |
| China | | | 2.7 | |
| Colombia | | | 2.6 | |
| Kazakhstan | | | 2.6 | |
| Lebanon | | | 2.3 | |
| Oman | | | 2.1 | |
| Peru | | | 2.1 | |
| Croatia | | | 2.1 | |
| Azerbaijan | | | 1.9 | |
| Ghana | | | 1.8 | |
| Pakistan | | | 1.8 | |
| Jamaica | | | 1.8 | |
| Poland | | | 1.8 | |
| Uruguay | | | 1.7 | |
| Hungary | | | 1.7 | |
| Panama | | | 1.6 | |
| Ivory Coast | | | 1.6 | |
| Malaysia | | | 1.5 | |
| Iraq | | | 1.5 | |
| Kenya | | | 1.5 | |
| Jordan | | | 1.3 | |
| Chile | | | 1.2 | |
| Romania | | | 1.2 | |
| Others (each less than 1.0%) | | | 5.0 | |
| Short-Term Investments | | | 0.6 | |
| * | | The return shown is based on net asset value calculated for shareholder transactions and may differ from the return shown in the financial highlights, which reflects adjustments made to the net asset value in accordance with accounting principles generally accepted in the United States of America. The net asset value was $47.52 as of February 28, 2019. |
| ** | | Market price return is calculated assuming an initial investment made at the market price at the beginning of the period, reinvestment of all dividends and distributions at market price during the period, and sale at the market price on the last day of the period. The price used to calculate the market price return is the midpoint of the bid/ask spread at the close of business on the NYSE Arca, Inc. The midpoint price was $47.62 as of February 28, 2019. |
| *** | | The adviser seeks to achieve the Fund’s objective. There can be no guarantee it will be achieved. |
| **** | | Percentages indicated are based on total investments as of February 28, 2019. The Fund’s composition is subject to change. |
| | | | | | |
| | | |
| 20 | | | | J.P. MORGAN EXCHANGE-TRADED FUNDS | | FEBRUARY 28, 2019 |
| | | | | | | | | | | | |
TOTAL RETURNSAS OF FEBRUARY 28, 2019 (Unaudited) | |
| | | INCEPTION DATE | | | 1 YEAR | | | SINCE
INCEPTION | |
JPMorgan USD Emerging Markets Sovereign Bond ETF | | | | | | | | | | | | |
Net Asset Value | | | January 29, 2018 | | | | 2.29% | | | | 0.19% | |
Market Price | | | | | | | 2.23% | | | | 0.36% | |
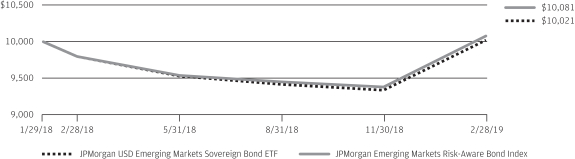
LIFE OF FUND PERFORMANCE(1/29/18 TO 2/28/19)
The performance quoted is past performance and is not a guarantee of future results. Exchange-traded funds are subject to certain market risks. Investment returns and principal value of an investment will fluctuate so that an investor’s shares, when sold or redeemed, may be worth more or less than their original cost. Current performance may be higher or lower than the performance data shown. Forup-to-date,month-end performance information please call1-844-457-6383.
Fund commenced operations on January 29, 2018.
The graph illustrates comparative performance for $10,000 invested in shares of the JPMorgan USD Emerging Markets Sovereign Bond ETF and the JPMorgan Emerging Markets Risk-Aware Bond Index from January 29, 2018 to February 28, 2019. The performance of the Fund reflects the deduction of Fund expenses and assumes reinvestment of all dividends and capital gain distributions, if any. The performance of the JPMorgan Emerging Markets Risk-Aware Bond Index does not reflect the deduction of expenses associated with an exchange-traded fund and has been adjusted to reflect reinvestment of all dividends and capital gain distributions of the securities included in the Index, if applicable. The JPMorgan Emerging Markets Risk-Aware Bond Index (the “index”) is comprised of liquid, U.S. dollar-denominated sovereign and quasi-sovereign fixed and floating rate debt securities from emerging markets selected using a rules-based methodology and is owned by J.P. Morgan Investment Inc., the Fund’s adviser (the “Adviser”). The Index is maintained and calculated by J.P. Morgan Securities LLC (“JPMS” or the “Index Provider”), which selects securities in accordance with the methodology from among the components of the J.P. Morgan Emerging Market Bond Index Global Diversified, which was developed and is maintained by the Index Provider. The Index Provider and the Adviser are both wholly-owned subsidiaries of JPMorgan Chase & Co., a publicly-held financial services holding company. The Index starts with the
J.P. Morgan Emerging Market Bond Index Global Diversified and applies a proprietary methodology that filters for liquidity and for country risk and allocates risk based on credit rating. Historically, the J.P. Morgan Emerging Markets Bond Index Global Diversified has included bonds issued by the countries of Angola, Argentina, Armenia, Azerbaijan, Belize, Bolivia, Brazil, Cameroon, Chile, China, Colombia, Costa Rica, Cote D’Ivoire, Croatia, Dominican Republic, Ecuador, Egypt, El Salvador, Ethiopia, Gabon, Georgia, Ghana, Guatemala, Honduras, Hungary, India, Indonesia, Iraq, Jamaica, Jordan, Kazakhstan, Kenya, Latvia, Lebanon, Lithuania, Malaysia, Mexico, Mongolia, Morocco, Mozambique, Namibia, Nigeria, Oman, Pakistan, Panama, Paraguay, Peru, Philippines, Poland, Romania, Russian Federation, Senegal, Serbia, Slovakia, South Africa, Sri Lanka, Suriname, Trinidad and Tobago, Tunisia, Turkey, Ukraine, Uruguay, Venezuela, Vietnam, Zambia; however, this universe of countries may change in accordance with the Index Provider’s determination of eligible emerging market countries and there is no assurance that a particular country will be represented in the Underlying Index at any given time. Investors cannot invest directly in an index.
Fund performance reflects the partial waiver of the Fund’s fees and reimbursement of expenses for certain periods since the inception date. Without these waivers and reimbursements, performance would have been lower. Also, performance shown in this section does not reflect the deduction of taxes that a shareholder may pay on Fund distributions or redemption or sale of Fund shares.
The returns shown are based on net asset values calculated for shareholder transactions and may differ from the returns shown in the financial highlights, which reflect adjustments made to the net asset values in accordance with accounting principles generally accepted in the United States of America.
| | | | | | | | |
| | | |
| FEBRUARY 28, 2019 | | J.P. MORGAN EXCHANGE-TRADED FUNDS | | | | | 21 | |
JPMorgan Core Plus Bond ETF
SCHEDULE OF PORTFOLIO INVESTMENTS
AS OF FEBRUARY 28, 2019
| | | | | | | | |
| INVESTMENTS | | PRINCIPAL
AMOUNT ($) | | | VALUE ($) | |
Corporate Bonds — 28.6% | |
|
Aerospace & Defense — 1.1% | |
| | |
Arconic, Inc. 5.13%, 10/1/2024 | | | 37,000 | | | | 36,630 | |
| | |
General Dynamics Corp. 3.50%, 5/15/2025 | | | 45,000 | | | | 45,786 | |
| | |
L3 Technologies, Inc. 3.85%, 12/15/2026 | | | 40,000 | | | | 39,825 | |
| | |
Precision Castparts Corp. | | | | | | | | |
| | |
2.50%, 1/15/2023 | | | 19,000 | | | | 18,732 | |
| | |
4.38%, 6/15/2045 | | | 5,000 | | | | 5,188 | |
| | |
Rockwell Collins, Inc. 3.50%, 3/15/2027 | | | 40,000 | | | | 38,666 | |
| | |
TransDigm, Inc. 6.25%, 3/15/2026 (a) | | | 20,000 | | | | 20,500 | |
| | |
United Technologies Corp. 3.65%, 8/16/2023 | | | 60,000 | | | | 60,844 | |
| | | | | | | | |
| | |
| | | | | | | 266,171 | |
| | | | | | | | |
| | |
Air Freight & Logistics — 0.1% | | | | | | | | |
| | |
United Parcel Service, Inc. 3.05%, 11/15/2027 | | | 10,000 | | | | 9,739 | |
| | |
XPO Logistics, Inc. 6.13%, 9/1/2023 (a) | | | 20,000 | | | | 19,950 | |
| | | | | | | | |
| | |
| | | | | | | 29,689 | |
| | | | | | | | |
| | |
Airlines — 0.2% | | | | | | | | |
| | |
Continental Airlines Pass-Through Trust Series 2012-2, Class A, 4.00%, 10/29/2024 | | | 23,202 | | | | 23,271 | |
| | |
United Continental Holdings, Inc. 5.00%, 2/1/2024 | | | 20,000 | | | | 20,100 | |
| | | | | | | | |
| | |
| | | | | | | 43,371 | |
| | | | | | | | |
| | |
Auto Components — 0.4% | | | | | | | | |
| | |
Allison Transmission, Inc. 5.00%, 10/1/2024 (a) | | | 18,000 | | | | 18,112 | |
| | |
American Axle & Manufacturing, Inc. 6.25%, 4/1/2025 | | | 18,000 | | | | 17,957 | |
| | |
Goodyear Tire & Rubber Co. (The) 5.00%, 5/31/2026 | | | 19,000 | | | | 18,026 | |
| | |
Icahn Enterprises LP 6.75%, 2/1/2024 | | | 35,000 | | | | 36,619 | |
| | | | | | | | |
| | |
| | | | | | | 90,714 | |
| | | | | | | | |
| | |
Banks — 4.3% | | | | | | | | |
| | |
Bank of America Corp. | | | | | | | | |
| | |
4.10%, 7/24/2023 | | | 70,000 | | | | 72,182 | |
| | |
(ICE LIBOR USD 3 Month + 0.79%), 3.00%, 12/20/2023 (b) | | | 70,000 | | | | 69,090 | |
| | |
3.88%, 8/1/2025 | | | 40,000 | | | | 40,719 | |
| | |
(ICE LIBOR USD 3 Month + 1.58%), 3.82%, 1/20/2028 (b) | | | 15,000 | | | | 14,932 | |
| | |
(ICE LIBOR USD 3 Month + 1.07%), 3.97%, 3/5/2029 (b) | | | 35,000 | | | | 35,115 | |
| | |
(ICE LIBOR USD 3 Month + 1.21%), 3.97%, 2/7/2030 (b) | | | 20,000 | | | | 20,067 | |
| | | | | | | | |
| INVESTMENTS | | PRINCIPAL
AMOUNT ($) | | | VALUE ($) | |
| | | | | | | | |
| | |
Banks — continued | | | | | | | | |
| | |
Bank of Montreal (Canada) | | | | | | | | |
| | |
1.90%, 8/27/2021 | | | 8,000 | | | | 7,800 | |
| | |
2.35%, 9/11/2022 | | | 7,000 | | | | 6,831 | |
| | |
Bank of Nova Scotia (The) (Canada) 3.13%, 4/20/2021 | | | 100,000 | | | | 100,454 | |
| | |
BB&T Corp. 2.85%, 10/26/2024 | | | 25,000 | | | | 24,486 | |
| | |
BNP Paribas SA (France) 3.25%, 3/3/2023 | | | 10,000 | | | | 10,078 | |
| | |
Canadian Imperial Bank of Commerce (Canada) 2.55%, 6/16/2022 | | | 9,000 | | | | 8,895 | |
| | |
CIT Group, Inc. 5.25%, 3/7/2025 | | | 24,000 | | | | 25,080 | |
| | |
Citigroup, Inc. | | | | | | | | |
| | |
2.75%, 4/25/2022 | | | 40,000 | | | | 39,489 | |
| | |
(ICE LIBOR USD 3 Month + 1.02%), 4.04%, 6/1/2024 (b) | | | 60,000 | | | | 61,355 | |
| | |
Comerica, Inc. 3.70%, 7/31/2023 | | | 5,000 | | | | 5,065 | |
| | |
Fifth Third Bancorp 2.88%, 7/27/2020 | | | 10,000 | | | | 9,985 | |
| | |
HSBC Holdings plc (United Kingdom) | | | | | | | | |
| | |
7.63%, 5/17/2032 | | | 20,000 | | | | 25,683 | |
| | |
6.10%, 1/14/2042 | | | 40,000 | | | | 49,218 | |
| | |
Huntington Bancshares, Inc. 2.30%, 1/14/2022 | | | 15,000 | | | | 14,639 | |
| | |
KeyCorp 5.10%, 3/24/2021 | | | 10,000 | | | | 10,401 | |
| | |
Mitsubishi UFJ Financial Group, Inc. (Japan) | | | | | | | | |
| | |
2.67%, 7/25/2022 | | | 8,000 | | | | 7,835 | |
| | |
3.78%, 3/2/2025 | | | 5,000 | | | | 5,071 | |
| | |
MUFG Americas Holdings Corp. 3.50%, 6/18/2022 | | | 3,000 | | | | 3,013 | |
| | |
PNC Financial Services Group, Inc. (The) 3.50%, 1/23/2024 | | | 20,000 | | | | 20,166 | |
| | |
Royal Bank of Canada (Canada) | | | | | | | | |
| | |
3.20%, 4/30/2021 | | | 100,000 | | | | 100,561 | |
| | |
2.75%, 2/1/2022 | | | 8,000 | | | | 7,974 | |
| | |
Royal Bank of Scotland Group plc (United Kingdom) 6.10%, 6/10/2023 | | | 19,000 | | | | 19,930 | |
| | |
Santander UK plc (United Kingdom) 4.00%, 3/13/2024 | | | 5,000 | | | | 5,150 | |
| | |
Sumitomo Mitsui Financial Group, Inc. (Japan) | | | | | | | | |
| | |
2.85%, 1/11/2022 | | | 15,000 | | | | 14,845 | |
| | |
3.75%, 7/19/2023 | | | 10,000 | | | | 10,134 | |
| | |
SunTrust Bank 4.05%, 11/3/2025 | | | 10,000 | | | | 10,375 | |
| | |
Toronto-Dominion Bank (The) (Canada) 1.80%, 7/13/2021 | | | 9,000 | | | | 8,771 | |
| | |
US Bancorp 2.95%, 7/15/2022 | | | 20,000 | | | | 19,894 | |
| | |
Wells Fargo & Co. | | | | | | | | |
| | |
2.63%, 7/22/2022 | | | 35,000 | | | | 34,329 | |
| | |
3.07%, 1/24/2023 | | | 70,000 | | | | 69,535 | |
SEE NOTES TO FINANCIAL STATEMENTS.
| | | | | | |
| | | |
| 22 | | | | J.P. MORGAN EXCHANGE-TRADED FUNDS | | FEBRUARY 28, 2019 |
| | | | | | | | |
| INVESTMENTS | | PRINCIPAL
AMOUNT ($) | | | VALUE ($) | |
Corporate Bonds — continued | |
| | |
Banks — continued | | | | | | | | |
| | |
3.00%, 10/23/2026 | | | 25,000 | | | | 23,838 | |
| | |
(ICE LIBOR USD 3 Month + 1.31%), 3.58%, 5/22/2028 (b) | | | 40,000 | | | | 39,477 | |
| | |
Westpac Banking Corp. (Australia) 3.65%, 5/15/2023 | | | 20,000 | | | | 20,302 | |
| | | | | | | | |
| | |
| | | | | | | 1,072,764 | |
| | | | | | | | |
| | |
Beverages — 0.4% | | | | | | | | |
| | |
Anheuser-Busch Cos. LLC (Belgium) | | | | | | | | |
| | |
3.65%, 2/1/2026 (a) | | | 40,000 | | | | 39,461 | |
| | |
4.90%, 2/1/2046 (a) | | | 35,000 | | | | 33,696 | |
| | |
PepsiCo, Inc. 2.38%, 10/6/2026 | | | 25,000 | | | | 23,397 | |
| | | | | | | | |
| | |
| | | | | | | 96,554 | |
| | | | | | | | |
| | |
Biotechnology — 0.2% | | | | | | | | |
| | |
Gilead Sciences, Inc. | | | | | | | | |
| | |
2.95%, 3/1/2027 | | | 48,000 | | | | 45,305 | |
| | |
4.15%, 3/1/2047 | | | 15,000 | | | | 13,744 | |
| | | | | | | | |
| | |
| | | | | | | 59,049 | |
| | | | | | | | |
| | |
Building Products — 0.1% | | | | | | | | |
| | |
Standard Industries, Inc. 6.00%, 10/15/2025 (a) | | | 32,000 | | | | 33,400 | |
| | | | | | | | |
| | |
Capital Markets — 2.1% | | | | | | | | |
| | |
Ameriprise Financial, Inc. 4.00%, 10/15/2023 | | | 10,000 | | | | 10,287 | |
| | |
Bank of New York Mellon Corp. (The) | | | | | | | | |
| | |
3.50%, 4/28/2023 | | | 10,000 | | | | 10,143 | |
| | |
2.20%, 8/16/2023 | | | 23,000 | | | | 22,081 | |
| | |
Goldman Sachs Group, Inc. (The) | | | | | | | | |
| | |
2.35%, 11/15/2021 | | | 95,000 | | | | 93,025 | |
| | |
(ICE LIBOR USD 3 Month + 1.05%), 2.91%, 6/5/2023 (b) | | | 60,000 | | | | 58,872 | |
| | |
(ICE LIBOR USD 3 Month + 1.20%), 3.27%, 9/29/2025 (b) | | | 45,000 | | | | 43,632 | |
| | |
3.50%, 11/16/2026 | | | 10,000 | | | | 9,622 | |
| | |
3.85%, 1/26/2027 | | | 15,000 | | | | 14,701 | |
| | |
(ICE LIBOR USD 3 Month + 1.51%), 3.69%, 6/5/2028 (b) | | | 35,000 | | | | 33,892 | |
| | |
Morgan Stanley | | | | | | | | |
| | |
3.75%, 2/25/2023 | | | 50,000 | | | | 50,821 | |
| | |
(ICE LIBOR USD 3 Month + 0.85%), 3.74%, 4/24/2024 (b) | | | 65,000 | | | | 65,566 | |
| | |
3.88%, 1/27/2026 | | | 25,000 | | | | 25,081 | |
| | |
3.63%, 1/20/2027 | | | 18,000 | | | | 17,651 | |
| | |
(ICE LIBOR USD 3 Month + 1.34%), 3.59%, 7/22/2028 (b) | | | 35,000 | | | | 33,980 | |
| | | | | | | | |
| INVESTMENTS | | PRINCIPAL
AMOUNT ($) | | | VALUE ($) | |
| | | | | | | | |
| | |
Capital Markets — continued | | | | | | | | |
| | |
MSCI, Inc. 5.75%, 8/15/2025 (a) | | | 12,000 | | | | 12,480 | |
| | |
Northern Trust Corp. 3.95%, 10/30/2025 | | | 12,000 | | | | 12,463 | |
| | |
State Street Corp. 3.10%, 5/15/2023 | | | 12,000 | | | | 11,944 | |
| | | | | | | | |
| | |
| | | | | | | 526,241 | |
| | | | | | | | |
| | |
Chemicals — 0.4% | | | | | | | | |
| | |
CF Industries, Inc. 4.95%, 6/1/2043 | | | 15,000 | | | | 12,544 | |
| | |
Chemours Co. (The) 7.00%, 5/15/2025 | | | 17,000 | | | | 17,722 | |
| | |
Ecolab, Inc. 3.25%, 12/1/2027 | | | 12,000 | | | | 11,779 | |
| | |
Ingevity Corp. 4.50%, 2/1/2026 (a) | | | 11,000 | | | | 10,533 | |
| | |
Olin Corp. 5.13%, 9/15/2027 | | | 13,000 | | | | 13,098 | |
| | |
PolyOne Corp. 5.25%, 3/15/2023 | | | 12,000 | | | | 12,270 | |
| | |
Valvoline, Inc. 4.38%, 8/15/2025 | | | 10,000 | | | | 9,475 | |
| | | | | | | | |
| | |
| | | | | | | 87,421 | |
| | | | | | | | |
|
Commercial Services & Supplies — 0.4% | |
| | |
ACCO Brands Corp. 5.25%, 12/15/2024 (a) | | | 10,000 | | | | 9,825 | |
| | |
ADT Security Corp. (The) 4.13%, 6/15/2023 | | | 39,000 | | | | 38,269 | |
| | |
Aramark Services, Inc. 4.75%, 6/1/2026 | | | 15,000 | | | | 14,887 | |
| | |
Brink’s Co. (The) 4.63%, 10/15/2027 (a) | | | 13,000 | | | | 12,382 | |
| | |
Covanta Holding Corp. 5.88%, 3/1/2024 | | | 10,000 | | | | 10,213 | |
| | |
Garda World Security Corp. (Canada) 8.75%, 5/15/2025 (a) | | | 5,000 | | | | 4,788 | |
| | |
Pitney Bowes, Inc. 4.95%, 4/1/2023 (c) | | | 13,000 | | | | 12,220 | |
| | | | | | | | |
| | |
| | | | | | | 102,584 | |
| | | | | | | | |
|
Communications Equipment —0.1% | |
| | |
CommScope, Inc. 5.50%, 6/15/2024 (a) | | | 17,000 | | | | 16,320 | |
| | |
Nokia OYJ (Finland) 4.38%, 6/12/2027 | | | 13,000 | | | | 12,774 | |
| | | | | | | | |
| | |
| | | | | | | 29,094 | |
| | | | | | | | |
|
Construction & Engineering —0.2% | |
| | |
AECOM 5.13%, 3/15/2027 | | | 18,000 | | | | 17,077 | |
| | |
MasTec, Inc. 4.88%, 3/15/2023 | | | 25,000 | | | | 25,062 | |
| | |
Tutor Perini Corp. 6.88%, 5/1/2025 (a) | | | 13,000 | | | | 12,903 | |
| | | | | | | | |
| | |
| | | | | | | 55,042 | |
| | | | | | | | |
| | |
Consumer Finance — 0.7% | | | | | | | | |
| | |
Ally Financial, Inc. | | | | | | | | |
| | |
5.75%, 11/20/2025 | | | 29,000 | | | | 30,740 | |
| | |
8.00%, 11/1/2031 | | | 17,000 | | | | 20,995 | |
| | |
American Express Co. 3.40%, 2/27/2023 | | | 25,000 | | | | 25,165 | |
| | |
Capital One Financial Corp. 3.20%, 1/30/2023 | | | 20,000 | | | | 19,697 | |
| | |
Curo Group Holdings Corp. 8.25%, 9/1/2025 (a) | | | 7,000 | | | | 5,997 | |
SEE NOTES TO FINANCIAL STATEMENTS.
| | | | | | | | |
| | | |
| FEBRUARY 28, 2019 | | J.P. MORGAN EXCHANGE-TRADED FUNDS | | | | | 23 | |
JPMorgan Core Plus Bond ETF
SCHEDULE OF PORTFOLIO INVESTMENTS
AS OF FEBRUARY 28, 2019 (continued)
| | | | | | | | |
| INVESTMENTS | | PRINCIPAL
AMOUNT ($) | | | VALUE ($) | |
Corporate Bonds — continued | |
| | |
Consumer Finance — continued | | | | | | | | |
| | |
John Deere Capital Corp. 2.65%, 6/10/2026 | | | 24,000 | | | | 23,006 | |
| | |
Springleaf Finance Corp. 7.13%, 3/15/2026 | | | 26,000 | | | | 26,325 | |
| | |
Toyota Motor Credit Corp. 2.70%, 1/11/2023 | | | 35,000 | | | | 34,502 | |
| | | | | | | | |
| | |
| | | | | | | 186,427 | |
| | | | | | | | |
| | |
Containers & Packaging — 0.3% | | | | | | | | |
| | |
Ball Corp. 5.25%, 7/1/2025 | | | 12,000 | | | | 12,600 | |
| | |
Crown Americas LLC 4.25%, 9/30/2026 | | | 13,000 | | | | 12,513 | |
| | |
Greif, Inc. 6.50%, 3/1/2027 (a) | | | 15,000 | | | | 15,281 | |
| | |
Reynolds Group Issuer, Inc. 5.75%, 10/15/2020 | | | 24,228 | | | | 24,276 | |
| | |
Sealed Air Corp. 5.50%, 9/15/2025 (a) | | | 12,000 | | | | 12,510 | |
| | | | | | | | |
| | |
| | | | | | | 77,180 | |
| | | | | | | | |
|
Diversified Consumer Services — 0.1% | |
| | |
Service Corp. International 5.38%, 5/15/2024 | | | 12,000 | | | | 12,270 | |
| | | | | | | | |
|
Diversified Financial Services — 0.6% | |
| | |
ACE Cash Express, Inc. 12.00%, 12/15/2022 (a) | | | 5,000 | | | | 4,756 | |
| | |
AIG Global Funding 1.90%, 10/6/2021 (a) | | | 7,000 | | | | 6,747 | |
| | |
Berkshire Hathaway, Inc. 3.13%, 3/15/2026 | | | 23,000 | | | | 22,749 | |
| | |
CNG Holdings, Inc. 9.38%, 5/15/2020 (a) | | | 10,000 | | | | 9,813 | |
| | |
National Rural Utilities Cooperative Finance Corp. | | | | | | | | |
| | |
3.25%, 11/1/2025 | | | 40,000 | | | | 39,659 | |
| | |
3.40%, 2/7/2028 | | | 12,000 | | | | 11,867 | |
| | |
4.40%, 11/1/2048 | | | 12,000 | | | | 12,335 | |
| | |
ORIX Corp. (Japan) 4.05%, 1/16/2024 | | | 7,000 | | | | 7,122 | |
| | |
Shell International Finance BV (Netherlands) | | | | | | | | |
| | |
3.25%, 5/11/2025 | | | 35,000 | | | | 35,101 | |
| | |
3.75%, 9/12/2046 | | | 11,000 | | | | 10,496 | |
| | | | | | | | |
| | |
| | | | | | | 160,645 | |
| | | | | | | | |
|
Diversified Telecommunication Services — 1.1% | |
| | |
AT&T, Inc. 4.75%, 5/15/2046 | | | 10,000 | | | | 9,285 | |
| | |
CCO Holdings LLC 5.75%, 2/15/2026 (a) | | | 61,000 | | | | 63,214 | |
| | |
CenturyLink, Inc. Series T, 5.80%, 3/15/2022 | | | 12,000 | | | | 12,315 | |
| | |
Cincinnati Bell, Inc. 8.00%, 10/15/2025 (a) | | | 5,000 | | | | 4,525 | |
| | |
Embarq Corp. 8.00%, 6/1/2036 | | | 33,000 | | | | 31,845 | |
| | |
Frontier Communications Corp. 6.88%, 1/15/2025 | | | 30,000 | | | | 16,200 | |
| | | | | | | | |
| INVESTMENTS | | PRINCIPAL
AMOUNT ($) | | | VALUE ($) | |
| | | | | | | | |
|
Diversified Telecommunication Services — continued | |
| | |
Intelsat Jackson Holdings SA (Luxembourg) 5.50%, 8/1/2023 | | | 5,000 | | | | 4,587 | |
| | |
Intelsat Luxembourg SA (Luxembourg) | | | | | | | | |
| | |
7.75%, 6/1/2021 | | | 5,000 | | | | 4,875 | |
| | |
8.13%, 6/1/2023 | | | 5,000 | | | | 4,175 | |
| | |
Level 3 Financing, Inc. 5.25%, 3/15/2026 | | | 36,000 | | | | 35,325 | |
| | |
Sprint Capital Corp. 8.75%, 3/15/2032 | | | 10,000 | | | | 10,838 | |
| | |
Telecom Italia Capital SA (Italy) 6.00%, 9/30/2034 | | | 23,000 | | | | 20,700 | |
| | |
Verizon Communications, Inc. | | | | | | | | |
| | |
4.33%, 9/21/2028 | | | 30,000 | | | | 31,044 | |
| | |
4.02%, 12/3/2029 (a) | | | 20,000 | | | | 19,977 | |
| | |
Windstream Services LLC | | | | | | | | |
| | |
8.63%, 10/31/2025 (a) | | | 5,000 | | | | 4,663 | |
| | |
9.00%, 6/30/2025 (a) | | | 20,000 | | | | 11,900 | |
| | | | | | | | |
| | |
| | | | | | | 285,468 | |
| | | | | | | | |
| | |
Electric Utilities — 0.8% | | | | | | | | |
| | |
Alabama Power Co. Series 13-A, 3.55%, 12/1/2023 | | | 12,000 | | | | 12,145 | |
| | |
Arizona Public Service Co. 3.15%, 5/15/2025 | | | 12,000 | | | | 11,808 | |
| | |
Entergy Louisiana LLC | | | | | | | | |
| | |
2.40%, 10/1/2026 | | | 12,000 | | | | 11,038 | |
| | |
3.05%, 6/1/2031 | | | 25,000 | | | | 23,078 | |
| | |
Indiana Michigan Power Co. Series K, 4.55%, 3/15/2046 | | | 12,000 | | | | 12,296 | |
| | |
Kentucky Utilities Co. 5.13%, 11/1/2040 | | | 12,000 | | | | 13,644 | |
| | |
Monongahela Power Co. 4.10%, 4/15/2024 (a) | | | 12,000 | | | | 12,393 | |
| | |
Public Service Electric & Gas Co. 3.00%, 5/15/2027 | | | 12,000 | | | | 11,558 | |
| | |
Puget Sound Energy, Inc. 4.30%, 5/20/2045 | | | 12,000 | | | | 12,283 | |
| | |
Southern California Edison Co. Series C, 4.13%, 3/1/2048 | | | 12,000 | | | | 11,045 | |
| | |
Southwestern Public Service Co. | | | | | | | | |
| | |
3.30%, 6/15/2024 | | | 12,000 | | | | 12,062 | |
| | |
4.50%, 8/15/2041 | | | 12,000 | | | | 12,374 | |
| | |
Tucson Electric Power Co. | | | | | | | | |
| | |
3.05%, 3/15/2025 | | | 12,000 | | | | 11,658 | |
| | |
4.85%, 12/1/2048 | | | 12,000 | | | | 12,729 | |
| | |
Vistra Operations Co. LLC 5.50%, 9/1/2026 (a) | | | 19,000 | | | | 19,713 | |
| | |
Wisconsin Public Service Corp. 4.75%, 11/1/2044 | | | 12,000 | | | | 12,967 | |
| | | | | | | | |
| | |
| | | | | | | 212,791 | |
| | | | | | | | |
SEE NOTES TO FINANCIAL STATEMENTS.
| | | | | | |
| | | |
| 24 | | | | J.P. MORGAN EXCHANGE-TRADED FUNDS | | FEBRUARY 28, 2019 |
| | | | | | | | |
| INVESTMENTS | | PRINCIPAL
AMOUNT ($) | | | VALUE ($) | |
Corporate Bonds — continued | |
| | |
Electrical Equipment — 0.1% | | | | | | | | |
| | |
Sensata Technologies BV 5.00%, 10/1/2025 (a) | | | 15,000 | | | | 15,150 | |
| | |
Vertiv Group Corp. 9.25%, 10/15/2024 (a) | | | 10,000 | | | | 10,013 | |
| | | | | | | | |
| | |
| | | | | | | 25,163 | |
| | | | | | | | |
|
Electronic Equipment, Instruments & Components — 0.1% | |
| | |
CDW LLC 5.00%, 9/1/2025 | | | 12,000 | | | | 12,135 | |
| | | | | | | | |
|
Energy Equipment & Services — 0.2% | |
| | |
Bristow Group, Inc. 6.25%, 10/15/2022 | | | 5,000 | | | | 1,500 | |
| | |
Nabors Industries, Inc. 5.50%, 1/15/2023 | | | 14,000 | | | | 13,125 | |
| | |
Transocean, Inc. 6.80%, 3/15/2038 | | | 10,000 | | | | 7,550 | |
| | |
Unit Corp. 6.63%, 5/15/2021 | | | 13,000 | | | | 12,740 | |
| | |
Weatherford International Ltd. | | | | | | | | |
| | |
4.50%, 4/15/2022 | | | 5,000 | | | | 3,438 | |
| | |
5.95%, 4/15/2042 | | | 10,000 | | | | 5,925 | |
| | | | | | | | |
| | |
| | | | | | | 44,278 | |
| | | | | | | | |
| | |
Entertainment — 0.6% | | | | | | | | |
| | |
Carmike Cinemas, Inc. 6.00%, 6/15/2023 (a) | | | 20,000 | | | | 20,400 | |
| | |
Cinemark USA, Inc. 4.88%, 6/1/2023 | | | 15,000 | | | | 15,015 | |
| | |
NBCUniversal Media LLC 2.88%, 1/15/2023 | | | 41,000 | | | | 40,690 | |
| | |
Netflix, Inc. 4.38%, 11/15/2026 | | | 24,000 | | | | 23,025 | |
| | |
Viacom, Inc. (ICE LIBOR USD 3 Month + 3.90%), 5.87%, 2/28/2057 (b) | | | 20,000 | | | | 19,747 | |
| | |
Walt Disney Co. (The) 1.85%, 7/30/2026 | | | 13,000 | | | | 11,835 | |
| | |
WMG Acquisition Corp. 4.88%, 11/1/2024 (a) | | | 13,000 | | | | 12,903 | |
| | | | | | | | |
| | |
| | | | | | | 143,615 | |
| | | | | | | | |
|
Equity Real Estate Investment Trusts (REITs) — 0.7% | |
| | |
AvalonBay Communities, Inc. 3.35%, 5/15/2027 | | | 4,000 | | | | 3,923 | |
| | |
CyrusOne LP 5.38%, 3/15/2027 | | | 17,000 | | | | 17,298 | |
| | |
Equinix, Inc. 5.75%, 1/1/2025 | | | 24,000 | | | | 24,990 | |
| | |
Equity Commonwealth 5.88%, 9/15/2020 | | | 3,000 | | | | 3,067 | |
| | |
ERP Operating LP 3.25%, 8/1/2027 | | | 5,000 | | | | 4,874 | |
| | |
ESH Hospitality, Inc. 5.25%, 5/1/2025 (a) | | | 10,000 | | | | 9,950 | |
| | |
Iron Mountain, Inc. 5.75%, 8/15/2024 | | | 18,000 | | | | 18,045 | |
| | |
MGM Growth Properties Operating Partnership LP 5.63%, 5/1/2024 | | | 12,000 | | | | 12,270 | |
| | |
National Retail Properties, Inc. 3.60%, 12/15/2026 | | | 3,000 | | | | 2,920 | |
| | |
Office Properties Income Trust 3.75%, 8/15/2019 | | | 8,000 | | | | 8,013 | |
| | |
Realty Income Corp. 4.13%, 10/15/2026 | | | 7,000 | | | | 7,165 | |
| | | | | | | | |
| INVESTMENTS | | PRINCIPAL
AMOUNT ($) | | | VALUE ($) | |
| | | | | | | | |
|
Equity Real Estate Investment Trusts (REITs) — continued | |
| | |
Simon Property Group LP | | | | | | | | |
| | |
2.75%, 6/1/2023 | | | 65,000 | | | | 63,790 | |
| | |
3.30%, 1/15/2026 | | | 10,000 | | | | 9,834 | |
| | | | | | | | |
| | |
| | | | | | | 186,139 | |
| | | | | | | | |
| | |
Food & Staples Retailing — 0.1% | | | | | | | | |
| | |
Albertsons Cos. LLC 6.63%, 6/15/2024 | | | 10,000 | | | | 10,000 | |
| | |
New Albertsons LP 8.00%, 5/1/2031 | | | 10,000 | | | | 8,975 | |
| | | | | | | | |
| | |
| | | | | | | 18,975 | |
| | | | | | | | |
| | |
Food Products — 0.3% | | | | | | | | |
| | |
JBS USA LUX SA 5.75%, 6/15/2025 (a) | | | 38,000 | | | | 38,405 | |
| | |
Mead Johnson Nutrition Co. (United Kingdom) 4.13%, 11/15/2025 | | | 11,000 | | | | 11,462 | |
| | |
Pilgrim’s Pride Corp. 5.75%, 3/15/2025 (a) | | | 12,000 | | | | 12,000 | |
| | | | | | | | |
| | |
| | | | | | | 61,867 | |
| | | | | | | | |
| | |
Gas Utilities — 0.1% | | | | | | | | |
| | |
AmeriGas Partners LP 5.50%, 5/20/2025 | | | 13,000 | | | | 12,870 | |
| | |
Brooklyn Union Gas Co. (The) 3.87%, 3/4/2029 (a) | | | 10,000 | | | | 9,986 | |
| | | | | | | | |
| | |
| | | | | | | 22,856 | |
| | | | | | | | |
|
Health Care Equipment & Supplies — 0.6% | |
| | |
Boston Scientific Corp. | | | | | | | | |
| | |
4.00%, 3/1/2029 | | | 10,000 | | | | 10,002 | |
| | |
4.70%, 3/1/2049 | | | 20,000 | | | | 20,074 | |
| | |
Medtronic Global Holdings SCA 3.35%, 4/1/2027 | | | 23,000 | | | | 22,856 | |
| | |
Medtronic, Inc. | | | | | | | | |
| | |
3.63%, 3/15/2024 | | | 55,000 | | | | 56,412 | |
| | |
4.00%, 4/1/2043 | | | 24,000 | | | | 22,997 | |
| | |
Teleflex, Inc. 4.63%, 11/15/2027 | | | 13,000 | | | | 12,903 | |
| | | | | | | | |
| | |
| | | | | | | 145,244 | |
| | | | | | | | |
|
Health Care Providers & Services — 1.1% | |
| | |
Centene Corp. 5.38%, 6/1/2026 (a) | | | 29,000 | | | | 30,088 | |
| | |
Community Health Systems, Inc. | | | | | | | | |
| | |
8.13%, 6/30/2024 (a) | | | 10,000 | | | | 8,325 | |
| | |
8.00%, 3/15/2026 (a) | | | 3,000 | | | | 2,960 | |
| | |
CVS Health Corp. 4.78%, 3/25/2038 | | | 20,000 | | | | 19,455 | |
| | |
Envision Healthcare Corp. 8.75%, 10/15/2026 (a) | | | 5,000 | | | | 4,513 | |
| | |
HCA, Inc. 5.38%, 9/1/2026 | | | 48,000 | | | | 49,289 | |
| | |
Tenet Healthcare Corp. 4.50%, 4/1/2021 | | | 31,000 | | | | 31,388 | |
| | |
UnitedHealth Group, Inc. | | | | | | | | |
| | |
3.88%, 10/15/2020 | | | 100,000 | | | | 101,385 | |
| | |
3.38%, 4/15/2027 | | | 20,000 | | | | 19,895 | |
SEE NOTES TO FINANCIAL STATEMENTS.
| | | | | | | | |
| | | |
| FEBRUARY 28, 2019 | | J.P. MORGAN EXCHANGE-TRADED FUNDS | | | | | 25 | |
JPMorgan Core Plus Bond ETF
SCHEDULE OF PORTFOLIO INVESTMENTS
AS OF FEBRUARY 28, 2019 (continued)
| | | | | | | | |
| INVESTMENTS | | PRINCIPAL
AMOUNT ($) | | | VALUE ($) | |
Corporate Bonds — continued | |
|
Health Care Providers & Services — continued | |
| | |
WellCare Health Plans, Inc. 5.25%, 4/1/2025 | | | 12,000 | | | | 12,251 | |
| | | | | | | | |
| | |
| | | | | | | 279,549 | |
| | | | | | | | |
| | |
Hotels, Restaurants & Leisure — 0.4% | | | | | | | | |
| | |
Boyne USA, Inc. 7.25%, 5/1/2025 (a) | | | 9,000 | | | | 9,630 | |
| | |
Downstream Development Authority of the Quapaw Tribe of Oklahoma 10.50%, 2/15/2023 (a) | | | 7,000 | | | | 7,122 | |
| | |
Eldorado Resorts, Inc. 6.00%, 9/15/2026 (a) | | | 12,000 | | | | 12,210 | |
| | |
Enterprise Development Authority (The) 12.00%, 7/15/2024 (a) | | | 7,000 | | | | 7,053 | |
| | |
Hilton Grand Vacations Borrower LLC 6.13%, 12/1/2024 | | | 10,000 | | | | 10,300 | |
| | |
Marriott Ownership Resorts, Inc. 6.50%, 9/15/2026 (a) | | | 10,000 | | | | 10,325 | |
| | |
MGM Resorts International 5.75%, 6/15/2025 | | | 25,000 | | | | 25,500 | |
| | |
Scientific Games International, Inc. 5.00%, 10/15/2025 (a) | | | 13,000 | | | | 12,594 | |
| | |
Wyndham Destinations, Inc. 5.40%, 4/1/2024 (c) | | | 10,000 | | | | 10,050 | |
| | | | | | | | |
| | |
| | | | | | | 104,784 | |
| | | | | | | | |
| | |
Household Durables — 0.1% | | | | | | | | |
| | |
Lennar Corp. 4.75%, 5/30/2025 | | | 21,000 | | | | 21,059 | |
| | |
Toll Brothers Finance Corp. 4.88%, 11/15/2025 | | | 13,000 | | | | 12,951 | |
| | | | | | | | |
| | |
| | | | | | | 34,010 | |
| | | | | | | | |
| | |
Household Products — 0.1% | | | | | | | | |
| | |
Procter & Gamble Co. (The) 2.45%, 11/3/2026 | | | 24,000 | | | | 22,861 | |
| | |
Spectrum Brands, Inc. 5.75%, 7/15/2025 | | | 10,000 | | | | 9,787 | |
| | | | | | | | |
| | |
| | | | | | | 32,648 | |
| | | | | | | | |
|
Independent Power and Renewable Electricity Producers — 0.3% | |
| | |
AES Corp. 5.50%, 4/15/2025 | | | 24,000 | | | | 24,750 | |
| | |
Calpine Corp. 5.88%, 1/15/2024 (a) | | | 13,000 | | | | 13,260 | |
| | |
Clearway Energy Operating LLC 5.38%, 8/15/2024 | | | 13,000 | | | | 12,740 | |
| | |
NRG Energy, Inc. 6.63%, 1/15/2027 | | | 24,000 | | | | 25,560 | |
| | |
Talen Energy Supply LLC 6.50%, 6/1/2025 | | | 10,000 | | | | 8,910 | |
| | | | | | | | |
| | |
| | | | | | | 85,220 | |
| | | | | | | | |
| | |
Insurance — 0.4% | | | | | | | | |
| | |
Aflac, Inc. 3.25%, 3/17/2025 | | | 4,000 | | | | 3,951 | |
| | |
Allstate Corp. (The) 5.35%, 6/1/2033 | | | 3,000 | | | | 3,436 | |
| | | | | | | | |
| INVESTMENTS | | PRINCIPAL
AMOUNT ($) | | | VALUE ($) | |
| | | | | | | | |
| | |
Insurance — continued | | | | | | | | |
| | |
Athene Global Funding 4.00%, 1/25/2022 (a) | | | 7,000 | | | | 7,106 | |
| | |
CNO Financial Group, Inc. 5.25%, 5/30/2025 | | | 15,000 | | | | 15,375 | |
| | |
Jackson National Life Global Funding 2.50%, 6/27/2022 (a) | | | 15,000 | | | | 14,605 | |
| | |
Lincoln National Corp. 3.35%, 3/9/2025 | | | 3,000 | | | | 2,939 | |
| | |
Manulife Financial Corp. (Canada) 4.15%, 3/4/2026 | | | 10,000 | | | | 10,293 | |
| | |
MetLife, Inc. 3.60%, 11/13/2025 | | | 20,000 | | | | 20,195 | |
| | |
New York Life Global Funding 3.00%, 1/10/2028 (a) | | | 10,000 | | | | 9,656 | |
| | |
Progressive Corp. (The) 4.35%, 4/25/2044 | | | 3,000 | | | | 3,065 | |
| | |
Prudential Financial, Inc. 3.88%, 3/27/2028 | | | 8,000 | | | | 8,177 | |
| | |
Travelers Cos., Inc. (The) 5.35%, 11/1/2040 | | | 5,000 | | | | 5,834 | |
| | | | | | | | |
| | |
| | | | | | | 104,632 | |
| | | | | | | | |
|
Interactive Media & Services — 0.0%(d) | |
| | |
Rackspace Hosting, Inc. 8.63%, 11/15/2024 (a) | | | 5,000 | | | | 4,375 | |
| | | | | | | | |
|
Internet & Direct Marketing Retail — 0.2% | |
| | |
Amazon.com, Inc. 3.15%, 8/22/2027 | | | 46,000 | | | | 45,334 | |
| | | | | | | | |
| | |
IT Services — 0.1% | | | | | | | | |
| | |
Alliance Data Systems Corp. 5.38%, 8/1/2022 (a) | | | 15,000 | | | | 15,225 | |
| | |
Banff Merger Sub, Inc. 9.75%, 9/1/2026 (a) | | | 5,000 | | | | 4,844 | |
| | | | | | | | |
| | |
| | | | | | | 20,069 | |
| | | | | | | | |
| | |
Machinery — 0.2% | | | | | | | | |
| | |
ATS Automation Tooling Systems, Inc. (Canada) 6.50%, 6/15/2023 (a) | | | 15,000 | | | | 15,492 | |
| | |
Colfax Corp. 6.00%, 2/15/2024 (a) | | | 5,000 | | | | 5,175 | |
| | |
Illinois Tool Works, Inc. 4.88%, 9/15/2041 | | | 5,000 | | | | 5,618 | |
| | |
Parker-Hannifin Corp. 3.25%, 3/1/2027 | | | 24,000 | | | | 23,226 | |
| | |
Tennant Co. 5.63%, 5/1/2025 | | | 10,000 | | | | 9,937 | |
| | | | | | | | |
| | |
| | | | | | | 59,448 | |
| | | | | | | | |
| | |
Media — 1.2% | | | | | | | | |
| | |
AMC Networks, Inc. 5.00%, 4/1/2024 | | | 12,000 | | | | 11,906 | |
| | |
Charter Communications Operating LLC 4.91%, 7/23/2025 | | | 45,000 | | | | 46,616 | |
| | |
Clear Channel Worldwide Holdings, Inc. 9.25%, 2/15/2024 (a) | | | 5,000 | | | | 5,244 | |
| | |
Comcast Corp. | | | | | | | | |
| | |
3.38%, 8/15/2025 | | | 20,000 | | | | 19,954 | |
SEE NOTES TO FINANCIAL STATEMENTS.
| | | | | | |
| | | |
| 26 | | | | J.P. MORGAN EXCHANGE-TRADED FUNDS | | FEBRUARY 28, 2019 |
| | | | | | | | |
| INVESTMENTS | | PRINCIPAL
AMOUNT ($) | | | VALUE ($) | |
Corporate Bonds — continued | |
| | |
Media — continued | | | | | | | | |
| | |
2.35%, 1/15/2027 | | | 40,000 | | | | 36,611 | |
| | |
3.90%, 3/1/2038 | | | 20,000 | | | | 18,915 | |
| | |
4.75%, 3/1/2044 | | | 39,000 | | | | 40,486 | |
| | |
3.40%, 7/15/2046 | | | 15,000 | | | | 12,627 | |
| | |
DISH DBS Corp. | | | | | | | | |
| | |
6.75%, 6/1/2021 | | | 20,000 | | | | 20,450 | |
| | |
7.75%, 7/1/2026 | | | 5,000 | | | | 4,325 | |
| | |
Lamar Media Corp. 5.75%, 2/1/2026 | | | 24,000 | | | | 25,110 | |
| | |
Sirius XM Radio, Inc. 5.38%, 7/15/2026 (a) | | | 20,000 | | | | 20,050 | |
| | |
TEGNA, Inc. 6.38%, 10/15/2023 | | | 19,000 | | | | 19,570 | |
| | |
Videotron Ltd. (Canada) 5.38%, 6/15/2024 (a) | | | 12,000 | | | | 12,483 | |
| | | | | | | | |
| | |
| | | | | | | 294,347 | |
| | | | | | | | |
| | |
Metals & Mining — 0.4% | | | | | | | | |
| | |
Commercial Metals Co. 4.88%, 5/15/2023 | | | 18,000 | | | | 17,640 | |
| | |
Freeport-McMoRan, Inc. | | | | | | | | |
| | |
3.88%, 3/15/2023 | | | 31,000 | | | | 30,550 | |
| | |
5.45%, 3/15/2043 | | | 15,000 | | | | 13,162 | |
| | |
Rio Tinto Finance USA Ltd. (Australia) 7.13%, 7/15/2028 | | | 9,000 | | | | 11,428 | |
| | |
Steel Dynamics, Inc. 4.13%, 9/15/2025 | | | 13,000 | | | | 12,641 | |
| | |
Teck Resources Ltd. (Canada) 6.13%, 10/1/2035 | | | 22,000 | | | | 23,176 | |
| | | | | | | | |
| | |
| | | | | | | 108,597 | |
| | | | | | | | |
| | |
Multiline Retail — 0.0% (d) | | | | | | | | |
| | |
Neiman Marcus Group Ltd. LLC 8.00%, 10/15/2021 (a) | | | 20,000 | | | | 10,400 | |
| | | | | | | | |
| | |
Multi-Utilities — 0.2% | | | | | | | | |
| | |
Berkshire Hathaway Energy Co. | | | | | | | | |
| | |
3.25%, 4/15/2028 | | | 12,000 | | | | 11,637 | |
| | |
5.15%, 11/15/2043 | | | 12,000 | | | | 13,259 | |
| | |
3.80%, 7/15/2048 | | | 15,000 | | | | 13,684 | |
| | | | | | | | |
| | |
| | | | | | | 38,580 | |
| | | | | | | | |
| | |
Oil, Gas & Consumable Fuels —2.6% | | | | | | | | |
| | |
Antero Resources Corp. 5.13%, 12/1/2022 | | | 20,000 | | | | 20,032 | |
| | |
BP Capital Markets America, Inc. | | | | | | | | |
| | |
3.02%, 1/16/2027 | | | 13,000 | | | | 12,502 | |
| | |
4.23%, 11/6/2028 | | | 30,000 | | | | 31,539 | |
| | |
BP Capital Markets plc (United Kingdom) | | | | | | | | |
| | |
3.81%, 2/10/2024 | | | 33,000 | | | | 33,868 | |
| | |
3.51%, 3/17/2025 | | | 45,000 | | | | 45,348 | |
| | |
California Resources Corp. 8.00%, 12/15/2022 (a) | | | 5,000 | | | | 3,994 | |
| | | | | | | | |
| INVESTMENTS | | PRINCIPAL
AMOUNT ($) | | | VALUE ($) | |
| | | | | | | | |
|
Oil, Gas & Consumable Fuels — continued | |
| | |
Cheniere Corpus Christi Holdings LLC 5.88%, 3/31/2025 | | | 24,000 | | | | 25,560 | |
| | |
Cheniere Energy Partners LP 5.25%, 10/1/2025 | | | 12,000 | | | | 12,150 | |
| | |
DCP Midstream Operating LP 5.38%, 7/15/2025 | | | 20,000 | | | | 20,800 | |
| | |
Diamondback Energy, Inc. 4.75%, 11/1/2024 (a) | | | 12,000 | | | | 12,135 | |
| | |
Energy Transfer LP 5.88%, 1/15/2024 | | | 21,000 | | | | 22,523 | |
| | |
EnLink Midstream Partners LP | | | | | | | | |
| | |
4.40%, 4/1/2024 | | | 8,000 | | | | 7,770 | |
| | |
5.60%, 4/1/2044 | | | 9,000 | | | | 7,943 | |
| | |
EP Energy LLC | | | | | | | | |
| | |
9.38%, 5/1/2024 (a) | | | 10,000 | | | | 4,675 | |
| | |
7.75%, 5/15/2026 (a) | | | 5,000 | | | | 4,431 | |
| | |
Hilcorp Energy I LP 5.00%, 12/1/2024 (a) | | | 16,000 | | | | 15,360 | |
| | |
Murphy Oil Corp. 4.45%, 12/1/2022 (c) | | | 13,000 | | | | 12,936 | |
| | |
Newfield Exploration Co. 5.38%, 1/1/2026 | | | 15,000 | | | | 15,825 | |
| | |
NGPL PipeCo LLC 4.38%, 8/15/2022 (a) | | | 12,000 | | | | 12,120 | |
| | |
Occidental Petroleum Corp. | | | | | | | | |
| | |
2.60%, 4/15/2022 | | | 22,000 | | | | 21,710 | |
| | |
4.40%, 4/15/2046 | | | 21,000 | | | | 21,502 | |
| | |
Peabody Energy Corp. 6.00%, 3/31/2022 (a) | | | 12,000 | | | | 12,105 | |
| | |
QEP Resources, Inc. 5.63%, 3/1/2026 | | | 13,000 | | | | 12,188 | |
| | |
Range Resources Corp. 5.00%, 8/15/2022 | | | 13,000 | | | | 12,821 | |
| | |
SM Energy Co. 6.13%, 11/15/2022 | | | 13,000 | | | | 12,935 | |
| | |
Southwestern Energy Co. 7.50%, 4/1/2026 | | | 12,000 | | | | 12,480 | |
| | |
Sunoco Logistics Partners Operations LP 5.35%, 5/15/2045 | | | 20,000 | | | | 18,862 | |
| | |
Sunoco LP 5.50%, 2/15/2026 | | | 12,000 | | | | 11,920 | |
| | |
Tallgrass Energy Partners LP 5.50%, 9/15/2024 (a) | | | 12,000 | | | | 12,259 | |
| | |
Targa Resources Partners LP 5.13%, 2/1/2025 | | | 25,000 | | | | 25,125 | |
| | |
Total Capital International SA (France) | | | | | | | | |
| | |
3.70%, 1/15/2024 | | | 55,000 | | | | 56,356 | |
| | |
3.46%, 2/19/2029 | | | 15,000 | | | | 14,962 | |
| | |
TransCanada PipeLines Ltd. (Canada) | | | | | | | | |
| | |
3.75%, 10/16/2023 | | | 21,000 | | | | 21,367 | |
| | |
4.25%, 5/15/2028 | | | 35,000 | | | | 35,739 | |
| | |
5.10%, 3/15/2049 | | | 11,000 | | | | 11,398 | |
| | |
Ultra Resources, Inc. 9.00%, 7/12/2024 | | | 25,000 | | | | 16,125 | |
| | | | | | | | |
| | |
| | | | | | | 651,365 | |
| | | | | | | | |
SEE NOTES TO FINANCIAL STATEMENTS.
| | | | | | | | |
| | | |
| FEBRUARY 28, 2019 | | J.P. MORGAN EXCHANGE-TRADED FUNDS | | | | | 27 | |
JPMorgan Core Plus Bond ETF
SCHEDULE OF PORTFOLIO INVESTMENTS
AS OF FEBRUARY 28, 2019 (continued)
| | | | | | | | |
| INVESTMENTS | | PRINCIPAL
AMOUNT ($) | | | VALUE ($) | |
Corporate Bonds — continued | |
| | |
Paper & Forest Products — 0.0%(d) | | | | | | | | |
| | |
Clearwater Paper Corp. 4.50%, 2/1/2023 | | | 8,000 | | | | 7,600 | |
| | | | | | | | |
| | |
Pharmaceuticals — 0.9% | | | | | | | | |
| | |
Advanz Pharma Corp. (Canada) 8.00%, 9/6/2024 | | | 11,000 | | | | 10,477 | |
| | |
Bausch Health Cos., Inc. 7.00%, 3/15/2024 (a) | | | 35,000 | | | | 36,881 | |
| | |
Eli Lilly & Co. | | | | | | | | |
| | |
2.75%, 6/1/2025 | | | 45,000 | | | | 44,046 | |
| | |
3.38%, 3/15/2029 | | | 5,000 | | | | 5,000 | |
| | |
3.88%, 3/15/2039 | | | 5,000 | | | | 4,924 | |
| | |
3.95%, 3/15/2049 | | | 10,000 | | | | 9,797 | |
| | |
4.15%, 3/15/2059 | | | 10,000 | | | | 9,764 | |
| | |
GlaxoSmithKline Capital, Inc. (United Kingdom) 3.88%, 5/15/2028 | | | 30,000 | | | | 30,828 | |
| | |
Novartis Capital Corp. (Switzerland) 4.00%, 11/20/2045 | | | 22,000 | | | | 22,196 | |
| | |
Pfizer, Inc. 3.60%, 9/15/2028 | | | 45,000 | | | | 45,788 | |
| | | | | | | | |
| | |
| | | | | | | 219,701 | |
| | | | | | | | |
| | |
Road & Rail — 0.6% | | | | | | | | |
| | |
Avis Budget Car Rental LLC 5.25%, 3/15/2025 (a) | | | 11,000 | | | | 10,450 | |
| | |
Avolon Holdings Funding Ltd. (Ireland) 5.50%, 1/15/2023 (a) | | | 35,000 | | | | 35,882 | |
| | |
Burlington Northern Santa Fe LLC 4.70%, 9/1/2045 | | | 15,000 | | | | 16,168 | |
| | |
DAE Funding LLC (United Arab Emirates) 5.75%, 11/15/2023 (a) | | | 15,000 | | | | 15,289 | |
| | |
Norfolk Southern Corp. 2.90%, 2/15/2023 | | | 70,000 | | | | 69,246 | |
| | | | | | | | |
| | |
| | | | | | | 147,035 | |
| | | | | | | | |
|
Semiconductors & Semiconductor Equipment — 0.2% | |
| | |
Intel Corp. | | | | | | | | |
| | |
2.60%, 5/19/2026 | | | 35,000 | | | | 33,534 | |
| | |
3.73%, 12/8/2047 | | | 11,000 | | | | 10,563 | |
| | | | | | | | |
| | |
| | | | | | | 44,097 | |
| | | | | | | | |
| | |
Software — 1.0% | | | | | | | | |
| | |
Microsoft Corp. | | | | | | | | |
| | |
2.70%, 2/12/2025 | | | 58,000 | | | | 57,049 | |
| | |
3.50%, 2/12/2035 | | | 20,000 | | | | 19,560 | |
| | |
4.75%, 11/3/2055 | | | 19,000 | | | | 21,502 | |
| | |
Nuance Communications, Inc. 5.63%, 12/15/2026 | | | 13,000 | | | | 13,260 | |
| | |
Open Text Corp. (Canada) 5.88%, 6/1/2026 (a) | | | 14,000 | | | | 14,729 | |
| | |
Oracle Corp. | | | | | | | | |
| | |
2.65%, 7/15/2026 | | | 101,000 | | | | 95,909 | |
| | | | | | | | |
| INVESTMENTS | | PRINCIPAL
AMOUNT ($) | | | VALUE ($) | |
| | | | | | | | |
| | |
Software — continued | | | | | | | | |
| | |
4.00%, 7/15/2046 | | | 15,000 | | | | 14,374 | |
| | |
4.38%, 5/15/2055 | | | 11,000 | | | | 10,967 | |
| | |
Symantec Corp. 5.00%, 4/15/2025 (a) | | | 15,000 | | | | 14,943 | |
| | | | | | | | |
| | |
| | | | | | | 262,293 | |
| | | | | | | | |
| | |
Specialty Retail —0.3% | | | | | | | | |
| | |
Group 1 Automotive, Inc. 5.25%, 12/15/2023 (a) | | | 13,000 | | | | 12,968 | |
| | |
Home Depot, Inc. (The) | | | | | | | | |
| | |
3.90%, 12/6/2028 | | | 22,000 | | | | 22,797 | |
| | |
5.95%, 4/1/2041 | | | 20,000 | | | | 24,756 | |
| | |
L Brands, Inc. 5.63%, 10/15/2023 | | | 10,000 | | | | 9,925 | |
| | |
PetSmart, Inc. | | | | | | | | |
| | |
5.88%, 6/1/2025 (a) | | | 7,000 | | | | 5,565 | |
| | |
8.88%, 6/1/2025 (a) | | | 5,000 | | | | 3,375 | |
| | |
Staples, Inc. 8.50%, 9/15/2025 (a) | | | 5,000 | | | | 4,900 | |
| | | | | | | | |
| | |
| | | | | | | 84,286 | |
| | | | | | | | |
|
Technology Hardware, Storage & Peripherals — 0.7% | |
| | |
Apple, Inc. | | | | | | | | |
| | |
2.75%, 1/13/2025 | | | 59,000 | | | | 57,918 | |
| | |
3.35%, 2/9/2027 | | | 35,000 | | | | 34,989 | |
| | |
4.38%, 5/13/2045 | | | 22,000 | | | | 22,852 | |
| | |
EMC Corp. 3.38%, 6/1/2023 | | | 37,000 | | | | 35,530 | |
| | |
Western Digital Corp. 4.75%, 2/15/2026 | | | 16,000 | | | | 15,120 | |
| | |
Xerox Corp. 3.62%, 3/15/2023 (c) | | | 13,000 | | | | 12,756 | |
| | | | | | | | |
| | |
| | | | | | | 179,165 | |
| | | | | | | | |
|
Textiles, Apparel & Luxury Goods — 0.1% | |
| | |
Hanesbrands, Inc. 4.63%, 5/15/2024 (a) | | | 13,000 | | | | 12,986 | |
| | | | | | | | |
| | |
Thrifts & Mortgage Finance — 0.1% | | | | | | | | |
| | |
Ladder Capital Finance Holdings LLLP 5.25%, 10/1/2025 (a) | | | 13,000 | | | | 12,220 | |
| | |
Quicken Loans, Inc. 5.75%, 5/1/2025 (a) | | | 20,000 | | | | 19,740 | |
| | | | | | | | |
| | |
| | | | | | | 31,960 | |
| | | | | | | | |
| | |
Tobacco — 0.3% | | | | | | | | |
| | |
BAT Capital Corp. (United Kingdom) 3.56%, 8/15/2027 | | | 40,000 | | | | 36,556 | |
| | |
Philip Morris International, Inc. | | | | | | | | |
| | |
2.75%, 2/25/2026 | | | 40,000 | | | | 37,628 | |
| | |
3.13%, 3/2/2028 | | | 12,000 | | | | 11,391 | |
| | | | | | | | |
| | |
| | | | | | | 85,575 | |
| | | | | | | | |
|
Trading Companies & Distributors — 0.3% | |
| | |
Ahern Rentals, Inc. 7.38%, 5/15/2023 (a) | | | 5,000 | | | | 4,612 | |
| | |
United Rentals North America, Inc. 4.63%, 10/15/2025 | | | 52,000 | | | | 50,570 | |
SEE NOTES TO FINANCIAL STATEMENTS.
| | | | | | |
| | | |
| 28 | | | | J.P. MORGAN EXCHANGE-TRADED FUNDS | | FEBRUARY 28, 2019 |
| | | | | | | | |
| INVESTMENTS | | PRINCIPAL
AMOUNT ($) | | | VALUE ($) | |
Corporate Bonds — continued | |
|
Trading Companies & Distributors — continued | |
| | |
WESCO Distribution, Inc. 5.38%, 6/15/2024 | | | 13,000 | | | | 13,033 | |
| | | | | | | | |
| | |
| | | | | | | 68,215 | |
| | | | | | | | |
|
Wireless Telecommunication Services — 0.4% | |
| | |
Intelsat Connect Finance SA (Luxembourg) 9.50%, 2/15/2023 (a) | | | 10,000 | | | | 9,675 | |
| | |
Sprint Corp. 7.13%, 6/15/2024 | | | 29,000 | | | | 29,964 | |
| | |
T-Mobile USA, Inc. 5.13%, 4/15/2025 | | | 50,000 | | | | 51,265 | |
| | | | | | | | |
| | |
| | | | | | | 90,904 | |
| | | | | | | | |
| |
Total Corporate Bonds
(Cost $7,126,775) | | | | 7,194,322 | |
| | | | | | | | |
Mortgage-Backed Securities — 20.2% | |
| | |
FNMA, 30 Year, Single Family | | | | | | | | |
| | |
Pool # BN5013, 5.00%, 1/1/2049 | | | 223,670 | | | | 239,898 | |
| | |
TBA, 4.50%, 3/25/2049 (e) | | | 4,000,000 | | | | 4,138,375 | |
| | |
FNMA, Other | | | | | | | | |
| | |
Pool # AN3099, 2.53%, 10/1/2024 | | | 96,573 | | | | 94,536 | |
| | |
Pool # AN9917, 3.80%, 7/1/2028 | | | 350,000 | | | | 363,481 | |
| | |
GNMA II, 30 Year, Single Family Pool # AJ9020, 4.50%, 10/20/2044 | | | 243,192 | | | | 249,756 | |
| | | | | | | | |
| |
Total Mortgage-Backed Securities
(Cost $5,082,702) | | | | 5,086,046 | |
| | | | | | | | |
U.S. Treasury Obligations — 16.5% | |
| | |
U.S. Treasury Notes | | | | | | | | |
| | |
2.63%, 12/31/2023 | | | 1,600,000 | | | | 1,606,625 | |
| | |
2.63%, 12/31/2025 | | | 1,000,000 | | | | 1,000,586 | |
| | |
U.S. Treasury STRIPS Bonds | | | | | | | | |
| | |
3.00%, 11/15/2039 (f) | | | 1,600,000 | | | | 863,246 | |
| | |
3.13%, 8/15/2048 (f) | | | 1,700,000 | | | | 678,827 | |
| | | | | | | | |
| |
Total U.S. Treasury Obligations
(Cost $4,149,642) | | | | 4,149,284 | |
| | | | | | | | |
Asset-Backed Securities — 16.1% | |
| | |
American Credit Acceptance Receivables Trust | | | | | | | | |
| | |
Series 2017-1, Class C, 2.88%, 3/13/2023 (a) | | | 64,683 | | | | 64,684 | |
| | |
Series 2018-2, Class C, 3.70%, 7/10/2024 (a) | | | 167,000 | | | | 167,416 | |
| | |
American Homes 4 RentSeries 2015-SFR1, Class E, 5.64%, 4/17/2052 (a) | | | 350,000 | | | | 373,829 | |
| | |
American Homes 4 Rent TrustSeries 2015-SFR2, Class A, 3.73%, 10/17/2052 (a) | | | 97,163 | | | | 98,394 | |
| | |
AmeriCredit Automobile Receivables Trust Series 2017-2, Class D, 3.42%, 4/18/2023 | | | 250,000 | | | | 249,897 | |
| | |
B2R Mortgage Trust Series 2015-1, Class A1, 2.52%, 5/15/2048 (a) | | | 65,034 | | | | 64,534 | |
| | | | | | | | |
| INVESTMENTS | | PRINCIPAL
AMOUNT ($) | | | VALUE ($) | |
| | | | | | | | |
| | |
CPS Auto Receivables Trust Series 2017-C, Class D, 3.79%, 6/15/2023 (a) | | | 100,000 | | | | 100,376 | |
| | |
Credit Acceptance Auto Loan Trust Series 2017-3A, Class C, 3.48%, 10/15/2026 (a) | | | 250,000 | | | | 248,707 | |
| | |
Delta Air Lines Pass-Through Trust Series 2007-1, Class A, 6.82%, 8/10/2022 | | | 855 | | | | 929 | |
| | |
DT Auto Owner Trust | | | | | | | | |
| | |
Series 2017-3A, Class D, 3.58%, 5/15/2023 (a) | | | 99,000 | | | | 99,049 | |
| | |
Series 2019-1A, Class D, 3.87%, 11/15/2024 (a) | | | 200,000 | | | | 200,345 | |
| | |
First Investors Auto Owner Trust | | | | | | | | |
| | |
Series 2015-1A, Class D, 3.59%, 1/18/2022 (a) | | | 100,000 | | | | 100,100 | |
| | |
Series 2016-2A, Class D, 3.35%, 11/15/2022 (a) | | | 90,000 | | | | 89,585 | |
| | |
Series 2017-1A, Class D, 3.60%, 4/17/2023 (a) | | | 81,000 | | | | 80,964 | |
| | |
Flagship Credit Auto Trust | | | | | | | | |
| | |
Series 2017-2, Class C, 2.96%, 7/15/2023 (a) | | | 85,000 | | | | 84,432 | |
| | |
Series 2019-1, Class D, 4.08%, 2/18/2025 (a) | | | 208,000 | | | | 208,837 | |
| | |
Genesis Sales Finance Master Trust Series 2019-AA, Class A, 4.68%, 8/20/2023 (a) | | | 250,000 | | | | 251,647 | |
| | |
GLS Auto Receivables Issuer Trust | | | | | | | | |
| | |
Series 2019-1A, Class A, 3.37%, 1/17/2023 (a) | | | 175,000 | | | | 175,094 | |
| | |
Series 2019-1A, Class C, 3.87%, 12/16/2024 (a) | | | 295,000 | | | | 295,764 | |
| | |
Lendmark Funding TrustSeries 2017-2A, Class A, 2.80%, 5/20/2026 (a) | | | 280,000 | | | | 277,578 | |
| | |
Prestige Auto Receivables Trust Series 2018-1A, Class D, 4.14%, 10/15/2024 (a) | | | 115,000 | | | | 116,692 | |
| | |
Progress Residential Trust | | | | | | | | |
| | |
Series 2017-SFR1, Class A, 2.77%, 8/17/2034 (a) | | | 99,680 | | | | 97,613 | |
| | |
Series 2017-SFR1, Class D, 3.57%, 8/17/2034 (a) | | | 150,000 | | | | 147,352 | |
| | |
Regional Management Issuance Trust Series 2018-1, Class A, 3.83%, 7/15/2027 (a) | | | 200,000 | | | | 198,939 | |
| | |
Santander Drive Auto Receivables Trust Series 2019-1, Class C, 3.42%, 4/15/2025 | | | 90,000 | | | | 90,110 | |
| | |
Springleaf Funding TrustSeries 2015-AA, Class B, 3.62%, 11/15/2024 (a) | | | 135,000 | | | | 135,125 | |
SEE NOTES TO FINANCIAL STATEMENTS.
| | | | | | | | |
| | | |
| FEBRUARY 28, 2019 | | J.P. MORGAN EXCHANGE-TRADED FUNDS | | | | | 29 | |
JPMorgan Core Plus Bond ETF
SCHEDULE OF PORTFOLIO INVESTMENTS
AS OF FEBRUARY 28, 2019 (continued)
| | | | | | | | |
| INVESTMENTS | | PRINCIPAL
AMOUNT ($) | | | VALUE ($) | |
Asset-Backed Securities — continued | |
| | |
US Airways Pass-Through TrustSeries 2011-1, Class A, 7.13%, 10/22/2023 | | | 21,163 | | | | 23,244 | |
| | | | | | | | |
| |
Total Asset-Backed Securities
(Cost $4,024,766) | | | | 4,041,236 | |
| | | | | | | | |
Collateralized Mortgage Obligations — 8.0% | |
| | |
FHLMC REMIC Series 4281, Class BC, 4.50%, 12/15/2043 (g) | | | 273,793 | | | | 285,711 | |
| | |
FNMA REMIC | | | | | | | | |
| | |
Series 2003-7, Class FA, 3.24%, 2/25/2033 (g) | | | 212,064 | | | | 212,655 | |
| | |
Series 2013-108, Class GU, 3.00%, 10/25/2033 | | | 545,000 | | | | 528,256 | |
| | |
Series 2005-110, Class TY, 5.50%, 12/25/2035 | | | 100,000 | | | | 110,462 | |
| | |
Series 2007-89, Class F, 3.07%, 9/25/2037 (g) | | | 225,597 | | | | 227,596 | |
| | |
GNMA | | | | | | | | |
| | |
Series 2010-H24, Class FA, 2.86%, 10/20/2060 (g) | | | 119,705 | | | | 119,320 | |
| | |
Series 2014-H03, Class FA, 3.11%, 1/20/2064 (g) | | | 152,662 | | | | 153,113 | |
| | |
Series 2015-H05, Class FC, 2.99%, 2/20/2065 (g) | | | 375,080 | | | | 375,257 | |
| | | | | | | | |
| |
Total Collateralized Mortgage Obligations
(Cost $2,005,264) | | | | 2,012,370 | |
| | | | | | | | |
Commercial Mortgage-Backed Securities — 2.6% | |
| | |
FHLMC Multifamily Structured Pass-Through Certificates Series KJ08, Class A2, 2.36%, 8/25/2022 | | | 80,329 | | | | 79,191 | |
| | | | | | | | |
| INVESTMENTS | | PRINCIPAL
AMOUNT ($) | | | VALUE ($) | |
| | | | | | | | |
| | |
FNMA ACES Series 2017-M3, Class A2, 2.49%, 12/25/2026 (g) | | | 100,000 | | | | 95,319 | |
| | |
FNMA Grantor Trust Series 2017-T1, Class A, 2.90%, 6/25/2027 | | | 249,687 | | | | 242,832 | |
| | |
FREMF Mortgage TrustSeries 2016-K52, Class B, 3.92%, 1/25/2049 (a) (g) | | | 250,000 | | | | 247,703 | |
| | | | | | | | |
| |
Total Commercial Mortgage-Backed Securities
(Cost $663,142) | | | | 665,045 | |
| | | | | | | | |
Convertible Bonds — 0.0% (d) | |
|
Media — 0.0% (d) | |
| | |
DISH Network Corp. 3.38%, 8/15/2026
(Cost $4,240) | | | 5,000 | | | | 4,295 | |
| | | | | | | | |
| | |
| | | SHARES | | | | |
Short-Term Investments — 24.1% | |
|
Investment Companies — 24.1% | |
| | |
JPMorgan U.S. Government Money Market Fund Class Institutional Shares 2.33% (h) (i)
(Cost $6,071,775) | | | 6,071,775 | | | | 6,071,775 | |
| | | | | | | | |
Total Investments — 116.1%
(Cost $29,128,306) | | | | 29,224,373 | |
Liabilities in Excess of Other
Assets — (16.1%) | | | | | | | (4,046,271) | |
| | | | | | | | |
NET ASSETS — 100.0% | | | | 25,178,102 | |
| | | | | | | | |
Percentages indicated are based on net assets.
| | |
| Abbreviations |
| ACES | | Alternative Credit Enhancement Securities |
| FHLMC | | Federal Home Loan Mortgage Corp. |
| FNMA | | Federal National Mortgage Association |
| GNMA | | Government National Mortgage Association |
| ICE | | Intercontinental Exchange |
| LIBOR | | London Interbank Offered Rate |
| MSCI | | Morgan Stanley Capital International |
| OYJ | | Public Limited Company |
| REMIC | | Real Estate Mortgage Investment Conduit |
| SCA | | Limited partnership with share capital |
| STRIPS | | Separate Trading of Registered Interest and Principal of Securities. The STRIPS Program lets investors hold and trade individual interest and principal components of eligible notes and bonds as separate securities. |
| TBA | | To Be Announced; Security is subject to delayed delivery |
| USD | | United States Dollar |
| |
| (a) | | Securities exempt from registration under Rule 144A or section 4(a)(2), of the Securities Act of 1933, as amended. |
| | |
| |
| (b) | | Variable or floating rate security, linked to the referenced benchmark. The interest rate shown is the current rate as of February 28, 2019. |
| (c) | | Step bond. Interest rate is a fixed rate for an initial period that either resets at a specific date or may reset in the future contingent upon a predetermined trigger. The interest rate shown is the current rate as of February 28, 2019. |
| (d) | | Amount rounds to less than 0.1% of net assets. |
| (e) | | All or a portion of the security is a when-issued security, delayed delivery security, or forward commitment. |
| (f) | | The rate shown is the effective yield as of February 28, 2019. |
| (g) | | Variable or floating rate security, the interest rate of which adjusts periodically based on changes in current interest rates and prepayments on the underlying pool of assets. The interest rate shown is the current rate as of February 28, 2019. |
| (h) | | Investment in affiliate. Fund is registered under the Investment Company Act of 1940, as amended, and advised by J.P. Morgan Investment Management Inc. |
| (i) | | The rate shown is the current yield as of February 28, 2019. |
SEE NOTES TO FINANCIAL STATEMENTS.
| | | | | | |
| | | |
| 30 | | | | J.P. MORGAN EXCHANGE-TRADED FUNDS | | FEBRUARY 28, 2019 |
| | | | | | | | | | | | | | | | | | | | |
| Futures contracts outstanding as of February 28, 2019: | |
| DESCRIPTION | | NUMBER OF
CONTRACTS | | | EXPIRATION
DATE | | | TRADING
CURRENCY | | | NOTIONAL
AMOUNT ($) | | | VALUE AND
UNREALIZED
APPRECIATION
(DEPRECIATION) ($) | |
Long Contracts | |
| U.S. Treasury 10 Year Ultra Note | | | 2 | | | | 06/2019 | | | | USD | | | | 258,812 | | | | (692 | ) |
| | | | | |
| U.S. Treasury 5 Year Note | | | 26 | | | | 06/2019 | | | | USD | | | | 2,978,016 | | | | (2,492 | ) |
| | | | | | | | | | | | | | | | | | | | |
| | | | | | | | | | | | | | | | | | | (3,184 | ) |
| | | | | | | | | | | | | | | | | | | | |
| | |
| Abbreviations |
| |
| USD | | United States Dollar |
SEE NOTES TO FINANCIAL STATEMENTS.
| | | | | | | | |
| | | |
| FEBRUARY 28, 2019 | | J.P. MORGAN EXCHANGE-TRADED FUNDS | | | | | 31 | |
JPMorgan Corporate Bond Research Enhanced ETF
SCHEDULE OF PORTFOLIO INVESTMENTS
AS OF FEBRUARY 28, 2019
| | | | | | | | |
| INVESTMENTS | | PRINCIPAL
AMOUNT ($) | | | VALUE ($) | |
Corporate Bonds — 96.7% | |
|
Aerospace & Defense — 2.2% | |
| | |
L3 Technologies, Inc. 4.40%, 6/15/2028 | | | 28,000 | | | | 28,746 | |
| | |
Lockheed Martin Corp. | | | | | | | | |
| | |
3.55%, 1/15/2026 | | | 34,000 | | | | 34,562 | |
| | |
4.09%, 9/15/2052 | | | 76,000 | | | | 73,467 | |
| | |
Northrop Grumman Corp. | | | | | | | | |
| | |
3.25%, 1/15/2028 | | | 22,000 | | | | 21,070 | |
| | |
4.03%, 10/15/2047 | | | 77,000 | | | | 72,070 | |
| | |
Precision Castparts Corp. 3.25%, 6/15/2025 | | | 24,000 | | | | 24,285 | |
| | |
Rockwell Collins, Inc. 3.50%, 3/15/2027 | | | 101,000 | | | | 97,632 | |
| | |
United Technologies Corp. | | | | | | | | |
| | |
3.10%, 6/1/2022 | | | 80,000 | | | | 79,758 | |
| | |
4.13%, 11/16/2028 | | | 30,000 | | | | 30,470 | |
| | |
4.45%, 11/16/2038 | | | 40,000 | | | | 39,735 | |
| | |
4.50%, 6/1/2042 | | | 20,000 | | | | 19,767 | |
| | |
4.63%, 11/16/2048 | | | 50,000 | | | | 50,464 | |
| | | | | | | | |
| | |
| | | | | | | 572,026 | |
| | | | | | | | |
| | |
Automobiles — 0.6% | | | | | | | | |
| | |
Ford Motor Co. 4.75%, 1/15/2043 | | | 16,000 | | | | 12,247 | |
| | |
General Motors Co. | | | | | | | | |
| | |
4.88%, 10/2/2023 | | | 113,000 | | | | 116,606 | |
| | |
5.00%, 10/1/2028 | | | 26,000 | | | | 25,461 | |
| | | | | | | | |
| | |
| | | | | | | 154,314 | |
| | | | | | | | |
| | |
Banks — 16.8% | | | | | | | | |
| | |
Bank of America Corp. | | | | | | | | |
| | |
(ICE LIBOR USD 3 Month + 0.66%), 2.37%, 7/21/2021 (a) | | | 440,000 | | | | 435,615 | |
| | |
(ICE LIBOR USD 3 Month + 0.79%), 3.00%, 12/20/2023 (a) | | | 181,000 | | | | 178,647 | |
| | |
(ICE LIBOR USD 3 Month + 1.58%), 3.82%, 1/20/2028 (a) | | | 110,000 | | | | 109,500 | |
| | |
(ICE LIBOR USD 3 Month + 1.04%), 3.42%, 12/20/2028 (a) | | | 110,000 | | | | 106,129 | |
| | |
(ICE LIBOR USD 3 Month + 1.81%), 4.24%, 4/24/2038 (a) | | | 110,000 | | | | 109,641 | |
| | |
Bank of Nova Scotia (The) (Canada) | | | | | | | | |
| | |
2.45%, 3/22/2021 | | | 86,000 | | | | 85,205 | |
| | |
2.70%, 3/7/2022 | | | 80,000 | | | | 79,194 | |
| | |
Citigroup, Inc. | | | | | | | | |
| | |
2.65%, 10/26/2020 | | | 140,000 | | | | 139,059 | |
| | |
2.90%, 12/8/2021 | | | 50,000 | | | | 49,731 | |
| | |
(ICE LIBOR USD 3 Month + 0.95%), 2.88%, 7/24/2023 (a) | | | 225,000 | | | | 221,585 | |
| | |
3.20%, 10/21/2026 | | | 225,000 | | | | 215,544 | |
| | | | | | | | |
| INVESTMENTS | | PRINCIPAL
AMOUNT ($) | | | VALUE ($) | |
| | | | | | | | |
| | |
Banks — continued | | | | | | | | |
| | |
(ICE LIBOR USD 3 Month + 1.39%), 3.67%, 7/24/2028 (a) | | | 58,000 | | | | 56,803 | |
| | |
(ICE LIBOR USD 3 Month + 1.17%), 3.88%, 1/24/2039 (a) | | | 20,000 | | | | 19,037 | |
| | |
4.65%, 7/23/2048 | | | 50,000 | | | | 52,099 | |
| | |
Citizens Financial Group, Inc. 4.30%, 12/3/2025 | | | 34,000 | | | | 34,288 | |
| | |
Cooperatieve Rabobank UA (Netherlands) | | | | | | | | |
| | |
4.50%, 1/11/2021 | | | 28,000 | | | | 28,798 | |
| | |
3.88%, 2/8/2022 | | | 59,000 | | | | 60,261 | |
| | |
5.25%, 5/24/2041 | | | 30,000 | | | | 34,765 | |
| | |
HSBC Holdings plc (United Kingdom) | | | | | | | | |
| | |
5.10%, 4/5/2021 | | | 110,000 | | | | 114,573 | |
| | |
4.00%, 3/30/2022 | | | 31,000 | | | | 31,778 | |
| | |
HSBC USA, Inc. 2.35%, 3/5/2020 | | | 101,000 | | | | 100,431 | |
| | |
Huntington Bancshares, Inc. 2.30%, 1/14/2022 | | | 180,000 | | | | 175,674 | |
| | |
Mitsubishi UFJ Financial Group, Inc. (Japan) | | | | | | | | |
| | |
3.76%, 7/26/2023 | | | 66,000 | | | | 66,960 | |
| | |
3.68%, 2/22/2027 | | | 31,000 | | | | 30,992 | |
| | |
3.96%, 3/2/2028 | | | 39,000 | | | | 39,852 | |
| | |
PNC Financial Services Group, Inc. (The) | | | | | | | | |
| | |
3.90%, 4/29/2024 | | | 13,000 | | | | 13,221 | |
| | |
3.15%, 5/19/2027 | | | 23,000 | | | | 22,348 | |
| | |
Regions Financial Corp. 3.20%, 2/8/2021 | | | 59,000 | | | | 59,077 | |
| | |
Royal Bank of Scotland Group plc (United Kingdom) | | | | | | | | |
| | |
6.13%, 12/15/2022 | | | 39,000 | | | | 41,145 | |
| | |
6.00%, 12/19/2023 | | | 35,000 | | | | 36,778 | |
| | |
5.13%, 5/28/2024 | | | 101,000 | | | | 102,376 | |
| | |
Sumitomo Mitsui Financial Group, Inc. (Japan) | | | | | | | | |
| | |
2.78%, 7/12/2022 | | | 80,000 | | | | 78,716 | |
| | |
2.63%, 7/14/2026 | | | 70,000 | | | | 65,615 | |
| | |
3.36%, 7/12/2027 | | | 59,000 | | | | 57,807 | |
| | |
SunTrust Bank 2.45%, 8/1/2022 | | | 40,000 | | | | 39,173 | |
| | |
Toronto-Dominion Bank (The) (Canada) | | | | | | | | |
| | |
2.50%, 12/14/2020 | | | 130,000 | | | | 129,109 | |
| | |
3.50%, 7/19/2023 | | | 60,000 | | | | 60,971 | |
| | |
US Bancorp | | | | | | | | |
| | |
Series V, 2.63%, 1/24/2022 | | | 46,000 | | | | 45,789 | |
| | |
Series V, 2.38%, 7/22/2026 | | | 42,000 | | | | 39,421 | |
| | |
Series X, 3.15%, 4/27/2027 | | | 39,000 | | | | 38,400 | |
| | |
Wells Fargo & Co. | | | | | | | | |
| | |
2.10%, 7/26/2021 | | | 100,000 | | | | 97,925 | |
| | |
2.63%, 7/22/2022 | | | 80,000 | | | | 78,467 | |
SEE NOTES TO FINANCIAL STATEMENTS.
| | | | | | |
| | | |
| 32 | | | | J.P. MORGAN EXCHANGE-TRADED FUNDS | | FEBRUARY 28, 2019 |
| | | | | | | | |
| INVESTMENTS | | PRINCIPAL
AMOUNT ($) | | | VALUE ($) | |
Corporate Bonds — continued | |
| | |
Banks — continued | | | | | | | | |
| | |
3.75%, 1/24/2024 | | | 40,000 | | | | 40,744 | |
| | |
3.00%, 10/23/2026 | | | 143,000 | | | | 136,351 | |
| | |
4.30%, 7/22/2027 | | | 70,000 | | | | 71,264 | |
| | |
(ICE LIBOR USD 3 Month + 1.31%), 3.58%, 5/22/2028 (a) | | | 101,000 | | | | 99,679 | |
| | |
3.90%, 5/1/2045 | | | 50,000 | | | | 47,950 | |
| | |
Westpac Banking Corp. (Australia) | | | | | | | | |
| | |
2.60%, 11/23/2020 | | | 107,000 | | | | 106,366 | |
| | |
2.75%, 1/11/2023 | | | 70,000 | | | | 68,666 | |
| | |
2.85%, 5/13/2026 | | | 167,000 | | | | 158,737 | |
| | | | | | | | |
| | |
| | | | | | | 4,312,256 | |
| | | | | | | | |
| | |
Beverages — 2.6% | | | | | | | | |
| | |
Anheuser-Busch Cos. LLC (Belgium) 4.90%, 2/1/2046 (b) | | | 104,000 | | | | 100,124 | |
| | |
Anheuser-Busch InBev Worldwide, Inc. (Belgium) | | | | | | | | |
| | |
4.00%, 4/13/2028 | | | 40,000 | | | | 39,726 | |
| | |
4.75%, 1/23/2029 | | | 30,000 | | | | 31,319 | |
| | |
4.90%, 1/23/2031 | | | 25,000 | | | | 26,175 | |
| | |
4.60%, 4/15/2048 | | | 97,000 | | | | 89,403 | |
| | |
5.55%, 1/23/2049 | | | 30,000 | | | | 31,509 | |
| | |
Keurig Dr Pepper, Inc. | | | | | | | | |
| | |
4.06%, 5/25/2023 (b) | | | 102,000 | | | | 103,109 | |
| | |
4.60%, 5/25/2028 (b) | | | 40,000 | | | | 40,437 | |
| | |
5.09%, 5/25/2048 (b) | | | 28,000 | | | | 27,212 | |
| | |
Molson Coors Brewing Co. | | | | | | | | |
| | |
3.00%, 7/15/2026 | | | 86,000 | | | | 78,909 | |
| | |
4.20%, 7/15/2046 | | | 20,000 | | | | 16,984 | |
| | |
PepsiCo, Inc. | | | | | | | | |
| | |
3.60%, 3/1/2024 | | | 19,000 | | | | 19,628 | |
| | |
3.00%, 10/15/2027 | | | 24,000 | | | | 23,379 | |
| | |
3.45%, 10/6/2046 | | | 50,000 | | | | 45,765 | |
| | | | | | | | |
| | |
| | | | | | | 673,679 | |
| | | | | | | | |
| | |
Biotechnology — 0.5% | | | | | | | | |
| | |
Gilead Sciences, Inc. | | | | | | | | |
| | |
3.65%, 3/1/2026 | | | 27,000 | | | | 26,837 | |
| | |
4.75%, 3/1/2046 | | | 33,000 | | | | 33,114 | |
| | |
4.15%, 3/1/2047 | | | 63,000 | | | | 57,726 | |
| | | | | | | | |
| | |
| | | | | | | 117,677 | |
| | | | | | | | |
| | |
Capital Markets — 8.3% | | | | | | | | |
| | |
Bank of New York Mellon Corp. (The) | | | | | | | | |
| | |
3.55%, 9/23/2021 | | | 99,000 | | | | 100,601 | |
| | |
2.20%, 8/16/2023 | | | 60,000 | | | | 57,602 | |
| | | | | | | | |
| INVESTMENTS | | PRINCIPAL
AMOUNT ($) | | | VALUE ($) | |
| | | | | | | | |
| | |
Capital Markets — continued | | | | | | | | |
| | |
(ICE LIBOR USD 3 Month + 1.07%), 3.44%, 2/7/2028 (a) | | | 112,000 | | | | 111,637 | |
| | |
CME Group, Inc. 3.00%, 3/15/2025 | | | 192,000 | | | | 189,210 | |
| | |
Credit Suisse Group AG (Switzerland) (ICE LIBOR USD 3 Month + 1.24%), 4.21%, 6/12/2024 (a) (b) | | | 250,000 | | | | 251,255 | |
| | |
Goldman Sachs Group, Inc. (The) | | | | | | | | |
| | |
2.35%, 11/15/2021 | | | 90,000 | | | | 88,130 | |
| | |
5.75%, 1/24/2022 | | | 191,000 | | | | 203,870 | |
| | |
4.00%, 3/3/2024 | | | 188,000 | | | | 190,904 | |
| | |
3.85%, 1/26/2027 | | | 73,000 | | | | 71,547 | |
| | |
(ICE LIBOR USD 3 Month + 1.30%), 4.22%, 5/1/2029 (a) | | | 63,000 | | | | 63,126 | |
| | |
(ICE LIBOR USD 3 Month + 1.37%), 4.02%, 10/31/2038 (a) | | | 138,000 | | | | 127,660 | |
| | |
Morgan Stanley | | | | | | | | |
| | |
2.63%, 11/17/2021 | | | 290,000 | | | | 286,054 | |
| | |
2.75%, 5/19/2022 | | | 182,000 | | | | 179,381 | |
| | |
3.63%, 1/20/2027 | | | 70,000 | | | | 68,641 | |
| | |
(ICE LIBOR USD 3 Month + 1.14%), 3.77%, 1/24/2029 (a) | | | 30,000 | | | | 29,527 | |
| | |
(ICE LIBOR USD 3 Month + 1.46%), 3.97%, 7/22/2038 (a) | | | 110,000 | | | | 104,511 | |
| | | | | | | | |
| | |
| | | | | | | 2,123,656 | |
| | | | | | | | |
| | |
Chemicals — 2.4% | | | | | | | | |
| | |
Dow Chemical Co. (The) | | | | | | | | |
| | |
3.50%, 10/1/2024 | | | 55,000 | | | | 54,249 | |
| | |
5.55%, 11/30/2048 (b) | | | 20,000 | | | | 21,046 | |
| | |
DowDuPont, Inc. | | | | | | | | |
| | |
4.21%, 11/15/2023 | | | 164,000 | | | | 169,233 | |
| | |
4.73%, 11/15/2028 | | | 110,000 | | | | 114,811 | |
| | |
5.42%, 11/15/2048 | | | 10,000 | | | | 10,708 | |
| | |
Eastman Chemical Co. 4.65%, 10/15/2044 | | | 21,000 | | | | 19,550 | |
| | |
Sherwin-Williams Co. (The) | | | | | | | | |
| | |
2.25%, 5/15/2020 | | | 138,000 | | | | 136,630 | |
| | |
2.75%, 6/1/2022 | | | 80,000 | | | | 78,588 | |
| | | | | | | | |
| | |
| | | | | | | 604,815 | |
| | | | | | | | |
| | |
Communications Equipment — 0.4% | | | | | | | | |
| | |
Cisco Systems, Inc. 2.50%, 9/20/2026 | | | 110,000 | | | | 104,512 | |
| | | | | | | | |
| | |
Consumer Finance — 3.5% | | | | | | | | |
| | |
AerCap Ireland Capital DAC (Ireland) 3.95%, 2/1/2022 | | | 150,000 | | | | 150,658 | |
| | |
American Express Co. 3.70%, 8/3/2023 | | | 60,000 | | | | 61,100 | |
| | |
American Express Credit Corp. | | | | | | | | |
| | |
2.20%, 3/3/2020 | | | 74,000 | | | | 73,532 | |
| | |
3.30%, 5/3/2027 | | | 40,000 | | | | 39,704 | |
SEE NOTES TO FINANCIAL STATEMENTS.
| | | | | | | | |
| | | |
| FEBRUARY 28, 2019 | | J.P. MORGAN EXCHANGE-TRADED FUNDS | | | | | 33 | |
JPMorgan Corporate Bond Research Enhanced ETF
SCHEDULE OF PORTFOLIO INVESTMENTS
AS OF FEBRUARY 28, 2019 (continued)
| | | | | | | | |
| INVESTMENTS | | PRINCIPAL
AMOUNT ($) | | | VALUE ($) | |
Corporate Bonds — continued | |
| | |
Consumer Finance — continued | | | | | | | | |
| | |
Capital One Financial Corp. | | | | | | | | |
| | |
2.50%, 5/12/2020 | | | 92,000 | | | | 91,380 | |
| | |
3.30%, 10/30/2024 | | | 67,000 | | | | 64,734 | |
| | |
3.80%, 1/31/2028 | | | 40,000 | | | | 38,441 | |
| | |
Discover Financial Services 4.10%, 2/9/2027 | | | 45,000 | | | | 43,793 | |
| | |
General Motors Financial Co., Inc. | | | | | | | | |
| | |
3.20%, 7/6/2021 | | | 154,000 | | | | 152,315 | |
| | |
4.35%, 1/17/2027 | | | 36,000 | | | | 34,157 | |
| | |
John Deere Capital Corp. | | | | | | | | |
| | |
2.80%, 3/6/2023 | | | 104,000 | | | | 103,655 | |
| | |
3.45%, 3/13/2025 | | | 30,000 | | | | 30,565 | |
| | | | | | | | |
| | |
| | | | | | | 884,034 | |
| | | | | | | | |
| | |
Containers & Packaging — 0.2% | | | | | | | | |
| | |
WRKCo, Inc. 4.65%, 3/15/2026 | | | 54,000 | | | | 55,546 | |
| | | | | | | | |
|
Diversified Financial Services — 0.9% | |
| | |
ORIX Corp. (Japan) 2.90%, 7/18/2022 | | | 10,000 | | | | 9,862 | |
| | |
Shell International Finance BV (Netherlands) | | | | | | | | |
| | |
3.25%, 5/11/2025 | | | 22,000 | | | | 22,063 | |
| | |
4.13%, 5/11/2035 | | | 150,000 | | | | 155,109 | |
| | |
4.38%, 5/11/2045 | | | 34,000 | | | | 35,743 | |
| | | | | | | | |
| | |
| | | | | | | 222,777 | |
| | | | | | | | |
|
Diversified Telecommunication Services — 3.0% | |
| | |
AT&T, Inc. | | | | | | | | |
| | |
2.45%, 6/30/2020 | | | 60,000 | | | | 59,574 | |
| | |
3.00%, 6/30/2022 | | | 59,000 | | | | 58,503 | |
| | |
3.40%, 5/15/2025 | | | 49,000 | | | | 47,738 | |
| | |
4.30%, 2/15/2030 | | | 56,000 | | | | 54,939 | |
| | |
5.25%, 3/1/2037 | | | 25,000 | | | | 25,242 | |
| | |
4.50%, 3/9/2048 | | | 170,000 | | | | 152,173 | |
| | |
Verizon Communications, Inc. | | | | | | | | |
| | |
3.38%, 2/15/2025 | | | 7,000 | | | | 6,998 | |
| | |
4.02%, 12/3/2029 | | | 40,000 | | | | 39,990 | |
| | |
4.33%, 9/21/2028 | | | 52,000 | | | | 53,809 | |
| | |
4.86%, 8/21/2046 | | | 160,000 | | | | 164,519 | |
| | |
5.01%, 8/21/2054 | | | 92,000 | | | | 94,507 | |
| | | | | | | | |
| | |
| | | | | | | 757,992 | |
| | | | | | | | |
|
Electric Utilities — 5.1% | |
| | |
Duke Energy Corp. | | | | | | | | |
| | |
3.75%, 4/15/2024 | | | 210,000 | | | | 213,331 | |
| | |
2.65%, 9/1/2026 | | | 40,000 | | | | 37,268 | |
| | |
3.75%, 9/1/2046 | | | 130,000 | | | | 116,481 | |
| | |
Emera US Finance LP (Canada) 4.75%, 6/15/2046 | | | 98,000 | | | | 96,135 | |
| | | | | | | | |
| INVESTMENTS | | PRINCIPAL
AMOUNT ($) | | | VALUE ($) | |
| | | | | | | | |
|
Electric Utilities — continued | |
| | |
Entergy Louisiana LLC 4.00%, 3/15/2033 | | | 143,000 | | | | 145,121 | |
| | |
Exelon Corp. | | | | | | | | |
| | |
3.95%, 6/15/2025 | | | 17,000 | | | | 17,142 | |
| | |
4.45%, 4/15/2046 | | | 114,000 | | | | 111,005 | |
| | |
FirstEnergy Corp. | | | | | | | | |
| | |
Series B, 3.90%, 7/15/2027 | | | 119,000 | | | | 117,816 | |
| | |
Series C, 4.85%, 7/15/2047 | | | 50,000 | | | | 51,600 | |
| | |
Florida Power & Light Co. 3.95%, 3/1/2048 | | | 60,000 | | | | 59,660 | |
| | |
Fortis, Inc. (Canada) 3.06%, 10/4/2026 | | | 100,000 | | | | 93,374 | |
| | |
Indiana Michigan Power Co. 4.25%, 8/15/2048 | | | 20,000 | | | | 19,838 | |
| | |
PacifiCorp 4.15%, 2/15/2050 | | | 15,000 | | | | 14,834 | |
| | |
Southern Co. (The) | | | | | | | | |
| | |
2.35%, 7/1/2021 | | | 44,000 | | | | 43,346 | |
| | |
3.25%, 7/1/2026 | | | 24,000 | | | | 22,880 | |
| | |
4.40%, 7/1/2046 | | | 54,000 | | | | 51,797 | |
| | |
Virginia Electric & Power Co. | | | | | | | | |
| | |
Series A, 3.15%, 1/15/2026 | | | 17,000 | | | | 16,708 | |
| | |
Series A, 3.50%, 3/15/2027 | | | 43,000 | | | | 42,796 | |
| | |
4.60%, 12/1/2048 | | | 30,000 | | | | 31,456 | |
| | | | | | | | |
| | |
| | | | | | | 1,302,588 | |
| | | | | | | | |
| | | | | | | | |
|
Electrical Equipment — 0.2% | |
| | |
Eaton Corp. 2.75%, 11/2/2022 | | | 53,000 | | | | 52,308 | |
| | | | | | | | |
|
Energy Equipment & Services — 0.9% | |
| | |
Baker Hughes a GE Co. LLC 4.08%, 12/15/2047 | | | 81,000 | | | | 71,561 | |
| | |
Schlumberger Finance Canada Ltd. 2.20%, 11/20/2020 (b) | | | 90,000 | | | | 88,605 | |
| | |
Schlumberger Holdings Corp. | | | | | | | | |
| | |
3.75%, 5/1/2024 (b) | | | 20,000 | | | | 20,075 | |
| | |
4.30%, 5/1/2029 (b) | | | 45,000 | | | | 45,544 | |
| | | | | | | | |
| | |
| | | | | | | 225,785 | |
| | | | | | | | |
|
Entertainment — 0.1% | |
| | |
Walt Disney Co. (The) 4.13%, 6/1/2044 | | | 30,000 | | | | 30,422 | |
| | | | | | | | |
|
Equity Real Estate Investment Trusts (REITs) — 3.0% | |
| | |
American Tower Corp. | | | | | | | | |
| | |
3.38%, 10/15/2026 | | | 110,000 | | | | 105,164 | |
| | |
3.55%, 7/15/2027 | | | 118,000 | | | | 113,172 | |
| | |
Boston Properties LP 4.50%, 12/1/2028 | | | 60,000 | | | | 62,211 | |
| | |
ERP Operating LP 4.50%, 7/1/2044 | | | 24,000 | | | | 24,787 | |
| | |
HCP, Inc. 3.88%, 8/15/2024 | | | 141,000 | | | | 141,469 | |
| | |
Simon Property Group LP 3.30%, 1/15/2026 | | | 80,000 | | | | 78,674 | |
SEE NOTES TO FINANCIAL STATEMENTS.
| | | | | | |
| | | |
| 34 | | | | J.P. MORGAN EXCHANGE-TRADED FUNDS | | FEBRUARY 28, 2019 |
| | | | | | | | |
| INVESTMENTS | | PRINCIPAL
AMOUNT ($) | | | VALUE ($) | |
Corporate Bonds — continued | |
|
Equity Real Estate Investment Trusts (REITs) — continued | |
| | |
Welltower, Inc. | | | | | | | | |
| | |
3.63%, 3/15/2024 | | | 110,000 | | | | 110,012 | |
| | |
4.00%, 6/1/2025 | | | 140,000 | | | | 141,221 | |
| | | | | | | | |
| | |
| | | | | | | 776,710 | |
| | | | | | | | |
|
Food & Staples Retailing — 0.9% | |
| | |
Kroger Co. (The) 4.45%, 2/1/2047 | | | 20,000 | | | | 17,671 | |
| | |
Sysco Corp. 3.30%, 7/15/2026 | | | 30,000 | | | | 28,995 | |
| | |
Walmart, Inc. | | | | | | | | |
| | |
3.40%, 6/26/2023 | | | 120,000 | | | | 122,238 | |
| | |
3.70%, 6/26/2028 | | | 25,000 | | | | 25,709 | |
| | |
4.05%, 6/29/2048 | | | 49,000 | | | | 49,458 | |
| | | | | | | | |
| | |
| | | | | | | 244,071 | |
| | | | | | | | |
|
Food Products — 2.0% | |
| | |
Campbell Soup Co. 3.65%, 3/15/2023 | | | 149,000 | | | | 148,046 | |
| | |
Conagra Brands, Inc. | | | | | | | | |
| | |
4.85%, 11/1/2028 | | | 34,000 | | | | 34,140 | |
| | |
5.30%, 11/1/2038 | | | 22,000 | | | | 20,904 | |
| | |
Kraft Heinz Foods Co. | | | | | | | | |
| | |
3.50%, 6/6/2022 | | | 12,000 | | | | 11,953 | |
| | |
3.95%, 7/15/2025 | | | 22,000 | | | | 21,771 | |
| | |
4.38%, 6/1/2046 | | | 99,000 | | | | 82,029 | |
| | |
McCormick & Co., Inc. 2.70%, 8/15/2022 | | | 68,000 | | | | 66,764 | |
| | |
Mead Johnson Nutrition Co. (United Kingdom) 4.13%, 11/15/2025 | | | 23,000 | | | | 23,966 | |
| | |
Tyson Foods, Inc. 4.00%, 3/1/2026 | | | 115,000 | | | | 115,151 | |
| | | | | | | | |
| | |
| | | | | | | 524,724 | |
| | | | | | | | |
|
Gas Utilities — 0.1% | |
| | |
Atmos Energy Corp. 4.13%, 10/15/2044 | | | 31,000 | | | | 30,447 | |
| | | | | | | | |
|
Health Care Equipment & Supplies — 3.0% | |
| | |
Abbott Laboratories 4.90%, 11/30/2046 | | | 30,000 | | | | 32,898 | |
| | |
Becton Dickinson and Co. | | | | | | | | |
| | |
2.89%, 6/6/2022 | | | 129,000 | | | | 127,568 | |
| | |
3.70%, 6/6/2027 | | | 70,000 | | | | 67,811 | |
| | |
4.67%, 6/6/2047 | | | 43,000 | | | | 42,743 | |
| | |
Boston Scientific Corp. 4.00%, 3/1/2028 | | | 189,000 | | | | 189,946 | |
| | |
Medtronic, Inc. | | | | | | | | |
| | |
2.50%, 3/15/2020 | | | 36,000 | | | | 35,921 | |
| | |
4.38%, 3/15/2035 | | | 32,000 | | | | 33,696 | |
| | |
4.63%, 3/15/2045 | | | 100,000 | | | | 109,562 | |
| | |
Zimmer Biomet Holdings, Inc. 3.55%, 4/1/2025 | | | 140,000 | | | | 136,010 | |
| | | | | | | | |
| | |
| | | | | | | 776,155 | |
| | | | | | | | |
| | | | | | | | |
| INVESTMENTS | | PRINCIPAL
AMOUNT ($) | | | VALUE ($) | |
| | | | | | | | |
|
Health Care Providers & Services — 5.1% | |
| | |
Aetna, Inc. | | | | | | | | |
| | |
2.80%, 6/15/2023 | | | 145,000 | | | | 141,288 | |
| | |
3.88%, 8/15/2047 | | | 20,000 | | | | 16,521 | |
| | |
Anthem, Inc. | | | | | | | | |
| | |
3.65%, 12/1/2027 | | | 31,000 | | | | 30,494 | |
| | |
4.65%, 8/15/2044 | | | 116,000 | | | | 115,677 | |
| | |
Cigna Corp. | | | | | | | | |
| | |
4.80%, 8/15/2038 (b) | | | 68,000 | | | | 67,867 | |
| | |
4.90%, 12/15/2048 (b) | | | 20,000 | | | | 19,913 | |
| | |
CVS Health Corp. | | | | | | | | |
| | |
3.35%, 3/9/2021 | | | 102,000 | | | | 102,281 | |
| | |
3.70%, 3/9/2023 | | | 73,000 | | | | 73,448 | |
| | |
4.10%, 3/25/2025 | | | 24,000 | | | | 24,329 | |
| | |
4.30%, 3/25/2028 | | | 46,000 | | | | 46,032 | |
| | |
5.05%, 3/25/2048 | | | 136,000 | | | | 134,765 | |
| | |
HCA, Inc. | | | | | | | | |
| | |
4.50%, 2/15/2027 | | | 40,000 | | | | 40,327 | |
| | |
5.50%, 6/15/2047 | | | 90,000 | | | | 92,866 | |
| | |
UnitedHealth Group, Inc. | | | | | | | | |
| | |
2.70%, 7/15/2020 | | | 191,000 | | | | 190,995 | |
| | |
3.75%, 7/15/2025 | | | 118,000 | | | | 121,152 | |
| | |
4.25%, 3/15/2043 | | | 90,000 | | | | 91,619 | |
| | | | | | | | |
| | |
| | | | | | | 1,309,574 | |
| | | | | | | | |
|
Hotels, Restaurants & Leisure — 1.0% | |
| | |
McDonald’s Corp. | | | | | | | | |
| | |
2.75%, 12/9/2020 | | | 32,000 | | | | 31,947 | |
| | |
3.70%, 1/30/2026 | | | 112,000 | | | | 112,657 | |
| | |
3.80%, 4/1/2028 | | | 33,000 | | | | 32,942 | |
| | |
4.88%, 12/9/2045 | | | 70,000 | | | | 72,095 | |
| | | | | | | | |
| | |
| | | | | | | 249,641 | |
| | | | | | | | |
|
Household Durables — 0.1% | |
| | |
Newell Brands, Inc. 4.20%, 4/1/2026 | | | 32,000 | | | | 30,046 | |
| | | | | | | | |
|
Industrial Conglomerates — 1.7% | |
| | |
General Electric Co. | | | | | | | | |
| | |
4.63%, 1/7/2021 | | | 100,000 | | | | 102,307 | |
| | |
2.70%, 10/9/2022 | | | 160,000 | | | | 154,662 | |
| | |
6.75%, 3/15/2032 | | | 31,000 | | | | 35,476 | |
| | |
5.88%, 1/14/2038 | | | 41,000 | | | | 42,954 | |
| | |
4.13%, 10/9/2042 | | | 90,000 | | | | 75,914 | |
| | |
Roper Technologies, Inc. 4.20%, 9/15/2028 | | | 29,000 | | | | 29,161 | |
| | | | | | | | |
| | |
| | | | | | | 440,474 | |
| | | | | | | | |
SEE NOTES TO FINANCIAL STATEMENTS.
| | | | | | | | |
| | | |
| FEBRUARY 28, 2019 | | J.P. MORGAN EXCHANGE-TRADED FUNDS | | | | | 35 | |
JPMorgan Corporate Bond Research Enhanced ETF
SCHEDULE OF PORTFOLIO INVESTMENTS
AS OF FEBRUARY 28, 2019 (continued)
| | | | | | | | |
| INVESTMENTS | | PRINCIPAL
AMOUNT ($) | | | VALUE ($) | |
Corporate Bonds — continued | |
|
Insurance — 1.3% | |
| | |
American International Group, Inc. | | | | | | | | |
| | |
3.90%, 4/1/2026 | | | 78,000 | | | | 76,036 | |
| | |
4.50%, 7/16/2044 | | | 119,000 | | | | 109,148 | |
| | |
Athene Holding Ltd. 4.13%, 1/12/2028 | | | 84,000 | | | | 78,409 | |
| | |
Marsh & McLennan Cos., Inc. 4.38%, 3/15/2029 | | | 30,000 | | | | 30,919 | |
| | |
MetLife, Inc. 4.13%, 8/13/2042 | | | 20,000 | | | | 19,274 | |
| | |
Prudential Financial, Inc. 3.91%, 12/7/2047 | | | 20,000 | | | | 18,418 | |
| | | | | | | | |
| | |
| | | | | | | 332,204 | |
| | | | | | | | |
|
Internet & Direct Marketing Retail — 0.7% | |
| | |
Amazon.com, Inc. | | | | | | | | |
| | |
3.88%, 8/22/2037 | | | 140,000 | | | | 139,625 | |
| | |
4.05%, 8/22/2047 | | | 30,000 | | | | 30,107 | |
| | | | | | | | |
| | |
| | | | | | | 169,732 | |
| | | | | | | | |
|
IT Services — 0.2% | |
| | |
Visa, Inc. 2.20%, 12/14/2020 | | | 46,000 | | | | 45,580 | |
| | | | | | | | |
|
Life Sciences Tools & Services — 0.3% | |
| | |
Thermo Fisher Scientific, Inc. 3.00%, 4/15/2023 | | | 70,000 | | | | 68,979 | |
| | | | | | | | |
|
Machinery — 0.2% | |
| | |
Deere & Co. 3.90%, 6/9/2042 | | | 20,000 | | | | 19,906 | |
| | |
Illinois Tool Works, Inc. 2.65%, 11/15/2026 | | | 28,000 | | | | 26,769 | |
| | | | | | | | |
| | |
| | | | | | | 46,675 | |
| | | | | | | | |
|
Media — 4.7% | |
| | |
Charter Communications Operating LLC | | | | | | | | |
| | |
4.46%, 7/23/2022 | | | 88,000 | | | | 90,263 | |
| | |
4.91%, 7/23/2025 | | | 49,000 | | | | 50,760 | |
| | |
6.48%, 10/23/2045 | | | 78,000 | | | | 83,895 | |
| | |
Comcast Corp. | | | | | | | | |
| | |
3.70%, 4/15/2024 | | | 167,000 | | | | 170,785 | |
| | |
3.95%, 10/15/2025 | | | 78,000 | | | | 80,386 | |
| | |
4.15%, 10/15/2028 | | | 74,000 | | | | 76,221 | |
| | |
4.60%, 10/15/2038 | | | 178,000 | | | | 183,023 | |
| | |
4.70%, 10/15/2048 | | | 38,000 | | | | 39,563 | |
| | |
Cox Communications, Inc. 3.50%, 8/15/2027 (b) | | | 70,000 | | | | 66,564 | |
| | |
Fox Corp. | | | | | | | | |
| | |
4.03%, 1/25/2024 (b) | | | 72,000 | | | | 73,378 | |
| | |
4.71%, 1/25/2029 (b) | | | 10,000 | | | | 10,365 | |
| | |
5.48%, 1/25/2039 (b) | | | 120,000 | | | | 125,791 | |
| | |
Time Warner Cable LLC | | | | | | | | |
| | |
5.00%, 2/1/2020 | | | 100,000 | | | | 101,517 | |
| | |
6.75%, 6/15/2039 | | | 48,000 | | | | 51,523 | |
| | | | | | | | |
| | |
| | | | | | | 1,204,034 | |
| | | | | | | | |
| | | | | | | | |
| INVESTMENTS | | PRINCIPAL
AMOUNT ($) | | | VALUE ($) | |
| | | | | | | | |
|
Metals & Mining — 0.3% | |
| | |
Glencore Funding LLC (Switzerland) 4.00%, 3/27/2027 (b) | | | 80,000 | | | | 76,129 | |
| | | | | | | | |
|
Multiline Retail — 0.2% | |
| | |
Dollar Tree, Inc. 4.20%, 5/15/2028 | | | 60,000 | | | | 57,230 | |
| | | | | | | | |
|
Multi-Utilities — 1.4% | |
| | |
Berkshire Hathaway Energy Co. | | | | | | | | |
| | |
4.50%, 2/1/2045 | | | 80,000 | | | | 81,785 | |
| | |
3.80%, 7/15/2048 | | | 38,000 | | | | 34,666 | |
| | |
4.45%, 1/15/2049 | | | 49,000 | | | | 49,341 | |
| | |
Consolidated Edison Co. of New York, Inc. 4.45%, 3/15/2044 | | | 70,000 | | | | 70,995 | |
| | |
Dominion Energy, Inc. 3.90%, 10/1/2025 | | | 17,000 | | | | 17,054 | |
| | |
Sempra Energy | | | | | | | | |
| | |
3.40%, 2/1/2028 | | | 80,000 | | | | 75,166 | |
| | |
3.80%, 2/1/2038 | | | 38,000 | | | | 33,551 | |
| | | | | | | | |
| | |
| | | | | | | 362,558 | |
| | | | | | | | |
|
Oil, Gas & Consumable Fuels — 7.3% | |
| | |
Anadarko Petroleum Corp. | | | | | | | | |
| | |
5.55%, 3/15/2026 | | | 28,000 | | | | 29,919 | |
| | |
6.45%, 9/15/2036 | | | 129,000 | | | | 145,178 | |
| | |
Andeavor Logistics LP 4.25%, 12/1/2027 | | | 28,000 | | | | 27,526 | |
| | |
BP Capital Markets America, Inc. | | | | | | | | |
| | |
3.41%, 2/11/2026 | | | 45,000 | | | | 44,914 | |
| | |
4.23%, 11/6/2028 | | | 150,000 | | | | 157,698 | |
| | |
BP Capital Markets plc (United Kingdom) 2.32%, 2/13/2020 | | | 113,000 | | | | 112,516 | |
| | |
Canadian Natural Resources Ltd. (Canada) | | | | | | | | |
| | |
2.95%, 1/15/2023 | | | 125,000 | | | | 122,273 | |
| | |
3.85%, 6/1/2027 | | | 29,000 | | | | 28,372 | |
| | |
Columbia Pipeline Group, Inc. 4.50%, 6/1/2025 | | | 60,000 | | | | 61,591 | |
| | |
Enbridge, Inc. (Canada) 4.25%, 12/1/2026 | | | 61,000 | | | | 62,203 | |
| | |
Energy Transfer Operating LP | | | | | | | | |
| | |
4.75%, 1/15/2026 | | | 22,000 | | | | 22,404 | |
| | |
4.95%, 6/15/2028 | | | 32,000 | | | | 32,605 | |
| | |
Enterprise Products Operating LLC | | | | | | | | |
| | |
5.10%, 2/15/2045 | | | 43,000 | | | | 45,321 | |
| | |
4.80%, 2/1/2049 | | | 34,000 | | | | 34,614 | |
| | |
EOG Resources, Inc. 2.63%, 3/15/2023 | | | 70,000 | | | | 68,525 | |
| | |
EQM Midstream Partners LP 4.75%, 7/15/2023 | | | 118,000 | | | | 118,803 | |
| | |
Kinder Morgan, Inc. | | | | | | | | |
| | |
4.30%, 6/1/2025 | | | 13,000 | | | | 13,297 | |
| | |
5.55%, 6/1/2045 | | | 63,000 | | | | 66,142 | |
SEE NOTES TO FINANCIAL STATEMENTS.
| | | | | | |
| | | |
| 36 | | | | J.P. MORGAN EXCHANGE-TRADED FUNDS | | FEBRUARY 28, 2019 |
| | | | | | | | |
| INVESTMENTS | | PRINCIPAL
AMOUNT ($) | | | VALUE ($) | |
Corporate Bonds — continued | |
|
Oil, Gas & Consumable Fuels — continued | |
| | |
Marathon Petroleum Corp. 4.75%, 9/15/2044 | | | 37,000 | | | | 35,495 | |
| | |
MPLX LP | | | | | | | | |
| | |
4.00%, 3/15/2028 | | | 34,000 | | | | 32,937 | |
| | |
4.50%, 4/15/2038 | | | 60,000 | | | | 55,221 | |
| | |
Occidental Petroleum Corp. Series 1, 4.10%, 2/1/2021 | | | 70,000 | | | | 71,438 | |
| | |
ONEOK, Inc. 4.55%, 7/15/2028 | | | 37,000 | | | | 37,498 | |
| | |
Phillips 66 4.30%, 4/1/2022 | | | 64,000 | | | | 66,197 | |
| | |
Suncor Energy, Inc. (Canada) 4.00%, 11/15/2047 | | | 30,000 | | | | 27,847 | |
| | |
Sunoco Logistics Partners Operations LP 5.40%, 10/1/2047 | | | 92,000 | | | | 88,498 | |
| | |
TransCanada PipeLines Ltd. (Canada) | | | | | | | | |
| | |
4.25%, 5/15/2028 | | | 21,000 | | | | 21,443 | |
| | |
4.63%, 3/1/2034 | | | 101,000 | | | | 102,722 | |
| | |
Western Midstream Operating LP 4.50%, 3/1/2028 | | | 40,000 | | | | 38,714 | |
| | |
5.45%, 4/1/2044 | | | 20,000 | | | | 18,419 | |
| | |
Williams Cos., Inc. (The) | | | | | | | | |
| | |
4.55%, 6/24/2024 | | | 59,000 | | | | 61,085 | |
| | |
3.75%, 6/15/2027 | | | 16,000 | | | | 15,499 | |
| | | | | | | | |
| | |
| | | | | | | 1,866,914 | |
| | | | | | | | |
|
Pharmaceuticals — 3.0% | |
| | |
AstraZeneca plc (United Kingdom) 4.38%, 11/16/2045 | | | 20,000 | | | | 19,376 | |
| | |
Eli Lilly & Co. | | | | | | | | |
| | |
3.38%, 3/15/2029 | | | 10,000 | | | | 10,000 | |
| | |
3.88%, 3/15/2039 | | | 20,000 | | | | 19,697 | |
| | |
3.95%, 3/15/2049 | | | 25,000 | | | | 24,493 | |
| | |
GlaxoSmithKline Capital plc (United Kingdom) 2.85%, 5/8/2022 | | | 34,000 | | | | 33,900 | |
| | |
Novartis Capital Corp. (Switzerland) | | | | | | | | |
| | |
3.40%, 5/6/2024 | | | 59,000 | | | | 60,325 | |
| | |
4.40%, 5/6/2044 | | | 43,000 | | | | 45,765 | |
| | |
Pfizer, Inc. | | | | | | | | |
| | |
3.00%, 12/15/2026 | | | 40,000 | | | | 39,019 | |
| | |
4.00%, 12/15/2036 | | | 20,000 | | | | 20,192 | |
| | |
4.40%, 5/15/2044 | | | 20,000 | | | | 21,012 | |
| | |
4.13%, 12/15/2046 | | | 42,000 | | | | 42,734 | |
| | |
Shire Acquisitions Investments Ireland DAC | | | | | | | | |
| | |
2.40%, 9/23/2021 | | | 275,000 | | | | 268,746 | |
| | |
3.20%, 9/23/2026 | | | 81,000 | | | | 75,951 | |
| | |
Zoetis, Inc. | | | | | | | | |
| | |
3.00%, 9/12/2027 | | | 40,000 | | | | 37,189 | |
| | |
4.70%, 2/1/2043 | | | 40,000 | | | | 41,169 | |
| | | | | | | | |
| | |
| | | | | | | 759,568 | |
| | | | | | | | |
| | | | | | | | |
| INVESTMENTS | | PRINCIPAL
AMOUNT ($) | | | VALUE ($) | |
| | | | | | | | |
|
Road & Rail — 2.0% | |
| | |
Burlington Northern Santa Fe LLC | | | | | | | | |
| | |
4.90%, 4/1/2044 | | | 76,000 | | | | 83,733 | |
| | |
4.55%, 9/1/2044 | | | 25,000 | | | | 26,232 | |
| | |
4.15%, 4/1/2045 | | | 51,000 | | | | 51,071 | |
| | |
CSX Corp. | | | | | | | | |
| | |
3.25%, 6/1/2027 | | | 44,000 | | | | 42,279 | |
| | |
4.30%, 3/1/2048 | | | 77,000 | | | | 74,881 | |
| | |
Norfolk Southern Corp. 4.15%, 2/28/2048 | | | 70,000 | | | | 67,858 | |
| | |
Union Pacific Corp. | | | | | | | | |
| | |
3.95%, 9/10/2028 | | | 21,000 | | | | 21,485 | |
| | |
3.70%, 3/1/2029 | | | 30,000 | | | | 29,901 | |
| | |
4.38%, 9/10/2038 | | | 41,000 | | | | 40,860 | |
| | |
4.50%, 9/10/2048 | | | 27,000 | | | | 27,112 | |
| | |
4.30%, 3/1/2049 | | | 50,000 | | | | 48,712 | |
| | | | | | | | |
| | |
| | | | | | | 514,124 | |
| | | | | | | | |
|
Semiconductors & Semiconductor Equipment — 1.1% | |
| | |
Analog Devices, Inc. 3.50%, 12/5/2026 | | | 14,000 | | | | 13,496 | |
| | |
Broadcom Corp. | | | | | | | | |
| | |
3.00%, 1/15/2022 | | | 54,000 | | | | 52,998 | |
| | |
3.88%, 1/15/2027 | | | 52,000 | | | | 48,166 | |
| | |
Intel Corp. | | | | | | | | |
| | |
3.30%, 10/1/2021 | | | 114,000 | | | | 115,534 | |
| | |
3.73%, 12/8/2047 | | | 57,000 | | | | 54,734 | |
| | | | | | | | |
| | |
| | | | | | | 284,928 | |
| | | | | | | | |
|
Software — 2.8% | |
| | |
Microsoft Corp. | | | | | | | | |
| | |
2.88%, 2/6/2024 | | | 131,000 | | | | 131,034 | |
| | |
3.30%, 2/6/2027 | | | 30,000 | | | | 30,169 | |
| | |
4.10%, 2/6/2037 | | | 150,000 | | | | 157,191 | |
| | |
3.70%, 8/8/2046 | | | 56,000 | | | | 54,506 | |
| | |
Oracle Corp. | | | | | | | | |
| | |
1.90%, 9/15/2021 | | | 65,000 | | | | 63,496 | |
| | |
2.40%, 9/15/2023 | | | 44,000 | | | | 42,760 | |
| | |
2.65%, 7/15/2026 | | | 46,000 | | | | 43,682 | |
| | |
3.25%, 11/15/2027 | | | 53,000 | | | | 52,333 | |
| | |
3.80%, 11/15/2037 | | | 40,000 | | | | 38,364 | |
| | |
4.00%, 7/15/2046 | | | 74,000 | | | | 70,910 | |
| | |
salesforce.com, Inc. 3.70%, 4/11/2028 | | | 34,000 | | | | 34,827 | |
| | | | | | | | |
| | |
| | | | | | | 719,272 | |
| | | | | | | | |
|
Specialty Retail — 1.8% | |
| | |
Home Depot, Inc. (The) | | | | | | | | |
| | |
2.00%, 4/1/2021 | | | 278,000 | | | | 274,186 | |
| | |
4.20%, 4/1/2043 | | | 20,000 | | | | 20,192 | |
SEE NOTES TO FINANCIAL STATEMENTS.
| | | | | | | | |
| | | |
| FEBRUARY 28, 2019 | | J.P. MORGAN EXCHANGE-TRADED FUNDS | | | | | 37 | |
JPMorgan Corporate Bond Research Enhanced ETF
SCHEDULE OF PORTFOLIO INVESTMENTS
AS OF FEBRUARY 28, 2019 (continued)
| | | | | | | | |
| INVESTMENTS | | PRINCIPAL
AMOUNT ($) | | | VALUE ($) | |
Corporate Bonds — continued | |
|
Specialty Retail — continued | |
| | |
Home Depot, Inc. (The) | | | | | | | | |
| | |
4.25%, 4/1/2046 | | | 81,000 | | | | 82,273 | |
| | |
3.50%, 9/15/2056 | | | 20,000 | | | | 17,628 | |
| | |
Lowe’s Cos., Inc. | | | | | | | | |
| | |
3.70%, 4/15/2046 | | | 40,000 | | | | 33,818 | |
| | |
4.05%, 5/3/2047 | | | 30,000 | | | | 26,856 | |
| | | | | | | | |
| | |
| | | | | | | 454,953 | |
| | | | | | | | |
|
Technology Hardware, Storage & Peripherals — 1.7% | |
| | |
Apple, Inc. | | | | | | | | |
| | |
2.25%, 2/23/2021 | | | 123,000 | | | | 121,931 | |
| | |
2.40%, 5/3/2023 | | | 77,000 | | | | 75,525 | |
| | |
3.25%, 2/23/2026 | | | 74,000 | | | | 74,088 | |
| | |
2.90%, 9/12/2027 | | | 71,000 | | | | 68,519 | |
| | |
4.65%, 2/23/2046 | | | 87,000 | | | | 93,649 | |
| | | | | | | | |
| | |
| | | | | | | 433,712 | |
| | | | | | | | |
|
Tobacco — 1.5% | |
| | |
Altria Group, Inc. | | | | | | | | |
| | |
4.80%, 2/14/2029 | | | 70,000 | | | | 69,861 | |
| | |
5.80%, 2/14/2039 | | | 20,000 | | | | 19,932 | |
| | |
BAT Capital Corp. (United Kingdom) 4.39%, 8/15/2037 | | | 150,000 | | | | 125,190 | |
| | |
Philip Morris International, Inc. | | | | | | | | |
| | |
3.88%, 8/21/2042 | | | 40,000 | | | | 34,797 | |
| | |
4.25%, 11/10/2044 | | | 60,000 | | | | 55,061 | |
| | |
Reynolds American, Inc. (United Kingdom) | | | | | | | | |
| | |
4.00%, 6/12/2022 | | | 23,000 | | | | 23,278 | |
| | |
4.45%, 6/12/2025 | | | 58,000 | | | | 58,489 | |
| | | | | | | | |
| | |
| | | | | | | 386,608 | |
| | | | | | | | |
|
Trading Companies & Distributors — 1.2% | |
| | |
Air Lease Corp. | | | | | | | | |
| | |
3.00%, 9/15/2023 | | | 317,000 | | | | 304,217 | |
| | | | | | | | |
| | | | | | | | |
| INVESTMENTS | | PRINCIPAL
AMOUNT ($) | | | VALUE ($) | |
| | | | | | | | |
|
Wireless Telecommunication Services — 0.4% | |
| | |
Vodafone Group plc (United Kingdom) | | | | | | | | |
| | |
4.38%, 5/30/2028 | | | 30,000 | | | | 29,735 | |
| | |
5.25%, 5/30/2048 | | | 70,000 | | | | 66,845 | |
| | | | | | | | |
| | |
| | | | | | | 96,580 | |
| | | | | | | | |
| |
Total Corporate Bonds
(Cost $24,249,979) | | | | 24,760,226 | |
| | | | | | | | |
U.S. Treasury Obligations — 2.1% | |
| | |
U.S. Treasury Bonds | | | | | | | | |
| | |
3.00%, 8/15/2048 | | | 10,000 | | | | 9,828 | |
| | |
3.38%, 11/15/2048 | | | 20,000 | | | | 21,144 | |
| | |
U.S. Treasury Notes | | | | | | | | |
| | |
2.88%, 11/15/2021 | | | 60,000 | | | | 60,565 | |
| | |
2.88%, 10/31/2023 | | | 175,000 | | | | 177,625 | |
| | |
2.63%, 12/31/2023 | | | 60,000 | | | | 60,248 | |
| | |
2.50%, 1/31/2024 | | | 60,000 | | | | 59,934 | |
| | |
2.63%, 2/15/2029 | | | 150,000 | | | | 148,758 | |
| | | | | | | | |
| |
Total U.S. Treasury Obligations
(Cost $538,807) | | | | 538,102 | |
| | | | | | | | |
| | |
| | | SHARES | | | | |
Short-Term Investments — 1.2% | |
|
Investment Companies — 1.2% | |
| | |
JPMorgan U.S. Government Money Market Fund Class Institutional Shares,
2.33% (c) (d)
(Cost $307,539) | | | 307,539 | | | | 307,539 | |
| | | | | | | | |
Total Investments — 100.0%
(Cost $25,096,325) | | | | | | | 25,605,867 | |
Liabilities in Excess of
Other Assets — 0.0% (e) | | | | | | | (10,374) | |
| | | | | | | | |
NET ASSETS — 100.0% | | | | | | | 25,595,493 | |
| | | | | | | | |
Percentages indicated are based on net assets.
| | |
| Abbreviations |
| |
| ICE | | Intercontinental Exchange |
| LIBOR | | London Interbank Offered Rate |
| USD | | United States Dollar |
| |
| (a) | | Variable or floating rate security, linked to the referenced benchmark. The interest rate shown is the current rate as of February 28, 2019. |
| (b) | | Securities exempt from registration under Rule 144A or section 4(a)(2), of the Securities Act of 1933, as amended. |
| | |
| |
| (c) | | Investment in affiliate. Fund is registered under the Investment Company Act of 1940, as amended, and advised by J.P. Morgan Investment Management Inc. |
| (d) | | The rate shown is the current yield as of February 28, 2019. |
| (e) | | Amount rounds to less than 0.1% of net assets. |
SEE NOTES TO FINANCIAL STATEMENTS.
| | | | | | |
| | | |
| 38 | | | | J.P. MORGAN EXCHANGE-TRADED FUNDS | | FEBRUARY 28, 2019 |
| | | | | | | | | | | | | | | | | | | | |
| Futures contracts outstanding as of February 28, 2019: | |
| DESCRIPTION | | NUMBER OF
CONTRACTS | | | EXPIRATION
DATE | | | TRADING
CURRENCY | | | NOTIONAL
AMOUNT ($) | | | VALUE AND
UNREALIZED
APPRECIATION
(DEPRECIATION) ($) | |
Long Contracts | |
| | | | | |
| U.S. Treasury 2 Year Note | | | 2 | | | | 06/2019 | | | | USD | | | | 424,375 | | | | (67 | ) |
| | | | | |
| U.S. Treasury Long Bond | | | 1 | | | | 06/2019 | | | | USD | | | | 144,500 | | | | (1,471 | ) |
| | | | | | | | | | | | | | | | | | | | |
| | | | | | | | | | | | | | | | | | | (1,538 | ) |
| | | | | | | | | | | | | | | | | | | | |
Short Contracts | |
| | | | | |
| U.S. Treasury 10 Year Note | | | (2 | ) | | | 06/2019 | | | | USD | | | | (243,906 | ) | | | 464 | |
| | | | | |
| U.S. Treasury 10 Year Ultra Note | | | (2 | ) | | | 06/2019 | | | | USD | | | | (258,813 | ) | | | 668 | |
| | | | | |
| U.S. Treasury 5 Year Note | | | (1 | ) | | | 06/2019 | | | | USD | | | | (114,539 | ) | | | 37 | |
| | | | | | | | | | | | | | | | | | | | |
| | | | | | | | | | | | | | | | | | | 1,169 | |
| | | | | | | | | | | | | | | | | | | | |
| | | | | | | | | | | | | | | | | | | (369 | ) |
| | | | | | | | | | | | | | | | | | | | |
| | |
| Abbreviations |
| |
| USD | | United States Dollar |
SEE NOTES TO FINANCIAL STATEMENTS.
| | | | | | | | |
| | | |
| FEBRUARY 28, 2019 | | J.P. MORGAN EXCHANGE-TRADED FUNDS | | | | | 39 | |
JPMorgan Disciplined High Yield ETF
SCHEDULE OF PORTFOLIO INVESTMENTS
AS OF FEBRUARY 28, 2019
| | | | | | | | |
| INVESTMENTS | | PRINCIPAL
AMOUNT ($) | | | VALUE ($) | |
Corporate Bonds — 97.6% | |
|
Aerospace & Defense — 2.6% | |
| | |
Arconic, Inc. | | | | | | | | |
| | |
6.15%, 8/15/2020 | | | 288,000 | | | | 297,360 | |
| | |
5.40%, 4/15/2021 | | | 385,000 | | | | 396,008 | |
| | |
5.13%, 10/1/2024 | | | 372,000 | | | | 368,280 | |
| | |
Bombardier, Inc. (Canada) | | | | | | | | |
| | |
8.75%, 12/1/2021 (a) | | | 394,000 | | | | 433,400 | |
| | |
6.13%, 1/15/2023 (a) | | | 348,000 | | | | 350,610 | |
| | |
7.50%, 3/15/2025 (a) | | | 422,000 | | | | 422,528 | |
| | |
7.88%, 4/15/2027 (a) | | | 355,000 | | | | 352,323 | |
| | |
TransDigm, Inc. | | | | | | | | |
| | |
6.00%, 7/15/2022 | | | 330,000 | | | | 336,105 | |
| | |
6.50%, 7/15/2024 | | | 341,000 | | | | 344,410 | |
| | |
6.25%, 3/15/2026 (a) | | | 516,000 | | | | 528,900 | |
| | |
6.38%, 6/15/2026 | | | 262,000 | | | | 254,795 | |
| | | | | | | | |
| | |
| | | | | | | 4,084,719 | |
| | | | | | | | |
|
Air Freight & Logistics — 0.3% | |
| | |
XPO Logistics, Inc. | | | | | | | | |
| | |
6.50%, 6/15/2022 (a) | | | 287,000 | | | | 292,022 | |
| | |
6.13%, 9/1/2023 (a) | | | 145,000 | | | | 144,638 | |
| | | | | | | | |
| | |
| | | | | | | 436,660 | |
| | | | | | | | |
|
Airlines — 0.2% | |
| | |
American Airlines Group, Inc. | | | | | | | | |
| | |
5.50%, 10/1/2019 (a) | | | 164,000 | | | | 165,230 | |
| | |
4.63%, 3/1/2020 (a) | | | 139,000 | | | | 139,869 | |
| | | | | | | | |
| | |
| | | | | | | 305,099 | |
| | | | | | | | |
|
Auto Components — 1.8% | |
| | |
Allison Transmission, Inc. 5.00%, 10/1/2024 (a) | | | 273,000 | | | | 274,706 | |
| | |
American Axle & Manufacturing, Inc. | | | | | | | | |
| | |
6.63%, 10/15/2022 | | | 80,000 | | | | 81,900 | |
| | |
6.25%, 4/1/2025 | | | 169,000 | | | | 168,594 | |
| | |
6.50%, 4/1/2027 | | | 145,000 | | | | 143,188 | |
| | |
Goodyear Tire & Rubber Co. (The) | | | | | | | | |
| | |
5.13%, 11/15/2023 | | | 273,000 | | | | 272,318 | |
| | |
5.00%, 5/31/2026 | | | 244,000 | | | | 231,495 | |
| | |
4.88%, 3/15/2027 (b) | | | 170,000 | | | | 156,400 | |
| | |
Icahn Enterprises LP | | | | | | | | |
| | |
6.00%, 8/1/2020 | | | 489,000 | | | | 493,890 | |
| | |
5.88%, 2/1/2022 | | | 390,000 | | | | 394,387 | |
| | |
6.25%, 2/1/2022 | | | 349,000 | | | | 359,400 | |
| | |
6.38%, 12/15/2025 | | | 122,000 | | | | 125,508 | |
| | | | | | | | |
| | |
| | | | | | | 2,701,786 | |
| | | | | | | | |
| | | | | | | | |
| INVESTMENTS | | PRINCIPAL
AMOUNT ($) | | | VALUE ($) | |
| |
|
Automobiles — 1.2% | |
| | |
Fiat Chrysler Automobiles NV (United Kingdom) | | | | | | | | |
| | |
4.50%, 4/15/2020 | | | 602,000 | | | | 605,762 | |
| | |
5.25%, 4/15/2023 | | | 600,000 | | | | 609,600 | |
| | |
Jaguar Land Rover Automotive plc (United Kingdom) | | | | | | | | |
| | |
4.25%, 11/15/2019 (a) | | | 200,000 | | | | 199,000 | |
| | |
3.50%, 3/15/2020 (a) (b) | | | 200,000 | | | | 196,746 | |
| | |
5.63%, 2/1/2023 (a) (b) | | | 150,000 | | | | 144,750 | |
| | |
4.50%, 10/1/2027 (a) (b) | | | 200,000 | | | | 155,480 | |
| | | | | | | | |
| | |
| | | | | | | 1,911,338 | |
| | | | | | | | |
|
Banks — 1.8% | |
| | |
CIT Group, Inc. | | | | | | | | |
| | |
4.13%, 3/9/2021 | | | 106,000 | | | | 107,157 | |
| | |
5.00%, 8/15/2022 | | | 330,000 | | | | 340,725 | |
| | |
5.00%, 8/1/2023 | | | 198,000 | | | | 205,229 | |
| | |
4.75%, 2/16/2024 | | | 70,000 | | | | 71,400 | |
| | |
5.25%, 3/7/2025 | | | 97,000 | | | | 101,365 | |
| | |
Goldman Sachs Capital I 6.35%, 2/15/2034 | | | 324,000 | | | | 379,288 | |
| | |
Intesa Sanpaolo SpA (Italy) | | | | | | | | |
| | |
5.02%, 6/26/2024 (a) | | | 600,000 | | | | 555,671 | |
| | |
5.71%, 1/15/2026 (a) | | | 600,000 | | | | 561,862 | |
| | |
Royal Bank of Scotland Group plc (United Kingdom) (ICE LIBOR USD 3 Month + 2.50%), 7.65%, 9/30/2031 (c) (d) (e) | | | 108,000 | | | | 135,000 | |
| | |
UniCredit SpA (Italy) (USD ICE Swap Rate 5 Year + 3.70%), 5.86%, 6/19/2032 (a) (d) | | | 400,000 | | | | 357,421 | |
| | | | | | | | |
| | |
| | | | | | | 2,815,118 | |
| | | | | | | | |
|
Beverages — 0.0% (f) | |
| | |
Cott Holdings, Inc. (Canada) 5.50%, 4/1/2025 (a) | | | 40,000 | | | | 39,550 | |
| | | | | | | | |
|
Building Products — 0.2% | |
| | |
Builders FirstSource, Inc. 5.63%, 9/1/2024 (a) | | | 104,000 | | | | 101,530 | |
| | |
Summit Materials LLC 6.13%, 7/15/2023 | | | 201,000 | | | | 206,025 | |
| | | | | | | | |
| | |
| | | | | | | 307,555 | |
| | | | | | | | |
|
Capital Markets — 1.4% | |
| | |
Deutsche Bank AG (Germany) | | | | | | | | |
| | |
4.50%, 4/1/2025 | | | 408,000 | | | | 379,803 | |
| | |
(USD Swap Semi 5 Year + 2.25%), 4.30%, 5/24/2028 (d) | | | 408,000 | | | | 363,787 | |
| | |
(USD ICE Swap Rate 5 Year + 2.55%), 4.88%, 12/1/2032 (d) | | | 400,000 | | | | 337,548 | |
SEE NOTES TO FINANCIAL STATEMENTS.
| | | | | | |
| | | |
| 40 | | | | J.P. MORGAN EXCHANGE-TRADED FUNDS | | FEBRUARY 28, 2019 |
| | | | | | | | |
| INVESTMENTS | | PRINCIPAL
AMOUNT ($) | | | VALUE ($) | |
Corporate Bonds — continued | |
|
Capital Markets — continued | |
| | |
Dresdner Funding Trust I (Germany) 8.15%, 6/30/2031 (a) | | | 340,000 | | | | 422,195 | |
| | |
MSCI, Inc. | | | | | | | | |
| | |
5.25%, 11/15/2024 (a) | | | 232,000 | | | | 237,800 | |
| | |
5.75%, 8/15/2025 (a) | | | 224,000 | | | | 232,960 | |
| | |
4.75%, 8/1/2026 (a) | | | 92,000 | | | | 92,000 | |
| | |
5.38%, 5/15/2027 (a) | | | 159,000 | | | | 164,168 | |
| | | | | | | | |
| | |
| | | | | | | 2,230,261 | |
| | | | | | | | |
| | |
Chemicals — 2.1% | | | | | | | | |
| | |
Ashland LLC 4.75%, 8/15/2022 (g) | | | 298,000 | | | | 306,195 | |
| | |
Blue Cube Spinco LLC | | | | | | | | |
| | |
9.75%, 10/15/2023 | | | 198,000 | | | | 221,760 | |
| | |
10.00%, 10/15/2025 | | | 93,000 | | | | 106,485 | |
| | |
CF Industries, Inc. | | | | | | | | |
| | |
7.13%, 5/1/2020 | | | 52,000 | | | | 53,885 | |
| | |
3.45%, 6/1/2023 | | | 217,000 | | | | 209,948 | |
| | |
5.15%, 3/15/2034 | | | 222,000 | | | | 208,671 | |
| | |
4.95%, 6/1/2043 | | | 180,000 | | | | 150,525 | |
| | |
5.38%, 3/15/2044 | | | 223,000 | | | | 194,846 | |
| | |
Chemours Co. (The) | | | | | | | | |
| | |
6.63%, 5/15/2023 | | | 240,000 | | | | 249,012 | |
| | |
7.00%, 5/15/2025 | | | 200,000 | | | | 208,500 | |
| | |
5.38%, 5/15/2027 | | | 145,000 | | | | 141,375 | |
| | |
Element Solutions, Inc. 5.88%, 12/1/2025 (a) | | | 243,000 | | | | 245,887 | |
| | |
Huntsman International LLC 4.88%, 11/15/2020 | | | 180,000 | | | | 184,612 | |
| | |
Momentive Performance Materials, Inc. 3.88%, 10/24/2021 | | | 156,000 | | | | 168,090 | |
| | |
Olin Corp. | | | | | | | | |
| | |
5.13%, 9/15/2027 | | | 144,000 | | | | 145,080 | |
| | |
5.00%, 2/1/2030 | | | 160,000 | | | | 155,400 | |
| | |
Tronox, Inc. 6.50%, 4/15/2026 (a) | | | 179,000 | | | | 169,379 | |
| | |
WR Grace & Co.-Conn. 5.13%, 10/1/2021 (a) | | | 183,000 | | | | 188,287 | |
| | | | | | | | |
| | |
| | | | | | | 3,307,937 | |
| | | | | | | | |
|
Commercial Services & Supplies — 1.9% | |
| | |
ADT Security Corp. (The) | | | | | | | | |
| | |
6.25%, 10/15/2021 | | | 275,000 | | | | 289,438 | |
| | |
3.50%, 7/15/2022 | | | 276,000 | | | | 271,515 | |
| | |
4.13%, 6/15/2023 | | | 177,000 | | | | 173,681 | |
| | |
Aramark Services, Inc. | | | | | | | | |
| | |
5.13%, 1/15/2024 | | | 250,000 | | | | 255,312 | |
| | |
5.00%, 4/1/2025 (a) | | | 149,000 | | | | 151,608 | |
| | | | | | | | |
| INVESTMENTS | | PRINCIPAL
AMOUNT ($) | | | VALUE ($) | |
| |
|
Commercial Services & Supplies — continued | |
| | |
4.75%, 6/1/2026 | | | 73,000 | | | | 72,452 | |
| | |
5.00%, 2/1/2028 (a) | | | 321,000 | | | | 316,988 | |
| | |
Nielsen Co. Luxembourg SARL (The) 5.50%, 10/1/2021 (a) | | | 178,000 | | | | 179,557 | |
| | |
Nielsen Finance LLC | | | | | | | | |
| | |
4.50%, 10/1/2020 | | | 225,000 | | | | 225,000 | |
| | |
5.00%, 4/15/2022 (a) | | | 680,000 | | | | 678,300 | |
| | |
Pitney Bowes, Inc. | | | | | | | | |
| | |
3.88%, 10/1/2021 (g) | | | 173,000 | | | | 167,810 | |
| | |
4.63%, 3/15/2024 | | | 135,000 | | | | 123,525 | |
| | | | | | | | |
| | |
| | | | | | | 2,905,186 | |
| | | | | | | | |
|
Communications Equipment — 1.1% | |
| | |
CommScope Technologies LLC | | | | | | | | |
| | |
6.00%, 6/15/2025 (a) | | | 431,000 | | | | 406,217 | |
| | |
5.00%, 3/15/2027 (a) | | | 216,000 | | | | 193,385 | |
| | |
CommScope, Inc. | | | | | | | | |
| | |
5.00%, 6/15/2021 (a) | | | 88,000 | | | | 88,220 | |
| | |
5.50%, 6/15/2024 (a) | | | 187,000 | | | | 179,520 | |
| | |
Nokia OYJ (Finland) | | | | | | | | |
| | |
5.38%, 5/15/2019 | | | 102,000 | | | | 102,255 | |
| | |
3.38%, 6/12/2022 | | | 144,000 | | | | 141,077 | |
| | |
4.38%, 6/12/2027 | | | 145,000 | | | | 142,480 | |
| | |
6.63%, 5/15/2039 | | | 146,000 | | | | 153,300 | |
| | |
Telefonaktiebolaget LM Ericsson (Sweden) 4.13%, 5/15/2022 | | | 288,000 | | | | 290,975 | |
| | | | | | | | |
| | |
| | | | | | | 1,697,429 | |
| | | | | | | | |
|
Construction & Engineering — 0.3% | |
| | |
AECOM
5.88%, 10/15/2024 | | | 210,000 | | | | 220,006 | |
| | |
5.13%, 3/15/2027 | | | 258,000 | | | | 244,778 | |
| | | | | | | | |
| | |
| | | | | | | 464,784 | |
| | | | | | | | |
|
Consumer Finance — 2.5% | |
| | |
Ally Financial, Inc. | | | | | | | | |
| | |
8.00%, 3/15/2020 | | | 272,000 | | | | 284,580 | |
| | |
4.13%, 3/30/2020 | | | 193,000 | | | | 193,965 | |
| | |
5.75%, 11/20/2025 (b) | | | 290,000 | | | | 307,400 | |
| | |
8.00%, 11/1/2031 | | | 554,000 | | | | 684,190 | |
| | |
Navient Corp. | | | | | | | | |
| | |
8.00%, 3/25/2020 | | | 382,000 | | | | 398,934 | |
| | |
6.50%, 6/15/2022 | | | 267,000 | | | | 273,675 | |
| | |
5.50%, 1/25/2023 | | | 250,000 | | | | 246,875 | |
| | |
Springleaf Finance Corp. | | | | | | | | |
| | |
5.25%, 12/15/2019 | | | 95,000 | | | | 96,425 | |
| | |
8.25%, 12/15/2020 | | | 217,000 | | | | 232,353 | |
SEE NOTES TO FINANCIAL STATEMENTS.
| | | | | | | | |
| | | |
| FEBRUARY 28, 2019 | | J.P. MORGAN EXCHANGE-TRADED FUNDS | | | | | 41 | |
JPMorgan Disciplined High Yield ETF
SCHEDULE OF PORTFOLIO INVESTMENTS
AS OF FEBRUARY 28, 2019 (continued)
| | | | | | | | |
| INVESTMENTS | | PRINCIPAL
AMOUNT ($) | | | VALUE ($) | |
Corporate Bonds — continued | |
|
Consumer Finance — continued | |
| | |
7.75%, 10/1/2021 | | | 31,000 | | | | 33,276 | |
| | |
6.13%, 5/15/2022 | | | 254,000 | | | | 263,525 | |
| | |
5.63%, 3/15/2023 | | | 141,000 | | | | 143,115 | |
| | |
6.88%, 3/15/2025 | | | 281,000 | | | | 288,025 | |
| | |
7.13%, 3/15/2026 | | | 364,000 | | | | 368,550 | |
| | | | | | | | |
| | |
| | | | | | | 3,814,888 | |
| | | | | | | | |
|
Containers & Packaging — 2.4% | |
| | |
Ardagh Packaging Finance plc (Ireland) | | | | | | | | |
| | |
4.63%, 5/15/2023 (a) | | | 400,000 | | | | 403,000 | |
| | |
7.25%, 5/15/2024 (a) | | | 600,000 | | | | 625,500 | |
| | |
6.00%, 2/15/2025 (a) | | | 600,000 | | | | 592,500 | |
| | |
Ball Corp. | | | | | | | | |
| | |
4.38%, 12/15/2020 | | | 282,000 | | | | 287,640 | |
| | |
4.00%, 11/15/2023 | | | 285,000 | | | | 285,712 | |
| | |
5.25%, 7/1/2025 | | | 287,000 | | | | 301,350 | |
| | |
Berry Global, Inc. | | | | | | | | |
| | |
5.50%, 5/15/2022 | | | 138,000 | | | | 139,725 | |
| | |
5.13%, 7/15/2023 | | | 182,000 | | | | 182,228 | |
| | |
4.50%, 2/15/2026 (a) | | | 125,000 | | | | 118,281 | |
| | |
Crown Americas LLC | | | | | | | | |
| | |
4.50%, 1/15/2023 | | | 287,000 | | | | 289,870 | |
| | |
4.75%, 2/1/2026 | | | 237,000 | | | | 238,142 | |
| | |
Owens-Brockway Glass Container, Inc. | | | | | | | | |
| | |
5.00%, 1/15/2022 (a) | | | 119,000 | | | | 122,399 | |
| | |
5.88%, 8/15/2023 (a) | | | 182,000 | | | | 191,555 | |
| | | | | | | | |
| | |
| | | | | | | 3,777,902 | |
| | | | | | | | |
|
Diversified Consumer Services — 0.2% | |
| | |
Service Corp. International | | | | | | | | |
| | |
5.38%, 5/15/2024 | | | 222,000 | | | | 226,995 | |
| | |
4.63%, 12/15/2027 | | | 141,000 | | | | 139,238 | |
| | | | | | | | |
| | |
| | | | | | | 366,233 | |
| | | | | | | | |
|
Diversified Financial Services — 0.1% | |
| | |
Voya Financial, Inc. (ICE LIBOR USD 3 Month + 3.58%), 5.65%, 5/15/2053 (d) | | | 190,000 | | | | 188,174 | |
| | | | | | | | |
|
Diversified Telecommunication Services — 6.9% | |
| | |
Altice France SA (France) | | | | | | | | |
| | |
6.25%, 5/15/2024 (a) | | | 400,000 | | | | 400,000 | |
| | |
7.38%, 5/1/2026 (a) | | | 1,559,000 | | | | 1,533,074 | |
| | |
8.13%, 2/1/2027 (a) | | | 539,000 | | | | 541,695 | |
| | |
CCO Holdings LLC | | | | | | | | |
| | |
5.88%, 4/1/2024 (a) | | | 116,000 | | | | 120,785 | |
| | |
5.75%, 2/15/2026 (a) | | | 721,000 | | | | 747,165 | |
| | | | | | | | |
| INVESTMENTS | | PRINCIPAL
AMOUNT ($) | | | VALUE ($) | |
| |
|
Diversified Telecommunication Services — continued | |
| | |
5.50%, 5/1/2026 (a) | | | 61,000 | | | | 62,202 | |
| | |
5.13%, 5/1/2027 (a) | | | 963,000 | | | | 944,944 | |
| | |
5.00%, 2/1/2028 (a) | | | 721,000 | | | | 693,963 | |
| | |
CenturyLink, Inc. | | | | | | | | |
| | |
Series S, 6.45%, 6/15/2021 | | | 387,000 | | | | 401,996 | |
| | |
Series T, 5.80%, 3/15/2022 | | | 429,000 | | | | 440,261 | |
| | |
Series Y, 7.50%, 4/1/2024 (b) | | | 309,000 | | | | 326,864 | |
| | |
Embarq Corp. 8.00%, 6/1/2036 | | | 428,000 | | | | 413,020 | |
| | |
Intelsat Jackson Holdings SA (Luxembourg) 8.00%, 2/15/2024 (a) | | | 374,000 | | | | 389,194 | |
| | |
Level 3 Financing, Inc. | | | | | | | | |
| | |
5.38%, 8/15/2022 | | | 288,000 | | | | 289,800 | |
| | |
5.38%, 1/15/2024 | | | 245,000 | | | | 246,531 | |
| | |
5.38%, 5/1/2025 | | | 244,000 | | | | 243,390 | |
| | |
Sable International Finance Ltd. 6.88%, 8/1/2022 (a) | | | 200,000 | | | | 208,000 | |
| | |
Sprint Capital Corp. 6.88%, 11/15/2028 | | | 727,000 | | | | 717,458 | |
| | |
Telecom Italia Capital SA (Italy) | | | | | | | | |
| | |
7.20%, 7/18/2036 | | | 285,000 | | | | 285,627 | |
| | |
7.72%, 6/4/2038 | | | 318,000 | | | | 328,240 | |
| | |
Telecom Italia SpA (Italy) 5.30%, 5/30/2024 (a) | | | 600,000 | | | | 586,500 | |
| | |
Virgin Media Finance plc (United Kingdom) 6.00%, 10/15/2024 (a) | | | 200,000 | | | | 205,250 | |
| | |
Virgin Media Secured Finance plc (United Kingdom) | | | | | | | | |
| | |
5.25%, 1/15/2026 (a) | | | 400,000 | | | | 401,192 | |
| | |
5.50%, 8/15/2026 (a) | | | 200,000 | | | | 199,000 | |
| | | | | | | | |
| | |
| | | | | | | 10,726,151 | |
| | | | | | | | |
Electric Utilities — 0.6% | | | | | | | | |
| | |
Emera, Inc. (Canada) Series 16-A, (ICE LIBOR USD 3 Month + 5.44%), 6.75%, 6/15/2076 (d) | | | 333,000 | | | | 344,655 | |
| | |
NextEra Energy Operating Partners LP | | | | | | | | |
| | |
4.25%, 9/15/2024 (a) | | | 160,000 | | | | 157,200 | |
| | |
4.50%, 9/15/2027 (a) | | | 156,000 | | | | 148,200 | |
| | |
Vistra Operations Co. LLC 5.50%, 9/1/2026 (a) | | | 292,000 | | | | 302,950 | |
| | | | | | | | |
| | |
| | | | | | | 953,005 | |
| | | | | | | | |
|
Electrical Equipment — 0.2% | |
| | |
Sensata Technologies BV | | | | | | | | |
| | |
4.88%, 10/15/2023 (a) | | | 139,000 | | | | 142,822 | |
| | |
5.00%, 10/1/2025 (a) | | | 193,000 | | | | 194,930 | |
| | | | | | | | |
| | |
| | | | | | | 337,752 | |
| | | | | | | | |
SEE NOTES TO FINANCIAL STATEMENTS.
| | | | | | |
| | | |
| 42 | | | | J.P. MORGAN EXCHANGE-TRADED FUNDS | | FEBRUARY 28, 2019 |
| | | | | | | | |
| INVESTMENTS | | PRINCIPAL
AMOUNT ($) | | | VALUE ($) | |
Corporate Bonds — continued | |
|
Electronic Equipment, Instruments & Components — 0.3% | |
| | |
CDW LLC | | | | | | | | |
| | |
5.00%, 9/1/2023 | | | 144,000 | | | | 145,440 | |
| | |
5.50%, 12/1/2024 | | | 167,000 | | | | 174,097 | |
| | |
5.00%, 9/1/2025 | | | 182,000 | | | | 184,048 | |
| | | | | | | | |
| | |
| | | | | | | 503,585 | |
| | | | | | | | |
|
Energy Equipment & Services — 1.5% | |
| | |
Diamond Offshore Drilling, Inc. | | | | | | | | |
| | |
7.88%, 8/15/2025 (b) | | | 126,000 | | | | 119,070 | |
| | |
5.70%, 10/15/2039 | | | 128,000 | | | | 86,400 | |
| | |
4.88%, 11/1/2043 | | | 207,000 | | | | 129,375 | |
| | |
Ensco plc | | | | | | | | |
| | |
4.50%, 10/1/2024 | | | 92,000 | | | | 70,840 | |
| | |
5.20%, 3/15/2025 | | | 160,000 | | | | 122,800 | |
| | |
7.75%, 2/1/2026 | | | 490,000 | | | | 411,600 | |
| | |
5.75%, 10/1/2044 | | | 253,000 | | | | 162,552 | |
| | |
McDermott Technology Americas, Inc. 10.63%, 5/1/2024 (a) | | | 364,000 | | | | 302,120 | |
| | |
Transocean Guardian Ltd. 5.88%, 1/15/2024 (a) | | | 100,170 | | | | 101,798 | |
| | |
Transocean Phoenix 2 Ltd. 7.75%, 10/15/2024 (a) | | | 38,400 | | | | 40,416 | |
| | |
Transocean Proteus Ltd. 6.25%, 12/1/2024 (a) | | | 30,400 | | | | 31,008 | |
| | |
Transocean, Inc. | | | | | | | | |
| | |
9.00%, 7/15/2023 (a) | | | 352,000 | | | | 371,360 | |
| | |
7.25%, 11/1/2025 (a) | | | 106,000 | | | | 101,230 | |
| | |
7.50%, 1/15/2026 (a) | | | 198,000 | | | | 191,070 | |
| | | | | | | | |
| | |
| | | | | | | 2,241,639 | |
| | | | | | | | |
|
Entertainment — 1.6% | |
| | |
AMC Entertainment Holdings, Inc. | | | | | | | | |
| | |
5.75%, 6/15/2025 | | | 166,000 | | | | 153,135 | |
| | |
5.88%, 11/15/2026 | | | 162,000 | | | | 145,816 | |
| | |
Cinemark USA, Inc. 4.88%, 6/1/2023 | | | 213,000 | | | | 213,213 | |
| | |
Live Nation Entertainment, Inc. 4.88%, 11/1/2024 (a) | | | 163,000 | | | | 161,778 | |
| | |
Netflix, Inc. | | | | | | | | |
| | |
5.50%, 2/15/2022 | | | 26,000 | | | | 27,235 | |
| | |
5.88%, 2/15/2025 | | | 160,000 | | | | 169,600 | |
| | |
4.38%, 11/15/2026 (b) | | | 276,000 | | | | 264,789 | |
| | |
4.88%, 4/15/2028 | | | 451,000 | | | | 439,161 | |
| | |
5.88%, 11/15/2028 (a) | | | 526,000 | | | | 547,855 | |
| | |
Viacom, Inc. | | | | | | | | |
| | |
(ICE LIBOR USD 3 Month + 3.90%), 5.87%, 2/28/2057 (d) | | | 172,000 | | | | 169,827 | |
| | | | | | | | |
| INVESTMENTS | | PRINCIPAL
AMOUNT ($) | | | VALUE ($) | |
| |
|
Entertainment — continued | |
| | |
(ICE LIBOR USD 3 Month + 3.90%), 6.25%, 2/28/2057 (d) | | | 172,000 | | | | 171,035 | |
| | | | | | | | |
| | |
| | | | | | | 2,463,444 | |
| | | | | | | | |
|
Equity Real Estate Investment Trusts (REITs) — 2.9% | |
| | |
CyrusOne LP 5.00%, 3/15/2024 | | | 202,000 | | | | 205,535 | |
| | |
Equinix, Inc. | | | | | | | | |
| | |
5.38%, 4/1/2023 | | | 288,000 | | | | 293,040 | |
| | |
5.88%, 1/15/2026 | | | 341,000 | | | | 357,197 | |
| | |
5.38%, 5/15/2027 | | | 361,000 | | | | 373,635 | |
| | |
ESH Hospitality, Inc. 5.25%, 5/1/2025 (a) | | | 362,000 | | | | 360,190 | |
| | |
Iron Mountain, Inc. | | | | | | | | |
| | |
6.00%, 8/15/2023 | | | 82,000 | | | | 84,050 | |
| | |
5.75%, 8/15/2024 | | | 286,000 | | | | 286,715 | |
| | |
4.88%, 9/15/2027 (a) | | | 260,000 | | | | 246,025 | |
| | |
5.25%, 3/15/2028 (a) | | | 206,000 | | | | 197,245 | |
| | |
MGM Growth Properties Operating Partnership LP | | | | | | | | |
| | |
5.63%, 5/1/2024 | | | 315,000 | | | | 322,087 | |
| | |
4.50%, 9/1/2026 | | | 138,000 | | | | 132,250 | |
| | |
MPT Operating Partnership LP | | | | | | | | |
| | |
6.38%, 3/1/2024 | | | 139,000 | | | | 145,603 | |
| | |
5.25%, 8/1/2026 | | | 122,000 | | | | 123,525 | |
| | |
5.00%, 10/15/2027 | | | 394,000 | | | | 391,045 | |
| | |
SBA Communications Corp. | | | | | | | | |
| | |
4.88%, 7/15/2022 | | | 202,000 | | | | 204,303 | |
| | |
4.00%, 10/1/2022 | | | 229,000 | | | | 226,710 | |
| | |
4.88%, 9/1/2024 | | | 336,000 | | | | 335,580 | |
| | |
Uniti Group LP 6.00%, 4/15/2023 (a) (b) | | | 150,000 | | | | 139,125 | |
| | | | | | | | |
| | |
| | | | | | | 4,423,860 | |
| | | | | | | | |
|
Food & Staples Retailing — 0.1% | |
| | |
Tesco plc (United Kingdom) 6.15%, 11/15/2037 (a) | | | 105,000 | | | | 109,696 | |
| | | | | | | | |
|
Food Products — 1.9% | |
| | |
B&G Foods, Inc. | | | | | | | | |
| | |
4.63%, 6/1/2021 | | | 192,000 | | | | 191,760 | |
| | |
5.25%, 4/1/2025 | | | 242,000 | | | | 231,543 | |
| | |
Lamb Weston Holdings, Inc. | | | | | | | | |
| | |
4.63%, 11/1/2024 (a) | | | 214,000 | | | | 215,070 | |
| | |
4.88%, 11/1/2026 (a) | | | 214,000 | | | | 214,267 | |
| | |
Pilgrim’s Pride Corp. | | | | | | | | |
| | |
5.75%, 3/15/2025 (a) | | | 282,000 | | | | 282,000 | |
| | |
5.88%, 9/30/2027 (a) | | | 217,000 | | | | 213,203 | |
SEE NOTES TO FINANCIAL STATEMENTS.
| | | | | | | | |
| | | |
| FEBRUARY 28, 2019 | | J.P. MORGAN EXCHANGE-TRADED FUNDS | | | | | 43 | |
JPMorgan Disciplined High Yield ETF
SCHEDULE OF PORTFOLIO INVESTMENTS
AS OF FEBRUARY 28, 2019 (continued)
| | | | | | | | |
| INVESTMENTS | | PRINCIPAL
AMOUNT ($) | | | VALUE ($) | |
Corporate Bonds — continued | |
|
Food Products — continued | |
| | |
Post Holdings, Inc. | | | | | | | | |
| | |
5.50%, 3/1/2025 (a) | | | 276,000 | | | | 276,690 | |
| | |
5.00%, 8/15/2026 (a) | | | 482,000 | | | | 463,323 | |
| | |
5.75%, 3/1/2027 (a) | | | 361,000 | | | | 356,036 | |
| | |
5.63%, 1/15/2028 (a) | | | 211,000 | | | | 203,879 | |
| | |
TreeHouse Foods, Inc. 6.00%, 2/15/2024 (a) | | | 204,000 | | | | 210,120 | |
| | | | | | | | |
| | |
| | | | | | | 2,857,891 | |
| | | | | | | | |
|
Gas Utilities — 0.5% | |
| | |
AmeriGas Partners LP | | | | | | | | |
| | |
5.63%, 5/20/2024 | | | 189,000 | | | | 190,890 | |
| | |
5.50%, 5/20/2025 | | | 193,000 | | | | 191,070 | |
| | |
5.88%, 8/20/2026 | | | 189,000 | | | | 189,416 | |
| | |
Suburban Propane Partners LP 5.50%, 6/1/2024 | | | 164,000 | | | | 161,950 | |
| | | | | | | | |
| | |
| | | | | | | 733,326 | |
| | | | | | | | |
|
Health Care Equipment & Supplies — 0.6% | |
| | |
Hologic, Inc. 4.38%, 10/15/2025 (a) | | | 267,000 | | | | 262,328 | |
| | |
Mallinckrodt International Finance SA | | | | | | | | |
| | |
4.88%, 4/15/2020 (a) | | | 193,000 | | | | 192,054 | |
| | |
5.75%, 8/1/2022 (a) (b) | | | 229,000 | | | | 215,260 | |
| | |
5.63%, 10/15/2023 (a) (b) | | | 194,000 | | | | 169,750 | |
| | |
Teleflex, Inc. 4.63%, 11/15/2027 | | | 118,000 | | | | 117,123 | |
| | | | | | | | |
| | |
| | | | | | | 956,515 | |
| | | | | | | | |
|
Health Care Providers & Services — 6.0% | |
| | |
Acadia Healthcare Co., Inc. 5.63%, 2/15/2023 | | | 175,000 | | | | 173,688 | |
| | |
Centene Corp. | | | | | | | | |
| | |
5.63%, 2/15/2021 | | | 396,000 | | | | 401,445 | |
| | |
6.13%, 2/15/2024 | | | 258,000 | | | | 269,932 | |
| | |
4.75%, 1/15/2025 | | | 339,000 | | | | 341,119 | |
| | |
5.38%, 6/1/2026 (a) | | | 483,000 | | | | 501,113 | |
| | |
DaVita, Inc. | | | | | | | | |
| | |
5.75%, 8/15/2022 | | | 349,000 | | | | 355,345 | |
| | |
5.13%, 7/15/2024 | | | 494,000 | | | | 489,060 | |
| | |
5.00%, 5/1/2025 | | | 422,000 | | | | 407,103 | |
| | |
Encompass Health Corp. 5.75%, 11/1/2024 | | | 338,000 | | | | 341,481 | |
| | |
HCA, Inc. | | | | | | | | |
| | |
7.50%, 2/15/2022 | | | 624,000 | | | | 684,060 | |
| | |
5.38%, 2/1/2025 | | | 775,000 | | | | 803,823 | |
| | |
5.63%, 9/1/2028 | | | 468,000 | | | | 483,795 | |
| | |
5.88%, 2/1/2029 | | | 119,000 | | | | 124,801 | |
| | | | | | | | |
| INVESTMENTS | | PRINCIPAL
AMOUNT ($) | | | VALUE ($) | |
| |
|
Health Care Providers & Services — continued | |
| | |
MEDNAX, Inc. | | | | | | | | |
| | |
5.25%, 12/1/2023 (a) | | | 106,000 | | | | 107,192 | |
| | |
6.25%, 1/15/2027 (a) | | | 70,000 | | | | 70,389 | |
| | |
Molina Healthcare, Inc. 5.38%, 11/15/2022 (g) | | | 205,000 | | | | 211,342 | |
| | |
Tenet Healthcare Corp. | | | | | | | | |
| | |
6.00%, 10/1/2020 | | | 470,000 | | | | 484,687 | |
| | |
8.13%, 4/1/2022 | | | 831,000 | | | | 887,092 | |
| | |
6.75%, 6/15/2023 (b) | | | 283,000 | | | | 290,075 | |
| | |
4.63%, 7/15/2024 | | | 538,000 | | | | 534,638 | |
| | |
5.13%, 5/1/2025 | | | 407,000 | | | | 403,439 | |
| | |
6.25%, 2/1/2027 (a) | | | 260,000 | | | | 267,638 | |
| | |
WellCare Health Plans, Inc. | | | | | | | | |
| | |
5.25%, 4/1/2025 | | | 346,000 | | | | 353,248 | |
| | |
5.38%, 8/15/2026 (a) | | | 217,000 | | | | 223,239 | |
| | | | | | | | |
| | |
| | | | | | | 9,209,744 | |
| | | | | | | | |
|
Health Care Technology — 0.4% | |
| | |
IQVIA, Inc. | | | | | | | | |
| | |
4.88%, 5/15/2023 (a) | | | 207,000 | | | | 210,105 | |
| | |
5.00%, 10/15/2026 (a) | | | 400,000 | | | | 407,000 | |
| | | | | | | | |
| | |
| | | | | | | 617,105 | |
| | | | | | | | |
|
Hotels, Restaurants & Leisure — 6.4% | |
| | |
1011778 BC ULC (Canada) | | | | | | | | |
| | |
4.63%, 1/15/2022 (a) | | | 351,000 | | | | 352,316 | |
| | |
4.25%, 5/15/2024 (a) | | | 422,000 | | | | 410,922 | |
| | |
5.00%, 10/15/2025 (a) | | | 822,000 | | | | 797,135 | |
| | |
Boyd Gaming Corp. | | | | | | | | |
| | |
6.88%, 5/15/2023 | | | 202,000 | | | | 211,090 | |
| | |
6.38%, 4/1/2026 | | | 226,000 | | | | 235,605 | |
| | |
6.00%, 8/15/2026 | | | 191,000 | | | | 195,894 | |
| | |
Caesars Resort Collection LLC 5.25%, 10/15/2025 (a) | | | 481,000 | | | | 456,349 | |
| | |
Eldorado Resorts, Inc. | | | | | | | | |
| | |
6.00%, 4/1/2025 | | | 242,000 | | | | 245,932 | |
| | |
6.00%, 9/15/2026 (a) | | | 84,000 | | | | 85,470 | |
| | |
Hilton Domestic Operating Co., Inc. | | | | | | | | |
| | |
4.25%, 9/1/2024 | | | 298,000 | | | | 293,530 | |
| | |
5.13%, 5/1/2026 (a) | | | 432,000 | | | | 434,035 | |
| | |
Hilton Worldwide Finance LLC | | | | | | | | |
| | |
4.63%, 4/1/2025 | | | 244,000 | | | | 242,780 | |
| | |
4.88%, 4/1/2027 | | | 177,000 | | | | 176,115 | |
| | |
International Game Technology plc | | | | | | | | |
| | |
6.25%, 2/15/2022 (a) | | | 600,000 | | | | 627,000 | |
| | |
6.50%, 2/15/2025 (a) | | | 400,000 | | | | 425,500 | |
| | |
6.25%, 1/15/2027 (a) | | | 213,000 | | | | 221,786 | |
SEE NOTES TO FINANCIAL STATEMENTS.
| | | | | | |
| | | |
| 44 | | | | J.P. MORGAN EXCHANGE-TRADED FUNDS | | FEBRUARY 28, 2019 |
| | | | | | | | |
| INVESTMENTS | | PRINCIPAL
AMOUNT ($) | | | VALUE ($) | |
Corporate Bonds — continued | |
|
Hotels, Restaurants & Leisure — continued | |
| | |
KFC Holding Co. | | | | | | | | |
| | |
5.00%, 6/1/2024 (a) | | | 294,000 | | | | 297,757 | |
| | |
5.25%, 6/1/2026 (a) | | | 299,000 | | | | 304,762 | |
| | |
4.75%, 6/1/2027 (a) | | | 200,000 | | | | 196,940 | |
| | |
MGM Resorts International | | | | | | | | |
| | |
6.63%, 12/15/2021 | | | 346,000 | | | | 369,397 | |
| | |
7.75%, 3/15/2022 | | | 213,000 | | | | 233,767 | |
| | |
6.00%, 3/15/2023 | | | 350,000 | | | | 366,188 | |
| | |
5.75%, 6/15/2025 | | | 245,000 | | | | 249,900 | |
| | |
NCL Corp. Ltd. 4.75%, 12/15/2021 (a) | | | 21,000 | | | | 21,361 | |
| | |
Sabre GLBL, Inc. | | | | | | | | |
| | |
5.38%, 4/15/2023 (a) | | | 153,000 | | | | 156,060 | |
| | |
5.25%, 11/15/2023 (a) | | | 144,000 | | | | 146,880 | |
| | |
Scientific Games International, Inc. 5.00%, 10/15/2025 (a) | | | 355,000 | | | | 343,906 | |
| | |
Six Flags Entertainment Corp. | | | | | | | | |
| | |
4.88%, 7/31/2024 (a) | | | 286,000 | | | | 281,710 | |
| | |
5.50%, 4/15/2027 (a) | | | 138,000 | | | | 135,585 | |
| | |
Stars Group Holdings BV (Canada) 7.00%, 7/15/2026 (a) | | | 280,000 | | | | 286,527 | |
| | |
Wyndham Destinations, Inc. 4.25%, 3/1/2022 | | | 172,000 | | | | 171,149 | |
| | |
Wynn Las Vegas LLC | | | | | | | | |
| | |
4.25%, 5/30/2023 (a) | | | 143,000 | | | | 141,212 | |
| | |
5.50%, 3/1/2025 (a) | | | 506,000 | | | | 503,622 | |
| | |
5.25%, 5/15/2027 (a) | | | 263,000 | | | | 251,576 | |
| | | | | | | | |
| | |
| | | | | | | 9,869,758 | |
| | | | | | | | |
|
Household Durables — 1.2% | |
| | |
Brookfield Residential Properties, Inc. (Canada) | | | | | | | | |
| | |
6.50%, 12/15/2020 (a) | | | 152,000 | | | | 152,380 | |
| | |
6.13%, 7/1/2022 (a) | | | 153,000 | | | | 152,044 | |
| | |
Lennar Corp. | | | | | | | | |
| | |
4.50%, 11/15/2019 | | | 23,000 | | | | 23,086 | |
| | |
4.13%, 1/15/2022 | | | 155,000 | | | | 154,225 | |
| | |
4.75%, 11/15/2022 (g) | | | 26,000 | | | | 26,577 | |
| | |
4.50%, 4/30/2024 | | | 169,000 | | | | 167,733 | |
| | |
4.75%, 11/29/2027 | | | 241,000 | | | | 234,071 | |
| | |
MDC Holdings, Inc. 6.00%, 1/15/2043 | | | 144,000 | | | | 122,400 | |
| | |
PulteGroup, Inc. | | | | | | | | |
| | |
4.25%, 3/1/2021 | | | 191,000 | | | | 192,432 | |
| | |
5.50%, 3/1/2026 | | | 216,000 | | | | 217,620 | |
| | |
5.00%, 1/15/2027 | | | 172,000 | | | | 164,690 | |
| | |
Taylor Morrison Communities, Inc. 5.25%, 4/15/2021 (a) | | | 148,000 | | | | 148,185 | |
| | | | | | | | |
| INVESTMENTS | | PRINCIPAL
AMOUNT ($) | | | VALUE ($) | |
| |
|
Household Durables — continued | |
| | |
Tempur Sealy International, Inc. 5.50%, 6/15/2026 | | | 152,000 | | | | 151,620 | |
| | | | | | | | |
| | |
| | | | | | | 1,907,063 | |
| | | | | | | | |
|
Household Products — 0.5% | |
| | |
Energizer Holdings, Inc. | | | | | | | | |
| | |
5.50%, 6/15/2025 (a) | | | 168,000 | | | | 164,220 | |
| | |
6.38%, 7/15/2026 (a) | | | 140,000 | | | | 141,400 | |
| | |
Spectrum Brands, Inc. | | | | | | | | |
| | |
6.63%, 11/15/2022 | | | 151,000 | | | | 154,397 | |
| | |
5.75%, 7/15/2025 | | | 276,000 | | | | 270,135 | |
| | | | | | | | |
| | |
| | | | | | | 730,152 | |
| | | | | | | | |
|
Independent Power and Renewable Electricity Producers — 1.6% | |
| | |
AES Corp. | | | | | | | | |
| | |
4.00%, 3/15/2021 | | | 70,000 | | | | 70,218 | |
| | |
4.88%, 5/15/2023 | | | 192,000 | | | | 193,860 | |
| | |
5.50%, 4/15/2025 | | | 141,000 | | | | 145,406 | |
| | |
Clearway Energy Operating LLC | | | | | | | | |
| | |
5.38%, 8/15/2024 | | | 170,000 | | | | 166,600 | |
| | |
5.75%, 10/15/2025 (a) | | | 150,000 | | | | 147,375 | |
| | |
NRG Energy, Inc. | | | | | | | | |
| | |
7.25%, 5/15/2026 | | | 275,000 | | | | 298,031 | |
| | |
6.63%, 1/15/2027 | | | 350,000 | | | | 372,750 | |
| | |
5.75%, 1/15/2028 | | | 230,000 | | | | 236,038 | |
| | |
Vistra Energy Corp. | | | | | | | | |
| | |
7.38%, 11/1/2022 | | | 457,000 | | | | 474,137 | |
| | |
7.63%, 11/1/2024 | | | 341,000 | | | | 362,313 | |
| | | | | | | | |
| | |
| | | | | | | 2,466,728 | |
| | | | | | | | |
|
Insurance — 0.1% | |
| | |
Genworth Holdings, Inc. 7.63%, 9/24/2021 | | | 179,000 | | | | 174,570 | |
| | | | | | | | |
|
Internet & Direct Marketing Retail — 0.3% | |
| | |
QVC, Inc. | | | | | | | | |
| | |
4.38%, 3/15/2023 | | | 194,000 | | | | 195,601 | |
| | |
4.85%, 4/1/2024 | | | 156,000 | | | | 156,977 | |
| | |
4.45%, 2/15/2025 | | | 154,000 | | | | 149,824 | |
| | | | | | | | |
| | |
| | | | | | | 502,402 | |
| | | | | | | | |
|
IT Services — 2.1% | |
| | |
First Data Corp. | | | | | | | | |
| | |
5.38%, 8/15/2023 (a) | | | 359,000 | | | | 367,437 | |
| | |
5.00%, 1/15/2024 (a) | | | 547,000 | | | | 561,364 | |
| | |
5.75%, 1/15/2024 (a) | | | 633,000 | | | | 653,313 | |
SEE NOTES TO FINANCIAL STATEMENTS.
| | | | | | | | |
| | | |
| FEBRUARY 28, 2019 | | J.P. MORGAN EXCHANGE-TRADED FUNDS | | | | | 45 | |
JPMorgan Disciplined High Yield ETF
SCHEDULE OF PORTFOLIO INVESTMENTS
AS OF FEBRUARY 28, 2019 (continued)
| | | | | | | | |
| INVESTMENTS | | PRINCIPAL
AMOUNT ($) | | | VALUE ($) | |
Corporate Bonds — continued | |
|
IT Services — continued | |
| | |
VeriSign, Inc. | | | | | | | | |
| | |
4.63%, 5/1/2023 | | | 216,000 | | | | 219,685 | |
| | |
5.25%, 4/1/2025 | | | 138,000 | | | | 143,347 | |
| | |
4.75%, 7/15/2027 | | | 158,000 | | | | 156,025 | |
| | |
Zayo Group LLC | | | | | | | | |
| | |
6.00%, 4/1/2023 | | | 438,000 | | | | 443,475 | |
| | |
6.38%, 5/15/2025 | | | 257,000 | | | | 255,073 | |
| | |
5.75%, 1/15/2027 (a) | | | 503,000 | | | | 487,910 | |
| | | | | | | | |
| | |
| | | | | | | 3,287,629 | |
| | | | | | | | |
|
Leisure Products — 0.3% | |
| | |
Mattel, Inc. 6.75%, 12/31/2025 (a) | | | 421,000 | | | | 414,685 | |
| | | | | | | | |
|
Machinery — 0.5% | |
| | |
Novelis Corp. | | | | | | | | |
| | |
6.25%, 8/15/2024 (a) | | | 332,000 | | | | 334,387 | |
| | |
5.88%, 9/30/2026 (a) | | | 437,000 | | | | 426,075 | |
| | | | | | | | |
| | |
| | | | | | | 760,462 | |
| | | | | | | | |
|
Media — 9.6% | |
| | |
Altice Financing SA (Luxembourg) | | | | | | | | |
| | |
6.63%, 2/15/2023 (a) | | | 600,000 | | | | 616,494 | |
| | |
7.50%, 5/15/2026 (a) | | | 850,000 | | | | 822,375 | |
| | |
AMC Networks, Inc. | | | | | | | | |
| | |
4.75%, 12/15/2022 | | | 155,000 | | | | 157,131 | |
| | |
5.00%, 4/1/2024 | | | 308,000 | | | | 305,595 | |
| | |
4.75%, 8/1/2025 | | | 218,000 | | | | 212,005 | |
| | |
Cablevision Systems Corp. | | | | | | | | |
| | |
8.00%, 4/15/2020 | | | 70,000 | | | | 73,346 | |
| | |
5.88%, 9/15/2022 | | | 92,000 | | | | 94,904 | |
| | |
Clear Channel Worldwide Holdings, Inc. | | | | | | | | |
| | |
Series A, 6.50%, 11/15/2022 | | | 196,000 | | | | 200,165 | |
| | |
Series B, 6.50%, 11/15/2022 | | | 561,000 | | | | 573,622 | |
| | |
CSC Holdings LLC | | | | | | | | |
| | |
5.13%, 12/15/2021 (a) | | | 413,000 | | | | 414,297 | |
| | |
5.38%, 7/15/2023 (a) | | | 400,000 | | | | 411,080 | |
| | |
7.75%, 7/15/2025 (a) | | | 400,000 | | | | 427,000 | |
| | |
10.88%, 10/15/2025 (a) | | | 567,000 | | | | 657,720 | |
| | |
5.50%, 5/15/2026 (a) | | | 400,000 | | | | 406,000 | |
| | |
5.50%, 4/15/2027 (a) | | | 400,000 | | | | 402,000 | |
| | |
7.50%, 4/1/2028 (a) | | | 400,000 | | | | 422,000 | |
| | |
DISH DBS Corp. | | | | | | | | |
| | |
6.75%, 6/1/2021 | | | 572,000 | | | | 584,870 | |
| | |
5.88%, 7/15/2022 | | | 573,000 | | | | 547,215 | |
| | |
5.88%, 11/15/2024 | | | 570,000 | | | | 480,054 | |
| | | | | | | | |
| INVESTMENTS | | PRINCIPAL
AMOUNT ($) | | | VALUE ($) | |
| |
|
Media — continued | |
| | |
Gray Television, Inc. | | | | | | | | |
| | |
5.13%, 10/15/2024 (a) | | | 152,000 | | | | 151,430 | |
| | |
5.88%, 7/15/2026 (a) | | | 202,000 | | | | 204,020 | |
| | |
7.00%, 5/15/2027 (a) | | | 106,000 | | | | 112,095 | |
| | |
Lamar Media Corp. | | | | | | | | |
| | |
5.00%, 5/1/2023 | | | 145,000 | | | | 147,537 | |
| | |
5.38%, 1/15/2024 | | | 142,000 | | | | 145,905 | |
| | |
Meredith Corp. 6.88%, 2/1/2026 (a) | | | 393,000 | | | | 405,890 | |
| | |
Nexstar Broadcasting, Inc. 5.63%, 8/1/2024 (a) | | | 249,000 | | | | 247,132 | |
| | |
Outfront Media Capital LLC | | | | | | | | |
| | |
5.25%, 2/15/2022 | | | 146,000 | | | | 148,234 | |
| | |
5.63%, 2/15/2024 | | | 148,000 | | | | 151,515 | |
| | |
Quebecor Media, Inc. (Canada) 5.75%, 1/15/2023 | | | 247,000 | | | | 255,877 | |
| | |
Sinclair Television Group, Inc. | | | | | | | | |
| | |
5.38%, 4/1/2021 | | | 152,000 | | | | 152,190 | |
| | |
6.13%, 10/1/2022 | | | 127,000 | | | | 129,819 | |
| | |
5.63%, 8/1/2024 (a) | | | 150,000 | | | | 151,500 | |
| | |
Sirius XM Radio, Inc. | | | | | | | | |
| | |
3.88%, 8/1/2022 (a) | | | 305,000 | | | | 303,002 | |
| | |
6.00%, 7/15/2024 (a) | | | 437,000 | | | | 452,842 | |
| | |
5.38%, 4/15/2025 (a) | | | 36,000 | | | | 36,686 | |
| | |
5.00%, 8/1/2027 (a) | | | 437,000 | | | | 427,159 | |
| | |
TEGNA, Inc. | | | | | | | | |
| | |
5.13%, 7/15/2020 | | | 173,000 | | | | 174,514 | |
| | |
6.38%, 10/15/2023 | | | 188,000 | | | | 193,640 | |
| | |
Telenet Finance Luxembourg Notes SARL (Belgium) 5.50%, 3/1/2028 (a) | | | 400,000 | | | | 385,000 | |
| | |
Tribune Media Co. 5.88%, 7/15/2022 | | | 296,000 | | | | 301,180 | |
| | |
Unitymedia GmbH (Germany) 6.13%, 1/15/2025 (a) | | | 400,000 | | | | 414,000 | |
| | |
Unitymedia Hessen GmbH & Co. KG (Germany) 5.00%, 1/15/2025 (a) | | | 200,000 | | | | 204,750 | |
| | |
UPC Holding BV (Netherlands) 5.50%, 1/15/2028 (a) | | | 200,000 | | | | 205,500 | |
| | |
UPCB Finance IV Ltd. (Netherlands) 5.38%, 1/15/2025 (a) | | | 400,000 | | | | 410,324 | |
| | |
Videotron Ltd. (Canada) | | | | | | | | |
| | |
5.00%, 7/15/2022 | | | 221,000 | | | | 225,973 | |
| | |
5.13%, 4/15/2027 (a) | | | 172,000 | | | | 174,580 | |
| | |
Ziggo Bond Co. BV (Netherlands) 6.00%, 1/15/2027 (a) | | | 150,000 | | | | 142,125 | |
| | |
Ziggo BV (Netherlands) 5.50%, 1/15/2027 (a) | | | 600,000 | | | | 579,000 | |
| | | | | | | | |
| | |
| | | | | | | 14,841,292 | |
| | | | | | | | |
SEE NOTES TO FINANCIAL STATEMENTS.
| | | | | | |
| | | |
| 46 | | | | J.P. MORGAN EXCHANGE-TRADED FUNDS | | FEBRUARY 28, 2019 |
| | | | | | | | |
| INVESTMENTS | | PRINCIPAL
AMOUNT ($) | | | VALUE ($) | |
Corporate Bonds — continued | |
|
Metals & Mining — 3.5% | |
| | |
Alcoa Nederland Holding BV | | | | | | | | |
| | |
6.75%, 9/30/2024 (a) | | | 200,000 | | | | 211,250 | |
| | |
7.00%, 9/30/2026 (a) | | | 200,000 | | | | 214,000 | |
| | |
6.13%, 5/15/2028 (a) | | | 200,000 | | | | 204,750 | |
| | |
Allegheny Technologies, Inc. | | | | | | | | |
| | |
5.95%, 1/15/2021 | | | 155,000 | | | | 159,294 | |
| | |
7.88%, 8/15/2023 (g) | | | 167,000 | | | | 182,915 | |
| | |
Cleveland-Cliffs, Inc. 5.75%, 3/1/2025 | | | 315,000 | | | | 307,912 | |
| | |
Constellium NV | | | | | | | | |
| | |
6.63%, 3/1/2025 (a) | | | 250,000 | | | | 251,875 | |
| | |
5.88%, 2/15/2026 (a) | | | 250,000 | | | | 243,125 | |
| | |
FMG Resources August 2006 Pty. Ltd. (Australia) | | | | | | | | |
| | |
4.75%, 5/15/2022 (a) | | | 200,000 | | | | 200,000 | |
| | |
5.13%, 3/15/2023 (a) | | | 151,000 | | | | 150,623 | |
| | |
5.13%, 5/15/2024 (a) | | | 226,000 | | | | 223,740 | |
| | |
Freeport-McMoRan, Inc. | | | | | | | | |
| | |
3.55%, 3/1/2022 | | | 543,000 | | | | 536,891 | |
| | |
3.88%, 3/15/2023 | | | 555,000 | | | | 546,941 | |
| | |
5.45%, 3/15/2043 | | | 535,000 | | | | 469,463 | |
| | |
Hudbay Minerals, Inc. (Canada) 7.63%, 1/15/2025 (a) | | | 84,000 | | | | 87,045 | |
| | |
Steel Dynamics, Inc. | | | | | | | | |
| | |
5.13%, 10/1/2021 | | | 182,000 | | | | 183,024 | |
| | |
5.50%, 10/1/2024 | | | 139,000 | | | | 142,822 | |
| | |
Teck Resources Ltd. (Canada) | | | | | | | | |
| | |
8.50%, 6/1/2024 (a) | | | 173,000 | | | | 185,759 | |
| | |
6.13%, 10/1/2035 | | | 176,000 | | | | 185,409 | |
| | |
6.25%, 7/15/2041 | | | 243,000 | | | | 253,570 | |
| | |
United States Steel Corp. | | | | | | | | |
| | |
6.88%, 8/15/2025 | | | 228,000 | | | | 224,580 | |
| | |
6.25%, 3/15/2026 | | | 195,000 | | | | 184,519 | |
| | | | | | | | |
| | |
| | | | | | | 5,349,507 | |
| | | | | | | | |
|
Mortgage Real Estate Investment Trusts (REITs) — 0.3% | |
| | |
Starwood Property Trust, Inc. | | | | | | | | |
| | |
3.63%, 2/1/2021 | | | 127,000 | | | | 126,206 | |
| | |
5.00%, 12/15/2021 | | | 185,000 | | | | 188,931 | |
| | |
4.75%, 3/15/2025 | | | 107,000 | | | | 104,090 | |
| | | | | | | | |
| | |
| | | | | | | 419,227 | |
| | | | | | | | |
|
Oil, Gas & Consumable Fuels — 13.0% | |
| | |
Antero Resources Corp. | | | | | | | | |
| | |
5.38%, 11/1/2021 | | | 287,000 | | | | 288,076 | |
| | |
5.13%, 12/1/2022 | | | 300,000 | | | | 300,480 | |
| | |
5.63%, 6/1/2023 | | | 201,000 | | | | 201,503 | |
| | | | | | | | |
| INVESTMENTS | | PRINCIPAL
AMOUNT ($) | | | VALUE ($) | |
| |
|
Oil, Gas & Consumable Fuels — continued | |
| | |
Carrizo Oil & Gas, Inc. 6.25%, 4/15/2023 (b) | | | 102,000 | | | | 100,597 | |
| | |
Cheniere Corpus Christi Holdings LLC | | | | | | | | |
| | |
7.00%, 6/30/2024 | | | 415,000 | | | | 459,612 | |
| | |
5.88%, 3/31/2025 | | | 468,000 | | | | 498,425 | |
| | |
5.13%, 6/30/2027 | | | 468,000 | | | | 477,360 | |
| | |
Cheniere Energy Partners LP | | | | | | | | |
| | |
5.25%, 10/1/2025 | | | 467,000 | | | | 472,837 | |
| | |
5.63%, 10/1/2026 (a) | | | 346,000 | | | | 352,488 | |
| | |
Chesapeake Energy Corp. | | | | | | | | |
| | |
7.00%, 10/1/2024 (b) | | | 280,000 | | | | 276,500 | |
| | |
8.00%, 1/15/2025 (b) | | | 385,000 | | | | 391,256 | |
| | |
8.00%, 6/15/2027 (b) | | | 400,000 | | | | 396,140 | |
| | |
CNX Resources Corp. 5.88%, 4/15/2022 | | | 378,000 | | | | 381,780 | |
| | |
Continental Resources, Inc. | | | | | | | | |
| | |
5.00%, 9/15/2022 | | | 450,000 | | | | 454,493 | |
| | |
4.50%, 4/15/2023 | | | 422,000 | | | | 430,565 | |
| | |
3.80%, 6/1/2024 | | | 276,000 | | | | 271,859 | |
| | |
4.38%, 1/15/2028 | | | 224,000 | | | | 222,963 | |
| | |
Crestwood Midstream Partners LP | | | | | | | | |
| | |
6.25%, 4/1/2023 (g) | | | 188,000 | | | | 192,986 | |
| | |
5.75%, 4/1/2025 | | | 135,000 | | | | 135,886 | |
| | |
DCP Midstream LP Series A, (ICE LIBOR USD 3 Month + 5.15%), 7.38%, 12/15/2022 (c) (d) (e) | | | 107,000 | | | | 102,939 | |
| | |
DCP Midstream Operating LP | | | | | | | | |
| | |
5.35%, 3/15/2020 (a) | | | 156,000 | | | | 158,730 | |
| | |
3.88%, 3/15/2023 | | | 63,000 | | | | 62,527 | |
| | |
5.38%, 7/15/2025 | | | 257,000 | | | | 267,280 | |
| | |
(ICE LIBOR USD 3 Month + 3.85%), 5.85%, 5/21/2043 (a) (d) | | | 162,000 | | | | 143,370 | |
| | |
Denbury Resources, Inc. 9.00%, 5/15/2021 (a) | | | 145,000 | | | | 146,269 | |
| | |
Diamondback Energy, Inc. | | | | | | | | |
| | |
4.75%, 11/1/2024 | | | 137,000 | | | | 138,541 | |
| | |
5.38%, 5/31/2025 | | | 225,000 | | | | 232,875 | |
| | |
Energy Transfer LP | | | | | | | | |
| | |
7.50%, 10/15/2020 | | | 337,000 | | | | 358,063 | |
| | |
4.25%, 3/15/2023 | | | 279,000 | | | | 282,543 | |
| | |
5.88%, 1/15/2024 | | | 314,000 | | | | 336,765 | |
| | |
5.50%, 6/1/2027 | | | 56,000 | | | | 58,800 | |
| | |
Energy Transfer Operating LP | | | | | | | | |
| | |
Series A, (ICE LIBOR USD 3 Month + 4.03%), 6.25%, 2/15/2023 (c) (d) (e) | | | 296,000 | | | | 269,360 | |
SEE NOTES TO FINANCIAL STATEMENTS.
| | | | | | | | |
| | | |
| FEBRUARY 28, 2019 | | J.P. MORGAN EXCHANGE-TRADED FUNDS | | | | | 47 | |
JPMorgan Disciplined High Yield ETF
SCHEDULE OF PORTFOLIO INVESTMENTS
AS OF FEBRUARY 28, 2019 (continued)
| | | | | | | | |
| INVESTMENTS | | PRINCIPAL
AMOUNT ($) | | | VALUE ($) | |
Corporate Bonds — continued | |
|
Oil, Gas & Consumable Fuels — continued | |
| | |
Series B, (ICE LIBOR USD 3 Month + 4.16%), 6.63%, 2/15/2028 (c) (d) (e) | | | 160,000 | | | | 145,600 | |
| | |
EnLink Midstream Partners LP | | | | | | | | |
| | |
4.40%, 4/1/2024 | | | 160,000 | | | | 155,400 | |
| | |
4.15%, 6/1/2025 | | | 206,000 | | | | 196,215 | |
| | |
5.45%, 6/1/2047 | | | 140,000 | | | | 123,550 | |
| | |
Genesis Energy LP | | | | | | | | |
| | |
6.75%, 8/1/2022 | | | 194,000 | | | | 197,395 | |
| | |
6.50%, 10/1/2025 | | | 162,000 | | | | 155,115 | |
| | |
Gulfport Energy Corp. | | | | | | | | |
| | |
6.00%, 10/15/2024 | | | 186,000 | | | | 168,330 | |
| | |
6.38%, 5/15/2025 | | | 164,000 | | | | 146,780 | |
| | |
Matador Resources Co. 5.88%, 9/15/2026 | | | 298,000 | | | | 296,510 | |
| | |
MEG Energy Corp. (Canada) | | | | | | | | |
| | |
6.38%, 1/30/2023 (a) (b) | | | 225,000 | | | | 205,312 | |
| | |
7.00%, 3/31/2024 (a) | | | 275,000 | | | | 251,625 | |
| | |
6.50%, 1/15/2025 (a) | | | 236,000 | | | | 231,870 | |
| | |
Murphy Oil Corp. | | | | | | | | |
| | |
4.00%, 6/1/2022 (b) | | | 10,000 | | | | 9,914 | |
| | |
4.45%, 12/1/2022 (g) | | | 164,000 | | | | 163,197 | |
| | |
6.88%, 8/15/2024 | | | 160,000 | | | | 169,243 | |
| | |
5.75%, 8/15/2025 | | | 160,000 | | | | 162,519 | |
| | |
Newfield Exploration Co. | | | | | | | | |
| | |
5.75%, 1/30/2022 | | | 200,000 | | | | 210,500 | |
| | |
5.63%, 7/1/2024 | | | 287,000 | | | | 306,911 | |
| | |
5.38%, 1/1/2026 | | | 189,000 | | | | 199,395 | |
| | |
NGL Energy Partners LP 7.50%, 11/1/2023 | | | 169,000 | | | | 174,281 | |
| | |
NuStar Logistics LP 5.63%, 4/28/2027 | | | 171,000 | | | | 171,427 | |
| | |
Oasis Petroleum, Inc. 6.88%, 3/15/2022 | | | 233,000 | | | | 232,709 | |
| | |
Parsley Energy LLC | | | | | | | | |
| | |
5.38%, 1/15/2025 (a) | | | 186,000 | | | | 186,465 | |
| | |
5.63%, 10/15/2027 (a) | | | 218,000 | | | | 215,820 | |
| | |
PBF Holding Co. LLC 7.25%, 6/15/2025 | | | 203,000 | | | | 208,176 | |
| | |
PDC Energy, Inc. 5.75%, 5/15/2026 | | | 187,000 | | | | 180,689 | |
| | |
Peabody Energy Corp. | | | | | | | | |
| | |
6.00%, 3/31/2022 (a) | | | 139,000 | | | | 140,216 | |
| | |
6.38%, 3/31/2025 (a) | | | 127,000 | | | | 125,032 | |
| | |
QEP Resources, Inc. | | | | | | | | |
| | |
5.38%, 10/1/2022 | | | 155,000 | | | | 152,287 | |
| | |
5.25%, 5/1/2023 | | | 186,000 | | | | 179,025 | |
| | |
5.63%, 3/1/2026 (b) | | | 138,000 | | | | 129,375 | |
| | |
Range Resources Corp. | | | | | | | | |
| | |
5.00%, 8/15/2022 | | | 152,000 | | | | 149,910 | |
| | | | | | | | |
| INVESTMENTS | | PRINCIPAL
AMOUNT ($) | | | VALUE ($) | |
| |
|
Oil, Gas & Consumable Fuels — continued | |
| | |
5.00%, 3/15/2023 | | | 206,000 | | | | 199,047 | |
| | |
4.88%, 5/15/2025 (b) | | | 212,000 | | | | 194,179 | |
| | |
Seven Generations Energy Ltd. (Canada) 5.38%, 9/30/2025 (a) | | | 203,000 | | | | 195,388 | |
| | |
SM Energy Co. | | | | | | | | |
| | |
6.13%, 11/15/2022 | | | 150,000 | | | | 149,250 | |
| | |
5.63%, 6/1/2025 | | | 140,000 | | | | 130,900 | |
| | |
6.75%, 9/15/2026 | | | 131,000 | | | | 125,433 | |
| | |
6.63%, 1/15/2027 (b) | | | 156,000 | | | | 148,590 | |
| | |
Southwestern Energy Co. | | | | | | | | |
| | |
6.20%, 1/23/2025 (g) | | | 308,000 | | | | 304,828 | |
| | |
7.50%, 4/1/2026 | | | 174,000 | | | | 180,960 | |
| | |
7.75%, 10/1/2027 | | | 156,000 | | | | 162,045 | |
| | |
Sunoco LP | | | | | | | | |
| | |
4.88%, 1/15/2023 | | | 312,000 | | | | 315,900 | |
| | |
5.50%, 2/15/2026 | | | 226,000 | | | | 224,486 | |
| | |
Tallgrass Energy Partners LP | | | | | | | | |
| | |
4.75%, 10/1/2023 (a) | | | 70,000 | | | | 69,825 | |
| | |
5.50%, 9/15/2024 (a) | | | 200,000 | | | | 204,310 | |
| | |
5.50%, 1/15/2028 (a) | | | 213,000 | | | | 212,468 | |
| | |
Targa Resources Partners LP | | | | | | | | |
| | |
4.25%, 11/15/2023 | | | 144,000 | | | | 142,200 | |
| | |
6.75%, 3/15/2024 | | | 34,000 | | | | 35,615 | |
| | |
5.88%, 4/15/2026 (a) | | | 283,000 | | | | 294,320 | |
| | |
6.50%, 7/15/2027 (a) | | | 234,000 | | | | 247,455 | |
| | |
5.00%, 1/15/2028 | | | 198,000 | | | | 192,307 | |
| | |
6.88%, 1/15/2029 (a) | | | 234,000 | | | | 249,064 | |
| | |
TerraForm Power Operating LLC | | | | | | | | |
| | |
4.25%, 1/31/2023 (a) | | | 122,000 | | | | 120,867 | |
| | |
5.00%, 1/31/2028 (a) | | | 182,000 | | | | 172,900 | |
| | |
Whiting Petroleum Corp. | | | | | | | | |
| | |
5.75%, 3/15/2021 | | | 229,000 | | | | 231,576 | |
| | |
6.63%, 1/15/2026 | | | 312,000 | | | | 305,760 | |
| | |
WPX Energy, Inc. | | | | | | | | |
| | |
6.00%, 1/15/2022 | | | 165,000 | | | | 170,363 | |
| | |
8.25%, 8/1/2023 | | | 92,000 | | | | 103,155 | |
| | |
5.25%, 9/15/2024 | | | 172,000 | | | | 171,355 | |
| | |
5.75%, 6/1/2026 | | | 156,000 | | | | 156,585 | |
| | | | | | | | |
| | |
| | | | | | | 20,015,792 | |
| | | | | | | | |
|
Personal Products — 0.2% | |
| | |
Edgewell Personal Care Co. | | | | | | | | |
| | |
4.70%, 5/19/2021 | | | 155,000 | | | | 156,937 | |
| | |
4.70%, 5/24/2022 | | | 120,000 | | | | 120,730 | |
| | | | | | | | |
| | |
| | | | | | | 277,667 | |
| | | | | | | | |
SEE NOTES TO FINANCIAL STATEMENTS.
| | | | | | |
| | | |
| 48 | | | | J.P. MORGAN EXCHANGE-TRADED FUNDS | | FEBRUARY 28, 2019 |
| | | | | | | | |
| INVESTMENTS | | PRINCIPAL
AMOUNT ($) | | | VALUE ($) | |
Corporate Bonds — continued | |
|
Pharmaceuticals — 2.3% | |
| | |
Bausch Health Cos., Inc. | | | | | | | | |
| | |
6.50%, 3/15/2022 (a) | | | 247,000 | | | | 255,954 | |
| | |
5.88%, 5/15/2023 (a) | | | 918,000 | | | | 913,410 | |
| | |
7.00%, 3/15/2024 (a) | | | 564,000 | | | | 594,315 | |
| | |
6.13%, 4/15/2025 (a) | | | 918,000 | | | | 883,575 | |
| | |
5.50%, 11/1/2025 (a) | | | 363,000 | | | | 366,176 | |
| | |
Elanco Animal Health, Inc. | | | | | | | | |
| | |
3.91%, 8/27/2021 (a) | | | 70,000 | | | | 70,762 | |
| | |
4.27%, 8/28/2023 (a) | | | 217,000 | | | | 220,213 | |
| | |
4.90%, 8/28/2028 (a) | | | 217,000 | | | | 224,814 | |
| | | | | | | | |
| | |
| | | | | | | 3,529,219 | |
| | | | | | | | |
|
Real Estate Management & Development — 0.6% | |
| | |
Howard Hughes Corp. (The) 5.38%, 3/15/2025 (a) | | | 284,000 | | | | 281,279 | |
| | |
Kennedy-Wilson, Inc. 5.88%, 4/1/2024 | | | 319,000 | | | | 313,803 | |
| | |
Realogy Group LLC | | | | | | | | |
| | |
5.25%, 12/1/2021 (a) | | | 146,000 | | | | 145,635 | |
| | |
4.88%, 6/1/2023 (a) (b) | | | 135,000 | | | | 122,513 | |
| | | | | | | | |
| | |
| | | | | | | 863,230 | |
| | | | | | | | |
|
Road & Rail — 1.3% | |
| | |
Avis Budget Car Rental LLC 5.50%, 4/1/2023 | | | 179,000 | | | | 181,014 | |
| | |
Avolon Holdings Funding Ltd. (Ireland) 5.13%, 10/1/2023 (a) | | | 142,000 | | | | 143,420 | |
| | |
Herc Rentals, Inc. | | | | | | | | |
| | |
7.50%, 6/1/2022 (a) (b) | | | 38,000 | | | | 39,615 | |
| | |
7.75%, 6/1/2024 (a) (b) | | | 39,000 | | | | 41,595 | |
| | |
Hertz Corp. (The) | | | | | | | | |
| | |
5.88%, 10/15/2020 | | | 169,000 | | | | 169,000 | |
| | |
7.63%, 6/1/2022 (a) | | | 348,000 | | | | 355,830 | |
| | |
5.50%, 10/15/2024 (a) | | | 205,000 | | | | 174,250 | |
| | |
Park Aerospace Holdings Ltd. (Ireland) | | | | | | | | |
| | |
5.25%, 8/15/2022 (a) | | | 497,000 | | | | 508,784 | |
| | |
4.50%, 3/15/2023 (a) | | | 65,000 | | | | 64,512 | |
| | |
5.50%, 2/15/2024 (a) | | | 365,000 | | | | 377,319 | |
| | | | | | | | |
| | |
| | | | | | | 2,055,339 | |
| | | | | | | | |
|
Semiconductors & Semiconductor Equipment — 0.1% | |
| | |
Sensata Technologies UK Financing Co. plc 6.25%, 2/15/2026 (a) | | | 200,000 | | | | 211,000 | |
| | | | | | | | |
|
Software — 1.1% | |
| | |
CDK Global, Inc. | | | | | | | | |
| | |
5.00%, 10/15/2024 (g) | | | 144,000 | | | | 146,160 | |
| | |
5.88%, 6/15/2026 | | | 143,000 | | | | 147,469 | |
| | |
4.88%, 6/1/2027 | | | 172,000 | | | | 169,026 | |
| | | | | | | | |
| INVESTMENTS | | PRINCIPAL
AMOUNT ($) | | | VALUE ($) | |
| |
|
Software — continued | |
| | |
Nuance Communications, Inc. 5.63%, 12/15/2026 | | | 144,000 | | | | 146,880 | |
| | |
Open Text Corp. (Canada) | | | | | | | | |
| | |
5.63%, 1/15/2023 (a) | | | 238,000 | | | | 244,247 | |
| | |
5.88%, 6/1/2026 (a) | | | 247,000 | | | | 259,864 | |
| | |
Symantec Corp. | | | | | | | | |
| | |
4.20%, 9/15/2020 | | | 225,000 | | | | 227,470 | |
| | |
5.00%, 4/15/2025 (a) | | | 324,000 | | | | 322,774 | |
| | | | | | | | |
| | |
| | | | | | | 1,663,890 | |
| | | | | | | | |
| | | | | | | | |
|
Specialty Retail — 0.8% | |
| | |
Bed Bath & Beyond, Inc. 5.17%, 8/1/2044 | | | 128,000 | | | | 94,560 | |
| | |
L Brands, Inc. | | | | | | | | |
| | |
6.63%, 4/1/2021 | | | 214,000 | | | | 222,560 | |
| | |
5.63%, 2/15/2022 | | | 259,000 | | | | 263,209 | |
| | |
5.25%, 2/1/2028 | | | 87,000 | | | | 75,255 | |
| | |
6.88%, 11/1/2035 | | | 258,000 | | | | 222,525 | |
| | |
Penske Automotive Group, Inc. | | | | | | | | |
| | |
5.75%, 10/1/2022 | | | 147,000 | | | | 149,205 | |
| | |
5.50%, 5/15/2026 | | | 116,000 | | | | 113,819 | |
| | |
Sally Holdings LLC 5.63%, 12/1/2025 | | | 26,000 | | | | 25,512 | |
| | | | | | | | |
| | |
| | | | | | | 1,166,645 | |
| | | | | | | | |
|
Technology Hardware, Storage & Peripherals — 2.2% | |
| | |
Dell International LLC | | | | | | | | |
| | |
5.88%, 6/15/2021 (a) | | | 300,000 | | | | 305,911 | |
| | |
7.13%, 6/15/2024 (a) | | | 500,000 | | | | 530,567 | |
| | |
EMC Corp. | | | | | | | | |
| | |
2.65%, 6/1/2020 | | | 575,000 | | | | 569,138 | |
| | |
3.38%, 6/1/2023 | | | 294,000 | | | | 282,315 | |
| | |
NCR Corp. | | | | | | | | |
| | |
4.63%, 2/15/2021 | | | 138,000 | | | | 137,310 | |
| | |
5.00%, 7/15/2022 | | | 177,000 | | | | 176,980 | |
| | |
6.38%, 12/15/2023 | | | 204,000 | | | | 206,952 | |
| | |
Western Digital Corp. 4.75%, 2/15/2026 | | | 661,000 | | | | 624,645 | |
| | |
Xerox Corp. | | | | | | | | |
| | |
4.50%, 5/15/2021 | | | 300,000 | | | | 303,750 | |
| | |
3.62%, 3/15/2023 (g) | | | 300,000 | | | | 294,375 | |
| | | | | | | | |
| | |
| | | | | | | 3,431,943 | |
| | | | | | | | |
|
Textiles, Apparel & Luxury Goods — 0.3% | |
| | |
Hanesbrands, Inc. | | | | | | | | |
| | |
4.63%, 5/15/2024 (a) | | | 245,000 | | | | 244,730 | |
| | |
4.88%, 5/15/2026 (a) | | | 272,000 | | | | 267,920 | |
| | | | | | | | |
| | |
| | | | | | | 512,650 | |
| | | | | | | | |
SEE NOTES TO FINANCIAL STATEMENTS.
| | | | | | | | |
| | | |
| FEBRUARY 28, 2019 | | J.P. MORGAN EXCHANGE-TRADED FUNDS | | | | | 49 | |
JPMorgan Disciplined High Yield ETF
SCHEDULE OF PORTFOLIO INVESTMENTS
AS OF FEBRUARY 28, 2019 (continued)
| | | | | | | | |
| INVESTMENTS | | PRINCIPAL
AMOUNT ($) | | | VALUE ($) | |
Corporate Bonds — continued | |
|
Thrifts & Mortgage Finance — 0.5% | |
| | |
Ladder Capital Finance Holdings LLLP 5.25%, 3/15/2022 (a) | | | 137,000 | | | | 139,055 | |
| | |
Nationstar Mortgage Holdings, Inc. | | | | | | | | |
| | |
8.13%, 7/15/2023 (a) | | | 275,000 | | | | 279,812 | |
| | |
9.13%, 7/15/2026 (a) | | | 217,000 | | | | 221,883 | |
| | |
Nationstar Mortgage LLC 6.50%, 7/1/2021 | | | 170,000 | | | | 170,495 | |
| | | | | | | | |
| | |
| | | | | | | 811,245 | |
| | | | | | | | |
|
Tobacco — 0.1% | |
| | |
Vector Group Ltd. 6.13%, 2/1/2025 (a) | | | 120,000 | | | | 106,200 | |
| | | | | | | | |
|
Trading Companies & Distributors — 1.1% | |
| | |
Beacon Roofing Supply, Inc. 4.88%, 11/1/2025 (a) | | | 375,000 | | | | 349,101 | |
| | |
United Rentals North America, Inc. | | | | | | | | |
| | |
4.63%, 7/15/2023 | | | 131,000 | | | | 133,522 | |
| | |
5.88%, 9/15/2026 | | | 260,000 | | | | 266,175 | |
| | |
6.50%, 12/15/2026 | | | 282,000 | | | | 294,337 | |
| | |
5.50%, 5/15/2027 | | | 261,000 | | | | 261,000 | |
| | |
4.88%, 1/15/2028 | | | 467,000 | | | | 445,892 | |
| | | | | | | | |
| | |
| | | | | | | 1,750,027 | |
| | | | | | | | |
|
Wireless Telecommunication Services — 4.0% | |
| | |
C&W Senior Financing DAC (Ireland) | | | | | | | | |
| | |
7.50%, 10/15/2026 (a) | | | 200,000 | | | | 204,010 | |
| | |
6.88%, 9/15/2027 (a) | | | 200,000 | | | | 196,000 | |
| | |
Hughes Satellite Systems Corp. | | | | | | | | |
| | |
6.50%, 6/15/2019 | | | 212,000 | | | | 213,325 | |
| | |
7.63%, 6/15/2021 | | | 245,000 | | | | 262,762 | |
| | |
5.25%, 8/1/2026 | | | 227,000 | | | | 221,893 | |
| | |
6.63%, 8/1/2026 | | | 195,000 | | | | 191,831 | |
| | |
Inmarsat Finance plc (United Kingdom) 4.88%, 5/15/2022 (a) | | | 300,000 | | | | 300,000 | |
| | |
Millicom International Cellular SA (Colombia) | | | | | | | | |
| | |
6.00%, 3/15/2025 (a) | | | 200,000 | | | | 203,000 | |
| | |
5.13%, 1/15/2028 (a) | | | 200,000 | | | | 189,500 | |
| | |
Sprint Corp. | | | | | | | | |
| | |
7.88%, 9/15/2023 | | | 1,232,000 | | | | 1,316,700 | |
| | |
7.13%, 6/15/2024 | | | 746,000 | | | | 770,790 | |
| | |
T-Mobile USA, Inc. | | | | | | | | |
| | |
6.38%, 3/1/2025 ‡ | | | 369,000 | | | | — | |
| | |
6.38%, 3/1/2025 | | | 524,000 | | | | 545,287 | |
| | |
6.50%, 1/15/2026 ‡ | | | 432,000 | | | | — | |
| | |
6.50%, 1/15/2026 | | | 621,000 | | | | 662,918 | |
| | |
4.75%, 2/1/2028 ‡ | | | 168,000 | | | | — | |
| | |
4.75%, 2/1/2028 | | | 456,000 | | | | 441,180 | |
| | | | | | | | |
| INVESTMENTS | | PRINCIPAL
AMOUNT ($) | | | VALUE ($) | |
| |
|
Wireless Telecommunication Services — continued | |
| | |
Wind Tre SpA (Italy) 5.00%, 1/20/2026 (a) | | | 600,000 | | | | 517,260 | |
| | | | | | | | |
| | |
| | | | | | | 6,236,456 | |
| | | | | | | | |
| |
Total Corporate Bonds
(Cost $152,254,667) | | | | 150,843,110 | |
| | | | | | | | |
| | |
| | | SHARES | | | | |
Short-Term Investments — 1.7% | |
|
Investment Companies — 1.7% | |
| | |
JPMorgan U.S. Government Money Market Fund Class Institutional Shares, 2.33% (h) (i)
(Cost $2,621,250) | | | 2,621,250 | | | | 2,621,250 | |
| | | | | | | | |
Investment of Cash Collateral from Securities Loaned — 2.7% | |
| | |
JPMorgan U.S. Government Money Market Fund Class IM Shares, 2.37% (h) (i)
(Cost $4,202,920) | | | 4,202,920 | | | | 4,202,920 | |
| | | | | | | | |
Total Investments — 102.0%
(Cost $159,078,837) | | | | 157,667,280 | |
Liabilities in Excess of
Other Assets — (2.0%) | | | | (3,096,895) | |
| | | | | | | | |
NET ASSETS — 100.0% | | | | 154,570,385 | |
| | | | | | | | |
Percentages indicated are based on net assets.
SEE NOTES TO FINANCIAL STATEMENTS.
| | | | | | |
| | | |
| 50 | | | | J.P. MORGAN EXCHANGE-TRADED FUNDS | | FEBRUARY 28, 2019 |
| | |
| Abbreviations |
| ICE | | Intercontinental Exchange |
| LIBOR | | London Interbank Offered Rate |
| OYJ | | Public Limited Company |
| USD | | United States Dollar |
| |
| (a) | | Securities exempt from registration under Rule 144A or section 4(a)(2), of the Securities Act of 1933, as amended. |
| (b) | | The security or a portion of this security is on loan at February 28, 2019. The total value of securities on loan at February 28, 2019 is $4,045,947. |
| (c) | | Security is perpetual and thus, does not have a predetermined maturity date. The coupon rate for this security is fixed for a period of time and may be structured to adjust thereafter. The date shown, if applicable, reflects the next call date. The coupon rate shown is the rate in effect as of February 28, 2019. |
| | |
| |
| (d) | | Variable or floating rate security, linked to the referenced benchmark. The interest rate shown is the current rate as of February 28, 2019. |
| (e) | | Security is an interest bearing note with preferred security characteristics. |
| (f) | | Amount rounds to less than 0.1% of net assets. |
| (g) | | Step bond. Interest rate is a fixed rate for an initial period that either resets at a specific date or may reset in the future contingent upon a predetermined trigger. The interest rate shown is the current rate as of February 28, 2019. |
| (h) | | Investment in affiliate. Fund is registered under the Investment Company Act of 1940, as amended, and advised by J.P. Morgan Investment Management Inc. |
| (i) | | The rate shown is the current yield as of February 28, 2019. |
| ‡ | | Value determined using significant unobservable inputs. |
SEE NOTES TO FINANCIAL STATEMENTS.
| | | | | | | | |
| | | |
| FEBRUARY 28, 2019 | | J.P. MORGAN EXCHANGE-TRADED FUNDS | | | | | 51 | |
JPMorgan Global Bond Opportunities ETF
SCHEDULE OF PORTFOLIO INVESTMENTS
AS OF FEBRUARY 28, 2019
(Amounts in U.S. Dollars, unless otherwise noted)
| | | | | | | | |
| INVESTMENTS | | PRINCIPAL
AMOUNT | | | VALUE ($) | |
Corporate Bonds — 52.0% | | | | | | | | |
| | |
Argentina — 0.1% | | | | | | | | |
| | |
Pampa Energia SA 7.50%, 1/24/2027 (a) | | | 150,000 | | | | 135,089 | |
| | |
YPF SA 6.95%, 7/21/2027 (b) | | | 120,000 | | | | 106,350 | |
| | | | | | | | |
| | |
| | | | | | | 241,439 | |
| | | | | | | | |
| | |
Australia — 1.4% | | | | | | | | |
| | |
Australia & New Zealand Banking Group Ltd. | | | | | | | | |
| | |
3.63%, 7/18/2022 (a) | | | EUR 146,000 | | | | 185,600 | |
| | |
0.25%, 11/29/2022 | | | EUR 550,000 | | | | 627,055 | |
| | |
(USD ICE Swap Rate 5 Year + 5.17%), 6.75%, 6/15/2026 (b) (c) (d) (e) | | | 200,000 | | | | 210,100 | |
| | |
Commonwealth Bank of Australia 0.38%, 4/24/2023 (a) | | | EUR 390,000 | | | | 446,199 | |
| | |
National Australia Bank Ltd. | | | | | | | | |
| | |
0.25%, 3/28/2022 (a) | | | EUR 230,000 | | | | 263,138 | |
| | |
0.88%, 11/16/2022 (a) | | | EUR 276,000 | | | | 322,230 | |
| | |
Transurban Finance Co. Pty. Ltd. 2.00%, 8/28/2025 (a) | | | EUR 150,000 | | | | 178,582 | |
| | |
Westpac Banking Corp. 0.63%, 1/14/2022 (a) | | | EUR 280,000 | | | | 323,604 | |
| | | | | | | | |
| | |
| | | | | | | 2,556,508 | |
| | | | | | | | |
| | |
Azerbaijan — 0.2% | | | | | | | | |
| | |
State Oil Co. of the Azerbaijan Republic 4.75%, 3/13/2023 (a) | | | 260,000 | | | | 262,600 | |
| | | | | | | | |
| | |
Bahrain — 0.1% | | | | | | | | |
| | |
Batelco International Finance No. 1 Ltd. 4.25%, 5/1/2020 (a) | | | 200,000 | | | | 198,250 | |
| | | | | | | | |
| | |
Belgium — 0.4% | | | | | | | | |
| | |
Anheuser-Busch Cos. LLC | | | | | | | | |
| | |
4.70%, 2/1/2036 (b) | | | 20,000 | | | | 19,358 | |
| | |
4.90%, 2/1/2046 (b) | | | 35,000 | | | | 33,696 | |
| | |
Anheuser-Busch InBev Worldwide, Inc. | | | | | | | | |
| | |
4.15%, 1/23/2025 | | | 160,000 | | | | 165,162 | |
| | |
4.90%, 1/23/2031 | | | 95,000 | | | | 99,464 | |
| | |
Solvay Finance SA (EUR Swap Annual 5 Year + 3.70%), 5.42%, 11/12/2023 (a) (c) (d) (e) | | | EUR 300,000 | | | | 380,081 | |
| | | | | | | | |
| | |
| | | | | | | 697,761 | |
| | | | | | | | |
| | |
Brazil — 0.5% | | | | | | | | |
| | |
Cemig Geracao e Transmissao SA 9.25%, 12/5/2024 (b) | | | 400,000 | | | | 444,136 | |
| | |
JSL Europe SA 7.75%, 7/26/2024 (a) | | | 200,000 | | | | 202,500 | |
| | |
Votorantim Cimentos International SA 7.25%, 4/5/2041 (a) | | | 200,000 | | | | 219,000 | |
| | | | | | | | |
| | |
| | | | | | | 865,636 | |
| | | | | | | | |
| | | | | | | | |
| INVESTMENTS | | PRINCIPAL
AMOUNT | | | VALUE ($) | |
| | | | | | | | |
| | |
Canada — 1.8% | | | | | | | | |
| | |
1011778 BC ULC 5.00%, 10/15/2025 (b) | | | 15,000 | | | | 14,546 | |
| | |
Advanz Pharma Corp. 8.00%, 9/6/2024 | | | 20,000 | | | | 19,050 | |
| | |
Bank of Montreal 2.50%, 1/11/2022 (a) | | | 450,000 | | | | 445,424 | |
| | |
Bank of Nova Scotia (The) 1.88%, 4/26/2021 | | | 456,000 | | | | 446,222 | |
| | |
Bombardier, Inc. | | | | | | | | |
| | |
8.75%, 12/1/2021 (b) | | | 77,000 | | | | 84,700 | |
| | |
6.00%, 10/15/2022 (b) | | | 10,000 | | | | 10,050 | |
| | |
7.50%, 3/15/2025 (b) | | | 57,000 | | | | 57,071 | |
| | |
7.88%, 4/15/2027 (b) | | | 32,000 | | | | 31,759 | |
| | |
Cenovus Energy, Inc. | | | | | | | | |
| | |
4.25%, 4/15/2027 | | | 27,000 | | | | 25,712 | |
| | |
6.75%, 11/15/2039 | | | 83,000 | | | | 87,655 | |
| | |
Emera US Finance LP 3.55%, 6/15/2026 | | | 216,000 | | | | 207,202 | |
| | |
Encana Corp. | | | | | | | | |
| | |
6.50%, 8/15/2034 | | | 100,000 | | | | 114,139 | |
| | |
6.50%, 2/1/2038 | | | 25,000 | | | | 27,770 | |
| | |
Garda World Security Corp. 8.75%, 5/15/2025 (b) | | | 99,000 | | | | 94,793 | |
| | |
Gateway Casinos & Entertainment Ltd. 8.25%, 3/1/2024 (b) | | | 49,000 | | | | 50,960 | |
| | |
Hudbay Minerals, Inc. 7.25%, 1/15/2023 (b) | | | 20,000 | | | | 20,600 | |
| | |
Intertape Polymer Group, Inc. 7.00%, 10/15/2026 (b) | | | 16,000 | | | | 16,120 | |
| | |
Kronos Acquisition Holdings, Inc. 9.00%, 8/15/2023 (b) | | | 39,000 | | | | 33,345 | |
| | |
Mattamy Group Corp. 6.50%, 10/1/2025 (b) | | | 16,000 | | | | 15,428 | |
| | |
MEG Energy Corp. | | | | | | | | |
| | |
6.38%, 1/30/2023 (b) | | | 185,000 | | | | 168,812 | |
| | |
6.50%, 1/15/2025 (b) | | | 25,000 | | | | 24,563 | |
| | |
NOVA Chemicals Corp. | | | | | | | | |
| | |
4.88%, 6/1/2024 (b) | | | 80,000 | | | | 77,456 | |
| | |
5.00%, 5/1/2025 (b) | | | 55,000 | | | | 52,525 | |
| | |
5.25%, 6/1/2027 (b) | | | 30,000 | | | | 28,200 | |
| | |
Open Text Corp. 5.88%, 6/1/2026 (b) | | | 40,000 | | | | 42,083 | |
| | |
Precision Drilling Corp. | | | | | | | | |
| | |
7.75%, 12/15/2023 | | | 65,000 | | | | 65,650 | |
| | |
7.13%, 1/15/2026 (b) | | | 6,000 | | | | 5,895 | |
| | |
Quebecor Media, Inc. 5.75%, 1/15/2023 | | | 22,000 | | | | 22,791 | |
| | |
Royal Bank of Canada 3.35%, 10/22/2021 (a) | | | 300,000 | | | | 303,600 | |
SEE NOTES TO FINANCIAL STATEMENTS.
| | | | | | |
| | | |
| 52 | | | | J.P. MORGAN EXCHANGE-TRADED FUNDS | | FEBRUARY 28, 2019 |
| | | | | | | | |
| INVESTMENTS | | PRINCIPAL
AMOUNT | | | VALUE ($) | |
Corporate Bonds — continued | | | | | | | | |
|
Canada — continued | |
| | |
Seven Generations Energy Ltd. 5.38%, 9/30/2025 (b) | | | 24,000 | | | | 23,100 | |
| | |
Stars Group Holdings BV 7.00%, 7/15/2026 (b) | | | 14,000 | | | | 14,326 | |
| | |
Teck Resources Ltd. 6.13%, 10/1/2035 | | | 52,000 | | | | 54,780 | |
| | |
Toronto-Dominion Bank (The) 2.50%, 1/18/2022 (a) | | | 450,000 | | | | 444,804 | |
| | |
TransCanada PipeLines Ltd. 5.10%, 3/15/2049 | | | 35,000 | | | | 36,269 | |
| | |
Videotron Ltd. | | | | | | | | |
| | |
5.38%, 6/15/2024 (b) | | | 65,000 | | | | 67,613 | |
| | |
5.13%, 4/15/2027 (b) | | | 40,000 | | | | 40,600 | |
| | | | | | | | |
| | |
| | | | | | | 3,275,613 | |
| | | | | | | | |
|
China — 0.3% | |
| | |
GCL New Energy Holdings Ltd. 7.10%, 1/30/2021 (a) | | | 200,000 | | | | 177,624 | |
| | |
GOME Retail Holdings Ltd. 5.00%, 3/10/2020 (a) | | | 200,000 | | | | 191,585 | |
| | |
Sino-Ocean Land Treasure III Ltd. (US Treasury Yield Curve Rate T Note Constant Maturity 5 Year + 3.26%), 4.90%, 9/21/2022 (a) (c) (d) (e) | | | 200,000 | | | | 161,000 | |
| | | | | | | | |
| | |
| | | | | | | 530,209 | |
| | | | | | | | |
|
Denmark — 0.3% | |
| | |
Danske Bank A/S 5.00%, 1/12/2022 (b) | | | 200,000 | | | | 204,076 | |
| | |
DKT Finance ApS 7.00%, 6/17/2023 (a) | | | EUR100,000 | | | | 122,645 | |
| | |
TDC A/S 3.75%, 3/2/2022 (f) | | | EUR200,000 | | | | 251,754 | |
| | | | | | | | |
| | |
| | | | | | | 578,475 | |
| | | | | | | | |
|
Finland — 0.1% | |
| | |
Nokia OYJ | | | | | | | | |
| | |
2.00%, 3/15/2024 (a) | | | EUR100,000 | | | | 116,753 | |
| | |
4.38%, 6/12/2027 | | | 40,000 | | | | 39,305 | |
| | | | | | | | |
| | |
| | | | | | | 156,058 | |
| | | | | | | | |
|
France — 3.0% | |
| | |
Altice France SA | | | | | | | | |
| | |
5.63%, 5/15/2024 (a) | | | EUR150,000 | | | | 176,143 | |
| | |
6.25%, 5/15/2024 (b) | | | 200,000 | | | | 200,000 | |
| | |
7.38%, 5/1/2026 (b) | | | 200,000 | | | | 196,674 | |
| | |
BPCE SA | | | | | | | | |
| | |
5.15%, 7/21/2024 (b) | | | 600,000 | | | | 615,431 | |
| | |
(EUR Swap Annual 5 Year + 2.37%), 2.75%, 11/30/2027 (a) (d) | | | EUR200,000 | | | | 238,865 | |
| | | | | | | | |
| INVESTMENTS | | PRINCIPAL
AMOUNT | | | VALUE ($) | |
| | | | | | | | |
|
France — continued | |
| | |
Burger King France SAS 6.00%, 5/1/2024 (a) | | | EUR100,000 | | | | 121,164 | |
| | |
Casino Guichard Perrachon SA | | | | | | | | |
| | |
4.56%, 1/25/2023 (a) (f) | | | EUR100,000 | | | | 116,728 | |
| | |
4.05%, 8/5/2026 (a) (f) | | | EUR100,000 | | | | 107,769 | |
| | |
Constantin Investissement 3 SASU 5.38%, 4/15/2025 (a) | | | EUR 100,000 | | | | 110,337 | |
| | |
Credit Agricole SA | | | | | | | | |
| | |
(EUR Swap Annual 5 Year + 5.12%), 6.50%, 6/23/2021 (a) (c) (d) (e) | | | EUR300,000 | | | | 368,960 | |
| | |
2.38%, 7/1/2021 (b) | | | 250,000 | | | | 245,142 | |
| | |
(USD Swap Semi 5 Year + 6.19%), 8.12%, 12/23/2025 (b) (c) (d) (e) | | | 200,000 | | | | 223,056 | |
| | |
Elis SA 1.88%, 2/15/2023 (a) | | | EUR300,000 | | | | 346,814 | |
| | |
Europcar Mobility Group 4.13%, 11/15/2024 (a) | | | EUR100,000 | | | | 113,034 | |
| | |
Faurecia SA 3.63%, 6/15/2023 (a) | | | EUR100,000 | | | | 116,446 | |
| | |
La Financiere Atalian SASU 4.00%, 5/15/2024 (a) | | | EUR200,000 | | | | 178,041 | |
| | |
Loxam SAS 4.25%, 4/15/2024 (a) | | | EUR150,000 | | | | 178,712 | |
| | |
Orano SA | | | | | | | | |
| | |
4.38%, 11/6/2019 (a) | | | EUR50,000 | | | | 58,323 | |
| | |
3.13%, 3/20/2023 (a) | | | EUR300,000 | | | | 348,769 | |
| | |
Picard Groupe SAS (EURIBOR 3 Month + 3.00%), 3.00%, 11/30/2023 (a) (d) | | | EUR100,000 | | | | 112,319 | |
| | |
Rexel SA 2.63%, 6/15/2024 (a) | | | EUR300,000 | | | | 349,766 | |
| | |
Societe Generale SA (USD ICE Swap Rate 5 Year + 5.87%), 8.00%, 9/29/2025 (b) (c) (d) (e) | | | 200,000 | | | | 211,000 | |
| | |
SPIE SA 3.13%, 3/22/2024 (a) | | | EUR200,000 | | | | 232,428 | |
| | |
TOTAL SA | | | | | | | | |
| | |
(EUR Swap Annual 5 Year + 1.86%), 2.25%, 2/26/2021 (a) (c) (d) (e) | | | EUR125,000 | | | | 145,815 | |
| | |
(EUR Swap Annual 5 Year + 3.78%), 3.88%, 5/18/2022 (a) (c) (d) (e) | | | EUR100,000 | | | | 123,435 | |
| | |
Vallourec SA 2.25%, 9/30/2024 (a) | | | EUR100,000 | | | | 76,210 | |
| | | | | | | | |
| | |
| | | | | | | 5,311,381 | |
| | | | | | | | |
|
Germany — 1.5% | |
| | |
CTC BondCo GmbH 5.25%, 12/15/2025 (a) | | | EUR200,000 | | | | 222,239 | |
| | |
Deutsche Bank AG 4.25%, 10/14/2021 | | | 100,000 | | | | 99,373 | |
SEE NOTES TO FINANCIAL STATEMENTS.
| | | | | | | | |
| | | |
| FEBRUARY 28, 2019 | | J.P. MORGAN EXCHANGE-TRADED FUNDS | | | | | 53 | |
JPMorgan Global Bond Opportunities ETF
SCHEDULE OF PORTFOLIO INVESTMENTS
AS OF FEBRUARY 28, 2019 (continued)
(Amounts in U.S. Dollars, unless otherwise noted)
| | | | | | | | |
| INVESTMENTS | | PRINCIPAL
AMOUNT | | | VALUE ($) | |
Corporate Bonds — continued | | | | | | | | |
|
Germany — continued | |
| | |
Douglas GmbH 6.25%, 7/15/2022 (a) | | | EUR100,000 | | | | 108,058 | |
| | |
IHO Verwaltungs GmbH | | | | | | | | |
| | |
4.50% (cash), 5.50% (PIK), 9/15/2023 (b) (g) | | | 200,000 | | | | 193,580 | |
| | |
3.75% (cash), 4.50% (PIK), 9/15/2026 (a) (g) | | | EUR225,000 | | | | 255,542 | |
| | |
K+S AG 3.25%, 7/18/2024 (a) | | | EUR100,000 | | | | 115,878 | |
| | |
Nidda BondCo GmbH 5.00%, 9/30/2025 (a) | | | EUR225,000 | | | | 239,517 | |
| | |
Nidda Healthcare Holding GmbH 3.50%, 9/30/2024 (a) | | | EUR200,000 | | | | 225,175 | |
| | |
ProGroup AG 3.00%, 3/31/2026 (a) | | | EUR125,000 | | | | 145,025 | |
| | |
Techem Verwaltungsgesellschaft 674 mbH 6.00%, 7/30/2026 (a) | | | EUR250,000 | | | | 291,100 | |
| | |
thyssenkrupp AG | | | | | | | | |
| | |
1.38%, 3/3/2022 (a) | | | EUR200,000 | | | | 223,236 | |
| | |
2.50%, 2/25/2025 (a) | | | EUR100,000 | | | | 111,563 | |
| | |
Unitymedia GmbH | | | | | | | | |
| | |
3.75%, 1/15/2027 (a) | | | EUR200,000 | | | | 238,705 | |
| | |
Unitymedia Hessen GmbH & Co. KG 3.50%, 1/15/2027 (a) | | | EUR100,000 | | | | 119,575 | |
| | |
WEPA Hygieneprodukte GmbH 3.75%, 5/15/2024 (a) | | | EUR100,000 | | | | 115,167 | |
| | | | | | | | |
| | |
| | | | | | | 2,703,733 | |
| | | | | | | | |
| | |
Greece — 0.5% | | | | | | | | |
| | |
Alpha Bank AE 2.50%, 2/5/2023 (a) | | | EUR440,000 | | | | 507,126 | |
| | |
Crystal Almond SARL 10.00%, 11/1/2021 (a) | | | EUR79,000 | | | | 96,146 | |
| | |
National Bank of Greece SA 2.75%, 10/19/2020 (a) | | | EUR 200,000 | | | | 232,800 | |
| | |
OTE plc 3.50%, 7/9/2020 (a) | | | EUR100,000 | | | | 117,574 | |
| | | | | | | | |
| | |
| | | | | | | 953,646 | |
| | | | | | | | |
| | |
Guatemala — 0.1% | | | | | | | | |
| | |
Comunicaciones Celulares SA 6.88%, 2/6/2024 (a) | | | 200,000 | | | | 206,000 | |
| | | | | | | | |
| | |
Hong Kong — 0.1% | | | | | | | | |
| | |
WTT Investment Ltd. 5.50%, 11/21/2022 (b) | | | 200,000 | | | | 198,223 | |
| | | | | | | | |
| | |
India — 0.2% | | | | | | | | |
| | |
ABJA Investment Co. Pte. Ltd. 5.45%, 1/24/2028 (a) | | | 260,000 | | | | 236,600 | |
| | |
JSW Steel Ltd. 5.25%, 4/13/2022 (a) | | | 200,000 | | | | 199,721 | |
| | | | | | | | |
| | |
| | | | | | | 436,321 | |
| | | | | | | | |
| | | | | | | | |
| INVESTMENTS | | PRINCIPAL
AMOUNT | | | VALUE ($) | |
| | | | | | | | |
| | |
Indonesia — 0.1% | | | | | | | | |
| | |
Indonesia Asahan Aluminium Persero PT 5.71%, 11/15/2023 (b) | | | 230,000 | | | | 242,823 | |
| | | | | | | | |
| | |
Ireland — 1.5% | | | | | | | | |
| | |
AerCap Ireland Capital DAC | | | | | | | | |
| | |
4.63%, 7/1/2022 | | | 330,000 | | | | 333,633 | |
| | |
3.65%, 7/21/2027 | | | 180,000 | | | | 162,240 | |
| | |
Allied Irish Banks plc | | | | | | | | |
| | |
(EUR Swap Annual 5 Year + 7.34%), 7.38%, 12/3/2020 (a) (c) (d) (e) | | | EUR200,000 | | | | 244,267 | |
| | |
(EUR Swap Annual 5 Year + 3.95%), 4.13%, 11/26/2025 (a) (d) | | | EUR100,000 | | | | 117,415 | |
| | |
Ardagh Packaging Finance plc | | | | | | | | |
| | |
4.13%, 5/15/2023 (a) | | | EUR200,000 | | | | 233,746 | |
| | |
6.75%, 5/15/2024 (a) | | | EUR175,000 | | | | 211,216 | |
| | |
7.25%, 5/15/2024 (b) | | | 210,000 | | | | 218,925 | |
| | |
Bank of Ireland (EUR Swap Annual 5 Year + 3.55%), 4.25%, 6/11/2024 (a) (d) | | | EUR100,000 | | | | 114,493 | |
| | |
eircom Finance DAC 4.50%, 5/31/2022 (a) | | | EUR200,000 | | | | 232,061 | |
| | |
James Hardie International Finance DAC 4.75%, 1/15/2025 (b) | | | 200,000 | | | | 193,000 | |
| | |
Park Aerospace Holdings Ltd. 5.50%, 2/15/2024 (b) | | | 129,000 | | | | 133,354 | |
| | |
Smurfit Kappa Acquisitions ULC 2.38%, 2/1/2024 (a) | | | EUR350,000 | | | | 414,405 | |
| | | | | | | | |
| | |
| | | | | | | 2,608,755 | |
| | | | | | | | |
| | |
Israel — 0.1% | | | | | | | | |
| | |
Teva Pharmaceutical Finance Netherlands II BV 1.13%, 10/15/2024 (a) | | | EUR100,000 | | | | 99,463 | |
| | |
Teva Pharmaceutical Finance Netherlands III BV 3.15%, 10/1/2026 | | | 145,000 | | | | 120,206 | |
| | | | | | | | |
| | |
| | | | | | | 219,669 | |
| | | | | | | | |
| | |
Italy — 1.7% | | | | | | | | |
| | |
Enel Finance International NV | | | | | | | | |
| | |
5.63%, 8/14/2024 (a) | | | GBP50,000 | | | | 75,809 | |
| | |
3.50%, 4/6/2028 (b) | | | 200,000 | | | | 178,916 | |
| | |
EVOCA SpA 7.00%, 10/15/2023 (a) | | | EUR200,000 | | | | 240,534 | |
| | |
Leonardo SpA 4.88%, 3/24/2025 | | | EUR300,000 | | | | 386,399 | |
| | |
Nexi Capital SpA 4.13%, 11/1/2023 (a) | | | EUR200,000 | | | | 233,860 | |
| | |
Rossini SARL 6.75%, 10/30/2025 (b) | | | EUR250,000 | | | | 295,990 | |
| | |
Saipem Finance International BV 2.63%, 1/7/2025 (a) | | | EUR250,000 | | | | 279,346 | |
SEE NOTES TO FINANCIAL STATEMENTS.
| | | | | | |
| | | |
| 54 | | | | J.P. MORGAN EXCHANGE-TRADED FUNDS | | FEBRUARY 28, 2019 |
| | | | | | | | |
| INVESTMENTS | | PRINCIPAL
AMOUNT | | | VALUE ($) | |
Corporate Bonds — continued | | | | | | | | |
|
Italy — continued | |
| | |
Telecom Italia SpA | | | | | | | | |
| | |
5.25%, 2/10/2022 (a) | | | EUR100,000 | | | | 125,232 | |
| | |
3.25%, 1/16/2023 (a) | | | EUR200,000 | | | | 233,835 | |
| | |
3.63%, 1/19/2024 (a) | | | EUR225,000 | | | | 260,137 | |
| | |
3.63%, 5/25/2026 (a) | | | EUR225,000 | | | | 256,499 | |
| | |
2.38%, 10/12/2027 (a) | | | EUR150,000 | | | | 150,997 | |
| | |
Wind Tre SpA | | | | | | | | |
| | |
2.63%, 1/20/2023 (a) | | | EUR250,000 | | | | 267,301 | |
| | |
2.63%, 1/20/2023 (b) | | | EUR150,000 | | | | 160,380 | |
| | | | | | | | |
| | |
| | | | | | | 3,145,235 | |
| | | | | | | | |
| | |
Japan — 0.2% | | | | | | | | |
| | |
Sumitomo Mitsui Banking Corp. 0.55%, 11/6/2023 (a) | | | EUR230,000 | | | | 263,643 | |
| | | | | | | | |
| | |
Kuwait — 0.3% | | | | | | | | |
| | |
Kuwait Projects Co. SPC Ltd. | | | | | | | | |
| | |
5.00%, 3/15/2023 (a) | | | 200,000 | | | | 203,250 | |
| | |
4.50%, 2/23/2027 (a) | | | 270,000 | | | | 257,513 | |
| | | | | | | | |
| | |
| | | | | | | 460,763 | |
| | | | | | | | |
| | |
Luxembourg — 1.5% | | | | | | | | |
| | |
Altice Finco SA 4.75%, 1/15/2028 (a) | | | EUR225,000 | | | | 216,897 | |
| | |
Altice Luxembourg SA | | | | | | | | |
| | |
7.25%, 5/15/2022 (a) | | | EUR375,000 | | | | 425,975 | |
| | |
6.25%, 2/15/2025 (a) | | | EUR150,000 | | | | 152,276 | |
| | |
INEOS Group Holdings SA | | | | | | | | |
| | |
5.38%, 8/1/2024 (a) | | | EUR100,000 | | | | 115,245 | |
| | |
5.63%, 8/1/2024 (b) | | | 200,000 | | | | 193,750 | |
| | |
Intelsat Connect Finance SA 9.50%, 2/15/2023 (b) | | | 50,000 | | | | 48,375 | |
| | |
Intelsat Jackson Holdings SA | | | | | | | | |
| | |
5.50%, 8/1/2023 | | | 80,000 | | | | 73,400 | |
| | |
8.00%, 2/15/2024 (b) | | | 75,000 | | | | 78,047 | |
| | |
8.50%, 10/15/2024 (b) | | | 89,000 | | | | 89,863 | |
| | |
9.75%, 7/15/2025 (b) | | | 120,000 | | | | 124,500 | |
| | |
Intelsat Luxembourg SA | | | | | | | | |
| | |
7.75%, 6/1/2021 | | | 4,000 | | | | 3,900 | |
| | |
8.13%, 6/1/2023 | | | 16,000 | | | | 13,360 | |
| | |
Matterhorn Telecom Holding SA 4.88%, 5/1/2023 (a) | | | EUR300,000 | | | | 326,723 | |
| | |
SES SA (EUR Swap Annual 5 Year + 4.66%), 4.62%, 1/2/2022 (a) (c) (d) (e) | | | EUR350,000 | | | | 414,032 | |
| | |
Telenet Finance VI Luxembourg SCA 4.88%, 7/15/2027 (a) | | | EUR270,000 | | | | 329,695 | |
| | | | | | | | |
| | |
| | | | | | | 2,606,038 | |
| | | | | | | | |
| | | | | | | | |
| INVESTMENTS | | PRINCIPAL
AMOUNT | | | VALUE ($) | |
| | | | | | | | |
| | |
Mexico — 0.5% | | | | | | | | |
| | |
Banco Mercantil del Norte SA (US Treasury Yield Curve Rate T Note Constant Maturity 5 Year + 5.04%), 6.87%, 7/6/2022 (b) (c) (d) (e) | | | 200,000 | | | | 197,000 | |
| | |
BBVA Bancomer SA (US Treasury Yield Curve Rate T Note Constant Maturity 5 Year + 2.65%), 5.13%, 1/18/2033 (b) (d) | | | 200,000 | | | | 179,557 | |
| | |
Cemex SAB de CV 7.75%, 4/16/2026 (b) | | | 200,000 | | | | 217,362 | |
| | |
Petroleos Mexicanos 6.38%, 2/4/2021 | | | 260,000 | | | | 267,485 | |
| | | | | | | | |
| | |
| | | | | | | 861,404 | |
| | | | | | | | |
| | |
Morocco — 0.1% | | | | | | | | |
| | |
OCP SA 4.50%, 10/22/2025 (a) | | | 250,000 | | | | 248,250 | |
| | | | | | | | |
| | |
Netherlands — 1.4% | | | | | | | | |
| | |
ABN AMRO Bank NV 4.75%, 7/28/2025 (b) | | | 200,000 | | | | 203,737 | |
| | |
ING Bank NV 2.63%, 12/5/2022 (a) | | | 460,000 | | | | 454,683 | |
| | |
ING Groep NV | | | | | | | | |
| | |
(USD Swap Semi 5 Year + 5.12%), 6.87%, 4/16/2022 (a) (c) (d) (e) | | | 220,000 | | | | 228,720 | |
| | |
(EUR Swap Annual 5 Year + 2.85%), 3.00%, 4/11/2028 (d) | | | EUR100,000 | | | | 120,172 | |
| | |
Promontoria Holding 264 BV 6.75%, 8/15/2023 (a) | | | EUR100,000 | | | | 115,337 | |
| | |
Sigma Holdco BV 5.75%, 5/15/2026 (a) | | | EUR225,000 | | | | 238,971 | |
| | |
Sunshine Mid BV 6.50%, 5/15/2026 (b) | | | EUR200,000 | | | | 224,323 | |
| | |
UPCB Finance IV Ltd. 4.00%, 1/15/2027 (a) | | | EUR270,000 | | | | 321,331 | |
| | |
Ziggo Bond Co. BV 4.63%, 1/15/2025 (a) | | | EUR300,000 | | | | 348,845 | |
| | |
Ziggo BV 4.25%, 1/15/2027 (a) | | | EUR200,000 | | | | 233,985 | |
| | | | | | | | |
| | |
| | | | | | | 2,490,104 | |
| | | | | | | | |
| | |
New Zealand — 0.2% | | | | | | | | |
| | |
Westpac Securities NZ Ltd. 0.25%, 4/6/2022 (a) | | | EUR253,000 | | | | 288,868 | |
| | | | | | | | |
| | |
Peru — 0.3% | | | | | | | | |
| | |
Nexa Resources SA 5.38%, 5/4/2027 (a) | | | 400,000 | | | | 403,760 | |
| | |
Southern Copper Corp. 5.88%, 4/23/2045 | | | 140,000 | | | | 149,975 | |
| | | | | | | | |
| | |
| | | | | | | 553,735 | |
| | | | | | | | |
SEE NOTES TO FINANCIAL STATEMENTS.
| | | | | | | | |
| | | |
| FEBRUARY 28, 2019 | | J.P. MORGAN EXCHANGE-TRADED FUNDS | | | | | 55 | |
JPMorgan Global Bond Opportunities ETF
SCHEDULE OF PORTFOLIO INVESTMENTS
AS OF FEBRUARY 28, 2019 (continued)
(Amounts in U.S. Dollars, unless otherwise noted)
| | | | | | | | |
| INVESTMENTS | | PRINCIPAL
AMOUNT | | | VALUE ($) | |
Corporate Bonds — continued | | | | | | | | |
| | |
Portugal — 0.2% | | | | | | | | |
| | |
EDP — Energias de Portugal SA (EUR Swap Annual 5 Year + 5.04%), 5.38%, 9/16/2075 (a) (d) | | | EUR100,000 | | | | 121,605 | |
| | |
EDP Finance BV 2.38%, 3/23/2023 (a) | | | EUR200,000 | | | | 242,613 | |
| | | | | | | | |
| | |
| | | | | | | 364,218 | |
| | | | | | | | |
| | |
Qatar — 0.1% | | | | | | | | |
| | |
ABQ Finance Ltd. 3.50%, 2/22/2022 (a) | | | 200,000 | | | | 197,500 | |
| | |
Ras Laffan Liquefied Natural Gas Co. Ltd. II 5.30%, 9/30/2020 (a) | | | 55,150 | | | | 55,839 | |
| | | | | | | | |
| | |
| | | | | | | 253,339 | |
| | | | | | | | |
| | |
Singapore — 0.3% | | | | | | | | |
| | |
DBS Bank Ltd. 3.30%, 11/27/2021 (a) | | | 200,000 | | | | 199,880 | |
| | |
Oversea-Chinese Banking Corp. Ltd. 0.38%, 3/1/2023 (a) | | | EUR230,000 | | | | 263,171 | |
| | | | | | | | |
| | |
| | | | | | | 463,051 | |
| | | | | | | | |
| | |
Spain — 1.5% | | | | | | | | |
| | |
Bankinter SA (EUR Swap Annual 5 Year + 2.40%), 2.50%, 4/6/2027 (a) (d) | | | EUR100,000 | | | | 114,744 | |
| | |
CaixaBank SA | | | | | | | | |
| | |
(EUR Swap Annual 5 Year + 6.50%), 6.75%, 6/13/2024 (a) (c) (d) (e) | | | EUR200,000 | | | | 237,808 | |
| | |
(EUR Swap Annual 5 Year + 3.35%), 3.50%, 2/15/2027 (a) (d) | | | EUR200,000 | | | | 236,517 | |
| | |
Cellnex Telecom SA 2.88%, 4/18/2025 (a) | | | EUR100,000 | | | | 117,737 | |
| | |
Cirsa Finance International SARL 6.25%, 12/20/2023 (b) | | | EUR200,000 | | | | 238,873 | |
| | |
eDreams ODIGEO SA 5.50%, 9/1/2023 (b) | | | EUR200,000 | | | | 217,822 | |
| | |
Grifols SA 3.20%, 5/1/2025 (a) | | | EUR200,000 | | | | 229,510 | |
| | |
Repsol International Finance BV (EUR Swap Annual 10 Year + 4.20%), 4.50%, 3/25/2075 (a) (d) | | | EUR200,000 | | | | 244,552 | |
| | |
Telefonica Europe BV | | | | | | | | |
| | |
(EUR Swap Annual 6 Year + 3.80%), 5.00%, 3/31/2020 (a) (c) (d) (e) | | | EUR200,000 | | | | 237,518 | |
| | |
(EUR Swap Annual 5 Year + 3.86%), 3.75%, 3/15/2022 (a) (c) (d) (e) | | | EUR400,000 | | | | 470,904 | |
| | | | | | | | |
| INVESTMENTS | | PRINCIPAL
AMOUNT | | | VALUE ($) | |
| | | | | | | | |
|
Spain — continued | |
| | |
(EUR Swap Annual 5 Year + 2.33%), 2.63%, 6/7/2023 (a) (c) (d) (e) | | | EUR200,000 | | | | 218,770 | |
| | |
Series NC5, (EUR Swap Annual 5 Year + 2.45%), 3.00%, 12/4/2023 (a) (c) (d) (e) | | | EUR100,000 | | | | 110,704 | |
| | | | | | | | |
| | |
| | | | | | | 2,675,459 | |
| | | | | | | | |
| | |
Sweden — 1.2% | | | | | | | | |
| | |
Nordea Hypotek AB Series 5531, 1.00%, 4/8/2022 (a) | | | SEK7,000,000 | | | | 774,446 | |
| | |
Stadshypotek AB Series 1586, 4.50%, 9/21/2022 (a) | | | SEK6,000,000 | | | | 743,657 | |
| | |
Telefonaktiebolaget LM Ericsson 1.88%, 3/1/2024 (a) | | | EUR225,000 | | | | 257,348 | |
| | |
Verisure Midholding AB 5.75%, 12/1/2023 (a) | | | EUR200,000 | | | | 230,457 | |
| | |
Volvo Car AB | | | | | | | | |
| | |
3.25%, 5/18/2021 (a) | | | EUR100,000 | | | | 119,432 | |
| | |
2.00%, 1/24/2025 (a) | | | EUR100,000 | | | | 111,044 | |
| | | | | | | | |
| | |
| | | | | | | 2,236,384 | |
| | | | | | | | |
| | |
Switzerland — 1.2% | | | | | | | | |
| | |
Credit Suisse Group AG | | | | | | | | |
| | |
(USD Swap Semi 5 Year + 4.60%), 7.50%, 12/11/2023 (b) (c) (d) (e) | | | 650,000 | | | | 695,159 | |
| | |
4.28%, 1/9/2028 (b) | | | 250,000 | | | | 248,963 | |
| | |
Dufry One BV 2.50%, 10/15/2024 (a) | | | EUR100,000 | | | | 115,443 | |
| | |
Glencore Finance Europe Ltd. 6.00%, 4/3/2022 (a) (f) | | | GBP100,000 | | | | 146,105 | |
| | |
UBS Group Funding Switzerland AG | | | | | | | | |
| | |
(EUR Swap Annual 5 Year + 5.29%), 5.75%, 2/19/2022 (a) (c) (d) (e) | | | EUR600,000 | | | | 745,081 | |
| | |
(USD Swap Semi 5 Year + 4.87%), 7.00%, 2/19/2025 (a) (c) (d) (e) | | | 200,000 | | | | 212,250 | |
| | | | | | | | |
| | |
| | | | | | | 2,163,001 | |
| | | | | | | | |
| | |
Turkey — 0.3% | | | | | | | | |
| | |
Petkim Petrokimya Holding A/S 5.88%, 1/26/2023 (a) | | | 260,000 | | | | 247,325 | |
| | |
Turkiye Garanti Bankasi A/S 5.25%, 9/13/2022 (a) | | | 210,000 | | | | 203,438 | |
| | | | | | | | |
| | |
| | | | | | | 450,763 | |
| | | | | | | | |
| |
United Arab Emirates — 0.0% (h) | | | | | |
| | |
Shelf Drilling Holdings Ltd. 8.25%, 2/15/2025 (b) | | | 79,000 | | | | 75,445 | |
| | | | | | | | |
SEE NOTES TO FINANCIAL STATEMENTS.
| | | | | | |
| | | |
| 56 | | | | J.P. MORGAN EXCHANGE-TRADED FUNDS | | FEBRUARY 28, 2019 |
| | | | | | | | |
| INVESTMENTS | | PRINCIPAL
AMOUNT | | | VALUE ($) | |
Corporate Bonds — continued | | | | | | | | |
| | |
United Kingdom — 3.5% | | | | | | | | |
| | |
Algeco Global Finance plc 6.50%, 2/15/2023 (a) | | | EUR200,000 | | | | 232,608 | |
| | |
Barclays plc (EUR Swap Annual 5 Year + 2.45%), 2.63%, 11/11/2025 (a) (d) | | | EUR100,000 | | | | 114,220 | |
| | |
BAT Capital Corp. | | | | | | | | |
| | |
3.56%, 8/15/2027 | | | 270,000 | | | | 246,755 | |
| | |
4.39%, 8/15/2037 | | | 315,000 | | | | 262,900 | |
| | |
Corral Petroleum Holdings AB 11.75% (cash), 5/15/2021 (a) (g) (i) | | | EUR100,000 | | | | 121,316 | |
| | |
CPUK Finance Ltd. 4.25%, 8/28/2022 (a) | | | GBP100,000 | | | | 131,269 | |
| | |
EC Finance plc 2.38%, 11/15/2022 (a) | | | EUR300,000 | | | | 343,438 | |
| | |
Fiat Chrysler Automobiles NV 3.75%, 3/29/2024 (a) | | | EUR100,000 | | | | 122,418 | |
| | |
Fiat Chrysler Finance Europe SA | | | | | | | | |
| | |
4.75%, 3/22/2021 (a) | | | EUR225,000 | | | | 275,579 | |
| | |
4.75%, 7/15/2022 (a) | | | EUR100,000 | | | | 125,127 | |
| | |
HSBC Holdings plc | | | | | | | | |
| | |
3.40%, 3/8/2021 | | | 280,000 | | | | 281,460 | |
| | |
(ICE LIBOR USD 3 Month + 1.00%), 3.68%, 5/18/2024 (d) | | | 237,000 | | | | 234,769 | |
| | |
(USD ICE Swap Rate 5 Year + 4.37%), 6.37%, 3/30/2025 (c) (d) (e) | | | 200,000 | | | | 204,000 | |
| | |
Iceland Bondco plc 4.63%, 3/15/2025 (b) | | | GBP100,000 | | | | 116,276 | |
| | |
Lloyds Banking Group plc 4.58%, 12/10/2025 | | | 200,000 | | | | 197,413 | |
| | |
Merlin Entertainments plc 2.75%, 3/15/2022 (a) | | | EUR100,000 | | | | 118,340 | |
| | |
Nomad Foods Bondco plc 3.25%, 5/15/2024 (a) | | | EUR200,000 | | | | 232,339 | |
| | |
Royal Bank of Scotland Group plc | | | | | | | | |
| | |
(USD Swap Semi 5 Year + 7.60%), 8.62%, 8/15/2021 (c) (d) (e) | | | 200,000 | | | | 214,460 | |
| | |
(ICE LIBOR USD 3 Month + 1.48%), 3.50%, 5/15/2023 (d) | | | 235,000 | | | | 231,713 | |
| | |
6.10%, 6/10/2023 | | | 30,000 | | | | 31,469 | |
| | |
Santander UK Group Holdings plc 3.57%, 1/10/2023 | | | 400,000 | | | | 394,169 | |
| | |
Sky Ltd. | | | | | | | | |
| | |
1.50%, 9/15/2021 (a) | | | EUR200,000 | | | | 234,099 | |
| | |
2.25%, 11/17/2025 (a) | | | EUR200,000 | | | | 243,756 | |
| | |
Standard Chartered plc (USD Swap Semi 5 Year + 5.72%), 7.75%, 4/2/2023 (b) (c) (d) (e) | | | 200,000 | | | | 209,500 | |
| | | | | | | | |
| INVESTMENTS | | PRINCIPAL
AMOUNT | | | VALUE ($) | |
| | | | | | | | |
United Kingdom — continued | | | | | | | | |
| | |
Synlab Unsecured Bondco plc 8.25%, 7/1/2023 (a) | | | EUR200,000 | | | | 242,031 | |
| | |
Tesco Corporate Treasury Services plc | | | | | | | | |
| | |
2.13%, 11/12/2020 (a) | | | EUR250,000 | | | | 290,836 | |
| | |
2.50%, 7/1/2024 (a) | | | EUR300,000 | | | | 356,375 | |
| | |
Virgin Media Finance plc 4.50%, 1/15/2025 (a) | | | EUR200,000 | | | | 236,272 | |
| | |
Virgin Media Secured Finance plc 5.50%, 8/15/2026 (b) | | | 200,000 | | | | 199,000 | |
| | |
Worldpay Finance plc 3.75%, 11/15/2022 (a) | | | EUR100,000 | | | | 122,446 | |
| | | | | | | | |
| | |
| | | | | | | 6,366,353 | |
| | | | | | | | |
| | |
United States — 25.2% | | | | | | | | |
| | |
21st Century Fox America, Inc. 4.95%, 10/15/2045 | | | 120,000 | | | | 133,581 | |
| | |
Abbott Ireland Financing DAC 1.50%, 9/27/2026 (a) | | | EUR200,000 | | | | 230,363 | |
| | |
Acadia Healthcare Co., Inc. 6.50%, 3/1/2024 | | | 54,000 | | | | 53,730 | |
| | |
ACCO Brands Corp. 5.25%, 12/15/2024 (b) | | | 120,000 | | | | 117,900 | |
| | |
ACE Cash Express, Inc. 12.00%, 12/15/2022 (b) | | | 23,000 | | | | 21,879 | |
| | |
ADT Security Corp. (The) 4.13%, 6/15/2023 | | | 74,000 | | | | 72,612 | |
| | |
AES Corp. 5.50%, 4/15/2025 | | | 15,000 | | | | 15,469 | |
| | |
Ahern Rentals, Inc. 7.38%, 5/15/2023 (b) | | | 30,000 | | | | 27,675 | |
| | |
Air Lease Corp. 3.00%, 9/15/2023 | | | 45,000 | | | | 43,185 | |
| | |
Air Medical Group Holdings, Inc. 6.38%, 5/15/2023 (b) | | | 70,000 | | | | 59,500 | |
| | |
AK Steel Corp. | | | | | | | | |
| | |
6.38%, 10/15/2025 | | | 20,000 | | | | 16,600 | |
| | |
7.00%, 3/15/2027 | | | 18,000 | | | | 15,120 | |
| | |
Albertsons Cos. LLC | | | | | | | | |
| | |
6.63%, 6/15/2024 | | | 124,000 | | | | 124,000 | |
| | |
5.75%, 3/15/2025 | | | 25,000 | | | | 23,812 | |
| | |
Alliance Data Systems Corp. 5.38%, 8/1/2022 (b) | | | 47,000 | | | | 47,705 | |
| | |
Allison Transmission, Inc. | | | | | | | | |
| | |
5.00%, 10/1/2024 (b) | | | 20,000 | | | | 20,125 | |
| | |
4.75%, 10/1/2027 (b) | | | 50,000 | | | | 47,875 | |
| | |
Ally Financial, Inc. 4.63%, 5/19/2022 | | | 174,000 | | | | 177,262 | |
| | |
Altria Group, Inc. | | | | | | | | |
| | |
4.00%, 1/31/2024 | | | 40,000 | | | | 40,377 | |
| | |
1.70%, 6/15/2025 | | | EUR300,000 | | | | 340,314 | |
| | |
2.20%, 6/15/2027 | | | EUR 250,000 | | | | 283,460 | |
SEE NOTES TO FINANCIAL STATEMENTS.
| | | | | | | | |
| | | |
| FEBRUARY 28, 2019 | | J.P. MORGAN EXCHANGE-TRADED FUNDS | | | | | 57 | |
JPMorgan Global Bond Opportunities ETF
SCHEDULE OF PORTFOLIO INVESTMENTS
AS OF FEBRUARY 28, 2019 (continued)
(Amounts in U.S. Dollars, unless otherwise noted)
| | | | | | | | |
| INVESTMENTS | | PRINCIPAL
AMOUNT | | | VALUE ($) | |
Corporate Bonds — continued | | | | | | | | |
| | |
United States — continued | | | | | | | | |
| | |
4.25%, 8/9/2042 | | | 15,000 | | | | 12,115 | |
| | |
3.88%, 9/16/2046 | | | 115,000 | | | | 87,152 | |
| | |
AMC Entertainment Holdings, Inc. | | | | | | | | |
| | |
5.75%, 6/15/2025 | | | 146,000 | | | | 134,685 | |
| | |
5.88%, 11/15/2026 | | | 18,000 | | | | 16,202 | |
| | |
6.13%, 5/15/2027 | | | 19,000 | | | | 17,029 | |
| | |
AMC Networks, Inc. 5.00%, 4/1/2024 | | | 119,000 | | | | 118,071 | |
| | |
American Axle & Manufacturing, Inc. | | | | | | | | |
| | |
6.63%, 10/15/2022 | | | 241,000 | | | | 246,724 | |
| | |
6.25%, 4/1/2025 | | | 11,000 | | | | 10,974 | |
| | |
6.50%, 4/1/2027 | | | 43,000 | | | | 42,462 | |
| | |
American Tower Corp. | | | | | | | | |
| | |
REIT, 5.00%, 2/15/2024 | | | 570,000 | | | | 604,102 | |
| | |
REIT, 1.38%, 4/4/2025 | | | EUR140,000 | | | | 157,386 | |
| | |
American Woodmark Corp. 4.88%, 3/15/2026 (b) | | | 95,000 | | | | 92,625 | |
| | |
AmeriGas Partners LP 5.50%, 5/20/2025 | | | 35,000 | | | | 34,650 | |
| | |
Amkor Technology, Inc. 6.38%, 10/1/2022 | | | 130,000 | | | | 130,975 | |
| | |
Antero Resources Corp. 5.13%, 12/1/2022 | | | 134,000 | | | | 134,214 | |
| | |
Anthem, Inc. 3.50%, 8/15/2024 | | | 110,000 | | | | 109,890 | |
| | |
Aramark International Finance SARL 3.13%, 4/1/2025 (a) | | | EUR100,000 | | | | 118,326 | |
| | |
Arconic, Inc. 5.90%, 2/1/2027 | | | 60,000 | | | | 59,700 | |
| | |
AT&T, Inc. 4.75%, 5/15/2046 | | | 75,000 | | | | 69,638 | |
| | |
Avantor, Inc. 6.00%, 10/1/2024 (b) | | | 200,000 | | | | 204,000 | |
| | |
Avis Budget Car Rental LLC | | | | | | | | |
| | |
6.38%, 4/1/2024 (b) | | | 55,000 | | | | 56,100 | |
| | |
5.25%, 3/15/2025 (b) | | | 141,000 | | | | 133,950 | |
| | |
Avis Budget Finance plc 4.13%, 11/15/2024 (a) | | | EUR100,000 | | | | 117,692 | |
| | |
Axalta Coating Systems LLC 4.25%, 8/15/2024 (a) | | | EUR100,000 | | | | 118,579 | |
| | |
B&G Foods, Inc. 5.25%, 4/1/2025 | | | 20,000 | | | | 19,136 | |
| | |
Ball Corp. 4.38%, 12/15/2023 | | | EUR250,000 | | | | 323,599 | |
| | |
Banff Merger Sub, Inc. 9.75%, 9/1/2026 (b) | | | 35,000 | | | | 33,906 | |
| | |
Bank of America Corp. | | | | | | | | |
| | |
2.63%, 4/19/2021 | | | 270,000 | | | | 268,243 | |
| | |
(ICE LIBOR USD 3 Month + 0.37%), 2.74%, 1/23/2022 (d) | | | 180,000 | | | | 178,572 | |
| | |
(ICE LIBOR USD 3 Month + 0.79%), 3.00%, 12/20/2023 (d) | | | 810,000 | | | | 799,468 | |
| | | | | | | | |
| INVESTMENTS | | PRINCIPAL
AMOUNT | | | VALUE ($) | |
| | | | | | | | |
| | |
United States — continued | | | | | | | | |
| | |
Series DD, (ICE LIBOR USD 3 Month + 4.55%), 6.30%, 3/10/2026 (c) (d) (e) | | | 230,000 | | | | 250,470 | |
| | |
Series L, 4.18%, 11/25/2027 | | | 180,000 | | | | 179,156 | |
| | |
Series FF, (ICE LIBOR USD 3 Month + 2.93%), 5.87%, 3/15/2028 (c) (d) (e) | | | 335,000 | | | | 327,660 | |
| | |
Bausch Health Cos., Inc. | | | | | | | | |
| | |
6.50%, 3/15/2022 (b) | | | 74,000 | | | | 76,683 | |
| | |
4.50%, 5/15/2023 (a) | | | EUR300,000 | | | | 343,756 | |
| | |
5.88%, 5/15/2023 (b) | | | 250,000 | | | | 248,750 | |
| | |
7.00%, 3/15/2024 (b) | | | 75,000 | | | | 79,031 | |
| | |
6.13%, 4/15/2025 (b) | | | 445,000 | | | | 428,312 | |
| | |
Becton Dickinson and Co. 1.40%, 5/24/2023 | | | EUR100,000 | | | | 115,545 | |
| | |
Belden, Inc. 3.38%, 7/15/2027 (a) | | | EUR300,000 | | | | 341,208 | |
| | |
Berry Global, Inc. | | | | | | | | |
| | |
5.13%, 7/15/2023 | | | 25,000 | | | | 25,031 | |
| | |
4.50%, 2/15/2026 (b) | | | 13,000 | | | | 12,301 | |
| | |
Big River Steel LLC 7.25%, 9/1/2025 (b) | | | 10,000 | | | | 10,362 | |
| | |
Blue Racer Midstream LLC 6.13%, 11/15/2022 (b) | | | 80,000 | | | | 81,100 | |
| | |
Boston Scientific Corp. | | | | | | | | |
| | |
3.75%, 3/1/2026 | | | 110,000 | | | | 109,977 | |
| | |
4.00%, 3/1/2029 | | | 280,000 | | | | 280,060 | |
| | |
Boyd Gaming Corp. | | | | | | | | |
| | |
6.88%, 5/15/2023 | | | 80,000 | | | | 83,600 | |
| | |
6.38%, 4/1/2026 | | | 89,000 | | | | 92,782 | |
| | |
Boyne USA, Inc. 7.25%, 5/1/2025 (b) | | | 35,000 | | | | 37,450 | |
| | |
Brink’s Co. (The) 4.63%, 10/15/2027 (b) | | | 12,000 | | | | 11,430 | |
| | |
Bristow Group, Inc. 6.25%, 10/15/2022 | | | 8,000 | | | | 2,400 | |
| | |
Broadcom Corp. 3.63%, 1/15/2024 | | | 210,000 | | | | 204,082 | |
| | |
Buckeye Partners LP | | | | | | | | |
| | |
4.15%, 7/1/2023 | | | 171,000 | | | | 169,965 | |
| | |
3.95%, 12/1/2026 | | | 30,000 | | | | 28,055 | |
| | |
(ICE LIBOR USD 3 Month + 4.02%), 6.37%, 1/22/2078 (d) | | | 45,000 | | | | 39,038 | |
| | |
BWAY Holding Co. 5.50%, 4/15/2024 (b) | | | 75,000 | | | | 73,945 | |
| | |
Cablevision Systems Corp. 8.00%, 4/15/2020 | | | 119,000 | | | | 124,688 | |
| | |
California Resources Corp. 8.00%, 12/15/2022 (b) | | | 22,000 | | | | 17,572 | |
SEE NOTES TO FINANCIAL STATEMENTS.
| | | | | | |
| | | |
| 58 | | | | J.P. MORGAN EXCHANGE-TRADED FUNDS | | FEBRUARY 28, 2019 |
| | | | | | | | |
| INVESTMENTS | | PRINCIPAL
AMOUNT | | | VALUE ($) | |
Corporate Bonds — continued | | | | | | | | |
| | |
United States — continued | | | | | | | | |
| | |
Callon Petroleum Co. 6.13%, 10/1/2024 | | | 45,000 | | | | 45,337 | |
| | |
Calpine Corp. 5.25%, 6/1/2026 (b) | | | 69,000 | | | | 67,534 | |
| | |
Camelot Finance SA 7.88%, 10/15/2024 (b) | | | 30,000 | | | | 31,320 | |
| | |
Capital One Financial Corp. 3.80%, 1/31/2028 | | | 180,000 | | | | 172,983 | |
| | |
Carrizo Oil & Gas, Inc. 6.25%, 4/15/2023 | | | 47,000 | | | | 46,354 | |
| | |
Catalent Pharma Solutions, Inc. 4.88%, 1/15/2026 (b) | | | 15,000 | | | | 14,850 | |
| | |
CBS Radio, Inc. 7.25%, 11/1/2024 (b) | | | 20,000 | | | | 19,825 | |
| | |
CCO Holdings LLC | | | | | | | | |
| | |
5.88%, 4/1/2024 (b) | | | 139,000 | | | | 144,734 | |
| | |
5.75%, 2/15/2026 (b) | | | 501,000 | | | | 519,181 | |
| | |
5.13%, 5/1/2027 (b) | | | 140,000 | | | | 137,375 | |
| | |
Centene Corp. 6.13%, 2/15/2024 | | | 48,000 | | | | 50,220 | |
| | |
Central Garden & Pet Co. | | | | | | | | |
| | |
6.13%, 11/15/2023 | | | 20,000 | | | | 20,750 | |
| | |
5.13%, 2/1/2028 | | | 95,000 | | | | 87,875 | |
| | |
CenturyLink, Inc. | | | | | | | | |
| | |
Series S, 6.45%, 6/15/2021 | | | 70,000 | | | | 72,713 | |
| | |
Series T, 5.80%, 3/15/2022 | | | 60,000 | | | | 61,575 | |
| | |
Series W, 6.75%, 12/1/2023 | | | 80,000 | | | | 83,075 | |
| | |
CF Industries, Inc. 4.50%, 12/1/2026 (b) | | | 190,000 | | | | 188,337 | |
| | |
Charter Communications Operating LLC | | | | | | | | |
| | |
4.91%, 7/23/2025 | | | 279,000 | | | | 289,021 | |
| | |
5.38%, 5/1/2047 | | | 138,000 | | | | 130,841 | |
| | |
Chemours Co. (The) | | | | | | | | |
| | |
6.63%, 5/15/2023 | | | 40,000 | | | | 41,502 | |
| | |
7.00%, 5/15/2025 | | | 17,000 | | | | 17,723 | |
| | |
4.00%, 5/15/2026 | | | EUR100,000 | | | | 113,075 | |
| | |
Cheniere Corpus Christi Holdings LLC 5.88%, 3/31/2025 | | | 39,000 | | | | 41,535 | |
| | |
Cheniere Energy Partners LP 5.25%, 10/1/2025 | | | 30,000 | | | | 30,375 | |
| | |
Chesapeake Energy Corp. | | | | | | | | |
| | |
7.00%, 10/1/2024 | | | 40,000 | | | | 39,500 | |
| | |
8.00%, 1/15/2025 | | | 32,000 | | | | 32,520 | |
| | |
8.00%, 6/15/2027 | | | 134,000 | | | | 132,707 | |
| | |
Cincinnati Bell, Inc. 7.00%, 7/15/2024 (b) | | | 134,000 | | | | 121,270 | |
| | |
Cinemark USA, Inc. 4.88%, 6/1/2023 | | | 25,000 | | | | 25,025 | |
| | | | | | | | |
| INVESTMENTS | | PRINCIPAL
AMOUNT | | | VALUE ($) | |
| | | | | | | | |
| | |
United States — continued | | | | | | | | |
| | |
CITGO Petroleum Corp. 6.25%, 8/15/2022 (b) | | | 27,000 | | | | 26,899 | |
| | |
Citigroup, Inc. | | | | | | | | |
| | |
(ICE LIBOR USD 3 Month + 0.72%), 3.14%, 1/24/2023 (d) | | | 100,000 | | | | 99,623 | |
| | |
Series P, (ICE LIBOR USD 3 Month + 3.91%), 5.95%, 5/15/2025 (c) (d) (e) | | | 190,000 | | | | 191,425 | |
| | |
Series T, (ICE LIBOR USD 3 Month + 4.52%), 6.25%, 8/15/2026 (c) (d) (e) | | | 200,000 | | | | 210,232 | |
| | |
Clear Channel Worldwide Holdings, Inc. | | | | | | | | |
| | |
Series B, 7.63%, 3/15/2020 | | | 125,000 | | | | 125,062 | |
| | |
Series B, 6.50%, 11/15/2022 | | | 450,000 | | | | 460,125 | |
| | |
9.25%, 2/15/2024 (b) | | | 100,000 | | | | 104,875 | |
| | |
Clearwater Paper Corp. 4.50%, 2/1/2023 | | | 32,000 | | | | 30,400 | |
| | |
Clearway Energy Operating LLC 5.00%, 9/15/2026 | | | 44,000 | | | | 41,030 | |
| | |
Cleveland-Cliffs, Inc. | | | | | | | | |
| | |
4.88%, 1/15/2024 (b) | | | 15,000 | | | | 14,962 | |
| | |
5.75%, 3/1/2025 | | | 10,000 | | | | 9,775 | |
| | |
CNG Holdings, Inc. 9.38%, 5/15/2020 (b) | | | 60,000 | | | | 58,875 | |
| | |
CNO Financial Group, Inc. 5.25%, 5/30/2025 | | | 15,000 | | | | 15,375 | |
| | |
CNX Midstream Partners LP 6.50%, 3/15/2026 (b) | | | 20,000 | | | | 19,650 | |
| | |
CNX Resources Corp. 5.88%, 4/15/2022 | | | 21,000 | | | | 21,210 | |
| | |
Cogent Communications Finance, Inc. 5.63%, 4/15/2021 (b) | | | 40,000 | | | | 40,300 | |
| | |
Cogent Communications Group, Inc. 5.38%, 3/1/2022 (b) | | | 25,000 | | | | 25,437 | |
| | |
Comcast Corp. | | | | | | | | |
| | |
3.95%, 10/15/2025 | | | 250,000 | | | | 257,647 | |
| | |
3.20%, 7/15/2036 | | | 170,000 | | | | 148,736 | |
| | |
4.60%, 8/15/2045 | | | 105,000 | | | | 106,010 | |
| | |
4.00%, 3/1/2048 | | | 90,000 | | | | 84,145 | |
| | |
4.70%, 10/15/2048 | | | 120,000 | | | | 124,936 | |
| | |
Commercial Metals Co. 4.88%, 5/15/2023 | | | 30,000 | | | | 29,400 | |
| | |
CommScope Technologies LLC 6.00%, 6/15/2025 (b) | | | 289,000 | | | | 272,382 | |
| | |
Community Health Systems, Inc. | | | | | | | | |
| | |
5.13%, 8/1/2021 | | | 33,000 | | | | 32,381 | |
| | |
6.25%, 3/31/2023 | | | 21,000 | | | | 20,212 | |
SEE NOTES TO FINANCIAL STATEMENTS.
| | | | | | | | |
| | | |
| FEBRUARY 28, 2019 | | J.P. MORGAN EXCHANGE-TRADED FUNDS | | | | | 59 | |
JPMorgan Global Bond Opportunities ETF
SCHEDULE OF PORTFOLIO INVESTMENTS
AS OF FEBRUARY 28, 2019 (continued)
(Amounts in U.S. Dollars, unless otherwise noted)
| | | | | | | | |
| INVESTMENTS | | PRINCIPAL
AMOUNT | | | VALUE ($) | |
Corporate Bonds — continued | | | | | | | | |
| | |
United States — continued | | | | | | | | |
| | |
8.63%, 1/15/2024 (b) | | | 37,000 | | | | 38,018 | |
| | |
8.13%, 6/30/2024 (b) | | | 60,000 | | | | 49,950 | |
| | |
Concho Resources, Inc. 3.75%, 10/1/2027 | | | 53,000 | | | | 51,357 | |
| | |
Constellation Merger Sub, Inc. 8.50%, 9/15/2025 (b) | | | 26,000 | | | | 24,895 | |
| | |
Constellium NV 4.25%, 2/15/2026 (a) | | | EUR200,000 | | | | 227,037 | |
| | |
Cooper-Standard Automotive, Inc. 5.63%, 11/15/2026 (b) | | | 105,000 | | | | 94,106 | |
| | |
Coty, Inc. 6.50%, 4/15/2026 (b) | | | 50,000 | | | | 48,185 | |
| | |
Covanta Holding Corp. 5.88%, 7/1/2025 | | | 14,000 | | | | 13,965 | |
| | |
Crestwood Midstream Partners LP 5.75%, 4/1/2025 | | | 30,000 | | | | 30,197 | |
| | |
Crown Americas LLC 4.25%, 9/30/2026 | | | 74,000 | | | | 71,225 | |
| | |
Crown European Holdings SA | | | | | | | | |
| | |
4.00%, 7/15/2022 (a) | | | EUR350,000 | | | | 433,937 | |
| | |
2.63%, 9/30/2024 (a) | | | EUR125,000 | | | | 147,158 | |
| | |
CSC Holdings LLC 6.63%, 10/15/2025 (b) | | | 210,000 | | | | 221,550 | |
| | |
CSI Compressco LP 7.50%, 4/1/2025 (b) | | | 10,000 | | | | 9,700 | |
| | |
Curo Group Holdings Corp. 8.25%, 9/1/2025 (b) | | | 110,000 | | | | 94,240 | |
| | |
CVR Partners LP 9.25%, 6/15/2023 (b) | | | 93,000 | | | | 98,106 | |
| | |
CVS Health Corp. | | | | | | | | |
| | |
4.30%, 3/25/2028 | | | 100,000 | | | | 100,068 | |
| | |
4.78%, 3/25/2038 | | | 65,000 | | | | 63,230 | |
| | |
Dana Financing Luxembourg SARL 6.50%, 6/1/2026 (b) | | | 105,000 | | | | 107,100 | |
| | |
Darling Global Finance BV 3.63%, 5/15/2026 (a) | | | EUR125,000 | | | | 146,249 | |
| | |
DaVita, Inc. 5.13%, 7/15/2024 | | | 82,000 | | | | 81,180 | |
| | |
DCP Midstream Operating LP 3.88%, 3/15/2023 | | | 74,000 | | | | 73,445 | |
| | |
Delek Logistics Partners LP 6.75%, 5/15/2025 | | | 29,000 | | | | 27,840 | |
| | |
Dell International LLC | | | | | | | | |
| | |
7.13%, 6/15/2024 (b) | | | 37,000 | | | | 39,262 | |
| | |
6.02%, 6/15/2026 (b) | | | 255,000 | | | | 270,422 | |
| | |
Diamond Offshore Drilling, Inc. 7.88%, 8/15/2025 | | | 15,000 | | | | 14,175 | |
| | |
DISH DBS Corp. | | | | | | | | |
| | |
6.75%, 6/1/2021 | | | 10,000 | | | | 10,225 | |
| | |
5.88%, 7/15/2022 | | | 157,000 | | | | 149,935 | |
| | | | | | | | |
| INVESTMENTS | | PRINCIPAL
AMOUNT | | | VALUE ($) | |
| | | | | | | | |
| | |
United States — continued | | | | | | | | |
| | |
5.00%, 3/15/2023 | | | 100,000 | | | | 88,375 | |
| | |
5.88%, 11/15/2024 | | | 415,000 | | | | 349,513 | |
| | |
7.75%, 7/1/2026 | | | 122,000 | | | | 105,530 | |
| | |
Dole Food Co., Inc. 7.25%, 6/15/2025 (b) | | | 39,000 | | | | 35,086 | |
| | |
Downstream Development Authority of the Quapaw Tribe of Oklahoma 10.50%, 2/15/2023 (b) | | | 60,000 | | | | 61,050 | |
| | |
Eldorado Resorts, Inc. 7.00%, 8/1/2023 | | | 40,000 | | | | 41,900 | |
| | |
Encompass Health Corp. | | | | | | | | |
| | |
5.75%, 11/1/2024 | | | 85,000 | | | | 85,875 | |
| | |
5.75%, 9/15/2025 | | | 105,000 | | | | 106,050 | |
| | |
Endo Finance LLC 5.75%, 1/15/2022 (b) | | | 67,000 | | | | 62,812 | |
| | |
Energizer Holdings, Inc. 5.50%, 6/15/2025 (b) | | | 70,000 | | | | 68,425 | |
| | |
EnLink Midstream Partners LP | | | | | | | | |
| | |
4.40%, 4/1/2024 | | | 20,000 | | | | 19,425 | |
| | |
4.15%, 6/1/2025 | | | 20,000 | | | | 19,050 | |
| | |
5.60%, 4/1/2044 | | | 20,000 | | | | 17,650 | |
| | |
Ensco plc 5.20%, 3/15/2025 | | | 11,000 | | | | 8,442 | |
| | |
Entegris, Inc. 4.63%, 2/10/2026 (b) | | | 65,000 | | | | 63,862 | |
| | |
Enterprise Development Authority (The) 12.00%, 7/15/2024 (b) | | | 85,000 | | | | 85,637 | |
| | |
Enterprise Products Operating LLC | | | | | | | | |
| | |
Series E, (ICE LIBOR USD 3 Month + 3.03%), 5.25%, 8/16/2077 (d) | | | 125,000 | | | | 114,638 | |
| | |
(ICE LIBOR USD 3 Month + 2.57%), 5.38%, 2/15/2078 (d) | | | 28,000 | | | | 24,513 | |
| | |
Envision Healthcare Corp. 8.75%, 10/15/2026 (b) | | | 130,000 | | | | 117,325 | |
| | |
EP Energy LLC | | | | | | | | |
| | |
9.38%, 5/1/2024 (b) | | | 34,000 | | | | 15,895 | |
| | |
8.00%, 11/29/2024 (b) | | | 87,000 | | | | 61,335 | |
| | |
7.75%, 5/15/2026 (b) | | | 161,000 | | | | 142,686 | |
| | |
Equinix, Inc. | | | | | | | | |
| | |
REIT, 5.38%, 4/1/2023 | | | 60,000 | | | | 61,050 | |
| | |
REIT, 2.88%, 10/1/2025 | | | EUR225,000 | | | | 262,608 | |
| | |
REIT, 5.88%, 1/15/2026 | | | 115,000 | | | | 120,463 | |
| | |
ESH Hospitality, Inc. REIT, 5.25%, 5/1/2025 (b) | | | 133,000 | | | | 132,335 | |
| | |
Exela Intermediate LLC 10.00%, 7/15/2023 (b) | | | 56,000 | | | | 57,120 | |
| | |
Fidelity & Guaranty Life Holdings, Inc. 5.50%, 5/1/2025 (b) | | | 32,000 | | | | 31,480 | |
SEE NOTES TO FINANCIAL STATEMENTS.
| | | | | | |
| | | |
| 60 | | | | J.P. MORGAN EXCHANGE-TRADED FUNDS | | FEBRUARY 28, 2019 |
| | | | | | | | |
| INVESTMENTS | | PRINCIPAL
AMOUNT | | | VALUE ($) | |
Corporate Bonds — continued | | | | | | | | |
| | |
United States — continued | | | | | | | | |
| | |
First Data Corp. | | | | | | | | |
| | |
5.38%, 8/15/2023 (b) | | | 190,000 | | | | 194,465 | |
| | |
5.75%, 1/15/2024 (b) | | | 60,000 | | | | 61,925 | |
| | |
FirstCash, Inc. 5.38%, 6/1/2024 (b) | | | 15,000 | | | | 15,192 | |
| | |
FirstEnergy Corp. Series B, 3.90%, 7/15/2027 | | | 295,000 | | | | 292,066 | |
| | |
Fox Corp. | | | | | | | | |
| | |
4.03%, 1/25/2024 (b) | | | 90,000 | | | | 91,722 | |
| | |
4.71%, 1/25/2029 (b) | | | 40,000 | | | | 41,462 | |
| | |
Freeport-McMoRan, Inc. | | | | | | | | |
| | |
3.55%, 3/1/2022 | | | 59,000 | | | | 58,336 | |
| | |
3.88%, 3/15/2023 | | | 25,000 | | | | 24,637 | |
| | |
Frontier Communications Corp. | | | | | | | | |
| | |
8.75%, 4/15/2022 | | | 35,000 | | | | 23,888 | |
| | |
8.50%, 4/1/2026 (b) | | | 160,000 | | | | 148,800 | |
| | |
FXI Holdings, Inc. 7.88%, 11/1/2024 (b) | | | 14,000 | | | | 13,405 | |
| | |
GCI LLC 6.88%, 4/15/2025 | | | 90,000 | | | | 91,800 | |
| | |
GE Capital International Funding Co. Unlimited Co. 4.42%, 11/15/2035 | | | 200,000 | | | | 180,656 | |
| | |
General Electric Co. | | | | | | | | |
| | |
1.50%, 5/17/2029 | | | EUR100,000 | | | | 106,484 | |
| | |
2.13%, 5/17/2037 | | | EUR100,000 | | | | 98,780 | |
| | |
4.50%, 3/11/2044 | | | 120,000 | | | | 107,420 | |
| | |
General Motors Co. 5.15%, 4/1/2038 | | | 115,000 | | | | 103,288 | |
| | |
General Motors Financial Co., Inc. 4.00%, 1/15/2025 | | | 330,000 | | | | 316,969 | |
| | |
Genesis Energy LP 5.63%, 6/15/2024 | | | 35,000 | | | | 32,578 | |
| | |
GEO Group, Inc. (The) REIT, 5.88%, 10/15/2024 | | | 100,000 | | | | 94,750 | |
| | |
Gilead Sciences, Inc. 4.00%, 9/1/2036 | | | 20,000 | | | | 18,638 | |
| | |
Global Partners LP | | | | | | | | |
| | |
6.25%, 7/15/2022 | | | 25,000 | | | | 24,500 | |
| | |
7.00%, 6/15/2023 | | | 25,000 | | | | 24,719 | |
| | |
Goldman Sachs Group, Inc. (The) | | | | | | | | |
| | |
Series P, (ICE LIBOR USD 3 Month + 2.87%), 5.00%, 11/10/2022 (c) (d) (e) | | | 170,000 | | | | 156,400 | |
| | |
(ICE LIBOR USD 3 Month + 0.99%), 2.90%, 7/24/2023 (d) | | | 205,000 | | | | 200,757 | |
| | |
(ICE LIBOR USD 3 Month + 1.60%), 4.23%, 11/29/2023 (d) | | | 130,000 | | | | 132,900 | |
| | |
(ICE LIBOR USD 3 Month + 1.17%), 3.85%, 5/15/2026 (d) | | | 201,000 | | | | 196,242 | |
| | | | | | | | |
| INVESTMENTS | | PRINCIPAL
AMOUNT | | | VALUE ($) | |
| | | | | | | | |
| | |
United States — continued | | | | | | | | |
| | |
Series O, (ICE LIBOR USD 3 Month + 3.83%), 5.30%, 11/10/2026 (c) (d) (e) | | | 190,000 | | | | 188,986 | |
| | |
(ICE LIBOR USD 3 Month + 1.16%), 3.81%, 4/23/2029 (d) | | | 67,000 | | | | 65,218 | |
| | |
Goodyear Tire & Rubber Co. (The) | | | | | | | | |
| | |
5.00%, 5/31/2026 | | | 94,000 | | | | 89,182 | |
| | |
4.88%, 3/15/2027 | | | 21,000 | | | | 19,320 | |
| | |
Gray Television, Inc. 7.00%, 5/15/2027 (b) | | | 60,000 | | | | 63,450 | |
| | |
Gulfport Energy Corp. 6.00%, 10/15/2024 | | | 78,000 | | | | 70,590 | |
| | |
H&E Equipment Services, Inc. 5.63%, 9/1/2025 | | | 15,000 | | | | 14,850 | |
| | |
Hanesbrands, Inc. 4.88%, 5/15/2026 (b) | | | 51,000 | | | | 50,235 | |
| | |
Harris Corp. 4.85%, 4/27/2035 | | | 185,000 | | | | 190,925 | |
| | |
HCA, Inc. | | | | | | | | |
| | |
5.88%, 3/15/2022 | | | 82,000 | | | | 87,248 | |
| | |
5.88%, 5/1/2023 | | | 82,000 | | | | 86,715 | |
| | |
5.38%, 2/1/2025 | | | 130,000 | | | | 134,835 | |
| | |
5.88%, 2/15/2026 | | | 375,000 | | | | 396,094 | |
| | |
5.63%, 9/1/2028 | | | 4,000 | | | | 4,135 | |
| | |
5.88%, 2/1/2029 | | | 16,000 | | | | 16,780 | |
| | |
Hertz Corp. (The) | | | | | | | | |
| | |
7.38%, 1/15/2021 | | | 24,000 | | | | 24,000 | |
| | |
7.63%, 6/1/2022 (b) | | | 6,000 | | | | 6,135 | |
| | |
5.50%, 10/15/2024 (b) | | | 213,000 | | | | 181,050 | |
| | |
Hertz Holdings Netherlands BV 4.13%, 10/15/2021 (a) | | | EUR125,000 | | | | 145,110 | |
| | |
Hilcorp Energy I LP | | | | | | | | |
| | |
5.00%, 12/1/2024 (b) | | | 23,000 | | | | 22,080 | |
| | |
6.25%, 11/1/2028 (b) | | | 25,000 | | | | 24,500 | |
| | |
Hilton Domestic Operating Co., Inc. 5.13%, 5/1/2026 (b) | | | 5,000 | | | | 5,024 | |
| | |
Hilton Grand Vacations Borrower LLC 6.13%, 12/1/2024 | | | 23,000 | | | | 23,690 | |
| | |
Hilton Worldwide Finance LLC | | | | | | | | |
| | |
4.63%, 4/1/2025 | | | 65,000 | | | | 64,675 | |
| | |
4.88%, 4/1/2027 | | | 34,000 | | | | 33,830 | |
| | |
Holly Energy Partners LP 6.00%, 8/1/2024 (b) | | | 16,000 | | | | 16,400 | |
| | |
Home Depot, Inc. (The) 3.90%, 12/6/2028 | | | 140,000 | | | | 145,074 | |
| | |
Hughes Satellite Systems Corp. 5.25%, 8/1/2026 | | | 104,000 | | | | 101,660 | |
SEE NOTES TO FINANCIAL STATEMENTS.
| | | | | | | | |
| | | |
| FEBRUARY 28, 2019 | | J.P. MORGAN EXCHANGE-TRADED FUNDS | | | | | 61 | |
JPMorgan Global Bond Opportunities ETF
SCHEDULE OF PORTFOLIO INVESTMENTS
AS OF FEBRUARY 28, 2019 (continued)
(Amounts in U.S. Dollars, unless otherwise noted)
| | | | | | | | |
| INVESTMENTS | | PRINCIPAL
AMOUNT | | | VALUE ($) | |
Corporate Bonds — continued | | | | | | | | |
| | |
United States — continued | | | | | | | | |
| | |
Huntsman International LLC 5.13%, 4/15/2021 | | | EUR100,000 | | | | 123,641 | |
| | |
Icahn Enterprises LP 6.00%, 8/1/2020 | | | 45,000 | | | | 45,450 | |
| | |
IHS Markit Ltd. 4.00%, 3/1/2026 (b) | | | 21,000 | | | | 20,398 | |
| | |
Infor Software Parent LLC 7.13% (cash), 5/1/2021 (b) (g) | | | 58,000 | | | | 58,232 | |
| | |
Infor US, Inc. 6.50%, 5/15/2022 | | | 141,000 | | | | 143,788 | |
| | |
Intel Corp. 2.60%, 5/19/2026 | | | 15,000 | | | | 14,372 | |
| | |
International Game Technology plc 4.75%, 2/15/2023 (a) | | | EUR200,000 | | | | 247,673 | |
| | |
IQVIA, Inc. | | | | | | | | |
| | |
3.50%, 10/15/2024 (a) | | | EUR250,000 | | | | 291,471 | |
| | |
3.25%, 3/15/2025 (a) | | | EUR200,000 | | | | 232,328 | |
| | |
IRB Holding Corp. 6.75%, 2/15/2026 (b) | | | 58,000 | | | | 54,810 | |
| | |
Iron Mountain, Inc. | | | | | | | | |
| | |
REIT, 5.75%, 8/15/2024 | | | 58,000 | | | | 58,145 | |
| | |
REIT, 3.00%, 1/15/2025 (a) | | | EUR100,000 | | | | 112,890 | |
| | |
ITC Holdings Corp. 3.35%, 11/15/2027 | | | 140,000 | | | | 134,678 | |
| | |
Jack Ohio Finance LLC 6.75%, 11/15/2021 (b) | | | 40,000 | | | | 41,200 | |
| | |
JBS USA LUX SA 6.75%, 2/15/2028 (b) | | | 80,000 | | | | 82,744 | |
| | |
JELD-WEN, Inc. 4.63%, 12/15/2025 (b) | | | 70,000 | | | | 65,888 | |
| | |
Kaiser Aluminum Corp. 5.88%, 5/15/2024 | | | 10,000 | | | | 10,225 | |
| | |
Kennedy-Wilson, Inc. 5.88%, 4/1/2024 | | | 14,000 | | | | 13,772 | |
| | |
Kinetic Concepts, Inc. 7.88%, 2/15/2021 (b) | | | 90,000 | | | | 91,913 | |
| | |
Kraft Heinz Foods Co. 4.38%, 6/1/2046 | | | 55,000 | | | | 45,572 | |
| | |
Kroger Co. (The) 2.65%, 10/15/2026 | | | 135,000 | | | | 121,568 | |
| | |
Kronos International, Inc. 3.75%, 9/15/2025 (b) | | | EUR100,000 | | | | 104,645 | |
| | |
L Brands, Inc. | | | | | | | | |
| | |
5.63%, 10/15/2023 | | | 45,000 | | | | 44,663 | |
| | |
5.25%, 2/1/2028 | | | 18,000 | | | | 15,570 | |
| | |
Lamar Media Corp. 5.75%, 2/1/2026 | | | 50,000 | | | | 52,313 | |
| | |
Lennar Corp. 5.88%, 11/15/2024 | | | 48,000 | | | | 50,400 | |
| | |
Level 3 Financing, Inc. 5.25%, 3/15/2026 | | | 61,000 | | | | 59,856 | |
| | |
Level 3 Parent LLC 5.75%, 12/1/2022 | | | 175,000 | | | | 176,969 | |
| | | | | | | | |
| INVESTMENTS | | PRINCIPAL
AMOUNT | | | VALUE ($) | |
| | | | | | | | |
| | |
United States — continued | | | | | | | | |
| | |
Liberty Mutual Group, Inc. 7.80%, 3/15/2037 (b) | | | 15,000 | | | | 17,100 | |
| | |
LKQ Italia Bondco SpA 3.88%, 4/1/2024 (a) | | | EUR100,000 | | | | 120,177 | |
| | |
LPL Holdings, Inc. 5.75%, 9/15/2025 (b) | | | 38,000 | | | | 38,428 | |
| | |
Marriott Ownership Resorts, Inc. 6.50%, 9/15/2026 (b) | | | 26,000 | | | | 26,845 | |
| | |
Martin Marietta Materials, Inc.
3.50%, 12/15/2027 | | | 125,000 | | | | 115,920 | |
| | |
4.25%, 12/15/2047 | | | 150,000 | | | | 124,830 | |
| | |
Martin Midstream Partners LP 7.25%, 2/15/2021 | | | 46,000 | | | | 44,793 | |
| | |
Masco Corp. 3.50%, 11/15/2027 | | | 15,000 | | | | 13,895 | |
| | |
MasTec, Inc. 4.88%, 3/15/2023 | | | 37,000 | | | | 37,093 | |
| | |
Matador Resources Co. 5.88%, 9/15/2026 | | | 21,000 | | | | 20,895 | |
| | |
Mattel, Inc. | | | | | | | | |
| | |
3.15%, 3/15/2023 | | | 10,000 | | | | 8,825 | |
| | |
6.75%, 12/31/2025 (b) | | | 135,000 | | | | 132,975 | |
| | |
MetLife, Inc. 6.40%, 12/15/2036 | | | 20,000 | | | | 21,200 | |
| | |
MGM Resorts International | | | | | | | | |
| | |
6.00%, 3/15/2023 | | | 315,000 | | | | 329,569 | |
| | |
4.63%, 9/1/2026 | | | 55,000 | | | | 52,250 | |
| | |
Morgan Stanley | | | | | | | | |
| | |
Series J, (ICE LIBOR USD 3 Month + 3.81%), 5.55%, 7/15/2020 (c) (d) (e) | | | 100,000 | | | | 100,375 | |
| | |
3.70%, 10/23/2024 | | | 360,000 | | | | 361,572 | |
| | |
3.63%, 1/20/2027 | | | 200,000 | | | | 196,117 | |
| | |
(ICE LIBOR USD 3 Month + 1.14%), 3.77%, 1/24/2029 (d) | | | 15,000 | | | | 14,764 | |
| | |
(ICE LIBOR USD 3 Month + 1.46%), 3.97%, 7/22/2038 (d) | | | 240,000 | | | | 228,025 | |
| | |
MPH Acquisition Holdings LLC 7.13%, 6/1/2024 (b) | | | 59,000 | | | | 58,779 | |
| | |
Mylan, Inc. 4.20%, 11/29/2023 | | | 270,000 | | | | 268,570 | |
| | |
Nabors Industries, Inc. | | | | | | | | |
| | |
5.10%, 9/15/2023 | | | 9,000 | | | | 7,965 | |
| | |
5.75%, 2/1/2025 | | | 90,000 | | | | 79,425 | |
| | |
Nationstar Mortgage LLC | | | | | | | | |
| | |
6.50%, 7/1/2021 | | | 2,000 | | | | 2,006 | |
| | |
6.50%, 6/1/2022 | | | 45,000 | | | | 44,652 | |
| | |
Netflix, Inc. | | | | | | | | |
| | |
4.38%, 11/15/2026 | | | 70,000 | | | | 67,156 | |
| | |
3.63%, 5/15/2027 | | | EUR100,000 | | | | 116,300 | |
| | |
4.88%, 4/15/2028 | | | 65,000 | | | | 63,294 | |
SEE NOTES TO FINANCIAL STATEMENTS.
| | | | | | |
| | | |
| 62 | | | | J.P. MORGAN EXCHANGE-TRADED FUNDS | | FEBRUARY 28, 2019 |
| | | | | | | | |
| INVESTMENTS | | PRINCIPAL
AMOUNT | | | VALUE ($) | |
Corporate Bonds — continued | | | | | | | | |
| | |
United States — continued | | | | | | | | |
| | |
New Albertsons LP 8.00%, 5/1/2031 | | | 103,000 | | | | 92,442 | |
| | |
New Home Co., Inc. (The) 7.25%, 4/1/2022 | | | 33,000 | | | | 30,380 | |
| | |
NextEra Energy Operating Partners LP 4.25%, 9/15/2024 (b) | | | 10,000 | | | | 9,825 | |
| | |
Nielsen Co. Luxembourg SARL (The) | | | | | | | | |
| | |
5.50%, 10/1/2021 (b) | | | 110,000 | | | | 110,963 | |
| | |
5.00%, 2/1/2025 (b) | | | 40,000 | | | | 39,500 | |
| | |
Nielsen Finance LLC 5.00%, 4/15/2022 (b) | | | 38,000 | | | | 37,905 | |
| | |
Noble Energy, Inc. 3.85%, 1/15/2028 | | | 410,000 | | | | 387,714 | |
| | |
Noble Holding International Ltd. | | | | | | | | |
| | |
7.88%, 2/1/2026 (b) | | | 53,000 | | | | 49,555 | |
| | |
5.25%, 3/15/2042 | | | 12,000 | | | | 7,440 | |
| | |
Northern Oil and Gas, Inc. 8.50%, (Blend (cash 8.50% + PIK 1.00%), 5/15/2023 (g) | | | 30,075 | | | | 30,815 | |
| | |
Novelis Corp. 5.88%, 9/30/2026 (b) | | | 74,000 | | | | 72,150 | |
| | |
NRG Energy, Inc. 6.63%, 1/15/2027 | | | 45,000 | | | | 47,925 | |
| | |
Nuance Communications, Inc. 5.63%, 12/15/2026 | | | 50,000 | | | | 51,000 | |
| | |
NuStar Logistics LP 5.63%, 4/28/2027 | | | 30,000 | | | | 30,075 | |
| | |
NVA Holdings, Inc. 6.88%, 4/1/2026 (b) | | | 20,000 | | | | 19,300 | |
| | |
Oasis Petroleum, Inc. | | | | | | | | |
| | |
6.88%, 1/15/2023 | | | 125,000 | | | | 124,219 | |
| | |
6.25%, 5/1/2026 (b) | | | 33,000 | | | | 31,432 | |
| | |
OI European Group BV 3.13%, 11/15/2024 (a) | | | EUR150,000 | | | | 178,070 | |
| | |
ONEOK, Inc. 4.00%, 7/13/2027 | | | 130,000 | | | | 127,820 | |
| | |
Outfront Media Capital LLC 5.88%, 3/15/2025 | | | 75,000 | | | | 76,897 | |
| | |
Owens Corning 4.30%, 7/15/2047 | | | 165,000 | | | | 128,293 | |
| | |
Party City Holdings, Inc. 6.63%, 8/1/2026 (b) | | | 47,000 | | | | 46,295 | |
| | |
Pattern Energy Group, Inc. 5.88%, 2/1/2024 (b) | | | 20,000 | | | | 20,275 | |
| | |
PBF Holding Co. LLC 7.25%, 6/15/2025 | | | 22,000 | | | | 22,561 | |
| | |
Peabody Energy Corp. 6.00%, 3/31/2022 (b) | | | 20,000 | | | | 20,175 | |
| | |
Penske Automotive Group, Inc. 5.75%, 10/1/2022 | | | 35,000 | | | | 35,525 | |
| | |
PetSmart, Inc. | | | | | | | | |
| | |
7.13%, 3/15/2023 (b) | | | 12,000 | | | | 8,130 | |
| | |
5.88%, 6/1/2025 (b) | | | 85,000 | | | | 67,575 | |
| | | | | | | | |
| INVESTMENTS | | PRINCIPAL
AMOUNT | | | VALUE ($) | |
| | | | | | | | |
| | |
United States — continued | | | | | | | | |
| | |
8.88%, 6/1/2025 (b) | | | 14,000 | | | | 9,450 | |
| | |
Pilgrim’s Pride Corp. 5.75%, 3/15/2025 (b) | | | 63,000 | | | | 63,000 | |
| | |
Plantronics, Inc. 5.50%, 5/31/2023 (b) | | | 53,000 | | | | 52,801 | |
| | |
Post Holdings, Inc. | | | | | | | | |
| | |
5.00%, 8/15/2026 (b) | | | 63,000 | | | | 60,559 | |
| | |
5.75%, 3/1/2027 (b) | | | 50,000 | | | | 49,312 | |
| | |
5.63%, 1/15/2028 (b) | | | 50,000 | | | | 48,313 | |
| | |
PPL Capital Funding, Inc. 3.10%, 5/15/2026 | | | 130,000 | | | | 122,254 | |
| | |
Prime Security Services Borrower LLC 9.25%, 5/15/2023 (b) | | | 43,000 | | | | 45,344 | |
| | |
PVH Corp. 3.63%, 7/15/2024 (a) | | | EUR125,000 | | | | 154,625 | |
| | |
QEP Resources, Inc. | | | | | | | | |
| | |
5.38%, 10/1/2022 | | | 38,000 | | | | 37,335 | |
| | |
5.63%, 3/1/2026 | | | 5,000 | | | | 4,688 | |
| | |
Qorvo, Inc. 5.50%, 7/15/2026 (b) | | | 52,000 | | | | 53,040 | |
| | |
Quicken Loans, Inc. 5.75%, 5/1/2025 (b) | | | 53,000 | | | | 52,311 | |
| | |
Rackspace Hosting, Inc. 8.63%, 11/15/2024 (b) | | | 38,000 | | | | 33,250 | |
| | |
Radian Group, Inc. 4.50%, 10/1/2024 | | | 25,000 | | | | 24,313 | |
| | |
Rain CII Carbon LLC 7.25%, 4/1/2025 (b) | | | 50,000 | | | | 43,250 | |
| | |
Realty Income Corp. REIT, 3.65%, 1/15/2028 | | | 150,000 | | | | 147,790 | |
| | |
Refinitiv US Holdings, Inc. 6.25%, 5/15/2026 (b) | | | 9,000 | | | | 9,090 | |
| | |
8.25%, 11/15/2026 (b) | | | 9,000 | | | | 8,806 | |
| | |
Reynolds Group Issuer, Inc. | | | | | | | | |
| | |
5.75%, 10/15/2020 | | | 72,683 | | | | 72,828 | |
| | |
5.13%, 7/15/2023 (b) | | | 76,000 | | | | 76,000 | |
| | |
Rite Aid Corp. 6.13%, 4/1/2023 (b) | | | 80,000 | | | | 68,343 | |
| | |
Rockwell Collins, Inc. | | | | | | | | |
| | |
3.70%, 12/15/2023 | | | 325,000 | | | | 325,758 | |
| | |
3.20%, 3/15/2024 | | | 400,000 | | | | 392,125 | |
| | |
3.50%, 3/15/2027 | | | 340,000 | | | | 328,664 | |
| | |
Roper Technologies, Inc. 3.80%, 12/15/2026 | | | 280,000 | | | | 276,313 | |
| | |
Schlumberger Holdings Corp. 3.75%, 5/1/2024 (b) | | | 315,000 | | | | 316,183 | |
| | |
Scientific Games International, Inc. | | | | | | | | |
| | |
10.00%, 12/1/2022 | | | 29,000 | | | | 30,487 | |
| | |
5.00%, 10/15/2025 (b) | | | 55,000 | | | | 53,281 | |
| | |
Scotts Miracle-Gro Co. (The) 6.00%, 10/15/2023 | | | 70,000 | | | | 72,100 | |
SEE NOTES TO FINANCIAL STATEMENTS.
| | | | | | | | |
| | | |
| FEBRUARY 28, 2019 | | J.P. MORGAN EXCHANGE-TRADED FUNDS | | | | | 63 | |
JPMorgan Global Bond Opportunities ETF
SCHEDULE OF PORTFOLIO INVESTMENTS
AS OF FEBRUARY 28, 2019 (continued)
(Amounts in U.S. Dollars, unless otherwise noted)
| | | | | | | | |
| INVESTMENTS | | PRINCIPAL
AMOUNT | | | VALUE ($) | |
Corporate Bonds — continued | | | | | | | | |
| | |
United States — continued | | | | | | | | |
| | |
Sealed Air Corp. 5.13%, 12/1/2024 (b) | | | 94,000 | | | | 96,685 | |
| | |
SemGroup Corp. 5.63%, 11/15/2023 | | | 58,000 | | | | 54,230 | |
| | |
Sempra Energy 3.80%, 2/1/2038 | | | 145,000 | | | | 128,023 | |
| | |
Sensata Technologies BV 4.88%, 10/15/2023 (b) | | | 85,000 | | | | 87,338 | |
| | |
Service Corp. International 7.50%, 4/1/2027 | | | 70,000 | | | | 77,350 | |
| | |
Shire Acquisitions Investments Ireland DAC 2.88%, 9/23/2023 | | | 225,000 | | | | 217,069 | |
| | |
Silgan Holdings, Inc. 3.25%, 3/15/2025 | | | EUR200,000 | | | | 234,315 | |
| | |
Sinclair Television Group, Inc. 5.63%, 8/1/2024 (b) | | | 176,000 | | | | 177,760 | |
| | |
Sirius XM Radio, Inc. | | | | | | | | |
| | |
4.63%, 5/15/2023 (b) | | | 10,000 | | | | 10,112 | |
| | |
6.00%, 7/15/2024 (b) | | | 170,000 | | | | 176,162 | |
| | |
5.38%, 4/15/2025 (b) | | | 90,000 | | | | 91,716 | |
| | |
5.00%, 8/1/2027 (b) | | | 12,000 | | | | 11,730 | |
| | |
Six Flags Entertainment Corp. 4.88%, 7/31/2024 (b) | | | 21,000 | | | | 20,685 | |
| | |
Solera LLC 10.50%, 3/1/2024 (b) | | | 45,000 | | | | 48,769 | |
| | |
Sotheby’s 4.88%, 12/15/2025 (b) | | | 20,000 | | | | 19,300 | |
| | |
Southwestern Energy Co. 6.20%, 1/23/2025 (f) | | | 87,000 | | | | 86,104 | |
| | |
Spectrum Brands, Inc. | | | | | | | | |
| | |
6.63%, 11/15/2022 | | | 56,000 | | | | 57,260 | |
| | |
5.75%, 7/15/2025 | | | 40,000 | | | | 39,150 | |
| | |
Springleaf Finance Corp. | | | | | | | | |
| | |
5.63%, 3/15/2023 | | | 60,000 | | | | 60,900 | |
| | |
7.13%, 3/15/2026 | | | 32,000 | | | | 32,400 | |
| | |
Sprint Capital Corp. 8.75%, 3/15/2032 | | | 175,000 | | | | 189,674 | |
| | |
Sprint Corp. | | | | | | | | |
| | |
7.88%, 9/15/2023 | | | 160,000 | | | | 171,000 | |
| | |
7.13%, 6/15/2024 | | | 80,000 | | | | 82,658 | |
| | |
7.63%, 2/15/2025 | | | 376,000 | | | | 393,860 | |
| | |
SPX FLOW, Inc. 5.63%, 8/15/2024 (b) | | | 50,000 | | | | 50,000 | |
| | |
Standard Industries, Inc. | | | | | | | | |
| | |
6.00%, 10/15/2025 (b) | | | 24,000 | | | | 25,050 | |
| | |
4.75%, 1/15/2028 (b) | | | 60,000 | | | | 56,100 | |
| | |
Staples, Inc. 8.50%, 9/15/2025 (b) | | | 135,000 | | | | 132,300 | |
| | |
Station Casinos LLC 5.00%, 10/1/2025 (b) | | | 10,000 | | | | 9,713 | |
| | |
Steel Dynamics, Inc. 5.00%, 12/15/2026 | | | 25,000 | | | | 25,438 | |
| | | | | | | | |
| INVESTMENTS | | PRINCIPAL
AMOUNT | | | VALUE ($) | |
| | | | | | | | |
| | |
United States — continued | | | | | | | | |
| | |
Stevens Holding Co., Inc. 6.13%, 10/1/2026 (b) | | | 16,000 | | | | 16,320 | |
| | |
Summit Materials LLC 6.13%, 7/15/2023 | | | 20,000 | | | | 20,500 | |
| | |
Summit Midstream Holdings LLC | | | | | | | | |
| | |
5.50%, 8/15/2022 | | | 20,000 | | | | 19,944 | |
| | |
5.75%, 4/15/2025 | | | 20,000 | | | | 19,100 | |
| | |
Sunoco Logistics Partners Operations LP 5.35%, 5/15/2045 | | | 130,000 | | | | 122,604 | |
| | |
Sunoco LP | | | | | | | | |
| | |
4.88%, 1/15/2023 | | | 20,000 | | | | 20,250 | |
| | |
5.50%, 2/15/2026 | | | 15,000 | | | | 14,900 | |
| | |
Synchrony Financial 4.25%, 8/15/2024 | | | 50,000 | | | | 49,012 | |
| | |
Syneos Health, Inc. 7.50%, 10/1/2024 (b) | | | 51,000 | | | | 53,295 | |
| | |
Talen Energy Supply LLC 6.50%, 6/1/2025 | | | 20,000 | | | | 17,820 | |
| | |
Tallgrass Energy Partners LP 5.50%, 9/15/2024 (b) | | | 28,000 | | | | 28,603 | |
| | |
Targa Resources Partners LP | | | | | | | | |
| | |
4.25%, 11/15/2023 | | | 62,000 | | | | 61,225 | |
| | |
6.75%, 3/15/2024 | | | 170,000 | | | | 178,075 | |
| | |
Team Health Holdings, Inc. 6.38%, 2/1/2025 (b) | | | 41,000 | | | | 32,544 | |
| | |
TEGNA, Inc. 6.38%, 10/15/2023 | | | 75,000 | | | | 77,250 | |
| | |
Tempur Sealy International, Inc. | | | | | | | | |
| | |
5.63%, 10/15/2023 | | | 110,000 | | | | 111,100 | |
| | |
5.50%, 6/15/2026 | | | 50,000 | | | | 49,875 | |
| | |
Tenet Healthcare Corp. | | | | | | | | |
| | |
4.50%, 4/1/2021 | | | 74,000 | | | | 74,925 | |
| | |
8.13%, 4/1/2022 | | | 145,000 | | | | 154,787 | |
| | |
6.75%, 6/15/2023 | | | 70,000 | | | | 71,750 | |
| | |
5.13%, 5/1/2025 | | | 75,000 | | | | 74,344 | |
| | |
6.25%, 2/1/2027 (b) | | | 35,000 | | | | 36,028 | |
| | |
Tenneco, Inc. 5.00%, 7/15/2026 | | | 65,000 | | | | 55,575 | |
| | |
Terex Corp. 5.63%, 2/1/2025 (b) | | | 65,000 | | | | 63,213 | |
| | |
Terraform Global Operating LLC 6.13%, 3/1/2026 (b) | | | 10,000 | | | | 9,625 | |
| | |
TerraForm Power Operating LLC | | | | | | | | |
| | |
4.25%, 1/31/2023 (b) | | | 17,000 | | | | 16,842 | |
| | |
6.63%, 6/15/2025 (b) (f) | | | 8,000 | | | | 8,400 | |
| | |
5.00%, 1/31/2028 (b) | | | 21,000 | | | | 19,950 | |
| | |
Thermo Fisher Scientific, Inc. 3.00%, 4/15/2023 | | | 475,000 | | | | 468,071 | |
SEE NOTES TO FINANCIAL STATEMENTS.
| | | | | | |
| | | |
| 64 | | | | J.P. MORGAN EXCHANGE-TRADED FUNDS | | FEBRUARY 28, 2019 |
| | | | | | | | |
| INVESTMENTS | | PRINCIPAL
AMOUNT | | | VALUE ($) | |
Corporate Bonds — continued | | | | | | | | |
| | |
United States — continued | | | | | | | | |
| | |
T-Mobile USA, Inc. | | | | | | | | |
| | |
6.50%, 1/15/2024 ‡ | | | 150,000 | | | | — | |
| | |
6.38%, 3/1/2025 | | | 79,000 | | | | 82,209 | |
| | |
6.50%, 1/15/2026 | | | 375,000 | | | | 400,312 | |
| | |
6.50%, 1/15/2026 ‡ | | | 160,000 | | | | — | |
| | |
4.50%, 2/1/2026 | | | 50,000 | | | | 49,313 | |
| | |
TransDigm, Inc. 6.25%, 3/15/2026 (b) | | | 70,000 | | | | 71,750 | |
| | |
Transocean Pontus Ltd. 6.13%, 8/1/2025 (b) | | | 19,845 | | | | 20,043 | |
| | |
Transocean Poseidon Ltd. 6.88%, 2/1/2027 (b) | | | 10,000 | | | | 10,275 | |
| | |
Transocean Proteus Ltd. 6.25%, 12/1/2024 (b) | | | 38,400 | | | | 39,168 | |
| | |
Transocean, Inc.
9.00%, 7/15/2023 (b) | | | 25,000 | | | | 26,375 | |
| | |
7.50%, 1/15/2026 (b) | | | 55,000 | | | | 53,075 | |
| | |
7.50%, 4/15/2031 | | | 9,000 | | | | 7,448 | |
| | |
6.80%, 3/15/2038 | | | 36,000 | | | | 27,180 | |
| | |
9.35%, 12/15/2041 (f) | | | 29,000 | | | | 26,680 | |
| | |
Trinseo Materials Operating SCA 5.38%, 9/1/2025 (b) | | | 17,000 | | | | 15,980 | |
| | |
Triumph Group, Inc. 7.75%, 8/15/2025 | | | 75,000 | | | | 71,250 | |
| | |
Tronox, Inc. 6.50%, 4/15/2026 (b) | | | 19,000 | | | | 17,979 | |
| | |
Tutor Perini Corp. 6.88%, 5/1/2025 (b) | | | 42,000 | | | | 41,685 | |
| | |
Ultra Resources, Inc. 9.00%, 7/12/2024 | | | 126,000 | | | | 81,270 | |
| | |
Union Pacific Corp. | | | | | | | | |
| | |
3.15%, 3/1/2024 | | | 130,000 | | | | 129,564 | |
| | |
4.30%, 3/1/2049 | | | 100,000 | | | | 97,425 | |
| | |
United Continental Holdings, Inc. | | | | | | | | |
| | |
4.25%, 10/1/2022 | | | 15,000 | | | | 14,963 | |
| | |
5.00%, 2/1/2024 | | | 25,000 | | | | 25,125 | |
| | |
United Rentals North America, Inc. | | | | | | | | |
| | |
5.75%, 11/15/2024 | | | 45,000 | | | | 46,350 | |
| | |
5.50%, 5/15/2027 | | | 289,000 | | | | 289,000 | |
| | |
United States Cellular Corp. 6.70%, 12/15/2033 | | | 90,000 | | | | 95,400 | |
| | |
United States Steel Corp. | | | | | | | | |
| | |
6.88%, 8/15/2025 | | | 9,000 | | | | 8,865 | |
| | |
6.25%, 3/15/2026 | | | 28,000 | | | | 26,495 | |
| | |
United Technologies Corp. | | | | | | | | |
| | |
3.95%, 8/16/2025 | | | 125,000 | | | | 127,414 | |
| | |
4.13%, 11/16/2028 | | | 150,000 | | | | 152,349 | |
| | |
3.75%, 11/1/2046 | | | 115,000 | | | | 101,155 | |
| | | | | | | | |
| INVESTMENTS | | PRINCIPAL
AMOUNT | | | VALUE ($) | |
| | | | | | | | |
| | |
United States — continued | | | | | | | | |
| | |
Uniti Group LP REIT, 6.00%, 4/15/2023 (b) | | | 85,000 | | | | 78,837 | |
| | |
Univision Communications, Inc. | | | | | | | | |
| | |
5.13%, 5/15/2023 (b) | | | 26,000 | | | | 23,595 | |
| | |
5.13%, 2/15/2025 (b) | | | 21,000 | | | | 18,270 | |
| | |
Vantiv LLC 3.88%, 11/15/2025 (a) | | | GBP100,000 | | | | 128,954 | |
| | |
Verizon Communications, Inc. 4.33%, 9/21/2028 | | | 230,000 | | | | 238,001 | |
| | |
Verscend Escrow Corp. 9.75%, 8/15/2026 (b) | | | 4,000 | | | | 4,090 | |
| | |
Vertiv Group Corp. 9.25%, 10/15/2024 (b) | | | 97,000 | | | | 97,126 | |
| | |
VICI Properties 1 LLC REIT, 8.00%, 10/15/2023 | | | 115,000 | | | | 125,638 | |
| | |
Vista Outdoor, Inc. 5.88%, 10/1/2023 | | | 85,000 | | | | 79,900 | |
| | |
Vistra Energy Corp. 5.88%, 6/1/2023 | | | 22,000 | | | | 22,605 | |
| | |
Vistra Operations Co. LLC 5.50%, 9/1/2026 (b) | | | 55,000 | | | | 57,063 | |
| | |
W&T Offshore, Inc. 9.75%, 11/1/2023 (b) | | | 34,000 | | | | 33,660 | |
| | |
Warner Media LLC 2.95%, 7/15/2026 | | | 42,000 | | | | 38,995 | |
| | |
Weatherford International Ltd. | | | | | | | | |
| | |
6.50%, 8/1/2036 | | | 11,000 | | | | 6,545 | |
| | |
7.00%, 3/15/2038 | | | 21,000 | | | | 12,548 | |
| | |
Welbilt, Inc. 9.50%, 2/15/2024 | | | 140,000 | | | | 150,675 | |
| | |
WellCare Health Plans, Inc. 5.25%, 4/1/2025 | | | 13,000 | | | | 13,272 | |
| | |
Wells Fargo & Co. 4.90%, 11/17/2045 | | | 150,000 | | | | 153,899 | |
| | |
WESCO Distribution, Inc. 5.38%, 6/15/2024 | | | 17,000 | | | | 17,043 | |
| | |
Western Digital Corp. 4.75%, 2/15/2026 | | | 50,000 | | | | 47,250 | |
| | |
Western Midstream Operating LP 4.75%, 8/15/2028 | | | 120,000 | | | | 118,419 | |
| | |
Whiting Petroleum Corp. | | | | | | | | |
| | |
5.75%, 3/15/2021 | | | 85,000 | | | | 85,956 | |
| | |
6.63%, 1/15/2026 | | | 21,000 | | | | 20,580 | |
| | |
William Carter Co. (The) 5.63%, 3/15/2027 (b)(j) | | | 8,000 | | | | 8,000 | |
| | |
Williams Cos., Inc. (The) 4.00%, 9/15/2025 | | | 275,000 | | | | 276,192 | |
| | |
Windstream Services LLC 9.00%, 6/30/2025 (b) | | | 161,000 | | | | 95,795 | |
| | |
WMG Acquisition Corp. | | | | | | | | |
| | |
4.13%, 11/1/2024 (a) | | | EUR135,000 | | | | 160,936 | |
| | |
4.88%, 11/1/2024 (b) | | | 113,000 | | | | 112,152 | |
SEE NOTES TO FINANCIAL STATEMENTS.
| | | | | | | | |
| | | |
| FEBRUARY 28, 2019 | | J.P. MORGAN EXCHANGE-TRADED FUNDS | | | | | 65 | |
JPMorgan Global Bond Opportunities ETF
SCHEDULE OF PORTFOLIO INVESTMENTS
AS OF FEBRUARY 28, 2019 (continued)
(Amounts in U.S. Dollars, unless otherwise noted)
| | | | | | | | |
| INVESTMENTS | | PRINCIPAL
AMOUNT | | | VALUE ($) | |
Corporate Bonds — continued | | | | | | | | |
| | |
United States — continued | | | | | | | | |
| | |
WPX Energy, Inc. 8.25%, 8/1/2023 | | | 70,000 | | | | 78,488 | |
| | |
Wyndham Destinations, Inc. | | | | | | | | |
| | |
4.25%, 3/1/2022 | | | 2,000 | | | | 1,990 | |
| | |
6.35%, 10/1/2025 (f) | | | 10,000 | | | | 10,375 | |
| | |
5.75%, 4/1/2027 (f) | | | 10,000 | | | | 9,925 | |
| | |
Wynn Las Vegas LLC 5.50%, 3/1/2025 (b) | | | 100,000 | | | | 99,530 | |
| | |
XPO Logistics, Inc. 6.50%, 6/15/2022 (b) | | | 90,000 | | | | 91,575 | |
| | |
Zayo Group LLC | | | | | | | | |
| | |
6.38%, 5/15/2025 | | | 104,000 | | | | 103,220 | |
| | |
5.75%, 1/15/2027 (b) | | | 21,000 | | | | 20,370 | |
| | | | | | | | |
| | |
| | | | | | | 45,499,993 | |
| | | | | | | | |
| | |
Total Corporate Bonds
(Cost $95,585,274) | | | | | | | 93,709,146 | |
| | | | | | | | |
Foreign Government Securities — 19.0% | |
| | |
Angola — 0.1% | | | | | | | | |
| | |
Republic of Angola 9.50%, 11/12/2025 (a) | | | 200,000 | | | | 226,750 | |
| | | | | | | | |
| | |
Bahrain — 0.3% | | | | | | | | |
| | |
Kingdom of Bahrain 7.50%, 9/20/2047 (a) | | | 500,000 | | | | 518,750 | |
| | | | | | | | |
| | |
Brazil — 0.8% | | | | | | | | |
| | |
Federative Republic of Brazil 6.00%, 8/15/2050 | | | BRL1,277,000 | | | | 1,348,711 | |
| | | | | | | | |
| | |
Colombia — 0.3% | | | | | | | | |
| | |
Republic of Colombia | | | | | | | | |
| | |
5.00%, 6/15/2045 | | | 200,000 | | | | 201,200 | |
| | |
5.20%, 5/15/2049 | | | 300,000 | | | | 308,400 | |
| | | | | | | | |
| | |
| | | | | | | 509,600 | |
| | | | | | | | |
| | |
Costa Rica — 0.2% | | | | | | | | |
| | |
Republic of Costa Rica 7.00%, 4/4/2044 (a) | | | 463,000 | | | | 439,271 | |
| | | | | | | | |
| | |
Cyprus — 0.4% | | | | | | | | |
| | |
Republic of Cyprus 2.38%, 9/25/2028 (a) | | | EUR570,000 | | | | 676,543 | |
| | | | | | | | |
| | |
Dominican Republic — 0.3% | | | | | | | | |
| |
Government of Dominican Republic | | | | | |
| | |
6.88%, 1/29/2026 (a) | | | 350,000 | | | | 379,034 | |
| | |
5.95%, 1/25/2027 (a) | | | 160,000 | | | | 166,134 | |
| | | | | | | | |
| | |
| | | | | | | 545,168 | |
| | | | | | | | |
| | | | | | | | |
| INVESTMENTS | | PRINCIPAL
AMOUNT | | | VALUE ($) | |
| | | | | | | | |
| | |
Ecuador — 0.4% | | | | | | | | |
| | |
Republic of Ecuador | | | | | | | | |
| | |
10.50%, 3/24/2020 (a) | | | 350,000 | | | | 364,443 | |
| | |
7.88%, 1/23/2028 (a) | | | 400,000 | | | | 378,054 | |
| | | | | | | | |
| | |
| | | | | | | 742,497 | |
| | | | | | | | |
| | |
Egypt — 0.2% | | | | | | | | |
| | |
Arab Republic of Egypt 7.60%, 3/1/2029 (b) | | | 280,000 | | | | 286,440 | |
| | | | | | | | |
| | |
El Salvador — 0.2% | | | | | | | | |
| | |
Republic of El Salvador | | | | | | | | |
| | |
7.75%, 1/24/2023 (a) | | | 152,000 | | | | 159,790 | |
| | |
7.63%, 2/1/2041 (a) | | | 200,000 | | | | 202,000 | |
| | | | | | | | |
| | |
| | | | | | | 361,790 | |
| | | | | | | | |
| | |
Ethiopia — 0.1% | | | | | | | | |
| | |
Federal Democratic Republic of Ethiopia 6.63%, 12/11/2024 (a) | | | 200,000 | | | | 201,000 | |
| | | | | | | | |
| | |
France — 0.7% | | | | | | | | |
| | |
France Government Bond 1.50%, 5/25/2050 (a) | | | EUR1,120,000 | | | | 1,235,868 | |
| | | | | | | | |
| | |
Gabon — 0.1% | | | | | | | | |
| | |
Gabonese Republic 6.38%, 12/12/2024 (a) | | | 200,000 | | | | 192,750 | |
| | | | | | | | |
| | |
Greece — 0.9% | | | | | | | | |
| | |
Greece Government Bond | | | | | | | | |
| | |
3.45%, 4/2/2024 (a) | | | EUR247,000 | | | | 288,921 | |
| | |
3.38%, 2/15/2025 (a) | | | EUR1,166,000 | | | | 1,336,921 | |
| | | | | | | | |
| | |
| | | | | | | 1,625,842 | |
| | | | | | | | |
| | |
Indonesia — 2.0% | | | | | | | | |
| | |
Republic of Indonesia | | | | | | | | |
| | |
8.25%, 7/15/2021 | | | IDR 20,461,000,000 | | | | 1,490,777 | |
| | |
8.75%, 5/15/2031 | | | IDR16,335,000,000 | | | | 1,216,924 | |
| | |
8.25%, 5/15/2036 | | | IDR7,468,000,000 | | | | 532,196 | |
| | |
6.63%, 2/17/2037 (a) | | | 340,000 | | | | 407,869 | |
| | | | | | | | |
| | |
| | | | | | | 3,647,766 | |
| | | | | | | | |
| | |
Ivory Coast — 0.2% | | | | | | | | |
| | |
Republic of Cote d’Ivoire 5.13%, 6/15/2025 (a) | | | EUR240,000 | | | | 275,377 | |
| | | | | | | | |
| | |
Jamaica — 0.1% | | | | | | | | |
| | |
Jamaica Government International Bond 8.00%, 3/15/2039 | | | 220,000 | | | | 261,715 | |
| | | | | | | | |
| | |
Kenya — 0.1% | | | | | | | | |
| | |
Republic of Kenya 8.25%, 2/28/2048 (a) | | | 250,000 | | | | 252,187 | |
| | | | | | | | |
SEE NOTES TO FINANCIAL STATEMENTS.
| | | | | | |
| | | |
| 66 | | | | J.P. MORGAN EXCHANGE-TRADED FUNDS | | FEBRUARY 28, 2019 |
| | | | | | | | |
| INVESTMENTS | | PRINCIPAL
AMOUNT | | | VALUE ($) | |
Foreign Government Securities — continued | |
| | |
Lebanon — 0.3% | | | | | | | | |
| | |
Republic of Lebanon | | | | | | | | |
| | |
6.00%, 5/20/2019 (a) | | | 177,000 | | | | 175,451 | |
| | |
6.85%, 3/23/2027 (a) | | | 321,000 | | | | 272,449 | |
| | |
6.65%, 11/3/2028 (a) | | | 199,000 | | | | 164,424 | |
| | | | | | | | |
| | |
| | | | | | | 612,324 | |
| | | | | | | | |
| | |
Malaysia — 1.0% | | | | | | | | |
| | |
Federation of Malaysia | | | | | | | | |
| | |
3.66%, 10/15/2020 | | | MYR3,600,000 | | | | 886,913 | |
| | |
3.62%, 11/30/2021 | | | MYR3,600,000 | | | | 885,893 | |
| | | | | | | | |
| | |
| | | | | | | 1,772,806 | |
| | | | | | | | |
| | |
Mexico — 1.0% | | | | | | | | |
| | |
United Mexican States 7.25%, 12/9/2021 | | | MXN35,000,000 | | | | 1,779,207 | |
| | | | | | | | |
| | |
Nigeria — 0.1% | | | | | | | | |
| | |
Federal Republic of Nigeria 7.63%, 11/28/2047 (b) | | | 270,000 | | | | 262,575 | |
| | | | | | | | |
| | |
Oman — 0.2% | | | | | | | | |
| | |
Oman Government International Bond 6.75%, 1/17/2048 (a) | | | 400,000 | | | | 361,500 | |
| | | | | | | | |
| | |
Paraguay — 0.2% | | | | | | | | |
| | |
Republic of Paraguay 5.00%, 4/15/2026 (a) | | | 420,000 | | | | 435,120 | |
| | | | | | | | |
| | |
Peru — 0.3% | | | | | | | | |
| | |
Republic of Peru 5.94%, 2/12/2029 (a) | | | PEN1,630,000 | | | | 510,778 | |
| | | | | | | | |
| | |
Portugal — 3.3% | | | | | | | | |
| |
Portugal Obrigacoes do Tesouro | | | | | |
| | |
3.85%, 4/15/2021 (a) | | | EUR1,440,000 | | | | 1,780,506 | |
| | |
5.13%, 10/15/2024 (a) | | | 990,000 | | | | 1,055,455 | |
| | |
2.88%, 10/15/2025 (a) | | | EUR860,000 | | | | 1,114,323 | |
| | |
2.88%, 7/21/2026 (a) | | | EUR1,215,000 | | | | 1,571,532 | |
| | |
2.25%, 4/18/2034 (a) | | | EUR350,000 | | | | 413,286 | |
| | | | | | | | |
| | |
| | | | | | | 5,935,102 | |
| | | | | | | | |
| | |
Qatar — 0.5% | | | | | | | | |
| |
State of Qatar | | | | | |
| | |
3.88%, 4/23/2023 (b) | | | 420,000 | | | | 429,450 | |
| | |
4.63%, 6/2/2046 (a) | | | 200,000 | | | | 205,500 | |
| | |
5.10%, 4/23/2048 (a) | | | 245,000 | | | | 263,681 | |
| | | | | | | | |
| | |
| | | | | | | 898,631 | |
| | | | | | | | |
| | |
Saudi Arabia — 0.1% | | | | | | | | |
| | |
Kingdom of Saudi Arabia 5.00%, 4/17/2049 (a) | | | 260,000 | | | | 264,225 | |
| | | | | | | | |
| | | | | | | | |
| INVESTMENTS | | PRINCIPAL
AMOUNT | | | VALUE ($) | |
| |
| | |
Serbia — 0.2% | | | | | | | | |
| | |
Republic of Serbia 4.88%, 2/25/2020 (a) | | | 300,000 | | | | 302,940 | |
| | | | | | | | |
| | |
South Africa — 2.0% | | | | | | | | |
| | |
Republic of South Africa 6.50%, 2/28/2041 | | | ZAR71,840,000 | | | | 3,587,737 | |
| | | | | | | | |
| | |
Spain — 2.1% | | | | | | | | |
| |
Kingdom of Spain | | | | | |
| | |
1.85%, 7/30/2035 (a) | | | EUR780,000 | | | | 880,645 | |
| | |
2.90%, 10/31/2046 (a) | | | EUR1,545,000 | | | | 1,951,771 | |
| | |
2.70%, 10/31/2048 (a) | | | EUR844,000 | | | | 1,016,653 | |
| | | | | | | | |
| | |
| | | | | | | 3,849,069 | |
| | | | | | | | |
|
United Arab Emirates — 0.3% | |
| |
Abu Dhabi Government Bond | | | | | |
| | |
4.13%, 10/11/2047 (a) | | | 450,000 | | | | 444,937 | |
| | | | | | | | |
| |
Total Foreign Government Securities
(Cost $35,100,529) | | | | 34,364,976 | |
| | | | | | | | |
Asset-Backed Securities — 8.4% | | | | | | | | |
| | |
Cayman Islands — 0.7% | | | | | | | | |
| | |
Apidos CLO Series XXXA, Class A2, 4.02%, 10/18/2031 (b) (i) | | | 250,000 | | | | 247,281 | |
| | |
Benefit Street Partners CLO XI Series 2017-11A, Class A2A, 4.54%, 4/15/2029 (b) (i) | | | 250,000 | | | | 249,053 | |
| | |
BlueMountain CLO Ltd.Series 2014-2A, Class BR2, 4.51%, 10/20/2030 ‡ (b) (i) | | | 350,000 | | | | 348,478 | |
| | |
Renew Series 2017-1A, Class B, 5.75%, 9/20/2052 ‡ (b) | | | 76,019 | | | | 77,303 | |
| | |
Shackleton CLO Ltd. Series 2014-6RA, Class B, 4.50%, 7/17/2028 (b) (i) | | | 260,000 | | | | 258,876 | |
| | | | | | | | |
| | |
| | | | | | | 1,180,991 | |
| | | | | | | | |
| | |
United States — 7.7% | | | | | | | | |
| | |
ACC Trust Series 2019-1, Class A, 3.75%, 5/20/2022 (b) | | | 130,000 | | | | 130,009 | |
| | |
Accelerated Assets LLC Series 2018-1, Class C, 6.65%, 12/2/2033 ‡ (b) | | | 263,336 | | | | 267,825 | |
| | |
American Credit Acceptance Receivables Trust | | | | | | | | |
| | |
Series 2016-4, Class D, 4.11%, 4/12/2023 (b) | | | 47,000 | | | | 47,156 | |
| | |
Series 2018-3, Class C, 3.75%, 10/15/2024 (b) | | | 60,000 | | | | 60,106 | |
| | |
Business Jet Securities LLC Series 2018-2, Class C, 6.66%, 6/15/2033 (b) | | | 204,508 | | | | 204,844 | |
SEE NOTES TO FINANCIAL STATEMENTS.
| | | | | | | | |
| | | |
| FEBRUARY 28, 2019 | | J.P. MORGAN EXCHANGE-TRADED FUNDS | | | | | 67 | |
JPMorgan Global Bond Opportunities ETF
SCHEDULE OF PORTFOLIO INVESTMENTS
AS OF FEBRUARY 28, 2019 (continued)
(Amounts in U.S. Dollars, unless otherwise noted)
| | | | | | | | |
| INVESTMENTS | | PRINCIPAL
AMOUNT | | | VALUE ($) | |
Asset-Backed Securities — continued | | | | | | | | |
| | |
United States — continued | | | | | | | | |
| | |
Chase Funding Trust Series 2003-6, Class 1A7, 5.04%, 11/25/2034 ‡ (f) | | | 152,622 | | | | 156,649 | |
| | |
Citi Held For Asset Issuance Series 2015-PM2, Class C, 5.96%, 3/15/2022 ‡ (b) | | | 54,360 | | | | 54,437 | |
| | |
CLUB Credit Trust Series 2017-NP1, Class C, 5.13%, 4/17/2023 (b) | | | 59,581 | | | | 59,853 | |
| | |
Consumer Loan Underlying Bond Credit Trust Series 2017-P1, Class A, 2.42%, 9/15/2023 (b) | | | 8,026 | | | | 8,021 | |
| | |
CPS Auto Receivables Trust | | | | | | | | |
| | |
Series 2018-A, Class B, 2.77%, 4/18/2022 (b) | | | 640,000 | | | | 637,232 | |
| | |
Series 2018-A, Class D, 3.66%, 12/15/2023 (b) | | | 400,000 | | | | 398,747 | |
| | |
Credit Acceptance Auto Loan Trust | | | | | | | | |
| | |
Series 2018-1A, Class C, 3.77%, 6/15/2027 (b) | | | 250,000 | | | | 250,176 | |
| | |
Series 2018-3A, Class B, 3.89%, 10/15/2027 (b) | | | 250,000 | | | | 252,367 | |
| | |
Credit-Based Asset Servicing & Securitization LLC Series 2004-CB5, Class M1, 3.40%, 1/25/2034 ‡ (i) | | | 123,764 | | | | 123,829 | |
| | |
CWABS, Inc. Asset-Backed Certificates Series 2003-5, Class AF5, 5.15%, 2/25/2034 ‡ (f) | | | 126,037 | | | | 126,001 | |
| | |
Drive Auto Receivables Trust | | | | | | | | |
| | |
Series 2018-3, Class D, 4.30%, 9/16/2024 | | | 256,000 | | | | 260,338 | |
| | |
Series 2018-4, Class C, 3.66%, 11/15/2024 | | | 260,000 | | | | 261,521 | |
| | |
DT Auto Owner Trust | | | | | | | | |
| | |
Series 2017-3A, Class D, 3.58%, 5/15/2023 (b) | | | 100,000 | | | | 100,050 | |
| | |
Series 2018-3A, Class C, 3.79%, 7/15/2024 (b) | | | 260,000 | | | | 261,662 | |
| | |
Series 2019-1A, Class D, 3.87%, 11/15/2024 (b) | | | 65,000 | | | | 65,112 | |
| | |
Series 2019-1A, Class E, 4.94%, 2/17/2026 (b) | | | 100,000 | | | | 100,371 | |
| | |
Exeter Automobile Receivables Trust | | | | | | | | |
| | |
Series 2015-2A, Class D, 5.79%, 5/16/2022 (b) | | | 100,000 | | | | 101,598 | |
| | |
Series 2015-3A, Class D, 6.55%, 10/17/2022 (b) | | | 220,000 | | | | 225,450 | |
| | |
Series 2018-3A, Class C, 3.71%, 6/15/2023 (b) | | | 99,000 | | | | 99,654 | |
| | | | | | | | |
| INVESTMENTS | | PRINCIPAL
AMOUNT | | | VALUE ($) | |
| | | | | | | | |
| | |
United States — continued | | | | | | | | |
| | |
Series 2017-3A, Class C, 3.68%, 7/17/2023 (b) | | | 180,000 | | | | 180,837 | |
| | |
Series 2016-3A, Class D, 6.40%, 7/17/2023 (b) | | | 350,000 | | | | 360,927 | |
| | |
Series 2018-2A, Class D, 4.04%, 3/15/2024 (b) | | | 60,000 | | | | 60,566 | |
| | |
Series 2018-3A, Class D, 4.35%, 6/17/2024 (b) | | | 210,000 | | | | 213,699 | |
| | |
Series 2019-1A, Class C, 3.82%, 12/16/2024 (b) | | | 130,000 | | | | 130,710 | |
| | |
Series 2019-1A, Class D, 4.13%, 12/16/2024 (b) | | | 240,000 | | | | 243,430 | |
| | |
Flagship Credit Auto Trust | | | | | | | | |
| | |
Series 2018-3, Class A, 3.07%, 2/15/2023 (b) | | | 275,030 | | | | 275,243 | |
| | |
Series 2017-4, Class D, 3.58%, 1/15/2024 (b) | | | 280,000 | | | | 279,098 | |
| | |
Series 2017-2, Class E, 5.55%, 7/15/2024 (b) | | | 380,000 | | | | 386,791 | |
| | |
Series 2018-3, Class C, 3.79%, 12/16/2024 (b) | | | 170,000 | | | | 171,391 | |
| | |
Series 2018-3, Class D, 4.15%, 12/16/2024 (b) | | | 40,000 | | | | 40,306 | |
| | |
FREED ABS Trust | | | | | | | | |
| | |
Series 2018-1, Class A, 3.61%, 7/18/2024 (b) | | | 92,998 | | | | 93,043 | |
| | |
Series 2018-1, Class B, 4.56%, 7/18/2024 ‡ (b) | | | 100,000 | | | | 100,702 | |
| | |
GLS Auto Receivables Issuer Trust Series 2019-1A, Class C, 3.87%, 12/16/2024 (b) | | | 155,000 | | | | 155,401 | |
| | |
Lendmark Funding TrustSeries 2017-1A, Class C, 5.41%, 12/22/2025 ‡ (b) | | | 350,000 | | | | 357,229 | |
| | |
Marlette Funding Trust | | | | | | | | |
| | |
Series 2018-1A, Class B, 3.19%, 3/15/2028 ‡ (b) | | | 100,000 | | | | 99,491 | |
| | |
Series 2018-1A, Class C, 3.69%, 3/15/2028 (b) | | | 100,000 | | | | 99,594 | |
| | |
Series 2018-2A, Class B, 3.61%, 7/17/2028 (b) | | | 335,000 | | | | 334,664 | |
| | |
Series 2018-2A, Class C, 4.37%, 7/17/2028 (b) | | | 280,000 | | | | 281,838 | |
| | |
Series 2018-3A, Class A, 3.20%, 9/15/2028 (b) | | | 66,093 | | | | 66,111 | |
| | |
MFA LLC Series 2018-NPL2, Class A1, 4.16%, 7/25/2048 ‡ (b) (f) | | | 170,284 | | | | 170,434 | |
SEE NOTES TO FINANCIAL STATEMENTS.
| | | | | | |
| | | |
| 68 | | | | J.P. MORGAN EXCHANGE-TRADED FUNDS | | FEBRUARY 28, 2019 |
| | | | | | | | |
| INVESTMENTS | | PRINCIPAL
AMOUNT | | | VALUE ($) | |
Asset-Backed Securities — continued | | | | | | | | |
| | |
United States — continued | | | | | | | | |
| | |
MFA Trust Series 2017-NPL1, Class A1, 3.35%, 11/25/2047 ‡ (b) (f) | | | 245,678 | | | | 243,468 | |
| | |
Morgan Stanley ABS Capital I, Inc. Trust Series 2004-NC8, Class B1, 5.11%, 9/25/2034 ‡ (i) | | | 311,899 | | | | 311,235 | |
| | |
OneMain Direct Auto Receivables Trust | | | | | | | | |
| | |
Series 2018-1A, Class B, 3.71%, 4/14/2025 (b) | | | 100,000 | | | | 100,471 | |
| | |
Series 2018-1A, Class D, 4.40%, 1/14/2028 (b) | | | 160,000 | | | | 162,246 | |
| | |
OneMain Financial Issuance Trust Series 2018-1A, Class D, 4.08%, 3/14/2029 ‡ (b) | | | 100,000 | | | | 99,568 | |
| | |
Oportun Funding VI LLCSeries 2017-A, Class B, 3.97%, 6/8/2023 ‡ (b) (i) | | | 293,000 | | | | 291,159 | |
| | |
Prestige Auto Receivables Trust | | | | | | | | |
| | |
Series 2018-1A, Class C, 3.75%, 10/15/2024 (b) | | | 440,000 | | | | 445,414 | |
| | |
Series 2018-1A, Class D, 4.14%, 10/15/2024 (b) | | | 75,000 | | | | 76,104 | |
| | |
Pretium Mortgage Credit Partners I LLC | | | | | | | | |
| | |
Series 2018-NPL1, Class A1, 3.38%, 1/27/2033 ‡ (b) (f) | | | 193,476 | | | | 192,089 | |
| | |
Series 2018-NPL4, Class A1, 4.83%, 9/25/2058 ‡ (b) (f) | | | 238,237 | | | | 239,826 | |
| | |
Progress Residential Trust Series 2018-SFR3, Class E, 4.87%, 10/17/2035 ‡ (b) | | | 262,000 | | | | 267,707 | |
| | |
Santander Drive Auto Receivables Trust Series 2018-4, Class D, 3.98%, 12/15/2025 | | | 350,000 | | | | 352,698 | |
| | |
SoFi Consumer Loan Program Trust Series 2018-1, Class B, 3.65%, 2/25/2027 (b) | | | 100,000 | | | | 99,816 | |
| | |
Stanwich Mortgage Loan Trust Series 2018-NPB1, Class A1, 4.02%, 5/16/2023 ‡ (b) (f) | | | 209,712 | | | | 209,554 | |
| |
Structured Asset Investment Loan Trust | | | | | |
| | |
Series 2004-8, Class M3, 3.46%, 9/25/2034 ‡ (i) | | | 84,676 | | | | 82,123 | |
| | |
Series 2005-HE3, Class M1, 3.21%, 9/25/2035 ‡ (i) | | | 112,186 | | | | 112,544 | |
| | |
T-Mobile USA, Inc. 6.00%, 4/15/2024 ‡ | | | 328,000 | | | | — | |
| | | | | | | | |
| INVESTMENTS | | PRINCIPAL
AMOUNT | | | VALUE ($) | |
| | | | | | | | |
| | |
United States — continued | | | | | | | | |
| | |
Tricolor Auto Securitization Trust | | | | | | | | |
| | |
Series 2018-2A, Class A, 3.96%, 10/15/2021 (b) | | | 193,367 | | | | 193,529 | |
| | |
Series 2018-2A, Class C, 5.75%, 5/16/2022 (b) | | | 385,581 | | | | 387,300 | |
| | |
Veros Automobile Receivables Trust Series 2017-1, Class A, 2.84%, 4/17/2023 (b) | | | 34,185 | | | | 34,127 | |
| | |
VOLT LXII LLC Series 2017-NPL9, Class A1, 3.13%, 9/25/2047 ‡ (b) (f) | | | 64,389 | | | | 64,070 | |
| | |
VOLT LXIV LLC Series 2017-NP11, Class A1, 3.38%, 10/25/2047 ‡ (b) (f) | | | 60,549 | | | | 60,381 | |
| | |
VOLT LXIX LLC Series 2018-NPL5, Class A2, 5.80%, 8/25/2048 ‡ (b) (f) | | | 389,000 | | | | 390,126 | |
| | |
VOLT LXVIII LLC Series 2018-NPL4, Class A2, 5.93%, 7/27/2048 ‡ (b) (f) | | | 300,000 | | | | 301,040 | |
| | |
VOLT LXX LLC Series 2018-NPL6, Class A1B, 4.56%, 9/25/2048 ‡ (b) (f) | | | 330,000 | | | | 332,386 | |
| | |
Westlake Automobile Receivables Trust | | | | | | | | |
| | |
Series 2018-3A, Class C, 3.61%, 10/16/2023 (b) | | | 130,000 | | | | 130,570 | |
| | |
Series 2018-3A, Class D, 4.00%, 10/16/2023 (b) | | | 80,000 | | | | 80,828 | |
| | |
Series 2018-2A, Class E, 4.86%, 1/16/2024 (b) | | | 310,000 | | | | 312,613 | |
| | | | | | | | |
| | |
| | | | | | | 13,927,505 | |
| | | | | | | | |
| | |
Total Asset-Backed Securities (Cost $15,056,902) | | | | | | | 15,108,496 | |
| | | | | | | | |
Commercial Mortgage-Backed Securities — 5.7% | |
| | |
United States — 5.7% | | | | | | | | |
| | |
BAMLL Re-REMIC TrustSeries 2014-FRR4, Class BK29, PO, 4/27/2023 (b) | | | 400,000 | | | | 291,077 | |
| | |
Banc of America Commercial Mortgage Trust | | | | | | | | |
| | |
Series 2006-1, Class E, 6.01%, 9/10/2045 ‡ (b) (i) | | | 25,332 | | | | 26,181 | |
| | |
Series 2007-5, Class AJ, 6.17%, 2/10/2051 (i) | | | 529,194 | | | | 533,250 | |
| | |
BANK Series 2017-BNK9, Class D, 2.80%, 11/15/2054 (b) | | | 105,000 | | | | 83,048 | |
| | |
BHMS ATLS Series 2018-ATLS, Class A, 3.74%, 7/15/2035 (b) (i) | | | 492,000 | | | | 491,224 | |
SEE NOTES TO FINANCIAL STATEMENTS.
| | | | | | | | |
| | | |
| FEBRUARY 28, 2019 | | J.P. MORGAN EXCHANGE-TRADED FUNDS | | | | | 69 | |
JPMorgan Global Bond Opportunities ETF
SCHEDULE OF PORTFOLIO INVESTMENTS
AS OF FEBRUARY 28, 2019 (continued)
(Amounts in U.S. Dollars, unless otherwise noted)
| | | | | | | | |
| INVESTMENTS | | PRINCIPAL
AMOUNT | | | VALUE ($) | |
Commercial Mortgage-Backed Securities — continued | |
| | |
United States — continued | | | | | | | | |
| | |
BX Commercial Mortgage Trust | | | | | | | | |
| | |
Series 2018-IND, Class E, 4.19%, 11/15/2035 ‡ (b) (i) | | | 362,689 | | | | 363,256 | |
| | |
Series 2018-BIOA, Class D, 3.81%, 3/15/2037 ‡ (b) (i) | | | 485,000 | | | | 482,565 | |
| | |
BX Trust | | | | | | | | |
| | |
Series 2018-MCSF, Class B, 3.29%, 4/15/2035 ‡ (b) (i) | | | 100,000 | | | | 97,937 | |
| | |
Series 2018-MCSF, Class C, 3.49%, 4/15/2035 ‡ (b) (i) | | | 100,000 | | | | 96,811 | |
| | |
BXMT Ltd. Series 2017-FL1, Class D, 5.19%, 6/15/2035 ‡ (b) (i) | | | 210,000 | | | | 209,737 | |
| | |
Citigroup Commercial Mortgage Trust | | | | | | | | |
| | |
Series 2015-P1, Class D, 3.23%, 9/15/2048 ‡ (b) | | | 205,000 | | | | 179,947 | |
| | |
Series 2016-P5, Class C, 4.32%, 10/10/2049 ‡ (i) | | | 350,000 | | | | 344,846 | |
| | |
Cold Storage Trust Series 2017-ICE3, Class B, 3.74%, 4/15/2036 ‡ (b) (i) | | | 300,000 | | | | 299,786 | |
| | |
Commercial Mortgage Trust | | | | | | | | |
| | |
Series 2004-GG1, Class H, 6.44%, 6/10/2036 ‡ (b) (i) | | | 120,000 | | | | 120,428 | |
| | |
Series 2015-CR23, Class CME, 3.68%, 5/10/2048 (b) (i) | | | 540,000 | | | | 535,613 | |
| | |
CSAIL Commercial Mortgage Trust Series 2017-C8, Class C, 4.32%, 6/15/2050 ‡ | | | 100,000 | | | | 98,066 | |
| | |
FHLMC Multifamily StructuredPass-Through Certificates | | | | | | | | |
| | |
Series K033, Class X1, IO, 0.30%, 7/25/2023 (i) | | | 4,014,924 | | | | 49,435 | |
| | |
Series K153, Class X3, IO, 3.77%, 4/25/2035 (i) | | | 340,000 | | | | 114,533 | |
| | |
Series K036, Class X3, IO, 2.11%, 12/25/2041 (i) | | | 2,640,000 | | | | 234,852 | |
| | |
Series K720, Class X3, IO, 1.33%, 8/25/2042 (i) | | | 6,800,000 | | | | 273,620 | |
| | |
Series K041, Class X3, IO, 1.64%, 11/25/2042 (i) | | | 3,470,000 | | | | 282,792 | |
| | |
Series K042, Class X3, IO, 1.60%, 1/25/2043 (i) | | | 3,025,000 | | | | 241,179 | |
| | |
Series K718, Class X3, IO, 1.43%, 2/25/2043 (i) | | | 10,025,000 | | | | 407,891 | |
| | |
Series K045, Class X3, IO, 1.50%, 4/25/2043 (i) | | | 1,915,000 | | | | 146,852 | |
| | |
Series K054, Class X3, IO, 1.60%, 4/25/2043 (i) | | | 1,365,000 | | | | 127,181 | |
| | | | | | | | |
| INVESTMENTS | | PRINCIPAL
AMOUNT | | | VALUE ($) | |
| |
| | |
United States — continued | | | | | | | | |
| | |
Series K050, Class X3, IO, 1.55%, 10/25/2043 (i) | | | 1,010,000 | | | | 86,185 | |
| | |
Series K051, Class X3, IO, 1.61%, 10/25/2043 (i) | | | 1,395,000 | | | | 127,845 | |
| | |
Series K052, Class X3, IO, 1.61%, 1/25/2044 (i) | | | 750,000 | | | | 70,140 | |
| | |
Series K726, Class X3, IO, 2.13%, 7/25/2044 (i) | | | 2,890,000 | | | | 275,173 | |
| | |
Series K067, Class X3, IO, 2.11%, 9/25/2044 (i) | | | 950,000 | | | | 137,434 | |
| | |
Series K072, Class X3, IO, 2.14%, 12/25/2045 (i) | | | 400,000 | | | | 60,269 | |
| | |
Series K078, Class X3, IO, 2.21%, 6/25/2051 (i) | | | 1,820,000 | | | | 301,442 | |
| | |
FREMF Series 2018-KF46, Class B, 4.46%, 3/25/2028 (b) (i) | | | 799,961 | | | | 794,285 | |
| | |
FREMF Mortgage Trust | | | | | | | | |
| | |
Series 2017-KF31, Class B, 5.41%, 4/25/2024 (b) (i) | | | 67,228 | | | | 68,234 | |
| | |
Series 2017-KF36, Class B, 5.16%, 8/25/2024 (b) (i) | | | 96,985 | | | | 97,735 | |
| | |
Series 2017-KF38, Class B, 5.01%, 9/25/2024 (b) (i) | | | 81,180 | | | | 81,752 | |
| | |
Series 2018-KF47, Class B, 4.51%, 5/25/2025 (b) (i) | | | 49,977 | | | | 49,852 | |
| | |
Series 2018-KF49, Class B, 4.41%, 6/25/2025 (b) (i) | | | 593,083 | | | | 587,028 | |
| | |
Series 2017-K728, Class B, 3.65%, 11/25/2050 (b) (i) | | | 190,000 | | | | 186,843 | |
| | |
Series 2017-K728, Class C, 3.65%, 11/25/2050 (b) (i) | | | 105,000 | | | | 100,485 | |
| | |
GNMA Series 2017-23, IO, 0.73%, 5/16/2059 (i) | | | 695,635 | | | | 42,461 | |
| | |
GRACE Mortgage Trust Series2014-GRCE, Class B, 3.52%, 6/10/2028 ‡ (b) | | | 100,000 | | | | 100,333 | |
| | |
GS Mortgage Securities Trust Series 2012-GCJ9, Class D, 4.75%, 11/10/2045 ‡ (b) (i) | | | 320,000 | | | | 318,340 | |
| | |
JP Morgan Chase Commercial Mortgage Securities Trust Series 2004-CBX, Class C, 5.07%, 1/12/2037 (i) | | | 51,672 | | | | 51,737 | |
| | |
LB Commercial Mortgage Trust Series 2007-C3, Class AJ, 6.09%, 7/15/2044 (i) | | | 66,335 | | | | 67,053 | |
| | |
LB-UBS Commercial Mortgage Trust Series 2006-C6, Class AJ, 5.45%, 9/15/2039 (i) | | | 248,309 | | | | 171,403 | |
SEE NOTES TO FINANCIAL STATEMENTS.
| | | | | | |
| | | |
| 70 | | | | J.P. MORGAN EXCHANGE-TRADED FUNDS | | FEBRUARY 28, 2019 |
| | | | | | | | |
| INVESTMENTS | | PRINCIPAL
AMOUNT | | | VALUE ($) | |
Commercial Mortgage-Backed Securities — continued | |
| | |
United States — continued | | | | | | | | |
| | |
Morgan Stanley Capital I Trust Series 2005-HQ7, Class E, 5.39%, 11/14/2042 ‡ (i) | | | 71,044 | | | | 71,044 | |
| | |
Velocity Commercial Capital Loan Trust Series 2018-2, Class A, 4.05%, 10/26/2048 (b) (i) | | | 296,438 | | | | 299,725 | |
| | | | | | | | |
| |
Total Commercial Mortgage-Backed Securities
(Cost $10,268,658) | | | | 10,278,905 | |
| | | | | | | | |
Mortgage-Backed Securities — 3.9% | | | | | |
| | |
United States — 3.9% | | | | | | | | |
| | |
FHLMC Gold Pools, 15 Year, Single Family Pool # G18702, 3.50%, 8/1/2033 | | | 2,390,570 | | | | 2,430,662 | |
| | |
FHLMC Gold Pools, 30 Year, Single Family Pool # G67705, 4.00%, 10/1/2047 | | | 1,972,774 | | | | 2,032,526 | |
| | |
FNMA, 15 Year, Single Family | | | | | | | | |
| | |
Pool # 890789, 3.00%, 9/1/2032 | | | 2,101,723 | | | | 2,098,539 | |
| | |
Pool # BM3956, 3.00%, 12/1/2032 | | | 441,242 | | | | 440,903 | |
| | | | | | | | |
| | |
Total Mortgage-Backed Securities
(Cost $6,952,627) | | | | | | | 7,002,630 | |
| | | | | | | | |
Collateralized Mortgage Obligations — 3.2% | | | | | |
| | |
Netherlands — 0.2% | | | | | | | | |
| | |
Permanent Master Issuer plc Series 2018-1A, Class 1A1, 3.17%, 7/15/2058 (b) (i) | | | 255,000 | | | | 254,181 | |
| | | | | | | | |
| | |
United Kingdom — 0.1% | | | | | | | | |
| | |
Lanark Master Issuer plcSeries 2019-1A, Class 1A1, 3.46%, 12/22/2069 (b) (i) | | | 200,000 | | | | 200,116 | |
| | | | | | | | |
| | |
United States — 2.9% | | | | | | | | |
| | |
Alternative Loan Trust | | | | | | | | |
| | |
Series 2004-25CB, Class A1, 6.00%, 12/25/2034 | | | 177,069 | | | | 176,148 | |
| | |
Series 2005-6CB, Class 1A6, 5.50%, 4/25/2035 | | | 110,752 | | | | 110,638 | |
| | |
Series 2005-80CB, Class 5A1, 6.00%, 2/25/2036 | | | 163,615 | | | | 163,327 | |
| | |
Series 2007-2CB, Class 1A6, 5.75%, 3/25/2037 | | | 197,017 | | | | 165,822 | |
| | |
Chase Mortgage Finance Trust Series 2007-A1, Class 1A5, 4.62%, 2/25/2037 (i) | | | 49,683 | | | | 50,109 | |
| | |
CHL Mortgage Pass-Through Trust Series 2007-16, Class A1, 6.50%, 10/25/2037 | | | 73,784 | | | | 59,166 | |
| | | | | | | | |
| INVESTMENTS | | PRINCIPAL
AMOUNT | | | VALUE ($) | |
| | | | | |
| | |
United States — continued | | | | | | | | |
| | |
FHLMC REMIC | | | | | | | | |
| | |
Series 2916, Class S, IF, IO, 4.76%, 1/15/2035 (i) | | | 2,684,082 | | | | 458,046 | |
| | |
Series 4689, Class SD, IF, IO, 3.66%, 6/15/2047 (i) | | | 773,965 | | | | 143,454 | |
| | |
Series 4714, Class SA, IF, IO, 3.66%, 8/15/2047 (i) | | | 593,849 | | | | 108,897 | |
| | |
FHLMC Structured Agency Credit Risk Debt Notes Series 2018-HQA1, Class M2, 4.79%, 9/25/2030 (i) | | | 60,000 | | | | 59,972 | |
| | |
FNMA REMIC | | | | | | | | |
| | |
Series 2010-57, Class ID, IO, 4.00%, 6/25/2025 | | | 545,069 | | | | 33,843 | |
| | |
Series 2012-146, Class AI, IO, 3.00%, 1/25/2028 | | | 2,410,528 | | | | 199,221 | |
| | |
Series 2016-68, Class BI, IO, 3.00%, 10/25/2031 | | | 1,300,439 | | | | 134,147 | |
| | |
Series 2012-93, Class SE, IF, IO, 3.61%, 9/25/2042 (i) | | | 174,777 | | | | 30,260 | |
| | |
Series 2012-124, Class UI, IO, 4.00%, 11/25/2042 | | | 245,707 | | | | 50,396 | |
| | |
Series 2012-133, Class NS, IF, IO, 3.66%, 12/25/2042 (i) | | | 331,278 | | | | 59,015 | |
| | |
Series 2017-31, Class SG, IF, IO, 3.61%, 5/25/2047 (i) | | | 1,866,227 | | | | 333,542 | |
| | |
Series 2017-39, Class ST, IF, IO, 3.61%, 5/25/2047 (i) | | | 500,374 | | | | 85,173 | |
| | |
Series 2017-69, Class SH, IF, IO, 3.71%, 9/25/2047 (i) | | | 848,840 | | | | 160,595 | |
| | |
FNMA STRIPS Series 409, Class 27, IO, 4.00%, 4/25/2027 (i) | | | 373,704 | | | | 33,119 | |
| | |
FNMA, Connecticut Avenue Securities | | | | | | | | |
| | |
Series 2018-C05, Class 1M2, 4.84%, 1/25/2031 (i) | | | 10,000 | | | | 10,079 | |
| | |
Series 2018-C06, Class 1M2, 4.49%, 3/25/2031 (i) | | | 130,000 | | | | 128,914 | |
| | |
Series 2018-C06, Class 2M2, 4.59%, 3/25/2031 (i) | | | 30,000 | | | | 29,725 | |
| | |
GNMA | | | | | | | | |
| | |
Series 2015-H13, Class GI, IO, 1.61%, 4/20/2065 (i) | | | 305,025 | | | | 14,259 | |
| | |
Series 2017-H14, Class FG, 3.53%, 6/20/2067 (i) | | | 406,717 | | | | 416,419 | |
| | |
Homeward Opportunities Fund I Trust Series 2018-1, Class A1, 3.77%, 6/25/2048 (b) (i) | | | 85,856 | | | | 86,448 | |
| | |
Merrill Lynch Mortgage Investors Trust Series 2004-C, Class A1, 3.05%, 7/25/2029 (i) | | | 105,795 | | | | 101,308 | |
SEE NOTES TO FINANCIAL STATEMENTS.
| | | | | | | | |
| | | |
| FEBRUARY 28, 2019 | | J.P. MORGAN EXCHANGE-TRADED FUNDS | | | | | 71 | |
JPMorgan Global Bond Opportunities ETF
SCHEDULE OF PORTFOLIO INVESTMENTS
AS OF FEBRUARY 28, 2019 (continued)
(Amounts in U.S. Dollars, unless otherwise noted)
| | | | | | | | |
| INVESTMENTS | | PRINCIPAL
AMOUNT | | | VALUE ($) | |
Collateralized Mortgage Obligations — continued | | | | | |
| | |
United States — continued | | | | | | | | |
| | |
OBX Trust Series 2018-EXP1, Class 2A1, 3.34%, 4/25/2048 (b) (i) | | | 271,976 | | | | 270,900 | |
| | |
PNMAC GMSR Issuer Trust Series 2018-GT2, Class A, 5.14%, 8/25/2025 (b) (i) | | | 210,000 | | | | 210,459 | |
| | |
PRPM LLC Series 2019-1A, Class A1, 4.50%, 1/25/2024 (b) (f) | | | 630,000 | | | | 633,072 | |
| | |
Structured Adjustable Rate Mortgage Loan Trust Series 2004-8, Class 3A, 4.39%, 7/25/2034 (i) | | | 25,735 | | | | 25,586 | |
| | |
Toorak Mortgage Corp. Ltd. Series 2018-1, Class A1, 4.34%, 8/25/2021 (b) (f) | | | 240,000 | | | | 237,723 | |
| | |
Verus Securitization Trust | | | | | | | | |
| | |
Series 2018-2, Class A1, 3.68%, 6/1/2058 (b) (i) | | | 208,223 | | | | 209,016 | |
| | |
Series 2019-1, Class A1, 3.84%, 2/25/2059 (b) (i) | | | 315,000 | | | | 314,996 | |
| | | | | | | | |
| | |
| | | | | | | 5,303,794 | |
| | | | | | | | |
| |
Total Collateralized Mortgage Obligations
(Cost $5,783,813) | | | | 5,758,091 | |
| | | | | | | | |
U.S. Treasury Obligations — 1.1% | | | | | | | | |
| | |
U.S. Treasury Bonds 3.00%, 2/15/2048 | | | 90,000 | | | | 88,432 | |
| | |
U.S. Treasury Notes 2.88%, 5/15/2028 | | | 1,970,000 | | | | 1,996,472 | |
| | | | | | | | |
| | |
| | | | | | | 2,084,904 | |
| | | | | | | | |
| |
Total U.S. Treasury Obligations
(Cost $2,046,326) | | | | 2,084,904 | |
| | | | | | | | |
| | |
| | | NO. OF WARRANTS | | | | |
Warrants — 0.0% (h) | |
|
Canada — 0.0% (h) | |
| | |
Ultra Petroleum Corp.expiring 7/14/2025, price 1.00*
(Cost $—) | | | 2,450 | | | | 858 | |
| | | | | | | | |
| | |
| | | PRINCIPAL
AMOUNT | | | | |
Short-Term Investments — 7.0% | |
|
Foreign Government Treasury Bills — 1.0% | |
| | |
Italy Buoni Ordinari del Tesoro BOT 0.04%, 12/13/2019 (a) (k)
(Cost $1,809,932) | | | EUR1,595,000 | | | | 1,813,634 | |
| | | | | | | | |
| | | | | | | | |
| INVESTMENTS | |
SHARES | | | VALUE ($) | |
Investment Companies — 6.0% | | | | | | | | |
| | |
JPMorgan U.S. Government Money Market Fund Class Institutional Shares, 2.33% (l) (m) (Cost $10,805,532) | | | 10,805,532 | | | | 10,805,532 | |
| | | | | | | | |
| | |
Total Short-Term Investments
(Cost $12,615,464) | | | | | | | 12,619,166 | |
| | | | | | | | |
Total Investments — 100.3%
(Cost $183,409,593) | | | | 180,927,172 | |
Liabilities in Excess of
Other Assets — (0.3%) | | | | (569,941) | |
| | | | | | | | |
NET ASSETS — 100.0% | | | | | | | 180,357,231 | |
| | | | | | | | |
Percentages indicated are based on net assets.
SEE NOTES TO FINANCIAL STATEMENTS.
| | | | | | |
| | | |
| 72 | | | | J.P. MORGAN EXCHANGE-TRADED FUNDS | | FEBRUARY 28, 2019 |
Abbreviations
| | |
| ABS | | Asset-backed securities |
| BRL | | Brazilian Real |
| CLO | | Collateralized Loan Obligations |
| EUR | | Euro |
| EURIBOR | | Euro Interbank Offered Rate |
| FHLMC | | Federal Home Loan Mortgage Corp. |
| FNMA | | Federal National Mortgage Association |
| GBP | | British Pound |
| GNMA | | Government National Mortgage Association |
| ICE | | Intercontinental Exchange |
| IDR | | Indonesian Rupiah |
| IF | | Inverse Floaters represent securities that pay interest at a rate that increases (decreases) with a decline (incline) in a specified index. The interest rate shown is the rate in effect as of February 28, 2019. The rate may be subject to a cap and floor. |
| IO | | Interest Only represents the right to receive the monthly interest payments on an underlying pool of mortgage loans. The principal amount shown represents the par value on the underlying pool. The yields on these securities are subject to accelerated principal paydowns as a result of prepayment or refinancing of the underlying pool of mortgage instruments. As a result, interest income may be reduced considerably. |
| LIBOR | | London Interbank Offered Rate |
| MXN | | Mexican Peso |
| MYR | | Malaysian Ringgit |
| OYJ | | Public Limited Company |
| PEN | | Peruvian Nuevo Sol |
| PO | | Principal Only represents the right to receive the principal portion only on an underlying pool of mortgage loans. The market value of these securities is extremely volatile in response to changes in market interest rates. As prepayments on the underlying mortgages of these securities increase, the yield on these securities increases. |
| PT | | Limited liability company |
| REIT | | Real Estate Investment Trust |
| REMIC | | Real Estate Mortgage Investment Conduit |
| Re-REMIC | | Combined Real Estate Mortgage Investment Conduit |
| SCA | | Limited partnership with share capital |
| SEK | | Swedish Krona |
| SPC | | Special purpose company |
| STRIPS | | Separate Trading of Registered Interest and Principal of Securities. The STRIPS Program lets investors hold and trade individual interest and principal components of eligible notes and bonds as separate securities. |
| | |
| USD | | United States Dollar |
| ZAR | | South African Rand |
| |
| (a) | | Security exempt from registration pursuant to Regulation S under the Securities Act of 1933, as amended. Regulation S applies to securities offerings that are made outside of the United States and do not involve direct selling efforts in the United States and as such may have restrictions on resale. |
| (b) | | Securities exempt from registration under Rule 144A or section 4(a)(2), of the Securities Act of 1933, as amended. |
| (c) | | Security is perpetual and thus, does not have a predetermined maturity date. The coupon rate for this security is fixed for a period of time and may be structured to adjust thereafter. The date shown, if applicable, reflects the next call date. The coupon rate shown is the rate in effect as of February 28, 2019. |
| (d) | | Variable or floating rate security, linked to the referenced benchmark. The interest rate shown is the current rate as of February 28, 2019. |
| (e) | | Security is an interest bearing note with preferred security characteristics. |
| (f) | | Step bond. Interest rate is a fixed rate for an initial period that either resets at a specific date or may reset in the future contingent upon a predetermined trigger. The interest rate shown is the current rate as of February 28, 2019. |
| (g) | | Security has the ability to pay in kind (“PIK”) or pay income in cash. When applicable, separate rates of such payments are disclosed. |
| (h) | | Amount rounds to less than 0.1% of net assets. |
| (i) | | Variable or floating rate security, the interest rate of which adjusts periodically based on changes in current interest rates and prepayments on the underlying pool of assets. The interest rate shown is the current rate as of February 28, 2019. |
| (j) | | All or a portion of the security is a when-issued security, delayed delivery security, or forward commitment. |
| (k) | | The rate shown is the effective yield as of February 28, 2019. |
| (l) | | Investment in affiliate. Fund is registered under the Investment Company Act of 1940, as amended, and advised by J.P. Morgan Investment Management Inc. |
| (m) | | The rate shown is the current yield as of February 28, 2019. |
| * | | Non-income producing security. |
| ‡ | | Value determined using significant unobservable inputs. |
SEE NOTES TO FINANCIAL STATEMENTS.
| | | | | | | | |
| | | |
| FEBRUARY 28, 2019 | | J.P. MORGAN EXCHANGE-TRADED FUNDS | | | | | 73 | |
JPMorgan Global Bond Opportunities ETF
SCHEDULE OF PORTFOLIO INVESTMENTS
AS OF FEBRUARY 28, 2019 (continued)
| | | | | | | | | | | | | | | | | | | | |
| Futures contracts outstanding as of February 28, 2019: | |
| DESCRIPTION | | NUMBER OF
CONTRACTS | | | EXPIRATION
DATE | | | TRADING
CURRENCY | | | NOTIONAL
AMOUNT ($) | | | VALUE AND
UNREALIZED
APPRECIATION
(DEPRECIATION) ($) | |
| |
Long Contracts | | | | | |
| | | | | |
| Australia 10 Year Bond | | | 72 | | | | 03/2019 | | | | AUD | | | | 6,895,511 | | | | (3,649 | ) |
| | | | | |
| Long Gilt | | | 1 | | | | 06/2019 | | | | GBP | | | | 166,842 | | | | (2,230 | ) |
| | | | | |
| U.S. Treasury 10 Year Note | | | 43 | | | | 06/2019 | | | | USD | | | | 5,243,984 | | | | (16,532 | ) |
| | | | | |
| U.S. Treasury 10 Year Ultra Note | | | 40 | | | | 06/2019 | | | | USD | | | | 5,176,250 | | | | (13,885 | ) |
| | | | | |
| U.S. Treasury 2 Year Note | | | 2 | | | | 06/2019 | | | | USD | | | | 424,375 | | | | (67 | ) |
| | | | | |
| U.S. Treasury 5 Year Note | | | 103 | | | | 06/2019 | | | | USD | | | | 11,797,523 | | | | (18,076 | ) |
| | | | | | | | | | | | | | | | | | | | |
| | | | | |
| | | | | | | | | | | | | | | | | | | (54,439 | ) |
| | | | | | | | | | | | | | | | | | | | |
Short Contracts | | | | | |
| | | | | |
| Euro-Bobl | | | (32) | | | | 03/2019 | | | | EUR | | | | (4,830,795 | ) | | | (16,685 | ) |
| | | | | |
| Euro-Bund | | | (71) | | | | 03/2019 | | | | EUR | | | | (13,350,261 | ) | | | 11,194 | |
| | | | | |
| Euro-Buxl | | | (3) | | | | 03/2019 | | | | EUR | | | | (628,009 | ) | | | 7,435 | |
| | | | | |
| Euro-OAT | | | (23) | | | | 03/2019 | | | | EUR | | | | (4,000,070 | ) | | | 16,557 | |
| | | | | |
| U.S. Treasury 10 Year Note | | | (15) | | | | 06/2019 | | | | USD | | | | (1,829,297 | ) | | | 3,483 | |
| | | | | |
| U.S. Treasury 10 Year Ultra Note | | | (2) | | | | 06/2019 | | | | USD | | | | (258,813 | ) | | | 590 | |
| | | | | |
| U.S. Treasury 5 Year Note | | | (28) | | | | 06/2019 | | | | USD | | | | (3,207,094 | ) | | | 1,035 | |
| | | | | |
| U.S. Treasury Long Bond | | | (1) | | | | 06/2019 | | | | USD | | | | (144,500 | ) | | | 1,459 | |
| | | | | |
| U.S. Treasury Ultra Bond | | | (2) | | | | 06/2019 | | | | USD | | | | (319,438 | ) | | | 5,542 | |
| | | | | |
| 3 Month Eurodollar | | | (281) | | | | 09/2019 | | | | USD | | | | (68,419,987 | ) | | | (229,962 | ) |
| | | | | | | | | | | | | | | | | | | | |
| | | | | |
| | | | | | | | | | | | | | | | | | | (199,352 | ) |
| | | | | | | | | | | | | | | | | | | | |
| | | | | |
| | | | | | | | | | | | | | | | | | | (253,791 | ) |
| | | | | | | | | | | | | | | | | | | | |
| | |
| Abbreviations |
| AUD | | Australian Dollar |
| EUR | | Euro |
| GBP | | British Pound |
| USD | | United States Dollar |
| | | | | | | | | | | | | | | | | | | | |
| Forward foreign currency exchange contracts outstanding as of February 28, 2019: | | | | |
| CURRENCY PURCHASED | | | CURRENCY SOLD | | | COUNTERPARTY | | SETTLEMENT DATE | | | UNREALIZED
APPRECIATION
(DEPRECIATION) ($) | |
| CLP | | | 598,579,236 | | | USD | | | 893,122 | | | Goldman Sachs International ** | | | 3/5/2019 | | | | 19,584 | |
| COP | | | 4,442,652,370 | | | USD | | | 1,408,548 | | | Goldman Sachs International ** | | | 3/5/2019 | | | | 33,102 | |
| EUR | | | 43,198 | | | USD | | | 49,110 | | | Barclays Bank plc | | | 3/5/2019 | | | | 29 | |
| EUR | | | 2,281,063 | | | USD | | | 2,580,400 | | | BNP Paribas | | | 3/5/2019 | | | | 14,409 | |
| EUR | | | 248,848 | | | USD | | | 282,938 | | | Citibank, NA | | | 3/5/2019 | | | | 137 | |
| EUR | | | 2,841,375 | | | USD | | | 3,231,899 | | | Goldman Sachs International | | | 3/5/2019 | | | | 289 | |
| EUR | | | 13,574,602 | | | USD | | | 15,430,865 | | | HSBC Bank, NA | | | 3/5/2019 | | | | 10,835 | |
| EUR | | | 289,769 | | | USD | | | 328,271 | | | State Street Corp. | | | 3/5/2019 | | | | 1,354 | |
| GBP | | | 112,507 | | | USD | | | 144,719 | | | BNP Paribas | | | 3/5/2019 | | | | 4,512 | |
| GBP | | | 100,962 | | | USD | | | 130,113 | | | Merrill Lynch International | | | 3/5/2019 | | | | 3,804 | |
| GBP | | | 85,786 | | | USD | | | 112,604 | | | Morgan Stanley | | | 3/5/2019 | | | | 1,184 | |
| IDR | | | 4,083,098,272 | | | USD | | | 287,968 | | | Goldman Sachs International ** | | | 3/5/2019 | | | | 1,993 | |
| SEK | | | 14,103,523 | | | USD | | | 1,514,680 | | | HSBC Bank, NA | | | 3/5/2019 | | | | 12,457 | |
| TRY | | | 1,450,214 | | | USD | | | 269,632 | | | Citibank, NA | | | 3/5/2019 | | | | 1,876 | |
SEE NOTES TO FINANCIAL STATEMENTS.
| | | | | | |
| | | |
| 74 | | | | J.P. MORGAN EXCHANGE-TRADED FUNDS | | FEBRUARY 28, 2019 |
| | | | | | | | | | | | | | | | | | | | |
| CURRENCY PURCHASED | | | CURRENCY SOLD | | | COUNTERPARTY | | SETTLEMENT DATE | | | UNREALIZED
APPRECIATION
(DEPRECIATION) ($) | |
| USD | | | 908,936 | | | AUD | | | 1,279,632 | | | Barclays Bank plc | | | 3/5/2019 | | | | 1,210 | |
| USD | | | 915,889 | | | CLP | | | 598,579,236 | | | Barclays Bank plc ** | | | 3/5/2019 | | | | 3,183 | |
| USD | | | 154,168 | | | EUR | | | 134,066 | | | Australia & New Zealand Banking Group Ltd. | | | 3/5/2019 | | | | 1,662 | |
| USD | | | 15,943,513 | | | EUR | | | 13,843,415 | | | Barclays Bank plc | | | 3/5/2019 | | | | 196,027 | |
| USD | | | 10,859,403 | | | EUR | | | 9,489,362 | | | BNP Paribas | | | 3/5/2019 | | | | 64,841 | |
| USD | | | 15,949,697 | | | EUR | | | 13,843,000 | | | Goldman Sachs International | | | 3/5/2019 | | | | 202,682 | |
| USD | | | 897,132 | | | EUR | | | 788,299 | | | Merrill Lynch International | | | 3/5/2019 | | | | 408 | |
| USD | | | 51,084 | | | EUR | | | 44,656 | | | Royal Bank of Canada | | | 3/5/2019 | | | | 286 | |
| USD | | | 326,476 | | | EUR | | | 283,882 | | | State Street Corp. | | | 3/5/2019 | | | | 3,548 | |
| USD | | | 898,601 | | | MXN | | | 17,126,525 | | | Goldman Sachs International | | | 3/5/2019 | | | | 10,503 | |
| USD | | | 1,561,001 | | | SEK | | | 14,103,523 | | | TD Bank Financial Group | | | 3/5/2019 | | | | 33,865 | |
| USD | | | 1,784,042 | | | TRY | | | 9,511,774 | | | Citibank, NA | | | 3/5/2019 | | | | 3,256 | |
| USD | | | 1,921,268 | | | ZAR | | | 26,302,096 | | | Goldman Sachs International | | | 3/5/2019 | | | | 55,255 | |
| USD | | | 1,064,342 | | | ZAR | | | 14,730,810 | | | HSBC Bank, NA | | | 3/5/2019 | | | | 19,258 | |
| BRL | | | 1,699,349 | | | USD | | | 446,000 | | | Barclays Bank plc ** | | | 3/6/2019 | | | | 6,352 | |
| BRL | | | 1,688,134 | | | USD | | | 445,722 | | | Merrill Lynch International ** | | | 3/6/2019 | | | | 3,644 | |
| USD | | | 909,990 | | | BRL | | | 3,387,483 | | | Citibank, NA ** | | | 3/6/2019 | | | | 8,274 | |
| COP | | | 5,625,094,404 | | | USD | | | 1,810,513 | | | Goldman Sachs International ** | | | 4/3/2019 | | | | 12,230 | |
| EUR | | | 148,736 | | | USD | | | 168,588 | | | BNP Paribas | | | 4/3/2019 | | | | 1,034 | |
| EUR | | | 173,294 | | | USD | | | 197,197 | | | TD Bank Financial Group | | | 4/3/2019 | | | | 432 | |
| PLN | | | 6,898,163 | | | EUR | | | 1,594,600 | | | Barclays Bank plc | | | 4/3/2019 | | | | 6,264 | |
| USD | | | 76,702 | | | AUD | | | 107,353 | | | Merrill Lynch International | | | 4/3/2019 | | | | 511 | |
| USD | | | 918,701 | | | AUD | | | 1,279,632 | | | State Street Corp. | | | 4/3/2019 | | | | 10,515 | |
| USD | | | 1,334,960 | | | BRL | | | 4,953,369 | | | Goldman Sachs International ** | | | 4/3/2019 | | | | 19,184 | |
| USD | | | 2,725,376 | | | CNY | | | 18,211,535 | | | HSBC Bank, NA ** | | | 4/3/2019 | | | | 6,891 | |
| USD | | | 44,027 | | | EUR | | | 38,568 | | | Barclays Bank plc | | | 4/3/2019 | | | | 43 | |
| USD | | | 272,983 | | | EUR | | | 239,190 | | | BNP Paribas | | | 4/3/2019 | | | | 205 | |
| USD | | | 7,195,662 | | | EUR | | | 6,298,845 | | | Citibank, NA | | | 4/3/2019 | | | | 12,302 | |
| USD | | | 7,897,149 | | | EUR | | | 6,916,058 | | | Goldman Sachs International | | | 4/3/2019 | | | | 9,903 | |
| USD | | | 10,722,042 | | | EUR | | | 9,386,719 | | | HSBC Bank, NA | | | 4/3/2019 | | | | 17,193 | |
| USD | | | 45,996 | | | EUR | | | 40,280 | | | Merrill Lynch International | | | 4/3/2019 | | | | 60 | |
| USD | | | 1,270,478 | | | EUR | | | 1,112,179 | | | State Street Corp. | | | 4/3/2019 | | | | 2,121 | |
| USD | | | 631,814 | | | GBP | | | 474,140 | | | Citibank, NA | | | 4/3/2019 | | | | 1,928 | |
| USD | | | 2,948,143 | | | ZAR | | | 41,032,906 | | | Citibank, NA | | | 4/3/2019 | | | | 47,326 | |
| USD | | | 926,418 | | | IDR | | | 12,995,600,132 | | | Merrill Lynch International ** | | | 4/4/2019 | | | | 11,800 | |
| | | | | | | | | | | | | | | | | | | | |
| Total unrealized appreciation | | | | | | | | | | 879,761 | |
| | | | | | | | | | | | | | | | | | | | |
| AUD | | | 1,279,632 | | | USD | | | 918,331 | | | State Street Corp. | | | 3/5/2019 | | | | (10,606 | ) |
| CNY | | | 18,211,535 | | | USD | | | 2,725,455 | | | HSBC Bank, NA ** | | | 3/5/2019 | | | | (2,275 | ) |
| EUR | | | 6,647,476 | | | USD | | | 7,576,079 | | | Citibank, NA | | | 3/5/2019 | | | | (14,285 | ) |
| EUR | | | 6,873,068 | | | USD | | | 7,828,988 | | | Goldman Sachs International | | | 3/5/2019 | | | | (10,574 | ) |
| EUR | | | 9,513,147 | | | USD | | | 10,840,814 | | | HSBC Bank, NA | | | 3/5/2019 | | | | (19,195 | ) |
| EUR | | | 366,754 | | | USD | | | 417,377 | | | Morgan Stanley | | | 3/5/2019 | | | | (178 | ) |
| GBP | | | 474,140 | | | USD | | | 630,871 | | | Citibank, NA | | | 3/5/2019 | | | | (1,963 | ) |
| IDR | | | 11,265,777,240 | | | USD | | | 804,124 | | | Goldman Sachs International ** | | | 3/5/2019 | | | | (4,085 | ) |
| IDR | | | 12,995,600,132 | | | USD | | | 929,731 | | | Merrill Lynch International ** | | | 3/5/2019 | | | | (6,849 | ) |
| MXN | | | 17,126,525 | | | USD | | | 893,472 | | | Citibank, NA | | | 3/5/2019 | | | | (5,374 | ) |
| TRY | | | 8,061,560 | | | USD | | | 1,518,902 | | | Goldman Sachs International | | | 3/5/2019 | | | | (9,623 | ) |
| USD | | | 2,687,581 | | | CNY | | | 18,211,535 | | | Citibank, NA ** | | | 3/5/2019 | | | | (35,600 | ) |
| USD | | | 1,433,969 | | | COP | | | 4,442,652,370 | | | Goldman Sachs International ** | | | 3/5/2019 | | | | (7,680 | ) |
| USD | | | 139,340 | | | EUR | | | 122,976 | | | Australia & New Zealand Banking Group Ltd. | | | 3/5/2019 | | | | (550 | ) |
| USD | | | 1,518,467 | | | EUR | | | 1,342,220 | | | BNP Paribas | | | 3/5/2019 | | | | (8,368 | ) |
| USD | | | 340,711 | | | EUR | | | 301,236 | | | Citibank, NA | | | 3/5/2019 | | | | (1,958 | ) |
| USD | | | 2,708,156 | | | EUR | | | 2,389,824 | | | HSBC Bank, NA | | | 3/5/2019 | | | | (10,373 | ) |
| USD | | | 109,211 | | | EUR | | | 96,363 | | | Merrill Lynch International | | | 3/5/2019 | | | | (406 | ) |
SEE NOTES TO FINANCIAL STATEMENTS.
| | | | | | | | |
| | | |
| FEBRUARY 28, 2019 | | J.P. MORGAN EXCHANGE-TRADED FUNDS | | | | | 75 | |
JPMorgan Global Bond Opportunities ETF
SCHEDULE OF PORTFOLIO INVESTMENTS
AS OF FEBRUARY 28, 2019 (continued)
| | | | | | | | | | | | | | | | | | | | |
| CURRENCY PURCHASED | | | CURRENCY SOLD | | | COUNTERPARTY | | SETTLEMENT DATE | | | UNREALIZED
APPRECIATION
(DEPRECIATION) ($) | |
| USD | | | 1,017,802 | | | GBP | | | 773,395 | | | Merrill Lynch International | | | 3/5/2019 | | | | (8,043 | ) |
| USD | | | 2,004,914 | | | IDR | | | 28,344,475,644 | | | Merrill Lynch International ** | | | 3/5/2019 | | | | (7,969 | ) |
| ZAR | | | 41,032,906 | | | USD | | | 2,958,315 | | | Citibank, NA | | | 3/5/2019 | | | | (47,219 | ) |
| AUD | | | 1,386,985 | | | USD | | | 993,445 | | | BNP Paribas | | | 4/3/2019 | | | | (9,067 | ) |
| BRL | | | 3,236,303 | | | USD | | | 866,898 | | | Goldman Sachs International ** | | | 4/3/2019 | | | | (7,231 | ) |
| CNY | | | 6,059,179 | | | USD | | | 906,769 | | | HSBC Bank, NA ** | | | 4/3/2019 | | | | (2,300 | ) |
| MXN | | | 17,126,525 | | | USD | | | 894,530 | | | Goldman Sachs International | | | 4/3/2019 | | | | (10,584 | ) |
| TRY | | | 9,511,774 | | | USD | | | 1,755,141 | | | Citibank, NA | | | 4/3/2019 | | | | (4,657 | ) |
| USD | | | 904,256 | | | EUR | | | 797,774 | | | BNP Paribas | | | 4/3/2019 | | | | (5,546 | ) |
| USD | | | 3,346,845 | | | EUR | | | 2,935,305 | | | Goldman Sachs International | | | 4/3/2019 | | | | (650 | ) |
| USD | | | 16,562,610 | | | EUR | | | 14,534,323 | | | HSBC Bank, NA | | | 4/3/2019 | | | | (12,695 | ) |
| USD | | | 589,676 | | | EUR | | | 517,919 | | | National Australia Bank Ltd. | | | 4/3/2019 | | | | (972 | ) |
| USD | | | 1,518,309 | | | SEK | | | 14,103,523 | | | HSBC Bank, NA | | | 4/3/2019 | | | | (12,484 | ) |
| ZAR | | | 8,032,857 | | | USD | | | 577,280 | | | BNP Paribas | | | 4/3/2019 | | | | (9,398 | ) |
| | | | | | | | | | | | | | | | | | | | |
| Total unrealized depreciation | | | | | | | | | | (288,757 | ) |
| | | | | | | | | | | | | | | | | | | | |
| Net unrealized appreciation | | | | | | | 591,004 | |
| | | | | | | | | | | | | | | | | | | | |
| | |
| Abbreviations |
| |
| AUD | | Australian Dollar |
| BRL | | Brazilian Real |
| CLP | | Chilean Peso |
| CNY | | Chinese Yuan |
| COP | | Colombian Peso |
| EUR | | Euro |
| GBP | | British Pound |
| IDR | | Indonesian Rupiah |
| MXN | | Mexican Peso |
| PLN | | Polish Zloty |
| SEK | | Swedish Krona |
| TRY | | Turkish Lira |
| USD | | United States Dollar |
| ZAR | | South African Rand |
| |
| ** | | Non-deliverable forward. |
SEE NOTES TO FINANCIAL STATEMENTS.
| | | | | | |
| | | |
| 76 | | | | J.P. MORGAN EXCHANGE-TRADED FUNDS | | FEBRUARY 28, 2019 |
JPMorgan Municipal ETF
SCHEDULE OF PORTFOLIO INVESTMENTS
AS OF FEBRUARY 28, 2019
| | | | | | | | |
| INVESTMENTS | | PRINCIPAL
AMOUNT ($) | | | VALUE ($) | |
Municipal Bonds — 97.7%(a) | | | | | | | | |
| | |
Alabama — 3.3% | | | | | | | | |
| | |
Education — 1.5% | | | | | | | | |
| | |
Auburn University Series 2016A, Rev., 5.00%, 6/1/2030 | | | 35,000 | | | | 41,158 | |
| | |
Tuscaloosa City Board of Education, Warrants Rev., 5.00%, 8/1/2028 | | | 275,000 | | | | 324,208 | |
| | |
University of Alabama (The) Series B-2, Rev., 5.00%, 9/1/2031 | | | 95,000 | | | | 112,870 | |
| | | | | | | | |
| | |
| | | | | | | 478,236 | |
| | | | | | | | |
| | |
General Obligation — 0.4% | | | | | | | | |
| | |
City of Pell City Series A, GO, 5.00%, 2/1/2025 | | | 100,000 | | | | 116,368 | |
| | | | | | | | |
| | |
Transportation — 0.7% | | | | | | | | |
| | |
Alabama Federal Aid Highway Finance Authority Series 2016A, Rev., 5.00%, 9/1/2034 | | | 200,000 | | | | 231,078 | |
| | | | | | | | |
| | |
Utility — 0.7% | | | | | | | | |
| | |
Black Belt Energy Gas District, Gas Supply Series 2017A, Rev., VAR, LIQ: Royal Bank of Canada, 4.00%, 7/1/2022 (b) | | | 150,000 | | | | 157,192 | |
| | |
Southeast Alabama Gas District, Project No.1 Series A, Rev., 4.00%, 4/1/2024 (b) | | | 50,000 | | | | 52,715 | |
| | | | | | | | |
| | |
| | | | | | | 209,907 | |
| | | | | | | | |
| | |
Total Alabama | | | | | | | 1,035,589 | |
| | | | | | | | |
| | |
Alaska — 0.1% | | | | | | | | |
| | |
Other Revenue — 0.1% | | | | | | | | |
| | |
Alaska Municipal Bond Bank Authority Series 3, Rev., 5.00%, 10/1/2025 | | | 20,000 | | | | 22,841 | |
| | | | | | | | |
| | |
Arizona — 1.1% | | | | | | | | |
| | |
General Obligation — 0.4% | | | | | | | | |
| | |
City of Phoenix GO, 5.00%, 7/1/2027 | | | 25,000 | | | | 30,006 | |
| | |
City of Tempe Series B, GO, 4.00%, 7/1/2024 | | | 25,000 | | | | 27,827 | |
| | |
Lake Havasu City, Wastewater System, Senior Lien Series A, GO, AGM, 5.00%, 7/1/2033 | | | 25,000 | | | | 28,101 | |
| | |
Maricopa County School District No. 3 Tempe Elementary, School Improvement Series A, GO, 5.00%, 7/1/2027 | | | 30,000 | | | | 36,672 | |
| | | | | | | | |
| | |
| | | | | | | 122,606 | |
| | | | | | | | |
| | |
Prerefunded — 0.1% | | | | | | | | |
| | |
Scottsdale Preserve Authority Rev., 5.25%, 7/1/2020 (c) | | | 25,000 | | | | 26,150 | |
| | | | | | | | |
| | | | | | | | |
| INVESTMENTS | | PRINCIPAL
AMOUNT ($) | | | VALUE ($) | |
| | | | | | | | |
| | |
Transportation — 0.1% | | | | | | | | |
| | |
Maricopa County, Regional Public Transportation Authority, Excise Tax Revenue, Public Transportation Fund Rev., 5.25%, 7/1/2024 | | | 30,000 | | | | 35,234 | |
| | | | | | | | |
| | |
Utility — 0.5% | | | | | | | | |
| | |
Salt Verde Financial Corp. Rev., 5.25%, 12/1/2026 | | | 150,000 | | | | 174,446 | |
| | | | | | | | |
| | |
Total Arizona | | | | | | | 358,436 | |
| | | | | | | | |
| | |
Arkansas — 0.4% | | | | | | | | |
| | |
Education — 0.1% | | | | | | | | |
| | |
University of Arkansas, UAMS Campus Rev., 5.00%, 11/1/2021 | | | 40,000 | | | | 43,353 | |
| | | | | | | | |
| | |
Water & Sewer — 0.3% | | | | | | | | |
| | |
City of Fort Smith, Water and Sewer Construction Rev., 5.00%, 10/1/2024 | | | 75,000 | | | | 86,611 | |
| | | | | | | | |
| | |
Total Arkansas | | | | | | | 129,964 | |
| | | | | | | | |
| | |
California — 2.3% | | | | | | | | |
| |
Certificate of Participation/Lease — 0.6% | | | | | |
| | |
City of Roseville, 316 Vernon Street Project COP, 5.00%, 8/1/2025 | | | 70,000 | | | | 84,076 | |
| | |
City of Santa Rosa, Courthouse Square Project and Lease COP, 4.00%, 10/1/2024 | | | 90,000 | | | | 101,124 | |
| | | | | | | | |
| | |
| | | | | | | 185,200 | |
| | | | | | | | |
| | |
General Obligation — 0.3% | | | | | | | | |
| | |
El Monte City School District, Election 2014 Series A, GO, 5.00%, 8/1/2025 | | | 55,000 | | | | 65,737 | |
| | |
Hermosa Beach City School District, Election of 2016 Series A, GO, 4.00%, 8/1/2023 | | | 15,000 | | | | 16,576 | |
| | | | | | | | |
| | |
| | | | | | | 82,313 | |
| | | | | | | | |
| | |
Other Revenue — 1.4% | | | | | | | | |
| | |
Anaheim Public Financing Authority, Anaheim Convention Center Expansion Project Series A, Rev., 5.00%, 5/1/2026 | | | 50,000 | | | | 58,132 | |
| | |
Chula Vista Municipal Financing Authority Rev., 4.00%, 5/1/2026 | | | 60,000 | | | | 68,714 | |
| | |
Golden State Tobacco Securitization Corp., Tobacco Settlement Series A-1, Rev., 5.00%, 6/1/2032 | | | 250,000 | | | | 280,857 | |
| | |
Municipal Improvement Corp. of Los Angeles, Real Property Series 2014-A, Rev., 5.00%, 5/1/2023 | | | 20,000 | | | | 22,767 | |
| | | | | | | | |
| | |
| | | | | | | 430,470 | |
| | | | | | | | |
SEE NOTES TO FINANCIAL STATEMENTS.
| | | | | | | | |
| | | |
| FEBRUARY 28, 2019 | | J.P. MORGAN EXCHANGE-TRADED FUNDS | | | | | 77 | |
JPMorgan Municipal ETF
SCHEDULE OF PORTFOLIO INVESTMENTS
AS OF FEBRUARY 28, 2019 (continued)
| | | | | | | | |
| INVESTMENTS | | PRINCIPAL
AMOUNT ($) | | | VALUE ($) | |
Municipal Bonds — continued | | | | | | | | |
| | |
Utility — 0.0%(d) | | | | | | | | |
| | |
Modesto Irrigation District Financing Authority, Electric System Series 2015A, Rev., 5.00%, 10/1/2025 | | | 10,000 | | | | 12,018 | |
| | | | | | | | |
| | |
Total California | | | | | | | 710,001 | |
| | | | | | | | |
| | |
Colorado — 1.0% | | | | | | | | |
| |
Certificate of Participation/Lease — 0.0%(d) | | | | | |
| | |
State of Colorado, Higher Education Capital Construction, Lease Purchase Financing Program Series 2014A, COP, 5.00%, 11/1/2025 | | | 10,000 | | | | 11,862 | |
| | | | | | | | |
| | |
Education — 0.2% | | | | | | | | |
| | |
University of Colorado, University Enterprise Series A-2, Rev., 5.00%, 6/1/2026 | | | 40,000 | | | | 48,350 | |
| | | | | | | | |
| | |
General Obligation — 0.8% | | | | | | | | |
| | |
Southlands Metropolitan District No. 1 Series A-1, GO, 5.00%, 12/1/2037 | | | 250,000 | | | | 264,643 | |
| | | | | | | | |
| | |
Total Colorado | | | | | | | 324,855 | |
| | | | | | | | |
| | |
Connecticut — 1.2% | | | | | | | | |
| | |
General Obligation — 0.7% | | | | | | | | |
| | |
State of Connecticut Series A, GO, 5.00%, 4/15/2033 | | | 210,000 | | | | 234,673 | |
| | | | | | | | |
| | |
Hospital — 0.2% | | | | | | | | |
| | |
Connecticut State Health and Educational Facilities Authority, University of New Haven Issue Series K-1, Rev., 5.00%, 7/1/2032 | | | 50,000 | | | | 56,487 | |
| | | | | | | | |
| | |
Special Tax — 0.3% | | | | | | | | |
| | |
State of Connecticut Special Tax Transportation Infrastructure Purposes Series B, Rev., 5.00%, 8/1/2023 | | | 75,000 | | | | 84,035 | |
| | | | | | | | |
| | |
Total Connecticut | | | | | | | 375,195 | |
| | | | | | | | |
| | |
Delaware — 0.1% | | | | | | | | |
| | |
Transportation — 0.1% | | | | | | | | |
| | |
Delaware Transportation Authority Rev., 5.00%, 7/1/2022 | | | 25,000 | | | | 27,712 | |
| | | | | | | | |
| | |
District of Columbia — 0.8% | | | | | | | | |
| | |
General Obligation — 0.3% | | | | | | | | |
| | |
District of Columbia | | | | | | | | |
| | |
Series 2018B, GO, 5.00%, 6/1/2025 | | | 30,000 | | | | 35,583 | |
| | |
Series D, GO, 5.00%, 6/1/2031 | | | 65,000 | | | | 77,494 | |
| | | | | | | | |
| | |
| | | | | | | 113,077 | |
| | | | | | | | |
| | |
Other Revenue — 0.1% | | | | | | | | |
| | |
District of Columbia, Income Tax Secured Series C, Rev., 5.00%, 12/1/2021 | | | 25,000 | | | | 27,202 | |
| | | | | | | | |
| | | | | | | | |
| INVESTMENTS | | PRINCIPAL
AMOUNT ($) | | | VALUE ($) | |
| | | | | | | | |
| | |
Water & Sewer — 0.4% | | | | | | | | |
| | |
District of Columbia, Water and Sewer Authority Series B, Rev., 5.00%, 10/1/2025 | | | 65,000 | | | | 78,008 | |
| | |
District of Columbia, Water and Sewer Authority, Public Utility, Subordinate Lien Series 2012A, Rev., 4.00%, 10/1/2022 | | | 35,000 | | | | 37,748 | |
| | | | | | | | |
| | |
| | | | | | | 115,756 | |
| | | | | | | | |
| | |
Total District of Columbia | | | | | | | 256,035 | |
| | | | | | | | |
| | |
Florida — 5.4% | | | | | | | | |
| |
Certificate of Participation/Lease — 0.7% | | | | | |
| | |
South Florida Water Management District COP, 5.00%, 10/1/2036 | | | 200,000 | | | | 227,114 | |
| | | | | | | | |
| | |
Education — 0.5% | | | | | | | | |
| | |
Escambia County School Board, Sales Tax Rev., 5.00%, 9/1/2027 | | | 25,000 | | | | 29,551 | |
| | |
Florida State Board of Education, Lottery Series 2016B, Rev., 5.00%, 7/1/2023 | | | 40,000 | | | | 45,442 | |
| | |
State of Florida, State Board of Education Lottery Series A, Rev., 5.00%, 7/1/2026 | | | 75,000 | | | | 90,362 | |
| | | | | | | | |
| | |
| | | | | | | 165,355 | |
| | | | | | | | |
| | |
General Obligation — 1.0% | | | | | | | | |
| | |
Reedy Creek Improvement District Series 2016-A, GO, 5.00%, 6/1/2026 | | | 50,000 | | | | 59,944 | |
| | |
School Board of Miami-Dade County (The) GO, 5.00%, 3/15/2034 | | | 65,000 | | | | 73,955 | |
| | |
State of Florida, Public Education Capital Outlay Series B, GO, 5.00%, 6/1/2031 | | | 75,000 | | | | 89,333 | |
| | |
State of Florida, State Board of Education Full Faith and Credit, Public Education Capital Outlay Bonds | | | | | | | | |
| | |
Series B, GO, 5.00%, 6/1/2024 | | | 30,000 | | | | 34,875 | |
| | |
Series C, GO, 4.00%, 6/1/2025 | | | 30,000 | | | | 32,128 | |
| | |
Series B, GO, 5.00%, 6/1/2026 | | | 20,000 | | | | 24,197 | |
| | | | | | | | |
| | |
| | | | | | | 314,432 | |
| | | | | | | | |
| | |
Hospital — 1.0% | | | | | | | | |
| | |
Palm Beach County Health Facilities Authority, ACTS Retirement Life Communities Inc. Obligated Group Rev., 5.00%, 11/15/2032 | | | 290,000 | | | | 321,114 | |
| | | | | | | | |
|
Industrial Development Revenue/Pollution Control Revenue — 0.1% | |
| | |
Florida Department of Environmental Protection Series 2014-A, Rev., 5.00%, 7/1/2020 | | | 35,000 | | | | 36,521 | |
| | | | | | | | |
SEE NOTES TO FINANCIAL STATEMENTS.
| | | | | | |
| | | |
| 78 | | | | J.P. MORGAN EXCHANGE-TRADED FUNDS | | FEBRUARY 28, 2019 |
| | | | | | | | |
| INVESTMENTS | | PRINCIPAL
AMOUNT ($) | | | VALUE ($) | |
Municipal Bonds — continued | | | | | | | | |
| | |
Other Revenue — 1.2% | | | | | | | | |
| | |
City of Orlando, Capital Improvement | | | | | | | | |
| | |
Series D, Rev., 5.00%, 10/1/2022 | | | 75,000 | | | | 83,533 | |
| | |
Series B, Rev., 5.00%, 10/1/2024 | | | 60,000 | | | | 70,076 | |
| | |
County of Hillsborough Rev., 5.00%, 10/1/2024 | | | 40,000 | | | | 46,904 | |
| | |
County of Lee Rev., 5.00%, 10/1/2025 | | | 40,000 | | | | 47,496 | |
| | |
County of Miami-Dade Series A, Rev., 5.00%, 4/1/2036 | | | 25,000 | | | | 28,665 | |
| | |
County of Okaloosa Rev., 5.00%, 10/1/2024 | | | 30,000 | | | | 35,120 | |
| | |
County of Osceola, Sales Tax Series 2016A, Rev., 4.00%, 10/1/2023 | | | 10,000 | | | | 10,859 | |
| | |
Sunshine State Governmental Financing Commission, Miami-Dade County Program Series 2011A, Rev., 5.00%, 9/1/2020 | | | 20,000 | | | | 20,949 | |
| | |
Tampa Sports Authority, Stadium Project Rev., 4.00%, 1/1/2023 | | | 20,000 | | | | 21,698 | |
| | | | | | | | |
| | |
| | | | | | | 365,300 | |
| | | | | | | | |
| | |
Transportation — 0.2% | | | | | | | | |
| | |
Tampa-Hillsborough County Expressway Authority Series B, Rev., 5.00%, 7/1/2031 | | | 40,000 | | | | 47,312 | |
| | | | | | | | |
| | |
Utility — 0.1% | | | | | | | | |
| | |
County of Sarasota, Utilities System Rev., 5.00%, 10/1/2022 | | | 30,000 | | | | 33,414 | |
| | | | | | | | |
| | |
Water & Sewer — 0.6% | | | | | | | | |
| | |
City of Cape Coral, Water and Sewer Rev., 5.00%, 10/1/2022 | | | 25,000 | | | | 27,688 | |
| | |
City of Miami Beach, Water and Sewer Rev., 5.00%, 9/1/2033 | | | 25,000 | | | | 29,026 | |
| | |
East Central Regional Wastewater Treatment Facilities Operation Board, Green Bonds, Bio Solids Project Rev., 5.00%, 10/1/2024 | | | 30,000 | | | | 35,011 | |
| | |
Tampa Bay Water, Regional Water Supply Authority Utility System Series C, Rev., 5.00%, 10/1/2025 | | | 55,000 | | | | 65,835 | |
| | |
Tohopekaliga Water Authority, Utility System Rev., 5.00%, 10/1/2025 | | | 10,000 | | | | 11,915 | |
| | | | | | | | |
| | |
| | | | | | | 169,475 | |
| | | | | | | | |
| | |
Total Florida | | | | | | | 1,680,037 | |
| | | | | | | | |
| | |
Georgia — 0.7% | | | | | | | | |
| | |
General Obligation — 0.3% | | | | | | | | |
| | |
Forsyth County School District GO, 5.00%, 2/1/2020 | | | 20,000 | | | | 20,608 | |
| | | | | | | | |
| INVESTMENTS | | PRINCIPAL
AMOUNT ($) | | | VALUE ($) | |
| | | | | | | | |
| | |
General Obligation — continued | | | | | | | | |
| | |
State of Georgia | | | | | | | | |
| | |
Series D, GO, 5.00%, 2/1/2020 | | | 50,000 | | | | 51,536 | |
| | |
Series 2013C, GO, 5.00%, 10/1/2020 | | | 25,000 | | | | 26,318 | |
| | | | | | | | |
| | |
| | | | | | | 98,462 | |
| | | | | | | | |
| | | | | | | | |
| | |
Hospital — 0.3% | | | | | | | | |
| | |
Clarke County Hospital Authority, Piedmont Healthcare, Inc. Project Series 2016-A, Rev., 5.00%, 7/1/2020 | | | 100,000 | | | | 104,251 | |
| | | | | | | | |
| | |
Water & Sewer — 0.1% | | | | | | | | |
| | |
County of DeKalb, Water and Sewerage Series B, Rev., 5.25%, 10/1/2026 | | | 25,000 | | | | 30,814 | |
| | | | | | | | |
| | |
Total Georgia | | | | | | | 233,527 | |
| | | | | | | | |
| | |
Hawaii — 1.0% | | | | | | | | |
| | |
General Obligation — 0.9% | | | | | | | | |
| | |
City & County of Honolulu Series A, GO, 5.00%, 10/1/2023 | | | 50,000 | | | | 57,150 | |
| | |
City and County of Honolulu, Tax-Exempt Series D, GO, 5.00%, 9/1/2032 | | | 45,000 | | | | 53,159 | |
| | |
State of Hawaii | | | | | | | | |
| | |
Series EP, GO, 5.00%, 8/1/2023 | | | 40,000 | | | | 45,564 | |
| | |
Series FK, GO, 5.00%, 5/1/2033 | | | 100,000 | | | | 117,664 | |
| | | | | | | | |
| | |
| | | | | | | 273,537 | |
| | | | | | | | |
| | |
Prerefunded — 0.0%(d) | | | | | | | | |
| | |
State of Hawaii Series EE, GO, 5.00%, 11/1/2022 (c) | | | 15,000 | | | | 16,744 | |
| | | | | | | | |
| | |
Transportation — 0.1% | | | | | | | | |
| | |
State of Hawaii State Highway Fund Series B, Rev., 5.00%, 1/1/2027 | | | 25,000 | | | | 30,099 | |
| | | | | | | | |
| | |
Total Hawaii | | | | | | | 320,380 | |
| | | | | | | | |
| | |
Illinois — 4.7% | | | | | | | | |
| | |
General Obligation — 4.3% | | | | | | | | |
| | |
Champaign County Community Unit School District No. 4 Champaign, School Building GO, 5.00%, 1/1/2027 | | | 45,000 | | | | 52,092 | |
| | |
City of Decatur GO, 5.00%, 3/1/2027 | | | 255,000 | | | | 292,597 | |
| | |
City of Peoria Series B, GO, 5.00%, 1/1/2027 | | | 230,000 | | | | 266,020 | |
| | |
Cook and DuPage Counties, Village of Elk Grove GO, 5.00%, 1/1/2029 | | | 25,000 | | | | 29,075 | |
| | |
Grundy & Will Counties Community Unit School District No. 1 Coal City GO, 5.00%, 2/1/2027 | | | 225,000 | | | | 256,790 | |
| | |
Kane McHenry Cook and De Kalb Counties Unit School District No. 300, School Bonds GO, 5.00%, 1/1/2024 | | | 30,000 | | | | 33,671 | |
SEE NOTES TO FINANCIAL STATEMENTS.
| | | | | | | | |
| | | |
| FEBRUARY 28, 2019 | | J.P. MORGAN EXCHANGE-TRADED FUNDS | | | | | 79 | |
JPMorgan Municipal ETF
SCHEDULE OF PORTFOLIO INVESTMENTS
AS OF FEBRUARY 28, 2019 (continued)
| | | | | | | | |
| INVESTMENTS | | PRINCIPAL
AMOUNT ($) | | | VALUE ($) | |
Municipal Bonds — continued | | | | | | | | |
| | |
General Obligation — continued | | | | | | | | |
| | |
Kendall and Kane Counties Community Unit School District No. 115, School Bonds Series B, GO, 5.00%, 1/1/2027 | | | 25,000 | | | | 29,204 | |
| | |
Lake and McHenry Counties Community Unit School District No. 118 Wauconda GO, 5.00%, 1/1/2022 | | | 50,000 | | | | 53,902 | |
| | |
McLean & Woodford Counties Community Unit School District No. 5 Normal Series 2017A, GO, 4.00%, 12/1/2023 | | | 80,000 | | | | 86,582 | |
| | |
State of Illinois | | | | | | | | |
| | |
GO, 5.00%, 4/1/2024 | | | 30,000 | | | | 32,217 | |
| | |
Series A, GO, 5.00%, 10/1/2024 | | | 30,000 | | | | 32,292 | |
| | |
Series A, GO, 5.00%, 12/1/2024 | | | 30,000 | | | | 32,308 | |
| | |
Village of Bolingbrook Series A, GO, AGM, 5.00%, 1/1/2033 | | | 125,000 | | | | 141,129 | |
| | |
Will & Kendall Counties Community Consolidated School District 202 Plainfield GO, 4.00%, 1/1/2023 | | | 10,000 | | | | 10,713 | |
| | | | | | | | |
| | |
| | | | | | | 1,348,592 | |
| | | | | | | | |
| | |
Transportation — 0.3% | | | | | | | | |
| | |
Chicago O’Hare International Airport, General Airport, Senior Lien Series 2017B, Rev., 5.00%, 1/1/2034 | | | 40,000 | | | | 45,358 | |
| | |
Illinois State Toll Highway Authority Series D, Rev., 5.00%, 1/1/2024 | | | 25,000 | | | | 28,531 | |
| | | | | | | | |
| | |
| | | | | | | 73,889 | |
| | | | | | | | |
| | |
Water & Sewer — 0.1% | | | | | | | | |
| | |
Illinois Finance Authority, Clean Water Initiative Revolving Fund Rev., 5.00%, 7/1/2032 | | | 35,000 | | | | 40,771 | |
| | | | | | | | |
| | |
Total Illinois | | | | | | | 1,463,252 | |
| | | | | | | | |
| | |
Indiana — 2.1% | | | | | | | | |
| | |
Education — 1.0% | | | | | | | | |
| | |
Adams Central Elementary School Building Corp., Valorem Property Tax First Mortgage Rev., 5.00%, 1/15/2027 | | | 20,000 | | | | 24,075 | |
| | |
Ball State University, Board Trustees University Student Fee Series R, Rev., 5.00%, 7/1/2024 | | | 35,000 | | | | 40,526 | |
| | |
Indiana State University, Housing and Dining System Rev., 5.00%, 4/1/2031 | | | 75,000 | | | | 87,504 | |
| | |
Indiana University | | | | | | | | |
| | |
Series A, Rev., 5.00%, 6/1/2022 | | | 25,000 | | | | 27,675 | |
| | |
Series Y, Rev., 5.00%, 8/1/2028 | | | 25,000 | | | | 30,542 | |
| | |
Perry Township Multi School Building Corp. Rev., 5.00%, 7/15/2025 | | | 35,000 | | | | 41,259 | |
| | | | | | | | |
| INVESTMENTS | | PRINCIPAL
AMOUNT ($) | | | VALUE ($) | |
| | | | | | | | |
| | |
Education — continued | | | | | | | | |
| | |
Warsaw Multi-School Building Corp., Ad Valorem Property Tax Rev., 4.00%, 1/15/2020 | | | 50,000 | | | | 50,987 | |
| | | | | �� | | | |
| | |
| | | | | | | 302,568 | |
| | | | | | | | |
| | |
Housing — 0.9% | | | | | | | | |
| | |
Decatur County Jail Building Corp. Rev., 5.00%, 7/15/2028 | | | 250,000 | | | | 291,230 | |
| | | | | | | | |
| | |
Other Revenue — 0.1% | | | | | | | | |
| | |
Indiana Finance Authority, State Revolving Fund Program Series A, Rev., 5.00%, 2/1/2031 | | | 25,000 | | | | 29,293 | |
| | | | | | | | |
| | |
Transportation — 0.1% | | | | | | | | |
| | |
Indiana Finance Authority, Highway Series C, Rev., 5.00%, 12/1/2025 | | | 25,000 | | | | 29,914 | |
| | | | | | | | |
| | |
Total Indiana | | | | | | | 653,005 | |
| | | | | | | | |
| | |
Iowa — 0.4% | | | | | | | | |
| | |
General Obligation — 0.1% | | | | | | | | |
| | |
City of West Des Moines, Urban Renewal Series B, GO, 5.00%, 6/1/2024 | | | 35,000 | | | | 40,605 | |
| | | | | | | | |
| | |
Other Revenue — 0.1% | | | | | | | | |
| | |
Iowa Finance Authority, State Revolving Fund, Green Bonds Rev., 5.00%, 8/1/2027 | | | 30,000 | | | | 36,869 | |
| | | | | | | | |
| | |
Water & Sewer — 0.2% | | | | | | | | |
| | |
City of Cedar Rapids Series 2018D, Rev., 5.00%, 6/1/2022 | | | 50,000 | | | | 55,151 | |
| | | | | | | | |
| | |
Total Iowa | | | | | | | 132,625 | |
| | | | | | | | |
| | |
Kansas — 0.4% | | | | | | | | |
| | |
General Obligation — 0.2% | | | | | | | | |
| | |
County of Johnson Series A, GO, 5.00%, 9/1/2031 | | | 50,000 | | | | 59,520 | |
| | | | | | | | |
| | |
Water & Sewer — 0.2% | | | | | | | | |
| | |
Johnson County Water District No. 1 Series 2017A, Rev., 5.00%, 1/1/2025 | | | 50,000 | | | | 58,928 | |
| | | | | | | | |
| | |
Total Kansas | | | | | | | 118,448 | |
| | | | | | | | |
| | |
Kentucky — 1.7% | | | | | | | | |
| | |
Hospital — 0.7% | | | | | | | | |
| | |
Louisville/Jefferson County Metropolitan Government, Health System, Norton Healthcare, Inc. Series 2016-A, Rev., 4.00%, 10/1/2036 | | | 200,000 | | | | 201,462 | |
| | | | | | | | |
SEE NOTES TO FINANCIAL STATEMENTS.
| | | | | | |
| | | |
| 80 | | | | J.P. MORGAN EXCHANGE-TRADED FUNDS | | FEBRUARY 28, 2019 |
| | | | | | | | |
| INVESTMENTS | | PRINCIPAL
AMOUNT ($) | | | VALUE ($) | |
Municipal Bonds — continued | | | | | | | | |
|
Industrial Development Revenue/Pollution Control Revenue — 0.6% | |
| | |
Kentucky Economic Development Finance Authority, Baptist Healthcare System Obligated Group Series B, Rev., 5.00%, 8/15/2029 | | | 165,000 | | | | 187,767 | |
| | | | | | | | |
| | |
Water & Sewer — 0.4% | | | | | | | | |
| | |
Louisville and Jefferson County Metropolitan Sewer District, Sewer and Drainage System | | | | | | | | |
| | |
Series B, Rev., 5.00%, 5/15/2019 | | | 100,000 | | | | 100,651 | |
| | |
Series B, Rev., 5.00%, 5/15/2024 | | | 25,000 | | | | 28,927 | |
| | | | | | | | |
| | |
| | | | | | | 129,578 | |
| | | | | | | | |
| | |
Total Kentucky | | | | | | | 518,807 | |
| | | | | | | | |
| | |
Louisiana — 1.7% | | | | | | | | |
| | |
General Obligation — 0.4% | | | | | | | | |
| | |
St Tammany Parish Wide School District No. 12, School Building Series 2012A, GO, 4.50%, 3/1/2024 | | | 70,000 | | | | 78,560 | |
| | |
State of Louisiana Series 2016-B, GO, 4.00%, 8/1/2026 | | | 30,000 | | | | 33,978 | |
| | | | | | | | |
| | |
| | | | | | | 112,538 | |
| | | | | | | | |
|
Industrial Development Revenue/Pollution Control Revenue — 0.1% | |
| | |
Louisiana Local Government Environmental Facilities and Community Development Authority, Bossier City Public Improvement Rev., 5.00%, 11/1/2024 | | | 30,000 | | | | 34,812 | |
| | | | | | | | |
| | |
Other Revenue — 0.9% | | | | | | | | |
| | |
Louisiana Local Government Environmental Facilities and Community Development Authority Rev., 5.00%, 12/1/2030 | | | 250,000 | | | | 296,227 | |
| | | | | | | | |
| | |
Prerefunded — 0.3% | | | | | | | | |
| | |
State of Louisiana Gasoline and Fuels Tax | | | | | | | | |
| | |
Series B, Rev., 5.00%, 5/1/2020 (c) | | | 25,000 | | | | 25,952 | |
| | |
Series A-1, Rev., 5.00%, 5/1/2022 (c) | | | 55,000 | | | | 60,626 | |
| | | | | | | | |
| | |
| | | | | | | 86,578 | |
| | | | | | | | |
| | |
Total Louisiana | | | | | | | 530,155 | |
| | | | | | | | |
| | |
Maine — 0.4% | | | | | | | | |
| | |
General Obligation — 0.1% | | | | | | | | |
| | |
Regional School Unit No. 21 GO, 5.00%, 11/1/2025 | | | 30,000 | | | | 35,709 | |
| | | | | | | | |
| | |
Other Revenue — 0.3% | | | | | | | | |
| | |
Maine Municipal Bond Bank Series C, Rev., 5.00%, 11/1/2024 | | | 75,000 | | | | 87,316 | |
| | | | | | | | |
| | |
Total Maine | | | | | | | 123,025 | |
| | | | | | | | |
| | | | | | | | |
| INVESTMENTS | | PRINCIPAL
AMOUNT ($) | | | VALUE ($) | |
| | | | | | | | |
| | |
Maryland — 1.8% | | | | | | | | |
| | |
General Obligation — 0.7% | | | | | | | | |
| | |
County of Charles, Public Improvement GO, 5.00%, 3/1/2021 | | | 25,000 | | | | 26,648 | |
| | |
County of Spotsylvania, Commissioners of St. Mary’s, Public Improvement GO, 4.00%, 7/15/2027 | | | 70,000 | | | | 81,092 | |
| | |
State of Maryland, State and Local Facilities Loan of 2017 | | | | | | | | |
| | |
Series C, GO, 5.00%, 8/1/2024 | | | 50,000 | | | | 58,309 | |
| | |
Series A, GO, 5.00%, 8/1/2025 | | | 45,000 | | | | 53,492 | |
| | | | | | | | |
| | |
| | | | | | | 219,541 | |
| | | | | | | | |
| | |
Hospital — 0.7% | | | | | | | | |
| | |
Maryland Health and Higher Educational Facilities Authority, Broadmead Issue Series A, Rev., 4.00%, 7/1/2035 | | | 225,000 | | | | 221,463 | |
| | | | | | | | |
| | |
Transportation — 0.4% | | | | | | | | |
| | |
State of Maryland Department of Transportation Rev., 5.00%, 9/1/2026 | | | 100,000 | | | | 121,734 | |
| | | | | | | | |
| | |
Total Maryland | | | | | | | 562,738 | |
| | | | | | | | |
| | |
Massachusetts — 0.7% | | | | | | | | |
| | |
Education — 0.2% | | | | | | | | |
| | |
Massachusetts State College Building Authority Series D, Rev., 5.00%, 5/1/2027 | | | 45,000 | | | | 55,113 | |
| | | | | | | | |
| | |
General Obligation — 0.4% | | | | | | | | |
| | |
City of Boston Series 2017A, GO, 5.00%, 4/1/2025 | | | 10,000 | | | | 11,905 | |
| | |
Commonwealth of Massachusetts | | | | | | | | |
| | |
Series B, GO, 5.00%, 7/1/2023 | | | 25,000 | | | | 28,424 | |
| | |
Series C, GO, 5.00%, 10/1/2026 | | | 25,000 | | | | 30,321 | |
| | |
Town of Hopkinton GO, 5.00%, 11/15/2024 | | | 30,000 | | | | 35,451 | |
| | | | | | | | |
| | |
| | | | | | | 106,101 | |
| | | | | | | | |
| | |
Hospital — 0.0%(d) | | | | | | | | |
| | |
Massachusetts Health and Educational Facilities Authority, Tufts University Series M, Rev., 5.25%, 2/15/2021 | | | 10,000 | | | | 10,701 | |
| | | | | | | | |
| | |
Other Revenue — 0.1% | | | | | | | | |
| | |
Massachusetts Bay Transportation Authority, Senior Sales Tax Series A, Rev., 5.00%, 7/1/2022 | | | 20,000 | | | | 22,200 | |
| | | | | | | | |
| | |
Water & Sewer — 0.0%(d) | | | | | | | | |
| | |
Springfield Water & Sewer Commission Series C, Rev., 5.00%, 7/15/2023 | | | 10,000 | | | | 11,397 | |
| | | | | | | | |
| | |
Total Massachusetts | | | | | | | 205,512 | |
| | | | | | | | |
SEE NOTES TO FINANCIAL STATEMENTS.
| | | | | | | | |
| | | |
| FEBRUARY 28, 2019 | | J.P. MORGAN EXCHANGE-TRADED FUNDS | | | | | 81 | |
JPMorgan Municipal ETF
SCHEDULE OF PORTFOLIO INVESTMENTS
AS OF FEBRUARY 28, 2019 (continued)
| | | | | | | | |
| INVESTMENTS | | PRINCIPAL
AMOUNT ($) | | | VALUE ($) | |
Municipal Bonds — continued | | | | | | | | |
| | |
Michigan — 3.1% | | | | | | | | |
| | |
Education — 1.9% | | | | | | | | |
| | |
Eastern Michigan University Series 2017A, Rev., 5.00%, 3/1/2026 | | | 500,000 | | | | 589,055 | |
| | | | | | | | |
| | |
General Obligation — 1.0% | | | | | | | | |
| | |
Berrien Springs Public Schools, School Building and Site GO, Q-SBLF, 5.00%, 5/1/2030 | | | 250,000 | | | | 302,297 | |
| | |
Novi Community School District GO, Q-SBLF, 5.00%, 5/1/2024 | | | 20,000 | | | | 23,008 | |
| | | | | | | | |
| | |
| | | | | | | 325,305 | |
| | | | | | | | |
| | |
Hospital — 0.1% | | | | | | | | |
| | |
Michigan State Hospital Finance Authority, Trinity Health Credit Group Series C, Rev., 5.00%, 12/1/2025 | | | 25,000 | | | | 29,572 | |
| | | | | | | | |
Transportation — 0.1% | | | | | | | | |
| | |
State of Michigan Trunk Line Rev., 5.00%, 11/15/2021 | | | 25,000 | | | | 27,183 | |
| | | | | | | | |
| | |
Total Michigan | | | | | | | 971,115 | |
| | | | | | | | |
| | |
Minnesota — 1.4% | | | | | | | | |
| | |
Education — 0.3% | | | | | | | | |
| | |
University of Minnesota, Board of Regents Series B, Rev., 5.00%, 12/1/2025 | | | 65,000 | | | | 77,919 | |
| | | | | | | | |
| | |
General Obligation — 0.3% | | | | | | | | |
| | |
Alexandria Lake Area Sanitation District, Sanitary Sewer Board Series 2015A, GO, 5.00%, 2/1/2022 | | | 30,000 | | | | 32,775 | |
| | |
City of Hopkins Series 2017B, GO, 4.00%, 2/1/2025 | | | 20,000 | | | | 22,487 | |
| | |
City of Maple Grove, Improvement Series 2013A, GO, 4.00%, 2/1/2022 | | | 20,000 | | | | 21,349 | |
| | |
St Louis Park Independent School District No. 283 Series A, GO, 5.00%, 2/1/2030 | | | 25,000 | | | | 29,655 | |
| | | | | | | | |
| | |
| | | | | | | 106,266 | |
| | | | | | | | |
| | |
Housing — 0.8% | | | | | | | | |
| | |
City of Apple Valley, Minnesota Senior Housing, Orchard Path Project Rev., 4.25%, 9/1/2038 | | | 250,000 | | | | 248,035 | |
| | | | | | | | |
| | |
Total Minnesota | | | | | | | 432,220 | |
| | | | | | | | |
| | |
Mississippi — 2.1% | | | | | | | | |
| | |
Education — 0.2% | | | | | | | | |
| | |
Mississippi Development Bank Special Obligation, Hinds County School District Project Rev., 4.00%, 3/1/2031 | | | 25,000 | | | | 27,037 | |
| | | | | | | | |
| INVESTMENTS | | PRINCIPAL
AMOUNT ($) | | | VALUE ($) | |
| | | | | | | | |
| | |
Education — continued | | | | | | | | |
| | |
Mississippi State University Educational Building Corp., New Facilities and Refinancing Project Rev., 5.00%, 8/1/2025 | | | 35,000 | | | | 41,406 | |
| | | | | | | | |
| | |
| | | | | | | 68,443 | |
| | | | | | | | |
| | |
General Obligation — 0.1% | | | | | | | | |
| | |
State of Mississippi Series B, GO, 5.00%, 12/1/2025 | | | 20,000 | | | | 23,877 | |
| | | | | | | | |
|
Industrial Development Revenue/Pollution Control Revenue — 1.3% | |
| | |
Mississippi Business Finance Corp., Gulf Opportunity Zone Industrial Development, Chevron USA, Inc. Project Series D, Rev., VRDO, 1.68%, 3/1/2019(b) | | | 400,000 | | | | 400,000 | |
| | | | | | | | |
| | |
Utility — 0.5% | | | | | | | | |
| | |
West Rankin Utility Authority Rev., AGM, 5.00%, 1/1/2029 | | | 135,000 | | | | 154,796 | |
| | | | | | | | |
| | |
Total Mississippi | | | | | | | 647,116 | |
| | | | | | | | |
| | |
Missouri — 2.3% | | | | | | | | |
| | |
Hospital — 1.8% | | | | | | | | |
| | |
Health and Educational Facilities Authority of the State of Missouri, City Art Institute Rev., 5.00%, 9/1/2030 | | | 200,000 | | | | 231,684 | |
| | |
Health and Educational Facilities Authority of the State of Missouri, St. Luke’s Episcopal-Presbyterian Hospitals Series 2015-B, Rev., 5.00%, 12/1/2026 | | | 300,000 | | | | 345,282 | |
| | | | | | | | |
| | |
| | | | | | | 576,966 | |
| | | | | | | | |
| | |
Transportation — 0.1% | | | | | | | | |
| | |
Bi-State Development Agency, Metropolitan District, St. Clair County Metrolink Project Rev., AGM, 5.25%, 7/1/2024 | | | 20,000 | | | | 23,486 | |
| | | | | | | | |
| | |
Utility — 0.1% | | | | | | | | |
| | |
County of Jackson, Harry S. Truman Sports Complex Project Rev., 5.00%, 12/1/2025 | | | 25,000 | | | | 28,947 | |
| | | | | | | | |
| | |
Water & Sewer — 0.3% | | | | | | | | |
| | |
City of Kansas, Sanitary Sewer System Series B, Rev., 5.00%, 1/1/2033 | | | 25,000 | | | | 29,608 | |
| | |
Metropolitan St. Louis Sewer District Wastewater System Improvement Series A, Rev., 5.00%, 5/1/2027 | | | 45,000 | | | | 55,125 | |
| | | | | | | | |
| | |
| | | | | | | 84,733 | |
| | | | | | | | |
| | |
Total Missouri | | | | | | | 714,132 | |
| | | | | | | | |
| | |
Montana — 0.4% | | | | | | | | |
| | |
General Obligation — 0.4% | | | | | | | | |
| | |
County of Missoula Series A, GO, 5.00%, 7/1/2030 | | | 120,000 | | | | 141,516 | |
| | | | | | | | |
SEE NOTES TO FINANCIAL STATEMENTS.
| | | | | | |
| | | |
| 82 | | | | J.P. MORGAN EXCHANGE-TRADED FUNDS | | FEBRUARY 28, 2019 |
| | | | | | | | |
| INVESTMENTS | | PRINCIPAL
AMOUNT ($) | | | VALUE ($) | |
Municipal Bonds — continued | | | | | | | | |
| | |
Nebraska — 2.9% | | | | | | | | |
| | |
Utility — 2.4% | | | | | | | | |
| | |
Central Plains Energy Project, Gas Project No. 3 Series 2017A, Rev., 5.00%, 9/1/2030 | | | 320,000 | | | | 370,227 | |
| | |
City of Lincoln, Electric System | | | | | | | | |
| | |
Rev., 5.00%, 9/1/2026 | | | 80,000 | | | | 96,962 | |
| | |
Rev., 5.00%, 9/1/2028 | | | 50,000 | | | | 60,113 | |
| | |
Omaha Public Power District, Electric System | | | | | | | | |
| | |
Series B, Rev., 5.00%, 2/1/2025 | | | 120,000 | | | | 139,867 | |
| | |
Series A, Rev., 5.00%, 2/1/2026 | | | 40,000 | | | | 48,025 | |
| | |
Series A, Rev., 5.00%, 2/1/2027 | | | 30,000 | | | | 35,678 | |
| | | | | | | | |
| | |
| | | | | | | 750,872 | |
| | | | | | | | |
| | |
Water & Sewer — 0.5% | | | | | | | | |
| | |
City of Omaha Rev., 4.00%, 11/15/2022 | | | 100,000 | | | | 108,360 | |
| | |
City of Omaha, Sanitary Sewerage System Rev., 5.00%, 4/1/2027 | | | 50,000 | | | | 59,642 | |
| | | | | | | | |
| | |
| | | | | | | 168,002 | |
| | | | | | | | |
| | |
Total Nebraska | | | | | | | 918,874 | |
| | | | | | | | |
| | |
Nevada — 0.9% | | | | | | | | |
| | |
General Obligation — 0.6% | | | | | | | | |
| | |
Clark County School District, Limited Tax | | | | | | | | |
| | |
Series A, GO, 5.00%, 6/15/2032 | | | 95,000 | | | | 110,281 | |
| | |
Series A, GO, 4.00%, 6/15/2035 | | | 90,000 | | | | 94,725 | |
| | | | | | | | |
| | |
| | | | | | | 205,006 | |
| | | | | | | | |
| | |
Transportation — 0.1% | | | | | | | | |
| | |
County of Clark Rev., 5.00%, 7/1/2028 | | | 25,000 | | | | 29,979 | |
| | | | | | | | |
| | |
Water & Sewer — 0.2% | | | | | | | | |
| | |
Truckee Meadows Water Authority Rev., 5.00%, 7/1/2029 | | | 50,000 | | | | 59,831 | |
| | | | | | | | |
| | |
Total Nevada | | | | | | | 294,816 | |
| | | | | | | | |
| | |
New Hampshire — 0.1% | | | | | | | | |
| | |
General Obligation — 0.1% | | | | | | | | |
| | |
City of Nashua GO, 4.00%, 7/15/2022 | | | 25,000 | | | | 26,920 | |
| | | | | | | | |
| | |
New Jersey — 2.7% | | | | | | | | |
| | |
Education — 0.6% | | | | | | | | |
| | |
New Jersey Economic Development Authority, School Facilities Construction | | | | | | | | |
| | |
Series NN, Rev., 5.00%, 3/1/2022 | | | 60,000 | | | | 64,471 | |
| | |
Series II, Rev., 5.00%, 3/1/2027 | | | 115,000 | | | | 122,243 | |
| | | | | | | | |
| | |
| | | | | | | 186,714 | |
| | | | | | | | |
| | |
General Obligation — 0.1% | | | | | | | | |
| | |
City of North Wildwood GO, 5.00%, 8/1/2022 | | | 10,000 | | | | 11,068 | |
| | | | | | | | |
| | | | | | | | |
| INVESTMENTS | | PRINCIPAL
AMOUNT ($) | | | VALUE ($) | |
| | | | | | | | |
| | |
Other Revenue — 1.0% | | | | | | | | |
| | |
Tobacco Settlement Financing Corp. Series A, Rev., 5.00%, 6/1/2027 | | | 265,000 | | | | 308,192 | |
| | | | | | | | |
| | |
Prerefunded — 0.2% | | | | | | | | |
| | |
New Jersey Turnpike Authority Series A, Rev., 5.00%, 1/1/2022 (c) | | | 65,000 | | | | 71,026 | |
| | | | | | | | |
| | |
Transportation — 0.8% | | | | | | | | |
| | |
New Jersey Transportation Trust Fund Authority, Transportation System Series A, Rev., 4.00%, 12/15/2031 | | | 250,000 | | | | 252,640 | |
| | | | | | | | |
| | |
Total New Jersey | | | | | | | 829,640 | |
| | | | | | | | |
| | |
New Mexico — 2.4% | | | | | | | | |
| | |
Education — 0.1% | | | | | | | | |
| | |
University of New Mexico (The), Board of Regents, Subordinate Lien System Rev., 5.00%, 6/1/2029 | | | 20,000 | | | | 23,712 | |
| | | | | | | | |
| | |
General Obligation — 0.5% | | | | | | | | |
| | |
City of Albuquerque, General Purpose Series 2016A, GO, 5.00%, 7/1/2023 | | | 75,000 | | | | 85,223 | |
| | |
Santa Fe Community College District Series A, GO, 5.00%, 8/1/2023 | | | 50,000 | | | | 56,590 | |
| | |
State of New Mexico Series B, GO, 5.00%, 3/1/2025 | | | 25,000 | | | | 29,477 | |
| | | | | | | | |
| | |
| | | | | | | 171,290 | |
| | | | | | | | |
| | |
Other Revenue — 1.3% | | | | | | | | |
| | |
City of Albuquerque, Gross Receipts Series 2015A, Rev., 5.00%, 7/1/2026 | | | 235,000 | | | | 277,648 | |
| | |
New Mexico Finance Authority, Senior Lien Public Project Revolving Fund Series 2016C, Rev., 5.00%, 6/1/2022 | | | 30,000 | | | | 33,079 | |
| | |
State of New Mexico, Severance Tax Permanent Fund Series B, Rev., 4.00%, 7/1/2021 | | | 80,000 | | | | 84,201 | |
| | | | | | | | |
| | |
| | | | | | | 394,928 | |
| | | | | | | | |
| | |
Transportation — 0.4% | | | | | | | | |
| | |
New Mexico Finance Authority, State Transportation, Subordinate Lien Series A, Rev., 5.00%, 6/15/2027 | | | 100,000 | | | | 122,171 | |
| | | | | | | | |
| | |
Utility — 0.1% | | | | | | | | |
| | |
New Mexico Finance Authority, Senior Lien Public Project Revolving Fund Series E, Rev., 5.00%, 6/1/2024 | | | 25,000 | | | | 28,940 | |
| | | | | | | | |
| | |
Total New Mexico | | | | | | | 741,041 | |
| | | | | | | | |
SEE NOTES TO FINANCIAL STATEMENTS.
| | | | | | | | |
| | | |
| FEBRUARY 28, 2019 | | J.P. MORGAN EXCHANGE-TRADED FUNDS | | | | | 83 | |
JPMorgan Municipal ETF
SCHEDULE OF PORTFOLIO INVESTMENTS
AS OF FEBRUARY 28, 2019 (continued)
| | | | | | | | |
| INVESTMENTS | | PRINCIPAL
AMOUNT ($) | | | VALUE ($) | |
Municipal Bonds — continued | | | | | | | | |
| | |
New York — 3.5% | | | | | | | | |
| | |
Education — 1.1% | | | | | | | | |
| | |
Monroe County IDA, School Facility, Rochester School Modernization Project Rev., 5.00%, 5/1/2030 | | | 80,000 | | | | 93,304 | |
| | |
New York State Dormitory Authority Series A, Rev., 5.00%, 7/1/2034 | | | 20,000 | | | | 23,517 | |
| | |
New York State Dormitory Authority, Columbia University Series B, Rev., 5.00%, 10/1/2038 | | | 25,000 | | | | 29,502 | |
| | |
Orange County Funding Corp., Mount Saint Mary College Project Series 2012B, Rev., 4.00%, 7/1/2023 | | | 200,000 | | | | 208,168 | |
| | | | | | | | |
| | |
| | | | | | | 354,491 | |
| | | | | | | | |
| | |
General Obligation — 0.6% | | | | | | | | |
| | |
City of New York, Fiscal Year 2012 Series I, GO, 5.00%, 8/1/2022 | | | 45,000 | | | | 49,937 | |
| | |
City of New York, Fiscal Year 2013 | | | | | | | | |
| | |
Series I, GO, 5.00%, 8/1/2023 | | | 25,000 | | | | 28,442 | |
| | |
Series J, GO, 5.00%, 8/1/2023 | | | 35,000 | | | | 39,818 | |
| | |
City of New York, Fiscal Year 2017 Series C, GO, 4.00%, 8/1/2022 | | | 10,000 | | | | 10,765 | |
| | |
County of Onondaga GO, 5.00%, 3/15/2026 | | | 20,000 | | | | 23,087 | |
| | |
County of Orange, Various Purpose Series A, GO, 4.00%, 3/15/2024 | | | 20,000 | | | | 22,381 | |
| | | | | | | | |
| | |
| | | | | | | 174,430 | |
| | | | | | | | |
| | |
Housing — 0.2% | | | | | | | | |
| | |
New York City Transitional Finance Authority Building Aid, Fiscal Year 2019Series S-2A, Rev., 5.00%, 7/15/2025 | | | 50,000 | | | | 59,727 | |
| | | | | | | | |
| | |
Other Revenue — 1.5% | | | | | | | | |
| | |
New York City Transitional Finance Authority, Future Tax Secured, Fiscal Year 2015 Series C, Rev., 5.00%, 11/1/2022 | | | 25,000 | | | | 27,973 | |
| | |
New York City Transitional Finance Authority, Future Tax Secured, Fiscal Year 2018 Series 1, Rev., 5.00%, 11/1/2026 | | | 25,000 | | | | 30,362 | |
| | |
New York City Transitional Finance Authority, Future Tax Secured, Fiscal Year 2019 Subseries B-5, Rev., VRDO, LIQ: U.S. Bank NA, 1.68%, 3/1/2019 (b) | | | 200,000 | | | | 200,000 | |
| | |
New York Convention Center Development Corp., Hotel Unit fee Secured Rev., 5.00%, 11/15/2025 | | | 25,000 | | | | 29,749 | |
| | |
New York State Urban Development Corp., State Personal Income Tax, General Purpose Series 2017-A, Rev., 5.00%, 3/15/2028 | | | 150,000 | | | | 180,830 | |
| | | | | | | | |
| | |
| | | | | | | 468,914 | |
| | | | | | | | |
| | | | | | | | |
| INVESTMENTS | | PRINCIPAL
AMOUNT ($) | | | VALUE ($) | |
| | | | | | | | |
| | |
Water & Sewer — 0.1% | | | | | | | | |
| | |
Erie County Water Authority Rev., 5.00%, 12/1/2027 | | | 20,000 | | | | 24,202 | |
| | | | | | | | |
| | |
Total New York | | | | | | | 1,081,764 | |
| | | | | | | | |
| | |
North Carolina — 0.6% | | | | | | | | |
| | |
General Obligation — 0.1% | | | | | | | | |
| | |
County of Davidson GO, 5.00%, 6/1/2027 | | | 35,000 | | | | 42,919 | |
| | | | | | | | |
| | |
Other Revenue — 0.5% | | | | | | | | |
| | |
County of Wake Series A, Rev., 5.00%, 12/1/2027 | | | 30,000 | | | | 36,130 | |
| | |
County of Wayne Rev., 5.00%, 6/1/2024 | | | 25,000 | | | | 28,975 | |
| | |
State of North Carolina Rev., 5.00%, 3/1/2021 | | | 25,000 | | | | 26,601 | |
| | |
State of North Carolina, Limited Obligation | | | | | | | | |
| | |
Series C, Rev., 5.00%, 5/1/2024 | | | 25,000 | | | | 29,021 | |
| | |
Series B, Rev., 5.00%, 5/1/2028 | | | 20,000 | | | | 24,176 | |
| | | | | | | | |
| | |
| | | | | | | 144,903 | |
| | | | | | | | |
| | |
Total North Carolina | | | | | | | 187,822 | |
| | | | | | | | |
| | |
North Dakota — 0.1% | | | | | | | | |
| | |
Other Revenue — 0.1% | | | | | | | | |
| | |
North Dakota Public Finance Authority, State Revolving Fund Program Series 2011A, Rev., 5.00%, 10/1/2021 | | | 25,000 | | | | 27,119 | |
| | | | | | | | |
| | |
Ohio — 4.4% | | | | | | | | |
| | |
Education — 1.9% | | | | | | | | |
| | |
Bowling Green State University | | | | | | | | |
| | |
Series 2016A, Rev., 5.00%, 6/1/2024 | | | 25,000 | | | | 28,828 | |
| | |
Series 2016A, Rev., 5.00%, 6/1/2035 | | | 175,000 | | | | 197,498 | |
| | |
Ohio Higher Educational Facility Commission, Denison University Series A, Rev., 5.00%, 11/1/2025 | | | 75,000 | | | | 89,221 | |
| | |
Ohio Higher Educational Facility Commission, University of Findlay Project Rev., 5.00%, 3/1/2034 (e) | | | 260,000 | | | | 281,583 | |
| | | | | | | | |
| | |
| | | | | | | 597,130 | |
| | | | | | | | |
| | |
General Obligation — 0.7% | | | | | | | | |
| | |
City of Reynoldsburg, Limited Tax GO, 5.00%, 12/1/2026 | | | 15,000 | | | | 18,179 | |
| | |
State of Ohio, Higher Education Series B, GO, 5.00%, 8/1/2022 | | | 55,000 | | | | 61,022 | |
| | |
State of Ohio, Highway Capital Improvements Bonds, Full Faith and Credit/Highway User Receipts Series R, GO, 5.00%, 5/1/2021 | | | 60,000 | | | | 64,238 | |
| | |
State of Ohio, Infrastructure Improvement Bonds Series A, GO, 5.00%, 9/1/2028 | | | 25,000 | | | | 31,074 | |
SEE NOTES TO FINANCIAL STATEMENTS.
| | | | | | |
| | | |
| 84 | | | | J.P. MORGAN EXCHANGE-TRADED FUNDS | | FEBRUARY 28, 2019 |
| | | | | | | | |
| INVESTMENTS | | PRINCIPAL
AMOUNT ($) | | | VALUE ($) | |
Municipal Bonds — continued | | | | | | | | |
| | |
General Obligation — continued | | | | | | | | |
| | |
State of Ohio, Natural Resources Series V, GO, 5.00%, 10/1/2027 | | | 35,000 | | | | 42,916 | |
| | | | | | | | |
| | |
| | | | | | | 217,429 | |
| | | | | | | | |
| | |
Hospital — 0.1% | | | | | | | | |
| | |
State of Ohio, Cleveland Clinic Health System Obligated Group Series 2017A, Rev., 5.00%, 1/1/2028 | | | 25,000 | | | | 30,544 | |
| | | | | | | | |
|
Industrial Development Revenue/Pollution Control Revenue — 0.2% | |
| | |
Ohio Water Development Authority Water Pollution Control Loan Fund Series A, Rev., 5.00%, 12/1/2026 | | | 45,000 | | | | 54,864 | |
| | | | | | | | |
| | |
Other Revenue — 0.1% | | | | | | | | |
| | |
State of Ohio, Capital Facilities Lease-Appropriation Series 2018-A, Rev., 5.00%, 6/1/2025 | | | 25,000 | | | | 29,477 | |
| | | | | | | | |
| | |
Prerefunded — 0.7% | | | | | | | | |
| | |
South-Western City School District, School Facilities Construction and Improvement Bonds GO, 5.00%, 6/1/2022 (c) | | | 160,000 | | | | 176,712 | |
| | |
State of Ohio, Highway Capital Improvements Bonds, Full Faith and Credit/Highway User Receipts Series R, GO, 5.00%, 5/1/2024 (c) | | | 25,000 | | | | 29,013 | |
| | | | | | | | |
| | |
| | | | | | | 205,725 | |
| | | | | | | | |
| | |
Transportation — 0.5% | | | | | | | | |
| | |
Ohio Turnpike and Infrastructure Commission Series A, Rev., 5.00%, 2/15/2027 | | | 135,000 | | | | 162,462 | |
| | | | | | | | |
| | |
Utility — 0.1% | | | | | | | | |
| | |
American Municipal Power, Inc., Greenup Hydro-Electric Project Series 2016A, Rev., 5.00%, 2/15/2030 | | | 25,000 | | | | 28,878 | |
| | | | | | | | |
| | |
Water & Sewer — 0.1% | | | | | | | | |
| | |
Ohio Water Development Authority, Fresh Water Series B, Rev., 5.00%, 6/1/2026 | | | 30,000 | | | | 36,272 | |
| | | | | | | | |
| | |
Total Ohio | | | | | | | 1,362,781 | |
| | | | | | | | |
| | |
Oklahoma — 0.7% | | | | | | | | |
| | |
Hospital — 0.2% | | | | | | | | |
| | |
Oklahoma Development Finance Authority, St. John Health System Rev., 5.00%, 2/15/2020 (c) | | | 55,000 | | | | 56,697 | |
| | | | | | | | |
| | |
Other Revenue — 0.0%(d) | | | | | | | | |
| | |
The Edmond Public Works Authority, Sales Tax and Utility System Rev., 4.00%, 7/1/2021 | | | 10,000 | | | | 10,485 | |
| | | | | | | | |
| | | | | | | | |
| INVESTMENTS | | PRINCIPAL
AMOUNT ($) | | | VALUE ($) | |
| | | | | | | | |
| | |
Transportation — 0.4% | | | | | | | | |
| | |
Oklahoma Capitol Improvement Authority, State Highway Rev., 5.00%, 7/1/2024 | | | 100,000 | | | | 115,584 | |
| | | | | | | | |
| | |
Water & Sewer — 0.1% | | | | | | | | |
| | |
Oklahoma Water Resources Board, Clean Water Program Rev., 5.00%, 4/1/2023 | | | 35,000 | | | | 39,549 | |
| | | | | | | | |
| | |
Total Oklahoma | | | | | | | 222,315 | |
| | | | | | | | |
| | |
Oregon — 1.3% | | | | | | | | |
| | |
General Obligation — 1.0% | | | | | | | | |
| | |
City of Portland Series A, GO, 5.00%, 4/1/2025 | | | 30,000 | | | | 35,549 | |
| | |
State of Oregon Series A, GO, 5.00%, 5/1/2023 | | | 50,000 | | | | 56,599 | |
| | |
State of Oregon, Article XI-Q State Projects Series A, GO, 5.00%, 5/1/2030 | | | 155,000 | | | | 185,470 | |
| | |
Washington County School District No. 1 West Union, Hillsborough School District GO, 5.00%, 6/15/2028 | | | 25,000 | | | | 30,253 | |
| | | | | | | | |
| | |
| | | | | | | 307,871 | |
| | | | | | | | |
| | |
Transportation — 0.3% | | | | | | | | |
| | |
State of Oregon, Department of Transportation User Tax Series A, Rev., 5.00%, 11/15/2025 | | | 30,000 | | | | 35,947 | |
| | |
Tri-County Metropolitan Transportation District of Oregon Series A, Rev., 5.00%, 9/1/2030 | | | 45,000 | | | | 53,924 | |
| | | | | | | | |
| | |
| | | | | | | 89,871 | |
| | | | | | | | |
| | |
Total Oregon | | | | | | | 397,742 | |
| | | | | | | | |
| | |
Pennsylvania — 5.2% | | | | | | | | |
| | |
General Obligation — 0.9% | | | | | | | | |
| | |
Abington School District GO, 5.00%, 10/1/2020 | | | 20,000 | | | | 21,009 | |
| | |
Aliquippa School District GO, 3.88%, 12/1/2037 | | | 200,000 | | | | 203,496 | |
| | |
Township of Upper St Clair Series A, GO, 4.00%, 6/1/2025 | | | 15,000 | | | | 16,884 | |
| | |
Upper Merion Area School District GO, 5.00%, 1/15/2034 | | | 20,000 | | | | 22,996 | |
| | | | | | | | |
| | |
| | | | | | | 264,385 | |
| | | | | | | | |
| | |
Hospital — 2.3% | | | | | | | | |
| | |
Berks County Industrial Development Authority, Healthcare Facilities, The Highlands at Wyomissing Series 2017A, Rev., 5.00%, 5/15/2037 | | | 250,000 | | | | 264,415 | |
| | |
County of Lehigh, Health Network Hospital Series A, Rev., 4.00%, 7/1/2035 | | | 200,000 | | | | 205,758 | |
SEE NOTES TO FINANCIAL STATEMENTS.
| | | | | | | | |
| | | |
| FEBRUARY 28, 2019 | | J.P. MORGAN EXCHANGE-TRADED FUNDS | | | | | 85 | |
JPMorgan Municipal ETF
SCHEDULE OF PORTFOLIO INVESTMENTS
AS OF FEBRUARY 28, 2019 (continued)
| | | | | | | | |
| INVESTMENTS | | PRINCIPAL
AMOUNT ($) | | | VALUE ($) | |
Municipal Bonds — continued | | | | | | | | |
| | |
Hospital — continued | | | | | | | | |
| | |
Montgomery County Higher Education and Health Authority, Thomas Jefferson University Series 2018A, Rev., 4.00%, 9/1/2038 | | | 225,000 | | | | 230,873 | |
| | | | | | | | |
| | |
| | | | | | | 701,046 | |
| | | | | | | | |
| | |
Other Revenue — 1.1% | | | | | | | | |
| | |
Commonwealth Financing Authority, Tobacco Master Settlement Payment Rev., 5.00%, 6/1/2035 | | | 250,000 | | | | 281,102 | |
| | |
Monroeville Finance Authority, UPMC Obligated Group Rev., 5.00%, 2/15/2022 | | | 60,000 | | | | 65,454 | |
| | | | | | | | |
| | |
| | | | | | | 346,556 | |
| | | | | | | | |
| | |
Prerefunded — 0.3% | | | | | | | | |
| | |
Pennsylvania Turnpike Commission Series B, Rev., 5.25%, 12/1/2021 (c) | | | 95,000 | | | | 104,096 | |
| | | | | | | | |
| | |
Transportation — 0.6% | | | | | | | | |
| | |
Pennsylvania Turnpike Commission | | | | | | | | |
| | |
Series A-1, Rev., 5.00%, 12/1/2029 | | | 105,000 | | | | 123,513 | |
| | |
Series A-1, Rev., 5.00%, 12/1/2031 | | | 60,000 | | | | 69,653 | |
| | | | | | | | |
| | |
| | | | | | | 193,166 | |
| | | | | | | | |
| | |
Total Pennsylvania | | | | | | | 1,609,249 | |
| | | | | | | | |
| | |
Rhode Island — 0.3% | | | | | | | | |
| | |
General Obligation — 0.3% | | | | | | | | |
| | |
State of Rhode Island and Providence Plantations, Consolidated Capital Development Loan of 2018 Series A, GO, 5.00%, 4/1/2029 | | | 75,000 | | | | 92,191 | |
| | | | | | | | |
| | |
South Carolina — 2.3% | | | | | | | | |
| | |
General Obligation — 0.2% | | | | | | | | |
| | |
Richland County School District No. 1 GO, SCSDE, 4.00%, 3/1/2019 | | | 50,000 | | | | 50,010 | |
| | | | | | | | |
|
Industrial Development Revenue/Pollution Control Revenue — 0.8% | |
| | |
South Carolina Jobs-Economic Development Authority, South Carolina Episcopal Home at Still Homes Series 2018A, Rev., 5.00%, 4/1/2033 | | | 250,000 | | | | 261,663 | |
| | | | | | | | |
| | |
Other Revenue — 0.1% | | | | | | | | |
| | |
South Carolina Public Service Authority Series A, Rev., 5.00%, 12/1/2032 | | | 25,000 | | | | 27,963 | |
| | | | | | | | |
| | |
Transportation — 1.0% | | | | | | | | |
| | |
Charleston County Airport District Rev., 5.00%, 7/1/2035 | | | 250,000 | | | | 295,010 | |
| | | | | | | | |
| | |
Water & Sewer — 0.2% | | | | | | | | |
| | |
City of Charleston, Waterworks and Sewer System Rev., 5.00%, 1/1/2026 | | | 25,000 | | | | 30,029 | |
| | | | | | | | |
| INVESTMENTS | | PRINCIPAL
AMOUNT ($) | | | VALUE ($) | |
| | | | | | | | |
| | |
Water & Sewer — continued | | | | | | | | |
| | |
City of Spartanburg, Water System Series B, Rev., 5.00%, 6/1/2030 | | | 35,000 | | | | 41,376 | |
| | | | | | | | |
| | |
| | | | | | | 71,405 | |
| | | | | | | | |
| | |
Total South Carolina | | | | | | | 706,051 | |
| | | | | | | | |
| | |
South Dakota — 0.1% | | | | | | | | |
| | |
Other Revenue — 0.1% | | | | | | | | |
| | |
City of Rapid City, Sales Tax Rev., 5.00%, 12/1/2023 | | | 25,000 | | | | 28,568 | |
| | | | | | | | |
| | |
Tennessee — 3.3% | | | | | | | | |
| | |
General Obligation — 1.9% | | | | | | | | |
| | |
City of Johnson City Series 2016A, GO, 5.00%, 6/1/2023 | | | 15,000 | | | | 17,025 | |
| | |
City of Murfreesboro GO, 4.00%, 4/1/2025 | | | 15,000 | | | | 16,551 | |
| | |
County of Franklin, Public Improvement GO, 5.00%, 6/1/2027 | | | 50,000 | | | | 60,858 | |
| | |
County of Montgomery, Public Improvement GO, 5.00%, 4/1/2027 | | | 25,000 | | | | 30,547 | |
| | |
County of Robertson GO, 5.00%, 6/1/2025 | | | 25,000 | | | | 29,617 | |
| | |
County of Shelby | | | | | | | | |
| | |
Series A, GO, 4.00%, 3/1/2021 | | | 20,000 | | | | 20,925 | |
| | |
Series A, GO, 5.00%, 3/1/2022 | | | 40,000 | | | | 43,885 | |
| | |
County of Sullivan GO, 5.00%, 5/1/2026 | | | 30,000 | | | | 36,079 | |
| | |
County of Williamson GO, 5.00%, 4/1/2024 | | | 20,000 | | | | 23,168 | |
| | |
County of Wilson GO, 4.00%, 4/1/2021 | | | 20,000 | | | | 20,961 | |
| | |
Metropolitan Government of Nashville & Davidson County GO, 5.00%, 7/1/2025 | | | 10,000 | | | | 11,872 | |
| | |
Metropolitan Government of Nashville and Davidson County | | | | | | | | |
| | |
Series A, GO, 5.00%, 7/1/2020 | | | 20,000 | | | | 20,887 | |
| | |
GO, 4.00%, 7/1/2035 | | | 210,000 | | | | 228,356 | |
| | |
State of Tennessee Series A, GO, 5.00%, 9/1/2025 | | | 25,000 | | | | 29,032 | |
| | | | | | | | |
| | |
| | | | | | | 589,763 | |
| | | | | | | | |
| | |
Prerefunded — 0.1% | | | | | | | | |
| | |
Metropolitan Government of Nashville & Davidson County GO, 5.00%, 7/1/2022 (c) | | | 20,000 | | | | 22,120 | |
| | | | | | | | |
| | |
Utility — 1.3% | | | | | | | | |
| | |
Metropolitan Government of Nashville and Davidson County, Electric System Series 2014A, Rev., 5.00%, 5/15/2024 | | | 10,000 | | | | 11,606 | |
| | |
Tennessee Energy Acquisition Corp., Gas Project Series A, Rev., 4.00%, 5/1/2023 (b) | | | 385,000 | | | | 403,815 | |
| | | | | | | | |
| | |
| | | | | | | 415,421 | |
| | | | | | | | |
| | |
Total Tennessee | | | | | | | 1,027,304 | |
| | | | | | | | |
SEE NOTES TO FINANCIAL STATEMENTS.
| | | | | | |
| | | |
| 86 | | | | J.P. MORGAN EXCHANGE-TRADED FUNDS | | FEBRUARY 28, 2019 |
| | | | | | | | |
| INVESTMENTS | | PRINCIPAL
AMOUNT ($) | | | VALUE ($) | |
Municipal Bonds — continued | | | | | | | | |
| | |
Texas — 9.9% | | | | | | | | |
| | |
Education — 1.6% | | | | | | | | |
| | |
Regents of the University of Texas Series A, Rev., 5.00%, 2/15/2024 | | | 35,000 | | | | 40,135 | |
| | |
Texas A&M University, Financing System | | | | | | | | |
| | |
Series E, Rev., 5.00%, 5/15/2028 | | | 80,000 | | | | 96,867 | |
| | |
Series E, Rev., 5.00%, 5/15/2030 | | | 170,000 | | | | 203,359 | |
| | |
University of Texas (The), Board of Regents, Financing System Series D, Rev., 5.00%, 8/15/2024 | | | 40,000 | | | | 46,669 | |
| | |
University of Texas System (The) Rev., 5.00%, 8/15/2022 | | | 10,000 | | | | 11,114 | |
| | |
University of Texas, Board of Regents, Permanent University Fund Series A, Rev., 5.00%, 7/1/2024 | | | 85,000 | | | | 98,935 | |
| | | | | | | | |
| | |
| | | | | | | 497,079 | |
| | | | | | | | |
| | |
General Obligation — 5.5% | | | | | | | | |
| | |
Alamo Community College District, Limited Tax | | | | | | | | |
| | |
GO, 5.00%, 2/15/2024 | | | 75,000 | | | | 86,215 | |
| | |
GO, 5.00%, 8/15/2026 | | | 250,000 | | | | 301,423 | |
| | |
Allen Independent School District, School Building GO, PSF-GTD, 5.00%, 2/15/2032 | | | 55,000 | | | | 63,643 | |
| | |
City of Houston, Public Improvement Series 2013A, GO, 5.00%, 3/1/2020 | | | 30,000 | | | | 30,969 | |
| | |
City of Hutto GO, 5.00%, 8/1/2026 | | | 80,000 | | | | 95,870 | |
| | |
City of League City GO, 5.00%, 2/15/2027 | | | 20,000 | | | | 23,578 | |
| | |
City of Pflugerville GO, 5.00%, 8/1/2026 | | | 25,000 | | | | 30,045 | |
| | |
City of San Angelo GO, 5.00%, 2/15/2027 | | | 20,000 | | | | 24,120 | |
| | |
City of San Marcos, Certificates of Obligation GO, 5.00%, 8/15/2031 | | | 270,000 | | | | 319,645 | |
| | |
Clint Independent School District, Unlimited Tax Series A, GO, PSF-GTD, 5.00%, 2/15/2024 | | | 25,000 | | | | 28,768 | |
| | |
County of Bexar, Certificates of Obligation Series A, GO, 5.00%, 6/15/2031 | | | 160,000 | | | | 186,843 | |
| | |
County of Fort Bend Series 2016B, GO, 5.00%, 3/1/2022 | | | 15,000 | | | | 16,427 | |
| | |
County of Harris, Unlimited Tax Series 2017A, GO, 5.00%, 10/1/2026 | | | 25,000 | | | | 30,339 | |
| | |
County of Hays, Limited Tax GO, 5.00%, 2/15/2026 | | | 20,000 | | | | 24,170 | |
| | |
County of Montgomery, Unlimited Tax GO, 5.00%, 3/1/2025 | | | 25,000 | | | | 29,544 | |
| | |
County of Wichita, Limited Tax GO, 5.00%, 9/15/2027 | | | 60,000 | | | | 73,075 | |
| | |
County of Williamson, Limited Tax GO, 5.00%, 2/15/2026 | | | 40,000 | | | | 47,865 | |
| | | | | | | | |
| INVESTMENTS | | PRINCIPAL
AMOUNT ($) | | | VALUE ($) | |
| | | | | | | | |
| | |
General Obligation — continued | | | | | | | | |
| | |
Cypress-Fairbanks Independent School District, School Building Series 2015A, GO, PSF-GTD, 5.00%, 2/15/2025 | | | 20,000 | | | | 23,557 | |
| | |
Laredo Independent School District, Unlimited Tax GO, PSF-GTD, 5.00%, 8/1/2024 | | | 25,000 | | | | 29,003 | |
| | |
North East Independent School District GO, PSF-GTD, 5.00%, 8/1/2025 | | | 20,000 | | | | 23,702 | |
| | |
Northside Independent School District GO, PSF-GTD, 5.00%, 8/15/2024 | | | 65,000 | | | | 75,598 | |
| | |
Pearland Independent School District Series A, GO, PSF-GTD, 5.00%, 2/15/2023 | | | 25,000 | | | | 28,095 | |
| | |
Prosper Independent School District, Unlimited Tax School Building GO,PSF-GTD, 5.00%, 2/15/2037 | | | 25,000 | | | | 29,042 | |
| | |
Sherman Independent School District Series A, GO, PSF-GTD, 5.00%, 2/15/2030 | | | 25,000 | | | | 29,882 | |
| | |
State of Texas, Transportation Commission Mobility Series 2015-A, GO, 5.00%, 10/1/2024 | | | 50,000 | | | | 58,443 | |
| | |
Wylie Independent School District, Unlimited Tax GO, PSF-GTD, 4.00%, 2/15/2023 | | | 10,000 | | | | 10,853 | |
| | | | | | | | |
| | |
| | | | | | | 1,720,714 | |
| | | | | | | | |
| | | | | | | | |
| | |
Other Revenue — 0.2% | | | | | | | | |
| | |
Metropolitan Transit Authority of Harris County Series 2017A, Rev., 5.00%, 11/1/2025 | | | 45,000 | | | | 53,672 | |
| | | | | | | | |
| | |
Transportation — 0.1% | | | | | | | | |
| | |
Metropolitan Transit Authority of Harris County Series B, Rev., 5.00%, 11/1/2029 | | | 25,000 | | | | 30,050 | |
| | | | | | | | |
| | |
Utility — 1.5% | | | | | | | | |
| | |
Brushy Creek Regional Utility Authority, Inc., Water Treatment And Distribution Project Rev., 5.00%, 8/1/2026 | | | 85,000 | | | | 102,304 | |
| | |
City of Houston, Utility System Revenue Refunding Series D, Rev., 5.00%, 11/15/2030 | | | 45,000 | | | | 54,407 | |
| | |
City of San Antonio, Electric and Gas Systems Rev., 5.00%, 2/1/2028 | | | 100,000 | | | | 122,148 | |
| | |
Lower Colorado River Authority, Transmission Contract, LCRA Transmission Services Corp. Project | | | | | | | | |
| | |
Rev., 5.00%, 5/15/2020 | | | 30,000 | | | | 31,172 | |
| | |
Rev., 5.00%, 5/15/2035 | | | 155,000 | | | | 179,709 | |
| | | | | | | | |
| | |
| | | | | | | 489,740 | |
| | | | | | | | |
SEE NOTES TO FINANCIAL STATEMENTS.
| | | | | | | | |
| | | |
| FEBRUARY 28, 2019 | | J.P. MORGAN EXCHANGE-TRADED FUNDS | | | | | 87 | |
JPMorgan Municipal ETF
SCHEDULE OF PORTFOLIO INVESTMENTS
AS OF FEBRUARY 28, 2019 (continued)
| | | | | | | | |
| INVESTMENTS | | PRINCIPAL
AMOUNT ($) | | | VALUE ($) | |
Municipal Bonds — continued | | | | | | | | |
| | |
Water & Sewer — 1.0% | | | | | | | | |
| | |
City of Amarillo, Waterworks and Sewer System Series 2015A, Rev., 4.00%, 4/1/2025 | | | 25,000 | | | | 27,989 | |
| | |
City of Dallas, Waterworks and Sewer System Rev., 5.00%, 10/1/2022 | | | 10,000 | | | | 10,828 | |
| | |
City of San Antonio, Water System, Junior Lien Series A, Rev., 5.00%, 5/15/2025 | | | 25,000 | | | | 29,538 | |
| | |
North Texas Municipal Water District, Water System Rev., 5.00%, 6/1/2027 | | | 20,000 | | | | 24,336 | |
| | |
Tarrant Regional Water District Rev., 5.00%, 3/1/2025 | | | 125,000 | | | | 146,929 | |
| | |
Trinity River Authority LLC, Tarrant County Water Project Rev., 5.00%, 2/1/2026 | | | 60,000 | | | | 71,713 | |
| | | | | | | | |
| | |
| | | | | | | 311,333 | |
| | | | | | | | |
| | |
Total Texas | | | | | | | 3,102,588 | |
| | | | | | | | |
| | |
Utah — 0.8% | | | | | | | | |
| | |
Education — 0.1% | | | | | | | | |
| | |
Utah State Board of Regents, University of Utah (The) Series A, Rev., 5.00%, 8/1/2031 | | | 40,000 | | | | 47,337 | |
| | | | | | | | |
| | |
Other Revenue — 0.4% | | | | | | | | |
| | |
City of Park City Rev., 5.00%, 6/15/2022 | | | 30,000 | | | | 33,172 | |
| | |
County of Summit, Sales Tax Rev., 5.00%, 12/15/2023 | | | 70,000 | | | | 80,511 | |
| | | | | | | | |
| | |
| | | | | | | 113,683 | |
| | | | | | | | |
| | |
Prerefunded — 0.1% | | | | | | | | |
| | |
Utah State Board of Regents, University of Utah (The) Series B, Rev., 5.00%, 8/1/2023 (c) | | | 25,000 | | | | 28,462 | |
| | | | | | | | |
| | |
Water & Sewer — 0.2% | | | | | | | | |
| | |
Washington County Water Conservancy District Series 2012A, Rev., 4.50%, 10/1/2024 | | | 55,000 | | | | 59,432 | |
| | | | | | | | |
| | |
Total Utah | | | | | | | 248,914 | |
| | | | | | | | |
| | |
Virginia — 4.0% | | | | | | | | |
| | |
Education — 0.4% | | | | | | | | |
| | |
Virginia College Building Authority, Educational Facilities, 21st Century College and Equipment Programs Series 2017-C, Rev., 5.00%, 2/1/2024 | | | 65,000 | | | | 74,979 | |
| | |
Virginia Public School Authority Series 2015-A, Rev., 4.00%, 8/1/2020 | | | 50,000 | | | | 51,690 | |
| | | | | | | | |
| | |
| | | | | | | 126,669 | |
| | | | | | | | |
| | |
General Obligation — 1.1% | | | | | | | | |
| | |
City of Richmond Series B, GO, 5.00%, 7/15/2027 | | | 175,000 | | | | 215,684 | |
| | | | | | | | |
| INVESTMENTS | | PRINCIPAL
AMOUNT ($) | | | VALUE ($) | |
| | | | | | | | |
| | |
General Obligation — continued | | | | | | | | |
| | |
Commonwealth of Virginia Series A, GO, 5.00%, 6/1/2030 | | | 25,000 | | | | 30,575 | |
| | |
County of Spotsylvania, Public Improvement GO, 5.00%, 7/15/2029 | | | 85,000 | | | | 105,047 | |
| | | | | | | | |
| | |
| | | | | | | 351,306 | |
| | | | | | | | |
| | |
Housing — 0.1% | | | | | | | | |
| | |
Virginia Public Building Authority, Public Facilities Series A, Rev., 5.00%, 8/1/2022 | | | 25,000 | | | | 27,735 | |
| | | | | | | | |
| | |
Transportation — 0.5% | | | | | | | | |
| | |
Virginia Commonwealth Transportation Board Series 2013-A, Rev., GAN, 5.00%, 3/15/2023 | | | 100,000 | | | | 112,784 | |
| | |
Virginia Resources Authority, Infrastructure and State Moral Obligation Series 2013-C, Rev., 5.00%, 11/1/2023 | | | 35,000 | | | | 40,117 | |
| | | | | | | | |
| | |
| | | | | | | 152,901 | |
| | | | | | | | |
| | |
Water & Sewer — 1.9% | | | | | | | | |
| | |
Hampton Roads Sanitation District, Wastewater | | | | | | | | |
| | |
Series 2014A, Rev., 5.00%, 7/1/2021 | | | 15,000 | | | | 16,153 | |
| | |
Series A, Rev., 5.00%, 10/1/2027 | | | 465,000 | | | | 577,386 | |
| | | | | | | | |
| | |
| | | | | | | 593,539 | |
| | | | | | | | |
| | |
Total Virginia | | | | | | | 1,252,150 | |
| | | | | | | | |
| | |
Washington — 7.0% | | | | | | | | |
| |
Certificate of Participation/Lease — 0.2% | | | | | |
| | |
State of Washington Series 2015-C, COP, 5.00%, 1/1/2029 | | | 55,000 | | | | 64,012 | |
| | | | | | | | |
| | |
Education — 0.5% | | | | | | | | |
| | |
University of Washington Rev., 5.00%, 4/1/2032 | | | 115,000 | | | | 135,667 | |
| | | | | | | | |
| | |
General Obligation — 5.2% | | | | | | | | |
| | |
City of University Place, Limited Tax GO, 5.00%, 12/1/2026 | | | 45,000 | | | | 54,018 | |
| | |
Clark County School District No. 101 La Center, Unlimited Tax GO, 5.00%, 12/1/2029 | | | 50,000 | | | | 60,539 | |
| | |
County of King, Limited Tax | | | | | | | | |
| | |
Series A, GO, 5.00%, 7/1/2025 | | | 50,000 | | | | 58,843 | |
| | |
Series B, GO, 5.00%, 12/1/2025 | | | 20,000 | | | | 22,841 | |
| | |
County of Snohomish, Limited Tax GO, 5.00%, 12/1/2025 | | | 10,000 | | | | 11,822 | |
| | |
King County Public Hospital District No. 2, EvergreenHealth GO, 5.00%, 12/1/2031 | | | 105,000 | | | | 118,551 | |
| | |
King County School District No. 403 Renton GO, 5.00%, 12/1/2022 | | | 40,000 | | | | 44,146 | |
SEE NOTES TO FINANCIAL STATEMENTS.
| | | | | | |
| | | |
| 88 | | | | J.P. MORGAN EXCHANGE-TRADED FUNDS | | FEBRUARY 28, 2019 |
| | | | | | | | |
| INVESTMENTS | | PRINCIPAL
AMOUNT ($) | | | VALUE ($) | |
Municipal Bonds — continued | | | | | | | | |
| | |
General Obligation — continued | | | | | | | | |
| | |
King County School District No. 405 Bellevue GO, 5.00%, 12/1/2024 | | | 350,000 | | | | 411,092 | |
| | |
King County School District No. 405 Bellevue, Credit Enhancement Program | | | | | | | | |
| | |
GO, 5.00%, 12/1/2021 | | | 30,000 | | | | 32,686 | |
| | |
GO, 5.00%, 12/1/2026 | | | 20,000 | | | | 24,362 | |
| | |
King County School District No. 411 Issaquah GO, 5.00%, 12/1/2024 | | | 35,000 | | | | 40,947 | |
| | |
King County School District No. 411 Issaquah, Unlimited Tax GO, 5.00%, 12/1/2031 | | | 225,000 | | | | 265,050 | |
| | |
Kitsap County School District No. 401 Central Kitsap, Unlimited Tax GO, 5.00%, 12/1/2023 | | | 50,000 | | | | 57,369 | |
| | |
Mason County School District No. 309 Shelton, Unlimited Tax GO, 5.00%, 12/1/2029 | | | 45,000 | | | | 53,596 | |
| | |
Pasco School District No. 1, Franklin County, Unlimited Tax GO, 5.00%, 12/1/2030 | | | 35,000 | | | | 41,819 | |
| | |
Pierce and King Counties School District No. 417 Fife GO, 4.00%, 12/1/2020 | | | 75,000 | | | | 78,128 | |
| | |
Pierce County, White River School District No. 416 GO, 5.00%, 12/1/2025 | | | 50,000 | | | | 59,749 | |
| | |
Snohomish County Edmonds School District No. 15 GO, 5.00%, 12/1/2025 | | | 25,000 | | | | 29,854 | |
| | |
Snohomish County School District No. 4 Lake Stevens GO, 5.00%, 12/1/2024 | | | 25,000 | | | | 29,413 | |
| | |
Spokane County, Mead School District No. 354 GO, 5.00%, 12/1/2024 | | | 20,000 | | | | 23,464 | |
| | |
State of Washington, Motor Vehicle Fuel Tax Series 2013E, GO, 5.00%, 2/1/2025 | | | 75,000 | | | | 83,996 | |
| | |
State of Washington, Various Purpose Series C, GO, 5.00%, 2/1/2038 | | | 25,000 | | | | 28,509 | |
| | | | | | | | |
| | |
| | | | | | | 1,630,794 | |
| | | | | | | | |
| | |
Other Revenue — 0.1% | | | | | | | | |
| | |
Washington State Convention Center Public Facilities District Rev., 5.00%, 7/1/2032 | | | 35,000 | | | | 40,928 | |
| | | | | | | | |
| | |
Prerefunded — 0.2% | | | | | | | | |
| | |
City of Seattle, Municipal Light and Power Improvement Series 2011A, Rev., 5.00%, 2/1/2021 (c) | | | 20,000 | | | | 21,254 | |
| | |
State of Washington, Various Purpose Series 2011-A, GO, 5.00%, 8/1/2020 (c) | | | 25,000 | | | | 26,164 | |
| | | | | | | | |
| | |
| | | | | | | 47,418 | |
| | | | | | | | |
| | |
Transportation — 0.2% | | | | | | | | |
| | |
Central Puget Sound Regional Transit Authority, Sales Tax Series 2015S-1, Rev., 5.00%, 11/1/2024 | | | 30,000 | | | | 35,166 | |
| | | | | | | | |
| INVESTMENTS | | PRINCIPAL
AMOUNT ($) | | | VALUE ($) | |
| | | | | | | | |
| | |
Transportation — continued | | | | | | | | |
| | |
Port of Seattle, Intermediate Lien Series B, Rev., 5.00%, 3/1/2022 | | | 30,000 | | | | 32,736 | |
| | | | | | | | |
| | |
| | | | | | | 67,902 | |
| | | | | | | | |
| | |
Utility — 0.4% | | | | | | | | |
| | |
Energy Northwest, Electric | | | | | | | | |
| | |
Series 2016-A, Rev., 5.00%, 7/1/2028 | | | 25,000 | | | | 29,753 | |
| | |
Series A, Rev., 5.00%, 7/1/2028 | | | 55,000 | | | | 66,838 | |
| | |
Grant County Public Utility District No. 2, Priest Rapids Hydroelectric Project Series A, Rev., 5.00%, 1/1/2023 | | | 25,000 | | | | 27,903 | |
| | | | | | | | |
| | |
| | | | | | | 124,494 | |
| | | | | | | | |
| | |
Water & Sewer — 0.2% | | | | | | | | |
| | |
City of Seattle, Drainage and Wastewater System Improvement Rev., 4.00%, 4/1/2026 | | | 20,000 | | | | 22,742 | |
| | |
City of Seattle, Wastewater System Improvement Rev., 5.00%, 8/1/2024 | | | 35,000 | | | | 40,769 | |
| | | | | | | | |
| | |
| | | | | | | 63,511 | |
| | | | | | | | |
| | |
Total Washington | | | | | | | 2,174,726 | |
| | | | | | | | |
| | |
Wisconsin — 4.6% | | | | | | | | |
| | |
Education — 0.7% | | | | | | | | |
| | |
Public Finance Authority, Piedmont Community Charter School Rev., 5.00%, 6/15/2039 | | | 200,000 | | | | 217,274 | |
| | | | | | | | |
| | |
General Obligation — 2.6% | | | | | | | | |
| | |
City of Milwaukee, Promissory Notes Series N4 & B5, GO, 5.00%, 4/1/2023 | | | 35,000 | | | | 39,366 | |
| | |
City of West Allis, Corporate Purpose Series A, GO, 4.00%, 4/1/2022 | | | 425,000 | | | | 452,000 | |
| | |
Hamilton School District, School Building Improvement GO, 5.00%, 4/1/2025 | | | 60,000 | | | | 70,799 | |
| | |
State of Wisconsin | | | | | | | | |
| | |
Series 3, GO, 5.00%, 11/1/2021 | | | 75,000 | | | | 81,487 | |
| | |
Series B, GO, 4.00%, 5/1/2023 | | | 40,000 | | | | 43,677 | |
| | |
Series 1, GO, 5.00%, 11/1/2024 | | | 40,000 | | | | 46,928 | |
| | |
Series 2, GO, 5.00%, 11/1/2026 | | | 50,000 | | | | 60,208 | |
| | |
Village of Pleasant Prairie GO, 4.00%, 8/1/2024 | | | 10,000 | | | | 11,062 | |
| | | | | | | | |
| | |
| | | | | | | 805,527 | |
| | | | | | | | |
|
Industrial Development Revenue/Pollution Control Revenue — 0.2% | |
| | |
State of Wisconsin Environmental Improvement Fund | | | | | | | | |
| | |
Series A, Rev., 5.00%, 6/1/2025 | | | 35,000 | | | | 41,608 | |
| | |
Series A, Rev., 5.00%, 6/1/2026 | | | 20,000 | | | | 24,224 | |
| | | | | | | | |
| | |
| | | | | | | 65,832 | |
| | | | | | | | |
SEE NOTES TO FINANCIAL STATEMENTS.
| | | | | | | | |
| | | |
| FEBRUARY 28, 2019 | | J.P. MORGAN EXCHANGE-TRADED FUNDS | | | | | 89 | |
JPMorgan Municipal ETF
SCHEDULE OF PORTFOLIO INVESTMENTS
AS OF FEBRUARY 28, 2019 (continued)
| | | | | | | | |
| INVESTMENTS | | PRINCIPAL
AMOUNT ($) | | | VALUE ($) | |
Municipal Bonds — continued | | | | | | | | |
| | |
Prerefunded — 0.4% | | | | | | | | |
| | |
State of Wisconsin Series C, GO, 4.00%, 5/1/2021(c) | | | 25,000 | | | | 26,206 | |
| | |
State of Wisconsin, Clean Water Series 1, Rev., 5.00%, 6/1/2023 (c) | | | 25,000 | | | | 28,350 | |
| | |
State of Wisconsin, Clean Water Fund, Leveraged Loan Portfolio Rev., 5.00%, 6/1/2024 (c) | | | 65,000 | | | | 75,522 | |
| | | | | | | | |
| | |
| | | | | | | 130,078 | |
| | | | | | | | |
| | |
Transportation — 0.7% | | | | | | | | |
| | |
Wisconsin Department of Transportation Series 2, Rev., 5.00%, 7/1/2031 | | | 180,000 | | | | 214,942 | |
| | | | | | | | |
| | |
Total Wisconsin | | | | | | | 1,433,653 | |
| | | | | | | | |
| |
Total Municipal Bonds
(Cost $29,544,673) | | | | 30,454,466 | |
| | | | | | | | |
| | |
| | |
SHARES | | | | |
Short-term Investments — 3.4% | | | | | | | | |
| | |
Investment Companies — 3.4% | | | | | | | | |
| | |
JPMorgan Institutional Tax Free Money Market Fund Class IM Shares, 1.57% (f) (g)
(Cost $1,050,773) | | | 1,050,773 | | | | 1,050,773 | |
| | | | | | | | |
| |
Total Investments — 101.1%
(Cost $30,595,446) | | | | 31,505,239 | |
| |
Liabilities in Excess of Other Assets — (1.1)% | | | | (351,681) | |
| | | | | | | | |
| |
Net Assets — 100.0% | | | | 31,153,558 | |
| | | | | | | | |
Percentages indicated are based on net assets.
| | |
Abbreviations |
AGM | | Insured by Assured Guaranty Municipal Corp. |
COP | | Certificate of Participation |
GAN | | Grant Anticipation Notes |
GO | | General Obligation |
IDA | | Industrial Development Authority |
LIQ | | Liquidity Agreement |
PSF-GTD | | Permanent School Fund Guaranteed |
Q-SBLF | | Qualified School Bond Loan Fund |
Rev. | | Revenue |
SCSDE | | South Carolina School District Enhancement |
VAR | | Variable Rate Security. The interest rate shown is the rate in effect as of February 28, 2019. |
VRDO | | Variable Rate Demand Obligation. The interest rate shown is the rate in effect as of February 28, 2019. |
| |
(a) | | The date shown represents the earliest of the prerefunded date, next put date or final maturity date. |
(b) | | Variable or floating rate security, the interest rate of which adjusts periodically based on changes in current interest rates and prepayments on the underlying pool of assets. The interest rate shown is the current rate as of February 28, 2019. |
(c) | | Security is prerefunded or escrowed to maturity. |
(d) | | Amount rounds to less than 0.1% of net assets. |
(e) | | All or a portion of the security is a when-issued security, delayed delivery security, or forward commitment. |
(f) | | Investment in affiliate. Fund is registered under the Investment Company Act of 1940, as amended, and advised by J.P. Morgan Investment Management Inc. |
(g) | | The rate shown is the current yield as of February 28, 2019. |
SEE NOTES TO FINANCIAL STATEMENTS.
| | | | | | |
| | | |
| 90 | | | | J.P. MORGAN EXCHANGE-TRADED FUNDS | | FEBRUARY 28, 2019 |
JPMorgan U.S. Aggregate Bond ETF
SCHEDULE OF PORTFOLIO INVESTMENTS
AS OF FEBRUARY 28, 2019
| | | | | | | | |
| INVESTMENTS | | PRINCIPAL
AMOUNT ($) | | | VALUE ($) | |
U.S. Treasury Obligations — 38.7% | | | | | | | | |
|
U.S. Treasury Bonds | |
| | |
8.75%, 8/15/2020 | | | 4,882,000 | | | | 5,310,319 | |
| | |
7.88%, 2/15/2021 | | | 241,000 | | | | 265,401 | |
| | |
8.13%, 5/15/2021 | | | 29,000 | | | | 32,448 | |
| | |
8.13%, 8/15/2021 | | | 3,355,000 | | | | 3,798,096 | |
| | |
5.50%, 8/15/2028 | | | 29,000 | | | | 35,687 | |
| | |
6.25%, 5/15/2030 | | | 1,138,000 | | | | 1,519,541 | |
| | |
4.50%, 5/15/2038 | | | 426,000 | | | | 527,175 | |
| | |
4.25%, 5/15/2039 | | | 896,000 | | | | 1,073,835 | |
| | |
4.63%, 2/15/2040 | | | 39,000 | | | | 49,046 | |
| | |
3.00%, 5/15/2045 | | | 2,867,000 | | | | 2,826,347 | |
| | |
3.00%, 11/15/2045 | | | 40,000 | | | | 39,422 | |
| | |
2.25%, 8/15/2046 | | | 410,000 | | | | 346,114 | |
| | |
3.00%, 5/15/2047 | | | 21,000 | | | | 20,669 | |
| | |
3.00%, 2/15/2048 | | | 44,000 | | | | 43,233 | |
| | |
3.00%, 8/15/2048 | | | 20,000 | | | | 19,655 | |
| | |
3.38%, 11/15/2048 | | | 1,203,000 | | | | 1,271,797 | |
| | |
3.00%, 2/15/2049 | | | 80,000 | | | | 78,669 | |
| | |
U.S. Treasury Notes | | | | | | | | |
| | |
1.63%, 3/15/2020 | | | 151,000 | | | | 149,561 | |
| | |
2.25%, 3/31/2020 | | | 74,000 | | | | 73,763 | |
| | |
2.63%, 8/15/2020 | | | 32,000 | | | | 32,025 | |
| | |
2.88%, 10/31/2020 | | | 32,000 | | | | 32,162 | |
| | |
2.00%, 1/15/2021 | | | 121,000 | | | | 119,790 | |
| | |
2.25%, 2/15/2021 | | | 29,000 | | | | 28,839 | |
| | |
1.25%, 3/31/2021 | | | 116,000 | | | | 113,055 | |
| | |
1.50%, 1/31/2022 | | | 3,672,000 | | | | 3,569,442 | |
| | |
1.75%, 6/30/2022 | | | 4,775,000 | | | | 4,661,407 | |
| | |
2.13%, 12/31/2022 | | | 160,000 | | | | 157,713 | |
| | |
2.38%, 1/31/2023 | | | 29,000 | | | | 28,845 | |
| | |
1.25%, 7/31/2023 | | | 128,000 | | | | 121,210 | |
| | |
2.25%, 12/31/2023 | | | 2,329,000 | | | | 2,299,251 | |
| | |
2.25%, 1/31/2024 | | | 797,000 | | | | 786,446 | |
| | |
2.50%, 1/31/2024 | | | 254,000 | | | | 253,722 | |
| | |
2.38%, 2/29/2024 | | | 340,000 | | | | 337,729 | |
| | |
2.00%, 4/30/2024 | | | 124,000 | | | | 120,735 | |
| | |
1.88%, 8/31/2024 | | | 3,662,000 | | | | 3,534,688 | |
| | |
2.63%, 12/31/2025 | | | 3,490,000 | | | | 3,492,045 | |
| | |
2.75%, 2/15/2028 | | | 29,000 | | | | 29,109 | |
| | |
2.88%, 8/15/2028 | | | 55,000 | | | | 55,713 | |
| | |
3.13%, 11/15/2028 | | | 757,000 | | | | 782,844 | |
| | |
2.63%, 2/15/2029 | | | 150,000 | | | | 148,758 | |
| | | | | | | | |
| | |
Total U.S. Treasury Obligations
(Cost $38,161,514) | | | | | | | 38,186,306 | |
| | | | | | | | |
| | | | | | | | |
| INVESTMENTS | | PRINCIPAL
AMOUNT ($) | | | VALUE ($) | |
Mortgage-Backed Securities — 28.1% | | | | | | | | |
| | |
FHLMC Gold Pools, 15 Year, Single Family | | | | | | | | |
| | |
Pool # G15602, 2.50%, 11/1/2027 | | | 176,774 | | | | 174,438 | |
| | |
Pool # G18466, 2.00%, 5/1/2028 | | | 31,439 | | | | 30,490 | |
| | |
Pool # V60840, 3.00%, 6/1/2030 | | | 24,492 | | | | 24,518 | |
| | |
Pool # G16622, 3.00%, 11/1/2030 | | | 100,173 | | | | 100,066 | |
| | |
Pool # G16044, 2.50%, 1/1/2032 | | | 247,522 | | | | 242,929 | |
| | |
Pool # J36524, 3.00%, 3/1/2032 | | | 400,000 | | | | 399,567 | |
| | |
Pool # G18706, 3.00%, 9/1/2033 | | | 49,414 | | | | 49,360 | |
| | |
FHLMC Gold Pools, 20 Year, Single Family | | | | | | | | |
| | |
Pool # C91266, 4.00%, 9/1/2029 | | | 24,614 | | | | 25,113 | |
| | |
Pool # C91911, 2.50%, 1/1/2037 | | | 198,729 | | | | 191,049 | |
| | |
Pool # G31005, 4.00%, 5/1/2037 | | | 292,396 | | | | 302,089 | |
| | |
Pool # C91974, 4.00%, 11/1/2037 | | | 510,710 | | | | 526,384 | |
| | |
FHLMC Gold Pools, 30 Year, Single Family | | | | | | | | |
| | |
Pool # A34212, 6.00%, 4/1/2035 | | | 24,906 | | | | 26,846 | |
| | |
Pool # G06856, 6.00%, 5/1/2040 | | | 25,358 | | | | 27,857 | |
| | |
Pool # G07794, 5.50%, 6/1/2041 | | | 24,512 | | | | 26,647 | |
| | |
Pool # G08477, 3.50%, 2/1/2042 | | | 38,700 | | | | 39,032 | |
| | |
Pool # C03858, 3.50%, 4/1/2042 | | | 211,345 | | | | 213,156 | |
| | |
Pool # Q13477, 3.00%, 12/1/2042 | | | 258,560 | | | | 254,213 | |
| | |
Pool # C09031, 2.50%, 2/1/2043 | | | 242,864 | | | | 231,437 | |
| | |
Pool # Q17374, 4.00%, 4/1/2043 | | | 179,053 | | | | 185,554 | |
| | |
Pool # C09044, 3.50%, 7/1/2043 | | | 118,167 | | | | 119,137 | |
| | |
Pool # G08599, 3.50%, 8/1/2044 | | | 172,674 | | | | 173,700 | |
| | |
Pool # G08659, 3.50%, 8/1/2045 | | | 138,936 | | | | 139,568 | |
| | |
Pool # Q35460, 3.50%, 8/1/2045 | | | 277,946 | | | | 279,211 | |
| | |
Pool # G08677, 4.00%, 11/1/2045 | | | 150,000 | | | | 153,591 | |
| | |
Pool # G60480, 4.50%, 11/1/2045 | | | 266,894 | | | | 279,199 | |
| | |
Pool # G08680, 3.00%, 12/1/2045 | | | 133,109 | | | | 130,417 | |
| | |
Pool # G61796, 4.50%, 12/1/2045 | | | 198,209 | | | | 208,366 | |
| | |
Pool # Q39844, 3.50%, 4/1/2046 | | | 349,376 | | | | 350,207 | |
| | |
Pool # Q42045, 3.50%, 7/1/2046 | | | 76,323 | | | | 76,744 | |
| | |
Pool # G61730, 3.00%, 9/1/2046 | | | 320,753 | | | | 315,365 | |
| | |
Pool # G08741, 3.00%, 1/1/2047 | | | 248,524 | | | | 243,346 | |
| | |
Pool # G08747, 3.00%, 2/1/2047 | | | 450,882 | | | | 441,458 | |
| | |
Pool # G08793, 4.00%, 12/1/2047 | | | 148,558 | | | | 151,921 | |
| | |
Pool # Q53751, 3.50%, 1/1/2048 | | | 562,196 | | | | 562,699 | |
| | |
Pool # G08823, 3.50%, 7/1/2048 | | | 135,222 | | | | 135,343 | |
| | |
Pool # G08836, 4.00%, 9/1/2048 | | | 700,977 | | | | 715,190 | |
| | |
Pool # G08858, 4.50%, 1/1/2049 | | | 102,181 | | | | 105,912 | |
| | |
FNMA, 15 Year, Single Family | | | | | | | | |
| | |
Pool # AC3256, 4.50%, 9/1/2024 | | | 81,526 | | | | 84,000 | |
| | |
Pool # AC7007, 4.50%, 1/1/2025 | | | 114,223 | | | | 118,356 | |
| | |
Pool # AL9580, 4.00%, 3/1/2025 | | | 70,000 | | | | 71,836 | |
| | |
Pool # AL2605, 3.00%, 6/1/2027 | | | 150,000 | | | | 150,345 | |
| | |
Pool # AB6811, 2.50%, 10/1/2027 | | | 49,306 | | | | 48,636 | |
SEE NOTES TO FINANCIAL STATEMENTS.
| | | | | | | | |
| | | |
| FEBRUARY 28, 2019 | | J.P. MORGAN EXCHANGE-TRADED FUNDS | | | | | 91 | |
JPMorgan U.S. Aggregate Bond ETF
SCHEDULE OF PORTFOLIO INVESTMENTS
AS OF FEBRUARY 28, 2019 (continued)
| | | | | | | | |
| INVESTMENTS | | PRINCIPAL
AMOUNT ($) | | | VALUE ($) | |
Mortgage-Backed Securities — continued | | | | | | | | |
| | |
Pool # AQ9442, 2.00%, 12/1/2027 | | | 33,565 | | | | 32,548 | |
| | |
Pool # AS3345, 2.00%, 7/1/2029 | | | 27,787 | | | | 26,946 | |
| | |
Pool # AX2889, 3.50%, 11/1/2029 | | | 1,925 | | | | 1,960 | |
| | |
Pool # AL7205, 3.50%, 12/1/2029 | | | 295,867 | | | | 301,110 | |
| | |
Pool # AS5278, 2.50%, 6/1/2030 | | | 65,319 | | | | 64,145 | |
| | |
Pool # MA2684, 3.00%, 7/1/2031 | | | 287,461 | | | | 287,153 | |
| | |
Pool # BD1493, 2.50%, 9/1/2031 | | | 68,988 | | | | 67,759 | |
| | |
Pool # BD5647, 2.00%, 11/1/2031 | | | 37,747 | | | | 36,228 | |
| | |
Pool # BM4741, 3.00%, 4/1/2032 | | | 70,154 | | | | 70,241 | |
| | |
Pool # MA3188, 3.00%, 11/1/2032 | | | 78,000 | | | | 77,882 | |
| | |
Pool # BH7081, 2.50%, 12/1/2032 | | | 194,754 | | | | 191,109 | |
| | |
Pool # MA3547, 3.00%, 12/1/2033 | | | 35,671 | | | | 35,617 | |
| | |
FNMA, 20 Year, Single Family | | | | | | | | |
| | |
Pool # AB4262, 3.50%, 1/1/2032 | | | 98,911 | | | | 100,441 | |
| | |
Pool # AL6159, 4.50%, 1/1/2032 | | | 198,967 | | | | 207,628 | |
| | |
Pool # MA2287, 3.00%, 6/1/2035 | | | 178,263 | | | | 177,092 | |
| | |
Pool # AL6970, 3.50%, 7/1/2035 | | | 39,344 | | | | 39,735 | |
| | |
FNMA, 30 Year, Single Family | | | | | | | | |
| | |
Pool # 725232, 5.00%, 3/1/2034 | | | 24,645 | | | | 26,321 | |
| | |
Pool # 790003, 6.00%, 8/1/2034 | | | 24,911 | | | | 27,372 | |
| | |
Pool # 735503, 6.00%, 4/1/2035 | | | 83,802 | | | | 92,856 | |
| | |
Pool # 872499, 6.50%, 6/1/2036 | | | 823 | | | | 937 | |
| | |
Pool # BH7907, 6.50%, 12/1/2037 | | | 35,370 | | | | 39,061 | |
| | |
Pool # 190399, 5.50%, 11/1/2039 | | | 197,634 | | | | 211,361 | |
| | |
Pool # AB1259, 5.00%, 7/1/2040 | | | 98,551 | | | | 105,493 | |
| | |
Pool # BM3090, 3.50%, 2/1/2041 | | | 522,984 | | | | 527,379 | |
| | |
Pool # AL0241, 4.00%, 4/1/2041 | | | 136,488 | | | | 140,388 | |
| | |
Pool # AK2386, 3.50%, 2/1/2042 | | | 90,662 | | | | 91,424 | |
| | |
Pool # AO8694, 4.50%, 7/1/2042 | | | 40,000 | | | | 41,427 | |
| | |
Pool # AB6632, 3.50%, 10/1/2042 | | | 707,125 | | | | 713,069 | |
| | |
Pool # AB7391, 2.50%, 12/1/2042 | | | 26,806 | | | | 25,547 | |
| | |
Pool # AB7580, 3.00%, 1/1/2043 | | | 490,673 | | | | 481,974 | |
| | |
Pool # AR2315, 3.50%, 2/1/2043 | | | 246,725 | | | | 248,798 | |
| | |
Pool # AR6770, 4.00%, 3/1/2043 | | | 59,805 | | | | 61,689 | |
| | |
Pool # AU3735, 3.00%, 8/1/2043 | | | 296,461 | | | | 291,204 | |
| | |
Pool # BM3704, 3.00%, 9/1/2043 | | | 89,726 | | | | 87,825 | |
| | |
Pool # AL7696, 3.00%, 12/1/2043 | | | 138,936 | | | | 136,473 | |
| | |
Pool # AV4894, 4.50%, 12/1/2043 | | | 199,020 | | | | 210,682 | |
| | |
Pool # AS1557, 4.00%, 1/1/2044 | | | 129,114 | | | | 132,839 | |
| | |
Pool # BM5365, 4.00%, 3/1/2044 | | | 198,364 | | | | 204,015 | |
| | |
Pool # AS2700, 4.00%, 6/1/2044 | | | 177,994 | | | | 183,816 | |
| | |
Pool # AL9569, 5.00%, 8/1/2044 | | | 407,440 | | | | 438,232 | |
| | |
Pool # AS3710, 4.00%, 11/1/2044 | | | 79,803 | | | | 82,114 | |
| | |
Pool # BM5171, 4.00%, 1/1/2045 | | | 131,065 | | | | 134,799 | |
| | |
Pool # AS4402, 3.50%, 2/1/2045 | | | 250,000 | | | | 252,025 | |
| | |
Pool # AS5570, 3.50%, 8/1/2045 | | | 149,724 | | | | 150,199 | |
| | | | | | | | |
| INVESTMENTS | | PRINCIPAL
AMOUNT ($) | | | VALUE ($) | |
| | | | | | | | |
| | |
Pool # AS5851, 4.50%, 9/1/2045 | | | 57,657 | | | | 59,967 | |
| | |
Pool # AS6196, 3.50%, 11/1/2045 | | | 79,402 | | | | 79,689 | |
| | |
Pool # AS6613, 4.00%, 2/1/2046 | | | 122,083 | | | | 124,917 | |
| | |
Pool # AL9128, 4.50%, 2/1/2046 | | | 79,153 | | | | 83,145 | |
| | |
Pool # AL8936, 4.50%, 5/1/2046 | | | 45,818 | | | | 47,637 | |
| | |
Pool # MA2806, 3.00%, 11/1/2046 (g) | | | 711,054 | | | | 695,360 | |
| | |
Pool # AL9916, 4.00%, 2/1/2047 | | | 199,665 | | | | 204,132 | |
| | |
Pool # MA2920, 3.00%, 3/1/2047 | | | 99,465 | | | | 97,269 | |
| | |
Pool # AS8966, 4.00%, 3/1/2047 | | | 560,236 | | | | 573,009 | |
| | |
Pool # MA3237, 3.00%, 1/1/2048 | | | 895,003 | | | | 874,706 | |
| | |
Pool # MA3276, 3.50%, 2/1/2048 | | | 248,615 | | | | 248,944 | |
| | |
Pool # MA3332, 3.50%, 4/1/2048 | | | 67,681 | | | | 67,730 | |
| | |
Pool # CA2687, 3.00%, 5/1/2048 | | | 49,754 | | | | 48,743 | |
| | |
Pool # BM4757, 3.50%, 7/1/2048 | | | 197,597 | | | | 198,341 | |
| | |
Pool # MA3414, 3.50%, 7/1/2048 | | | 99,672 | | | | 99,743 | |
| | |
Pool # MA3495, 4.00%, 10/1/2048 | | | 268,425 | | | | 273,793 | |
| | |
Pool # MA3603, 3.00%, 2/1/2049 | | | 40,951 | | | | 40,022 | |
| | |
Pool # MA3592, 4.00%, 2/1/2049 | | | 520,917 | | | | 531,333 | |
| | |
Pool # MA3593, 4.50%, 2/1/2049 | | | 405,131 | | | | 419,475 | |
| | |
GNMA I, 30 Year, Single Family | | | | | | | | |
| | |
Pool # AL9314, 3.00%, 3/15/2045 | | | 147,626 | | | | 145,968 | |
| | |
Pool # BE6231, 3.50%, 2/15/2048 | | | 99,606 | | | | 100,569 | |
| | |
Pool # BF1292, 4.00%, 3/15/2048 | | | 90,452 | | | | 92,917 | |
| | |
Pool # AF8266, 3.50%, 10/15/2048 | | | 100,415 | | | | 101,310 | |
| | |
GNMA II, 30 Year, Single Family | | | | | | | | |
| | |
Pool # 3330, 4.50%, 12/20/2032 | | | 26,890 | | | | 28,112 | |
| | |
Pool # 3388, 4.50%, 5/20/2033 | | | 13,958 | | | | 14,580 | |
| | |
Pool # 3459, 5.50%, 10/20/2033 | | | 32,904 | | | | 35,896 | |
| | |
Pool # 3554, 4.50%, 5/20/2034 | | | 7,514 | | | | 7,843 | |
| | |
Pool # 3736, 5.50%, 7/20/2035 | | | 26,350 | | | | 29,015 | |
| | |
Pool # 4222, 6.00%, 8/20/2038 | | | 26,284 | | | | 28,605 | |
| | |
Pool # 4446, 4.50%, 5/20/2039 | | | 7,626 | | | | 8,005 | |
| | |
Pool # 4468, 4.50%, 6/20/2039 | | | 7,219 | | | | 7,581 | |
| | |
Pool # 4495, 4.50%, 7/20/2039 | | | 30,561 | | | | 32,077 | |
| | |
Pool # 4519, 4.50%, 8/20/2039 | | | 11,402 | | | | 11,968 | |
| | |
Pool # 4558, 4.50%, 10/20/2039 | | | 9,327 | | | | 9,789 | |
| | |
Pool # 4598, 4.50%, 12/20/2039 | | | 18,420 | | | | 19,333 | |
| | |
Pool # 4617, 4.50%, 1/20/2040 | | | 24,108 | | | | 25,304 | |
| | |
Pool # 4636, 4.50%, 2/20/2040 | | | 14,078 | | | | 14,776 | |
| | |
Pool # 4656, 4.00%, 3/20/2040 | | | 28,494 | | | | 29,503 | |
| | |
Pool # 4677, 4.00%, 4/20/2040 | | | 191,684 | | | | 198,507 | |
| | |
Pool # 4678, 4.50%, 4/20/2040 | | | 3,540 | | | | 3,716 | |
| | |
Pool # 4695, 4.00%, 5/20/2040 | | | 8,951 | | | | 9,324 | |
| | |
Pool # 4696, 4.50%, 5/20/2040 | | | 3,685 | | | | 3,867 | |
| | |
Pool # 4712, 4.00%, 6/20/2040 | | | 13,020 | | | | 13,481 | |
| | |
Pool # 4800, 4.00%, 9/20/2040 | | | 14,904 | | | | 15,453 | |
SEE NOTES TO FINANCIAL STATEMENTS.
| | | | | | |
| | | |
| 92 | | | | J.P. MORGAN EXCHANGE-TRADED FUNDS | | FEBRUARY 28, 2019 |
| | | | | | | | |
| INVESTMENTS | | PRINCIPAL
AMOUNT ($) | | | VALUE ($) | |
Mortgage-Backed Securities — continued | | | | | | | | |
| | |
Pool # 4976, 3.50%, 3/20/2041 | | | 30,843 | | | | 31,351 | |
| | |
Pool # 4977, 4.00%, 3/20/2041 | | | 53,042 | | �� | | 54,926 | |
| | |
Pool # 5016, 4.00%, 4/20/2041 | | | 20,313 | | | | 21,033 | |
| | |
Pool # 5054, 4.00%, 5/20/2041 | | | 32,551 | | | | 33,704 | |
| | |
Pool # 5114, 4.00%, 7/20/2041 | | | 4,455 | | | | 4,613 | |
| | |
Pool # 5233, 4.00%, 11/20/2041 | | | 5,176 | | | | 5,359 | |
| | |
Pool # 5259, 4.00%, 12/20/2041 | | | 19,644 | | | | 20,339 | |
| | |
Pool # 5279, 3.50%, 1/20/2042 | | | 24,410 | | | | 24,772 | |
| | |
Pool # 5330, 3.00%, 3/20/2042 | | | 37,256 | | | | 37,082 | |
| | |
Pool # MA0534, 3.50%, 11/20/2042 | | | 173,477 | | | | 175,906 | |
| | |
Pool # 783755, 3.00%, 4/20/2043 | | | 215,036 | | | | 214,048 | |
| | |
Pool # 783976, 3.50%, 4/20/2043 | | | 79,238 | | | | 80,347 | |
| | |
Pool # MA1376, 4.00%, 10/20/2043 | | | 320,624 | | | | 331,585 | |
| | |
Pool # 784026, 3.50%, 12/20/2044 | | | 249,387 | | | | 251,716 | |
| | |
Pool # MA2678, 3.50%, 3/20/2045 | | | 506,089 | | | | 511,288 | |
| | |
Pool # 784016, 3.50%, 4/20/2045 | | | 59,363 | | | | 60,124 | |
| | |
Pool # MA2754, 3.50%, 4/20/2045 | | | 24,708 | | | | 24,962 | |
| | |
Pool # 626942, 3.00%, 5/20/2045 | | | 223,464 | | | | 219,381 | |
| | |
Pool # MA2829, 5.00%, 5/20/2045 | | | 69,393 | | | | 74,048 | |
| | |
Pool # AN2972, 4.00%, 9/20/2045 | | | 191,948 | | | | 196,969 | |
| | |
Pool # 784623, 3.50%, 10/20/2045 | | | 148,270 | | | | 149,834 | |
| | |
Pool # AQ3441, 4.00%, 2/20/2046 | | | 46,352 | | | | 47,596 | |
| | |
Pool # AS2837, 3.50%, 3/20/2046 | | | 526,088 | | | | 528,695 | |
| | |
Pool # AS4942, 4.00%, 5/20/2046 | | | 43,473 | | | | 45,126 | |
| | |
Pool # MA3735, 3.00%, 6/20/2046 | | | 854,202 | | | | 844,465 | |
| | |
Pool # MA4002, 2.50%, 10/20/2046 | | | 147,519 | | | | 141,369 | |
| | |
Pool # MA4654, 4.50%, 8/20/2047 | | | 194,282 | | | | 201,187 | |
| | |
Pool # 784474, 3.50%, 2/20/2048 | | | 298,023 | | | | 300,237 | |
| | |
Pool # MA5265, 4.50%, 6/20/2048 | | | 80,000 | | | | 82,853 | |
| | |
Pool # MA5331, 4.50%, 7/20/2048 | | | 297,735 | | | | 308,294 | |
| | |
Pool # MA5332, 5.00%, 7/20/2048 | | | 179,616 | | | | 187,273 | |
| | |
Pool # MA5651, 4.00%, 12/20/2048 | | | 536,764 | | | | 551,279 | |
| | |
Pool # MA5709, 3.50%, 1/20/2049 | | | 571,522 | | | | 576,776 | |
| | |
Pool # MA5762, 3.50%, 2/20/2049 | | | 650,000 | | | | 655,975 | |
| | | | | | | | |
| | |
Total Mortgage-Backed Securities
(Cost $27,695,294) | | | | | | | 27,732,171 | |
| | | | | | | | |
Corporate Bonds — 25.4% | | | | | | | | |
| | |
Aerospace & Defense — 0.7% | | | | | | | | |
| | |
Boeing Co. (The) | | | | | | | | |
| | |
1.65%, 10/30/2020 | | | 75,000 | | | | 73,616 | |
| | |
2.80%, 3/1/2023 | | | 26,000 | | | | 26,047 | |
| | |
3.45%, 11/1/2028 | | | 75,000 | | | | 75,954 | |
| | |
3.55%, 3/1/2038 | | | 260,000 | | | | 248,687 | |
| | |
3.38%, 6/15/2046 | | | 25,000 | | | | 22,572 | |
| | |
Hexcel Corp. 3.95%, 2/15/2027 | | | 50,000 | | | | 48,778 | |
| | |
Huntington Ingalls Industries, Inc. 3.48%, 12/1/2027 | | | 50,000 | | | | 47,911 | |
| | | | | | | | |
| INVESTMENTS | | PRINCIPAL
AMOUNT ($) | | | VALUE ($) | |
| | | | | | | | |
| | |
Aerospace & Defense — continued | | | | | | | | |
| | |
Spirit AeroSystems, Inc. | | | | | | | | |
| | |
3.85%, 6/15/2026 | | | 50,000 | | | | 48,002 | |
| | |
4.60%, 6/15/2028 | | | 55,000 | | | | 54,682 | |
| | | | | | | | |
| | |
| | | | | | | 646,249 | |
| | | | | | | | |
| | |
Auto Components — 0.1% | | | | | | | | |
| | |
Lear Corp. | | | | | | | | |
| | |
5.25%, 1/15/2025 | | | 65,000 | | | | 66,717 | |
| | |
3.80%, 9/15/2027 | | | 28,000 | | | | 26,063 | |
| | | | | | | | |
| | |
| | | | | | | 92,780 | |
| | | | | | | | |
| | |
Banks — 3.6% | | | | | | | | |
| | |
Bancolombia SA (Colombia) 5.95%, 6/3/2021 | | | 200,000 | | | | 209,250 | |
| | |
Bank of Nova Scotia (The) (Canada) 1.88%, 4/26/2021 | | | 30,000 | | | | 29,357 | |
| | |
BankUnited, Inc. 4.88%, 11/17/2025 | | | 61,000 | | | | 62,200 | |
| | |
Canadian Imperial Bank of Commerce (Canada) | | | | | | | | |
| | |
2.70%, 2/2/2021 | | | 100,000 | | | | 99,669 | |
| | |
3.50%, 9/13/2023 | | | 217,000 | | | | 219,912 | |
| | |
Comerica, Inc. 3.70%, 7/31/2023 | | | 100,000 | | | | 101,308 | |
| | |
Commonwealth Bank of Australia (Australia) 2.55%, 3/15/2021 | | | 250,000 | | | | 247,222 | |
| | |
Discover Bank 4.20%, 8/8/2023 | | | 250,000 | | | | 255,464 | |
| | |
Huntington Bancshares, Inc. 2.30%, 1/14/2022 | | | 110,000 | | | | 107,356 | |
| | |
Kreditanstalt fuer Wiederaufbau (Germany) | | | | | | | | |
| | |
2.63%, 4/12/2021 | | | 145,000 | | | | 144,985 | |
| | |
2.50%, 2/15/2022 | | | 25,000 | | | | 24,924 | |
| | |
2.13%, 3/7/2022 | | | 100,000 | | | | 98,627 | |
| | |
2.88%, 4/3/2028 | | | 190,000 | | | | 190,119 | |
| | |
0.00%, 6/29/2037 | | | 25,000 | | | | 13,525 | |
| | |
Landwirtschaftliche Rentenbank (Germany) | | | | | | | | |
| | |
3.13%, 11/14/2023 | | | 31,000 | | | | 31,623 | |
| | |
2.00%, 1/13/2025 | | | 25,000 | | | | 24,018 | |
| | |
M&T Bank Corp. 3.55%, 7/26/2023 | | | 208,000 | | | | 211,017 | |
| | |
Oesterreichische Kontrollbank AG (Austria) 3.13%, 11/7/2023 | | | 50,000 | | | | 50,901 | |
| | |
Regions Financial Corp. | | | | | | | | |
| | |
3.20%, 2/8/2021 | | | 100,000 | | | | 100,131 | |
| | |
2.75%, 8/14/2022 | | | 97,000 | | | | 95,015 | |
| | |
Royal Bank of Canada (Canada) | | | | | | | | |
| | |
2.13%, 3/2/2020 | | | 35,000 | | | | 34,760 | |
| | |
2.50%, 1/19/2021 | | | 70,000 | | | | 69,480 | |
| | |
2.75%, 2/1/2022 | | | 204,000 | | | | 203,333 | |
| | |
3.70%, 10/5/2023 | | | 100,000 | | | | 101,731 | |
SEE NOTES TO FINANCIAL STATEMENTS.
| | | | | | | | |
| | | |
| FEBRUARY 28, 2019 | | J.P. MORGAN EXCHANGE-TRADED FUNDS | | | | | 93 | |
JPMorgan U.S. Aggregate Bond ETF
SCHEDULE OF PORTFOLIO INVESTMENTS
AS OF FEBRUARY 28, 2019 (continued)
| | | | | | | | |
| INVESTMENTS | | PRINCIPAL
AMOUNT ($) | | | VALUE ($) | |
Corporate Bonds — continued | | | | | | | | |
| | |
Banks — continued | | | | | | | | |
| | |
Skandinaviska Enskilda Banken AB (Sweden) 1.88%, 9/13/2021 | | | 250,000 | | | | 241,820 | |
| | |
SunTrust Bank | | | | | | | | |
| | |
2.45%, 8/1/2022 | | | 27,000 | | | | 26,442 | |
| | |
(ICE LIBOR USD 3 Month + 0.59%), 3.50%, 8/2/2022(a) | | | 51,000 | | | | 51,344 | |
| | |
SunTrust Banks, Inc. | | | | | | | | |
| | |
2.90%, 3/3/2021 | | | 108,000 | | | | 107,706 | |
| | |
2.70%, 1/27/2022 | | | 105,000 | | | | 103,824 | |
| | |
4.00%, 5/1/2025 | | | 164,000 | | | | 169,020 | |
| | |
SVB Financial Group | | | | | | | | |
| | |
5.38%, 9/15/2020 | | | 26,000 | | | | 26,747 | |
| | |
3.50%, 1/29/2025 | | | 50,000 | | | | 48,483 | |
| | |
Synovus Financial Corp. 3.13%, 11/1/2022 | | | 50,000 | | | | 48,313 | |
| | | | | | | | |
| | |
| | | | | | | 3,549,626 | |
| | | | | | | | |
| | |
Biotechnology — 0.4% | | | | | | | | |
| | |
Biogen, Inc. | | | | | | | | |
| | |
3.63%, 9/15/2022 | | | 193,000 | | | | 195,744 | |
| | |
4.05%, 9/15/2025 | | | 60,000 | | | | 60,922 | |
| | |
5.20%, 9/15/2045 | | | 94,000 | | | | 98,619 | |
| | | | | | | | |
| | |
| | | | | | | 355,285 | |
| | | | | | | | |
| | |
Building Products — 0.0%(b) | | | | | | | | |
| | |
Lennox International, Inc. 3.00%, 11/15/2023 | | | 25,000 | | | | 24,038 | |
| | | | | | | | |
| | |
Capital Markets — 2.6% | | | | | | | | |
| | |
Affiliated Managers Group, Inc. 4.25%, 2/15/2024 | | | 53,000 | | | | 54,438 | |
| | |
Ameriprise Financial, Inc. | | | | | | | | |
| | |
4.00%, 10/15/2023 | | | 55,000 | | | | 56,578 | |
| | |
3.70%, 10/15/2024 | | | 47,000 | | | | 47,609 | |
| | |
2.88%, 9/15/2026 | | | 37,000 | | | | 35,198 | |
| | |
Apollo Investment Corp. 5.25%, 3/3/2025 | | | 30,000 | | | | 28,786 | |
| | |
BGC Partners, Inc. 5.38%, 7/24/2023 | | | 32,000 | | | | 32,191 | |
| | |
BlackRock, Inc. | | | | | | | | |
| | |
4.25%, 5/24/2021 | | | 130,000 | | | | 133,942 | |
| | |
3.38%, 6/1/2022 | | | 75,000 | | | | 75,986 | |
| | |
3.50%, 3/18/2024 | | | 120,000 | | | | 122,133 | |
| | |
3.20%, 3/15/2027 | | | 120,000 | | | | 117,990 | |
| | |
Brookfield Asset Management, Inc. (Canada) 4.00%, 1/15/2025 | | | 47,000 | | | | 46,477 | |
| | |
Brookfield Finance, Inc. (Canada) | | | | | | | | |
| | |
4.25%, 6/2/2026 | | | 71,000 | | | | 69,874 | |
| | |
3.90%, 1/25/2028 | | | 53,000 | | | | 49,760 | |
| | | | | | | | |
| INVESTMENTS | | PRINCIPAL
AMOUNT ($) | | | VALUE ($) | |
| | | | | | | | |
| | |
Capital Markets — continued | | | | | | | | |
| | |
CME Group, Inc. | | | | | | | | |
| | |
3.75%, 6/15/2028 | | | 54,000 | | | | 55,203 | |
| | |
5.30%, 9/15/2043 | | | 100,000 | | | | 119,212 | |
| | |
Eaton Vance Corp. 3.63%, 6/15/2023 | | | 51,000 | | | | 51,709 | |
| | |
Intercontinental Exchange, Inc. | | | | | | | | |
| | |
2.75%, 12/1/2020 | | | 40,000 | | | | 39,885 | |
| | |
2.35%, 9/15/2022 | | | 40,000 | | | | 39,119 | |
| | |
4.00%, 10/15/2023 | | | 125,000 | | | | 130,132 | |
| | |
3.10%, 9/15/2027 | | | 115,000 | | | | 111,239 | |
| | |
3.75%, 9/21/2028 | | | 25,000 | | | | 25,261 | |
| | |
4.25%, 9/21/2048 | | | 75,000 | | | | 75,851 | |
| | |
Janus Capital Group, Inc. (United Kingdom) 4.88%, 8/1/2025 | | | 25,000 | | | | 25,478 | |
| | |
Lazard Group LLC | | | | | | | | |
| | |
3.75%, 2/13/2025 | | | 50,000 | | | | 49,154 | |
| | |
3.63%, 3/1/2027 | | | 170,000 | | | | 162,748 | |
| | |
4.50%, 9/19/2028 | | | 100,000 | | | | 101,420 | |
| | |
Nasdaq, Inc. | | | | | | | | |
| | |
4.25%, 6/1/2024 | | | 50,000 | | | | 50,978 | |
| | |
3.85%, 6/30/2026 | | | 100,000 | | | | 97,991 | |
| | |
S&P Global, Inc. | | | | | | | | |
| | |
3.30%, 8/14/2020 | | | 40,000 | | | | 40,126 | |
| | |
2.95%, 1/22/2027 | | | 125,000 | | | | 118,665 | |
| | |
4.50%, 5/15/2048 | | | 119,000 | | | | 121,797 | |
| | |
Stifel Financial Corp. | | | | | | | | |
| | |
3.50%, 12/1/2020 | | | 75,000 | | | | 75,021 | |
| | |
4.25%, 7/18/2024 | | | 26,000 | | | | 26,212 | |
| | |
TD Ameritrade Holding Corp. | | | | | | | | |
| | |
2.95%, 4/1/2022 | | | 103,000 | | | | 102,933 | |
| | |
3.75%, 4/1/2024 | | | 75,000 | | | | 76,383 | |
| | |
3.30%, 4/1/2027 | | | 26,000 | | | | 25,385 | |
| | | | | | | | |
| | |
| | | | | | | 2,592,864 | |
| | | | | | | | |
| | |
Chemicals — 1.2% | | | | | | | | |
| | |
Ecolab, Inc. | | | | | | | | |
| | |
4.35%, 12/8/2021 | | | 25,000 | | | | 25,904 | |
| | |
5.50%, 12/8/2041 | | | 60,000 | | | | 69,145 | |
| | |
3.95%, 12/1/2047 | | | 197,000 | | | | 192,569 | |
| | |
International Flavors & Fragrances, Inc. 3.40%, 9/25/2020 | | | 43,000 | | | | 43,170 | |
| | |
LYB International Finance BV | | | | | | | | |
| | |
4.00%, 7/15/2023 | | | 237,000 | | | | 238,861 | |
| | |
5.25%, 7/15/2043 | | | 75,000 | | | | 73,399 | |
| | |
4.88%, 3/15/2044 | | | 26,000 | | | | 24,374 | |
| | |
LYB International Finance II BV 3.50%, 3/2/2027 | | | 25,000 | | | | 23,367 | |
SEE NOTES TO FINANCIAL STATEMENTS.
| | | | | | |
| | | |
| 94 | | | | J.P. MORGAN EXCHANGE-TRADED FUNDS | | FEBRUARY 28, 2019 |
| | | | | | | | |
| INVESTMENTS | | PRINCIPAL
AMOUNT ($) | | | VALUE ($) | |
Corporate Bonds — continued | | | | | | | | |
| | |
Chemicals — continued | | | | | | | | |
| | |
LyondellBasell Industries NV | | | | | | | | |
| | |
6.00%, 11/15/2021 | | | 100,000 | | | | 105,825 | |
| | |
4.63%, 2/26/2055 | | | 95,000 | | | | 81,747 | |
| | |
Methanex Corp. (Canada) 4.25%, 12/1/2024 | | | 26,000 | | | | 25,032 | |
| | |
NewMarket Corp. 4.10%, 12/15/2022 | | | 50,000 | | | | 50,881 | |
| | |
SASOL Financing USA LLC (South Africa) 5.88%, 3/27/2024 | | | 200,000 | | | | 206,490 | |
| | | | | | | | |
| | |
| | | | | | | 1,160,764 | |
| | | | | | | | |
| | |
Commercial Services & Supplies — 0.1% | | | | | | | | |
| | |
RELX Capital, Inc. (United Kingdom) | | | | | | | | |
| | |
3.13%, 10/15/2022 | | | 35,000 | | | | 34,439 | |
| | |
3.50%, 3/16/2023 | | | 77,000 | | | | 76,673 | |
| | | | | | | | |
| | |
| | | | | | | 111,112 | |
| | | | | | | | |
| | |
Communications Equipment — 0.2% | | | | | | | | |
| | |
Motorola Solutions, Inc. | | | | | | | | |
| | |
3.50%, 9/1/2021 | | | 90,000 | | | | 90,130 | |
| | |
3.75%, 5/15/2022 | | | 74,000 | | | | 74,307 | |
| | |
4.00%, 9/1/2024 | | | 50,000 | | | | 49,986 | |
| | | | | | | | |
| | |
| | | | | | | 214,423 | |
| | | | | | | | |
| | |
Consumer Finance — 1.8% | | | | | | | | |
| | |
American Express Co. | | | | | | | | |
| | |
3.38%, 5/17/2021 | | | 40,000 | | | | 40,306 | |
| | |
2.50%, 8/1/2022 | | | 40,000 | | | | 39,163 | |
| | |
3.40%, 2/27/2023 | | | 40,000 | | | | 40,264 | |
| | |
3.00%, 10/30/2024 | | | 28,000 | | | | 27,340 | |
| | |
4.05%, 12/3/2042 | | | 235,000 | | | | 231,241 | |
| | |
American Express Credit Corp. | | | | | | | | |
| | |
2.70%, 3/3/2022 | | | 70,000 | | | | 69,577 | |
| | |
3.30%, 5/3/2027 | | | 111,000 | | | | 110,178 | |
| | |
Capital One Financial Corp. | | | | | | | | |
| | |
2.50%, 5/12/2020 | | | 344,000 | | | | 341,683 | |
| | |
2.40%, 10/30/2020 | | | 25,000 | | | | 24,699 | |
| | |
4.75%, 7/15/2021 | | | 30,000 | | | | 30,942 | |
| | |
3.30%, 10/30/2024 | | | 57,000 | | | | 55,072 | |
| | |
3.80%, 1/31/2028 | | | 40,000 | | | | 38,441 | |
| | |
Discover Financial Services | | | | | | | | |
| | |
3.85%, 11/21/2022 | | | 100,000 | | | | 100,580 | |
| | |
3.95%, 11/6/2024 | | | 25,000 | | | | 24,744 | |
| | |
3.75%, 3/4/2025 | | | 104,000 | | | | 101,414 | |
| | |
4.10%, 2/9/2027 | | | 35,000 | | | | 34,061 | |
| | |
Synchrony Financial | | | | | | | | |
| | |
3.75%, 8/15/2021 | | | 280,000 | | | | 280,613 | |
| | |
4.25%, 8/15/2024 | | | 50,000 | | | | 49,012 | |
| | | | | | | | |
| INVESTMENTS | | PRINCIPAL
AMOUNT ($) | | | VALUE ($) | |
| | | | | | | | |
| | |
Consumer Finance — continued | | | | | | | | |
| | |
4.50%, 7/23/2025 | | | 25,000 | | | | 24,402 | |
| | |
3.70%, 8/4/2026 | | | 69,000 | | | | 62,863 | |
| | | | | | | | |
| | |
| | | | | | | 1,726,595 | |
| | | | | | | | |
| | |
Containers & Packaging — 0.1% | | | | | | | | |
| | |
Sonoco Products Co. 5.75%, 11/1/2040 | | | 65,000 | | | | 70,435 | |
| | | | | | | | |
| | |
Diversified Financial Services — 0.0%(b) | | | | | | | | |
| | |
Private Export Funding Corp. Series LL, 2.25%, 3/15/2020 | | | 29,000 | | | | 28,900 | |
| | | | | | | | |
| |
Diversified Telecommunication Services — 0.6% | | | | | |
| | |
TELUS Corp. (Canada) | | | | | | | | |
| | |
2.80%, 2/16/2027 | | | 50,000 | | | | 46,628 | |
| | |
4.60%, 11/16/2048 | | | 62,000 | | | | 62,198 | |
| | |
Verizon Communications, Inc. | | | | | | | | |
| | |
3.38%, 2/15/2025 | | | 6,000 | | | | 5,998 | |
| | |
4.02%, 12/3/2029 | | | 163,000 | | | | 163,544 | |
| | |
4.33%, 9/21/2028 | | | 25,000 | | | | 25,870 | |
| | |
7.75%, 12/1/2030 | | | 51,000 | | | | 66,112 | |
| | |
4.40%, 11/1/2034 | | | 91,000 | | | | 91,091 | |
| | |
4.81%, 3/15/2039 | | | 25,000 | | | | 25,710 | |
| | |
4.52%, 9/15/2048 | | | 28,000 | | | | 27,478 | |
| | |
5.01%, 4/15/2049 | | | 62,000 | | | | 64,898 | |
| | |
4.67%, 3/15/2055 | | | 25,000 | | | | 24,356 | |
| | | | | | | | |
| | |
| | | | | | | 603,883 | |
| | | | | | | | |
| | |
Electric Utilities — 1.2% | | | | | | | | |
| | |
Arizona Public Service Co. | | | | | | | | |
| | |
3.15%, 5/15/2025 | | | 10,000 | | | | 9,840 | |
| | |
2.95%, 9/15/2027 | | | 130,000 | | | | 123,746 | |
| | |
5.05%, 9/1/2041 | | | 25,000 | | | | 27,005 | |
| | |
4.20%, 8/15/2048 | | | 39,000 | | | | 38,015 | |
| | |
Avangrid, Inc. 3.15%, 12/1/2024 | | | 25,000 | | | | 24,266 | |
| | |
Baltimore Gas & Electric Co. | | | | | | | | |
| | |
2.40%, 8/15/2026 | | | 65,000 | | | | 60,152 | |
| | |
3.50%, 8/15/2046 | | | 156,000 | | | | 138,555 | |
| | |
DTE Electric Co. 4.30%, 7/1/2044 | | | 51,000 | | | | 52,179 | |
| | |
Enel Americas SA (Chile) 4.00%, 10/25/2026 | | | 185,000 | | | | 180,375 | |
| | |
Enel Chile SA (Chile) 4.88%, 6/12/2028 | | | 26,000 | | | | 26,764 | |
| | |
Exelon Corp. | | | | | | | | |
| | |
5.15%, 12/1/2020 | | | 60,000 | | | | 61,669 | |
| | |
4.95%, 6/15/2035 | | | 99,000 | | | | 101,580 | |
| | |
5.10%, 6/15/2045 | | | 25,000 | | | | 26,514 | |
| | |
Kansas City Power & Light Co. 4.20%, 6/15/2047 | | | 51,000 | | | | 49,174 | |
SEE NOTES TO FINANCIAL STATEMENTS.
| | | | | | | | |
| | | |
| FEBRUARY 28, 2019 | | J.P. MORGAN EXCHANGE-TRADED FUNDS | | | | | 95 | |
JPMorgan U.S. Aggregate Bond ETF
SCHEDULE OF PORTFOLIO INVESTMENTS
AS OF FEBRUARY 28, 2019 (continued)
| | | | | | | | |
| INVESTMENTS | | PRINCIPAL
AMOUNT ($) | | | VALUE ($) | |
Corporate Bonds — continued | | | | | | | | |
| | |
Electric Utilities — continued | | | | | | | | |
| | |
NextEra Energy Capital Holdings, Inc. | | | | | | | | |
| | |
Series H, 3.34%, 9/1/2020 | | | 25,000 | | | | 25,114 | |
| | |
2.80%, 1/15/2023 | | | 75,000 | | | | 73,231 | |
| | |
3.55%, 5/1/2027 | | | 38,000 | | | | 37,085 | |
| | |
Public Service Electric & Gas Co. | | | | | | | | |
| | |
2.38%, 5/15/2023 | | | 70,000 | | | | 68,251 | |
| | |
3.00%, 5/15/2025 | | | 25,000 | | | | 24,508 | |
| | |
3.65%, 9/1/2042 | | | 72,000 | | | | 67,561 | |
| | | | | | | | |
| | |
| | | | | | | 1,215,584 | |
| | | | | | | | |
|
Electronic Equipment, Instruments & Components — 0.1% | |
| | |
Allegion US Holding Co., Inc. 3.55%, 10/1/2027 | | | 70,000 | | | | 64,719 | |
| | | | | | | | |
| |
Energy Equipment & Services — 0.0%(b) | | | | | |
| | |
Helmerich & Payne, Inc. 4.65%, 3/15/2025 (c) | | | 30,000 | | | | 30,642 | |
| | | | | | | | |
| |
Entertainment — 0.1% | | | | | |
| | |
Electronic Arts, Inc. 4.80%, 3/1/2026 | | | 55,000 | | | | 57,678 | |
| | | | | | | | |
| |
Equity Real Estate Investment Trusts (REITs) — 0.1% | | | | | |
| | |
Rayonier, Inc. 3.75%, 4/1/2022 | | | 50,000 | | | | 49,817 | |
| | | | | | | | |
| | |
Food & Staples Retailing — 0.5% | | | | | | | | |
| | |
Ahold Finance USA LLC (Netherlands) 6.88%, 5/1/2029 | | | 55,000 | | | | 64,646 | |
| | |
Koninklijke Ahold Delhaize NV (Netherlands) 5.70%, 10/1/2040 | | | 25,000 | | | | 26,847 | |
| | |
Sysco Corp. | | | | | | | | |
| | |
3.75%, 10/1/2025 | | | 25,000 | | | | 25,044 | |
| | |
3.30%, 7/15/2026 | | | 150,000 | | | | 144,975 | |
| | |
3.25%, 7/15/2027 | | | 85,000 | | | | 81,567 | |
| | |
4.85%, 10/1/2045 | | | 25,000 | | | | 26,023 | |
| | |
4.45%, 3/15/2048 | | | 105,000 | | | | 102,006 | |
| | | | | | | | |
| | |
| | | | | | | 471,108 | |
| | | | | | | | |
| | |
Food Products — 0.1% | | | | | | | | |
| | |
Ingredion, Inc. 3.20%, 10/1/2026 | | | 65,000 | | | | 60,137 | |
| | | | | | | | |
| | |
Gas Utilities — 0.1% | | | | | | | | |
| | |
National Fuel Gas Co. | | | | | | | | |
| | |
3.75%, 3/1/2023 | | | 71,000 | | | | 70,033 | |
| | |
5.20%, 7/15/2025 | | | 50,000 | | | | 51,279 | |
| | |
3.95%, 9/15/2027 | | | 15,000 | | | | 13,946 | |
| | | | | | | | |
| | |
| | | | | | | 135,258 | |
| | | | | | | | |
| |
Health Care Equipment & Supplies — 0.8% | | | | | |
| | |
Baxter International, Inc. | | | | | | | | |
| | |
1.70%, 8/15/2021 | | | 25,000 | | | | 24,161 | |
| | |
2.60%, 8/15/2026 | | | 26,000 | | | | 24,199 | |
| | |
3.50%, 8/15/2046 | | | 50,000 | | | | 41,410 | |
| | | | | | | | |
| INVESTMENTS | | PRINCIPAL
AMOUNT ($) | | | VALUE ($) | |
| | | | | | | | |
| |
Health Care Equipment & Supplies — continued | | | | | |
| | |
Edwards Lifesciences Corp. 4.30%, 6/15/2028 | | | 37,000 | | | | 37,596 | |
| | |
Koninklijke Philips NV (Netherlands) | | | | | | | | |
| | |
6.88%, 3/11/2038 | | | 56,000 | | | | 72,316 | |
| | |
5.00%, 3/15/2042 | | | 134,000 | | | | 143,952 | |
| | |
Stryker Corp. | | | | | | | | |
| | |
2.63%, 3/15/2021 | | | 105,000 | | | | 104,212 | |
| | |
3.38%, 5/15/2024 | | | 40,000 | | | | 40,148 | |
| | |
3.38%, 11/1/2025 | | | 63,000 | | | | 62,857 | |
| | |
3.65%, 3/7/2028 | | | 219,000 | | | | 218,870 | |
| | | | | | | | |
| | |
| | | | | | | 769,721 | |
| | | | | | | | |
| | |
Health Care Providers & Services — 1.0% | | | | | | | | |
| | |
Cigna Corp. | | | | | | | | |
| | |
3.40%, 9/17/2021 (c) | | | 140,000 | | | | 140,726 | |
| | |
3.75%, 7/15/2023 (c) | | | 140,000 | | | | 141,677 | |
| | |
4.38%, 10/15/2028 (c) | | | 62,000 | | | | 62,847 | |
| | |
4.80%, 8/15/2038 (c) | | | 28,000 | | | | 27,945 | |
| | |
4.90%, 12/15/2048 (c) | | | 106,000 | | | | 105,541 | |
| | |
Express Scripts Holding Co. | | | | | | | | |
| | |
3.90%, 2/15/2022 | | | 25,000 | | | | 25,515 | |
| | |
3.50%, 6/15/2024 | | | 89,000 | | | | 88,055 | |
| | |
4.50%, 2/25/2026 | | | 50,000 | | | | 51,179 | |
| | |
3.40%, 3/1/2027 | | | 176,000 | | | | 167,618 | |
| | |
4.80%, 7/15/2046 | | | 150,000 | | | | 146,701 | |
| | | | | | | | |
| | |
| | | | | | | 957,804 | |
| | | | | | | | |
| | |
Hotels, Restaurants & Leisure — 0.1% | | | | | | | | |
| | |
Darden Restaurants, Inc. | | | | | | | | |
| | |
3.85%, 5/1/2027 | | | 45,000 | | | | 43,418 | |
| | |
4.55%, 2/15/2048 | | | 100,000 | | | | 91,419 | |
| | | | | | | | |
| | |
| | | | | | | 134,837 | |
| | | | | | | | |
| | |
Household Products — 0.2% | | | | | | | | |
| | |
Church & Dwight Co., Inc. 3.95%, 8/1/2047 | | | 65,000 | | | | 59,610 | |
| | |
Clorox Co. (The) | | | | | | | | |
| | |
3.80%, 11/15/2021 | | | 80,000 | | | | 81,478 | |
| | |
3.10%, 10/1/2027 | | | 65,000 | | | | 62,536 | |
| | | | | | | | |
| | |
| | | | | | | 203,624 | |
| | | | | | | | |
|
Independent Power and Renewable Electricity Producers — 0.2% | |
| | |
Enel Generacion Chile SA (Chile) 4.25%, 4/15/2024 | | | 25,000 | | | | 25,373 | |
| | |
Exelon Generation Co. LLC 4.25%, 6/15/2022 | | | 75,000 | | | | 76,722 | |
| | |
PSEG Power LLC | | | | | | | | |
| | |
3.00%, 6/15/2021 | | | 50,000 | | | | 49,515 | |
SEE NOTES TO FINANCIAL STATEMENTS.
| | | | | | |
| | | |
| 96 | | | | J.P. MORGAN EXCHANGE-TRADED FUNDS | | FEBRUARY 28, 2019 |
| | | | | | | | |
| INVESTMENTS | | PRINCIPAL
AMOUNT ($) | | | VALUE ($) | |
Corporate Bonds — continued | | | | | | | | |
|
Independent Power and Renewable Electricity Producers — continued | |
| | |
3.85%, 6/1/2023 | | | 25,000 | | | | 25,169 | |
| | |
8.63%, 4/15/2031 | | | 25,000 | | | | 32,687 | |
| | | | | | | | |
| | |
| | | | | | | 209,466 | |
| | | | | | | | |
| | |
Industrial Conglomerates — 0.1% | | | | | | | | |
| | |
Carlisle Cos., Inc. | | | | | | | | |
| | |
3.75%, 11/15/2022 | | | 25,000 | | | | 24,885 | |
| | |
3.50%, 12/1/2024 | | | 50,000 | | | | 48,858 | |
| | |
3.75%, 12/1/2027 | | | 50,000 | | | | 47,415 | |
| | | | | | | | |
| | |
| | | | | | | 121,158 | |
| | | | | | | | |
| | |
Insurance — 0.1% | | | | | | | | |
| | |
Loews Corp. | | | | | | | | |
| | |
2.63%, 5/15/2023 | | | 50,000 | | | | 48,966 | |
| | |
3.75%, 4/1/2026 | | | 25,000 | | | | 25,067 | |
| | |
6.00%, 2/1/2035 | | | 30,000 | | | | 34,153 | |
| | |
4.13%, 5/15/2043 | | | 25,000 | | | | 23,624 | |
| | | | | | | | |
| | |
| | | | | | | 131,810 | |
| | | | | | | | |
| | |
Interactive Media & Services — 0.2% | | | | | | | | |
| | |
Alphabet, Inc. | | | | | | | | |
| | |
3.63%, 5/19/2021 | | | 95,000 | | | | 97,220 | |
| | |
3.38%, 2/25/2024 | | | 40,000 | | | | 41,068 | |
| | |
2.00%, 8/15/2026 | | | 113,000 | | | | 104,633 | |
| | | | | | | | |
| | |
| | | | | | | 242,921 | |
| | | | | | | | |
| |
Internet & Direct Marketing Retail — 0.1% | | | | | |
| | |
Booking Holdings, Inc. | | | | | | | | |
| | |
2.75%, 3/15/2023 | | | 74,000 | | | | 72,247 | |
| | |
3.60%, 6/1/2026 | | | 26,000 | | | | 25,398 | |
| | |
3.55%, 3/15/2028 | | | 26,000 | | | | 25,032 | |
| | | | | | | | |
| | |
| | | | | | | 122,677 | |
| | | | | | | | |
| | |
IT Services — 0.4% | | | | | | | | |
| | |
Broadridge Financial Solutions, Inc. 3.40%, 6/27/2026 | | | 53,000 | | | | 50,490 | |
| | |
Mastercard, Inc. | | | | | | | | |
| | |
2.00%, 11/21/2021 | | | 100,000 | | | | 98,225 | |
| | |
3.38%, 4/1/2024 | | | 35,000 | | | | 35,717 | |
| | |
3.50%, 2/26/2028 | | | 35,000 | | | | 35,447 | |
| | |
3.80%, 11/21/2046 | | | 89,000 | | | | 87,889 | |
| | |
3.95%, 2/26/2048 | | | 71,000 | | | | 71,367 | |
| | | | | | | | |
| | |
| | | | | | | 379,135 | |
| | | | | | | | |
| | |
Leisure Products — 0.1% | | | | | | | | |
| | |
Hasbro, Inc. 3.50%, 9/15/2027 | | | 95,000 | | | | 88,045 | |
| | | | | | | | |
| | | | | | | | |
| INVESTMENTS | | PRINCIPAL
AMOUNT ($) | | | VALUE ($) | |
| | | | | | | | |
| | |
Life Sciences Tools & Services — 0.1% | | | | | | | | |
| | |
Agilent Technologies, Inc. | | | | | | | | |
| | |
3.20%, 10/1/2022 | | | 68,000 | | | | 67,621 | |
| | |
3.88%, 7/15/2023 | | | 40,000 | | | | 40,668 | |
| | |
Bio-Rad Laboratories, Inc. 4.88%, 12/15/2020 | | | 25,000 | | | | 25,627 | |
| | | | | | | | |
| | |
| | | | | | | 133,916 | |
| | | | | | | | |
| | |
Machinery — 0.1% | | | | | | | | |
| | |
Crane Co. 4.20%, 3/15/2048 | | | 50,000 | | | | 45,252 | |
| | |
Fortive Corp. | | | | | | | | |
| | |
3.15%, 6/15/2026 | | | 40,000 | | | | 38,068 | |
| | |
4.30%, 6/15/2046 | | | 25,000 | | | | 23,498 | |
| | |
IDEX Corp. 4.50%, 12/15/2020 | | | 26,000 | | | | 26,430 | |
| | | | | | | | |
| | |
| | | | | | | 133,248 | |
| | | | | | | | |
| | |
Media — 0.2% | | | | | | | | |
| | |
Interpublic Group of Cos., Inc. (The) | | | | | | | | |
| | |
3.50%, 10/1/2020 | | | 78,000 | | | | 78,386 | |
| | |
3.75%, 10/1/2021 | | | 31,000 | | | | 31,286 | |
| | |
4.65%, 10/1/2028 | | | 80,000 | | | | 80,917 | |
| | | | | | | | |
| | |
| | | | | | | 190,589 | |
| | | | | | | | |
| | |
Metals & Mining — 1.0% | | | | | | | | |
| | |
Rio Tinto Alcan, Inc. (Canada) | | | | | | | | |
| | |
7.25%, 3/15/2031 | | | 50,000 | | | | 64,515 | |
| | |
6.13%, 12/15/2033 | | | 150,000 | | | | 184,047 | |
| | |
Rio Tinto Finance USA Ltd. (Australia) 3.75%, 6/15/2025 | | | 30,000 | | | | 30,935 | |
| | |
Rio Tinto Finance USA plc (Australia) | | | | | | | | |
| | |
4.75%, 3/22/2042 | | | 90,000 | | | | 98,327 | |
| | |
4.13%, 8/21/2042 | | | 83,000 | | | | 83,454 | |
| | |
Vale Overseas Ltd. (Brazil) | | | | | | | | |
| | |
4.38%, 1/11/2022 | | | 50,000 | | | | 50,175 | |
| | |
6.25%, 8/10/2026 | | | 165,000 | | | | 174,281 | |
| | |
6.88%, 11/21/2036 | | | 141,000 | | | | 153,048 | |
| | |
6.88%, 11/10/2039 | | | 100,000 | | | | 109,250 | |
| | |
Vale SA (Brazil) 5.63%, 9/11/2042 | | | 20,000 | | | | 19,420 | |
| | | | | | | | |
| | |
| | | | | | | 967,452 | |
| | | | | | | | |
| | |
Multiline Retail — 0.4% | | | | | | | | |
| | |
Dollar General Corp. | | | | | | | | |
| | |
3.25%, 4/15/2023 | | | 46,000 | | | | 45,331 | |
| | |
4.15%, 11/1/2025 | | | 100,000 | | | | 101,787 | |
| | |
3.88%, 4/15/2027 | | | 40,000 | | | | 39,386 | |
| | |
4.13%, 5/1/2028 | | | 25,000 | | | | 24,848 | |
| | |
Nordstrom, Inc. | | | | | | | | |
| | |
4.00%, 10/15/2021 | | | 38,000 | | | | 38,590 | |
SEE NOTES TO FINANCIAL STATEMENTS.
| | | | | | | | |
| | | |
| FEBRUARY 28, 2019 | | J.P. MORGAN EXCHANGE-TRADED FUNDS | | | | | 97 | |
JPMorgan U.S. Aggregate Bond ETF
SCHEDULE OF PORTFOLIO INVESTMENTS
AS OF FEBRUARY 28, 2019 (continued)
| | | | | | | | |
| INVESTMENTS | | PRINCIPAL
AMOUNT ($) | | | VALUE ($) | |
Corporate Bonds — continued | | | | | | | | |
| | |
Multiline Retail — continued | | | | | | | | |
| | |
4.00%, 3/15/2027 | | | 33,000 | | | | 31,533 | |
| | |
6.95%, 3/15/2028 | | | 50,000 | | | | 56,985 | |
| | |
5.00%, 1/15/2044 | | | 25,000 | | | | 21,393 | |
| | | | | | | | |
| | |
| | | | | | | 359,853 | |
| | | | | | | | |
| | |
Multi-Utilities — 0.2% | | | | | | | | |
| | |
DTE Energy Co. | | | | | | | | |
| | |
Series B, 3.30%, 6/15/2022 | | | 27,000 | | | | 26,883 | |
| | |
3.80%, 3/15/2027 | | | 25,000 | | | | 24,625 | |
| | |
Public Service Enterprise Group, Inc. | | | | | | | | |
| | |
2.00%, 11/15/2021 | | | 55,000 | | | | 53,045 | |
| | |
2.65%, 11/15/2022 | | | 76,000 | | | | 74,215 | |
| | | | | | | | |
| | |
| | | | | | | 178,768 | |
| | | | | | | | |
| | |
Oil, Gas & Consumable Fuels — 3.6% | | | | | | | | |
| | |
Boardwalk Pipelines LP | | | | | | | | |
| | |
3.38%, 2/1/2023 | | | 67,000 | | | | 64,826 | |
| | |
4.95%, 12/15/2024 | | | 25,000 | | | | 25,406 | |
| | |
4.45%, 7/15/2027 | | | 51,000 | | | | 48,260 | |
| | |
Cimarex Energy Co. | | | | | | | | |
| | |
4.38%, 6/1/2024 | | | 50,000 | | | | 50,933 | |
| | |
3.90%, 5/15/2027 | | | 103,000 | | | | 99,436 | |
| | |
Ecopetrol SA (Colombia) | | | | | | | | |
| | |
5.88%, 9/18/2023 | | | 55,000 | | | | 58,988 | |
| | |
5.38%, 6/26/2026 | | | 20,000 | | | | 20,990 | |
| | |
EOG Resources, Inc. | | | | | | | | |
| | |
2.63%, 3/15/2023 | | | 127,000 | | | | 124,324 | |
| | |
3.15%, 4/1/2025 | | | 29,000 | | | | 28,338 | |
| | |
3.90%, 4/1/2035 | | | 113,000 | | | | 110,360 | |
| | |
Equinor ASA (Norway) 3.63%, 9/10/2028 | | | 56,000 | | | | 56,945 | |
| | |
HollyFrontier Corp. 5.88%, 4/1/2026 | | | 50,000 | | | | 52,725 | |
| | |
Husky Energy, Inc. (Canada) | | | | | | | | |
| | |
3.95%, 4/15/2022 | | | 73,000 | | | | 73,872 | |
| | |
6.80%, 9/15/2037 | | | 63,000 | | | | 75,245 | |
| | |
Magellan Midstream Partners LP | | | | | | | | |
| | |
4.25%, 2/1/2021 | | | 80,000 | | | | 81,495 | |
| | |
5.00%, 3/1/2026 | | | 72,000 | | | | 76,569 | |
| | |
5.15%, 10/15/2043 | | | 55,000 | | | | 56,926 | |
| | |
4.25%, 9/15/2046 | | | 75,000 | | | | 69,711 | |
| | |
Marathon Petroleum Corp. | | | | | | | | |
| | |
5.13%, 3/1/2021 | | | 50,000 | | | | 51,715 | |
| | |
4.75%, 12/15/2023 (c) | | | 50,000 | | | | 51,947 | |
| | |
5.13%, 12/15/2026 (c) | | | 100,000 | | | | 104,965 | |
| | |
3.80%, 4/1/2028 (c) | | | 58,000 | | | | 55,942 | |
| | |
6.50%, 3/1/2041 | | | 108,000 | | | | 126,258 | |
| | |
4.50%, 4/1/2048 (c) | | | 75,000 | | | | 68,979 | |
| | | | | | | | |
| INVESTMENTS | | PRINCIPAL
AMOUNT ($) | | | VALUE ($) | |
| | | | | | | | |
| | |
Oil, Gas & Consumable Fuels — continued | | | | | | | | |
| | |
Nexen, Inc. (China) 7.88%, 3/15/2032 | | | 60,000 | | | | 81,602 | |
| | |
Petro-Canada (Canada) 6.80%, 5/15/2038 | | | 29,000 | | | | 35,721 | |
| | |
Petroleos Mexicanos (Mexico) | | | | | | | | |
| | |
6.38%, 2/4/2021 | | | 50,000 | | | | 51,439 | |
| | |
4.63%, 9/21/2023 | | | 50,000 | | | | 47,810 | |
| | |
5.50%, 6/27/2044 | | | 30,000 | | | | 23,541 | |
| | |
6.35%, 2/12/2048 | | | 69,000 | | | | 57,160 | |
| | |
Phillips 66 | | | | | | | | |
| | |
4.30%, 4/1/2022 | | | 75,000 | | | | 77,574 | |
| | |
3.90%, 3/15/2028 | | | 75,000 | | | | 74,577 | |
| | |
4.65%, 11/15/2034 | | | 228,000 | | | | 235,634 | |
| | |
5.88%, 5/1/2042 | | | 38,000 | | | | 44,013 | |
| | |
4.88%, 11/15/2044 | | | 85,000 | | | | 88,557 | |
| | |
Suncor Energy, Inc. (Canada) | | | | | | | | |
| | |
3.60%, 12/1/2024 | | | 70,000 | | | | 70,385 | |
| | |
5.95%, 12/1/2034 | | | 41,000 | | | | 46,597 | |
| | |
6.50%, 6/15/2038 | | | 70,000 | | | | 84,457 | |
| | |
6.85%, 6/1/2039 | | | 90,000 | | | | 112,910 | |
| | |
4.00%, 11/15/2047 | | | 281,000 | | | | 260,833 | |
| | |
Valero Energy Corp. | | | | | | | | |
| | |
3.40%, 9/15/2026 | | | 30,000 | | | | 28,740 | |
| | |
4.35%, 6/1/2028 | | | 174,000 | | | | 176,218 | |
| | |
7.50%, 4/15/2032 | | | 25,000 | | | | 31,073 | |
| | |
6.63%, 6/15/2037 | | | 125,000 | | | | 147,980 | |
| | |
4.90%, 3/15/2045 | | | 75,000 | | | | 76,363 | |
| | |
Valero Energy Partners LP 4.50%, 3/15/2028 | | | 45,000 | | | | 45,566 | |
| | | | | | | | |
| | |
| | | | | | | 3,533,905 | |
| | | | | | | | |
| | |
Paper & Forest Products — 0.0%(b) | | | | | | | | |
| | |
Fibria Overseas Finance Ltd. (Brazil) 5.50%, 1/17/2027 | | | 30,000 | | | | 31,086 | |
| | | | | | | | |
| | |
Personal Products — 0.2% | | | | | | | | |
| | |
Estee Lauder Cos., Inc. (The) | | | | | | | | |
| | |
3.15%, 3/15/2027 | | | 25,000 | | | | 24,514 | |
| | |
6.00%, 5/15/2037 | | | 35,000 | | | | 43,009 | |
| | |
4.38%, 6/15/2045 | | | 25,000 | | | | 25,765 | |
| | |
4.15%, 3/15/2047 | | | 120,000 | | | | 120,398 | |
| | | | | | | | |
| | |
| | | | | | | 213,686 | |
| | | | | | | | |
| | |
Pharmaceuticals — 0.9% | | | | | | | | |
| | |
Johnson & Johnson | | | | | | | | |
| | |
2.25%, 3/3/2022 | | | 94,000 | | | | 92,729 | |
| | |
5.95%, 8/15/2037 | | | 25,000 | | | | 31,595 | |
| | |
3.40%, 1/15/2038 | | | 106,000 | | | | 101,075 | |
| | |
4.50%, 9/1/2040 | | | 40,000 | | | | 43,433 | |
SEE NOTES TO FINANCIAL STATEMENTS.
| | | | | | |
| | | |
| 98 | | | | J.P. MORGAN EXCHANGE-TRADED FUNDS | | FEBRUARY 28, 2019 |
| | | | | | | | |
| INVESTMENTS | | PRINCIPAL
AMOUNT ($) | | | VALUE ($) | |
Corporate Bonds — continued | | | | | | | | |
| | |
Pharmaceuticals — continued | | | | | | | | |
| | |
4.50%, 12/5/2043 | | | 25,000 | | | | 27,144 | |
| | |
3.70%, 3/1/2046 | | | 202,000 | | | | 196,291 | |
| | |
3.75%, 3/3/2047 | | | 56,000 | | | | 54,893 | |
| | |
Zoetis, Inc. | | | | | | | | |
| | |
3.45%, 11/13/2020 | | | 38,000 | | | | 38,193 | |
| | |
3.25%, 8/20/2021 | | | 90,000 | | | | 89,915 | |
| | |
3.25%, 2/1/2023 | | | 176,000 | | | | 174,881 | |
| | |
3.95%, 9/12/2047 | | | 25,000 | | | | 22,692 | |
| | |
4.45%, 8/20/2048 | | | 51,000 | | | | 50,406 | |
| | | | | | | | |
| | |
| | | | | | | 923,247 | |
| | | | | | | | |
| | |
Professional Services — 0.3% | | | | | | | | |
| | |
Thomson Reuters Corp. (Canada) | | | | | | | | |
| | |
4.30%, 11/23/2023 | | | 83,000 | | | | 84,501 | |
| | |
3.35%, 5/15/2026 | | | 50,000 | | | | 46,610 | |
| | |
5.85%, 4/15/2040 | | | 60,000 | | | | 64,881 | |
| | |
5.65%, 11/23/2043 | | | 110,000 | | | | 117,288 | |
| | | | | | | | |
| | |
| | | | | | | 313,280 | |
| | | | | | | | |
| |
Semiconductors & Semiconductor Equipment — 0.4% | | | | | |
| | |
Marvell Technology Group Ltd. 4.20%, 6/22/2023 | | | 25,000 | | | | 25,107 | |
| | |
Maxim Integrated Products, Inc. | | | | | | | | |
| | |
3.38%, 3/15/2023 | | | 30,000 | | | | 29,882 | |
| | |
3.45%, 6/15/2027 | | | 25,000 | | | | 23,373 | |
| | |
Micron Technology, Inc. 5.50%, 2/1/2025 | | | 130,000 | | | | 133,568 | |
| | |
Texas Instruments, Inc. | | | | | | | | |
| | |
2.75%, 3/12/2021 | | | 165,000 | | | | 164,706 | |
| | |
2.90%, 11/3/2027 | | | 30,000 | | | | 28,903 | |
| | |
4.15%, 5/15/2048 | | | 30,000 | | | | 30,685 | |
| | | | | | | | |
| | |
| | | | | | | 436,224 | |
| | | | | | | | |
| | |
Software — 0.1% | | | | | | | | |
| | |
Cadence Design Systems, Inc. 4.38%, 10/15/2024 | | | 25,000 | | | | 25,300 | |
| | |
Citrix Systems, Inc. 4.50%, 12/1/2027 | | | 39,000 | | | | 37,376 | |
| | | | | | | | |
| | |
| | | | | | | 62,676 | |
| | | | | | | | |
| | |
Specialty Retail — 0.3% | | | | | | | | |
| | |
Best Buy Co., Inc. | | | | | | | | |
| | |
5.50%, 3/15/2021 | | | 26,000 | | | | 27,028 | |
| | |
4.45%, 10/1/2028 | | | 48,000 | | | | 46,431 | |
| | |
TJX Cos., Inc. (The) | | | | | | | | |
| | |
2.75%, 6/15/2021 | | | 85,000 | | | | 84,763 | |
| | |
2.50%, 5/15/2023 | | | 25,000 | | | | 24,496 | |
| | |
2.25%, 9/15/2026 | | | 77,000 | | | | 71,073 | |
| | | | | | | | |
| | |
| | | | | | | 253,791 | |
| | | | | | | | |
| | | | | | | | |
| INVESTMENTS | | PRINCIPAL
AMOUNT ($) | | | VALUE ($) | |
| | | | | | | | |
| |
Technology Hardware, Storage & Peripherals — 0.4% | | | | | |
| | |
HP, Inc. | | | | | | | | |
| | |
4.30%, 6/1/2021 | | | 20,000 | | | | 20,449 | |
| | |
4.38%, 9/15/2021 | | | 40,000 | | | | 41,281 | |
| | |
4.65%, 12/9/2021 | | | 25,000 | | | | 25,910 | |
| | |
4.05%, 9/15/2022 | | | 98,000 | | | | 99,811 | |
| | |
6.00%, 9/15/2041 | | | 135,000 | | | | 137,707 | |
| | |
NetApp, Inc. | | | | | | | | |
| | |
3.38%, 6/15/2021 | | | 27,000 | | | | 27,028 | |
| | |
3.30%, 9/29/2024 | | | 67,000 | | | | 64,447 | |
| | | | | | | | |
| | |
| | | | | | | 416,633 | |
| | | | | | | | |
| | |
Textiles, Apparel & Luxury Goods — 0.2% | | | | | | | | |
| | |
NIKE, Inc. | | | | | | | | |
| | |
2.25%, 5/1/2023 | | | 34,000 | | | | 33,473 | |
| | |
3.63%, 5/1/2043 | | | 26,000 | | | | 24,772 | |
| | |
3.88%, 11/1/2045 | | | 31,000 | | | | 30,661 | |
| | |
3.38%, 11/1/2046 | | | 25,000 | | | | 22,635 | |
| | |
VF Corp. | | | | | | | | |
| | |
3.50%, 9/1/2021 | | | 50,000 | | | | 50,675 | |
| | |
6.45%, 11/1/2037 | | | 27,000 | | | | 31,968 | |
| | | | | | | | |
| | |
| | | | | | | 194,184 | |
| | | | | | | | |
| | |
Trading Companies & Distributors — 0.1% | | | | | | | | |
| | |
WW Grainger, Inc. | | | | | | | | |
| | |
4.60%, 6/15/2045 | | | 34,000 | | | | 35,082 | |
| | |
3.75%, 5/15/2046 | | | 89,000 | | | | 79,745 | |
| | | | | | | | |
| | |
| | | | | | | 114,827 | |
| | | | | | | | |
| | |
Total Corporate bonds
(Cost $25,035,871) | | | | | | | 25,080,460 | |
| | | | | | | | |
Foreign Government Securities — 2.0% | | | | | |
| | |
Canada Government Bond (Canada) | | | | | | | | |
| | |
2.63%, 1/25/2022 | | | 65,000 | | | | 65,081 | |
| | |
2.00%, 11/15/2022 | | | 25,000 | | | | 24,482 | |
| | |
Export Development Canada (Canada) | | | | | | | | |
| | |
2.00%, 5/17/2022 | | | 50,000 | | | | 49,046 | |
| | |
2.75%, 3/15/2023 | | | 25,000 | | | | 25,106 | |
| | |
Export-Import Bank of Korea (South Korea) 2.63%, 12/30/2020 | | | 200,000 | | | | 198,388 | |
| | |
Italy Government Bond (Italy) 5.38%, 6/15/2033 | | | 40,000 | | | | 41,179 | |
| | |
Japan Bank for International Cooperation (Japan) 1.75%, 5/28/2020 | | | 200,000 | | | | 197,704 | |
| | |
Korea Development Bank (The) (South Korea) 2.25%, 5/18/2020 | | | 200,000 | | | | 198,159 | |
| | |
Province of Alberta (Canada) 2.95%, 1/23/2024 | | | 50,000 | | | | 49,989 | |
SEE NOTES TO FINANCIAL STATEMENTS.
| | | | | | | | |
| | | |
| FEBRUARY 28, 2019 | | J.P. MORGAN EXCHANGE-TRADED FUNDS | | | | | 99 | |
JPMorgan U.S. Aggregate Bond ETF
SCHEDULE OF PORTFOLIO INVESTMENTS
AS OF FEBRUARY 28, 2019 (continued)
| | | | | | | | |
| INVESTMENTS | | PRINCIPAL
AMOUNT ($) | | | VALUE ($) | |
Foreign Government Securities — continued | | | | | |
| | |
Province of Ontario (Canada) | | | | | | | | |
| | |
3.40%, 10/17/2023 | | | 95,000 | | | | 96,871 | |
| | |
3.05%, 1/29/2024 | | | 55,000 | | | | 55,383 | |
| | |
Province of Quebec (Canada) | | | | | | | | |
| | |
2.75%, 8/25/2021 | | | 50,000 | | | | 50,011 | |
| | |
2.38%, 1/31/2022 | | | 25,000 | | | | 24,753 | |
| | |
Republic of Colombia (Colombia) 10.38%, 1/28/2033 | | | 43,000 | | | | 65,347 | |
| | |
Republic of Korea (South Korea) 2.75%, 1/19/2027 | | | 200,000 | | | | 193,183 | |
| | |
Republic of Panama (Panama) 6.70%, 1/26/2036 | | | 40,000 | | | | 50,748 | |
| | |
Republic of Peru (Peru) 6.55%, 3/14/2037 | | | 25,000 | | | | 32,438 | |
| | |
Republic of Philippines (Philippines) | | | | | | | | |
| | |
9.50%, 10/21/2024 | | | 26,000 | | | | 33,995 | |
| | |
9.50%, 2/2/2030 | | | 27,000 | | | | 40,732 | |
| | |
Republic of Poland (Poland) | | | | | | | | |
| | |
5.00%, 3/23/2022 | | | 37,000 | | | | 39,123 | |
| | |
3.00%, 3/17/2023 | | | 29,000 | | | | 28,934 | |
| | |
Republic of Uruguay (Uruguay) | | | | | | | | |
| | |
8.00%, 11/18/2022 | | | 25,000 | | | | 28,237 | |
| | |
4.50%, 8/14/2024 | | | 29,000 | | | | 30,059 | |
| | |
United Mexican States (Mexico) | | | | | | | | |
| | |
8.00%, 9/24/2022 | | | 25,000 | | | | 28,809 | |
| | |
4.00%, 10/2/2023 | | | 100,000 | | | | 100,900 | |
| | |
6.75%, 9/27/2034 | | | 25,000 | | | | 29,594 | |
| | |
4.60%, 1/23/2046 | | | 200,000 | | | | 185,200 | |
| | | | | | | | |
| | |
Total Foreign Government Securities
(Cost $1,960,711) | | | | | | | 1,963,451 | |
| | | | | | | | |
Commercial Mortgage-Backed Securities — 1.9% | |
| | |
BANK | | | | | | | | |
| | |
Series 2017-BNK4, Class ASB, 3.42%, 5/15/2050 | | | 30,000 | | | | 30,303 | |
| | |
Series 2018-BN15, Class A4, 4.41%, 11/15/2061 | | | 20,000 | | | | 21,297 | |
| | |
BENCHMARK Mortgage Trust Series 2018-B7, Class A4, 4.51%, 5/15/2053 | | | 20,000 | | | | 21,516 | |
| | |
CD Mortgage Trust | | | | | | | | |
| | |
Series 2017-CD6, Class ASB, 3.33%, 11/13/2050 | | | 20,000 | | | | 19,935 | |
| | |
Series 2018-CD7, Class A3, 4.01%, 8/15/2051 | | | 10,000 | | | | 10,327 | |
| | |
CFCRE Commercial Mortgage Trust Series 2016-C7, Class ASB, 3.64%, 12/10/2054 | | | 20,000 | | | | 20,319 | |
| | |
Citigroup Commercial Mortgage Trust | | | | | | | | |
| | |
Series 2014-GC21, Class AAB, 3.48%, 5/10/2047 | | | 20,000 | | | | 20,261 | |
| | | | | | | | |
| INVESTMENTS | | PRINCIPAL
AMOUNT ($) | | | VALUE ($) | |
| | | | | | | | |
| | |
Series 2014-GC25, Class AAB, 3.37%, 10/10/2047 | | | 29,000 | | | | 29,279 | |
| | |
Series 2016-P5, Class A2, 2.40%, 10/10/2049 | | | 50,000 | | | | 49,415 | |
| | |
Commercial Mortgage Trust | | | | | | | | |
| | |
Series 2012-CR3, Class ASB, 2.37%, 10/15/2045 | | | 29,284 | | | | 29,029 | |
| | |
Series 2012-CR4, Class ASB, 2.44%, 10/15/2045 | | | 15,090 | | | | 14,922 | |
| | |
Series 2013-CR7, Class A4, 3.21%, 3/10/2046 | | | 74,432 | | | | 74,621 | |
| | |
Series 2015-CR26, Class A2, 2.88%, 10/10/2048 | | | 36,342 | | | | 36,304 | |
| | |
CSAIL Commercial Mortgage Trust | | | | | | | | |
| | |
Series 2015-C4, Class A2, 3.16%, 11/15/2048 | | | 60,000 | | | | 60,053 | |
| | |
Series 2016-C5, Class A5, 3.76%, 11/15/2048 | | | 27,000 | | | | 27,503 | |
| | |
FHLMC Multifamily Structured Pass-Through Certificates | | | | | | | | |
| | |
Series K009, Class A2, 3.81%, 8/25/2020 | | | 25,000 | | | | 25,261 | |
| | |
Series K019, Class A2, 2.27%, 3/25/2022 | | | 20,000 | | | | 19,719 | |
| | |
Series K023, Class A1, 1.58%, 4/25/2022 | | | 24,048 | | | | 23,612 | |
| | |
Series K027, Class A2, 2.64%, 1/25/2023 | | | 50,000 | | | | 49,692 | |
| | |
Series K036, Class A2, 3.53%, 10/25/2023 (d) | | | 162,000 | | | | 166,309 | |
| | |
Series K725, Class AM, 3.10%, 2/25/2024 | | | 50,000 | | | | 50,391 | |
| | |
Series K728, Class A2, 3.06%, 8/25/2024 (d) | | | 50,000 | | | | 50,255 | |
| | |
Series K048, Class A1, 2.69%, 12/25/2024 | | | 43,130 | | | | 42,803 | |
| | |
Series K731, Class A2, 3.60%, 2/25/2025 (d) | | | 50,000 | | | | 51,561 | |
| | |
Series K063, Class A1, 3.05%, 8/25/2026 | | | 48,071 | | | | 48,139 | |
| | |
FNMA ACES | | | | | | | | |
| | |
Series 2012-M1, Class A2, 2.73%, 10/25/2021 | | | 45,595 | | | | 45,502 | |
| | |
Series 2014-M3, Class A2, 3.46%, 1/25/2024 (d) | | | 50,000 | | | | 51,115 | |
| | |
Series 2017-M10, Class AV2, 2.56%, 7/25/2024 (d) | | | 50,000 | | | | 49,019 | |
| | |
Series 2019-M1, Class A2, 3.55%, 9/25/2028 (d) | | | 35,000 | | | | 35,746 | |
SEE NOTES TO FINANCIAL STATEMENTS.
| | | | | | |
| | | |
| 100 | | | | J.P. MORGAN EXCHANGE-TRADED FUNDS | | FEBRUARY 28, 2019 |
| | | | | | | | |
| INVESTMENTS | | PRINCIPAL
AMOUNT ($) | | | VALUE ($) | |
Commercial Mortgage-Backed Securities — continued | |
| | |
Series 2018-M13, Class A1, 3.70%, 3/25/2030 (d) | | | 34,945 | | | | 36,558 | |
| | |
GS Mortgage Securities Corp. II | | | | | | | | |
| | |
Series 2013-GC10, Class AAB, 2.56%, 2/10/2046 | | | 15,830 | | | | 15,699 | |
| | |
Series 2015-GC30, Class A4, 3.38%, 5/10/2050 | | | 25,000 | | | | 25,141 | |
| | |
GS Mortgage Securities TrustSeries 2011-GC5, Class A4, 3.71%, 8/10/2044 | | | 60,000 | | | | 60,715 | |
| | |
JP Morgan Chase Commercial Mortgage Securities Trust | | | | | | | | |
| | |
Series 2012-C8, Class A3, 2.83%, 10/15/2045 | | | 8,358 | | | | 8,305 | |
| | |
Series 2013-C16, Class ASB, 3.67%, 12/15/2046 | | | 22,689 | | | | 23,016 | |
| | |
Series 2012-LC9, Class A5, 2.84%, 12/15/2047 | | | 25,000 | | | | 24,841 | |
| | |
JPMBB Commercial Mortgage Securities Trust | | | | | | | | |
| | |
Series 2014-C19, Class A3, 3.67%, 4/15/2047 | | | 40,000 | | | | 40,503 | |
| | |
Series 2015-C31, Class A2, 3.01%, 8/15/2048 | | | 30,000 | | | | 29,974 | |
| | |
Morgan Stanley Bank of America Merrill Lynch Trust | | | | | | | | |
| | |
Series 2014-C14, Class A3, 3.67%, 2/15/2047 | | | 42,427 | | | | 42,813 | |
| | |
Series 2014-C18, Class ASB, 3.62%, 10/15/2047 | | | 20,000 | | | | 20,306 | |
| | |
Series 2015-C25, Class ASB, 3.38%, 10/15/2048 | | | 50,000 | | | | 50,576 | |
| | |
Morgan Stanley Capital I TrustSeries 2012-C4, Class A4, 3.24%, 3/15/2045 | | | 38,000 | | | | 38,016 | |
| | |
UBS Commercial Mortgage Trust | | | | | | | | |
| | |
Series 2017-C1, Class A2, 2.98%, 6/15/2050 | | | 30,000 | | | | 29,868 | |
| | |
Series 2018-C14, Class A4, 4.45%, 12/15/2051 | | | 20,000 | | | | 21,220 | |
| | |
UBS-Barclays Commercial Mortgage Trust Series 2012-C2, Class A4, 3.53%, 5/10/2063 | | | 20,000 | | | | 20,261 | |
| | |
Wells Fargo Commercial Mortgage Trust | | | | | | | | |
| | |
Series 2015-LC20, Class A2, 2.68%, 4/15/2050 | | | 25,000 | | | | 24,914 | |
| | |
Series 2018-C45, Class A3, 3.92%, 6/15/2051 | | | 45,000 | | | | 46,114 | |
| | |
Series 2015-NXS3, Class A2, 2.85%, 9/15/2057 | | | 70,000 | | | | 69,789 | |
| | | | | | | | |
| INVESTMENTS | | PRINCIPAL
AMOUNT ($) | | | VALUE ($) | |
| | | | | | | | |
| | |
WFRBS Commercial Mortgage Trust | | | | | | | | |
| | |
Series 2012-C9, Class AS, 3.39%, 11/15/2045 | | | 60,000 | | | | 59,851 | |
| | |
Series 2013-C12, Class ASB, 2.84%, 3/15/2048 | | | 8,518 | | | | 8,490 | |
| | |
Series 2014-C22, Class A5, 3.75%, 9/15/2057 | | | 25,000 | | | | 25,570 | |
| | | | | | | | |
| |
Total Commercial Mortgage-Backed Securities
(Cost $1,888,221) | | | | 1,896,748 | |
| | | | | | | | |
Supranational — 1.5% | | | | | | | | |
| | |
Asian Development Bank (Supranational) | | | | | | | | |
| | |
2.88%, 11/27/2020 | | | 117,000 | | | | 117,485 | |
| | |
3.13%, 9/26/2028 | | | 80,000 | | | | 81,563 | |
| | |
Corp. Andina de Fomento (Supranational) 3.75%, 11/23/2023 | | | 125,000 | | | | 126,950 | |
| | |
European Bank for Reconstruction & Development (Supranational) | | | | | | | | |
| | |
2.00%, 2/1/2021 | | | 25,000 | | | | 24,712 | |
| | |
1.50%, 11/2/2021 | | | 32,000 | | | | 31,090 | |
| | |
European Investment Bank (Supranational) | | | | | | | | |
| | |
1.63%, 8/14/2020 | | | 30,000 | | | | 29,572 | |
| | |
2.38%, 6/15/2022 | | | 67,000 | | | | 66,524 | |
| | |
2.00%, 12/15/2022 | | | 264,000 | | | | 258,218 | |
| | |
Inter-American Development Bank (Supranational) | | | | | | | | |
| | |
3.00%, 2/21/2024 | | | 65,000 | | | | 65,960 | |
| | |
3.20%, 8/7/2042 | | | 89,000 | | | | 86,058 | |
| | |
International Bank for Reconstruction & Development (Supranational) | | | | | | | | |
| | |
1.38%, 3/30/2020 | | | 300,000 | | | | 296,050 | |
| | |
1.63%, 3/9/2021 | | | 89,000 | | | | 87,296 | |
| | |
2.50%, 11/25/2024 | | | 50,000 | | | | 49,562 | |
| | |
International Finance Corp. (Supranational) 1.63%, 7/16/2020 | | | 100,000 | | | | 98,651 | |
| | | | | | | | |
| | |
Total Supranational
(Cost $1,418,674) | | | | | | | 1,419,691 | |
| | | | | | | | |
U.S. Government Agency Securities — 1.1% | | | | | |
| | |
FHLB | | | | | | | | |
| | |
3.00%, 10/12/2021 | | | 55,000 | | | | 55,603 | |
| | |
2.63%, 12/10/2021 | | | 110,000 | | | | 110,137 | |
| | |
3.38%, 12/8/2023 | | | 100,000 | | | | 103,227 | |
| | |
3.25%, 11/16/2028 | | | 60,000 | | | | 61,216 | |
| | |
5.63%, 3/14/2036 | | | 50,000 | | | | 64,371 | |
| | |
FHLMC | | | | | | | | |
| | |
2.50%, 4/23/2020 | | | 25,000 | | | | 24,989 | |
| | |
1.63%, 9/29/2020 | | | 25,000 | | | | 24,639 | |
| | |
2.38%, 1/13/2022 | | | 50,000 | | | | 49,784 | |
SEE NOTES TO FINANCIAL STATEMENTS.
| | | | | | | | |
| | | |
| FEBRUARY 28, 2019 | | J.P. MORGAN EXCHANGE-TRADED FUNDS | | | | | 101 | |
JPMorgan U.S. Aggregate Bond ETF
SCHEDULE OF PORTFOLIO INVESTMENTS
AS OF FEBRUARY 28, 2019 (continued)
| | | | | | | | |
| INVESTMENTS | | PRINCIPAL
AMOUNT ($) | | | VALUE ($) | |
U.S. Government Agency Securities — continued | | | | | |
| | |
2.75%, 6/19/2023 | | | 40,000 | | | | 40,264 | |
| | |
6.25%, 7/15/2032 | | | 40,000 | | | | 53,206 | |
| | |
FNMA | | | | | | | | |
| | |
1.50%, 7/30/2020 | | | 20,000 | | | | 19,712 | |
| | |
2.88%, 10/30/2020 | | | 50,000 | | | | 50,251 | |
| | |
2.50%, 4/13/2021 | | | 40,000 | | | | 39,960 | |
| | |
1.25%, 8/17/2021 | | | 36,000 | | | | 34,914 | |
| | |
2.00%, 1/5/2022 | | | 55,000 | | | | 54,135 | |
| | |
2.38%, 1/19/2023 | | | 61,000 | | | | 60,578 | |
| | |
2.88%, 9/12/2023 | | | 50,000 | | | | 50,582 | |
| | |
2.13%, 4/24/2026 | | | 90,000 | | | | 85,871 | |
| | |
1.88%, 9/24/2026 | | | 50,000 | | | | 46,661 | |
| | |
Tennessee Valley Authority | | | | | | | | |
| | |
2.88%, 2/1/2027 | | | 23,000 | | | | 22,832 | |
| | |
3.50%, 12/15/2042 | | | 50,000 | | | | 48,925 | |
| | |
4.25%, 9/15/2065 | | | 10,000 | | | | 11,236 | |
| | | | | | | | |
| | |
Total U.S. Government Agency Securities
(Cost $1,112,464) | | | | | | | 1,113,093 | |
| | | | | | | | |
Municipal Bonds — 0.6% | | | | | |
| |
California — 0.1% | | | | | |
| | |
General Obligation — 0.1% | | | | | | | | |
| | |
State of California, Various Purpose | | | | | | | | |
| | |
GO, 5.70%, 11/1/2021 | | | 50,000 | | | | 53,741 | |
| | |
GO, 7.55%, 4/1/2039 | | | 45,000 | | | | 65,609 | |
| | | | | | | | |
| | |
| | | | | | | 119,350 | |
| | | | | | | | |
| |
Utility — 0.0%(b) | | | | | |
| | |
State of California Department of Water Resources Power Supply Series 2016P, Rev., 2.00%, 5/1/2022 | | | 35,000 | | | | 34,139 | |
| | | | | | | | |
| | |
Total California | | | | | | | 153,489 | |
| | | | | | | | |
| | |
Florida — 0.0%(b) | | | | | | | | |
|
Other Revenue — 0.0%(b) | |
| | |
State Board of Administration Finance Corp. Series 2016A, Rev., 2.64%, 7/1/2021 | | | 25,000 | | | | 24,912 | |
| | | | | | | | |
| | |
Illinois — 0.2% | | | | | | | | |
|
General Obligation — 0.1% | |
| | |
Metropolitan Water Reclamation District of Greater Chicago, Build America Bonds GO, 5.72%, 12/1/2038 | | | 55,000 | | | | 65,960 | |
| | | | | | | | |
| | |
Other Revenue — 0.1% | | | | | | | | |
| | |
Sales Tax Securitization Corp. Series 2019A, Rev., 4.64%, 1/1/2040 | | | 60,000 | | | | 60,230 | |
| | | | | | | | |
| | | | | | | | |
| INVESTMENTS | | PRINCIPAL
AMOUNT ($) | | | VALUE ($) | |
| | | | | | | | |
| | |
Transportation — 0.0%(b) | | | | | | | | |
| | |
Chicago O’Hare International Airport, Senior Lien Rev., 4.47%, 1/1/2049 | | | 50,000 | | | | 51,433 | |
| | | | | | | | |
| | |
Total Illinois | | | | | | | 177,623 | |
| | | | | | | | |
| | |
Massachusetts — 0.0%(b) | | | | | | | | |
|
General Obligation — 0.0%(b) | |
| | |
Commonwealth of Massachusetts, Consolidated Loan of 2010, Build America Bonds Series A, GO, 4.91%, 5/1/2029 | | | 15,000 | | | | 16,635 | |
| | | | | | | | |
| | |
Missouri — 0.1% | | | | | | | | |
| | |
Hospital — 0.1% | | | | | | | | |
| | |
Health & Educational Facilities Authority of the State of Missouri, Educational Facilities, The Washington University Series 2017A, Rev., 3.65%, 8/15/2057 | | | 45,000 | | | | 41,942 | |
| | | | | | | | |
| | |
New Jersey — 0.1% | | | | | | | | |
| | |
Transportation — 0.1% | | | | | | | | |
| | |
New Jersey Transportation Trust Fund Authority, Build America Bonds Series C, Rev., 6.10%, 12/15/2028 | | | 50,000 | | | | 51,721 | |
| | | | | | | | |
| | |
New York — 0.0%(b) | | | | | | | | |
| | |
General Obligation — 0.0%(b) | | | | | | | | |
| | |
City of New York, Fiscal Year 2010, Build America Bonds Subseries A-2, GO, 5.21%, 10/1/2031 | | | 25,000 | | | | 28,290 | |
| | | | | | | | |
| | |
Special Tax — 0.0%(b) | | | | | | | | |
| | |
New York State Urban Development Corp., State Personal Income Tax, Build America Bonds Series 2009E, Rev., 5.77%, 3/15/2039 | | | 25,000 | | | | 28,697 | |
| | | | | | | | |
| | |
Total New York | | | | | | | 56,987 | |
| | | | | | | | |
| | |
Oregon — 0.1% | | | | | | | | |
| | |
General Obligation — 0.1% | | | | | | | | |
| | |
State of Oregon GO, 5.76%, 6/1/2023 | | | 39,967 | | | | 42,679 | |
| | | | | | | | |
| | |
Texas — 0.0% (b) | | | | | | | | |
| | |
General Obligation — 0.0% (b) | | | | | | | | |
| | |
City of Houston GO, 3.96%, 3/1/2047 | | | 40,000 | | | | 39,448 | |
| | | | | | | | |
| | |
Total Municipal Bonds
(Cost $606,728) | | | | | | | 605,436 | |
| | | | | | | | |
Asset-Backed Securities — 0.5% | | | | | | | | |
| | |
Ally Auto Receivables Trust Series 2018-2, Class A3, 2.92%, 11/15/2022 | | | 30,000 | | | | 30,073 | |
| | |
Ally Master Owner Trust Series 2017-3, Class A2, 2.04%, 6/15/2022 | | | 100,000 | | | | 98,986 | |
SEE NOTES TO FINANCIAL STATEMENTS.
| | | | | | |
| | | |
| 102 | | | | J.P. MORGAN EXCHANGE-TRADED FUNDS | | FEBRUARY 28, 2019 |
| | | | | | | | |
| INVESTMENTS | | PRINCIPAL
AMOUNT ($) | | | VALUE ($) | |
Asset-Backed Securities — continued | | | | | | | | |
| | |
American Express Credit Account Master Trust Series 2018-6, Class A, 3.06%, 2/15/2024 | | | 100,000 | | | | 100,729 | |
| | |
AmeriCredit Automobile Receivables Trust Series 2018-1, Class C, 3.50%, 1/18/2024 | | | 15,000 | | | | 15,117 | |
| | |
BA Credit Card Trust Series 2017-A1, Class A1, 1.95%, 8/15/2022 | | | 30,000 | | | | 29,778 | |
| | |
Capital One Multi-Asset Execution Trust | | | | | | | | |
| | |
Series 2015-A8, Class A8, 2.05%, 8/15/2023 | | | 20,000 | | | | 19,789 | |
| | |
Series 2017-A6, Class A6, 2.29%, 7/15/2025 | | | 10,000 | | | | 9,811 | |
| | |
CarMax Auto Owner Trust Series 2018-1, Class A4, 2.64%, 6/15/2023 | | | 25,000 | | | | 24,858 | |
| | |
Citibank Credit Card Issuance Trust Series 2017-A3, Class A3, 1.92%, 4/7/2022 | | | 60,000 | | | | 59,446 | |
| | |
Discover Card Execution Note Trust Series 2018-A1, Class A1, 3.03%, 8/15/2025 | | | 18,000 | | | | 18,057 | |
| | |
Honda Auto Receivables Owner Trust Series 2018-1, Class A3, 2.64%, 2/15/2022 | | | 20,000 | | | | 19,964 | |
| | |
Santander Drive Auto Receivables Trust | | | | | | | | |
| | |
Series 2017-3, Class C, 2.76%, 12/15/2022 | | | 20,000 | | | | 19,933 | |
| | |
Series 2019-1, Class C, 3.42%, 4/15/2025 | | | 20,000 | | | | 20,025 | |
| | |
Synchrony Credit Card Master Note Trust Series 2015-1, Class A, 2.37%, 3/15/2023 | | | 20,000 | | | | 19,902 | |
| | |
Toyota Auto Receivables Owner Trust Series 2018-C, Class A3, 3.02%, 12/15/2022 | | | 20,000 | | | | 20,116 | |
| | | | | | | | |
| | |
Total Asset-Backed Securities
(Cost $505,002) | | | | | | | 506,584 | |
| | | | | | | | |
| | |
| | | SHARES | | | | |
Short-Term Investments — 0.3% | | | | | | | | |
| | |
Investment Companies — 0.3% | | | | | | | | |
| | |
JPMorgan U.S. Government Money Market Fund Class Institutional Shares, 2.33% (e) (f)
(Cost $337,456) | | | 337,456 | | | | 337,456 | |
| | | | | | | | |
| | |
Total Investments — 100.1%
(Cost $98,721,935) | | | | | | | 98,841,396 | |
| | |
Liabilities in Excess of Other
Assets — (0.1%) | | | | | | | (111,314) | |
| | | | | | | | |
| | |
Net Assets — 100.0% | | | | | | | 98,730,082 | |
| | | | | | | | |
Percentages indicated are based on net assets.
Abbreviations
| | |
ACES | | Alternative Credit Enhancement Securities |
BA | | Bankers’ Acceptance Rate |
FHLB | | Federal Home Loan Bank |
FHLMC | | Federal Home Loan Mortgage Corp. |
FNMA | | Federal National Mortgage Association |
GNMA | | Government National Mortgage Association |
GO | | General Obligation |
ICE | | Intercontinental Exchange |
LIBOR | | London Interbank Offered Rate |
REIT | | Real Estate Investment Trust |
Rev. | | Revenue |
USD | | United States Dollar |
| |
(a) | | Variable or floating rate security, linked to the referenced benchmark. The interest rate shown is the current rate as of February 28, 2019. |
(b) | | Amount rounds to less than 0.1% of net assets. |
(c) | | Securities exempt from registration under Rule 144A or section 4(a)(2), of the Securities Act of 1933, as amended. |
(d) | | Variable or floating rate security, the interest rate of which adjusts periodically based on changes in current interest rates and prepayments on the underlying pool of assets. The interest rate shown is the current rate as of February 28, 2019. |
(e) | | Investment in affiliate. Fund is registered under the Investment Company Act of 1940, as amended, and advised by J.P. Morgan Investment Management Inc. |
(f) | | The rate shown is the current yield as of February 28, 2019. |
(g) | | All or a portion of the security is a when-issued security, delayed delivery security, or forward commitment. |
SEE NOTES TO FINANCIAL STATEMENTS.
| | | | | | | | |
| | | |
| FEBRUARY 28, 2019 | | J.P. MORGAN EXCHANGE-TRADED FUNDS | | | | | 103 | |
JPMorgan Ultra-Short Income ETF
SCHEDULE OF PORTFOLIO INVESTMENTS
AS OF FEBRUARY 28, 2019
| | | | | | | | |
| INVESTMENTS | | PRINCIPAL
AMOUNT ($) | | | VALUE ($) | |
Corporate Bonds — 70.7% | | | | | | | | |
| | |
Aerospace & Defense — 0.6% | | | | | | | | |
| | |
BAE Systems Holdings, Inc. (United Kingdom) 6.38%, 6/1/2019 (a) | | | 18,466,000 | | | | 18,610,381 | |
| | |
General Dynamics Corp. (ICE LIBOR USD 3 Month + 0.29%), 2.99%, 5/11/2020 (b) | | | 834,000 | | | | 835,480 | |
| | |
Lockheed Martin Corp. 4.25%, 11/15/2019 | | | 8,237,000 | | | | 8,315,809 | |
| | |
Rockwell Collins, Inc. 5.25%, 7/15/2019 | | | 2,480,000 | | | | 2,500,250 | |
| | |
United Technologies Corp. (ICE LIBOR USD 3 Month + 0.65%), 3.33%, 8/16/2021 (b) | | | 6,381,000 | | | | 6,381,977 | |
| | | | | | | | |
| | |
| | | | | | | 36,643,897 | |
| | | | | | | | |
| | |
Automobiles — 3.5% | | | | | | | | |
| | |
BMW US Capital LLC (Germany) | | | | | | | | |
| | |
1.45%, 9/13/2019 (a) | | | 12,245,000 | | | | 12,159,042 | |
| | |
(ICE LIBOR USD 3 Month + 0.38%), 3.17%, 4/6/2020 (a) (b) | | | 14,989,000 | | | | 14,996,960 | |
| | |
(ICE LIBOR USD 3 Month + 0.37%), 3.06%, 8/14/2020 (a) (b) | | | 7,091,000 | | | | 7,079,396 | |
| | |
(ICE LIBOR USD 3 Month + 0.41%), 3.21%, 4/12/2021 (a) (b) | | | 1,910,000 | | | | 1,906,960 | |
| | |
(ICE LIBOR USD 3 Month + 0.50%), 3.19%, 8/13/2021 (a) (b) | | | 900,000 | | | | 897,975 | |
| | |
(ICE LIBOR USD 3 Month + 0.64%), 3.44%, 4/6/2022 (a) (b) | | | 10,000,000 | | | | 10,006,609 | |
| | |
Daimler Finance North America LLC (Germany) | | | | | | | | |
| | |
2.25%, 3/2/2020 (a) | | | 18,824,000 | | | | 18,670,001 | |
| | |
3.10%, 5/4/2020 (a) | | | 6,874,000 | | | | 6,862,148 | |
| | |
(ICE LIBOR USD 3 Month + 0.39%), 3.13%, 5/4/2020 (a) (b) | | | 1,971,000 | | | | 1,964,478 | |
| | |
2.20%, 5/5/2020 (a) | | | 1,905,000 | | | | 1,883,192 | |
| | |
(ICE LIBOR USD 3 Month + 0.53%), 3.26%, 5/5/2020 (a) (b) | | | 3,495,000 | | | | 3,491,446 | |
| | |
(ICE LIBOR USD 3 Month + 0.43%), 3.13%, 2/12/2021 (a) (b) | | | 2,900,000 | | | | 2,880,290 | |
| | |
(ICE LIBOR USD 3 Month + 0.45%), 3.11%, 2/22/2021 (a) (b) | | | 2,100,000 | | | | 2,090,073 | |
| | |
(ICE LIBOR USD 3 Month + 0.88%), 3.54%, 2/22/2022 (a) (b) | | | 28,000,000 | | | | 28,047,600 | |
| | |
General Motors Co. (ICE LIBOR USD 3 Month + 0.90%), 3.67%, 9/10/2021 (b) | | | 5,644,000 | | | | 5,562,323 | |
| | |
Nissan Motor Acceptance Corp. | | | | | | | | |
| | |
2.00%, 3/8/2019 (a) | | | 800,000 | | | | 799,942 | |
| | |
1.55%, 9/13/2019 (a) | | | 3,196,000 | | | | 3,168,970 | |
| | |
2.25%, 1/13/2020 (a) | | | 15,977,000 | | | | 15,840,196 | |
| | | | | | | | |
| INVESTMENTS | | PRINCIPAL
AMOUNT ($) | | | VALUE ($) | |
| | | | | | | | |
| | |
Automobiles — continued | | | | | | | | |
| | |
(ICE LIBOR USD 3 Month + 0.58%), 3.38%, 1/13/2020 (a) (b) | | | 630,000 | | | | 630,046 | |
| | |
2.13%, 3/3/2020 (a) | | | 4,651,000 | | | | 4,597,267 | |
| | |
(ICE LIBOR USD 3 Month + 0.39%), 3.20%, 9/28/2020 (a) (b) | | | 4,850,000 | | | | 4,816,927 | |
| | |
(ICE LIBOR USD 3 Month + 0.52%), 3.31%, 3/15/2021 (a) (b) | | | 5,826,000 | | | | 5,765,764 | |
| | |
Toyota Motor Credit Corp. (ICE LIBOR USD 3 Month + 0.40%), 3.08%, 5/17/2022 (b) | | | 10,900,000 | | | | 10,851,415 | |
| | |
Volkswagen Group of America Finance LLC (Germany) | | | | | | | | |
| | |
2.13%, 5/23/2019 (a) | | | 4,945,000 | | | | 4,935,604 | |
| | |
2.45%, 11/20/2019 (a) | | | 16,215,000 | | | | 16,133,987 | |
| | |
2.40%, 5/22/2020 (a) | | | 1,200,000 | | | | 1,187,932 | |
| | |
(ICE LIBOR USD 3 Month + 0.77%), 3.46%, 11/13/2020 (a) (b) | | | 8,000,000 | | | | 8,011,334 | |
| | |
(ICE LIBOR USD 3 Month + 0.94%), 3.64%, 11/12/2021 (a) (b) | | | 5,200,000 | | | | 5,202,778 | |
| | | | | | | | |
| | |
| | | | | | | 200,440,655 | |
| | | | | | | | |
| | |
Banks — 34.1% | | | | | | | | |
| | |
ABN AMRO Bank NV (Netherlands) | | | | | | | | |
| | |
1.80%, 9/20/2019 (a) | | | 34,352,000 | | | | 34,148,293 | |
| | |
2.45%, 6/4/2020 (a) | | | 6,402,000 | | | | 6,358,492 | |
| | |
(ICE LIBOR USD 3 Month + 0.41%), 3.17%, 1/19/2021 (a) (b) | | | 3,900,000 | | | | 3,896,794 | |
| | |
(ICE LIBOR USD 3 Month + 0.57%), 3.21%, 8/27/2021 (a) (b) | | | 20,978,000 | | | | 20,979,489 | |
| | |
ANZ New Zealand Int’l Ltd. (New Zealand) | | | | | | | | |
| | |
2.60%, 9/23/2019 (a) | | | 1,590,000 | | | | 1,588,396 | |
| | |
2.20%, 7/17/2020 (a) | | | 2,716,000 | | | | 2,694,752 | |
| | |
2.75%, 2/3/2021 (a) | | | 835,000 | | | | 828,179 | |
| | |
(ICE LIBOR USD 3 Month + 1.01%), 3.76%, 7/28/2021 (a) (b) | | | 13,356,000 | | | | 13,500,279 | |
| | |
Australia & New Zealand Banking Group Ltd. (Australia) | | | | | | | | |
| | |
2.05%, 9/23/2019 | | | 3,913,000 | | | | 3,896,805 | |
| | |
(ICE LIBOR USD 3 Month + 0.32%), 3.12%, 7/2/2020 (a) (b) | | | 3,000,000 | | | | 2,999,601 | |
| | |
(ICE LIBOR USD 3 Month + 0.32%), 3.02%, 11/9/2020 (a) (b) | | | 3,841,000 | | | | 3,842,585 | |
| | |
(ICE LIBOR USD 3 Month + 0.46%), 3.14%, 5/17/2021 (a) (b) | | | 2,300,000 | | | | 2,300,185 | |
| | |
(ICE LIBOR USD 3 Month + 0.99%), 3.73%, 6/1/2021 (a) (b) | | | 2,100,000 | | | | 2,126,334 | |
| | |
(ICE LIBOR USD 3 Month + 0.87%), 3.52%, 11/23/2021 (a) (b) | | | 1,220,000 | | | | 1,231,681 | |
SEE NOTES TO FINANCIAL STATEMENTS.
| | | | | | |
| | | |
| 104 | | | | J.P. MORGAN EXCHANGE-TRADED FUNDS | | FEBRUARY 28, 2019 |
| | | | | | | | |
| INVESTMENTS | | PRINCIPAL
AMOUNT ($) | | | VALUE ($) | |
Corporate Bonds — continued | |
| | |
Banks — continued | | | | | | | | |
| | |
Bank of America Corp. | | | | | | | | |
| | |
Series L, 2.25%, 4/21/2020 | | | 11,465,000 | | | | 11,384,630 | |
| | |
(ICE LIBOR USD 3 Month + 0.65%), 3.47%, 6/25/2022 (b) | | | 10,180,000 | | | | 10,173,592 | |
| | |
(ICE LIBOR USD 3 Month + 1.18%), 3.94%, 10/21/2022 (b) | | | 18,004,000 | | | | 18,232,741 | |
| | |
Bank of America NA (ICE LIBOR USD 3 Month + 0.25%), 2.88%, 8/28/2020 (b) | | | 10,470,000 | | | | 10,472,220 | |
| | |
Bank of Montreal (Canada) | | | | | | | | |
| | |
(ICE LIBOR USD 3 Month + 0.34%), 3.14%, 7/13/2020 (b) | | | 7,700,000 | | | | 7,707,075 | |
| | |
(ICE LIBOR USD 3 Month + 0.40%), 3.15%, 1/22/2021 (b) | | | 69,269,000 | | | | 69,288,738 | |
| | |
Series D, (ICE LIBOR USD 3 Month + 0.46%), 3.26%, 4/13/2021 (b) | | | 1,319,000 | | | | 1,321,860 | |
| | |
Bank of Nova Scotia (The) (Canada) | | | | | | | | |
| | |
2.05%, 6/5/2019 | | | 7,913,000 | | | | 7,900,582 | |
| | |
(ICE LIBOR USD 3 Month + 0.66%), 3.44%, 6/14/2019 (b) | | | 475,000 | | | | 475,790 | |
| | |
(ICE LIBOR USD 3 Month + 0.42%), 3.17%, 1/25/2021 (b) | | | 52,000,000 | | | | 52,045,610 | |
| | |
(ICE LIBOR USD 3 Month + 0.64%), 3.41%, 3/7/2022 (b) | | | 9,815,000 | | | | 9,829,366 | |
| | |
Banque Federative du Credit Mutuel SA (France) | | | | | | | | |
| | |
2.20%, 7/20/2020 (a) | | | 13,030,000 | | | | 12,869,185 | |
| | |
(ICE LIBOR USD 3 Month + 0.49%), 3.25%, 7/20/2020 (a) (b) | | | 250,000 | | | | 250,464 | |
| | |
2.75%, 10/15/2020 (a) | | | 25,819,000 | | | | 25,634,467 | |
| | |
(ICE LIBOR USD 3 Month + 0.73%), 3.49%, 7/20/2022 (a) (b) | | | 13,200,000 | | | | 13,181,476 | |
| | |
Barclays Bank plc (United Kingdom) | | | | | | | | |
| | |
5.13%, 1/8/2020 | | | 1,277,000 | | | | 1,299,801 | |
| | |
(ICE LIBOR USD 3 Month + 0.65%), 3.39%, 8/7/2020 (b) | | | 1,750,000 | | | | 1,747,987 | |
| | |
BB&T Corp. | | | | | | | | |
| | |
2.45%, 1/15/2020 | | | 12,425,000 | | | | 12,370,916 | |
| | |
(ICE LIBOR USD 3 Month + 0.57%), 3.36%, 6/15/2020 (b) | | | 23,866,000 | | | | 23,922,039 | |
| | |
BNP Paribas SA (France) | | | | | | | | |
| | |
2.45%, 3/17/2019 | | | 760,000 | | | | 759,955 | |
| | |
2.38%, 5/21/2020 | | | 13,394,000 | | | | 13,324,019 | |
| | |
BNZ International Funding Ltd. (New Zealand) | | | | | | | | |
| | |
2.40%, 2/21/2020 (a) | | | 3,565,000 | | | | 3,548,587 | |
| | |
(ICE LIBOR USD 3 Month + 0.70%), 3.34%, 2/21/2020 (a) (b) | | | 3,737,000 | | | | 3,749,839 | |
| | | | | | | | |
| INVESTMENTS | | PRINCIPAL
AMOUNT ($) | | | VALUE ($) | |
| | | | | | | | |
| | |
Banks — continued | | | | | | | | |
| | |
(ICE LIBOR USD 3 Month + 0.98%), 3.76%, 9/14/2021 (a) (b) | | | 8,145,000 | | | | 8,227,264 | |
| | |
BPCE SA (France) (ICE LIBOR USD 3 Month + 0.88%), 3.51%, 5/31/2022 (b) | | | 500,000 | | | | 498,941 | |
| | |
Branch Banking & Trust Co. | | | | | | | | |
| | |
1.45%, 5/10/2019 | | | 1,902,000 | | | | 1,898,158 | |
| | |
2.10%, 1/15/2020 | | | 1,261,000 | | | | 1,252,467 | |
| | |
(ICE LIBOR USD 3 Month + 0.45%), 3.24%, 1/15/2020 (b) | | | 13,300,000 | | | | 13,333,563 | |
| | |
(ICE LIBOR USD 3 Month + 0.22%), 2.96%, 6/1/2020 (b) | | | 4,200,000 | | | | 4,194,893 | |
| | |
Capital One NA | | | | | | | | |
| | |
1.85%, 9/13/2019 | | | 13,286,000 | | | | 13,211,129 | |
| | |
2.35%, 1/31/2020 | | | 9,666,000 | | | | 9,607,837 | |
| | |
(ICE LIBOR USD 3 Month + 0.82%), 3.56%, 8/8/2022 (b) | | | 2,600,000 | | | | 2,572,596 | |
| | |
Citibank NA | | | | | | | | |
| | |
(ICE LIBOR USD 3 Month + 0.50%), 3.28%, 6/12/2020 (b) | | | 1,190,000 | | | | 1,193,123 | |
| | |
(ICE LIBOR USD 3 Month + 0.57%), 3.34%, 7/23/2021 (b) | | | 8,559,000 | | | | 8,589,735 | |
| | |
(ICE LIBOR USD 3 Month + 0.53%), 3.21%, 2/19/2022 (b) | | | 25,750,000 | | | | 25,773,767 | |
| | |
Citigroup, Inc. | | | | | | | | |
| | |
(ICE LIBOR USD 3 Month + 1.38%), 4.18%, 3/30/2021 (b) | | | 7,813,000 | | | | 7,958,963 | |
| | |
(ICE LIBOR USD 3 Month + 1.19%), 3.93%, 8/2/2021 (b) | | | 7,700,000 | | | | 7,808,570 | |
| | |
(ICE LIBOR USD 3 Month + 0.96%), 3.73%, 4/25/2022 (b) | | | 21,558,000 | | | | 21,724,277 | |
| | |
Citizens Bank NA | | | | | | | | |
| | |
2.25%, 3/2/2020 | | | 27,529,000 | | | | 27,321,625 | |
| | |
(ICE LIBOR USD 3 Month + 0.54%), 3.28%, 3/2/2020 (b) | | | 5,375,000 | | | | 5,379,881 | |
| | |
2.20%, 5/26/2020 | | | 6,168,000 | | | | 6,102,987 | |
| | |
(ICE LIBOR USD 3 Month + 0.57%), 3.22%, 5/26/2020 (b) | | | 3,400,000 | | | | 3,400,779 | |
| | |
(ICE LIBOR USD 3 Month + 0.72%), 3.41%, 2/14/2022 (b) | | | 13,205,000 | | | | 13,214,453 | |
| | |
Comerica Bank 2.50%, 6/2/2020 | | | 20,077,000 | | | | 19,921,227 | |
| | |
Comerica, Inc. 2.13%, 5/23/2019 | | | 11,625,000 | | | | 11,609,367 | |
| | |
Commonwealth Bank of Australia (Australia) | | | | | | | | |
| | |
2.30%, 9/6/2019 | | | 6,371,000 | | | | 6,356,980 | |
| | |
5.00%, 10/15/2019 (a) | | | 10,344,000 | | | | 10,479,789 | |
| | |
1.75%, 11/7/2019 (a) | | | 11,325,000 | | | | 11,245,821 | |
| | |
2.25%, 3/10/2020 (a) | | | 10,542,000 | | | | 10,474,262 | |
SEE NOTES TO FINANCIAL STATEMENTS.
| | | | | | | | |
| | | |
| FEBRUARY 28, 2019 | | J.P. MORGAN EXCHANGE-TRADED FUNDS | | | | | 105 | |
JPMorgan Ultra-Short Income ETF
SCHEDULE OF PORTFOLIO INVESTMENTS
AS OF FEBRUARY 28, 2019 (continued)
| | | | | | | | |
| INVESTMENTS | | PRINCIPAL
AMOUNT ($) | | | VALUE ($) | |
Corporate Bonds — continued | |
| | |
Banks — continued | | | | | | | | |
| | |
(ICE LIBOR USD 3 Month + 0.45%), 3.22%, 3/10/2020 (a) (b) | | | 680,000 | | | | 682,074 | |
| | |
2.30%, 3/12/2020 | | | 2,650,000 | | | | 2,633,643 | |
| | |
(ICE LIBOR USD 3 Month + 0.68%), 3.48%, 9/18/2022 (a) (b) | | | 20,000,000 | | | | 20,023,288 | |
| | |
Compass Bank | | | | | | | | |
| | |
2.75%, 9/29/2019 | | | 10,062,000 | | | | 10,061,932 | |
| | |
(ICE LIBOR USD 3 Month + 0.73%), 3.50%, 6/11/2021 (b) | | | 9,511,000 | | | | 9,417,964 | |
| | |
Cooperatieve Rabobank UA (Netherlands) | | | | | | | | |
| | |
1.38%, 8/9/2019 | | | 9,260,000 | | | | 9,207,394 | |
| | |
2.25%, 1/14/2020 | | | 12,456,000 | | | | 12,399,290 | |
| | |
4.75%, 1/15/2020 (a) | | | 10,067,000 | | | | 10,230,799 | |
| | |
(ICE LIBOR USD 3 Month + 0.43%), 3.19%, 4/26/2021 (b) | | | 4,750,000 | | | | 4,757,225 | |
| | |
(ICE LIBOR USD 3 Month + 0.83%), 3.61%, 1/10/2022 (b) | | | 3,200,000 | | | | 3,223,778 | |
| | |
Credit Agricole Corporate & Investment Bank SA (France) (ICE LIBOR USD 3 Month + 0.63%), 3.43%, 10/3/2021 (b) | | | 32,614,000 | | | | 32,673,357 | |
| | |
Credit Agricole SA (France) | | | | | | | | |
| | |
2.75%, 6/10/2020 (a) | | | 13,800,000 | | | | 13,742,965 | |
| | |
(ICE LIBOR USD 3 Month + 0.97%), 3.74%, 6/10/2020 (a) (b) | | | 3,049,000 | | | | 3,071,221 | |
| | |
(ICE LIBOR USD 3 Month + 1.18%), 3.98%, 7/1/2021 (a) (b) | | | 6,523,000 | | | | 6,608,888 | |
| | |
(ICE LIBOR USD 3 Month + 1.43%), 4.21%, 1/10/2022 (a) (b) | | | 3,320,000 | | | | 3,343,517 | |
| | |
Credit Suisse Group Funding Guernsey Ltd. (Switzerland) | | | | | | | | |
| | |
3.13%, 12/10/2020 | | | 16,282,000 | | | | 16,244,483 | |
| | |
(ICE LIBOR USD 3 Month + 2.29%), 5.07%, 4/16/2021 (b) | | | 4,750,000 | | | | 4,897,752 | |
| | |
DBS Group Holdings Ltd. (Singapore) | | | | | | | | |
| | |
2.25%, 7/16/2019 (a) | | | 14,760,000 | | | | 14,717,779 | |
| | |
(ICE LIBOR USD 3 Month + 0.49%), 3.26%, 6/8/2020 (a) (b) | | | 9,339,000 | | | | 9,346,362 | |
| | |
DNB Bank ASA (Norway) (ICE LIBOR USD 3 Month + 0.37%), 3.17%, 10/2/2020 (a) (b) | | | 7,000,000 | | | | 7,004,102 | |
| | |
Fifth Third Bancorp 2.88%, 7/27/2020 | | | 28,947,000 | | | | 28,903,535 | |
| | |
Fifth Third Bank | | | | | | | | |
| | |
1.63%, 9/27/2019 | | | 7,195,000 | | | | 7,146,708 | |
| | |
(ICE LIBOR USD 3 Month + 0.59%), 3.41%, 9/27/2019 (b) | | | 1,278,000 | | | | 1,280,692 | |
| | |
2.20%, 10/30/2020 | | | 8,840,000 | | | | 8,725,927 | |
| | | | | | | | |
| INVESTMENTS | | PRINCIPAL
AMOUNT ($) | | | VALUE ($) | |
| | | | | | | | |
| | |
Banks — continued | | | | | | | | |
| | |
(ICE LIBOR USD 3 Month + 0.25%), 3.00%, 10/30/2020 (b) | | | 3,455,000 | | | | 3,446,347 | |
| | |
(ICE LIBOR USD 3 Month + 0.44%), 3.20%, 7/26/2021 (b) | | | 1,300,000 | | | | 1,296,954 | |
| | |
First Niagara Financial Group, Inc. 6.75%, 3/19/2020 | | | 2,247,000 | | | | 2,332,789 | |
| | |
HSBC Holdings plc (United Kingdom) | | | | | | | | |
| | |
(ICE LIBOR USD 3 Month + 0.60%), 3.28%, 5/18/2021 (b) | | | 9,538,000 | | | | 9,528,901 | |
| | |
(ICE LIBOR USD 3 Month + 1.66%), 4.31%, 5/25/2021 (b) | | | 7,579,000 | | | | 7,732,408 | |
| | |
(ICE LIBOR USD 3 Month + 0.65%), 3.43%, 9/11/2021 (b) | | | 25,986,000 | | | | 25,969,925 | |
| | |
(ICE LIBOR USD 3 Month + 1.50%), 4.30%, 1/5/2022 (b) | | | 9,710,000 | | | | 9,924,076 | |
| | |
HSBC USA, Inc. | | | | | | | | |
| | |
2.38%, 11/13/2019 | | | 11,836,000 | | | | 11,801,287 | |
| | |
2.35%, 3/5/2020 | | | 11,540,000 | | | | 11,474,984 | |
| | |
5.00%, 9/27/2020 | | | 2,661,000 | | | | 2,723,487 | |
| | |
Huntington National Bank (The) | | | | | | | | |
| | |
2.20%, 4/1/2019 | | | 1,000,000 | | | | 999,679 | |
| | |
2.38%, 3/10/2020 | | | 3,967,000 | | | | 3,944,606 | |
| | |
(ICE LIBOR USD 3 Month + 0.51%), 3.28%, 3/10/2020 (b) | | | 757,000 | | | | 759,309 | |
| | |
2.40%, 4/1/2020 | | | 3,086,000 | | | | 3,068,207 | |
| | |
(ICE LIBOR USD 3 Month + 0.55%), 3.28%, 2/5/2021 (b) | | | 21,866,000 | | | | 21,867,246 | |
| | |
ING Groep NV (Netherlands) (ICE LIBOR USD 3 Month + 1.15%), 3.95%, 3/29/2022 (b) | | | 33,162,000 | | | | 33,269,290 | |
| | |
KeyBank NA | | | | | | | | |
| | |
1.60%, 8/22/2019 | | | 11,116,000 | | | | 11,055,343 | |
| | |
2.50%, 12/15/2019 | | | 9,321,000 | | | | 9,299,740 | |
| | |
2.25%, 3/16/2020 | | | 10,276,000 | | | | 10,211,105 | |
| | |
Lloyds Bank plc (United Kingdom) | | | | | | | | |
| | |
5.80%, 1/13/2020 (a) | | | 11,470,000 | | | | 11,732,911 | |
| | |
(ICE LIBOR USD 3 Month + 0.49%), 3.23%, 5/7/2021 (b) | | | 2,101,000 | | | | 2,090,057 | |
| | |
Manufacturers & Traders Trust Co. | | | | | | | | |
| | |
(ICE LIBOR USD 3 Month + 0.64%), 3.38%, 12/1/2021 (b) | | | 16,250,000 | | | | 16,157,101 | |
| | |
(ICE LIBOR USD 3 Month + 0.61%), 3.30%, 5/18/2022 (b) | | | 14,091,000 | | | | 13,989,109 | |
| | |
Mitsubishi UFJ Financial Group, Inc. (Japan) | | | | | | | | |
| | |
(ICE LIBOR USD 3 Month + 0.65%), 3.41%, 7/26/2021 (b) | | | 8,560,000 | | | | 8,558,547 | |
SEE NOTES TO FINANCIAL STATEMENTS.
| | | | | | |
| | | |
| 106 | | | | J.P. MORGAN EXCHANGE-TRADED FUNDS | | FEBRUARY 28, 2019 |
| | | | | | | | |
| INVESTMENTS | | PRINCIPAL
AMOUNT ($) | | | VALUE ($) | |
Corporate Bonds — continued | |
| | |
Banks — continued | | | | | | | | |
| | |
(ICE LIBOR USD 3 Month + 1.06%), 3.84%, 9/13/2021 (b) | | | 6,576,000 | | | | 6,637,860 | |
| | |
(ICE LIBOR USD 3 Month + 0.92%), 3.58%, 2/22/2022 (b) | | | 4,189,000 | | | | 4,214,611 | |
| | |
(ICE LIBOR USD 3 Month + 0.79%), 3.56%, 7/25/2022 (b) | | | 20,092,000 | | | | 20,104,978 | |
| | |
Mitsubishi UFJ Trust & Banking Corp. (Japan) 2.45%, 10/16/2019 (a) | | | 22,844,000 | | | | 22,785,690 | |
| | |
Mizuho Bank Ltd. (Japan) 2.40%, 3/26/2020 (a) | | | 14,056,000 | | | | 13,986,344 | |
| | |
Mizuho Financial Group, Inc. (Japan) | | | | | | | | |
| | |
(ICE LIBOR USD 3 Month + 1.14%), 3.92%, 9/13/2021 (b) | | | 14,870,000 | | | | 15,031,611 | |
| | |
(ICE LIBOR USD 3 Month + 0.94%), 3.57%, 2/28/2022 (b) | | | 6,525,000 | | | | 6,560,238 | |
| | |
(ICE LIBOR USD 3 Month + 0.88%), 3.65%, 9/11/2022 (b) | | | 7,800,000 | | | | 7,817,057 | |
| | |
MUFG Bank Ltd. (Japan) | | | | | | | | |
| | |
2.35%, 9/8/2019 (a) | | | 10,049,000 | | | | 10,023,363 | |
| | |
2.30%, 3/5/2020 (a) | | | 15,497,000 | | | | 15,413,357 | |
| | |
National Australia Bank Ltd. (Australia) | | | | | | | | |
| | |
2.40%, 12/9/2019 (a) | | | 3,000,000 | | | | 2,991,140 | |
| | |
2.25%, 1/10/2020 | | | 2,857,000 | | | | 2,843,882 | |
| | |
2.13%, 5/22/2020 | | | 2,485,000 | | | | 2,461,831 | |
| | |
(ICE LIBOR USD 3 Month + 0.51%), 3.17%, 5/22/2020 (a) (b) | | | 23,959,000 | | | | 24,063,397 | |
| | |
(ICE LIBOR USD 3 Month + 0.35%), 3.15%, 1/12/2021 (a) (b) | | | 7,170,000 | | | | 7,168,020 | |
| | |
(ICE LIBOR USD 3 Month + 1.00%), 3.80%, 7/12/2021 (a) (b) | | | 4,490,000 | | | | 4,548,213 | |
| | |
(ICE LIBOR USD 3 Month + 0.71%), 3.45%, 11/4/2021 (a) (b) | | | 16,500,000 | | | | 16,577,217 | |
| | |
(ICE LIBOR USD 3 Month + 0.72%), 3.38%, 5/22/2022 (a) (b) | | | 10,000,000 | | | | 10,043,487 | |
| | |
National Bank of Canada (Canada) (ICE LIBOR USD 3 Month + 0.60%), 3.37%, 1/17/2020 (b) | | | 15,739,000 | | | | 15,801,200 | |
| | |
Nordea Bank AB (Finland) | | | | | | | | |
| | |
1.63%, 9/30/2019 (a) | | | 724,000 | | | | 718,871 | |
| | |
4.88%, 1/27/2020 (a) | | | 9,975,000 | | | | 10,153,694 | |
| | |
2.13%, 5/29/2020 (a) | | | 7,879,000 | | | | 7,792,888 | |
| | |
(ICE LIBOR USD 3 Month + 0.47%), 3.10%, 5/29/2020 (a) (b) | | | 5,052,000 | | | | 5,067,232 | |
| | |
2.50%, 9/17/2020 (a) | | | 4,505,000 | | | | 4,473,410 | |
| | |
PNC Bank NA | | | | | | | | |
| | |
2.40%, 10/18/2019 | | | 6,922,000 | | | | 6,906,017 | |
| | |
2.30%, 6/1/2020 | | | 4,368,000 | | | | 4,337,636 | |
| | | | | | | | |
| INVESTMENTS | | PRINCIPAL
AMOUNT ($) | | | VALUE ($) | |
| | | | | | | | |
| | |
Banks — continued | | | | | | | | |
| | |
(ICE LIBOR USD 3 Month + 0.25%), 3.01%, 1/22/2021 (b) | | | 1,000,000 | | | | 998,480 | |
| | |
2.15%, 4/29/2021 | | | 15,000,000 | | | | 14,729,231 | |
| | |
(ICE LIBOR USD 3 Month + 0.50%), 3.26%, 7/27/2022 (b) | | | 2,075,000 | | | | 2,063,192 | |
| | |
Regions Bank (ICE LIBOR USD 3 Month + 0.38%), 3.18%, 4/1/2021 (b) | | | 4,950,000 | | | | 4,905,072 | |
| | |
Royal Bank of Canada (Canada) | | | | | | | | |
| | |
(ICE LIBOR USD 3 Month + 0.71%), 3.50%, 4/15/2019 (b) | | | 665,000 | | | | 665,668 | |
| | |
1.50%, 7/29/2019 | | | 10,000,000 | | | | 9,955,983 | |
| | |
(ICE LIBOR USD 3 Month + 0.30%), 3.06%, 7/22/2020 (b) | | | 6,317,000 | | | | 6,321,360 | |
| | |
(ICE LIBOR USD 3 Month + 0.40%), 3.17%, 1/25/2021 (b) | | | 26,000,000 | | | | 26,008,228 | |
| | |
(ICE LIBOR USD 3 Month + 0.39%), 3.14%, 4/30/2021 (b) | | | 7,000,000 | | | | 7,004,706 | |
| | |
Santander UK plc (United Kingdom) | | | | | | | | |
| | |
2.50%, 3/14/2019 | | | 9,246,000 | | | | 9,245,737 | |
| | |
2.35%, 9/10/2019 | | | 10,103,000 | | | | 10,079,038 | |
| | |
(ICE LIBOR USD 3 Month + 0.62%), 3.36%, 6/1/2021 (b) | | | 2,800,000 | | | | 2,795,150 | |
| | |
(ICE LIBOR USD 3 Month + 0.66%), 3.34%, 11/15/2021 (b) | | | 5,788,000 | | | | 5,780,437 | |
| | |
Skandinaviska Enskilda Banken AB (Sweden) | | | | | | | | |
| | |
1.50%, 9/13/2019 | | | 26,598,000 | | | | 26,413,217 | |
| | |
2.30%, 3/11/2020 | | | 4,055,000 | | | | 4,030,971 | |
| | |
2.45%, 5/27/2020 (a) | | | 8,972,000 | | | | 8,912,049 | |
| | |
2.63%, 11/17/2020 (a) | | | 10,090,000 | | | | 9,999,331 | |
| | |
2.63%, 3/15/2021 | | | 4,120,000 | | | | 4,085,313 | |
| | |
(ICE LIBOR USD 3 Month + 0.43%), 3.11%, 5/17/2021 (a) (b) | | | 7,500,000 | | | | 7,490,963 | |
| | |
Societe Generale SA (France) (ICE LIBOR USD 3 Month + 1.33%), 4.13%, 4/8/2021 (a) (b) | | | 4,900,000 | | | | 4,969,617 | |
| | |
Standard Chartered plc (United Kingdom) | | | | | | | | |
| | |
2.10%, 8/19/2019 (a) | | | 41,308,000 | | | | 41,145,794 | |
| | |
2.40%, 9/8/2019 (a) | | | 3,165,000 | | | | 3,151,603 | |
| | |
2.25%, 4/17/2020 (a) | | | 3,572,000 | | | | 3,524,835 | |
| | |
(ICE LIBOR USD 3 Month + 1.15%), 3.91%, 1/20/2023 (a) (b) | | | 10,500,000 | | | | 10,446,030 | |
| | |
Sumitomo Mitsui Banking Corp. (Japan) | | | | | | | | |
| | |
2.51%, 1/17/2020 | | | 27,922,000 | | | | 27,828,241 | |
| | |
(ICE LIBOR USD 3 Month + 0.35%), 3.12%, 1/17/2020 (b) | | | 9,863,000 | | | | 9,879,304 | |
SEE NOTES TO FINANCIAL STATEMENTS.
| | | | | | | | |
| | | |
| FEBRUARY 28, 2019 | | J.P. MORGAN EXCHANGE-TRADED FUNDS | | | | | 107 | |
JPMorgan Ultra-Short Income ETF
SCHEDULE OF PORTFOLIO INVESTMENTS
AS OF FEBRUARY 28, 2019 (continued)
| | | | | | | | |
| INVESTMENTS | | PRINCIPAL
AMOUNT ($) | | | VALUE ($) | |
Corporate Bonds — continued | |
| | |
Banks — continued | | | | | | | | |
| | |
Sumitomo Mitsui Financial Group, Inc. (Japan) | | | | | | | | |
| | |
(ICE LIBOR USD 3 Month + 1.11%), 3.90%, 7/14/2021 (b) | | | 4,104,000 | | | | 4,147,667 | |
| | |
(ICE LIBOR USD 3 Month + 0.97%), 3.77%, 1/11/2022 (b) | | | 19,000,000 | | | | 19,120,798 | |
| | |
(ICE LIBOR USD 3 Month + 0.74%), 3.52%, 10/18/2022 (b) | | | 1,890,000 | | | | 1,882,118 | |
| | |
Sumitomo Mitsui Trust Bank Ltd. (Japan) | | | | | | | | |
| | |
1.95%, 9/19/2019 (a) | | | 2,432,000 | | | | 2,420,325 | |
| | |
2.05%, 10/18/2019 (a) | | | 4,798,000 | | | | 4,774,867 | |
| | |
(ICE LIBOR USD 3 Month + 0.91%), 3.69%, 10/18/2019 (a) (b) | | | 4,200,000 | | | | 4,220,041 | |
| | |
SunTrust Banks, Inc. 2.50%, 5/1/2019 | | | 22,233,000 | | | | 22,227,231 | |
| | |
Svenska Handelsbanken AB (Sweden) | | | | | | | | |
| | |
2.25%, 6/17/2019 | | | 2,414,000 | | | | 2,411,139 | |
| | |
1.50%, 9/6/2019 | | | 11,103,000 | | | | 11,027,245 | |
| | |
(ICE LIBOR USD 3 Month + 0.49%), 3.23%, 9/6/2019 (b) | | | 4,811,000 | | | | 4,819,953 | |
| | |
5.13%, 3/30/2020 (a) | | | 17,779,000 | | | | 18,183,912 | |
| | |
2.40%, 10/1/2020 | | | 7,621,000 | | | | 7,558,631 | |
| | |
(ICE LIBOR USD 3 Month + 0.47%), 3.12%, 5/24/2021 (b) | | | 28,555,000 | | | | 28,579,348 | |
| | |
Swedbank AB (Sweden) 2.20%, 3/4/2020 (a) | | | 250,000 | | | | 247,804 | |
| | |
Toronto-Dominion Bank (The) (Canada) | | | | | | | | |
| | |
1.45%, 8/13/2019 | | | 1,000,000 | | | | 994,557 | |
| | |
(ICE LIBOR USD 3 Month + 0.28%), 3.05%, 6/11/2020 (b) | | | 8,231,000 | | | | 8,243,912 | |
| | |
(ICE LIBOR USD 3 Month + 0.26%), 3.05%, 9/17/2020 (b) | | | 8,360,000 | | | | 8,362,531 | |
| | |
UBS Group Funding Switzerland AG (Switzerland) | | | | | | | | |
| | |
2.95%, 9/24/2020 (a) | | | 3,036,000 | | | | 3,028,020 | |
| | |
(ICE LIBOR USD 3 Month + 1.44%), 4.26%, 9/24/2020 (a) (b) | | | 17,549,000 | | | | 17,778,077 | |
| | |
(ICE LIBOR USD 3 Month + 1.78%), 4.58%, 4/14/2021 (a) (b) | | | 1,400,000 | | | | 1,432,405 | |
| | |
(ICE LIBOR USD 3 Month + 1.53%), 4.27%, 2/1/2022 (a) (b) | | | 15,805,000 | | | | 16,092,403 | |
| | |
US Bank NA | | | | | | | | |
| | |
(ICE LIBOR USD 3 Month + 0.15%), 2.80%, 5/24/2019 (b) | | | 250,000 | | | | 250,033 | |
| | |
(ICE LIBOR USD 3 Month + 0.31%), 3.05%, 2/4/2021 (b) | | | 21,496,000 | | | | 21,523,444 | |
| | |
(ICE LIBOR USD 3 Month + 0.32%), 3.08%, 4/26/2021 (b) | | | 1,331,000 | | | | 1,331,227 | |
| | | | | | | | |
| INVESTMENTS | | PRINCIPAL
AMOUNT ($) | | | VALUE ($) | |
| | | | | | | | |
| | |
Banks — continued | | | | | | | | |
| | |
Wells Fargo Bank NA | | | | | | | | |
| | |
2.40%, 1/15/2020 | | | 20,734,000 | | | | 20,654,335 | |
| | |
(SOFR + 0.48%), 2.85%, 3/25/2020 (b) | | | 9,220,000 | | | | 9,216,905 | |
| | |
(ICE LIBOR USD 3 Month + 0.51%), 3.27%, 10/22/2021 (b) | | | 12,251,000 | | | | 12,253,981 | |
| | |
Westpac Banking Corp. (Australia) | | | | | | | | |
| | |
1.65%, 5/13/2019 | | | 8,050,000 | | | | 8,032,048 | |
| | |
1.60%, 8/19/2019 | | | 15,000,000 | | | | 14,925,399 | |
| | |
4.88%, 11/19/2019 | | | 6,687,000 | | | | 6,785,322 | |
| | |
2.15%, 3/6/2020 | | | 6,112,000 | | | | 6,073,117 | |
| | |
(ICE LIBOR USD 3 Month + 0.28%), 2.96%, 5/15/2020 (b) | | | 1,283,000 | | | | 1,284,315 | |
| | |
3.05%, 5/15/2020 | | | 5,000,000 | | | | 5,008,401 | |
| | |
(ICE LIBOR USD 3 Month + 0.36%), 3.10%, 9/1/2020 (a) (b) | | | 450,000 | | | | 450,967 | |
| | | | | | | | |
| | |
| | | | | | | 1,945,108,613 | |
| | | | | | | | |
| | |
Beverages — 0.3% | | | | | | | | |
| | |
Anheuser-Busch InBev Worldwide, Inc. (Belgium) 6.88%, 11/15/2019 | | | 5,773,000 | | | | 5,933,988 | |
| | |
Constellation Brands, Inc. (ICE LIBOR USD 3 Month + 0.70%), 3.38%, 11/15/2021 (b) | | | 7,392,000 | | | | 7,358,389 | |
| | |
Diageo Capital plc (United Kingdom) (ICE LIBOR USD 3 Month + 0.24%), 2.92%, 5/18/2020 (b) | | | 1,715,000 | | | | 1,714,995 | |
| | |
Molson Coors Brewing Co. 1.90%, 3/15/2019 | | | 2,500,000 | | | | 2,499,386 | |
| | |
Suntory Holdings Ltd. (Japan) 2.55%, 9/29/2019 (a) | | | 2,023,000 | | | | 2,015,261 | |
| | | | | | | | |
| | |
| | | | | | | 19,522,019 | |
| | | | | | | | |
| | |
Biotechnology — 0.5% | | | | | | | | |
| | |
Amgen, Inc. | | | | | | | | |
| | |
1.90%, 5/10/2019 | | | 7,067,000 | | | | 7,055,761 | |
| | |
2.20%, 5/22/2019 | | | 20,186,000 | | | | 20,163,756 | |
| | |
Gilead Sciences, Inc. (ICE LIBOR USD 3 Month + 0.22%), 3.01%, 3/20/2019 (b) | | | 195,000 | | | | 195,021 | |
| | | | | | | | |
| | |
| | | | | | | 27,414,538 | |
| | | | | | | | |
| | |
Capital Markets — 5.2% | | | | | | | | |
| | |
Bank of New York Mellon Corp. (The) 2.30%, 9/11/2019 | | | 4,978,000 | | | | 4,968,431 | |
| | |
CDP Financial, Inc. (Canada) 4.40%, 11/25/2019 (a) | | | 1,172,000 | | | | 1,185,189 | |
SEE NOTES TO FINANCIAL STATEMENTS.
| | | | | | |
| | | |
| 108 | | | | J.P. MORGAN EXCHANGE-TRADED FUNDS | | FEBRUARY 28, 2019 |
| | | | | | | | |
| INVESTMENTS | | PRINCIPAL
AMOUNT ($) | | | VALUE ($) | |
Corporate Bonds — continued | |
| | |
Capital Markets — continued | | | | | | | | |
| | |
Charles Schwab Corp. (The) (ICE LIBOR USD 3 Month + 0.32%), 2.96%, 5/21/2021 (b) | | | 10,961,000 | | | | 10,960,890 | |
| | |
CPPIB Capital, Inc. (Canada) 1.25%, 9/20/2019 (a) | | | 4,798,000 | | | | 4,760,441 | |
| | |
Credit Suisse AG (Switzerland) 2.30%, 5/28/2019 | | | 3,500,000 | | | | 3,497,025 | |
| | |
Goldman Sachs Bank USA 3.20%, 6/5/2020 | | | 1,305,000 | | | | 1,310,416 | |
| | |
Goldman Sachs Group, Inc. (The) | | | | | | | | |
| | |
2.55%, 10/23/2019 | | | 1,033,000 | | | | 1,030,616 | |
| | |
5.38%, 3/15/2020 | | | 7,594,000 | | | | 7,771,975 | |
| | |
(ICE LIBOR USD 3 Month + 1.16%), 3.93%, 4/23/2020 (b) | | | 7,445,000 | | | | 7,504,762 | |
| | |
(ICE LIBOR USD 3 Month + 1.20%), 3.99%, 9/15/2020 (b) | | | 1,900,000 | | | | 1,921,011 | |
| | |
(ICE LIBOR USD 3 Month + 0.73%), 3.55%, 12/27/2020 (b) | | | 5,444,000 | | | | 5,455,198 | |
| | |
(ICE LIBOR USD 3 Month + 1.77%), 4.42%, 2/25/2021 (b) | | | 5,144,000 | | | | 5,257,736 | |
| | |
(ICE LIBOR USD 3 Month + 1.11%), 3.87%, 4/26/2022 (b) | | | 20,664,000 | | | | 20,780,827 | |
| | |
(ICE LIBOR USD 3 Month + 0.78%), 3.52%, 10/31/2022 (b) | | | 4,934,000 | | | | 4,917,915 | |
| | |
ING Bank NV (Netherlands) | | | | | | | | |
| | |
(ICE LIBOR USD 3 Month + 0.61%), 3.29%, 8/15/2019 (a) (b) | | | 4,370,000 | | | | 4,379,439 | |
| | |
2.50%, 10/1/2019 (a) | | | 10,911,000 | | | | 10,885,555 | |
| | |
(ICE LIBOR USD 3 Month + 0.69%), 3.49%, 10/1/2019 (a) (b) | | | 2,035,000 | | | | 2,041,497 | |
| | |
2.45%, 3/16/2020 (a) | | | 26,706,000 | | | | 26,588,817 | |
| | |
(ICE LIBOR USD 3 Month + 0.97%), 3.65%, 8/17/2020 (a) (b) | | | 6,025,000 | | | | 6,081,972 | |
| | |
Macquarie Bank Ltd. (Australia) | | | | | | | | |
| | |
2.60%, 6/24/2019 (a) | | | 1,613,000 | | | | 1,612,495 | |
| | |
2.40%, 1/21/2020 (a) | | | 7,338,000 | | | | 7,304,245 | |
| | |
(ICE LIBOR USD 3 Month + 1.12%), 3.87%, 7/29/2020 (a) (b) | | | 2,094,000 | | | | 2,113,252 | |
| | |
Macquarie Group Ltd. (Australia) | | | | | | | | |
| | |
7.63%, 8/13/2019 (a) | | | 1,572,000 | | | | 1,603,623 | |
| | |
6.00%, 1/14/2020 (a) | | | 24,670,000 | | | | 25,278,889 | |
| | |
Morgan Stanley | | | | | | | | |
| | |
5.63%, 9/23/2019 | | | 15,704,000 | | | | 15,935,740 | |
| | |
(ICE LIBOR USD 3 Month + 1.14%), 3.90%, 1/27/2020 (b) | | | 4,000,000 | | | | 4,028,540 | |
| | |
5.50%, 7/24/2020 | | | 3,530,000 | | | | 3,643,960 | |
| | |
(ICE LIBOR USD 3 Month + 0.55%), 3.25%, 2/10/2021 (b) | | | 5,000,000 | | | | 5,007,925 | |
| | | | | | | | |
| INVESTMENTS | | PRINCIPAL
AMOUNT ($) | | | VALUE ($) | |
| |
| | |
Capital Markets — continued | | | | | | | | |
| | |
(ICE LIBOR USD 3 Month + 0.93%), 3.69%, 7/22/2022 (b) | | | 27,958,000 | | | | 28,056,372 | |
| | |
Nomura Holdings, Inc. (Japan) | | | | | | | | |
| | |
2.75%, 3/19/2019 | | | 13,703,000 | | | | 13,704,246 | |
| | |
6.70%, 3/4/2020 | | | 7,946,000 | | | | 8,229,392 | |
| | |
UBS AG (Switzerland) | | | | | | | | |
| | |
2.20%, 6/8/2020 (a) | | | 6,737,000 | | | | 6,668,889 | |
| | |
(ICE LIBOR USD 3 Month + 0.58%), 3.35%, 6/8/2020 (a) (b) | | | 3,000,000 | | | | 3,010,746 | |
| | |
4.88%, 8/4/2020 | | | 16,250,000 | | | | 16,665,904 | |
| | |
2.45%, 12/1/2020 (a) | | | 9,813,000 | | | | 9,708,001 | |
| | |
(ICE LIBOR USD 3 Month + 0.48%), 3.22%, 12/1/2020 (a) (b) | | | 10,162,000 | | | | 10,168,870 | |
| | |
USAA Capital Corp. 2.13%, 6/3/2019 (a) | | | 651,000 | | | | 650,063 | |
| | | | | | | | |
| | |
| | | | | | | 294,690,864 | |
| | | | | | | | |
| | |
Chemicals — 0.6% | | | | | | | | |
| | |
Air Liquide Finance SA (France) 1.38%, 9/27/2019 (a) | | | 22,316,000 | | | | 22,121,695 | |
| | |
DowDuPont, Inc. (ICE LIBOR USD 3 Month + 0.71%), 3.39%, 11/15/2020 (b) | | | 6,599,000 | | | | 6,637,424 | |
| | |
Nutrien Ltd. (Canada) 6.50%, 5/15/2019 | | | 6,260,000 | | | | 6,306,278 | |
| | | | | | | | |
| | |
| | | | | | | 35,065,397 | |
| | | | | | | | |
|
Commercial Services & Supplies — 0.2% | |
| | |
Brambles USA, Inc. (Australia) 5.35%, 4/1/2020 (a) | | | 7,869,000 | | | | 8,031,011 | |
| | |
Republic Services, Inc. 5.00%, 3/1/2020 | | | 5,601,000 | | | | 5,710,734 | |
| | | | | | | | |
| | |
| | | | | | | 13,741,745 | |
| | | | | | | | |
| | |
Construction Materials — 0.1% | | | | | | | | |
| | |
Martin Marietta Materials, Inc. (ICE LIBOR USD 3 Month + 0.65%), 3.31%, 5/22/2020 (b) | | | 5,627,000 | | | | 5,626,984 | |
| | | | | | | | |
| | |
Consumer Finance — 2.7% | | | | | | | | |
| | |
AerCap Ireland Capital DAC (Ireland) 3.75%, 5/15/2019 | | | 4,050,000 | | | | 4,060,166 | |
| | |
American Express Co. | | | | | | | | |
| | |
(ICE LIBOR USD 3 Month + 0.53%), 3.21%, 5/17/2021 (b) | | | 3,354,000 | | | | 3,357,130 | |
| | |
(ICE LIBOR USD 3 Month + 0.60%), 3.33%, 11/5/2021 (b) | | | 7,500,000 | | | | 7,511,070 | |
| | |
(ICE LIBOR USD 3 Month + 0.65%), 3.29%, 2/27/2023 (b) | | | 5,421,000 | | | | 5,377,632 | |
SEE NOTES TO FINANCIAL STATEMENTS.
| | | | | | | | |
| | | |
| FEBRUARY 28, 2019 | | J.P. MORGAN EXCHANGE-TRADED FUNDS | | | | | 109 | |
JPMorgan Ultra-Short Income ETF
SCHEDULE OF PORTFOLIO INVESTMENTS
AS OF FEBRUARY 28, 2019 (continued)
| | | | | | | | |
| INVESTMENTS | | PRINCIPAL
AMOUNT ($) | | | VALUE ($) | |
Corporate Bonds — continued | |
| | |
Consumer Finance — continued | | | | | | | | |
| | |
American Express Credit Corp. | | | | | | | | |
| | |
1.88%, 5/3/2019 | | | 3,923,000 | | | | 3,917,469 | |
| | |
(ICE LIBOR USD 3 Month + 0.49%), 3.17%, 8/15/2019 (b) | | | 3,303,000 | | | | 3,308,588 | |
| | |
1.70%, 10/30/2019 | | | 9,547,000 | | | | 9,478,844 | |
| | |
(ICE LIBOR USD 3 Month + 0.57%), 3.32%, 10/30/2019 (b) | | | 1,024,000 | | | | 1,026,487 | |
| | |
American Honda Finance Corp. 1.20%, 7/12/2019 | | | 10,000,000 | | | | 9,947,444 | |
| | |
Capital One Financial Corp. | | | | | | | | |
| | |
2.50%, 5/12/2020 | | | 14,984,000 | | | | 14,883,101 | |
| | |
(ICE LIBOR USD 3 Month + 0.76%), 3.46%, 5/12/2020 (b) | | | 7,750,000 | | | | 7,780,593 | |
| | |
(ICE LIBOR USD 3 Month + 0.95%), 3.72%, 3/9/2022 (b) | | | 7,714,000 | | | | 7,673,338 | |
| | |
Caterpillar Financial Services Corp. | | | | | | | | |
| | |
2.10%, 6/9/2019 | | | 1,629,000 | | | | 1,626,191 | |
| | |
(ICE LIBOR USD 3 Month + 0.18%), 2.86%, 5/15/2020 (b) | | | 6,853,000 | | | | 6,853,868 | |
| | |
(ICE LIBOR USD 3 Month + 0.28%), 3.05%, 9/7/2021 (b) | | | 4,763,000 | | | | 4,750,180 | |
| | |
General Motors Financial Co., Inc. | | | | | | | | |
| | |
2.40%, 5/9/2019 | | | 2,838,000 | | | | 2,835,275 | |
| | |
3.50%, 7/10/2019 | | | 1,097,000 | | | | 1,099,060 | |
| | |
3.15%, 1/15/2020 | | | 6,081,000 | | | | 6,080,421 | |
| | |
(ICE LIBOR USD 3 Month + 0.93%), 3.73%, 4/13/2020 (b) | | | 3,271,000 | | | | 3,270,122 | |
| | |
ICBCIL Finance Co. Ltd. (China) 2.38%, 5/19/2019 (a) | | | 1,595,000 | | | | 1,591,773 | |
| | |
John Deere Capital Corp. | | | | | | | | |
| | |
1.70%, 1/15/2020 | | | 5,495,000 | | | | 5,445,170 | |
| | |
(ICE LIBOR USD 3 Month + 0.42%), 3.20%, 7/10/2020 (b) | | | 26,235,000 | | | | 26,280,268 | |
| | |
PACCAR Financial Corp. | | | | | | | | |
| | |
(ICE LIBOR USD 3 Month + 0.20%), 2.89%, 11/13/2020 (b) | | | 11,340,000 | | | | 11,329,735 | |
| | |
(ICE LIBOR USD 3 Month + 0.26%), 2.96%, 5/10/2021 (b) | | | 879,000 | | | | 875,663 | |
| | |
Toyota Motor Credit Corp. (ICE LIBOR USD 3 Month + 0.20%), 2.75%, 6/3/2020 (b) | | | 3,500,000 | | | | 3,498,054 | |
| | | | | | | | |
| | |
| | | | | | | 153,857,642 | |
| | | | | | | | |
| | |
Diversified Financial Services — 0.9% | | | | | | | | |
| | |
AIG Global Funding | | | | | | | | |
| | |
(ICE LIBOR USD 3 Month + 0.48%), 3.28%, 7/2/2020 (a) (b) | | | 3,956,000 | | | | 3,962,860 | |
| | | | | | | | |
| INVESTMENTS | | PRINCIPAL
AMOUNT ($) | | | VALUE ($) | |
| |
| |
Diversified Financial Services — continued | | | | | |
| | |
(ICE LIBOR USD 3 Month + 0.65%), 3.38%, 1/22/2021 (a) (b) | | | 26,436,000 | | | | 26,459,955 | |
| | |
Boeing Capital Corp. 4.70%, 10/27/2019 | | | 3,910,000 | | | | 3,962,244 | |
| | |
Federation des Caisses Desjardins du Quebec (Canada) (ICE LIBOR USD 3 Month + 0.33%), 3.08%, 10/30/2020 (a) (b) | | | 700,000 | | | | 699,794 | |
| | |
National Rural Utilities Cooperative Finance Corp. | | | | | | | | |
| | |
2.00%, 1/27/2020 | | | 2,787,000 | | | | 2,767,948 | |
| | |
(ICE LIBOR USD 3 Month + 0.38%), 3.18%, 6/30/2021 (b) | | | 7,159,000 | | | | 7,148,597 | |
| | |
Siemens Financieringsmaatschappij NV (Germany) (ICE LIBOR USD 3 Month + 0.34%), 3.13%, 3/16/2020 (a) (b) | | | 4,036,000 | | | | 4,036,277 | |
| | | | | | | | |
| | |
| | | | | | | 49,037,675 | |
| | | | | | | | |
| |
Diversified Telecommunication Services — 1.6% | | | | | |
| | |
AT&T, Inc. (ICE LIBOR USD 3 Month + 0.65%), 3.44%, 1/15/2020 (b) | | | 11,800,000 | | | | 11,842,034 | |
| | |
Deutsche Telekom International Finance BV (Germany) | | | | | | | | |
| | |
6.00%, 7/8/2019 | | | 4,087,000 | | | | 4,131,556 | |
| | |
1.50%, 9/19/2019 (a) | | | 5,145,000 | | | | 5,106,422 | |
| | |
(ICE LIBOR USD 3 Month + 0.45%), 3.25%, 9/19/2019 (a) (b) | | | 4,490,000 | | | | 4,498,558 | |
| | |
2.23%, 1/17/2020 (a) | | | 4,909,000 | | | | 4,873,819 | |
| | |
(ICE LIBOR USD 3 Month + 0.58%), 3.35%, 1/17/2020 (a) (b) | | | 3,009,000 | | | | 3,017,009 | |
| | |
Orange SA (France) | | | | | | | | |
| | |
5.38%, 7/8/2019 | | | 14,821,000 | | | | 14,946,303 | |
| | |
1.63%, 11/3/2019 | | | 8,493,000 | | | | 8,420,790 | |
| | |
SES GLOBAL Americas Holdings GP (Luxembourg) 2.50%, 3/25/2019 (a) | | | 4,371,000 | | | | 4,370,108 | |
| | |
Verizon Communications, Inc. | | | | | | | | |
| | |
(ICE LIBOR USD 3 Month + 0.55%), 3.21%, 5/22/2020 (b) | | | 5,434,000 | | | | 5,456,501 | |
| | |
(ICE LIBOR USD 3 Month + 1.00%), 3.79%, 3/16/2022 (b) | | | 25,199,000 | | | | 25,487,170 | |
| | | | | | | | |
| | |
| | | | | | | 92,150,270 | |
| | | | | | | | |
| | |
Electric Utilities — 1.7% | | | | | | | | |
| | |
Arizona Public Service Co. 8.75%, 3/1/2019 | | | 1,998,000 | | | | 1,998,000 | |
| | |
Duke Energy Florida LLC | | | | | | | | |
| | |
2.10%, 12/15/2019 | | | 265,500 | | | | 264,746 | |
| | |
1.85%, 1/15/2020 | | | 2,325,000 | | | | 2,307,136 | |
SEE NOTES TO FINANCIAL STATEMENTS.
| | | | | | |
| | | |
| 110 | | | | J.P. MORGAN EXCHANGE-TRADED FUNDS | | FEBRUARY 28, 2019 |
| | | | | | | | |
| INVESTMENTS | | PRINCIPAL
AMOUNT ($) | | | VALUE ($) | |
Corporate Bonds — continued | |
| | |
Electric Utilities — continued | | | | | | | | |
| | |
Duke Energy Ohio, Inc. 5.45%, 4/1/2019 | | | 1,373,000 | | | | 1,375,854 | |
| | |
Eversource Energy 4.50%, 11/15/2019 | | | 4,818,000 | | | | 4,872,198 | |
| | |
Kansas City Power & Light Co. Series 09A, 7.15%, 4/1/2019 | | | 2,403,000 | | | | 2,410,899 | |
| | |
Mississippi Power Co. (ICE LIBOR USD 3 Month + 0.65%), 3.47%, 3/27/2020 (b) | | | 2,849,000 | | | | 2,847,548 | |
| | |
NextEra Energy Capital Holdings, Inc. | | | | | | | | |
| | |
2.30%, 4/1/2019 | | | 5,902,000 | | | | 5,900,451 | |
| | |
(ICE LIBOR USD 3 Month + 0.55%), 3.18%, 8/28/2021 (b) | | | 12,660,000 | | | | 12,599,842 | |
| | |
Niagara Mohawk Power Corp. 4.88%, 8/15/2019 (a) | | | 8,505,000 | | | | 8,580,980 | |
| | |
Oncor Electric Delivery Co. LLC 2.15%, 6/1/2019 | | | 11,509,000 | | | | 11,492,209 | |
| | |
Progress Energy, Inc. 7.05%, 3/15/2019 | | | 6,603,000 | | | | 6,611,800 | |
| | |
Public Service Co. of Oklahoma 5.15%, 12/1/2019 | | | 1,673,000 | | | | 1,700,498 | |
| | |
Public Service Electric & Gas Co. Series I, 1.80%, 6/1/2019 | | | 5,631,000 | | | | 5,615,346 | |
| | |
State Grid Overseas Investment 2016 Ltd. (China) 2.25%, 5/4/2020 (a) | | | 2,719,000 | | | | 2,683,689 | |
| | |
State Grid Overseas Investment Ltd. (China) 2.75%, 5/7/2019 (a) | | | 14,200,000 | | | | 14,192,732 | |
| | |
Virginia Electric & Power Co. 5.00%, 6/30/2019 | | | 4,973,000 | | | | 5,006,821 | |
| | |
Wisconsin Power & Light Co. | | | | | | | | |
| | |
5.00%, 7/15/2019 | | | 3,338,000 | | | | 3,361,536 | |
| | |
4.60%, 6/15/2020 | | | 1,368,000 | | | | 1,393,725 | |
| | | | | | | | |
| | |
| | | | | | | 95,216,010 | |
| | | | | | | | |
| | |
Electrical Equipment — 0.0%(c) | | | | | | | | |
| | |
Emerson Electric Co. 5.00%, 4/15/2019 | | | 1,245,000 | | | | 1,248,021 | |
| | | | | | | | |
| | |
Energy Equipment & Services — 0.3% | | | | | | | | |
| | |
Schlumberger Holdings Corp. 3.00%, 12/21/2020 (a) | | | 14,962,000 | | | | 14,909,479 | |
| | | | | | | | |
| | |
Entertainment — 0.7% | | | | | | | | |
| | |
NBCUniversal Enterprise, Inc. (ICE LIBOR USD 3 Month + 0.40%), 3.20%, 4/1/2021 (a) (b) | | | 39,762,000 | | | | 39,769,590 | |
| | | | | | | | |
| |
Equity Real Estate Investment Trusts (REITs) — 1.5% | | | | | |
| | |
ERP Operating LP 2.38%, 7/1/2019 | | �� | 7,739,000 | | | | 7,726,791 | |
| | |
HCP, Inc. 2.63%, 2/1/2020 | | | 20,227,000 | | | | 20,174,768 | |
| | | | | | | | |
| INVESTMENTS | | PRINCIPAL
AMOUNT ($) | | | VALUE ($) | |
| | | | | | | | |
|
Equity Real Estate Investment Trusts (REITs) — continued | |
| | |
Scentre Group Trust 1 (Australia) 2.38%, 11/5/2019 (a) | | | 14,402,000 | | | | 14,327,426 | |
| | |
WEA Finance LLC (France) | | | | | | | | |
| | |
2.70%, 9/17/2019 (a) | | | 10,346,000 | | | | 10,335,415 | |
| | |
3.25%, 10/5/2020 (a) | | | 27,920,000 | | | | 27,963,559 | |
| | |
Welltower, Inc. 4.13%, 4/1/2019 | | | 5,273,000 | | | | 5,274,887 | |
| | | | | | | | |
| | |
| | | | | | | 85,802,846 | |
| | | | | | | | |
| | |
Food & Staples Retailing — 0.9% | | | | | | | | |
| | |
Alimentation Couche-Tard, Inc. (Canada) | | | | | | | | |
| | |
2.35%, 12/13/2019 (a) | | | 23,192,000 | | | | 23,069,141 | |
| | |
(ICE LIBOR USD 3 Month + 0.50%), 3.28%, 12/13/2019 (a) (b) | | | 4,800,000 | | | | 4,799,084 | |
| | |
Kroger Co. (The) | | | | | | | | |
| | |
1.50%, 9/30/2019 | | | 9,361,000 | | | | 9,289,180 | |
| | |
6.15%, 1/15/2020 | | | 7,740,000 | | | | 7,947,931 | |
| | |
Walmart, Inc. (ICE LIBOR USD 3 Month + 0.04%), 2.86%, 6/23/2020 (b) | | | 3,899,000 | | | | 3,894,401 | |
| | | | | | | | |
| | |
| | | | | | | 48,999,737 | |
| | | | | | | | |
| | |
Food Products — 0.6% | | | | | | | | |
| | |
Conagra Brands, Inc. (ICE LIBOR USD 3 Month + 0.75%), 3.51%, 10/22/2020 (b) | | | 13,830,000 | | | | 13,768,702 | |
| | |
Mondelez International Holdings Netherlands BV | | | | | | | | |
| | |
1.63%, 10/28/2019 (a) | | | 4,052,000 | | | | 4,016,699 | |
| | |
(ICE LIBOR USD 3 Month + 0.61%), 3.37%, 10/28/2019 (a) (b) | | | 6,000,000 | | | | 6,013,898 | |
| | |
Tyson Foods, Inc. | | | | | | | | |
| | |
(ICE LIBOR USD 3 Month + 0.45%), 3.08%, 5/30/2019 (b) | | | 4,770,000 | | | | 4,769,917 | |
| | |
2.65%, 8/15/2019 | | | 2,000,000 | | | | 1,996,713 | |
| | |
(ICE LIBOR USD 3 Month + 0.55%), 3.29%, 6/2/2020 (b) | | | 1,372,000 | | | | 1,369,491 | |
| | | | | | | | |
| | |
| | | | | | | 31,935,420 | |
| | | | | | | | |
| | |
Gas Utilities — 0.0%(c) | | | | | | | | |
| | |
Atmos Energy Corp. 8.50%, 3/15/2019 | | | 440,000 | | | | 440,797 | |
| | | | | | | | |
|
Health Care Equipment & Supplies — 0.0%(c) | |
| | |
Zimmer Biomet Holdings, Inc. (ICE LIBOR USD 3 Month + 0.75%), 3.55%, 3/19/2021 (b) | | | 1,050,000 | | | | 1,045,332 | |
| | | | | | | | |
|
Health Care Providers & Services — 0.5% | |
| | |
Cardinal Health, Inc. 1.95%, 6/14/2019 | | | 8,462,000 | | | | 8,441,094 | |
SEE NOTES TO FINANCIAL STATEMENTS.
| | | | | | | | |
| | | |
| FEBRUARY 28, 2019 | | J.P. MORGAN EXCHANGE-TRADED FUNDS | | | | | 111 | |
JPMorgan Ultra-Short Income ETF
SCHEDULE OF PORTFOLIO INVESTMENTS
AS OF FEBRUARY 28, 2019 (continued)
| | | | | | | | |
| INVESTMENTS | | PRINCIPAL
AMOUNT ($) | | | VALUE ($) | |
Corporate Bonds — continued | |
|
Health Care Providers & Services — continued | |
| | |
CVS Health Corp. | | | | | | | | |
| | |
3.13%, 3/9/2020 | | | 4,650,000 | | | | 4,657,563 | |
| | |
(ICE LIBOR USD 3 Month + 0.63%), 3.40%, 3/9/2020 (b) | | | 12,450,000 | | | | 12,474,931 | |
| | |
Express Scripts Holding Co. | | | | | | | | |
| | |
2.25%, 6/15/2019 | | | 1,143,000 | | | | 1,140,670 | |
| | |
(ICE LIBOR USD 3 Month + 0.75%), 3.38%, 11/30/2020 (b) | | | 2,500,000 | | | | 2,500,007 | |
| | | | | | | | |
| | |
| | | | | | | 29,214,265 | |
| | | | | | | | |
|
Independent Power and Renewable Electricity Producers — 0.5% | |
| | |
Exelon Generation Co. LLC | | | | | | | | |
| | |
5.20%, 10/1/2019 | | | 11,471,000 | | | | 11,601,043 | |
| | |
2.95%, 1/15/2020 | | | 14,634,000 | | | | 14,620,818 | |
| | | | | | | | |
| | |
| | | | | | | 26,221,861 | |
| | | | | | | | |
| | |
Industrial Conglomerates — 0.3% | | | | | | | | |
| | |
Hutchison Whampoa International Ltd. (Hong Kong) | | | | | | | | |
| | |
7.63%, 4/9/2019 (a) | | | 14,015,000 | | | | 14,077,922 | |
| | |
5.75%, 9/11/2019 (a) | | | 1,826,000 | | | | 1,852,048 | |
| | | | | | | | |
| | |
| | | | | | | 15,929,970 | |
| | | | | | | | |
| | |
Insurance — 4.3% | | | | | | | | |
| | |
AIA Group Ltd. (Hong Kong) | | | | | | | | |
| | |
2.25%, 3/11/2019 (a) | | | 10,464,000 | | | | 10,462,267 | |
| | |
(ICE LIBOR USD 3 Month + 0.52%), 3.31%, 9/20/2021 (a) (b) | | | 10,683,000 | | | | 10,655,576 | |
| | |
Allstate Corp. (The) 7.45%, 5/16/2019 | | | 859,000 | | | | 866,671 | |
| | |
Athene Global Funding | | | | | | | | |
| | |
2.75%, 4/20/2020 (a) | | | 11,483,000 | | | | 11,417,596 | |
| | |
(ICE LIBOR USD 3 Month + 1.14%), 3.90%, 4/20/2020 (a) (b) | | | 6,795,000 | | | | 6,838,518 | |
| | |
(ICE LIBOR USD 3 Month + 1.23%), 4.04%, 7/1/2022 (a) (b) | | | 26,740,000 | | | | 26,894,588 | |
| | |
Jackson National Life Global Funding | | | | | | | | |
| | |
2.30%, 4/16/2019 (a) | | | 2,050,000 | | | | 2,049,438 | |
| | |
(ICE LIBOR USD 3 Month + 0.30%), 3.06%, 4/27/2020 (a) (b) | | | 7,309,000 | | | | 7,306,515 | |
| | |
(ICE LIBOR USD 3 Month + 0.30%), 3.09%, 10/15/2020 (a) (b) | | | 17,022,000 | | | | 16,985,153 | |
| | |
(ICE LIBOR USD 3 Month + 0.48%), 3.25%, 6/11/2021 (a) (b) | | | 3,446,000 | | | | 3,437,080 | |
| | |
(ICE LIBOR USD 3 Month + 0.73%), 3.55%, 6/27/2022 (a) (b) | | | 2,000,000 | | | | 2,003,191 | |
| | |
MassMutual Global Funding II 1.55%, 10/11/2019 (a) | | | 6,914,000 | | | | 6,866,338 | |
| | | | | | | | |
| INVESTMENTS | | PRINCIPAL
AMOUNT ($) | | | VALUE ($) | |
| | | | | | | | |
| | |
Insurance — continued | | | | | | | | |
| | |
Metropolitan Life Global Funding I | | | | | | | | |
| | |
2.00%, 4/14/2020 (a) | | | 1,125,000 | | | | 1,113,807 | |
| | |
(ICE LIBOR USD 3 Month + 0.40%), 3.18%, 6/12/2020 (a) (b) | | | 2,631,000 | | | | 2,636,985 | |
| | |
(SOFR + 0.57%), 2.94%, 9/7/2020 (a) (b) | | | 12,000,000 | | | | 11,994,599 | |
| | |
(ICE LIBOR USD 3 Month + 0.23%), 3.03%, 1/8/2021 (a) (b) | | | 12,450,000 | | | | 12,428,611 | |
| | |
New York Life Global Funding | | | | | | | | |
| | |
2.15%, 6/18/2019 (a) | | | 1,075,000 | | | | 1,073,389 | |
| | |
1.50%, 10/24/2019 (a) | | | 4,625,000 | | | | 4,588,988 | |
| | |
(ICE LIBOR USD 3 Month + 0.32%), 3.05%, 8/6/2021 (a) (b) | | | 2,017,000 | | | | 2,017,496 | |
| | |
Pricoa Global Funding I | | | | | | | | |
| | |
2.20%, 5/16/2019 (a) | | | 664,000 | | | | 663,356 | |
| | |
1.45%, 9/13/2019 (a) | | | 1,242,000 | | | | 1,232,786 | |
| | |
Principal Life Global Funding II | | | | | | | | |
| | |
2.38%, 9/11/2019 (a) | | | 1,624,000 | | | | 1,620,625 | |
| | |
2.15%, 1/10/2020 (a) | | | 15,320,000 | | | | 15,228,385 | |
| | |
Protective Life Global Funding | | | | | | | | |
| | |
1.72%, 4/15/2019 (a) | | | 8,498,000 | | | | 8,490,267 | |
| | |
1.56%, 9/13/2019 (a) | | | 10,119,000 | | | | 10,051,055 | |
| | |
2.26%, 4/8/2020 (a) | | | 15,779,000 | | | | 15,672,626 | |
| | |
(ICE LIBOR USD 3 Month + 0.37%), 3.17%, 7/13/2020 (a) (b) | | | 10,380,000 | | | | 10,381,278 | |
| | |
2.70%, 11/25/2020 (a) | | | 7,952,000 | | | | 7,888,092 | |
| | |
Reliance Standard Life Global Funding II | | | | | | | | |
| | |
2.50%, 4/24/2019 (a) | | | 17,906,000 | | | | 17,897,599 | |
| | |
2.50%, 1/15/2020 (a) | | | 9,888,000 | | | | 9,837,896 | |
| | |
Suncorp-Metway Ltd. (Australia) 2.10%, 5/3/2019 (a) | | | 890,000 | | | | 889,156 | |
| | |
WR Berkley Corp. 6.15%, 8/15/2019 | | | 4,925,000 | | | | 4,994,156 | |
| | | | | | | | |
| | |
| | | | | | | 246,484,083 | |
| | | | | | | | |
| | |
Interactive Media & Services — 0.4% | | | | | | | | |
| | |
Tencent Holdings Ltd. (China) | | | | | | | | |
| | |
3.38%, 5/2/2019 (a) | | | 22,847,000 | | | | 22,858,138 | |
| | |
2.88%, 2/11/2020 (a) | | | 1,659,000 | | | | 1,655,534 | |
| | | | | | | | |
| | |
| | | | | | | 24,513,672 | |
| | | | | | | | |
| | |
IT Services — 0.1% | | | | | | | | |
| | |
Western Union Co. (The) | | | | | | | | |
| | |
3.35%, 5/22/2019 | | | 7,913,000 | | | | 7,917,203 | |
| | |
(ICE LIBOR USD 3 Month + 0.80%), 3.46%, 5/22/2019 (b) | | | 810,000 | | | | 810,418 | |
| | | | | | | | |
| | |
| | | | | | | 8,727,621 | |
| | | | | | | | |
SEE NOTES TO FINANCIAL STATEMENTS.
| | | | | | |
| | | |
| 112 | | | | J.P. MORGAN EXCHANGE-TRADED FUNDS | | FEBRUARY 28, 2019 |
| | | | | | | | |
| INVESTMENTS | | PRINCIPAL
AMOUNT ($) | | | VALUE ($) | |
Corporate Bonds — continued | |
| | |
Machinery — 0.6% | | | | | | | | |
| | |
Caterpillar Financial Services Corp. (ICE LIBOR USD 3 Month + 0.23%), 3.02%, 3/15/2021 (b) | | | 30,000,000 | | | | 29,947,596 | |
| | |
Illinois Tool Works, Inc. 6.25%, 4/1/2019 | | | 2,024,000 | | | | 2,029,270 | |
| | | | | | | | |
| | |
| | | | | | | 31,976,866 | |
| | | | | | | | |
| | |
Media — 0.4% | | | | | | | | |
| | |
Comcast Corp. (ICE LIBOR USD 3 Month + 0.33%), 3.13%, 10/1/2020 (b) | | | 12,934,000 | | | | 12,952,947 | |
| | |
Omnicom Group, Inc. 6.25%, 7/15/2019 | | | 12,078,000 | | | | 12,227,865 | |
| | | | | | | | |
| | |
| | | | | | | 25,180,812 | |
| | | | | | | | |
| | |
Multiline Retail — 0.2% | | | | | | | | |
| | |
Dollar Tree, Inc. (ICE LIBOR USD 3 Month + 0.70%), 3.47%, 4/17/2020 (b) | | | 14,311,000 | | | | 14,316,882 | |
| | | | | | | | |
| | |
Multi-Utilities — 0.7% | | | | | | | | |
| | |
Consolidated Edison Co. of New York, Inc. | | | | | | | | |
| | |
6.65%, 4/1/2019 | | | 1,655,000 | | | | 1,659,981 | |
| | |
Series C, (ICE LIBOR USD 3 Month + 0.40%), 3.22%, 6/25/2021 (b) | | | 2,131,000 | | | | 2,125,673 | |
| | |
Dominion Energy, Inc. Series B, 1.60%, 8/15/2019 | | | 7,881,000 | | | | 7,834,476 | |
| | |
DTE Energy Co. | | | | | | | | |
| | |
1.50%, 10/1/2019 | | | 11,937,000 | | | | 11,833,935 | |
| | |
2.40%, 12/1/2019 | | | 3,111,000 | | | | 3,088,134 | |
| | |
TECO Finance, Inc. 5.15%, 3/15/2020 | | | 14,655,000 | | | | 14,952,410 | |
| | | | | | | | |
| | |
| | | | | | | 41,494,609 | |
| | | | | | | | |
| | |
Oil, Gas & Consumable Fuels — 1.1% | | | | | | | | |
| | |
BP Capital Markets America, Inc. 4.50%, 10/1/2020 | | | 3,683,000 | | | | 3,774,489 | |
| | |
Chevron Corp. 4.95%, 3/3/2019 | | | 3,456,000 | | | | 3,456,000 | |
| | |
Enable Midstream Partners LP 2.40%, 5/15/2019 (d) | | | 1,500,000 | | | | 1,497,926 | |
| | |
Enbridge, Inc. (Canada) (ICE LIBOR USD 3 Month + 0.40%), 3.18%, 1/10/2020 (b) | | | 7,500,000 | | | | 7,487,667 | |
| | |
Enterprise Products Operating LLC | | | | | | | | |
| | |
2.55%, 10/15/2019 | | | 1,038,000 | | | | 1,036,217 | |
| | |
5.25%, 1/31/2020 | | | 5,438,000 | | | | 5,545,593 | |
| | |
EOG Resources, Inc. | | | | | | | | |
| | |
5.63%, 6/1/2019 | | | 22,531,000 | | | | 22,666,509 | |
| | |
2.45%, 4/1/2020 | | | 7,091,000 | | | | 7,049,206 | |
| | |
ONEOK Partners LP 8.63%, 3/1/2019 | | | 4,139,000 | | | | 4,139,000 | |
| | | | | | | | |
| INVESTMENTS | | PRINCIPAL
AMOUNT ($) | | | VALUE ($) | |
| | | | | | | | |
|
Oil, Gas & Consumable Fuels — continued | |
| | |
Phillips 66 | | | | | | | | |
| | |
(ICE LIBOR USD 3 Month + 0.75%), 3.54%, 4/15/2020 (a) (b) | | | 410,000 | | | | 410,200 | |
| | |
(ICE LIBOR USD 3 Month + 0.60%), 3.25%, 2/26/2021 (b) | | | 1,000,000 | | | | 998,926 | |
| | |
Spectra Energy Partners LP (ICE LIBOR USD 3 Month + 0.70%), 3.45%, 6/5/2020 (b) | | | 3,942,000 | | | | 3,919,722 | |
| | |
Total Capital International SA (France) (ICE LIBOR USD 3 Month + 0.35%), 3.15%, 6/19/2019 (b) | | | 441,000 | | | | 441,368 | |
| | |
TransCanada PipeLines Ltd. (Canada) 2.13%, 11/15/2019 | | | 1,513,000 | | | | 1,505,692 | |
| | | | | | | | |
| | |
| | | | | | | 63,928,515 | |
| | | | | | | | |
| | |
Pharmaceuticals — 1.0% | | | | | | | | |
| | |
EMD Finance LLC (Germany) 2.40%, 3/19/2020 (a) | | | 4,240,000 | | | | 4,212,763 | |
| | |
GlaxoSmithKline Capital plc (United Kingdom) (ICE LIBOR USD 3 Month + 0.35%), 3.04%, 5/14/2021 (b) | | | 3,393,000 | | | | 3,391,326 | |
| | |
Shire Acquisitions Investments Ireland DAC 1.90%, 9/23/2019 | | | 25,000,000 | | | | 24,825,139 | |
| | |
Zoetis, Inc. (ICE LIBOR USD 3 Month + 0.44%), 3.08%, 8/20/2021 (b) | | | 22,847,000 | | | | 22,617,436 | |
| | | | | | | | |
| | |
| | | | | | | 55,046,664 | |
| | | | | | | | |
| | |
Road & Rail — 0.7% | | | | | | | | |
| | |
Burlington Northern Santa Fe LLC 4.70%, 10/1/2019 | | | 2,905,000 | | | | 2,936,259 | |
| | |
Cie de Chemin de Fer Canadien Pacifique (Canada) 7.25%, 5/15/2019 | | | 2,239,000 | | | | 2,258,208 | |
| | |
ERAC USA Finance LLC 2.35%, 10/15/2019 (a) | | | 7,681,000 | | | | 7,646,136 | |
| | |
Ryder System, Inc. | | | | | | | | |
| | |
2.55%, 6/1/2019 | | | 9,925,000 | | | | 9,906,937 | |
| | |
2.45%, 9/3/2019 | | | 3,407,000 | | | | 3,398,229 | |
| | |
2.88%, 9/1/2020 | | | 12,615,000 | | | | 12,577,080 | |
| | | | | | | | |
| | |
| | | | | | | 38,722,849 | |
| | | | | | | | |
|
Technology Hardware, Storage & Peripherals — 0.0%(c) | |
| | |
Apple, Inc. (ICE LIBOR USD 3 Month + 0.20%), 2.94%, 2/7/2020 (b) | | | 400,000 | | | | 400,834 | |
| | | | | | | | |
| | |
Thrifts & Mortgage Finance — 1.8% | | | | | | | | |
| | |
BPCE SA (France) | | | | | | | | |
| | |
3.15%, 7/31/2020 (a) | | | 65,000,000 | | | | 65,007,712 | |
| | |
(ICE LIBOR USD 3 Month + 1.22%), 3.88%, 5/22/2022 (a) (b) | | | 27,483,000 | | | | 27,542,144 | |
SEE NOTES TO FINANCIAL STATEMENTS.
| | | | | | | | |
| | | |
| FEBRUARY 28, 2019 | | J.P. MORGAN EXCHANGE-TRADED FUNDS | | | | | 113 | |
JPMorgan Ultra-Short Income ETF
SCHEDULE OF PORTFOLIO INVESTMENTS
AS OF FEBRUARY 28, 2019 (continued)
| | | | | | | | |
| INVESTMENTS | | PRINCIPAL
AMOUNT ($) | | | VALUE ($) | |
Corporate Bonds — continued | |
| |
Thrifts & Mortgage Finance — continued | | | | | |
| | |
Nationwide Building Society (United Kingdom) 2.35%, 1/21/2020 (a) | | | 9,799,000 | | | | 9,742,627 | |
| | | | | | | | |
| | |
| | | | | | | 102,292,483 | |
| | | | | | | | |
| | |
Tobacco — 0.6% | | | | | | | | |
| | |
Altria Group, Inc. | | | | | | | | |
| | |
9.25%, 8/6/2019 | | | 2,406,000 | | | | 2,466,896 | |
| | |
4.75%, 5/5/2021 | | | 5,514,000 | | | | 5,701,124 | |
| | |
BAT Capital Corp. (United Kingdom) (ICE LIBOR USD 3 Month + 0.59%), 3.28%, 8/14/2020 (b) | | | 1,800,000 | | | | 1,794,293 | |
| | |
Philip Morris International, Inc. 2.00%, 2/21/2020 | | | 9,140,000 | | | | 9,067,216 | |
| | |
Reynolds American, Inc. (United Kingdom) 8.13%, 6/23/2019 | | | 12,777,000 | | | | 12,972,624 | |
| | | | | | | | |
| | |
| | | | | | | 32,002,153 | |
| | | | | | | | |
| |
Trading Companies & Distributors — 0.6% | | | | | |
| | |
Air Lease Corp. 4.75%, 3/1/2020 | | | 2,593,000 | | | | 2,629,507 | |
| | |
Aviation Capital Group LLC | | | | | | | | |
| | |
(ICE LIBOR USD 3 Month + 0.95%), 3.69%, 6/1/2021 (a) (b) | | | 15,000,000 | | | | 14,984,210 | |
| | |
(ICE LIBOR USD 3 Month + 0.67%), 3.42%, 7/30/2021 (a) (b) | | | 6,254,000 | | | | 6,207,881 | |
| | |
BOC Aviation Ltd. (Singapore) (ICE LIBOR USD 3 Month + 1.05%), 3.79%, 5/2/2021 (a) (b) | | | 4,090,000 | | | | 4,108,257 | |
| | |
International Lease Finance Corp. 5.88%, 4/1/2019 | | | 5,607,000 | | | | 5,615,758 | |
| | | | | | | | |
| | |
| | | | | | | 33,545,613 | |
| | | | | | | | |
| | |
Transportation Infrastructure — 0.2% | | | | | | | | |
| | |
Central Nippon Expressway Co. Ltd. (Japan) 2.17%, 8/5/2019 (e) | | | 2,595,000 | | | | 2,585,892 | |
| | |
HPHT Finance 15 Ltd. (Hong Kong) 2.88%, 3/17/2020 (a) | | | 8,593,000 | | | | 8,550,681 | |
| | | | | | | | |
| | |
| | | | | | | 11,136,573 | |
| | | | | | | | |
| |
Wireless Telecommunication Services — 0.7% | | | | | |
| | |
America Movil SAB de CV (Mexico) | | | | | | | | |
| | |
5.00%, 10/16/2019 | | | 13,389,000 | | | | 13,489,418 | |
| | |
5.00%, 3/30/2020 | | | 24,214,000 | | | | 24,607,477 | |
| | | | | | | | |
| | |
| | | | | | | 38,096,895 | |
| | | | | | | | |
| | |
Total Corporate Bonds
(Cost $4,029,786,131) | | | | | | | 4,031,900,751 | |
| | | | | | | | |
Asset-Backed Securities — 10.8% | |
| | |
Allegro CLO II-S Ltd. (Cayman Islands) Series 2014-1RA, Class X, 3.41%, 10/21/2028 (a) (f) | | | 875,000 | | | | 875,000 | |
| | | | | | | | |
| INVESTMENTS | | PRINCIPAL
AMOUNT ($) | | | VALUE ($) | |
| | | | | | | | |
| | |
Ally Auto Receivables Trust Series 2018-3, Class A2, 2.72%, 5/17/2021 | | | 4,016,220 | | | | 4,016,962 | |
| | |
ALM VI Ltd. (Cayman Islands) Series 2012-6A, Class X, 3.39%, 7/15/2026 ‡ (a) (f) | | | 940,000 | | | | 940,000 | |
| | |
American Express Credit Account Master Trust Series 2017-3, Class A, 1.77%, 11/15/2022 | | | 25,000,000 | | | | 24,729,082 | |
| | |
AmeriCredit Automobile Receivables Trust | | | | | | | | |
| | |
Series 2017-2, Class A2A, 1.65%, 9/18/2020 | | | 4,386 | | | | 4,384 | |
| | |
Series 2016-3, Class A3, 1.46%, 5/10/2021 | | | 107,911 | | | | 107,664 | |
| | |
Series 2017-4, Class A2A, 1.83%, 5/18/2021 | | | 106,481 | | | | 106,358 | |
| | |
Series 2016-4, Class A3, 1.53%, 7/8/2021 | | | 320,196 | | | | 319,168 | |
| | |
Series 2018-1, Class A2A, 2.71%, 7/19/2021 | | | 726,347 | | | | 726,279 | |
| | |
Series 2018-2, Class A2A, 2.86%, 11/18/2021 | | | 8,377,786 | | | | 8,372,475 | |
| | |
Series 2017-2, Class A3, 1.98%, 12/20/2021 | | | 3,802,000 | | | | 3,787,212 | |
| | |
Series 2018-3, Class A2A, 3.11%, 1/18/2022 | | | 9,196,000 | | | | 9,211,327 | |
| | |
Anchorage Capital CLO Ltd. (Cayman Islands) Series 2013-1A, Class X, 3.45%, 10/13/2030 ‡ (a) (f) | | | 556,283 | | | | 556,004 | |
| | |
Apidos CLO (Cayman Islands) Series 2015-21A, Class A1R, 3.71%, 7/18/2027 (a) (f) | | | 7,345,000 | | | | 7,280,305 | |
| | |
ARES XLVI CLO Ltd. Series 2017-46A, Class X, 3.39%, 1/15/2030 ‡ (a) (f) | | | 156,250 | | | | 156,242 | |
| | |
Ares XXVII CLO Ltd. (Cayman Islands) Series 2013-2A, Class XR, 3.66%, 7/28/2029 ‡ (a) (f) | | | 181,250 | | | | 181,241 | |
| | |
Ares XXXVR CLO Ltd.Series 2015-35RA, Class X, 3.44%, 7/15/2030 (a) (f) | | | 1,050,000 | | | | 1,049,947 | |
| | |
Atrium XV (Cayman Islands) Series 15A, Class X, 3.45%, 1/23/2031 (a) (f) | | | 2,230,000 | | | | 2,230,000 | |
| | |
Avery Point III CLO Ltd. (Cayman Islands) Series 2013-3A, Class AR, 3.90%, 1/18/2025 (a) (f) | | | 745,694 | | | | 745,304 | |
| | |
Avery Point VI CLO Ltd. (Cayman Islands) Series 2015-6A, Class AR, 3.78%, 8/5/2027 (a) (f) | | | 11,906,000 | | | | 11,858,697 | |
| | |
Battalion CLO VII Ltd. (Cayman Islands) Series 2014-7A, Class XRR, 3.67%, 7/17/2028 ‡ (a) (f) | | | 4,500,000 | | | | 4,499,775 | |
SEE NOTES TO FINANCIAL STATEMENTS.
| | | | | | |
| | | |
| 114 | | | | J.P. MORGAN EXCHANGE-TRADED FUNDS | | FEBRUARY 28, 2019 |
| | | | | | | | |
| INVESTMENTS | | PRINCIPAL
AMOUNT ($) | | | VALUE ($) | |
Asset-Backed Securities — continued | |
| | |
Battalion CLO XI Ltd. (Cayman Islands) Series 2017-11A, Class X, 3.58%, 10/24/2029 (a) (f) | | | 1,425,000 | | | | 1,424,287 | |
| | |
Benefit Street Partners CLO II Ltd. (Cayman Islands) Series 2013-IIA, Class X, 4.49%, 7/15/2029 ‡ (a) (f) | | | 171,875 | | | | 171,789 | |
| | |
Benefit Street Partners CLO XI (Cayman Islands) Series 2017-11A, Class X, 3.79%, 4/15/2029 (a) (f) | | | 290,625 | | | | 290,610 | |
| | |
BlueMountain CLO Ltd. (Cayman Islands) | | | | | | | | |
| | |
Series 2012-2A, Class AR2, 3.69%, 11/20/2028 (a) (f) | | | 17,750,000 | | | | 17,657,718 | |
| | |
Series 2014-2A, Class X, 3.36%, 10/20/2030 (a) (f) | | | 3,000,000 | | | | 3,000,000 | |
| | |
Series 2016-3A, Class X, 3.30%, 11/15/2030 (a) (f) | | | 2,700,000 | | | | 2,699,865 | |
| | |
BMW Vehicle Lease TrustSeries 2017-1, Class A3, 1.98%, 5/20/2020 | | | 3,116,823 | | | | 3,111,984 | |
| | |
Capital Auto Receivables Asset Trust | | | | | | | | |
| | |
Series 2015-2, Class C, 2.67%, 8/20/2020 | | | 321,399 | | | | 321,205 | |
| | |
Series 2018-2, Class A2, 3.02%, 2/22/2021 (a) | | | 8,933,000 | | | | 8,943,095 | |
| | |
CarMax Auto Owner Trust | | | | | | | | |
| | |
Series 2017-3, Class A2A, 1.64%, 9/15/2020 | | | 43,438 | | | | 43,372 | |
| | |
Series 2018-3, Class A2A, 2.88%, 10/15/2021 | | | 6,335,000 | | | | 6,340,591 | |
| | |
CBAM Ltd. (Cayman Islands) Series 2017-3A, Class X, 3.47%, 10/17/2029 (a) (f) | | | 3,000,000 | | | | 3,000,000 | |
| | |
CIFC Funding Ltd. (Cayman Islands) | | | | | | | | |
| | |
Series 2015-4A, Class A1R, 3.91%, 10/20/2027 (a) (f) | | | 440,000 | | | | 439,560 | |
| | |
Series 2016-1A, Class A, 4.24%, 10/21/2028 (a) (f) | | | 8,490,000 | | | | 8,485,517 | |
| | |
Series 2013-1A, Class X, 3.63%, 7/16/2030 (a) (f) | | | 594,208 | | | | 594,179 | |
| | |
Series 2014-1A, Class X, 3.38%, 1/18/2031 (a) (f) | | | 857,143 | | | | 857,143 | |
| | |
Series 2013-3RA, Class X, 3.43%, 4/24/2031 (a) (f) | | | 3,000,000 | | | | 2,998,500 | |
| | |
Citibank Credit Card Issuance Trust | | | | | | | | |
| | |
Series 2014-A6, Class A6, 2.15%, 7/15/2021 | | | 15,000,000 | | | | 14,974,473 | |
| | |
Series 2016-A1, Class A1, 1.75%, 11/19/2021 | | | 24,426,000 | | | | 24,262,199 | |
| | | | | | | | |
| INVESTMENTS | | PRINCIPAL
AMOUNT ($) | | | VALUE ($) | |
| | | | | | | | |
| | |
Clear Creek CLO (Cayman Islands) Series 2015-1A, Class X, 3.76%, 10/20/2030 ‡ (a) (f) | | | 189,063 | | | | 188,968 | |
| | |
Cole Park CLO Ltd. (Cayman Islands) Series 2015-1A, Class AR, 3.81%, 10/20/2028 (a) (f) | | | 11,000,000 | | | | 10,943,493 | |
| | |
Colombia Cent CLO Ltd. (Cayman Islands) Series 2018-27A, Class X, 3.19%, 10/25/2028 (a) (f) | | | 2,150,000 | | | | 2,150,000 | |
| | |
Denali Capital CLO XII Ltd. (Cayman Islands) Series 2016-1A, Class X, 3.34%, 4/15/2031 ‡ (a) (f) | | | 337,500 | | | | 337,331 | |
| | |
Discover Card Execution Note Trust Series 2016-A4, Class A4, 1.39%, 3/15/2022 | | | 7,153,000 | | | | 7,104,279 | |
| | |
Drive Auto Receivables Trust | | | | | | | | |
| | |
Series 2018-2, Class A2, 2.64%, 9/15/2020 | | | 65,156 | | | | 65,159 | |
| | |
Series 2017-3, Class B, 2.30%, 5/17/2021 | | | 31,621 | | | | 31,613 | |
| | |
Series 2018-2, Class A3, 2.88%, 6/15/2021 | | | 540,000 | | | | 540,103 | |
| | |
Series 2018-5, Class A2A, 3.21%, 7/15/2021 | | | 13,994,000 | | | | 14,007,840 | |
| | |
Series 2018-3, Class A3, 3.01%, 11/15/2021 | | | 3,333,000 | | | | 3,336,657 | |
| | |
Dryden 30 Senior Loan Fund (Cayman Islands) Series 2013-30A, Class X, 3.28%, 11/15/2028 ‡ (a) (f) | | | 150,000 | | | | 149,992 | |
| | |
Dryden 50 Senior Loan Fund (Cayman Islands) Series 2017-50A, Class X, 3.59%, 7/15/2030 ‡ (a) (f) | | | 180,000 | | | | 179,910 | |
| | |
Dryden 61 CLO Ltd. (Cayman Islands) Series 2018-61A, Class X, 3.14%, 1/17/2032 (a) (f) | | | 4,500,000 | | | | 4,499,775 | |
| | |
Ford Credit Auto Owner Trust | | | | | | | | |
| | |
Series 2014-1, Class A, 2.26%, 11/15/2025 (a) | | | 26,349,000 | | | | 26,324,827 | |
| | |
Series 2015-1, Class A, 2.12%, 7/15/2026 (a) | | | 5,224,000 | | | | 5,187,390 | |
| | |
Galaxy XVIII CLO Ltd. (Cayman Islands) Series 2018-28A, Class X, 3.44%, 7/15/2031 (a) (f) | | | 4,785,000 | | | | 4,784,761 | |
| | |
Galaxy XXI CLO Ltd. (Cayman Islands) Series 2015-21A, Class X, 3.26%, 4/20/2031 ‡ (a) (f) | | | 500,000 | | | | 499,975 | |
| | |
GE Capital Credit Card Master Note Trust Series 2012-7, Class A, 1.76%, 9/15/2022 | | | 20,921,000 | | | | 20,810,539 | |
| | |
GT Loan Financing I Ltd. (Cayman Islands) Series 2013-1A, Class XR, 3.41%, 7/28/2031 (a) (f) | | | 1,500,000 | | | | 1,500,000 | |
SEE NOTES TO FINANCIAL STATEMENTS.
| | | | | | | | |
| | | |
| FEBRUARY 28, 2019 | | J.P. MORGAN EXCHANGE-TRADED FUNDS | | | | | 115 | |
JPMorgan Ultra-Short Income ETF
SCHEDULE OF PORTFOLIO INVESTMENTS
AS OF FEBRUARY 28, 2019 (continued)
| | | | | | | | |
| INVESTMENTS | | PRINCIPAL
AMOUNT ($) | | | VALUE ($) | |
Asset-Backed Securities — continued | |
| | |
Honda Auto Receivables Owner Trust Series 2018-3, Class A2, 2.67%, 12/22/2020 | | | 9,355,508 | | | | 9,358,087 | |
| | |
ICG US CLO Ltd. (Cayman Islands) | | | | | | | | |
| | |
Series 2017-2A, Class X, 3.57%, 10/23/2029 (a) (f) | | | 557,143 | | | | 557,115 | |
| | |
Series 2014-1A, Class X, 3.41%, 1/20/2030 (a) (f) | | | 550,000 | | | | 549,725 | |
| | |
KKR CLO Ltd. (Cayman Islands) | | | | | | | | |
| | |
Series 13, Class A1R, 3.58%, 1/16/2028 (a) (f) | | | 2,000,000 | | | | 1,979,716 | |
| | |
Series 11, Class X, 3.39%, 1/15/2031 ‡ (a) (f) | | | 731,250 | | | | 730,884 | |
| | |
KREF Ltd. Series 2018-FL1, Class A, 3.59%, 6/15/2036 (a) (f) | | | 5,000,000 | | | | 4,993,750 | |
| | |
KVK CLO Ltd. (Cayman Islands)Series 2013-1A, Class X, 3.45%, 1/14/2028 ‡ (a) (f) | | | 1,653,000 | | | | 1,653,000 | |
| | |
LCM XVI LP (Cayman Islands) Series 16A, Class XR, 3.49%, 10/15/2031 (a) (f) | | | 7,450,000 | | | | 7,450,000 | |
| | |
LCM XVII LP (Cayman Islands) Series 17A, Class XR, 3.39%, 10/15/2031 (a) (f) | | | 1,350,000 | | | | 1,347,300 | |
| | |
LCM XX LP (Cayman Islands) Series 20A, Class AR, 3.80%, 10/20/2027 (a) (f) | | | 8,700,000 | | | | 8,640,797 | |
| | |
Magnetite IX Ltd. (Cayman Islands)Series 2014-9A, Class A1R, 3.77%, 7/25/2026 (a) (f) | | | 12,295,420 | | | | 12,287,194 | |
| | |
Magnetite XI Ltd. (Cayman Islands) Series 2014-11A, Class A1R, 3.90%, 1/18/2027 (a) (f) | | | 8,650,000 | | | | 8,652,673 | |
| | |
Magnetite XXI Ltd. (Cayman Islands) Series 2019-21A, Class X, 4/20/2030 (a) (f) (g) | | | 5,000,000 | | | | 5,000,000 | |
| | |
Mercedes-Benz Auto Lease Trust Series 2019-A, Class A2, 3.01%, 2/16/2021 | | | 12,341,000 | | | | 12,368,693 | |
| | |
MP CLO IV Ltd. (Cayman Islands) Series 2013-2A, Class X, 3.72%, 7/25/2029 (a) (f) | | | 950,000 | | | | 949,525 | |
| | |
Neuberger Berman CLO XIX Ltd. (Cayman Islands) Series 2015-19A, Class A1R2, 3.59%, 7/15/2027 (a) (f) | | | 2,780,000 | | | | 2,760,407 | |
| | |
Neuberger Berman CLO XVI-S Ltd. (Cayman Islands) Series 2017-16SA, Class X, 3.39%, 1/15/2028 (a) (f) | | | 75,000 | | | | 74,996 | |
| | |
Nissan Auto Receivables Owner Trust Series 2019-A, Class A2A, 2.82%, 1/18/2022 | | | 10,044,000 | | | | 10,048,021 | |
| | | | | | | | |
| INVESTMENTS | | PRINCIPAL
AMOUNT ($) | | | VALUE ($) | |
| | | | | | | | |
| | |
Oak Hill Credit Partners Ltd. (Cayman Islands) Series 2014-10RA, Class X, 3.41%, 12/12/2030 (a) (f) | | | 4,150,000 | | | | 4,150,000 | |
| | |
Oak Hill Credit Partners XII Ltd. Series 2015-12A, Class XR, 3.42%, 7/23/2030 (a) (f) | | | 4,650,000 | | | | 4,650,000 | |
| | |
OCP CLO Ltd. (Cayman Islands) | | | | | | | | |
| | |
Series 2015-8A, Class A1R, 3.62%, 4/17/2027 (a) (f) | | | 39,185,000 | | | | 38,989,977 | |
| | |
Series 2015-9A, Class A1R, 3.59%, 7/15/2027 (a) (f) | | | 3,285,000 | | | | 3,263,759 | |
| | |
Series 2016-12A, Class A1R, 3.90%, 10/18/2028 (a) (f) | | | 10,420,000 | | | | 10,357,459 | |
| | |
Octagon Investment Partners 24 Ltd. (Cayman Islands) Series 2015-1A, Class A1R, 3.54%, 5/21/2027 (a) (f) | | | 21,423,000 | | | | 21,330,410 | |
| | |
Octagon Investment Partners 25 Ltd. (Cayman Islands) Series 2015-1A, Class AR, 3.56%, 10/20/2026 (a) (f) | | | 13,000,000 | | | | 12,922,975 | |
| | |
Octagon Investment Partners 28 Ltd. (Cayman Islands) Series 2016-1A, Class XR, 3.43%, 10/24/2030 (a) (f) | | | 1,430,000 | | | | 1,430,000 | |
| | |
Octagon Investment Partners XVII Ltd. (Cayman Islands) Series 2013-1A, Class X, 3.37%, 1/25/2031 ‡ (a) (f) | | | 879,293 | | | | 879,249 | |
| | |
Octagon Investment Partners XX Ltd. (Cayman Islands) Series 2014-1A, Class AR, 3.83%, 8/12/2026 (a) (f) | | | 5,363,580 | | | | 5,362,056 | |
| | |
OHA Credit Funding 1 Ltd. (Cayman Islands) Series 2018-1A, Class X, 3.29%, 10/20/2030 (a) (f) | | | 2,000,000 | | | | 2,000,000 | |
| | |
OHA Loan Funding Ltd. (Cayman Islands) Series 2013-2A, Class X, 3.25%, 5/23/2031 ‡ (a) (f) | | | 1,150,000 | | | | 1,149,425 | |
| | |
Regatta XIII Funding Ltd. (Cayman Islands) Series 2018-2A, Class X, 3.44%, 7/15/2031 (a) (f) | | | 4,842,857 | | | | 4,842,615 | |
| | |
Regatta XV Funding Ltd. (Cayman Islands) Series 2018-4A, Class X, 3.14%, 10/25/2031 (a) (f) | | | 5,300,000 | | | | 5,300,000 | |
| | |
Santander Drive Auto Receivables Trust Series 2018-4, Class A2, 2.73%, 3/15/2021 | | | 2,355,343 | | | | 2,353,950 | |
| | |
Shackleton CLO Ltd. (Cayman Islands) | | | | | | | | |
| | |
Series 2015-8A, Class A1R, 3.70%, 10/20/2027 (a) (f) | | | 13,016,500 | | | | 12,925,281 | |
| | |
Series 2014-6RA, Class A, 3.79%, 7/17/2028 (a) (f) | | | 16,485,000 | | | | 16,391,876 | |
| | |
Symphony CLO V Ltd. (Cayman Islands) Series 2007-5A, Class A1, 3.54%, 1/15/2024 (a) (f) | | | 16,212 | | | | 16,208 | |
SEE NOTES TO FINANCIAL STATEMENTS.
| | | | | | |
| | | |
| 116 | | | | J.P. MORGAN EXCHANGE-TRADED FUNDS | | FEBRUARY 28, 2019 |
| | | | | | | | |
| INVESTMENTS | | PRINCIPAL
AMOUNT ($) | | | VALUE ($) | |
Asset-Backed Securities — continued | |
| |
Symphony CLO XIV Ltd. (Cayman Islands) | | | | | |
| | |
Series 2014-14A, Class A1R, 4.08%, 7/14/2026 (a) (f) | | | 2,810,523 | | | | 2,814,846 | |
| | |
Series 2014-14A, Class A2R, 4.08%, 7/14/2026 (a) (f) | | | 4,009,680 | | | | 4,009,535 | |
| | |
Symphony CLO XV Ltd. (Cayman Islands) Series 2014-15A, Class XR2, 3.54%, 1/17/2032 (a) (f) | | | 6,000,000 | | | | 6,000,000 | |
| | |
Synchrony Credit Card Master Note Trust Series 2016-3, Class A, 1.58%, 9/15/2022 | | | 10,284,000 | | | | 10,219,114 | |
| | |
THL Credit Wind River CLO Ltd. (Cayman Islands) | | | | | | | | |
| | |
Series 2017-1A, Class A, 4.12%, 4/18/2029 (a) (f) | | | 7,500,000 | | | | 7,506,863 | |
| | |
Series 2014-2A, Class X, 3.44%, 1/15/2031 ‡ (a) (f) | | | 625,000 | | | | 624,687 | |
| | |
Series 2014-1A, Class X, 3.38%, 7/18/2031 ‡ (a) (f) | | | 1,875,000 | | | | 1,874,966 | |
| | |
Toyota Auto Receivables Owner Trust Series 2018-C, Class A2A, 2.77%, 8/16/2021 | | | 8,084,000 | | | | 8,089,084 | |
| | |
Treman Park CLO Ltd. (Cayman Islands) Series 2015-1A, Class ARR, 3.83%, 10/20/2028 (a) (f) | | | 4,527,000 | | | | 4,511,169 | |
| | |
Verizon Owner Trust | | | | | | | | |
| | |
Series 2016-2A, Class A, 1.68%, 5/20/2021 (a) | | | 9,751,938 | | | | 9,716,113 | |
| | |
Series 2017-3A, Class A1B, 2.75%, 4/20/2022 (a) (f) | | | 440,000 | | | | 440,260 | |
| | |
Volvo Financial Equipment LLC Series 2019-1A, Class A2, 2.90%, 11/15/2021 (a) | | | 5,788,000 | | | | 5,796,115 | |
| | |
Voya CLO Ltd. (Cayman Islands) | | | | | | | | |
| | |
Series 2014-3A, Class A1R, 3.49%, 7/25/2026 (a) (f) | | | 2,478,347 | | | | 2,467,175 | |
| | |
Series 2015-2A, Class AR, 3.74%, 7/23/2027 (a) (f) | | | 3,750,000 | | | | 3,724,778 | |
| | |
Series 2019-1A, Class A, 4/15/2029 (a) (f) (g) | | | 11,411,000 | | | | 11,411,000 | |
| | |
Series 2014-4A, Class XR, 3.50%, 7/14/2031 (a) (f) | | | 857,143 | | | | 857,100 | |
| | |
Series 2015-3A, Class X, 3.46%, 10/20/2031 (a) (f) | | | 3,320,000 | | | | 3,319,834 | |
| | |
Westlake Automobile Receivables Trust Series 2019-1A, Class A2A, 3.06%, 5/16/2022 (a) | | | 7,500,000 | | | | 7,507,859 | |
| | | | | | | | |
| | |
Total Asset-Backed Securities
(Cost $612,735,221) | | | | | | | 612,619,746 | |
| | | | | | | | |
| | | | | | | | |
| INVESTMENTS | | PRINCIPAL
AMOUNT ($) | | | VALUE ($) | |
Certificates of Deposit — 2.0% | | | | | | | | |
| | |
Bank of Nova Scotia (The) (Canada) | | | | | | | | |
| | |
(ICE LIBOR USD 3 Month + 0.30%), 2.96%, 5/22/2020 (b) | | | 2,500,000 | | | | 2,501,487 | |
| | |
(ICE LIBOR USD 3 Month + 0.28%), 3.07%, 9/21/2020 (b) | | | 3,000,000 | | | | 3,001,345 | |
| | |
Canadian Imperial Bank of Commerce (Canada) (ICE LIBOR USD 3 Month + 0.40%), 2.80%, 5/2/2020 (b) | | | 4,000,000 | | | | 4,011,516 | |
| | |
Credit Agricole Corporate and Investment Bank (France) (ICE LIBOR USD 3 Month + 0.35%), 3.10%, 7/30/2020 (b) | | | 21,500,000 | | | | 21,499,872 | |
| | |
Lloyds Bank Corporate Markets plc (United Kingdom) (ICE LIBOR USD 3 Month + 0.50%), 3.32%, 9/24/2020 (b) | | | 23,000,000 | | | | 22,999,799 | |
| | |
Mizuho Bank Ltd. (Japan) (ICE LIBOR USD 3 Month + 0.33%), 3.12%, 4/15/2020 (b) | | | 17,000,000 | | | | 17,024,101 | |
| | |
Nordea Bank AB (Finland) | | | | | | | | |
| | |
(ICE LIBOR USD 3 Month + 0.30%), 3.05%, 6/5/2020 (b) | | | 4,000,000 | | | | 4,007,362 | |
| | |
(ICE LIBOR USD 3 Month + 0.28%), 3.02%, 9/4/2020 (b) | | | 21,000,000 | | | | 21,018,495 | |
| | |
Sumitomo Mitsui Banking Corp. (Japan) (ICE LIBOR USD 3 Month + 0.41%), 3.21%, 6/18/2020 (b) | | | 4,000,000 | | | | 4,006,541 | |
| | |
Svenska Handelsbanken AB (Sweden) | | | | | | | | |
| | |
(ICE LIBOR USD 3 Month + 0.40%), 3.20%, 4/1/2020 (b) | | | 4,965,000 | | | | 4,980,742 | |
| | |
(ICE LIBOR USD 3 Month + 0.30%), 3.07%, 6/11/2020 (b) | | | 2,773,000 | | | | 2,778,166 | |
| | |
(ICE LIBOR USD 3 Month + 0.28%), 3.08%, 9/11/2020 (b) | | | 6,000,000 | | | | 6,005,342 | |
| | | | | | | | |
| | |
Total Certificates of Deposit
(Cost $113,737,785) | | | | | | | 113,834,768 | |
| | | | | | | | |
U.S. Treasury Obligations — 1.7% | | | | | | | | |
| | |
U.S. Treasury Notes | | | | | | | | |
| | |
0.88%, 7/31/2019 | | | 20,595,200 | | | | 20,456,826 | |
| | |
1.00%, 11/30/2019 | | | 36,041,600 | | | | 35,624,869 | |
| | |
1.63%, 12/31/2019 | | | 40,000,000 | | | | 39,695,312 | |
| | | | | | | | |
| | |
Total U.S. Treasury Obligations
(Cost $95,667,667) | | | | | | | 95,777,007 | |
| | | | | | | | |
Commercial Mortgage-Backed Securities — 0.4% | |
| | |
BX Commercial Mortgage Trust Series 2018-IND, Class A, 3.24%, 11/15/2035 (a) (f) | | | 11,527,622 | | | | 11,513,179 | |
SEE NOTES TO FINANCIAL STATEMENTS.
| | | | | | | | |
| | | |
| FEBRUARY 28, 2019 | | J.P. MORGAN EXCHANGE-TRADED FUNDS | | | | | 117 | |
JPMorgan Ultra-Short Income ETF
SCHEDULE OF PORTFOLIO INVESTMENTS
AS OF FEBRUARY 28, 2019 (continued)
| | | | | | | | |
| INVESTMENTS | | PRINCIPAL
AMOUNT ($) | | | VALUE ($) | |
Commercial Mortgage-Backed Securities — continued | |
| | |
BXMT Ltd. Series 2017-FL1, Class A, 3.36%, 6/15/2035 (a) (f) | | | 1,000,000 | | | | 998,750 | |
| | |
BXP Trust Series 2017-CQHP, Class A, 3.34%, 11/15/2034 (a) (f) | | | 500,000 | | | | 495,197 | |
| | |
CGDBB Commercial Mortgage Trust Series 2017-BIOC, Class A, 3.28%, 7/15/2032 (a) (f) | | | 900,000 | | | | 898,835 | |
| | |
Citigroup Commercial Mortgage Trust Series 2017-1500, Class A, 3.34%, 7/15/2032 (a) (f) | | | 1,800,000 | | | | 1,800,561 | |
| | |
Cold Storage Trust Series 2017-ICE3, Class A, 3.49%, 4/15/2036 (a) (f) | | | 4,530,000 | | | | 4,518,514 | |
| | |
Exantas Capital Corp. Ltd. (Cayman Islands) Series 2018-RSO6, Class A, 3.32%, 6/15/2035 (a) (f) | | | 2,900,000 | | | | 2,867,555 | |
| | |
TPG Real Estate Finance Ltd. (Cayman Islands) Series 2018-FL1, Class A, 3.24%, 2/15/2035 (a) (f) | | | 497,069 | | | | 493,652 | |
| | | | | | | | |
| |
Total Commercial Mortgage-Backed Securities
(Cost $23,664,747) | | | | 23,586,243 | |
| | | | | | | | |
Foreign Government Securities — 0.0%(c) | |
| | |
Japan Bank for International Cooperation (Japan) (ICE LIBOR USD 3 Month + 0.48%), 3.22%, 6/1/2020 (b) | | | 200,000 | | | | 200,886 | |
| | |
Japan Finance Organization for Municipalities (Japan) 2.13%, 3/6/2019 (a) | | | 1,751,000 | | | | 1,749,564 | |
| | | | | | | | |
| | |
Total Foreign Government Securities
(Cost $1,950,867) | | | | | | | 1,950,450 | |
| | | | | | | | |
Short-term Investments — 14.9% | | | | | | | | |
| |
Certificates of Deposit — 2.8% | | | | | |
| | |
Bank of Montreal (Canada) (ICE LIBOR USD 3 Month + 0.25%), 3.05%, 3/18/2019 (b) | | | 2,200,000 | | | | 2,200,217 | |
| | |
Bank of Nova Scotia (The) (Canada) (ICE LIBOR USD 3 Month + 0.28%), 3.07%, 3/20/2019 (b) | | | 1,400,000 | | | | 1,400,177 | |
| | |
Barclays Bank plc (United Kingdom) 3.00%, 9/19/2019 | | | 25,250,000 | | | | 25,250,892 | |
| | |
BNP Paribas SA (France) (ICE LIBOR USD 3 Month + 0.14%), 2.94%, 6/19/2019 (b) | | | 5,800,000 | | | | 5,801,997 | |
| | |
Canadian Imperial Bank of Commerce (Canada) | | | | | | | | |
| | |
(ICE LIBOR USD 3 Month + 0.41%), 3.20%, 9/20/2019 (b) | | | 1,950,000 | | | | 1,953,542 | |
| | |
3.08%, 10/25/2019 | | | 32,000,000 | | | | 32,089,568 | |
| | | | | | | | |
| INVESTMENTS | | PRINCIPAL
AMOUNT ($) | | | VALUE ($) | |
| | | | | | | | |
| |
Certificates of Deposit — continued | | | | | |
| | |
Credit Suisse AG (Switzerland) | | | | | | | | |
| | |
1.75%, 3/12/2019 | | | 700,000 | | | | 699,841 | |
| | |
2.94%, 9/27/2019 | | | 21,000,000 | | | | 21,029,003 | |
| | |
Lloyds Bank plc 3.03%, 10/21/2019 | | | 6,000,000 | | | | 6,010,533 | |
| | |
Mizuho Bank Ltd. (Japan) (ICE LIBOR USD 3 Month + 0.40%), 3.17%, 10/25/2019 (b) | | | 9,289,000 | | | | 9,312,612 | |
| | |
National Bank of Canada (Canada) (ICE LIBOR USD 3 Month + 0.19%), 2.88%, 2/14/2020 (b) | | | 5,000,000 | | | | 5,005,109 | |
| | |
Societe Generale SA (France) 3.05%, 10/18/2019 | | | 12,000,000 | | | | 12,024,994 | |
| | |
Sumitomo Mitsui Banking Corp. (Japan) | | | | | | | | |
| | |
(ICE LIBOR USD 3 Month + 0.37%), 3.17%, 7/11/2019 (b) | | | 400,000 | | | | 400,492 | |
| | |
(ICE LIBOR USD 3 Month + 0.37%), 3.11%, 1/31/2020 (b) | | | 6,959,000 | | | | 6,971,473 | |
| | |
US Bank NA 2.72%, 9/6/2019 | | | 12,080,000 | | | | 12,084,365 | |
| | |
Westpac Banking Corp. (Australia) 2.97%, 10/18/2019 | | | 16,600,000 | | | | 16,632,647 | |
| | | | | | | | |
| | |
Total Certificates of Deposit
(COST $158,630,972) | | | | | | | 158,867,462 | |
| | | | | | | | |
|
Commercial Paper — 8.8% | |
| | |
ASSA ABLOY Financial Services AB (Sweden) 2.95%, 3/25/2019 (a) (h) | | | 12,686,000 | | | | 12,661,958 | |
| | |
AT&T, Inc. 3.09%, 6/5/2019 (a) (h) | | | 7,800,000 | | | | 7,738,421 | |
| | |
Bank of China Ltd. (China) | | | | | | | | |
| | |
2.94%, 3/27/2019 (h) | | | 8,000,000 | | | | 7,985,240 | |
| | |
2.91%, 4/15/2019 (h) | | | 26,575,000 | | | | 26,489,123 | |
| | |
3.02%, 4/23/2019 (h) | | | 3,400,000 | | | | 3,386,923 | |
| | |
3.13%, 5/10/2019 (a) (h) | | | 10,000,000 | | | | 9,948,407 | |
| | |
Bell Canada, Inc. (Canada) 3.12%, 4/3/2019 (a) (h) | | | 12,108,000 | | | | 12,076,919 | |
| | |
BNZ International Funding Ltd. (New Zealand) 2.98%, 10/11/2019 (a) (h) | | | 12,500,000 | | | | 12,290,625 | |
| | |
BP Capital Markets plc (United Kingdom) 3.03%, 10/10/2019 (a) (h) | | | 34,700,000 | | | | 34,102,142 | |
| | |
China Construction Bank Corp. (China) 3.14%, 3/19/2019 (a) (h) | | | 29,000,000 | | | | 28,962,103 | |
| | |
Coca-Cola Co. (The) | | | | | | | | |
| | |
2.63%, 5/30/2019 (a) (h) | | | 3,740,000 | | | | 3,715,968 | |
| | |
2.60%, 7/17/2019 (a) (h) | | | 8,264,000 | | | | 8,180,847 | |
| | |
Dexia Credit Local SA (France) 2.61%, 5/7/2019 (h) | | | 10,000,000 | | | | 9,953,288 | |
| | |
Enbridge, Inc. (Canada) 2.88%, 3/4/2019 (h) | | | 11,000,000 | | | | 10,996,787 | |
SEE NOTES TO FINANCIAL STATEMENTS.
| | | | | | |
| | | |
| 118 | | | | J.P. MORGAN EXCHANGE-TRADED FUNDS | | FEBRUARY 28, 2019 |
| | | | | | | | |
| INVESTMENTS | | PRINCIPAL
AMOUNT ($) | | | VALUE ($) | |
Short-term Investments — continued | | | | | | | | |
|
Commercial Paper — continued | |
| | |
Enel Finance International NV (Italy) 3.15%, 8/12/2019 (a) (h) | | | 25,000,000 | | | | 24,657,396 | |
| | |
Eni Finance USA, Inc. 2.99%, 4/30/2019 (a) (h) | | | 7,500,000 | | | | 7,464,785 | |
| | |
Entergy Corp. 2.84%, 3/5/2019 (a) (h) | | | 25,000,000 | | | | 24,990,736 | |
| | |
Federation des Caisses Desjardins du Quebec (Canada) 2.73%, 7/22/2019 (a) (h) | | | 1,000,000 | | | | 989,488 | |
| | |
General Electric Co. 2.94%, 3/29/2019 (h) | | | 19,000,000 | | | | 18,957,190 | |
| | |
Macquarie Bank Ltd. (Australia) | | | | | | | | |
| | |
2.73%, 8/8/2019 (a) (h) | | | 8,955,000 | | | | 8,847,870 | |
| | |
3.10%, 10/25/2019 (a) (h) | | | 14,000,000 | | | | 13,744,867 | |
| | |
NextEra Energy Capital Holdings, Inc. 2.76%, 3/8/2019 (a) (h) | | | 6,500,000 | | | | 6,496,181 | |
| | |
ONEOK, Inc. 2.96%, 3/7/2019 (a) (h) | | | 30,304,000 | | | | 30,287,266 | |
| | |
Schlumberger Holdings Corp. 2.86%, 3/1/2019 (a) (h) | | | 5,500,000 | | | | 5,499,597 | |
| | |
Societe Generale SA (France) | | | | | | | | |
| | |
2.90%, 8/2/2019 (h) | | | 15,500,000 | | | | 15,326,580 | |
| | |
2.89%, 8/26/2019 (h) | | | 5,000,000 | | | | 4,934,366 | |
| | |
Suncor Energy, Inc. (Canada) | | | | | | | | |
| | |
3.03%, 3/1/2019 (a) (h) | | | 7,500,000 | | | | 7,499,455 | |
| | |
2.97%, 5/6/2019 (a) (h) | | | 8,000,000 | | | | 7,958,028 | |
| | |
Telstra Corp. Ltd. (Australia) 3.05%, 4/29/2019 (a) (h) | | | 10,500,000 | | | | 10,452,400 | |
| | |
TELUS Corp. (Canada) | | | | | | | | |
| | |
3.14%, 4/2/2019 (a) (h) | | | 18,121,000 | | | | 18,075,553 | |
| | |
2.98%, 4/30/2019 (a) (h) | | | 9,000,000 | | | | 8,957,254 | |
| | |
Toronto-Dominion Bank (The) (Canada) 3.09%, 10/18/2019 (a) (h) | | | 28,000,000 | | | | 27,531,386 | |
| | |
TransCanada PipeLines Ltd. (Canada) | | | | | | | | |
| | |
3.02%, 4/8/2019 (a) (h) | | | 10,000,000 | | | | 9,970,230 | |
| | |
3.00%, 4/10/2019 (a) (h) | | | 9,000,000 | | | | 8,971,792 | |
| | |
3.08%, 4/11/2019 (a) (h) | | | 12,000,000 | | | | 11,961,444 | |
| | |
VW Credit, Inc. (Germany) 3.41%, 7/8/2019 (a) (h) | | | 2,500,000 | | | | 2,473,522 | |
| | |
Walgreens Boots Alliance, Inc. | | | | | | | | |
| | |
3.30%, 5/24/2019 (h) | | | 7,500,000 | | | | 7,449,230 | |
| | |
3.36%, 7/22/2019 (h) | | | 5,750,000 | | | | 5,682,104 | |
| | |
3.20%, 8/1/2019 (h) | | | 5,000,000 | | | | 4,936,625 | |
| | |
3.17%, 8/5/2019 (h) | | | 7,500,000 | | | | 7,402,402 | |
| | |
Westpac Banking Corp. (Australia) (ICE LIBOR USD 3 Month + 0.00%), 2.77%, 8/12/2019 (a) (b) (h) | | | 9,750,000 | | | | 9,752,109 | |
| | | | | | | | |
| | |
Total Commercial Paper
(Cost $499,513,797) | | | | | | | 499,758,607 | |
| | | | | | | | |
| | | | | | | | |
| INVESTMENTS | |
SHARES | | | VALUE ($) | |
Investment Companies — 2.6% | | | | | | | | |
| | |
JPMorgan U.S. Government Money Market Fund Class Institutional Shares, 2.33% (i) (j)
(Cost $150,351,796) | | | 150,351,796 | | | | 150,351,796 | |
| | | | | | | | |
| | |
| | | PRINCIPAL
AMOUNT ($) | | | | |
Repurchase Agreements — 0.7% | | | | | | | | |
| | |
Citigroup Global Markets Holdings, Inc., 3.12%, dated 2/28/2019, due 1/17/2020, repurchase price $12,335,396, collateralized by Collateralized Mortgage Obligations, 2.70% — 7.00%, due 7/25/2033 — 12/10/2049, with the value of $12,960,001. | | | 12,000,000 | | | | 12,000,000 | |
| | |
Merrill Lynch PFS, Inc., 2.85%, dated 2/28/2019, due 4/18/2019, repurchase price $9,034,913, collateralized by Municipal Debt Securities, 0.00 — 6.13% due 7/1/2020 — 7/1/2040, Asset-Backed Securities, 3.70% due 6/25/2043, with value of $9,717,567. | | | 9,000,000 | | | | 9,000,000 | |
| | |
Wells Fargo Securities LLC, 3.31%, dated 2/28/2019, due 5/13/2019, repurchase price $20,136,078, collateralized by Asset-Backed Securities, 3.45% — 7.26%, due 3/22/2021 — 2/19/2045 with the value of $22,364,100. | | | 20,000,000 | | | | 20,000,000 | |
| | | | | | | | |
| | |
Total Repurchase Agreements
(Cost $41,000,000) | | | | | | | 41,000,000 | |
| | | | | | | | |
| | |
Total Short-term Investments
(Cost $849,496,565) | | | | | | | 849,977,865 | |
| | | | | | | | |
| | |
Total Investments — 100.5%
(Cost $5,727,038,983) | | | | | | | 5,729,646,830 | |
| | |
Liabilities in Excess of Other
Assets — (0.5%) | | | | | | | (26,584,555) | |
| | | | | | | | |
| | |
Net Assets — 100.0% | | | | | | | 5,703,062,275 | |
| | | | | | | | |
Percentages indicated are based on net assets.
SEE NOTES TO FINANCIAL STATEMENTS.
| | | | | | | | |
| | | |
| FEBRUARY 28, 2019 | | J.P. MORGAN EXCHANGE-TRADED FUNDS | | | | | 119 | |
JPMorgan Ultra-Short Income ETF
SCHEDULE OF PORTFOLIO INVESTMENTS
AS OF FEBRUARY 28, 2019 (continued)
Abbreviations
| | |
CIFC | | Commercial Industrial Finance Corp. |
CLO | | Collateralized Loan Obligations |
ICE | | Intercontinental Exchange |
LIBOR | | London Interbank Offered Rate |
REIT | | Real Estate Investment Trust |
SOFR | | Secured Overnight Financing Rate |
USD | | United States Dollar |
| |
| (a) | | Securities exempt from registration under Rule 144A or section 4(a)(2), of the Securities Act of 1933, as amended. |
| (b) | | Variable or floating rate security, linked to the referenced benchmark. The interest rate shown is the current rate as of February 28, 2019. |
| (c) | | Amount rounds to less than 0.1% of net assets. |
| (d) | | Step bond. Interest rate is a fixed rate for an initial period that either resets at a specific date or may reset in the future contingent upon a predetermined trigger. The interest rate shown is the current rate as of February 28, 2019. |
| | |
| (e) | | Security exempt from registration pursuant to Regulation S under the Securities Act of 1933, as amended. Regulation S applies to securities offerings that are made outside of the United States and do not involve direct selling efforts in the United States and as such may have restrictions on resale. |
| (f) | | Variable or floating rate security, the interest rate of which adjusts periodically based on changes in current interest rates and prepayments on the underlying pool of assets. The interest rate shown is the current rate as of February 28, 2019. |
| (g) | | All or a portion of the security is a when-issued security, delayed delivery security, or forward commitment. |
| (h) | | The rate shown is the effective yield as of February 28, 2019. |
| (i) | | Investment in affiliate. Fund is registered under the Investment Company Act of 1940, as amended, and advised by J.P. Morgan Investment Management Inc. |
| (j) | | The rate shown is the current yield as of February 28, 2019. |
| ‡ | | Value determined using significant unobservable inputs. |
SEE NOTES TO FINANCIAL STATEMENTS.
| | | | | | |
| | | |
| 120 | | | | J.P. MORGAN EXCHANGE-TRADED FUNDS | | FEBRUARY 28, 2019 |
JPMorgan Ultra-Short Municipal Income ETF
SCHEDULE OF PORTFOLIO INVESTMENTS
AS OF FEBRUARY 28, 2019
| | | | | | | | |
| INVESTMENTS | | PRINCIPAL
AMOUNT ($) | | | VALUE ($) | |
Municipal Bonds — 101.6% (a) | |
|
Alabama — 1.3% | |
| | |
Education — 0.3% | | | | | | | | |
| | |
Alabama Public School and College Authority, Capital Improvement Economic Development and Training Series 2012B, Rev., 5.00%, 3/1/2019 | | | 100,000 | | | | 100,028 | |
| | |
Baldwin County Board of Education, School Warrants Rev., 5.00%, 6/1/2019 | | | 25,000 | | | | 25,186 | |
| | | | | | | | |
| | |
| | | | | | | 125,214 | |
| | | | | | | | |
| | |
General Obligation — 0.0% (b) | | | | | | | | |
| | |
City of Huntsville Series C, GO, 5.00%, 5/1/2019 | | | 20,000 | | | | 20,107 | |
| | | | | | | | |
|
Industrial Development Revenue/Pollution Control Revenue — 0.1% | |
| | |
Alabama Water Pollution Control Authority, Revolving Loan Series 2010-A, Rev., 4.00%, 8/15/2019 | | | 20,000 | | | | 20,196 | |
| | |
Madison County Public Building Authority, Department of Human Resources Project Series 2019-0, Rev., 5.00%, 3/1/2020 | | | 30,000 | | | | 30,920 | |
| | | | | | | | |
| | |
| | | | | | | 51,116 | |
| | | | | | | | |
| | |
Prerefunded — 0.5% | | | | | | | | |
| | |
South Alabama Gas District Rev., 3.40%, 8/1/2020 (c) | | | 300,000 | | | | 307,188 | |
| | | | | | | | |
| | |
Special Tax — 0.3% | | | | | | | | |
| | |
Mobile County Board of School Commissioners 3.00%, 3/1/2019 | | | 100,000 | | | | 100,008 | |
| | |
Mobile County Board of School Commissioners, Public School Refunding Warrants Series 2016B, 5.00%, 3/1/2019 | | | 75,000 | | | | 75,019 | |
| | | | | | | | |
| | |
| | | | | | | 175,027 | |
| | | | | | | | |
| | |
Transportation — 0.1% | | | | | | | | |
| | |
Alabama Federal Aid Highway Finance Authority Series 2012A, Rev., GAN, 5.00%, 9/1/2019 | | | 45,000 | | | | 45,711 | |
| | | | | | | | |
| | |
Total Alabama | | | | | | | 724,363 | |
| | | | | | | | |
|
Alaska — 0.3% | |
| | |
Education — 0.0% (b) | | | | | | | | |
| | |
University of Alaska Series T, Rev., 5.00%, 10/1/2019 | | | 25,000 | | | | 25,471 | |
| | | | | | | | |
| | |
General Obligation — 0.0% (b) | | | | | | | | |
| | |
Municipality of Anchorage Series C, GO, 5.00%, 9/1/2019 | | | 20,000 | | | | 20,321 | |
| | | | | | | | |
| | |
Other Revenue — 0.1% | | | | | | | | |
| | |
Alaska Municipal Bond Bank Authority | | | | | | | | |
| | |
Series 2, Rev., 3.00%, 6/1/2019 | | | 30,000 | | | | 30,092 | |
| | | | | | | | |
| INVESTMENTS | | PRINCIPAL
AMOUNT ($) | | | VALUE ($) | |
| | | | | | | | |
| | |
Other Revenue — continued | | | | | | | | |
| | |
Series 2, Rev., 5.00%, 9/1/2019 | | | 30,000 | | | | 30,477 | |
| | | | | | | | |
| | |
| | | | | | | 60,569 | |
| | | | | | | | |
| | |
Prerefunded — 0.1% | | | | | | | | |
| | |
Alaska Housing Finance Corp., Capital Project Series 2011A, Rev., 5.00%, 12/1/2020 (c) | | | 50,000 | | | | 52,792 | |
| | | | | | | | |
| | |
Utility — 0.1% | | | | | | | | |
| | |
Alaska Energy Authority, Power Sixth Series, Bradley Lake Hydroelectric Project Series 6, Rev., 5.00%, 7/1/2020 | | | 30,000 | | | | 31,227 | |
| | | | | | | | |
| | |
Total Alaska | | | | | | | 190,380 | |
| | | | | | | | |
|
Arizona — 0.3% | |
| |
Certificate of Participation/Lease — 0.1% | | | | | |
| | |
City of Tucson | | | | | | | | |
| | |
COP, AGC, 4.00%, 7/1/2019 | | | 30,000 | | | | 30,236 | |
| | |
COP, AGM, 4.00%, 7/1/2020 | | | 25,000 | | | | 25,772 | |
| | | | | | | | |
| | |
| | | | | | | 56,008 | |
| | | | | | | | |
|
General Obligation — 0.1% | |
| | |
Maricopa County Elementary School District No. 79-Litchfield Elementary GO, 2.00%, 7/1/2019 | | | 25,000 | | | | 25,030 | |
| | |
Maricopa County Unified School District No. 69 Paradise Valley, School Improvement Project Series 2017B, GO, 5.00%, 7/1/2019 | | | 25,000 | | | | 25,278 | |
| | |
Pinal County, Florence Unified School District No. 1 GO, 4.00%, 7/1/2020 | | | 20,000 | | | | 20,616 | |
| | | | | | | | |
| | |
| | | | | | | 70,924 | |
| | | | | | | | |
|
Transportation — 0.1% | |
| | |
Pima County Regional Transportation Authority Rev., 5.00%, 6/1/2020 (c) | | | 40,000 | | | | 41,600 | |
| | |
Regional Public Transportation Authority, Maricopa County Public Transportation Rev., 5.25%, 7/1/2021 | | | 30,000 | | | | 32,430 | |
| | | | | | | | |
| | |
| | | | | | | 74,030 | |
| | | | | | | | |
| | |
Total Arizona | | | | | | | 200,962 | |
| | | | | | | | |
|
Arkansas — 0.7% | |
| | |
Education — 0.1% | | | | | | | | |
| | |
Arkansas Technical University, Student Fee Series 2014A, Rev., 3.00%, 5/1/2019 | | | 50,000 | | | | 50,096 | |
| | | | | | | | |
| | |
General Obligation — 0.6% | | | | | | | | |
| | |
Newport Special School District, Subordinate Construction GO, 2.45%, 2/1/2021 | | | 330,000 | | | | 330,132 | |
| | | | | | | | |
SEE NOTES TO FINANCIAL STATEMENTS.
| | | | | | | | |
| | | |
| FEBRUARY 28, 2019 | | J.P. MORGAN EXCHANGE-TRADED FUNDS | | | | | 121 | |
JPMorgan Ultra-Short Municipal Income ETF
SCHEDULE OF PORTFOLIO INVESTMENTS
AS OF FEBRUARY 28, 2019 (continued)
| | | | | | | | |
| INVESTMENTS | | PRINCIPAL
AMOUNT ($) | | | VALUE ($) | |
Municipal Bonds — continued | |
| | |
Housing — 0.0%(b) | | | | | | | | |
| | |
Arkansas Technical University, Housing System Series 2017A, Rev., 3.00%, 6/1/2019 | | | 25,000 | | | | 25,073 | |
| | | | | | | | |
| | |
Total Arkansas | | | | | | | 405,301 | |
| | | | | | | | |
|
Colorado — 0.6% | |
|
Certificate of Participation/Lease — 0.0% (b) | |
| | |
Regional Transportation District Series 2015A, COP, 5.00%, 6/1/2020 | | | 25,000 | | | | 25,961 | |
| | | | | | | | |
| | |
Education — 0.4% | | | | | | | | |
| | |
Colorado State Education Loan Program Series 2018A, Rev., 4.00%, 6/27/2019 | | | 200,000 | | | | 201,476 | |
| | | | | | | | |
| | |
Transportation — 0.2% | | | | | | | | |
| | |
E-470 Public Highway Authority | | | | | | | | |
| | |
Series 2015A, Rev., 2.25%, 9/1/2019 | | | 25,000 | | | | 25,054 | |
| | |
Series 2015A, Rev., 5.00%, 9/1/2019 | | | 110,000 | | | | 111,713 | |
| | | | | | | | |
| | |
| | | | | | | 136,767 | |
| | | | | | | | |
| | |
Total Colorado | | | | | | | 364,204 | |
| | | | | | | | |
|
Connecticut — 0.8% | |
| | |
General Obligation — 0.3% | | | | | | | | |
| | |
State of Connecticut | | | | | | | | |
| | |
Series B, GO, 3.50%, 3/1/2019 | | | 50,000 | | | | 50,007 | |
| | |
Series C, GO, 5.00%, 6/1/2020 | | | 100,000 | | | | 103,904 | |
| | | | | | | | |
| | |
| | | | | | | 153,911 | |
| | | | | | | | |
|
Hospital — 0.3% | |
| | |
Connecticut State Health and Educational Facilities Authority, Yale University Issue Series 2014A, Rev., VAR, 1.30%, 2/3/2020 (d) | | | 200,000 | | | | 198,994 | |
| | | | | | | | |
|
Housing — 0.2% | |
| | |
Connecticut Housing Finance Authority Series C, Subseries C-1, Rev., 1.80%, 5/15/2020 | | | 110,000 | | | | 109,933 | |
| | | | | | | | |
| | |
Total Connecticut | | | | | | | 462,838 | |
| | | | | | | | |
|
Delaware — 0.0% (b) | |
| | |
General Obligation — 0.0% (b) | | | | | | | | |
| | |
State of Delaware Series 2009-C, GO, 4.00%, 10/1/2019 | | | 25,000 | | | | 25,348 | |
| | | | | | | | |
|
District of Columbia — 0.1% | |
| | |
General Obligation — 0.0% (b) | | | | | | | | |
| | |
District of Columbia Series A, GO, 5.00%, 6/1/2019 | | | 25,000 | | | | 25,205 | |
| | | | | | | | |
| | | | | | | | |
| INVESTMENTS | | PRINCIPAL
AMOUNT ($) | | | VALUE ($) | |
| | | | | | | | |
|
Other Revenue — 0.1% | |
| | |
District of Columbia, Income Tax Secured Series F, Rev., 4.00%, 12/1/2021 | | | 35,000 | | | | 37,135 | |
| | | | | | | | |
| | |
Total District of Columbia | | | | | | | 62,340 | |
| | | | | | | | |
|
Florida — 11.6% | |
|
Certificate of Participation/Lease — 0.6% | |
| | |
Escambia County School Board COP, 5.00%, 2/1/2020 | | | 30,000 | | | | 30,873 | |
| | |
Palm Beach County School District Series B, COP, 5.00%, 8/1/2019 | | | 20,000 | | | | 20,266 | |
| | |
Pasco County School Board Series 2013A, COP, 5.00%, 8/1/2021 | | | 50,000 | | | | 53,618 | |
| | |
School Board of Miami-Dade County (The) Series D, COP, 5.00%, 2/1/2021 | | | 100,000 | | | | 105,914 | |
| | |
St Lucie County School Board Series 2015A, COP, 5.00%, 7/1/2021 | | | 30,000 | | | | 32,073 | |
| | |
Volusia County School Board Series 2014-B, COP, 5.00%, 8/1/2019 | | | 40,000 | | | | 40,532 | |
| | |
Walton County District School Board COP, 4.00%, 7/1/2019 | | | 50,000 | | | | 50,354 | |
| | | | | | | | |
| | |
| | | | | | | 333,630 | |
| | | | | | | | |
|
Education — 0.2% | |
| | |
City of Tampa, The University of Tampa Project Rev., 5.00%, 4/1/2019 | | | 25,000 | | | | 25,058 | |
| | |
Miami-Dade County Educational Facilities Authority Series B, Rev., AMBAC, 5.25%, 4/1/2019 | | | 55,000 | | | | 55,143 | |
| | |
School Board of Miami-Dade County (The) Rev., TAN, 5.00%, 6/15/2019 | | | 25,000 | | | | 25,232 | |
| | |
State of Florida, State Board of Education Lottery Series E, Rev., 5.00%, 7/1/2020 | | | 20,000 | | | | 20,873 | |
| | | | | | | | |
| | |
| | | | | | | 126,306 | |
| | | | | | | | |
|
General Obligation — 0.6% | |
| | |
City of Miami Gardens GO, 4.00%, 7/1/2019 | | | 100,000 | | | | 100,745 | |
| | |
County of Miami-Dade, Building Better Communities Program Series 2015-D, GO, 5.00%, 7/1/2019 | | | 250,000 | | | | 252,777 | |
| | | | | | | | |
| | |
| | | | | | | 353,522 | |
| | | | | | | | |
|
Hospital — 3.2% | |
| | |
Miami-Dade County Health Facilities Authority, Miami Children’s Hospital Project | | | | | | | | |
| | |
Rev., 5.00%, 8/1/2019 | | | 165,000 | | | | 167,082 | |
| | |
Rev., 4.00%, 8/1/2020 | | | 700,000 | | | | 720,146 | |
| | |
Pinellas County Health Facilities Authority, Baycare Health Rev., VRDO, LOC: U.S. Bank NA, 1.71%, 3/1/2019 (d) | | | 1,000,000 | | | | 1,000,000 | |
| | | | | | | | |
| | |
| | | | | | | 1,887,228 | |
| | | | | | | | |
SEE NOTES TO FINANCIAL STATEMENTS.
| | | | | | |
| | | |
| 122 | | | | J.P. MORGAN EXCHANGE-TRADED FUNDS | | FEBRUARY 28, 2019 |
| | | | | | | | |
| INVESTMENTS | | PRINCIPAL
AMOUNT ($) | | | VALUE ($) | |
Municipal Bonds — continued | |
|
Industrial Development Revenue/Pollution Control Revenue — 1.7% | |
| | |
Florida Department of Environmental Protection | | | | | | | | |
| | |
Series A, Rev., VRDO, AGC, 1.76%, 3/7/2019 (d) | | | 900,000 | | | | 900,000 | |
| | |
Series A, Rev., 5.00%, 7/1/2019 | | | 55,000 | | | | 55,601 | |
| | |
Series 2014-A, Rev., 5.00%, 7/1/2021 | | | 20,000 | | | | 21,505 | |
| | | | | | | | |
| | |
| | | | | | | 977,106 | |
| | | | | | | | |
|
Other Revenue — 1.9% | |
| | |
City of Gulf Breeze, Local Government Loan Program, Remarketing Series 1985J, Rev., 4.50%, 12/1/2020 | | | 200,000 | | | | 209,536 | |
| | |
City of Jacksonville, Excise Tax Series 2009B, Rev., 5.00%, 10/1/2019 | | | 25,000 | | | | 25,455 | |
| | |
City of Tallahassee Rev., 5.00%, 10/1/2020 | | | 270,000 | | | | 283,913 | |
| | |
County of Collier Series 2010B, Rev., 5.00%, 10/1/2021 | | | 30,000 | | | | 32,521 | |
| | |
County of Miami-Dade | | | | | | | | |
| | |
Series A, Rev., 5.75%, 10/1/2020 | | | 40,000 | | | | 40,928 | |
| | |
Series A, Rev., 5.00%, 4/1/2021 | | | 125,000 | | | | 133,391 | |
| | |
County of Miami-Dade, Capital Asset Acquisition Series B, Rev., 4.50%, 4/1/2019 | | | 100,000 | | | | 100,215 | |
| | |
Florida Department of Environmental Protection, Forever Refunding | | | | | | | | |
| | |
Series 2014A, Rev., 5.00%, 7/1/2019 | | | 25,000 | | | | 25,270 | |
| | |
Series 2011B, Rev., 5.00%, 7/1/2021 | | | 100,000 | | | | 107,523 | |
| | |
Orange County Convention Center Rev., 5.00%, 10/1/2021 | | | 85,000 | | | | 91,933 | |
| | |
St. Johns County, School District Rev., 5.00%, 10/1/2019 | | | 40,000 | | | | 40,744 | |
| | | | | | | | |
| | |
| | | | | | | 1,091,429 | |
| | | | | | | | |
|
Prerefunded — 0.1% | |
| | |
City of Jacksonville Series B-1A, Rev., 5.00%, 10/1/2019 (c) | | | 20,000 | | | | 20,378 | |
| | |
JEA Electric System Series 3-C, Rev., 3.25%, 4/1/2020 (c) | | | 25,000 | | | | 25,412 | |
| | | | | | | | |
| | |
| | | | | | | 45,790 | |
| | | | | | | | |
|
Transportation — 0.2% | |
| | |
Florida’s Turnpike Enterprise, Department of Transportation Series 2015B, Rev., 5.00%, 7/1/2019 | | | 70,000 | | | | 70,765 | |
| | |
State of Florida, Department of Transportation, Turnpike Series A, Rev., 5.00%, 7/1/2019 | | | 30,000 | | | | 30,328 | |
| | | | | | | | |
| | |
| | | | | | | 101,093 | |
| | | | | | | | |
| | | | | | | | |
| INVESTMENTS | | PRINCIPAL
AMOUNT ($) | | | VALUE ($) | |
| | | | | | | | |
|
Utility — 2.8% | |
| | |
City of Palm Coast, Utility System Improvement Rev., 5.00%, 10/1/2019 | | | 50,000 | | | | 50,898 | |
| | |
City of Port St. Lucie, Utility Systems Rev., NATL-RE, 5.25%, 9/1/2019 | | | 25,000 | | | | 25,419 | |
| | |
City of Tallahassee, Energy System | | | | | | | | |
| | |
Rev., 5.00%, 10/1/2019 | | | 70,000 | | | | 71,319 | |
| | |
Rev., 5.00%, 10/1/2020 | | | 110,000 | | | | 115,624 | |
| | |
Rev., 5.00%, 10/1/2021 | | | 35,000 | | | | 37,893 | |
| | |
Florida Municipal Power Agency, All Requirements Power Supply Project Series C, Rev., VRDO, LOC: Bank of America NA, 1.72%, 3/1/2019 (d) | | | 1,000,000 | | | | 1,000,000 | |
| | |
JEA Electric System | | | | | | | | |
| | |
Series A, Rev., 4.00%, 10/1/2019 | | | 20,000 | | | | 20,217 | |
| | |
Series 2015A, Rev., 5.00%, 10/1/2019 | | | 30,000 | | | | 30,497 | |
| | |
Series 2015B, Rev., 5.00%, 10/1/2019 | | | 50,000 | | | | 50,828 | |
| | |
Series A, Rev., 5.00%, 10/1/2019 | | | 180,000 | | | | 182,981 | |
| | |
Series G, Rev., 5.00%, 10/1/2019 | | | 30,000 | | | | 30,521 | |
| | | | | | | | |
| | |
| | | | | | | 1,616,197 | |
| | | | | | | | |
|
Water & Sewer — 0.3% | |
| | |
City of Fort Lauderdale, Water and Sewer Rev., 5.00%, 3/1/2019 | | | 150,000 | | | | 150,042 | |
| | |
County of Lee County Series 2013B, Rev., 5.00%, 10/1/2022 | | | 35,000 | | | | 38,836 | |
| | | | | | | | |
| | |
| | | | | | | 188,878 | |
| | | | | | | | |
| | |
Total Florida | | | | | | | 6,721,179 | |
| | | | | | | | |
|
Georgia — 4.0% | |
| | |
General Obligation — 0.4% | | | | | | | | |
| | |
Clarke County School District, Sales Tax GO, 5.00%, 9/1/2021 | | | 30,000 | | | | 32,415 | |
| | |
Columbia County School District GO, 5.00%, 4/1/2019 | | | 20,000 | | | | 20,051 | |
| | |
Savannah-Chatham County School District GO, AGM, 5.25%, 8/1/2019 | | | 25,000 | | | | 25,372 | |
| | |
Toombs County School District Series 2012A&B, GO, 4.00%, 5/1/2019 | | | 100,000 | | | | 100,373 | |
| | |
White County School District GO, 3.00%, 4/1/2019 | | | 25,000 | | | | 25,026 | |
| | | | | | | | |
| | |
| | | | | | | 203,237 | |
| | | | | | | | |
| | |
Hospital — 0.4% | | | | | | | | |
| | |
Cobb County Kennestone Hospital Authority, WellStar Health System Obligated Group Rev., 5.00%, 4/1/2019 | | | 125,000 | | | | 125,290 | |
| | |
Fulton County Development Authority, Piedmont Healthcare, Inc., Project Series 2016A, Rev., 5.00%, 7/1/2019 | | | 50,000 | | | | 50,529 | |
SEE NOTES TO FINANCIAL STATEMENTS.
| | | | | | | | |
| | | |
| FEBRUARY 28, 2019 | | J.P. MORGAN EXCHANGE-TRADED FUNDS | | | | | 123 | |
JPMorgan Ultra-Short Municipal Income ETF
SCHEDULE OF PORTFOLIO INVESTMENTS
AS OF FEBRUARY 28, 2019 (continued)
| | | | | | | | |
| INVESTMENTS | | PRINCIPAL
AMOUNT ($) | | | VALUE ($) | |
Municipal Bonds — continued | |
| | |
Hospital — continued | | | | | | | | |
| | |
Glynn-Brunswick Memorial Hospital Authority, Southeast Georgia Health System Project Rev., 5.00%, 8/1/2021 | | | 50,000 | | | | 53,213 | |
| | | | | | | | |
| | |
| | | | | | | 229,032 | |
| | | | | | | | |
| | |
Housing — 0.1% | | | | | | | | |
| | |
South Regional Joint Development Authority, Auxiliary Service Real Estate Rev., 5.00%, 8/1/2020 | | | 75,000 | | | | 78,316 | |
| | | | | | | | |
|
Industrial Development Revenue/Pollution Control Revenue — 0.4% | |
| | |
Fulton County Development Authority Series A, Rev., 4.00%, 5/1/2021 | | | 200,000 | | | | 209,610 | |
| | | | | | | | |
|
Other Revenue — 0.3% | |
| | |
Athens-Clarke County Unified Government Development Authority, UGAREF Parking Deck Project Rev., 3.00%, 6/15/2019 | | | 170,000 | | | | 170,610 | |
| | | | | | | | |
|
Prerefunded — 0.0% (b) | |
| | |
County of Columbia, Water and Sewer Rev., 5.00%, 6/1/2020 (c) | | | 20,000 | | | | 20,823 | |
| | | | | | | | |
|
Transportation — 0.1% | |
| | |
Georgia State Road and Tollway Authority, Federal Highway Series A, Rev., 5.00%, 6/1/2019 | | | 35,000 | | | | 35,280 | |
| | | | | | | | |
|
Utility — 2.3% | |
| | |
Burke County Development Authority, Georgia Power Co. Plant Vogtle Project Rev., VAR, 2.20%, 4/2/2019 (d) | | | 1,275,000 | | | | 1,275,038 | |
| | |
Monroe County Development Authority, Gulf Power Company Plant Scherer Project Rev., VAR, 1.40%, 9/19/2019 (d) | | | 50,000 | | | | 49,823 | |
| | | | | | | | |
| | |
| | | | | | | 1,324,861 | |
| | | | | | | | |
|
Water & Sewer — 0.0% (b) | |
| | |
City of Columbus, Georgia Water and Sewerage Rev., AGC, 4.00%, 5/1/2019 | | | 20,000 | | | | 20,076 | |
| | | | | | | | |
| | |
Total Georgia | | | | | | | 2,291,845 | |
| | | | | | | | |
|
Hawaii — 0.1% | |
| | |
General Obligation — 0.1% | | | | | | | | |
| | |
State of Hawaii | | | | | | | | |
| | |
Series DQ, GO, 5.00%, 6/1/2019 | | | 30,000 | | | | 30,247 | |
| | |
Series EO, GO, 5.00%, 8/1/2019 | | | 25,000 | | | | 25,345 | |
| | | | | | | | |
| | |
Total Hawaii | | | | | | | 55,592 | |
| | | | | | | | |
|
Illinois — 2.2% | |
| | |
Education — 0.6% | | | | | | | | |
| | |
Chicago Board of Education Series 2018E, Rev., VRDO, 2.63%, 3/1/2019 (d) (e) | | | 300,000 | | | | 300,000 | |
| | | | | | | | |
| INVESTMENTS | | PRINCIPAL
AMOUNT ($) | | | VALUE ($) | |
| | | | | | | | |
| | |
Education — continued | | | | | | | | |
| | |
University of Illinois, Auxiliary Facilities System Series A, Rev., 4.00%, 4/1/2019 | | | 25,000 | | | | 25,038 | |
| | | | | | | | |
| | |
| | | | | | | 325,038 | |
| | | | | | | | |
| | |
General Obligation — 0.2% | | | | | | | | |
| | |
Cook County School District No. 81 Schiller Park, School Bonds GO, 4.00%, 12/1/2021 | | | 80,000 | | | | 83,974 | |
| | |
Kane McHenry Cook and De Kalb Counties Unit School District No. 300, School Bonds GO, 4.00%, 1/1/2020 | | | 20,000 | | | | 20,299 | |
| | | | | | | | |
| | |
| | | | | | | 104,273 | |
| | | | | | | | |
| | |
Other Revenue — 0.3% | | | | | | | | |
| | |
Railsplitter Tobacco Settlement Authority | | | | | | | | |
| | |
Rev., 5.00%, 6/1/2019 | | | 50,000 | | | | 50,363 | |
| | |
Rev., 5.25%, 6/1/2020 | | | 100,000 | | | | 103,931 | |
| | |
State of Illinois, Build Illinois Rev., 4.00%, 6/15/2020 | | | 45,000 | | | | 45,892 | |
| | | | | | | | |
| | |
| | | | | | | 200,186 | |
| | | | | | | | |
| | |
Prerefunded — 0.5% | | | | | | | | |
| | |
Cook County School District No. 144 Prairie Hills, School Bonds Series A, GO, AGM, 5.00%, 12/1/2020 (c) | | | 100,000 | | | | 105,617 | |
| | |
Illinois Finance Authority, Advocate Healthcare Network Series 2010D, Rev., 5.00%, 4/1/2019 (c) | | | 155,000 | | | | 155,383 | |
| | |
Macoupin County Community Unit School District No. 7 Gillespie, School Building GO, AGC, 6.00%, 12/1/2021 (c) | | | 50,000 | | | | 55,695 | |
| | | | | | | | |
| | |
| | | | | | | 316,695 | |
| | | | | | | | |
| | |
Transportation — 0.1% | | | | | | | | |
| | |
Regional Transportation Authority Series B, Rev., NATL-RE, 5.50%, 6/1/2020 | | | 45,000 | | | | 47,032 | |
| | | | | | | | |
| | |
Utility — 0.1% | | | | | | | | |
| | |
City of Springfield, Senior Lien Electric Rev., 5.00%, 3/1/2020 | | | 50,000 | | | | 51,473 | |
| | | | | | | | |
| | |
Water & Sewer — 0.4% | | | | | | | | |
| | |
Illinois Finance Authority, Clean Water Initiative Rev., 5.00%, 7/1/2019 | | | 200,000 | | | | 202,110 | |
| | | | | | | | |
| | |
Total Illinois | | | | | | | 1,246,807 | |
| | | | | | | | |
|
Indiana — 4.3% | |
| | |
Education — 1.1% | | | | | | | | |
| | |
City of Evansville, Economic Development Lease Rental School Project Series 2015C, 5.00%, 2/15/2020 | | | 25,000 | | | | 25,794 | |
SEE NOTES TO FINANCIAL STATEMENTS.
| | | | | | |
| | | |
| 124 | | | | J.P. MORGAN EXCHANGE-TRADED FUNDS | | FEBRUARY 28, 2019 |
| | | | | | | | |
| INVESTMENTS | | PRINCIPAL
AMOUNT ($) | | | VALUE ($) | |
Municipal Bonds — continued | |
| | |
Education — continued | | | | | | | | |
| | |
Danville School Building Corp., Ad Valorem Property Tax Series B, Rev., 5.00%, 1/15/2020 | | | 100,000 | | | | 102,832 | |
| | |
East Porter County School Building Corp. Rev., 4.00%, 7/15/2020 | | | 125,000 | | | | 128,878 | |
| | |
Elkhart Community Schools Building Corp., First Mortgage Bonds Series 2018B, Rev., 5.00%, 1/15/2020 | | | 75,000 | | | | 77,111 | |
| | |
Evansville-Vanderburgh School Building Corp. Rev., 4.50%, 1/15/2020 | | | 50,000 | | | | 50,105 | |
| | |
Indiana State University Rev., 5.00%, 4/1/2019 | | | 155,000 | | | | 155,391 | |
| | |
MSD of Steuben County K-5 Building Corp., First Mortgage Multipurpose Rev., 3.00%, 7/15/2019 | | | 100,000 | | | | 100,483 | |
| | | | | | | | |
| | |
| | | | | | | 640,594 | |
| | | | | | | | |
| | |
Hospital — 0.9% | | | | | | | | |
| | |
Indiana Finance Authority, Parkview Health Series 2017A, Rev., 5.00%, 11/1/2020 | | | 35,000 | | | | 36,760 | |
| | |
Indiana Health Facility Financing Authority, Ascension Health Subordinate Credit Group Rev., 1.37%, 5/1/2020 (d) | | | 455,000 | | | | 451,992 | |
| | | | | | | | |
| | |
| | | | | | | 488,752 | |
| | | | | | | | |
| | |
Other Revenue — 2.2% | | | | | | | | |
| | |
Indiana State Finance Authority, Lease Appropriation, Stadium Project Rev., VRDO, LIQ: Wells Fargo Bank NA, 1.68%, 3/1/2019 (d) | | | 1,300,000 | | | | 1,300,000 | |
| | | | | | | | |
| | |
Utility — 0.1% | | | | | | | | |
| | |
Indiana Municipal Power Agency Series B, Rev., 5.00%, 1/1/2020 | | | 50,000 | | | | 51,328 | |
| | |
Indiana Municipal Power Agency, Power Supply System Series A, Rev., 5.00%, 1/1/2021 | | | 20,000 | | | | 21,172 | |
| | | | | | | | |
| | |
| | | | | | | 72,500 | |
| | | | | | | | |
| | |
Total Indiana | | | | | | | 2,501,846 | |
| | | | | | | | |
|
Iowa — 1.0% | |
| | |
Education — 0.1% | | | | | | | | |
| | |
Des Moines Independent Community School District Rev., 5.00%, 6/1/2019 | | | 50,000 | | | | 50,385 | |
| | | | | | | | |
| | |
General Obligation — 0.8% | | | | | | | | |
| | |
Ankeny Community School District Series 2015A, GO, 4.00%, 6/1/2019 | | | 60,000 | | | | 60,325 | |
| | |
City of Cedar Rapids Series 2017A, GO, 5.00%, 6/1/2019 | | | 25,000 | | | | 25,206 | |
| | |
City of Des Moines Series 2015A, GO, 5.00%, 6/1/2019 | | | 20,000 | | | | 20,164 | |
| | | | | | | | |
| INVESTMENTS | | PRINCIPAL
AMOUNT ($) | | | VALUE ($) | |
| | | | | | | | |
| | |
General Obligation — continued | | | | | | | | |
| | |
Kirkwood Community College Merged Area Series A, GO, 4.00%, 6/1/2019 | | | 300,000 | | | | 301,575 | |
| | |
Waukee Community School District Series 2014C, GO, 5.00%, 6/1/2021 | | | 40,000 | | | | 42,882 | |
| | |
West Des Moines Community School District, Capital Loan Notes GO, 5.00%, 5/1/2019 | | | 25,000 | | | | 25,131 | |
| | | | | | | | |
| | |
| | | | | | | 475,283 | |
| | | | | | | | |
| | |
Hospital — 0.1% | | | | | | | | |
| | |
Iowa State Board of Regents, University of Iowa Hospitals and Clinics Rev., 4.00%, 9/1/2020 | | | 25,000 | | | | 25,855 | |
| | | | | | | | |
| | |
Prerefunded — 0.0% (b) | | | | | | | | |
| | |
Waterloo Community School District, Infrastructure Sales Series A, Rev., 5.00%, 7/1/2019 (c) | | | 20,000 | | | | 20,218 | |
| | | | | | | | |
| | |
Total Iowa | | | | | | | 571,741 | |
| | | | | | | | |
|
Kansas — 0.4% | |
| | |
General Obligation — 0.0% (b) | | | | | | | | |
| | |
City of Topeka Series 2017-A, GO, 5.00%, 8/15/2019 | | | 20,000 | | | | 20,291 | |
| | | | | | | | |
|
Other Revenue — 0.2% | |
| | |
Wyandotte County Unified Government, Kansas City, Juvenile Justice Series A, Rev., 5.00%, 8/1/2019 | | | 90,000 | | | | 91,139 | |
| | | | | | | | |
|
Utility — 0.2% | |
| | |
Wyandotte County Unified Government, Kansas City, Utility System Series A, 5.00%, 9/1/2019 | | | 110,000 | | | | 111,694 | |
| | | | | | | | |
| | |
Total Kansas | | | | | | | 223,124 | |
| | | | | | | | |
|
Kentucky — 0.5% | |
| | |
General Obligation — 0.2% | | | | | | | | |
| | |
City of Bowling Green Series 2016C, GO, 4.00%, 6/1/2020 | | | 100,000 | | | | 102,941 | |
| | | | | | | | |
|
Prerefunded — 0.1% | |
| | |
Nelson County School District Finance Corp., School Building Rev., 4.00%, 5/1/2019 (c) | | | 45,000 | | | | 45,170 | |
| | | | | | | | |
|
Transportation — 0.2% | |
| | |
Kentucky Turnpike Authority, Revitalization Projects Series A, Rev., 5.00%, 7/1/2019 | | | 100,000 | | | | 101,039 | |
| | | | | | | | |
|
Water & Sewer — 0.0% (b) | |
| | |
Louisville and Jefferson County Metropolitan Sewer District Rev., BAN, 4.00%, 11/1/2019 | | | 25,000 | | | | 25,383 | |
| | | | | | | | |
| | |
Total Kentucky | | | | | | | 274,533 | |
| | | | | | | | |
SEE NOTES TO FINANCIAL STATEMENTS.
| | | | | | | | |
| | | |
| FEBRUARY 28, 2019 | | J.P. MORGAN EXCHANGE-TRADED FUNDS | | | | | 125 | |
JPMorgan Ultra-Short Municipal Income ETF
SCHEDULE OF PORTFOLIO INVESTMENTS
AS OF FEBRUARY 28, 2019 (continued)
| | | | | | | | |
| INVESTMENTS | | PRINCIPAL
AMOUNT ($) | | | VALUE ($) | |
Municipal Bonds — continued | |
|
Louisiana — 1.2% | |
| | |
General Obligation — 0.3% | | | | | | | | |
| | |
Lafourche Parish Consolidated School District No. 1 GO, AGC, 4.00%, 3/1/2019 | | | 65,000 | | | | 65,012 | |
| | |
St Tammany Parish Wide School District No. 12 GO, 5.00%, 4/1/2019 | | | 100,000 | | | | 100,243 | |
| | | | | | | | |
| | |
| | | | | | | 165,255 | |
| | | | | | | | |
|
Industrial Development Revenue/Pollution Control Revenue — 0.9% | |
| | |
East Baton Rouge Parish Industrial Development Board, Inc., ExxonMobil Project Rev., VRDO, 1.70%, 3/1/2019 (d) | | | 500,000 | | | | 500,000 | |
| | | | | | | | |
|
Prerefunded — 0.0% (b) | |
| | |
State of Louisiana Series 2009-A, GO, 4.25%, 5/1/2019 (c) | | | 25,000 | | | | 25,102 | |
| | |
State of Louisiana Gasoline and Fuels Tax Series B, Rev., 5.00%, 5/1/2020 (c) | | | 20,000 | | | | 20,761 | |
| | | | | | | | |
| | |
| | | | | | | 45,863 | |
| | | | | | | | |
| | |
Total Louisiana | | | | | | | 711,118 | |
| | | | | | | | |
|
Maryland — 0.6% | |
| | |
Education — 0.2% | | | | | | | | |
| | |
Montgomery County Revenue Authority Rev., 4.00%, 5/1/2019 | | | 100,000 | | | | 100,351 | |
| | | | | | | | |
| | |
General Obligation — 0.2% | | | | | | | | |
| | |
State of Maryland | | | | | | | | |
| | |
Series B, GO, 5.00%, 3/15/2019 | | | 25,000 | | | | 25,027 | |
| | |
GO, 5.00%, 6/1/2019 | | | 75,000 | | | | 75,614 | |
| | | | | | | | |
| | |
| | | | | | | 100,641 | |
| | | | | | | | |
| | |
Hospital — 0.2% | | | | | | | | |
| | |
Maryland Health and Higher Educational Facilities Authority, Carroll Hospital Center Issue Series A, Rev., 5.00%, 7/1/2019 | | | 50,000 | | | | 50,531 | |
| | |
Maryland Health and Higher Educational Facilities Authority, Meritus Medical Center Rev., 5.00%, 7/1/2019 | | | 50,000 | | | | 50,501 | |
| | | | | | | | |
| | |
| | | | | | | 101,032 | |
| | | | | | | | |
| | |
Transportation — 0.0% (b) | | | | | | | | |
| | |
Maryland State Transportation Authority, Transportation Facilities Projects Rev., 5.00%, 7/1/2020 | | | 25,000 | | | | 26,091 | |
| | | | | | | | |
| | |
Total Maryland | | | | | | | 328,115 | |
| | | | | | | | |
|
Massachusetts — 1.6% | |
| | |
General Obligation — 0.6% | | | | | | | | |
| | |
City of Newburyport, Municipal Purpose Loan of 2013 GO, 4.00%, 1/15/2020 | | | 25,000 | | | | 25,544 | |
| | | | | | | | |
| INVESTMENTS | | PRINCIPAL
AMOUNT ($) | | | VALUE ($) | |
| | | | | | | | |
| | |
General Obligation — continued | | | | | | | | |
| | |
Commonwealth of Massachusetts | | | | | | | | |
| | |
Series A, GO, 5.00%, 3/1/2019 | | | 125,000 | | | | 125,035 | |
| | |
Series A, GO, 5.25%, 8/1/2019 | | | 20,000 | | | | 20,299 | |
| | |
Series D, GO, AMBAC, 5.50%, 10/1/2019 | | | 40,000 | | | | 40,889 | |
| | |
Town of Barnstable, Municipal Purpose Loan GO, 4.00%, 6/15/2019 | | | 20,000 | | | | 20,142 | |
| | |
Town of Concord, Municipal Purpose Loan GO, 4.00%, 9/15/2019 | | | 20,000 | | | | 20,268 | |
| | |
Town of Dartmouth GO, 4.00%, 4/15/2020 | | | 20,000 | | | | 20,535 | |
| | |
Town of Hingham, Municipal Purpose Loan Series 2009A, GO, 4.00%, 4/15/2019 | | | 20,000 | | | | 20,058 | |
| | |
Town of Natick, Municipal Purpose Loan GO, 4.00%, 6/15/2019 | | | 35,000 | | | | 35,249 | |
| | | | | | | | |
| | |
| | | | | | | 328,019 | |
| | | | | | | | |
| | |
Hospital — 0.5% | | | | | | | | |
| | |
Massachusetts Development Finance Agency, Umass Memorial Health Care Obligated Group Series I, Rev., 5.00%, 7/1/2022 | | | 245,000 | | | | 267,234 | |
| | |
Massachusetts Health and Educational Facilities Authority, Partners Healthcare System Series I-3, Rev., 4.00%, 7/1/2019 | | | 50,000 | | | | 50,379 | |
| | | | | | | | |
| | |
| | | | | | | 317,613 | |
| | | | | | | | |
| | |
Prerefunded — 0.2% | | | | | | | | |
| | |
Massachusetts Clean Water Trust (The), State Revolving Fund Series 14, Rev., 5.00%, 8/1/2019 (c) | | | 25,000 | | | | 25,347 | |
| | |
Massachusetts State College Building Authority Series A, Rev., 5.50%, 5/1/2019 (c) | | | 25,000 | | | | 25,155 | |
| | |
Town of Braintree, Municipal Purpose Loan GO, 5.00%, 5/15/2019 (c) | | | 25,000 | | | | 25,168 | |
| | |
University of Massachusetts Building Authority Series 2009-1, Rev., 5.00%, 5/1/2019 (c) | | | 20,000 | | | | 20,108 | |
| | | | | | | | |
| | |
| | | | | | | 95,778 | |
| | | | | | | | |
| | |
Transportation — 0.3% | | | | | | | | |
| | |
Massachusetts Bay Transportation Authority Series A, Rev., 5.00%, 7/1/2019 | | | 60,000 | | | | 60,673 | |
| | |
Massachusetts Bay Transportation Authority, Sales Tax | | | | | | | | |
| | |
Series D, Rev., 5.00%, 7/1/2019 | | | 45,000 | | | | 45,505 | |
| | |
Series C, Rev., 5.50%, 7/1/2019 | | | 50,000 | | | | 50,642 | |
| | |
Series C, Rev., 5.00%, 7/1/2020 | | | 25,000 | | | | 26,130 | |
| | | | | | | | |
| | |
| | | | | | | 182,950 | |
| | | | | | | | |
| | |
Total Massachusetts | | | | | | | 924,360 | |
| | | | | | | | |
SEE NOTES TO FINANCIAL STATEMENTS.
| | | | | | |
| | | |
| 126 | | | | J.P. MORGAN EXCHANGE-TRADED FUNDS | | FEBRUARY 28, 2019 |
| | | | | | | | |
| INVESTMENTS | | PRINCIPAL
AMOUNT ($) | | | VALUE ($) | |
Municipal Bonds — continued | |
|
Michigan — 2.8% | |
| | |
Education — 0.0% (b) | | | | | | | | |
| | |
Michigan State University Series C, Rev., 4.00%, 8/15/2019 | | | 20,000 | | | | 20,193 | |
| | | | | | | | |
| | |
General Obligation — 1.4% | | | | | | | | |
| | |
Adrian City School District, County of Lenawee GO, Q-SBLF, 3.00%, 5/1/2019 | | | 20,000 | | | | 20,042 | |
| | |
County of Kent GO, 5.00%, 1/1/2021 | | | 110,000 | | | | 116,596 | |
| | |
Hastings Area School System, School Building GO, Q-SBLF, 5.00%, 5/1/2019 | | | 20,000 | | | | 20,105 | |
| | |
Lansing School District GO, Q-SBLF, 5.00%, 5/1/2019 | | | 30,000 | | | | 30,154 | |
| | |
Novi Community School District, School Building and Site Bonds Series I, GO, 4.00%, 5/1/2021 | | | 25,000 | | | | 26,165 | |
| | |
Port Huron Area School District, School Building and Site GO, 4.00%, 5/1/2019 | | | 50,000 | | | | 50,182 | |
| | |
State of Michigan, Reeths Puffer Schools GO, 2.75%, 8/20/2019 | | | 525,000 | | | | 526,738 | |
| | |
Wayne County, Westland Community Schools GO, Q-SBLF, 5.00%, 5/1/2019 | | | 25,000 | | | | 25,132 | |
| | | | | | | | |
| | |
| | | | | | | 815,114 | |
| | | | | | | | |
|
Hospital — 0.9% | |
| | |
Michigan Finance Authority, Beaumont Health Credit Group Series 2015-A, Rev., 4.00%, 8/1/2019 | | | 145,000 | | | | 146,318 | |
| | |
Michigan Finance Authority, Henry Ford Health System Rev., 5.00%, 11/15/2020 | | | 120,000 | | | | 126,217 | |
| | |
Michigan State Hospital Finance Authority, Ascension Health Series 2010 F-1, Rev., VAR, 4.00%, 6/1/2023 (d) | | | 50,000 | | | | 53,872 | |
| | |
Michigan State Hospital Finance Authority, Mclaren Health Care Series 2012A, Rev., 5.00%, 6/1/2019 | | | 135,000 | | | | 136,050 | |
| | |
Royal Oak Hospital Finance Authority, William Beaumont Hospital Obligated Group Series 2014D, Rev., 5.00%, 9/1/2020 | | | 25,000 | | | | 26,174 | |
| | | | | | | | |
| | |
| | | | | | | 488,631 | |
| | | | | | | | |
|
Housing — 0.0% (b) | |
| | |
Michigan State Housing Development Authority Series A, Rev., 4.50%, 4/1/2019 | | | 25,000 | | | | 25,046 | |
| | | | | | | | |
|
Other Revenue — 0.3% | |
| | |
Michigan State Building Authority, Facilities Program Series I, Rev., 5.00%, 4/15/2021 | | | 100,000 | | | | 106,978 | |
| | | | | | | | |
| INVESTMENTS | | PRINCIPAL
AMOUNT ($) | | | VALUE ($) | |
| | | | | | | | |
|
Other Revenue — continued | |
| | |
State of Michigan Rev., GAN, 5.00%, 3/15/2020 | | | 75,000 | | | | 77,489 | |
| | | | | | | | |
| | |
| | | | | | | 184,467 | |
| | | | | | | | |
|
Transportation — 0.2% | |
| | |
Wayne County Airport Authority, Junior Lien Series 2017A, Rev., 5.00%, 12/1/2020 | | | 100,000 | | | | 105,491 | |
| | | | | | | | |
| | |
Total Michigan | | | | | | | 1,638,942 | |
| | | | | | | | |
|
Minnesota — 1.5% | |
| | |
Education — 0.1% | | | | | | | | |
| | |
Minnesota Higher Education Facilities Authority, St. Olaf College Series 8-G, Rev., 5.00%, 12/1/2019 | | | 25,000 | | | | 25,622 | |
| | |
Minnesota Higher Education Facilities Authority, University of St. Thomas Rev., 5.00%, 4/1/2019 | | | 25,000 | | | | 25,061 | |
| | | | | | | | |
| | |
| | | | | | | 50,683 | |
| | | | | | | | |
| | |
General Obligation — 0.2% | | | | | | | | |
| | |
City of Pipestone Series A, GO, 3.00%, 2/1/2020 | | | 80,000 | | | | 80,838 | |
| | |
State of Minnesota Series A, GO, 5.00%, 12/1/2019 | | | 25,000 | | | | 25,618 | |
| | |
State of Minnesota, Trunk Highway Series E, GO, 5.00%, 8/1/2020 | | | 35,000 | | | | 36,637 | |
| | | | | | | | |
| | |
| | | | | | | 143,093 | |
| | | | | | | | |
| | |
Housing — 0.2% | | | | | | | | |
| | |
Housing and Redevelopment Authority of The City of St Paul Minnesota, Millberry Apartments Project Series 2018A, Rev., VAR, 2.15%, 3/1/2020 (d) | | | 100,000 | | | | 100,033 | |
| | | | | | | | |
| | |
Prerefunded — 0.1% | | | | | | | | |
| | |
City of St Louis Park, Health Care Facilities, Park Nicollet Health Services Rev., 5.50%, 7/1/2019 (c) | | | 20,000 | | | | 20,248 | |
| | |
State of Minnesota 911 Services, Public Safety Radio Communications System Rev., AGC, 5.00%, 6/1/2019 (c) | | | 25,000 | | | | 25,203 | |
| | | | | | | | |
| | |
| | | | | | | 45,451 | |
| | | | | | | | |
| | |
Transportation — 0.0% (b) | | | | | | | | |
| | |
Minneapolis-St Paul Metropolitan Airports Commission, Subordinate Airport Series C, Rev., 5.00%, 1/1/2020 | | | 20,000 | | | | 20,546 | |
| | | | | | | | |
| | |
Utility — 0.0% (b) | | | | | | | | |
| | |
Minnesota Municipal Power Agency Series 2010A, Rev., 5.00%, 10/1/2019 | | | 25,000 | | | | 25,470 | |
| | | | | | | | |
SEE NOTES TO FINANCIAL STATEMENTS.
| | | | | | | | |
| | | |
| FEBRUARY 28, 2019 | | J.P. MORGAN EXCHANGE-TRADED FUNDS | | | | | 127 | |
JPMorgan Ultra-Short Municipal Income ETF
SCHEDULE OF PORTFOLIO INVESTMENTS
AS OF FEBRUARY 28, 2019 (continued)
| | | | | | | | |
| INVESTMENTS | | PRINCIPAL
AMOUNT ($) | | | VALUE ($) | |
Municipal Bonds — continued | |
| | |
Water & Sewer — 0.9% | | | | | | | | |
| | |
Minnesota Rural Water Finance Authority, Inc., Public Projects Construction Rev., 2.00%, 8/1/2020 | | | 500,000 | | | | 500,060 | |
| | | | | | | | |
| | |
Total Minnesota | | | | | | | 885,336 | |
| | | | | | | | |
|
Mississippi — 0.2% | |
| | |
Water & Sewer — 0.2% | | | | | | | | |
| | |
Mississippi Development Bank Special Obligation, Water and Sewer System Project Rev., AGM, 3.00%, 12/1/2020 | | | 100,000 | | | | 102,147 | |
| | | | | | | | |
|
Missouri — 1.5% | |
| | |
Education — 0.0% (b) | | | | | | | | |
| | |
Health and Educational Facilities Authority of the State of Missouri, Lutheran Senior Services Projects Series 2016A, Rev., 4.00%, 2/1/2020 | | | 20,000 | | | | 20,220 | |
| | | | | | | | |
|
General Obligation — 0.5% | |
| | |
Columbia School District GO, 4.00%, 3/1/2020 | | | 25,000 | | | | 25,584 | |
| | |
Fort Osage School District No. R-1, Direct Deposit Program GO, 3.00%, 3/1/2019 | | | 105,000 | | | | 105,010 | |
| | |
North St. Francois County School District No. R-I, Missouri Direct Deposit Program GO, 5.00%, 3/1/2034 | | | 140,000 | | | | 140,035 | |
| | | | | | | | |
| | |
| | | | | | | 270,629 | |
| | | | | | | | |
|
Hospital — 0.2% | |
| | |
Missouri State Health and Educational Facilities Authority, Children’s Mercy Hospital Rev., 4.63%, 5/15/2019 | | | 100,000 | | | | 100,550 | |
| | | | | | | | |
|
Industrial Development Revenue/Pollution Control Revenue — 0.0%(b) | |
| | |
Kansas City Industrial Development Authority, Downtown Redevelopment District Series A, Rev., 5.00%, 9/1/2019 | | | 35,000 | | | | 35,541 | |
| | | | | | | | |
|
Other Revenue — 0.2% | |
| | |
City of Columbia Rev., 5.00%, 2/1/2020 | | | 25,000 | | | | 25,752 | |
| | |
County of Jackson Rev., 4.00%, 12/1/2019 | | | 70,000 | | | | 71,179 | |
| | | | | | | | |
| | |
| | | | | | | 96,931 | |
| | | | | | | | |
|
Utility — 0.6% | |
| | |
City of Springfield, Public Utility Rev., 5.00%, 8/1/2019 | | | 40,000 | | | | 40,546 | |
| | |
County of Jackson, Harry S. Truman Sports Complex Project Rev., 5.00%, 12/1/2019 | | | 275,000 | | | | 281,441 | |
| | |
Missouri Joint Municipal Electric Utility Commission Series 2014A, Rev., 5.00%, 1/1/2020 | | | 20,000 | | | | 20,517 | |
| | | | | | | | |
| | |
| | | | | | | 342,504 | |
| | | | | | | | |
| | |
Total Missouri | | | | | | | 866,375 | |
| | | | | | | | |
| | | | | | | | |
| INVESTMENTS | | PRINCIPAL
AMOUNT ($) | | | VALUE ($) | |
| | | | | | | | |
|
Nebraska — 1.2% | |
| | |
General Obligation — 0.0%(b) | | | | | | | | |
| | |
City of Omaha GO, 5.25%, 4/1/2021 | | | 25,000 | | | | 26,852 | |
| | | | | | | | |
| | |
Utility — 1.2% | | | | | | | | |
| | |
Central Plains Energy Project, Gas Supply Rev., LIQ: Royal Bank of Canada, 5.00%, 12/1/2019 (d) | | | 550,000 | | | | 561,676 | |
| | |
Nebraska Public Power District Series A, Rev., 5.00%, 1/1/2021 | | | 50,000 | | | | 52,970 | |
| | |
Norris Public Power District, Electric System Series 2011B, Rev., 4.00%, 1/1/2020 | | | 50,000 | | | | 50,845 | |
| | | | | | | | |
| | |
| | | | | | | 665,491 | |
| | | | | | | | |
| | |
Total Nebraska | | | | | | | 692,343 | |
| | | | | | | | |
|
Nevada — 0.4% | |
| | |
Education — 0.0% (b) | | | | | | | | |
| | |
Nevada System of Higher Education Series B, Rev., 4.00%, 7/1/2019 | | | 25,000 | | | | 25,184 | |
| | | | | | | | |
| | |
General Obligation — 0.3% | | | | | | | | |
| | |
City of North Las Vegas, Water and Sewer Series B, GO, AMBAC, 4.00%, 8/1/2019 | | | 75,000 | | | | 75,052 | |
| | |
County of Clark GO, 5.00%, 6/1/2020 | | | 25,000 | | | | 26,037 | |
| | |
Las Vegas Valley Water District, Limited Tax Series 2009D, GO, 5.00%, 6/1/2019 (c) | | | 30,000 | | | | 30,249 | |
| | |
State of Nevada, Capital Improvement Series A, GO, 5.00%, 5/1/2019 | | | 25,000 | | | | 25,134 | |
| | |
State of Nevada, Capital Improvement and Cultural Affairs Series 2012B, GO, 5.00%, 8/1/2021 | | | 30,000 | | | | 32,352 | |
| | | | | | | | |
| | |
| | | | | | | 188,824 | |
| | | | | | | | |
| |
Prerefunded — 0.1% | | | | | |
| | |
Washoe County School District, Limited Tax, School Improvement Series 2011-A, GO, 5.00%, 6/1/2021 (c) | | | 40,000 | | | | 42,900 | |
| | | | | | | | |
| | |
Total Nevada | | | | | | | 256,908 | |
| | | | | | | | |
|
New Hampshire — 2.0% | |
| | |
Education — 1.7% | | | | | | | | |
| | |
New Hampshire Health and Education Facilities Authority, Dartmouth College Series B, Rev., VRDO, LIQ: Bank of New York Mellon, 1.65%, 3/1/2019 (d) | | | 1,000,000 | | | | 1,000,000 | |
| | | | | | | | |
| | |
Prerefunded — 0.0% (b) | | | | | | | | |
| | |
New Hampshire Health and Education Facilities Authority Act, University System Series A, Rev., 4.50%, 7/1/2019 (c) | | | 25,000 | | | | 25,233 | |
| | | | | | | | |
| | |
Transport — 0.3% | | | | | | | | |
| | |
State of New Hampshire, Federal Highway Rev., GAN, 5.00%, 9/1/2019 | | | 155,000 | | | | 157,508 | |
| | | | | | | | |
| | |
Total New Hampshire | | | | | | | 1,182,741 | |
| | | | | | | | |
SEE NOTES TO FINANCIAL STATEMENTS.
| | | | | | |
| | | |
| 128 | | | | J.P. MORGAN EXCHANGE-TRADED FUNDS | | FEBRUARY 28, 2019 |
| | | | | | | | |
| INVESTMENTS | | PRINCIPAL
AMOUNT ($) | | | VALUE ($) | |
Municipal Bonds — continued | |
|
New Jersey — 7.2% | |
| | |
Education — 0.8% | | | | | | | | |
| | |
New Jersey Economic Development Authority, School Facilities Construction Rev., 5.00%, 3/1/2020 | | | 390,000 | | | | 400,748 | |
| | |
Rutgers The State University of New Jersey Series 2010I, Rev., 4.00%, 5/1/2019 | | | 35,000 | | | | 35,130 | |
| | | | | | | | |
| | |
| | | | | | | 435,878 | |
| | | | | | | | |
| | |
General Obligation — 6.0% | | | | | | | | |
| | |
Bernards Township School District Series 2013B, GO, 5.00%, 1/1/2021 | | | 20,000 | | | | 21,277 | |
| | |
Borough of Oakland GO, BAN, 3.25%, 12/13/2019 | | | 251,000 | | | | 253,412 | |
| | |
Borough of Ridgefield GO, BAN, 3.00%, 10/17/2019 | | | 900,000 | | | | 905,940 | |
| | |
City of Orange Township GO, 3.00%, 12/5/2019 | | | 300,000 | | | | 302,061 | |
| | |
City of Somers Point GO, BAN, 3.00%, 12/3/2019 | | | 300,000 | | | | 302,130 | |
| | |
City of Woodbury, Water and Sewer Utility GO, 2.00%, 5/1/2020 | | | 45,000 | | | | 45,162 | |
| | |
Township of Clark GO, BAN, 3.00%, 10/4/2019 | | | 900,000 | | | | 906,120 | |
| | |
Township of West Deptford GO, BAN, 2.75%, 4/10/2019 | | | 750,000 | | | | 750,653 | |
| | | | | | | | |
| | |
| | | | | | | 3,486,755 | |
| | | | | | | | |
|
Industrial Development Revenue/Pollution Control Revenue — 0.2% | |
| | |
New Jersey Economic Development Authority Rev., NATL-RE, 0.00%, 3/15/2019 | | | 50,000 | | | | 49,969 | |
| | |
New Jersey Economic Development Authority, School Facilities Construction Series PP, Rev., 5.00%, 6/15/2019 | | | 35,000 | | | | 35,273 | |
| | | | | | | | |
| | |
| | | | | | | 85,242 | |
| | | | | | | | |
|
Other Revenue — 0.2% | |
| | |
Garden State Preservation Trust Series C, Rev., AGM, 5.13%, 11/1/2019 | | | 35,000 | | | | 35,769 | |
| | |
New Jersey Building Authority, Unrefunded Balance Series A, Rev., 5.00%, 6/15/2019 | | | 45,000 | | | | 45,351 | |
| | |
Tobacco Settlement Financing Corp. Series A, Rev., 5.00%, 6/1/2020 | | | 25,000 | | | | 25,885 | |
| | | | | | | | |
| | |
| | | | | | | 107,005 | |
| | | | | | | | |
| | |
Transportation — 0.0% (b) | | | | | | | | |
| | |
New Jersey Transportation Trust Fund Authority, Transportation System Series B, Rev., NATL-RE, 5.50%, 12/15/2019 | | | 20,000 | | | | 20,551 | |
| | | | | | | �� | |
| | |
Total New Jersey | | | | | | | 4,135,431 | |
| | | | | | | | |
| | | | | | | | |
| INVESTMENTS | | PRINCIPAL
AMOUNT ($) | | | VALUE ($) | |
| | | | | | | | |
|
New Mexico — 1.6% | |
| | |
General Obligation — 0.1% | | | | | | | | |
| | |
County of Bernalillo GO, 5.00%, 8/15/2019 | | | 55,000 | | | | 55,825 | |
| | | | | | | | |
| | |
Housing — 0.5% | | | | | | | | |
| | |
County of Bernalillo, Arroyo Vista Apartments Project Rev., 1.40%, 3/1/2020 (d) | | | 300,000 | | | | 300,000 | |
| | | | | | | | |
| | | | | | | | |
| | |
Other Revenue — 0.5% | | | | | | | | |
| | |
City of Farmington, Southern California Edison Co. Four Corners Project Series A, Rev., VAR, 1.87%, 4/1/2020 (d) | | | 210,000 | | | | 207,850 | |
| | |
New Mexico Finance Authority, Senior Lien Public Project Revolving Fund Series 2013-A, Rev., 4.00%, 6/1/2021 | | | 20,000 | | | | 21,009 | |
| | |
State of New Mexico, Severance Tax Permanent Fund | | | | | | | | |
| | |
Series B, Rev., 4.00%, 7/1/2019 | | | 25,000 | | | | 25,189 | |
| | |
Series A, Rev., 5.00%, 7/1/2020 | | | 20,000 | | | | 20,868 | |
| | | | | | | | |
| | |
| | | | | | | 274,916 | |
| | | | | | | | |
| | |
Utility — 0.5% | | | | | | | | |
| | |
New Mexico Finance Authority, Senior Lien Public Project Revolving Fund Series 2018-A, Rev., 5.00%, 6/1/2019 | | | 180,000 | | | | 181,451 | |
| | |
New Mexico Municipal Energy Acquisition Authority Subseries A, Rev., VAR, LIQ: Royal Bank of Canada, 5.00%, 8/1/2019 (d) | | | 100,000 | | | | 101,184 | |
| | | | | | | | |
| | |
| | | | | | | 282,635 | |
| | | | | | | | |
| | |
Total New Mexico | | | | | | | 913,376 | |
| | | | | | | | |
|
New York — 20.6% | |
| | |
Education — 0.2% | | | | | | | | |
| | |
New York State Dormitory Authority, City University System, Fifth General Resolution Class A, Rev., 5.00%, 7/1/2019 | | | 20,000 | | | | 20,222 | |
| | |
New York State Dormitory Authority, General Purpose | | | | | | | | |
| | |
Series 2016D, Rev., 5.00%, 2/15/2020 | | | 25,000 | | | | 25,801 | |
| | |
Series 2017A, Rev., 5.00%, 2/15/2020 | | | 35,000 | | | | 36,121 | |
| | |
Series 2011A, Rev., 5.00%, 3/15/2020 | | | 25,000 | | | | 25,871 | |
| | |
Yonkers Industrial Development Agency, Sarah Lawrence College Project Series A, Rev., 5.00%, 6/1/2019 (c) | | | 25,000 | | | | 25,209 | |
| | | | | | | | |
| | |
| | | | | | | 133,224 | |
| | | | | | | | |
| | |
General Obligation — 14.0% | | | | | | | | |
| | |
City of Albany GO, BAN, 2.75%, 6/28/2019 | | | 80,000 | | | | 80,265 | |
SEE NOTES TO FINANCIAL STATEMENTS.
| | | | | | | | |
| | | |
| FEBRUARY 28, 2019 | | J.P. MORGAN EXCHANGE-TRADED FUNDS | | | | | 129 | |
JPMorgan Ultra-Short Municipal Income ETF
SCHEDULE OF PORTFOLIO INVESTMENTS
AS OF FEBRUARY 28, 2019 (continued)
| | | | | | | | |
| INVESTMENTS | | PRINCIPAL
AMOUNT ($) | | | VALUE ($) | |
Municipal Bonds — continued | |
| | |
General Obligation — continued | | | | | | | | |
| | |
City of New York, Fiscal Year 2019 Series D, Subseries D-4, GO, VRDO, LIQ: Barclays Bank plc, 1.70%, 3/1/2019 (d) | | | 1,500,000 | | | | 1,500,000 | |
| | |
City of Syracuse, Public Improvement Series A, GO, 5.00%, 3/1/2019 | | | 25,000 | | | | 25,007 | |
| | |
City of Troy GO, BAN, 3.00%, 2/7/2020 | | | 1,000,000 | | | | 1,011,850 | |
| | |
County of Montgomery GO, BAN, 3.00%, 10/11/2019 | | | 900,000 | | | | 906,381 | |
| | |
County of Nassau | | | | | | | | |
| | |
Series B, GO, BAN, 4.00%, 5/15/2019 | | | 285,000 | | | | 286,280 | |
| | |
Series C, GO, BAN, 4.00%, 12/10/2019 | | | 325,000 | | | | 330,635 | |
| | |
County of Onondaga Series A, GO, 5.00%, 3/1/2020 | | | 45,000 | | | | 45,000 | |
| | |
County of Rockland GO, TAN, 3.00%, 4/2/2019 | | | 430,000 | | | | 430,426 | |
| | |
County of Suffolk GO, TAN, 5.00%, 7/24/2019 | | | 100,000 | | | | 101,188 | |
| | |
East Quogue Union Free School District GO, TAN, 3.00%, 6/21/2019 | | | 500,000 | | | | 501,830 | |
| | |
Plainedge Union Free School District Series B, GO, 4.00%, 6/15/2019 | | | 20,000 | | | | 20,143 | |
| | |
Town of Colonie | | | | | | | | |
| | |
Series 2017B, GO, 3.00%, 4/1/2019 | | | 780,000 | | | | 780,897 | |
| | |
GO, BAN, 3.00%, 3/13/2020 (f) | | | 1,000,000 | | | | 1,011,420 | |
| | |
Town of Thompson GO, 3.00%, 3/15/2019 | | | 100,000 | | | | 99,999 | |
| | |
Village of Clayton GO, BAN, 2.75%, 2/13/2020 | | | 680,000 | | | | 685,039 | |
| | |
West Hempstead Union Free School District GO, BAN, 2.75%, 6/14/2019 | | | 250,000 | | | | 250,855 | |
| | | | | | | | |
| | |
| | | | | | | 8,067,215 | |
| | | | | | | | |
| | |
Hospital — 0.1% | | | | | | | | |
| | |
Erie County Fiscal Stability Authority, Catholic Healthcare Partners Series 2010C, Rev., 5.25%, 3/15/2019 | | | 20,000 | | | | 20,023 | |
| | |
Nassau County Local Economic Assistance Corp., Catholic Health Services, Long Island Obligated Group Project Rev., 5.00%, 7/1/2019 | | | 20,000 | | | | 20,191 | |
| | | | | | | | |
| | |
| | | | | | | 40,214 | |
| | | | | | | | |
| | |
Other Revenue — 3.9% | | | | | | | | |
| | |
Erie County Fiscal Stability Authority, Sales Tax Series C, Rev., 4.13%, 3/15/2019 | | | 25,000 | | | | 25,020 | |
| | |
New York City Transitional Finance Authority, Future Tax Secured, Fiscal Year 2003 Subseries C4, Rev., VRDO, LIQ: Landesbank Hessen-Thueringen 1.71%, 3/1/2019 (d) | | | 1,500,000 | | | | 1,500,000 | |
| | | | | | | | |
| INVESTMENTS | | PRINCIPAL
AMOUNT ($) | | | VALUE ($) | |
| | | | | | | | |
| | |
Other Revenue — continued | | | | | | | | |
| | |
Tender Option Bond Trust Receipts/Certificates Series 2018-XM0697, Rev., VRDO, LIQ: Bank of America NA, 1.89%, 3/7/2019 (d) (e) | | | 750,000 | | | | 750,000 | |
| | | | | | | | |
| | |
| | | | | | | 2,275,020 | |
| | | | | | | | |
| | |
Prerefunded — 0.0% (b) | | | | | | | | |
| | |
New York State Dormitory Authority Series B, Rev., 5.00%, 3/15/2019 (c) | | | 20,000 | | | | 20,021 | |
| | | | | | | | |
| | |
Transportation — 2.3% | | | | | | | | |
| | |
Metropolitan Transportation Authority | | | | | | | | |
| | |
Series 2019A, Rev., BAN, 4.00%, 2/3/2020 | | | 1,000,000 | | | | 1,017,921 | |
| | |
Subseries 2018B-2B, Rev., BAN, 5.00%, 5/15/2021 | | | 200,000 | | | | 212,788 | |
| | |
Subseries 2008B-4, Rev., 5.00%, 11/15/2021 | | | 20,000 | | | | 21,825 | |
| | |
Metropolitan Transportation Authority, Dedicated Tax Fund Series A, Rev., 5.00%, 11/15/2020 | | | 50,000 | | | | 52,899 | |
| | |
New York State Thruway Authority, Local Highway and Bridge Service Contract Rev., 4.00%, 4/1/2019 | | | 35,000 | | | | 35,064 | |
| | | | | | | | |
| | |
| | | | | | | 1,340,497 | |
| | | | | | | | |
| | |
Water & Sewer — 0.1% | | | | | | | | |
| | |
New York City Water and Sewer System, Second General Resolution Series EE, Rev., 4.00%, 6/15/2019 | | | 25,000 | | | | 25,175 | |
| | | | | | | | |
| | |
Total New York | | | | | | | 11,901,366 | |
| | | | | | | | |
|
North Carolina — 5.2% | |
|
Certificate of Participation/Lease — 2.6% | |
| | |
City of Raleigh, Downtown Improvement Projects Series A, COP, VRDO, LIQ: Wells Fargo Bank NA, 1.75%, 3/7/2019 (d) | | | 1,500,000 | | | | 1,500,000 | |
| | | | | | | | |
|
Education — 0.1% | |
| | |
Western Carolina University, Limited Obligation Rev., 4.00%, 6/1/2019 | | | 35,000 | | | | 35,178 | |
| | | | | | | | |
|
General Obligation — 0.1% | |
| | |
County of Carteret GO, 4.00%, 4/1/2019 | | | 25,000 | | | | 25,044 | |
| | |
County of Durham GO, 5.00%, 11/1/2019 | | | 20,000 | | | | 20,442 | |
| | |
County of Union Series A, GO, 5.00%, 3/1/2019 | | | 40,000 | | | | 40,011 | |
| | | | | | | | |
| | |
| | | | | | | 85,497 | |
| | | | | | | | |
| | |
Hospital — 2.1% | | | | | | | | |
| | |
North Carolina Medical Care Commission, Baptist Hospital Rev., 4.00%, 6/1/2019 | | | 25,000 | | | | 25,131 | |
SEE NOTES TO FINANCIAL STATEMENTS.
| | | | | | |
| | | |
| 130 | | | | J.P. MORGAN EXCHANGE-TRADED FUNDS | | FEBRUARY 28, 2019 |
| | | | | | | | |
| INVESTMENTS | | PRINCIPAL
AMOUNT ($) | | | VALUE ($) | |
Municipal Bonds — continued | |
| | |
Hospital — continued | | | | | | | | |
| | |
North Carolina Medical Care Commission, Firsthealth Carolinas Series A, Rev., VRDO, LIQ: Branch Banking & Trust, 1.75%, 3/7/2019 (d) | | | 1,000,000 | | | | 1,000,000 | |
| | |
North Carolina Medical Care Commission, Health Care Facilities, Wake Forest Baptist Obligated Group Series 2012-B, Rev., 5.00%, 12/1/2020 | | | 205,000 | | | | 215,994 | |
| | | | | | | | |
| | |
| | | | | | | 1,241,125 | |
| | | | | | | | |
| | |
Other Revenue — 0.1% | | | | | | | | |
| | |
City of Kannapolis Rev., 4.00%, 4/1/2019 | | | 50,000 | | | | 50,086 | |
| | | | | | | | |
| | |
Transport — 0.2% | | | | | | | | |
| | |
State of North Carolina, Vehicle Bonds Rev., 5.00%, 3/1/2019 | | | 100,000 | | | | 100,027 | |
| | | | | | | | |
| | |
Total North Carolina | | | | | | | 3,011,913 | |
| | | | | | | | |
|
North Dakota — 0.3% | |
|
Utility — 0.3% | |
| | |
City of Grand Forks, The Alerus Project Series D, Rev., 5.00%, 12/15/2019 | | | 150,000 | | | | 153,873 | |
| | | | | | | | |
|
Ohio — 8.5% | |
|
Education — 0.2% | |
| | |
Bowling Green State University Series 2017B, Rev., 5.00%, 6/1/2020 | | | 35,000 | | | | 36,365 | |
| | |
Ohio Higher Educational Facility Commission, Baldwin Wallace University 2012 Project Rev., 4.00%, 12/1/2019 | | | 50,000 | | | | 50,752 | |
| | | | | | | | |
| | |
| | | | | | | 87,117 | |
| | | | | | | | |
|
General Obligation — 0.9% | |
| | |
City of Columbus | | | | | | | | |
| | |
Series 2010-A, GO, 5.00%, 6/1/2019 | | | 25,000 | | | | 25,203 | |
| | |
Series 2015A, GO, 5.00%, 7/1/2019 | | | 40,000 | | | | 40,436 | |
| | |
City of Miamisburg, Various Purpose GO, BAN, 3.00%, 6/25/2019 | | | 100,000 | | | | 100,419 | |
| | |
City of Oxford, Aquatic Center GO, BAN, 3.00%, 6/11/2019 | | | 125,000 | | | | 125,454 | |
| | |
City of Reynoldsburg GO, 5.00%, 12/1/2020 | | | 60,000 | | | | 63,437 | |
| | |
Geauga County Public Library, Unlimited Tax Series A, GO, 3.00%, 12/1/2019 | | | 50,000 | | | | 50,498 | |
| | |
State of Ohio, Common Schools Series C, GO, 5.00%, 9/15/2019 | | | 25,000 | | | | 25,446 | |
| | |
State of Ohio, Higher Education Series 2009C, GO, 5.00%, 8/1/2019 | | | 25,000 | | | | 25,343 | |
| | |
State of Ohio, Infrastructure Improvement Bonds Series A, GO, 5.00%, 9/1/2020 | | | 45,000 | | | | 47,218 | |
| | | | | | | | |
| INVESTMENTS | | PRINCIPAL
AMOUNT ($) | | | VALUE ($) | |
| | | | | | | | |
|
General Obligation — continued | |
| | |
Vinton County Local School District, Galloa, Hocking and Jackson Counties Series A, GO, 2.00%, 12/1/2019 | | | 45,000 | | | | 45,073 | |
| | | | | | | | |
| | |
| | | | | | | 548,527 | |
| | | | | | | | |
| | |
Hospital — 7.0% | | | | | | | | |
| | |
County of Allen, Catholic Healthcare Partners | | | | | | | | |
| | |
Series 2010B, Rev., 5.00%, 9/1/2019 | | | 170,000 | | | | 172,623 | |
| | |
Series 2012A, Rev., 5.00%, 5/1/2021 | | | 85,000 | | | | 90,564 | |
| | |
County of Allen, Hospital Facilities, Catholic Healthcare Partners | | | | | | | | |
| | |
Series C, Rev., VRDO, LOC: Union Bank NA, 1.72%, 3/1/2019 (d) | | | 1,485,000 | | | | 1,485,000 | |
| | |
Series B, Rev., 4.13%, 9/1/2020 | | | 40,000 | | | | 41,324 | |
| | |
County of Allen, Hospital Facilities, Mercy Health Series A, Rev., 5.00%, 8/1/2021 | | | 480,000 | | | | 514,862 | |
| | |
County of Hamilton, Hospital Facilities, UC Health Rev., 5.00%, 2/1/2020 | | | 100,000 | | | | 102,723 | |
| | |
County of Lucas, Promedica Healthcare Obligated Group Series D, Rev., 5.00%, 11/15/2019 | | | 75,000 | | | | 76,238 | |
| | |
County of Montgomery, Premier Health Partners Obligated Group, Hospital Facilities Series 2016C, Rev., VRDO, LOC: Barclays Bank plc, 1.69%, 3/1/2019 (d) | | | 1,500,000 | | | | 1,500,000 | |
| | |
Ohio Higher Educational Facility Commission, Hospitals Health System Series A, Rev., 5.00%, 1/15/2020 | | | 75,000 | | | | 76,997 | |
| | | | | | | | |
| | |
| | | | | | | 4,060,331 | |
| | | | | | | | |
| | |
Other Revenue — 0.1% | | | | | | | | |
| | |
County of Hamilton Series 2016A, Rev., 5.00%, 12/1/2019 | | | 30,000 | | | | 30,737 | |
| | | | | | | | |
| | |
Prerefunded — 0.3% | | | | | | | | |
| | |
City of Barberton, Limited Tax, Various Purpose Improvement GO, AGC, 4.40%, 6/1/2019 (c) | | | 70,000 | | | | 70,469 | |
| | |
City of Cincinnati Series 2009B, GO, 4.00%, 6/1/2019 (c) | | | 45,000 | | | | 45,258 | |
| | |
City of Mentor, Various Purpose GO, 4.50%, 12/1/2019 (c) | | | 50,000 | | | | 51,050 | |
| | |
State of Ohio, Capital Facilities Lease-Appropriation Series 2013-B, Rev., 5.00%, 4/1/2021 (c) | | | 25,000 | | | | 26,695 | |
| | | | | | | | |
| | |
| | | | | | | 193,472 | |
| | | | | | | | |
| | |
Total Ohio | | | | | | | 4,920,184 | |
| | | | | | | | |
SEE NOTES TO FINANCIAL STATEMENTS.
| | | | | | | | |
| | | |
| FEBRUARY 28, 2019 | | J.P. MORGAN EXCHANGE-TRADED FUNDS | | | | | 131 | |
JPMorgan Ultra-Short Municipal Income ETF
SCHEDULE OF PORTFOLIO INVESTMENTS
AS OF FEBRUARY 28, 2019 (continued)
| | | | | | | | |
| INVESTMENTS | | PRINCIPAL
AMOUNT ($) | | | VALUE ($) | |
Municipal Bonds — continued | |
|
Oklahoma — 1.0% | |
| | |
General Obligation — 0.9% | | | | | | | | |
| | |
Oklahoma County Independent School District No. 12, Edmond School District GO, 3.00%, 3/1/2021 | | | 40,000 | | | | 40,940 | |
| | |
Payne County, Independent School District No. 16, Stillwater Board of Education Series B, GO, 3.00%, 6/1/2019 | | | 300,000 | | | | 300,939 | |
| | |
Tulsa County, Independent School District No. 1 Series B, GO, 2.00%, 1/1/2020 | | | 200,000 | | | | 200,530 | |
| | | | | | | | |
| | |
| | | | | | | 542,409 | |
| | | | | | | | |
| | |
Other Revenue — 0.1% | | | | | | | | |
| | |
Grand River Dam Authority Series 2014A, Rev., 4.00%, 6/1/2019 | | | 25,000 | | | | 25,145 | |
| | | | | | | | |
| | |
Water & Sewer — 0.0% (b) | | | | | | | | |
| | |
Oklahoma Water Resources Board, Clean Water Program Rev., 5.00%, 4/1/2019 | | | 20,000 | | | | 20,051 | |
| | | | | | | | |
| | |
Total Oklahoma | | | | | | | 587,605 | |
| | | | | | | | |
|
Pennsylvania — 2.4% | |
| | |
Education — 0.7% | | | | | | | | |
| | |
Allegheny County Higher Education Building Authority, Duquesne University of the Holy Spirit Rev., 5.00%, 3/1/2020 | | | 35,000 | | | | 36,095 | |
| | |
Montgomery County Higher Education and Health Authority, Arcadia University Rev., 4.00%, 4/1/2019 | | | 110,000 | | | | 110,127 | |
| | |
Pennsylvania State University Series B, Rev., VAR, 1.73%, 6/1/2019 (d) | | | 250,000 | | | | 250,063 | |
| | | | | | | | |
| | |
| | | | | | | 396,285 | |
| | | | | | | | |
| | |
General Obligation — 0.2% | | | | | | | | |
| | |
County of Delaware GO, 5.00%, 10/1/2020 | | | 30,000 | | | | 31,537 | |
| | |
Palmyra Area School District GO, 3.00%, 5/1/2019 | | | 25,000 | | | | 25,046 | |
| | |
Parkland School District GO, 4.00%, 4/15/2021 | | | 30,000 | | | | 31,384 | |
| | |
Trinity Area School District GO, AGM, 4.00%, 11/1/2020 (c) | | | 30,000 | | | | 31,149 | |
| | | | | | | | |
| | |
| | | | | | | 119,116 | |
| | | | | | | | |
| | |
Hospital — 0.3% | | | | | | | | |
| | |
Beaver County Hospital Authority, Heritage Valley Health System, Inc. Rev., 5.00%, 5/15/2020 | | | 165,000 | | | | 170,790 | |
| | | | | | | | |
|
Industrial Development Revenue/Pollution Control Revenue — 0.3% | |
| | |
Pennsylvania Economic Development Financing Authority | | | | | | | | |
| | |
Series A, Rev., 5.00%, 7/1/2019 | | | 20,000 | | | | 20,223 | |
| | |
Series 2015B, Rev., 5.00%, 3/15/2020 | | | 25,000 | | | | 25,828 | |
| | | | | | | | |
| INVESTMENTS | | PRINCIPAL
AMOUNT ($) | | | VALUE ($) | |
| | | | | | | | |
|
Industrial Development Revenue/Pollution Control Revenue — continued | |
| | |
Pennsylvania Economic Development Financing Authority, Waste Management, Inc. Project Rev., 2.80%, 12/1/2021 (d) | | | 100,000 | | | | 100,968 | |
| | | | | | | | |
| | |
| | | | | | | 147,019 | |
| | | | | | | | |
| | |
Other Revenue — 0.0% (b) | | | | | | | | |
| | |
Monroeville Finance Authority Rev., 5.00%, 2/15/2020 | | | 25,000 | | | | 25,762 | |
| | | | | | | | |
| | |
Prerefunded — 0.3% | | | | | | | | |
| | |
County of Dauphin GO, 4.00%, 5/15/2019 (c) | | | 25,000 | | | | 25,119 | |
| | |
Pennsylvania Turnpike Commission, Motor License Fund-Enhanced Turnpike Series B, Rev., 5.00%, 12/1/2021 (c) | | | 50,000 | | | | 54,453 | |
| | |
South Fork Municipal Authority, Conemaugh Valley Memorial Hospital Series B, Rev., AGC, 5.38%, 7/1/2020 (c) | | | 30,000 | | | | 31,405 | |
| | |
University of Pittsburgh of the Commonwealth System of Higher Education Series B, Rev., 5.50%, 3/15/2019 (c) | | | 30,000 | | | | 30,036 | |
| | |
Washington County Industrial Development Authority, Washington Jefferson College Rev., 4.00%, 5/1/2020 (c) | | | 25,000 | | | | 25,682 | |
| | | | | | | | |
| | |
| | | | | | | 166,695 | |
| | | | | | | | |
| | |
Transportation — 0.3% | | | | | | | | |
| | |
Pennsylvania Turnpike Commission | | | | | | | | |
| | |
Rev., 5.00%, 6/1/2019 | | | 100,000 | | | | 100,752 | |
| | |
Series A, Rev., AGM, 5.25%, 7/15/2020 | | | 50,000 | | | | 52,371 | |
| | |
Philadelphia Airport Parking Authority Rev., 5.00%, 9/1/2019 | | | 40,000 | | | | 40,646 | |
| | | | | | | | |
| | |
| | | | | | | 193,769 | |
| | | | | | | | |
| | |
Utility — 0.1% | | | | | | | | |
| | |
Philadelphia Gas Works Co. Rev., 5.00%, 8/1/2019 | | | 55,000 | | | | 55,708 | |
| | | | | | | | |
| | |
Water & Sewer — 0.2% | | | | | | | | |
| | |
West Goshen Sewer Authority Rev., 3.00%, 5/1/2020 | | | 95,000 | | | | 96,541 | |
| | | | | | | | |
| | |
Total Pennsylvania | | | | | | | 1,371,685 | |
| | | | | | | | |
|
Rhode Island — 0.1% | |
| | |
Transportation — 0.1% | | | | | | | | |
| | |
Rhode Island Commerce Corp., Department of Transportation Series 2016A, Rev., 3.00%, 6/15/2019 | | | 40,000 | | | | 40,139 | |
| | | | | | | | |
SEE NOTES TO FINANCIAL STATEMENTS.
| | | | | | |
| | | |
| 132 | | | | J.P. MORGAN EXCHANGE-TRADED FUNDS | | FEBRUARY 28, 2019 |
| | | | | | | | |
| INVESTMENTS | | PRINCIPAL
AMOUNT ($) | | | VALUE ($) | |
Municipal Bonds — continued | |
|
South Carolina — 0.3% | |
| | |
Education — 0.0%(b) | | | | | | | | |
| | |
Charleston Educational Excellence Finance Corp., Installment Purchase Series 2013B, Rev., 5.00%, 12/1/2019 | | | 25,000 | | | | 25,611 | |
| | | | | | | | |
| | |
General Obligation — 0.1% | | | | | | | | |
| | |
Florence School District No. 1 GO, SCSDE, 5.00%, 3/1/2019 | | | 35,000 | | | | 35,010 | |
| | |
State of South Carolina, Highway Series A, GO, 5.00%, 10/1/2020 | | | 25,000 | | | | 26,321 | |
| | | | | | | | |
| | |
| | | | | | | 61,331 | |
| | | | | | | | |
| | |
Transportation — 0.1% | | | | | | | | |
| | |
South Carolina Transportation Infrastructure Bank Series A, Rev., 4.00%, 10/1/2019 | | | 55,000 | | | | 55,738 | |
| | | | | | | | |
| | |
Water & Sewer — 0.1% | | | | | | | | |
| | |
Anderson Regional Joint Water System Series 2011A, Rev., 5.00%, 7/15/2020 | | | 25,000 | | | | 26,110 | |
| | | | | | | | |
| | |
Total South Carolina | | | | | | | 168,790 | |
| | | | | | | | |
|
South Dakota — 0.2% | |
| | |
Hospital — 0.1% | | | | | | | | |
| | |
South Dakota Health and Educational Facilities Authority, Sanford Health Rev., 5.25%, 11/1/2019 | | | 50,000 | | | | 51,097 | |
| | | | | | | | |
|
Housing — 0.1% | |
| | |
South Dakota Board of Regents, Housing and Auxiliary Facility System Series A, Rev., 5.00%, 4/1/2021 | | | 70,000 | | | | 74,603 | |
| | | | | | | | |
| | |
Total South Dakota | | | | | | | 125,700 | |
| | | | | | | | |
|
Tennessee — 2.6% | |
| | |
General Obligation — 0.2% | | | | | | | | |
| | |
County of Shelby | | | | | | | | |
| | |
Series A, GO, 4.75%, 3/1/2019 | | | 40,000 | | | | 40,010 | |
| | |
Series A, GO, 4.00%, 3/1/2020 | | | 20,000 | | | | 20,471 | |
| | |
State of Tennessee Series A, GO, 5.00%, 9/1/2020 | | | 30,000 | | | | 31,503 | |
| | | | | | | | |
| | |
| | | | | | | 91,984 | |
| | | | | | | | |
| | |
Housing — 0.8% | | | | | | | | |
| | |
Metropolitan Government Nashville and Davidson County Health and Educational Facilities Board, Multifamily Housing, Dandridge Towers Project Rev., 1.87%, 7/1/2020 (d) | | | 495,000 | | | | 493,901 | |
| | | | | | | | |
| | |
Prerefunded — 1.6% | | | | | | | | |
| | |
Johnson City Health and Educational Facilities Board, Mountain States Health Alliance Series 2010-A, Rev., 6.50%, 7/1/2020 (c) | | | 850,000 | | | | 903,958 | |
| | | | | | | | |
| INVESTMENTS | | PRINCIPAL
AMOUNT ($) | | | VALUE ($) | |
| | | | | | | | |
| | |
Prerefunded — continued | | | | | | | | |
| | |
Tennessee State School Bond Authority, Higher Education Series A, Rev., 5.00%, 5/1/2019 (c) | | | 30,000 | | | | 30,161 | |
| | | | | | | | |
| | |
| | | | | | | 934,119 | |
| | | | | | | | |
| | |
Total Tennessee | | | | | | | 1,520,004 | |
| | | | | | | | |
|
Texas — 5.5% | |
| | |
Education — 0.6% | | | | | | | | |
| | |
Alamo Community College District, Financing System Senior lien Series 2012A, Rev., 5.00%, 11/1/2020 | | | 20,000 | | | | 21,073 | |
| | |
Austin Community College District, Combined Fee Series 2014A, Rev., 5.00%, 2/1/2021 | | | 25,000 | | | | 26,505 | |
| | |
Clifton Higher Education Finance Corp., Baylor University Rev., 5.00%, 3/1/2020 | | | 45,000 | | | | 46,418 | |
| | |
Counties of Harris and Fort Bend, Houston Community College System, Combined Fee Rev., 4.00%, 4/15/2019 | | | 25,000 | | | | 25,066 | |
| | |
Regents of the Texas State University System Rev., 5.00%, 3/15/2019 | | | 150,000 | | | | 150,150 | |
| | |
University of A&M Texas, Permanent University Fund Series A, Rev., 5.00%, 7/1/2020 | | | 35,000 | | | | 36,539 | |
| | |
University of Texas (The), Board of Regents, Financing System Series A, Rev., 5.00%, 8/15/2020 | | | 20,000 | | | | 20,958 | |
| | | | | | | | |
| | |
| | | | | | | 326,709 | |
| | | | | | | | |
| | |
General Obligation — 2.0% | | | | | | | | |
| | |
City of Baytown GO, 5.00%, 2/1/2020 | | | 40,000 | | | | 41,211 | |
| | |
City of Burleson GO, 4.00%, 3/1/2019 | | | 25,000 | | | | 25,005 | |
| | |
City of Dallas GO, 5.00%, 2/15/2021 | | | 75,000 | | | | 79,613 | |
| | |
City of Fort Worth, Tarrant, Denton, Parker and Wise Counties GO, 3.50%, 3/1/2020 | | | 35,000 | | | | 35,620 | |
| | |
City of Frisco GO, 5.00%, 2/15/2021 | | | 25,000 | | | | 26,577 | |
| | |
City of Grand Prairie, Combination Tax Series 2013A, GO, 5.00%, 2/15/2021 | | | 65,000 | | | | 69,108 | |
| | |
City of Houston, Public Improvement Series A, GO, 5.00%, 3/1/2020 | | | 20,000 | | | | 20,646 | |
| | |
City of Lewisville GO, 5.00%, 2/15/2021 | | | 25,000 | | | | 26,583 | |
| | |
City of Lubbock, Waterworks System GO, 5.00%, 2/15/2020 | | | 20,000 | | | | 20,625 | |
| | |
City of Paris GO, 4.50%, 12/15/2020 | | | 30,000 | | | | 31,468 | |
| | |
County of Bell, Limited Tax GO, 4.00%, 2/15/2020 | | | 375,000 | | | | 383,182 | |
| | |
County of Bexar, Certificates of Obligation | | | | | | | | |
| | |
Series B, GO, 5.00%, 6/15/2020 | | | 20,000 | | | | 20,854 | |
| | |
Series B, GO, 5.00%, 6/15/2021 | | | 20,000 | | | | 21,494 | |
SEE NOTES TO FINANCIAL STATEMENTS.
| | | | | | | | |
| | | |
| FEBRUARY 28, 2019 | | J.P. MORGAN EXCHANGE-TRADED FUNDS | | | | | 133 | |
JPMorgan Ultra-Short Municipal Income ETF
SCHEDULE OF PORTFOLIO INVESTMENTS
AS OF FEBRUARY 28, 2019 (continued)
| | | | | | | | |
| INVESTMENTS | | PRINCIPAL
AMOUNT ($) | | | VALUE ($) | |
Municipal Bonds — continued | | | | | | | | |
| | |
General Obligation — continued | | | | | | | | |
| | |
County of Chambers GO, 3.00%, 3/1/2020 | | | 150,000 | | | | 151,938 | |
| | |
County of Webb, Limited Tax Series A, GO, 4.00%, 2/15/2020 | | | 50,000 | | | | 51,083 | |
| | |
Dallas County Utility and Reclamation District, Unlimited Tax GO, 5.00%, 2/15/2020 | | | 80,000 | | | | 82,400 | |
| | |
Grapevine-Colleyville Independent School District, Unlimited Tax, School Building Bonds GO, PSF-GTD, 5.00%, 8/15/2019 | | | 30,000 | | | | 30,448 | |
| | |
Keller Independent School District, Unlimited Tax Series A, GO, PSF-GTD, 5.00%, 8/15/2021 | | | 20,000 | | | | 21,595 | |
| | | | | | | | |
| | |
| | | | | | | 1,139,450 | |
| | | | | | | | |
| | |
Other Revenue — 0.5% | | | | | | | | |
| | |
City of Corpus Christi Rev., 5.00%, 7/15/2019 | | | 55,000 | | | | 55,637 | |
| | |
Dallas Area Rapid Transit, Sales Tax Rev., 4.00%, 12/1/2020 | | | 20,000 | | | | 20,813 | |
| | |
Lower Colorado River Authority Rev., 4.00%, 5/15/2019 | | | 30,000 | | | | 30,138 | |
| | |
Lower Colorado River Authority, LCRA Transmission Corporation Project Series 2010B, Rev., 5.00%, 5/15/2020 | | | 40,000 | | | | 41,512 | |
| | |
Lower Colorado River Authority, Unrefunded Balance | | | | | | | | |
| | |
Rev., 5.00%, 5/15/2019 | | | 25,000 | | | | 25,163 | |
| | |
Rev., 5.00%, 5/15/2020 | | | 60,000 | | | | 60,391 | |
| | |
Series A, Rev., 5.00%, 5/15/2020 | | | 35,000 | | | | 36,330 | |
| | |
State of Texas, Public Finance Authority Series 2016-A, Rev., 4.00%, 12/1/2019 | | | 50,000 | | | | 50,809 | |
| | | | | | | | |
| | |
| | | | | | | 320,793 | |
| | | | | | | | |
| | | | | | | | |
| | |
Prerefunded — 1.2% | | | | | | | | |
| | |
City of Annetta, GO, 5.00%, 8/1/2020 (c) | | | 295,000 | | | | 308,464 | |
| | |
Tarrant County Cultural Education Facilities Finance Corp. | | | | | | | | |
| | |
Rev., 5.00%, 8/15/2020 (c) | | | 20,000 | | | | 20,937 | |
| | |
Rev., 5.25%, 8/15/2020 (c) | | | 45,000 | | | | 47,269 | |
| | |
Travis County Health Facilities Development Corp. Rev., 7.13%, 11/1/2020 (c) | | | 220,000 | | | | 239,402 | |
| | |
University of North Texas, Board of Regents, Financing System Series A, Rev., 5.00%, 4/15/2019 (c) | | | 70,000 | | | | 70,287 | |
| | |
Waco Independent School District GO, AGC, 5.00%, 8/15/2019 (c) | | | 35,000 | | | | 35,513 | |
| | | | | | | | |
| | |
| | | | | | | 721,872 | |
| | | | | | | | |
| | | | | | | | |
| INVESTMENTS | | PRINCIPAL
AMOUNT ($) | | | VALUE ($) | |
| | | | | | | | |
| | |
Transportation — 0.1% | | | | | | | | |
| | |
Alamo Regional Mobility Authority, Vehicle Registration Fee Senior Lien Rev., 5.00%, 6/15/2021 | | | 25,000 | | | | 26,827 | |
| | |
Harris County, Toll Road, Senior Lien Series C, Rev., 5.00%, 8/15/2019 | | | 20,000 | | | | 20,278 | |
| | | | | | | | |
| | |
| | | | | | | 47,105 | |
| | | | | | | | |
| | |
Utility — 0.5% | | | | | | | | |
| | |
Texas Municipal Power Agency | | | | | | | | |
| | |
Rev., 5.00%, 9/1/2019 | | | 50,000 | | | | 50,818 | |
| | |
Rev., 5.00%, 9/1/2020 | | | 255,000 | | | | 267,434 | |
| | | | | | | | |
| | |
| | | | | | | 318,252 | |
| | | | | | | | |
| | |
Water & Sewer — 0.6% | | | | | | | | |
| | |
City of El Paso Rev., 4.00%, 3/1/2020 | | | 50,000 | | | | 51,123 | |
| | |
City of Garland, Water and Sewer System Rev., 4.00%, 3/1/2020 | | | 25,000 | | | | 25,559 | |
| | |
City of Irving, Waterworks and Sewer System Rev., 5.00%, 8/15/2019 | | | 50,000 | | | | 50,744 | |
| | |
City of San Antonio, Water System, Junior Lien Series B, Rev., 5.00%, 5/15/2020 | | | 35,000 | | | | 36,374 | |
| | |
Trinity River Authority Central Regional Wastewater System Rev., 5.00%, 8/1/2021 | | | 40,000 | | | | 43,093 | |
| | |
Upper Trinity Regional Water District Rev., 5.00%, 8/1/2019 | | | 25,000 | | | | 25,337 | |
| | |
Upper Trinity Regional Water District, Wastewater Treatment System Rev., AGM, 3.00%, 8/1/2019 | | | 100,000 | | | | 100,539 | |
| | | | | | | | |
| | |
| | | | | | | 332,769 | |
| | | | | | | | |
| | |
Total Texas | | | | | | | 3,206,950 | |
| | | | | | | | |
|
Utah — 0.2% | |
| | |
Education — 0.0% (b) | | | | | | | | |
| | |
Utah State Board of Regents, University of Utah (The) Series B, Rev., 5.00%, 8/1/2019 | | | 25,000 | | | | 25,342 | |
| | | | | | | | |
| | |
Other Revenue — 0.1% | | | | | | | | |
| | |
Utah Transit Authority, Sales Tax Series A, Rev., 5.00%, 6/15/2020 | | | 25,000 | | | | 26,063 | |
| | | | | | | | |
| | |
Prerefunded — 0.1% | | | | | | | | |
| | |
Utah State Building Ownership Authority, Master Lease Program Rev., 5.00%, 5/15/2019 (c) | | | 30,000 | | | | 30,201 | |
| | | | | | | | |
| | |
Utility — 0.0% (b) | | | | | | | | |
| | |
Intermountain Power Agency, Subordinated Power Supply Series A, Rev., 5.00%, 7/1/2019 | | | 25,000 | | | | 25,272 | |
| | | | | | | | |
| | |
Total Utah | | | | | | | 106,878 | |
| | | | | | | | |
SEE NOTES TO FINANCIAL STATEMENTS.
| | | | | | |
| | | |
| 134 | | | | J.P. MORGAN EXCHANGE-TRADED FUNDS | | FEBRUARY 28, 2019 |
| | | | | | | | |
| INVESTMENTS | | PRINCIPAL
AMOUNT ($) | | | VALUE ($) | |
Municipal Bonds — continued | | | | | | | | |
|
Vermont — 0.1% | |
| | |
General Obligation — 0.1% | | | | | | | | |
| | |
City of Burlington Series 2018D, GO, 5.00%, 11/1/2020 | | | 65,000 | | | | 68,504 | |
| | | | | | | | |
|
Virginia — 0.2% | |
| | |
Hospital — 0.1% | | | | | | | | |
| | |
Albermarle County Economic Development Authority, Virginia Hospital Facilities Rev., 5.00%, 6/1/2019 | | | 45,000 | | | | 45,367 | |
| | | | | | | | |
| | |
Transportation — 0.1% | | | | | | | | |
| | |
Virginia Commonwealth Transportation Board | | | | | | | | |
| | |
Rev., 5.00%, 3/15/2019 | | | 25,000 | | | | 25,025 | |
| | |
Series 2013-A, Rev., GAN, 5.00%, 3/15/2020 | | | 25,000 | | | | 25,849 | |
| | | | | | | | |
| | |
| | | | | | | 50,874 | |
| | | | | | | | |
| | |
Total Virginia | | | | | | | 96,241 | |
| | | | | | | | |
|
Washington — 1.2% | |
|
Certificate of Participation/Lease — 0.0% (b) | |
| | |
State of Washington, Local Ageny Real and Personal Property Series 2018C, COP, 5.00%, 7/1/2020 | | | 25,000 | | | | 26,091 | |
| | | | | | | | |
|
Education — 0.1% | |
| | |
Washington State University Rev., 5.00%, 10/1/2020 | | | 35,000 | | | | 36,732 | |
| | | | | | | | |
|
General Obligation — 0.7% | |
| | |
City of Seattle GO, 5.00%, 5/1/2019 | | | 40,000 | | | | 40,214 | |
| | |
City of Seattle, Limited Tax | | | | | | | | |
| | |
GO, 5.00%, 9/1/2019 | | | 25,000 | | | | 25,414 | |
| | |
Series B, GO, 5.00%, 8/1/2020 | | | 35,000 | | | | 36,641 | |
| | |
County of Skagit, Limited Tax GO, 5.00%, 12/1/2021 | | | 20,000 | | | | 21,749 | |
| | |
King County Public Hospital District No. 2, Evergreenhealth GO, 5.00%, 12/1/2021 | | | 60,000 | | | | 65,173 | |
| | |
King County School District No. 405 Bellevue, Credit Enhancement Program GO, 5.00%, 12/1/2020 | | | 20,000 | | | | 21,154 | |
| | |
Skagit County Public Hospital District No. 2, Refunding and Improvement-Limited Tax GO, 4.00%, 12/1/2019 | | | 50,000 | | | | 50,876 | |
| | |
State of Washington, Motor Vehicle Fuel Tax | | | | | | | | |
| | |
Series R-2015B, GO, 4.00%, 7/1/2019 | | | 25,000 | | | | 25,193 | |
| | |
Series B, GO, 5.00%, 8/1/2020 | | | 20,000 | | | | 20,933 | |
| | |
State of Washington, Various Purpose | | | | | | | | |
| | |
Series R-2011B, GO, 5.00%, 7/1/2019 | | | 25,000 | | | | 25,274 | |
| | |
Series R-2017A, GO, 4.00%, 8/1/2019 | | | 20,000 | | | | 20,194 | |
| | | | | | | | |
| INVESTMENTS | | PRINCIPAL
AMOUNT ($) | | | VALUE ($) | |
| | | | | | | | |
|
General Obligation — continued | |
| | |
Series 2013-A, GO, 5.00%, 8/1/2019 | | | 25,000 | | | | 25,344 | |
| | | | | | | | |
| | |
| | | | | | | 378,159 | |
| | | | | | | | |
| | |
Prerefunded — 0.1% | | | | | | | | |
| | |
County of King, Sewer Rev., 5.00%, 1/1/2021 (c) | | | 25,000 | | | | 26,500 | |
| | |
Grant County Public Utility District No. 2, Electric System Series 2011-I, Rev., 5.00%, 1/1/2021 (c) | | | 25,000 | | | | 26,500 | |
| | | | | | | | |
| | |
| | | | | | | 53,000 | |
| | | | | | | | |
| | |
Transportation — 0.1% | | | | | | | | |
| | |
Port of Seattle, Intermediate Lien Series 2010B, Rev., 5.00%, 6/1/2019 | | | 25,000 | | | | 25,195 | |
| | |
State of Washington Federal Highway Series 2012F, Rev., 5.00%, 9/1/2020 | | | 20,000 | | | | 20,969 | |
| | | | | | | | |
| | |
| | | | | | | 46,164 | |
| | | | | | | | |
| | |
Utility — 0.2% | | | | | | | | |
| | |
Energy Northwest, Electric | | | | | | | | |
| | |
Series A, Rev., 5.00%, 7/1/2019 | | | 65,000 | | | | 65,699 | |
| | |
Series A, Rev., 5.00%, 7/1/2021 | | | 25,000 | | | | 26,894 | |
| | |
Public Utility District No. 1 of Cowlitz County Rev., 5.00%, 9/1/2019 | | | 45,000 | | | | 45,698 | |
| | | | | | | | |
| | |
| | | | | | | 138,291 | |
| | | | | | | | |
| | |
Water & Sewer — 0.0% (b) | | | | | | | | |
| | |
County of Pierce, Sewer Rev., 5.00%, 8/1/2019 | | | 20,000 | | | | 20,265 | |
| | | | | | | | |
| | |
Total Washington | | | | | | | 698,702 | |
| | | | | | | | |
|
West Virginia — 0.4% | |
| | |
General Obligation — 0.0% (b) | | | | | | | | |
| | |
Cabell County Board of Education GO, 5.00%, 5/1/2019 | | | 20,000 | | | | 20,104 | |
| | | | | | | | |
| | |
Hospital — 0.4% | | | | | | | | |
| | |
Monongalia County Building Commission, Monongalia Health System Obligated Group Rev., 5.00%, 7/1/2020 | | | 200,000 | | | | 205,574 | |
| | | | | | | | |
| | |
Total West Virginia | | | | | | | 225,678 | |
| | | | | | | | |
|
Wisconsin — 2.8% | |
| | |
General Obligation — 1.4% | | | | | | | | |
| | |
City of Evansville Series 2017A, GO, 3.00%, 4/1/2019 | | | 175,000 | | | | 175,152 | |
| | |
City of Waukesha, Promissory Notes Series A, GO, 4.00%, 10/1/2020 | | | 20,000 | | | | 20,724 | |
| | |
City of West Allis, Corporate Purpose Series A, GO, 4.00%, 4/1/2020 | | | 455,000 | | | | 465,511 | |
SEE NOTES TO FINANCIAL STATEMENTS.
| | | | | | | | |
| | | |
| FEBRUARY 28, 2019 | | J.P. MORGAN EXCHANGE-TRADED FUNDS | | | | | 135 | |
JPMorgan Ultra-Short Municipal Income ETF
SCHEDULE OF PORTFOLIO INVESTMENTS
AS OF FEBRUARY 28, 2019 (continued)
| | | | | | | | |
| INVESTMENTS | | PRINCIPAL
AMOUNT ($) | | | VALUE ($) | |
Municipal Bonds — continued | | | | | | | | |
| | |
General Obligation — continued | | | | | | | | |
| | |
State of Wisconsin | | | | | | | | |
| | |
Series 2, GO, 4.00%, 5/1/2019 | | | 25,000 | | | | 25,095 | |
| | |
Series A, GO, 4.00%, 5/1/2019 | | | 90,000 | | | | 90,327 | |
| | |
Series 3, GO, 5.00%, 11/1/2020 | | | 65,000 | | | | 68,565 | |
| | | | | | | | |
| | |
| | | | | | | 845,374 | |
| | | | | | | | |
| | |
Hospital — 0.2% | | | | | | | | |
| | |
Wisconsin Health and Educational Facilities Authority, SSM Health Care Series 2010A, Rev., 4.00%, 6/1/2020 (c) | | | 40,000 | | | | 40,960 | |
| | |
Wisconsin Health and Educational Facilities Authority, Unity Point Health Series 2014A, Rev., 5.00%, 12/1/2021 | | | 50,000 | | | | 54,258 | |
| | | | | | | | |
| | |
| | | | | | | 95,218 | |
| | | | | | | | |
| | |
Prerefunded — 1.1% | | | | | | | | |
| | |
State of Wisconsin | | | | | | | | |
| | |
Series A, Rev., 5.75%, 5/1/2019 (c) | | | 595,000 | | | | 598,814 | |
| | |
Series 1, GO, 5.00%, 5/1/2020 (c) | | | 20,000 | | | | 20,753 | |
| | | | | | | | |
| | |
| | | | | | | 619,567 | |
| | | | | | | | |
| | |
Water & Sewer — 0.1% | | | | | | | | |
| | |
State of Wisconsin, Clean Water Fund Series 2, Rev., 5.00%, 6/1/2019 (c) | | | 50,000 | | | | 50,404 | |
| | | | | | | | |
| | |
Total Wisconsin | | | | | | | 1,610,563 | |
| | | | | | | | |
| | |
Total Municipal Bonds
(Cost $58,639,537) | | | | | | | 58,774,370 | |
| | | | | | | | |
| | |
| | | SHARES | | | | |
Short-Term Investments — 0.3% | | | | | | | | |
| | |
Investment Companies — 0.3% | | | | | | | | |
| | |
JPMorgan Institutional Tax Free Money Market Fund Class IM Shares, 1.57% (g) (h)
(Cost $146,947) | | | 146,947 | | | | 146,947 | |
| | | | | | | | |
Total Investments — 101.9%
(Cost $58,786,484) | | | | | | | 58,921,317 | |
Liabilities in Excess of
Other Assets — (1.9%) | | | | | | | (1,121,726) | |
| | | | | | | | |
Net Assets — 100.0% | | | | | | | 57,799,591 | |
| | | | | | | | |
Percentages indicated are based on net assets.
Abbreviations
| | |
AGC | | Insured by Assured Guaranty Corp. |
AGM | | Insured by Assured Guaranty Municipal Corp. |
AMBAC | | Insured by American Municipal Bond Assurance Corp. |
BAN | | Bond Anticipation Note |
COP | | Certificate of Participation |
GAN | | Grant Anticipation Notes |
GO | | General Obligation |
GRAN | | Grant Revenue Anticipation Notes |
LIQ | | Liquidity Agreement |
LOC | | Letter of Credit |
NATL | | Insured by National Public Finance Guarantee Corp. |
PSF-GTD | | Permanent School Fund Guaranteed |
Q-SBLF | | Qualified School Bond Loan Fund |
RE | | Reinsured |
Rev. | | Revenue |
SCSDE | | South Carolina School District Enhancement |
TAN | | Tax Anticipation Note |
USD | | United States Dollar |
VAR | | Variable Rate Security. The interest rate shown is the rate in effect as of February 28, 2019. |
VRDO | | Variable Rate Demand Obligation. The interest rate shown is the rate in effect as of February 28, 2019. |
| |
(a) | | The date shown represents the earliest of the prerefunded date, next put date or final maturity date. |
(b) | | Amount rounds to less than 0.1% of net assets. |
(c) | | Security is prerefunded or escrowed to maturity. |
(d) | | Variable or floating rate security, the interest rate of which adjusts periodically based on changes in current interest rates and prepayments on the underlying pool of assets. The interest rate shown is the current rate as of February 28, 2019. |
(e) | | Securities exempt from registration under Rule 144A or section 4 (a)(2), of the Securities Act of 1933, as amended. |
(f) | | All or a portion of the security is a when-issued security, delayed delivery security, or forward commitment. |
(g) | | Investment in affiliate. Fund is registered under the Investment Company Act of 1940, as amended, and advised by J.P. Morgan Investment Management Inc. |
(h) | | The rate shown is the current yield as of February 28, 2019. |
SEE NOTES TO FINANCIAL STATEMENTS.
| | | | | | |
| | | |
| 136 | | | | J.P. MORGAN EXCHANGE-TRADED FUNDS | | FEBRUARY 28, 2019 |
JPMorgan USD Emerging Markets Sovereign Bond ETF
SCHEDULE OF PORTFOLIO INVESTMENTS
AS OF FEBRUARY 28, 2019
| | | | | | | | |
| INVESTMENTS | | PRINCIPAL
AMOUNT ($) | | | VALUE ($) | |
Foreign Government Securities — 85.0% | |
| |
Azerbaijan — 0.9% | | | | | |
| | |
Republic of Azerbaijan | | | | | | | | |
| | |
4.75%, 3/18/2024 (a) | | | 200,000 | | | | 204,250 | |
| | |
3.50%, 9/1/2032 (a) | | | 440,000 | | | | 383,350 | |
| | | | | | | | |
| | |
| | | | | | | 587,600 | |
| | | | | | | | |
| |
Bolivia, Plurinational State of — 0.3% | | | | | |
| | |
Plurinational State of Bolivia 4.50%, 3/20/2028 (a) | | | 200,000 | | | | 183,011 | |
| | | | | | | | |
| |
Brazil — 5.9% | | | | | |
| | |
Federative Republic of Brazil | | | | | | | | |
| | |
4.88%, 1/22/2021 | | | 462,000 | | | | 475,398 | |
| | |
4.25%, 1/7/2025 | | | 520,000 | | | | 523,380 | |
| | |
6.00%, 4/7/2026 | | | 381,000 | | | | 416,242 | |
| | |
4.63%, 1/13/2028 | | | 220,000 | | | | 218,512 | |
| | |
8.25%, 1/20/2034 | | | 350,000 | | | | 443,998 | |
| | |
5.63%, 1/7/2041 | | | 750,000 | | | | 749,824 | |
| | |
5.63%, 2/21/2047 | | | 842,000 | | | | 825,610 | |
| | | | | | | | |
| | |
| | | | | | | 3,652,964 | |
| | | | | | | | |
| |
Chile — 0.3% | | | | | |
| | |
Republic of Chile 3.86%, 6/21/2047 | | | 200,000 | | | | 194,600 | |
| | | | | | | | |
| |
China — 0.7% | | | | | |
| | |
Export-Import Bank of China (The) 2.00%, 4/26/2021 (b) | | | 214,000 | | | | 208,705 | |
| | |
People’s Republic of China 2.13%, 11/2/2022 (b) | | | 200,000 | | | | 194,519 | |
| | | | | | | | |
| | |
| | | | | | | 403,224 | |
| | | | | | | | |
| |
Colombia — 2.6% | | | | | |
| | |
Republic of Colombia | | | | | | | | |
| | |
4.38%, 7/12/2021 | | | 277,000 | | | | 283,025 | |
| | |
8.13%, 5/21/2024 | | | 260,000 | | | | 309,435 | |
| | |
3.88%, 4/25/2027 | | | 216,000 | | | | 212,868 | |
| | |
7.38%, 9/18/2037 | | | 100,000 | | | | 126,058 | |
| | |
5.63%, 2/26/2044 | | | 205,000 | | | | 222,220 | |
| | |
5.00%, 6/15/2045 | | | 437,000 | | | | 439,622 | |
| | | | | | | | |
| | |
| | | | | | | 1,593,228 | |
| | | | | | | | |
| |
Croatia — 2.0% | | | | | |
| | |
Republic of Croatia | | | | | | | | |
| | |
6.38%, 3/24/2021 (a) | | | 450,000 | | | | 474,525 | |
| | |
5.50%, 4/4/2023 (a) | | | 205,000 | | | | 219,350 | |
| | |
6.00%, 1/26/2024 (a) | | | 509,000 | | | | 562,445 | |
| | | | | | | | |
| | |
| | | | | | | 1,256,320 | |
| | | | | | | | |
| | | | | | | | |
| INVESTMENTS | | PRINCIPAL
AMOUNT ($) | | | VALUE ($) | |
| | | | | | | | |
| |
Dominican Republic — 4.3% | | | | | |
| | |
Government of Dominican Republic | | | | | | | | |
| | |
7.50%, 5/6/2021 (a) | | | 478,000 | | | | 496,642 | |
| | |
5.50%, 1/27/2025 (a) | | | 116,000 | | | | 117,885 | |
| | |
5.95%, 1/25/2027 (b) | | | 741,000 | | | | 769,406 | |
| | |
5.95%, 1/25/2027 (a) | | | 198,000 | | | | 205,591 | |
| | |
7.45%, 4/30/2044 (a) | | | 619,000 | | | | 682,636 | |
| | |
6.85%, 1/27/2045 (a) | | | 394,000 | | | | 410,412 | |
| | | | | | | | |
| | |
| | | | | | | 2,682,572 | |
| | | | | | | | |
| |
Ecuador — 4.5% | | | | | |
| | |
Republic of Ecuador | | | | | | | | |
| | |
10.75%, 3/28/2022 (a) | | | 281,000 | | | | 305,985 | |
| | |
8.75%, 6/2/2023 (a) | | | 200,000 | | | | 206,103 | |
| | |
7.95%, 6/20/2024 (a) | | | 701,000 | | | | 694,540 | |
| | |
9.65%, 12/13/2026 (a) | | | 864,000 | | | | 896,603 | |
| | |
8.88%, 10/23/2027 (a) | | | 201,000 | | | | 199,976 | |
| | |
7.88%, 1/23/2028 (a) | | | 500,000 | | | | 472,568 | |
| | | | | | | | |
| | |
| | | | | | | 2,775,775 | |
| | | | | | | | |
| |
Egypt — 4.5% | | | | | |
| | |
Arab Republic of Egypt | | | | | | | | |
| | |
6.13%, 1/31/2022 (a) | | | 537,000 | | | | 545,726 | |
| | |
5.88%, 6/11/2025 (a) | | | 717,000 | | | | 708,038 | |
| | |
7.50%, 1/31/2027 (a) | | | 441,000 | | | | 456,435 | |
| | |
6.59%, 2/21/2028 (a) | | | 264,000 | | | | 257,400 | |
| | |
8.50%, 1/31/2047 (a) | | | 800,000 | | | | 820,000 | |
| | | | | | | | |
| | |
| | | | | | | 2,787,599 | |
| | | | | | | | |
| |
Ethiopia — 0.3% | | | | | |
| | |
Federal Democratic Republic of Ethiopia 6.63%, 12/11/2024 (a) | | | 200,000 | | | | 201,000 | |
| | | | | | | | |
| |
Gabon — 0.5% | | | | | |
| | |
Gabonese Republic 6.38%, 12/12/2024 (a) | | | 290,000 | | | | 279,487 | |
| | | | | | | | |
| |
Ghana — 1.8% | | | | | |
| | |
Republic of Ghana | | | | | | | | |
| | |
7.88%, 8/7/2023 (b) | | | 585,000 | | | | 610,594 | |
| | |
8.13%, 1/18/2026 (a) | | | 100,000 | | | | 101,750 | |
| | |
7.63%, 5/16/2029 (a) | | | 200,000 | | | | 193,750 | |
| | |
8.63%, 6/16/2049 (a) | | | 235,000 | | | | 222,956 | |
| | | | | | | | |
| | |
| | | | | | | 1,129,050 | |
| | | | | | | | |
| |
Hungary — 1.7% | | | | | |
| | |
Republic of Hungary | | | | | | | | |
| | |
6.38%, 3/29/2021 | | | 406,000 | | | | 431,245 | |
| | |
5.38%, 2/21/2023 | | | 204,000 | | | | 218,255 | |
| | |
5.38%, 3/25/2024 | | | 104,000 | | | | 112,683 | |
SEE NOTES TO FINANCIAL STATEMENTS.
| | | | | | | | |
| | | |
| FEBRUARY 28, 2019 | | J.P. MORGAN EXCHANGE-TRADED FUNDS | | | | | 137 | |
JPMorgan USD Emerging Markets Sovereign Bond ETF
SCHEDULE OF PORTFOLIO INVESTMENTS
AS OF FEBRUARY 28, 2019 (continued)
| | | | | | | | |
| INVESTMENTS | | PRINCIPAL
AMOUNT ($) | | | VALUE ($) | |
Foreign Government Securities — continued | |
| |
Hungary — continued | | | | | |
| | |
7.63%, 3/29/2041 | | | 190,000 | | | | 276,450 | |
| | | | | | | | |
| | |
| | | | | | | 1,038,633 | |
| | | | | | | | |
| |
India — 0.5% | | | | | |
| | |
Export-Import Bank of India 3.38%, 8/5/2026 (a) | | | 300,000 | | | | 282,344 | |
| | | | | | | | |
| |
Indonesia — 2.6% | | | | | |
| | |
Perusahaan Penerbit SBSN Indonesia III 4.55%, 3/29/2026 (a) | | | 200,000 | | | | 203,348 | |
| |
Republic of Indonesia | | | | | |
| | |
4.75%, 1/8/2026 (a) | | | 480,000 | | | | 495,815 | |
| | |
3.50%, 1/11/2028 | | | 200,000 | | | | 190,294 | |
| | |
4.10%, 4/24/2028 | | | 200,000 | | | | 198,612 | |
| | |
6.75%, 1/15/2044 (a) | | | 401,000 | | | | 498,784 | |
| | | | | | | | |
| | |
| | | | | | | 1,586,853 | |
| | | | | | | | |
| |
Iraq — 1.5% | | | | | |
| | |
Republic of Iraq | | | | | | | | |
| | |
6.75%, 3/9/2023 (a) | | | 400,000 | | | | 406,000 | |
| | |
5.80%, 1/15/2028 (a) | | | 520,000 | | | | 501,800 | |
| | | | | | | | |
| | |
| | | | | | | 907,800 | |
| | | | | | | | |
| |
Ivory Coast — 1.6% | | | | | |
| | |
Republic of Cote d’Ivoire | | | | | | | | |
| | |
6.38%, 3/3/2028 (a) | | | 574,000 | | | | 561,085 | |
| | |
5.75%, 12/31/2032 (a) (c) | | | 239,825 | | | | 226,934 | |
| | |
6.13%, 6/15/2033 (a) | | | 200,000 | | | | 184,750 | |
| | | | | | | | |
| | |
| | | | | | | 972,769 | |
| | | | | | | | |
| |
Jamaica — 1.8% | | | | | |
| |
Jamaica Government International Bond | | | | | |
| | |
6.75%, 4/28/2028 | | | 425,000 | | | | 468,669 | |
| | |
8.00%, 3/15/2039 | | | 100,000 | | | | 118,962 | |
| | |
7.88%, 7/28/2045 | | | 425,000 | | | | 504,668 | |
| | | | | | | | |
| | |
| | | | | | | 1,092,299 | |
| | | | | | | | |
| |
Jordan — 1.3% | | | | | |
| | |
Kingdom of Jordan | | | | | | | | |
| | |
6.13%, 1/29/2026 (a) | | | 565,000 | | | | 570,650 | |
| | |
7.38%, 10/10/2047 (a) | | | 225,000 | | | | 220,500 | |
| | | | | | | | |
| | |
| | | | | | | 791,150 | |
| | | | | | | | |
| |
Kazakhstan — 1.0% | | | | | |
| | |
Republic of Kazakhstan | | | | | | | | |
| | |
3.88%, 10/14/2024 (a) | | | 350,000 | | | | 357,437 | |
| | |
6.50%, 7/21/2045 (a) | | | 200,000 | | | | 254,250 | |
| | | | | | | | |
| | |
| | | | | | | 611,687 | |
| | | | | | | | |
| | | | | | | | |
| INVESTMENTS | | PRINCIPAL
AMOUNT ($) | | | VALUE ($) | |
| | | | | | | | |
| |
Kenya — 1.4% | | | | | |
| | |
Republic of Kenya | | | | | | | | |
| | |
6.88%, 6/24/2024 (a) | | | 394,000 | | | | 403,850 | |
| | |
7.25%, 2/28/2028 (a) | | | 200,000 | | | | 202,250 | |
| | |
8.25%, 2/28/2048 (a) | | | 280,000 | | | | 282,450 | |
| | | | | | | | |
| | |
| | | | | | | 888,550 | |
| | | | | | | | |
| |
Lebanon — 2.3% | | | | | |
| | |
Republic of Lebanon | | | | | | | | |
| | |
8.25%, 4/12/2021 (b) | | | 120,000 | | | | 115,950 | |
| | |
6.10%, 10/4/2022 (b) | | | 532,000 | | | | 477,470 | |
| | |
6.00%, 1/27/2023 (b) | | | 106,000 | | | | 94,075 | |
| | |
6.60%, 11/27/2026 (b) | | | 137,000 | | | | 116,450 | |
| | |
6.85%, 3/23/2027 (b) | | | 150,000 | | | | 127,313 | |
| | |
6.75%, 11/29/2027 (b) | | | 272,000 | | | | 228,140 | |
| | |
6.65%, 2/26/2030 (b) | | | 103,000 | | | | 83,816 | |
| | |
7.00%, 3/23/2032 (b) | | | 225,000 | | | | 183,094 | |
| | | | | | | | |
| | |
| | | | | | | 1,426,308 | |
| | | | | | | | |
| | |
Lithuania — 0.5% | | | | | | | | |
| | |
Republic of Lithuania 6.13%, 3/9/2021 (a) | | | 300,000 | | | | 317,340 | |
| | | | | | | | |
| |
Malaysia — 0.3% | | | | | |
| | |
Malaysia Sovereign Sukuk Bhd. 3.04%, 4/22/2025 (a) | | | 200,000 | | | | 196,946 | |
| | | | | | | | |
| |
Mexico — 1.8% | | | | | |
| | |
United Mexican States | | | | | | | | |
| | |
4.13%, 1/21/2026 | | | 725,000 | | | | 723,913 | |
| | |
6.05%, 1/11/2040 | | | 100,000 | | | | 110,250 | |
| | |
4.35%, 1/15/2047 | | | 200,000 | | | | 179,400 | |
| | |
5.75%, 10/12/2110 | | | 100,000 | | | | 98,500 | |
| | | | | | | | |
| | |
| | | | | | | 1,112,063 | |
| | | | | | | | |
| |
Mongolia — 0.3% | | | | | |
| | |
Mongolia Government International Bond 5.13%, 12/5/2022 (a) | | | 200,000 | | | | 198,750 | |
| | | | | | | | |
| |
Morocco — 0.2% | | | | | |
| | |
Kingdom of Morocco 4.25%, 12/11/2022 (a) | | | 150,000 | | | | 151,875 | |
| | | | | | | | |
| |
Oman — 1.5% | | | | | |
| |
Oman Government International Bond | | | | | |
| | |
4.75%, 6/15/2026 (a) | | | 300,000 | | | | 274,875 | |
| | |
5.38%, 3/8/2027 (a) | | | 381,000 | | | | 356,235 | |
| | |
5.63%, 1/17/2028 (a) | | | 200,000 | | | | 188,750 | |
| | |
6.50%, 3/8/2047 (a) | | | 150,000 | | | | 132,750 | |
| | | | | | | | |
| | |
| | | | | | | 952,610 | |
| | | | | | | | |
SEE NOTES TO FINANCIAL STATEMENTS.
| | | | | | |
| | | |
| 138 | | | | J.P. MORGAN EXCHANGE-TRADED FUNDS | | FEBRUARY 28, 2019 |
| | | | | | | | |
| INVESTMENTS | | PRINCIPAL
AMOUNT ($) | | | VALUE ($) | |
Foreign Government Securities — continued | |
| |
Pakistan — 1.8% | | | | | |
| | |
Republic of Pakistan | | | | | | | | |
| | |
5.50%, 10/13/2021 (a) | | | 200,000 | | | | 197,500 | |
| | |
5.63%, 12/5/2022 (a) | | | 210,000 | | | | 203,963 | |
| | |
8.25%, 4/15/2024 (a) | | | 400,000 | | | | 416,694 | |
| | |
6.88%, 12/5/2027 (a) | | | 295,000 | | | | 283,110 | |
| | | | | | | | |
| | |
| | | | | | | 1,101,267 | |
| | | | | | | | |
| |
Panama — 1.6% | | | | | |
| | |
Republic of Panama | | | | | | | | |
| | |
4.00%, 9/22/2024 | | | 269,000 | | | | 276,398 | |
| | |
3.88%, 3/17/2028 | | | 200,000 | | | | 203,000 | |
| | |
6.70%, 1/26/2036 | | | 250,000 | | | | 317,174 | |
| | |
4.50%, 5/15/2047 | | | 206,000 | | | | 208,860 | |
| | | | | | | | |
| | |
| | | | | | | 1,005,432 | |
| | | | | | | | |
| |
Paraguay — 0.4% | | | | | |
| | |
Republic of Paraguay 6.10%, 8/11/2044 (a) | | | 200,000 | | | | 219,505 | |
| | | | | | | | |
| |
Peru — 1.7% | | | | | |
| | |
Republic of Peru | | | | | | | | |
| | |
4.13%, 8/25/2027 | | | 451,000 | | | | 477,834 | |
| | |
6.55%, 3/14/2037 | | | 100,000 | | | | 130,400 | |
| | |
5.63%, 11/18/2050 | | | 375,000 | | | | 459,750 | |
| | | | | | | | |
| | |
| | | | | | | 1,067,984 | |
| | | | | | | | |
| |
Philippines — 2.6% | | | | | |
| | |
Republic of Philippines | | | | | | | | |
| | |
10.63%, 3/16/2025 | | | 160,000 | | | | 224,294 | |
| | |
5.50%, 3/30/2026 | | | 200,000 | | | | 226,029 | |
| | |
9.50%, 2/2/2030 | | | 30,000 | | | | 45,257 | |
| | |
6.38%, 1/15/2032 | | | 396,000 | | | | 498,780 | |
| | |
6.38%, 10/23/2034 | | | 147,000 | | | | 190,471 | |
| | |
3.70%, 3/1/2041 | | | 214,000 | | | | 209,336 | |
| | |
3.70%, 2/2/2042 | | | 200,000 | | | | 195,651 | |
| | | | | | | | |
| | |
| | | | | | | 1,589,818 | |
| | | | | | | | |
| |
Poland — 1.8% | | | | | |
| | |
Republic of Poland | | | | | | | | |
| | |
5.00%, 3/23/2022 | | | 160,000 | | | | 169,180 | |
| | |
3.00%, 3/17/2023 | | | 706,000 | | | | 704,394 | |
| | |
4.00%, 1/22/2024 | | | 206,000 | | | | 213,564 | |
| | | | | | | | |
| | |
| | | | | | | 1,087,138 | |
| | | | | | | | |
| |
Romania — 1.2% | | | | | |
| | |
Republic of Romania | | | | | | | | |
| | |
6.75%, 2/7/2022 (a) | | | 136,000 | | | | 147,390 | |
| | |
4.38%, 8/22/2023 (a) | | | 100,000 | | | | 102,250 | |
| | | | | | | | |
| INVESTMENTS | | PRINCIPAL
AMOUNT ($) | | | VALUE ($) | |
| | | | | | | | |
| |
Romania — continued | | | | | |
| | |
4.88%, 1/22/2024 (a) | | | 240,000 | | | | 251,400 | |
| | |
6.13%, 1/22/2044 (a) | | | 204,000 | | | | 230,520 | |
| | | | | | | | |
| | |
| | | | | | | 731,560 | |
| | | | | | | | |
| |
Russia — 2.8% | | | | | |
| | |
Russian Federation | | | | | | | | |
| | |
4.50%, 4/4/2022 (a) | | | 200,000 | | | | 204,800 | |
| | |
4.25%, 6/23/2027 (a) | | | 400,000 | | | | 392,000 | |
| | |
12.75%, 6/24/2028 (a) | | | 383,000 | | | | 610,789 | |
| | |
7.50%, 3/31/2030 (a) (c) | | | 86,735 | | | | 96,016 | |
| | |
5.88%, 9/16/2043 (a) | | | 200,000 | | | | 223,000 | |
| | |
5.25%, 6/23/2047 (a) | | | 200,000 | | | | 197,750 | |
| | | | | | | | |
| | |
| | | | | | | 1,724,355 | |
| | | | | | | | |
| |
Serbia — 0.8% | | | | | |
| | |
Republic of Serbia 7.25%, 9/28/2021 (a) | | | 442,000 | | | | 479,017 | |
| | | | | | | | |
| |
Slovakia — 0.3% | | | | | |
| | |
Slovak Republic 4.38%, 5/21/2022 (a) | | | 200,000 | | | | 208,887 | |
| | | | | | | | |
| |
South Africa — 4.2% | | | | | |
| | |
Republic of South Africa | | | | | | | | |
| | |
5.88%, 5/30/2022 | | | 526,000 | | | | 550,985 | |
| | |
5.88%, 9/16/2025 | | | 484,000 | | | | 507,595 | |
| | |
4.30%, 10/12/2028 | | | 494,000 | | | | 458,185 | |
| | |
5.88%, 6/22/2030 | | | 461,000 | | | | 472,064 | |
| | |
5.38%, 7/24/2044 | | | 204,000 | | | | 189,720 | |
| | |
5.00%, 10/12/2046 | | | 205,000 | | | | 182,194 | |
| | |
5.65%, 9/27/2047 | | | 221,000 | | | | 208,845 | |
| | | | | | | | |
| | |
| | | | | | | 2,569,588 | |
| | | | | | | | |
| |
Sri Lanka — 3.2% | | | | | |
| | |
Republic of Sri Lanka | | | | | | | | |
| | |
6.25%, 7/27/2021 (a) | | | 385,000 | | | | 386,577 | |
| | |
5.75%, 4/18/2023 (a) | | | 200,000 | | | | 193,989 | |
| | |
6.85%, 11/3/2025 (a) | | | 871,000 | | | | 852,491 | |
| | |
6.20%, 5/11/2027 (a) | | | 605,000 | | | | 561,165 | |
| | | | | | | | |
| | |
| | | | | | | 1,994,222 | |
| | | | | | | | |
| |
Trinidad and Tobago — 0.3% | | | | | |
| | |
Republic of Trinidad & Tobago 4.50%, 8/4/2026 (a) | | | 200,000 | | | | 192,000 | |
| | | | | | | | |
| |
Turkey — 6.9% | | | | | |
| | |
Hazine Mustesarligi Varlik Kiralama A/S 5.00%, 4/6/2023 (a) | | | 200,000 | | | | 193,000 | |
| | |
Republic of Turkey | | | | | | | | |
| | |
5.13%, 3/25/2022 | | | 200,000 | | | | 197,500 | |
| | |
6.25%, 9/26/2022 | | | 681,000 | | | | 690,364 | |
| | |
5.75%, 3/22/2024 | | | 275,000 | | | | 270,188 | |
SEE NOTES TO FINANCIAL STATEMENTS.
| | | | | | | | |
| | | |
| FEBRUARY 28, 2019 | | J.P. MORGAN EXCHANGE-TRADED FUNDS | | | | | 139 | |
JPMorgan USD Emerging Markets Sovereign Bond ETF
SCHEDULE OF PORTFOLIO INVESTMENTS
AS OF FEBRUARY 28, 2019 (continued)
| | | | | | | | |
| INVESTMENTS | | PRINCIPAL
AMOUNT ($) | | | VALUE ($) | |
Foreign Government Securities — continued | |
| |
Turkey — continued | | | | | |
| | |
7.38%, 2/5/2025 | | | 216,000 | | | | 226,260 | |
| | |
6.00%, 3/25/2027 | | | 651,000 | | | | 624,146 | |
| | |
6.13%, 10/24/2028 | | | 290,000 | | | | 275,500 | |
| | |
8.00%, 2/14/2034 | | | 200,000 | | | | 214,000 | |
| | |
6.88%, 3/17/2036 | | | 335,000 | | | | 320,762 | |
| | |
6.75%, 5/30/2040 | | | 315,000 | | | | 296,887 | |
| | |
6.00%, 1/14/2041 | | | 206,000 | | | | 177,933 | |
| | |
4.88%, 4/16/2043 | | | 250,000 | | | | 189,375 | |
| | |
6.63%, 2/17/2045 | | | 455,000 | | | | 418,031 | |
| | |
5.75%, 5/11/2047 | | | 240,000 | | | | 198,900 | |
| | | | | | | | |
| | |
| | | | | | | 4,292,846 | |
| | | | | | | | |
| |
Ukraine — 4.5% | | | | | |
| | |
Republic of Ukraine | | | | | | | | |
| | |
7.75%, 9/1/2021 (a) | | | 287,000 | | | | 281,977 | |
| | |
7.75%, 9/1/2022 (a) | | | 375,000 | | | | 365,156 | |
| | |
7.75%, 9/1/2023 (a) | | | 217,000 | | | | 207,778 | |
| | |
7.75%, 9/1/2024 (a) | | | 110,000 | | | | 103,675 | |
| | |
7.75%, 9/1/2025 (a) | | | 348,000 | | | | 324,075 | |
| | |
7.75%, 9/1/2026 (a) | | | 782,000 | | | | 722,373 | |
| | |
7.75%, 9/1/2027 (a) | | | 420,000 | | | | 384,300 | |
| | |
7.38%, 9/25/2032 (a) | | | 443,000 | | | | 382,641 | |
| | | | | | | | |
| | |
| | | | | | | 2,771,975 | |
| | | | | | | | |
| |
Uruguay — 1.7% | | | | | |
| | |
Republic of Uruguay | | | | | | | | |
| | |
4.38%, 10/27/2027 | | | 282,000 | | | | 290,037 | |
| | |
7.63%, 3/21/2036 | | | 140,000 | | | | 188,300 | |
| | |
5.10%, 6/18/2050 | | | 450,000 | | | | 462,600 | |
| | |
4.98%, 4/20/2055 | | | 100,000 | | | | 100,500 | |
| | | | | | | | |
| | |
| | | | | | | 1,041,437 | |
| | | | | | | | |
| |
Vietnam — 0.3% | | | | | |
| | |
Republic of Vietnam 4.80%, 11/19/2024 (a) | | | 200,000 | | | | 208,626 | |
| | | | | | | | |
| |
Total Foreign Government Securities
(Cost $54,018,166) | | | | 52,540,064 | |
| | | | | | | | |
Corporate Bonds — 13.4% | |
| |
Azerbaijan — 0.9% | | | | | |
| | |
Southern Gas Corridor CJSC 6.88%, 3/24/2026 (a) | | | 200,000 | | | | 222,750 | |
| | |
State Oil Co. of the Azerbaijan Republic 4.75%, 3/13/2023 (b) | | | 350,000 | | | | 353,500 | |
| | | | | | | | |
| | |
| | | | | | | 576,250 | |
| | | | | | | | |
| | | | | | | | |
| INVESTMENTS | | PRINCIPAL
AMOUNT ($) | | | VALUE ($) | |
| | | | | | | | |
| |
Brazil — 0.5% | | | | | |
| | |
Banco Nacional de Desenvolvimento Economico e Social 5.75%, 9/26/2023 (a) | | | 280,000 | | | | 298,420 | |
| | | | | | | | |
| |
Chile — 0.9% | | | | | |
| | |
Corp. Nacional del Cobre de Chile | | | | | | | | |
| | |
3.63%, 8/1/2027 (a) | | | 372,000 | | | | 366,046 | |
| | |
4.50%, 8/1/2047 (a) | | | 201,000 | | | | 201,088 | |
| | | | | | | | |
| | |
| | | | | | | 567,134 | |
| | | | | | | | |
| |
China — 2.0% | | | | | |
| | |
CNAC HK Finbridge Co. Ltd. 3.50%, 7/19/2022 (b) | | | 200,000 | | | | 197,367 | |
| | |
CNOOC Curtis Funding No. 1 Pty. Ltd. 4.50%, 10/3/2023 (a) | | | 200,000 | | | | 207,481 | |
| | |
Sinopec Group Overseas Development 2012 Ltd. 4.88%, 5/17/2042 (a) | | | 200,000 | | | | 212,737 | |
| | |
Sinopec Group Overseas Development Ltd. 3.63%, 4/12/2027 (a) | | | 200,000 | | | | 195,933 | |
| |
State Grid Overseas Investment Ltd. | | | | | |
| | |
3.13%, 5/22/2023 (a) | | | 200,000 | | | | 197,642 | |
| | |
3.50%, 5/4/2027 (a) | | | 250,000 | | | | 242,696 | |
| | | | | | | | |
| | |
| | | | | | | 1,253,856 | |
| | | | | | | | |
| |
Indonesia — 1.0% | | | | | |
| | |
Pelabuhan Indonesia II PT 4.25%, 5/5/2025 (a) | | | 200,000 | | | | 198,000 | |
| | |
Pertamina Persero PT 4.30%, 5/20/2023 (a) | | | 220,000 | | | | 221,925 | |
| | |
Perusahaan Listrik Negara PT 5.25%, 10/24/2042 (a) | | | 200,000 | | | | 190,320 | |
| | | | | | | | |
| | |
| | | | | | | 610,245 | |
| | | | | | | | |
| | |
Kazakhstan — 1.6% | | | | | | | | |
| | |
Kazakhstan Temir Zholy Finance BV 6.95%, 7/10/2042 (a) | | | 200,000 | | | | 230,900 | |
| | |
KazMunayGas National Co. JSC | | | | | | | | |
| | |
4.75%, 4/19/2027 (a) | | | 200,000 | | | | 201,750 | |
| | |
5.38%, 4/24/2030 (a) | | | 520,000 | | | | 538,200 | |
| | | | | | | | |
| | |
| | | | | | | 970,850 | |
| | | | | | | | |
| | |
Malaysia — 1.2% | | | | | | | | |
| | |
Petronas Capital Ltd. | | | | | | | | |
| | |
7.88%, 5/22/2022 (a) | | | 440,000 | | | | 501,186 | |
| | |
4.50%, 3/18/2045 (a) | | | 231,000 | | | | 242,853 | |
| | | | | | | | |
| | |
| | | | | | | 744,039 | |
| | | | | | | | |
| | |
Mexico — 2.2% | | | | | | | | |
| | |
Comision Federal de Electricidad 4.75%, 2/23/2027 (a) | | | 100,000 | | | | 97,941 | |
SEE NOTES TO FINANCIAL STATEMENTS.
| | | | | | |
| | | |
| 140 | | | | J.P. MORGAN EXCHANGE-TRADED FUNDS | | FEBRUARY 28, 2019 |
| | | | | | | | |
| INVESTMENTS | | PRINCIPAL
AMOUNT ($) | | | VALUE ($) | |
Corporate Bonds — continued | |
| | |
Mexico — continued | | | | | | | | |
| | |
Mexico City Airport Trust 3.88%, 4/30/2028 (a) | | | 106,000 | | | | 92,466 | |
| | |
Petroleos Mexicanos | | | | | | | | |
| | |
4.88%, 1/24/2022 | | | 60,000 | | | | 59,519 | |
| | |
(ICE LIBOR USD 3 Month + 3.65%), 6.42%, 3/11/2022 (d) | | | 100,000 | | | | 102,150 | |
| | |
5.38%, 3/13/2022 | | | 50,000 | | | | 49,900 | |
| | |
4.63%, 9/21/2023 | | | 70,000 | | | | 66,934 | |
| | |
4.25%, 1/15/2025 | | | 75,000 | | | | 67,800 | |
| | |
5.50%, 6/27/2044 | | | 163,000 | | | | 127,906 | |
| | |
5.63%, 1/23/2046 | | | 767,000 | | | | 600,178 | |
| | |
6.35%, 2/12/2048 (a) | | | 125,000 | | | | 103,550 | |
| | | | | | | | |
| | |
| | | | | | | 1,368,344 | |
| | | | | | | | |
| | |
Oman — 0.6% | | | | | | | | |
| | |
Lamar Funding Ltd. 3.96%, 5/7/2025 (a) | | | 400,000 | | | | 346,500 | |
| | | | | | | | |
| | |
Peru — 0.3% | | | | | | | | |
| | |
Petroleos del Peru SA 4.75%, 6/19/2032 (a) | | | 200,000 | | | | 197,000 | |
| | | | | | | | |
| | |
Philippines — 0.2% | | | | | | | | |
| | |
Power Sector Assets & Liabilities Management Corp. 7.39%, 12/2/2024 (a) | | | 100,000 | | | | 119,284 | |
| | | | | | | | |
| | |
Russia — 0.2% | | | | | | | | |
| | |
Vnesheconombank Via VEB Finance plc 6.80%, 11/22/2025 (a) | | | 125,000 | | | | 129,687 | |
| | | | | | | | |
| | |
South Africa — 1.5% | | | | | | | | |
| | |
Eskom Holdings SOC Ltd. | | | | | | | | |
| | |
7.13%, 2/11/2025 (a) | | | 494,000 | | | | 497,804 | |
| | |
6.35%, 8/10/2028 (a) | | | 200,000 | | | | 204,750 | |
| | |
Transnet SOC Ltd. 4.00%, 7/26/2022 (a) | | | 200,000 | | | | 194,500 | |
| | | | | | | | |
| | |
| | | | | | | 897,054 | |
| | | | | | | | |
| | |
Tunisia — 0.3% | | | | | | | | |
| | |
Banque Centrale de Tunisie International Bond 5.75%, 1/30/2025 (a) | | | 200,000 | | | | 177,000 | |
| | | | | | | | |
| | |
Total Corporate Bonds
(Cost 8,438,666) | | | | | | | 8,255,663 | |
| | | | | | | | |
| | | | | | | | |
| INVESTMENTS | |
SHARES | | | VALUE ($) | |
Short-Term Investments — 0.6% | |
| | |
Investment Companies — 0.6% | | | | | | | | |
| | |
JPMorgan U.S. Government Money Market Fund Class Institutional Shares, 2.33% (e) (f)
(Cost $353,654) | | | 353,654 | | | | 353,654 | |
| | | | | | | | |
Total Investments — 99.0%
(Cost $62,810,486) | | | | | | | 61,149,381 | |
Other Assets Less Liabilities — 1.0% | | | | | | | 627,366 | |
| | | | | | | | |
Net Assets — 100.0% | | | | | | | 61,776,747 | |
| | | | | | | | |
Percentages indicated are based on net assets.
Abbreviations
| | |
CJSC | | Closed joint stock company |
ICE | | Intercontinental Exchange |
JSC | | Joint Stock Company |
LIBOR | | London Interbank Offered Rate |
PT | | Limited liability company |
USD | | United States Dollar |
| |
| (a) | | Securities exempt from registration under Rule 144A or section 4(a)(2), of the Securities Act of 1933, as amended. |
| (b) | | Security exempt from registration pursuant to Regulation S under the Securities Act of 1933, as amended. Regulation S applies to securities offerings that are made outside of the United States and do not involve direct selling efforts in the United States and as such may have restrictions on resale. |
| (c) | | Step bond. Interest rate is a fixed rate for an initial period that either resets at a specific date or may reset in the future contingent upon a predetermined trigger. The interest rate shown is the current rate as of February 28, 2019. |
| (d) | | Variable or floating rate security, linked to the referenced benchmark. The interest rate shown is the current rate as of February 28, 2019. |
| (e) | | Investment in affiliate. Fund is registered under the Investment Company Act of 1940, as amended, and advised by J.P. Morgan Investment Management Inc. |
| (f) | | The rate shown is the current yield as of February 28, 2019. |
SEE NOTES TO FINANCIAL STATEMENTS.
| | | | | | | | |
| | | |
| FEBRUARY 28, 2019 | | J.P. MORGAN EXCHANGE-TRADED FUNDS | | | | | 141 | |
STATEMENTS OF ASSETS AND LIABILITIES
AS OF FEBRUARY 28, 2019
| | | | | | | | | | | | |
| | | JPMorgan Core Plus
Bond ETF | | | JPMorgan Corporate
Bond Research
Enhanced ETF | | | JPMorgan
Disciplined High
Yield ETF | |
ASSETS: | |
Investments innon-affiliates, at value | | $ | 23,152,598 | | | $ | 25,298,328 | | | $ | 150,843,110 | |
Investments in affiliates, at value | | | 6,071,775 | | | | 307,539 | | | | 2,621,250 | |
Investments of cash collateral received from securities loaned, at value (Note 2.F.) | | | — | | | | — | | | | 4,202,920 | |
Restricted cash | | | 100 | | | | 300 | | | | 600 | |
Cash | | | 272 | | | | — | | | | 116 | |
Deposits at broker for futures contracts | | | 35,000 | | | | 15,000 | | | | — | |
Due from custodian | | | 281,096 | | | | — | | | | — | |
Deferred offering costs (Note 2.I.) | | | 9,821 | | | | 12,220 | | | | — | |
Receivables: | | | | | | | | | | | | |
Investment securities sold | | | 5,421 | | | | 36,447 | | | | — | |
Interest fromnon-affiliates | | | 114,288 | | | | 246,071 | | | | 2,237,862 | |
Dividends from affiliates | | | 13,154 | | | | 449 | | | | 4,179 | |
Securities lending income (Note 2.F.) | | | — | | | | — | | | | 2,734 | |
Variation margin on futures contracts | | | — | | | | 2,652 | | | | — | |
Due from Adviser | | | 94,837 | | | | 38,038 | | | | — | |
| | | | | | | | | | | | |
Total Assets | | | 29,778,362 | | | | 25,957,044 | | | | 159,912,771 | |
| | | | | | | | | | | | |
|
LIABILITIES: | |
Payables: | | | | | | | | | | | | |
Due to custodian | | | — | | | | 1,719 | | | | — | |
Distributions | | | 63,565 | | | | 84,530 | | | | 656,580 | |
Investment securities purchased | | | 266,623 | | | | 169,496 | | | | 352,323 | |
Investment securities purchased — delayed delivery securities | | | 4,138,125 | | | | — | | | | — | |
Collateral received on securities loaned (Note 2.F.) | | | — | | | | — | | | | 4,202,920 | |
Variation margin on futures contracts | | | 11,422 | | | | — | | | | — | |
Accrued liabilities: | | | | | | | | | | | | |
Investment advisory fees | | | — | | | | — | | | | 27,518 | |
Administration fees | | | 1,452 | | | | 1,478 | | | | 8,852 | |
Custodian, Accounting and Transfer Agent fees | | | 10,548 | | | | 6,033 | | | | 16,128 | |
Trustees’ and Chief Compliance Officer’s fees | | | 82 | | | | 187 | | | | 2,142 | |
Professional Fees | | | 87,682 | | | | 86,954 | | | | 56,131 | |
Other | | | 20,761 | | | | 11,154 | | | | 19,792 | |
| | | | | | | | | | | | |
Total Liabilities | | | 4,600,260 | | | | 361,551 | | | | 5,342,386 | |
| | | | | | | | | | | | |
Net Assets | | $ | 25,178,102 | | | $ | 25,595,493 | | | $ | 154,570,385 | |
| | | | | | | | | | | | |
|
NET ASSETS: | |
Paid-in-Capital | | $ | 25,075,000 | | | $ | 25,050,000 | | | $ | 156,896,077 | |
Total distributable earnings (loss) (a) | | | 103,102 | | | | 545,493 | | | | (2,325,692 | ) |
| | | | | | | | | | | | |
Total Net Assets | | $ | 25,178,102 | | | $ | 25,595,493 | | | $ | 154,570,385 | |
| | | | | | | | | | | | |
|
Outstanding number of shares | |
(unlimited number of shares authorized — par value $0.0001) | | | 500,000 | | | | 500,000 | | | | 3,100,000 | |
| | | | | | | | | | | | |
Net asset value, per share | | $ | 50.36 | | | $ | 51.19 | | | $ | 49.86 | |
| | | | | | | | | | | | |
| | | |
Cost of investments innon-affiliates | | $ | 23,056,531 | | | $ | 24,788,786 | | | $ | 152,254,667 | |
Cost of investments in affiliates | | | 6,071,775 | | | | 307,539 | | | | 2,621,250 | |
Investment securities on loan, at value | | | — | | | | — | | | | 4,045,947 | |
Cost of investment of cash collateral | | | — | | | | — | | | | 4,202,920 | |
| (a) | Total distributable earnings has been aggregated to conform to the current presentation requirements for the adoption of the Securities and Exchange Commission’s Disclosure Update and Simplification Rule. See Note 8. |
SEE NOTES TO FINANCIAL STATEMENTS.
| | | | | | |
| | | |
| 142 | | | | J.P. MORGAN EXCHANGE-TRADED FUNDS | | FEBRUARY 28, 2019 |
STATEMENTS OF ASSETS AND LIABILITIES
AS OF FEBRUARY 28, 2019 (continued)
| | | | | | | | | | | | |
| | | JPMorgan Global Bond Opportunities
ETF | | | JPMorgan Municipal ETF | | | JPMorgan U.S. Aggregate Bond ETF | |
ASSETS: | |
Investments innon-affiliates, at value | | $ | 170,121,640 | | | $ | 30,454,466 | | | $ | 98,503,940 | |
Investments in affiliates, at value | | | 10,805,532 | | | | 1,050,773 | | | | 337,456 | |
Restricted cash | | | — | | | | 400 | | | | 700 | |
Foreign currency, at value | | | 610,325 | | | | — | | | | — | |
Deposits at broker for futures contracts | | | 846,000 | | | | — | | | | — | |
Due from custodian | | | 1,130,260 | | | | — | | | | 94,638 | |
Deferred offering costs (Note 2.I.) | | | — | | | | 10,947 | | | | 18,117 | |
Prepaid Expenses | | | — | | | | 156 | | | | — | |
Receivables: | | | | | | | | | | | | |
Investment securities sold | | | 2,163,234 | | | | 306,722 | | | | 1,885,841 | |
Investment securities sold — delayed delivery securities | | | — | | | | — | | | | 210,675 | |
Interest fromnon-affiliates | | | 1,799,056 | | | | 331,236 | | | | 585,904 | |
Dividends from affiliates | | | 17,560 | | | | 844 | | | | 1,857 | |
Tax reclaims | | | 2,388 | | | | — | | | | — | |
Variation margin on futures contracts | | | 104,075 | | | | — | | | | — | |
Unrealized appreciation on forward foreign currency exchange contracts | | | 879,761 | | | | — | | | | — | |
Due from Adviser | | | — | | | | 15,714 | | | | 40,999 | |
Other assets | | | 3,778 | | | | — | | | | — | |
| | | | | | | | | | | | |
Total Assets | | | 188,483,609 | | | | 32,171,258 | | | | 101,680,127 | |
| | | | | | | | | | | | |
|
LIABILITIES: | |
Payables: | | | | | | | | | | | | |
Distributions | | | 612,239 | | | | 68,928 | | | | 223,704 | |
Investment securities purchased | | | 7,036,073 | | | | 628,238 | | | | 2,406,354 | |
Investment securities purchased — delayed delivery securities | | | 8,000 | | | | 281,590 | | | | 210,910 | |
Unrealized depreciation on forward foreign currency exchange contracts | | | 288,757 | | | | — | | | | — | |
Accrued liabilities: | | | | | | | | | | | | |
Investment advisory fees | | | 50,004 | | | | — | | | | — | |
Administration fees | | | 10,354 | | | | 1,790 | | | | 5,110 | |
Custodian, Accounting and Transfer Agent fees | | | 23,725 | | | | 7,076 | | | | 11,491 | |
Trustees’ and Chief Compliance Officer’s fees | | | 2,419 | | | | 346 | | | | 187 | |
Professional Fees | | | 65,223 | | | | 20,987 | | | | 81,262 | |
Other | | | 29,584 | | | | 8,745 | | | | 11,027 | |
| | | | | | | | | | | | |
Total Liabilities | | | 8,126,378 | | | | 1,017,700 | | | | 2,950,045 | |
| | | | | | | | | | | | |
Net Assets | | $ | 180,357,231 | | | $ | 31,153,558 | | | $ | 98,730,082 | |
| | | | | | | | | | | | |
|
NET ASSETS: | |
Paid-in-Capital | | $ | 187,631,337 | | | $ | 30,144,117 | | | $ | 98,579,663 | |
Total distributable earnings (loss) (a) | | | (7,274,106 | ) | | | 1,009,441 | | | | 150,419 | |
| | | | | | | | | | | | |
Total Net Assets | | $ | 180,357,231 | | | $ | 31,153,558 | | | $ | 98,730,082 | |
| | | | | | | | | | | | |
|
Outstanding number of shares | |
(unlimited number of shares authorized — par value $0.0001) | | | 3,700,000 | | | | 600,000 | | | | 3,900,000 | |
| | | | | | | | | | | | |
Net asset value, per share | | $ | 48.75 | | | $ | 51.92 | | | $ | 25.32 | |
| | | | | | | | | | | | |
| | | |
Cost of investments innon-affiliates | | $ | 172,604,061 | | | $ | 29,544,673 | | | $ | 98,384,479 | |
Cost of investments in affiliates | | | 10,805,532 | | | | 1,050,773 | | | | 337,456 | |
Cost of foreign currency | | | 823,316 | | | | — | | | | — | |
| (a) | Total distributable earnings has been aggregated to conform to the current presentation requirements for the adoption of the Securities and Exchange Commission’s Disclosure Update and Simplification Rule. See Note 8. |
SEE NOTES TO FINANCIAL STATEMENTS.
| | | | | | | | |
| | | |
| FEBRUARY 28, 2019 | | J.P. MORGAN EXCHANGE-TRADED FUNDS | | | | | 143 | |
STATEMENTS OF ASSETS AND LIABILITIES
AS OF FEBRUARY 28, 2019 (continued)
| | | | | | | | | | | | |
| | | JPMorgan Ultra-Short
Income ETF | | | JPMorgan Ultra-Short
Municipal
Income ETF | | | JPMorgan USD
Emerging Markets
Sovereign Bond ETF | |
ASSETS: | |
Investments innon-affiliates, at value | | $ | 5,538,295,034 | | | $ | 58,774,370 | | | $ | 60,795,727 | |
Investments in affiliates, at value | | | 150,351,796 | | | | 146,947 | | | | 353,654 | |
Repurchase agreements, at value | | | 41,000,000 | | | | — | | | | — | |
Restricted cash | | | 4,400 | | | | 1,600 | | | | 200 | |
Cash | | | — | | | | — | | | | 18,800 | |
Deposits at broker for futures contracts | | | 1,000 | | | | — | | | | — | |
Due from custodian | | | 8,145,012 | | | | — | | | | — | |
Deferred offering costs (Note 2.I.) | | | — | | | | 11,769 | | | | — | |
Receivables: | | | | | | | | | | | | |
Investment securities sold | | | 23,594,754 | | | | — | | | | 729,798 | |
Fund shares sold | | | 65,337,756 | | | | — | | | | — | |
Interest fromnon-affiliates | | | 30,740,592 | | | | 499,630 | | | | 936,515 | |
Dividends from affiliates | | | 141,167 | | | | 2,777 | | | | 585 | |
Securities lending income (Note 2.F.) | | | 171 | | | | — | | | | 14 | |
Due from Adviser | | | 94,272 | | | | 21,505 | | | | 1,741 | |
| | | | | | | | | | | | |
Total Assets | | | 5,857,705,954 | | | | 59,458,598 | | | | 62,837,034 | |
| | | | | | | | | | | | |
|
LIABILITIES: | |
Payables: | | | | | | | | | | | | |
Distributions | | | 12,956,103 | | | | 87,492 | | | | 255,138 | |
Investment securities purchased | | | 124,195,918 | | | | 518,649 | | | | 712,711 | |
Investment securities purchased — delayed delivery securities | | | 16,411,000 | | | | 1,011,060 | | | | — | |
Accrued liabilities: | | | | | | | | | | | | |
Administration fees | | | 314,516 | | | | 3,085 | | | | 3,499 | |
Custodian, Accounting and Transfer Agent fees | | | 19,424 | | | | 9,115 | | | | 8,718 | |
Trustees’ and Chief Compliance Officer’s fees | | | 14,801 | | | | 323 | | | | 958 | |
Professional Fees | | | 42,052 | | | | 20,341 | | | | 51,689 | |
Other | | | 689,865 | | | | 8,942 | | | | 27,574 | |
| | | | | | | | | | | | |
Total Liabilities | | | 154,643,679 | | | | 1,659,007 | | | | 1,060,287 | |
| | | | | | | | | | | | |
Net Assets | | $ | 5,703,062,275 | | | $ | 57,799,591 | | | $ | 61,776,747 | |
| | | | | | | | | | | | |
|
NET ASSETS: | |
Paid-in-Capital | | $ | 5,700,051,569 | | | $ | 57,663,091 | | | $ | 64,284,140 | |
Total distributable earnings (loss) (a) | | | 3,010,706 | | | | 136,500 | | | | (2,507,393 | ) |
| | | | | | | | | | | | |
Total Net Assets | | $ | 5,703,062,275 | | | $ | 57,799,591 | | | $ | 61,776,747 | |
| | | | | | | | | | | | |
|
Outstanding number of shares | |
(unlimited number of shares authorized — par value $0.0001) | | | 113,600,000 | | | | 1,150,000 | | | | 1,300,000 | |
| | | | | | | | | | | | |
Net asset value, per share | | $ | 50.20 | | | $ | 50.26 | | | $ | 47.52 | |
| | | | | | | | | | | | |
| | | |
Cost of investments innon-affiliates | | $ | 5,535,687,187 | | | $ | 58,639,537 | | | $ | 62,456,832 | |
Cost of investments in affiliates | | | 150,351,796 | | | | 146,947 | | | | 353,654 | |
Cost of repurchase agreements | | | 41,000,000 | | | | — | | | | — | |
| (a) | Total distributable earnings has been aggregated to conform to the current presentation requirements for the adoption of the Securities and Exchange Commission’s Disclosure Update and Simplification Rule. See Note 8. |
SEE NOTES TO FINANCIAL STATEMENTS.
| | | | | | |
| | | |
| 144 | | | | J.P. MORGAN EXCHANGE-TRADED FUNDS | | FEBRUARY 28, 2019 |
STATEMENTS OF OPERATIONS
FOR THE PERIOD ENDED FEBRUARY 28, 2019
| | | | | | | | | | | | |
| | | JPMorgan Core Plus
Bond ETF (a) | | | JPMorgan Corporate
Bond Research
Enhanced ETF(b) | | | JPMorgan
Disciplined High
Yield ETF | |
INVESTMENT INCOME: | |
Interest income fromnon-affiliates | | $ | 57,819 | | | $ | 225,035 | | | $ | 7,441,952 | |
Interest income from affiliates | | | — | | | | — | | | | 278 | |
Dividend income from affiliates | | | 16,006 | | | | 946 | | | | 40,211 | |
Income from securities lending (net) | | | — | | | | — | | | | 8,187 | |
| | | | | | | | | | | | |
Total investment income | | | 73,825 | | | | 225,981 | | | | 7,490,628 | |
| | | | | | | | | | | | |
|
EXPENSES: | |
Investment advisory fees (Note 3.A.) | | | 6,428 | | | | 7,590 | | | | 415,308 | |
Administration fees (Note 3.B.) | | | 1,607 | | | | 4,197 | | | | 115,210 | |
Interest expense tonon-affiliates | | | 2 | | | | 3 | | | | — | |
Professional fees | | | 90,320 | | | | 86,954 | | | | 120,093 | |
Trustees’ and Chief Compliance Officer’s fees | | | 82 | | | | 202 | | | | 11,957 | |
Printing and mailing costs | | | 3,500 | | | | 3,500 | | | | 26,460 | |
Registration and filing fees | | | 4,007 | | | | 5,494 | | | | 23,884 | |
Custodian, Accounting and Transfer Agent fees (Note 3.C.) | | | 10,548 | | | | 6,033 | | | | 67,828 | |
Insurance expense | | | 22 | | | | 75 | | | | 8,123 | |
Offering costs (Note 2.I.) | | | 912 | | | | 3,181 | | | | — | |
Other | | | 2,500 | | | | 2,484 | | | | 966 | |
| | | | | | | | | | | | |
Total expenses | | | 119,928 | | | | 119,713 | | | | 789,829 | |
| | | | | | | | | | | | |
Less fee waived (Note 3.D.) | | | (8,035 | ) | | | (11,787 | ) | | | (237,697 | ) |
Less expense reimbursements from affiliates (Note 3.D.) | | | (103,377 | ) | | | (100,058 | ) | | | — | |
Less expense reimbursements fromnon-affiliates (Note 3.C.) | | | (100 | ) | | | (300 | ) | | | (2,200 | ) |
| | | | | | | | | | | | |
Net expenses | | | 8,416 | | | | 7,568 | | | | 549,932 | |
| | | | | | | | | | | | |
Net investment income (loss) | | | 65,409 | | | | 218,413 | | | | 6,940,696 | |
| | | | | | | | | | | | |
| | | |
REALIZED/UNREALIZED GAINS (LOSSES): | | | | | | | | | | | | |
Net realized gain (loss) on transactions from: | |
investments innon-affiliates | | | 686 | | | | 42,029 | | | | (861,970 | ) |
In-kind redemptions innon-affiliates | | | — | | | | — | | | | (15,001 | ) |
Futures | | | 7,689 | | | | (5,767 | ) | | | — | |
| | | | | | | | | | | | |
Net realized gain (loss) | | | 8,375 | | | | 36,262 | | | | (876,971 | ) |
| | | | | | | | | | | | |
Change in net unrealized appreciation/depreciation on: | |
Investments innon-affiliates | | | 96,067 | | | | 509,542 | | | | 742,057 | |
Futures | | | (3,184 | ) | | | (369 | ) | | | — | |
| | | | | | | | | | | | |
Change in net unrealized appreciation/depreciation | | | 92,883 | | | | 509,173 | | | | 742,057 | |
| | | | | | | | | | | | |
Net realized/unrealized gains (losses) | | | 101,258 | | | | 545,435 | | | | (134,914 | ) |
| | | | | | | | | | | | |
Change in net assets resulting from operations | | $ | 166,667 | | | $ | 763,848 | | | $ | 6,805,782 | |
| | | | | | | | | | | | |
| (a) | Commencement of operations was January 28, 2019. |
| (b) | Commencement of operations was December 12, 2018. |
SEE NOTES TO FINANCIAL STATEMENTS.
| | | | | | | | |
| | | |
| FEBRUARY 28, 2019 | | J.P. MORGAN EXCHANGE-TRADED FUNDS | | | | | 145 | |
STATEMENTS OF OPERATIONS
FOR THE PERIOD ENDED FEBRUARY 28, 2019 (continued)
| | | | | | | | | | | | |
| | | JPMorgan Global Bond
Opportunities ETF | | | JPMorgan
Municipal ETF (a) | | | JPMorgan
U.S. Aggregate
Bond ETF(b) | |
INVESTMENT INCOME: | |
Interest income fromnon-affiliates | | $ | 7,518,168 | | | $ | 266,681 | | | $ | 349,927 | |
Interest income from affiliates | | | 57 | | | | — | | | | — | |
Dividend income from affiliates | | | 177,373 | | | | 4,574 | | | | 2,838 | |
Foreign taxes withheld | | | (77,809 | ) | | | — | | | | — | |
| | | | | | | | | | | | |
Total investment income | | | 7,617,789 | | | | 271,255 | | | | 352,765 | |
| | | | | | | | | | | | |
EXPENSES: | |
Investment advisory fees (Note 3.A.) | | | 939,699 | | | | 22,371 | | | | 7,237 | |
Administration fees (Note 3.B.) | | | 142,341 | | | | 7,442 | | | | 7,885 | |
Interest expense tonon-affiliates | | | 2,043 | | | | — | | | | — | |
Interest expense to affiliates | | | 1,592 | | | | — | | | | 24 | |
Professional fees | | | 126,007 | | | | 41,423 | | | | 81,262 | |
Trustees’ and Chief Compliance Officer’s fees | | | 16,060 | | | | 408 | | | | 202 | |
Printing and mailing costs | | | 22,282 | | | | 3,500 | | | | 3,500 | |
Registration and filing fees | | | 21,331 | | | | 7,185 | | | | 5,490 | |
Custodian, Accounting and Transfer Agent fees (Note 3.C.) | | | 109,897 | | | | 12,749 | | | | 11,491 | |
Insurance expense | | | 10,566 | | | | 153 | | | | 75 | |
Offering costs (Note 2.I.) | | | 7,950 | | | | 5,295 | | | | 4,685 | |
Other | | | 2,552 | | | | 2,474 | | | | 2,484 | |
| | | | | | | | | | | | |
Total expenses | | | 1,402,320 | | | | 103,000 | | | | 124,335 | |
| | | | | | | | | | | | |
Less fee waived (Note 3.D.) | | | (470,549 | ) | | | (29,813 | ) | | | (15,122 | ) |
Less expense reimbursements from affiliates (Note 3.D.) | | | — | | | | (50,543 | ) | | | (101,167 | ) |
Less expense reimbursements fromnon-affiliates (Note 3.C.) | | | (6,600 | ) | | | (600 | ) | | | (700 | ) |
| | | | | | | | | | | | |
Net expenses | | | 925,171 | | | | 22,044 | | | | 7,346 | |
| | | | | | | | | | | | |
Net investment income (loss) | | | 6,692,618 | | | | 249,211 | | | | 345,419 | |
| | | | | | | | | | | | |
REALIZED/UNREALIZED GAINS (LOSSES): | | | | | | | | | | | | |
Net realized gain (loss) on transactions from: | |
Investments innon-affiliates | | | (4,182,974 | )(c) | | | 99,269 | | | | 22,161 | |
Investments in affiliates | | | — | | | | (27 | ) | | | — | |
Futures | | | (116,451 | ) | | | — | | | | — | |
Foreign currency transactions | | | 111,494 | | | | — | | | | — | |
Forward foreign currency exchange contracts | | | 4,459,893 | | | | — | | | | — | |
| | | | | | | | | | | | |
Net realized gain (loss) | | | 271,962 | | | | 99,242 | | | | 22,161 | |
| | | | | | | | | | | | |
Change in net unrealized appreciation/depreciation on: | |
Investments innon-affiliates | | | (2,678,222 | )(d) | | | 909,793 | | | | 119,461 | |
Futures | | | (608,346 | ) | | | — | | | | — | |
Foreign currency translations | | | (221,512 | ) | | | — | | | | — | |
Forward foreign currency exchange contracts | | | 216,665 | | | | — | | | | — | |
| | | | | | | | | | | | |
Change in net unrealized appreciation/depreciation | | | (3,291,415 | ) | | | 909,793 | | | | 119,461 | |
| | | | | | | | | | | | |
Net realized/unrealized gains (losses) | | | (3,019,453 | ) | | | 1,009,035 | | | | 141,622 | |
| | | | | | | | | | | | |
Change in net assets resulting from operations | | $ | 3,673,165 | | | $ | 1,258,246 | | | $ | 487,041 | |
| | | | | | | | | | | | |
| (a) | Commencement of operations was October 29, 2018. |
| (b) | Commencement of operations was December 12, 2018. |
| (c) | Net of foreign capital gains tax of approximately $(3,997). |
| (d) | Net change in foreign capital gains tax of approximately $11,081. |
SEE NOTES TO FINANCIAL STATEMENTS.
| | | | | | |
| | | |
| 146 | | | | J.P. MORGAN EXCHANGE-TRADED FUNDS | | FEBRUARY 28, 2019 |
STATEMENTS OF OPERATIONS
FOR THE PERIOD ENDED FEBRUARY 28, 2019 (continued)
| | | | | | | | | | | | |
| | | JPMorgan Ultra-Short
Income ETF | | | JPMorgan
Ultra-Short
Municipal
Income ETF (a) | | | JPMorgan USD
Emerging Markets
Sovereign Bond ETF | |
INVESTMENT INCOME: | |
Interest income fromnon-affiliates | | $ | 70,517,269 | | | $ | 281,269 | | | $ | 2,822,672 | |
Interest income from affiliates | | | 660 | | | | — | | | | 3 | |
Dividend income fromnon-affiliates | | | 10 | | | | — | | | | — | |
Dividend income from affiliates | | | 1,994,653 | | | | 7,915 | | | | 6,776 | |
Income from securities lending (net) | | | 434 | | | | — | | | | 60 | |
| | | | | | | | | | | | |
Total investment income | | | 72,513,026 | | | | 289,184 | | | | 2,829,511 | |
| | | | | | | | | | | | |
|
EXPENSES: | |
Investment advisory fees (Note 3.A.) | | | 3,713,459 | | | | 20,912 | | | | 169,263 | |
Administration fees (Note 3.B.) | | | 2,018,651 | | | | 11,077 | | | | 44,023 | |
Interest expense to affiliates | | | — | | | | — | | | | 32 | |
Professional fees | | | 170,646 | | | | 46,750 | | | | 113,952 | |
Trustees’ and Chief Compliance Officer’s fees | | | 90,258 | | | | 457 | | | | 5,368 | |
Printing and mailing costs | | | 148,500 | | | | 3,500 | | | | 14,751 | |
Registration and filing fees | | | 624,439 | | | | 9,805 | | | | 19,079 | |
Custodian, Accounting and Transfer Agent fees (Note 3.C.) | | | 103,718 | | | | 15,731 | | | | 43,987 | |
Insurance expense | | | 17,289 | | | | 169 | | | | 3,318 | |
Offering costs (Note 2.I.) | | | 5,910 | | | | 6,747 | | | | 43,915 | |
Other | | | 17 | | | | 467 | | | | 2,700 | |
| | | | | | | | | | | | |
Total expenses | | | 6,892,887 | | | | 115,615 | | | | 460,388 | |
| | | | | | | | | | | | |
Less fee waived (Note 3.D.) | | | (2,590,501 | ) | | | (31,989 | ) | | | (213,286 | ) |
Less expense reimbursements from affiliates (Note 3.D.) | | | — | | | | (56,962 | ) | | | (41,768 | ) |
Less expense reimbursements fromnon-affiliates (Note 3.C.) | | | (16,650 | ) | | | (2,000 | ) | | | (400 | ) |
| | | | | | | | | | | | |
Net expenses | | | 4,285,736 | | | | 24,664 | | | | 204,934 | |
| | | | | | | | | | | | |
Net investment income (loss) | | | 68,227,290 | | | | 264,520 | | | | 2,624,577 | |
| | | | | | | | | | | | |
| | | |
REALIZED/UNREALIZED GAINS (LOSSES): | | | | | | | | | | | | |
Net realized gain (loss) on transactions from: | |
Investments innon-affiliates | | | 191,002 | | | | 173 | | | | (840,894 | ) |
Investments in affiliates | | | — | | | | 13 | | | | — | |
Futures | | | 7,667 | | | | — | | | | — | |
| | | | | | | | | | | | |
Net realized gain (loss) | | | 198,669 | | | | 186 | | | | (840,894 | ) |
| | | | | | | | | | | | |
Change in net unrealized appreciation/depreciation on: | |
Investments innon-affiliates | | | 2,891,011 | | | | 134,833 | | | | (334,291 | ) |
Futures | | | (136 | ) | | | — | | | | — | |
| | | | | | | | | | | | |
Change in net unrealized appreciation/depreciation | | | 2,890,875 | | | | 134,833 | | | | (334,291 | ) |
| | | | | | | | | | | | |
Net realized/unrealized gains (losses) | | | 3,089,544 | | | | 135,019 | | | | (1,175,185 | ) |
| | | | | | | | | | | | |
Change in net assets resulting from operations | | $ | 71,316,834 | | | $ | 399,539 | | | $ | 1,449,392 | |
| | | | | | | | | | | | |
| (a) | Commencement of operations was October 16, 2018. |
SEE NOTES TO FINANCIAL STATEMENTS.
| | | | | | | | |
| | | |
| FEBRUARY 28, 2019 | | J.P. MORGAN EXCHANGE-TRADED FUNDS | | | | | 147 | |
STATEMENTS OF CHANGES IN NET ASSETS
FOR THE PERIODS INDICATED
| | | | | | | | |
| | | JPMorgan Core Plus
Bond ETF | | | JPMorgan Corporate
Bond Research Enhanced
ETF | |
| | | Period Ended February 28, 2019 (a) | | | Period Ended February 28, 2019 (b) | |
CHANGE IN NET ASSETS RESULTING FROM OPERATIONS: | |
Net investment income (loss) | | $ | 65,409 | | | $ | 218,413 | |
Net realized gain (loss) | | | 8,375 | | | | 36,262 | |
Change in net unrealized appreciation/depreciation | | | 92,883 | | | | 509,173 | |
| | | | | | | | |
Change in net assets resulting from operations | | | 166,667 | | | | 763,848 | |
| | | | | | | | |
|
DISTRIBUTIONS TO SHAREHOLDERS: | |
Total distributions to shareholders | | | (63,565 | ) | | | (218,355 | ) |
| | | | | | | | |
|
CAPITAL TRANSACTIONS: | |
Change in net assets resulting from capital transactions | | | 25,075,000 | | | | 25,050,000 | |
| | | | | | | | |
|
NET ASSETS: | |
Change in net assets | | | 25,178,102 | | | | 25,595,493 | |
Beginning of period | | | — | | | | — | |
| | | | | | | | |
End of period | | $ | 25,178,102 | | | $ | 25,595,493 | |
| | | | | | | | |
| | |
CAPITAL TRANSACTIONS: | | | | | | | | |
Proceeds from shares issued | | $ | 25,075,000 | | | $ | 25,050,000 | |
| | | | | | | | |
Total change in net assets resulting from capital transactions | | $ | 25,075,000 | | | $ | 25,050,000 | |
| | | | | | | | |
SHARE TRANSACTIONS: | |
Issued | | | 500,000 | | | | 500,000 | |
| | | | | | | | |
Net increase in shares from share transactions | | | 500,000 | | | | 500,000 | |
| | | | | | | | |
| (a) | Commencement of operations was January 28, 2019. |
| (b) | Commencement of operations was December 12, 2018. |
SEE NOTES TO FINANCIAL STATEMENTS.
| | | | | | |
| | | |
| 148 | | | | J.P. MORGAN EXCHANGE-TRADED FUNDS | | FEBRUARY 28, 2019 |
STATEMENTS OF CHANGES IN NET ASSETS
FOR THE PERIODS INDICATED (continued)
| | | | | | | | | | | | | | | | |
| | | JPMorgan Disciplined
High Yield ETF | | | JPMorgan Global Bond
Opportunities ETF | |
| | | Year Ended
February 28, 2019 | | | Year Ended
February 28, 2018 | | | Year Ended
February 28, 2019 | | | Period Ended February 28, 2018 (a) | |
CHANGE IN NET ASSETS RESULTING FROM OPERATIONS: | |
Net investment income (loss) | | $ | 6,940,696 | | | $ | 2,362,660 | | | $ | 6,692,618 | | | $ | 3,696,762 | |
Net realized gain (loss) | | | (876,971 | ) | | | (6,635 | ) | | | 271,962 | | | | (2,316,581 | ) |
Change in net unrealized appreciation/depreciation | | | 742,057 | | | | (2,542,614 | ) | | | (3,291,415 | ) | | | 931,390 | |
| | | | | | | | | | | | | | | | |
Change in net assets resulting from operations | | | 6,805,782 | | | | (186,589 | ) | | | 3,673,165 | | | | 2,311,571 | |
| | | | | | | | | | | | | | | | |
|
DISTRIBUTIONS TO SHAREHOLDERS: | |
Total distributions to shareholders (b) | | | (7,004,942 | ) | | | (2,305,921 | ) | | | (9,983,877 | ) | | | (3,275,400 | ) |
| | | | | | | | | | | | | | | | |
|
CAPITAL TRANSACTIONS: | |
Change in net assets resulting from capital transactions | | | 49,578,237 | | | | 77,109,750 | | | | 35,033,711 | | | | 152,598,061 | |
| | | | | | | | | | | | | | | | |
|
NET ASSETS: | |
Change in net assets | | | 49,379,077 | | | | 74,617,240 | | | | 28,722,999 | | | | 151,634,232 | |
Beginning of period | | | 105,191,308 | | | | 30,574,068 | | | | 151,634,232 | | | | — | |
| | | | | | | | | | | | | | | | |
End of period | | $ | 154,570,385 | | | $ | 105,191,308 | | | $ | 180,357,231 | | | $ | 151,634,232 | |
| | | | | | | | | | | | | | | | |
| | | | |
CAPITAL TRANSACTIONS: | | | | | | | | | | | | | | | | |
Proceeds from shares issued | | $ | 64,284,563 | | | $ | 77,109,750 | | | $ | 35,033,711 | | | $ | 152,598,061 | |
Cost of shares redeemed | | | (14,706,326 | ) | | | — | | | | — | | | | — | |
| | | | | | | | | | | | | | | | |
Total change in net assets resulting from capital transactions | | $ | 49,578,237 | | | $ | 77,109,750 | | | $ | 35,033,711 | | | $ | 152,598,061 | |
| | | | | | | | | | | | | | | | |
|
SHARE TRANSACTIONS: | |
Issued | | | 1,300,000 | | | | 1,500,000 | | | | 700,000 | | | | 3,000,000 | |
Redeemed | | | (300,000 | ) | | | — | | | | — | | | | — | |
| | | | | | | | | | | | | | | | |
Net increase in shares from share transactions | | | 1,000,000 | | | | 1,500,000 | | | | 700,000 | | | | 3,000,000 | |
| | | | | | | | | | | | | | | | |
| (a) | Commencement of operations was April 5, 2017. |
| (b) | The prior period distributions have been reclassified to conform to current period presentation for the adoption of the Securities and Exchange Commission’s Disclosure Update and Simplification Rule. See Note 8. Prior period balances were as follows: |
| | | | | | | | |
| | | JPMorgan Disciplined
High Yield ETF | | | JPMorgan Global Bond
Opportunities ETF | |
From net investment income | | $ | (2,305,921 | ) | | $ | (3,275,400 | ) |
SEE NOTES TO FINANCIAL STATEMENTS.
| | | | | | | | |
| | | |
| FEBRUARY 28, 2019 | | J.P. MORGAN EXCHANGE-TRADED FUNDS | | | | | 149 | |
STATEMENTS OF CHANGES IN NET ASSETS
FOR THE PERIODS INDICATED (continued)
| | | | | | | | |
| | | JPMorgan Municipal
ETF | | | JPMorgan U.S. Aggregate
Bond ETF | |
| | | Period Ended February 28, 2019 (a) | | | Period Ended February 28, 2019 (b) | |
CHANGE IN NET ASSETS RESULTING FROM OPERATIONS: | |
Net investment income (loss) | | $ | 249,211 | | | $ | 345,419 | |
Net realized gain (loss) | | | 99,242 | | | | 22,161 | |
Change in net unrealized appreciation/depreciation | | | 909,793 | | | | 119,461 | |
| | | | | | | | |
Change in net assets resulting from operations | | | 1,258,246 | | | | 487,041 | |
| | | | | | | | |
|
DISTRIBUTIONS TO SHAREHOLDERS: | |
Total distributions to shareholders | | | (248,805 | ) | | | (336,622 | ) |
| | | | | | | | |
|
CAPITAL TRANSACTIONS: | |
Change in net assets resulting from capital transactions | | | 30,144,117 | | | | 98,579,663 | |
| | | | | | | | |
|
NET ASSETS: | |
Change in net assets | | | 31,153,558 | | | | 98,730,082 | |
Beginning of period | | | — | | | | — | |
| | | | | | | | |
End of period | | $ | 31,153,558 | | | $ | 98,730,082 | |
| | | | | | | | |
| | |
CAPITAL TRANSACTIONS: | | | | | | | | |
Proceeds from shares issued | | $ | 30,144,117 | | | $ | 98,579,663 | |
| | | | | | | | |
Total change in net assets resulting from capital transactions | | $ | 30,144,117 | | | $ | 98,579,663 | |
| | | | | | | | |
|
SHARE TRANSACTIONS: | |
Issued | | | 600,000 | | | | 3,900,000 | |
| | | | | | | | |
Net increase in shares from share transactions | | | 600,000 | | | | 3,900,000 | |
| | | | | | | | |
| (a) | Commencement of operations was October 29, 2018. |
| (b) | Commencement of operations was December 12, 2018. |
SEE NOTES TO FINANCIAL STATEMENTS.
| | | | | | |
| | | |
| 150 | | | | J.P. MORGAN EXCHANGE-TRADED FUNDS | | FEBRUARY 28, 2019 |
STATEMENTS OF CHANGES IN NET ASSETS
FOR THE PERIODS INDICATED (continued)
| | | | | | | | | | | | |
| | | JPMorgan Ultra-Short Income ETF | | | JPMorgan Ultra-Short
Municipal Income ETF | |
| | | Year Ended
February 28, 2019 | | | Period Ended February 28, 2018 (a) | | | Period Ended February 28, 2019(b) | |
CHANGE IN NET ASSETS RESULTING FROM OPERATIONS: | |
Net investment income (loss) | | $ | 68,227,290 | | | $ | 1,036,708 | | | $ | 264,520 | |
Net realized gain (loss) | | | 198,669 | | | | 9,316 | | | | 186 | |
Change in net unrealized appreciation/depreciation | | | 2,890,875 | | | | (283,028 | ) | | | 134,833 | |
| | | | | | | | | | | | |
Change in net assets resulting from operations | | | 71,316,834 | | | | 762,996 | | | | 399,539 | |
| | | | | | | | | | | | |
|
DISTRIBUTIONS TO SHAREHOLDERS: | |
Total distributions to shareholders (c) | | | (68,093,896 | ) | | | (975,348 | ) | | | (263,039 | ) |
| | | | | | | | | | | | |
|
CAPITAL TRANSACTIONS: | |
Change in net assets resulting from capital transactions | | | 5,499,788,071 | | | | 200,263,618 | | | | 57,663,091 | |
| | | | | | | | | | | | |
|
NET ASSETS: | |
Change in net assets | | | 5,503,011,009 | | | | 200,051,266 | | | | 57,799,591 | |
Beginning of period | | | 200,051,266 | | | | — | | | | — | |
| | | | | | | | | | | | |
End of period | | $ | 5,703,062,275 | | | $ | 200,051,266 | | | $ | 57,799,591 | |
| | | | | | | | | | | | |
| | | |
CAPITAL TRANSACTIONS: | | | | | | | | | | | | |
Proceeds from shares issued | | $ | 5,574,934,056 | | | $ | 200,263,618 | | | $ | 57,663,091 | |
Cost of shares redeemed | | | (75,145,985 | ) | | | — | | | | — | |
| | | | | | | | | | | | |
Total change in net assets resulting from capital transactions | | $ | 5,499,788,071 | | | $ | 200,263,618 | | | $ | 57,663,091 | |
| | | | | | | | | | | | |
|
SHARE TRANSACTIONS: | |
Issued | | | 111,100,000 | | | | 4,000,000 | | | | 1,150,000 | |
Redeemed | | | (1,500,000 | ) | | | — | | | | — | |
| | | | | | | | | | | | |
Net increase in shares from share transactions | | | 109,600,000 | | | | 4,000,000 | | | | 1,150,000 | |
| | | | | | | | | | | | |
| (a) | Commencement of operations was May 17, 2017. |
| (b) | Commencement of operations was October 16, 2018. |
| (c) | The prior period distributions have been reclassified to conform to current period presentation for the adoption of the Securities and Exchange Commission’s Disclosure Update and Simplification Rule. See Note 8. Prior period balances for were as follows: |
| | | | |
| | | JPMorgan Ultra-Short
Income ETF | |
From net investment income | | $ | (975,348 | ) |
SEE NOTES TO FINANCIAL STATEMENTS.
| | | | | | | | |
| | | |
| FEBRUARY 28, 2019 | | J.P. MORGAN EXCHANGE-TRADED FUNDS | | | | | 151 | |
STATEMENTS OF CHANGES IN NET ASSETS
FOR THE PERIODS INDICATED (continued)
| | | | | | | | |
| | | JPMorgan USD Emerging Markets Sovereign Bond ETF | |
| | | Year Ended
February 28, 2019 | | | Period Ended
February 28, 2018 (a) | |
CHANGE IN NET ASSETS RESULTING FROM OPERATIONS: | |
Net investment income (loss) | | $ | 2,624,577 | | | $ | 198,418 | |
Net realized gain (loss) | | | (840,894 | ) | | | (8,117 | ) |
Change in net unrealized appreciation/depreciation | | | (334,291 | ) | | | (1,326,814 | ) |
| | | | | | | | |
Change in net assets resulting from operations | | | 1,449,392 | | | | (1,136,513 | ) |
| | | | | | | | |
|
DISTRIBUTIONS TO SHAREHOLDERS: | |
Total distributions to shareholders (b) | | | (2,651,785 | ) | | | (168,487 | ) |
|
CAPITAL TRANSACTIONS: | |
Change in net assets resulting from capital transactions | | | 9,265,211 | | | | 55,018,929 | |
| | | | | | | | |
|
NET ASSETS: | |
Change in net assets | | | 8,062,818 | | | | 53,713,929 | |
Beginning of period | | | 53,713,929 | | | | — | |
| | | | | | | | |
End of period | | $ | 61,776,747 | | | $ | 53,713,929 | |
| | | | | | | | |
| | |
CAPITAL TRANSACTIONS: | | | | | | | | |
Proceeds from shares issued | | $ | 9,265,211 | | | $ | 55,018,929 | |
|
SHARE TRANSACTIONS: | |
Issued | | | 200,000 | | | | 1,100,000 | |
| | | | | | | | |
Net increase in shares from share transactions | | | 200,000 | | | | 1,100,000 | |
| | | | | | | | |
| (a) | Commencement of operations was January 29, 2018. |
| (b) | The prior period distributions have been reclassified to conform to current period presentation for the adoption of the Securities and Exchange Commission’s Disclosure Update and Simplification Rule. See Note 8. Prior period balances were as follows: |
| | | | |
| | | JPMorgan USD Emerging
Markets Sovereign Bond ETF | |
From net investment income | | $ | (168,487 | ) |
SEE NOTES TO FINANCIAL STATEMENTS.
| | | | | | |
| | | |
| 152 | | | | J.P. MORGAN EXCHANGE-TRADED FUNDS | | FEBRUARY 28, 2019 |
THIS PAGE IS INTENTIONALLY LEFT BLANK
| | | | | | | | |
| | | |
| FEBRUARY 28, 2019 | | J.P. MORGAN EXCHANGE-TRADED FUNDS | | | | | 153 | |
FINANCIAL HIGHLIGHTS
FOR THE PERIODS INDICATED
| | | | | | | | | | | | | | | | | | | | | | | | | | | | | | | | |
| | | Per share operating performance | |
| | | | | | Investment Operations | | | Distributions | | | | |
| | | Net asset
value,
beginning
of period | | | Net
investment
income
(loss) (b) | | | Net realized
and unrealized
gains (losses) on
investments | | | Total from
investment
operations | | | Net
investment
income | | | Net
realized
gain | | | Total
distributions | | | Net asset
value,
end of
period | |
| | | | | | | | |
JPMorgan Core Plus Bond ETF | | | | | | | | | | | | | | | | | | | | | | | | | | | | | | | | |
January 28, 2019 (g) through February 28, 2019 | | $ | 50.00 | | | $ | 0.13 | | | $ | 0.36 | | | $ | 0.49 | | | $ | (0.13 | ) | | $ | — | | | $ | (0.13 | ) | | $ | 50.36 | |
| | | | | | | | |
JPMorgan Corporate Bond Research Enhanced ETF | | | | | | | | | | | | | | | | | | | | | | | | | | | | | | | | |
December 12, 2018 (g) through February 28, 2019 | | | 50.00 | | | | 0.44 | | | | 1.19 | | | | 1.63 | | | | (0.44 | ) | | | — | | | | (0.44 | ) | | | 51.19 | |
| | | | | | | | |
JPMorgan Disciplined High Yield ETF | | | | | | | | | | | | | | | | | | | | | | | | | | | | | | | | |
Year Ended February 28, 2019 | | | 50.09 | | | | 2.47 | | | | (0.23 | ) | | | 2.24 | | | | (2.47 | ) | | | — | | | | (2.47 | ) | | | 49.86 | |
Year Ended February 28, 2018 | | | 50.96 | | | | 2.44 | | | | (0.92 | ) | | | 1.52 | | | | (2.39 | ) | | | — | | | | (2.39 | ) | | | 50.09 | |
September 14, 2016 (g) through February 28, 2017 | | | 50.00 | | | | 1.14 | | | | 0.96 | | | | 2.10 | | | | (1.14 | ) | | | — | (j) | | | (1.14 | ) | | | 50.96 | |
| | | | | | | | |
JPMorgan Global Bond Opportunities ETF | | | | | | | | | | | | | | | | | | | | | | | | | | | | | | | | |
Year Ended February 28, 2019 | | | 50.54 | | | | 1.94 | | | | (0.97 | ) | | | 0.97 | | | | (2.56 | ) | | | (0.20 | ) | | | (2.76 | ) | | | 48.75 | |
April 5, 2017 (g) through February 28, 2018 | | | 50.00 | | | | 1.83 | | | | 0.05 | (k) | | | 1.88 | | | | (1.34 | ) | | | — | | | | (1.34 | ) | | | 50.54 | |
| | | | | | | | |
JPMorgan Municipal ETF | | | | | | | | | | | | | | | | | | | | | | | | | | | | | | | | |
October 29, 2018 (g) through February 28, 2019 | | | 50.00 | | | | 0.46 | | | | 1.90 | | | | 2.36 | | | | (0.44 | ) | | | — | | | | (0.44 | ) | | | 51.92 | |
| | | | | | | | |
JPMorgan U.S. Aggregate Bond ETF | | | | | | | | | | | | | | | | | | | | | | | | | | | | | | | | |
December 12, 2018 (g) through February 28, 2019 | | | 25.00 | | | | 0.18 | | | | 0.29 | | | | 0.47 | | | | (0.15 | ) | | | — | | | | (0.15 | ) | | | 25.32 | |
| | | | | | | | |
JPMorgan Ultra-Short Income ETF | | | | | | | | | | | | | | | | | | | | | | | | | | | | | | | | |
Year Ended February 28, 2019 | | | 50.01 | | | | 1.37 | | | | (0.04 | )(k) | | | 1.33 | | | | (1.14 | ) | | | — | | | | (1.14 | ) | | | 50.20 | |
May 17, 2017 (g) through February 28, 2018 | | | 50.00 | | | | 0.70 | | | | (0.08 | ) | | | 0.62 | | | | (0.61 | ) | | | — | | | | (0.61 | ) | | | 50.01 | |
| | | | | | | | |
JPMorgan Ultra-Short Municipal Income ETF | | | | | | | | | | | | | | | | | | | | | | | | | | | | | | | | |
October 16, 2018 (g) through February 28, 2019 | | | 50.00 | | | | 0.35 | | | | 0.23 | | | | 0.58 | | | | (0.32 | ) | | | — | | | | (0.32 | ) | | | 50.26 | |
| | | | | | | | |
JPMorgan USD Emerging Markets Sovereign Bond ETF | | | | | | | | | | | | | | | | | | | | | | | | | | | | | | | | |
Year Ended February 28, 2019 | | | 48.83 | | | | 2.31 | | | | (1.30 | ) | | | 1.01 | | | | (2.32 | ) | | | — | | | | (2.32 | ) | | | 47.52 | |
January 29, 2018 (g) through February 28, 2018 | | | 50.00 | | | | 0.19 | | | | (1.21 | ) | | | (1.02 | ) | | | (0.15 | ) | | | — | | | | (0.15 | ) | | | 48.83 | |
| (a) | Annualized for periods less than one year, unless otherwise indicated. |
| (b) | Calculated based upon average shares outstanding. |
| (c) | Not annualized for periods less than one year. |
| (d) | Includes adjustments in accordance with accounting principles generally accepted in the United States of America and as such, the net asset values for financial reporting purposes and the returns based upon those net asset values may differ from the net asset values and returns for shareholder transactions. |
| (e) | Market price total return is calculated assuming an initial investment made at the beginning of the period market price, reinvestment of all dividends and distributions at market price during the period, and sale at the market price on the last day of the period. The market price presented to calculate the market price total return is themid-point of the bid/ask spread at the close of business for the Core Plus Bond ETF, Disciplined High Yield ETF, Global Bond Opportunities ETF, Municipal ETF, Ultra-Short Municipal Income ETF and Ultra-Short Income ETF on the Cboe BZX Exchange, Inc. and on the NYSE Arca, Inc. for the Corporate Bond Research Enhanced ETF, U.S. Aggregate Bond ETF and USD Emerging Markets Sovereign Bond ETF. |
| (f) | Since the Shares of the Fund did not trade in the secondary market until the day after the Fund’s inception, for the period from the inception to the first day of secondary market trading, the NAV is used as a proxy for the secondary market trading price to calculate the market returns. |
| (g) | Commencement of operations. |
| (h) | Certainnon-recurring expenses incurred by the Fund were not annualized for the period indicated. |
| (i) | Amount rounds to less than 0.5%. |
| (j) | Amount rounds to less than $0.005. |
| (k) | Calculation of the net realized and unrealized gains (losses) per share do not correlate with the Fund’s net realized and unrealized gains (losses) presented in the Statements of Operations due to the timing of capital transactions in relation to the fluctuating market values of the Fund’s investments. |
SEE NOTES TO FINANCIAL STATEMENTS.
| | | | | | |
| | | |
| 154 | | | | J.P. MORGAN EXCHANGE-TRADED FUNDS | | FEBRUARY 28, 2019 |
| | | | | | | | | | | | | | | | | | | | | | | | | | | | | | |
| Ratios/Supplemental data | |
| | | | | | | | | | | | | Ratios to average net assets (a) | | | | |
Market price, end of period | | | Total return (c)(d) | | | Market price total
return (c)(e) | | | Net assets, end of period | | | Net expenses | | | Net investment income
(loss) | | | Expenses without waivers and
reimbursements | | | Portfolio
turnover
rate (c) | |
| | | | | | | |
| | | | | | | | | | | | | | | | | | | | | | | | | | | | | | |
| | $50.48 | | | | 0.97 | % | | | 1.21 | %(f) | | $ | 25,178,102 | | | | 0.38 | %(h) | | | 2.96 | % | | | 5.38 | %(h) | | | — | %(i) |
| | | | | | | |
| | | | | | | | | | | | | | | | | | | | | | | | | | | | | | |
| | 51.30 | | | | 3.26 | | | | 3.48 | (f) | | | 25,595,493 | | | | 0.14 | (h) | | | 3.98 | | | | 2.13 | (h) | | | 12 | |
| | | | | | | |
| | | | | | | | | | | | | | | | | | | | | | | | | | | | | | |
| | 49.82 | | | | 4.66 | | | | 4.00 | | | | 154,570,385 | | | | 0.40 | | | | 5.01 | | | | 0.57 | | | | 23 | |
| | 50.36 | | | | 3.00 | | | | 3.12 | | | | 105,191,308 | | | | 0.40 | | | | 4.78 | | | | 0.98 | | | | 23 | |
| | 51.16 | | | | 4.24 | | | | 4.64 | (f) | | | 30,574,068 | | | | 0.39 | (h) | | | 4.99 | | | | 1.74 | (h) | | | 8 | |
| | | | | | | |
| | | | | | | | | | | | | | | | | | | | | | | | | | | | | | |
| | 48.83 | | | | 2.09 | | | | 2.13 | | | | 180,357,231 | | | | 0.54 | | | | 3.92 | | | | 0.82 | | | | 73 | |
| | 50.60 | | | | 3.76 | | | | 3.88 | (f) | | | 151,634,232 | | | | 0.53 | (h) | | | 3.98 | | | | 1.10 | (h) | | | 52 | |
| | | | | | | |
| | | | | | | | | | | | | | | | | | | | | | | | | | | | | | |
| | 52.01 | | | | 4.74 | | | | 4.92 | (f) | | | 31,153,558 | | | | 0.23 | (h) | | | 2.65 | | | | 1.06 | (h) | | | 15 | |
| | | | | | | |
| | | | | | | | | | | | | | | | | | | | | | | | | | | | | | |
| | 25.34 | | | | 1.90 | | | | 1.98 | (f) | | | 98,730,082 | | | | 0.07 | (h) | | | 3.26 | | | | 1.14 | (h) | | | 53 | |
| | | | | | | |
| | | | | | | | | | | | | | | | | | | | | | | | | | | | | | |
| | 50.23 | | | | 2.68 | | | | 2.66 | | | | 5,703,062,275 | | | | 0.17 | | | | 2.74 | | | | 0.28 | | | | 43 | |
| | 50.05 | | | | 1.25 | | | | 1.33 | (f) | | | 200,051,266 | | | | 0.16 | (h) | | | 1.77 | | | | 0.55 | (h) | | | 25 | |
| | | | | | | |
| | | | | | | | | | | | | | | | | | | | | | | | | | | | | | |
| | 50.29 | | | | 1.16 | | | | 1.22 | (f) | | | 57,799,591 | | | | 0.17 | (h) | | | 1.88 | | | | 0.79 | (h) | | | 61 | |
| | | | | | | |
| | | | | | | | | | | | | | | | | | | | | | | | | | | | | | |
| | 47.62 | | | | 2.29 | | | | 2.23 | | | | 61,776,747 | | | | 0.39 | | | | 4.96 | | | | 0.87 | | | | 28 | |
| | 48.95 | | | | (2.03 | ) | | | (1.79 | )(f) | | | 53,713,929 | | | | 0.35 | (h) | | | 4.79 | | | | 2.74 | (h) | | | 2 | |
SEE NOTES TO FINANCIAL STATEMENTS.
| | | | | | | | |
| | | |
| FEBRUARY 28, 2019 | | J.P. MORGAN EXCHANGE-TRADED FUNDS | | | | | 155 | |
NOTES TO FINANCIAL STATEMENTS
AS OF FEBRUARY 28, 2019
1. Organization
J.P. Morgan Exchange-Traded Fund Trust (the “Trust”) was formed on February 25, 2010, and is governed by a Declaration of Trust as amended and restated February 19, 2014, and is registered under the Investment Company Act of 1940, as amended (the “1940 Act”), as anopen-end management investment company.
The following are 9 separate funds of the Trust (each, a “Fund” and collectively, the “Funds”) covered by this report:
| | |
| | | Diversified/Non-Diversified |
| JPMorgan Core Plus Bond ETF | | Diversified |
| JPMorgan Corporate Bond Research Enhanced ETF | | Diversified |
| JPMorgan Disciplined High Yield ETF | | Diversified |
| JPMorgan Global Bond Opportunities ETF | | Diversified |
| JPMorgan Municipal ETF | | Diversified |
| JPMorgan U.S. Aggregate Bond ETF | | Diversified |
| JPMorgan Ultra-Short Income ETF | | Diversified |
| JPMorgan Ultra-Short Municipal Income ETF | | Diversified |
| JPMorgan USD Emerging Markets Sovereign Bond ETF | | Diversified |
JPMorgan Core Plus Bond ETF (the “Core Plus Bond ETF”) commenced operations on January 28, 2019. The investment objective of the Fund is to seek a high level of current income by investing primarily in a diversified portfolio of high-, medium- andlow-grade debt securities.
JPMorgan Corporate Bond Research Enhanced ETF (the “Corporate Bond Research Enhanced ETF”) commenced operations on December 12, 2018. The investment objective of the Fund is to seek to provide total return.
JPMorgan Disciplined High Yield ETF (the “Disciplined High Yield ETF”) commenced operations on September 14, 2016. The investment objective of the Fund is to seek to provide a high level of income with capital appreciation as a secondary objective.
JPMorgan Global Bond Opportunities ETF (the “Global Bond Opportunities ETF”) commenced operations on April 5, 2017. The investment objective of the Fund is to seek to provide total return.
JPMorgan Municipal ETF (the “Municipal ETF”) commenced operations on October 29, 2018. The investment objective of the Fund is to seek to provide monthly dividends, which are excluded from gross income, and to protect the value of your investment by investing primarily in municipal obligations. For purposes of the Fund’s investment objective, “gross income” means gross income for federal income tax purposes.
JPMorgan U.S. Aggregate Bond ETF (the “U.S. Aggregate Bond ETF”) commenced operations on December 12, 2018. The investment objective of the Fund is to seek long-term total return.
JPMorgan Ultra-Short Income ETF (the “Ultra-Short Income ETF”) commenced operations on May 17, 2017. The investment objective of the Fund is to seek to provide current income while seeking to maintain a low volatility of principal.
JPMorgan Ultra-Short Municipal Income ETF (the “Ultra-Short Municipal Income ETF”) commenced operations on October 16, 2018. The investment objective of the Fund is to seek to provide as high a level of current income exempt from federal income tax as is consistent with relative stability of principal.
JPMorgan USD Emerging Markets Sovereign Bond ETF (the “USD Emerging Markets Sovereign Bond ETF”) commenced operations on January 29, 2018. The investment objective of the Fund is to seek investment results that closely correspond, before fees and expenses, to the performance of the JPMorgan Emerging Markets Risk-Aware Bond Index.
J.P. Morgan Investment Management Inc. (“JPMIM”), an indirect, wholly-owned subsidiary of JPMorgan Chase & Co. (“JPMorgan”), acts as Adviser (the “Adviser”) and Administrator (the “Administrator”) to the Funds.
Shares of Core Plus Bond ETF, Disciplined High Yield ETF, Global Bond Opportunities ETF, Municipal ETF, Ultra-Short Municipal Income ETF and Ultra-Short Income ETF are listed and traded on the Cboe BZX Exchange, Inc. Shares of Corporate Bond Research Enhanced ETF, U.S. Aggregate Bond ETF and USD Emerging Markets Sovereign Bond ETF are listed and traded on the NYSE Arca, Inc. Market prices for the Funds’ shares may be different from their net asset value (“NAV”). The Funds issue and redeem their shares on a continuous basis, through JPMorgan Distribution
| | | | | | |
| | | |
| 156 | | | | J.P. MORGAN EXCHANGE-TRADED FUNDS | | FEBRUARY 28, 2019 |
Services, Inc. (the “Distributor” or “JPMDS”), an indirect, wholly-owned subsidiary of JPMorgan, at NAV in large blocks of shares, referred to as “Creation Units” as shown in the table below:
| | | | |
| | | Shares per Creation Unit | |
Core Plus Bond ETF | | | 100,000 | |
Corporate Bond Research Enhanced ETF | | | 25,000 | |
Disciplined High Yield ETF | | | 100,000 | |
Global Bond Opportunities ETF | | | 100,000 | |
Municipal ETF | | | 50,000 | |
U.S. Aggregate Bond ETF | | | 50,000 | |
Ultra-Short Income ETF | | | 50,000 | |
Ultra-Short Municipal Income ETF | | | 50,000 | |
USD Emerging Markets Sovereign Bond ETF | | | 100,000 | |
The Funds may elect creations and redemptions in cash or partially in cash. Shares are generally traded in the secondary market in amounts less than a Creation Unit at market prices that change throughout the day. Only individuals or institutions that have entered into an authorized participant agreement with the Distributor may do business directly with the Funds (each, an “Authorized Participant”).
2. Significant Accounting Policies
The following is a summary of significant accounting policies followed by the Funds in the preparation of their financial statements. The Funds are investment companies and, thus, follow the investment company accounting and reporting guidance of the Financial Accounting Standards Board Accounting Standards Codification Topic 946— Investment Companies, which is part of U.S. generally accepted accounting principles (“GAAP”). The preparation of financial statements in conformity with GAAP requires management to make estimates and assumptions that affect the reported amounts of assets and liabilities and disclosure of contingent assets and liabilities at the date of the financial statements and the reported amounts of increases and decreases in net assets from operations during the reporting period. Actual results could differ from those estimates.
A. Valuation of Investments — The valuation of investments is in accordance with GAAP and the Funds’ valuation policies set forth by and under the supervision and responsibility of the Board of Trustees (the “Board”), which established the following approach to valuation, as described more fully below: (i) investments for which market quotations are readily available shall be valued at their market value and (ii) all other investments for which market quotations are not readily available shall be valued at their fair value as determined in good faith by the Board.
The Administrator has established the J.P. Morgan Asset Management Americas Valuation Committee (“AVC”) to assist the Board with the oversight and monitoring of the valuation of the Funds’ investments. The Administrator implements the valuation policies of the Funds’ investments, as directed by the Board. The AVC oversees and carries out the policies for the valuation of investments held in the Funds. This includes monitoring the appropriateness of fair values based on results of ongoing valuation oversight including, but not limited to, consideration of macro or security specific events, market events and pricing vendor and broker due diligence. The Administrator is responsible for discussing and assessing the potential impacts to the fair values on an ongoing basis, and at least on a quarterly basis with the AVC and the Board.
A market-based approach is primarily used to value the Funds’ investments. Investments for which market quotations are not readily available are fair valued by approved affiliated and unaffiliated pricing vendors or third party broker-dealers (collectively referred to as “Pricing Services”) or may be internally fair valued using methods set forth by the valuation policies approved by the Board. This may include related or comparable assets or liabilities, recent transactions, market multiples, book values and other relevant information for the investment to determine the fair value of the investment. An income-based valuation approach may be used in which the anticipated future cash flows of the investment are discounted to calculate the fair value. Discounts may also be applied due to the nature or duration of any restrictions on the disposition of the investments. Valuations may be based upon current market prices of securities that are comparable in coupon, rating, maturity and industry. It is possible that the estimated values may differ significantly from the values that would have been used, had a ready market for the investments existed, and such differences could be material.
Fixed income instruments are valued based on prices received from Pricing Services. The Pricing Services use multiple valuation techniques to determine the valuation of fixed income instruments. In instances where sufficient market activity exists, the Pricing Services may utilize a market based approach through which trades or quotes from market makers are used to determine the valuation of these instruments. In instances where sufficient market activity may not exist, the Pricing Services also utilize proprietary valuation models which may consider market transactions in comparable securities and the various relationships between securities in determining fair value and/or market characteristics in order to estimate the relevant cash flows, which are then discounted to calculate the fair values.
Investments inopen-end investment companies, excluding exchange traded funds (“ETFs”) (the “Underlying Funds”), are valued at each Underlying Fund’s NAV per share as of the report date.
Futures contracts are generally valued on the basis of available market quotations. Forward foreign currency exchange contracts are valued utilizing market quotations from approved Pricing Services.
| | | | | | | | |
| | | |
| FEBRUARY 28, 2019 | | J.P. MORGAN EXCHANGE-TRADED FUNDS | | | | | 157 | |
NOTES TO FINANCIAL STATEMENTS
AS OF FEBRUARY 28, 2019 (continued)
See the table on “Quantitative Information about Level 3 Fair Value Measurements” for information on the valuation techniques and inputs used to value level 3 securities held by Global Bond Opportunities ETF at February 28, 2019.
Valuations reflected in this report are as of the report date. As a result, changes in valuation due to market events and/or issuer related events after the report date and prior to issuance of the report are not reflected herein.
The various inputs that are used in determining the valuation of the Funds’ investments are summarized into the three broad levels listed below.
| • | | Level 1 — Unadjusted inputs using quoted prices in active markets for identical investments. |
| • | | Level 2 — Other significant observable inputs including, but not limited to, quoted prices for similar investments, inputs other than quoted prices that are observable for investments (such as interest rates, prepayment speeds, credit risk, etc.) or other market corroborated inputs. |
| • | | Level 3 — Significant inputs based on the best information available in the circumstances, to the extent observable inputs are not available (including the Funds’ assumptions in determining the fair value of investments). |
A financial instrument’s level within the fair value hierarchy is based on the lowest level of any input, both individually and in the aggregate, that is significant to the fair value measurement. The inputs or methodology used for valuing instruments are not necessarily an indication of the risk associated with investing in those instruments.
The following tables represent each valuation input as presented on the Schedules of Portfolio Investments (“SOIs”):
Core Plus Bond ETF
| | | | | | | | | | | | | | | | |
| | | Level 1 Quoted prices | | | Level 2 Other significant
observable inputs | | | Level 3 Significant unobservable inputs | | | Total | |
Investments in Securities | | | | | | | | | | | | | | | | |
Debt Securities | | | | | | | | | | | | | | | | |
Asset-Backed Securities | | $ | — | | | $ | 4,041,236 | | | $ | — | | | $ | 4,041,236 | |
Collateralized Mortgage Obligations | | | — | | | | 2,012,370 | | | | — | | | | 2,012,370 | |
Commercial Mortgage-Backed | | | | | | | | | | | | | | | | |
Securities | | | — | | | | 665,045 | | | | — | | | | 665,045 | |
Convertible Bonds | | | — | | | | 4,295 | | | | — | | | | 4,295 | |
Corporate Bonds | | | — | | | | 7,194,322 | | | | — | | | | 7,194,322 | |
Mortgage-Backed Securities | | | — | | | | 5,086,046 | | | | | | | | 5,086,046 | |
U.S. Treasury Obligations | | | — | | | | 4,149,284 | | | | — | | | | 4,149,284 | |
Short-Term Investments | | | | | | | | | | | | | | | | |
Investment Companies | | | 6,071,775 | | | | — | | | | — | | | | 6,071,775 | |
| | | | | | | | | | | | | | | | |
Total Investments in Securities | | $ | 6,071,775 | | | $ | 23,152,598 | | | $ | — | | | $ | 29,224,373 | |
| | | | | | | | | | | | | | | | |
Depreciation in Other Financial Instruments | | | | | | | | | | | | | | | | |
Futures Contracts | | $ | (3,184 | ) | | $ | — | | | $ | — | | | $ | (3,184 | ) |
| | | | | | | | | | | | | | | | |
Corporate Bond Research Enhanced ETF
| | | | | | | | | | | | | | | | |
| | | Level 1 Quoted prices | | | Level 2 Other significant
observable inputs | | | Level 3 Significant unobservable inputs | | | Total | |
Investments in Securities | | | | | | | | | | | | | | | | |
Debt Securities | | | | | | | | | | | | | | | | |
Corporate Bonds | | $ | — | | | $ | 24,760,226 | | | $ | — | | | $ | 24,760,226 | |
U.S. Treasury Obligations | | | — | | | | 538,102 | | | | — | | | | 538,102 | |
Short-Term Investments | | | | | | | | | | | | | | | | |
Investment Companies | | | 307,539 | | | | — | | | | — | | | | 307,539 | |
| | | | | | | | | | | | | | | | |
Total Investments in Securities | | $ | 307,539 | | | $ | 25,298,328 | | | $ | — | | | $ | 25,605,867 | |
| | | | | | | | | | | | | | | | |
Appreciation in Other Financial Instruments | | | | | | | | | | | | | |
Futures Contracts | | $ | 1,169 | | | $ | — | | | $ | — | | | $ | 1,169 | |
| | | | | | | | | | | | | | | | |
Depreciation in Other Financial Instruments | | | | | | | | | | | | | |
Futures Contracts | | $ | (1,538 | ) | | $ | — | | | $ | — | | | $ | (1,538 | ) |
| | | | | | | | | | | | | | | | |
| | | | | | |
| | | |
| 158 | | | | J.P. MORGAN EXCHANGE-TRADED FUNDS | | FEBRUARY 28, 2019 |
Disciplined High Yield ETF
| | | | | | | | | | | | | | | | |
| | | Level 1 Quoted prices | | | Level 2 Other significant
observable inputs | | | Level 3 Significant unobservable inputs | | | Total | |
Investments in Securities | | | | | | | | | | | | | | | | |
Debt Securities | | | | | | | | | | | | | | | | |
Corporate Bonds | | | | | | | | | | | | | | | | |
Wireless Telecommunication Services | | $ | — | | | $ | 6,236,456 | | | $ | — | (a) | | $ | 6,236,456 | |
Other Corporate Bonds | | | — | | | | 144,606,654 | | | | — | | | | 144,606,654 | |
| | | | | | | | | | | | | | | | |
Total Corporate Bonds | | | — | | | | 150,843,110 | | | | — | (a) | | | 150,843,110 | |
| | | | | | | | | | | | | | | | |
Short-Term Investments | | | | | | | | | | | | | | | | |
Investment Companies | | | 2,621,250 | | | | — | | | | — | | | | 2,621,250 | |
Investment of Cash Collateral from Securities Loaned | | | 4,202,920 | | | | — | | | | — | | | | 4,202,920 | |
| | | | | | | | | | | | | | | | |
Total Investments in Securities | | $ | 6,824,170 | | | $ | 150,843,110 | | | $ | — | (a) | | $ | 157,667,280 | |
| | | | | | | | | | | | | | | | |
Global Bond Opportunities ETF
| | | | | | | | | | | | | | | | |
| | | Level 1 Quoted prices | | | Level 2 Other significant
observable inputs | | | Level 3 Significant unobservable inputs | | | Total | |
Investments in Securities | | | | | | | | | | | | | | | | |
Debt Securities | | | | | | | | | | | | | | | | |
Asset-Backed Securities | | | | | | | | | | | | | | | | |
Cayman Islands | | $ | — | | | $ | 755,210 | | | $ | 425,781 | | | $ | 1,180,991 | |
United States | | | — | | | | 9,273,632 | | | | 4,653,873 | | | | 13,927,505 | |
| | | | | | | | | | | | | | | | |
Total Asset-Backed Securities | | | — | | | | 10,028,842 | | | | 5,079,654 | | | | 15,108,496 | |
| | | | | | | | | | | | | | | | |
Collateralized Mortgage Obligations | | | — | | | | 5,758,091 | | | | — | | | | 5,758,091 | |
Commercial Mortgage-Backed Securities | | | — | | | | 7,469,628 | | | | 2,809,277 | | | | 10,278,905 | |
Corporate Bonds | | | | | | | | | | | | | | | | |
United States | | | — | | | | 45,499,993 | | | | — | (a) | | | 45,499,993 | |
Other Corporate Bonds | | | — | | | | 48,209,153 | | | | — | | | | 48,209,153 | |
| | | | | | | | | | | | | | | | |
Total Corporate Bonds | | | — | | | | 93,709,146 | | | | — | (a) | | | 93,709,146 | |
| | | | | | | | | | | | | | | | |
Mortgage-Backed Securities | | | — | | | | 7,002,630 | | | | — | | | | 7,002,630 | |
Foreign Government Securities | | | — | | | | 34,364,976 | | | | — | | | | 34,364,976 | |
U.S. Treasury Obligations | | | — | | | | 2,084,904 | | | | — | | | | 2,084,904 | |
Warrants | | | — | | | | 858 | | | | — | | | | 858 | |
Short-Term Investments | | | | | | | | | | | | | | | | |
Foreign Government Treasury Bills | | | — | | | | 1,813,634 | | | | — | | | | 1,813,634 | |
Investment Companies | | | 10,805,532 | | | | — | | | | — | | | | 10,805,532 | |
| | | | | | | | | | | | | | | | |
Total Short-Term Investments | | | 10,805,532 | | | | 1,813,634 | | | | — | | | | 12,619,166 | |
| | | | | | | | | | | | | | | | |
Total Investments in Securities | | $ | 10,805,532 | | | $ | 162,232,709 | | | $ | 7,888,931 | | | $ | 180,927,172 | |
| | | | | | | | | | | | | | | | |
Appreciation in Other Financial Instruments | | | | | | | | | | | | | | | | |
Forward Foreign Currency Exchange | | | | | | | | | | | | | | | | |
Contracts | | $ | — | | | $ | 879,761 | | | $ | — | | | $ | 879,761 | |
Futures Contracts | | | 47,295 | | | | — | | | | — | | | | 47,295 | |
| | | | | | | | | | | | | | | | |
Total Appreciation in Other Financial Instruments | | $ | 47,295 | | | $ | 879,761 | | | $ | — | | | $ | 927,056 | |
| | | | | | | | | | | | | | | | |
Depreciation in Other Financial Instruments | | | | | | | | | | | | | | | | |
Forward Foreign Currency Exchange | | | | | | | | | | | | | | | | |
Contracts | | $ | — | | | $ | (288,757 | ) | | $ | — | | | $ | (288,757 | ) |
Futures Contracts | | | (301,086 | ) | | | — | | | | — | | | | (301,086 | ) |
| | | | | | | | | | | | | | | | |
Total Depreciation in Other Financial Instruments | | $ | (301,086 | ) | | $ | (288,757 | ) | | $ | — | | | $ | (589,843 | ) |
| | | | | | | | | | | | | | | | |
| | | | | | | | |
| | | |
| FEBRUARY 28, 2019 | | J.P. MORGAN EXCHANGE-TRADED FUNDS | | | | | 159 | |
NOTES TO FINANCIAL STATEMENTS
AS OF FEBRUARY 28, 2019 (continued)
Municipal ETF
| | | | | | | | | | | | | | | | |
| | | Level 1 Quoted prices | | | Level 2 Other significant
observable inputs | | | Level 3 Significant unobservable inputs | | | Total | |
Total Investments in Securities (b) | | | $ 1,050,773 | | | | $ 30,454,466 | | | | $— | | | | $31,505,239 | |
| | | | | | | | | | | | | | | | |
U.S. Aggregate Bond ETF
| | | | | | | | | | | | | | | | |
| | | Level 1 Quoted prices | | | Level 2 Other significant
observable inputs | | | Level 3 Significant unobservable inputs | | | Total | |
Investments in Securities | | | | | | | | | | | | | | | | |
Debt Securities | | | | | | | | | | | | | | | | |
Asset-Backed Securities | | | $ — | | | | $ 506,584 | | | | $— | | | | $ 506,584 | |
Commercial Mortgage-Backed | | | | | | | | | | | | | | | | |
Securities | | | — | | | | 1,896,748 | | | | — | | | | 1,896,748 | |
Corporate Bonds | | | — | | | | 25,080,460 | | | | — | | | | 25,080,460 | |
Foreign Government Securities | | | — | | | | 1,963,451 | | | | — | | | | 1,963,451 | |
Mortgage-Backed Securities | | | — | | | | 27,732,171 | | | | — | | | | 27,732,171 | |
Municipal Bonds | | | — | | | | 605,436 | | | | — | | | | 605,436 | |
Supranational | | | — | | | | 1,419,691 | | | | — | | | | 1,419,691 | |
U.S. Government Agency Securities | | | — | | | | 1,113,093 | | | | — | | | | 1,113,093 | |
U.S. Treasury Obligations | | | — | | | | 38,186,306 | | | | — | | | | 38,186,306 | |
Short-Term Investments | | | | | | | | | | | | | | | | |
Investment Companies | | | 337,456 | | | | — | | | | — | | | | 337,456 | |
| | | | | | | | | | | | | | | | |
Total Investments in Securities | | | $ 337,456 | | | | $ 98,503,940 | | | | $— | | | | $ 98,841,396 | |
| | | | | | | | | | | | | | | | |
Ultra-Short Income ETF
| | | | | | | | | | | | | | | | |
| | | Level 1 Quoted prices | | | Level 2 Other significant
observable inputs | | | Level 3 Significant unobservable inputs | | | Total | |
Investments in Securities | | | | | | | | | | | | | | | | |
Debt Securities | | | | | | | | | | | | | | | | |
Asset-Backed Securities | | $ | — | | | $ | 597,846,308 | | | $ | 14,773,438 | | | $ | 612,619,746 | |
Certificates of Deposit | | | — | | | | 113,834,768 | | | | — | | | | 113,834,768 | |
Commercial Mortgage-Backed | | | | | | | | | | | | | | | | |
Securities | | | — | | | | 23,586,243 | | | | — | | | | 23,586,243 | |
Corporate Bonds | | | — | | | | 4,031,900,751 | | | | — | | | | 4,031,900,751 | |
Foreign Government Securities | | | — | | | | 1,950,450 | | | | — | | | | 1,950,450 | |
U.S. Treasury Obligations | | | — | | | | 95,777,007 | | | | — | | | | 95,777,007 | |
Short-Term Investments | | | | | | | | | | | | | | | | |
Certificates of Deposit | | | — | | | | 158,867,462 | | | | — | | | | 158,867,462 | |
Commercial Paper | | | — | | | | 499,758,607 | | | | — | | | | 499,758,607 | |
Investment Companies | | | 150,351,796 | | | | — | | | | — | | | | 150,351,796 | |
Repurchase Agreements | | | — | | | | 41,000,000 | | | | — | | | | 41,000,000 | |
| | | | | | | | | | | | | | | | |
Total Short-Term Investments | | | 150,351,796 | | | | 699,626,069 | | | | — | | | | 849,977,865 | |
| | | | | | | | | | | | | | | | |
Total Investments in Securities | | $ | 150,351,796 | | | $ | 5,564,521,596 | | | $ | 14,773,438 | | | $ | 5,729,646,830 | |
| | | | | | | | | | | | | | | | |
Ultra-Short Municipal Income ETF
| | | | | | | | | | | | | | | | |
| | | Level 1 Quoted prices | | | Level 2 Other significant
observable inputs | | | Level 3 Significant unobservable inputs | | | Total | |
Total Investments in Securities (b) | | | $ 146,947 | | | | $ 58,774,370 | | | | $— | | | | $ 58,921,317 | |
| | | | | | | | | | | | | | | | |
| | | | | | |
| | | |
| 160 | | | | J.P. MORGAN EXCHANGE-TRADED FUNDS | | FEBRUARY 28, 2019 |
USD Emerging Markets Sovereign Bond ETF
| | | | | | | | | | | | | | | | |
| | | Level 1 Quoted prices | | | Level 2 Other significant
observable inputs | | | Level 3 Significant unobservable inputs | | | Total | |
Investments in Securities | | | | | | | | | | | | | | | | |
Debt Securities | | | | | | | | | | | | | | | | |
Corporate Bonds | | $ | — | | | $ | 8,255,663 | | | $ | — | | | $ | 8,255,663 | |
Foreign Government Securities | | | — | | | | 52,540,064 | | | | — | | | | 52,540,064 | |
Short-Term Investments | | | | | | | | | | | | | | | | |
Investment Companies | | | 353,654 | | | | — | | | | — | | | | 353,654 | |
| | | | | | | | | | | | | | | | |
Total Investments in Securities | | $ | 353,654 | | | $ | 60,795,727 | | | $ | — | | | $ | 61,149,381 | |
| | | | | | | | | | | | | | | | |
| (b) | Portfolio holdings designated as level 1 and level 2 are disclosed individually on the SOIs. Level 1 consists of a money market mutual fund that is held for daily investments of cash. Please refer to the SOIs for industry specifics of portfolio holdings. |
Transfers between level 2 and level 3 are due to a decline or an increase in market activity (e.g. frequency of trades), which resulted in a lack or increase of available market inputs to determine the price for the year ended February 28, 2019 for Global Bond Opportunities ETF.
There were no significant transfers between level 2 and level 3 during the year ended February 28, 2019 for Ultra-Short Income ETF.
There were no transfers into and out of level 3 for the period ended February 28, 2019 for Core Plus Bond ETF, Corporate Bond Research Enhanced ETF, Disciplined High Yield ETF, Municipal ETF, U.S. Aggregate Bond ETF, Ultra-Short Municipal Income ETF and USD Emerging Markets Sovereign Bond ETF.
The following is a summary of investments for which significant unobservable inputs (level 3) were used in determining fair value:
| | | | | | | | | | | | | | | | | | | | | | | | | | | | | | | | | | | | |
| Global Bond Opportunities ETF | | Balance as of
February 28,
2018 | | | Realized
gain
(loss) | | | Change in net
unrealized
appreciation
(depreciation) | | | Net accretion
(amortization) | | | Purchases1 | | | Sales2 | | | Transfers into Level 3 | | | Transfers
out of
Level 3 | | | Balance as of
February 28,
2019 | |
Investments in Securities: | | | | | | | | | | | | | | | | | | | | | | | | | | | | | |
Asset-Backed Securities — Cayman Islands | | $ | 95,564 | | | $ | — | | | $ | (1,599 | ) | | $ | (15 | ) | | $ | 350,000 | | | $ | (18,169 | ) | | $ | — | | | $ | — | | | $ | 425,781 | |
Asset-Backed Securities — United States | | | 2,264,474 | | | | (228 | ) | | | 92,149 | | | | (1,275 | ) | | | 2,371,260 | | | | (1,177,968 | ) | | | 1,105,461 | | | | — | | | | 4,653,873 | |
Commercial Mortgage-Backed Securities — United States | | | 2,953,242 | | | | 44,768 | | | | 23,926 | | | | 2,352 | | | | 1,150,269 | | | | (1,115,685 | ) | | | 120,667 | | | | (370,262 | ) | | | 2,809,277 | |
Corporate Bonds — United States | | | — | | | | — | | | | — | | | | — | | | | —(a | ) | | | — | | | | — | | | | — | | | | —(a | ) |
| | | | | | | | | | | | | | | | | | | | | | | | | | | | | | | | | | | | |
| | $ | 5,313,280 | | | $ | 44,540 | | | $ | 114,476 | | | $ | 1,062 | | | $ | 3,871,529 | | | $ | (2,311,822 | ) | | $ | 1,226,128 | | | $ | (370,262 | ) | | $ | 7,888,931 | |
| | | | | | | | | | | | | | | | | | | | | | | | | | | | | | | | | | | | |
| 1 | Purchases include all purchases of securities and securities received in corporate actions. |
| 2 | Sales include all sales of securities, maturities, paydowns and securities tendered in corporate actions. |
The changes in net unrealized appreciation (depreciation) attributable to securities owned at February 28, 2019, which were valued using significant unobservable inputs (level 3) amounted to $55,960. This amount is included in Change in net unrealized appreciation/ depreciation of investments innon-affiliates on the Statements of Operations.
Global Bond Opportunities ETF
Quantitative Information about Level 3 Fair Value Measurements#
| | | | | | | | | | | | |
| | | Fair Value at
February 28, 2019 | | | Valuation Technique(s) | | Unobservable Input | | Range (Weighted Average) (a) | |
| | $ | 4,731,177 | | | Discounted Cash Flow | | Constant Prepayment Rate | | | 0.00% - 35.00% (17.47%) | |
| | | | | | | | Constant Default Rate | | | 0.00% - 2.96% (0.51%) | |
| | | | | | | | Yield (Discount Rate of Cash Flows) | | | 3.17% - 6.08% (4.73%) | |
| | | | | | | | | | | | |
| Asset-Backed Securities | | | 4,731,177 | | | | | | | | | |
| |
| | | 2,599,541 | | | Discounted Cash Flow | | Yield (Discount Rate of Cash Flows) | | | 1.15% - 49.70% (6.38%) | |
| | | | | | | | | | | | |
| Commercial Mortgage-Backed Securities | | | 2,599,541 | | | | | | | | | |
| |
| Total | | $ | 7,330,718 | | | | | | | | | |
| |
| # | The table above does not include level 3 securities that are valued by brokers and pricing services. At February 28, 2019, the value of these securities was $558,213. The inputs for these securities are not readily available or cannot be reasonably estimated and are generally those inputs described in Note A. |
| (a) | Unobservable inputs were weighted by the relative fair value of the instruments. |
| | | | | | | | |
| | | |
| FEBRUARY 28, 2019 | | J.P. MORGAN EXCHANGE-TRADED FUNDS | | | | | 161 | |
NOTES TO FINANCIAL STATEMENTS
AS OF FEBRUARY 28, 2019 (continued)
The significant unobservable inputs used in the fair value measurement of the Fund’s investments are listed above. Generally, a change in the assumptions used in any input in isolation may be accompanied by a change in another input. Significant changes in any of the unobservable inputs may significantly impact the fair value measurement. The impact is based on the relationship between each unobservable input and the fair value measurement. Significant increases (decreases) in the default rate may decrease (increase) the fair value measurement. A significant change in the discount rate or prepayment rate (Constant Prepayment Rate or PSA Prepayment Model) may decrease or increase the fair value measurement.
B. Restricted Securities — Certain securities held by the Funds may be subject to legal or contractual restrictions on resale. Restricted securities generally are resold in transactions exempt from registration under the Securities Act of 1933, as amended (the “Securities Act”). Disposal of these securities may involve time-consuming negotiations and expense. Prompt sale at the current valuation may be difficult and could adversely affect the NAVs of the Funds.
As of February 28, 2019, the Funds had no investments in restricted securities other than securities sold to the Funds under Rule 144A and/or Regulation S under the Securities Act.
C. When-Issued Securities, Delayed Delivery Securities and Forward Commitments —Core Plus Bond ETF, Global Bond Opportunities ETF, Municipal ETF, U.S. Aggregate Bond ETF, Ultra-Short Income ETF and Ultra-Short Municipal Income ETF purchased when-issued securities, including To Be Announced (“TBA”) securities, and entered into contracts to purchase or sell securities for a fixed price that may be settled a month or more after the trade date. When-issued securities are securities that have been authorized, but not issued in the market. A forward commitment involves entering into a contract to purchase or sell securities for a fixed price at a future date that may be settled a month or more after the trade date. A delayed delivery security is agreed upon in advance between the buyer and the seller of the security and is generally delivered beyond seven days of the agreed upon date. The purchase of securities on a when-issued, delayed delivery or forward commitment basis involves the risk that the value of the security to be purchased declines before the settlement date. The sale of securities on a forward commitment basis involves the risk that the value of the securities sold may increase before the settlement date. The Fund may be exposed to credit risk if the counterparty fails to perform under the terms of the transaction. Interest income for securities purchased on a when-issued, delayed delivery or forward commitment basis is not accrued until the settlement date.
Core Plus Bond ETF, Global Bond Opportunities ETF, Municipal ETF, U.S. Aggregate Bond ETF, Ultra-Short Income ETF and Ultra-Short Municipal Income ETF had delayed delivery securities outstanding as of February 28, 2019, which are shown as a Receivable for Investment securities sold — delayed delivery securities and Payable for Investment securities purchased — delayed delivery securities, respectively, on the Statements of Assets and Liabilities (“SAL”). The values of these securities held at February 28, 2019 are detailed on the SOIs.
D. Repurchase Agreements — The Funds may enter into repurchase agreement transactions that meet the credit guidelines of JPMIM, an indirect, wholly-owned subsidiary of JPMorgan. Repurchase agreements involve the purchase of securities subject to the seller’s agreement to repurchase the securities at a mutually agreed upon date and price. The Funds require that the collateral received in a repurchase agreement transaction be transferred to a custodian in a manner sufficient to enable the Funds to obtain collateral in the event of a counterparty default. If the counterparty defaults and the fair value of the collateral declines, realization of the collateral by the Funds may be delayed or limited. Repurchase agreement collateral may be held in segregated accounts maintained by JPMorgan Chase Bank, N.A. (“JPMCB”), a wholly-owned subsidiary of JPMorgan.
The Funds’ repurchase agreements are not subject to master netting arrangements.
E. Derivatives — The Funds used derivative instruments including futures and forward foreign currency exchange contracts, in connection with their respective investment strategies. Derivative instruments may be used as substitutes for securities in which the Funds can invest, to hedge portfolio investments or to generate income or gain to the Funds. Derivatives may also be used to manage duration, sector and yield curve exposures and credit and spread volatility.
The Funds may be subject to various risks from the use of derivatives including the risk that changes in the value of a derivative may not correlate perfectly with the underlying asset, rate or index; counterparty credit risk related to derivatives counterparties’ failure to perform under contract terms; liquidity risk related to the lack of a liquid market for these contracts allowing a Fund to close out its position(s); and documentation risk relating to disagreement over contract terms. Investing in certain derivatives also results in a form of leverage and as such, the Funds’ risk of loss associated with these instruments may exceed their value, as recorded on the SAL.
The Funds are party to various derivative contracts governed by International Swaps and Derivatives Association master agreements (“ISDA agreements”). The Funds’ ISDA agreements, which are separately negotiated with each dealer counterparty, may contain provisions allowing, absent other considerations, a counterparty to exercise rights, to the extent not otherwise waived, against the Funds in the event the Funds’ net assets decline over time by apre-determined percentage or fall below apre-determined floor. The ISDA agreements may also contain provisions allowing, absent other conditions, the Funds to exercise rights, to the extent not otherwise waived, against a counterparty (e.g., decline in a counterparty’s credit rating below a specified level). Such rights for both a counterparty and the Funds often include the ability to terminate (i.e., close out) open contracts at prices which may favor a counterparty, which could have an adverse effect on the Funds. The ISDA agreements give the Funds and a counterparty the right, upon an event of default, to close out all transactions traded under such agreements and to net amounts owed or due across all transactions and offset such net payable or receivable with collateral posted to a segregated account by one party to the other.
Counterparty credit risk may be mitigated to the extent a counterparty posts collateral for mark to market gains to the Funds.
Notes (1) — (2) below describe the various derivatives used by the Funds.
| | | | | | |
| | | |
| 162 | | | | J.P. MORGAN EXCHANGE-TRADED FUNDS | | FEBRUARY 28, 2019 |
(1). Futures Contracts — The Core Bond Plus ETF, Corporate Bond Research Enhanced ETF, Global Bond Opportunities ETF and Ultra-Short Income ETF used treasury futures contracts to manage and hedge interest rate risk associated with portfolio investments. The Funds also bought futures contracts to immediately invest incoming cash in the market or sold futures in response to cash outflows, thereby simulating an invested position in the underlying index while maintaining a cash balance for liquidity.
Futures contracts provide for the delayed delivery of the underlying instrument at a fixed price or are settled for a cash amount based on the change in the value of the underlying instrument at a specific date in the future. Upon entering into a futures contract, the Funds are required to deposit with the broker, cash or securities in an amount equal to a certain percentage of the contract amount, which is referred to as the initial margin deposit. Subsequent payments, referred to as variation margin, are made or received by the Funds periodically and are based on changes in the market value of open futures contracts. Changes in the market value of open futures contracts are recorded as Change in net unrealized appreciation/depreciation on the Statements of Operations (“SOP”). Realized gains or losses, representing the difference between the value of the contract at the time it was opened and the value at the time it was closed, are reported on the SOP at the closing or expiration of the futures contract. Securities deposited as initial margin are designated on the SOIs, while cash deposited, which is considered restricted, is recorded on the SAL. A receivable from and/or a payable to brokers for the daily variation margin is also recorded on the SAL.
The use of futures contracts exposes the Funds to interest rate risk. The Funds may be subject to the risk that the change in the value of the futures contract may not correlate perfectly with the underlying instrument. Use of long futures contracts subjects the Funds to risk of loss in excess of the amounts shown on the SAL, up to the notional amount of the futures contracts. Use of short futures contracts subjects the Funds to unlimited risk of loss. The Funds may enter into futures contracts only on exchanges or boards of trade. The exchange or board of trade acts as the counterparty to each futures transaction; therefore, the Funds’ credit risk is limited to failure of the exchange or board of trade. Under some circumstances, futures exchanges may establish daily limits on the amount that the price of a futures contract can vary from the previous day’s settlement price, which could effectively prevent liquidation of positions.
The Funds’ futures contracts are not subject to master netting arrangements (the right to close out all transactions traded with a counterparty and net amounts owed or due across transactions).
(2). Forward Foreign Currency Exchange Contracts — The Global Bond Opportunities ETF may be exposed to foreign currency risks associated with some or all of the portfolio investments and used forward foreign currency exchange contracts to hedge or manage certain of these exposures as part of an investment strategy. The Fund also bought forward foreign currency exchange contracts to gain exposure to currencies. Forward foreign currency exchange contracts represent obligations to purchase or sell foreign currency on a specified future date at a price fixed at the time the contracts are entered into.Non-deliverable forward foreign currency exchange contracts are settled with the counterparty in U.S. Dollar without the delivery of foreign currency.
The values of the forward foreign currency exchange contracts are adjusted daily based on the applicable exchange rate of the underlying currency. Changes in the value of these contracts are recorded as unrealized appreciation or depreciation until the contract settlement date. When the forward foreign currency exchange contract is closed, the Fund records a realized gain or loss equal to the difference between the value at the time the contract was opened and the value at the time it was closed. The Fund also records a realized gain or loss when a forward foreign currency exchange contract offsets another forward foreign currency exchange contract with the same counterparty upon settlement.
The Fund’s forward foreign currency exchange contracts are subject to master netting arrangements (the right to close out all transactions with a counterparty and net amounts owed or due across transactions).
The Fund may be required to post or receive collateral fornon-deliverable forward foreign currency exchange contracts.
(3). Summary of Derivatives Information
The following table presents the value of derivatives held as of February 28, 2019, by their primary underlying risk exposure and respective location on the SAL:
| | | | | | |
| Core Plus Bond ETF | |
| Derivative Contracts | | Statements of Assets and Liabilities Location | | | |
| Gross Liabilities: | | | | Futures
Contracts (a) | |
| Interest rate contracts | | Payables, Net assets — Unrealized Depreciation | | $ | (3,184 | ) |
| | | | | | |
| | | | | | | | |
| | | |
| FEBRUARY 28, 2019 | | J.P. MORGAN EXCHANGE-TRADED FUNDS | | | | | 163 | |
NOTES TO FINANCIAL STATEMENTS
AS OF FEBRUARY 28, 2019 (continued)
| | | | | | |
|
| Corporate Bond Research Enhanced ETF | |
| Derivative Contracts | | Statements of Assets and Liabilities Location | | | |
| Gross Assets: | | | | Futures
Contracts (a) | |
| Interest rate contracts | | Receivables, Net assets — Unrealized Appreciation | | $ | 1,169 | |
| | | | | | |
| | |
Gross Liabilities: | | | | | |
| Interest rate contracts | | Payables, Net assets — Unrealized Depreciation | | $ | (1,538 | ) |
| | | | | | |
| | | | | | | | | | | | | | |
| Global Bond Opportunities ETF | |
| Derivative Contracts | | Statements of Assets and Liabilities Location | | | |
| Gross Assets: | | | | Futures
Contracts (a) | | | Forward Foreign
Currency Exchange
Contracts | | | Total | |
| Interest rate contracts | | Receivables, Net assets — Unrealized Appreciation | | $ | 47,295 | | | $ | — | | | $ | 47,295 | |
Foreign exchange contracts | | Receivables | | | — | | | | 879,761 | | | | 879,761 | |
| | | | | | | | | | | | | | |
Total | | | | $ | 47,295 | | | $ | 879,761 | | | $ | 927,056 | |
| | | | | | | | | | | | | | |
| | | | |
Gross Liabilities: | | | | | | | | | | | |
| Interest rate contracts | | Payables, Net assets — Unrealized Depreciation | | | (301,086 | ) | | | — | | | | (301,086 | ) |
Foreign exchange contracts | | Payables | | | — | | | | (288,757 | ) | | | (288,757 | ) |
| | | | | | | | | | | | | | |
Total | | | | $ | (301,086 | ) | | $ | (288,757 | ) | | $ | (589,843 | ) |
| | | | | | | | | | | | | | |
| (a) | This amount reflects the cumulative appreciation/depreciation of futures contracts as reported on the SOIs. The SAL only reflects the current day variation margin receivable/payable from/to brokers. |
The following table presents the Fund’s gross derivative assets and liabilities by counterparty net of amounts available for offset under netting arrangements and any related collateral received or posted by the Fund as of February 28, 2019.
Global Bond Opportunities ETF
| | | | | | | | | | | | | | | | |
| Counterparty | | Gross Amount of Derivative Assets
Subject to Netting Arrangements
Presented on the Statements of Assets and
Liabilities(a) | | | Derivatives
Available for Offset | | | Collateral
Received | | | Net Amount Due
from Counterparty
(not less than zero) | |
Barclays Bank plc | | $ | 213,108 | | | $ | — | | | $ | — | | | $ | 213,108 | |
Citibank, NA | | | 75,099 | | | | (75,099 | ) | | | — | | | | – | |
Goldman Sachs International | | | 364,725 | | | | (50,427 | ) | | | — | | | | 314,298 | |
Morgan Stanley | | | 1,184 | | | | (178 | ) | | | — | | | | 1,006 | |
Royal Bank of Canada | | | 286 | | | | — | | | | — | | | | 286 | |
State Street Corp. | | | 17,538 | | | | (10,606 | ) | | | — | | | | 6,932 | |
TD Bank Financial Group | | | 34,297 | | | | — | | | | — | | | | 34,297 | |
BNP Paribas | | | 85,001 | | | | (32,379 | ) | | | — | | | | 52,622 | |
HSBC Bank, NA | | | 66,634 | | | | (59,322 | ) | | | — | | | | 7,312 | |
Merrill Lynch International | | | 20,227 | | | | (20,227 | ) | | | — | | | | – | |
Australia & New Zealand Banking Group Ltd. | | | 1,662 | | | | (550 | ) | | | — | | | | 1,112 | |
| | | | | | | | | | | | | | | | |
Total | | $ | 879,761 | | | $ | (248,788 | ) | | $ | — | | | $ | 630,973 | |
| | | | | | | | | | | | | | | | |
| | | | | | |
| | | |
| 164 | | | | J.P. MORGAN EXCHANGE-TRADED FUNDS | | FEBRUARY 28, 2019 |
| | | | | | | | | | | | | | | | |
| | | | |
| Counterparty | | Gross Amount of Derivative Liabilities Subject to Netting
Arrangements
Presented on the Statements of Assets and
Liabilities(a) | | | Derivatives
Available
for Offset | | | Collateral
Pledged | | | Net Amount Due
from Counterparty
(not less than zero) | |
Citibank, NA | | $ | 111,056 | | | $ | (75,099 | ) | | $ | — | | | $ | 35,957 | |
Goldman Sachs International | | | 50,427 | | | | (50,427 | ) | | | — | | | | — | |
Morgan Stanley | | | 178 | | | | (178 | ) | | | — | | | | — | |
National Australia Bank Ltd. | | | 972 | | | | — | | | | — | | | | 972 | |
State Street Corp. | | | 10,606 | | | | (10,606 | ) | | | — | | | | — | |
BNP Paribas | | | 32,379 | | | | (32,379 | ) | | | — | | | | — | |
HSBC Bank, NA | | | 59,322 | | | | (59,322 | ) | | | — | | | | — | |
Merrill Lynch International | | | 23,267 | | | | (20,227 | ) | | | — | | | | 3,040 | |
Australia & New Zealand Banking Group Ltd. | | | 550 | | | | (550 | ) | | | — | | | | — | |
| | | | | | | | | | | | | | | | |
Total | | $ | 288,757 | | | $ | (248,788 | ) | | $ | — | | | $ | 39,969 | |
| | | | | | | | | | | | | | | | |
| (a) | For financial reporting purposes, the Fund does not offset derivative assets and derivative liabilities subject to master netting arrangements on the SAL. |
The following tables present the effect of derivatives on the SOP for the period ended February 28, 2019, by primary underlying risk exposure:
| | | | |
| Core Plus Bond ETF | |
| Amount of Realized Gain (Loss) on Derivatives Recognized on the Statements of Operations | |
| Derivative Contracts | | Futures
Contracts | |
Interest rate contracts | | $ | 7,689 | |
| | | | |
|
| Amount of Change in Unrealized Appreciation (Depreciation) on Derivatives Recognized on the Statements of Operations | |
| Derivative Contracts | | Futures
Contracts | |
Interest rate contracts | | $ | (3,184 | ) |
| | | | |
| Corporate Bond Research Enhanced ETF | |
| Amount of Realized Gain (Loss) on Derivatives Recognized on the Statements of Operations | |
| Derivative Contracts | | Futures
Contracts | |
Interest rate contracts | | $ | (5,767 | ) |
| | | | |
| | | | |
|
| Amount of Change in Unrealized Appreciation (Depreciation) on Derivatives Recognized on the Statements of Operations | |
| Derivative Contracts | | Futures
Contracts | |
Interest rate contracts | | $ | (369 | ) |
| | | | |
| | | | | | | | | | | | |
| Global Bond Opportunities ETF | |
| Amount of Realized Gain (Loss) on Derivatives Recognized on the Statements of Operations | |
| Derivative Contracts | | Futures
Contracts | | | Forward Foreign
Currency Exchange
Contracts | | | Total | |
Interest rate contracts | | $ | (116,451 | ) | | $ | — | | | $ | (116,451 | ) |
Foreign exchange contracts | | | — | | | | 4,459,893 | | | | 4,459,893 | |
| | | | | | | | | | | | |
Total | | $ | (116,451 | ) | | $ | 4,459,893 | | | $ | 4,343,442 | |
| | | | | | | | | | | | |
| | | | | | | | |
| | | |
| FEBRUARY 28, 2019 | | J.P. MORGAN EXCHANGE-TRADED FUNDS | | | | | 165 | |
NOTES TO FINANCIAL STATEMENTS
AS OF FEBRUARY 28, 2019 (continued)
| | | | | | | | | | | | |
|
| Amount of Change in Unrealized Appreciation (Depreciation) on Derivatives Recognized on the Statements of Operations | |
| Derivative Contracts | | Futures
Contracts | | | Forward
Foreign
Currency
Exchange
Contracts | | | Total | |
Interest rate contracts | | $ | (608,346 | ) | | $ | — | | | $ | (608,346 | ) |
Foreign exchange contracts | | | – | | | | 216,665 | | | | 216,665 | |
| | | | | | | | | | | | |
Total | | $ | (608,346 | ) | | $ | 216,665 | | | $ | (391,681 | ) |
| | | | | | | | | | | | |
| | | | |
| Ultra-Short Income ETF | |
| Amount of Realized Gain (Loss) on Derivatives Recognized on the Statements of Operations | |
| Derivative Contracts | | Futures
Contracts | |
Interest rate contracts | | $ | 7,667 | |
| | | | |
|
| Amount of Change in Unrealized Appreciation (Depreciation) on Derivatives Recognized on the Statements of Operations | |
| Derivative Contracts | | Futures
Contracts | |
Interest rate contracts | | $ | (136 | ) |
| | | | |
Derivatives Volume
The table below discloses the volume of the Funds’ futures contracts and forward foreign currency exchange contracts activity during the period ended February 28, 2019. Please refer to the tables in the Summary of Derivatives Information for derivative-related gains and losses associated with volume activity.
| | | | | | | | | | | | | | | | |
| | | Core Plus
Bond ETF | | | Corporate
Bond
Research
Enhanced
ETF | | | Global Bond
Opportunities
ETF | | | Ultra-Short
Income ETF | |
Futures Contracts — Interest Rate: | | | | | | | | | | | | | | | | |
Average Notional Balance Long | | $ | 3,456,414 | (a) | | $ | 738,763 | (b) | | $ | 19,344,184 | | | $ | — | |
Average Notional Balance Short | | | — | | | | 820,477 | (b) | | | 103,186,488 | | | | 2,124,688 | (c) |
Ending Notional Balance Long | | | 3,236,828 | | | | 568,875 | | | | 29,704,485 | | | | — | |
Ending Notional Balance Short | | | — | | | | 617,258 | | | | 96,988,264 | | | | — | |
| | | | |
Forward Foreign Currency Exchange Contracts: | | | | | | | | | | | | | | | | |
Average Settlement Value Purchased | | | — | | | | — | | | | 36,955,548 | | | | — | |
Average Settlement Value Sold | | | — | | | | — | | | | 88,801,068 | | | | — | |
Ending Settlement Value Purchased | | | — | | | | — | | | | 75,587,934 | | | | — | |
Ending Settlement Value Sold | | | — | | | | — | | | | 126,037,840 | | | | — | |
| (a) | For the period January 28, 2019 through February 28, 2019. |
| (b) | For the period December 12, 2018 through February 28, 2019. |
| (c) | For the period from March 1, 2018 to March 31, 2018. |
The Funds’ derivatives contracts held at February 28, 2019 are not accounted for as hedging instruments under GAAP.
F. Securities Lending — Effective October 5, 2018, Disciplined High Yield ETF, Ultra-Short Income ETF and USD Emerging Markets Sovereign Bond ETF and effective December 12, 2018, Corporate Bond Research Enhanced ETF, Municipal ETF, Ultra-Short Municipal Income ETF and U.S. Aggregate Bond ETF and effective January 28, 2019, Core Plus Bond ETF became authorized to engage in securities lending in order to generate additional income. The Funds are able to lend to approved borrowers. Citibank N.A. (“Citibank”) serves as lending agent for the Funds, pursuant to a Securities Lending Agency Agreement (the “Securities Lending Agency Agreement”). Securities loaned are collateralized by cash equal to at least 100% of the market value plus accrued interest on the securities lent, which is invested in the IM Shares of JPMorgan U.S. Government Money Market Fund and the Agency SL Shares of the JPMorgan Securities Lending Money Market Fund. The Funds retain loan fees and the interest on cash collateral investments but are required to pay the borrower a rebate for the use of cash collateral. In cases where the lent security is of high value to borrowers, there may be a negative rebate (i.e., a net payment from the borrower to the Funds). Upon termination of a loan, the Funds are required to return to the borrower an amount equal to the cash collateral, plus any rebate owed to the borrowers. The remaining maturities of the securities lending transactions are considered overnight and continuous. Loans are subject to termination by the Funds or the borrower at any time.
| | | | | | |
| | | |
| 166 | | | | J.P. MORGAN EXCHANGE-TRADED FUNDS | | FEBRUARY 28, 2019 |
The net income earned on the securities lending (after payment of rebates and Citibank’s fee) is included on the SOP as Income from securities lending (net). The Funds also receive payments from the borrower during the period of the loan, equivalent to dividends and interest earned on the securities loaned, which are recorded as Dividend or Interest income, respectively, on the SOP.
Under the Securities Lending Agency Agreement, Citibank marks to market the loaned securities on a daily basis. In the event the cash received
from the borrower is less than 102% of the value of the loaned securities (105% for loans ofnon-U.S. securities), Citibank requests additional cash from the borrower so as to maintain a collateralization level of at least 102% of the value of the loaned securities plus accrued interest (105% for loans ofnon-U.S. securities, subject to certainde minimis amounts).
The value of securities out on loan is recorded as an asset on the SAL. The value of the cash collateral received is recorded as a liability on the SAL and details of Collateral Investments are disclosed on the SOIs. As of February 28, 2019, the value of outstanding securities on loan and the value of Collateral investments were as follows:
| | | | | | | | | | | | |
| | | Value of
Securities on Loan | | | Cash Collateral
Posted by Borrower | | | Total Value of
Collateral
Investments | |
Disciplined High Yield ETF | | $ | 4,045,947 | | | $ | 4,202,920 | | | $ | 4,202,920 | |
The Funds bear the risk of loss associated with the Collateral Investments and are not entitled to additional collateral from the borrower to cover any such losses. To the extent that the value of the Collateral Investments declines below the amount owed to a borrower, the Funds may incur losses that exceed the amount they earned on lending the security. Upon termination of a loan, the Funds may use leverage (borrow money) to repay the borrower for cash collateral posted if the Adviser does not believe that it is prudent to sell the Collateral Investments to fund the payment of this liability.
The following table presents the Funds’ value of the securities on loan with Citibank, net of amounts available for offset under the master netting arrangements and any related collateral received or posted by the Funds as of February 28, 2019.
| | | | | | | | | | | | |
| | | Investment Securities
on Loan, at Value,
Presented on the
Statements of Assets
and Liabilities | | | Cash Collateral
Posted by Borrower | | | Net Amount Due
to Counterparty
(not less than zero) | |
Disciplined High Yield ETF | | $ | 4,045,947 | | | $ | (4,045,947 | ) | | $ | — | |
Securities lending also involves counterparty risks, including the risk that the loaned securities may not be returned in a timely manner or at all. Subject to certain conditions, Citibank has agreed to indemnify the Funds from losses resulting from a borrower’s failure to return a loaned security.
JPMIM voluntarily waived investment advisory fees charged to the Funds to reduce the impact of the investment in the JPMorgan U.S. Government Money Market Fund from 0.16% to 0.06%. JPMIM waived fees associated with the Funds’ investment in JPMorgan U.S. Government Money Market Fund as follows:
| | | | |
Disciplined High Yield ETF | | $ | 790 | |
Ultra-Short Income ETF | | | 75 | |
USD Emerging Markets Sovereign Bond ETF | | | 37 | |
The above waiver is included in the determination of earnings on cash collateral investment and in the calculation of Citibank’s compensation and is included on the SOP as Income from securities lending (net).
Core Plus Bond ETF, Corporate Bond Research Enhanced ETF, Municipal ETF, Ultra-Short Municipal Income ETF and U.S. Aggregate Bond ETF did not lend out any securities during the period ended February 28, 2019.
G. Investment Transactions with Affiliates — The Funds invested in Underlying Funds which are advised by the Adviser. An issuer which is under common control with a Fund may be considered an affiliate. For the purposes of the financial statements, the Funds assume the issuers listed in the table below to be affiliated issuers. Underlying Funds’ distributions may be reinvested into the Underlying Funds. Reinvestment amounts are included in the purchase cost amounts in the tables below. Included in the purchases and sales amounts in the tables below are exchanges between certain shares of the Underlying Funds. Such exchanges are not treated as purchases and sales for the purpose of recognizing realized gains (losses) or portfolio turnover.
| | | | | | | | |
| | | |
| FEBRUARY 28, 2019 | | J.P. MORGAN EXCHANGE-TRADED FUNDS | | | | | 167 | |
NOTES TO FINANCIAL STATEMENTS
AS OF FEBRUARY 28, 2019 (continued)
Core Plus Bond ETF
| | | | | | | | | | | | | | | | | | | | | | | | | | | | | | | | | | | | |
| For the period ended February 28, 2019 | |
| Security Description | | Value at
January 28,
2019 (a) | | | Purchases at Cost | | | Proceeds
from Sales | | | Net Realized
Gain (Loss) | | | Change in
Unrealized
Appreciation/
(Depreciation) | | | Value at
February 28,
2019 | | | Shares at
February 28,
2019 | | | Dividend
Income | | | Capital Gain
Distributions | |
JPMorgan U.S. Government Money Market Fund Class Institutional Shares, 2.33% (b) (c) | | $ | — | | | $ | 21,795,522 | | | $ | 15,723,747 | | | $ | — | | | $ | — | | | $ | 6,071,775 | | | | 6,071,775 | | | $ | 16,006 | | | $ | — | |
| | | | | | | | | | | | | | | | | | | | | | | | | | | | | | | | | | | | |
|
Corporate Bond Research Enhanced ETF | |
|
| For the period ended February 28, 2019 | |
| Security Description | | Value at
December 12
2018 (a) | | | Purchases at Cost | | | Proceeds
from Sales | | | Net Realized
Gain (Loss) | | | Change in
Unrealized
Appreciation/
(Depreciation) | | | Value at
February 28,
2019 | | | Shares at
February 28,
2019 | | | Dividend
Income | | | Capital Gain
Distributions | |
JPMorgan U.S. Government Money Market Fund Class Institutional Shares, 2.33% (b) (c) | | $ | — | | | $ | 1,212,597 | | | $ | 905,058 | | | $ | — | | | $ | — | | | $ | 307,539 | | | | 307,539 | | | $ | 946 | | | $ | — | |
| | | | | | | | | | | | | | | | | | | | | | | | | | | | | | | | | | | | |
|
Disciplined High Yield ETF | |
|
| For the year ended February 28, 2019 | |
| Security Description | | Value at
February 28,
2018 | | | Purchases at Cost | | | Proceeds
from Sales | | | Net Realized
Gain (Loss) | | | Change in
Unrealized
Appreciation/
(Depreciation) | | | Value at
February 28,
2019 | | | Shares at
February 28,
2019 | | | Dividend
Income | | | Capital Gain
Distributions | |
JPMorgan U.S. Government Money Market Fund Class IM Shares, 2.37% (b) (c) | | $ | — | | | $ | 13,966,450 | | | $ | 9,763,530 | | | $ | — | | | $ | — | | | $ | 4,202,920 | | | | 4,202,920 | | | $ | 20,041 | * | | $ | — | |
JPMorgan U.S. Government Money Market Fund Class Institutional Shares, 2.33% (b) (c) | | | 2,316,266 | | | | 62,530,571 | | | | 62,225,587 | | | | — | | | | — | | | | 2,621,250 | | | | 2,621,250 | | | | 40,211 | | | | — | |
| | | | | | | | | | | | | | | | | | | | | | | | | | | | | | | | | | | | |
Total | | $ | 2,316,266 | | | $ | 76,497,021 | | | $ | 71,989,117 | | | $ | — | | | $ | — | | | $ | 6,824,170 | | | | | | | $ | 60,252 | | | $ | — | |
| | | | | | | | | | | | | | | | | | | | | | | | | | | | | | | | | | | | |
|
Global Bond Opportunities ETF | |
|
| For the year ended February 28, 2019 | |
| Security Description | | Value at
February 28,
2018 | | | Purchases at Cost | | | Proceeds
from Sales | | | Net Realized
Gain (Loss) | | | Change in
Unrealized
Appreciation/
(Depreciation) | | | Value at
February 28,
2019 | | | Shares at
February 28,
2019 | | | Dividend
Income | | | Capital Gain
Distributions | |
JPMorgan U.S. Government Money Market Fund Class Institutional Shares, 2.33% (b) (c) | | $ | — | | | $ | 105,592,340 | | | $ | 94,786,808 | | | $ | — | | | $ | — | | | $ | 10,805,532 | | | | 10,805,532 | | | $ | 177,373 | | | $ | — | |
| | | | | | | | | | | | | | | | | | | | | | | | | | | | | | | | | | | | |
| | | | | | |
| | | |
| 168 | | | | J.P. MORGAN EXCHANGE-TRADED FUNDS | | FEBRUARY 28, 2019 |
| | | | | | | | | | | | | | | | | | | | | | | | | | | | | | | | | | | | |
|
Municipal ETF | |
|
| For the period ended February 28, 2019 | |
| Security Description | | Value at
October 29,
2018 (a) | | | Purchases at Cost | | | Proceeds
from Sales | | | Net Realized
Gain (Loss) | | | Change in
Unrealized
Appreciation/
(Depreciation) | | | Value at
February 28,
2019 | | | Shares at
February 28,
2019 | | | Dividend
Income | | | Capital Gain
Distributions | |
JPMorgan Institutional Tax Free Money Market Fund Class IM Shares, 1.57% (b) (c) | | $ | — | | | $ | 32,751,381 | | | $ | 31,700,581 | | | $ | (27 | ) | | $ | — | | | $ | 1,050,773 | | | | 1,050,773 | | | $ | 4,574 | | | $ | — | |
| | | | | | | | | | | | | | | | | | | | | | | | | | | | | | | | | | | | |
|
U.S. Aggregate Bond ETF | |
|
| For the period ended February 28, 2019 | |
| Security Description | | Value at
December 12,
2018 (a) | | | Purchases at Cost | | | Proceeds
from Sales | | | Net Realized
Gain (Loss) | | | Change in
Unrealized
Appreciation/
(Depreciation) | | | Value at
February 28,
2019 | | | Shares at
February 28,
2019 | | | Dividend
Income | | | Capital Gain
Distributions | |
JPMorgan U.S. Government Money Market Fund Class Institutional Shares, 2.33% (b) (c) | | $ | — | | | $ | 13,396,079 | | | $ | 13,058,623 | | | $ | — | | | $ | — | | | $ | 337,456 | | | | 337,456 | | | $ | 2,838 | | | $ | — | |
| | | | | | | | | | | | | | | | | | | | | | | | | | | | | | | | | | | | |
|
Ultra-Short Income ETF | |
|
| For the year ended February 28, 2019 | |
| Security Description | | Value at
February 28,
2018 | | | Purchases at Cost | | | Proceeds
from Sales | | | Net Realized
Gain (Loss) | | | Change in
Unrealized
Appreciation/
(Depreciation) | | | Value at
February 28,
2019 | | | Shares at
February 28,
2019 | | | Dividend
Income | | | Capital Gain
Distributions | |
JPMorgan U.S. Government Money Market Fund Class IM Shares (b) | | $ | — | | | $ | 11,390,590 | | | $ | 11,390,590 | | | $ | — | | | $ | — | | | $ | — | | | | — | | | $ | 1,913 | * | | $ | — | |
JPMorgan U.S. Government Money Market Fund Class Institutional Shares, 2.33% (b) (c) | | | 18,312,370 | | | | 2,983,604,497 | | | | 2,851,565,071 | | | | — | | | | — | | | | 150,351,796 | | | | 150,351,796 | | | | 1,994,653 | | | | — | |
| | | | | | | | | | | | | | | | | | | | | | | | | | | | | | | | | | | | |
Total | | $ | 18,312,370 | | | $ | 2,994,995,087 | | | $ | 2,862,955,661 | | | $ | — | | | $ | — | | | $ | 150,351,796 | | | | | | | $ | 1,996,566 | | | $ | — | |
| | | | | | | | | | | | | | | | | | | | | | | | | | | | | | | | | | | | |
| | | | | | | | |
| | | |
| FEBRUARY 28, 2019 | | J.P. MORGAN EXCHANGE-TRADED FUNDS | | | | | 169 | |
NOTES TO FINANCIAL STATEMENTS
AS OF FEBRUARY 28, 2019 (continued)
| | | | | | | | | | | | | | | | | | | | | | | | | | | | | | | | | | | | |
|
Ultra-Short Municipal Income ETF | |
|
| For the period ended February 28, 2019 | |
| Security Description | | Value at
October 16,
2018 (a) | | | Purchases at Cost | | | Proceeds
from Sales | | | Net Realized
Gain (Loss) | | | Change in
Unrealized
Appreciation/
(Depreciation) | | | Value at
February 28,
2019 | | | Shares at
February 28,
2019 | | | Dividend
Income | | | Capital Gain
Distributions | |
JPMorgan Institutional Tax Free Money Market Fund Class IM Shares, 1.57% (b) (c) | | $ | — | | | $ | 51,732,866 | | | $ | 51,585,932 | | | $ | 13 | | | $ | — | | | $ | 146,947 | | | | 146,947 | | | $ | 7,915 | | | $ | — | |
| | | | | | | | | | | | | | | | | | | | | | | | | | | | | | | | | | | | |
|
USD Emerging Markets Sovereign Bond ETF | |
|
| For the year ended February 28, 2019 | |
| Security Description | | Value at
February 28,
2018 | | | Purchases at Cost | | | Proceeds
from Sales | | | Net Realized
Gain (Loss) | | | Change in
Unrealized
Appreciation/
(Depreciation) | | | Value at
February 28,
2019 | | | Shares at
February 28,
2019 | | | Dividend
Income | | | Capital Gain
Distributions | |
JPMorgan U.S. Government Money Market Fund Class IM Shares (b) | | $ | — | | | $ | 973,939 | | | $ | 973,939 | | | $ | — | | | $ | — | | | $ | — | | | | — | | | $ | 1,015 | * | | $ | — | |
JPMorgan U.S. Government Money Market Fund Class Institutional Shares, 2.33% (b) (c) | | | 2,764,325 | | | | 8,257,080 | | | | 10,667,751 | | | | — | | | | — | | | | 353,654 | | | | 353,654 | | | | 6,776 | | | | — | |
| | | | | | | | | | | | | | | | | | | | | | | | | | | | | | | | | | | | |
Total | | $ | 2,764,325 | | | $ | 9,231,019 | | | $ | 11,641,690 | | | $ | — | | | $ | — | | | $ | 353,654 | | | | | | | $ | 7,791 | | | $ | — | |
| | | | | | | | | | | | | | | | | | | | | | | | | | | | | | | | | | | | |
| (a) | Commencement of operations. |
| (b) | Investment in affiliate. Fund is registered under the Investment Company Act of 1940, as amended, and advised by J.P. Morgan Investment Management Inc. |
| (c) | The rate shown is the current yield as of February 28, 2019. |
| * | Amount is included on the SOP as Income from securities lending (net) (after payments of rebates and Citibank’s fee). |
H. Foreign Currency Translation — The books and records of the Funds are maintained in U.S. dollars. Foreign currency amounts are translated into U.S. dollars at the prevailing exchange rates of such currencies against the U.S. dollar. The market value of investment securities and other assets and liabilities are translated at the exchange rate as of the valuation date. Purchases and sales of investment securities, income and expenses are translated at the exchange rate prevailing on the respective dates of such transactions.
The Funds do not isolate the effect of changes in foreign exchange rates from changes in market prices on securities held. Accordingly, such changes are included within Change in net unrealized appreciation/depreciation on investments on the SOP.
Reported realized foreign currency gains and losses arise from the disposition of foreign currency, currency gains or losses realized between the trade and settlement dates on securities transactions, and the difference between the amounts of dividends, interest and foreign withholding taxes recorded on each Fund’s books on the transaction date and the U.S. dollar equivalent of the amounts actually received or paid. These reported realized foreign currency gains and losses are included in Net realized gain (loss) on foreign currency transactions on the SOP. Unrealized foreign currency gains and losses arise from changes (due to changes in exchange rates) in the value of foreign currency and other assets and liabilities denominated in foreign currencies, which are held at year end and are included in Change in net unrealized appreciation/ depreciation on foreign currency translations on the SOP.
I. Offering and Organizational Costs — Total offering costs incurred in connection with the offering of shares of the Funds are amortized on a straight line basis over 12 months from the date the Funds commenced operations. Total offering costs incurred were as follows:
| | | | |
Core Plus Bond ETF (a) | | $ | 10,733 | |
Corporate Bond Research Enhanced ETF (b) | | | 15,401 | |
Municipal ETF (c) | | | 16,242 | |
U.S. Aggregate Bond ETF (d) | | | 22,802 | |
Ultra-Short Municipal Income ETF (e) | | | 18,516 | |
USD Emerging Markets Sovereign Bond ETF | | | 45,252 | |
| (a) | Commencement of operations was January 28, 2019. |
| | | | | | |
| | | |
| 170 | | | | J.P. MORGAN EXCHANGE-TRADED FUNDS | | FEBRUARY 28, 2019 |
| (b) | Commencement of operations was December 12, 2018. |
| (c) | Commencement of operations was October 29, 2018. |
| (d) | Commencement of operations was December 12, 2018. |
| (e) | Commencement of operations was October 16, 2018. |
Costs paid in connection with the organization of the Funds, if any, were recorded as an expense at the time the Funds commenced operations and are included as part of Professional fees on the SOP. For the period ended February 28, 2019, total offering costs amortized were:
| | | | |
Core Plus Bond ETF | | $ | 912 | |
Corporate Bond Research Enhanced ETF | | | 3,181 | |
Global Bond Opportunities ETF | | | 7,950 | |
Municipal ETF | | | 5,295 | |
U.S. Aggregate Bond ETF | | | 4,685 | |
Ultra-Short Income ETF | | | 5,910 | |
Ultra-Short Municipal Income ETF | | | 6,747 | |
USD Emerging Markets Sovereign Bond ETF | | | 43,915 | |
J. Security Transactions and Investment Income — Investment transactions are accounted for on the trade date (the date the order to buy or sell is executed). Securities gains and losses are calculated on a specifically identified cost basis. Interest income is determined on the basis of coupon interest accrued using the effective interest method which adjusts for amortization of premiums and accretion of discounts. Dividend income net of foreign taxes withheld, if any, is recorded on theex-dividend date or when a Fund first learns of the dividend.
K. Allocation of Expenses — Expenses directly attributable to a fund are charged directly to that fund, while the expenses attributable to more than one fund of the Trust are allocated among the respective funds.
L. Federal Income Taxes — Each Fund is treated as a separate taxable entity for Federal income tax purposes. Each Fund’s policy is to comply with the provisions of the Internal Revenue Code (the “Code”), applicable to regulated investment companies and to distribute to shareholders all of its distributable net investment income and net realized capital gains on investments. Accordingly, no provision for Federal income tax is necessary. Management has reviewed the Funds’ tax positions for all open tax years and has determined that as of February 28, 2019, no liability for income tax is required in the Funds’ financial statements for net unrecognized tax benefits. However, management’s conclusions may be subject to future review based on changes in, or the interpretation of, the accounting standards or tax laws and regulations. Each of the Funds’ Federal tax returns for the prior three fiscal years, or since inception if shorter, remains subject to examination by the Internal Revenue Service.
M. Foreign Taxes — The Funds may be subject to foreign taxes on income, gains on investments or currency purchases/repatriation, a portion of which may be recoverable. The Funds will accrue such taxes and recoveries as applicable, based upon their current interpretation of tax rules and regulations that exist in the markets in which they invest. When a capital gain tax is determined to apply, the Funds record an estimated deferred tax liability in an amount that would be payable if the securities were disposed of on the valuation date.
N. Distributions to Shareholders — Distributions from net investment income, if any, are generally declared and paid monthly. Net realized capital gains, if any, are distributed by each Fund at least annually. The amount of distributions from net investment income and net realized capital gains is determined in accordance with Federal income tax regulations, which may differ from GAAP. To the extent these “book/tax” differences are permanent in nature (i.e., that they result from other than timing of recognition — “temporary differences”), such amounts are reclassified within the capital accounts based on their Federaltax-basis treatment.
The following amounts were reclassified within the capital accounts:
| | | | | | | | | | | | |
| | | Paid-in-Capital | | | Accumulated
undistributed
(distributions
in excess of)
net investment
income | | | Accumulated
net realized
gains (losses) | |
Disciplined High Yield ETF | | $ | (15,448 | ) | | $ | — | | | $ | 15,448 | |
Global Bond Opportunities ETF | | | (435 | ) | | | 3,449,936 | | | | (3,449,501 | ) |
Ultra-Short Income ETF | | | (121 | ) | | | 9,570 | | | | (9,449 | ) |
The reclassifications for the Funds relate primarily to investments in contingent payment debt instruments, redemptions-in-kind and foreign currency gains or losses.
| | | | | | | | |
| | | |
| FEBRUARY 28, 2019 | | J.P. MORGAN EXCHANGE-TRADED FUNDS | | | | | 171 | |
NOTES TO FINANCIAL STATEMENTS
AS OF FEBRUARY 28, 2019 (continued)
3. Fees and Other Transactions with Affiliates
A. Investment Advisory Fee — Pursuant to an Investment Advisory Agreement, the Adviser supervises the investments of each Fund and for such services is paid a fee. The fee is accrued daily and paid monthly based on each Fund’s respective average daily net assets. The annual rate for each Fund is as follows:
| | | | |
Core Plus Bond ETF | | | 0.30 | % |
Corporate Bond Research Enhanced ETF | | | 0.14 | |
Disciplined High Yield ETF | | | 0.30 | |
Global Bond Opportunities ETF | | | 0.55 | |
Municipal ETF | | | 0.24 | |
U.S. Aggregate Bond ETF | | | 0.07 | |
Ultra-Short Income ETF | | | 0.15 | |
Ultra-Short Municipal Income ETF | | | 0.15 | |
USD Emerging Markets Sovereign Bond ETF | | | 0.32 | |
The Adviser waived Investment Advisory fees and/or reimbursed expenses as outlined in Note 3.D.
B. Administration Fee — Pursuant to an Administration Agreement, the Administrator provides certain administration services to the Funds. In consideration of these services, effective January 1, 2019, the Administrator receives a fee accrued daily and paid monthly at an annual rate of 0.075% of each Fund’s respective average daily net assets. Prior to January 1, 2019, the Administrator received a fee accrued daily and paid monthly at an annual rate of 0.085% each Fund’s respective average daily net assets.
The Administrator waived Administration fees as outlined in Note 3.D.
JPMorgan Chase Bank, N.A. (“JPMCB”), a wholly-owned subsidiary of JPMorgan, serves as the Funds’sub-administrator (the“Sub-administrator”). For its services asSub-administrator, JPMCB receives a portion of the fees payable to the Administrator.
C. Custodian, Accounting and Transfer Agent Fees — JPMCB provides custody, accounting and transfer agency services to the Funds. The amounts paid directly to JPMCB by the Funds for custody services are included in the Custodian, Accounting and Transfer Agent fees on the SOP. Interest income earned on cash balances at the custodian, if any, is included in Interest income from affiliates on the SOP. With respect to the transfer agency services provided by JPMCB for each creation or redemption transaction, the Authorized Participant will generally be responsible for such associated expenses; during the period, the Funds paid no transfer agency fees to JPMCB.
Additionally, Authorized Participants generally pay transaction fees associated with the creation and redemption of fund shares. These fees are used to offset certain custodian charges incurred by the Fund for these transactions.
For the period ended February 28, 2019, the amount of transaction fees paid by the Authorized Participants that were used to reimburse custodian fees were as follows:
| | | | |
Core Plus Bond ETF | | $ | 100 | |
Corporate Bond Research Enhanced ETF | | | 300 | |
Disciplined High Yield ETF | | | 2,200 | |
Global Bond Opportunities ETF | | | 6,600 | |
Municipal ETF | | | 600 | |
U.S. Aggregate Bond ETF | | | 700 | |
Ultra-Short Income ETF | | | 16,650 | |
Ultra-Short Municipal Income ETF | | | 2,000 | |
USD Emerging Markets Sovereign Bond ETF | | | 400 | |
Such amounts are included in expense reimbursements fromnon-affiliates in the SOP.
Restricted cash on the SAL is cash received from Authorized Participants for the reimbursement of creation and/or redemption of Fund shares.
Interest expense paid to the custodian related to cash overdrafts, if any, is included in Interest expense to affiliates on the SOP.
D. Waivers and Reimbursements — The Adviser has contractually agreed to waive fees and/or reimburse the Funds to the extent that total annual operating expenses, (excluding acquired fund fees and expenses, dividend expenses related to short sales, interest, taxes, expenses related to
| | | | | | |
| | | |
| 172 | | | | J.P. MORGAN EXCHANGE-TRADED FUNDS | | FEBRUARY 28, 2019 |
litigation and potential litigation, and extraordinary expenses), exceed the percentages of the Funds’ respective average daily net assets as shown in the table below:
| | | | |
| | | Expense Cap | |
Core Plus Bond ETF | | | 0.40 | % |
Corporate Bond Research Enhanced ETF | | | 0.14 | |
Disciplined High Yield ETF | | | 0.40 | |
Global Bond Opportunities ETF | | | 0.55 | |
Municipal ETF | | | 0.24 | |
U.S. Aggregate Bond ETF | | | 0.07 | |
Ultra-Short Income ETF | | | 0.18 | |
Ultra-Short Municipal Income ETF | | | 0.18 | |
USD Emerging Markets Sovereign Bond ETF | | | 0.39 | |
The expense limitation agreements were in effect for the period ended February 28, 2019 and are in place until at least June 30, 2021 for Disciplined High Yield ETF, Global Bond Opportunities ETF, USD Emerging Markets Sovereign Bond ETF and Ultra-Short Income ETF, until at least October 31, 2021 for Municipal ETF and Ultra-Short Municipal Income ETF, until at least December 31, 2021 for Corporate Bond Research Enhanced ETF and U.S. Aggregate Bond ETF, and until at least January 31, 2022 for Core Plus Bond ETF.
For the period ended February 28, 2019, the Funds’ service providers waived fees and/or reimbursed expenses for each of the Funds as follows. None of these parties expect the Funds to repay any such waived fees and/or reimbursed expenses in future years.
| | | | | | | | | | | | | | | | |
| | | Contractual Waivers | | | | |
| | | Investment
Advisory
Fees | | | Administration
Fees | | | Total | | | Contractual
Reimbursements | |
Core Plus Bond ETF | | $ | 6,268 | | | $ | 1,607 | | | $ | 7,875 | | | $ | 103,377 | |
Corporate Bond Research Enhanced ETF | | | 7,562 | | | | 4,197 | | | | 11,759 | | | | 100,058 | |
Disciplined High Yield ETF | | | 140,004 | | | | 93,336 | | | | 233,340 | | | | – | |
Global Bond Opportunities ETF | | | 309,614 | | | | 142,341 | | | | 451,955 | | | | – | |
Municipal ETF | | | 22,002 | | | | 7,442 | | | | 29,444 | | | | 50,543 | |
U.S. Aggregate Bond ETF | | | 7,180 | | | | 7,885 | | | | 15,065 | | | | 101,167 | |
Ultra-Short Income ETF | | | 1,437,027 | | | | 958,017 | | | | 2,395,044 | | | | – | |
Ultra-Short Municipal Income ETF | | | 20,318 | | | | 11,077 | | | | 31,395 | | | | 56,962 | |
USD Emerging Markets Sovereign Bond ETF | | | 167,787 | | | | 44,023 | | | | 211,810 | | | | 41,768 | |
Additionally, the Funds may invest in one or more money market funds advised by the Adviser or its affiliates (affiliated money market funds). The Adviser, Administrator and/or JPMDS, as shareholder servicing agent, have contractually agreed to waive fees and/or reimburse expenses in an amount sufficient to offset the respective net fees each collects from the affiliated money market fund on the applicable Fund’s investment in such affiliated money market fund, except for investments of securities lending cash collateral.
The amounts of these waivers resulting from investments in these money market funds for the period ended February 28, 2019 were as follows:
| | | | |
Core Plus Bond ETF | | $ | 160 | |
Corporate Bond Research Enhanced ETF | | | 28 | |
Disciplined High Yield ETF | | | 4,357 | |
Global Bond Opportunities ETF | | | 18,594 | |
Municipal ETF | | | 369 | |
U.S. Aggregate Bond ETF | | | 57 | |
Ultra-Short Income ETF | | | 195,457 | |
Ultra-Short Municipal Income ETF | | | 594 | |
USD Emerging Markets Sovereign Bond ETF | | | 1,476 | |
E. Distribution Services — The Distributor or its agent distributes Creation Units for each Fund on an agency basis. The Distributor does not maintain a secondary market in shares of each Fund. JPMDS receives no fees for their distribution services under their respective distribution agreements with the Trust (the “Distribution Agreements”). Although the Trust does not pay any fees under the Distribution Agreements, JPMIM pays JPMDS for certain distribution related services.
F. Other — Certain officers of the Trust are affiliated with the Adviser, the Administrator and JPMDS. Such officers, with the exception of the Chief Compliance Officer, receive no compensation from the Funds for serving in their respective roles.
The Board appointed a Chief Compliance Officer to the Funds in accordance with Federal securities regulations. Each Fund, along with other affiliated funds, makes reimbursement payments, on apro-rata basis, to the Administrator for a portion of the fees associated with the Office of the Chief Compliance Officer. Such fees are included in Trustees’ and Chief Compliance Officer’s fees on the SOP.
| | | | | | | | |
| | | |
| FEBRUARY 28, 2019 | | J.P. MORGAN EXCHANGE-TRADED FUNDS | | | | | 173 | |
NOTES TO FINANCIAL STATEMENTS
AS OF FEBRUARY 28, 2019 (continued)
During the period ended February 28, 2019, the Disciplined High Yield ETF, Global Bond Opportunities ETF and Ultra-Short Income ETF purchased securities from an underwriting syndicate in which the principal underwriter or members of the syndicate were affiliated with the Adviser.
The Funds may use related party broker-dealers. For the period ended February 28, 2019, the Funds did not incur any brokerage commissions with broker-dealers affiliated with the Adviser.
The Securities and Exchange Commission (“SEC”) has granted an exemptive order permitting the Funds to engage in principal transactions with J.P. Morgan Securities, Inc., an affiliated broker, involving taxable money market instruments, subject to certain conditions.
4. Investment Transactions
During the period ended February 28, 2019, purchases and sales of investments (excluding short-term investments) were as follows:
| | | | | | | | | | | | | | | | |
| | | Purchases
(excluding U.S.
Government) | | | Sales
(excluding U.S.
Government) | | | Purchases
of U.S.
Government | | | Sales of U.S.
Government | |
Core Plus Bond ETF | | $ | 18,970,315 | | | $ | 73,969 | | | $ | 4,145,686 | | | | — | |
Corporate Bond Research Enhanced ETF | | | 26,814,757 | | | | 2,630,451 | | | | 911,360 | | | $ | 373,113 | |
Disciplined High Yield ETF | | | 85,191,191 | | | | 30,962,376 | | | | — | | | | — | |
Global Bond Opportunities ETF | | | 142,553,200 | | | | 116,357,557 | | | | 2,129,830 | | | | 83,946 | |
Municipal ETF | | | 33,529,253 | | | | 4,120,544 | | | | — | | | | — | |
U.S. Aggregate Bond ETF | | | 64,883,258 | | | | 4,679,629 | | | | 57,455,780 | | | | 19,260,823 | |
Ultra-Short Income ETF | | | 4,594,455,982 | | | | 684,798,290 | | | | 74,934,196 | | | | — | |
Ultra-Short Municipal Income ETF | | | 57,724,200 | | | | 16,170,000 | | | | — | | | | — | |
USD Emerging Markets Sovereign Bond ETF | | | 24,250,637 | | | | 14,576,446 | | | | — | | | | — | |
For the period ended February 28, 2019,in-kind transactions associated with creations and redemptions (excluding short-term investments) were as follows:
| | | | | | | | |
| | | In-Kind
Creations | | | In-Kind
Redemptions | |
Disciplined High Yield ETF | | $ | 7,800,220 | | | $ | 11,850,666 | |
5. Federal Income Tax Matters
For Federal income tax purposes, the estimated cost and unrealized appreciation (depreciation) in value of investments held at February 28, 2019 were as follows:
| | | | | | | | | | | | | | | | |
| | | Aggregate
Cost | | | Gross
Unrealized
Appreciation | | | Gross
Unrealized
Depreciation | | | Net Unrealized
Appreciation
(Depreciation) | |
Core Plus Bond ETF | | $ | 29,125,122 | | | $ | 114,341 | | | $ | 18,274 | | | $ | 96,067 | |
Corporate Bond Research Enhanced ETF | | | 25,096,108 | | | | 529,864 | | | | 20,474 | | | | 509,390 | |
Disciplined High Yield ETF | | | 159,087,186 | | | | 1,058,888 | | | | 2,478,794 | | | | (1,419,906 | ) |
Global Bond Opportunities ETF | | | 183,838,739 | | | | 2,259,297 | | | | 4,833,651 | | | | (2,574,354 | ) |
Municipal ETF | | | 30,595,446 | | | | 910,280 | | | | 487 | | | | 909,793 | |
U.S. Aggregate Bond ETF | | | 98,723,759 | | | | 306,951 | | | | 189,314 | | | | 117,637 | |
Ultra-Short Income ETF | | | 5,727,046,424 | | | | 5,448,747 | | | | 2,848,341 | | | | 2,600,406 | |
Ultra-Short Municipal Income ETF | | | 58,786,484 | | | | 135,328 | | | | 495 | | | | 134,833 | |
USD Emerging Markets Sovereign Bond ETF | | | 62,869,460 | | | | 352,964 | | | | 2,073,043 | | | | (1,720,079 | ) |
The difference between book and tax basis appreciation (depreciation) on investments is primarily attributed to wash sale loss deferrals, mark to market of futures contracts and mark to market of forward foreign currency contracts.
| | | | | | |
| | | |
| 174 | | | | J.P. MORGAN EXCHANGE-TRADED FUNDS | | FEBRUARY 28, 2019 |
The tax character of distributions paid during the period ended February 28, 2019 was as follows:
| | | | | | | | | | | | | | | | |
| | | Ordinary
Income* | | | Net
Long-Term
Capital Gains | | | Tax
Exempt
Income | | | Total
Distributions
Paid | |
Core Plus Bond ETF | | $ | 63,565 | | | $ | — | | | $ | — | | | $ | 63,565 | |
Corporate Bond Research Enhanced ETF | | | 218,355 | | | | — | | | | — | | | | 218,355 | |
Disciplined High Yield ETF | | | 7,004,942 | | | | — | | | | — | | | | 7,004,942 | |
Global Bond Opportunities ETF | | | 9,465,447 | | | | 518,430 | | | | — | | | | 9,983,877 | |
Municipal ETF | | | 4,314 | | | | — | | | | 244,491 | | | | 248,805 | |
U.S. Aggregate Bond ETF | | | 336,622 | | | | — | | | | — | | | | 336,622 | |
Ultra-Short Income ETF | | | 68,091,573 | | | | 2,323 | | | | — | | | | 68,093,896 | |
Ultra-Short Municipal Income ETF | | | 7,575 | | | | — | | | | 255,464 | | | | 263,039 | |
USD Emerging Markets Sovereign Bond ETF | | | 2,651,785 | | | | — | | | | — | | | | 2,651,785 | |
| * | Short-term gain distributions are treated as ordinary income for income tax purposes. |
The tax character of distributions paid during the period ended February 28, 2018 was as follows:
| | | | | | | | |
| | | Ordinary Income* | | | Total Distributions Paid | |
Disciplined High Yield ETF | | $ | 2,305,921 | | | $ | 2,305,921 | |
Global Bond Opportunities ETF | | | 3,275,400 | | | | 3,275,400 | |
Ultra-Short Income ETF | | | 975,348 | | | | 975,348 | |
USD Emerging Markets Sovereign Bond ETF | | | 168,487 | | | | 168,487 | |
| * | Short-term gain distributions are treated as ordinary income for income tax purposes. |
As of February 28, 2019, the estimated components of net assets (excludingpaid-in-capital) on a tax basis were as follows:
| | | | | | | | | | | | | | | | |
| | | Current
Distributable
Ordinary
Income | | | Current
Distributable
Long-Term
Capital Gain or
(Tax Basis Capital
Loss Carryover) | | | Total
Exempt
Income | | | Unrealized
Appreciation
(Depreciation) | |
Core Plus Bond ETF | | $ | 67,896 | | | $ | 2,703 | | | $ | — | | | $ | 96,067 | |
Corporate Bond Research Enhanced ETF | | | 120,633 | | | | — | | | | — | | | | 509,390 | |
Disciplined High Yield ETF | | | 657,342 | | | | (356,495 | ) | | | — | | | | (1,419,906 | ) |
Global Bond Opportunities ETF | | | 620,836 | | | | (1,599,974 | ) | | | — | | | | (3,085,489 | ) |
Municipal ETF | | | 99,241 | | | | — | | | | 69,335 | | | | 909,793 | |
U.S. Aggregate Bond ETF | | | 256,487 | | | | — | | | | — | | | | 117,637 | |
Ultra-Short Income ETF | | | 13,385,590 | | | | — | | | | — | | | | 2,600,406 | |
Ultra-Short Municipal Income ETF | | | 185 | | | | — | | | | 88,974 | | | | 134,833 | |
USD Emerging Markets Sovereign Bond ETF | | | 257,862 | | | | (662,337 | ) | | | — | | | | (1,720,079 | ) |
For the Funds the cumulative timing differences primarily consist of wash sale loss deferrals, late year ordinary deferrals, mark to market of forward foreign currency contracts, mark to market of futures contracts, straddle loss deferrals, post-October capital loss deferrals and distributions payable.
As of February 28, 2019, the following Funds had the following net capital loss carryforwards:
| | | | | | | | |
| | | Capital Loss Carryforward
Character | |
| | | Short-Term | | | Long-Term | |
Disciplined High Yield ETF | | $ | 278,732 | | | $ | 77,763 | |
Global Bond Opportunities ETF | | | 1,184,197 | | | | 415,777 | |
USD Emerging Markets Sovereign Bond ETF | | | 662,337 | | | | — | |
| | | | | | | | |
| | | |
| FEBRUARY 28, 2019 | | J.P. MORGAN EXCHANGE-TRADED FUNDS | | | | | 175 | |
NOTES TO FINANCIAL STATEMENTS
AS OF FEBRUARY 28, 2019 (continued)
Net capital losses and specified ordinary losses incurred after October 31, and within the taxable year are deemed to arise on the first business day of the Funds’ next taxable year. For the year ended February 28, 2019, the Funds deferred to March 1, 2019 the following net capital losses and specified ordinary losses of:
| | | | | | | | | | | | |
| | | Net Capital Losses | | | Specified
Ordinary Losses | |
| | | Short-Term | | | Long-Term | |
Disciplined High Yield ETF | | $ | 361,803 | | | $ | 188,246 | | | $ | — | |
Global Bond Opportunities ETF | | | 931,655 | | | | 1,099,030 | | | | 566,558 | |
Ultra-Short Income ETF | | | — | | | | 19,191 | | | | — | |
USD Emerging Markets Sovereign Bond ETF | | | 123,967 | | | | 3,736 | | | | — | |
6. Capital Share Transactions
The Trust issues and redeems shares of the Funds only in Creation Units through the Distributor at NAV. Capital shares transactions detail can be found in the Statements of Changes in Net Assets.
Shares of the Funds may only be purchased or redeemed by Authorized Participants. Such Authorized Participants may from time to time hold, of record or beneficially, a substantial percentage of the Funds’ shares outstanding, act as executing or clearing broker for investment transactions on behalf of the Funds. An Authorized Participant is either (1) a “Participating Party” or other participant in the clearing process through the Continuous Net Settlement System of the National Securities Clearing Corporation (“NSCC”); or (2) a DTC Participant; which, in either case, must have executed an agreement with the Distributor.
Creation Units of a Fund may be created in advance of receipt by the Trust of all or a portion of the applicable basket of equity securities and other instruments (“Deposit Instruments”) and cash as described in the Funds’ registration statement. In these instances, the initial Deposit Instruments and cash must be deposited in an amount equal to the sum of the cash amount, plus at least 105%, for Disciplined High Yield ETF, Global Bond Opportunities ETF, USD Emerging Markets Sovereign Bond ETF, Ultra-Short Income ETF, Corporate Bond Research Enhanced ETF and U.S. Aggregate Bond ETF, of the market value of undelivered Deposit Instruments. A transaction fee may be imposed to offset transfer and other transaction costs associated with the purchase or redemption of Creation Units.
Authorized Participants transacting in Creation Units for cash may also pay a variable fee to compensate the relevant fund for market impact expenses relating to investing in portfolio securities. Such variable fees, if any, are included in “Proceeds from shares issued” in the Statements of Changes in Net Assets.
7. Risks, Concentrations and Indemnifications
In the normal course of business, the Funds enter into contracts that contain a variety of representations which provide general indemnifications. Each Fund’s maximum exposure under these arrangements is unknown. The amount of exposure would depend on future claims that may be brought against each Fund. However, based on experience, the Funds expect the risk of loss to be remote.
As of February 28, 2019, the Adviser owns shares representing more than 10% of net assets of the following Funds:
| | | | |
| | | % of Ownership | |
Core Plus Bond ETF | | | 98 | % |
Corporate Bond Research Enhanced ETF | | | 99 | |
Global Bond Opportunities ETF | | | 53 | |
Municipal ETF | | | 83 | |
U.S. Aggregate Bond ETF | | | 25 | |
Ultra-Short Municipal Income ETF | | | 43 | |
USD Emerging Markets Sovereign Bond ETF | | | 77 | |
Significant shareholder transactions by the Adviser may impact the Funds’ performance.
The Core Plus Bond ETF, Global Bond Opportunities ETF, U.S. Aggregate Bond ETF and Ultra-Short Income ETF are subject to risks associated with securities with contractual cash flows including asset backed and mortgage-related securities such as collateralized mortgage obligations, mortgage-pass-through securities and commercial mortgage-backed securities, including securities backed bysub-prime mortgage loans. The value, liquidity and related income of these securities are sensitive to changes in economic conditions, including real estate value,pre-payments, delinquencies and/or defaults, and may be adversely affected by shifts in the market’s perception of the issuers and changes in interest rates.
The Disciplined High Yield ETF invests in high yield securities that are not rated or rated below investment grade (commonly known as “junk bonds.”) These securities are considered to be high risk investments. Investments in lower-rated securities or unrated securities of comparable quality tend to be more sensitive to economic conditions than higher rated securities. Junk bonds involve a greater risk of default by the issuer because such securities are generally unsecured and are often subordinated to other creditors’ claims. The market price of these securities can change suddenly and unexpectedly. As a result, the Fund is intended for investors who are able and willing to assume a high degree of risk.
Global Bond Opportunities ETF’s and USD Emerging Markets Sovereign Bond ETF’s investments in sovereign and corporate debt obligations within emerging market countries may be subject to potentially higher risks than investments in more developed markets and the prices of such
| | | | | | |
| | | |
| 176 | | | | J.P. MORGAN EXCHANGE-TRADED FUNDS | | FEBRUARY 28, 2019 |
investments may be volatile. The yields of emerging market debt obligations reflect, among other things, perceived credit risk. The consequences of political, social or economic instability in these markets may have disruptive effects on the market prices of the Funds’ investments and the income they generate, as well as the Funds’ ability to repatriate such amounts.
Derivatives may be riskier than other types of investments because they may be more sensitive to changes in economic and market conditions and could result in losses that significantly exceed the Funds’ original investment. Many derivatives create leverage thereby causing the Funds to be more volatile than they would have been if they had not used derivatives. Derivatives also expose the Funds to counterparty risk (the risk that the derivative counterparty will not fulfill its contractual obligations), including credit risk of the derivative counterparty.
The Global Bond Opportunities ETF and Ultra-Short Income ETF are also subject to counterparty credit risk, which is the risk that a counterparty fails to perform on agreements with the Fund such as forward foreign currency exchange contracts and TBA securities.
The Funds are subject to interest rate and credit risk. The value of debt securities may decline as interest rates increase. The Funds could lose money if the issuer of a fixed income security is unable to pay interest or repay principal when it is due. The Funds invest in floating rate loans and other floating rate debt securities. Although these investments are generally less sensitive to interest rate changes than other fixed rate instruments, the value of floating rate loans and other floating rate investments may decline if their interest rates do not rise as quickly, or as much, as general interest rates. Many factors can cause interest rates to rise. Some examples include central bank monetary policy, rising inflation rates and general economic conditions. Given that the Federal Reserve has been raising interest rates and may continue to do so, the Funds may face a heightened level of interest rate risk. The ability of the issuers of debt to meet their obligations may be affected by the economic and political developments in a specific industry or region.
The Funds may have elements of risk not typically associated with investments in the United States of America due to concentrated investments in a limited number of countries or regions, which may vary throughout the period depending on the Funds. Such concentrations may subject each Fund to additional risks resulting from political or economic conditions in such countries or regions and the possible imposition of adverse governmental laws or currency exchange restrictions could cause the securities and their markets to be less liquid and their prices to be more volatile than those of comparable U.S. securities.
Disruptions to creations and redemptions, the existence of significant market volatility or potential lack of an active trading market for the Shares (including through a trading halt), as well as other factors, may result in Shares trading significantly above (at a premium) or below (at a discount) to the NAV or to the intraday value of the Fund’s holdings. During such periods, investors may incur significant losses if shares are sold.
USD Emerging Markets Sovereign Bond ETF may not track the return of the underlying index for a number of reasons and therefore may not achieve its investment objective. For example, the Fund incurs a number of operating expenses not applicable to its underlying index, and incurs costs in buying and selling securities, especially when rebalancing the Fund’s securities holdings to reflect changes in the composition of the underlying index. In addition, a Fund’s return may differ from the return of its underlying index as a result of, among other things, pricing differences and the inability to purchase certain securities included in the underlying index due to regulatory or other restrictions. To the extent of the previously outlined items, the Fund’s return differs from the return of the underlying index.
8. New Accounting Pronouncements
In March 2017, the Financial Accounting Standard Board (“FASB”) issuedAccounting Standard Update (“ASU”)2017-08 (“ASU2017-08”) Premium Amortization on Purchased Callable Debt Securities, which shortens the premium amortization period for purchasednon-contingently callable debt securities. ASU2017-08 requires that the premium be amortized to the earliest call date, for purchasednon-contingently callable debt securities. ASU2017-08 is effective for the fiscal years, and interim periods within those fiscal years, beginning after December 15, 2018. Management has evaluated the implications of these changes and the amendments will have no effect on the Funds’ net assets or results of operations.
In August 2018, the FASB issued ASU2018-13 (“ASU2018-13”),Fair Value Measurement (Topic 820): Disclosure Framework — Changes to the DisclosureRequirements for Fair Value Measurement,which adds, removes, and modifies certain aspects of the fair value disclosure. ASU2018-13 amendments are the result of a broader disclosure project, FASB Concepts StatementConceptual Framework for Financial Reporting — Chapter 8: Notes to Financial Statements, to improve the effectiveness of the fair value disclosure requirements. ASU2018-13 is effective for the fiscal years, and interim periods within those fiscal years, beginning after December 15, 2019; early adoption is permitted. Management has evaluated the implications of these changes and the amendments are included in the financial statements, which had no effect to the Funds’ net assets or results of operation.
In August 2018, the SEC adopted their Disclosure Update and Simplification Rule (the “Rule”). The Rule is part of the SEC’s overall project to improve disclosure effectiveness by amending certain disclosure requirements that have become redundant, duplicative, overlapping, outdated, or superseded in light of other SEC disclosure requirements, U.S. GAAP, or changes in the information environment. The amendments are intended to facilitate the disclosure of information to investors and simplify compliance without significantly altering the total mix of information provided to investors. Management has evaluated the implications of these changes and the amendments are included in the financial statements, which had no effect on the Funds’ net assets or results of operation.
| | | | | | | | |
| | | |
| FEBRUARY 28, 2019 | | J.P. MORGAN EXCHANGE-TRADED FUNDS | | | | | 177 | |
REPORT OF INDEPENDENT REGISTERED PUBLIC ACCOUNTING FIRM
TotheBoard of Trustees of J.P. Morgan Exchange-Traded Fund Trust and Shareholders of JPMorgan Core Plus Bond ETF, JPMorgan Corporate Bond Research Enhanced ETF, JPMorgan Disciplined High Yield ETF, JPMorgan Global Bond Opportunities ETF, JPMorgan Municipal ETF, JPMorgan U.S. Aggregate Bond ETF, JPMorgan Ultra-Short Income ETF, JPMorgan Ultra-Short Municipal Income ETF and JPMorgan USD Emerging Markets Sovereign Bond ETF
Opinions on the Financial Statements
We have audited the accompanying statements of assets and liabilities, including the schedules of portfolio investments, of each of the funds listed in the table below (nine of the funds constituting J.P Morgan Exchange-Traded Fund Trust, hereafter collectively referred to as the “Funds”) as of February 28, 2019, the related statements of operations and of changes in net assets for each of the periods indicated in the table below, including the related notes,and the financial highlights for each of the periods indicated therein (collectively referred to as the “financial statements”). In our opinion, the financial statements present fairly, in all material respects, the financial position of each of the Funds as of February 28, 2019, the results of each of their operations and the changes in each of their net assets for the periods indicated in the table below, and each of the financial highlights for each of the periods indicated therein, in conformity with accounting principles generally accepted in the United States of America.
| | |
| JPMorgan Core Plus Bond ETF | | Statement of operations and statement of changes in net assets for the period January 28, 2019 (commencement of operations) through February 28, 2019 |
JPMorgan Corporate Bond Research Enhanced ETF JPMorgan U.S. Aggregate Bond ETF | | Statement of operations and statement of changes in net assets for the period December 12, 2018 (commencement of operations) through February 28, 2019 |
| JPMorgan Disciplined High Yield ETF | | Statement of operations for the year ended February 28, 2019 and statement of changes in net assets for the years ended February 28, 2019 and February 28, 2018 |
| JPMorgan Global Bond Opportunities ETF | | Statement of operations for the year ended February 28, 2019, and statement of changes in net assets for the year ended February 28, 2019 and the period April 5, 2017 (commencement of operations) through February 28, 2018 |
| JPMorgan Municipal ETF | | Statement of operations and statement of changes in net assets for the period October 29, 2018 (commencement of operations) through February 28, 2019 |
| JPMorgan Ultra-Short Income ETF | | Statement of operations for the year ended February 28, 2019, and statement of changes in net assets for the year ended February 28, 2019 and the period May 17, 2017 (commencement of operations) through February 28, 2018 |
| JPMorgan Ultra-Short Municipal Income ETF | | Statement of operations and statement of changes in net assets for the period October 16, 2018 (commencement of operations) through February 28, 2019 |
| JPMorgan USD Emerging Markets Sovereign Bond ETF | | Statement of operations for the year ended February 28, 2019, and statement of changes in net assets for the year ended February 28, 2019 and the period January 29, 2018 (commencement of operations) through February 28, 2018 |
Basis for Opinions
These financial statements are the responsibility of the Funds’ management. Our responsibility is to express an opinion on the Funds’ financial statements based on our audits. We are a public accounting firm registered with the Public Company Accounting Oversight Board (United States) (PCAOB) and are required to be independent with respect to the Funds in accordance with the U.S. federal securities laws and the applicable rules and regulations of the Securities and Exchange Commission and the PCAOB.
| | | | | | |
| | | |
| 178 | | | | J.P. MORGAN EXCHANGE-TRADED FUNDS | | FEBRUARY 28, 2019 |
We conducted our audits of these financial statements in accordance with the standards of the PCAOB. Those standards require that we plan and perform the audit to obtain reasonable assurance about whether the financial statements are free of material misstatement, whether due to error or fraud.
Our audits included performing procedures to assess the risks of material misstatement of the financial statements, whether due to error or fraud, and performing procedures that respond to those risks. Such procedures included examining, on a test basis, evidence regarding the amounts and disclosures in the financial statements. Our audits also included evaluating the accounting principles used and significant estimates made by management, as well as evaluating the overall presentation of the financial statements. Our procedures included confirmation of securities owned as of February 28, 2019 by correspondence with the custodian, transfer agent and brokers; when replies were not received from brokers, we performed other auditing procedures. We believe that our audits provide a reasonable basis for our opinions.
/s/PricewaterhouseCoopers LLP
New York, New York
April 25, 2019
We have served as the auditor of one or more investment companies in the JPMorgan Funds complex since 1993.
| | | | | | | | |
| | | |
| FEBRUARY 28, 2019 | | J.P. MORGAN EXCHANGE-TRADED FUNDS | | | | | 179 | |
TRUSTEES
(Unaudited)
The Funds’ Statements of Additional Information includes additional information about the Funds’ Trustees and is available, without charge, upon request by calling1-844-457-6383 or on the J.P. Morgan Funds’ website at www.jpmorganfunds.com.
| | | | | | | | |
Name (Year of Birth;
Positions With
the Funds since) | | Principal Occupation
During Past 5 Years | | Number of
Funds in Fund
Complex Overseen
by Trustee (1) | | | Other Directorships Held
During the Past 5 Years |
Independent Trustees | | | | | | | | |
| | | |
Gary L. French (1951);
Trustee of the Trust since 2014 | | Real Estate Investor (2011–present); Consultant to the Mutual Fund Industry (2011-present); Senior Consultant for The Regulatory Fundamentals Group LLC (2011–2017); Senior Vice President–Fund Administration, State Street Corporation (2002–2010). | | | 36 | | | Independent Trustee, The China Fund, Inc. (2013-2019); Exchange Traded Concepts Trust II (2012-2014); Exchange Traded Concepts Trust I (2011-2014). |
| | | |
| Robert J. Grassi (1957); Trustee of the Trust since 2014 | | Sole Proprietor, Academy Hills Advisors LLC (2012-present); Pension Director, Corning Incorporated (2002-2012). | | | 36 | | | None. |
| | | |
| Thomas P. Lemke (1954); Trustee of the Trust since 2014 | | Retired; Executive Vice President and General Counsel, Legg Mason (2005-2013). | | | 36 | | | SEI family of funds (Independent Trustee of Advisors’ Inner Circle Fund III (20 portfolios) (from February 2014 to present); Independent Trustee of Winton Diversified Opportunities Fund (from December 2014 to 2018); Independent Trustee of Gallery Trust (from August 2015 to present); Independent Trustee of Schroder Series Trust (from 2017 to present) Independent Trustee of Schroder Global Series Trust (from February 2017 to present); Independent Trustee of O’Connor EQUUS (May 2014-April 2016), Independent Trustee of Winton Series Trust (December 2014-March 2017); Independent Trustee of AXA Premier VIP Trust (2014-June 2017); Independent Director of The Victory Funds (or their predecessor funds) (35 portfolios) (2014-March 2015); Symmetry Panoramic Trust (16 portfolios) (2018-present) |
| | | |
| Lawrence R. Maffia (1950); Trustee of the Trust since 2014 | | Retired; Director and President, ICI Mutual Insurance Company (2006-2013). | | | 36 | | | Director, ICI Mutual Insurance Company (1999-2013). |
| | | |
| Emily A. Youssouf (1951); Trustee of the Trust since 2014 | | Clinical Professor, NYU Schack Institute of Real Estate (2009-present); Board Member(2005-present), Chair of Capital Committee (2006-2016), Chair of Audit Committee(2005-present), and Chair of IT Committee (2016-present), NYC Health and Hospitals Corporation; Board Member and Member of the Audit Committee and Related Parties Committee (2013-2018) and Member of the Risk Management Committee (2017-2018), PennyMac Financial Services, Inc. | | | 36 | | | Trustee, NYC School Construction Authority (2009-present); Board Member, NYS Job Development Authority (2008-present); Trustee (2015-present) and Chair of the Audit and Finance Committee (2015-present) of the Transit Center Foundation; Vice Chair (2011-2013) and Board Member (2013-2014) of New York City Housing Authority. |
Interested Trustee | | | | | | | | |
| | | |
| Robert Deutsch (2) (1957); Chairman and Trustee of the Trust since 2014 | | Retired; Head of the Global ETF Business for JPMorgan Asset Management (2013-2017); Head of the Global Liquidity Business for JPMorgan Asset Management (2003-2013). | | | 36 | | | Board of Directors of the JUST Capital Foundation (2017–present). |
| (1) | A Fund Complex means two or more registered investment companies that hold themselves out to investors as related companies for purposes of investment and investor services or have a common investment adviser or have an investment adviser that is an affiliated person of the investment adviser of any of the other registered investment companies. Thirty two series of the Trust have commenced operations. |
| (2) | Mr. Deutsch is an interested trustee because he was an employee of the Adviser until August 2017. |
The contact address for each of the Trustees is 277 Park Avenue, New York, NY 10172.
| | | | | | |
| | | |
| 180 | | | | J.P. MORGAN EXCHANGE-TRADED FUNDS | | FEBRUARY 28, 2019 |
OFFICERS
(Unaudited)
| | |
Name (Year of Birth),
Positions Held with
the Trusts (Since) | | Principal Occupations During Past 5 Years |
| |
Joanna Gallegos (1975), President and Principal Executive Officer (2017) | | Managing Director, Head of J.P. Morgan Asset Management’s U.S. Exchange Traded Funds business. Previously, Head of J.P. Morgan Asset Management’s ETF Product Development team from August 2013 to July 2017. |
| |
Ogden Hammond (1975), Interim President and Principal Executive Officer (2019) | | Managing Director and Global Head of Beta (Passive) Product and Business Development for J.P. Morgan Asset Management. Previously, Executive Director and Global Head of Beta Product and Business Development (2017-2018), Executive Director and Head of Beta Strategy and Business Development(2016-2017) and Executive Director and Head of ETF Solutions Strategy & Business Development (2014-2016) for J.P. Morgan Investment Management Inc., Executive Director, Strategy and Business Development(2013-2014) for J.P. Morgan Asset Management. |
| |
Lauren A. Paino (1973), Treasurer and Principal Financial Officer (2015)* | | Executive Director, J.P. Morgan Investment Management Inc. (formerly JPMorgan Funds Management, Inc.) since August 2013; Director, Credit Suisse Asset Management from 2000 to 2013. |
| |
Brian S. Shlissel (1964), Vice President (2016) | | Managing Director and Chief Administrative Officer for J.P. Morgan pooled vehicles, J.P. Morgan Investment Management Inc. (formerly JPMorgan Funds Management, Inc.) (from 2014 to present); Managing Director and Head of Mutual Fund Services, Allianz Global Investors; President and Chief Executive Officer, Allianz Global Investors Mutual Funds and PIMCO Closed-End Funds (from 1999 to 2014). |
| |
Paul Shield (1960), Vice President and Assistant Treasurer (2016) | | Managing Director and head of Business Management for JPMorgan Asset Management’s Exchange Traded Fund platform since 2013. Senior Global Product Manager of Alternative Investments for BNY Mellon from 2011 to 2013 and Global Product Head for Exchange Traded Funds at JPMorgan Chase Bank from 2008 to 2011. |
| |
| Elizabeth A. Davin (1964), Secretary (2018)** | | Executive Director and Assistant General Counsel, JPMorgan Chase. Ms. Davin has been with JPMorgan Chase (formerly Bank One Corporation) since 2004. |
| |
Stephen M. Ungerman (1953), Chief Compliance Officer (2014) | | Managing Director, JPMorgan Chase & Co.; Mr. Ungerman has been with JPMorgan Chase & Co. since 2000. |
| |
Jessica K. Ditullio (1962), Assistant Secretary (2014)** | | Executive Director and Assistant General Counsel, JPMorgan Chase. Ms. Ditullio has been with JPMorgan Chase (formerly Bank One Corporation) since 1990. |
| |
Carmine Lekstutis (1980), Assistant Secretary (2014)* | | Executive Director and Assistant General Counsel, JPMorgan Chase since February 2015; formerly Vice President and Assistant General Counsel, JPMorgan Chase from 2011 to February 2015. |
| |
Gregory S. Samuels (1980), Assistant Secretary (2014)* | | Executive Director and Assistant General Counsel, JPMorgan Chase since February 2014; formerly Vice President and Assistant General Counsel, JPMorgan Chase from 2010. |
| |
Pamela L. Woodley (1971), Assistant Secretary (2014)* | | Vice President and Assistant General Counsel, JPMorgan Chase since November 2004. |
| |
| Zachary E. Vonnegut-Gabovitch (1986), Assistant Secretary (2017)* | | Vice President and Assistant General Counsel, JPMorgan Chase since September 2016; Associate, Morgan Lewis & Bockius (law firm) from 2012 to 2016. |
| |
| Frederick J. Cavaliere (1978), Assistant Treasurer (2015)* | | Executive Director, J.P. Morgan Investment Management Inc. since February 2016; formerly, Vice President, J.P. Morgan Investment Management Inc. (formerly JPMorgan Funds Management, Inc.) since September 2010 to February 2016. Mr. Cavaliere has been with JPMorgan since May 2006. |
| |
Michael M. D’Ambrosio (1969), Assistant Treasurer (2014) | | Managing Director, J.P. Morgan Investment Management Inc. (formerly JPMorgan Funds Management, Inc.) since May 2014; formerly Executive Director, J.P. Morgan Investment Management Inc. (formerly JPMorgan Funds Management, Inc.) from 2012 to May 2014. |
| |
Jason Ronca (1978), Assistant Treasurer (2014)*** | | Executive Director, Assistant Treasurer and ETF Platform Manager for J.P. Morgan Asset Management since February 2017; formerly Vice President, Assistant Treasurer and ETF Platform Manager for J.P. Morgan Asset Management from May 2014 to February 2017. ETF Product Manager for Corporate Investment Bank responsible for setting the strategy and control agenda for the ETF servicing business from 2010 to May 2014; Prior to 2010, a Vice President in Fund Accounting within J.P. Morgan Investor Services, supporting a series of U.S. registered mutual funds. |
The contact address for each of officers, unless otherwise noted, is 277 Park Avenue, New York, NY 10172.
| * | | The contact address for the officer is 4 New York Plaza, New York, NY 10004. |
| ** | | The contact address for the officer is 1111 Polaris Parkway, Columbus, OH 43240. |
| *** | | The contact address for the officer is 50 Rowes Wharf, Floor 3, Boston, MA 02110. |
| | | | | | | | |
| | | |
| FEBRUARY 28, 2019 | | J.P. MORGAN EXCHANGE-TRADED FUNDS | | | | | 181 | |
SCHEDULE OF SHAREHOLDER EXPENSES
(Unaudited)
Hypothetical $1,000 Investment
As a shareholder of the Funds, you incur ongoing costs, investment advisory fees, administration fees and other Fund expenses, in addition to brokerage commissions on your purchases and sales of Fund shares. The examples below are intended to help you understand your ongoing costs (in dollars) of investing in the Fund and to compare these ongoing costs with the ongoing costs of investing in other funds. The examples assume that you had a $1,000 investment at the beginning of the reporting period, September 1, 2018 and continued to hold your shares at the end of the reporting period, February 28, 2019.
Actual Expenses
For the Fund in the table below, the first line provides information about actual account values and actual expenses. You may use the information in this line, together with the amount you invested, to estimate the expenses that you paid over the period. Simply divide your account value by $1,000 (for example, an $8,600 account value divided by $1,000 = 8.6), then multiply the result by the number under the heading
entitled “Expenses Paid During the Period” to estimate the expenses you paid on your account during this period.
Hypothetical Example for Comparison Purposes
The second line in the table below provides information about hypothetical account values and hypothetical expenses based on the Fund’s actual expense ratio and an assumed rate of return of 5% per year before expenses, which is not the Fund’s actual return. The hypothetical account values and expenses may not be used to estimate the actual ending account balance or expenses you paid for the period. You may use this information to compare the ongoing costs of investing in the Fund and other Funds. To do so, compare this 5% hypothetical example with the 5% hypothetical examples that appear in the shareholder reports of other funds. The examples also assume all dividends and distributions have been reinvested. The examples do not take into account brokerage commissions that you pay when purchasing or selling shares of a Fund.
| | | | | | | | | | | | | | | | |
| | | Beginning
Account Value
September 1, 2018 | | | Ending
Account Value
February 28, 2019 | | | Annualized
Expense
Ratio | | | Expenses
Paid During
the Period | |
JPMorgan Core Plus Bond ETF | |
Actual (1) | | $ | 1,000.00 | | | $ | 1,009.70 | | | | 0.38 | % | | $ | 0.33 | |
Hypothetical (2) | | | 1,000.00 | | | | 1,022.91 | | | | 0.38 | | | | 1.91 | |
|
JPMorgan Corporate Bond Research Enhanced ETF | |
Actual (3) | | | 1,000.00 | | | | 1,032.60 | | | | 0.14 | | | | 0.31 | |
Hypothetical (2) | | | 1,000.00 | | | | 1,024.10 | | | | 0.14 | | | | 0.70 | |
|
JPMorgan Disciplined High Yield ETF | |
Actual (2) | | | 1,000.00 | | | | 1,027.50 | | | | 0.40 | | | | 2.01 | |
Hypothetical (2) | | | 1,000.00 | | | | 1,022.81 | | | | 0.40 | | | | 2.01 | |
|
JPMorgan Global Bond Opportunities ETF | |
Actual (2) | | | 1,000.00 | | | | 1,026.00 | | | | 0.54 | | | | 2.71 | |
Hypothetical (2) | | | 1,000.00 | | | | 1,022.12 | | | | 0.54 | | | | 2.71 | |
|
JPMorgan Municipal ETF | |
Actual (4) | | | 1,000.00 | | | | 1,047.40 | | | | 0.23 | | | | 0.79 | |
Hypothetical (2) | | | 1,000.00 | | | | 1,023.65 | | | | 0.23 | | | | 1.15 | |
|
JPMorgan U.S. Aggregate Bond ETF | |
Actual (3) | | | 1,000.00 | | | | 1,019.00 | | | | 0.07 | | | | 0.15 | |
Hypothetical (2) | | | 1,000.00 | | | | 1,024.45 | | | | 0.07 | | | | 0.35 | |
|
JPMorgan Ultra-Short Income ETF | |
Actual (2) | | | 1,000.00 | | | | 1,013.80 | | | | 0.17 | | | | 0.85 | |
Hypothetical (2) | | | 1,000.00 | | | | 1,023.95 | | | | 0.17 | | | | 0.85 | |
|
JPMorgan Ultra-Short Municipal Income ETF | |
Actual (5) | | | 1,000.00 | | | | 1,011.60 | | | | 0.17 | | | | 0.64 | |
Hypothetical (2) | | | 1,000.00 | | | | 1,023.95 | | | | 0.17 | | | | 0.85 | |
|
JPMorgan USD Emerging Markets Sovereign Bond ETF | |
Actual (2) | | | 1,000.00 | | | | 1,064.30 | | | | 0.39 | | | | 2.00 | |
Hypothetical (2) | | | 1,000.00 | | | | 1,022.86 | | | | 0.39 | | | | 1.96 | |
| (1) | Expenses are equal to each Fund’s annualized net expense ratio, multiplied by the average account value over the period, multiplied by 32/365 (to reflect the one-half year period). Commencement of operations was January 28, 2019. |
| | | | | | |
| | | |
| 182 | | | | J.P. MORGAN EXCHANGE-TRADED FUNDS | | FEBRUARY 28, 2019 |
SCHEDULE OF SHAREHOLDER EXPENSES
(Unaudited) (continued)
Hypothetical $1,000 Investment
| (2) | Expenses are equal to each Fund’s annualized net expense ratio, multiplied by the average account value over the period, multiplied by 181/365 (to reflect the one-half year period). |
| (3) | Expenses are equal to each Fund’s annualized net expense ratio, multiplied by the average account value over the period, multiplied by 79/365 (to reflect the one-half year period). Commencement of operations was December 12, 2018. |
| (4) | Expenses are equal to each Fund’s annualized net expense ratio, multiplied by the average account value over the period, multiplied by 123/365 (to reflect the one-half year period). Commencement of operations was October 29, 2018. |
| (5) | Expenses are equal to each Fund’s annualized net expense ratio, multiplied by the average account value over the period, multiplied by 136/365 (to reflect the one-half year period). Commencement of operations was October 16, 2018. |
| | | | | | | | |
| | | |
| FEBRUARY 28, 2019 | | J.P. MORGAN EXCHANGE-TRADED FUNDS | | | | | 183 | |
TAX LETTER
(Unaudited)
Certain tax information for the J.P. Morgan Funds is required to be provided to shareholders based upon the Funds’ income and distributions for the taxable year ended February 28, 2019. The information and distributions reported in this letter may differ from the information and taxable distributions reported to the shareholders for the calendar year ending December 31, 2019. The information necessary to complete your income tax returns for the calendar year ending December 31, 2019 will be provided under separate cover.
Long Term Capital Gain
Each Fund listed below distributed the following amount, or
maximum allowable amount, of long-term capital gain dividends for the fiscal year ended February 28, 2019:
| | | | |
| | | Long-Term
Capital Gain
Distribution | |
Global Bond Opportunities ETF | | $ | 518,430 | |
Ultra-Short Income ETF | | | 2,323 | |
Tax-Exempt Income
Each Fund listed below had the following amount, or maximum allowable amount, of dividends paid from investment income that are exempt from federal income tax for the fiscal year ended February 28, 2019:
| | | | |
| | | Exempt
Distributions
Paid | |
Ultra-Short Municipal Income ETF | | $ | 255,464 | |
Municipal ETF | | | 244,491 | |
Qualified Interest Income (QII)
Each Fund listed below paid the following amount, or maximum allowable amount, of ordinary distributions treated as qualified interest income for the fiscal year ended February 28, 2019:
| | | | |
| | | Qualified
Interest
Income | |
Core Plus Bond ETF | | $ | 60,080 | |
Corporate Bond Research Enhanced ETF | | | 188,155 | |
Disciplined High Yield ETF | | | 5,095,314 | |
Global Bond Opportunities ETF | | | 3,525,300 | |
U.S. Aggregate Bond ETF | | | 300,973 | |
Ultra-Short Income ETF | | | 31,913,998 | |
USD Emerging Markets Sovereign Bond ETF | | | 6,178 | |
Each Fund listed below had the following percentage, or the
maximum allowable percentage, of income earned from direct
U.S. Treasury Obligations for the fiscal year ended February 28,
2019:
| | | | |
| | | Income from U.S. Treasury
Obligations | |
Corporate Bond Research Enhanced ETF | | | 0.1 | % |
U.S. Aggregate Bond ETF | | | 31.9 | |
Ultra-Short Income ETF | | | 0.8 | |
| | | | | | |
| | | |
| 184 | | | | J.P. MORGAN EXCHANGE-TRADED FUNDS | | FEBRUARY 28, 2019 |
BOARD APPROVAL OF INITIAL INVESTMENT ADVISORY AGREEMENTS
(Unaudited)
JPMorgan Core Plus Bond ETF, JPMorgan Corporate Bond Research Enhanced ETF, JPMorgan Municipal ETF, JPMorgan U.S. Aggregate Bond ETF and JPMorgan Ultra-Short Municipal Income ETF
On September18-19, 2018 and/or December 4, 2018, the Board of Trustees heldin-person meetings and approved the initial investment advisory agreements (each an “Advisory Agreement” and collectively, the “Advisory Agreements”) for the JPMorgan Core Plus Bond ETF, JPMorgan Corporate Bond Research Enhanced ETF, JPMorgan Municipal ETF, JPMorgan U.S. Aggregate Bond ETF and JPMorgan Ultra-Short Municipal Income ETF (the “Funds”). The Advisory Agreements were approved by a majority of the Trustees who are not “Interested Persons” (as defined in the 1940 Act) of any party to the Advisory Agreements or any of their affiliates. In connection with the approval of the Advisory Agreements, the Trustees reviewed written materials prepared by the Adviser and received oral presentations from Adviser personnel. Before voting on the proposed Advisory Agreements, the Trustees reviewed the Advisory Agreements with representatives of the Adviser and with counsel to the Trust and independent legal counsel to the Trustees and received a memorandum from independent legal counsel discussing the legal standards for their consideration of the proposed Advisory Agreements. They also considered information they receive from the Adviser over the course of the year in connection with their oversight of other funds managed by the Adviser. The Trustees also discussed the proposed Advisory Agreements in executive session with independent legal counsel at which no representatives of the Adviser were present.
Set forth below is a summary of the material factors evaluated by the Trustees in determining whether to approve each Advisory Agreement. The Trustees considered information provided with respect to each Fund and the approval of each Advisory Agreement. Each Trustee attributed his or her own evaluation of the significance of the various factors, and no factor alone was considered determinative. The Trustees determined that the proposed compensation to be received by the Adviser from each Fund under the applicable Advisory Agreement was fair and reasonable and that initial approval of the Advisory Agreements was in the best interests of each Fund and its potential shareholders.
The factors summarized below were considered and discussed by the Trustees in reaching their conclusions:
Nature, Extent and Quality of Services Provided by the Adviser
In connection with the approval of the initial Advisory Agreements, the Trustees considered the materials furnished specifically in connection with the approval of each Advisory Agreement, as well as other relevant information furnished for the Trustees. The Trustees considered the background and experience of the Adviser’s senior management and investment personnel. In addition, the Trustees reviewed the qualifications,
backgrounds and responsibilities of the portfolio management team primarily responsible for theday-to-day management of each Fund. The Trustees also considered the investment strategy for each Fund, and the infrastructure supporting the portfolio management teams. In addition, the Trustees considered information about the structure and distribution strategy of the Funds, how they fit within the Trust’s other fund offerings, and how each will be positioned against peer funds, as identified by management. The Trustees also considered the services provided by the Adviser in its role as each Fund’s administrator.
The Trustees also considered their knowledge of the nature and quality of the services provided by the Adviser and its affiliates gained from their experience as Trustees of the Trust and in the financial industry generally. In addition, they considered the overall reputation and capabilities of the Adviser and its affiliates, the commitment of the Adviser to provide high quality service to each Fund, their overall confidence in the Adviser’s integrity and the Adviser’s responsiveness to requests for additional information, questions or concerns raised by them.
Based upon these considerations and other factors, the Trustees concluded that they were satisfied with the nature, extent and quality of services to be provided to each Fund by the Adviser.
Fall-Out Benefits
The Trustees reviewed information regarding potential“fall-out” or ancillary benefits expected to be received by the Adviser and its affiliates as a result of their relationship with the Funds. Additionally, the Trustees considered that anyfall-out or ancillary benefits would be comparable to those related to the other funds in the complex.
The Trustees also considered the benefits the Adviser is expected to receive as the result of its role as each Fund’s administrator and JPMorgan Chase Bank, N.A.’s roles as custodian, fund accountant and transfer agent for each Fund.
Economies of Scale
The Trustees considered the extent to which each Fund will benefit from economies of scale. The Trustees noted that neither the proposed investment advisory fee schedule nor the proposed administration agreement for the Funds contain breakpoints. The Trustees considered whether it would be appropriate to add advisory fee breakpoints and the Trustees concluded that the current fee structure for each Fund was reasonable in light of the fee waivers and expense limitations that the Adviser has in place, limiting the overall net expense ratio of each Fund to competitive levels. With respect to fees for administrative services, the Trustees also considered the fact that each Fund would benefit from the economies of scale present in the broader J.P. Morgan fund complex, as the Funds
| | | | | | | | |
| | | |
| FEBRUARY 28, 2019 | | J.P. MORGAN EXCHANGE-TRADED FUNDS | | | | | 185 | |
BOARD APPROVAL OF INITIAL INVESTMENT ADVISORY AGREEMENTS
(Unaudited) (continued)
were able to negotiate an administration fee at a level consistent with the lower effective rate currently paid by the J.P. Morgan mutual funds, which includes breakpoints. The Trustees also took into consideration management’s belief that because of such economies of scale, each Fund’s administration fee is lower than what it would have to pay if it was not part of the J.P. Morgan fund complex.
Investment Performance
The Trustees considered each Fund’s investment strategy and processes, the portfolio management team and competitive positioning against identified peer funds, and concluded that the prospects for competitive future performance were acceptable.
Advisory Fees and Expense Ratios
The Trustees considered the contractual advisory fee rate and administration fee rate that will be paid by each Fund to the Adviser and compared the combined rate to information prepared by Broadridge Investor Communications Solutions Inc. (“Broadridge”), an independent provider of investment company data, concerning management fee rates paid by other
funds in the same Broadridge category as each Fund. The Trustees also compared the advisory fees for certain of the Funds to fees charged to mutual funds with similar investment objectives or in similar asset classes managed by the Adviser. The Trustees also considered the fees paid to JPMorgan Chase Bank, N.A., an affiliate of the Adviser, for custody, transfer agency and other related services for each Fund. The Trustees also reviewed information about other projected expenses and the expense ratio for each Fund. The Trustees considered the projected fee waiver and/or expense reimbursement arrangements proposed for each Fund and considered the net advisory fee rate and total expense ratio after taking into account any projected waivers and/or reimbursements.
The Trustees noted that each Fund’s estimated net advisory fee and total expense ratio were in line with identified peer funds. The Trustees also noted that because the Funds were not yet operational, no profitability information was available. After considering the factors identified above, in light of the information, the Trustees concluded that each Fund’s advisory fee and total expense ratio were reasonable.
| | | | | | |
| | | |
| 186 | | | | J.P. MORGAN EXCHANGE-TRADED FUNDS | | FEBRUARY 28, 2019 |
BOARD APPROVAL OF INVESTMENT ADVISORY AGREEMENTS
(Unaudited)
JPMorgan Disciplined High Yield ETF, JPMorgan Global Bond Opportunities ETF, JPMorgan Ultra-Short Income ETF and JPMorgan USD Emerging Markets Sovereign Bond ETF
The Board of Trustees meets regularly throughout the year and considers factors that are relevant to their annual consideration of investment advisory agreements at each meeting. The Board also meets specifically to consider investment advisory agreement annual renewals. The Board of Trustees held a meeting in person December 4, 2018, at which the Trustees considered the continuation of investment advisory agreements (each an “Advisory Agreement” and collectively, the “Advisory Agreements”) for JPMorgan Disciplined High Yield ETF, JPMorgan Global Bond Opportunities ETF, JPMorgan Ultra-Short Income ETF and JPMorgan USD Emerging Markets Sovereign Bond ETF (the “Funds”). In advance of the December 4, 2018 meeting, the Trustees met on November 8, 2018 to discuss certain information in connection with its consideration of the Advisory Agreements. At the December meeting, the Board reviewed and considered performance, expense and other information individually for each of the Funds. The Trustees, including a majority of the Trustees who are not “Interested Persons” (as defined in the 1940 Act) of any party to the Advisory Agreements or any of their affiliates, approved the continuation of each Advisory Agreement.
As part of their review of the Advisory Agreements, the Trustees considered and reviewed performance and other information about each Fund received from the Adviser. This information included each Fund’s performance as compared to the performance of its benchmark and analyses by the Adviser of each Fund’s performance. In addition, in preparation for the December meeting, the Trustees requested, received and evaluated extensive materials from the Adviser, including performance and expense information compiled by Broadridge Investor Communications Solutions Inc. (“Broadridge”), an independent provider of investment company data, and met with representatives of Broadridge.Before voting on the Advisory Agreements, the Trustees reviewed the Advisory Agreements with representatives of the Adviser, counsel to the Trust and independent legal counsel and received a memorandum from independent legal counsel to the Trustees discussing the legal standards for their consideration of the Advisory Agreements. The Trustees also discussed the Advisory Agreements in executive sessions with independent legal counsel at which no representatives of the Adviser were present.
A summary of the material factors evaluated by the Trustees in determining whether to approve each Advisory Agreement is provided below. The Trustees considered information provided with respect to the Funds over the course of the year, as well as the materials furnished specifically in connection with this annual renewal process. Each Trustee attributed his or her own evaluation of the significance of the various factors and no factor alone was considered determinative. From year to year,
the Trustees consider and place emphasis on relevant information in light of changing circumstances in market and economic conditions. The Trustees determined that the compensation received by the Adviser from each Fund under the Advisory Agreement was fair and reasonable and that the continuance of the Advisory Agreement was in the best interests of each Fund and its shareholders.
The factors summarized below were considered and discussed by the Trustees in reaching their conclusions:
Nature, Extent and Quality of Services Provided by the Adviser
The Trustees received and considered information regarding the nature, extent and quality of the services provided to each Fund under its respective Advisory Agreement. The Trustees took into account information furnished throughout the year at Trustee meetings, as well as the materials furnished specifically in connection with this annual review process. The Trustees considered the background and experience of the Adviser’s senior management and investment personnel. In addition, the Trustees reviewed the qualifications, backgrounds and responsibilities of the portfolio management team primarily responsible for theday-to-day management of each Fund. The Trustees also considered each Fund’s investment strategy, and the infrastructure supporting the portfolio management teams. In addition, the Trustees considered information about the structure and distribution strategies of the Funds, how they fit within the Trust’s fund offerings, and how each Fund is positioned against peer funds, as identified by management. The Trustees reviewed information relating to the Adviser’s risk governance model and reports showing the Adviser’s compliance structure and ongoing compliance processes. The Trustees also considered the quality of administrative services provided by the Adviser in its role as administrator to the Funds.
The Trustees also considered their knowledge of the nature and quality of services provided by the Adviser and its affiliates gained from their experience as Trustees of the Trust and in the financial industry. In addition, they considered the overall reputation and capabilities of the Adviser and its affiliates, the commitment of the Adviser to continue to provide high quality service to the Funds, their overall confidence in the Adviser’s integrity and the Adviser’s responsiveness to requests for additional information, questions or concerns raised by them.
Based upon these considerations and other factors, the Trustees concluded that they were satisfied with the nature, extent and quality of services provided to each Fund by the Adviser.
Costs of Services Provided and Profitability to the Adviser and its Affiliates
The Trustees received and considered information regarding the profitability to the Adviser and its affiliates in providing services to the Funds. The Trustees reviewed and discussed this
| | | | | | | | |
| | | |
| FEBRUARY 28, 2019 | | J.P. MORGAN EXCHANGE-TRADED FUNDS | | | | | 187 | |
BOARD APPROVAL OF INVESTMENT ADVISORY AGREEMENTS
(Unaudited) (continued)
information. The Trustees recognized that this information is not audited and represents the Adviser’s determination of its and its affiliates’ revenues from the contractual services provided to the Funds, less expenses of providing such services. Expenses include direct and indirect costs and are calculated using allocation methodologies developed by the Adviser. The Trustees also recognized that it is difficult to make direct comparisons of profitability from fund investment advisory contracts because comparative information is not generally publicly available and is affected by numerous factors, including the structure of the particular adviser, the types of funds it manages, its business mix, numerous assumptions regarding allocations and the fact that publicly-traded fund managers’ operating profits and net income are net of distribution and marketing expenses. Based upon their review, the Trustees concluded that the profitability to the Adviser under each Advisory Agreement was not unreasonable in light of the services and benefits provided to each Fund.
The Trustees also considered the fees that the Adviser earned from the Funds for providing administrative services. These fees were shown separately in the profitability analysis presented to the Trustees. The Trustees also considered the fees paid to J.P. Morgan Chase Bank, N.A. (“JPMCB”), also an affiliate of the Adviser, for custody, transfer agency and other related services for each Fund.
Fall-Out Benefits
The Trustees reviewed information regarding potential“fall-out” or ancillary benefits received by the Adviser and its affiliates as a result of their relationships with the Funds.
Economies of Scale
The Trustees considered the extent to which each Fund may benefit from economies of scale. The Trustees noted that the Adviser has implemented fee waivers and expense limitations (“Fee Caps”), which allow the Fund’s shareholders to share potential economies of scale from the Fund’s inception. The Trustees noted that neither the investment advisory fee schedule nor the administration agreement for the Funds contain breakpoints, but that fees are competitive with their peer funds. They concluded that the current fee structure was reasonable in light of the Fee Caps that the Adviser has in place which serve to limit the overall net expense ratio of each Fund to competitive levels. With respect to fees for administrative services, the Trustees also considered the fact that the Funds benefit from the economies of scale present in the broader J.P. Morgan fund complex, as the Funds were able to negotiate an administration fee at level consistent with the lower effective rate currently paid by the J.P. Morgan mutual funds, which includes breakpoints. The Trustees also took into consideration management’s belief that because of such economies of scale, the Funds’ administration fees are lower than what the Funds
would have to pay if they were not part of the J.P. Morgan fund complex.
Fees Relative to Adviser’s Other Clients
The Trustees requested and received and considered information about the nature and extent of investment advisory services and fee rates offered to other investment companies advised by the Adviser in the same asset class as each Fund. The Trustees also noted the Adviser’s view that it does not manage other accounts with substantially similar investment strategies as that of the Funds other than JPMorgan Global Bond Opportunities ETF. The Trustees concluded that the fee rates charged to each Fund in comparison to those charged to such other clients were reasonable.
Investment Performance
The Trustees received and considered absolute and relative performance information for Funds with at leastone-year of performance history in a report prepared by Broadridge except for the JPMorgan USD Emerging Markets Sovereign Bond ETF for which performance information is compared against the Fund’s benchmark index. The Trustees considered the total return performance information, which included the ranking of the Funds within a performance universe made up of funds with the same Broadridge investment classification and objective (the “Universe”), as well as a subset of funds within the Universe (the “Peer Group”), by total return for applicableone- and three-year periods. The Trustees reviewed a description of Broadridge’s methodology for selecting mutual funds in each Fund’s Peer Group and Universe. The Trustees also considered each Fund’s investment strategy and processes, portfolio management teams and competitive positioning against peer funds, as identified by Broadridge and/or management. As part of this review, the Trustees also reviewed each Fund’s performance against its benchmark and considered each Fund’s performance information provided at regular Board meetings by the Adviser. After consideration, the Trustees determined that each Fund’s performance was consistent with its investment objective. The Broadridge performance data noted by the Trustees as part of their review and the determinations made by the Trustees with respect to each Fund’s performance are summarized below:
The Trustees noted that the JPMorgan Disciplined High Yield ETF’s performance was in the fifth quintile based upon both the Peer Group and Universe for theone-year period ended September 30, 2018. The Trustees discussed the performance and investment strategy of the Fund with the Adviser and based upon these discussions and various other factors, the Trustees concluded that the Fund’s performance was satisfactory.
The Trustees noted that the JPMorgan Global Bond Opportunities ETF’s performance was in the fiftieth percentile based upon both the Peer Group and Universe for theone-year period
| | | | | | |
| | | |
| 188 | | | | J.P. MORGAN EXCHANGE-TRADED FUNDS | | FEBRUARY 28, 2019 |
ended September 30, 2018. The Trustees discussed the performance and investment strategy of the Fund with the Adviser and based upon these discussions and various other factors, the Trustees concluded that the Fund’s performance was satisfactory.
The Trustees noted that the JPMorgan Ultra-Short Income ETF’s performance was in the first and second quintiles based upon the Peer Group and Universe for theone-year period ended September 30, 2018, respectively. The Trustees discussed the performance and investment strategy of the Fund with the Adviser and based upon these discussions and various other factors, the Trustees concluded that the Fund’s performance was satisfactory.
The Trustees noted the performance of the JPMorgan USD Emerging Markets Sovereign Bond ETF since its inception on January 29, 2018 as compared with that of its benchmark index. The Trustees discussed the performance and investment strategy of the Fund with the Advisor and, based upon this discussion and various other factors, concluded that the performance was satisfactory.
Advisory Fees and Expense Ratios
The Trustees considered the contractual advisory fee rate and administration fee rate paid by each Fund to the Adviser and compared the combined rate to the information prepared by Broadridge concerning management fee rates paid by other funds in the same Broadridge category as each Fund. The Trustees reviewed a description of Broadridge’s methodology for selecting funds in the Peer Group and Universe. The Trustees recognized that Broadridge reported each Fund’s management fee rate as the combined contractual advisory fee and administration fee rates. The Trustees also reviewed information about other expenses and the total expense ratio for each Fund. The Trustees considered the Fee Caps currently
in place for each Fund and considered the net advisory fee rate after taking into account such Fee Caps. The Trustees recognized that it is difficult to make comparisons of advisory fees because there are variations in the services that are included in the fees paid by other funds. The Trustees’ determination as a result of the review of each Fund’s advisory fees and expense ratios are summarized below:
The Trustees noted that the JPMorgan Disciplined High Yield ETF’s net advisory fee was in the first quintile based upon both the Peer Group and Universe, and that the actual total expenses were in the second and third quintiles based upon the Peer Group and Universe, respectively. After considering the factors identified above, in light of this information, the Trustees concluded that the advisory fee was reasonable.
The Trustees noted that the JPMorgan Global Bond Opportunities ETF’s net advisory fee and actual total expenses were below the median of the Peer Group and Universe. After considering the factors identified above, in light of this information, the Trustees concluded that the advisory fee was reasonable.
The Trustees noted that the JPMorgan Ultra-Short Income ETF’s net advisory fee was in the second quintile based upon both the Peer Group and Universe, and that the actual total expenses were in the first and second quintiles based upon the Peer Group and Universe, respectively. After considering the factors identified above, in light of this information, the Trustees concluded that the advisory fee was reasonable.
The Trustees noted that the JPMorgan USD Emerging Markets Sovereign Bond ETF’s net advisory fee and actual total expenses were in the first quintile based upon the Universe. After considering the factors identified above, in light of this information, the Trustees concluded that the advisory fee was reasonable.
| | | | | | | | |
| | | |
| FEBRUARY 28, 2019 | | J.P. MORGAN EXCHANGE-TRADED FUNDS | | | | | 189 | |
J.P. Morgan Exchange-Traded Funds are distributed by JPMorgan Distribution Services, Inc., an indirect, wholly-owned subsidiary of JPMorgan Chase & Co.
Contact J.P. Morgan Exchange-Traded Funds at 1-844-457-6383 (844-4JPM ETF) for a fund prospectus. You can also visit us at www.jpmorganfunds.com. Investors should carefully consider the investment objectives and risks as well as charges and expenses of the fund before investing. The prospectus contains this and other information about the fund. Read the prospectus carefully before investing.
Investors may obtain information about the Securities Investor Protection Corporation (SIPC), including the SIPC brochure, by visiting www.sipc.org or by calling SIPC at 202-371-8300.
The Fund files a complete schedule of its fund holdings for the first and third quarters of its fiscal year with the SEC on Form N-Q. The Fund’s Forms N-Q is available on the SEC’s website at http://www.sec.gov and may be reviewed and copied at the SEC’s Public Reference Room in Washington, DC. Information on the operation of the SEC’s Public Reference Room may be obtained by calling 1-800-SEC-0330. Shareholders may request the Form N-Q without charge by calling 1-844-457-6383 or by visiting the J.P. Morgan Funds’ website at www.jpmorganfunds.com.
A description of each Fund’s policies and procedures with respect to the disclosure of each Fund’s holdings is available in the prospectus and Statement of Additional Information.
A copy of proxy policies and procedures is available without charge upon request by calling 1-844-457-6383 and on the Fund’s website at www.jpmorganfunds.com. A description of such policies and procedures is on the SEC’s website at www.sec.gov. The Trustees have delegated the authority to vote proxies for securities owned by the Fund to the Adviser. A copy of the Fund’s voting record for the most recent 12-month period ended June 30 is available on the SEC’s website at www.sec.gov or at the Fund’s website at www.jpmorganfunds.com no later than August 31 of each year. The Fund’s proxy voting record will include, among other things, a brief description of the matter voted on for each fund security, and will state how each vote was cast, for example, for or against the proposal.


J.P. Morgan Asset Management is the marketing name for the asset management business of JPMorgan Chase & Co. Those businesses include, but are not limited to, J.P. Morgan Investment Management Inc., Security Capital Research & Management Incorporated and J.P. Morgan Alternative Asset Management, Inc.
| | | | |
| | © JPMorgan Chase & Co., 2019. All rights reserved. February 2019. | | AN-FIETF-219 |
Annual Report
J.P. Morgan Exchange-Traded Funds
February 28, 2019
JPMorgan BetaBuilders MSCI US REIT ETF
Beginning on January 1, 2021, as permitted by regulations adopted by the Securities and Exchange Commission, paper copies of the Fund’s annual and semi-annual shareholder reports will no longer be sent by mail, unless you specifically request paper copies of the reports. Instead, the reports will be made available on the Fund’s website www.jpmorganfunds.com and you will be notified by mail each time a report is posted and provided with a website to access the report. If you already elected to receive shareholder reports electronically, you will not be affected by this change and you need not take any action.
You may elect to receive shareholder reports and other communications from the Fund’s electronically anytime by contacting your financial intermediary (such as a broker dealer, bank, or retirement plan).
Alternatively, you may elect to receive paper copies of all future reports free of charge by contacting your financial intermediary. Your election to receive paper reports will apply to all funds held within your account(s).

CONTENTS
Investments in a Fund are not bank deposits or obligations of, or guaranteed or endorsed by, any bank and are not insured or guaranteed by the FDIC, the Federal Reserve Board or any other government agency. You could lose money if you sell when the Fund’s share price is lower than when you invested.
Past performance is no guarantee of future performance. The general market views expressed in this report are opinions based on market and other conditions through the end of the reporting period and are subject to change without notice. These views are not intended to predict the future performance of a Fund or the securities markets. References to specific securities and their issuers are for illustrative purposes only and are not intended to be, and should not be interpreted as, recommendations to purchase or sell such securities. Such views are not meant as investment advice and may not be relied on as an indication of trading intent on behalf of any Fund.
Prospective investors should refer to the Fund’s prospectuses for a discussion of the Fund’s investment objectives, strategies and risks. Call J.P. Morgan Exchange-Traded Funds at (844) 457-6383 for a prospectus containing more complete information about a Fund, including management fees and other expenses. Please read it carefully before investing.
Shares are bought and sold throughout the day on an exchange at market price (not at net asset value) through a brokerage account, and are not individually subscribed and redeemed from a Fund. Shares may only be subscribed and redeemed directly from a Fund by Authorized Participants, in very large creation/redemption units. Brokerage commissions will reduce returns.
PRESIDENT’S LETTER
APRIL 5, 2019
Dear Shareholder,
JPMorgan Exchange-Traded Funds experienced tremendous growth over the past twelve months. In 2018, we were named “The industry’s fastest-growing ETF manager,”1 having accumulated assets under management of $21.3 billion as of April 2, 2019, up from $2.9 billion at the end of 2017. This success was recently recognized at the sixth annual ETF.com awards,2 where J.P. Morgan Asset Management won four accolades, including “ETF Issuer of the Year” and “ETF of the Year” for our JPMorgan BetaBuilders® Japan ETF (BBJP). Building on the success of our BetaBuilders® suite and in line with our mission to provide accessible portfolio solutions, we launched two additional BetaBuilders® ETFs in March 2019, BetaBuilders® 1-5 Year U.S. Aggregate Bond ETF (BBSA) and BetaBuilders® U.S. Equity ETF (BBUS), bringing our roster to 32 strategies.
| | |
 | | “We continue to believe real estate investment trusts provide investors with an attractive alternative for income, capital appreciation and portfolio diversification beyond traditional asset classes.” |
During the twelve months ended February 28, 2019, U.S. equity markets continued to outperform both developed and emerging markets. Equity prices were generally supported by record corporate profits, low interest rates and the continued expansion of the U.S. economy. Notably, investors sold off equity and bonds in the fourth quarter of 2018 amid concerns about U.S.-China trade tensions, slowing global economic
growth and a political impasse in Washington, D.C. that led to the partial shutdown of the federal government. While investor expectations of rising interest rates weighed down real estate sector equity during most of 2018, the sector rebounded in early 2019 after the U.S. Federal Reserve stated that it would take a “patient” approach toward future interest rate increases.
Our BetaBuilders® MSCI US REIT ETF returned 9.41% for the reporting period, tracking its underlying index, the MSCI US REIT Index. While REITs faced some headwinds last year due in part to rising interest rates, 2019 is off to a promising start. We continue to believe real estate investment trusts provide investors with an attractive alternative for generating income, capital appreciation and portfolio diversification beyond traditional asset classes.
We are proud to bring a range of investment solutions to help you navigate a changing financial market landscape. We are committed to building solutions that address your needs and help you build stronger portfolios. Thank you for your belief in our Firm and our process.
Sincerely,

Ogden H. Hammond
Interim President, J.P. Morgan Exchange-Traded Funds
J.P Morgan Asset Management
1-844-4JPM-ETF or jpmorgan.com/etfs for more information
| 1 | “Ten Fastest (and Slowest) Growing ETF Providers” Ignites.com, Nov. 28, 2018. |
| 2 | ETF.com Award winners are selected by a majority vote of the ETF.com Awards Selection Committee, a group of independent ETF experts. Voting was completed by Jan. 14, 2019, and results were announced March 28, 2019. |
| | | | | | | | |
| | | |
| FEBRUARY 28, 2019 | | J.P. MORGAN EXCHANGE-TRADED FUNDS | | | | | 1 | |
JPMorgan BetaBuilders MSCI US REIT ETF
FUND COMMENTARY
PERIOD JUNE 15, 2018 (FUND INCEPTION DATE) THROUGH FEBRUARY 28, 2019 (Unaudited)
| | | | |
| REPORTING PERIOD RETURN: | |
| JPMorgan BetaBuilders MSCI US REIT ETF | | | | |
| Net Asset Value* | | | 9.40% | |
| Market Price** | | | 9.41% | |
| MSCI US REIT Index | | | 9.59% | |
| |
| Net Assets as of 2/28/2019 | | $ | 136,028,924 | |
INVESTMENT OBJECTIVE***
The JPMorgan BetaBuilders MSCI US REIT ETF (the “Fund”) seeks investment results that closely correspond, before fees and expenses, to the performance of the MSCI US REIT Index (the “Underlying Index”).
INVESTMENT APPROACH
The Underlying Index is a free-float adjusted market-cap weighted index made up of the stocks of publicly traded equity real estate investment trusts (REITs). Using a “passive” investment approach, the Fund attempts to replicate the Underlying Index as closely as possible and invests at least 80% of its assets in securities included in the Underlying Index.
HOW DID THE MARKET PERFORM?
Overall, real estate sector equity outperformed the broader market for U.S. equity during the reporting period. While rising interest rates and weak demand in the U.S. housing sector held down prices and raised volatility for REITs through the end of 2018, real
estate equity rebounded in early 2019 after the U.S. Federal Reserve said it may slow its pace of interest rate increases.
HOW DID THE FUND PERFORM?
For the period from Fund inception on June 15, 2018 to February 28, 2019, the Fund performed in line with the Underlying Index, before considering the effects of operating expenses, fees and tax management of the Fund’s portfolio.
The Fund’s and the Underlying Index’s exposures to the health care and residential REIT sectors were leading contributors to absolute performance. The Fund’s and the Underlying Index’s exposures to the hotel and resorts REIT sector were a leading detractor from absolute performance.
HOW WAS THE FUND POSITIONED?
At the end of the reporting period, the Fund’s and the Underlying Index’s largest allocations were in the specialized and retail REIT sectors and their smallest allocations were in the diversified REIT sector and the hotel and resorts REIT sector.
| | | | | | |
| | | |
| 2 | | | | J.P. MORGAN EXCHANGE-TRADED FUNDS | | FEBRUARY 28, 2019 |
| | | | | | | | |
| TOP TEN EQUITY HOLDINGS OF THE PORTFOLIO**** | |
| | 1. | | | Simon Property Group, Inc. | | | 6.3 | % |
| | 2. | | | Prologis, Inc. | | | 4.9 | |
| | 3. | | | Equinix, Inc. | | | 3.8 | |
| | 4. | | | Public Storage | | | 3.7 | |
| | 5. | | | Welltower, Inc. | | | 3.1 | |
| | 6. | | | Equity Residential | | | 3.0 | |
| | 7. | | | AvalonBay Communities, Inc. | | | 3.0 | |
| | 8. | | | Digital Realty Trust, Inc. | | | 2.6 | |
| | 9. | | | Ventas, Inc. | | | 2.5 | |
| | 10. | | | Boston Properties, Inc. | | | 2.3 | |
| | | | |
PORTFOLIO COMPOSITION BY INDUSTRY**** | |
Apartments | | | 22.0 | % |
Industrial | | | 14.9 | |
Office | | | 13.1 | |
Health Care | | | 12.0 | |
Diversified | | | 8.5 | |
Storage | | | 8.4 | |
Regional Malls | | | 7.8 | |
Hotels | | | 6.3 | |
Shopping Centers | | | 6.0 | |
Investment of cash collateral from securities loaned | | | 0.1 | |
Short-Term Investments | | | 0.9 | |
| * | | The return shown is based on net asset value calculated for shareholder transactions and may differ from the return shown in the financial highlights, which reflects adjustments made to the net asset value in accordance with accounting principles generally accepted in the United States of America. The net asset value was $81.21 as of February 28, 2019. |
| ** | | Market price return is calculated assuming an initial investment made at the inception date net asset value, reinvestment of all dividends and distributions at market price during the period, and sale at the market price on the last day of the period. The price used to calculate the market price return is the midpoint of the bid/ask spread at the close of business on the Cboe BZX Exchange, Inc. The midpoint price was $81.22 as of February 28, 2019. |
| *** | | The adviser seeks to achieve the Fund’s objective. There can be no guarantee it will be achieved. |
| **** | | Percentages indicated are based on total investments as of February 28, 2019. The Fund’s composition is subject to change. |
| | | | | | | | |
| | | |
| FEBRUARY 28, 2019 | | J.P. MORGAN EXCHANGE-TRADED FUNDS | | | | | 3 | |
JPMorgan BetaBuilders MSCI US REIT ETF
FUND COMMENTARY
PERIOD JUNE 15, 2018 (FUND INCEPTION DATE) THROUGH FEBRUARY 28, 2019 (Unaudited) (continued)
| | | | | | | | |
TOTAL RETURNSAS OF FEBRUARY 28, 2019 (Unaudited) | |
| | | INCEPTION DATE | | | CUMULATIVE
SINCE
INCEPTION | |
JPMorgan BetaBuilders MSCI US REIT ETF | | | | | | | | |
Net Asset Value | | | June 15, 2018 | | | | 9.40% | |
Market Price | | | | | | | 9.41% | |
LIFE OF FUND PERFORMANCE(6/15/18 TO 2/28/19)
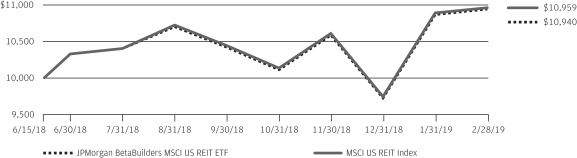
The performance quoted is past performance and is not a guarantee of future results. Exchange-traded funds are subject to certain market risks. Investment returns and principal value of an investment will fluctuate so that an investor’s shares, when sold or redeemed, may be worth more or less than their original cost. Current performance may be higher or lower than the performance data shown. For up-to-date, month-end performance information please call 1-844-457-6383.
Fund commenced operations on June 15, 2018.
The graph illustrates comparative performance for $10,000 invested in shares of the JPMorgan BetaBuilders MSCI US REIT ETF and the MSCI US REIT Index from June 15, 2018 to February 28, 2019. The performance of the Fund reflects the deduction of Fund expenses and assumes reinvestment of all dividends and capital gain distributions, if any. The performance of the MSCI US REIT Index does not reflect the deduction of expenses associated with an exchange-traded fund and has been adjusted to reflect reinvestment of all dividends and capital gain distributions of the securities included in the Index, if applicable. The Underlying Index is a free-float adjusted market-cap weighted index designed to measure the performance of US equity real estate investment trust (REIT) securities. The Underlying Index is made up of the stocks of publicly traded US equity REITs, as determined by MSCI Inc., the index provider. To be included
initially in the Underlying Index, an equity REIT must meet certain criteria established by the index provider, including meeting a minimum market capitalization threshold as well as a liquidity threshold based on a number of factors, including trading volume and frequency of trading. Equity REITs in the Underlying Index tend to be small- and mid-cap stocks, and may include Health Care REITs, Hotel & Resort REITs, Industrial REITs, Office REITs, Residential REITs, Retail REITs, Diversified REITs and certain Specialized REITs. Specialized REITs that may be included in the Underlying Index own and/or operate (i) storage and self-storage facilities, (ii) data centers, (iii) correctional facilities, (iv) theaters, (v) casinos and gaming facilities or (vi) restaurants.
Fund performance reflects the waiver of the Fund’s fees and reimbursement of expenses for certain periods since the inception date. Without these waivers and reimbursements, performance would have been lower. Also, performance shown in this section does not reflect the deduction of taxes that a shareholder may pay on Fund distributions or redemption or sale of Fund shares.
The returns shown are based on net asset values calculated for shareholder transactions and may differ from the returns shown in the financial highlights, which reflect adjustments made to the net asset values in accordance with accounting principles generally accepted in the United States of America.
| | | | | | |
| | | |
| 4 | | | | J.P. MORGAN EXCHANGE-TRADED FUNDS | | FEBRUARY 28, 2019 |
JPMorgan BetaBuilders MSCI US REIT ETF
SCHEDULE OF PORTFOLIO INVESTMENTS
AS OF FEBRUARY 28, 2019
| | | | | | | | |
| INVESTMENTS | | SHARES | | | VALUE($) | |
Common Stocks — 99.7% | |
|
Apartments — 22.1% | |
Agree Realty Corp., REIT | | | 5,274 | | | | 346,660 | |
American Campus Communities, Inc., REIT | | | 20,960 | | | | 944,458 | |
American Homes 4 Rent, Class A, REIT | | | 40,733 | | | | 889,609 | |
Apartment Investment & Management Co., Class A, REIT | | | 23,087 | | | | 1,129,647 | |
AvalonBay Communities, Inc., REIT | | | 21,142 | | | | 4,114,868 | |
Camden Property Trust, REIT | | | 14,246 | | | | 1,397,390 | |
Equity LifeStyle Properties, Inc., REIT | | | 13,041 | | | | 1,416,774 | |
Equity Residential, REIT | | | 56,355 | | | | 4,152,800 | |
Essential Properties Realty Trust, Inc., REIT | | | 5,688 | | | | 96,525 | |
Essex Property Trust, Inc., REIT | | | 10,105 | | | | 2,827,783 | |
Front Yard Residential Corp., REIT | | | 7,793 | | | | 86,736 | |
Getty Realty Corp., REIT | | | 5,270 | | | | 173,647 | |
Independence Realty Trust, Inc., REIT | | | 13,601 | | | | 140,906 | |
Investors Real Estate Trust, REIT | | | 1,828 | | | | 110,375 | |
Invitation Homes, Inc., REIT | | | 47,776 | | | | 1,098,848 | |
Mid-America Apartment Communities, Inc., REIT | | | 17,412 | | | | 1,803,535 | |
National Retail Properties, Inc., REIT | | | 24,342 | | | | 1,268,218 | |
NexPoint Residential Trust, Inc., REIT | | | 2,826 | | | | 101,566 | |
Preferred Apartment Communities, Inc., Class A, REIT | | | 6,279 | | | | 95,692 | |
Realty Income Corp., REIT | | | 45,140 | | | | 3,121,882 | |
Spirit Realty Capital, Inc., REIT | | | 13,108 | | | | 506,493 | |
STORE Capital Corp., REIT | | | 29,300 | | | | 951,371 | |
Sun Communities, Inc., REIT | | | 13,209 | | | | 1,500,146 | |
UDR, Inc., REIT | | | 41,052 | | | | 1,823,530 | |
| | | | | | | | |
| | | | | | | 30,099,459 | |
| | | | | | | | |
|
Diversified — 8.6% | |
Alexander & Baldwin, Inc., REIT* | | | 10,466 | | | | 239,985 | |
American Assets Trust, Inc., REIT | | | 5,056 | | | | 219,633 | |
American Finance Trust, Inc., REIT | | | 12,231 | | | | 132,217 | |
Armada Hoffler Properties, Inc., REIT | | | 7,591 | | | | 116,142 | |
Colony Capital, Inc., REIT | | | 71,247 | | | | 396,133 | |
CoreCivic, Inc., REIT | | | 18,153 | | | | 384,481 | |
CorePoint Lodging, Inc., REIT | | | 6,387 | | | | 89,226 | |
Cousins Properties, Inc., REIT | | | 64,301 | | | | 612,146 | |
Duke Realty Corp., REIT | | | 54,807 | | | | 1,620,643 | |
EPR Properties, REIT | | | 11,371 | | | | 835,541 | |
Four Corners Property Trust, Inc., REIT | | | 10,364 | | | | 283,870 | |
Gaming and Leisure Properties, Inc., REIT | | | 31,109 | | | | 1,131,745 | |
GEO Group, Inc. (The), REIT | | | 18,630 | | | | 423,274 | |
Gladstone Commercial Corp., REIT | | | 4,434 | | | | 91,518 | |
Global Net Lease, Inc., REIT | | | 11,636 | | | | 207,586 | |
Hannon Armstrong Sustainable Infrastructure Capital, Inc., REIT | | | 8,266 | | | | 203,509 | |
iStar, Inc., REIT | | | 10,399 | | | | 90,991 | |
Lexington Realty Trust, REIT | | | 32,526 | | | | 302,167 | |
NorthStar Realty Europe Corp., REIT | | | 6,858 | | | | 123,033 | |
One Liberty Properties, Inc., REIT | | | 2,224 | | | | 64,096 | |
PS Business Parks, Inc., REIT | | | 3,137 | | | | 461,672 | |
Spirit MTA, REIT | | | 6,577 | | | | 48,341 | |
UMH Properties, Inc., REIT | | | 5,185 | | | | 70,931 | |
| | | | | | | | |
| INVESTMENTS | | SHARES | | | VALUE($) | |
| | | | | | | | |
|
Diversified — continued | |
VICI Properties, Inc., REIT | | | 61,906 | | | | 1,319,217 | |
Washington, REIT | | | 12,213 | | | | 323,522 | |
Whitestone, REIT | | | 5,475 | | | | 71,230 | |
WP Carey, Inc., REIT | | | 24,636 | | | | 1,819,861 | |
| | | | | | | | |
| | | | | | | 11,682,710 | |
| | | | | | | | |
|
Health Care — 12.1% | |
CareTrust REIT, Inc., REIT | | | 12,831 | | | | 286,645 | |
Community Healthcare Trust, Inc., REIT | | | 2,835 | | | | 101,181 | |
HCP, Inc., REIT | | | 71,877 | | | | 2,211,655 | |
Healthcare Realty Trust, Inc., REIT | | | 19,156 | | | | 606,287 | |
Healthcare Trust of America, Inc., Class A, REIT | | | 31,653 | | | | 901,794 | |
LTC Properties, Inc., REIT | | | 6,066 | | | | 269,452 | |
Medical Properties Trust, Inc., REIT | | | 55,820 | | | | 1,017,599 | |
National Health Investors, Inc., REIT | | | 6,459 | | | | 503,996 | |
New Senior Investment Group, Inc., REIT | | | 12,565 | | | | 64,835 | |
Omega Healthcare Investors, Inc., REIT | | | 30,698 | | | | 1,102,058 | |
Physicians Realty Trust, REIT | | | 27,887 | | | | 503,918 | |
Sabra Health Care REIT, Inc., REIT | | | 27,270 | | | | 494,132 | |
Senior Housing Properties Trust, REIT | | | 36,362 | | | | 470,888 | |
Universal Health Realty Income Trust, REIT | | | 1,997 | | | | 148,717 | |
Ventas, Inc., REIT | | | 54,524 | | | | 3,421,381 | |
Welltower, Inc., REIT | | | 57,457 | | | | 4,269,630 | |
| | | | | | | | |
| | | | | | | 16,374,168 | |
| | | | | | | | |
|
Hotels — 6.3% | |
Apple Hospitality REIT, Inc., REIT | | | 33,243 | | | | 547,845 | |
Ashford Hospitality Trust, Inc., REIT | | | 14,682 | | | | 78,695 | |
Braemar Hotels & Resorts, Inc., REIT | | | 4,476 | | | | 58,277 | |
Chatham Lodging Trust, REIT | | | 7,115 | | | | 142,158 | |
Chesapeake Lodging Trust, REIT | | | 9,238 | | | | 278,249 | |
DiamondRock Hospitality Co., REIT | | | 31,803 | | | | 339,974 | |
Hersha Hospitality Trust, REIT | | | 5,729 | | | | 107,992 | |
Hospitality Properties Trust, REIT | | | 25,153 | | | | 680,892 | |
Host Hotels & Resorts, Inc., REIT | | | 113,503 | | | | 2,225,794 | |
MGM Growth Properties LLC, Class A, REIT | | | 13,447 | | | | 413,630 | |
Park Hotels & Resorts, Inc., REIT | | | 30,777 | | | | 961,473 | |
Pebblebrook Hotel Trust, REIT | | | 19,952 | | | | 638,663 | |
RLJ Lodging Trust, REIT | | | 26,798 | | | | 497,639 | |
Ryman Hospitality Properties, Inc., REIT | | | 7,067 | | | | 572,356 | |
Summit Hotel Properties, Inc., REIT | | | 16,024 | | | | 182,513 | |
Sunstone Hotel Investors, Inc., REIT | | | 34,912 | | | | 525,426 | |
Xenia Hotels & Resorts, Inc., REIT | | | 17,217 | | | | 336,248 | |
| | | | | | | | |
| | | | | | | 8,587,824 | |
| | | | | | | | |
|
Industrial — 15.0% | |
CoreSite Realty Corp., REIT | | | 5,613 | | | | 573,929 | |
CyrusOne, Inc., REIT | | | 16,188 | | | | 806,810 | |
Digital Realty Trust, Inc., REIT | | | 31,552 | | | | 3,569,162 | |
EastGroup Properties, Inc., REIT | | | 5,513 | | | | 582,504 | |
Equinix, Inc., REIT | | | 12,296 | | | | 5,207,356 | |
First Industrial Realty Trust, Inc., REIT | | | 19,320 | | | | 647,606 | |
SEE NOTES TO FINANCIAL STATEMENTS.
| | | | | | | | |
| | | |
| FEBRUARY 28, 2019 | | J.P. MORGAN EXCHANGE-TRADED FUNDS | | | | | 5 | |
JPMorgan BetaBuilders MSCI US REIT ETF
SCHEDULE OF PORTFOLIO INVESTMENTS
AS OF FEBRUARY 28, 2019 (continued)
| | | | | | | | |
| INVESTMENTS | | SHARES | | | VALUE($) | |
Common Stocks — continued | |
|
Industrial — continued | |
Industrial Logistics Properties Trust, REIT | | | 9,953 | | | | 207,620 | |
Liberty Property Trust, REIT | | | 22,610 | | | | 1,070,131 | |
Monmouth Real Estate Investment Corp., REIT | | | 13,308 | | | | 176,464 | |
Prologis, Inc., REIT | | | 96,291 | | | | 6,746,147 | |
STAG Industrial, Inc., REIT | | | 16,656 | | | | 461,038 | |
Terreno Realty Corp., REIT | | | 9,045 | | | | 369,941 | |
| | | | | | | | |
| | | | | | | 20,418,708 | |
| | | | | | | | |
|
Office — 13.2% | |
Alexandria Real Estate Equities, Inc., REIT | | | 16,447 | | | | 2,234,983 | |
Boston Properties, Inc., REIT | | | 23,623 | | | | 3,134,536 | |
Brandywine Realty Trust, REIT | | | 27,318 | | | | 429,439 | |
Columbia Property Trust, Inc., REIT | | | 18,046 | | | | 390,335 | |
Corporate Office Properties Trust, REIT | | | 16,650 | | | | 432,734 | |
Douglas Emmett, Inc., REIT | | | 24,694 | | | | 953,188 | |
Easterly Government Properties, Inc., REIT | | | 9,303 | | | | 167,268 | |
Empire State Realty Trust, Inc., Class A, REIT | | | 22,493 | | | | 342,344 | |
Equity Commonwealth, REIT | | | 18,582 | | | | 606,702 | |
Franklin Street Properties Corp., REIT | | | 16,402 | | | | 118,751 | |
Highwoods Properties, Inc., REIT | | | 15,829 | | | | 733,041 | |
Hudson Pacific Properties, Inc., REIT | | | 23,969 | | | | 796,250 | |
JBG SMITH Properties, REIT | | | 17,570 | | | | 707,895 | |
Kilroy Realty Corp., REIT | | | 15,410 | | | | 1,135,871 | |
Mack-Cali Realty Corp., REIT | | | 13,815 | | | | 290,253 | |
Office Properties Income Trust, REIT | | | 7,353 | | | | 224,340 | |
Paramount Group, Inc., REIT | | | 32,661 | | | | 469,012 | |
Piedmont Office Realty Trust, Inc., Class A, REIT | | | 19,635 | | | | 401,928 | |
SL Green Realty Corp., REIT | | | 13,043 | | | | 1,183,261 | |
Tier REIT, Inc., REIT | | | 8,242 | | | | 199,869 | |
VEREIT, Inc., REIT | | | 147,986 | | | | 1,179,448 | |
Vornado Realty Trust, REIT | | | 26,195 | | | | 1,763,185 | |
| | | | | | | | |
| | | | | | | 17,894,633 | |
| | | | | | | | |
|
Regional Malls — 7.9% | |
Brookfield Property REIT, Inc., Class A, REIT | | | 19,475 | | | | 382,099 | |
CBL & Associates Properties, Inc., REIT (a) | | | 26,411 | | | | 56,519 | |
Macerich Co. (The), REIT | | | 16,181 | | | | 705,492 | |
Pennsylvania, REIT (a) | | | 10,778 | | | | 66,285 | |
Simon Property Group, Inc., REIT | | | 47,309 | | | | 8,570,498 | |
Tanger Factory Outlet Centers, Inc., REIT | | | 14,364 | | | | 310,119 | |
Taubman Centers, Inc., REIT | | | 9,340 | | | | 498,569 | |
Washington Prime Group, Inc., REIT | | | 28,461 | | | | 164,505 | |
| | | | | | | | |
| | | | | | | 10,754,086 | |
| | | | | | | | |
|
Shopping Centers — 6.1% | |
Acadia Realty Trust, REIT | | | 12,474 | | | | 355,384 | |
Alexander’s, Inc., REIT | | | 352 | | | | 134,362 | |
Brixmor Property Group, Inc., REIT | | | 45,857 | | | | 800,663 | |
Cedar Realty Trust, Inc., REIT | | | 13,951 | | | | 48,549 | |
Federal Realty Investment Trust, REIT | | | 11,298 | | | | 1,509,300 | |
Kimco Realty Corp., REIT | | | 64,455 | | | | 1,133,763 | |
| | | | | | | | |
| INVESTMENTS | | SHARES | | | VALUE($) | |
| | | | | | | | |
|
Shopping Centers — continued | |
Kite Realty Group Trust, REIT | | | 12,805 | | | | 201,551 | |
Regency Centers Corp., REIT | | | 23,326 | | | | 1,522,022 | |
Retail Opportunity Investments Corp., REIT | | | 17,435 | | | | 299,359 | |
Retail Properties of America, Inc., Class A, REIT | | | 32,956 | | | | 410,632 | |
Retail Value, Inc., REIT | | | 2,351 | | | | 73,187 | |
RPT Realty, REIT | | | 12,260 | | | | 155,457 | |
Saul Centers, Inc., REIT | | | 2,074 | | | | 117,534 | |
Seritage Growth Properties, Class A, REIT (a) | | | 5,183 | | | | 228,829 | |
SITE Centers Corp., REIT | | | 24,010 | | | | 320,534 | |
Urban Edge Properties, REIT | | | 17,484 | | | | 339,539 | |
Urstadt Biddle Properties, Inc., Class A, REIT | | | 4,560 | | | | 95,395 | |
Weingarten Realty Investors, REIT | | | 18,647 | | | | 537,220 | |
| | | | | | | | |
| | | | | | | 8,283,280 | |
| | | | | | | | |
|
Storage — 8.4% | |
Americold Realty Trust, REIT | | | 14,701 | | | | 422,654 | |
CubeSmart, REIT | | | 28,497 | | | | 873,148 | |
Extra Space Storage, Inc., REIT | | | 19,351 | | | | 1,856,535 | |
Iron Mountain, Inc., REIT | | | 41,590 | | | | 1,473,118 | |
Life Storage, Inc., REIT | | | 7,128 | | | | 695,693 | |
National Storage Affiliates Trust, REIT | | | 8,653 | | | | 245,053 | |
Public Storage, REIT | | | 24,003 | | | | 5,076,394 | |
QTS Realty Trust, Inc., Class A, REIT | | | 7,802 | | | | 325,577 | |
Rexford Industrial Realty, Inc., REIT | | | 14,193 | | | | 486,536 | |
| | | | | | | | |
| | | | | | | 11,454,708 | |
| | | | | | | | |
Total Common Stocks
(Cost $129,089,885) | | | | 135,549,576 | |
| | | | | |
Short-Term Investments — 0.9% | |
|
Investment Companies — 0.9% | |
JPMorgan U.S. Government Money Market Fund Class Institutional Shares, 2.33% (b) (c)
(Cost $1,275,554) | | | 1,275,554 | | | | 1,275,554 | |
| | | | | | | | |
|
Investment of Cash Collateral from
Securities Loaned — 0.1% | |
JPMorgan U.S. Government Money Market Fund Class IM Shares, 2.37% (b) (c)
(Cost $132,381) | | | 132,381 | | | | 132,381 | |
| | | | | | | | |
Total Investments — 100.7%
(Cost $130,497,820) | | | | 136,957,511 | |
Liabilities in Excess of
Other Assets — (0.7%) | | | | (928,587 | ) |
| | | | | |
NET ASSETS — 100.0% | | | | 136,028,924 | |
| | | | | |
Percentages indicated are based on net assets.
SEE NOTES TO FINANCIAL STATEMENTS.
| | | | | | |
| | | |
| 6 | | | | J.P. MORGAN EXCHANGE-TRADED FUNDS | | FEBRUARY 28, 2019 |
| | |
| Abbreviations | | |
| REIT | | RealEstate Investment Trust |
| (a) | | Thesecurity or a portion of this security is on loan at February 28, 2019. The total value of securities on loan at February 28, 2019 is $123,404. |
| (b) | | Investmentin affiliate. Fund is registered under the Investment Company Act of 1940, as amended, and advised by J.P. Morgan Investment Management Inc. |
| (c) | | Therate shown is the current yield as of February 28, 2019. |
| * | | Non-incomeproducing security. |
| | | | | | | | | | | | | | | | | | | | |
| Futures contracts outstanding as of February 28, 2019: | |
| DESCRIPTION | | NUMBER OF
CONTRACTS | | | EXPIRATION
DATE | | | TRADING CURRENCY | | | NOTIONAL AMOUNT
($) | | | VALUE AND
UNREALIZED
APPRECIATION
(DEPRECIATION)($) | |
Long Contracts | |
DJ US Real Estate Index | | | 13 | | | | 03/2019 | | | | USD | | | | 430,690 | | | | 48,024 | |
| | | | | | | | | | | | | | | | | | | | |
| | | | | | | | | | | | | | | | | | | 48,024 | |
| | | | | | | | | | | | | | | | | | | | |
| | |
| Abbreviations | | |
| USD | | UnitedStates Dollar |
SEE NOTES TO FINANCIAL STATEMENTS.
| | | | | | | | |
| | | |
| FEBRUARY 28, 2019 | | J.P. MORGAN EXCHANGE-TRADED FUNDS | | | | | 7 | |
STATEMENT OF ASSETS AND LIABILITIES
AS OF FEBRUARY 28, 2019
| | | | |
| | | JPMorgan
BetaBuilders MSCI
U.S. REIT ETF | |
ASSETS: | |
Investments innon-affiliates, at value | | $ | 135,549,576 | |
Investments in affiliates, at value | | | 1,275,554 | |
Investments of cash collateral received from securities loaned, at value (Note 2.D.) | | | 132,381 | |
Restricted cash | | | 2,800 | |
Cash | | | 4,029 | |
Deposits at broker for futures contracts | | | 75,000 | |
Deferred offering costs (Note 2.F.) | | | 4,660 | |
Receivables: | | | | |
Investment securities sold | | | 153,185 | |
Dividends fromnon-affiliates | | | 156,574 | |
Dividends from affiliates | | | 1,797 | |
Securities lending income (Note 2.D.) | | | 255 | |
Due from Adviser | | | 26,539 | |
| | | | |
Total Assets | | | 137,382,350 | |
| | | | |
|
LIABILITIES: | |
Payables: | | | | |
Investment securities purchased | | | 1,149,613 | |
Collateral received on securities loaned (Note 2.D.) | | | 132,381 | |
Variation margin on futures contracts | | | 299 | |
Accrued liabilities: | | | | |
Administration fees | | | 7,823 | |
Custodian, Accounting and Transfer Agent fees | | | 13,570 | |
Trustees’ and Chief Compliance Officer’s fees | | | 502 | |
Professional Fees | | | 27,849 | |
Other | | | 21,389 | |
| | | | |
Total Liabilities | | | 1,353,426 | |
| | | | |
Net Assets | | $ | 136,028,924 | |
| | | | |
|
NET ASSETS: | |
Paid-in-Capital | | $ | 128,616,125 | |
Total distributable earnings (loss) (a) | | | 7,412,799 | |
| | | | |
Total Net Assets | | $ | 136,028,924 | |
| | | | |
| |
Outstanding number of shares
(unlimited number of shares authorized — par value $0.0001) | | | 1,675,000 | |
| | | | |
Net asset value, per share | | $ | 81.21 | |
| | | | |
| |
Cost of investments innon-affiliates | | $ | 129,089,885 | |
Cost of investments in affiliates | | | 1,275,554 | |
Investment securities on loan, at value | | | 123,404 | |
Cost of investment of cash collateral | | | 132,381 | |
| (a) | Total distributable earnings has been aggregated to conform to the current presentation requirements for the adoption of the Securities and Exchange Commission’s Disclosure Update and Simplification Rule. See Note 8. |
SEE NOTES TO FINANCIAL STATEMENTS.
| | | | | | |
| | | |
| 8 | | | | J.P. MORGAN EXCHANGE-TRADED FUNDS | | FEBRUARY 28, 2019 |
STATEMENT OF OPERATIONS
FOR THE PERIOD ENDED FEBRUARY 28, 2019
| | | | |
| | | JPMorgan
BetaBuilders MSCI
U.S. REIT ETF(a) | |
INVESTMENT INCOME: | |
Dividend income fromnon-affiliates | | $ | 2,056,433 | |
Dividend income from affiliates | | | 6,580 | |
Interest income fromnon-affiliates | | | 289 | |
Interest income from affiliates | | | 24 | |
Non-cash dividend income fromnon-affiliates | | | 154,190 | |
Income from securities lending (net) (Note 2.D.) | | | 3,632 | |
| | | | |
Total investment income | | | 2,221,148 | |
| | | | |
|
EXPENSES: | |
Investment advisory fees (Note 3.A.) | | | 75,916 | |
Administration fees (Note 3.B.) | | | 51,700 | |
Professional fees | | | 57,201 | |
Trustees’ and Chief Compliance Officer’s fees | | | 2,478 | |
Printing and mailing costs | | | 6,038 | |
Registration and filing fees | | | 22,630 | |
Custodian, Accounting and Transfer Agent fees (Note 3.C.) | | | 31,506 | |
Insurance expense | | | 751 | |
Offering costs (Note 2.F.) | | | 11,388 | |
Other | | | 1,264 | |
| | | | |
Total expenses | | | 260,872 | |
| | | | |
Less fee waived (Note 3.D.) | | | (127,616 | ) |
Less expense reimbursements from affiliates (Note 3.D.) | | | (57,096 | ) |
Less expense reimbursements fromnon-affiliates (Note 3.C.) | | | (6,800 | ) |
| | | | |
Net expenses | | | 69,360 | |
| | | | |
Net investment income (loss) | | | 2,151,788 | |
| | | | |
| |
REALIZED/UNREALIZED GAINS (LOSSES): | | | | |
Net realized gain (loss) on transactions from: | |
Investments innon-affiliates | | | 423,554 | |
In-kind redemptions innon-affiliates | | | 868,869 | |
Futures | | | (88,517 | ) |
| | | | |
Net realized gain (loss) | | | 1,203,906 | |
| | | | |
Change in net unrealized appreciation/depreciation on: | |
Investments innon-affiliates | | | 6,459,691 | |
Futures | | | 48,024 | |
| | | | |
Change in net unrealized appreciation/depreciation | | | 6,507,715 | |
| | | | |
Net realized/unrealized gains (losses) | | | 7,711,621 | |
| | | | |
Change in net assets resulting from operations | | $ | 9,863,409 | |
| | | | |
| (a) | Commencement of operations was June 15, 2018. |
SEE NOTES TO FINANCIAL STATEMENTS.
| | | | | | | | |
| | | |
| FEBRUARY 28, 2019 | | J.P. MORGAN EXCHANGE-TRADED FUNDS | | | | | 9 | |
STATEMENT OF CHANGES IN NET ASSETS
FOR THE PERIOD INDICATED
| | | | |
| | | JPMorgan
BetaBuilders
MSCI U.S. REIT ETF | |
| | | Period Ended
February 28, 2019 (a) | |
CHANGE IN NET ASSETS RESULTING FROM OPERATIONS: | |
Net investment income (loss) | | $ | 2,151,788 | |
Net realized gain (loss) | | | 1,203,906 | |
Change in net unrealized appreciation/depreciation | | | 6,507,715 | |
| | | | |
Change in net assets resulting from operations | | | 9,863,409 | |
| | | | |
|
DISTRIBUTIONS TO SHAREHOLDERS: | |
Total distributions to shareholders | | | (1,574,130 | ) |
| | | | |
|
CAPITAL TRANSACTIONS: | |
Change in net assets resulting from capital transactions | | | 127,739,645 | |
| | | | |
|
NET ASSETS: | |
Change in net assets | | | 136,028,924 | |
Beginning of period | | | — | |
| | | | |
End of period | | $ | 136,028,924 | |
| | | | |
| |
CAPITAL TRANSACTIONS: | | | | |
Proceeds from shares issued | | $ | 141,407,612 | |
Cost of shares redeemed | | | (13,667,967 | ) |
| | | | |
Total change in net assets resulting from capital transactions | | $ | 127,739,645 | |
| | | | |
|
SHARE TRANSACTIONS: | |
Issued | | | 1,850,000 | |
Redeemed | | | (175,000 | ) |
| | | | |
Net increase in shares from share transactions | | | 1,675,000 | |
| | | | |
| (a) | Commencement of operations was June 15, 2018. |
SEE NOTES TO FINANCIAL STATEMENTS.
| | | | | | |
| | | |
| 10 | | | | J.P. MORGAN EXCHANGE-TRADED FUNDS | | FEBRUARY 28, 2019 |
THIS PAGE IS INTENTIONALLY LEFT BLANK
| | | | | | | | |
| | | |
| FEBRUARY 28, 2019 | | J.P. MORGAN EXCHANGE-TRADED FUNDS | | | | | 11 | |
FINANCIAL HIGHLIGHTS
FOR THE PERIOD INDICATED
| | | | | | | | | | | | | | | | | | | | | | | | | | | | |
| | | Per share operating performance | |
| | | | | | Investment operations | | | Distributions | |
| | | Net asset
value,
beginning
of period | | | Net
investment
income
(loss) (b) | | | Net realized
and unrealized
gains
(losses) on
investments | | | Total from
investment
operations | | | Net
investment
income | | | Net
realized
gain | | | Total
distributions | |
| | | | | | | |
BetaBuilders MSCI U.S. REIT ETF | | | | | | | | | | | | | | | | | | | | | | | | | | | | |
June 15, 2018 (g) through February 28, 2019 | | $ | 75.67 | | | $ | 1.85 | | | $ | 5.10 | | | $ | 6.95 | | | $ | (1.35 | ) | | $ | (0.06 | ) | | $ | (1.41 | ) |
| (a) | Annualized for periods less than one year, unless otherwise indicated. |
| (b) | Calculated based upon average shares outstanding. |
| (c) | Not annualized for periods less than one year. |
| (d) | Includes adjustments in accordance with accounting principles generally accepted in the United States of America and as such, the net asset values for financial reporting purposes and the returns based upon those net asset values may differ from the net asset values and returns for shareholder transactions. |
| (e) | Market price total return is calculated assuming an initial investment made at the beginning of the period market price, reinvestment of all dividends and distributions at market price during the period, and sale at the market price on the last day of the period. The market price presented to calculate the market price total return is themid-point of the bid/ask spread at the close of business on the Cboe BZX Exchange, Inc. |
| (f) | Since the Shares of the Fund did not trade in the secondary market until the day after the Fund’s inception, for the period from the inception to the first day of secondary market trading, the NAV is used as a proxy for the secondary market trading price to calculate the market returns. |
| (g) | Commencement of operations. |
| (h) | Certainnon-recurring expenses incurred by the Fund were not annualized for the period indicated. |
SEE NOTES TO FINANCIAL STATEMENTS.
| | | | | | |
| | | |
| 12 | | | | J.P. MORGAN EXCHANGE-TRADED FUNDS | | FEBRUARY 28, 2019 |
| | | | | | | | | | | | | | | | | | | | | | | | | | | | | | | | | | |
| Ratios/Supplemental data | |
| | | | | | | | | | | | | | | | Ratios to average net assets(a) | | | | |
Net asset
value,
end of
period | | | Market
price,
end of
period | | | Total
return (c)(d) | | | Market
price total
return (c)(e) | | | Net assets, end of period | | | Net
expenses | | | Net
investment
income
(loss) | | | Expenses without
waivers and
reimbursements | | | Portfolio
turnover
rate (c) | |
| | | | | | | | |
| | | | | | | | | | | | | | | | | | | | | | | | | | | | | | | | | | |
| $ | 81.21 | | | $ | 81.22 | | | | 9.40 | % | | | 9.41 | %(f) | | $ | 136,028,924 | | | | 0.11 | %(h) | | | 3.37 | % | | | 0.40 | %(h) | | | 5 | % |
SEE NOTES TO FINANCIAL STATEMENTS.
| | | | | | | | |
| | | |
| FEBRUARY 28, 2019 | | J.P. MORGAN EXCHANGE-TRADED FUNDS | | | | | 13 | |
NOTES TO FINANCIAL STATEMENTS
AS OF February 28, 2019 (Unaudited)
1. Organization
J.P. Morgan Exchange-Traded Fund Trust (the “Trust”) was formed on February 25, 2010, and is governed by a Declaration of Trust as amended and restated February 19, 2014, and is registered under the Investment Company Act of 1940, as amended (the “1940 Act”), as anopen-end management investment company. JPMorgan BetaBuilders MSCI US REIT ETF (the “Fund” or the “MSCI US REIT ETF”) is a separate diversified series of the Trust covered in this report.
The Fund commenced operations on June 15, 2018. The investment objective of the Fund is to seek investment results that closely correspond, before fees and expenses, to the performance of the MSCI US REIT Index.
J.P. Morgan Investment Management Inc. (“JPMIM”), an indirect, wholly-owned subsidiary of JPMorgan Chase & Co. (“JPMorgan”), acts as Adviser (the “Adviser”) and Administrator (the “Administrator”) to the Fund.
Shares of the Fund are listed and traded on the Cboe BZX Exchange, Inc. Market prices for the Fund’s shares may be different from its net asset value (“NAV”). The Fund issues and redeems its shares on a continuous basis, through JPMorgan Distribution Services, Inc. (the “Distributor” or “JPMDS”), an indirect, wholly-owned subsidiary of JPMorgan, at NAV in large blocks of shares, typically 25,000 shares, referred to as “Creation Units”.
Creation Units are issued and redeemed principallyin-kind for a basket of securities. A cash amount may be substituted in a Fund with sizeable exposure to market or sponsor restricted securities. Shares are generally traded in the secondary market in amounts less than a Creation Unit at market prices that change throughout the day. Only individuals or institutions that have entered into an authorized participant agreement with the Distributor may do business directly with the Fund (each, an “Authorized Participant”).
2. Significant Accounting Policies
The following is a summary of significant accounting policies followed by the Fund in the preparation of its financial statements. The Fund is an investment company and, accordingly, follows the investment company accounting and reporting guidance of the Financial Accounting Standards Board Accounting Standards Codification Topic 946 —Investment Companies, which is part of U.S. generally accepted accounting principles (“GAAP”). The preparation of financial statements in conformity with GAAP requires management to make estimates and assumptions that affect the reported amounts of assets and liabilities and disclosure of contingent assets and liabilities at the date of the financial statements and the reported amounts of increases and decreases in net assets from operations during the reporting period. Actual results could differ from those estimates.
A. Valuation of Investments — The valuation of investments is in accordance with GAAP and the Fund’s valuation policies set forth by and under the supervision and responsibility of the Board of Trustees (the “Board”), which established the following approach to valuation, as described more fully below: (i) investments for which market quotations are readily available shall be valued at their market value and (ii) all other investments for which market quotations are not readily available shall be valued at their fair value as determined in good faith by the Board.
The Administrator has established the J.P. Morgan Asset Management Americas Valuation Committee (“AVC”) to assist the Board with the oversight and monitoring of the valuation of the Fund’s investments. The Administrator implements the valuation policies of the Fund’s investments, as directed by the Board. The AVC oversees and carries out the policies for the valuation of investments held in the Fund. This includes monitoring the appropriateness of fair values based on results of ongoing valuation oversight including, but not limited to consideration of macro or security specific events, market events and pricing vendor and broker due diligence. The Administrator is responsible for discussing and assessing the potential impacts to the fair values on an ongoing basis, and at least on a quarterly basis with the AVC and the Board.
A market-based approach is primarily used to value the Fund’s investments. Investments for which market quotations are not readily available are fair valued by approved affiliated and unaffiliated pricing vendors or third party broker-dealers (collectively referred to as “Pricing Services”) or may be internally fair valued using methods set forth by the valuation policies approved by the Board. This may include related or comparable assets or liabilities, recent transactions, market multiples, book values and other relevant information for the investment to determine the fair value of the investment. An income-based valuation approach may be used in which the anticipated future cash flows of the investment are discounted to calculate the fair value. Discounts may also be applied due to the nature or duration of any restrictions on the disposition of the investments. Valuations may be based upon current market prices of securities that are comparable in coupon, rating, maturity and industry. It is possible that the estimated values may differ significantly from the values that would have been used, had a ready market for the investments existed, and such differences could be material.
Equities and other exchange-traded instruments are valued at the last sale price or official market closing price on the primary exchange on which the instrument is traded before the NAV of the Fund is calculated on a valuation date.
Investments inopen-end investment companies excluding Exchange-Traded Funds (“ETFs”), (the “Underlying Funds”) are valued at each Underlying Fund’s NAV per share as of the report date.
Futures contracts are generally valued on the basis of available market quotations.
Valuations reflected in this report are as of the report date. As a result, changes in valuation due to market events and/or issuer related events after the report date and prior to issuance of the report are not reflected herein.
| | | | | | |
| | | |
| 14 | | | | J.P. MORGAN EXCHANGE-TRADED FUNDS | | FEBRUARY 28, 2019 |
The various inputs that are used in determining the valuation of the Fund’s investments are summarized into the three broad levels listed below.
| • | | Level 1 — Unadjusted inputs using quoted prices in active markets for identical investments. |
| • | | Level 2 — Other significant observable inputs including, but not limited to, quoted prices for similar investments, inputs other than quoted prices that are observable for investments (such as interest rates, prepayment speeds, credit risk, etc.) or other market corroborated inputs. |
| • | | Level 3 — Significant inputs based on the best information available in the circumstances, to the extent observable inputs are not available (including the Fund’s assumptions in determining the fair value of investments). |
A financial instrument’s level within the fair value hierarchy is based on the lowest level of any input, both individually and in the aggregate, that is significant to the fair value measurement. The inputs or methodology used for valuing instruments are not necessarily an indication of the risk associated with investing in those instruments.
The following table represents each valuation input as presented on the Schedule of Portfolio Investments (“SOI”):
| | | | | | | | | | | | | | | | |
| | | Level 1
Quoted prices | | | Level 2
Other significant
observable inputs | | | Level 3
Significant
unobservable inputs | | | Total | |
Total Investments in Securities(a) | | $ | 136,957,511 | | | $ | — | | | $ | — | | | $ | 136,957,511 | |
| | | | | | | | | | | | | | | | |
Appreciation in Other Financial Instruments | | | | | | | | | | | | | | | | |
Futures Contracts (a) | | $ | 48,024 | | | $ | — | | | $ | — | | | $ | 48,024 | |
| | | | | | | | | | | | | | | | |
| (a) | All portfolio holdings designated as level 1 are disclosed individually on the SOI. Please refer to the SOI for industry specifics of portfolio holdings. |
There were no transfers into and out of level 3 for the period ended February 28, 2019.
B. Restricted Securities — Certain securities held by the Fund may be subject to legal or contractual restrictions on resale. Restricted securities generally are resold in transactions exempt from registration under the Securities Act of 1933 as amended (the “Securities Act”). Disposal of these securities may involve time-consuming negotiations and expense. Prompt sale at the current valuation may be difficult and could adversely affect the NAV of the Fund.
As of February 28, 2019, the Fund had no investments in restricted securities other than securities sold to the Fund under Rule 144A and/or Regulation S under the Securities Act.
C. Futures Contracts — The Fund used index futures contracts to gain or reduce exposure to the stock market, maintain liquidity or minimize transaction costs. The Fund also bought futures contracts to invest incoming cash in the market or sold futures in response to cash outflows, thereby simulating an invested position in the underlying index while maintaining cash balance for liquidity.
Futures contracts provide for the delayed delivery of the underlying instrument at a fixed price or are settled for a cash amount based on the change in the value of the underlying instrument at a specific date in the future. Upon entering into a futures contract, the Fund is required to deposit with the broker, cash or securities in an amount equal to a certain percentage of the contract amount, which is referred to as the initial margin deposit. Subsequent payments, referred to as variation margin, are made or received by the Fund periodically and are based on changes in the market value of open futures contracts. Changes in the market value of open futures contracts are recorded as Change in net unrealized appreciation/depreciation on the Statement of Operations (“SOP”). Realized gains or losses, representing the difference between the value of the contract at the time it was opened and the value at the time it was closed, are reported on the SOP at the closing or expiration of the futures contract. Securities deposited as initial margin are designated on the SOI, while cash deposited, which is considered restricted, is recorded on the Statement of Assets and Liabilities (SAL). A receivable from and/or a payable to brokers for the daily variation margin is also recorded on the SAL.
The use of futures contracts exposes the Fund to equity price risk. The Fund may be subject to the risk that the change in the value of the futures contract may not correlate perfectly with the underlying instrument. Use of long futures contracts subjects the Fund to risk of loss in excess of the amounts shown on the SAL, up to the notional amount of the futures contracts. Use of short futures contracts subjects the Fund to unlimited risk of loss. The Fund may enter into futures contracts only on exchanges or boards of trade. The exchange or board of trade acts as the counterparty to each futures transaction; therefore, the Fund’s credit risk is limited to failure of the exchange or board of trade. Under some circumstances, futures exchanges may establish daily limits on the amount that the price of a futures contract can vary from the previous day’s settlement price, which could effectively prevent liquidation of positions.
The Fund’s futures contracts are not subject to master netting arrangements (the right to close out all transactions traded with a counterparty and net amounts owed or due across transactions).
| | | | | | | | |
| | | |
| FEBRUARY 28, 2019 | | J.P. MORGAN EXCHANGE-TRADED FUNDS | | | | | 15 | |
NOTES TO FINANCIAL STATEMENTS
AS OF February 28, 2019 (Unaudited) (continued)
The following table presents the value of derivatives held as of February 28, 2019, by their primary underlying risk exposure and respective location on the SAL:
| | | | | | |
| Derivative Contracts | | Statement of Assets and Liabilities Location | |
| Gross Assets: | | | | Futures
Contracts (a) | |
| Equity contracts | | Receivables, Net assets — Unrealized Appreciation | | $ | 48,024 | |
| | | | | | |
| (a) | This amount represents the cumulative appreciation (depreciation) of futures contracts as reported on the SOI. The Statement of Assets and Liabilities only reflects the current day variation margin receivable/payable from/to brokers. |
The following tables present the effect of derivatives on the SOP for the period ended February 28, 2019, by primary underlying risk exposure:
| | | | |
| Amount of Realized Gain (Loss) on Derivatives Recognized on the Statement of Operations | |
| Derivative Contracts | | Futures
Contracts | |
Equity contracts | | $ | (88,517 | ) |
| | | | |
|
| Amount of Change in Unrealized Appreciation (Depreciation) on Derivatives Recognized on the Statement of Operations | |
| Derivative Contracts | | Futures
Contracts | |
Equity contracts | | $ | 48,024 | |
| | | | |
Derivatives Volume
The table below discloses the volume of the Fund’s futures contracts activity during the period ended February 28, 2019: Please refer to the tables in the Summary of Derivatives Information for derivative-related gains and losses associated with volume activity.
| | | | |
Futures Contracts — Equity: | | | | |
Average Notional Balance Long | | $ | 498,167 | (a) |
Ending Notional Balance Long | | | 430,690 | |
| (a) | For the period June 15, 2018 through February 28, 2019. |
The Fund’s derivatives contracts held at February 28, 2019 are not accounted for as hedging instruments under GAAP.
D. Securities Lending — Effective June 18, 2018, the Fund became authorized to engage in securities lending in order to generate additional income. The Fund is able to lend to approved borrowers. Citibank N.A. (“Citibank”) serves as lending agent for the Fund, pursuant to a Securities Lending Agency Agreement (the “Securities Lending Agency Agreement”). Securities loaned are collateralized by cash equal to at least 100% of the market value plus accrued interest on the securities lent, which is invested in the IM Shares of JPMorgan U.S. Government Money Market Fund. The Fund retains loan fees and the interest on cash collateral investments but is required to pay the borrower a rebate for the use of cash collateral. In cases where the lent security is of high value to borrowers, there may be a negative rebate (i.e., a net payment from the borrower to the Fund). Upon termination of a loan, the Fund is required to return to the borrower an amount equal to the cash collateral, plus any rebate owed to the borrowers. The remaining maturities of the securities lending transactions are considered overnight and continuous. Loans are subject to termination by the Fund or the borrower at any time.
The net income earned on the securities lending (after payment of rebates and Citibank’s fee) is included on the SOP as Income from securities lending (net). The Fund also receives payments from the borrower during the period of the loan, equivalent to dividends and interest earned on the securities loaned, which are recorded as Dividend or Interest income, respectively, on the SOP.
Under the Securities Lending Agency Agreement, Citibank marks to market the loaned securities on a daily basis. In the event the cash received from the borrower is less than 102% of the value of the loaned securities (105% for loans ofnon-U.S. securities), Citibank requests additional cash from the borrower so as to maintain a collateralization level a of at least 102% of the value of the loaned securities plus accrued interest (105% for loans of non-U.S. securities), subject to certainde minimisamounts.
The value of securities out on loan is recorded as an asset on the SAL. The value of the cash collateral received is recorded as a liability on the SAL and details of Collateral Investments are disclosed in the SOI. As of February 28, 2019, the value of outstanding securities on loan and the value of Collateral Investments were as follows:
| | | | | | | | | | | | |
| | | Value of Securities
on Loan | | | Cash Collateral
Posted by Borrower | | | Total value of
Collateral
Investments | |
MSCI US REIT ETF | | $ | 123,404 | | | $ | 132,381 | | | $ | 132,381 | |
| | | | | | |
| | | |
| 16 | | | | J.P. MORGAN EXCHANGE-TRADED FUNDS | | FEBRUARY 28, 2019 |
The Fund bears the risk of loss associated with the Collateral Investments and is not entitled to additional collateral from the borrower to cover any such losses. To the extent that the value of the Collateral Investments declines below the amount owed to a borrower, the Fund may incur losses that exceed the amount it earned on lending the security. Upon termination of a loan, the Fund may use leverage (borrow money) to repay the borrower for cash collateral posted if the Adviser does not believe that it is prudent to sell the Collateral Investments to fund the payment of this liability.
The following table presents the Fund’s value of the securities on loan with Citibank, net of amounts available for offset under the master netting arrangements and any related collated received or posted by the Fund as of February 28, 2019.
| | | | | | | | | | | | |
| | | Investment Securities
On Loan, at value,
Presented in the
Statement of Assets
and Liabilities | | | Cash Collateral
Posted by Borrower | | | Net Amount Due
to Counterparty
(not less than zero) | |
MSCI US REIT ETF | | $ | 123,404 | | | $ | (123,404 | ) | | $ | — | |
Securities lending also involves counterparty risks, including the risk that the loaned securities may not be returned in a timely manner or at all. Subject to certain conditions, Citibank has agreed to indemnify the Fund from losses resulting from a borrower’s failure to return a loaned security.
JPMIM waived fees associated with the Fund’s investment in JPMorgan U.S. Government Money Market Fund in the amount of $287. JPMIM voluntarily waived investment advisory fees charged to the Fund to reduce the impact of the investment in the JPMorgan U.S. Government Money Market Fund from 0.16% to 0.06%. The above waiver is included in the determination of earnings on cash collateral investment and in the calculation of Citibank’s compensation and is included in the SOP as Income from securities lending (net).
E. Investment Transactions with Affiliates — The Fund invested in Underlying Funds which are advised by the Adviser. An issuer which is under common control with a Fund may be considered an affiliate. For the purposes of the financial statements, the Fund assumes the issuers listed in the tables below to be affiliated issuers. The Underlying Fund’s distributions may be reinvested into the Underlying Funds. Reinvestment amounts are included in the purchase cost amounts in the tables below. Included in the purchases and sales amounts in the tables below are exchanges between certain shares of the Underlying Funds. Such exchanges are not treated as purchases and sales for the purpose of recognizing realized gains (losses) or portfolio turnover.
| | | | | | | | | | | | | | | | | | | | | | | | | | | | | | | | | | | | |
| For the period ended February 28, 2019 | |
| Security Description | | Value at
June 15,
2018(a) | | | Purchases
at Cost | | | Proceeds
from Sales | | | Net
Realized
Gain
(Loss) | | | Change in
Unrealized
Appreciation/
(Depreciation) | | | Value at
February 28,
2019 | | | Shares at
February 28,
2019 | | | Dividend
Income | | | Capital Gain
Distributions | |
JPMorgan U.S. Government Money Market Fund Class IM Shares, 2.37% (b)(c) | | $ | — | | | $ | 3,966,222 | | | $ | 3,833,841 | | | $ | — | | | $ | — | | | $ | 132,381 | | | | 132,381 | | | $ | 6,782 | * | | $ | — | |
JPMorgan U.S. Government Money Market Fund Class Institutional Shares, 2.33% (b)(c) | | | — | | | | 5,152,522 | | | | 3,876,968 | | | | — | | | | — | | | | 1,275,554 | | | | 1,275,554 | | | | 6,580 | | | | — | |
| | | | | | | | | | | | | | | | | | | | | | | | | | | | | | | | | | | | |
Total | | $ | — | | | $ | 9,118,744 | | | $ | 7,710,809 | | | $ | — | | | $ | — | | | $ | 1,407,935 | | | | | | | $ | 13,362 | | | $ | — | |
| | | | | | | | | | | | | | | | | | | | | | | | | | | | | | | | | | | | |
| (a) | Commencement of operations. |
| (b) | Investment in affiliate. Fund is registered under the Investment Company Act of 1940, as amended, and advised by J.P. Morgan Investment Management Inc. |
| (c) | The rate shown is the current yield as of February 28, 2019. |
| * | Amount is included on the Statement of Operation as Income from securities lending (net). |
F. Offering and Organizational Costs — Total offering costs incurred in connection with the offering of shares of the Fund is amortized on a straight line basis over 12 months from the date the Fund commenced operations. For the period ended February 28, 2019, total offering costs incurred were $16,048 and total offering costs amortized were $11,388.
Costs paid in connection with the organization of the Fund, if any, were recorded as an expense at the time the Fund commenced operations and are included as part of Professional fees on the SOP.
| | | | | | | | |
| | | |
| FEBRUARY 28, 2019 | | J.P. MORGAN EXCHANGE-TRADED FUNDS | | | | | 17 | |
NOTES TO FINANCIAL STATEMENTS
AS OF February 28, 2019 (Unaudited) (continued)
G. Security Transactions and Investment Income — Investment transactions are accounted for on the trade date (the date the order to buy or sell is executed). Securities gains and losses are calculated on a specifically identified cost basis. Interest income is determined on the basis of coupon interest accrued using the effective interest method which adjusts for amortization of premiums and accretion of discounts. Dividend income, net of foreign taxes withheld, if any, is recorded on theex-dividend date or when the Fund first learns of the dividend.
To the extent such information is publicly available, the Fund records distributions received in excess of income earned from underlying investments as a reduction of cost of investments and/or realized gain. Such amounts are based on estimates if actual amounts are not available and actual amounts of income, realized gain and return of capital may differ from the estimated amounts. The Fund adjusts the estimated amounts of the components of distributions (and consequently its net investment income) as necessary once the issuers provide information about the actual composition of the distributions.
H. Allocation of Expenses — Expenses directly attributable to a fund are charged directly to that fund, while the expenses attributable to more than one fund of the Trust are allocated among the respective funds.
I. Federal Income Taxes — The Fund is treated as a separate taxable entity for Federal income tax purposes. The Fund’s policy is to comply with the provisions of the Internal Revenue Code (the “Code”), applicable to regulated investment companies and to distribute to shareholders all of its distributable net investment income and net realized capital gains on investments. Accordingly, no provision for Federal income tax is necessary. Management has reviewed the Fund’s tax positions for all open tax years and has determined that as of February 28, 2019, no liability for income tax is required in the Fund’s financial statements for net unrecognized tax benefits. However, management’s conclusions may be subject to future review based on changes in, or the interpretation of, the accounting standards or tax laws and regulations. The Fund’s Federal tax returns since inception remain subject to examination by the Internal Revenue Service.
J. Distributions to Shareholders — Distributions from net investment income, if any, are generally declared and paid quarterly. Net realized capital gains, if any, are distributed by the Fund at least annually. The amount of distributions from net investment income and net realized capital gains is determined in accordance with Federal income tax regulations, which may differ from GAAP. To the extent these “book/tax” differences are permanent in nature (i.e., that they result from other than timing of recognition — “temporary differences”), such amounts are reclassified within the capital accounts based on their Federaltax-basis treatment.
The following amounts were reclassified within the capital accounts:
| | | | | | | | | | | | |
| | | Paid-in-Capital | | | Accumulated
undistributed
(distributions in
excess of) net investment
income | | | Accumulated
net realized
gains (losses) | |
MSCI US REIT ETF | | $ | 876,480 | | | $ | (4,853 | ) | | $ | (871,627 | ) |
The reclassifications for the Fund relate primarily to redemptions in-kind.
3. Fees and Other Transactions with Affiliates
A. Investment Advisory Fee — Pursuant to an Investment Advisory Agreement, the Adviser supervises the investments of the Fund and for such services is paid a fee. The fee is accrued daily and paid monthly at an annual rate of 0.12% of the Fund’s average daily net assets.
The Adviser waived Investment Advisory fees and/or reimbursed expenses as outlined in Note 3.D.
B. Administration Fee — Pursuant to an Administration Agreement, the Administrator provides certain administration services to the Fund. In consideration of these services, effective January 1, 2019, the Administrator received a fee that was accrued daily and paid monthly at an annual rate of 0.075% of the Fund’s net assets. Prior to January 1, 2019, the Administrator received a fee that was accrued daily and paid monthly at an annual rate of 0.085% of the Fund’s average daily net assets.
The Administrator waived Administration fees as outlined in Note 3.D.
JPMorgan Chase Bank, N.A. (“JPMCB”), a wholly-owned subsidiary of JPMorgan, serves as the Fund’ssub-administrator (the“Sub-administrator”). For its services asSub-administrator, JPMCB receives a portion of the fees payable to the Administrator.
C. Custodian, Accounting and Transfer Agent Fees — JPMCB provides custody, accounting and transfer agency services to the Fund. The amount paid directly to JPMCB by the Fund for custody services are included in the Custodian, Accounting and Transfer Agent fees on the SOP. Interest income earned on cash balances at the custodian, if any, is included in Interest income from affiliates on the SOP. With respect to the transfer agency services provided by JPMCB for each creation or redemption transaction, the Authorized Participant will generally be responsible for such associated expenses; during the period, the Fund paid no transfer agency fees to JPMCB.
Additionally, Authorized Participants generally pay transaction fees associated with the creation and redemption of fund shares. These fees are used to offset certain custodian charges incurred by the Fund for these transactions.
| | | | | | |
| | | |
| 18 | | | | J.P. MORGAN EXCHANGE-TRADED FUNDS | | FEBRUARY 28, 2019 |
For the period ended February 28, 2019, the amount of transaction fees paid by the Authorized Participants to the fund that were used to reimburse custodian fees were $6,800.
Such amounts are included in expense reimbursements fromnon-affiliates in the SOP.
Restricted cash on the SAL is cash received from Authorized Participants for the reimbursement of creation and/or redemption of Fund shares.
Interest expense paid to the custodian related to cash overdrafts, if any, is included in Interest expense to affiliates on the SOP.
D. Waivers and Reimbursements — The Adviser has contractually agreed to waive fees and/or reimburse the Fund to the extent that total annual operating expenses, (excluding acquired fund fees and expenses, dividend expenses related to short sales, interest, taxes, expenses related to litigation and potential litigation, and extraordinary expenses), exceed 0.11% of the Fund’s average daily net assets.
The expense limitation agreement is in effect for the period ended February 28, 2019 and the current agreement is in place until at least June 30, 2021.
For the period ended February 28, 2019, the Fund’s service providers waived fees and/or reimbursed expenses for the Fund as follows. None of these parties expect the Fund to repay any such waived fees and/or reimbursed expenses in future years.
| | | | | | | | | | | | | | |
| | | Contractual Waivers | | | | |
| | | Investment Advisory Fees | | Administration
Fees | | | Total | | | Contractual
Reimbursements | |
MSCI US REIT ETF | | $75,432 | | $ | 51,700 | | | $ | 127,132 | | | $ | 57,096 | |
Additionally, the Fund may invest in one or more money market funds advised by the Adviser or its affiliates (affiliated money market funds). The Adviser, Administrator and/or JPMDS, as shareholder servicing agent, have contractually agreed to waive fees and/or reimburse expenses in an amount sufficient to offset the respective net fees each collects from the affiliated money market fund on the Fund’s investment in such affiliated money market fund, except for investments of securities lending cash collateral.
The amount of the waivers resulting from investments in the money market fund for the period ended February 28, 2019 was $484.
E. Distribution Services — The Distributor or its agent distributes Creation Units for the Fund on an agency basis. The Distributor does not maintain a secondary market in shares of the Fund. JPMDS receives no fees for their distribution services under their respective distribution agreements with the Trust (the “Distribution Agreements”). Although the Trust does not pay any fees under the Distribution Agreements, JPMIM pays JPMDS for certain distribution related services.
F. Other — Certain officers of the Trust are affiliated with the Adviser, the Administrator and JPMDS. Such officers, with the exception of the Chief Compliance Officer, receive no compensation from the Fund for serving in their respective roles.
The Board appointed a Chief Compliance Officer to the Fund in accordance with Federal securities regulations. The Fund, along with other affiliated funds, makes reimbursement payments, on apro-rata basis, to the Administrator for a portion of the fees associated with the Office of the Chief Compliance Officer. Such fees are included in Trustees’ and Chief Compliance Officer’s fees on the SOP.
The Fund may use related party broker-dealers. For the period ended February 28, 2019, the Fund did not incur any brokerage commissions with broker dealers affiliated with the Adviser.
The Securities and Exchange Commission (“SEC”) has granted an exemptive order permitting the Fund to engage in principal transactions with J.P. Morgan Securities, Inc., an affiliated broker, involving taxable money market instruments, subject to certain conditions.
4. Investment Transactions
During the period ended February 28, 2019, purchases and sales of investments (excluding short-term investments) were as follows:
| | | | | | | | |
| | | Purchases
(excluding U.S.
Government) | | | Sales
(excluding U.S.
Government) | |
MSCI US REIT ETF (a) | | $ | 6,106,718 | | | $ | 4,279,486 | |
During the period ended February 28, 2019, there were no purchases or sales of U.S. Government securities.
For the period ended February 28, 2019,in-kind transactions associated with creations and redemptions were as follows:
| | | | | | | | |
| | | In-Kind
Creations | | | In-Kind
Redemptions | |
MSCI US REIT ETF (a) | | $ | 140,238,178 | | | $ | 13,475,728 | |
| (a) | Commencement of operations was June 15, 2018. |
| | | | | | | | |
| | | |
| FEBRUARY 28, 2019 | | J.P. MORGAN EXCHANGE-TRADED FUNDS | | | | | 19 | |
NOTES TO FINANCIAL STATEMENTS
AS OF February 28, 2019 (Unaudited) (continued)
5. Federal Income Tax Matters
For Federal income tax purposes, the estimated cost and unrealized appreciation (depreciation) in value of investments held at February 28, 2019 were as follows:
| | | | | | | | | | | | | | | | |
| | | Aggregate
Cost | | | Gross
Unrealized
Appreciation | | | Gross
Unrealized
Depreciation | | | Net Unrealized
Appreciation
(Depreciation) | |
MSCI US REIT ETF | | $ | 130,620,900 | | | $ | 8,523,603 | | | $ | 2,138,968 | | | $ | 6,384,635 | |
The difference between book and tax basis appreciation (depreciation) on investments is primarily attributed to wash sale loss deferrals.
The Tax character of distributions paid during the period ended February 28, 2019 was as follows:
| | | | | | | | | | | | |
| | | Ordinary
Income* | | | Net Long-Term
Capital Gains | | | Total
Distributions
Paid | |
MSCI US REIT ETF | | $ | 1,480,354 | | | $ | 93,776 | | | $ | 1,574,130 | |
| * | Short-term gain distributions are treated as ordinary income for income tax purposes. |
As of February 28, 2019, the estimated components of net assets (excludingpaid-in-capital) on a tax basis were as follows:
| | | | | | | | | | | | |
| | | Current
Distributable
Ordinary
Income | | | Current
Distributable
Long-Term
Capital Gain or
(Tax Basis Capital
Loss Carryover) | | | Unrealized
Appreciation
(Depreciation) | |
MSCI US REIT ETF | | $ | 688,413 | | | $ | 339,751 | | | $ | 6,384,635 | |
The cumulative timing differences primarily consist of wash sale loss deferrals.
At February 28, 2019, the Fund did not have any net capital loss carryforwards.
6. Capital Share Transactions
The Trust issues and redeems shares of the Fund only in Creation Units through the Distributor at NAV. Capital shares transactions detail can be found in the Statements of Changes in Net Assets.
Shares of the Fund may only be purchased or redeemed by Authorized Participants. Such Authorized Participants may from time to time hold, of record or beneficially, a substantial percentage of the Fund’s shares outstanding, act as executing or clearing broker for investment transactions on behalf of the Fund. An Authorized Participant is either (1) a “Participating Party” or other participant in the clearing process through the Continuous Net Settlement System of the National Securities Clearing Corporation (“NSCC”); or (2) a DTC Participant; which, in either case, must have executed an agreement with the Distributor.
7. Risks, Concentrations and Indemnifications
In the normal course of business, the Fund enters into contracts that contain a variety of representations which provide general indemnifications. The Fund’s maximum exposure under these arrangements is unknown. The amount of exposure would depend on future claims that may be made against the Fund that has not yet occurred. However, based on experience, the Fund expects the risk of loss to be remote.
As of February 28, 2019, the Adviser owns shares representing 39% of the net assets of the Fund.
Significant shareholder transactions by the Adviser may impact the Fund’s performance.
Because the Fund may invest a significant portion of its assets in REITs, the Fund may be subject to certain risks similar to those associated with direct investments in real estate. REITs may be affected by changes in the value of their underlying properties and by defaults by tenants. REITs depend generally on their ability to generate cash flow to make distributions to shareholders, and certain REITs have self-liquidation provisions by which mortgages held may be paid in full and distributions of capital returns may be made at any time.
Disruptions to creations and redemptions, the existence of significant market volatility or potential lack of an active trading market for the Shares (including through a trading halt), as well as other factors, may result in Shares trading significantly above (at a premium) or below (at a discount) to the NAV or to the intraday value of the Fund’s holdings. During such periods, investors may incur significant losses if shares are sold.
The Fund may not track the return of the underlying index for a number of reasons and therefore may not achieve its investment objective. For example, the Fund incurs a number of operating expenses not applicable to its underlying index, and incurs costs in buying and selling securities, especially when rebalancing the Fund’s securities holdings to reflect changes in the composition of the underlying index. In addition, a Fund’s return may differ from the return of its underlying index as a result of, among other things, pricing differences and the inability to purchase certain
| | | | | | |
| | | |
| 20 | | | | J.P. MORGAN EXCHANGE-TRADED FUNDS | | FEBRUARY 28, 2019 |
securities included in the underlying index due to regulatory or other restrictions. To the extent of the previously outlined items, the Fund’s return differs from the return of the underlying index.
Derivatives may be riskier than other types of investments because they may be more sensitive to changes in economic and market conditions and could result in losses that significantly exceed the Fund’s original investment. Derivatives also expose the Fund to counterparty risk (the risk that the derivative counterparty will not fulfill its contractual obligations), including credit risk of the derivative counterparty.
8. New Accounting Pronouncement
In August 2018, the Financial Accounting Standard Board (“FASB”) issued Accounting Standard Update (“ASU”)2018-13 (“ASU2018-13”), Fair Value Measurement (Topic 820): Disclosure Framework — Changes to the Disclosure Requirements for Fair Value Measurement, which adds, removes, and modifies certain aspects of the fair value disclosure. ASU2018-13 amendments are the result of a broader disclosure project, FASB Concepts Statement Conceptual Framework for Financial Reporting — Chapter 8: Notes to Financial Statements, to improve the effectiveness of the fair value disclosure requirements. ASU2018-13 is effective for the fiscal years, and interim periods within those fiscal years, beginning after December 15, 2019; early adoption is permitted. Management has evaluated the implications of these changes and the amendments are included in the financial statements, which had no effect to the Fund’s net assets or results of operation.
In August 2018, the SEC adopted their Disclosure Update and Simplification Rule (the “Rule”). The Rule is part of the SEC’s overall project to improve disclosure effectiveness by amending certain disclosure requirements that have become redundant, duplicative, overlapping, outdated, or superseded in light of other SEC disclosure requirements, U.S. GAAP, or changes in the information environment. The amendments are intended to facilitate the disclosure of information to investors and simplify compliance without significantly altering the total mix of information provided to investors. Management has evaluated the implications of these changes and the amendments are included in the financial statements, which had no effect on the Funds’ net assets or results of operation.
| | | | | | | | |
| | | |
| FEBRUARY 28, 2019 | | J.P. MORGAN EXCHANGE-TRADED FUNDS | | | | | 21 | |
REPORT OF INDEPENDENT REGISTERED PUBLIC ACCOUNTING FIRM
TotheBoard of Trustees of J.P. Morgan Exchange-Traded Fund Trust and Shareholders of JPMorgan BetaBuilders MSCI US REIT ETF
Opinion on the Financial Statements
We have audited the accompanying statement of assets and liabilities, including the schedule of portfolio investments, ofJPMorgan BetaBuilders MSCI US REIT ETF (one of the funds constituting J.P. Morgan Exchange-Traded Fund Trust, hereafter referred to as the “Fund”) as of February 28, 2019, and the related statements of operations and changes in net assets, including the related notes,and the financial highlights for the period June 15, 2018 (commencement of operations) through February 28, 2019 (collectively referred to as the “financial statements”). In our opinion, the financial statements present fairly, in all material respects, the financial position of the Fund as of February 28, 2019, and the results of its operations, changes in its net assets, and the financial highlights for the period June 15, 2018 (commencement of operations) through February 28, 2019 in comformity with accounting principles generally accepted in the United States of America.
Basis for Opinion
These financial statements are the responsibility of the Fund’s management. Our responsibility is to express an opinion on the Fund’s financial statements based on our audit. We are a public accounting firm registered with the Public Company Accounting Oversight Board (United States) (PCAOB) and are required to be independent with respect to the Fund in accordance with the U.S. federal securities laws and the applicable rules and regulations of the Securities and Exchange Commission and the PCAOB.
We conducted our audit of these financial statements in accordance with the standards of the PCAOB. Those standards require that we plan and perform the audit to obtain reasonable assurance about whether the financial statements are free of material misstatement, whether due to error or fraud.
Our audit included performing procedures to assess the risks of material misstatement of the financial statements, whether due to error or fraud, and performing procedures that respond to those risks. Such procedures included examining, on a test basis, evidence regarding the amounts and disclosures in the financial statements. Our audit also included evaluating the accounting principles used and significant estimates made by management, as well as evaluating the overall presentation of the financial statements. Our procedures included confirmation of securities owned as of February 28, 2019 by correspondence with the custodian, transfer agent and brokers; when replies were not received from brokers, we performed other auditing procedures. We believe that our audit provides a reasonable basis for our opinion.
/s/PricewaterhouseCoopers LLP
New York, New York
April 25, 2019
We have served as the auditor of one or more investment companies in the JPMorgan Funds complex since 1993.
| | | | | | |
| | | |
| 22 | | | | J.P. MORGAN EXCHANGE-TRADED FUNDS | | FEBRUARY 28, 2019 |
TRUSTEES
(Unaudited)
The Fund’s Statement of Additional Information includes additional information about the Fund’s Trustees and is available, without charge, upon request by calling1-844-457-6383 or on the J.P. Morgan Funds’ website at www.jpmorganfunds.com.
| | | | | | | | |
Name (Year of Birth;
Positions With
the Funds since) | | Principal Occupation
During Past 5 Years | | Number of
Funds in Fund
Complex Overseen
by Trustee (1) | | | Other Directorships Held
During the Past 5 Years |
Independent Trustees | | | | | | | | |
| | | |
Gary L. French (1951);
Trustee of the Trust since 2014 | | Real Estate Investor (2011–present); Consultant to the Mutual Fund Industry (2011-present); Senior Consultant for The Regulatory Fundamentals Group LLC (2011–2017); Senior Vice President–Fund Administration, State Street Corporation (2002–2010). | | | 36 | | | Independent Trustee, The China Fund, Inc. (2013-2019); Exchange Traded Concepts Trust II (2012-2014); Exchange Traded Concepts Trust I (2011-2014). |
| | | |
| Robert J. Grassi (1957); Trustee of the Trust since 2014 | | Sole Proprietor, Academy Hills Advisors LLC (2012-present); Pension Director, Corning Incorporated (2002-2012). | | | 36 | | | None. |
| | | |
| Thomas P. Lemke (1954); Trustee of the Trust since 2014 | | Retired; Executive Vice President and General Counsel, Legg Mason (2005-2013). | | | 36 | | | SEI family of funds (Independent Trustee of Advisors’ Inner Circle Fund III (20 portfolios) (from February 2014 to present); Independent Trustee of Winton Diversified Opportunities Fund (from December 2014-2018); Independent Trustee of Gallery Trust (from August 2015 to present); Independent Trustee of Schroder Series Trust (from 2017 to present) Independent Trustee of Schroder Global Series Trust (from February 2017 to present); Independent Trustee of O’Connor EQUUS (May 2014-April 2016), Independent Trustee of Winton Series Trust (December 2014-March 2017); Independent Trustee of AXA Premier VIP Trust (2014-June 2017); Independent Director of The Victory Funds (or their predecessor funds) (35 portfolios) (2014-March 2015); Symmetry Panoramic Trust (16 portfolios) (2018-present). |
| | | |
| Lawrence R. Maffia (1950); Trustee of the Trust since 2014 | | Retired; Director and President, ICI Mutual Insurance Company (2006-2013). | | | 36 | | | Director, ICI Mutual Insurance Company (1999-2013). |
| | | |
| Emily A. Youssouf (1951); Trustee of the Trust since 2014 | | Clinical Professor, NYU Schack Institute of Real Estate (2009-present); Board Member(2005-present), Chair of Capital Committee (2006-2016), Chair of Audit Committee(2005-present), and Chair of IT Committee (2016-present), NYC Health and Hospitals Corporation; Board Member and Member of the Audit Committee and Related Parties Committee (2013-2018) and Member of the Risk Management Committee (2017-2018), PennyMac Financial Services, Inc. | | | 36 | | | Trustee, NYC School Construction Authority (2009-present); Board Member, NYS Job Development Authority (2008-present); Trustee (2015-present) and Chair of the Audit and Finance Committee (2015-present) of the Transit Center Foundation; Vice Chair (2011-2013) and Board Member (2013-2014) of New York City Housing Authority. |
Interested Trustee | | | | | | | | |
| | | |
| Robert Deutsch (2) (1957); Chairman and Trustee of the Trust since 2014 | | Retired; Head of the Global ETF Business for JPMorgan Asset Management (2013-2017); Head of the Global Liquidity Business for JPMorgan Asset Management (2003-2013). | | | 36 | | | Board of Directors of the JUST Capital Foundation (2017–present). |
| (1) | A Fund Complex means two or more registered investment companies that hold themselves out to investors as related companies for purposes of investment and investor services or have a common investment adviser or have an investment adviser that is an affiliated person of the investment adviser of any of the other registered investment companies. Thirty two series of the Trust have commenced operations. |
| (2) | Mr. Deutsch is an interested trustee because he was an employee of the Adviser until August 2017. |
The contact address for each of the Trustees is 277 Park Avenue, New York, NY 10172.
| | | | | | | | |
| | | |
| FEBRUARY 28, 2019 | | J.P. MORGAN EXCHANGE-TRADED FUNDS | | | | | 23 | |
OFFICERS
(Unaudited)
| | |
Name (Year of Birth),
Positions Held with
the Trusts (Since) | | Principal Occupations During Past 5 Years |
| |
Joanna Gallegos (1975), President and Principal Executive Officer (2017) | | Managing Director, Head of J.P. Morgan Asset Management’s U.S. Exchange Traded Funds business. Previously, Head of J.P. Morgan Asset Management’s ETF Product Development team from August 2013 to July 2017. |
| |
Ogden Hammond (1975), Interim President and Principal Executive Officer (2019) | | Managing Director and Global Head of Beta (Passive) Product and Business Development for J.P. Morgan Asset Management. Previously, Executive Director and Global Head of Beta Product and Business Development (2017-2018), Executive Director and Head of Beta Strategy and Business Development(2016-2017) and Executive Director and Head of ETF Solutions Strategy & Business Development (2014-2016) for J.P. Morgan Investment Management Inc., Executive Director, Strategy and Business Development(2013- 2014) for J.P. Morgan Asset Management. |
| |
Lauren A. Paino (1973), Treasurer and Principal Financial Officer (2015)* | | Executive Director, J.P. Morgan Investment Management Inc. (formerly JPMorgan Funds Management, Inc.) since August 2013; Director, Credit Suisse Asset Management from 2000 to 2013. |
| |
Brian S. Shlissel (1964), Vice President (2016) | | Managing Director and Chief Administrative Officer for J.P. Morgan pooled vehicles, J.P. Morgan Investment Management Inc. (formerly JPMorgan Funds Management, Inc.) (from 2014 to present); Managing Director and Head of Mutual Fund Services, Allianz Global Investors; President and Chief Executive Officer, Allianz Global Investors Mutual Funds and PIMCO Closed-End Funds (from 1999 to 2014). |
| |
Paul Shield (1960), Vice President and Assistant Treasurer (2016) | | Managing Director and head of Business Management for JPMorgan Asset Management’s Exchange Traded Fund platform since 2013. Senior Global Product Manager of Alternative Investments for BNY Mellon from 2011 to 2013 and Global Product Head for Exchange Traded Funds at JPMorgan Chase Bank from 2008 to 2011. |
| |
| Elizabeth A. Davin (1964), Secretary (2018)** | | Executive Director and Assistant General Counsel, JPMorgan Chase. Ms. Davin has been with JPMorgan Chase (formerly Bank One Corporation) since 2004. |
| |
Stephen M. Ungerman (1953), Chief Compliance Officer (2014) | | Managing Director, JPMorgan Chase & Co.; Mr. Ungerman has been with JPMorgan Chase & Co. since 2000. |
| |
Jessica K. Ditullio (1962), Assistant Secretary (2014)** | | Executive Director and Assistant General Counsel, JPMorgan Chase. Ms. Ditullio has been with JPMorgan Chase (formerly Bank One Corporation) since 1990. |
| |
Carmine Lekstutis (1980), Assistant Secretary (2014)* | | Executive Director and Assistant General Counsel, JPMorgan Chase since February 2015; formerly Vice President and Assistant General Counsel, JPMorgan Chase from 2011 to February 2015. |
| |
Gregory S. Samuels (1980), Assistant Secretary (2014)* | | Executive Director and Assistant General Counsel, JPMorgan Chase since February 2014; formerly Vice President and Assistant General Counsel, JPMorgan Chase from 2010. |
| |
Pamela L. Woodley (1971), Assistant Secretary (2014)* | | Vice President and Assistant General Counsel, JPMorgan Chase since November 2004. |
| |
| Zachary E. Vonnegut-Gabovitch (1986), Assistant Secretary (2017)* | | Vice President and Assistant General Counsel, JPMorgan Chase since September 2016; Associate, Morgan Lewis & Bockius (law firm) from 2012 to 2016. |
| |
| Frederick J. Cavaliere (1978), Assistant Treasurer (2015)* | | Executive Director, J.P. Morgan Investment Management Inc. since February 2016; formerly, Vice President, J.P. Morgan Investment Management Inc. (formerly JPMorgan Funds Management, Inc.) since September 2010 to February 2016. Mr. Cavaliere has been with JPMorgan since May 2006. |
| |
Michael M. D’Ambrosio (1969), Assistant Treasurer (2014) | | Managing Director, J.P. Morgan Investment Management Inc. (formerly JPMorgan Funds Management, Inc.) since May 2014; formerly Executive Director, J.P. Morgan Investment Management Inc. (formerly JPMorgan Funds Management, Inc.) from 2012 to May 2014. |
| |
Jason Ronca (1978), Assistant Treasurer (2014)*** | | Executive Director, Assistant Treasurer and ETF Platform Manager for J.P. Morgan Asset Management since February 2017; formerly Vice President, Assistant Treasurer and ETF Platform Manager for J.P. Morgan Asset Management from May 2014 to February 2017. ETF Product Manager for Corporate Investment Bank responsible for setting the strategy and control agenda for the ETF servicing business from 2010 to May 2014; Prior to 2010, a Vice President in Fund Accounting within J.P. Morgan Investor Services, supporting a series of U.S. registered mutual funds. |
The contact address for each of officers, unless otherwise noted, is 277 Park Avenue, New York, NY 10172.
| * | | The contact address for the officer is 4 New York Plaza, New York, NY 10004. |
| ** | | The contact address for the officer is 1111 Polaris Parkway, Columbus, OH 43240. |
| *** | | The contact address for the officer is 50 Rowes Wharf, Floor 3, Boston, MA 02110. |
| | | | | | |
| | | |
| 24 | | | | J.P. MORGAN EXCHANGE-TRADED FUNDS | | FEBRUARY 28, 2019 |
SCHEDULE OF SHAREHOLDER EXPENSES
(Unaudited)
Hypothetical $1,000 Investment
As a shareholder of the Fund, you incur ongoing costs, investment advisory fees, administration fees and other Fund expenses, in addition to brokerage commissions on your purchases and sales of Fund shares. The examples below are intended to help you understand your ongoing costs (in dollars) of investing in the Fund and to compare these ongoing costs with the ongoing costs of investing in other funds. The examples assume that you had a $1,000 investment at the beginning of the reporting period September 1, 2018 and continued to hold your shares at the end of the reporting period, February 28, 2019.
Actual Expenses
For the Fund in the table below, the first line provides information about actual account values and actual expenses. You may use the information in this line, together with the amount you invested, to estimate the expenses that you paid over the period. Simply divide your account value by $1,000 (for
example, an $8,600 account value divided by $1,000 = 8.6), then multiply the result by the number under the heading entitled “Expenses Paid During the Period” to estimate the expenses you paid on your account during this period.
Hypothetical Example for Comparison Purposes
The second line in the table below provides information about hypothetical account values and hypothetical expenses based on the Fund’s actual expense ratio and an assumed rate of return of 5% per year before expenses, which is not the Fund’s actual return. The hypothetical account values and expenses may not be used to estimate the actual ending account balance or expenses you paid for the period. You may use this information to compare the ongoing costs of investing in the Fund and other Funds. To do so, compare this 5% hypothetical example with the 5% hypothetical examples that appear in the shareholder reports of other funds. The examples also assume all dividends and distributions have been reinvested.
| | | | | | | | | | | | | | | | |
| | | Beginning
Account Value
September 1, 2018 | | | Ending
Account Value
February 28, 2019 | | | Annualized
Expense
Ratio | | | Expenses
Paid During
the Period | |
MSCI US REIT ETF | | | | | | | | | | | | | | | | |
Actual (1) | | $ | 1,000.00 | | | $ | 1,022.90 | | | | 0.11 | % | | $ | 0.55 | |
Hypothetical (1) | | | 1,000.00 | | | | 1,024.25 | | | | 0.11 | | | | 0.55 | |
| (1) | Expenses are equal to each Fund’s annualized net expense ratio, multiplied by the average account value over the period, multiplied by 181/365 (to reflect the one-half year period). |
| | | | | | | | |
| | | |
| FEBRUARY 28, 2019 | | J.P. MORGAN EXCHANGE-TRADED FUNDS | | | | | 25 | |
TAX LETTER
(Unaudited)
Certain tax information for the J.P. Morgan Funds is required to be provided to shareholders based upon the Fund’s income and distributions for the taxable year ended February 28, 2019. The information and distributions reported in this letter may differ from the information and taxable distributions reported to the shareholders for the calendar year ending December 31, 2019. The information necessary to complete your income tax returns for the calendar year ending December 31, 2019 will be provided under separate cover.
Long-Term Capital Gain
The Fund distributed the following amount, or maximum allowable amount, of long-term capital gain dividends for the period ended February 28, 2019:
| | | | |
| | | Long-Term
Capital Gain
Distribution | |
| | $ | 93,776 | * |
| * | Included in this amount is unrecaptured Section 1250 gains of $21,367. |
Section 199A Income
The Fund had the following amount, or maximum allowable amount, of ordinary income distributions treated as section 199A dividends for the period ended February 28, 2019:
Qualified Dividend Income (QDI)
The Fund had the following amount, or maximum allowable amount, of ordinary income distributions treated as qualified dividends for the period ended February 28, 2019:
| | | | |
| | | Qualified
Dividend
Income | |
| | $ | 3,678 | |
| | | | | | |
| | | |
| 26 | | | | J.P. MORGAN EXCHANGE-TRADED FUNDS | | FEBRUARY 28, 2019 |
J.P. Morgan Exchange-Traded Funds are distributed by JPMorgan Distribution Services, Inc., an indirect, wholly-owned subsidiary of JPMorgan Chase & Co.
Contact J.P. Morgan Exchange-Traded Funds at 1-844-457-6383 (844-4JPM ETF) for a fund prospectus. You can also visit us at www.jpmorganfunds.com. Investors should carefully consider the investment objectives and risks as well as charges and expenses of the fund before investing. The prospectus contains this and other information about the fund. Read the prospectus carefully before investing.
Investors may obtain information about the Securities Investor Protection Corporation (SIPC), including the SIPC brochure, by visiting www.sipc.org or by calling SIPC at 202-371-8300.
The Fund files a complete schedule of its fund holdings for the first and third quarters of its fiscal year with the SEC on Form N-Q. The Fund’s Forms N-Q is available on the SEC’s website at http://www.sec.gov and may be reviewed and copied at the SEC’s Public Reference Room in Washington, DC. Information on the operation of the SEC’s Public Reference Room may be obtained by calling 1-800-SEC-0330. Shareholders may request the Form N-Q without charge by calling 1-844-457-6383 or by visiting the J.P. Morgan Funds’ website at www.jpmorganfunds.com.
A description of each Fund’s policies and procedures with respect to the disclosure of each Fund’s holdings is available in the prospectus and Statement of Additional Information.
A copy of proxy policies and procedures is available without charge upon request by calling 1-844-457-6383 and on the Fund’s website at www.jpmorganfunds.com. A description of such policies and procedures is on the SEC’s website at www.sec.gov. The Trustees have delegated the authority to vote proxies for securities owned by the Fund to the Adviser. A copy of the Fund’s voting record for the most recent 12-month period ended June 30 is available on the SEC’s website at www.sec.gov or at the Fund’s website at www.jpmorganfunds.com no later than August 31 of each year. The Fund’s proxy voting record will include, among other things, a brief description of the matter voted on for each fund security, and will state how each vote was cast, for example, for or against the proposal.


J.P. Morgan Asset Management is the marketing name for the asset management businesses of JPMorgan Chase & Co. Those businesses include, but are not limited to, J.P. Morgan Investment Management Inc., Security Capital Research & Management Incorporated and J.P. Morgan Alternative Asset Management, Inc.
| | | | |
| | © JPMorgan Chase & Co., 2019. All rights reserved. February 2019. | | AN-RETF-219 |
ITEM 2. CODE OF ETHICS.
Disclose whether, as of the end of the period covered by the report, the registrant has adopted a code of ethics that applies to the registrant’s principal executive officer, principal financial officer, principal accounting officer or controller, or persons performing similar functions, regardless of whether these individuals are employed by the registrant or a third party. If the registrant has not adopted such a code of ethics, explain why it has not done so.
The registrant must briefly describe the nature of any amendment, during the period covered by the report, to a provision of its code of ethics that applies to the registrant’s principal executive officer, principal financial officer, principal accounting officer or controller, or persons performing similar functions, regardless of whether these individuals are employed by the registrant or a third party, and that relates to any element of the code of ethics definition enumerated in paragraph (b) of this Item. The registrant must file a copy of any such amendment as an exhibit pursuant to Item 13(a)(1), unless the registrant has elected to satisfy paragraph (f) of this Item by positing its code of ethics on its website pursuant to paragraph (f)(2) of this Item, or by undertaking to provide its code of ethics to any person without charge, upon request, pursuant to paragraph (f)(3) of this Item.
If the registrant has, during the period covered by the report, granted a waiver, including an implicit waiver, from a provision of the code of ethics that applies to the registrant’s principal executive officer, principal financial officer, principal accounting officer or controller, or persons performing similar functions, regardless of whether these individuals are employed by the registrant or third party, that relates to one or more items set forth in paragraph (b) of this Item, the registrant must briefly describe the nature of the waiver, the name of the person to whom the waiver was granted, and the date of the waiver.
The Registrant has adopted a code of ethics that applies to the Registrant’s principal executive officer and principal financial officer. There were no amendments to the code of ethics or waivers granted with respect to the code of ethics in the period covered by the report.
ITEM 3. AUDIT COMMITTEE FINANCIAL EXPERT.
(a) (1) Disclose that the registrant’s board of directors has determined that the registrant either:
(i) Has at least one audit committee financial expert serving on its audit committee; or
(ii) Does not have an audit committee financial expert serving on its audit committee.
The Registrant’s Board of Trustees has determined that the Registrant has at least one audit committee financial expert serving on its audit committee. The Securities and Exchange Commission has stated that the designation or identification of a person as an audit committee financial expert pursuant to this Item 3 of Form N-CSR does not impose on such person any duties, obligations or liabilities that are greater than the duties, obligations and liabilities imposed on such person as a member of the Audit Committee and the Board of Trustees in the absence of such designation or identification.
(2) If the registrant provides the disclosure required by paragraph (a)(1)(i) of this Item, it must disclose the name of the audit committee financial expert and whether that person is “independent.” In order to be considered “independent” for purposes of this Item, a member of an audit committee may not, other than in his or her capacity as a member of the audit committee, the board of directors, or any other board committee:
| | (i) | Accept directly or indirectly any consulting, advisory, or other compensatory fee from the issuer; or |
| | (ii) | Be an “interested person” of the investment company as defined in Section 2(a)(19) of the Act (15 U.S.C. 80a-2(a)(19)). |
The audit committee financial experts are Gary L. French, Robert J. Grassi, Thomas P. Lemke, Lawrence R. Maffia and EmilyA. Youssouf, each of which is not an “interested person” of the Registrant and is also “independent” as defined by the U.S. Securities and Exchange Commission for purposes of audit committee financial expert determinations.
(3) If the registrant provides the disclosure required by paragraph (a)(1)(ii) of this Item, it must explain why it does not have an audit committee financial expert.
Not applicable.
ITEM 4. PRINCIPAL ACCOUNTANT FEES AND SERVICES.
(a) Disclose, under the caption Audit Fees, the aggregate fees billed for each of the last two fiscal years for professional services rendered by the principal accountant for the audit of the registrant’s annual financial statements or services that are normally provided by the accountant in connection with statutory and regulatory filings or engagements for those fiscal years.
AUDIT FEES
2019 – $491,000
2018 – $234,790
(b) Disclose, under the caption Audit-Related Fees, the aggregate fees billed in each of the last two fiscal years for assurance and related services by the principal accountant that are reasonably related to the performance of the audit of the registrant’s financial statements and are not reported under paragraph (a) of this Item. Registrants shall describe the nature of the services comprising the fees disclosed under this category.
AUDIT-RELATED FEES
2019 – $59,500
2018 – $27,600
Audit-related fees consist of security count procedures performed as required under Rule 17f-2 of the Investment Company Act of 1940 during the Registrant’s fiscal year.
(c) Disclose, under the caption Tax Fees, the aggregate fees billed in each of the last two fiscal years for professional services rendered by the principal accountant for tax compliance, tax advice, and tax planning. Registrants shall describe the nature of the services comprising the fees disclosed under this category.
TAX FEES
2019 – $140,826
2018 – $58,000
The tax fees consist of fees billed in connection with preparing the federal regulated investment company income tax returns for the Registrant for the tax years ended February 28, 2019 and 2018, respectively.
For the last fiscal year, no tax fees were required to be approved pursuant to paragraph (c)(7)(ii) of Rule 2-01 of Regulation S-X.
(d) Disclose, under the caption All Other Fees, the aggregate fees billed in each of the last two fiscal years for products and services provided by the principal accountant, other than the services reported in paragraphs (a) through (c) of this Item. Registrants shall describe the nature of the services comprising the fees disclosed under this category.
ALL OTHER FEES
2019 – $0
2018 – $0
(e)(1) Disclose the audit committee’s pre-approval policies and procedures described in paragraph (c)(7) of Rule 2-01 of Regulation S-X.
Pursuant to the Registrant’s Audit Committee Charter and written policies and procedures for the pre-approval of audit and non-audit services (the “Pre-approval Policy”), the Audit Committee pre-approves all audit and non-audit services performed by the Registrant’s independent public registered accounting firm for the Registrant. In addition, the Audit Committee pre-approves the auditor’s engagement for non-audit services with the Registrant’s investment adviser (not including a sub-adviser whose role is primarily portfolio management and is sub-contracted or overseen by another investment adviser) and any Service Affiliate in accordance with paragraph (c)(7)(ii) of Rule 2-01 of Regulation S-X, if the engagement relates directly to the operations and financial reporting of the Registrant. Proposed services may be
pre-approved either 1) without consideration of specific case-by-case services or 2) require the specific pre-approval of the Audit Committee. Therefore, initially the Pre-approval Policy listed a number of audit and non-audit services that have been approved by the Audit Committee, or which were not subject to pre-approval under the transition provisions of Sarbanes-Oxley Act of 2002 (the “Pre-approval List”). The Audit Committee annually reviews and pre-approves the services included on the Pre-approval List that may be provided by the independent public registered accounting firm without obtaining additional specific pre-approval of individual services from the Audit Committee. The Audit Committee adds to, or subtracts from, the list of general pre-approved services from time to time, based on subsequent determinations. All other audit and non-audit services not on the Pre-approval List must be specifically pre-approved by the Audit Committee.
One or more members of the Audit Committee may be appointed as the Committee’s delegate for the purposes of considering whether to approve such services. Any pre-approvals granted by the delegate will be reported, for informational purposes only, to the Audit Committee at its next scheduled meeting. The Audit Committee’s responsibilities to pre-approve services performed by the independent public registered accounting firm are not delegated to management.
(2) Disclose the percentage of services described in each of paragraphs (b) through (d) of this Item that were approved by the audit committee pursuant to paragraph (c)(7)(i)(C) of Rule 2-01 of Regulation S-X.
2019 – 0.0%
2018 – 0.0%
(f) If greater than 50 percent, disclose the percentage of hours expended on the principal accountant’s engagement to audit the registrant’s financial statements for the most recent fiscal year that were attributed to work performed by persons other than the principal accountant’s full-time, permanent employees.
Not applicable.
(g) Disclose the aggregate non-audit fees billed by the registrant’s accountant for services rendered to the registrant, and rendered to the registrant’s investment adviser (not including any sub-adviser whose role is primarily portfolio management and is subcontracted with or overseen by another investment adviser), and any entity controlling, controlled by, or under common control with the adviser that provides ongoing services to the registrant for each of the last two fiscal years of the registrant.
The aggregate non-audit fees billed by the independent registered public accounting firm for services rendered to the Registrant, and rendered to Service Affiliates, for the last two calendar year ends were:
2018 – $32.2 million
2017 – $32.0 million
(h) Disclose whether the registrant’s audit committee of the board of directors has considered whether the provision of non-audit services that were rendered to the registrant’s investment adviser (not including any subadviser whose role is primarily portfolio management and is subcontracted with or overseen by another investment adviser), and any entity controlling, controlled by, or under common control with the investment adviser that provides ongoing services to the registrant that were not pre-approved pursuant to paragraph (c)(7)(ii) of Rule 2-01 of Regulation S-X is compatible with maintaining the principal accountant’s independence.
The Registrant’s Audit Committee has considered whether the provision of the non-audit services that were rendered to Service Affiliates that were not pre-approved (not requiring pre-approval) is compatible with maintaining the independent public registered accounting firm’s independence. All services provided by the independent public registered accounting firm to the Registrant or to Service Affiliates that were required to be pre-approved were pre-approved as required.
ITEM 5. AUDIT COMMITTEE OF LISTED REGISTRANTS.
(a) If the registrant is a listed issuer as defined in Rule 10A-3 under the Exchange Act (17CFR 240.10A-3), state whether or not the registrant has a separately-designated standing audit committee established in accordance with Section 3(a)(58)(A) of the Exchange Act (15 U.S.C. 78c(a)(58)(A)). If the registrant has such a committee, however designated, identify each committee member. If the entire board of directors is acting as the registrant’s audit committee as specified in Section 3(a)(58)(B) of the Exchange Act (15 U.S.C. 78c(a)(58)(B)), so state.
The registrant has a separately designated Audit Committee established in accordance with Section 3(a)(58)(A) of the Exchange Act. The members of the Audit Committee are Gary L. French, Robert J. Grassi, Thomas P. Lemke, Lawrence R. Maffia and Emily A. Youssouf.
(b) If applicable, provide the disclosure required by Rule 10A-3(d) under the Exchange Act (17CFR 240.10A-3(d)) regarding an exemption from the listing standards for all audit committees.
Not applicable.
ITEM 6. SCHEDULE OF INVESTMENTS.
File Schedule I – Investments in securities of unaffiliated issuers as of the close of the reporting period as set forth in Section 210.12-12 of Regulation S-X, unless the schedule is included as part of the report to shareholders filed under Item 1 of this Form.
Included in Item 1.
ITEM 7. DISCLOSURE OF PROXY VOTING POLICIES AND PROCEDURES FOR CLOSED-END MANAGEMENT INVESTMENT COMPANIES.
A closed-end management investment company that is filing an annual report on this Form N-CSR must, unless it invests exclusively in non-voting securities, describe the policies and procedures that it uses to determine how to vote proxies relating to portfolio securities, including the procedures that the company uses when a vote presents a conflict between the interests of its shareholders, on the one hand, and those of the company’s investment adviser; principal underwriter; or any affiliated person (as defined in Section 2(a)(3) of the Investment Company Act of 1940 (15 U.S.C. 80a-2(a)(3)) and the rules thereunder) of the company, its investment adviser, or its principal underwriter, on the other. Include any policies and procedures of the company’s investment adviser, or any other third party, that the company uses, or that are used on the company’s behalf, to determine how to vote proxies relating to portfolio securities.
Not applicable.
ITEM 8. PORTFOLIO MANAGERS OF CLOSED-END MANAGEMENT INVESTMENT COMPANIES.
Not applicable.
ITEM 9. PURCHASE OF EQUITY SECURITIES BY CLOSED-END MANAGEMENT INVESTMENT COMPANY AND AFFILIATED PURCHASERS.
(a) If the registrant is a closed-end management investment company, provide the information specified in paragraph (b) of this Item with respect to any purchase made by or on behalf of the registrant or any “affiliated purchaser,” as defined in Rule 10b-18(a)(3) under the Exchange Act (17 CFR 240.10b-18(a)(3)), of shares or other units of any class of the registrant’s equity securities that is registered by the registrant pursuant to Section 12 of the Exchange Act (15 U.S.C. 781).
Not applicable.
ITEM 10. SUBMISSION OF MATTERS TO A VOTE OF SECURITY HOLDERS.
Describe any material changes to the procedures by which shareholders may recommend nominees to the registrant’s board of directors, where those changes were implemented after the registrant last provided disclosure in response to the requirements of Item 7(d)(2)(ii)(G) of Schedule 14A (17 CFR 240.14a-101), or this Item.
No material changes to report.
ITEM 11. CONTROLS AND PROCEDURES.
(a) Disclose the conclusions of the registrant’s principal executive and principal financial officers, or persons performing similar functions, regarding the effectiveness of the registrant’s disclosure controls and procedures (as defined in Rule 30a-3(c) under the Act (17 CFR 270.30a-3(c))) as of a date within 90 days of the filing date of the report that includes the disclosure required by this paragraph, based on the evaluation of these controls and procedures required by Rule 30a-3(b) under the Act (17 CFR 270.30a-3(b))
and Rules 13a-15(b) or 15d-15(b) under the Exchange Act (17 CFR 240.13a-15(b) or 240.15d-15(b)).
The Registrant’s principal executive and principal financial officers have concluded, based on their evaluation of the Registrant’s disclosure controls and procedures as of a date within 90 days of the filing date of this report, that the Registrant’s disclosure controls and procedures are reasonably designed to ensure that information required to be disclosed by the Registrant on Form N-CSR is recorded, processed, summarized and reported within the required time periods and that information required to be disclosed by the Registrant in the reports that it files or submits on Form N-CSR is accumulated and communicated to the Registrant’s management, including its principal executive and principal financial officers, as appropriate to allow timely decisions regarding required disclosure.
(b) Disclose any change in the registrant’s internal control over financial reporting (as defined in Rule 30a-3(d) under the Act (17 CFR 270.30a-3(d)) that occurred during the registrant’s second fiscal quarter of the period covered by this report that has materially affected, or is reasonably likely to materially affect, the registrant’s internal control over financial reporting.
There were no changes in the Registrant’s internal control over financial reporting that occurred during the last fiscal quarter covered by this report that have materially affected, or are reasonably likely to materially affect, the Registrant’s internal control over financial reporting.
ITEM 12. DISCLOSURE OF SECURITIES LENDING ACTIVITIES FORCLOSED-END MANAGEMENT INVESTMENT COMPANIES.
Not applicable.
ITEM 13. EXHIBITS.
(a) File the exhibits listed below as part of this Form. Letter or number the exhibits in the sequence indicated.
(a)(1) Any code of ethics, or amendment thereto, that is the subject of the disclosure required by Item 2, to the extent that the registrant intends to satisfy the Item 2 requirements through filing of an exhibit.
Code of Ethics applicable to its Principal Executive and Principal Financial Officers pursuant to Section 406 of the Sarbanes-Oxley Act of 2002 attached hereto.
(a)(2) A separate certification for each principal executive officer and principal financial officer of the registrant as required by Rule 30a-2(a) under the Act (17 CFR 270.30a-2).
Certifications pursuant to Rule 30a-2(a) under the Investment Company Act of 1940 are attached hereto.
(a)(3) Any written solicitation to purchase securities under Rule 23c-1 under the Act (17 CFR 270.23c-1) sent or given during the period covered by the report by or on behalf of the registrant to 10 or more persons.
Not applicable.
(b) A separate or combined certification for each principal executive officer and principal officer of the registrant as required by Rule 30a-2(b) under the Act of 1940.
Certifications pursuant to Rule 30a-2(b) under the Investment Company Act of 1940 are attached hereto.
SIGNATURES
Pursuant to the requirements of the Securities Exchange Act of 1934 and the Investment Company Act of 1940, the registrant has duly caused this report to be signed on its behalf by the undersigned, thereunto duly authorized.
| | |
| J.P. Morgan Exchange-Traded Fund Trust |
| |
| By: | | /s/ Joanna M. Gallegos |
| | Joanna M. Gallegos |
| | President and Principal Executive Officer |
| | May 08, 2019 |
Pursuant to the requirements of the Securities Exchange Act of 1934 and the Investment Company Act of 1940, this report has been signed below by the following persons on behalf of the registrant and in the capacities and on the dates indicated.
| | |
| By: | | /s/ Joanna M. Gallegos |
| | Joanna M. Gallegos |
| | President and Principal Executive Officer |
| | May 08, 2019 |
| | |
| By: | | /s/ Lauren A. Paino |
| | Lauren A. Paino |
| | Treasurer and Principal Financial Officer |
| | May 08, 2019 |