UNITED STATES
SECURITIES AND EXCHANGE COMMISSION
Washington, D.C. 20549
FORM N-CSR
CERTIFIED SHAREHOLDER REPORT OF REGISTERED
MANAGEMENT INVESTMENT COMPANIES
Investment Company Act file number: 811-22903
J.P. Morgan Exchange-Traded Fund Trust
(Exact name of registrant as specified in charter)
270 Park Avenue
New York, NY 10017
(Address of principal executive offices) (Zip code)
Frank J. Nasta, Esq.
J.P. Morgan Investment Management Inc.
270 Park Avenue
New York, NY 10017
(Name and Address of Agent for Service)
With copies to:
| | | | |
| | Elizabeth A. Davin, Esq. | | Jon S. Rand Esq. |
| | JPMorgan Chase & Co. | | Dechert LLP |
| | 1111 Polaris Parkway | | 1095 Avenue of the Americas |
| | Columbus, OH 43240 | | New York, NY 10036 |
Registrant’s telephone number, including area code: (844) 457-6383
Date of fiscal year end: February, 28
Date of reporting period: March 1, 2016 through February 28, 2017
Form N-CSR is to be used by management investment companies to file reports with the Commission not later than 10 days after the transmission to stockholders of any report that is required to be transmitted to stockholders under Rule 30e-1 under the Investment Company Act of 1940 (17 CFR 270.30e-1). The Commission may use the information provided on Form N-CSR in its regulatory, disclosure review, inspection, and policymaking roles.
A registrant is required to disclose the information specified by Form N-CSR, and the Commission will make this information public. A registrant is not required to respond to the collection of information contained in Form N-CSR unless the Form displays a currently valid Office of Management and Budget (“OMB”) control number. Please direct comments concerning the accuracy of the information collection burden estimate and any suggestions for reducing the burden to Secretary, Securities and Exchange Commission, 450 Fifth Street, NW, Washington, DC 20549-0609. The OMB has reviewed this collection of information under the clearance requirements of 44 U.S.C. Section 3507.
| ITEM 1. | REPORTS TO STOCKHOLDERS. |
The following is a copy of the report transmitted to shareholders pursuant to Rule 30e-1 under the Investment Company Act of 1940 (17 CFR 270.30e-1).
Annual Report
JPMorgan Exchange-Traded Funds
February 28, 2017
JPMorgan Disciplined High Yield ETF
CONTENTS
Investments in the Fund are not bank deposits or obligations of, or guaranteed or endorsed by, any bank and are not insured or guaranteed by the FDIC, the Federal Reserve Board or any other government agency. You could lose money if you sell when the Fund’s share price is lower than when you invested.
Past performance is no guarantee of future performance. The general market views expressed in this report are opinions based on market and other conditions through the end of the reporting period and are subject to change without notice. These views are not intended to predict the future performance of the Fund or the securities markets. References to specific securities and their issuers are for illustrative purposes only and are not intended to be, and should not be interpreted as, recommendations to purchase or sell such securities. Such views are not meant as investment advice and may not be relied on as an indication of trading intent on behalf of the Fund.
Prospective investors should refer to the Fund’s prospectus for a discussion of the Fund’s investment objective, strategies and risks. Call J.P. Morgan Exchange-Traded Funds at (844) 457-6383 for a prospectus containing more complete information about a Fund, including management fees and other expenses. Please read it carefully before investing.
Shares are bought and sold throughout the day on an exchange at market price (not NAV) through a brokerage account, and are not individually redeemed from the Fund. Shares may only be redeemed directly from a Fund by Authorized Participants, in very large creation/redemption units. Brokerage commissions will reduce returns.
PRESIDENT’S LETTER
FEBRUARY 28, 2017 (UNAUDITED)
Dear Shareholders,
In the six months since its launch, the JPMorgan Disciplined High Yield ETF (the “Fund”) avoided the more speculative pockets within its investment universe in order to help maintain the value of the Fund’s portfolio in a period of heightened fixed-income volatility.
| | |
 | | “Our approach — applied with J.P. Morgan’s disciplined credit research — aims to capture the income potential of high yield bonds with less volatility than the benchmark.” |
The Fund participated in the broad rally in high yield bonds (also known as “junk bonds”) that marked the latter half of 2016 through early 2017, though not to the extent of the BofA Merrill Lynch High US Yield Index (the “Benchmark”). From the Fund’s inception on September 14, 2016 to February 28, 2017, the Fund returned 4.24% compared with 6.15% for the Benchmark.
The Benchmark included lower quality bonds, which generally outperformed higher quality high yield bonds during the reporting period. By contrast, the Fund typically invested in the higher rated bonds within the high yield universe. During the
period, it invested exclusively in higher quality issues, which the adviser believes will help protect value in adverse market conditions. In this context, the Fund’s relative performance reflects its methodology and multi-factor selection process.
Over the full cycle, we believe in an emphasis on quality, based on rigorous selection criteria.
Our approach — applied with J.P. Morgan’s disciplined credit research — aims to capture the income potential of high yield bonds with less volatility than the Benchmark. We believe this combination is one of the fundamental attractions of good fixed income investing: It diversifies core fixed income portfolios, helping to manage credit risk.
It also makes the Fund a valuable addition to our full suite of ETFs, which recently surpassed the billion-dollar mark in assets under management.
We are grateful for your belief in our firm and our investment process. If you have any questions, please visit www.jpmorganetfs.com or call J.P. Morgan Exchange-Traded Funds at 1-844-457-6383.

Robert F. Deutsch
President, J.P. Morgan Exchange-Traded Funds
J.P Morgan Asset Management
| | | | | | | | |
| | | |
| FEBRUARY 28, 2017 | | JPMORGAN EXCHANGE-TRADED FUNDS | | | | | 1 | |
JPMorgan Disciplined High Yield ETF
FUND COMMENTARY
FOR THE PERIOD SEPTEMBER 14, 2016 (FUND INCEPTION DATE) THROUGH FEBRUARY 28, 2017 (Unaudited)
| | | | |
| REPORTING PERIOD RETURN: | | | |
| JPMorgan Disciplined High Yield ETF* | | | 4.24% | |
| Market Price** | | | 4.64% | |
| BofA Merrill Lynch US High Yield Index | | | 6.15% | |
| Bloomberg Barclays US Aggregate Index | | | -1.59% | |
| |
| Net Assets as of 2/28/17 | | $ | 30,574,068 | |
| Duration as of 2/28/17 | | | 5.12 years | |
INVESTMENT OBJECTIVE***
The JPMorgan Disciplined High Yield ETF (the “Fund”) seeks to provide a high level of income. Capital appreciation is a secondary objective.
INVESTMENT APPROACH
The Fund invests in a diversified portfolio of high-yield securities (also called “junk bonds”), only in U.S. dollar-denominated investments of both domestic and foreign issuers.
HOW DID THE MARKET PERFORM?
High yield bonds generally outperformed investment grade corporate bonds and U.S. Treasury bonds during the reporting period. Stabilizing commodities prices, U.S. economic growth and the Republican Party’s control of both the presidency and the U.S. Congress provided support for high yield bonds.
HOW DID THE FUND PERFORM?
For the period September 14, 2016 to February 28, 2017, the Fund posted positive absolute performance, underperformed the BofA Merrill Lynch US High Yield Index (the “Benchmark”) and outperformed the Bloomberg Barclays US Aggregate Index (the “Index”). Relative to the Benchmark, the Fund’s underweight positions in bonds rated B and CCC detracted from performance as lower quality bonds generally outperformed higher quality bonds during the reporting period.
Relative to the Index, the Fund’s allocation to high yield bonds helped performance as high yield bonds generally outperformed other sectors of the bond market.
In terms of absolute performance, overall investor appetite for higher risk/higher yielding investments drove positive returns for high yield bonds.
HOW WAS THE FUND POSITIONED?
The Fund’s managers believe that bonds rated CCC generally have materially higher volatility and default risk than bonds rated BB and B, while providing inadequate incremental return
over a market cycle to justify the higher volatility. In addition, the managers believe bonds issued by private companies have had a materially higher probability of default than similarly-rated bonds issued by public companies. Relative to the Benchmark, the Fund’s largest average overweight allocation was in bonds rated BB and its largest average underweight allocation was in bonds rated CCC.
| | | | |
PORTFOLIO COMPOSITION BY SECTOR**** | |
| Consumer Discretionary | | | 24.9 | % |
| Energy | | | 14.4 | |
| Telecommunication Services | | | 12.4 | |
| Industrials | | | 9.3 | |
| Materials | | | 8.6 | |
| Information Technology | | | 8.2 | |
| Financials | | | 6.7 | |
| Health Care | | | 6.4 | |
| Consumer Staples | | | 3.1 | |
| Utilities | | | 2.9 | |
| Real Estate | | | 2.2 | |
| Short-Term Investment | | | 0.9 | |
| * | | The return shown is based on net asset value calculated for shareholder transactions and may differ from the return shown in the financial highlights, which reflects adjustments made to the net asset value in accordance with accounting principles generally accepted in the United States of America. The net asset value was $50.96 as of February 28, 2017. |
| ** | | Market price cumulative return is calculated assuming an initial investment made at the inception date net asset value, reinvestment of all dividends and distributions at market price during the period, and sale at the market price on the last day of the period. The price used to calculate the market price return is the midpoint of the bid/ask spread at the close of business on the Bats BZX Exchange, Inc. The midpoint price was $51.16 as of February 28, 2017. |
| *** | | The adviser seeks to achieve the Fund’s objective. There can be no guarantee it will be achieved. |
| **** | | Percentages indicated are based on total investments as of February 28, 2017. The Fund’s composition is subject to change. |
| | | | | | |
| | | |
| 2 | | | | JPMORGAN EXCHANGE-TRADED FUNDS | | FEBRUARY 28, 2017 |
AVERAGE ANNUAL TOTAL RETURNS AS OF FEBRUARY 28, 2017
| | | | | | | | |
| | | INCEPTION DATE | | | CUMULATIVE
SINCE INCEPTION | |
JPMorgan Disciplined High Yield ETF | | | | | | | | |
| Net Asset Value | | | September 14, 2016 | | | | 4.24 | % |
| Market Price | | | | | | | 4.64 | % |
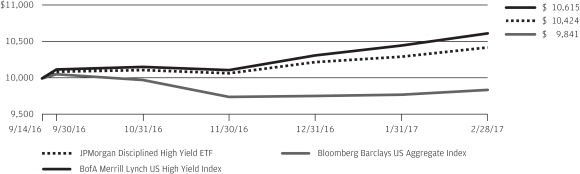
LIFE OF FUND PERFORMANCE (9/14/16 TO 2/28/17)
The performance quoted is past performance and is not a guarantee of future results. Exchange-traded funds are subject to certain market risks. Investment returns and principal value of an investment will fluctuate so that an investor’s shares, when sold or redeemed, may be worth more or less than their original cost. Current performance may be higher or lower than the performance data shown. For up-to-date, month-end performance information please call 1-844-457-6383.
Fund commenced operations on September 14, 2016.
The graph illustrates comparative performance for $10,000 invested in shares of the JPMorgan Disciplined High Yield ETF, the BofA Merrill Lynch US High Yield Index and the Bloomberg Barclays US Aggregate Index from September 14, 2016 to February 28, 2017. The performance of the Fund reflects the deduction of Fund expenses and assumes reinvestment of all dividends and capital gain distributions, if any. The performance of the BofA Merrill Lynch US High Yield Index and the Bloomberg Barclays US Aggregate Index does not reflect the deduction of expenses associated with an exchange-traded fund and has been adjusted to reflect reinvestment of all dividends and capital gain distributions of the securities included in the Index, if applicable. The BofA Merrill
Lynch US High Yield Index is an unmanaged index, which measures the performance of U.S. dollar denominated below investment grade corporate debt publicly issued in the U.S. domestic market. The Bloomberg Barclays US Aggregate Index is an unmanaged index that represents securities that are SEC-registered, taxable, and dollar denominated. The index covers the U.S. investment grade fixed rate bond market, with index components for government and corporate securities, mortgage pass-through securities, and asset-backed securities. Investors cannot invest directly in an index.
Fund performance reflects the partial waiver of the Fund’s fees and reimbursement of expenses for certain periods since the inception date. Without these waivers and reimbursements, performance would have been lower. Also, performance shown in this section does not reflect the deduction of taxes that a shareholder may pay on Fund distributions or redemption or sale of Fund shares.
The returns shown are based on net asset values calculated for shareholder transactions and may differ from the returns shown in the financial highlights, which reflect adjustments made to the net asset values in accordance with accounting principles generally accepted in the United States of America.
| | | | | | | | |
| | | |
| FEBRUARY 28, 2017 | | JPMORGAN EXCHANGE-TRADED FUNDS | | | | | 3 | |
JPMorgan Disciplined High Yield ETF
SCHEDULE OF PORTFOLIO INVESTMENTS
AS OF FEBRUARY 28, 2017
| | | | | | | | |
PRINCIPAL AMOUNT($) | | | SECURITY DESCRIPTION | | VALUE($) | |
| | Corporate Bonds — 97.6% | | | | |
| | | | Consumer Discretionary — 24.5% | | | | |
| | | | Auto Components — 1.0% | | | | |
| | 90,000 | | | Goodyear Tire & Rubber Co. (The),
5.125%, 11/15/23 | | | 93,420 | |
| | 200,000 | | | Schaeffler Finance BV MTN (Netherlands), 4.250%, 05/15/21 (a) | | | 204,080 | |
| | | | | | | | |
| | | | | | | 297,500 | |
| | | | | | | | |
| | | | Automobile — 1.3% | | | | |
| | 200,000 | | | Fiat Chrysler Automobiles NV (Netherlands), 5.250%, 04/15/23 | | | 207,250 | |
| | 200,000 | | | Jaguar Land Rover Automotive plc (United Kingdom), 4.125%, 12/15/18 (a) | | | 204,050 | |
| | | | | | | | |
| | | | | | | 411,300 | |
| | | | | | | | |
| | | | Diversified Consumer Services — 0.3% | | | | |
| | 75,000 | | | Service Corp. International,
5.375%, 05/15/24 | | | 79,455 | |
| | | | | | | | |
| | | | Diversified Telecommunication
Services — 4.3% | | | | |
| | | | Altice Financing S.A. (Luxembourg), | | | | |
| | 200,000 | | | 6.625%, 02/15/23 (a) | | | 210,500 | |
| | 250,000 | | | 7.500%, 05/15/26 (a) | | | 268,437 | |
| | | | CCO Holdings LLC/CCO Holdings Capital Corp., | | | | |
| | 63,000 | | | 5.500%, 05/01/26 (a) | | | 66,859 | |
| | 230,000 | | | 5.750%, 02/15/26 (a) | | | 246,100 | |
| | 100,000 | | | 5.875%, 04/01/24 (a) | | | 107,250 | |
| | 200,000 | | | UPCB Finance IV Ltd. (Cayman Islands), 5.375%, 01/15/25 (a) | | | 204,500 | |
| | 200,000 | | | Virgin Media Secured Finance plc (United Kingdom), 5.250%, 01/15/26 (a) | | | 202,250 | |
| | | | | | | | |
| | | | | | | 1,305,896 | |
| | | | | | | | |
| | | | Equity Real Estate Investment
Trust (REITs) — 0.3% | | | | |
| | 95,000 | | | MGM Growth Properties Operating Partnership LP/MGP Finance Co-Issuer, Inc.,
5.625%, 05/01/24 (a) | | | 100,462 | |
| | | | | | | | |
| | | | Home Builders — 0.2% | | | | |
| | 25,000 | | | Brookfield Residential Properties, Inc./Brookfield Residential U.S. Corp. (Canada), 6.125%, 07/01/22 (a) | | | 25,750 | |
| | 26,000 | | | Taylor Morrison Communities, Inc./Monarch Communities, Inc., 5.250%, 04/15/21 (a) | | | 26,650 | |
| | | | | | | | |
| | | | | | | 52,400 | |
| | | | | | | | |
| | | | | | | | |
PRINCIPAL AMOUNT($) | | | SECURITY DESCRIPTION | | VALUE($) | |
| | | | Hotels, Restaurants & Leisure — 5.3% | | | | |
| | | | 1011778 B.C. ULC/New Red Finance, Inc. (Canada), | | | | |
| | 55,000 | | | 4.625%, 01/15/22 (a) | | | 56,581 | |
| | 205,000 | | | 6.000%, 04/01/22 (a) | | | 213,774 | |
| | | | Boyd Gaming Corp., | | | | |
| | 26,000 | | | 6.375%, 04/01/26 | | | 28,113 | |
| | 65,000 | | | 6.875%, 05/15/23 | | | 70,200 | |
| | 115,000 | | | ESH Hospitality, Inc., 5.250%, 05/01/25 (a) | | | 116,006 | |
| | 90,000 | | | Hilton Domestic Operating Co., Inc.,
4.250%, 09/01/24 (a) | | | 89,010 | |
| | 135,000 | | | Hilton Worldwide Finance LLC/Hilton Worldwide Finance Corp.,
5.625%, 10/15/21 | | | 139,004 | |
| | 200,000 | | | International Game Technology plc (United Kingdom), 6.250%, 02/15/22 (a) | | | 216,000 | |
| | | | KFC Holding Co./Pizza Hut Holdings LLC/Taco Bell of America LLC, | | | | |
| | 38,000 | | | 5.000%, 06/01/24 (a) | | | 39,011 | |
| | 95,000 | | | 5.250%, 06/01/26 (a) | | | 98,206 | |
| | | | MGM Resorts International, | | | | |
| | 46,000 | | | 6.000%, 03/15/23 | | | 50,140 | |
| | 115,000 | | | 6.625%, 12/15/21 | | | 128,369 | |
| | 26,000 | | | NCL Corp. Ltd. (Bermuda),
4.750%, 12/15/21 (a) | | | 26,553 | |
| | 60,000 | | | Royal Caribbean Cruises Ltd. (Liberia), 5.250%, 11/15/22 | | | 67,182 | |
| | 70,000 | | | Six Flags Entertainment Corp.,
5.250%, 01/15/21 (a) | | | 71,960 | |
| | | | Wynn Las Vegas LLC/Wynn Las Vegas Capital Corp., | | | | |
| | 32,000 | | | 5.375%, 03/15/22 | | | 32,880 | |
| | 165,000 | | | 5.500%, 03/01/25 (a) | | | 167,475 | |
| | | | | | | | |
| | | | | | | 1,610,464 | |
| | | | | | | | |
| | | | Household Durables — 1.0% | | | | |
| | 55,000 | | | Brookfield Residential Properties, Inc. (Canada), 6.500%, 12/15/20 (a) | | | 56,617 | |
| | 50,000 | | | CalAtlantic Group, Inc., 8.375%, 05/15/18 | | | 53,438 | |
| | | | Lennar Corp., | | | | |
| | 55,000 | | | 4.500%, 11/15/19 | | | 56,856 | |
| | 27,000 | | | 4.750%, 11/15/22 | | | 27,769 | |
| | | | PulteGroup, Inc., | | | | |
| | 26,000 | | | 4.250%, 03/01/21 | | | 26,611 | |
| | 60,000 | | | 5.500%, 03/01/26 | | | 62,250 | |
| | 40,000 | | | Tempur Sealy International, Inc.,
5.500%, 06/15/26 | | | 39,150 | |
| | | | | | | | |
| | | | | | | 322,691 | |
| | | | | | | | |
SEE NOTES TO FINANCIAL STATEMENTS.
| | | | | | |
| | | |
| 4 | | | | JPMORGAN EXCHANGE-TRADED FUNDS | | FEBRUARY 28, 2017 |
| | | | | | | | |
PRINCIPAL AMOUNT($) | | | SECURITY DESCRIPTION | | VALUE($) | |
| | Corporate Bonds — continued | | | | |
| | | | Internet & Direct Marketing Retail — 0.4% | | | | |
| | | | Netflix, Inc., | | | | |
| | 25,000 | | | 4.375%, 11/15/26 (a) | | | 24,781 | |
| | 26,000 | | | 5.500%, 02/15/22 | | | 27,755 | |
| | 70,000 | | | 5.875%, 02/15/25 | | | 75,950 | |
| | | | | | | | |
| | | | | | | 128,486 | |
| | | | | | | | |
| | | | Media — 7.8% | | | | |
| | 200,000 | | | Altice US Finance I Corp.,
5.500%, 05/15/26 (a) | | | 206,750 | |
| | 25,000 | | | AMC Entertainment Holdings, Inc.,
5.750%, 06/15/25 | | | 25,906 | |
| | 90,000 | | | AMC Networks, Inc., 5.000%, 04/01/24 | | | 90,844 | |
| | 65,000 | | | Cinemark USA, Inc., 4.875%, 06/01/23 | | | 66,625 | |
| | | | Clear Channel Worldwide Holdings, Inc., | | | | |
| | 180,000 | | | Series B, 6.500%, 11/15/22 | | | 186,412 | |
| | 70,000 | | | Series B, 7.625%, 03/15/20 | | | 70,525 | |
| | | | CSC Holdings LLC, | | | | |
| | 200,000 | | | 10.125%, 01/15/23 (a) | | | 231,500 | |
| | 200,000 | | | 10.875%, 10/15/25 (a) | | | 241,000 | |
| | | | DISH DBS Corp., | | | | |
| | 100,000 | | | 5.875%, 07/15/22 | | | 107,188 | |
| | 74,000 | | | 5.875%, 11/15/24 | | | 78,995 | |
| | 180,000 | | | 6.750%, 06/01/21 | | | 197,550 | |
| | 80,000 | | | Nexstar Broadcasting, Inc., 5.625%, 08/01/24 (a) | | | 81,800 | |
| | 75,000 | | | Quebecor Media, Inc. (Canada), 5.750%, 01/15/23 | | | 79,969 | |
| | 70,000 | | | Regal Entertainment Group, 5.750%, 03/15/22 | | | 73,237 | |
| | 55,000 | | | Sinclair Television Group, Inc., 5.375%, 04/01/21 | | | 56,650 | |
| | | | Sirius XM Radio, Inc., | | | | |
| | 36,000 | | | 5.375%, 04/15/25 (a) | | | 36,822 | |
| | 135,000 | | | 6.000%, 07/15/24 (a) | | | 143,775 | |
| | 25,000 | | | TEGNA Inc., 6.375%, 10/15/23 | | | 26,625 | |
| | 200,000 | | | Unitymedia Hessen GmbH & Co. KG/Unitymedia NRW GmbH (Germany), 5.500%, 01/15/23 (a) | | | 209,000 | |
| | 28,000 | | | Videotron Ltd. (Canada), 5.000%, 07/15/22 | | | 29,470 | |
| | 150,000 | | | Ziggo Secured Finance BV (Netherlands), 5.500%, 01/15/27 (a) | | | 151,875 | |
| | | | | | | | |
| | | | | | | 2,392,518 | |
| | | | | | | | |
| | | | Multiline Retail — 0.8% | | | | |
| | 230,000 | | | Dollar Tree, Inc., 5.750%, 03/01/23 | | | 243,225 | |
| | | | | | | | |
| | | | Retail Consumer Discretionary — 0.3% | | | | |
| | | | QVC, Inc., | | | | |
| | 65,000 | | | 4.375%, 03/15/23 | | | 65,620 | |
| | 25,000 | | | 4.850%, 04/01/24 | | | 25,473 | |
| | | | | | | | |
| | | | | | | 91,093 | |
| | | | | | | | |
| | | | | | | | |
PRINCIPAL AMOUNT($) | | | SECURITY DESCRIPTION | | VALUE($) | |
| | | | | | | | |
| | | | Specialty Retail — 0.8% | | | | |
| | | | L Brands, Inc., | | | | |
| | 38,000 | | | 5.625%, 02/15/22 | | | 40,137 | |
| | 90,000 | | | 6.625%, 04/01/21 | | | 99,000 | |
| | | | Sally Holdings LLC/Sally Capital, Inc., | | | | |
| | 26,000 | | | 5.625%, 12/01/25 | | | 26,455 | |
| | 75,000 | | | 5.750%, 06/01/22 | | | 77,250 | |
| | | | | | | | |
| | | | | | | 242,842 | |
| | | | | | | | |
| | | | Textiles, Apparel & Luxury Goods — 0.4% | | | | |
| | | | Hanesbrands, Inc., | | | | |
| | 32,000 | | | 4.625%, 05/15/24 (a) | | | 31,720 | |
| | 80,000 | | | 4.875%, 05/15/26 (a) | | | 79,200 | |
| | | | | | | | |
| | | | | | | 110,920 | |
| | | | | | | | |
| | | | Wireless Telecommunication Service — 0.3% | | | | |
| | 100,000 | | | Inmarsat Finance plc (United Kingdom), 4.875%, 05/15/22 (a) | | | 100,000 | |
| | | | | | | | |
| | | | Total Consumer Discretionary | | | 7,489,252 | |
| | | | | | | | |
| | | | Consumer Staples — 3.1% | | | | |
| | | | Beverages — 0.2% | | | | |
| | 55,000 | | | Cott Beverages, Inc., 6.750%, 01/01/20 | | | 56,856 | |
| | | | | | | | |
| | | | Food & Staples Retailing — 1.0% | | | | |
| | | | Rite Aid Corp., | | | | |
| | 165,000 | | | 6.125%, 04/01/23 (a) | | | 174,842 | |
| | 32,000 | | | 9.250%, 03/15/20 | | | 33,040 | |
| | 105,000 | | | Tesco plc (United Kingdom),
6.150%, 11/15/37 (a) | | | 106,897 | |
| | | | | | | | |
| | | | | | | 314,779 | |
| | | | | | | | |
| | | | Food Products — 0.9% | | | | |
| | | | Lamb Weston Holdings, Inc., | | | | |
| | 16,000 | | | 4.625%, 11/01/24 (a) | | | 16,280 | |
| | 16,000 | | | 4.875%, 11/01/26 (a) | | | 16,248 | |
| | 160,000 | | | Post Holdings, Inc., 5.000%, 08/15/26 (a) | | | 154,100 | |
| | 70,000 | | | TreeHouse Foods, Inc.,
6.000%, 02/15/24 (a) | | | 73,675 | |
| | | | | | | | |
| | | | | | | 260,303 | |
| | | | | | | | |
| | | | Household Products — 0.7% | | | | |
| | | | HRG Group, Inc., | | | | |
| | 32,000 | | | 7.750%, 01/15/22 | | | 33,840 | |
| | 75,000 | | | 7.875%, 07/15/19 | | | 77,906 | |
| | 90,000 | | | Spectrum Brands, Inc., 5.750%, 07/15/25 | | | 95,814 | |
| | | | | | | | |
| | | | | | | 207,560 | |
| | | | | | | | |
| | | | Personal Products — 0.3% | | | | |
| | 40,000 | | | Avon International Operations, Inc., 7.875%, 08/15/22 (a) | | | 42,546 | |
| | 55,000 | | | Edgewell Personal Care Co., 4.700%, 05/19/21 | | | 58,263 | |
| | | | | | | | |
| | | | | | | 100,809 | |
| | | | | | | | |
| | | | Total Consumer Staples | | | 940,307 | |
| | | | | | | | |
SEE NOTES TO FINANCIAL STATEMENTS.
| | | | | | | | |
| | | |
| FEBRUARY 28, 2017 | | JPMORGAN EXCHANGE-TRADED FUNDS | | | | | 5 | |
JPMorgan Disciplined High Yield ETF
SCHEDULE OF PORTFOLIO INVESTMENTS
AS OF FEBRUARY 28, 2017 (continued)
| | | | | | | | |
PRINCIPAL AMOUNT($) | | | SECURITY DESCRIPTION | | VALUE($) | |
| | Corporate Bonds — continued | | | | |
| | | | Energy — 14.2% | | | | |
| | | | Energy Equipment & Services — 1.4% | | | | |
| | | | Ensco plc (United Kingdom), | | | | |
| | 38,000 | | | 5.750%, 10/01/44 | | | 29,640 | |
| | 36,000 | | | 8.000%, 01/31/24 (a) | | | 36,900 | |
| | | | Nabors Industries, Inc., | | | | |
| | 26,000 | | | 5.000%, 09/15/20 | | | 27,157 | |
| | 85,000 | | | 6.150%, 02/15/18 | | | 88,612 | |
| | 70,000 | | | SESI LLC, 7.125%, 12/15/21 | | | 71,925 | |
| | | | Transocean, Inc. (Cayman Islands), | | | | |
| | 28,000 | | | 6.000%, 03/15/18 | | | 28,700 | |
| | 40,000 | | | 6.800%, 03/15/38 | | | 32,800 | |
| | 115,000 | | | 9.000%, 07/15/23 (a) | | | 123,912 | |
| | | | | | | | |
| | | | | | | 439,646 | |
| | | | | | | | |
| | | | Oil & Gas Service & Equipment — 0.1% | | | | |
| | 27,000 | | | Rowan Co., Inc., 4.875%, 06/01/22 | | | 25,785 | |
| | | | | | | | |
| | | | Oil, Gas & Consumable Fuels — 12.4% | | | | |
| | | | Antero Resources Corp., | | | | |
| | 100,000 | | | 5.125%, 12/01/22 | | | 100,500 | |
| | 100,000 | | | 5.375%, 11/01/21 | | | 102,250 | |
| | 40,000 | | | 5.625%, 06/01/23 | | | 40,500 | |
| | | | Carrizo Oil & Gas, Inc., | | | | |
| | 55,000 | | | 6.250%, 04/15/23 | | | 55,688 | |
| | 35,000 | | | 7.500%, 09/15/20 | | | 36,138 | |
| | | | Cenovus Energy, Inc. (Canada), | | | | |
| | 48,000 | | | 5.700%, 10/15/19 | | | 51,628 | |
| | 125,000 | | | 6.750%, 11/15/39 | | | 141,287 | |
| | | | Cheniere Corpus Christi Holdings LLC, | | | | |
| | 54,000 | | | 5.875%, 03/31/25 (a) | | | 57,105 | |
| | 115,000 | | | 7.000%, 06/30/24 (a) | | | 128,800 | |
| | 220,000 | | | Chesapeake Energy Corp., 8.000%, 12/15/22 (a) | | | 232,650 | |
| | | | Concho Resources, Inc., | | | | |
| | 25,000 | | | 5.500%, 10/01/22 | | | 25,875 | |
| | 140,000 | | | 5.500%, 04/01/23 | | | 144,900 | |
| | 170,000 | | | CONSOL Energy, Inc., 5.875%, 04/15/22 | | | 165,750 | |
| | | | Continental Resources, Inc., | | | | |
| | 36,000 | | | 3.800%, 06/01/24 | | | 33,345 | |
| | 100,000 | | | 4.500%, 04/15/23 | | | 97,937 | |
| | 180,000 | | | 5.000%, 09/15/22 | | | 183,600 | |
| | 39,000 | | | Crestwood Midstream Partners LP/Crestwood Midstream Finance Corp., 6.250%, 04/01/23 | | | 40,463 | |
| | 35,000 | | | DCP Midstream Operating LP, 5.350%, 03/15/20 (a) | | | 36,663 | |
| | | | | | | | |
PRINCIPAL AMOUNT($) | | | SECURITY DESCRIPTION | | VALUE($) | |
| | | | | | | | |
| | | | Oil, Gas & Consumable Fuels — continued | | | | |
| | | | Energy Transfer Equity LP, | | | | |
| | 25,000 | | | 5.500%, 06/01/27 | | | 26,469 | |
| | 100,000 | | | 5.875%, 01/15/24 | | | 107,500 | |
| | 105,000 | | | 7.500%, 10/15/20 | | | 117,994 | |
| | 65,000 | | | EnLink Midstream Partners LP, 4.150%, 06/01/25 | | | 64,952 | |
| | 65,000 | | | Genesis Energy LP/Genesis Energy Finance Corp., 6.750%, 08/01/22 | | | 67,762 | |
| | 35,000 | | | Gulfport Energy Corp., 6.000%, 10/15/24 (a) | | | 34,825 | |
| | | | MEG Energy Corp. (Canada), | | | | |
| | 39,000 | | | 6.375%, 01/30/23 (a) | | | 34,612 | |
| | 26,000 | | | 6.500%, 01/15/25 (a) | | | 25,415 | |
| | 45,000 | | | 7.000%, 03/31/24 (a) | | | 40,500 | |
| | 30,000 | | | Murphy Oil Corp., 6.875%, 08/15/24 | | | 32,115 | |
| | | | Newfield Exploration Co., | | | | |
| | 90,000 | | | 5.625%, 07/01/24 | | | 96,300 | |
| | 26,000 | | | 5.750%, 01/30/22 | | | 27,755 | |
| | 100,000 | | | Oasis Petroleum Inc., 6.875%, 03/15/22 | | | 102,000 | |
| | 35,000 | | | Parsley Energy LLC/Parsley Finance Corp., 5.375%, 01/15/25 (a) | | | 35,525 | |
| | | | QEP Resources, Inc., | | | | |
| | 35,000 | | | 5.250%, 05/01/23 | | | 34,475 | |
| | 55,000 | | | 6.875%, 03/01/21 | | | 58,162 | |
| | | | Range Resources Corp., | | | | |
| | 65,000 | | | 4.875%, 05/15/25 | | | 61,587 | |
| | 40,000 | | | 5.000%, 03/15/23 (a) | | | 38,750 | |
| | 80,000 | | | Rice Energy, Inc., 6.250%, 05/01/22 | | | 81,600 | |
| | 26,000 | | | RSP Permian, Inc., 6.625%, 10/01/22 | | | 27,495 | |
| | 60,000 | | | Seven Generations Energy Ltd. (Canada), 8.250%, 05/15/20 (a) | | | 63,150 | |
| | 30,000 | | | SM Energy Co., 6.125%, 11/15/22 | | | 30,225 | |
| | | | Southwestern Energy Co., | | | | |
| | 36,000 | | | 4.100%, 03/15/22 | | | 31,995 | |
| | 90,000 | | | 4.950%, 01/23/25 | | | 86,400 | |
| | | | Sunoco LP/Sunoco Finance Corp., | | | | |
| | 70,000 | | | 6.250%, 04/15/21 | | | 71,050 | |
| | 28,000 | | | 6.375%, 04/01/23 | | | 28,350 | |
| | | | Targa Resources Partners LP/Targa Resources Partners Finance Corp., | | | | |
| | 65,000 | | | 4.125%, 11/15/19 | | | 66,137 | |
| | 35,000 | | | 6.750%, 03/15/24 | | | 38,238 | |
| | | | Tesoro Corp., | | | | |
| | 40,000 | | | 4.750%, 12/15/23 (a) | | | 41,400 | |
| | 26,000 | | | 5.125%, 12/15/26 (a) | | | 27,495 | |
SEE NOTES TO FINANCIAL STATEMENTS.
| | | | | | |
| | | |
| 6 | | | | JPMORGAN EXCHANGE-TRADED FUNDS | | FEBRUARY 28, 2017 |
| | | | | | | | |
PRINCIPAL AMOUNT($) | | | SECURITY DESCRIPTION | | VALUE($) | |
| | Corporate Bonds — continued | | | | |
| | | | Oil, Gas & Consumable Fuels — continued | | | | |
| | | | Tesoro Logistics LP/Tesoro Logistics Finance Corp., | | | | |
| | 28,000 | | | 6.125%, 10/15/21 | | | 29,225 | |
| | 70,000 | | | 6.250%, 10/15/22 | | | 74,900 | |
| | | | Whiting Petroleum Corp., | | | | |
| | 85,000 | | | 5.000%, 03/15/19 | | | 85,744 | |
| | 32,000 | | | 5.750%, 03/15/21 | | | 31,840 | |
| | | | Williams Co., Inc. (The), | | | | |
| | 30,000 | | | 3.700%, 01/15/23 | | | 29,400 | |
| | 115,000 | | | 4.550%, 06/24/24 | | | 116,725 | |
| | | | WPX Energy, Inc., | | | | |
| | 100,000 | | | 6.000%, 01/15/22 | | | 102,375 | |
| | 30,000 | | | 8.250%, 08/01/23 | | | 33,712 | |
| | | | | | | | |
| | | | | | | 3,779,233 | |
| | | | | | | | |
| | | | Refining & Marketing — 0.2% | | | | |
| | 60,000 | | | PBF Holding Co. LLC/PBF Finance Corp., 8.250%, 02/15/20 | | | 61,350 | |
| | | | | | | | |
| | | | Utilities — 0.1% | | | | |
| | 40,000 | | | NGL Energy Partners LP/NGL Energy Finance Corp., 7.500%, 11/01/23 (a) | | | 42,100 | |
| | | | | | | | |
| | | | Total Energy | | | 4,348,114 | |
| | | | | | | | |
| | | | Financials — 6.7% | | | | |
| | | | Banks — 4.1% | | | | |
| | 100,000 | | | Credit Agricole S.A. (France), VAR, 8.375%, 10/31/19 (a) (d) | | | 110,500 | |
| | 180,000 | | | Lloyds Bank plc (United Kingdom), VAR, 12.000%, 12/16/24 (a) (d) | | | 241,830 | |
| | | | CIT Group, Inc., | | | | |
| | 46,000 | | | 5.000%, 08/15/22 | | | 48,760 | |
| | 25,000 | | | 5.250%, 03/15/18 | | | 25,834 | |
| | 160,000 | | | 5.500%, 02/15/19 (a) | | | 168,501 | |
| | 100,000 | | | Dresdner Funding Trust I, 8.151%, 06/30/31 (a) | | | 117,750 | |
| | 200,000 | | | Intesa Sanpaolo SpA MTN (Italy), 5.017%, 06/26/24 (a) | | | 188,142 | |
| | | | Royal Bank of Scotland Group plc (United Kingdom), | | | | |
| | 100,000 | | | 5.125%, 05/28/24 | | | 101,215 | |
| | 25,000 | | | 6.000%, 12/19/23 | | | 26,547 | |
| | 205,000 | | | 6.125%, 12/15/22 | | | 217,933 | |
| | | | | | | | |
| | | | | | | 1,247,012 | |
| | | | | | | | |
| | | | Capital Markets — 0.3% | | | | |
| | 70,000 | | | MSCI, Inc., 5.250%, 11/15/24 (a) | | | 73,850 | |
| | | | | | | | |
| | | | | | | | |
PRINCIPAL AMOUNT($) | | | SECURITY DESCRIPTION | | VALUE($) | |
| | | | | | | | |
| | | | Consumer Finance — 1.6% | | | | |
| | | | Navient Corp. MTN, | | | | |
| | 54,000 | | | 8.000%, 03/25/20 | | | 58,583 | |
| | 195,000 | | | 8.450%, 06/15/18 | | | 208,406 | |
| | | | OneMain Financial Holdings LLC, | | | | |
| | 26,000 | | | 6.750%, 12/15/19 (a) | | | 27,219 | |
| | 70,000 | | | 7.250%, 12/15/21 (a) | | | 73,150 | |
| | | | Springleaf Finance Corp., | | | | |
| | 26,000 | | | 5.250%, 12/15/19 | | | 26,162 | |
| | 90,000 | | | 8.250%, 12/15/20 | | | 98,888 | |
| | | | | | | | |
| | | | | | | 492,408 | |
| | | | | | | | |
| | | | Diversified Financial Services — 0.2% | | | | |
| | 65,000 | | | Leucadia National Corp., 5.500%, 10/18/23 | | | 69,128 | |
| | | | | | | | |
| | | | Financial Services — 0.5% | | | | |
| | 125,000 | | | Goldman Sachs Capital I, 6.345%, 02/15/34 | | | 150,978 | |
| | | | | | | | |
| | | | Total Financials | | | 2,033,376 | |
| | | | | | | | |
| | | | Health Care — 6.3% | | | | |
| | | | Health Care Equipment & Supplies — 0.6% | | | | |
| | 90,000 | | | Hologic, Inc., 5.250%, 07/15/22 (a) | | | 93,825 | |
| | | | Mallinckrodt International Finance S.A./Mallinckrodt CB LLC (Luxembourg), | | | | |
| | 26,000 | | | 5.625%, 10/15/23 (a) | | | 24,960 | |
| | 80,000 | | | 5.750%, 08/01/22 (a) | | | 78,400 | |
| | | | | | | | |
| | | | | | | 197,185 | |
| | | | | | | | |
| | | | Health Care Providers & Services — 5.1% | | | | |
| | 55,000 | | | Acadia Healthcare Co., Inc., 5.625%, 02/15/23 | | | 57,200 | |
| | | | Centene Corp., | | | | |
| | 44,000 | | | 4.750%, 01/15/25 | | | 45,265 | |
| | 125,000 | | | 5.625%, 02/15/21 | | | 131,563 | |
| | | | DaVita, Inc., | | | | |
| | 54,000 | | | 5.000%, 05/01/25 | | | 54,334 | |
| | 160,000 | | | 5.125%, 07/15/24 | | | 163,300 | |
| | | | Envision Healthcare Corp., | | | | |
| | 26,000 | | | 5.125%, 07/01/22 (a) | | | 26,617 | |
| | 100,000 | | | 5.625%, 07/15/22 | | | 104,125 | |
| | | | Fresenius Medical Care US Finance II, Inc., | | | | |
| | 70,000 | | | 5.625%, 07/31/19 (a) | | | 74,725 | |
| | 26,000 | | | 5.875%, 01/31/22 (a) | | | 28,373 | |
| | | | HCA, Inc., | | | | |
| | 25,000 | | | 5.000%, 03/15/24 | | | 26,344 | |
| | 96,000 | | | 5.375%, 02/01/25 | | | 100,440 | |
| | 275,000 | | | 6.500%, 02/15/20 | | | 301,757 | |
| | 110,000 | | | HealthSouth Corp., 5.750%, 11/01/24 | | | 112,200 | |
SEE NOTES TO FINANCIAL STATEMENTS.
| | | | | | | | |
| | | |
| FEBRUARY 28, 2017 | | JPMORGAN EXCHANGE-TRADED FUNDS | | | | | 7 | |
JPMorgan Disciplined High Yield ETF
SCHEDULE OF PORTFOLIO INVESTMENTS
AS OF FEBRUARY 28, 2017 (continued)
| | | | | | | | |
PRINCIPAL AMOUNT($) | | | SECURITY DESCRIPTION | | VALUE($) | |
| | Corporate Bonds — continued | | | | |
| | | | Health Care Providers & Services — continued | | | | |
| | 100,000 | | | LifePoint Health, Inc., 5.500%, 12/01/21 | | | 104,062 | |
| | | | Tenet Healthcare Corp., | | | | |
| | 165,000 | | | 6.000%, 10/01/20 | | | 174,900 | |
| | 38,000 | | | 6.250%, 11/01/18 | | | 40,233 | |
| | | | | | | | |
| | | | | | | 1,545,438 | |
| | | | | | | | |
| | | | Pharmaceuticals — 0.6% | | | | |
| | 200,000 | | | Endo Ltd./Endo Finance LLC/Endo Finco, Inc. (Ireland), 6.000%, 07/15/23(a) | | | 184,000 | |
| | | | | | | | |
| | | | Total Health Care | | | 1,926,623 | |
| | | | | | | | |
| | | | Industrials — 9.2% | | | | |
| | | | Aerospace & Defense — 2.4% | | | | |
| | | | Arconic, Inc., | | | | |
| | 46,000 | | | 5.125%, 10/01/24 | | | 47,495 | |
| | 115,000 | | | 5.400%, 04/15/21 | | | 123,176 | |
| | | | Bombardier, Inc. (Canada), | | | | |
| | 135,000 | | | 7.500%, 03/15/25 (a) | | | 139,894 | |
| | 52,000 | | | 8.750%, 12/01/21 (a) | | | 57,590 | |
| | | | Huntington Ingalls Industries, Inc., | | | | |
| | 25,000 | | | 5.000%, 12/15/21 (a) | | | 26,125 | |
| | 55,000 | | | 5.000%, 11/15/25 (a) | | | 57,813 | |
| | 110,000 | | | KLX, Inc., 5.875%, 12/01/22 (a) | | | 115,797 | |
| | | | TransDigm, Inc., | | | | |
| | 42,000 | | | 6.000%, 07/15/22 | | | 43,207 | |
| | 110,000 | | | 6.500%, 07/15/24 | | | 113,575 | |
| | | | | | | | |
| | | | | | | 724,672 | |
| | | | | | | | |
| | | | Air Freight & Logistics — 0.5% | | | | |
| | 145,000 | | | XPO Logistics, Inc., 6.500%, 06/15/22 (a) | | | 152,250 | |
| | | | | | | | |
| | | | Airlines — 0.2% | | | | |
| | 65,000 | | | American Airlines Group, Inc., 5.500%, 10/01/19 (a) | | | 67,438 | |
| | | | | | | | |
| | | | Auto Components — 0.8% | | | | |
| | | | Icahn Enterprises LP/Icahn Enterprises Finance Corp., | | | | |
| | 46,000 | | | 4.875%, 03/15/19 | | | 46,747 | |
| | 25,000 | | | 5.875%, 02/01/22 | | | 25,500 | |
| | 155,000 | | | 6.000%, 08/01/20 | | | 161,202 | |
| | | | | | | | |
| | | | | | | 233,449 | |
| | | | | | | | |
| | | | Commercial Services & Supplies — 0.6% | | | | |
| | | | Clean Harbors, Inc., | | | | |
| | 75,000 | | | 5.125%, 06/01/21 | | | 76,687 | |
| | 28,000 | | | 5.250%, 08/01/20 | | | 28,602 | |
| | 90,000 | | | West Corp., 5.375%, 07/15/22 (a) | | | 86,445 | |
| | | | | | | | |
| | | | | | | 191,734 | |
| | | | | | | | |
| | | | | | | | |
PRINCIPAL AMOUNT($) | | | SECURITY DESCRIPTION | | VALUE($) | |
| | | | | |
| | | | Construction & Engineering — 0.5% | | | | |
| | | | AECOM, | | | | |
| | 64,000 | | | 5.125%, 03/15/27 (a) | | | 65,034 | |
| | 28,000 | | | 5.750%, 10/15/22 | | | 29,505 | |
| | 70,000 | | | 5.875%, 10/15/24 | | | 76,475 | |
| | | | | | | | |
| | | | | | | 171,014 | |
| | | | | | | | |
| | | | Electrical Equipment — 0.8% | | | | |
| | 26,000 | | | Sensata Technologies BV (Netherlands), 5.000%, 10/01/25 (a) | | | 26,390 | |
| | 200,000 | | | Sensata Technologies UK Financing Co. plc (United Kingdom), 6.250%, 02/15/26 (a) | | | 215,500 | |
| | | | | | | | |
| | | | | | | 241,890 | |
| | | | | | | | |
| | | | Machinery — 0.3% | | | | |
| | | | CNH Industrial Capital LLC, | | | | |
| | 25,000 | | | 3.625%, 04/15/18 | | | 25,438 | |
| | 55,000 | | | 4.375%, 11/06/20 | | | 57,200 | |
| | | | | | | | |
| | | | | | | 82,638 | |
| | | | | | | | |
| | | | Media — 0.8% | | | | |
| | | | Nielsen Finance LLC/Nielsen Finance Co., | | | | |
| | 28,000 | | | 4.500%, 10/01/20 | | | 28,560 | |
| | 210,000 | | | 5.000%, 04/15/22 (a) | | | 215,775 | |
| | | | | | | | |
| | | | | | | 244,335 | |
| | | | | | | | |
| | | | Road & Rail — 1.5% | | | | |
| | 200,000 | | | Ashtead Capital, Inc., 6.500%, 07/15/22 (a) | | | 209,181 | |
| | 60,000 | | | Avis Budget Car Rental LLC/Avis Budget Finance, Inc., 5.500%, 04/01/23 | | | 60,000 | |
| | 80,000 | | | Florida East Coast Holdings Corp., 6.750%, 05/01/19 (a) | | | 82,300 | |
| | 120,000 | | | Hertz Corp. (The), 5.500%, 10/15/24 (a) | | | 108,300 | |
| | | | | | | | |
| | | | | | | 459,781 | |
| | | | | | | | |
| | | | Trading Companies & Distributors — 0.8% | | | | |
| | | | HD Supply, Inc., | | | | |
| | 115,000 | | | 5.250%, 12/15/21 (a) | | | 121,325 | |
| | 36,000 | | | 5.750%, 04/15/24 (a) | | | 38,070 | |
| | | | United Rentals North America, Inc., | | | | |
| | 36,000 | | | 4.625%, 07/15/23 | | | 36,954 | |
| | 42,000 | | | 6.125%, 06/15/23 | | | 44,100 | |
| | | | | | | | |
| | | | | | | 240,449 | |
| | | | | | | | |
| | | | Total Industrials | | | 2,809,650 | |
| | | | | | | | |
| | | | Information Technology — 8.1% | | | | |
| | | | Communications Equipment — 1.3% | | | | |
| | 125,000 | | | Alcatel-Lucent USA, Inc., 6.450%, 03/15/29 | | | 138,125 | |
| | 135,000 | | | CommScope Technologies Finance LLC, 6.000%, 06/15/25 (a) | | | 144,450 | |
SEE NOTES TO FINANCIAL STATEMENTS.
| | | | | | |
| | | |
| 8 | | | | JPMORGAN EXCHANGE-TRADED FUNDS | | FEBRUARY 28, 2017 |
| | | | | | | | |
PRINCIPAL AMOUNT($) | | | SECURITY DESCRIPTION | | VALUE($) | |
| | Corporate Bonds — continued | | | | |
| | | | Communications Equipment — continued | | | | |
| | 25,000 | | | CommScope, Inc., 5.500%, 06/15/24 (a) | | | 26,187 | |
| | 90,000 | | | Nokia OYJ (Finland), 5.375%, 05/15/19 | | | 95,175 | |
| | | | | | | | |
| | | | | | | 403,937 | |
| | | | | | | | |
| | | | Electronic Equipment, Instruments & Components — 0.5% | | | | |
| | 55,000 | | | CDW LLC/CDW Finance Corp., 6.000%, 08/15/22 | | | 58,231 | |
| | 95,000 | | | Zebra Technologies Corp., 7.250%, 10/15/22 | | | 102,773 | |
| | | | | | | | |
| | | | | | | 161,004 | |
| | | | | | | | |
| | | | HealthCare Technology — 0.7% | | | | |
| | 200,000 | | | Quintiles IMS, Inc., 5.000%, 10/15/26 (a) | | | 203,000 | |
| | | | | | | | |
| | | | Internet Software & Services — 0.2% | | | | |
| | 65,000 | | | VeriSign, Inc., 4.625%, 05/01/23 | | | 66,300 | |
| | | | | | | | |
| | | | IT Services — 1.5% | | | | |
| | | | First Data Corp., | | | | |
| | 25,000 | | | 5.000%, 01/15/24 (a) | | | 25,531 | |
| | 80,000 | | | 5.750%, 01/15/24 (a) | | | 82,900 | |
| | 310,000 | | | 7.000%, 12/01/23 (a) | | | 333,250 | |
| | | | | | | | |
| | | | | | | 441,681 | |
| | | | | | | | |
| | | | Semiconductors & Semiconductor Equipment — 1.2% | | | | |
| | | | Micron Technology, Inc., | | | | |
| | 36,000 | | | 5.250%, 08/01/23 (a) | | | 36,315 | |
| | 105,000 | | | 5.500%, 02/01/25 | | | 108,412 | |
| | 200,000 | | | NXP BV/NXP Funding LLC (Netherlands), 4.125%, 06/01/21 (a) | | | 207,620 | |
| | | | | | | | |
| | | | | | | 352,347 | |
| | | | | | | | |
| | | | Software — 0.4% | | | | |
| | 41,000 | | | Nuance Communications, Inc., 5.375%, 08/15/20 (a) | | | 41,947 | |
| | 70,000 | | | Open Text Corp. (Canada), 5.625%, 01/15/23 (a) | | | 73,413 | |
| | | | | | | | |
| | | | | | | 115,360 | |
| | | | | | | | |
| | | | Technology Hardware, Storage & Peripherals — 1.9% | | | | |
| | | | EMC Corp., | | | | |
| | 92,000 | | | 1.875%, 06/01/18 | | | 91,631 | |
| | 25,000 | | | 2.650%, 06/01/20 | | | 24,377 | |
| | | | NCR Corp., | | | | |
| | 25,000 | | | 5.000%, 07/15/22 | | | 25,594 | |
| | 60,000 | | | 6.375%, 12/15/23 | | | 64,125 | |
| | 330,000 | | | Western Digital Corp., 10.500%, 04/01/24 | | | 385,688 | |
| | | | | | | | |
| | | | | | | 591,415 | |
| | | | | | | | |
| | | | | | | | |
PRINCIPAL AMOUNT($) | | | SECURITY DESCRIPTION | | VALUE($) | |
| | | | | | | | |
| | | | Wireless Telecommunication — 0.4% | | | | |
| | | | Hughes Satellite Systems Corp., | | | | |
| | 90,000 | | | 6.500%, 06/15/19 | | | 97,452 | |
| | 32,000 | | | 7.625%, 06/15/21 | | | 35,480 | |
| | | | | | | | |
| | | | | | | 132,932 | |
| | | | | | | | |
| | | | Total Information Technology | | | 2,467,976 | |
| | | | | | | | |
| | | | Materials — 8.4% | | | | |
| | | | Chemicals — 2.4% | | | | |
| | | | Ashland LLC, | | | | |
| | 26,000 | | | 3.875%, 04/15/18 | | | 26,455 | |
| | 100,000 | | | 4.750%, 08/15/22 | | | 103,800 | |
| | | | Blue Cube Spinco, Inc., | | | | |
| | 65,000 | | | 9.750%, 10/15/23 | | | 77,512 | |
| | 25,000 | | | 10.000%, 10/15/25 | | | 30,375 | |
| | | | CF Industries, Inc., | | | | |
| | 36,000 | | | 5.375%, 03/15/44 | | | 31,950 | |
| | 38,000 | | | 6.875%, 05/01/18 | | | 39,871 | |
| | 38,000 | | | 7.125%, 05/01/20 | | | 41,658 | |
| | | | Chemours Co. (The), | | | | |
| | 120,000 | | | 6.625%, 05/15/23 | | | 127,950 | |
| | 26,000 | | | 7.000%, 05/15/25 | | | 28,243 | |
| | 60,000 | | | Huntsman International LLC, 4.875%, 11/15/20 | | | 62,400 | |
| | 100,000 | | | Platform Specialty Products Corp., 6.500%, 02/01/22 (a) | | | 104,500 | |
| | 60,000 | | | WR Grace & Co.-Conn, 5.125%, 10/01/21 (a) | | | 63,150 | |
| | | | | | | | |
| | | | | | | 737,864 | |
| | | | | | | | |
| | | | Containers & Packaging — 1.1% | | | | |
| | | | Ball Corp., | | | | |
| | 36,000 | | | 4.375%, 12/15/20 | | | 37,800 | |
| | 90,000 | | | 5.250%, 07/01/25 | | | 95,512 | |
| | 60,000 | | | Berry Plastics Corp., 5.125%, 07/15/23 | | | 61,800 | |
| | 90,000 | | | Crown Americas LLC/Crown Americas Capital Corp IV, 4.500%, 01/15/23 | | | 92,363 | |
| | 60,000 | | | Owens-Brockway Glass Container, Inc., 5.875%, 08/15/23 (a) | | | 64,425 | |
| | | | | | | | |
| | | | | | | 351,900 | |
| | | | | | | | |
| | | | Electrical Equipment — 0.6% | | | | |
| | | | Novelis Corp., | | | | |
| | 63,000 | | | 5.875%, 09/30/26 (a) | | | 64,811 | |
| | 105,000 | | | 6.250%, 08/15/24 (a) | | | 111,300 | |
| | | | | | | | |
| | | | | | | 176,111 | |
| | | | | | | | |
SEE NOTES TO FINANCIAL STATEMENTS.
| | | | | | | | |
| | | |
| FEBRUARY 28, 2017 | | JPMORGAN EXCHANGE-TRADED FUNDS | | | | | 9 | |
JPMorgan Disciplined High Yield ETF
SCHEDULE OF PORTFOLIO INVESTMENTS
AS OF FEBRUARY 28, 2017 (continued)
| | | | | | | | |
PRINCIPAL AMOUNT($) | | | SECURITY DESCRIPTION | | VALUE($) | |
| | Corporate Bonds — continued | | | | |
| | | | Metals & Mining — 4.3% | | | | |
| | 200,000 | | | Alcoa Nederland Holding BV (Netherlands), 6.750%, 09/30/24 (a) | | | 217,500 | |
| | | | Allegheny Technologies, Inc., | | | | |
| | 25,000 | | | 5.950%, 01/15/21 | | | 25,110 | |
| | 25,000 | | | 7.875%, 08/15/23 | | | 25,813 | |
| | 100,000 | | | Anglo American Capital plc (United Kingdom), 9.375%, 04/08/19 (a) | | | 113,250 | |
| | | | ArcelorMittal (Luxembourg), | | | | |
| | 25,000 | | | 7.000%, 02/25/22 | | | 28,438 | |
| | 36,000 | | | 7.500%, 03/01/41 | | | 40,860 | |
| | 135,000 | | | 8.000%, 10/15/39 | | | 157,275 | |
| | | | First Quantum Minerals Ltd. (Canada), | | | | |
| | 100,000 | | | 6.750%, 02/15/20 (a) | | | 102,500 | |
| | 42,000 | | | 7.000%, 02/15/21 (a) | | | 43,496 | |
| | | | Freeport-McMoRan, Inc., | | | | |
| | 30,000 | | | 3.550%, 03/01/22 | | | 27,822 | |
| | 175,000 | | | 3.875%, 03/15/23 | | | 161,000 | |
| | 68,000 | | | 5.450%, 03/15/43 | | | 58,140 | |
| | 25,000 | | | Hudbay Minerals, Inc. (Canada), 7.625%, 01/15/25 (a) | | | 27,312 | |
| | 60,000 | | | Steel Dynamics, Inc., 5.125%, 10/01/21 | | | 61,875 | |
| | | | Teck Resources Ltd. (Canada), | | | | |
| | 26,000 | | | 4.750%, 01/15/22 | | | 27,008 | |
| | 90,000 | | | 6.250%, 07/15/41 | | | 93,375 | |
| | 90,000 | | | United States Steel Corp., 8.375%, 07/01/21 (a) | | | 101,250 | |
| | | | | | | | |
| | | | | | | 1,312,024 | |
| | | | | | | | |
| | | | Total Materials | | | 2,577,899 | |
| | | | | | | | |
| | | | Real Estate — 2.1% | | | | |
| | | | Equity Real Estate Investment Trusts (REITs) — 1.7% | | | | |
| | 100,000 | | | Communications Sales & Leasing, Inc./CSL Capital LLC, 8.250%, 10/15/23 | | | 108,375 | |
| | | | Equinix, Inc., | | | | |
| | 36,000 | | | 5.375%, 04/01/23 | | | 37,350 | |
| | 100,000 | | | 5.875%, 01/15/26 | | | 106,812 | |
| | | | Iron Mountain, Inc., | | | | |
| | 25,000 | | | 5.750%, 08/15/24 | | | 25,656 | |
| | 90,000 | | | 6.000%, 10/01/20 (a) | | | 94,526 | |
| | 25,000 | | | 6.000%, 08/15/23 | | | 26,460 | |
| | | | SBA Communications Corp., | | | | |
| | 26,000 | | | 4.875%, 07/15/22 | | | 26,553 | |
| | 100,000 | | | 4.875%, 09/01/24 (a) | | | 99,490 | |
| | | | | | | | |
| | | | | | | 525,222 | |
| | | | | | | | |
| | | | | | | | |
PRINCIPAL AMOUNT($) | | | SECURITY DESCRIPTION | | VALUE($) | |
| | | | | | | | |
| | | | Hotels, Restaurants & Leisure — 0.4% | | | | |
| | | | GLP Capital LP/GLP Financing II, Inc., | | | | |
| | 90,000 | | | 4.875%, 11/01/20 | | | 94,500 | |
| | 36,000 | | | 5.375%, 04/15/26 | | | 37,665 | |
| | | | | | | | |
| | | | | | | 132,165 | |
| | | | | | | | |
| | | | Total Real Estate | | | 657,387 | |
| | | | | | | | |
| | | | Telecommunication Services — 12.2% | | | | |
| | | | Diversified Telecommunication Services — 7.3% | | | | |
| | | | CenturyLink, Inc., | | | | |
| | 125,000 | | | 5.800%, 03/15/22 | | | 129,063 | |
| | 46,000 | | | 6.450%, 06/15/21 | | | 49,019 | |
| | 135,000 | | | Embarq Corp., 7.995%, 06/01/36 | | | 135,443 | |
| | | | Frontier Communications Corp., | | | | |
| | 80,000 | | | 10.500%, 09/15/22 | | | 83,300 | |
| | 330,000 | | | 11.000%, 09/15/25 | | | 331,650 | |
| | | | Level 3 Financing, Inc., | | | | |
| | 90,000 | | | 5.375%, 08/15/22 | | | 93,307 | |
| | 32,000 | | | 5.375%, 01/15/24 | | | 32,880 | |
| | | | SFR Group S.A. (France), | | | | |
| | 200,000 | | | 6.000%, 05/15/22 (a) | | | 207,500 | |
| | 475,000 | | | 7.375%, 05/01/26 (a) | | | 492,219 | |
| | 36,000 | | | Telecom Italia Capital S.A. (Luxembourg), 7.721%, 06/04/38 | | | 39,825 | |
| | 200,000 | | | Telecom Italia SpA (Italy), 5.303%, 05/30/24 (a) | | | 203,500 | |
| | 255,000 | | | Wind Acquisition Finance S.A. (Luxembourg), 7.375%, 04/23/21 (a) | | | 265,518 | |
| | | | Zayo Group LLC/Zayo Capital, Inc., | | | | |
| | 130,000 | | | 6.000%, 04/01/23 | | | 137,475 | |
| | 32,000 | | | 6.375%, 05/15/25 | | | 34,480 | |
| | | | | | | | |
| | | | | | | 2,235,179 | |
| | | | | | | | |
| | | | Wireless Telecommunication Services — 4.9% | | | | |
| | 200,000 | | | Millicom International Cellular S.A. (Luxembourg), 6.625%, 10/15/21 (a) | | | 209,500 | |
| | 225,000 | | | SoftBank Group Corp. (Japan), 4.500%, 04/15/20 (a) | | | 232,594 | |
| | 110,000 | | | Sprint Communications, Inc., 9.000%, 11/15/18 (a) | | | 120,450 | |
| | 390,000 | | | Sprint Corp., 7.875%, 09/15/23 | | | 433,875 | |
| | | | T-Mobile USA, Inc., | | | | |
| | 180,000 | | | 6.500%, 01/15/26 | | | 197,775 | |
| | 64,000 | | | 6.625%, 04/01/23 | | | 67,968 | |
| | 200,000 | | | VimpelCom Holdings BV (Netherlands), 7.504%, 03/01/22 (a) | | | 224,202 | |
| | | | | | | | |
| | | | | | | 1,486,364 | |
| | | | | | | | |
| | | | Total Telecommunication Services | | | 3,721,543 | |
| | | | | | | | |
SEE NOTES TO FINANCIAL STATEMENTS.
| | | | | | |
| | | |
| 10 | | | | JPMORGAN EXCHANGE-TRADED FUNDS | | FEBRUARY 28, 2017 |
| | | | | | | | |
PRINCIPAL AMOUNT($) | | | SECURITY DESCRIPTION | | VALUE($) | |
| | Corporate Bonds — continued | | | | |
| | | | Utilities — 2.8% | | | | |
| | | | Electric Utilities — 1.1% | | | | |
| | 110,000 | | | Emera, Inc. (Canada), VAR, 6.750%, 06/15/76 | | | 120,450 | |
| | 200,000 | | | Enel SpA (Italy), VAR,
8.750%, 09/24/73 (a) | | | 230,500 | |
| | | | | | | | |
| | | | | | | 350,950 | |
| | | | | | | | |
| | | | Gas Utilities — 0.2% | | | | |
| | | | AmeriGas Partners LP/AmeriGas Finance Corp., | | | | |
| | 26,000 | | | 5.500%, 05/20/25 | | | 26,358 | |
| | 40,000 | | | 5.875%, 08/20/26 | | | 41,300 | |
| | | | | | | | |
| | | | | | | 67,658 | |
| | | | | | | | |
| | | | Independent Power and Renewable Electricity Producers — 1.5% | | | | |
| | 85,000 | | | AES Corp., 7.375%, 07/01/21 | | | 95,838 | |
| | 28,000 | | | DPL, Inc., 7.250%, 10/15/21 | | | 29,820 | |
| | | | Calpine Corp., | | | | |
| | 46,000 | | | 5.375%, 01/15/23 | | | 46,460 | |
| | 140,000 | | | 5.750%, 01/15/25 | | | 138,530 | |
| | | | NRG Energy, Inc., | | | | |
| | 115,000 | | | 6.625%, 01/15/27 (a) | | | 112,987 | |
| | 36,000 | | | 7.250%, 05/15/26 | | | 37,035 | |
| | | | | | | | |
| | | | | | | 460,670 | |
| | | | | | | | |
| | | | Total Utilities | | | 879,278 | |
| | | | | | | | |
| | | | Total Corporate Bonds
(Cost $29,462,405) | | | 29,851,405 | |
| | | | | | | | |
| | | | | | | | |
SHARES | | | SECURITY DESCRIPTION | | VALUE($) | |
| | | | | | | | |
| | Short-Term Investment — 0.9% | | | | |
| | | | Investment Company — 0.9% | | | | |
| | 266,217 | | | JPMorgan U.S. Government Money Market Fund, Institutional Class Shares, 0.440% (b) (c)
(Cost $266,217) | | | 266,217 | |
| | | | | | | | |
| | | | Total Investments — 98.5%
(Cost $29,728,622) | | | 30,117,622 | |
| | | | | | | | |
| | | | Other Assets in Excess of
Liabilities — 1.5% | | | 456,446 | |
| | | | | | | | |
| | | | NET ASSETS — 100.0% | | $ | 30,574,068 | |
| | | | | | | | |
Percentages indicated are based on net assets.
NOTES TO SCHEDULE OF PORTFOLIO INVESTMENTS
| | |
| MTN | | — Medium Term Note |
| REIT | | — Real Estate Investment Trust |
| VAR | | — Variable Rate Security. The interest rate shown is the rate in effect as of February 28, 2017. |
| |
| (a) | | — Security is exempt from registration under Rule 144A of the Securities Act of 1933, as amended. Unless otherwise indicated , this security has been determined to be liquid under procedures established by the Board of Trustees and may be resold in transactions exempt from registration, normally to qualify institutional buyers. |
| |
| (b) | | — Investment in affiliate. Fund is registered under the Investment Company Act of 1940, as amended, and advised by J.P. Morgan Investment Management Inc. |
| |
| (c) | | — The rate shown is the current yield as of February 28, 2017. |
| |
| (d) | | — Securities are perpetual and, thus, do not have a predetermined maturity date. The coupon rate for these securities are fixed for a period of time and may be structured to adjust thereafter. The date shown, if applicable, reflects the next call date. The coupon rate shown is the rate in effect as of February 28, 2017. |
SEE NOTES TO FINANCIAL STATEMENTS.
| | | | | | | | |
| | | |
| FEBRUARY 28, 2017 | | JPMORGAN EXCHANGE-TRADED FUNDS | | | | | 11 | |
STATEMENT OF ASSETS AND LIABILITIES
AS OF FEBRUARY 28, 2017
| | | | |
| | | JPMorgan
Disciplined High
Yield ETF | |
ASSETS: | | | | |
Investments in non-affiliates, at value | | $ | 29,851,405 | |
Investment in affiliates, at value | | | 266,217 | |
| | | | |
Total Investment securities, at value | | | 30,117,622 | |
Restricted Cash | | | 250 | |
Receivables: | | | | |
Interest from non-affiliates | | | 477,125 | |
Due from Adviser | | | 33,562 | |
Deferred offering costs | | | 26,715 | |
Prepaid Expenses | | | 267 | |
| | | | |
Total Assets | | | 30,655,541 | |
| | | | |
| |
LIABILITIES: | | | | |
Accrued Liabilities: | | | | |
Professional fees | | | 61,374 | |
Accounting fees | | | 8,737 | |
Administration fees | | | 1,727 | |
Trustees’ and Chief Compliance Officer’s fees | | | 1,634 | |
Custodian and Transfer Agent fees | | | 754 | |
Other | | | 7,247 | |
| | | | |
Total Liabilities | | | 81,473 | |
| | | | |
Net Assets | | $ | 30,574,068 | |
| | | | |
| |
NET ASSETS: | | | | |
Paid-in Capital | | $ | 30,223,538 | |
Accumulated undistributed (distributions in excess of) net investment income | | | 4,397 | |
Accumulated net realized gains (losses) | | | (42,867 | ) |
Net unrealized appreciation (depreciation) | | | 389,000 | |
| | | | |
Total Net Assets | | $ | 30,574,068 | |
| | | | |
| |
Outstanding number of shares
(unlimited number of shares authorized — par value $0.0001) | | | 600,000 | |
| | | | |
Net asset value, per share | | $ | 50.96 | |
| | | | |
| |
Cost of investments in non-affiliates | | $ | 29,462,405 | |
Cost of investments in affiliates | | | 266,217 | |
SEE NOTES TO FINANCIAL STATEMENTS.
| | | | | | |
| | | |
| 12 | | | | JPMORGAN EXCHANGE-TRADED FUNDS | | FEBRUARY 28, 2017 |
STATEMENT OF OPERATIONS
FOR THE PERIOD ENDED FEBRUARY 28, 2017
| | | | |
| | | JPMorgan Disciplined High Yield ETF (a) | |
INVESTMENT INCOME: | | | | |
Interest income from non-affiliates | | $ | 618,584 | |
Dividend income from affiliates | | | 1,754 | |
Foreign taxes withheld | | | (2,275 | ) |
| | | | |
Total Investment Income | | | 618,063 | |
| | | | |
| |
EXPENSES: | | | | |
Investment advisory fees (Note 3.A) | | | 34,591 | |
Administration fees (Note 3.B) | | | 9,801 | |
Trustees’ and Chief Compliance Officer’s fees | | | 3,348 | |
Professional fees | | | 113,372 | |
Printing and mailing costs | | | 2,500 | |
Custodian and Transfer Agent fees | | | 1,577 | |
Registration and filing fees | | | 7,321 | |
Insurance expense | | | 361 | |
Offering costs | | | 11,530 | |
Accounting fees | | | 18,825 | |
Other | | | 2,700 | |
| | | | |
Total expenses | | | 205,926 | |
| | | | |
Less fees waived (Note 3.D) | | | (44,392 | ) |
Less expense reimbursements from affiliates (Note 3.D) | | | (115,805 | ) |
Less expense reimbursements from non-affiliates (Note 3.C) | | | (500 | ) |
| | | | |
Net expenses | | | 45,229 | |
| | | | |
Net investment income (loss) | | | 572,834 | |
| | | | |
| |
REALIZED/UNREALIZED GAINS (LOSSES): | | | | |
Net realized gain (loss) on transactions from: | | | | |
Investments in non-affiliates | | | (41,809 | ) |
| | | | |
Net realized gain (loss) | | | (41,809 | ) |
| | | | |
Change in net unrealized appreciation/depreciation on: | | | | |
Investments in non-affiliates | | | 389,000 | |
| | | | |
Change in net unrealized appreciation/depreciation | | | 389,000 | |
| | | | |
Net realized/unrealized gains (losses) | | | 347,191 | |
| | | | |
Change in net assets resulting from operations | | $ | 920,025 | |
| | | | |
| (a) | Commencement of operations was September 14, 2016. |
SEE NOTES TO FINANCIAL STATEMENTS.
| | | | | | | | |
| | | |
| FEBRUARY 28, 2017 | | JPMORGAN EXCHANGE-TRADED FUNDS | | | | | 13 | |
STATEMENT OF CHANGES IN NET ASSETS
FOR THE PERIOD INDICATED
| | | | |
| | | JPMorgan
Disciplined High
Yield ETF | |
| | | Period Ended
February 28, 2017 (a) | |
CHANGE IN NET ASSETS RESULTING FROM OPERATIONS: | | | | |
Net investment income (loss) | | $ | 572,834 | |
Net realized gain (loss) | | | (41,809 | ) |
Change in net unrealized appreciation/depreciation | | | 389,000 | |
| | | | |
Change in net assets resulting from operations | | | 920,025 | |
| | | | |
| |
DISTRIBUTIONS TO SHAREHOLDERS: | | | | |
From net investment income | | | (567,995 | ) |
From net realized gains | | | (1,500 | ) |
| | | | |
Total distributions to shareholders | | | (569,495 | ) |
| | | | |
| |
CAPITAL TRANSACTIONS: | | | | |
Change in net assets resulting from capital transactions | | | 30,223,538 | |
| | | | |
| |
NET ASSETS: | | | | |
Change in net assets | | | 30,574,068 | |
Beginning of period | | | — | |
| | | | |
End of period | | $ | 30,574,068 | |
| | | | |
Accumulated undistributed (distributions in excess of) net investment income | | $ | 4,397 | |
| | | | |
| |
CAPITAL SHARE TRANSACTIONS: | | | | |
Proceeds from shares issued | | $ | 30,223,538 | |
| | | | |
Total change in net assets resulting from capital transactions | | $ | 30,223,538 | |
| | | | |
| |
SHARE TRANSACTIONS: | | | | |
Issued | | | 600,000 | |
| | | | |
Net increase in shares from share transactions | | | 600,000 | |
| | | | |
| (a) | Commencement of operations was September 14, 2016. |
SEE NOTES TO FINANCIAL STATEMENTS.
| | | | | | |
| | | |
| 14 | | | | JPMORGAN EXCHANGE-TRADED FUNDS | | FEBRUARY 28, 2017 |
THIS PAGE IS INTENTIONALLY LEFT BLANK
| | | | | | | | |
| | | |
| FEBRUARY 28, 2017 | | JPMORGAN EXCHANGE-TRADED FUNDS | | | | | 15 | |
FINANCIAL HIGHLIGHTS
FOR THE PERIOD INDICATED
| | | | | | | | | | | | | | | | | | | | | | | | | | | | | | | | |
| | | Per share operating performance | |
| | | | | | Investment Operations | | | Distributions | | | | |
| | | Net asset
value,
beginning
of period | | | Net
investment
income
(loss) (b) | | | Net realized
and unrealized
gains
(losses) on
investments | | | Total from
investment
operations | | | Net
investment
income | | | Net
realized
gain | | | Total
distributions | | | Net asset
value,
end of period | |
| | | | | |
JPMorgan Disciplined High Yield ETF | | | | | | | | | | | | | | | | | | | | | |
September 14, 2016 (a) through February 28, 2017 | | $ | 50.00 | | | $ | 1.14 | | | $ | 0.96 | | | $ | 2.10 | | | $ | (1.14 | ) | | $ | — | (h) | | $ | (1.14 | ) | | $ | 50.96 | |
| (a) | Commencement of operations. |
| (b) | Calculated based upon average shares outstanding. |
| (c) | Not annualized for periods less than one year. |
| (d) | Includes adjustments in accordance with accounting principles generally accepted in the United States of America and as such, the net asset values for financial reporting purposes and the returns based upon those net asset values may differ from the net asset values and returns for shareholder transactions. |
| (e) | Market price total return is calculated assuming an initial investment made at the beginning of the period market price, reinvestment of all dividends and distributions at market price during the period, and sale at the market price on the last day of the period. The market price presented to calculate the market price total return is the mid-point of the bid/ask spread at the close of business on the Bats BZX Exchange, Inc. |
| (f) | Annualized for periods less than one year, unless otherwise indicated. |
| (g) | Certain non-recurring expenses incurred by the Fund were not annualized for the period indicated. |
| (h) | Amount rounds to less than $0.005. |
SEE NOTES TO FINANCIAL STATEMENTS.
| | | | | | |
| | | |
| 16 | | | | JPMORGAN EXCHANGE-TRADED FUNDS | | FEBRUARY 28, 2017 |
| | | | | | | | | | | | | | | | | | | | | | | | | | | | | | |
| Ratios/Supplemental data | |
| | | | | | | | | | | | | Ratios to average net assets (f) | | | | |
Market
price,
end of period | | | Total
return (c)(d) | | |
Market
price total
return (c)(e) | | | Net assets, end of period | | | Net
expenses | | | Net investment income (loss) | | | Expenses without waivers and reimbursements | | | Portfolio turnover
rate (c) | |
| | | | | | | |
| | | | | | | | | | | | | | | | | | | | | | | | | | | | | | |
| $ | 51.16 | | |
|
4.24 |
% | | | 4.64 | % | | $ | 30,574,068 | | | | 0.39 | % (g) | | | 4.99 | % | | | 1.74 | % (g) | | | 8 | % |
SEE NOTES TO FINANCIAL STATEMENTS.
| | | | | | | | |
| | | |
| FEBRUARY 28, 2017 | | JPMORGAN EXCHANGE-TRADED FUNDS | | | | | 17 | |
NOTES TO FINANCIAL STATEMENTS
AS OF FEBRUARY 28, 2017
1. Organization
J.P. Morgan Exchange-Traded Fund Trust (the “Trust”) was formed on February 25, 2010, and is governed by a Declaration of Trust as amended and restated February 19, 2014, and is registered under the Investment Company Act of 1940, as amended (the “1940 Act”), as an open-ended management investment company. JPMorgan Disciplined High Yield ETF (the “Fund” or the “High Yield ETF”) is a separate diversified series of the Trust covered in this report.
The Fund commenced operations on September 14, 2016. The investment objective of the Fund is to seek to provide a high level of income with capital appreciation as a secondary objective.
J.P. Morgan Investment Management Inc. (“JPMIM” or the “Adviser”) an indirect, wholly-owned subsidiary of JPMorgan Chase & Co. (“JPMorgan”) acts as the Adviser and Administrator (the “Administrator”) to the Fund.
Shares of the Fund are listed and traded on the Bats BZX Exchange, Inc. Market prices for the Fund’s shares may be different from their net asset value (“NAV”). The Fund issues and redeems its shares on a continuous basis, through SEI Investments Distribution Co. (the “Distributor” or “SIDCO”), at NAV in large blocks of shares, typically 100,000 shares, referred to as “Creation Units.” Creation Units are issued and redeemed principally in cash. Shares are generally traded in the secondary market in amounts less than a Creation Unit at market prices that change throughout the day. Only individuals or institutions that have entered into an authorized participant agreement with the Distributor may do business directly with the Fund (each, an “Authorized Participant”).
2. Significant Accounting Policies
The following is a summary of significant accounting policies followed by the Fund in the preparation of its financial statements. The Fund is an investment company and, accordingly, follows the investment company accounting and reporting guidance of the Financial Accounting Standards Board Accounting Standards Codification Topic 946 — Investment Companies, which is part of the U.S. generally accepted accounting principles (“GAAP”). The preparation of financial statements in conformity with GAAP requires management to make estimates and assumptions that affect the reported amounts of assets and liabilities and the disclosure of contingent assets and liabilities at the date of the financial statements and the reported amounts of increases and decreases in net assets from operations during the reporting period. Actual results could differ from those estimates.
A. Valuation of Investments — The valuation of the investments is in accordance with GAAP and the Fund’s valuation policies set forth by and under the supervision and responsibility of the Board of Trustees (the “Board”), which established the following approach to valuation, as described more fully below: (i) investments for which market quotations are readily available shall be valued at such unadjusted quoted prices, and (ii) all other investments for which market quotations are not readily available shall be valued at their fair value as determined in good faith by the Board.
The Administrator has established the J.P. Morgan Investment Management Americas Valuation Committee (“AVC”) to assist the Board with the oversight and monitoring of the valuation of the Fund’s investments. The Administrator implements the valuation policies of the Fund’s investments, as directed by the Board. The AVC oversees and carries out the policies for the valuation of investments held in the Fund. This includes monitoring the appropriateness of fair values based on results of ongoing valuation oversight, including but not limited to consideration of macro or security specific events, market events and pricing vendor and broker due diligence. The Administrator is responsible for discussing and assessing the potential impacts to the fair values on an ongoing basis, and at least on a quarterly basis with the AVC and the Board.
Fixed income instruments are valued based on prices received from approved pricing vendors or third party broker-dealers (collectively referred to as “Pricing Services”). The Pricing Services use multiple valuation techniques to determine the valuation of fixed income instruments. In instances where sufficient market activity exists, the Pricing Services may utilize a market-based approach through which trades or quotes from market makers are used to determine the valuation of these instruments. In instances where sufficient market activity may not exist, the Pricing Services also utilize proprietary valuation models which may consider market transactions in comparable securities and the various relationships between securities in determining fair value and/or market characteristics in order to estimate the relevant cash flows, which are then discounted to calculate the fair values.
Investments in mutual funds (the “Underlying Funds”) are valued at each Underlying Funds’ NAV per share as of the report date.
Valuations reflected in this report are as of the report date. As a result, changes in valuation due to market events and/or issuer related events after the report date and prior to issuance of the report are not reflected herein.
The various inputs that are used in determining the valuation of the Fund’s investments are summarized into the three broad levels listed below.
| • | | Level 1 — Unadjusted inputs using quoted prices in active markets for identical investments. |
| • | | Level 2 — Other significant observable inputs including, but not limited to, quoted prices for similar investments, inputs other than quoted prices that are observable for investments (such as interest rates, prepayment speeds, credit risk, etc.) or other market corroborated inputs. |
| • | | Level 3 — Significant inputs based on the best information available in the circumstances, to the extent observable inputs are not available (including the Fund’s assumptions in determining the fair value of investments). |
| | | | | | |
| | | |
| 18 | | | | JPMORGAN EXCHANGE-TRADED FUNDS | | FEBRUARY 28, 2017 |
A financial instrument’s level within the fair value hierarchy is based on the lowest level of any input, both individually and in the aggregate, that is significant to the fair value measurement. The inputs or methodology used for valuing instruments are not necessarily an indication of the risk associated with investing in those instruments.
The following table represents each valuation input as presented on the Schedule of Portfolio Investments:
| | | | | | | | | | | | | | | | |
| | | Level 1 Quoted prices | | | Level 2 Other significant observable inputs | | | Level 3 Significant unobservable inputs | | | Total | |
Investments in Securities | | | | | | | | | | | | | | | | |
Corporate Bonds | | | | | | | | | | | | | | | | |
Consumer Discretionary | | $ | — | | | $ | 7,489,252 | | | $ | — | | | $ | 7,489,252 | |
Consumer Staples | | | — | | | | 940,307 | | | | — | | | | 940,307 | |
Energy | | | — | | | | 4,348,114 | | | | — | | | | 4,348,114 | |
Financials | | | — | | | | 2,033,376 | | | | — | | | | 2,033,376 | |
Health Care | | | — | | | | 1,926,623 | | | | — | | | | 1,926,623 | |
Industrials | | | — | | | | 2,809,650 | | | | — | | | | 2,809,650 | |
Information Technology | | | — | | | | 2,467,976 | | | | — | | | | 2,467,976 | |
Materials | | | — | | | | 2,577,899 | | | | — | | | | 2,577,899 | |
Real Estate | | | — | | | | 657,387 | | | | — | | | | 657,387 | |
Telecommunication Services | | | — | | | | 3,721,543 | | | | — | | | | 3,721,543 | |
Utilities | | | — | | | | 879,278 | | | | — | | | | 879,278 | |
| | | | | | | | | | | | | | | | |
Total Corporate Bonds | | | — | | | | 29,851,405 | | | | — | | | | 29,851,405 | |
| | | | | | | | | | | | | | | | |
Short-Term Investment | | | | | | | | | | | | | | | | |
Investment Company | | | 266,217 | | | | — | | | | — | | | | 266,217 | |
| | | | | | | | | | | | | | | | |
Total Investments in Securities | | $ | 266,217 | | | $ | 29,851,405 | | | $ | — | | | $ | 30,117,622 | |
| | | | | | | | | | | | | | | | |
There were no transfers during the period ended February 28, 2017.
B. Restricted Securities — Certain securities held by the Fund may be subject to legal or contractual restrictions on resale. Restricted securities generally are resold in transactions exempt from registration under the Securities Act of 1933 (the “Securities Act”). Disposal of these securities may involve time-consuming negotiations and expense. Prompt sale at the current valuation may be difficult and could adversely affect the net assets of the Fund.
As of February 28, 2017, the Fund had no investments in restricted securities other than securities sold to the Fund under Rule 144A.
C. Offering and Organizational Costs — Total offering costs incurred in connection with the offering of shares of the Fund are amortized on a straight line basis over 12 months from the date the Fund commenced operations. Costs paid in connection with the organization of the Trust, if any, were recorded as an expense at the time it commenced operations. Approximate total offering costs incurred by the Fund were $38,245.
D. Security Transactions and Investment Income — Investment transactions are accounted for on the trade date (the date the order to buy or sell is executed). Securities gains and losses are calculated on a specifically identified cost basis. Interest income is determined on the basis of coupon interest accrued using the effective interest method which adjusts for amortization of premiums and accretion of discounts. Dividend income net of foreign taxes withheld, if any, is recorded on the ex-dividend date or when a fund first learns of the dividend.
E. Allocation of Expenses — Expenses directly attributable to the Fund are charged directly to the Fund, while the expenses attributable to more than one fund of the Trust are allocated among the respective funds.
F. Federal Income Taxes — The Fund is treated as a separate taxable entity for Federal income tax purposes. The Fund’s policy is to comply with the provisions of the Internal Revenue Code of 1986, as amended (the “Code”), applicable to regulated investment companies and to distribute to shareholders all of its distributable net investment income and net realized gain on investments. Accordingly, no provision for Federal income tax is necessary. Management has reviewed the Fund’s tax positions for all open tax years and has determined that as of February 28, 2017, no liability for income tax is required in the Fund’s financial statements for net unrecognized tax benefits. However, management’s conclusions may be subject to future review based on changes in, or the interpretation of, the accounting standards or tax laws and regulations. The Fund’s Federal tax returns for the prior three fiscal years, or since inception if shorter, remain subject to examination by the Internal Revenue Service.
G. Foreign Taxes — The Fund may be subject to foreign taxes on income, gains on investments or currency purchases/repatriation, a portion of which may be recoverable. The Fund will accrue such taxes and recoveries as applicable, based upon its current interpretation of tax rules and regulations that exist in the markets in which it invests.
H. Distributions to Shareholders — Distributions from net investment income, if any, are generally declared and paid monthly. Net realized capital gains, if any, are distributed by the Fund at least annually. The amount of distributions from net investment income and net realized capital gains is
| | | | | | | | |
| | | |
| FEBRUARY 28, 2017 | | JPMORGAN EXCHANGE-TRADED FUNDS | | | | | 19 | |
NOTES TO FINANCIAL STATEMENTS
AS OF FEBRUARY 28, 2017 (continued)
determined in accordance with Federal income tax regulations, which may differ from GAAP. To the extent these “book/tax” differences are permanent in nature (i.e., that they result from other than timing of recognition — “temporary differences”), such amounts are reclassified within the capital accounts based on their Federal tax-basis treatment.
The following amounts were reclassified within the capital accounts:
| | | | | | | | |
| | | Undistributed
Net Investment
Income (Loss) | | | Accumulated
Net Realized
Gain (Loss) | |
| | $ | (442 | ) | | $ | 442 | |
The amounts above primarily relate to the redesignation of distributions from short-term gain to ordinary income.
3. Fees and Other Transactions with Affiliates
A. Investment Advisory Fee — Pursuant to the Investment Advisory Agreement, the Adviser supervises the investments of the Fund and is paid a fee. The fee is accrued daily and paid monthly at an annual rate of 0.30% of the Fund’s average daily net assets.
The Adviser waived Investment Advisory fees and/or reimbursed expenses as outlined in Note 3.D.
B. Administration Fee — Pursuant to an Administration Agreement, the Administrator provides certain administration services to the Fund. In consideration of these services, the Administrator receives a fee accrued daily and paid monthly at an annual rate of 0.085% of the average daily net assets of each fund in the Trust covered by the Administration Agreement.
The Administrator waived administration fees as outlined in Note 3.D.
C. Custodian and Transfer Agent Fees — JPMorgan Chase Bank, N.A. (“JPMCB”), a wholly-owned subsidiary of JPMorgan, provides portfolio custody and transfer agency services to the Fund. The amounts paid directly to JPMCB by the Fund for custody services are included in the Custodian and Transfer Agent fees on the Statement of Operations. With respect to the transfer agency services provided by JPMCB for each creation or redemption transaction, the Authorized Participant will generally be responsible for such associated expenses; during the period, the Fund paid no transfer agency fees to JPMCB.
Additionally, Authorized Participants generally pay transaction fees associated with the creation and redemption of Fund shares. These fees are used to offset certain custodian charges incurred by the Fund for these transactions.
For the period ended February 28, 2017, the amount of transaction fees paid by the Authorized Participants that were used to reimburse custodian fees of the Fund were $500. Such amounts are included in expense reimbursements from non-affiliates in the Statement of Operations.
Restricted cash on the Statement of Assets and Liabilities is cash received from Authorized Participants for the reimbursement of creation and/or redemption of Fund shares.
Interest income earned on cash balances at the custodian, if any, is included as interest income from affiliates in the Statement of Operations.
Interest expense paid to the custodian related to overdrafts, if any, is included in interest expense to affiliates in the Statement of Operations.
D. Waivers and Reimbursements — The Adviser has contractually agreed to waive fees and/or reimburse the Fund to the extent that total annual operating expenses (excluding acquired fund fees and expenses, dividend expenses related to short sales (if applicable), interest, taxes, expenses related to litigation and potential litigation, and extraordinary expenses) exceed 0.40% of the Fund’s average daily net assets.
The expense limitation agreements were in effect for the period ended February 28, 2017. The contractual expense limitation percentage is in place until at least June 30, 2021.
For the period ended February 28, 2017, the Fund’s service providers waived fees and/or reimbursed expenses for the Fund as follows. None of these parties expect the Fund to repay any such waived fees and/or reimbursed expenses in future years.
| | | | | | | | | | | | | | | | |
| | | Contractual Waivers | | | | |
| | | Investment
Advisory | | | Administration | | | Total | | | Contractual
Reimbursements | |
| | $ | 34,591 | | | $ | 9,801 | | | $ | 44,392 | | | $ | 114,923 | |
Additionally, the Fund may invest in one or more money market funds advised by the Adviser or its affiliates (affiliated money market funds). The Adviser has agreed to waive the total expense ratio of the underlying money market funds.
The amount of the waivers resulting from investments in these money market funds during the period ended February 28, 2017 was $882. This amount is included in “expense reimbursements from affiliates” on the Statement of Operations.
E. Related Party Transactions — The Distributor or its agent distributes Creation Units for the Fund on an agency basis. The Distributor does not maintain a secondary market in shares of the Fund. The Distributor has no role in determining the investment policies of the Fund or the securities
| | | | | | |
| | | |
| 20 | | | | JPMORGAN EXCHANGE-TRADED FUNDS | | FEBRUARY 28, 2017 |
that are purchased or sold by the Fund. SIDCO receives no fee for its distribution services under the Distribution Agreement. Although the Distributor does not receive any fees under the Distribution Agreement with the Trust, JPMIM pays the Distributor for certain distribution related services.
F. Other — Certain officers of the Trust are affiliated with the Adviser. Such officers, with the exception of the Chief Compliance Officer, receive no compensation from the Fund for serving in their respective roles.
The Board of Trustees appointed a Chief Compliance Officer to the Fund in accordance with Federal securities regulations. The Fund, along with other affiliated funds, makes reimbursement payments, on a pro-rata basis, to the Administrator for a portion of the fees associated with the Office of the Chief Compliance Officer. Such fees are included in Trustees’ and Chief Compliance Officer’s fees on the Statement of Operations.
The Fund may use related party broker-dealers. For the period ended February 28, 2017, the Fund incurred no brokerage commissions with broker-dealers affiliated with the Advisor or Trust.
4. Investment Transactions
During the period ended February 28, 2017, purchases and sales of investments (excluding short-term investments) were as follows:
| | | | | | | | |
| | | Purchases (excluding U.S. Government) | | | Sales (excluding U.S. Government) | |
| | $ | 31,586,763 | | | $ | 2,022,349 | |
During the period ended February 28, 2017, there were no purchases or sales of U.S. Government securities.
For the period ended February 28, 2017, there were no in-kind transactions associated with creations and redemptions.
5. Federal Income Tax Matters
For Federal income tax purposes, the cost and unrealized appreciation (depreciation) in value of investment securities held at February 28, 2017 were as follows:
| | | | | | | | | | | | | | | | |
| | | Aggregate
Cost | | | Gross Unrealized Appreciation | | | Gross Unrealized Depreciation | | | Net Unrealized Appreciation (Depreciation) | |
| | $ | 29,728,622 | | | $ | 510,643 | | | $ | (121,643 | ) | | $ | 389,000 | |
There is no difference between book and tax basis appreciation (depreciation) on investments.
The tax character of distributions paid during the period ended February 28, 2017 was as follows:
| | | | | | | | |
| | | Ordinary Income | | | Total Distributions Paid | |
2017 | | $ | 569,495 | | | $ | 569,495 | |
As of February 28, 2017, the estimated components of net assets (excluding paid-in-capital) on a tax basis were as follows:
| | | | | | | | | | | | | | |
| | | Undistributed
Ordinary
Income | | Post
October
Losses | | | Unrealized
Appreciation
(Depreciation) | | | Total
Distributable
Earnings | |
| | $4,397 | | $ | (42,867 | ) | | $ | 389,000 | | | $ | 350,530 | |
As of February 28, 2017, the Fund had no net capital loss carryforwards.
Net capital losses and other late year losses after October 31 and within the taxable year are deemed to arise on the first business day of the Fund’s next taxable year. For the year ended February 28, 2017, the Fund deferred to March 1, 2017 net capital losses and other late year loss of:
| | | | | | | | | | |
| | | Net Capital Loss | | �� | | |
| | | Short Term | | Long-Term | | | Other late year loss | |
| | $(42,867) | | $ | — | | | $ | — | |
6. Capital Share Transactions
The Trust issues and redeems shares of the Fund only in Creation Units through the Distributor at NAV. Capital shares transactions detail can be found in the Statement of Changes in Net Assets.
Shares of the Fund may only be purchased or redeemed by Authorized Participants. An Authorized Participant is either (1) a “Participating Party” or other participant in the clearing process through the Continuous Net Settlement System of the National Securities Clearing Corporation (“NSCC”); or (2) a “DTC Participant”; which, in either case, must have executed an agreement with the Distributor.
Creation Units of the Fund may be created in advance of receipt by the Trust of all or a portion of the applicable basket of securities and other instruments (“Deposit Instruments”) and cash as described in the Fund’s registration statement. In these instances, the initial Deposit Instruments
| | | | | | | | |
| | | |
| FEBRUARY 28, 2017 | | JPMORGAN EXCHANGE-TRADED FUNDS | | | | | 21 | |
NOTES TO FINANCIAL STATEMENTS
AS OF FEBRUARY 28, 2017 (continued)
and cash must be deposited in an amount equal to the sum of the cash amount, plus at least 105% of the market value of undelivered Deposit Instruments. A transaction fee may be imposed to offset transfer and other transaction costs associated with the purchase or redemption of Creation Units.
Authorized Participants transacting in Creation Units for cash may also pay a variable charge to compensate the relevant fund for market impact expenses relating to investing in portfolio securities. Such variable charges, if any, are included in “Proceeds from shares purchased” or “Proceeds from shares issued” in the Statement of Changes in Net Assets.
7. Risks, Concentrations and Indemnifications
In the normal course of business, the Fund enters into contracts that contain a variety of representations which provide general indemnifications. The Fund’s maximum exposure under these arrangements is unknown. The amount of exposure would depend on future claims that may be made against the Fund that have not yet occurred. However, based on experience, the Fund expects the risk of loss to be remote.
As of February 28, 2017, the Adviser owned 80% of the outstanding shares of the Fund. Significant transactions by the Adviser may impact the Fund’s performance.
Disruptions to creations and redemptions, the existence of significant market volatility or potential lack of an active trading market for the Shares (including through a trading halt), as well as other factors, may result in Shares trading significantly above (at a premium) or below (at a discount) to the NAV or to the intraday value of the Fund’s holdings. During such periods, investors may incur significant losses if shares are sold.
The Fund invests in high yield securities that are not rated or rated below investment grade (commonly known as “junk bonds”). These securities are considered to be high risk investments. Investments in lower-rated securities or unrated securities of comparable quality tend to be more sensitive to economic conditions than higher rated securities. Junk bonds involve a greater risk of default by the issuer because such securities are generally unsecured and are often subordinated to other creditors’ claims. The market price of these securities can change suddenly and unexpectedly. As a result, the Fund is intended for investors who are able and willing to assume a high degree of risk.
The Fund may invest up to 100% of the Fund’s total assets in below investment grade securities or unrated securities that JPMIM deems to be of equivalent quality. Such securities may include so called “distressed debt”.
The Fund is subject to interest rate and credit risk. The value of debt securities may decline as interest rates increase. The Fund could lose money if the issuer of a fixed income security is unable to pay interest or repay principal when it is due. Many factors can cause interest rates to rise. Some examples include central bank monetary policy, rising inflation rates and general economic conditions. Given the historically low interest rate environment, risks associated with rising rates are heightened. The ability of the issuers of debt to meet their obligations may be affected by the economic and political developments in a specific industry or region.
8. Investment Company Reporting Modernization
In October 2016, the U.S. Securities and Exchange Commission adopted new rules and forms, and amendments to certain current rules and forms, to modernize the reporting and disclosure of information by registered investment companies. In part, the final rules amend Regulation S-X and will require standardized, enhanced disclosures about derivatives in investment company financial statements, as well as other amendments. The compliance date for the amendments to Regulation S-X is August 1, 2017. At this time, management is currently assessing the anticipated impact of the Regulation S-X amendments on the Fund’s financial statements and related disclosures.
| | | | | | |
| | | |
| 22 | | | | JPMORGAN EXCHANGE-TRADED FUNDS | | FEBRUARY 28, 2017 |
REPORT OF INDEPENDENT REGISTERED PUBLIC ACCOUNTING FIRM
To the Board of Trustees of J.P. Morgan Exchange-Traded Fund Trust and the Shareholders of JPMorgan Disciplined High Yield ETF:
In our opinion, the accompanying statement of assets and liabilities, including the schedule of portfolio investments, and the related statements of operations and of changes in net assets and the financial highlights present fairly, in all material respects, the financial position of JPMorgan Disciplined High Yield ETF (a separate series of J.P. Morgan Exchange-Traded Fund Trust, hereafter referred to as the “Fund”) as of February 28, 2017, and the results of its operations, the changes in its net assets and the financial highlights for the period September 14, 2016 (commencement of operations) through February 28, 2017, in conformity with accounting principles generally accepted in the United States of America. These financial statements and financial highlights (hereafter referred to as “financial statements”) are the responsibility of the Fund’s management. Our responsibility is to express an opinion on these financial statements based on our audit. We conducted our audit of these financial statements in accordance with the standards of the Public Company Accounting Oversight Board (United States). Those standards require that we plan and perform the audit to obtain reasonable assurance about whether the financial statements are free of material misstatement. An audit includes examining, on a test basis, evidence supporting the amounts and disclosures in the financial statements, assessing the accounting principles used and significant estimates made by management, and evaluating the overall financial statement presentation. We believe that our audit which included confirmation of securities as of February 28, 2017 by correspondence with the transfer agent and custodian, provides a reasonable basis for our opinion.
Pricewaterhousecooopers LLP
New York, New York
April 20, 2017
| | | | | | | | |
| | | |
| FEBRUARY 28, 2017 | | JPMORGAN EXCHANGE-TRADED FUNDS | | | | | 23 | |
SUPPLEMENTAL INFORMATION
For the Period September 14, 2016(a) Through February 28, 2017 (Unaudited)
The table below indicates the number of trading days in which the Fund traded within the range of the premium/discount noted. The number of days in each range is also shown as a percentage of the total trading days for the period covered in the table. All information within the table is based on historical performance. Past performance cannot be used to predict future results. Shareholders may pay more than NAV when they buy fund shares and receive less than NAV when they sell those shares because shares are bought and sold at current market prices.
| | | | | | | | |
| | | High Yield ETF (a) | |
| Range of Premium/(Discount) | | Day Count | | | Percentage | |
Greater than 0.5% and Less than or equal to 1.0% | | | 111 | | | | 97.37 | % |
Between 0.5% and -0.5% | | | 2 | | | | 1.75 | % |
Less than -0.5% and greater than or equal to -1.0% | | | 1 | | | | 0.88 | % |
| | | | | | | | |
| | | 114 | | | | 100.00 | % |
| | | | | | | | |
| (a) | Commencement of operations was September 14, 2016. |
| | | | | | |
| | | |
| 24 | | | | JPMORGAN EXCHANGE-TRADED FUNDS | | FEBRUARY 28, 2017 |
TRUSTEES
(Unaudited)
The Fund’s Statement of Additional Information includes additional information about the Funds Trustees and is available, without charge, upon request by calling 1-844-457-6383 or on the J.P. Morgan Funds’ website at www.jpmorganfunds.com.
| | | | | | | | |
Name (Year of Birth;
Positions With
the Funds since) | | Principal Occupation
During the Past 5 Years | | Number of
Funds in Fund
Complex Overseen
by Trustee (1) | | | Other Directorships Held
During the Past 5 Years |
Independent Trustees | | | | | | | | |
| | | |
| Gary L. French (1951); Trustee of the Trust since 2014 | | Real Estate Investor (2011-present); Senior Consultant for the Regulatory Fundamentals Group LLC (2011-present); Senior Vice President-Fund Administration, State Street Corporation (2002-2010). | | | 19 | | | Independent Trustee, The China Fund, Inc. (2013-present); Exchange Traded Concepts Trust II (2012-2014); Exchange Traded Concepts Trust I (2011-2014). |
| | | |
| Robert J. Grassi (1957); Trustee of the Trust since 2014 | | Sole Proprietor, Academy Hills Advisors LLC (2012-present); Pension Director, Coming Incorporated (2002-2012). | | | 19 | | | None. |
| | | |
| Thomas P. Lemke (1954); Trustee of the Trust since 2014 | | Retired; Executive Vice President and General Counsel, Legg Mason (2005-2013). | | | 19 | | | Independent Trustee of AXA Premier VIP Trust (2014-present); SEI family of funds, (Independent Trustee of The Advisors’ Inner Circle III Funds (5 portfolios) (2014-present)); Independent Trustee of O’Connor EQUUS (2014-present); Independent Trustee of Winton Series Trust (2014-present); Independent Director of The Victory Funds (or their predecessor funds) (35 portfolios) (2014-2015). |
| | | |
| Lawrence R. Maffia (1950); Trustee of the Trust since 2014 | | Retired; Director and President, ICI Mutual Insurance Company (2006-2013). | | | 19 | | | Director, ICI Mutual Insurance Company (1999-2013). |
| | | |
| Emily A. Youssouf (1951); Trustee of the Trust since 2014 | | Clinical Professor, NYU Schack Institute of Real Estate (2009-present); Board Member (2005-present), Chair of Capital Committee (2006-2016), Chair of Audit Committee (2005-present), and Chair of IT Committee (2016-present), NYC Health and Hospitals Corporation; Board Member and Member of the Audit Committee and Related Parties Committee (2013-present) and Member of the Risk Management Committee (2017-present), PennyMac Financial Services, Inc. | | | 19 | | | Trustee, NYC School Construction Authority (2009-present); Board Member, NYS Job Development Authority (2008-present); Trustee (2015-present) and Chair of the Audit Committee (2015-present) of the Transit Center; Vice Chair (2011-2013) and Board Member (2013-2014) of New York City Housing Authority. |
Interested Trustee | | | | | | | | |
| | | |
| Robert Deutsch (2) (1957); Trustee of the Trust since 2014 | | Head of the Global ETF Business for JPMorgan Asset Management (2013-present); Head of the Global Liquidity Business for JPMorgan Asset Management (2003-2013). | | | 19 | | | None |
| (1) | A Fund complex means two or more registered investment companies that hold themselves out to investors as related companies for purposes of investment and investor services or have a common investment adviser or have an investment adviser that is an affiliated person of the investment adviser of any of the other registered investment companies. Eleven Funds are currently operating and three additional series are in registration and five additional series have been created and will be registered in the future. |
| (2) | Mr. Deutsch is an interested trustee because he is an employee of the Adviser. |
| | | | | | | | |
| | | |
| FEBRUARY 28, 2017 | | JPMORGAN EXCHANGE-TRADED FUNDS | | | | | 25 | |
OFFICERS
(Unaudited)
| | |
Name (Year of Birth), Positions Held with the Trusts (Since) | | Principal Occupations During Past 5 Years |
| |
| Robert F. Deutsch (1957), President and Principal Executive Officer (2014)* | | Managing Director, global head of J.P. Morgan Asset Management’s Exchange Traded Funds and a member of the J.P. Morgan Global Funds Operating Committee. Previously, head of the Global Liquidity Business from 2003 to 2013 and National Sales Manager for J.P. Morgan’s U.S. Mutual Funds Business prior to 2003. |
| |
| Lauren A. Paino (1973), Treasurer and Principal Financial Officer (2015)*** | | Executive Director, J.P. Morgan Investment Management Inc. (formerly JPMorgan Funds Management, Inc.) since August 2013; Director, Credit Suisse Asset Management (2000-2013); Manager, PricewaterhouseCoopers LLP (1995-2000). |
| |
| Paul Shield (1960), Vice President and Assistant Treasurer (2016) | | Managing Director and head of Business Management for JPMorgan Asset Management’s Exchange Traded Fund platform since 2013. Senior Global Product Manager of Alternative Investments for BNY Mellon from 2011 to 2013 and Global Product Head for Exchange Traded Funds at JPMorgan Chase Bank from 2008 to 2011. |
| |
Brian S. Shlissel (1964), Vice President (2016) | | Managing Director and Chief Administrative Officer, leads the JPMorgan U.S. Platform Management Team for JPMorgan’s pooled vehicles, including ETFs and mutual funds since 2014. Prior to joining JPMorgan in 2014, President and Chief Executive Officer for Mutual Funds and Head of Mutual Fund Services for Allianz Global Investors. |
| |
| Frank J. Nasta (1964), Secretary (2014) | | Managing Director and Associate General Counsel, JPMorgan Chase since 2008. |
| |
| Stephen M. Ungerman (1953), Chief Compliance Officer (2014) | | Managing Director, JPMorgan Chase & Co.; Mr. Ungerman has been with JPMorgan Chase & Co. since 2000. |
| |
| Elizabeth A. Davin (1964), Assistant Secretary (2014)** | | Executive Director and Assistant General Counsel, JPMorgan Chase since February 2012; formerly Vice President and Assistant General Counsel, JPMorgan Chase from 2005 until February 2012; Senior Counsel, JPMorgan Chase (formerly Bank One Corporation) from 2004 to 2005. |
| |
| Jessica K. Ditullio (1962), Assistant Secretary (2014)** | | Executive Director and Assistant General Counsel, JPMorgan Chase since February 2011; Ms. Ditullio has served as an attorney with various titles for JPMorgan Chase (formerly Bank One Corporation) since 1990. |
| |
| John T. Fitzgerald (1975), Assistant Secretary (2014) | | Executive Director and Assistant General Counsel, JPMorgan Chase since February 2011; formerly, Vice President and Assistant General Counsel, JPMorgan Chase from 2005 until February 2011. |
| |
| Carmine Lekstutis (1980), Assistant Secretary (2014) | | Executive Director and Assistant General Counsel, JPMorgan Chase since February 2015; formerly Vice President and Assistant General Counsel, JPMorgan Chase from 2011 to February 2015; Associate, Skadden, Arps, Slate, Meagler & Flom LLP (law firm) from 2006 to 2011. |
| |
| Gregory S. Samuels (1980), Assistant Secretary (2014) | | Executive Director and Assistant General Counsel, JPMorgan Chase since February 2014; formerly Vice President and Assistant General Counsel, JPMorgan Chase from 2010 to February 2014; Associate, Ropes & Gray (law firm) from 2008 to 2010. |
| |
| Pamela L. Woodley (1971), Assistant Secretary (2014)*** | | Vice President and Assistant General Counsel, JPMorgan Chase since November 2004. |
| |
| Frederick J. Cavaliere (1978), Assistant Treasurer (2015)*** | | Executive Director, J.P. Morgan Investment Management Inc. (formerly JPMorgan Funds Management, Inc.) since February 2016; formerly Vice President, J.P. Morgan Investment Management Inc. (formerly JPMorgan Funds Management, Inc.) since September 2011; formerly Vice President of J.P. Morgan Investment Management Inc. 2010-2011. Mr. Cavaliere has been with JPMorgan since May 2006. |
| |
| Michael M. D’Ambrosio (1969), Assistant Treasurer (2014) | | Managing Director, J.P. Morgan Investment Management Inc. (formerly JPMorgan Funds Management, Inc.) since 2014; formerly Executive Director, J.P. Morgan Investment Management Inc. (formerly JPMorgan Funds Management, Inc.) from 2012 to 2014; prior to joining JPMorgan Chase, Mr. D’Ambrosio was a Tax Director at PricewaterhouseCoopers LLP since 2006. |
| |
| Julie A. Roach (1971), Assistant Treasurer (2014)** | | Executive Director, J.P. Morgan Investment Management Inc. since February 2017; formerly Vice President J.P. Morgan Investment Management Inc. (formerly JPMorgan Funds Management, Inc.) from August 2012; prior to joining JPMorgan Chase, Ms. Roach was a Senior Manager with Deloitte since 2001. |
| |
| Jason Ronca (1978), Assistant Treasurer (2014)**** | | Executive Director, since February 2017; formerly Vice President for J.P. Morgan Asset Management since 2014. ETF Product Manager for Corporate Investment Bank responsible for setting the strategy and control agenda for the ETF servicing business from 2010 to May 2014; Prior to 2010, a Vice President in Fund Accounting within J.P. Morgan Investor Services, supporting a series of U.S. registered mutual funds. |
| * | | The contact address for the officer is 500 Stanton Christiana Road, Newark, DE 19173. |
| ** | | The contact address for the officer is 1111 Polaris Parkway, Columbus, OH 43240. |
| *** | | The contact address for the officer is 4 New York Plaza, New York, NY 10004. |
| **** | | The contact address for the officer is One Beacon Street, Boston, MA 02108. |
| | | | | | |
| | | |
| 26 | | | | JPMORGAN EXCHANGE-TRADED FUNDS | | FEBRUARY 28, 2017 |
SCHEDULE OF SHAREHOLDER EXPENSES
(Unaudited)
Hypothetical $1,000 Investment
As a shareholder of the Fund, you incur ongoing costs, including investment advisory fees, administration fees, distribution fees and other Fund expenses, in addition to brokerage commissions on your purchases and sales of Fund shares. The examples below are intended to help you understand your ongoing costs (in dollars) of investing in the Fund and to compare these ongoing costs with the ongoing costs of investing in other funds. The examples assume that you had a $1,000 investment at the beginning of the reporting period, September 14, 2016 and continued to hold your shares at the end of the reporting period, February 28, 2017.
Actual Expenses
For the Fund in the table below, the first line provides information about actual account values and actual expenses. You may use the information in this line, together with the amount you invested, to estimate the expenses that you paid over the period. Simply divide your account value by $1,000 (for example, an $8,600 account value divided by $1,000 = 8.6), then multiply the result by the number under the heading entitled
“Expenses Paid During the Period” to estimate the expenses you paid on your account during this period.
Hypothetical Example for Comparison Purposes
The second line in the table below provides information about hypothetical account values and hypothetical expenses based on the Fund’s actual expense ratio and an assumed rate of return of 5% per year before expenses, which is not the Fund’s actual return. The hypothetical account values and expenses may not be used to estimate the actual ending account balance or expenses you paid for the period. You may use this information to compare the ongoing costs of investing in the Fund and other Funds. To do so, compare this 5% hypothetical example with the 5% hypothetical examples that appear in the shareholder reports of other funds. The examples also assume all dividends and distributions have been reinvested. The examples do not take into account brokerage commissions that you pay when purchasing or selling shares of the Fund.
| | | | | | | | | | | | | | | | |
| | | Beginning
Account Value
9/14/2016 | | | Ending
Account Value
2/28/2017 | | | Annualized
Expense
Ratios | | | Expenses
Paid During
Period | |
JPMorgan Disciplined High Yield ETF | | | | | | | | | | | | | | | | |
Actual Fund Return (1) | | $ | 1,000.00 | | | $ | 1,042.40 | | | | 0.39 | % | | $ | 1.81 | |
Hypothetical 5% Return (2) | | | 1,000.00 | | | | 1,022.86 | | | | 0.39 | % | | | 1.96 | |
| (1) | Expenses are equal to the Fund’s annualized expense ratio, multiplied by the average account value over the period, multiplied by 166/365 (to reflect the actual period). The Fund commenced operations on September 14, 2016. |
| (2) | Expenses are equal to the Fund’s annualized expense ratio, multiplied by the average account value over the period, multiplied by 181/365 (to reflect the one-half year period). |
| | | | | | | | |
| | | |
| FEBRUARY 28, 2017 | | JPMORGAN EXCHANGE-TRADED FUNDS | | | | | 27 | |
Tax Letter
(Unaudited)
Certain tax information for the JPMorgan Disciplined High Yield ETF is required to be provided to shareholders based upon the Fund’s income and distributions for the taxable year ended February 28, 2017. The information and distributions reported in this letter may differ from the information and taxable distributions reported to the shareholders for the calendar year ending December 31, 2017. The information necessary to complete your income tax returns for the calendar year ending December 31, 2017 will be provided under separate cover.
Qualified Interest Income (QII) and Short-Term Capital Gain
The Fund listed below paid the following amount, or the maximum allowable amount, of ordinary distributions treated as qualified interest income and short-term capital gains for the period ended February 28, 2017:
| | | | | | | | |
| | | Qualified
Interest
Income | | | Short-Term
Capital Gain | |
High Yield ETF | | $ | 404,281 | | | $ | 1,056 | |
| | | | | | |
| | | |
| 28 | | | | JPMORGAN EXCHANGE-TRADED FUNDS | | FEBRUARY 28, 2017 |
BOARD APPROVAL OF INITIAL INVESTMENT ADVISORY AGREEMENT
(Unaudited)
On December 15 – 16, 2015, the Board of the Trust, a statutory Trust organized under the laws of the State of Delaware, held an in-person meeting and approved the initial Investment Advisory Agreement (“Agreement”) for the JPMorgan Disciplined High Yield ETF (the “Fund”). On March 8-9, 2016, the Board of the Trust held an in-person meeting and approved other organizational matters related to the Fund. The approvals included the approval of a majority of Trustees who are not interested persons of the Trust or the Adviser. Such Trustees are considered Independent Trustees as defined by the 1940 Act. In connection with the approval of the Agreement and other organizational matters for the Fund, the Trustees reviewed written materials prepared by the Adviser and received oral presentations from Adviser personnel. Before voting on the proposed Agreement, the Trustees reviewed the Agreement with representatives of the Adviser and with counsel to the Trust and independent legal counsel and received a memorandum from independent legal counsel to the Trustees discussing the legal standards for their consideration of the proposed Agreement. The Trustees also discussed the proposed Agreement in an executive session with independent legal counsel at which no representatives of the Adviser were present. Set forth below is a summary of the material factors evaluated by the Trustees in determining whether to approve the Agreement for the Fund.
The Trustees considered information provided with respect to the Fund and the approval of the Agreement. Each Trustee attributed different weights to the various factors, and no factor alone was considered determinative. The Trustees determined that the proposed compensation to be received by the Adviser from the Fund under the Agreement was fair and reasonable and that the initial approval of the Agreement was in the best interests of the Fund and its potential shareholders.
The factors summarized below were considered and discussed by the Trustees in reaching their conclusions:
Nature, Extent and Quality of Services Provided by the Adviser
In connection with the approval of the initial Agreement, the Trustees considered the materials furnished specifically in connection with the approval of the Agreement, as well as other relevant information furnished for the Trustees. The Trustees considered the background and experience of the Adviser’s senior management and investment personnel of the Adviser. In addition, the Trustees reviewed the qualifications, backgrounds and responsibilities of the portfolio management team primarily responsible for the day-to-day management of the Fund. The Trustees also considered the investment strategy for the Fund, and the infrastructure supporting the portfolio management team. In addition, the Trustees considered information about the structure and distribution strategy of the Fund, how it fits within the Trust’s lineup, and how it will be positioned against identified peers.
The Trustees also considered their knowledge of the nature and quality of the services provided by the Adviser gained from their experience as Trustees of the Trust and in the financial industry. In addition, they considered the overall reputation and capabilities of the Adviser and its affiliates, the commitment of the Adviser to provide high quality service to the Trust, their overall confidence in the Adviser’s integrity and the Adviser’s responsiveness to questions or concerns raised by them.
Based upon these considerations and other factors, the Trustees concluded that they were satisfied with the nature, extent and quality of the investment advisory services to be provided to the Fund by the Adviser.
Fall-Out Benefits
The Trustees reviewed information regarding potential “fall-out” or ancillary benefits received by the Adviser and its affiliates as a result of their relationship with the Trust.
The Trustees also considered the fees that the Adviser will earn from the Fund for providing administrative services. The Trustees also considered the fees paid to JPMCB, an affiliate of the Adviser, for custody, transfer agency and other related services. The Trustees also considered that any fall-out or ancillary benefits would be comparable to those related to the other actively managed funds in the complex.
Economies of Scale
The Trustees considered the extent to which the Fund will benefit from economies of scale. The Trustees noted that neither the proposed investment advisory fee schedule nor the proposed administration agreement for the Fund contains breakpoints. The Trustees considered whether it would be appropriate to add advisory fee breakpoints. With respect to the administration agreement, the Trustees also considered the fact that the Fund would benefit from economies of scale for the broader J.P. Morgan fund complex because the administration fee had been set at a level consistent with the lower effective rate of the J.P. Morgan mutual funds, which includes breakpoints. The Trustees also noted that the Adviser has implemented fee waivers and expense limitations. The Trustees concluded that shareholders of the Fund will generally benefit from the lower expense ratios that result from these factors.
Investment Performance
The Trustees considered the Fund’s investment strategy and processes, the portfolio management team and competitive positioning against identified peer funds, and concluded that the prospects for competitive future performance were acceptable.
Advisory Fees and Expense Ratios
The Trustees considered the contractual advisory fee rate that will be paid by the Fund to the Adviser and compared that rate
| | | | | | | | |
| | | |
| FEBRUARY 28, 2017 | | JPMORGAN EXCHANGE-TRADED FUNDS | | | | | 29 | |
BOARD APPROVAL OF INITIAL INVESTMENT ADVISORY AGREEMENT
(Unaudited)
to the fees charged to mutual funds with similar investment objectives or in similar asset classes managed by the Adviser, as well as information prepared by Broadridge, using data from Lipper Inc., independent providers of investment company data, concerning management fee rates paid by other funds in the same Lipper category as the Fund. The Trustees also noted that the Adviser does not currently manage mutual funds or institutional accounts with the same or substantially similar strategies as the Fund. The Trustees also reviewed information about other projected expenses and the expense ratios for the
Fund. The Trustees considered the projected fee waiver and/or
expense reimbursement arrangements proposed for the Fund and considered the net advisory fee rate after taking into account any projected waivers and/or reimbursements.
The Trustees noted that the Fund’s estimated net advisory fees and total expenses were in line with identified peer funds. The Trustees also noted that because the Fund was not yet operational, no profitability information was available. After considering the factors identified above, in light of the information, the Trustees concluded that the advisory fees were reasonable.
| | | | | | |
| | | |
| 30 | | | | JPMORGAN EXCHANGE-TRADED FUNDS | | FEBRUARY 28, 2017 |
J.P. Morgan Exchange-Traded Funds are distributed by SEI Investments Distribution Co. (One Freedom Valley Dr., Oaks, PA 19456), which is not affiliated with JPMorgan Chase & Co. or any of its affiliates.
Contact J.P. Morgan Exchange-Traded Funds at 1-844-457-6383 (844-4JPM ETF) for a fund prospectus. You can also visit us at www.jpmorganfunds.com. Investors should carefully consider the investment objectives and risks as well as charges and expenses of the fund before investing. The prospectus contains this and other information about the fund. Read the prospectus carefully before investing.
Investors may obtain information about the Securities Investor Protection Corporation (SIPC), including the SIPC brochure by visiting www.sipc.org or by calling SIPC at 202-371-8300.
The Fund files a complete schedule of its fund holdings for the first and third quarters of its fiscal year with the SEC on Form N-Q. The Fund’s Forms N-Q is available on the SEC’s website at http://www.sec.gov and may be reviewed and copied at the SEC’s Public Reference Room in Washington, DC. Information on the operation of the SEC’s Public Reference Room may be obtained by calling 1-800-SEC-0330. Shareholders may request the Form N-Q without charge by calling 1-844-457-6383 or by visiting the J.P. Morgan Funds’ website at www.jpmorganfunds.com.
A description of each Fund’s policies and procedures with respect to the disclosure of each Fund’s holdings is available in the prospectus and Statement of Additional Information.
A copy of proxy policies and procedures is available without charge upon request by calling 1-844-457-6383 and on the Fund’s website at www.jpmorganfunds.com. A description of such policies and procedures is on the SEC’s website at www.sec.gov. The Trustees have delegated the authority to vote proxies for securities owned by the Fund to the Adviser. A copy of the Fund’s voting record for the most recent 12-month period ended June 30 is available on the SEC’s website at www.sec.gov or at the Fund’s website at www.jpmorganfunds.com no later than August 31 of each year. The Fund’s proxy voting record will include, among other things, a brief description of the matter voted on for each fund security, and will state how each vote was cast, for example, for or against the proposal.


J.P. Morgan Asset Management is the marketing name for the asset management business of JPMorgan Chase & Co. Those businesses include, but are not limited to, J.P. Morgan Investment Management Inc., Security Capital Research & Management Incorporated and J.P. Morgan Alternative Asset Management, Inc.
| | | | |
| | © JPMorgan Chase & Co., 2017. All rights reserved. February 2017. | | AN-DAETF-217 |
Disclose whether, as of the end of the period covered by the report, the registrant has adopted a code of ethics that applies to the registrant’s principal executive officer, principal financial officer, principal accounting officer or controller, or persons performing similar functions, regardless of whether these individuals are employed by the registrant or a third party. If the registrant has not adopted such a code of ethics, explain why it has not done so.
The registrant must briefly describe the nature of any amendment, during the period covered by the report, to a provision of its code of ethics that applies to the registrant’s principal executive officer, principal financial officer, principal accounting officer or controller, or persons performing similar functions, regardless of whether these individuals are employed by the registrant or a third party, and that relates to any element of the code of ethics definition enumerated in paragraph (b) of this Item. The registrant must file a copy of any such amendment as an exhibit pursuant to Item 12(a)(1), unless the registrant has elected to satisfy paragraph (f) of this Item by positing its code of ethics on its website pursuant to paragraph (f)(2) of this Item, or by undertaking to provide its code of ethics to any person without charge, upon request, pursuant to paragraph (f)(3) of this Item.
If the registrant has, during the period covered by the report, granted a waiver, including an implicit waiver, from a provision of the code of ethics that applies to the registrant’s principal executive officer, principal financial officer, principal accounting officer or controller, or persons performing similar functions, regardless of whether these individuals are employed by the registrant or third party, that relates to one or more items set forth in paragraph (b) of this Item, the registrant must briefly describe the nature of the waiver, the name of the person to whom the waiver was granted, and the date of the waiver.
The Registrant has adopted a code of ethics that applies to the Registrant’s principal executive officer and principal financial officer. There were no amendments to the code of ethics or waivers granted with respect to the code of ethics in the period covered by the report.
| ITEM 3. | AUDIT COMMITTEE FINANCIAL EXPERT. |
(a) (1) Disclose that the registrant’s board of directors has determined that the registrant either:
(i) Has at least one audit committee financial expert serving on its audit committee; or
(ii) Does not have an audit committee financial expert serving on its audit committee.
The Registrant’s Board of Trustees has determined that the Registrant has at least one audit committee financial expert serving on its audit committee. The Securities and Exchange Commission has stated that the designation or identification of a person as an audit committee financial expert pursuant to this Item 3 of Form N-CSR does not impose on such person any duties, obligations or liabilities that are greater than the duties, obligations and liabilities imposed on such person as a member of the Audit Committee and the Board of Trustees in the absence of such designation or identification.
(2) If the registrant provides the disclosure required by paragraph (a)(1)(i) of this Item, it must disclose the name of the audit committee financial expert and whether that person is “independent.” In order to be considered “independent” for purposes of this Item, a member of an audit committee may not, other than in his or her capacity as a member of the audit committee, the board of directors, or any other board committee:
(i) Accept directly or indirectly any consulting, advisory, or other compensatory fee from the issuer; or
(ii) Be an “interested person” of the investment company as defined in Section 2(a)(19) of the Act (15 U.S.C. 80a-2(a)(19)).
The audit committee financial experts are Gary L. French, Robert J. Grassi, Thomas P. Lemke, Lawrence R. Maffia, and Emily A. Youssouf, each of which is not an “interested person” of the Registrant and is also “independent” as defined by the U.S. Securities and Exchange Commission for purposes of audit committee financial expert determinations.
(3) If the registrant provides the disclosure required by paragraph (a)(1)(ii) of this Item, it must explain why it does not have an audit committee financial expert.
Not applicable.
| ITEM 4. | PRINCIPAL ACCOUNTANT FEES AND SERVICES. |
(a) Disclose, under the caption Audit Fees, the aggregate fees billed for each of the last two fiscal years for professional
services rendered by the principal accountant for the audit of the registrant’s annual financial statements or services that are normally provided by the accountant in connection with statutory and regulatory filings or engagements for those fiscal years.
AUDIT FEES
2017 – $ 74,000
2016 – $ 0
(b) Disclose, under the caption Audit-Related Fees, the aggregate fees billed in each of the last two fiscal years for assurance and related services by the principal accountant that are reasonably related to the performance of the audit of the registrant’s financial statements and are not reported under paragraph (a) of this Item. Registrants shall describe the nature of the services comprising the fees disclosed under this category.
AUDIT-RELATED FEES
2017 – $ 5,125
2016 – $ 0
Audit-related fees consist of security count procedures performed as required under Rule 17f-2 of the Investment Company Act of 1940 during the Registrant’s fiscal year.
(c) Disclose, under the caption Tax Fees, the aggregate fees billed in each of the last two fiscal years for professional services rendered by the principal accountant for tax compliance, tax advice, and tax planning. Registrants shall describe the nature of the services comprising the fees disclosed under this category.
TAX FEES
2017 – $ 14,535
2016 – $ 0
The tax fees consist of fees billed in connection with preparing the federal regulated investment company income tax returns for the Registrant for the tax years ended February 28, 2017 and 2016, respectively.
For the last fiscal year, no tax fees were required to be approved pursuant to paragraph (c)(7)(ii) of Rule 2-01 of Regulation S-X.
(d) Disclose, under the caption All Other Fees, the aggregate fees billed in each of the last two fiscal years for products and services provided by the principal accountant, other than the services reported in paragraphs (a) through (c) of this Item. Registrants shall describe the nature of the services comprising the fees disclosed under this category.
ALL OTHER FEES
2017 – $ 0
2016 – $ 0
(e) (1) Disclose the audit committee’s pre-approval policies and procedures described in paragraph (c)(7) of Rule 2-01 of Regulation S-X.
Pursuant to the Registrant’s Audit Committee Charter and written policies and procedures for the pre-approval of audit and non-audit services (the “Pre-approval Policy”), the Audit Committee pre-approves all audit and non-audit services performed by the Registrant’s independent public registered accounting firm for the Registrant. In addition, the Audit Committee pre-approves the auditor’s engagement for non-audit services with the Registrant’s investment adviser (not including a sub-adviser whose role is primarily portfolio management and is sub-contracted or overseen by another investment adviser) and any Service Affiliate in accordance with paragraph (c)(7)(ii) of Rule 2-01 of Regulation S-X, if the engagement relates directly to the operations and financial reporting of the Registrant. Proposed services may be pre-approved either 1) without consideration of specific case-by-case services or 2) require the specific pre-approval of the Audit Committee. Therefore, initially the Pre-approval Policy listed a number of audit and non-audit services that have been
approved by the Audit Committee, or which were not subject to pre-approval under the transition provisions of Sarbanes-Oxley Act of 2002 (the “Pre-approval List”). The Audit Committee annually reviews and pre-approves the services included on the Pre-approval List that may be provided by the independent public registered accounting firm without obtaining additional specific pre-approval of individual services from the Audit Committee. The Audit Committee adds to, or subtracts from, the list of general pre-approved services from time to time, based on subsequent determinations. All other audit and non-audit services not on the Pre-approval List must be specifically pre-approved by the Audit Committee.
One or more members of the Audit Committee may be appointed as the Committee’s delegate for the purposes of considering whether to approve such services. Any pre-approvals granted by the delegate will be reported, for informational purposes only, to the Audit Committee at its next scheduled meeting. The Audit Committee’s responsibilities to pre-approve services performed by the independent public registered accounting firm are not delegated to management.
(2) Disclose the percentage of services described in each of paragraphs (b) through (d) of this Item that were approved by the audit committee pursuant to paragraph (c)(7)(i)(C) of Rule 2-01 of Regulation S-X.
2017 – 0.0%
2016 – 0.0%
(f) If greater than 50 percent, disclose the percentage of hours expended on the principal accountant’s engagement to audit the registrant’s financial statements for the most recent fiscal year that were attributed to work performed by persons other than the principal accountant’s full-time, permanent employees.
Not applicable. Less than 50%.
(g) Disclose the aggregate non-audit fees billed by the registrant’s accountant for services rendered to the registrant, and rendered to the registrant’s investment adviser (not including any sub-adviser whose role is primarily portfolio management and is subcontracted with or overseen by another investment adviser), and any entity controlling, controlled by, or under common control with the adviser that provides ongoing services to the registrant for each of the last two fiscal years of the registrant.
The aggregate non-audit fees billed by the independent registered public accounting firm for services rendered to the Registrant, and rendered to Service Affiliates, for the last two calendar year ends were:
2016 – $28.3 million
2015 – $29.2 million
(h) Disclose whether the registrant’s audit committee of the board of directors has considered whether the provision of non-audit services that were rendered to the registrant’s investment adviser (not including any subadviser whose role is primarily portfolio management and is subcontracted with or overseen by another investment adviser), and any entity controlling, controlled by, or under common control with the investment adviser that provides ongoing services to the registrant that were not pre-approved pursuant to paragraph (c)(7)(ii) of Rule 2-01 of Regulation S-X is compatible with maintaining the principal accountant’s independence.
The Registrant’s Audit Committee has considered whether the provision of the non-audit services that were rendered to Service Affiliates that were not pre-approved (not requiring pre-approval) is compatible with maintaining the independent public registered accounting firm’s independence. All services provided by the independent public registered accounting firm to the Registrant or to Service Affiliates that were required to be pre-approved were pre-approved as required.
| ITEM 5. | AUDIT COMMITTEE OF LISTED REGISTRANTS. |
(a) If the registrant is a listed issuer as defined in Rule 10A-3 under the Exchange Act (17CFR 240.10A-3), state whether or not the registrant has a separately-designated standing audit committee established in accordance with Section 3(a)(58)(A) of the Exchange Act (15 U.S.C. 78c(a)(58)(A)). If the registrant has such a committee, however designated, identify each committee member. If the entire board of directors is acting as the registrant’s audit committee as specified in Section 3(a)(58)(B) of the Exchange Act (15 U.S.C. 78c(a)(58)(B)), so state.
The registrant has a separately designated Audit Committee established in accordance with Section 3(a)(58)(A) of the Exchange Act. The members of the Audit Committee are Gary L. French, Robert J. Grassi, Thomas P. Lemke, Lawrence R. Maffia, and Emily A. Youssouf.
(b) If applicable, provide the disclosure required by Rule 10A-3(d) under the Exchange Act (17CFR 240.10A-3(d)) regarding an exemption from the listing standards for all audit committees.
Not applicable.
| ITEM 6. | SCHEDULE OF INVESTMENTS. |
File Schedule I – Investments in securities of unaffiliated issuers as of the close of the reporting period as set forth in Section 210.12-12 of Regulation S-X, unless the schedule is included as part of the report to shareholders filed under Item 1 of this Form.
Included in Item 1.
| ITEM 7. | DISCLOSURE OF PROXY VOTING POLICIES AND PROCEDURES FOR CLOSED-END MANAGEMENT INVESTMENT COMPANIES. |
A closed-end management investment company that is filing an annual report on this Form N-CSR must, unless it invests exclusively in non-voting securities, describe the policies and procedures that it uses to determine how to vote proxies relating to portfolio securities, including the procedures that the company uses when a vote presents a conflict between the interests of its shareholders, on the one hand, and those of the company’s investment adviser; principal underwriter; or any affiliated person (as defined in Section 2(a)(3) of the Investment Company Act of 1940 (15 U.S.C. 80a-2(a)(3)) and the rules thereunder) of the company, its investment adviser, or its principal underwriter, on the other. Include any policies and procedures of the company’s investment adviser, or any other third party, that the company uses, or that are used on the company’s behalf, to determine how to vote proxies relating to portfolio securities.
Not applicable.
| ITEM 8. | PORTFOLIO MANAGERS OF CLOSED-END MANAGEMENT INVESTMENT COMPANIES. |
Not applicable.
| ITEM 9. | PURCHASE OF EQUITY SECURITIES BY CLOSED-END MANAGEMENT INVESTMENT COMPANY AND AFFILIATED PURCHASERS. |
(a) If the registrant is a closed-end management investment company, provide the information specified in paragraph (b) of this Item with respect to any purchase made by or on behalf of the registrant or any “affiliated purchaser,” as defined in Rule 10b-18(a)(3) under the Exchange Act (17 CFR 240.10b-18(a)(3)), of shares or other units of any class of the registrant’s equity securities that is registered by the registrant pursuant to Section 12 of the Exchange Act (15 U.S.C. 781).
Not applicable.
| ITEM 10. | SUBMISSION OF MATTERS TO A VOTE OF SECURITY HOLDERS. |
Describe any material changes to the procedures by which shareholders may recommend nominees to the registrant’s board of directors, where those changes were implemented after the registrant last provided disclosure in response to the requirements of Item 7(d)(2)(ii)(G) of Schedule 14A (17 CFR 240.14a-101), or this Item.
No material changes to report.
| ITEM 11. | CONTROLS AND PROCEDURES. |
(a) Disclose the conclusions of the registrant’s principal executive and principal financial officers, or persons performing similar functions, regarding the effectiveness of the registrant’s disclosure controls and procedures (as defined in Rule 30a-3(c) under the Act (17 CFR 270.30a-3(c))) as of a date within 90 days of the filing date of the report that includes the disclosure required by this paragraph, based on the evaluation of these controls and procedures required by Rule 30a-3(b) under the Act (17 CFR 270.30a-3(b)) and Rules 13a-15(b) or 15d-15(b) under the Exchange Act (17 CFR 240.13a-15(b) or 240.15d-15(b)).
The Registrant’s principal executive and principal financial officers have concluded, based on their evaluation of the Registrant’s disclosure controls and procedures as of a date within 90 days of the filing date of this report, that the Registrant’s disclosure controls and procedures are reasonably designed to ensure that information required to be disclosed by the Registrant on Form N-CSR is recorded, processed, summarized and reported within the required time periods and that information required to be disclosed by the Registrant in the reports that it files or submits on Form N-CSR is accumulated and communicated to the Registrant’s management, including its principal executive and principal financial officers, as appropriate to allow timely decisions regarding required disclosure.
(b) Disclose any change in the registrant’s internal control over financial reporting (as defined in Rule 30a-3(d) under the Act (17 CFR 270.30a-3(d)) that occurred during the registrant’s second fiscal quarter of the period covered by this report that has materially affected, or is reasonably likely to materially affect, the registrant’s internal control over financial reporting.
There were no changes in the Registrant’s internal control over financial reporting that occurred during the last fiscal quarter covered by this report that have materially affected, or are reasonably likely to materially affect, the Registrant’s internal control over financial reporting.
| (a) | File the exhibits listed below as part of this Form. Letter or number the exhibits in the sequence indicated. |
(a)(1) Any code of ethics, or amendment thereto, that is the subject of the disclosure required by Item 2, to the extent that the registrant intends to satisfy the Item 2 requirements through filing of an exhibit.
Code of Ethics applicable to its Principal Executive and Principal Financial Officers pursuant to Section 406 of the Sarbanes-Oxley Act of 2002 attached hereto.
(a)(2) A separate certification for each principal executive officer and principal financial officer of the registrant as required by Rule 30a-2(a) under the Act (17 CFR 270.30a-2).
Certifications pursuant to Rule 30a-2(a) under the Investment Company Act of 1940 are attached hereto.
(a)(3) Any written solicitation to purchase securities under Rule 23c-1 under the Act (17 CFR 270.23c-1) sent or given during the period covered by the report by or on behalf of the registrant to 10 or more persons.
Not applicable.
(b) A separate or combined certification for each principal executive officer and principal officer of the registrant as required by Rule 30a-2(b) under the Act of 1940.
Certifications pursuant to Rule 30a-2(b) under the Investment Company Act of 1940 are attached hereto.
SIGNATURES
Pursuant to the requirements of the Securities Exchange Act of 1934 and the Investment Company Act of 1940, the registrant has duly caused this report to be signed on its behalf by the undersigned, thereunto duly authorized.
| | |
| J.P. Morgan Exchange-Traded Fund Trust |
| |
| By: | | /s/ Robert F. Deutsch |
| | Robert F. Deutsch |
| | President and Principal Executive Officer |
| | April 24, 2017 |
Pursuant to the requirements of the Securities Exchange Act of 1934 and the Investment Company Act of 1940, this report has been signed below by the following persons on behalf of the registrant and in the capacities and on the dates indicated.
| | |
| By: | | /s/ Robert F. Deutsch |
| | Robert F. Deutsch |
| | President and Principal Executive Officer |
| | April 24, 2017 |
| | |
| By: | | /s/ Lauren A. Paino |
| | Lauren A. Paino |
| | Treasurer and Principal Financial Officer |
| | April 24, 2017 |