UNITED STATES
SECURITIES AND EXCHANGE COMMISSION
Washington, D.C. 20549
FORM N-CSR
CERTIFIED SHAREHOLDER REPORT OF REGISTERED
MANAGEMENT INVESTMENT COMPANIES
Investment Company Act File Number: 811-22410
| T. Rowe Price Real Assets Fund, Inc. |
|
| (Exact name of registrant as specified in charter) |
| |
| 100 East Pratt Street, Baltimore, MD 21202 |
|
| (Address of principal executive offices) |
| |
| David Oestreicher |
| 100 East Pratt Street, Baltimore, MD 21202 |
|
| (Name and address of agent for service) |
Registrant’s telephone number, including area code: (410) 345-2000
Date of fiscal year end: December 31
Date of reporting period: June 30, 2015
Item 1. Report to Shareholders
| Real Assets Fund | June 30, 2015 |

The views and opinions in this report were current as of June 30, 2015. They are not guarantees of performance or investment results and should not be taken as investment advice. Investment decisions reflect a variety of factors, and the managers reserve the right to change their views about individual stocks, sectors, and the markets at any time. As a result, the views expressed should not be relied upon as a forecast of the fund’s future investment intent. The report is certified under the Sarbanes-Oxley Act, which requires mutual funds and other public companies to affirm that, to the best of their knowledge, the information in their financial reports is fairly and accurately stated in all material respects.
REPORTS ON THE WEB
Sign up for our E-mail Program, and you can begin to receive updated fund reports and prospectuses online rather than through the mail. Log in to your account at troweprice.com for more information.
Manager’s Letter
Fellow Shareholders
Real assets stocks declined in the first six months of 2015 against a challenging market and economic backdrop. Natural resources equities rallied early in the period before falling in June amid concerns about slowing demand from China, debt woes in Greece, and a strong U.S. dollar. U.S. and global real estate securities declined as investors reacted to the prospect of interest rate hikes by the Federal Reserve later this year. Although underlying fundamentals did not materially change in the real estate environment, the expectation for higher interest rates caused long-term bond yields to rise in the second quarter, leading to a sell-off in equities thought to be more sensitive to interest rates, including real estate.
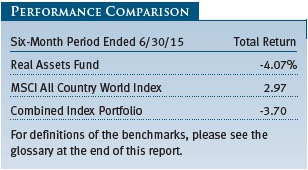
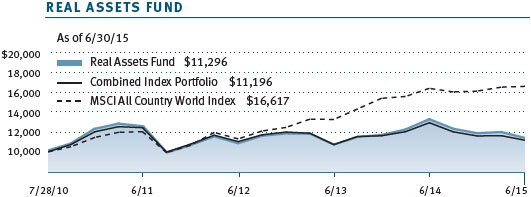
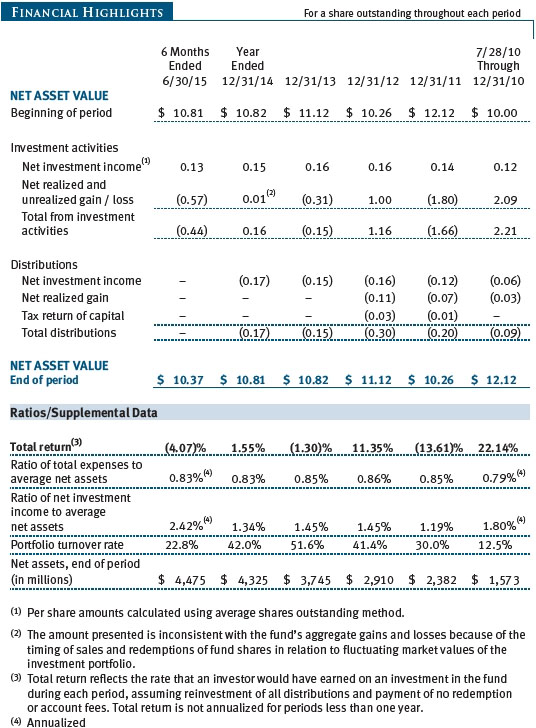
As shown in the Performance Comparison table, the Real Assets Fund returned -4.07% for the six months ended June 30, 2015. The fund trailed the broader global equities market, as represented by the MSCI All Country World Index, and lagged its combined index portfolio—a custom blended benchmark that we believe provides a more appropriate performance comparison—by a narrower margin. All of our underlying investment sectors declined in absolute terms. Security selection in the fund’s underlying portfolios helped results versus our combined index portfolio, while decisions to overweight and underweight various asset classes detracted from relative performance.
As the fund approaches its five-year anniversary, we thought it would be worthwhile to revisit some of the principles behind its creation. When we designed our investment strategy, we recognized that the Real Assets Fund would likely struggle against the broader global equities market in a low-inflation, slow-growth environment like we are now experiencing. Our approach is to diversify the portfolio across a range of assets that tend to perform differently under a given inflation scenario, with the goal to smooth returns over time under a full range of inflation regimes. This approach helped in the last half of 2014 as positive returns in our U.S. and international real estate portfolios helped to offset sharp losses in our energy and metals shares. Unfortunately, the prospect of higher U.S. interest rates eroded the support from real estate stocks in the first six months of 2015. We believe that incorporating investments with more attractive inflation sensitivity to complement traditional equity investments should provide better long-term outcomes. While the environment over the last few years has been less than favorable for an inflation-sensitive strategy such as ours, we continue to recognize the benefits of its inclusion in a broad portfolio context.
ECONOMIC AND MARKET ENVIRONMENT
U.S. stocks recorded modest overall gains in the first half of 2015. The U.S. economy contracted in the first quarter of 2015, due largely to temporary factors, including harsh winter weather and labor unrest at West Coast ports. Evidence suggests that growth resumed in the second quarter, with solid jobs and income growth, increased consumer spending, and improvement in the housing market. As has been telegraphed for some time, the Federal Reserve looks poised to begin raising short-term interest rates in the second half of the year, although Fed Chair Janet Yellen has indicated that the pace of increases will be gradual with a careful eye on underlying economic data. The U.S. dollar remains strong relative to most other currencies, but dollar strength moderated somewhat after the greenback’s sharp appreciation in the closing months of 2014.
Stocks in overseas developed markets outgained the U.S. market. European equities generated solid gains after the European Central Bank’s (ECB’s) recently implemented quantitative easing (QE) program appeared to have had some success in weakening the euro, boosting exports, and helping loan growth. However, unemployment in the periphery nations is still elevated, and political and economic uncertainty is still high in Greece, where fractious negotiations with creditors over the country’s unsustainable debt rattled global markets at the end of the reporting period. Japanese stocks climbed by double digits in U.S. dollar terms, supported by QE and good economic growth in the first quarter of 2015. However, consumer spending and wage growth remain muted, and structural reforms have been slow to materialize.
Emerging markets equities outpaced U.S. shares but lagged non-U.S. developed markets. Underlying returns were mixed, however, as slower global economic growth continues to expose the divergent fiscal, monetary, and political conditions among emerging countries. A stronger U.S. dollar and lower prices for oil and other commodities may widen the gap between commodity importers and challenged commodity exporters. Volatility could increase amid concerns about slowing growth in China and the potential impact of interest rate hikes in the U.S., though it should be less turbulent than 2013’s “taper tantrum” because there are fewer speculative investors chasing higher yields, and U.S. rate hikes are already being priced into most currencies.
Real assets-related equities declined in the first half of 2015. Natural resources stocks fell for the reporting period, although the scale of the losses moderated somewhat from the sharp declines seen in the latter half of 2014. Tepid global economic growth, a strong U.S. dollar, productive North American shale assets, and Saudi Arabia’s refusal to cut oil production to support prices set up challenging obstacles for the commodities complex. U.S. real estate investment trusts (REITs) fell sharply. U.S. REIT performance is significantly affected by the interest rate environment, and the prospect of Federal Reserve interest rate hikes later in 2015 weighed on the asset class. REITs fared somewhat better outside the U.S., but underlying returns were mixed. Despite the drag arising from the prospect of higher U.S. interest rates, real estate fundamentals remain healthy across all property types, with strong demand and limited supply.
PORTFOLIO REVIEW
Our natural resources stocks declined during the past six months. The market environment stabilized somewhat during the period as a reduction in U.S. energy exploration activity in response to sharply lower oil prices provided some support. Oil-related stocks retreated again in June in the face of slowing economic growth in China, Greece’s debt troubles, and robust production in Saudi Arabia and Iraq. U.S. oil prices are now down over 50% from their peak from a few years ago, and U.S. natural gas prices have fallen by almost 80% since 2008.
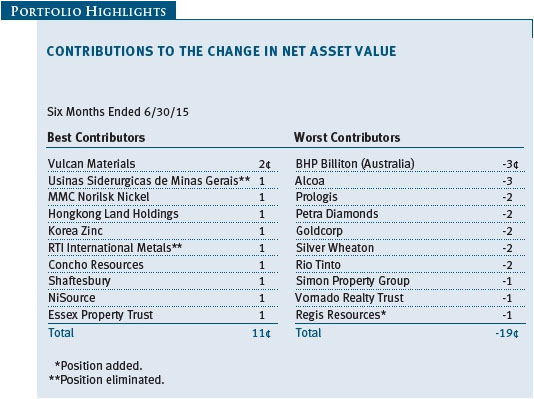
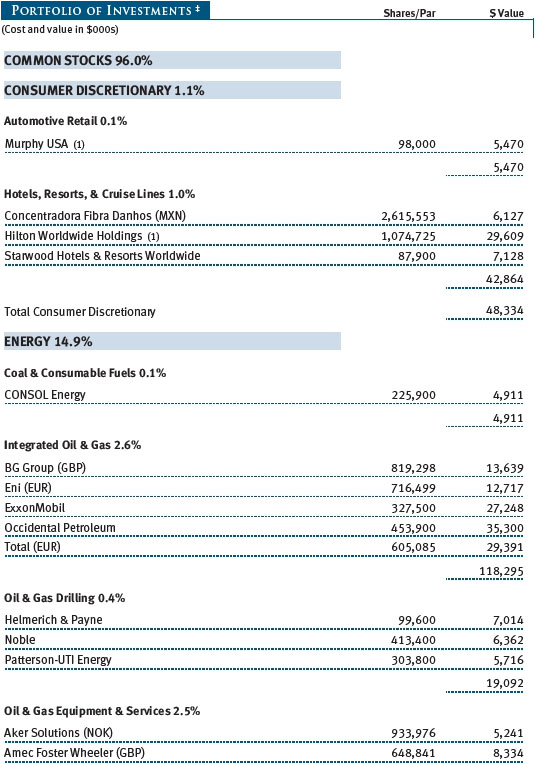
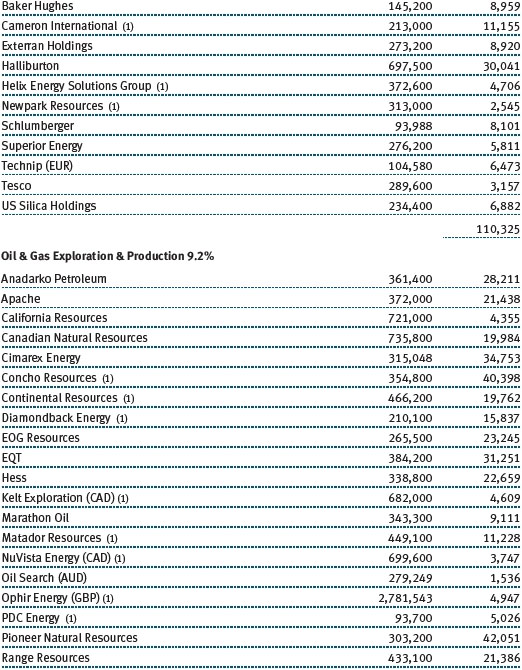
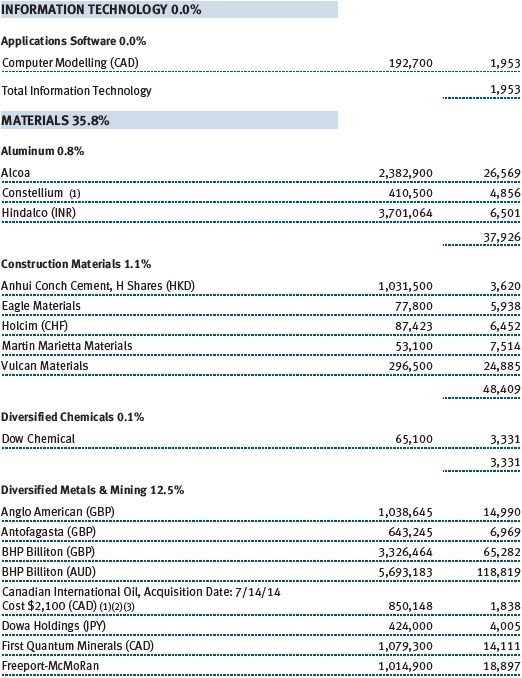
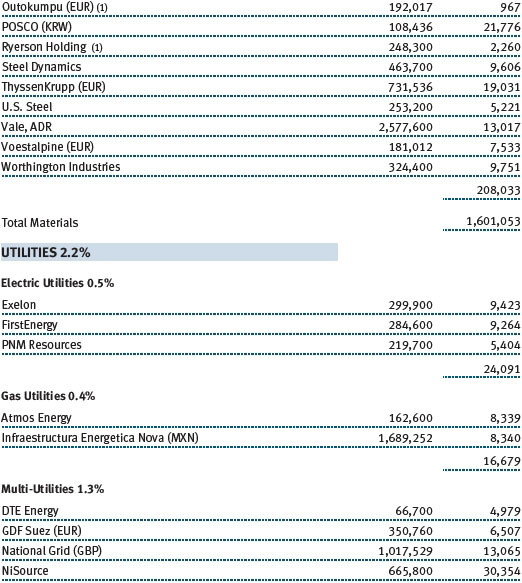
Most of our energy-related holdings declined. There were a few relative bright spots, however. These included low-cost oil producers with exposure to the Permian Basin, such as Concho Resources. Construction materials companies, such as Vulcan Materials, were positive contributors as the U.S. construction market continued to firm. We view utilities favorably relative to their commodity-producing peers as a number of utilities benefited from low natural gas prices. One such stock that contributed favorably to performance was NiSource, which recently split into a regulated utility and midstream company. (Please refer to the portfolio of investments for a complete list of holdings and the amount each represents in the portfolio.)
Commodity prices often move in tandem with energy prices—a factor that contributed to disappointing results in our metals and mining stocks. Weak demand from China, the overhang of previous investment cycles, and the strong U.S. dollar posed additional challenges. Aluminum producer Alcoa was one of the fund’s largest detractors. New aluminum supply coming to market has pressured prices, and investors also expressed concern that the company may have taken on too much leverage in its takeover of RTI International Metals. We also owned RTI, and the premium received in the buyout helped to offset some of the Alcoa weakness.
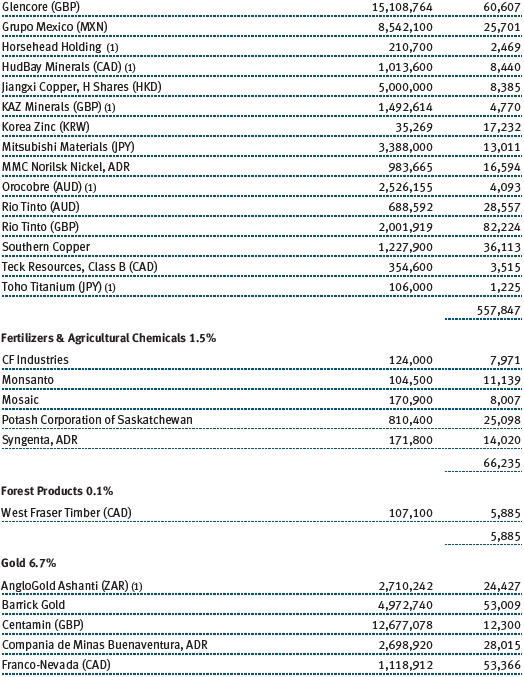
Prices for iron ore have fallen from approximately $130 per ton in late 2013 to around $50 per ton in June 2015, punishing miners Rio Tinto, Vale, and BHP Billiton, which have significant iron exposure. Despite the difficult commodity price environment, Usiminas, Brazil’s largest steel producer, rallied sharply during the first quarter due to a shareholder battle for the company. We benefited from holding voting shares versus non-voting shares and exited our position during the second quarter. Smelting company Korea Zinc benefited from superior technology that improves its profitability relative to its industry peers, while capacity additions are expected to support further production and earnings growth.
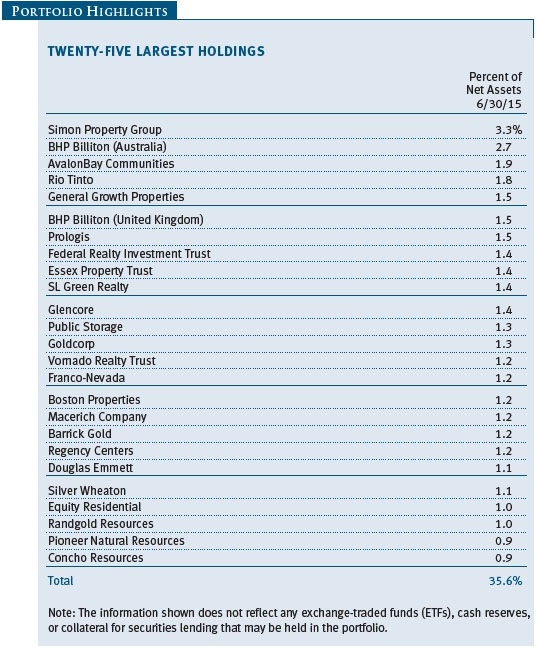
Over previous reporting periods, good performance in our real estate holdings helped to offset weakness in our commodity-oriented investments. While fundamentals in the real estate sector did not materially change, expectations of higher interest rates caused long-term bond yields to rise, which led to a sell-off in equities thought to be more sensitive to interest rates, including real estate. Prologis detracted from results as investors questioned the strategic merits and potential funding sources for a recent acquisition. Vornado Realty Trust also lagged as the company’s Washington, D.C., portfolio experienced higher-than-usual vacancy levels due to a weak leasing environment. Regional mall operators General Growth Properties and Simon Property Group were among our biggest detractors. Apartment REIT shares were a bright spot within the U.S. market, generating strong returns as the unemployment and homeownership rates continued to decline. New construction of apartments has increased, but rental growth remains robust for properties in desirable locations, like those of Essex Property Trust.
Real estate holdings outside the U.S. offered somewhat better returns. Rental growth and UK property values rose strongly, supported by strong demand for office and retail space in London. We enjoyed positive returns from some of our West End assets, including Shaftesbury. Hong Kong real estate stocks gained as data indicated a pickup in office demand and continued improvement in the vacancy rate in Hong Kong Central. Hongkong Land Holdings was a standout performer as the central district’s office vacancy rate tightened to a low level and rental growth accelerated.
OUTLOOK
We expect modest global economic growth in 2015. Despite expectations for stronger U.S. growth in the back half of the year, a weak start to the year means that full-year 2015 projections are falling below 3%, which would be the 10th consecutive year of less than 3% growth. Inflation remains below the Fed’s 2% target, although there is some evidence that wages are beginning to rise from trough levels, which could boost consumer demand and prices. Fed policy remains broadly accommodative, but the central bank is on track to begin raising interest rates later this year, with a gradual pace for subsequent rate hikes depending on economic data. On the corporate front, U.S. profit and revenue growth are expected to decline by low-single digits, weighed down by weakness in the energy sector. However, healthy balance sheets and cash flows grant companies a measure of flexibility to increase capital spending, engage in merger and acquisition activity, and return capital to shareholders through dividend increases and share buybacks.
Europe’s economy appears to have improved, with 2015 growth expectations supported by diminished fiscal headwinds; an improved credit environment; low energy costs; and a weaker euro, which is expected to boost exports. Monetary policy remains highly accommodative as the ECB’s QE program continues. Stronger capital spending helped Japan’s economy grow by 3.9% in the first quarter of 2015, the country’s second consecutive quarter of expansion. Fiscal conditions and monetary policies in emerging markets continue to diverge across countries as the secular decline in prices for energy and other commodities is helping commodity importers with lower inflation, while other countries dependent on commodity exports are facing slower growth. Weak economic data persist in China, with recent volatility in the country’s equity market raising fears of a bubble.
As we have written in previous shareholder letters, we believe that we are in the initial years of a secular down cycle in commodities. Energy prices, in particular, have fallen precipitously over the past few years. Although cheaper energy benefits U.S. consumers’ budgets and energy-intensive manufacturers, it challenges the stocks of energy producers, particularly energy service companies. Falling oil prices have also punished energy-exporting economies in the developing world and affected the U.S. high yield bond market, approximately 20% of which is composed of energy companies. Lackluster economic growth outside the U.S., particularly in China, and a stronger U.S. dollar spell continued trouble for a wide range of commodities, including industrial metals and energy.
Despite the headwinds that higher interest rates have created, we continue to be positive on the fundamentals of real estate. There has been relatively little development of new commercial real estate projects relative to previous recovery periods. This has allowed solid occupancy gains and positive rental growth over the past few years, driving increasing cash flows, net asset values, and dividends. We expect the favorable supply and demand imbalance to continue over the next few years and, therefore, believe that good operating fundamentals should persist. While the prospect of higher interest rates may weigh on U.S. real estate stocks, low interest rates and accommodative monetary policies should provide some support in non-U.S. markets, particularly Europe and Japan.
Against the backdrop of a challenging investment environment, we believe that highly diversified portfolios and a careful focus on fundamental research can enhance our ability to identify investment opportunities on behalf of our shareholders.
Respectfully submitted,

Wyatt A. Lee
Portfolio manager and chairman of the fund’s Investment Advisory Committee
July 27, 2015
The committee chairman has day-to-day responsibility for managing the portfolio and works with committee members in developing and executing its investment program.
RISKS OF STOCK INVESTING
The fund’s share price can fall because of weakness in the stock markets, a particular industry, or specific holdings. Stock markets can decline for many reasons, including adverse political or economic developments, changes in investor psychology, or heavy institutional selling. The prospects for an industry or company may deteriorate because of a variety of factors, including disappointing earnings or changes in the competitive environment. In addition, the investment manager’s assessment of companies held in a fund may prove incorrect, resulting in losses or poor performance even in rising markets. Funds that invest only in specific industries will experience greater volatility than funds investing in a broad range of industries. The rate of earnings growth of natural resources companies may be irregular since these companies are strongly affected by natural forces, global economic cycles, and international politics. For example, stock prices of energy companies can fall sharply when oil prices decrease.
GLOSSARY
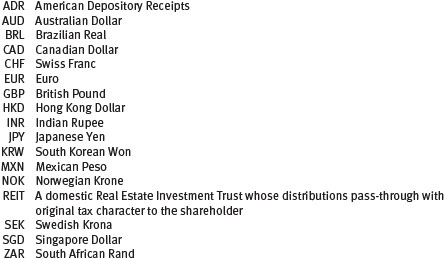
Combined index portfolio: An unmanaged stock portfolio consisting of 30% global natural resources (65% MSCI All Country World Index Energy and 35% MSCI All Country World Index Materials), 20% U.S. real estate (Wilshire U.S. Real Estate Securities Index), 20% global real estate (FTSE EPRA/NAREIT Developed Index), 25% global metals and mining (MSCI All Country World Index Metals & Mining), and 5% precious metals (80% MSCI All Country World Index IMI Gold and 20% MSCI All Country World Index IMI Precious Metals & Minerals).
| ● | FTSE EPRA/NAREIT Developed Index: An index that tracks the performance of developed market real estate securities.
|
| ● | MSCI All Country World Index Energy: An index that tracks the performance of companies engaged in the exploration and production of energy commodities.
|
| ● | MSCI All Country World Index IMI Gold: An index that tracks the performance of companies engaged in the exploration and production of gold.
|
| ● | MSCI All Country World Index IMI Precious Metals & Minerals: An index that tracks the performance of companies engaged in the exploration and production of precious metals and minerals.
|
| ● | MSCI All Country World Index Materials: An index that tracks the performance of companies engaged in the exploration and production of basic materials.
|
| ● | MSCI All Country World Index Metals & Mining: An index that tracks the performance of metals and mining companies.
|
| ● | Wilshire U.S. Real Estate Securities Index: An index that tracks the performance of publicly traded U.S. real estate securities. |
MSCI All Country World Index: A capitalization-weighted index of stocks from developed and emerging markets worldwide.
Real estate investment trusts (REITs): Publicly traded companies that own, develop, and operate apartment complexes, hotels, office buildings, and other commercial properties.
Note: MSCI makes no express or implied warranties or representations and shall have no liability whatsoever with respect to any MSCI data contained herein. The MSCI data may not be further redistributed or used as a basis for other indices or any securities or financial products. This report is not approved, reviewed, or produced by MSCI.
Performance and Expenses
This chart shows the value of a hypothetical $10,000 investment in the fund over the past 10 fiscal year periods or since inception (for funds lacking 10-year records). The result is compared with benchmarks, which may include a broad-based market index and a peer group average or index. Market indexes do not include expenses, which are deducted from fund returns as well as mutual fund averages and indexes.
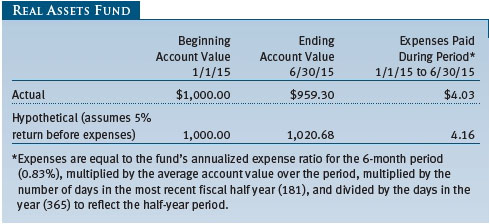
As a mutual fund shareholder, you may incur two types of costs: (1) transaction costs, such as redemption fees or sales loads, and (2) ongoing costs, including management fees, distribution and service (12b-1) fees, and other fund expenses. The following example is intended to help you understand your ongoing costs (in dollars) of investing in the fund and to compare these costs with the ongoing costs of investing in other mutual funds. The example is based on an investment of $1,000 invested at the beginning of the most recent six-month period and held for the entire period.
Actual Expenses
The first line of the following table (Actual) provides information about actual account values and expenses based on the fund’s actual returns. You may use the information on this line, together with your account balance, to estimate the expenses that you paid over the period. Simply divide your account value by $1,000 (for example, an $8,600 account value divided by $1,000 = 8.6), then multiply the result by the number on the first line under the heading “Expenses Paid During Period” to estimate the expenses you paid on your account during this period.
Hypothetical Example for Comparison Purposes
The information on the second line of the table (Hypothetical) is based on hypothetical account values and expenses derived from the fund’s actual expense ratio and an assumed 5% per year rate of return before expenses (not the fund’s actual return). You may compare the ongoing costs of investing in the fund with other funds by contrasting this 5% hypothetical example and the 5% hypothetical examples that appear in the shareholder reports of the other funds. The hypothetical account values and expenses may not be used to estimate the actual ending account balance or expenses you paid for the period.
Note: T. Rowe Price charges an annual account service fee of $20, generally for accounts with less than $10,000. The fee is waived for any investor whose T. Rowe Price mutual fund accounts total $50,000 or more; accounts electing to receive electronic delivery of account statements, transaction confirmations, prospectuses, and shareholder reports; or accounts of an investor who is a T. Rowe Price Preferred Services, Personal Services, or Enhanced Personal Services client (enrollment in these programs generally requires T. Rowe Price assets of at least $100,000). This fee is not included in the accompanying table. If you are subject to the fee, keep it in mind when you are estimating the ongoing expenses of investing in the fund and when comparing the expenses of this fund with other funds.
You should also be aware that the expenses shown in the table highlight only your ongoing costs and do not reflect any transaction costs, such as redemption fees or sales loads. Therefore, the second line of the table is useful in comparing ongoing costs only and will not help you determine the relative total costs of owning different funds. To the extent a fund charges transaction costs, however, the total cost of owning that fund is higher.
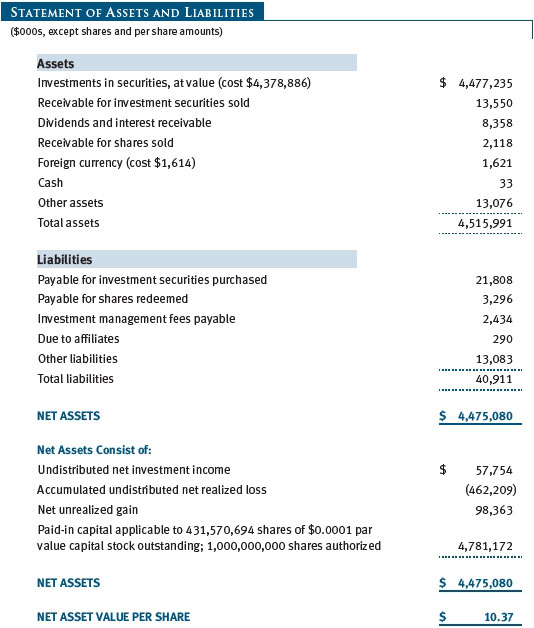
Unaudited
The accompanying notes are an integral part of these financial statements.
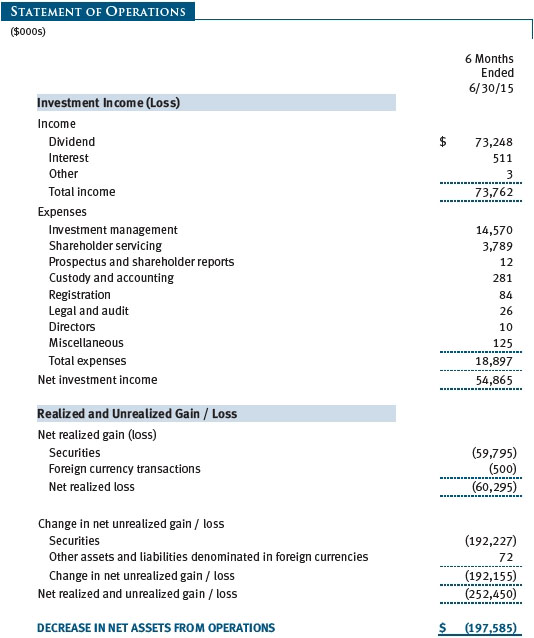
Unaudited
The accompanying notes are an integral part of these financial statements.
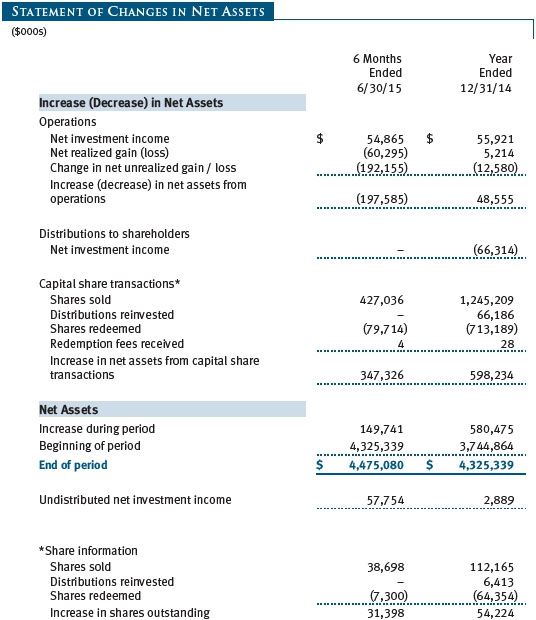
Unaudited
The accompanying notes are an integral part of these financial statements.
Unaudited
The accompanying notes are an integral part of these financial statements.
Unaudited
The accompanying notes are an integral part of these financial statements.
Unaudited
| Notes to Financial Statements |
T. Rowe Price Real Assets Fund (the fund), is registered under the Investment Company Act of 1940 (the 1940 Act) as a diversified, open-end management investment company. The fund commenced operations on July 28, 2010. The fund seeks to provide long-term growth of capital.
NOTE 1 - SIGNIFICANT ACCOUNTING POLICIES
Basis of Preparation The fund is an investment company and follows accounting and reporting guidance in the Financial Accounting Standards Board (FASB) Accounting Standards Codification Topic 946 (ASC 946). The accompanying financial statements were prepared in accordance with accounting principles generally accepted in the United States of America (GAAP), including but not limited to ASC 946. GAAP requires the use of estimates made by management. Management believes that estimates and valuations are appropriate; however, actual results may differ from those estimates, and the valuations reflected in the accompanying financial statements may differ from the value ultimately realized upon sale or maturity.
Investment Transactions, Investment Income, and Distributions Income and expenses are recorded on the accrual basis. Premiums and discounts on debt securities are amortized for financial reporting purposes. Dividends received from mutual fund investments are reflected as dividend income; capital gain distributions are reflected as realized gain/loss. Dividend income and capital gain distributions are recorded on the ex-dividend date. Income tax-related interest and penalties, if incurred, would be recorded as income tax expense. Investment transactions are accounted for on the trade date. Realized gains and losses are reported on the identified cost basis. Distributions to shareholders are recorded on the ex-dividend date. Distributions from REITs are initially recorded as dividend income and, to the extent such represent a return of capital or capital gain for tax purposes, are reclassified when such information becomes available. Income distributions are declared and paid annually. Capital gain distributions, if any, are generally declared and paid by the fund annually.
Currency Translation Assets, including investments, and liabilities denominated in foreign currencies are translated into U.S. dollar values each day at the prevailing exchange rate, using the mean of the bid and asked prices of such currencies against U.S. dollars as quoted by a major bank. Purchases and sales of securities, income, and expenses are translated into U.S. dollars at the prevailing exchange rate on the date of the transaction. The effect of changes in foreign currency exchange rates on realized and unrealized security gains and losses is reflected as a component of security gains and losses.
Rebates Subject to best execution, the fund may direct certain security trades to brokers who have agreed to rebate a portion of the related brokerage commission to the fund in cash. Commission rebates are reflected as realized gain on securities in the accompanying financial statements and totaled $24,000 for the six months ended June 30, 2015.
Redemption Fees A 2% fee is assessed on redemptions of fund shares held for 90 days or less to deter short-term trading and to protect the interests of long-term shareholders. Redemption fees are withheld from proceeds that shareholders receive from the sale or exchange of fund shares. The fees are paid to the fund and are recorded as an increase to paid-in capital. The fees may cause the redemption price per share to differ from the net asset value per share.
New Accounting Guidance In June 2014, FASB issued Accounting Standards Update (ASU) No. 2014-11, Transfers and Servicing (Topic 860), Repurchase-to-Maturity Transactions, Repurchase Financings, and Disclosures. The ASU changes the accounting for certain repurchase agreements and expands disclosure requirements related to repurchase agreements, securities lending, repurchase-to-maturity and similar transactions. The ASU is effective for interim and annual reporting periods beginning after December 15, 2014. Adoption will have no effect on the fund’s net assets or results of operations.
In May 2015, FASB issued ASU No. 2015-07, Fair Value Measurement (Topic 820), Disclosures for Investments in Certain Entities That Calculate Net Asset Value per Share (or Its Equivalent). The ASU removes the requirement to categorize within the fair value hierarchy all investments for which fair value is measured using the net asset value per share practical expedient and amends certain disclosure requirements for such investments. The ASU is effective for interim and annual reporting periods beginning after December 15, 2015. Adoption will have no effect on the fund’s net assets or results of operations.
NOTE 2 - VALUATION
The fund’s financial instruments are valued and its net asset value (NAV) per share is computed at the close of the New York Stock Exchange (NYSE), normally 4 p.m. ET, each day the NYSE is open for business.
Fair Value The fund’s financial instruments are reported at fair value, which GAAP defines as the price that would be received to sell an asset or paid to transfer a liability in an orderly transaction between market participants at the measurement date. The T. Rowe Price Valuation Committee (the Valuation Committee) has been established by the fund’s Board of Directors (the Board) to ensure that financial instruments are appropriately priced at fair value in accordance with GAAP and the 1940 Act. Subject to oversight by the Board, the Valuation Committee develops and oversees pricing-related policies and procedures and approves all fair value determinations. Specifically, the Valuation Committee establishes procedures to value securities; determines pricing techniques, sources, and persons eligible to effect fair value pricing actions; oversees the selection, services, and performance of pricing vendors; oversees valuation-related business continuity practices; and provides guidance on internal controls and valuation-related matters. The Valuation Committee reports to the Board; is chaired by the fund’s treasurer; and has representation from legal, portfolio management and trading, operations, and risk management.
Various valuation techniques and inputs are used to determine the fair value of financial instruments. GAAP establishes the following fair value hierarchy that categorizes the inputs used to measure fair value:
Level 1 – quoted prices (unadjusted) in active markets for identical financial instruments that the fund can access at the reporting date
Level 2 – inputs other than Level 1 quoted prices that are observable, either directly or indirectly (including, but not limited to, quoted prices for similar financial instruments in active markets, quoted prices for identical or similar financial instruments in inactive markets, interest rates and yield curves, implied volatilities, and credit spreads)
Level 3 – unobservable inputs
Observable inputs are developed using market data, such as publicly available information about actual events or transactions, and reflect the assumptions that market participants would use to price the financial instrument. Unobservable inputs are those for which market data are not available and are developed using the best information available about the assumptions that market participants would use to price the financial instrument. GAAP requires valuation techniques to maximize the use of relevant observable inputs and minimize the use of unobservable inputs. When multiple inputs are used to derive fair value, the financial instrument is assigned to the level within the fair value hierarchy based on the lowest-level input that is significant to the fair value of the financial instrument. Input levels are not necessarily an indication of the risk or liquidity associated with financial instruments at that level but rather the degree of judgment used in determining those values.
Valuation Techniques Equity securities listed or regularly traded on a securities exchange or in the over-the-counter (OTC) market are valued at the last quoted sale price or, for certain markets, the official closing price at the time the valuations are made. OTC Bulletin Board securities are valued at the mean of the closing bid and asked prices. A security that is listed or traded on more than one exchange is valued at the quotation on the exchange determined to be the primary market for such security. Listed securities not traded on a particular day are valued at the mean of the closing bid and asked prices for domestic securities and the last quoted sale or closing price for international securities.
For valuation purposes, the last quoted prices of non-U.S. equity securities may be adjusted to reflect the fair value of such securities at the close of the NYSE. If the fund determines that developments between the close of a foreign market and the close of the NYSE will, in its judgment, materially affect the value of some or all of its portfolio securities, the fund will adjust the previous quoted prices to reflect what it believes to be the fair value of the securities as of the close of the NYSE. In deciding whether it is necessary to adjust quoted prices to reflect fair value, the fund reviews a variety of factors, including developments in foreign markets, the performance of U.S. securities markets, and the performance of instruments trading in U.S. markets that represent foreign securities and baskets of foreign securities. The fund may also fair value securities in other situations, such as when a particular foreign market is closed but the fund is open. The fund uses outside pricing services to provide it with quoted prices and information to evaluate or adjust those prices. The fund cannot predict how often it will use quoted prices and how often it will determine it necessary to adjust those prices to reflect fair value. As a means of evaluating its security valuation process, the fund routinely compares quoted prices, the next day’s opening prices in the same markets, and adjusted prices.
Actively traded domestic equity securities generally are categorized in Level 1 of the fair value hierarchy. Non-U.S. equity securities generally are categorized in Level 2 of the fair value hierarchy despite the availability of quoted prices because, as described above, the fund evaluates and determines whether those quoted prices reflect fair value at the close of the NYSE or require adjustment. OTC Bulletin Board securities, certain preferred securities, and equity securities traded in inactive markets generally are categorized in Level 2 of the fair value hierarchy.
Debt securities generally are traded in the OTC market. Securities with remaining maturities of one year or more at the time of acquisition are valued at prices furnished by dealers who make markets in such securities or by an independent pricing service, which considers the yield or price of bonds of comparable quality, coupon, maturity, and type, as well as prices quoted by dealers who make markets in such securities. Generally, debt securities are categorized in Level 2 of the fair value hierarchy; however, to the extent the valuations include significant unobservable inputs, the securities would be categorized in Level 3.
Investments in mutual funds are valued at the mutual fund’s closing NAV per share on the day of valuation and are categorized in Level 1 of the fair value hierarchy. Assets and liabilities other than financial instruments, including short-term receivables and payables, are carried at cost, or estimated realizable value, if less, which approximates fair value.
Thinly traded financial instruments and those for which the above valuation procedures are inappropriate or are deemed not to reflect fair value are stated at fair value as determined in good faith by the Valuation Committee. The objective of any fair value pricing determination is to arrive at a price that could reasonably be expected from a current sale. Financial instruments fair valued by the Valuation Committee are primarily private placements, restricted securities, warrants, rights, and other securities that are not publicly traded.
Subject to oversight by the Board, the Valuation Committee regularly makes good faith judgments to establish and adjust the fair valuations of certain securities as events occur and circumstances warrant. For instance, in determining the fair value of an equity investment with limited market activity, such as a private placement or a thinly traded public company stock, the Valuation Committee considers a variety of factors, which may include, but are not limited to, the issuer’s business prospects, its financial standing and performance, recent investment transactions in the issuer, new rounds of financing, negotiated transactions of significant size between other investors in the company, relevant market valuations of peer companies, strategic events affecting the company, market liquidity for the issuer, and general economic conditions and events. In consultation with the investment and pricing teams, the Valuation Committee will determine an appropriate valuation technique based on available information, which may include both observable and unobservable inputs. The Valuation Committee typically will afford greatest weight to actual prices in arm’s length transactions, to the extent they represent orderly transactions between market participants; transaction information can be reliably obtained; and prices are deemed representative of fair value. However, the Valuation Committee may also consider other valuation methods such as market-based valuation multiples; a discount or premium from market value of a similar, freely traded security of the same issuer; or some combination. Fair value determinations are reviewed on a regular basis and updated as information becomes available, including actual purchase and sale transactions of the issue. Because any fair value determination involves a significant amount of judgment, there is a degree of subjectivity inherent in such pricing decisions, and fair value prices determined by the Valuation Committee could differ from those of other market participants. Depending on the relative significance of unobservable inputs, including the valuation technique(s) used, fair valued securities may be categorized in Level 2 or 3 of the fair value hierarchy.
Valuation Inputs The following table summarizes the fund’s financial instruments, based on the inputs used to determine their fair values on June 30, 2015:
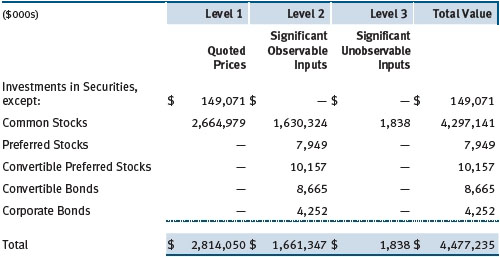
There were no material transfers between Levels 1 and 2 during the six months ended June 30, 2015.
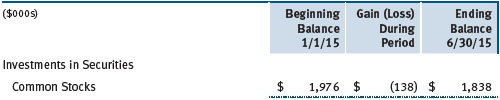
Following is a reconciliation of the fund’s Level 3 holdings for the six months ended June 30, 2015. Gain (loss) reflects both realized and change in unrealized gain/loss on Level 3 holdings during the period, if any, and is included on the accompanying Statement of Operations. The change in unrealized gain/loss on Level 3 instruments held at June 30, 2015, totaled $(138,000) for the six months ended June 30, 2015.
NOTE 3 - OTHER INVESTMENT TRANSACTIONS
Consistent with its investment objective, the fund engages in the following practices to manage exposure to certain risks and/or to enhance performance. The investment objective, policies, program, and risk factors of the fund are described more fully in the fund’s prospectus and Statement of Additional Information.
Restricted Securities The fund may invest in securities that are subject to legal or contractual restrictions on resale. Prompt sale of such securities at an acceptable price may be difficult and may involve substantial delays and additional costs.
Other Purchases and sales of portfolio securities other than short-term securities aggregated $1,419,334,000 and $998,523,000, respectively, for the six months ended June 30, 2015.
NOTE 4 - FEDERAL INCOME TAXES
No provision for federal income taxes is required since the fund intends to continue to qualify as a regulated investment company under Subchapter M of the Internal Revenue Code and distribute to shareholders all of its taxable income and gains. Distributions determined in accordance with federal income tax regulations may differ in amount or character from net investment income and realized gains for financial reporting purposes. Financial reporting records are adjusted for permanent book/tax differences to reflect tax character but are not adjusted for temporary differences. The amount and character of tax-basis distributions and composition of net assets are finalized at fiscal year-end; accordingly, tax-basis balances have not been determined as of the date of this report.
The fund intends to retain realized gains to the extent of available capital loss carryforwards. Net realized capital losses may be carried forward indefinitely to offset future realized capital gains. As of December 31, 2014, the fund had $313,626,000 of available capital loss carryforwards.
At June 30, 2015, the cost of investments for federal income tax purposes was $4,465,192,000. Net unrealized gain aggregated $12,057,000 at period-end, of which $489,180,000 related to appreciated investments and $477,123,000 related to depreciated investments.
NOTE 5 - ACQUISITION
On May 19, 2014, the fund acquired substantially all of the assets of the T. Rowe Price Global Infrastructure Fund (the acquired fund), pursuant to the Agreement and Plan of Reorganization dated January 31, 2014, and approved by shareholders of the acquired fund on April 30, 2014. The acquisition provides the acquired fund’s shareholders global investments along a broader diversification across sectors and a stronger focus on inflation protections, as well as a potentially lower expense ratio. The acquisition was accomplished by a tax-free exchange of 3,118,056 shares of the fund with a value of $36,731,000 for all 3,795,094 shares of the acquired fund then outstanding, with the same value. The exchange was based on values at the close of the NYSE on the immediately preceding business day, May 16, 2014. The net assets of the acquired fund at that date included $20,000 of unrealized depreciation. Assets of the acquired fund, including securities of $35,650,000, cash of $842,000, and receivables and other assets of $239,000 were combined with those of the fund, resulting in aggregate net assets of $4,181,367,000 immediately after the acquisition.
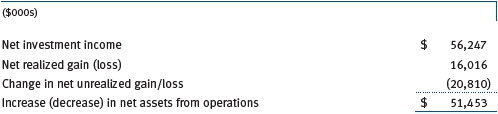
Pro forma results of operations of the combined entity for the entire year ended December 31, 2014, as though the acquisition had occurred as of the beginning of the year (rather than on the actual acquisition date), are as follows:
Because the combined investment portfolios have been managed as a single portfolio since the acquisition was completed, it is not practicable to separate the amounts of revenue and earnings of the acquired fund that have been included in the fund’s accompanying Statement of Operations since May 19, 2014.
NOTE 6 - RELATED PARTY TRANSACTIONS
The fund is managed by T. Rowe Price Associates, Inc. (Price Associates), a wholly owned subsidiary of T. Rowe Price Group, Inc. (Price Group). The investment management agreement between the fund and Price Associates provides for an annual investment management fee, which is computed daily and paid monthly. The fee consists of an individual fund fee, equal 0.35% of the fund’s average daily net assets, and a group fee. The group fee rate is calculated based on the combined net assets of certain mutual funds sponsored by Price Associates (the group) applied to a graduated fee schedule, with rates ranging from 0.48% for the first $1 billion of assets to 0.275% for assets in excess of $400 billion. The fund’s group fee is determined by applying the group fee rate to the fund’s average daily net assets. At June 30, 2015, the effective annual group fee rate was 0.29%.
In addition, the fund has entered into service agreements with Price Associates and two wholly owned subsidiaries of Price Associates (collectively, Price). Price Associates computes the daily share price and provides certain other administrative services to the fund. T. Rowe Price Services, Inc., provides shareholder and administrative services in its capacity as the fund’s transfer and dividend-disbursing agent. T. Rowe Price Retirement Plan Services, Inc., provides subaccounting and recordkeeping services for certain retirement accounts invested in the fund. For the six months ended June 30, 2015, expenses incurred pursuant to these service agreements were $93,000 for Price Associates; $44,000 for T. Rowe Price Services, Inc.; and $1,000 for T. Rowe Price Retirement Plan Services, Inc. The total amount payable at period-end pursuant to these service agreements is reflected as Due to Affiliates in the accompanying financial statements.
Additionally, the fund is one of several mutual funds in which certain college savings plans managed by Price Associates may invest. As approved by the fund’s Board of Directors, shareholder servicing costs associated with each college savings plan are borne by the fund in proportion to the average daily value of its shares owned by the college savings plan. For the six months ended June 30, 2015, the fund was charged $214,000 for shareholder servicing costs related to the college savings plans, of which $159,000 was for services provided by Price. The amount payable at period-end pursuant to this agreement is reflected as Due to Affiliates in the accompanying financial statements. At June 30, 2015, approximately 5% of the outstanding shares of the fund were held by college savings plans.
The fund is also one of several mutual funds sponsored by Price Associates (underlying Price funds) in which the T. Rowe Price Spectrum Funds (Spectrum Funds), as well as the T. Rowe Price Retirement Funds and T. Rowe Price Target Retirement Funds (Retirement Funds) may invest. Neither the Spectrum Funds nor the Retirement Funds invest in the underlying Price funds for the purpose of exercising management or control. Pursuant to separate special servicing agreements, expenses associated with the operation of the Spectrum Funds and Retirement Funds are borne by each underlying Price fund to the extent of estimated savings to it and in proportion to the average daily value of its shares owned by the Spectrum Funds and Retirement Funds, respectively. Expenses allocated under these agreements are reflected as shareholder servicing expenses in the accompanying financial statements. For the six months ended June 30, 2015, the fund was allocated $88,000 of Spectrum Funds’ expenses and $3,422,000 of Retirement Funds’ expenses. Of these amounts, $1,477,000 related to services provided by Price. At period-end, the amount payable to Price pursuant to this agreement is reflected as Due to Affiliates in the accompanying financial statements. At June 30, 2015, approximately 3% of the outstanding shares of the fund were held by the Spectrum Funds and 85% were held by the Retirement Funds.
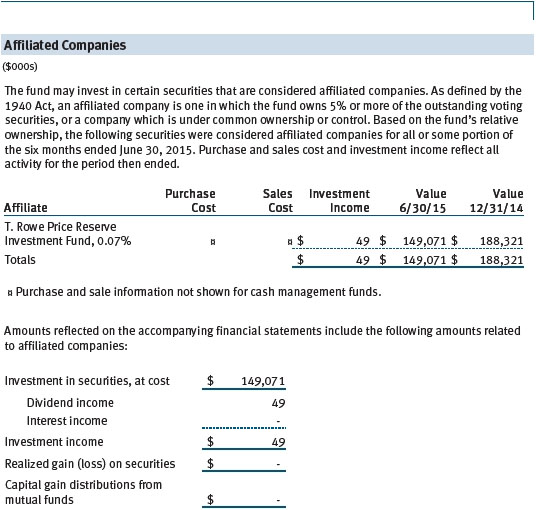
The fund may invest in the T. Rowe Price Reserve Investment Fund, the T. Rowe Price Government Reserve Investment Fund, or the T. Rowe Price Short-Term Reserve Fund (collectively, the Price Reserve Investment Funds), open-end management investment companies managed by Price Associates and considered affiliates of the fund. The Price Reserve Investment Funds are offered as short-term investment options to mutual funds, trusts, and other accounts managed by Price Associates or its affiliates and are not available for direct purchase by members of the public. The Price Reserve Investment Funds pay no investment management fees.
Mutual funds and other accounts managed by T. Rowe Price and its affiliates (collectively, T. Rowe Price funds) may invest in the fund; however, no T. Rowe Price fund may invest for the purpose of exercising management or control over the fund. At June 30, 2015, approximately 5% of the fund’s outstanding shares were held by T. Rowe Price funds.
| Information on Proxy Voting Policies, Procedures, and Records |
A description of the policies and procedures used by T. Rowe Price funds and portfolios to determine how to vote proxies relating to portfolio securities is available in each fund’s Statement of Additional Information. You may request this document by calling 1-800-225-5132 or by accessing the SEC’s website, sec.gov.
The description of our proxy voting policies and procedures is also available on our website, troweprice.com. To access it, click on the words “Social Responsibility” at the top of our corporate homepage. Next, click on the words “Conducting Business Responsibly” on the left side of the page that appears. Finally, click on the words “Proxy Voting Policies” on the left side of the page that appears.
Each fund’s most recent annual proxy voting record is available on our website and through the SEC’s website. To access it through our website, follow the above directions to reach the “Conducting Business Responsibly” page. Click on the words “Proxy Voting Records” on the left side of that page, and then click on the “View Proxy Voting Records” link at the bottom of the page that appears.
| How to Obtain Quarterly Portfolio Holdings |
The fund files a complete schedule of portfolio holdings with the Securities and Exchange Commission for the first and third quarters of each fiscal year on Form N-Q. The fund’s Form N-Q is available electronically on the SEC’s website (sec.gov); hard copies may be reviewed and copied at the SEC’s Public Reference Room, 100 F St. N.E., Washington, DC 20549. For more information on the Public Reference Room, call 1-800-SEC-0330.
| Approval of Investment Management Agreement |
On March 13, 2015, the fund’s Board of Directors (Board), including a majority of the fund’s independent directors, approved the continuation of the investment management agreement (Advisory Contract) between the fund and its investment advisor, T. Rowe Price Associates, Inc. (Advisor). In connection with its deliberations, the Board requested, and the Advisor provided, such information as the Board (with advice from independent legal counsel) deemed reasonably necessary. The Board considered a variety of factors in connection with its review of the Advisory Contract, also taking into account information provided by the Advisor during the course of the year, as discussed below:
Services Provided by the Advisor
The Board considered the nature, quality, and extent of the services provided to the fund by the Advisor. These services included, but were not limited to, directing the fund’s investments in accordance with its investment program and the overall management of the fund’s portfolio, as well as a variety of related activities such as financial, investment operations, and administrative services; compliance; maintaining the fund’s records and registrations; and shareholder communications. The Board also reviewed the background and experience of the Advisor’s senior management team and investment personnel involved in the management of the fund, as well as the Advisor’s compliance record. The Board concluded that it was satisfied with the nature, quality, and extent of the services provided by the Advisor.
Investment Performance of the Fund
The Board reviewed the fund’s three-month, one-year, and year-by-year returns, as well as the fund’s average annualized total returns over the three-year and since-inception periods, and compared these returns with a wide variety of previously agreed-upon comparable performance measures and market data, including those supplied by Lipper and Morningstar, which are independent providers of mutual fund data.
On the basis of this evaluation and the Board’s ongoing review of investment results, and factoring in the relative market conditions during certain of the performance periods, the Board concluded that the fund’s performance was satisfactory.
Costs, Benefits, Profits, and Economies of Scale
The Board reviewed detailed information regarding the revenues received by the Advisor under the Advisory Contract and other benefits that the Advisor (and its affiliates) may have realized from its relationship with the fund, including any research received under “soft dollar” agreements and commission-sharing arrangements with broker-dealers. The Board considered that the Advisor may receive some benefit from soft-dollar arrangements pursuant to which research is received from broker-dealers that execute the applicable fund’s portfolio transactions. The Board received information on the estimated costs incurred and profits realized by the Advisor from managing T. Rowe Price mutual funds. The Board also reviewed estimates of the profits realized from managing the fund in particular, and the Board concluded that the Advisor’s profits were reasonable in light of the services provided to the fund.
The Board also considered whether the fund benefits under the fee levels set forth in the Advisory Contract from any economies of scale realized by the Advisor. Under the Advisory Contract, the fund pays a fee to the Advisor for investment management services composed of two components—a group fee rate based on the combined average net assets of most of the T. Rowe Price mutual funds (including the fund) that declines at certain asset levels and an individual fund fee rate based on the fund’s average daily net assets—and the fund pays its own expenses of operations. At the March 13, 2015, meeting, the Board approved an additional 0.005% breakpoint to the group fee schedule, effective May 1, 2015. With the new breakpoint, the group fee rate will decline to 0.270% when the combined average net assets of the applicable T. Rowe Price funds exceed $500 billion. The Board concluded that the advisory fee structure for the fund continued to provide for a reasonable sharing of benefits from any economies of scale with the fund’s investors.
Fees
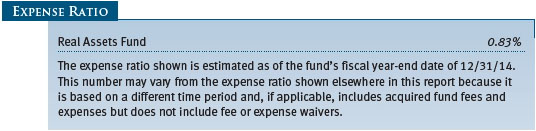
The Board was provided with information regarding industry trends in management fees and expenses, and the Board reviewed the fund’s management fee rate, operating expenses, and total expense ratio in comparison with fees and expenses of other comparable funds based on information and data supplied by Lipper. The information provided to the Board indicated that the fund’s management fee rate was above the median for certain groups of comparable funds and at or below the median for other groups of comparable funds, and the fund’s total expense ratio was at or below the median for comparable funds.
The Board also reviewed the fee schedules for institutional accounts and private accounts with similar mandates that are advised or subadvised by the Advisor and its affiliates. Management provided the Board with information about the Advisor’s responsibilities and services provided to institutional account clients, including information about how the requirements and economics of the institutional business are fundamentally different from those of the mutual fund business. The Board considered information showing that the mutual fund business is generally more complex from a business and compliance perspective than the institutional business and that the Advisor generally performs significant additional services and assumes greater risk in managing the fund and other T. Rowe Price mutual funds than it does for institutional account clients.
On the basis of the information provided and the factors considered, the Board concluded that the fees paid by the fund under the Advisory Contract are reasonable.
Approval of the Advisory Contract
As noted, the Board approved the continuation of the Advisory Contract. No single factor was considered in isolation or to be determinative to the decision. Rather, the Board concluded, in light of a weighting and balancing of all factors considered, that it was in the best interests of the fund and its shareholders for the Board to approve the continuation of the Advisory Contract (including the fees to be charged for services thereunder). The independent directors were advised throughout the process by independent legal counsel.
Item 2. Code of Ethics.
A code of ethics, as defined in Item 2 of Form N-CSR, applicable to its principal executive officer, principal financial officer, principal accounting officer or controller, or persons performing similar functions is filed as an exhibit to the registrant’s annual Form N-CSR. No substantive amendments were approved or waivers were granted to this code of ethics during the registrant’s most recent fiscal half-year.
Item 3. Audit Committee Financial Expert.
Disclosure required in registrant’s annual Form N-CSR.
Item 4. Principal Accountant Fees and Services.
Disclosure required in registrant’s annual Form N-CSR.
Item 5. Audit Committee of Listed Registrants.
Not applicable.
Item 6. Investments.
(a) Not applicable. The complete schedule of investments is included in Item 1 of this Form N-CSR.
(b) Not applicable.
Item 7. Disclosure of Proxy Voting Policies and Procedures for Closed-End Management Investment Companies.
Not applicable.
Item 8. Portfolio Managers of Closed-End Management Investment Companies.
Not applicable.
Item 9. Purchases of Equity Securities by Closed-End Management Investment Company and Affiliated Purchasers.
Not applicable.
Item 10. Submission of Matters to a Vote of Security Holders.
Not applicable.
Item 11. Controls and Procedures.
(a) The registrant’s principal executive officer and principal financial officer have evaluated the registrant’s disclosure controls and procedures within 90 days of this filing and have concluded that the registrant’s disclosure controls and procedures were effective, as of that date, in ensuring that information required to be disclosed by the registrant in this Form N-CSR was recorded, processed, summarized, and reported timely.
(b) The registrant’s principal executive officer and principal financial officer are aware of no change in the registrant’s internal control over financial reporting that occurred during the registrant’s second fiscal quarter covered by this report that has materially affected, or is reasonably likely to materially affect, the registrant’s internal control over financial reporting.
Item 12. Exhibits.
(a)(1) The registrant’s code of ethics pursuant to Item 2 of Form N-CSR is filed with the registrant’s annual Form N-CSR.
(2) Separate certifications by the registrant's principal executive officer and principal financial officer, pursuant to Section 302 of the Sarbanes-Oxley Act of 2002 and required by Rule 30a-2(a) under the Investment Company Act of 1940, are attached.
(3) Written solicitation to repurchase securities issued by closed-end companies: not applicable.
(b) A certification by the registrant's principal executive officer and principal financial officer, pursuant to Section 906 of the Sarbanes-Oxley Act of 2002 and required by Rule 30a-2(b) under the Investment Company Act of 1940, is attached.
SIGNATURES
Pursuant to the requirements of the Securities Exchange Act of 1934 and the Investment Company Act of 1940, the registrant has duly caused this report to be signed on its behalf by the undersigned, thereunto duly authorized.
T. Rowe Price Real Assets Fund, Inc.
| | By | /s/ Edward C. Bernard |
| | Edward C. Bernard |
| | Principal Executive Officer |
| |
| Date August 17, 2015 | | |
Pursuant to the requirements of the Securities Exchange Act of 1934 and the Investment Company Act of 1940, this report has been signed below by the following persons on behalf of the registrant and in the capacities and on the dates indicated.
| | By | /s/ Edward C. Bernard |
| | Edward C. Bernard |
| | Principal Executive Officer |
| |
| Date August 17, 2015 | | |
| |
| |
| By | /s/ Catherine D. Mathews |
| | Catherine D. Mathews |
| | Principal Financial Officer |
| |
| Date August 17, 2015 | | |