UNITED STATES
SECURITIES AND EXCHANGE COMMISSION
Washington, D.C. 20549
FORM N-CSR
CERTIFIED SHAREHOLDER REPORT OF REGISTERED
MANAGEMENT INVESTMENT COMPANIES
Investment Company Act File Number: 811-22410
| T. Rowe Price Real Assets Fund, Inc. |
|
| (Exact name of registrant as specified in charter) |
| |
| 100 East Pratt Street, Baltimore, MD 21202 |
|
| (Address of principal executive offices) |
| |
| David Oestreicher |
| 100 East Pratt Street, Baltimore, MD 21202 |
|
| (Name and address of agent for service) |
Registrant’s telephone number, including area code: (410) 345-2000
Date of fiscal year end: December 31
Date of reporting period: June 30, 2016
Item 1. Report to Shareholders
| Real Assets Fund | June 30, 2016 |
The views and opinions in this report were current as of June 30, 2016. They are not guarantees of performance or investment results and should not be taken as investment advice. Investment decisions reflect a variety of factors, and the managers reserve the right to change their views about individual stocks, sectors, and the markets at any time. As a result, the views expressed should not be relied upon as a forecast of the fund’s future investment intent. The report is certified under the Sarbanes-Oxley Act, which requires mutual funds and other public companies to affirm that, to the best of their knowledge, the information in their financial reports is fairly and accurately stated in all material respects.
REPORTS ON THE WEB
Sign up for our Email Program, and you can begin to receive updated fund reports and prospectuses online rather than through the mail. Log in to your account at troweprice.com for more information.
Manager’s Letter
Fellow Shareholders
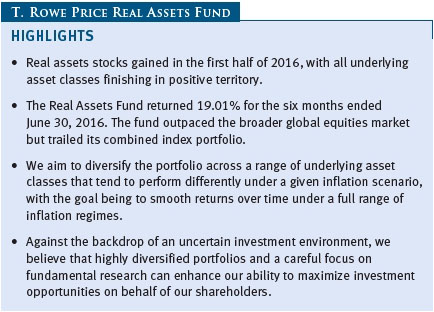
Real assets stocks posted strong gains in the first six months of 2016. Natural resources stocks rallied after a dismal 2015. A number of factors played a role in the rebound, including economic stimulus in China, oil supply outages, a healthier high yield bond market, and a modestly weaker dollar. U.S. and global real estate investment trusts (REITs) recorded solid gains, benefiting from low interest rates, attractive yields, and favorable fundamentals. The Real Assets Fund mirrored the positive environment for many of its underlying asset classes and generated strong double-digit gains for the period.
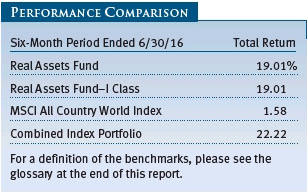
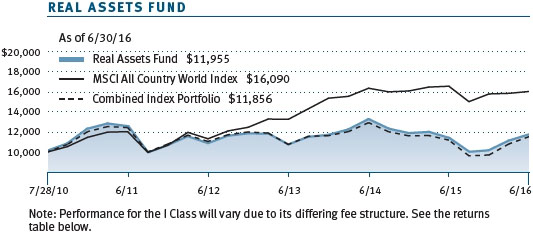
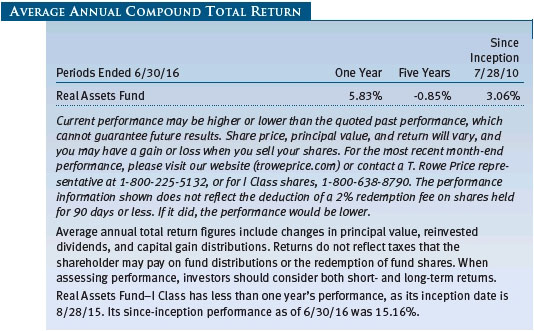
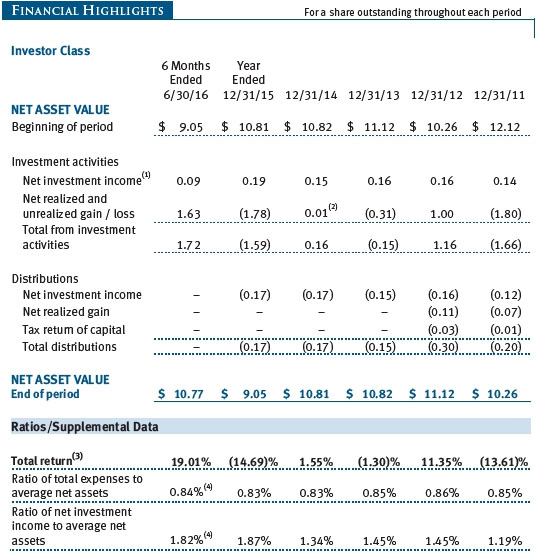
As shown in the Performance Comparison table, your fund returned 19.01% for the six months ended June 30, 2016. The fund significantly outpaced the broader global equities market, as represented by the MSCI All Country World Index, but trailed its combined index portfolio—a custom blended benchmark that we believe provides a more appropriate performance comparison. In absolute terms, every underlying asset class was solidly positive for the period. Our precious metals stocks recorded the strongest absolute gains, rising roughly 95%. The fund’s industrial metals stocks and other natural resources shares also posted significant advances, rising 28% and 17%, respectively. Our U.S. REITs climbed 9%, and our global REITs gained in excess of 7%.
Our approach is to diversify the portfolio across a range of assets that tend to perform differently under a given inflation scenario, with the goal being to smooth returns over time under a full range of inflation regimes. We believe that incorporating investments with more attractive inflation sensitivity to complement traditional equity investments should provide better long-term outcomes in the context of a broader investment portfolio.
ECONOMIC AND MARKET ENVIRONMENT
The S&P 500 added 3.84% in the first half of 2016, but the advance belied considerable turmoil over the period. Stocks and oil prices dropped in the first six weeks of the year as investors worried about a worldwide recession resulting from China’s economic slowdown and a global oversupply of oil, but they turned around starting in February after concerns about the oil glut receded and the Fed reduced its expectations for interest rate increases this year. The UK’s June 23 decision to leave the European Union (Brexit) derailed the U.S. market’s advance, causing a two-day global stock sell-off and considerable volatility in the currency market. However, stocks rallied in the last three days of June, pushing the major domestic stock indices into positive territory for the year.
Outside the U.S., stocks in developed European markets fell as uneven global growth, slowdowns in several emerging markets, and Brexit-induced uncertainty weighed on the region’s outlook. European Central Bank (ECB) officials warned that Brexit would hurt the eurozone’s recovery but signaled that fresh stimulus measures were unlikely after the ECB already expanded its stimulus program in March. Japanese stocks retreated as the country’s economy stayed weak despite more than three years of costly and sustained stimulus. Japan’s economy rebounded in this year’s first quarter after contracting in the final quarter of 2015, but the tenuous recovery led the government to delay a long-planned sales tax increase until 2019. Emerging markets stocks rose and generally outperformed U.S. shares. Latin American markets surged in response to higher commodity prices. Brazilian shares were particularly strong, benefiting from the suspension of scandal-plagued President Dilma Rousseff, whose replacement is pursuing reforms to help lift the country out of a deep recession. Chinese shares declined, however, especially A shares for domestic investors.
PORTFOLIO REVIEW
Natural resources stocks advanced, helped by China’s stimulus measures and oil supply disruptions. The U.S. dollar’s depreciation against many other currencies was another important factor. Expectations about the timing and pace of Federal Reserve rate hikes shifted as heightened global market volatility and sluggish economic growth convinced the Fed to adopt a more gradual approach to policy normalization. The weaker dollar helped commodity prices stabilize, which relieved fears that debt-laden commodity producers would create a negative domino effect that would spread into other areas of the economy. Renewed monetary stimulus measures in Europe and Japan were also supportive.
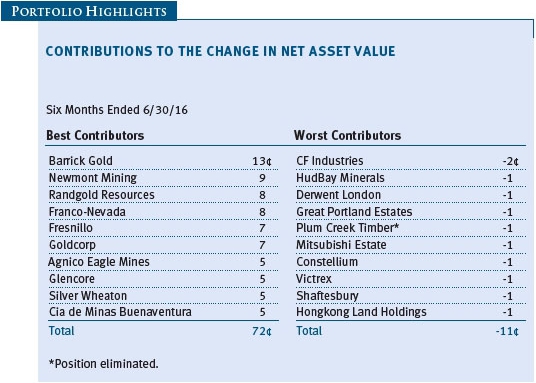
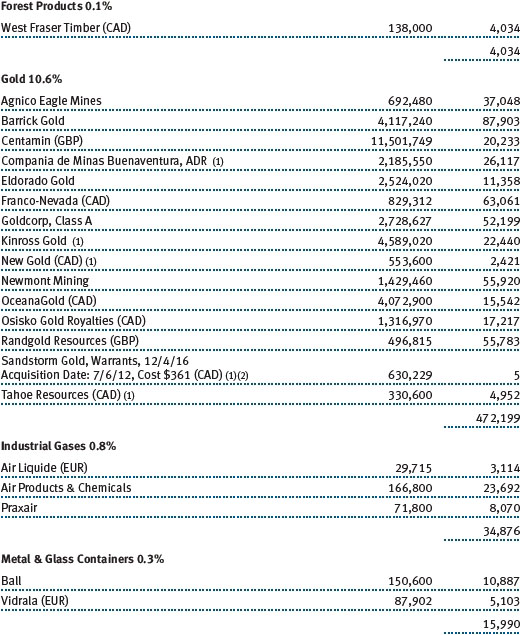
Our metals and mining stocks were the biggest contributors to the fund’s absolute gains for the six-month reporting period. Precious metals were particularly strong. Equity markets began the year on a weak note, and gold, which is typically viewed as a safe-haven investment, moved higher. Gold prices continued to rise throughout the first half of the year amid uncertainty regarding Federal Reserve monetary policies. Indications that the Federal Reserve would raise short-term interest rates in 2016 gradually gave way to a “low and slow” approach, with the Fed assessing U.S. and global growth rates carefully before renewing efforts to normalize its rate policy. Markets fluctuated wildly after the Brexit vote at the end of the period, driving risk-averse investors to the perceived safety of gold and other precious metals. The combination of these factors helped push gold prices up approximately 25% through June, with gold-related metals and mining stocks moving higher still.
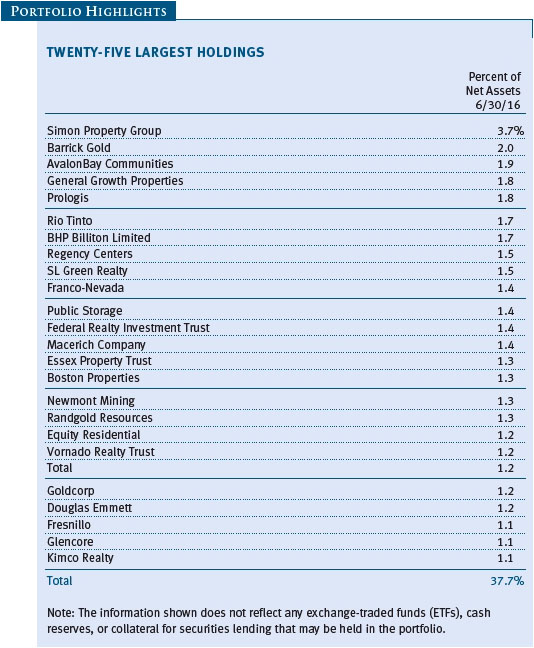
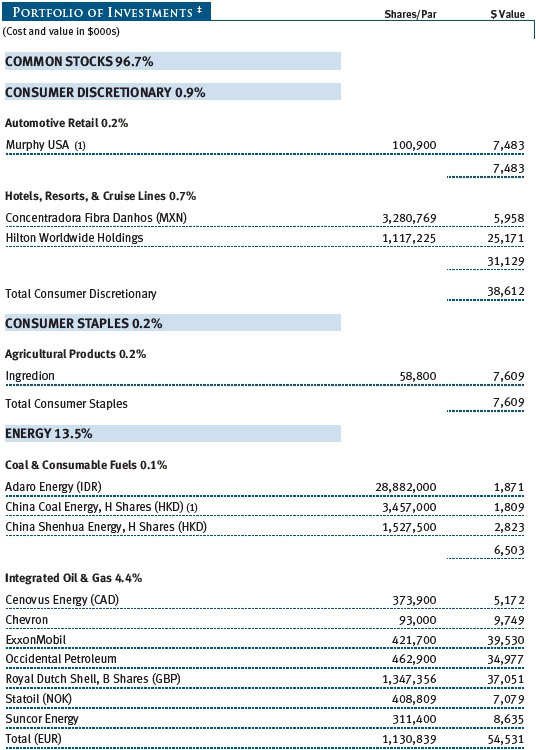
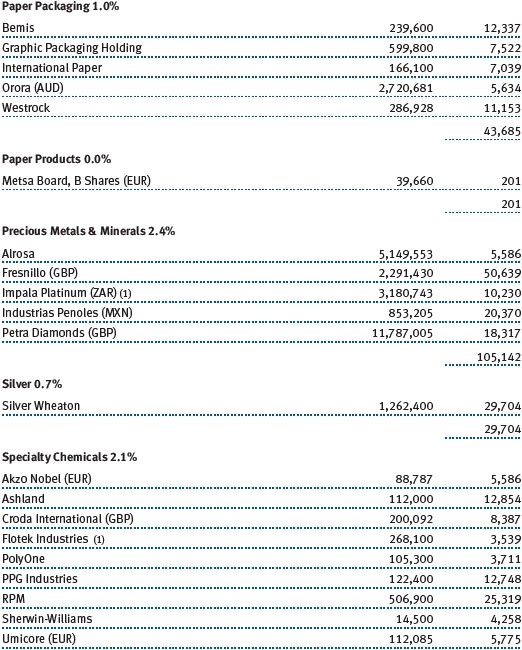
Nearly all of the fund’s top contributors were concentrated in precious metals, including Barrick Gold, Newmont Mining, Randgold Resources, Franco-Nevada, and Fresnillo, each of which produced strong absolute results. Our holdings trailed their underlying benchmark, however, due to our preference for higher-quality, fundamentally sound companies, which underperformed lower-quality, debt-laden companies. (Please refer to the portfolio of investments for a complete list of holdings and the amount each represents in the portfolio.)
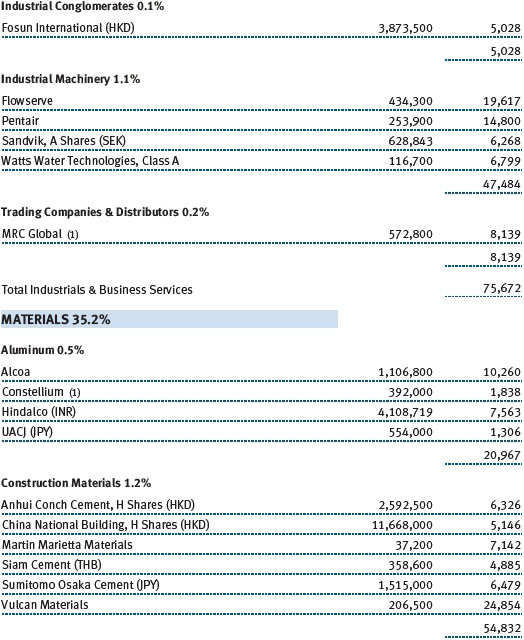
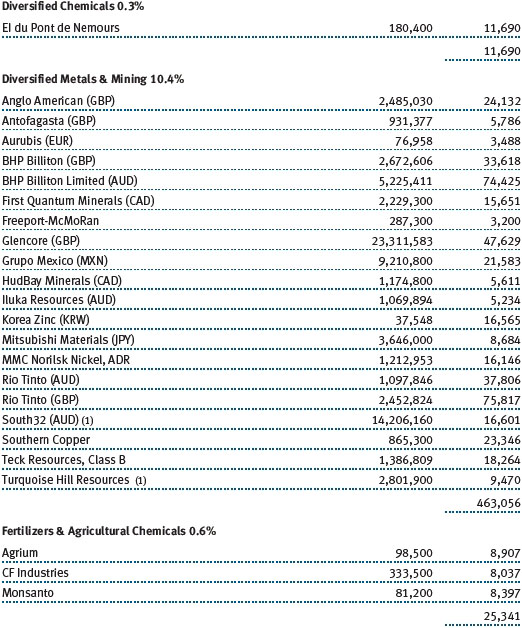
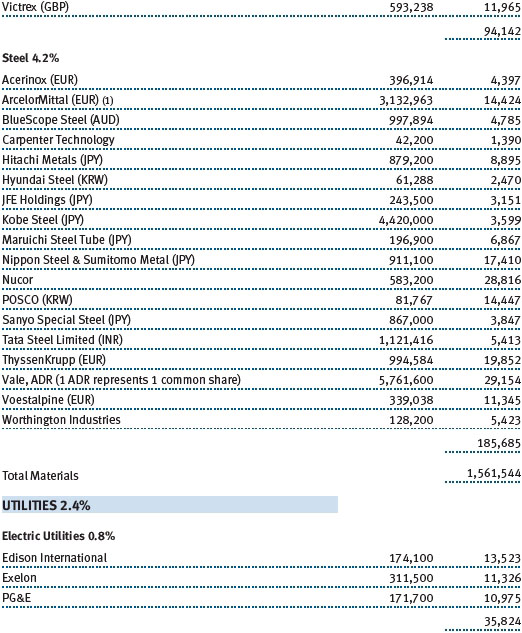
Our industrial metals also moved higher after a disastrous year in 2015. Support from economic stimulus in resource-hungry China and some apparent stockpiling helped push iron and copper prices higher. This benefited fund holdings BHP Billiton Limited, Rio Tinto, and Vale.
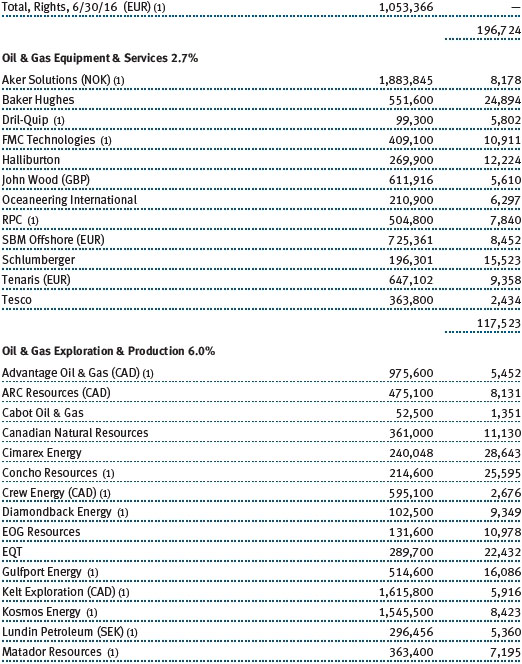
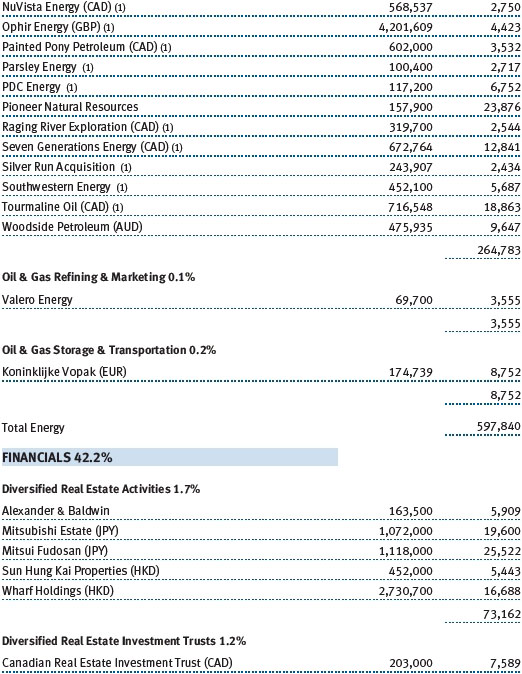
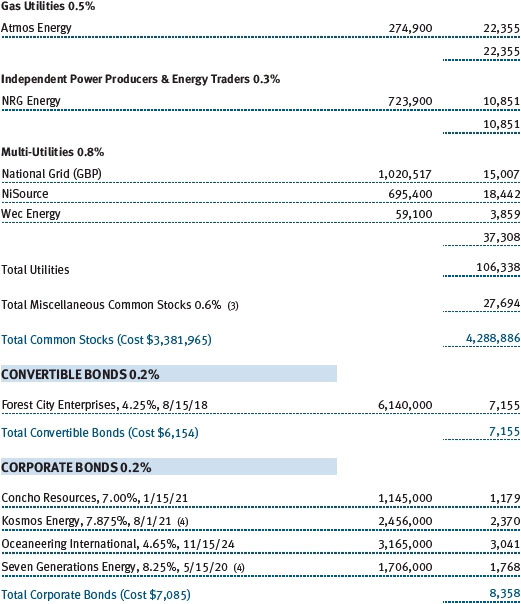
Within our natural resources exposure, we have been defensively postured with a focus on strong balance sheets and low costs. Low-cost oil exploration and production companies in the Permian Basin continue to represent a significant area of focus for the fund and were strong contributors in the first half of 2016. Among these stocks were Concho Resources and Cimarex Energy. We also benefited from exposure to global oil majors, including Royal Dutch Shell and ExxonMobil. We also have a significant position in North American natural gas producers. We think that natural gas prices reached unsustainably low levels in the first half of 2016. These stocks were strong performers in the first half of the year, and we are optimistic about continued price appreciation in the second half from names such as EQT.
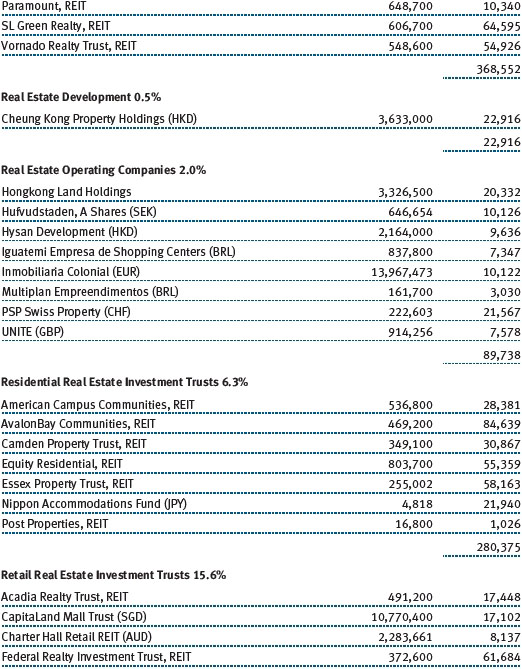
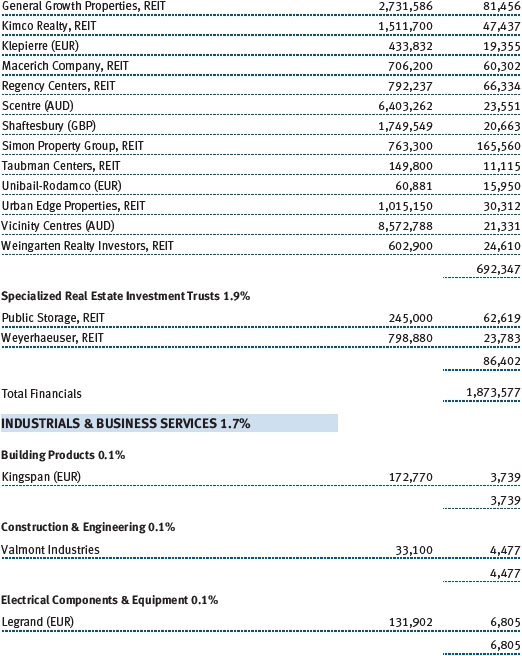
Low interest rates in the U.S. and other developed markets, attractive yields, and favorable fundamentals provided a significant boost to U.S. and global real estate securities. In the U.S., our industrial REITs, including DCT Industrial and Eastgroup Properties, stood out for their strong performance. While the growth in e-commerce is perceived as a risk to many traditional retailers, it is viewed as rewarding to providers of packing and distribution space that can facilitate this channel growth. Local shopping centers, particularly those with desirable necessity components, appeared to be of less concern in the retail landscape as investors strongly bid up shares during the period, including names such as Federal Realty Investment Trust, Regency Centers, and Urban Edge Properties.
The only area of significant weakness in the portfolio during the period was our exposure to UK real estate securities, which fell sharply due to the impact of the Brexit vote. We had been reducing our overall UK exposure over the past year due to concerns over oncoming London office supply but were unable to escape the fallout. Shares of Great Portland Estates and Derwent London declined following the Brexit referendum. We used the share price decline to add to both companies, as they own prime West End London office real estate, have good management teams, and possess solid balance sheets.
OUTLOOK
The Real Assets Fund is designed to provide some buffer against the impact of inflation over time. In the current low-growth environment, however, we see limited risk of inflation moving significantly higher over the near term. Increased global uncertainty following Brexit has weighed on our global growth expectations, which remain modest. The U.S. and other developed market economies are expanding at a subdued pace, while major emerging economies are struggling with weak growth. Monetary policy around the world is showing signs of convergence, with central banks in Europe, the UK, and Japan expected to renew and expand stimulus measures to stimulate growth and mitigate Brexit-related risks. Meanwhile, the Fed is not expected to start normalizing interest rates until December, at the earliest. Risks to our outlook include heightened instability within Europe, unforeseen global monetary policy actions, and elevated currency volatility. The rise of populism around the world and its harmful impact on trade pose further risks to global growth—risks that have increased following Brexit.
As we have written in previous letters, we believe that we are in the initial years of a secular downcycle in commodities. Most of the factors that contributed to the steep fall in oil prices since the latter half of 2014 remain in place, while new factors have emerged. The shale oil revolution has changed the competitive dynamics in the oil industry and has helped to significantly reduce costs across the entire commodity complex. U.S. producers responded to low oil prices by reducing rig counts and lowering production, which in turn, contributed to the recent price rebound. However, we are already seeing signs that higher prices are bringing production back online. Ultimately, the resulting supply increase will likely weigh on prices as there has been little change in global demand. In the industrial metals space, a number of large-scale production projects were started years ago on expectations that demand for raw materials, particularly from China, would remain high. Many of these projects, which take years to develop, have come online just as global demand has softened. As a result, the global supply/demand imbalance in the commodities universe is likely to persist and pressure prices for some time.
In contrast, the environment for real estate appears more attractive. Low interest rates around the world and modest global economic growth should support real estate values. Improving economic fundamentals should help foster an environment of strong demand, higher rents, good cash flow, and dividend distributions, which should temper concerns about rising interest rates. Over the long term, we believe the fundamental balance between global supply and demand will drive rents and, therefore, real estate values. The construction of new commercial real estate projects has been reasonably restrained amid modest global economic growth. While the supply/demand balance is favorable in most markets where we invest, supply pipelines in the U.S. appear to be increasing, and we are monitoring the supply/demand equation carefully. While we remain alert to potential risks, we are comforted that interest rates are likely to remain relatively low, providing support to real estate values for some time to come.
Against the backdrop of an uncertain investment environment, we believe that highly diversified portfolios and a careful focus on fundamental research can enhance our ability to maximize investment opportunities on behalf of our shareholders.
Respectfully submitted,
 Wyatt A. Lee
Portfolio manager and chairman of the fund’s Investment Advisory CommitteeJuly 25, 2016
The committee chairman has day-to-day responsibility for managing the portfolio and works with committee members in developing and executing the fund’s investment program.
RISKS OF STOCK INVESTING
The fund’s share price can fall because of weakness in the stock markets, a particular industry, or specific holdings. Stock markets can decline for many reasons, including adverse political or economic developments, changes in investor psychology, or heavy institutional selling. The prospects for an industry or company may deteriorate because of a variety of factors, including disappointing earnings or changes in the competitive environment. In addition, the investment manager’s assessment of companies held in a fund may prove incorrect, resulting in losses or poor performance even in rising markets. Funds that invest only in specific industries will experience greater volatility than funds investing in a broad range of industries. The rate of earnings growth of natural resources companies may be irregular since these companies are strongly affected by natural forces, global economic cycles, and international politics. For example, stock prices of energy companies can fall sharply when oil prices decrease.
GLOSSARY
Combined index portfolio: an unmanaged stock portfolio consisting of 30% global natural resources (65% MSCI All Country World Index Energy and 35% MSCI All Country World Index Materials), 20% U.S. real estate (Wilshire U.S. Real Estate Securities Index), 20% global real estate (FTSE EPRA/NAREIT Developed Index), 25% global metals and mining (MSCI All Country World Index Metals & Mining), and 5% precious metals (80% MSCI All Country World Index IMI Gold and 20% MSCI All Country World Index IMI Precious Metals & Minerals).
| ● | FTSE EPRA/NAREIT Developed Index: An index that tracks the performance of developed market real estate securities.
|
| ● | MSCI All Country World Index Energy: An index that tracks the performance of companies engaged in the exploration and production of energy commodities.
|
| ● | MSCI All Country World Index IMI Gold: An index that tracks the performance of companies engaged in the exploration and production of gold.
|
| ● | MSCI All Country World Index IMI Precious Metals & Minerals: An index that tracks the performance of companies engaged in the exploration and production of precious metals and minerals.
|
| ● | MSCI All Country World Index Materials: An index that tracks the performance of companies engaged in the exploration and production of basic materials.
|
| ● | MSCI All Country World Index Metals & Mining: An index that tracks the performance of metals and mining companies.
|
| ● | Wilshire U.S. Real Estate Securities Index: An index that tracks the performance of publicly traded U.S. real estate securities. |
MSCI All Country World Index: A capitalization-weighted index of stocks from developed and emerging markets worldwide.
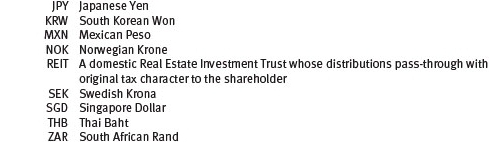
Real estate investment trusts (REITs): Publicly traded companies that own, develop, and operate apartment complexes, hotels, office buildings, and other commercial properties.
Note: MSCI makes no express or implied warranties or representations and shall have no liability whatsoever with respect to any MSCI data contained herein. The MSCI data may not be further redistributed or used as a basis for other indices or any securities or financial products. This report is not approved, reviewed, or produced by MSCI.
Performance and Expenses
This chart shows the value of a hypothetical $10,000 investment in the fund over the past 10 fiscal year periods or since inception (for funds lacking 10-year records). The result is compared with benchmarks, which may include a broad-based market index and a peer group average or index. Market indexes do not include expenses, which are deducted from fund returns as well as mutual fund averages and indexes.
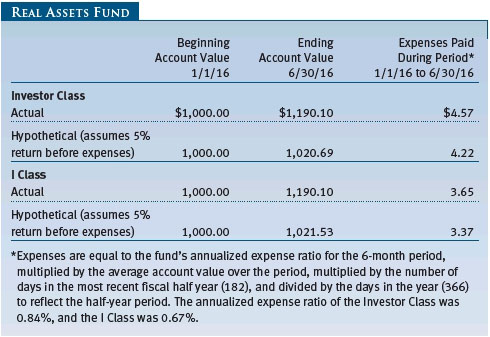
As a mutual fund shareholder, you may incur two types of costs: (1) transaction costs, such as redemption fees or sales loads, and (2) ongoing costs, including management fees, distribution and service (12b-1) fees, and other fund expenses. The following example is intended to help you understand your ongoing costs (in dollars) of investing in the fund and to compare these costs with the ongoing costs of investing in other mutual funds. The example is based on an investment of $1,000 invested at the beginning of the most recent six-month period and held for the entire period.
Please note that the fund has two share classes: The original share class (Investor Class) charges no distribution and service (12b-1) fee, and the I Class shares are also available to institutionally oriented clients and impose no 12b-1 or administrative fee payment. Each share class is presented separately in the table.
Actual Expenses
The first line of the following table (Actual) provides information about actual account values and expenses based on the fund’s actual returns. You may use the information on this line, together with your account balance, to estimate the expenses that you paid over the period. Simply divide your account value by $1,000 (for example, an $8,600 account value divided by $1,000 = 8.6), then multiply the result by the number on the first line under the heading “Expenses Paid During Period” to estimate the expenses you paid on your account during this period.
Hypothetical Example for Comparison Purposes
The information on the second line of the table (Hypothetical) is based on hypothetical account values and expenses derived from the fund’s actual expense ratio and an assumed 5% per year rate of return before expenses (not the fund’s actual return). You may compare the ongoing costs of investing in the fund with other funds by contrasting this 5% hypothetical example and the 5% hypothetical examples that appear in the shareholder reports of the other funds. The hypothetical account values and expenses may not be used to estimate the actual ending account balance or expenses you paid for the period.
Note: T. Rowe Price charges an annual account service fee of $20, generally for accounts with less than $10,000. The fee is waived for any investor whose T. Rowe Price mutual fund accounts total $50,000 or more; accounts electing to receive electronic delivery of account statements, transaction confirmations, prospectuses, and shareholder reports; or accounts of an investor who is a T. Rowe Price Preferred Services, Personal Services, or Enhanced Personal Services client (enrollment in these programs generally requires T. Rowe Price assets of at least $100,000). This fee is not included in the accompanying table. If you are subject to the fee, keep it in mind when you are estimating the ongoing expenses of investing in the fund and when comparing the expenses of this fund with other funds.
You should also be aware that the expenses shown in the table highlight only your ongoing costs and do not reflect any transaction costs, such as redemption fees or sales loads. Therefore, the second line of the table is useful in comparing ongoing costs only and will not help you determine the relative total costs of owning different funds. To the extent a fund charges transaction costs, however, the total cost of owning that fund is higher.
Unaudited
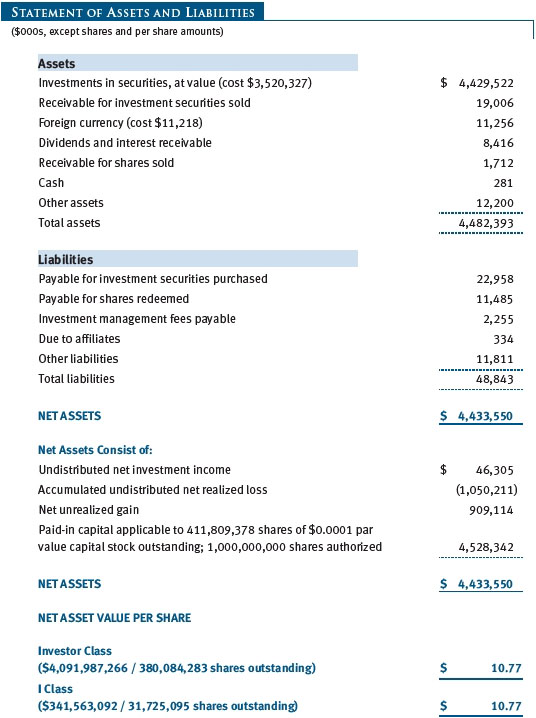
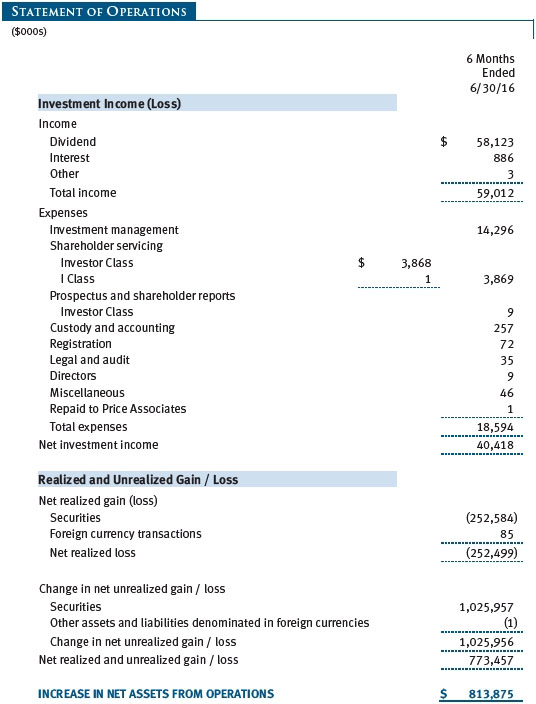
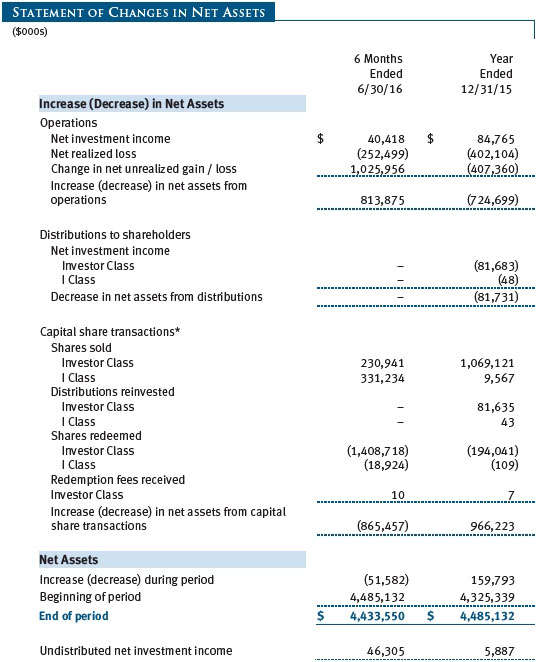
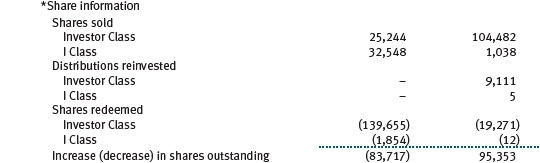
The accompanying notes are an integral part of these financial statements.
Unaudited
The accompanying notes are an integral part of these financial statements.
Unaudited

The accompanying notes are an integral part of these financial statements.
Unaudited
The accompanying notes are an integral part of these financial statements.
Unaudited
The accompanying notes are an integral part of these financial statements.
Unaudited
The accompanying notes are an integral part of these financial statements.
Unaudited
| Notes to Financial Statements |
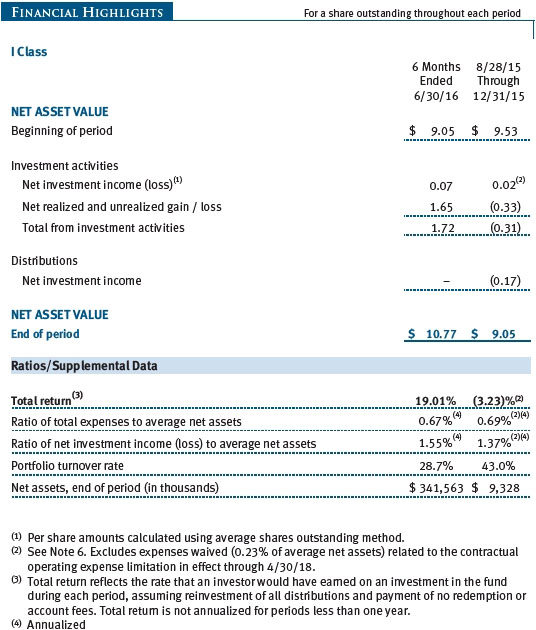
T. Rowe Price Real Assets Fund (the fund), is registered under the Investment Company Act of 1940 (the 1940 Act) as a diversified, open-end management investment company. The fund seeks to provide long-term growth of capital. The fund has two classes of shares: the Real Assets Fund original share class, referred to in this report as the Investor Class, incepted on July 28, 2010, and the Real Assets Fund–I Class (I Class), incepted on August 28, 2015. I Class shares generally are available only to investors meeting a $1,000,000 minimum investment or certain other criteria. Each class has exclusive voting rights on matters related solely to that class; separate voting rights on matters that relate to both classes; and, in all other respects, the same rights and obligations as the other class.
NOTE 1 - SIGNIFICANT ACCOUNTING POLICIES
Basis of Preparation The fund is an investment company and follows accounting and reporting guidance in the Financial Accounting Standards Board (FASB) Accounting Standards Codification Topic 946 (ASC 946). The accompanying financial statements were prepared in accordance with accounting principles generally accepted in the United States of America (GAAP), including, but not limited to, ASC 946. GAAP requires the use of estimates made by management. Management believes that estimates and valuations are appropriate; however, actual results may differ from those estimates, and the valuations reflected in the accompanying financial statements may differ from the value ultimately realized upon sale or maturity.
Investment Transactions, Investment Income, and Distributions Income and expenses are recorded on the accrual basis. Premiums and discounts on debt securities are amortized for financial reporting purposes. Dividends received from mutual fund investments are reflected as dividend income; capital gain distributions, if any, are reflected as realized gain/loss. Dividend income and capital gain distributions are recorded on the ex-dividend date. Income tax-related interest and penalties, if incurred, would be recorded as income tax expense. Investment transactions are accounted for on the trade date. Realized gains and losses are reported on the identified cost basis. Distributions from REITs are initially recorded as dividend income and, to the extent such represent a return of capital or capital gain for tax purposes, are reclassified when such information becomes available. Income distributions are declared and paid by each class annually. Distributions to shareholders are recorded on the ex-dividend date. Capital gain distributions, if any, are generally declared and paid by the fund annually.
Currency Translation Assets, including investments, and liabilities denominated in foreign currencies are translated into U.S. dollar values each day at the prevailing exchange rate, using the mean of the bid and asked prices of such currencies against U.S. dollars as quoted by a major bank. Purchases and sales of securities, income, and expenses are translated into U.S. dollars at the prevailing exchange rate on the date of the transaction. The effect of changes in foreign currency exchange rates on realized and unrealized security gains and losses is reflected as a component of security gains and losses.
Class Accounting Shareholder servicing, prospectus, and shareholder report expenses incurred by each class are charged directly to the class to which they relate. Expenses common to both classes, investment income, and realized and unrealized gains and losses are allocated to the classes based upon the relative daily net assets of each class.
Rebates Subject to best execution, the fund may direct certain security trades to brokers who have agreed to rebate a portion of the related brokerage commission to the fund in cash. Commission rebates are reflected as realized gain on securities in the accompanying financial statements and totaled $29,000 for the six months ended June 30, 2016.
Redemption Fees A 2% fee is assessed on redemptions of fund shares held for 90 days or less to deter short-term trading and to protect the interests of long-term shareholders. Redemption fees are withheld from proceeds that shareholders receive from the sale or exchange of fund shares. The fees are paid to the fund and are recorded as an increase to paid-in capital. The fees may cause the redemption price per share to differ from the net asset value per share.
NOTE 2 - VALUATION
The fund’s financial instruments are valued and each class’s net asset value (NAV) per share is computed at the close of the New York Stock Exchange (NYSE), normally 4 p.m. ET, each day the NYSE is open for business.
Fair Value The fund’s financial instruments are reported at fair value, which GAAP defines as the price that would be received to sell an asset or paid to transfer a liability in an orderly transaction between market participants at the measurement date. The T. Rowe Price Valuation Committee (the Valuation Committee) has been established by the fund’s Board of Directors (the Board) to ensure that financial instruments are appropriately priced at fair value in accordance with GAAP and the 1940 Act. Subject to oversight by the Board, the Valuation Committee develops and oversees pricing-related policies and procedures and approves all fair value determinations. Specifically, the Valuation Committee establishes procedures to value securities; determines pricing techniques, sources, and persons eligible to effect fair value pricing actions; oversees the selection, services, and performance of pricing vendors; oversees valuation-related business continuity practices; and provides guidance on internal controls and valuation-related matters. The Valuation Committee reports to the Board and has representation from legal, portfolio management and trading, operations, risk management, and the fund’s treasurer.
Various valuation techniques and inputs are used to determine the fair value of financial instruments. GAAP establishes the following fair value hierarchy that categorizes the inputs used to measure fair value:
Level 1 – quoted prices (unadjusted) in active markets for identical financial instruments that the fund can access at the reporting date
Level 2 – inputs other than Level 1 quoted prices that are observable, either directly or indirectly (including, but not limited to, quoted prices for similar financial instruments in active markets, quoted prices for identical or similar financial instruments in inactive markets, interest rates and yield curves, implied volatilities, and credit spreads)
Level 3 – unobservable inputs
Observable inputs are developed using market data, such as publicly available information about actual events or transactions, and reflect the assumptions that market participants would use to price the financial instrument. Unobservable inputs are those for which market data are not available and are developed using the best information available about the assumptions that market participants would use to price the financial instrument. GAAP requires valuation techniques to maximize the use of relevant observable inputs and minimize the use of unobservable inputs. When multiple inputs are used to derive fair value, the financial instrument is assigned to the level within the fair value hierarchy based on the lowest-level input that is significant to the fair value of the financial instrument. Input levels are not necessarily an indication of the risk or liquidity associated with financial instruments at that level but rather the degree of judgment used in determining those values.
Valuation Techniques Equity securities listed or regularly traded on a securities exchange or in the over-the-counter (OTC) market are valued at the last quoted sale price or, for certain markets, the official closing price at the time the valuations are made. OTC Bulletin Board securities are valued at the mean of the closing bid and asked prices. A security that is listed or traded on more than one exchange is valued at the quotation on the exchange determined to be the primary market for such security. Listed securities not traded on a particular day are valued at the mean of the closing bid and asked prices for domestic securities and the last quoted sale or closing price for international securities.
For valuation purposes, the last quoted prices of non-U.S. equity securities may be adjusted to reflect the fair value of such securities at the close of the NYSE. If the fund determines that developments between the close of a foreign market and the close of the NYSE will, in its judgment, materially affect the value of some or all of its portfolio securities, the fund will adjust the previous quoted prices to reflect what it believes to be the fair value of the securities as of the close of the NYSE. In deciding whether it is necessary to adjust quoted prices to reflect fair value, the fund reviews a variety of factors, including developments in foreign markets, the performance of U.S. securities markets, and the performance of instruments trading in U.S. markets that represent foreign securities and baskets of foreign securities. The fund may also fair value securities in other situations, such as when a particular foreign market is closed but the fund is open. The fund uses outside pricing services to provide it with quoted prices and information to evaluate or adjust those prices. The fund cannot predict how often it will use quoted prices and how often it will determine it necessary to adjust those prices to reflect fair value. As a means of evaluating its security valuation process, the fund routinely compares quoted prices, the next day’s opening prices in the same markets, and adjusted prices.
Actively traded equity securities listed on a domestic exchange generally are categorized in Level 1 of the fair value hierarchy. Non-U.S. equity securities generally are categorized in Level 2 of the fair value hierarchy despite the availability of quoted prices because, as described above, the fund evaluates and determines whether those quoted prices reflect fair value at the close of the NYSE or require adjustment. OTC Bulletin Board securities, certain preferred securities, and equity securities traded in inactive markets generally are categorized in Level 2 of the fair value hierarchy.
Debt securities generally are traded in the OTC market. Securities with remaining maturities of one year or more at the time of acquisition are valued at prices furnished by dealers who make markets in such securities or by an independent pricing service, which considers the yield or price of bonds of comparable quality, coupon, maturity, and type, as well as prices quoted by dealers who make markets in such securities. Generally, debt securities are categorized in Level 2 of the fair value hierarchy.
Investments in mutual funds are valued at the mutual fund’s closing NAV per share on the day of valuation and are categorized in Level 1 of the fair value hierarchy. Assets and liabilities other than financial instruments, including short-term receivables and payables, are carried at cost, or estimated realizable value, if less, which approximates fair value.
Thinly traded financial instruments and those for which the above valuation procedures are inappropriate or are deemed not to reflect fair value are stated at fair value as determined in good faith by the Valuation Committee. The objective of any fair value pricing determination is to arrive at a price that could reasonably be expected from a current sale. Financial instruments fair valued by the Valuation Committee are primarily private placements, restricted securities, warrants, rights, and other securities that are not publicly traded.
Subject to oversight by the Board, the Valuation Committee regularly makes good faith judgments to establish and adjust the fair valuations of certain securities as events occur and circumstances warrant. For instance, in determining the fair value of an equity investment with limited market activity, such as a private placement or a thinly traded public company stock, the Valuation Committee considers a variety of factors, which may include, but are not limited to, the issuer’s business prospects, its financial standing and performance, recent investment transactions in the issuer, new rounds of financing, negotiated transactions of significant size between other investors in the company, relevant market valuations of peer companies, strategic events affecting the company, market liquidity for the issuer, and general economic conditions and events. In consultation with the investment and pricing teams, the Valuation Committee will determine an appropriate valuation technique based on available information, which may include both observable and unobservable inputs. The Valuation Committee typically will afford greatest weight to actual prices in arm’s length transactions, to the extent they represent orderly transactions between market participants, transaction information can be reliably obtained, and prices are deemed representative of fair value. However, the Valuation Committee may also consider other valuation methods such as market-based valuation multiples; a discount or premium from market value of a similar, freely traded security of the same issuer; or some combination. Fair value determinations are reviewed on a regular basis and updated as information becomes available, including actual purchase and sale transactions of the issue. Because any fair value determination involves a significant amount of judgment, there is a degree of subjectivity inherent in such pricing decisions, and fair value prices determined by the Valuation Committee could differ from those of other market participants. Depending on the relative significance of unobservable inputs, including the valuation technique(s) used, fair valued securities may be categorized in Level 2 or 3 of the fair value hierarchy.
Valuation Inputs The following table summarizes the fund’s financial instruments, based on the inputs used to determine their fair values on June 30, 2016:
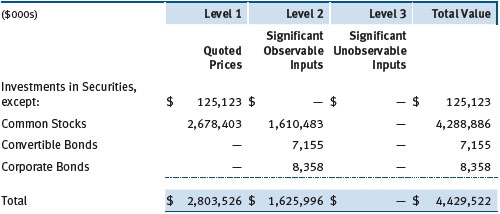
There were no material transfers between Levels 1 and 2 during the six months ended June 30, 2016.
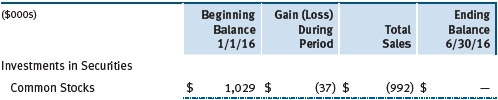
Following is a reconciliation of the fund’s Level 3 holdings for the six months ended June 30, 2016. Gain (loss) reflects both realized and change in unrealized gain/loss on Level 3 holdings during the period, if any, and is included on the accompanying Statement of Operations. The change in unrealized gain/loss on Level 3 instruments held at June 30, 2016, totaled $(1,071,000) for the six months ended June 30, 2016.
NOTE 3 - OTHER INVESTMENT TRANSACTIONS
Consistent with its investment objective, the fund engages in the following practices to manage exposure to certain risks and/or to enhance performance. The investment objective, policies, program, and risk factors of the fund are described more fully in the fund’s prospectus and Statement of Additional Information.
Restricted Securities The fund may invest in securities that are subject to legal or contractual restrictions on resale. Prompt sale of such securities at an acceptable price may be difficult and may involve substantial delays and additional costs.
Other Purchases and sales of portfolio securities other than short-term securities aggregated $1,242,161,000 and $2,008,758,000, respectively, for the six months ended June 30, 2016.
NOTE 4 - FEDERAL INCOME TAXES
No provision for federal income taxes is required since the fund intends to continue to qualify as a regulated investment company under Subchapter M of the Internal Revenue Code and distribute to shareholders all of its taxable income and gains. Distributions determined in accordance with federal income tax regulations may differ in amount or character from net investment income and realized gains for financial reporting purposes. Financial reporting records are adjusted for permanent book/tax differences to reflect tax character but are not adjusted for temporary differences. The amount and character of tax-basis distributions and composition of net assets are finalized at fiscal year-end; accordingly, tax-basis balances have not been determined as of the date of this report.
The fund intends to retain realized gains to the extent of available capital loss carryforwards. Net realized capital losses may be carried forward indefinitely to offset future realized capital gains. As of December 31, 2015, the fund had $658,404,000 of available capital loss carryforwards.
At June 30, 2016, the cost of investments for federal income tax purposes was $3,642,303,000. Net unrealized gain aggregated $787,138,000 at period-end, of which $1,043,830,000 related to appreciated investments and $256,692,000 related to depreciated investments.
NOTE 5 - RELATED PARTY TRANSACTIONS
The fund is managed by T. Rowe Price Associates, Inc. (Price Associates), a wholly owned subsidiary of T. Rowe Price Group, Inc. (Price Group). The investment management agreement between the fund and Price Associates provides for an annual investment management fee, which is computed daily and paid monthly. The fee consists of an individual fund fee, equal to 0.35% of the fund’s average daily net assets, and a group fee. The group fee rate is calculated based on the combined net assets of certain mutual funds sponsored by Price Associates (the group) applied to a graduated fee schedule, with rates ranging from 0.48% for the first $1 billion of assets to 0.270% for assets in excess of $500 billion. The fund’s group fee is determined by applying the group fee rate to the fund’s average daily net assets. At June 30, 2016, the effective annual group fee rate was 0.29%.
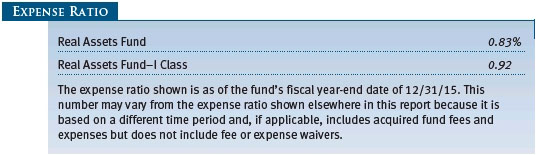
The I Class is subject to an operating expense limitation (I Class limit) pursuant to which Price Associates is contractually required to pay all operating expenses of the I Class, excluding management fees, interest, borrowing-related expenses, taxes, brokerage commissions, and extraordinary expenses, to the extent such operating expenses, on an annualized basis, exceed 0.05% of average net assets. This agreement will continue until April 30, 2018, and may be renewed, revised or revoked only with approval of the fund’s Board. The I Class is required to repay Price Associates for expenses previously paid to the extent the class’s net assets grow or expenses decline sufficiently to allow repayment without causing the class’s operating expenses to exceed the I Class limit. However, no repayment will be made more than three years after the date of a payment or waiver. For the six months ended June 30, 2016, the I Class operated below its expense limitation. Pursuant to this agreement, $1,000 of expenses were repaid to Price Associates during the six months ended June 30, 2016 and remain subject to repayment by the fund.
In addition, the fund has entered into service agreements with Price Associates and two wholly owned subsidiaries of Price Associates (collectively, Price). Price Associates provides certain accounting and administrative services to the fund. T. Rowe Price Services, Inc., provides shareholder and administrative services in its capacity as the fund’s transfer and dividend-disbursing agent. T. Rowe Price Retirement Plan Services, Inc., provides subaccounting and recordkeeping services for certain retirement accounts invested in the Investor Class. For the six months ended June 30, 2016, expenses incurred pursuant to these service agreements were $24,000 for Price Associates; $39,000 for T. Rowe Price Services, Inc.; and $2,000 for T. Rowe Price Retirement Plan Services, Inc. The total amount payable at period-end pursuant to these service agreements is reflected as Due to Affiliates in the accompanying financial statements, if any.
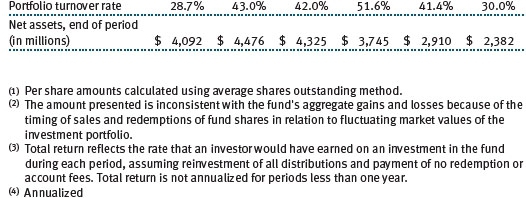
Additionally, the fund is one of several mutual funds in which certain college savings plans managed by Price Associates may invest. As approved by the fund’s Board of Directors, shareholder servicing costs associated with each college savings plan are borne by the fund in proportion to the average daily value of its shares owned by the college savings plan. For the six months ended June 30, 2016, the fund was charged $197,000 for shareholder servicing costs related to the college savings plans, of which $151,000 was for services provided by Price. The amount payable at period-end pursuant to this agreement is reflected as Due to Affiliates in the accompanying financial statements. At June 30, 2016, approximately 5% of the outstanding shares of the Investor Class were held by college savings plans.
The fund is also one of several mutual funds sponsored by Price Associates (underlying Price funds) in which the T. Rowe Price Spectrum Funds (Spectrum Funds), as well as the T. Rowe Price Retirement Funds (Retirement Funds) and T. Rowe Price Target Funds (Target Funds) may invest. Neither the Spectrum Funds, the Retirement Funds, nor the Target Funds invest in the underlying Price funds for the purpose of exercising management or control. Pursuant to separate special servicing agreements, expenses associated with the operation of the Spectrum Funds and Retirement Funds are borne by each underlying Price fund to the extent of estimated savings to it and in proportion to the average daily value of its shares owned by the Spectrum Funds and Retirement Funds, respectively. Prior to February 1, 2016, the Target Funds were subject to the same special servicing arrangement; thus expenses associated with the operation of the Target Funds prior to that date were borne by the underlying Price Funds. Effective February 1, 2016, expenses associated with the operation of the Target Funds are borne by the Target Funds.
Expenses allocated under these special servicing agreements are reflected as shareholder servicing expenses in the accompanying financial statements. For the six months ended June 30, 2016, the fund was allocated $77,000 of Spectrum Funds’ expenses, $3,530,000 of Retirement Funds’ expenses, and $8,000 of Target Funds’ expenses. Of these amounts, $1,503,000 related to services provided by Price. At period-end, the amount payable to Price pursuant to this agreement is reflected as Due to Affiliates in the accompanying financial statements. At June 30, 2016, 93% of the outstanding shares of the Investor Class were held by the Spectrum Funds and Retirement Funds, and approximately 6% of the outstanding shares of the I Class were held by the Target Funds.
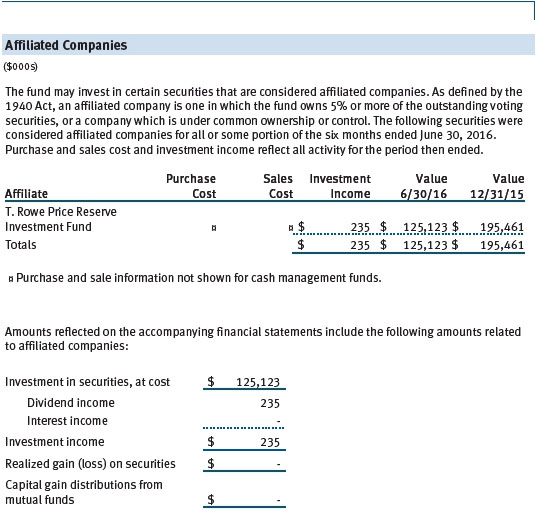
The fund may invest in the T. Rowe Price Reserve Investment Fund, the T. Rowe Price Government Reserve Investment Fund, or the T. Rowe Price Short-Term Reserve Fund (collectively, the Price Reserve Investment Funds), open-end management investment companies managed by Price Associates and considered affiliates of the fund. The Price Reserve Investment Funds are offered as short-term investment options to mutual funds, trusts, and other accounts managed by Price Associates or its affiliates and are not available for direct purchase by members of the public. The Price Reserve Investment Funds pay no investment management fees.
The fund may participate in securities purchase and sale transactions with other funds or accounts advised by Price Associates (cross trades), in accordance with procedures adopted by the fund’s Board and Securities and Exchange Commission rules, which require, among other things, that such purchase and sale cross trades be effected at the independent current market price of the security. During the six months ended June 30, 2016, the aggregate value of purchases and sales cross trades with other funds or accounts advised by Price Associates was less than 1% of the fund’s net assets as of June 30, 2016.
| Information on Proxy Voting Policies, Procedures, and Records |
A description of the policies and procedures used by T. Rowe Price funds and portfolios to determine how to vote proxies relating to portfolio securities is available in each fund’s Statement of Additional Information. You may request this document by calling 1-800-225-5132 or by accessing the SEC’s website, sec.gov.
The description of our proxy voting policies and procedures is also available on our corporate website. To access it, please visit the following Web page
https://www3.troweprice.com/usis/corporate/en/utility/policies.html
and scroll down to the section near the bottom of the page that says, “Proxy Voting Policies.” Click on the Proxy Voting Policies link in the shaded box.
Each fund’s most recent annual proxy voting record is available on our website and through the SEC’s website. To access it through T. Rowe Price, visit the website location shown above, and scroll down to the section near the bottom of the page that says, “Proxy Voting Records.” Click on the Proxy Voting Records link in the shaded box.
| How to Obtain Quarterly Portfolio Holdings |
The fund files a complete schedule of portfolio holdings with the Securities and Exchange Commission for the first and third quarters of each fiscal year on Form N-Q. The fund’s Form N-Q is available electronically on the SEC’s website (sec.gov); hard copies may be reviewed and copied at the SEC’s Public Reference Room, 100 F St. N.E., Washington, DC 20549. For more information on the Public Reference Room, call 1-800-SEC-0330.
| Approval of Investment Management Agreement |
On March 11, 2016, the fund’s Board of Directors (Board), including a majority of the fund’s independent directors, approved the continuation of the investment management agreement (Advisory Contract) between the fund and its investment advisor, T. Rowe Price Associates, Inc. (Advisor). In connection with its deliberations, the Board requested, and the Advisor provided, such information as the Board (with advice from independent legal counsel) deemed reasonably necessary. The Board considered a variety of factors in connection with its review of the Advisory Contract, also taking into account information provided by the Advisor during the course of the year, as discussed below:
Services Provided by the Advisor
The Board considered the nature, quality, and extent of the services provided to the fund by the Advisor. These services included, but were not limited to, directing the fund’s investments in accordance with its investment program and the overall management of the fund’s portfolio, as well as a variety of related activities such as financial, investment operations, and administrative services; compliance; maintaining the fund’s records and registrations; and shareholder communications. The Board also reviewed the background and experience of the Advisor’s senior management team and investment personnel involved in the management of the fund, as well as the Advisor’s compliance record. The Board concluded that it was satisfied with the nature, quality, and extent of the services provided by the Advisor.
Investment Performance of the Fund
The Board reviewed the fund’s three-month, one-year, and year-by-year returns, as well as the fund’s average annualized total returns over the three-year, five-year, and since-inception periods, and compared these returns with a wide variety of comparable performance measures and market data, including those supplied by Lipper and Morningstar, which are independent providers of mutual fund data.
On the basis of this evaluation and the Board’s ongoing review of investment results, and factoring in the relative market conditions during certain of the performance periods, the Board concluded that the fund’s performance was satisfactory.
Costs, Benefits, Profits, and Economies of Scale
The Board reviewed detailed information regarding the revenues received by the Advisor under the Advisory Contract and other benefits that the Advisor (and its affiliates) may have realized from its relationship with the fund, including any research received under “soft dollar” agreements and commission-sharing arrangements with broker-dealers. The Board considered that the Advisor may receive some benefit from soft-dollar arrangements pursuant to which research is received from broker-dealers that execute the applicable fund’s portfolio transactions. The Board received information on the estimated costs incurred and profits realized by the Advisor from managing T. Rowe Price mutual funds. The Board also reviewed estimates of the profits realized from managing the fund in particular, and the Board concluded that the Advisor’s profits were reasonable in light of the services provided to the fund.
The Board also considered whether the fund benefits under the fee levels set forth in the Advisory Contract from any economies of scale realized by the Advisor. Under the Advisory Contract, the fund pays a fee to the Advisor for investment management services composed of two components—a group fee rate based on the combined average net assets of most of the T. Rowe Price mutual funds (including the fund) that declines at certain asset levels and an individual fund fee rate based on the fund’s average daily net assets—and the fund pays its own expenses of operations (subject to an expense limitation on operating expenses with respect to the I Class). The Board concluded that the advisory fee structure for the fund continued to provide for a reasonable sharing of benefits from any economies of scale with the fund’s investors.
Fees
The Board was provided with information regarding industry trends in management fees and expenses, and the Board reviewed the fund’s management fee rate, operating expenses, and total expense ratio (for the Investor Class and I Class) in comparison with fees and expenses of other comparable funds based on information and data supplied by Lipper. The information provided to the Board indicated that the fund’s management fee rate was above the median for certain groups of comparable funds and at or below the median for other groups of comparable funds. The information also indicated that the total expense ratio for the Investor Class was above the median for certain groups of comparable funds and at or below the median for other groups of comparable funds, and the total expense ratio for the I Class was below the median for comparable funds.
The Board also reviewed the fee schedules for institutional accounts (including subadvised mutual funds) and private accounts with similar mandates that are advised or subadvised by the Advisor and its affiliates. Management provided the Board with information about the Advisor’s responsibilities and services provided to subadvisory and other institutional account clients, including information about how the requirements and economics of the institutional business differ from those of the Advisor’s proprietary mutual fund business. The Board considered information showing that the Advisor’s proprietary mutual fund business is generally more complex from a business and compliance perspective than its institutional account business and considered various other relevant factors, including the broader scope of operations and oversight, more extensive shareholder communication infrastructure, greater asset flows, heightened business risks, and differences in applicable laws and regulations associated with the Advisor’s proprietary mutual fund business. In assessing the reasonableness of the fund’s management fee rate, the Board considered the differences in the nature of the services required for the Advisor to manage its proprietary mutual fund business versus managing a discrete pool of assets as a subadvisor to another institution’s mutual fund or for another institutional account and the degree to which the Advisor performs significant additional services and assumes greater risk in managing the fund and other T. Rowe Price mutual funds than it does for institutional account clients.
On the basis of the information provided and the factors considered, the Board concluded that the fees paid by the fund under the Advisory Contract are reasonable.
Approval of the Advisory Contract
As noted, the Board approved the continuation of the Advisory Contract. No single factor was considered in isolation or to be determinative to the decision. Rather, the Board concluded, in light of a weighting and balancing of all factors considered, that it was in the best interests of the fund and its shareholders for the Board to approve the continuation of the Advisory Contract (including the fees to be charged for services thereunder). The independent directors were advised throughout the process by independent legal counsel.
Item 2. Code of Ethics.
A code of ethics, as defined in Item 2 of Form N-CSR, applicable to its principal executive officer, principal financial officer, principal accounting officer or controller, or persons performing similar functions is filed as an exhibit to the registrant’s annual Form N-CSR. No substantive amendments were approved or waivers were granted to this code of ethics during the registrant’s most recent fiscal half-year.
Item 3. Audit Committee Financial Expert.
Disclosure required in registrant’s annual Form N-CSR.
Item 4. Principal Accountant Fees and Services.
Disclosure required in registrant’s annual Form N-CSR.
Item 5. Audit Committee of Listed Registrants.
Not applicable.
Item 6. Investments.
(a) Not applicable. The complete schedule of investments is included in Item 1 of this Form N-CSR.
(b) Not applicable.
Item 7. Disclosure of Proxy Voting Policies and Procedures for Closed-End Management Investment Companies.
Not applicable.
Item 8. Portfolio Managers of Closed-End Management Investment Companies.
Not applicable.
Item 9. Purchases of Equity Securities by Closed-End Management Investment Company and Affiliated Purchasers.
Not applicable.
Item 10. Submission of Matters to a Vote of Security Holders.
Not applicable.
Item 11. Controls and Procedures.
(a) The registrant’s principal executive officer and principal financial officer have evaluated the registrant’s disclosure controls and procedures within 90 days of this filing and have concluded that the registrant’s disclosure controls and procedures were effective, as of that date, in ensuring that information required to be disclosed by the registrant in this Form N-CSR was recorded, processed, summarized, and reported timely.
(b) The registrant’s principal executive officer and principal financial officer are aware of no change in the registrant’s internal control over financial reporting that occurred during the registrant’s second fiscal quarter covered by this report that has materially affected, or is reasonably likely to materially affect, the registrant’s internal control over financial reporting.
Item 12. Exhibits.
(a)(1) The registrant’s code of ethics pursuant to Item 2 of Form N-CSR is filed with the registrant’s annual Form N-CSR.
(2) Separate certifications by the registrant's principal executive officer and principal financial officer, pursuant to Section 302 of the Sarbanes-Oxley Act of 2002 and required by Rule 30a-2(a) under the Investment Company Act of 1940, are attached.
(3) Written solicitation to repurchase securities issued by closed-end companies: not applicable.
(b) A certification by the registrant's principal executive officer and principal financial officer, pursuant to Section 906 of the Sarbanes-Oxley Act of 2002 and required by Rule 30a-2(b) under the Investment Company Act of 1940, is attached.
SIGNATURES
Pursuant to the requirements of the Securities Exchange Act of 1934 and the Investment Company Act of 1940, the registrant has duly caused this report to be signed on its behalf by the undersigned, thereunto duly authorized.
T. Rowe Price Real Assets Fund, Inc.
| | By | /s/ Edward C. Bernard |
| | Edward C. Bernard |
| | Principal Executive Officer |
| |
| Date August 17, 2016 | | |
Pursuant to the requirements of the Securities Exchange Act of 1934 and the Investment Company Act of 1940, this report has been signed below by the following persons on behalf of the registrant and in the capacities and on the dates indicated.
| | By | /s/ Edward C. Bernard |
| | Edward C. Bernard |
| | Principal Executive Officer |
| |
| Date August 17, 2016 | | |
| |
| |
| By | /s/ Catherine D. Mathews |
| | Catherine D. Mathews |
| | Principal Financial Officer |
| |
| Date August 17, 2016 | | |