
Consolidated Financial Statements FBLC Senior Loan Fund LLC For the year ended December 31, 2022
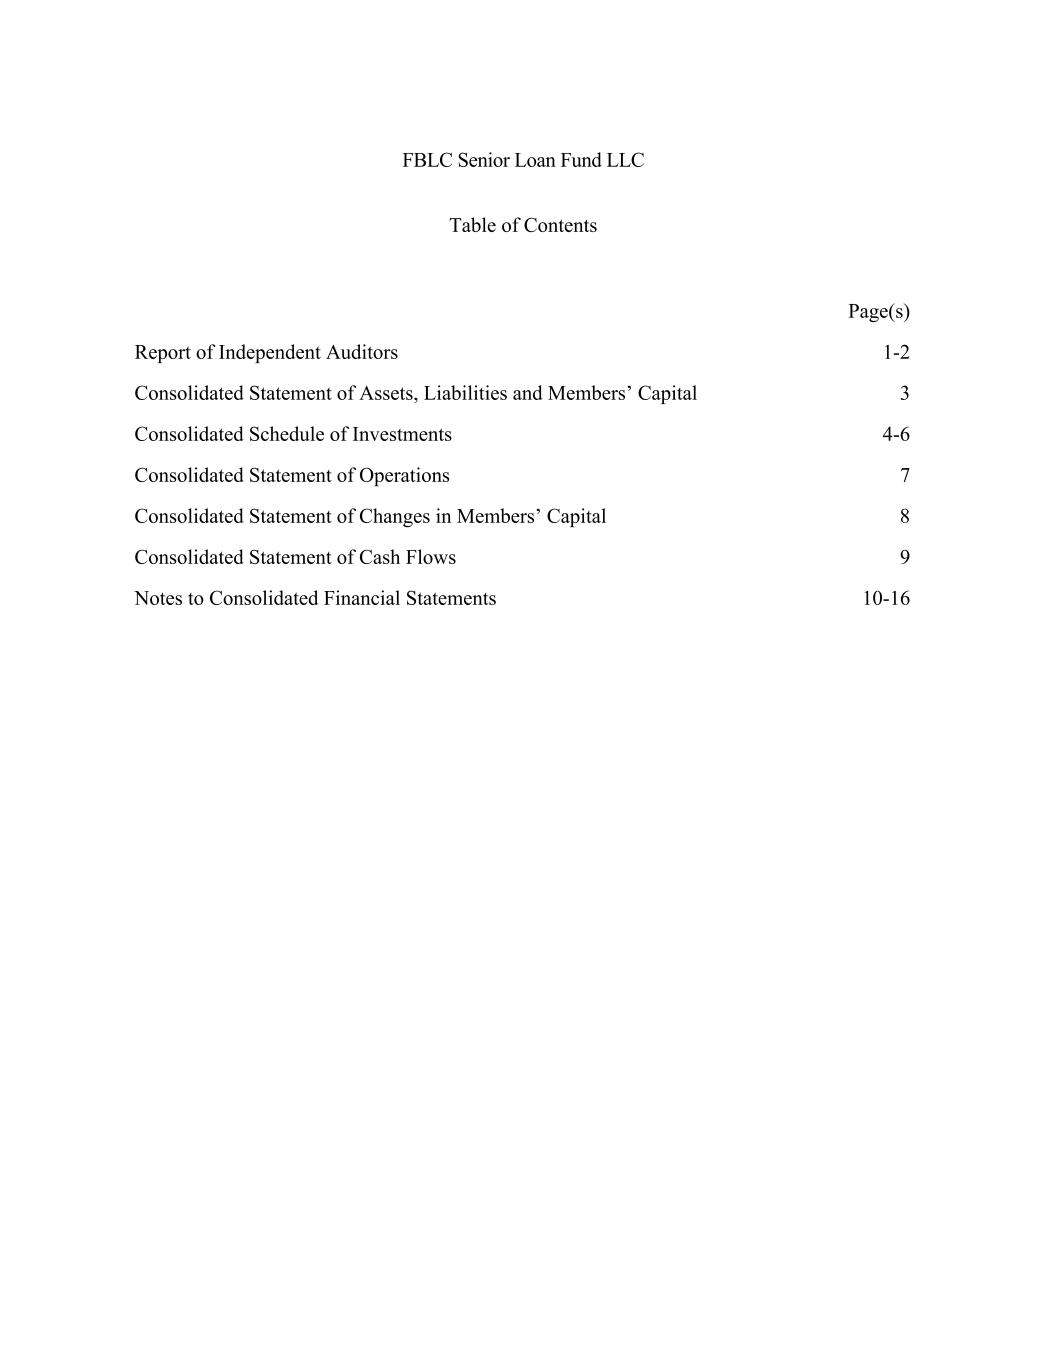
FBLC Senior Loan Fund LLC Table of Contents Page(s) Report of Independent Auditors 1-2 Consolidated Statement of Assets, Liabilities and Members’ Capital 3 Consolidated Schedule of Investments 4-6 Consolidated Statement of Operations 7 Consolidated Statement of Changes in Members’ Capital 8 Consolidated Statement of Cash Flows 9 Notes to Consolidated Financial Statements 10-16
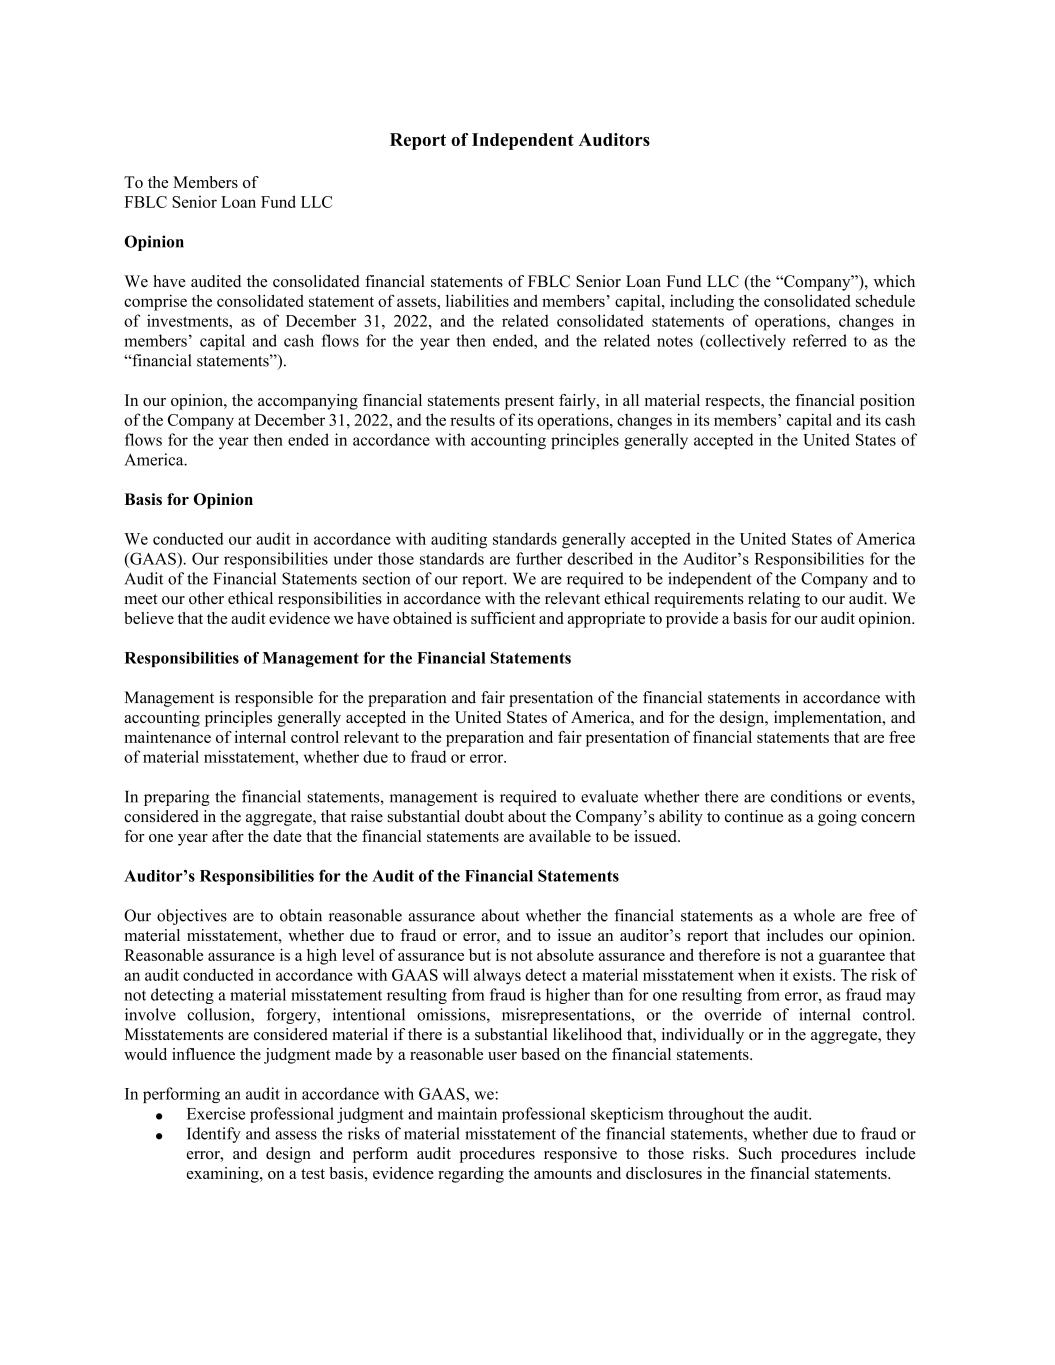
Report of Independent Auditors To the Members of FBLC Senior Loan Fund LLC Opinion We have audited the consolidated financial statements of FBLC Senior Loan Fund LLC (the “Company”), which comprise the consolidated statement of assets, liabilities and members’ capital, including the consolidated schedule of investments, as of December 31, 2022, and the related consolidated statements of operations, changes in members’ capital and cash flows for the year then ended, and the related notes (collectively referred to as the “financial statements”). In our opinion, the accompanying financial statements present fairly, in all material respects, the financial position of the Company at December 31, 2022, and the results of its operations, changes in its members’ capital and its cash flows for the year then ended in accordance with accounting principles generally accepted in the United States of America. Basis for Opinion We conducted our audit in accordance with auditing standards generally accepted in the United States of America (GAAS). Our responsibilities under those standards are further described in the Auditor’s Responsibilities for the Audit of the Financial Statements section of our report. We are required to be independent of the Company and to meet our other ethical responsibilities in accordance with the relevant ethical requirements relating to our audit. We believe that the audit evidence we have obtained is sufficient and appropriate to provide a basis for our audit opinion. Responsibilities of Management for the Financial Statements Management is responsible for the preparation and fair presentation of the financial statements in accordance with accounting principles generally accepted in the United States of America, and for the design, implementation, and maintenance of internal control relevant to the preparation and fair presentation of financial statements that are free of material misstatement, whether due to fraud or error. In preparing the financial statements, management is required to evaluate whether there are conditions or events, considered in the aggregate, that raise substantial doubt about the Company’s ability to continue as a going concern for one year after the date that the financial statements are available to be issued. Auditor’s Responsibilities for the Audit of the Financial Statements Our objectives are to obtain reasonable assurance about whether the financial statements as a whole are free of material misstatement, whether due to fraud or error, and to issue an auditor’s report that includes our opinion. Reasonable assurance is a high level of assurance but is not absolute assurance and therefore is not a guarantee that an audit conducted in accordance with GAAS will always detect a material misstatement when it exists. The risk of not detecting a material misstatement resulting from fraud is higher than for one resulting from error, as fraud may involve collusion, forgery, intentional omissions, misrepresentations, or the override of internal control. Misstatements are considered material if there is a substantial likelihood that, individually or in the aggregate, they would influence the judgment made by a reasonable user based on the financial statements. In performing an audit in accordance with GAAS, we: Exercise professional judgment and maintain professional skepticism throughout the audit. Identify and assess the risks of material misstatement of the financial statements, whether due to fraud or error, and design and perform audit procedures responsive to those risks. Such procedures include examining, on a test basis, evidence regarding the amounts and disclosures in the financial statements.

2 Obtain an understanding of internal control relevant to the audit in order to design audit procedures that are appropriate in the circumstances, but not for the purpose of expressing an opinion on the effectiveness of the Company’s internal control. Accordingly, no such opinion is expressed. Evaluate the appropriateness of accounting policies used and the reasonableness of significant accounting estimates made by management, as well as evaluate the overall presentation of the financial statements. Conclude whether, in our judgment, there are conditions or events, considered in the aggregate, that raise substantial doubt about the Company’s ability to continue as a going concern for a reasonable period of time. We are required to communicate with those charged with governance regarding, among other matters, the planned scope and timing of the audit, significant audit findings, and certain internal control-related matters that we identified during the audit. /s/ Ernst & Young LLP March 13, 2023
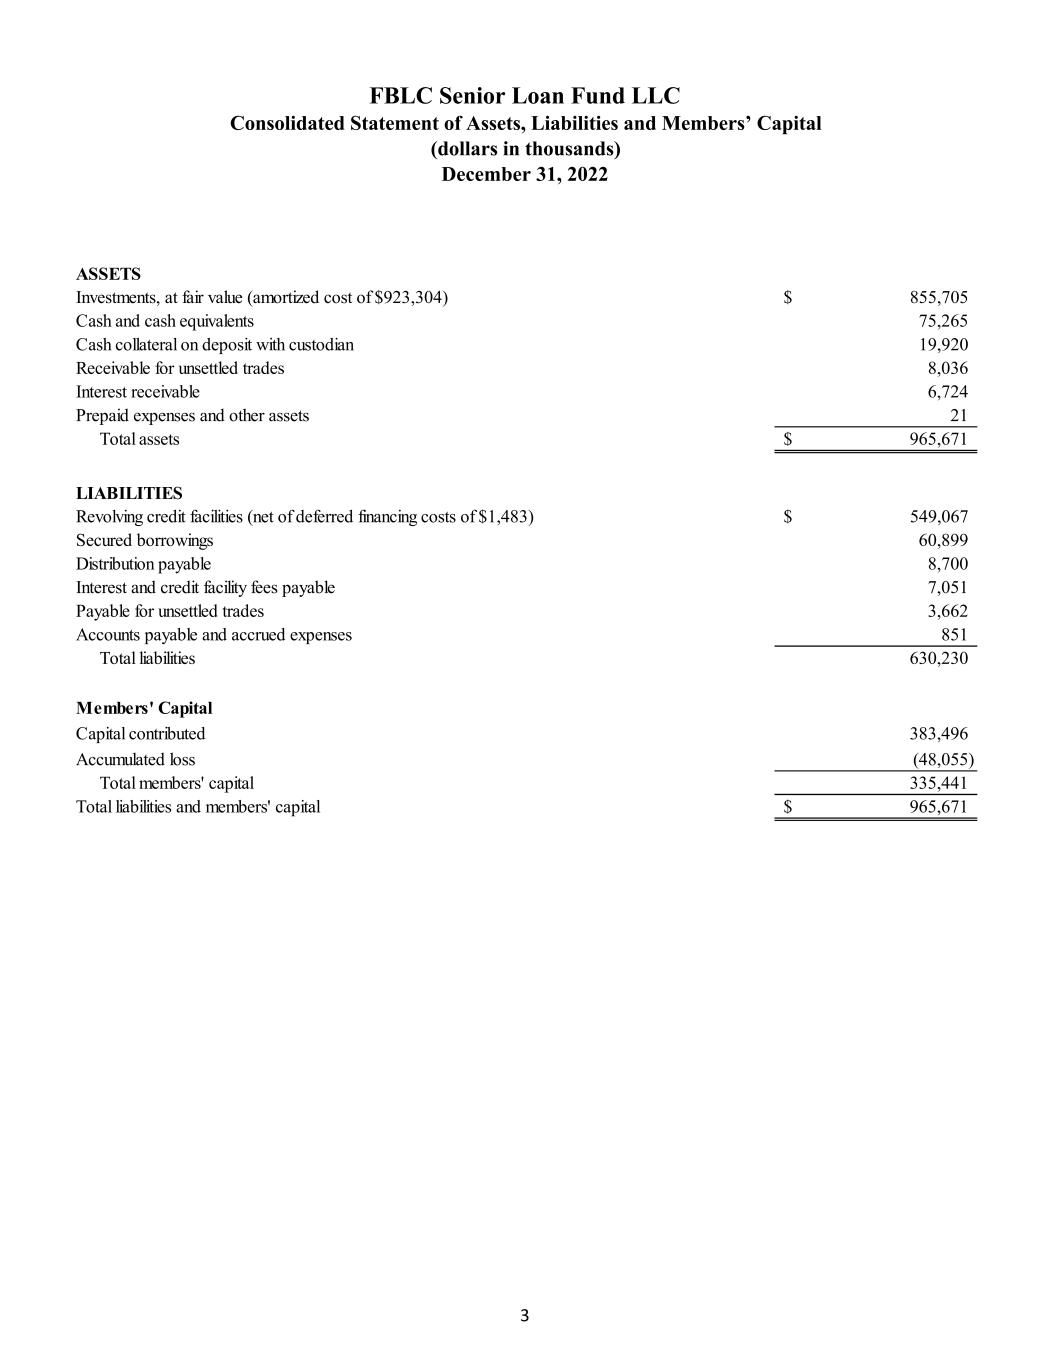
FBLC Senior Loan Fund LLC Consolidated Statement of Assets, Liabilities and Members’ Capital (dollars in thousands) December 31, 2022 3 Investments, at fair value (amortized cost of $923,304) 855,705$ Cash and cash equivalents 75,265 Cash collateral on deposit with custodian 19,920 Receivable for unsettled trades 8,036 Interest receivable 6,724 Prepaid expenses and other assets 21 Total assets 965,671$ Revolving credit facilities (net of deferred financing costs of $1,483) 549,067$ Secured borrowings 60,899 Distribution payable 8,700 Interest and credit facility fees payable 7,051 Payable for unsettled trades 3,662 Accounts payable and accrued expenses 851 Total liabilities 630,230 Capital contributed 383,496 Accumulated loss (48,055) Total members' capital 335,441 Total liabilities and members' capital 965,671$ Members' Capital ASSETS LIABILITIES
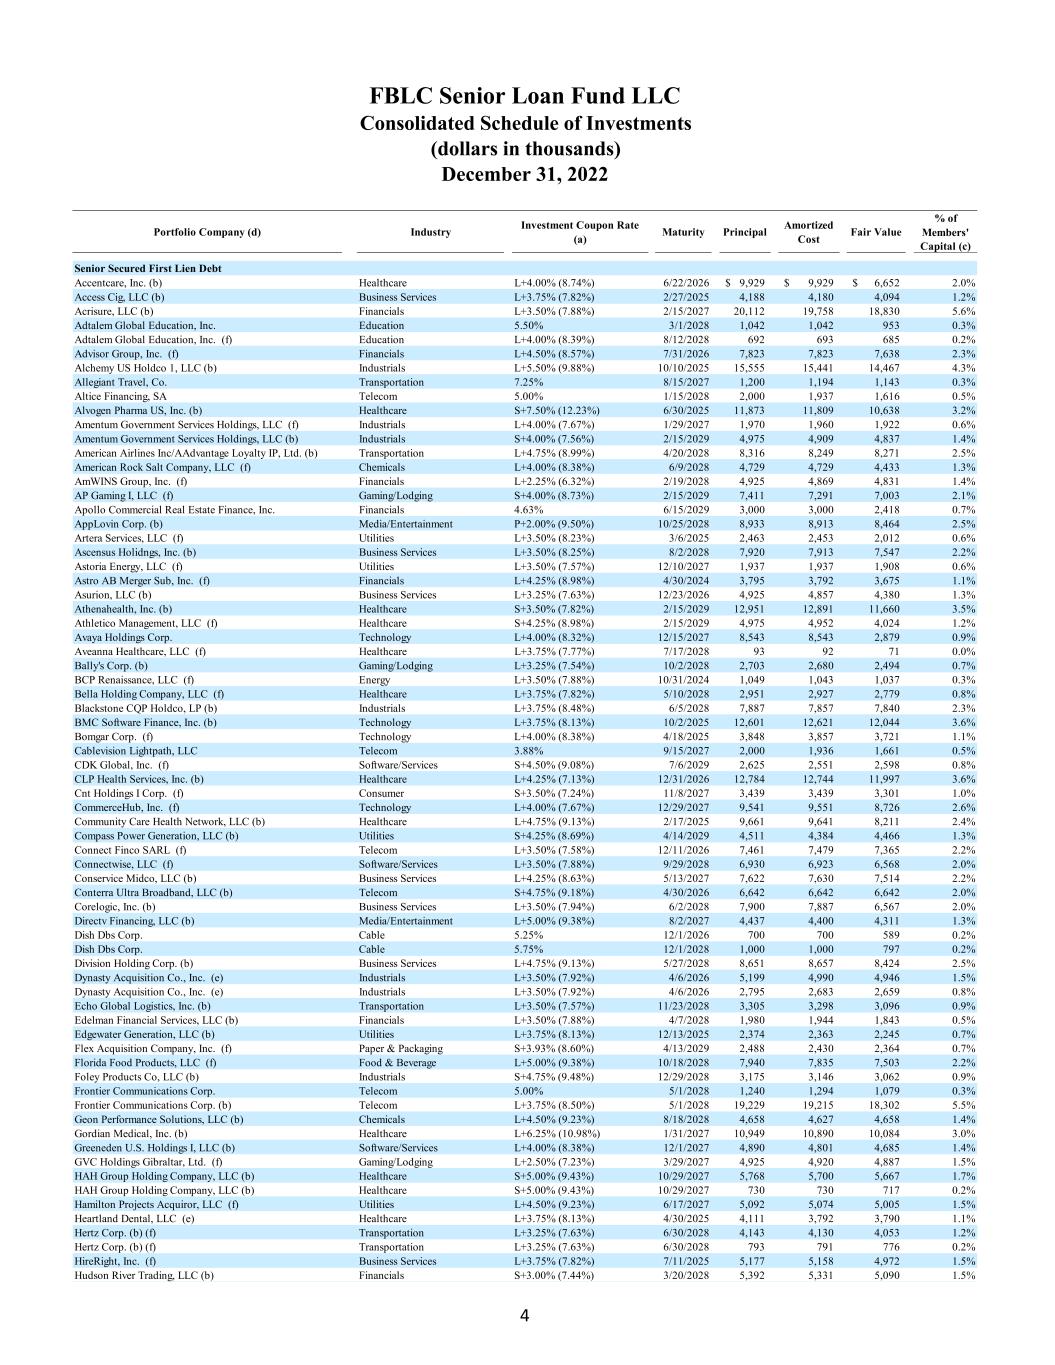
FBLC Senior Loan Fund LLC Consolidated Schedule of Investments (dollars in thousands) December 31, 2022 4 Portfolio Company (d) Industry Investment Coupon Rate (a) Maturity Principal Amortized Cost Fair Value % of Members' Capital (c) Senior Secured First Lien Debt Accentcare, Inc. (b) Healthcare L+4.00% (8.74%) 6/22/2026 9,929$ 9,929$ 6,652$ 2.0% Access Cig, LLC (b) Business Services L+3.75% (7.82%) 2/27/2025 4,188 4,180 4,094 1.2% Acrisure, LLC (b) Financials L+3.50% (7.88%) 2/15/2027 20,112 19,758 18,830 5.6% Adtalem Global Education, Inc. Education 5.50% 3/1/2028 1,042 1,042 953 0.3% Adtalem Global Education, Inc. (f) Education L+4.00% (8.39%) 8/12/2028 692 693 685 0.2% Advisor Group, Inc. (f) Financials L+4.50% (8.57%) 7/31/2026 7,823 7,823 7,638 2.3% Alchemy US Holdco 1, LLC (b) Industrials L+5.50% (9.88%) 10/10/2025 15,555 15,441 14,467 4.3% Allegiant Travel, Co. Transportation 7.25% 8/15/2027 1,200 1,194 1,143 0.3% Altice Financing, SA Telecom 5.00% 1/15/2028 2,000 1,937 1,616 0.5% Alvogen Pharma US, Inc. (b) Healthcare S+7.50% (12.23%) 6/30/2025 11,873 11,809 10,638 3.2% Amentum Government Services Holdings, LLC (f) Industrials L+4.00% (7.67%) 1/29/2027 1,970 1,960 1,922 0.6% Amentum Government Services Holdings, LLC (b) Industrials S+4.00% (7.56%) 2/15/2029 4,975 4,909 4,837 1.4% American Airlines Inc/AAdvantage Loyalty IP, Ltd. (b) Transportation L+4.75% (8.99%) 4/20/2028 8,316 8,249 8,271 2.5% American Rock Salt Company, LLC (f) Chemicals L+4.00% (8.38%) 6/9/2028 4,729 4,729 4,433 1.3% AmWINS Group, Inc. (f) Financials L+2.25% (6.32%) 2/19/2028 4,925 4,869 4,831 1.4% AP Gaming I, LLC (f) Gaming/Lodging S+4.00% (8.73%) 2/15/2029 7,411 7,291 7,003 2.1% Apollo Commercial Real Estate Finance, Inc. Financials 4.63% 6/15/2029 3,000 3,000 2,418 0.7% AppLovin Corp. (b) Media/Entertainment P+2.00% (9.50%) 10/25/2028 8,933 8,913 8,464 2.5% Artera Services, LLC (f) Utilities L+3.50% (8.23%) 3/6/2025 2,463 2,453 2,012 0.6% Ascensus Holidngs, Inc. (b) Business Services L+3.50% (8.25%) 8/2/2028 7,920 7,913 7,547 2.2% Astoria Energy, LLC (f) Utilities L+3.50% (7.57%) 12/10/2027 1,937 1,937 1,908 0.6% Astro AB Merger Sub, Inc. (f) Financials L+4.25% (8.98%) 4/30/2024 3,795 3,792 3,675 1.1% Asurion, LLC (b) Business Services L+3.25% (7.63%) 12/23/2026 4,925 4,857 4,380 1.3% Athenahealth, Inc. (b) Healthcare S+3.50% (7.82%) 2/15/2029 12,951 12,891 11,660 3.5% Athletico Management, LLC (f) Healthcare S+4.25% (8.98%) 2/15/2029 4,975 4,952 4,024 1.2% Avaya Holdings Corp. Technology L+4.00% (8.32%) 12/15/2027 8,543 8,543 2,879 0.9% Aveanna Healthcare, LLC (f) Healthcare L+3.75% (7.77%) 7/17/2028 93 92 71 0.0% Bally's Corp. (b) Gaming/Lodging L+3.25% (7.54%) 10/2/2028 2,703 2,680 2,494 0.7% BCP Renaissance, LLC (f) Energy L+3.50% (7.88%) 10/31/2024 1,049 1,043 1,037 0.3% Bella Holding Company, LLC (f) Healthcare L+3.75% (7.82%) 5/10/2028 2,951 2,927 2,779 0.8% Blackstone CQP Holdco, LP (b) Industrials L+3.75% (8.48%) 6/5/2028 7,887 7,857 7,840 2.3% BMC Software Finance, Inc. (b) Technology L+3.75% (8.13%) 10/2/2025 12,601 12,621 12,044 3.6% Bomgar Corp. (f) Technology L+4.00% (8.38%) 4/18/2025 3,848 3,857 3,721 1.1% Cablevision Lightpath, LLC Telecom 3.88% 9/15/2027 2,000 1,936 1,661 0.5% CDK Global, Inc. (f) Software/Services S+4.50% (9.08%) 7/6/2029 2,625 2,551 2,598 0.8% CLP Health Services, Inc. (b) Healthcare L+4.25% (7.13%) 12/31/2026 12,784 12,744 11,997 3.6% Cnt Holdings I Corp. (f) Consumer S+3.50% (7.24%) 11/8/2027 3,439 3,439 3,301 1.0% CommerceHub, Inc. (f) Technology L+4.00% (7.67%) 12/29/2027 9,541 9,551 8,726 2.6% Community Care Health Network, LLC (b) Healthcare L+4.75% (9.13%) 2/17/2025 9,661 9,641 8,211 2.4% Compass Power Generation, LLC (b) Utilities S+4.25% (8.69%) 4/14/2029 4,511 4,384 4,466 1.3% Connect Finco SARL (f) Telecom L+3.50% (7.58%) 12/11/2026 7,461 7,479 7,365 2.2% Connectwise, LLC (f) Software/Services L+3.50% (7.88%) 9/29/2028 6,930 6,923 6,568 2.0% Conservice Midco, LLC (b) Business Services L+4.25% (8.63%) 5/13/2027 7,622 7,630 7,514 2.2% Conterra Ultra Broadband, LLC (b) Telecom S+4.75% (9.18%) 4/30/2026 6,642 6,642 6,642 2.0% Corelogic, Inc. (b) Business Services L+3.50% (7.94%) 6/2/2028 7,900 7,887 6,567 2.0% Directv Financing, LLC (b) Media/Entertainment L+5.00% (9.38%) 8/2/2027 4,437 4,400 4,311 1.3% Dish Dbs Corp. Cable 5.25% 12/1/2026 700 700 589 0.2% Dish Dbs Corp. Cable 5.75% 12/1/2028 1,000 1,000 797 0.2% Division Holding Corp. (b) Business Services L+4.75% (9.13%) 5/27/2028 8,651 8,657 8,424 2.5% Dynasty Acquisition Co., Inc. (e) Industrials L+3.50% (7.92%) 4/6/2026 5,199 4,990 4,946 1.5% Dynasty Acquisition Co., Inc. (e) Industrials L+3.50% (7.92%) 4/6/2026 2,795 2,683 2,659 0.8% Echo Global Logistics, Inc. (b) Transportation L+3.50% (7.57%) 11/23/2028 3,305 3,298 3,096 0.9% Edelman Financial Services, LLC (b) Financials L+3.50% (7.88%) 4/7/2028 1,980 1,944 1,843 0.5% Edgewater Generation, LLC (b) Utilities L+3.75% (8.13%) 12/13/2025 2,374 2,363 2,245 0.7% Flex Acquisition Company, Inc. (f) Paper & Packaging S+3.93% (8.60%) 4/13/2029 2,488 2,430 2,364 0.7% Florida Food Products, LLC (f) Food & Beverage L+5.00% (9.38%) 10/18/2028 7,940 7,835 7,503 2.2% Foley Products Co, LLC (b) Industrials S+4.75% (9.48%) 12/29/2028 3,175 3,146 3,062 0.9% Frontier Communications Corp. Telecom 5.00% 5/1/2028 1,240 1,294 1,079 0.3% Frontier Communications Corp. (b) Telecom L+3.75% (8.50%) 5/1/2028 19,229 19,215 18,302 5.5% Geon Performance Solutions, LLC (b) Chemicals L+4.50% (9.23%) 8/18/2028 4,658 4,627 4,658 1.4% Gordian Medical, Inc. (b) Healthcare L+6.25% (10.98%) 1/31/2027 10,949 10,890 10,084 3.0% Greeneden U.S. Holdings I, LLC (b) Software/Services L+4.00% (8.38%) 12/1/2027 4,890 4,801 4,685 1.4% GVC Holdings Gibraltar, Ltd. (f) Gaming/Lodging L+2.50% (7.23%) 3/29/2027 4,925 4,920 4,887 1.5% HAH Group Holding Company, LLC (b) Healthcare S+5.00% (9.43%) 10/29/2027 5,768 5,700 5,667 1.7% HAH Group Holding Company, LLC (b) Healthcare S+5.00% (9.43%) 10/29/2027 730 730 717 0.2% Hamilton Projects Acquiror, LLC (f) Utilities L+4.50% (9.23%) 6/17/2027 5,092 5,074 5,005 1.5% Heartland Dental, LLC (e) Healthcare L+3.75% (8.13%) 4/30/2025 4,111 3,792 3,790 1.1% Hertz Corp. (b) (f) Transportation L+3.25% (7.63%) 6/30/2028 4,143 4,130 4,053 1.2% Hertz Corp. (b) (f) Transportation L+3.25% (7.63%) 6/30/2028 793 791 776 0.2% HireRight, Inc. (f) Business Services L+3.75% (7.82%) 7/11/2025 5,177 5,158 4,972 1.5% Hudson River Trading, LLC (b) Financials S+3.00% (7.44%) 3/20/2028 5,392 5,331 5,090 1.5%
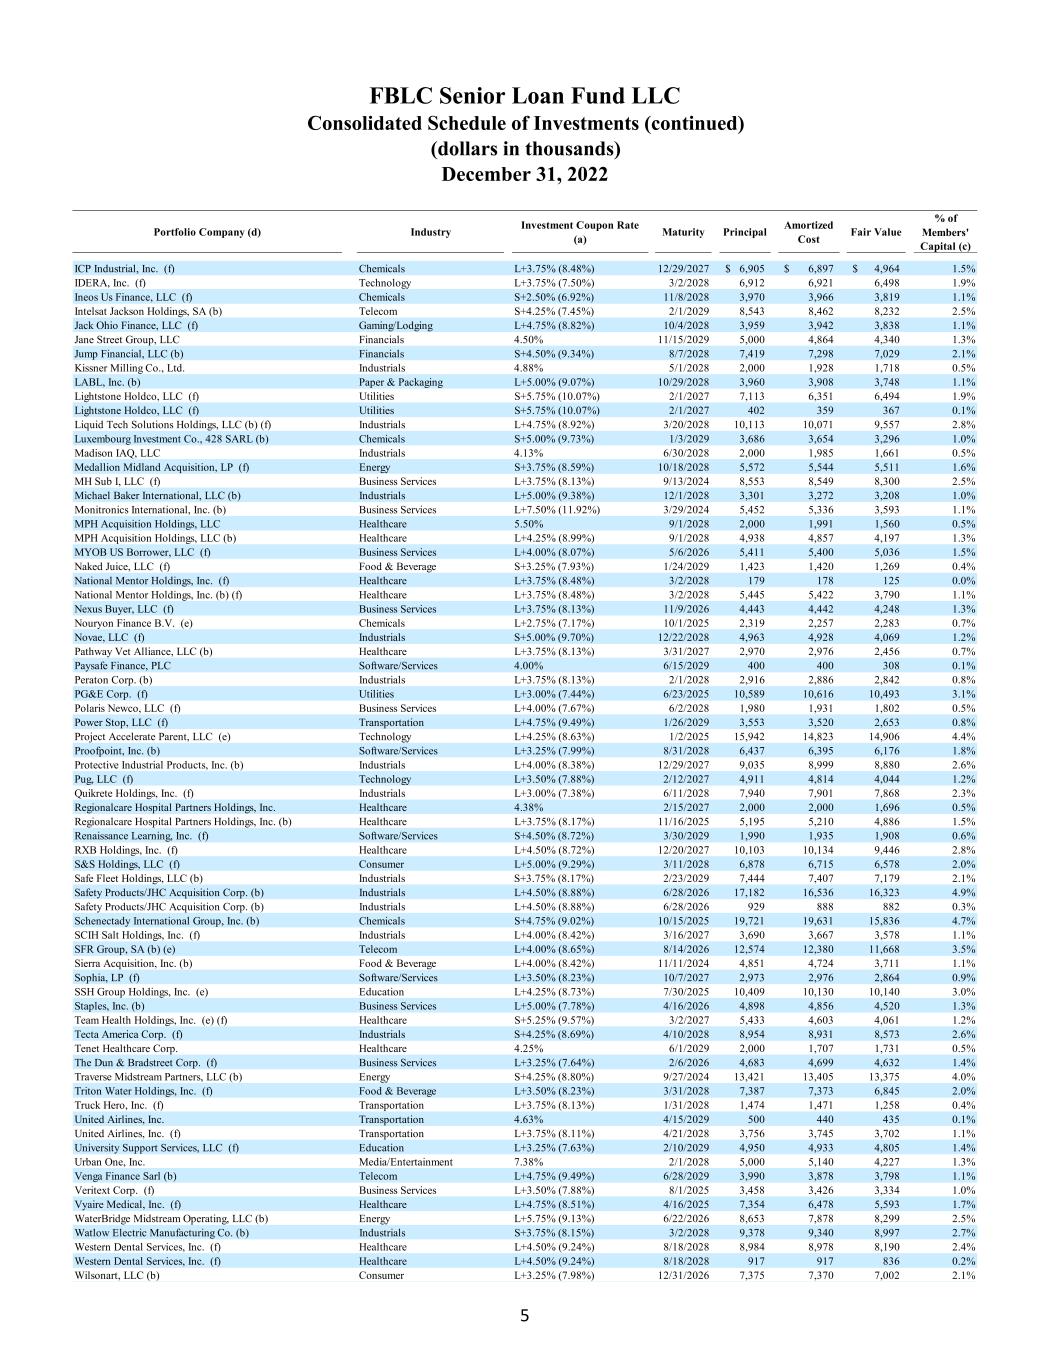
FBLC Senior Loan Fund LLC Consolidated Schedule of Investments (continued) (dollars in thousands) December 31, 2022 5 Portfolio Company (d) Industry Investment Coupon Rate (a) Maturity Principal Amortized Cost Fair Value % of Members' Capital (c) ICP Industrial, Inc. (f) Chemicals L+3.75% (8.48%) 12/29/2027 6,905$ 6,897$ 4,964$ 1.5% IDERA, Inc. (f) Technology L+3.75% (7.50%) 3/2/2028 6,912 6,921 6,498 1.9% Ineos Us Finance, LLC (f) Chemicals S+2.50% (6.92%) 11/8/2028 3,970 3,966 3,819 1.1% Intelsat Jackson Holdings, SA (b) Telecom S+4.25% (7.45%) 2/1/2029 8,543 8,462 8,232 2.5% Jack Ohio Finance, LLC (f) Gaming/Lodging L+4.75% (8.82%) 10/4/2028 3,959 3,942 3,838 1.1% Jane Street Group, LLC Financials 4.50% 11/15/2029 5,000 4,864 4,340 1.3% Jump Financial, LLC (b) Financials S+4.50% (9.34%) 8/7/2028 7,419 7,298 7,029 2.1% Kissner Milling Co., Ltd. Industrials 4.88% 5/1/2028 2,000 1,928 1,718 0.5% LABL, Inc. (b) Paper & Packaging L+5.00% (9.07%) 10/29/2028 3,960 3,908 3,748 1.1% Lightstone Holdco, LLC (f) Utilities S+5.75% (10.07%) 2/1/2027 7,113 6,351 6,494 1.9% Lightstone Holdco, LLC (f) Utilities S+5.75% (10.07%) 2/1/2027 402 359 367 0.1% Liquid Tech Solutions Holdings, LLC (b) (f) Industrials L+4.75% (8.92%) 3/20/2028 10,113 10,071 9,557 2.8% Luxembourg Investment Co., 428 SARL (b) Chemicals S+5.00% (9.73%) 1/3/2029 3,686 3,654 3,296 1.0% Madison IAQ, LLC Industrials 4.13% 6/30/2028 2,000 1,985 1,661 0.5% Medallion Midland Acquisition, LP (f) Energy S+3.75% (8.59%) 10/18/2028 5,572 5,544 5,511 1.6% MH Sub I, LLC (f) Business Services L+3.75% (8.13%) 9/13/2024 8,553 8,549 8,300 2.5% Michael Baker International, LLC (b) Industrials L+5.00% (9.38%) 12/1/2028 3,301 3,272 3,208 1.0% Monitronics International, Inc. (b) Business Services L+7.50% (11.92%) 3/29/2024 5,452 5,336 3,593 1.1% MPH Acquisition Holdings, LLC Healthcare 5.50% 9/1/2028 2,000 1,991 1,560 0.5% MPH Acquisition Holdings, LLC (b) Healthcare L+4.25% (8.99%) 9/1/2028 4,938 4,857 4,197 1.3% MYOB US Borrower, LLC (f) Business Services L+4.00% (8.07%) 5/6/2026 5,411 5,400 5,036 1.5% Naked Juice, LLC (f) Food & Beverage S+3.25% (7.93%) 1/24/2029 1,423 1,420 1,269 0.4% National Mentor Holdings, Inc. (f) Healthcare L+3.75% (8.48%) 3/2/2028 179 178 125 0.0% National Mentor Holdings, Inc. (b) (f) Healthcare L+3.75% (8.48%) 3/2/2028 5,445 5,422 3,790 1.1% Nexus Buyer, LLC (f) Business Services L+3.75% (8.13%) 11/9/2026 4,443 4,442 4,248 1.3% Nouryon Finance B.V. (e) Chemicals L+2.75% (7.17%) 10/1/2025 2,319 2,257 2,283 0.7% Novae, LLC (f) Industrials S+5.00% (9.70%) 12/22/2028 4,963 4,928 4,069 1.2% Pathway Vet Alliance, LLC (b) Healthcare L+3.75% (8.13%) 3/31/2027 2,970 2,976 2,456 0.7% Paysafe Finance, PLC Software/Services 4.00% 6/15/2029 400 400 308 0.1% Peraton Corp. (b) Industrials L+3.75% (8.13%) 2/1/2028 2,916 2,886 2,842 0.8% PG&E Corp. (f) Utilities L+3.00% (7.44%) 6/23/2025 10,589 10,616 10,493 3.1% Polaris Newco, LLC (f) Business Services L+4.00% (7.67%) 6/2/2028 1,980 1,931 1,802 0.5% Power Stop, LLC (f) Transportation L+4.75% (9.49%) 1/26/2029 3,553 3,520 2,653 0.8% Project Accelerate Parent, LLC (e) Technology L+4.25% (8.63%) 1/2/2025 15,942 14,823 14,906 4.4% Proofpoint, Inc. (b) Software/Services L+3.25% (7.99%) 8/31/2028 6,437 6,395 6,176 1.8% Protective Industrial Products, Inc. (b) Industrials L+4.00% (8.38%) 12/29/2027 9,035 8,999 8,880 2.6% Pug, LLC (f) Technology L+3.50% (7.88%) 2/12/2027 4,911 4,814 4,044 1.2% Quikrete Holdings, Inc. (f) Industrials L+3.00% (7.38%) 6/11/2028 7,940 7,901 7,868 2.3% Regionalcare Hospital Partners Holdings, Inc. Healthcare 4.38% 2/15/2027 2,000 2,000 1,696 0.5% Regionalcare Hospital Partners Holdings, Inc. (b) Healthcare L+3.75% (8.17%) 11/16/2025 5,195 5,210 4,886 1.5% Renaissance Learning, Inc. (f) Software/Services S+4.50% (8.72%) 3/30/2029 1,990 1,935 1,908 0.6% RXB Holdings, Inc. (f) Healthcare L+4.50% (8.72%) 12/20/2027 10,103 10,134 9,446 2.8% S&S Holdings, LLC (f) Consumer L+5.00% (9.29%) 3/11/2028 6,878 6,715 6,578 2.0% Safe Fleet Holdings, LLC (b) Industrials S+3.75% (8.17%) 2/23/2029 7,444 7,407 7,179 2.1% Safety Products/JHC Acquisition Corp. (b) Industrials L+4.50% (8.88%) 6/28/2026 17,182 16,536 16,323 4.9% Safety Products/JHC Acquisition Corp. (b) Industrials L+4.50% (8.88%) 6/28/2026 929 888 882 0.3% Schenectady International Group, Inc. (b) Chemicals S+4.75% (9.02%) 10/15/2025 19,721 19,631 15,836 4.7% SCIH Salt Holdings, Inc. (f) Industrials L+4.00% (8.42%) 3/16/2027 3,690 3,667 3,578 1.1% SFR Group, SA (b) (e) Telecom L+4.00% (8.65%) 8/14/2026 12,574 12,380 11,668 3.5% Sierra Acquisition, Inc. (b) Food & Beverage L+4.00% (8.42%) 11/11/2024 4,851 4,724 3,711 1.1% Sophia, LP (f) Software/Services L+3.50% (8.23%) 10/7/2027 2,973 2,976 2,864 0.9% SSH Group Holdings, Inc. (e) Education L+4.25% (8.73%) 7/30/2025 10,409 10,130 10,140 3.0% Staples, Inc. (b) Business Services L+5.00% (7.78%) 4/16/2026 4,898 4,856 4,520 1.3% Team Health Holdings, Inc. (e) (f) Healthcare S+5.25% (9.57%) 3/2/2027 5,433 4,603 4,061 1.2% Tecta America Corp. (f) Industrials S+4.25% (8.69%) 4/10/2028 8,954 8,931 8,573 2.6% Tenet Healthcare Corp. Healthcare 4.25% 6/1/2029 2,000 1,707 1,731 0.5% The Dun & Bradstreet Corp. (f) Business Services L+3.25% (7.64%) 2/6/2026 4,683 4,699 4,632 1.4% Traverse Midstream Partners, LLC (b) Energy S+4.25% (8.80%) 9/27/2024 13,421 13,405 13,375 4.0% Triton Water Holdings, Inc. (f) Food & Beverage L+3.50% (8.23%) 3/31/2028 7,387 7,373 6,845 2.0% Truck Hero, Inc. (f) Transportation L+3.75% (8.13%) 1/31/2028 1,474 1,471 1,258 0.4% United Airlines, Inc. Transportation 4.63% 4/15/2029 500 440 435 0.1% United Airlines, Inc. (f) Transportation L+3.75% (8.11%) 4/21/2028 3,756 3,745 3,702 1.1% University Support Services, LLC (f) Education L+3.25% (7.63%) 2/10/2029 4,950 4,933 4,805 1.4% Urban One, Inc. Media/Entertainment 7.38% 2/1/2028 5,000 5,140 4,227 1.3% Venga Finance Sarl (b) Telecom L+4.75% (9.49%) 6/28/2029 3,990 3,878 3,798 1.1% Veritext Corp. (f) Business Services L+3.50% (7.88%) 8/1/2025 3,458 3,426 3,334 1.0% Vyaire Medical, Inc. (f) Healthcare L+4.75% (8.51%) 4/16/2025 7,354 6,478 5,593 1.7% WaterBridge Midstream Operating, LLC (b) Energy L+5.75% (9.13%) 6/22/2026 8,653 7,878 8,299 2.5% Watlow Electric Manufacturing Co. (b) Industrials S+3.75% (8.15%) 3/2/2028 9,378 9,340 8,997 2.7% Western Dental Services, Inc. (f) Healthcare L+4.50% (9.24%) 8/18/2028 8,984 8,978 8,190 2.4% Western Dental Services, Inc. (f) Healthcare L+4.50% (9.24%) 8/18/2028 917 917 836 0.2% Wilsonart, LLC (b) Consumer L+3.25% (7.98%) 12/31/2026 7,375 7,370 7,002 2.1%
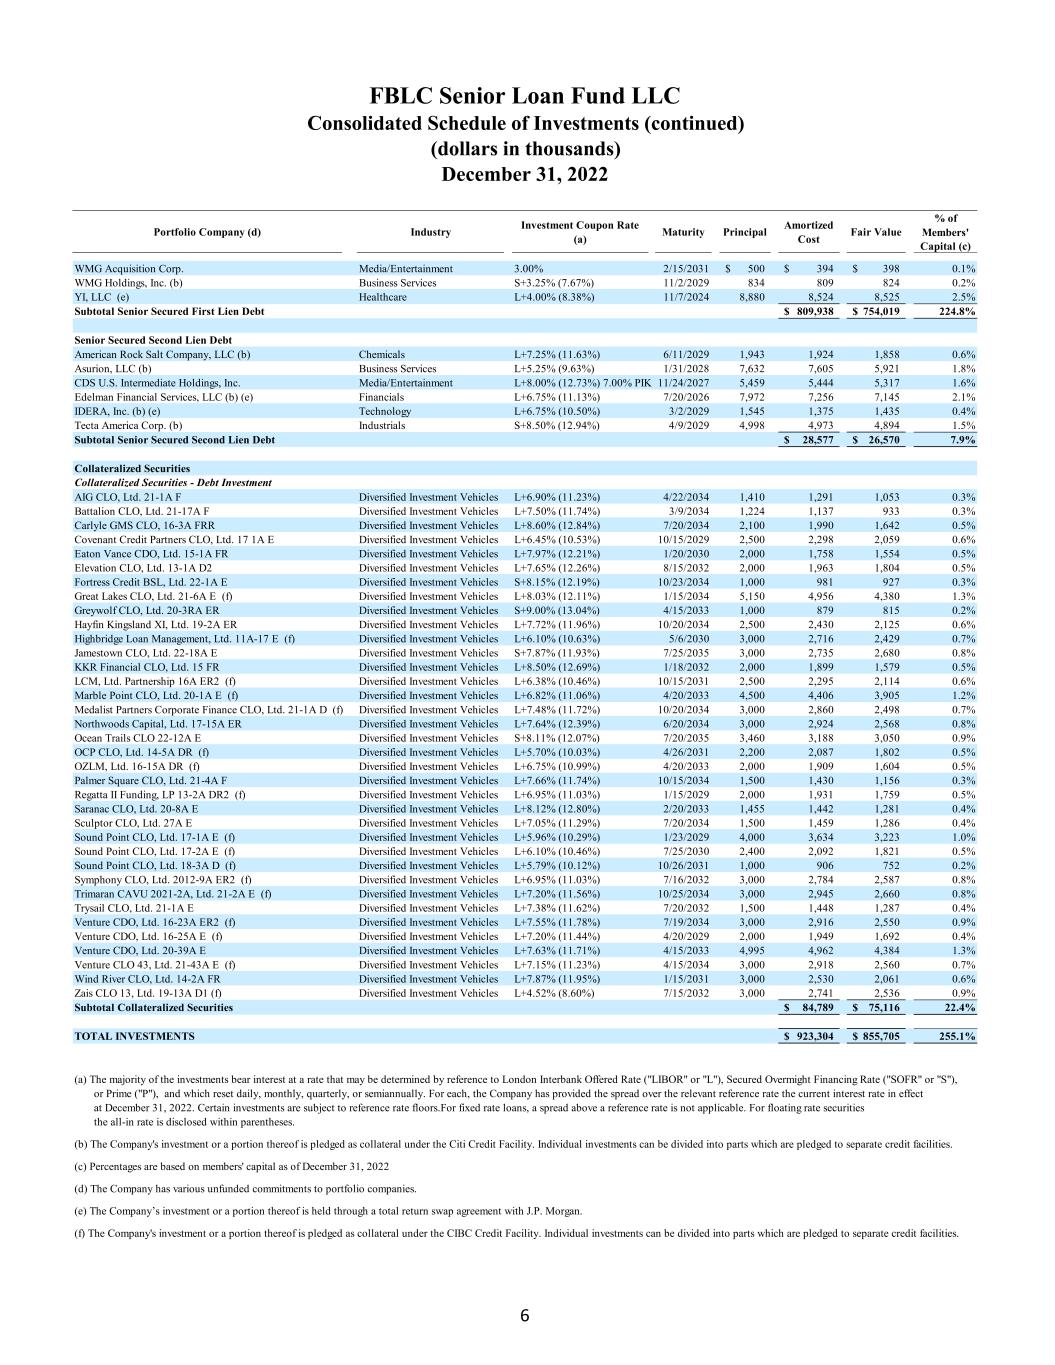
FBLC Senior Loan Fund LLC Consolidated Schedule of Investments (continued) (dollars in thousands) December 31, 2022 6 Portfolio Company (d) Industry Investment Coupon Rate (a) Maturity Principal Amortized Cost Fair Value % of Members' Capital (c) WMG Acquisition Corp. Media/Entertainment 3.00% 2/15/2031 500$ 394$ 398$ 0.1% WMG Holdings, Inc. (b) Business Services S+3.25% (7.67%) 11/2/2029 834 809 824 0.2% YI, LLC (e) Healthcare L+4.00% (8.38%) 11/7/2024 8,880 8,524 8,525 2.5% Subtotal Senior Secured First Lien Debt 809,938$ 754,019$ 224.8% Senior Secured Second Lien Debt American Rock Salt Company, LLC (b) Chemicals L+7.25% (11.63%) 6/11/2029 1,943 1,924 1,858 0.6% Asurion, LLC (b) Business Services L+5.25% (9.63%) 1/31/2028 7,632 7,605 5,921 1.8% CDS U.S. Intermediate Holdings, Inc. Media/Entertainment L+8.00% (12.73%) 7.00% PIK 11/24/2027 5,459 5,444 5,317 1.6% Edelman Financial Services, LLC (b) (e) Financials L+6.75% (11.13%) 7/20/2026 7,972 7,256 7,145 2.1% IDERA, Inc. (b) (e) Technology L+6.75% (10.50%) 3/2/2029 1,545 1,375 1,435 0.4% Tecta America Corp. (b) Industrials S+8.50% (12.94%) 4/9/2029 4,998 4,973 4,894 1.5% Subtotal Senior Secured Second Lien Debt 28,577$ 26,570$ 7.9% Collateralized Securities Collateralized Securities - Debt Investment AIG CLO, Ltd. 21-1A F Diversified Investment Vehicles L+6.90% (11.23%) 4/22/2034 1,410 1,291 1,053 0.3% Battalion CLO, Ltd. 21-17A F Diversified Investment Vehicles L+7.50% (11.74%) 3/9/2034 1,224 1,137 933 0.3% Carlyle GMS CLO, 16-3A FRR Diversified Investment Vehicles L+8.60% (12.84%) 7/20/2034 2,100 1,990 1,642 0.5% Covenant Credit Partners CLO, Ltd. 17 1A E Diversified Investment Vehicles L+6.45% (10.53%) 10/15/2029 2,500 2,298 2,059 0.6% Eaton Vance CDO, Ltd. 15-1A FR Diversified Investment Vehicles L+7.97% (12.21%) 1/20/2030 2,000 1,758 1,554 0.5% Elevation CLO, Ltd. 13-1A D2 Diversified Investment Vehicles L+7.65% (12.26%) 8/15/2032 2,000 1,963 1,804 0.5% Fortress Credit BSL, Ltd. 22-1A E Diversified Investment Vehicles S+8.15% (12.19%) 10/23/2034 1,000 981 927 0.3% Great Lakes CLO, Ltd. 21-6A E (f) Diversified Investment Vehicles L+8.03% (12.11%) 1/15/2034 5,150 4,956 4,380 1.3% Greywolf CLO, Ltd. 20-3RA ER Diversified Investment Vehicles S+9.00% (13.04%) 4/15/2033 1,000 879 815 0.2% Hayfin Kingsland XI, Ltd. 19-2A ER Diversified Investment Vehicles L+7.72% (11.96%) 10/20/2034 2,500 2,430 2,125 0.6% Highbridge Loan Management, Ltd. 11A-17 E (f) Diversified Investment Vehicles L+6.10% (10.63%) 5/6/2030 3,000 2,716 2,429 0.7% Jamestown CLO, Ltd. 22-18A E Diversified Investment Vehicles S+7.87% (11.93%) 7/25/2035 3,000 2,735 2,680 0.8% KKR Financial CLO, Ltd. 15 FR Diversified Investment Vehicles L+8.50% (12.69%) 1/18/2032 2,000 1,899 1,579 0.5% LCM, Ltd. Partnership 16A ER2 (f) Diversified Investment Vehicles L+6.38% (10.46%) 10/15/2031 2,500 2,295 2,114 0.6% Marble Point CLO, Ltd. 20-1A E (f) Diversified Investment Vehicles L+6.82% (11.06%) 4/20/2033 4,500 4,406 3,905 1.2% Medalist Partners Corporate Finance CLO, Ltd. 21-1A D (f) Diversified Investment Vehicles L+7.48% (11.72%) 10/20/2034 3,000 2,860 2,498 0.7% Northwoods Capital, Ltd. 17-15A ER Diversified Investment Vehicles L+7.64% (12.39%) 6/20/2034 3,000 2,924 2,568 0.8% Ocean Trails CLO 22-12A E Diversified Investment Vehicles S+8.11% (12.07%) 7/20/2035 3,460 3,188 3,050 0.9% OCP CLO, Ltd. 14-5A DR (f) Diversified Investment Vehicles L+5.70% (10.03%) 4/26/2031 2,200 2,087 1,802 0.5% OZLM, Ltd. 16-15A DR (f) Diversified Investment Vehicles L+6.75% (10.99%) 4/20/2033 2,000 1,909 1,604 0.5% Palmer Square CLO, Ltd. 21-4A F Diversified Investment Vehicles L+7.66% (11.74%) 10/15/2034 1,500 1,430 1,156 0.3% Regatta II Funding, LP 13-2A DR2 (f) Diversified Investment Vehicles L+6.95% (11.03%) 1/15/2029 2,000 1,931 1,759 0.5% Saranac CLO, Ltd. 20-8A E Diversified Investment Vehicles L+8.12% (12.80%) 2/20/2033 1,455 1,442 1,281 0.4% Sculptor CLO, Ltd. 27A E Diversified Investment Vehicles L+7.05% (11.29%) 7/20/2034 1,500 1,459 1,286 0.4% Sound Point CLO, Ltd. 17-1A E (f) Diversified Investment Vehicles L+5.96% (10.29%) 1/23/2029 4,000 3,634 3,223 1.0% Sound Point CLO, Ltd. 17-2A E (f) Diversified Investment Vehicles L+6.10% (10.46%) 7/25/2030 2,400 2,092 1,821 0.5% Sound Point CLO, Ltd. 18-3A D (f) Diversified Investment Vehicles L+5.79% (10.12%) 10/26/2031 1,000 906 752 0.2% Symphony CLO, Ltd. 2012-9A ER2 (f) Diversified Investment Vehicles L+6.95% (11.03%) 7/16/2032 3,000 2,784 2,587 0.8% Trimaran CAVU 2021-2A, Ltd. 21-2A E (f) Diversified Investment Vehicles L+7.20% (11.56%) 10/25/2034 3,000 2,945 2,660 0.8% Trysail CLO, Ltd. 21-1A E Diversified Investment Vehicles L+7.38% (11.62%) 7/20/2032 1,500 1,448 1,287 0.4% Venture CDO, Ltd. 16-23A ER2 (f) Diversified Investment Vehicles L+7.55% (11.78%) 7/19/2034 3,000 2,916 2,550 0.9% Venture CDO, Ltd. 16-25A E (f) Diversified Investment Vehicles L+7.20% (11.44%) 4/20/2029 2,000 1,949 1,692 0.4% Venture CDO, Ltd. 20-39A E Diversified Investment Vehicles L+7.63% (11.71%) 4/15/2033 4,995 4,962 4,384 1.3% Venture CLO 43, Ltd. 21-43A E (f) Diversified Investment Vehicles L+7.15% (11.23%) 4/15/2034 3,000 2,918 2,560 0.7% Wind River CLO, Ltd. 14-2A FR Diversified Investment Vehicles L+7.87% (11.95%) 1/15/2031 3,000 2,530 2,061 0.6% Zais CLO 13, Ltd. 19-13A D1 (f) Diversified Investment Vehicles L+4.52% (8.60%) 7/15/2032 3,000 2,741 2,536 0.9% Subtotal Collateralized Securities 84,789$ 75,116$ 22.4% TOTAL INVESTMENTS 923,304$ 855,705$ 255.1% (a) The majority of the investments bear interest at a rate that may be determined by reference to London Interbank Offered Rate ("LIBOR" or "L"), Secured Overmight Financing Rate ("SOFR" or "S"), or Prime ("P"), and which reset daily, monthly, quarterly, or semiannually. For each, the Company has provided the spread over the relevant reference rate the current interest rate in effect at December 31, 2022. Certain investments are subject to reference rate floors.For fixed rate loans, a spread above a reference rate is not applicable. For floating rate securities the all-in rate is disclosed within parentheses. (b) The Company's investment or a portion thereof is pledged as collateral under the Citi Credit Facility. Individual investments can be divided into parts which are pledged to separate credit facilities. (c) Percentages are based on members' capital as of December 31, 2022 (d) The Company has various unfunded commitments to portfolio companies. (e) The Company’s investment or a portion thereof is held through a total return swap agreement with J.P. Morgan. (f) The Company's investment or a portion thereof is pledged as collateral under the CIBC Credit Facility. Individual investments can be divided into parts which are pledged to separate credit facilities.
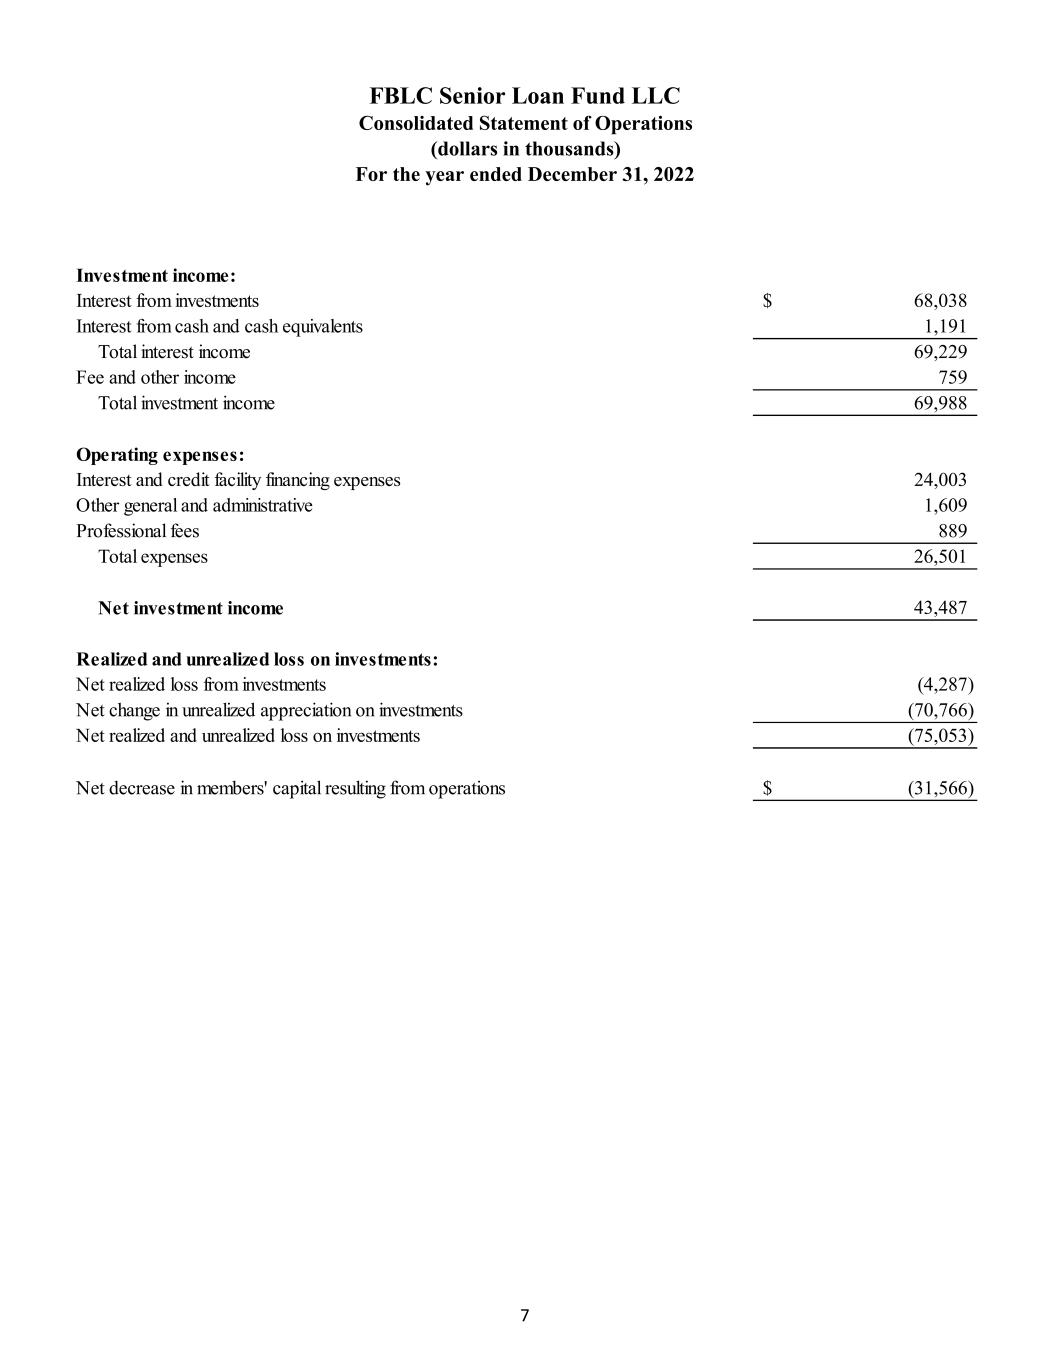
FBLC Senior Loan Fund LLC Consolidated Statement of Operations (dollars in thousands) For the year ended December 31, 2022 7 Investment income: Interest from investments 68,038$ Interest from cash and cash equivalents 1,191 Total interest income 69,229 Fee and other income 759 Total investment income 69,988 Operating expenses: Interest and credit facility financing expenses 24,003 Other general and administrative 1,609 Professional fees 889 Total expenses 26,501 Net investment income 43,487 Realized and unrealized loss on investments: Net realized loss from investments (4,287) Net change in unrealized appreciation on investments (70,766) Net realized and unrealized loss on investments (75,053) Net decrease in members' capital resulting from operations (31,566)$
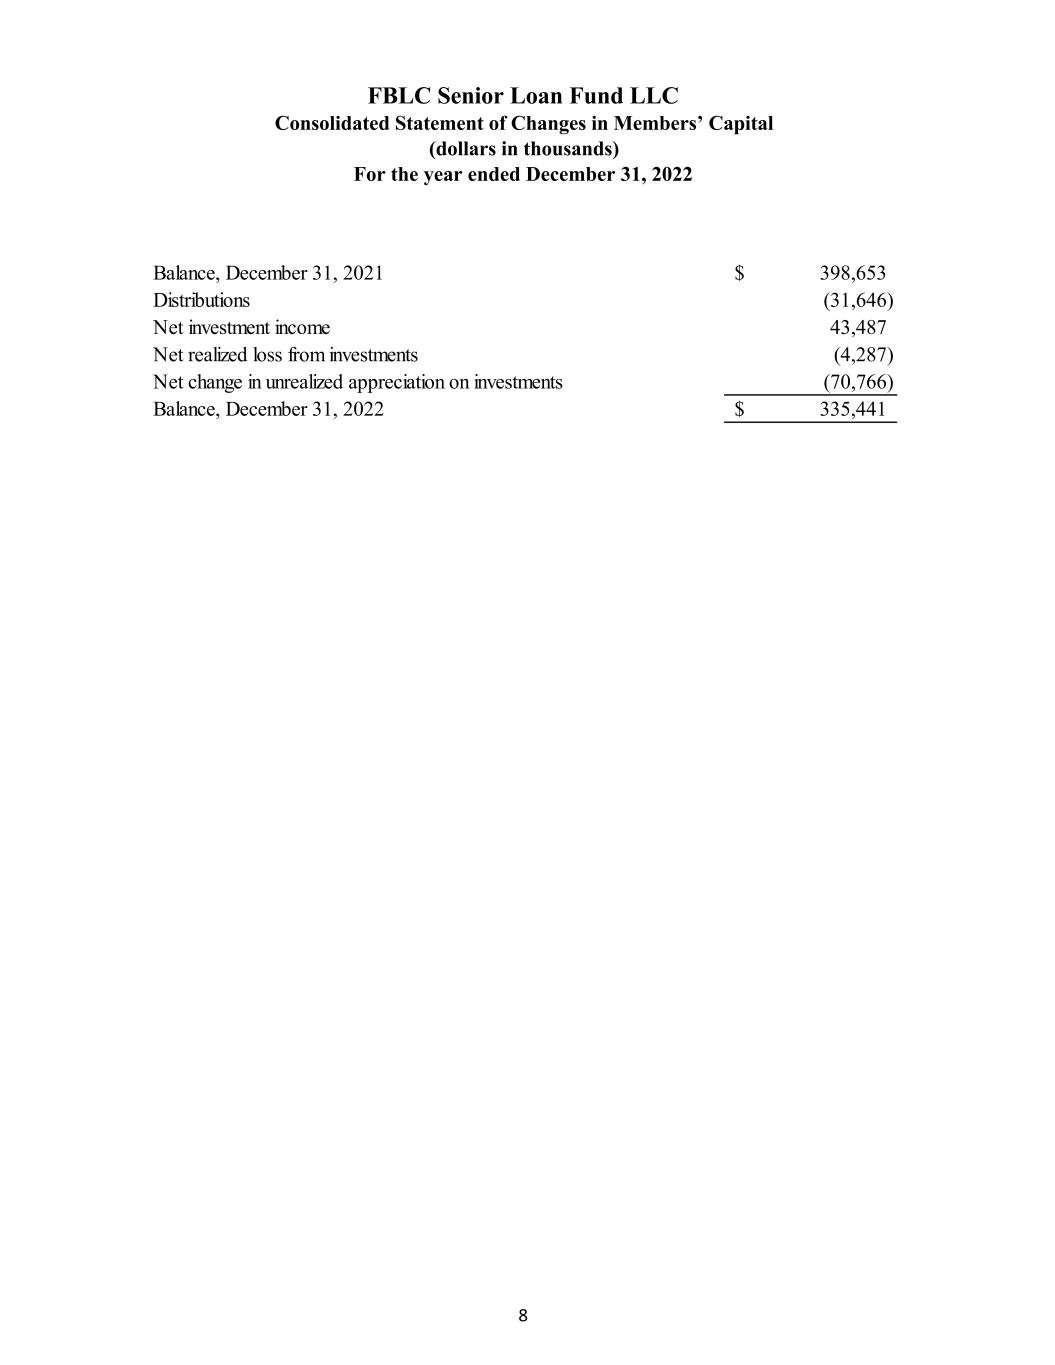
FBLC Senior Loan Fund LLC Consolidated Statement of Changes in Members’ Capital (dollars in thousands) For the year ended December 31, 2022 8 Balance, December 31, 2021 398,653$ Distributions (31,646) Net investment income 43,487 Net realized loss from investments (4,287) Net change in unrealized appreciation on investments (70,766) Balance, December 31, 2022 335,441$
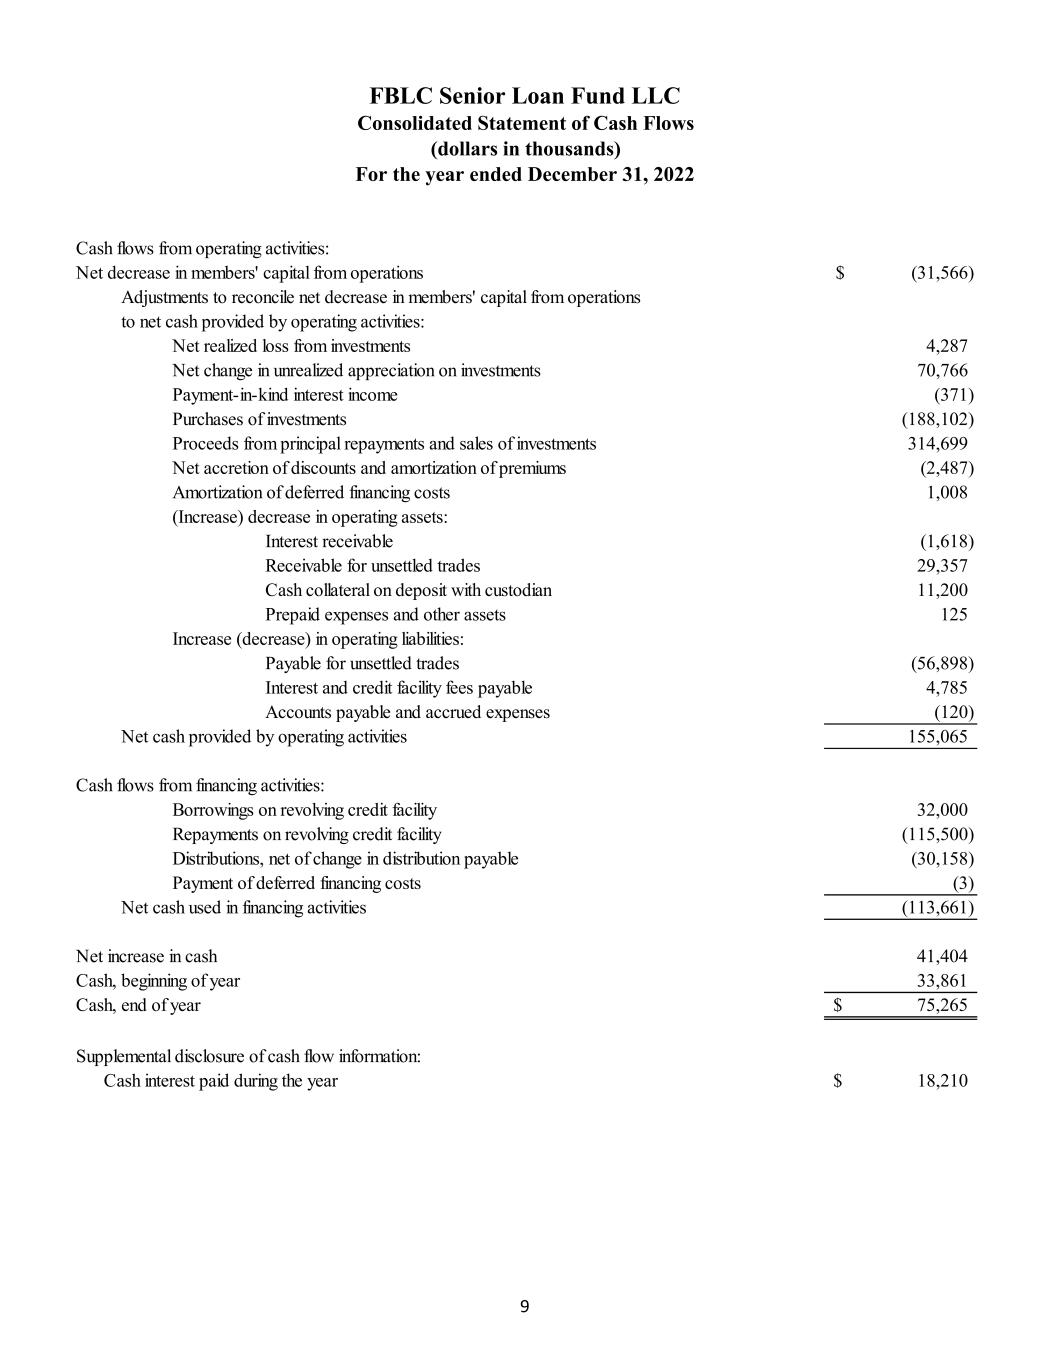
FBLC Senior Loan Fund LLC Consolidated Statement of Cash Flows (dollars in thousands) For the year ended December 31, 2022 9 Cash flows from operating activities: Net decrease in members' capital from operations (31,566)$ Adjustments to reconcile net decrease in members' capital from operations to net cash provided by operating activities: Net realized loss from investments 4,287 Net change in unrealized appreciation on investments 70,766 Payment-in-kind interest income (371) Purchases of investments (188,102) Proceeds from principal repayments and sales of investments 314,699 Net accretion of discounts and amortization of premiums (2,487) Amortization of deferred financing costs 1,008 (Increase) decrease in operating assets: Interest receivable (1,618) Receivable for unsettled trades 29,357 Cash collateral on deposit with custodian 11,200 Prepaid expenses and other assets 125 Increase (decrease) in operating liabilities: Payable for unsettled trades (56,898) Interest and credit facility fees payable 4,785 Accounts payable and accrued expenses (120) Net cash provided by operating activities 155,065 Cash flows from financing activities: Borrowings on revolving credit facility 32,000 Repayments on revolving credit facility (115,500) Distributions, net of change in distribution payable (30,158) Payment of deferred financing costs (3) Net cash used in financing activities (113,661) Net increase in cash 41,404 Cash, beginning of year 33,861 Cash, end of year 75,265$ Supplemental disclosure of cash flow information: Cash interest paid during the year 18,210$
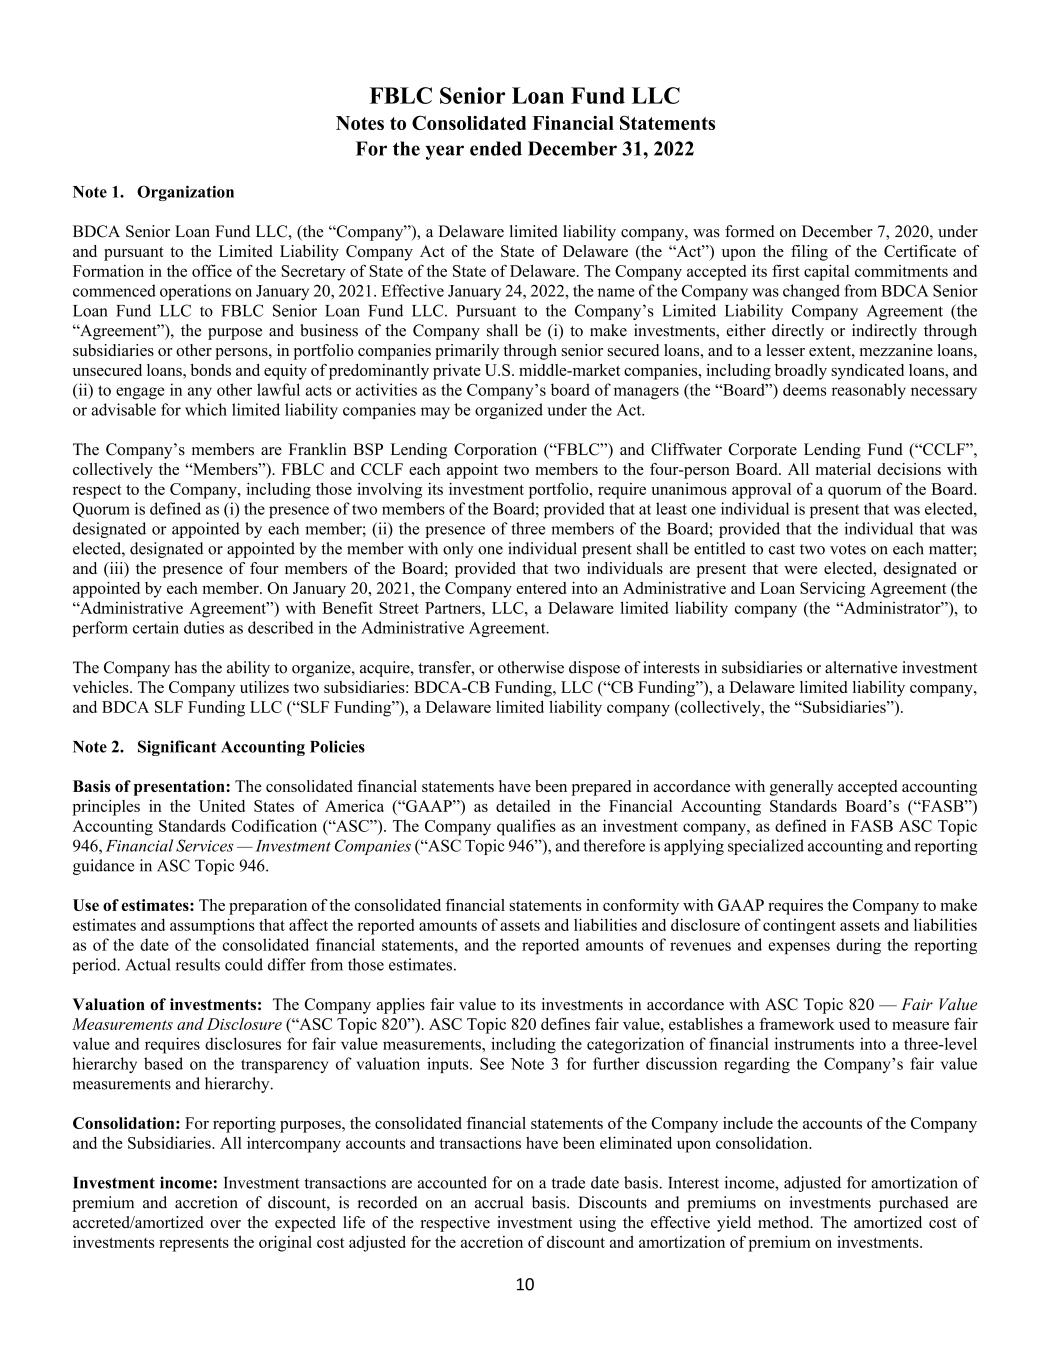
FBLC Senior Loan Fund LLC Notes to Consolidated Financial Statements For the year ended December 31, 2022 10 Note 1. Organization BDCA Senior Loan Fund LLC, (the “Company”), a Delaware limited liability company, was formed on December 7, 2020, under and pursuant to the Limited Liability Company Act of the State of Delaware (the “Act”) upon the filing of the Certificate of Formation in the office of the Secretary of State of the State of Delaware. The Company accepted its first capital commitments and commenced operations on January 20, 2021. Effective January 24, 2022, the name of the Company was changed from BDCA Senior Loan Fund LLC to FBLC Senior Loan Fund LLC. Pursuant to the Company’s Limited Liability Company Agreement (the “Agreement”), the purpose and business of the Company shall be (i) to make investments, either directly or indirectly through subsidiaries or other persons, in portfolio companies primarily through senior secured loans, and to a lesser extent, mezzanine loans, unsecured loans, bonds and equity of predominantly private U.S. middle-market companies, including broadly syndicated loans, and (ii) to engage in any other lawful acts or activities as the Company’s board of managers (the “Board”) deems reasonably necessary or advisable for which limited liability companies may be organized under the Act. The Company’s members are Franklin BSP Lending Corporation (“FBLC”) and Cliffwater Corporate Lending Fund (“CCLF”, collectively the “Members”). FBLC and CCLF each appoint two members to the four‐person Board. All material decisions with respect to the Company, including those involving its investment portfolio, require unanimous approval of a quorum of the Board. Quorum is defined as (i) the presence of two members of the Board; provided that at least one individual is present that was elected, designated or appointed by each member; (ii) the presence of three members of the Board; provided that the individual that was elected, designated or appointed by the member with only one individual present shall be entitled to cast two votes on each matter; and (iii) the presence of four members of the Board; provided that two individuals are present that were elected, designated or appointed by each member. On January 20, 2021, the Company entered into an Administrative and Loan Servicing Agreement (the “Administrative Agreement”) with Benefit Street Partners, LLC, a Delaware limited liability company (the “Administrator”), to perform certain duties as described in the Administrative Agreement. The Company has the ability to organize, acquire, transfer, or otherwise dispose of interests in subsidiaries or alternative investment vehicles. The Company utilizes two subsidiaries: BDCA-CB Funding, LLC (“CB Funding”), a Delaware limited liability company, and BDCA SLF Funding LLC (“SLF Funding”), a Delaware limited liability company (collectively, the “Subsidiaries”). Note 2. Significant Accounting Policies Basis of presentation: The consolidated financial statements have been prepared in accordance with generally accepted accounting principles in the United States of America (“GAAP”) as detailed in the Financial Accounting Standards Board’s (“FASB”) Accounting Standards Codification (“ASC”). The Company qualifies as an investment company, as defined in FASB ASC Topic 946, Financial Services — Investment Companies (“ASC Topic 946”), and therefore is applying specialized accounting and reporting guidance in ASC Topic 946. Use of estimates: The preparation of the consolidated financial statements in conformity with GAAP requires the Company to make estimates and assumptions that affect the reported amounts of assets and liabilities and disclosure of contingent assets and liabilities as of the date of the consolidated financial statements, and the reported amounts of revenues and expenses during the reporting period. Actual results could differ from those estimates. Valuation of investments: The Company applies fair value to its investments in accordance with ASC Topic 820 — Fair Value Measurements and Disclosure (“ASC Topic 820”). ASC Topic 820 defines fair value, establishes a framework used to measure fair value and requires disclosures for fair value measurements, including the categorization of financial instruments into a three-level hierarchy based on the transparency of valuation inputs. See Note 3 for further discussion regarding the Company’s fair value measurements and hierarchy. Consolidation: For reporting purposes, the consolidated financial statements of the Company include the accounts of the Company and the Subsidiaries. All intercompany accounts and transactions have been eliminated upon consolidation. Investment income: Investment transactions are accounted for on a trade date basis. Interest income, adjusted for amortization of premium and accretion of discount, is recorded on an accrual basis. Discounts and premiums on investments purchased are accreted/amortized over the expected life of the respective investment using the effective yield method. The amortized cost of investments represents the original cost adjusted for the accretion of discount and amortization of premium on investments.
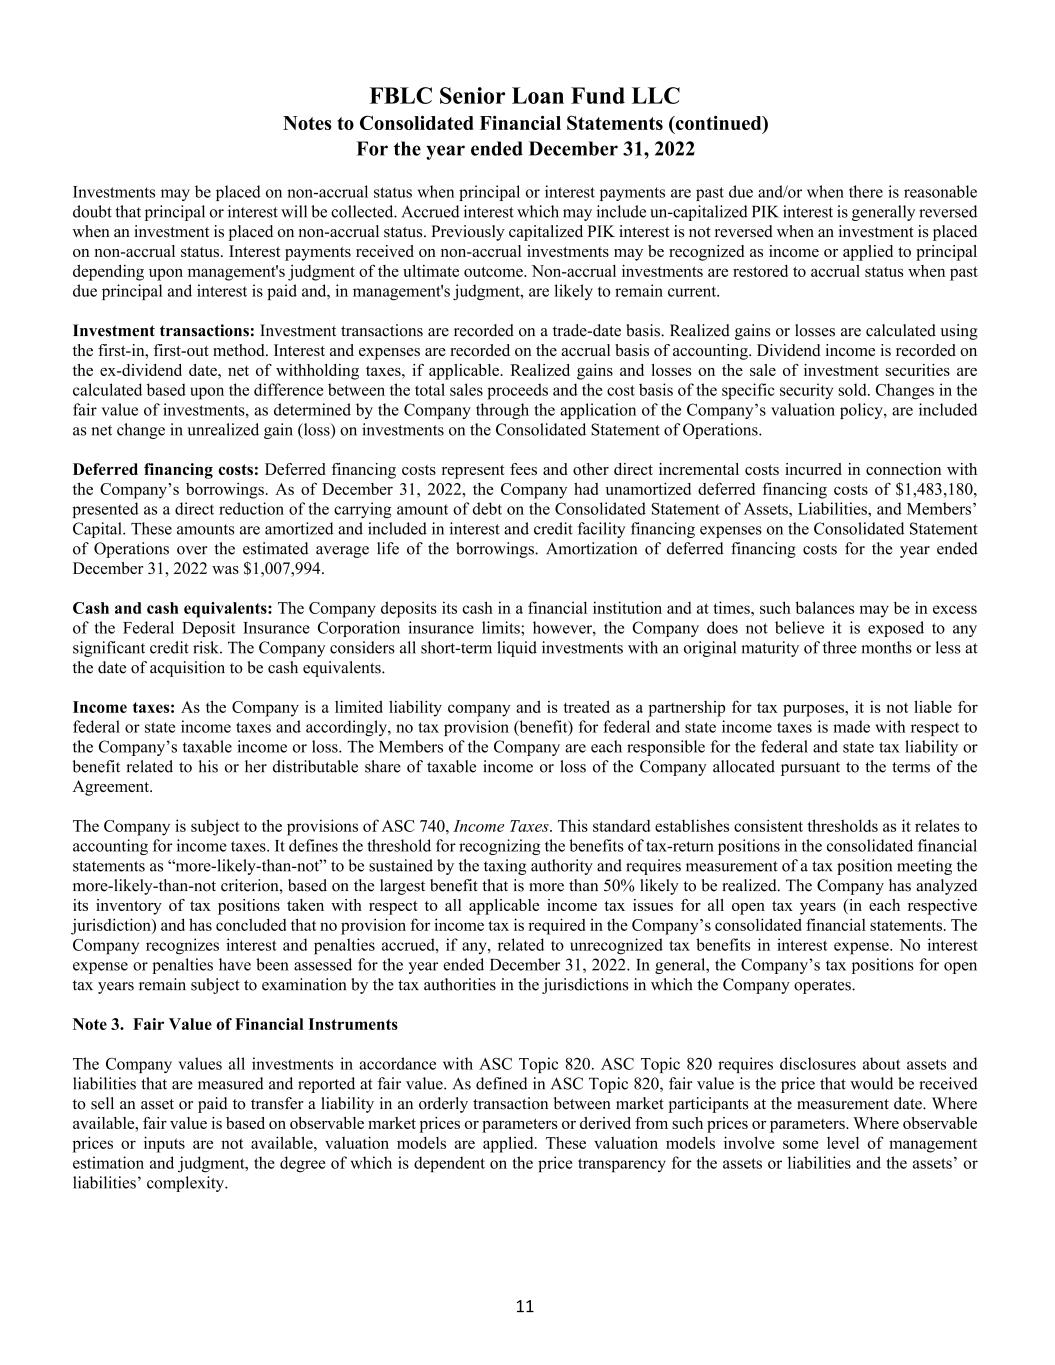
FBLC Senior Loan Fund LLC Notes to Consolidated Financial Statements (continued) For the year ended December 31, 2022 11 Investments may be placed on non-accrual status when principal or interest payments are past due and/or when there is reasonable doubt that principal or interest will be collected. Accrued interest which may include un-capitalized PIK interest is generally reversed when an investment is placed on non-accrual status. Previously capitalized PIK interest is not reversed when an investment is placed on non-accrual status. Interest payments received on non-accrual investments may be recognized as income or applied to principal depending upon management's judgment of the ultimate outcome. Non-accrual investments are restored to accrual status when past due principal and interest is paid and, in management's judgment, are likely to remain current. Investment transactions: Investment transactions are recorded on a trade-date basis. Realized gains or losses are calculated using the first-in, first-out method. Interest and expenses are recorded on the accrual basis of accounting. Dividend income is recorded on the ex-dividend date, net of withholding taxes, if applicable. Realized gains and losses on the sale of investment securities are calculated based upon the difference between the total sales proceeds and the cost basis of the specific security sold. Changes in the fair value of investments, as determined by the Company through the application of the Company’s valuation policy, are included as net change in unrealized gain (loss) on investments on the Consolidated Statement of Operations. Deferred financing costs: Deferred financing costs represent fees and other direct incremental costs incurred in connection with the Company’s borrowings. As of December 31, 2022, the Company had unamortized deferred financing costs of $1,483,180, presented as a direct reduction of the carrying amount of debt on the Consolidated Statement of Assets, Liabilities, and Members’ Capital. These amounts are amortized and included in interest and credit facility financing expenses on the Consolidated Statement of Operations over the estimated average life of the borrowings. Amortization of deferred financing costs for the year ended December 31, 2022 was $1,007,994. Cash and cash equivalents: The Company deposits its cash in a financial institution and at times, such balances may be in excess of the Federal Deposit Insurance Corporation insurance limits; however, the Company does not believe it is exposed to any significant credit risk. The Company considers all short-term liquid investments with an original maturity of three months or less at the date of acquisition to be cash equivalents. Income taxes: As the Company is a limited liability company and is treated as a partnership for tax purposes, it is not liable for federal or state income taxes and accordingly, no tax provision (benefit) for federal and state income taxes is made with respect to the Company’s taxable income or loss. The Members of the Company are each responsible for the federal and state tax liability or benefit related to his or her distributable share of taxable income or loss of the Company allocated pursuant to the terms of the Agreement. The Company is subject to the provisions of ASC 740, Income Taxes. This standard establishes consistent thresholds as it relates to accounting for income taxes. It defines the threshold for recognizing the benefits of tax-return positions in the consolidated financial statements as “more-likely-than-not” to be sustained by the taxing authority and requires measurement of a tax position meeting the more-likely-than-not criterion, based on the largest benefit that is more than 50% likely to be realized. The Company has analyzed its inventory of tax positions taken with respect to all applicable income tax issues for all open tax years (in each respective jurisdiction) and has concluded that no provision for income tax is required in the Company’s consolidated financial statements. The Company recognizes interest and penalties accrued, if any, related to unrecognized tax benefits in interest expense. No interest expense or penalties have been assessed for the year ended December 31, 2022. In general, the Company’s tax positions for open tax years remain subject to examination by the tax authorities in the jurisdictions in which the Company operates. Note 3. Fair Value of Financial Instruments The Company values all investments in accordance with ASC Topic 820. ASC Topic 820 requires disclosures about assets and liabilities that are measured and reported at fair value. As defined in ASC Topic 820, fair value is the price that would be received to sell an asset or paid to transfer a liability in an orderly transaction between market participants at the measurement date. Where available, fair value is based on observable market prices or parameters or derived from such prices or parameters. Where observable prices or inputs are not available, valuation models are applied. These valuation models involve some level of management estimation and judgment, the degree of which is dependent on the price transparency for the assets or liabilities and the assets’ or liabilities’ complexity.
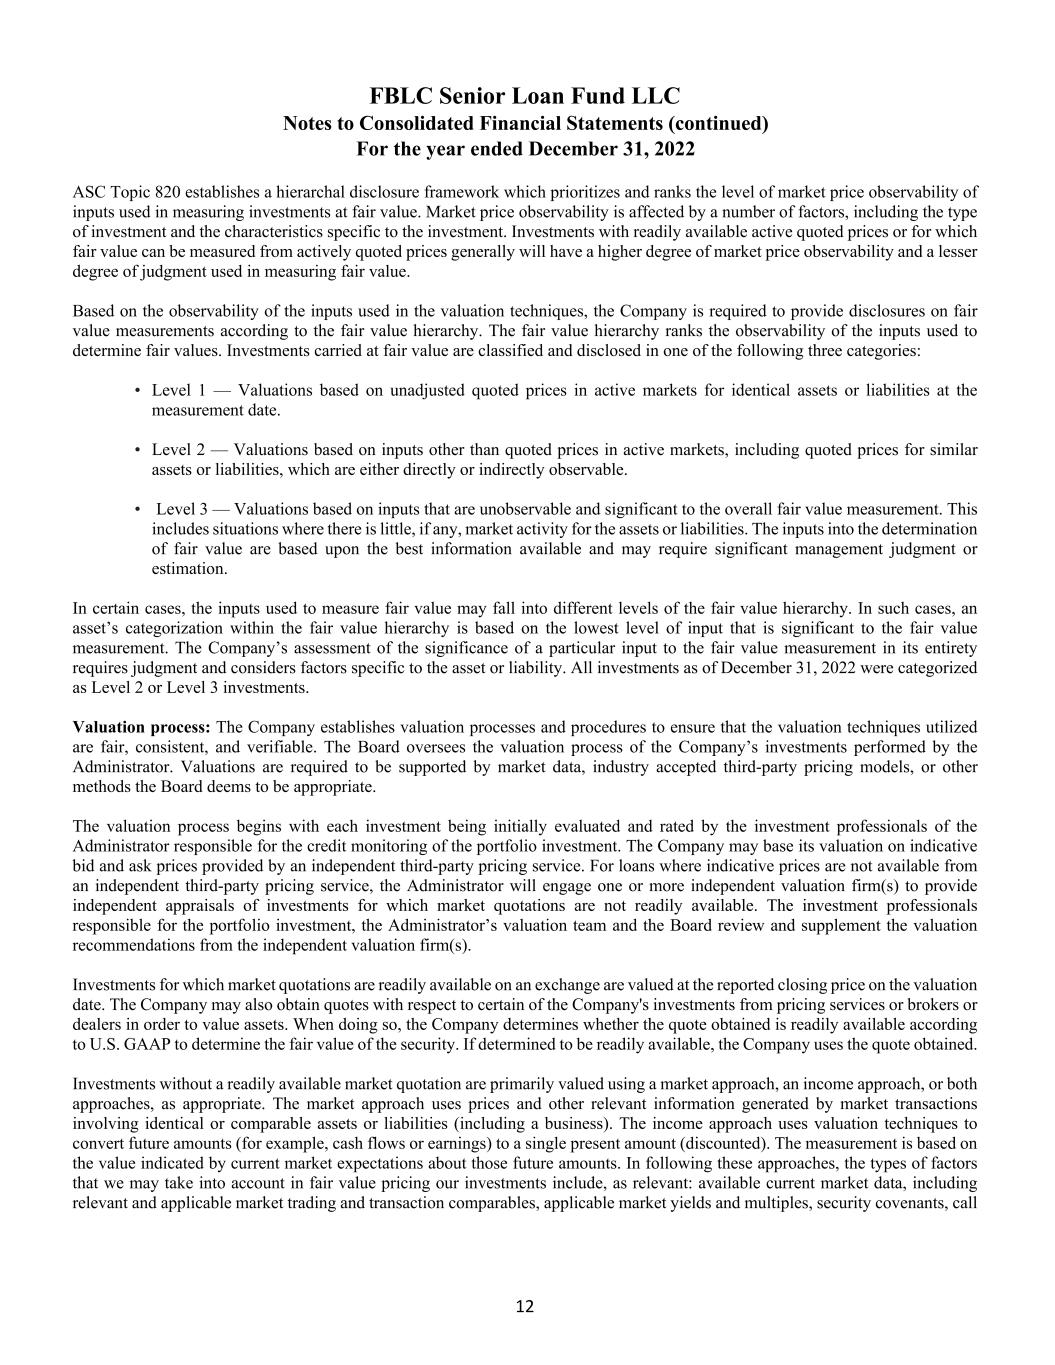
FBLC Senior Loan Fund LLC Notes to Consolidated Financial Statements (continued) For the year ended December 31, 2022 12 ASC Topic 820 establishes a hierarchal disclosure framework which prioritizes and ranks the level of market price observability of inputs used in measuring investments at fair value. Market price observability is affected by a number of factors, including the type of investment and the characteristics specific to the investment. Investments with readily available active quoted prices or for which fair value can be measured from actively quoted prices generally will have a higher degree of market price observability and a lesser degree of judgment used in measuring fair value. Based on the observability of the inputs used in the valuation techniques, the Company is required to provide disclosures on fair value measurements according to the fair value hierarchy. The fair value hierarchy ranks the observability of the inputs used to determine fair values. Investments carried at fair value are classified and disclosed in one of the following three categories: • Level 1 — Valuations based on unadjusted quoted prices in active markets for identical assets or liabilities at the measurement date. • Level 2 — Valuations based on inputs other than quoted prices in active markets, including quoted prices for similar assets or liabilities, which are either directly or indirectly observable. • Level 3 — Valuations based on inputs that are unobservable and significant to the overall fair value measurement. This includes situations where there is little, if any, market activity for the assets or liabilities. The inputs into the determination of fair value are based upon the best information available and may require significant management judgment or estimation. In certain cases, the inputs used to measure fair value may fall into different levels of the fair value hierarchy. In such cases, an asset’s categorization within the fair value hierarchy is based on the lowest level of input that is significant to the fair value measurement. The Company’s assessment of the significance of a particular input to the fair value measurement in its entirety requires judgment and considers factors specific to the asset or liability. All investments as of December 31, 2022 were categorized as Level 2 or Level 3 investments. Valuation process: The Company establishes valuation processes and procedures to ensure that the valuation techniques utilized are fair, consistent, and verifiable. The Board oversees the valuation process of the Company’s investments performed by the Administrator. Valuations are required to be supported by market data, industry accepted third-party pricing models, or other methods the Board deems to be appropriate. The valuation process begins with each investment being initially evaluated and rated by the investment professionals of the Administrator responsible for the credit monitoring of the portfolio investment. The Company may base its valuation on indicative bid and ask prices provided by an independent third-party pricing service. For loans where indicative prices are not available from an independent third-party pricing service, the Administrator will engage one or more independent valuation firm(s) to provide independent appraisals of investments for which market quotations are not readily available. The investment professionals responsible for the portfolio investment, the Administrator’s valuation team and the Board review and supplement the valuation recommendations from the independent valuation firm(s). Investments for which market quotations are readily available on an exchange are valued at the reported closing price on the valuation date. The Company may also obtain quotes with respect to certain of the Company's investments from pricing services or brokers or dealers in order to value assets. When doing so, the Company determines whether the quote obtained is readily available according to U.S. GAAP to determine the fair value of the security. If determined to be readily available, the Company uses the quote obtained. Investments without a readily available market quotation are primarily valued using a market approach, an income approach, or both approaches, as appropriate. The market approach uses prices and other relevant information generated by market transactions involving identical or comparable assets or liabilities (including a business). The income approach uses valuation techniques to convert future amounts (for example, cash flows or earnings) to a single present amount (discounted). The measurement is based on the value indicated by current market expectations about those future amounts. In following these approaches, the types of factors that we may take into account in fair value pricing our investments include, as relevant: available current market data, including relevant and applicable market trading and transaction comparables, applicable market yields and multiples, security covenants, call
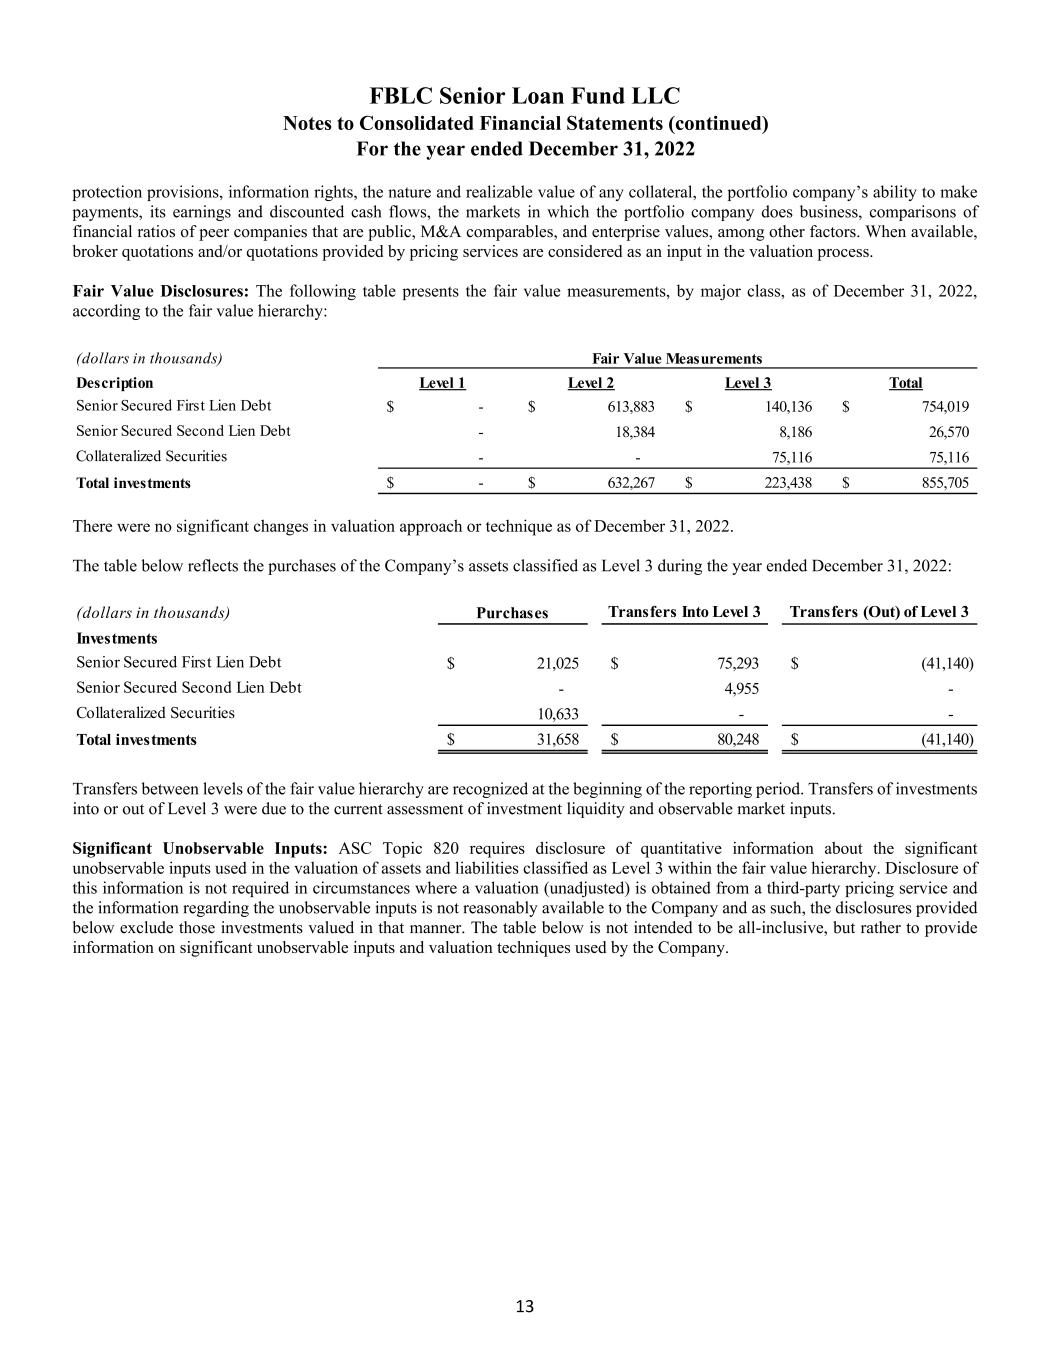
FBLC Senior Loan Fund LLC Notes to Consolidated Financial Statements (continued) For the year ended December 31, 2022 13 protection provisions, information rights, the nature and realizable value of any collateral, the portfolio company’s ability to make payments, its earnings and discounted cash flows, the markets in which the portfolio company does business, comparisons of financial ratios of peer companies that are public, M&A comparables, and enterprise values, among other factors. When available, broker quotations and/or quotations provided by pricing services are considered as an input in the valuation process. Fair Value Disclosures: The following table presents the fair value measurements, by major class, as of December 31, 2022, according to the fair value hierarchy: There were no significant changes in valuation approach or technique as of December 31, 2022. The table below reflects the purchases of the Company’s assets classified as Level 3 during the year ended December 31, 2022: Transfers between levels of the fair value hierarchy are recognized at the beginning of the reporting period. Transfers of investments into or out of Level 3 were due to the current assessment of investment liquidity and observable market inputs. Significant Unobservable Inputs: ASC Topic 820 requires disclosure of quantitative information about the significant unobservable inputs used in the valuation of assets and liabilities classified as Level 3 within the fair value hierarchy. Disclosure of this information is not required in circumstances where a valuation (unadjusted) is obtained from a third-party pricing service and the information regarding the unobservable inputs is not reasonably available to the Company and as such, the disclosures provided below exclude those investments valued in that manner. The table below is not intended to be all-inclusive, but rather to provide information on significant unobservable inputs and valuation techniques used by the Company. (dollars in thousands) Description Level 1 Level 2 Level 3 Total Senior Secured First Lien Debt -$ 613,883$ 140,136$ 754,019$ Senior Secured Second Lien Debt - 18,384 8,186 26,570 Collateralized Securities - - 75,116 75,116 Total investments -$ 632,267$ 223,438$ 855,705$ Fair Value Measurements (dollars in thousands) Purchases Transfers Into Level 3 Transfers (Out) of Level 3 Investments Senior Secured First Lien Debt 21,025$ 75,293$ (41,140)$ Senior Secured Second Lien Debt - 4,955 - Collateralized Securities 10,633 - - Total investments 31,658$ 80,248$ (41,140)$

FBLC Senior Loan Fund LLC Notes to Consolidated Financial Statements (continued) For the year ended December 31, 2022 14 The valuation techniques and significant unobservable inputs used in recurring Level 3 fair value measurements of assets as of December 31, 2022, were as follows: (a) Weighted averages are calculated based on fair value of investments. (b) This asset category contains one investment. The income and market approaches were used in the determination of fair value of certain Level 3 assets as of December 31, 2022. The significant unobservable inputs used in the income approach are the discount rate or market yield used to discount the estimated future cash flows expected to be received from the underlying investment, which include both future principal and interest payments. An increase in the discount rate or market yield would result in a decrease in the fair value. Included in the consideration and selection of discount rates is risk of default, rating of the investment, call provisions and comparable company investments. The significant unobservable inputs used in the market approach are based on market comparable transactions and market multiples of publicly traded comparable companies. Changes in these inputs in isolation may result in a significantly higher or lower fair value measurement of the respective subject instrument. Valuations of loans, corporate debt, and other debt obligations are generally based on discounted cash flow techniques, for which the significant inputs are the amount and timing of expected future cash flows, market yields and recovery assumptions. The significant inputs are generally determined based on relative value analysis, which incorporate comparisons to other debt instruments for which observable prices or broker quotes are available. Other valuation methodologies are used as appropriate including market comparables, transactions in similar instruments and recovery/liquidation analysis. The Company also considers the use of EBITDA multiples, revenue multiples, tangible net asset value multiples, TBV multiples, and other relevant multiples on its debt and equity investments to determine any credit gains or losses in certain instances. Changes in these inputs in isolation may result in a significantly higher or lower fair value measurement of the respective subject instrument. Note 4. Borrowings Citi Revolving Credit Facility: CB Funding entered into a senior secured revolving credit facility with Citibank, N.A. (the “Citi Facility”) on January 20, 2021. The maximum amount CB Funding is able to borrow from the Citi Facility is currently $400.0 million. Borrowings under the Citi Facility bear interest at an annual rate of LIBOR plus 1.60% per annum. In addition to the stated interest rate on borrowings, CB Funding is required to pay an unused commitment fee of (i) 1.25% per annum on any unused portion of the Citi Facility when the outstanding borrowings are less than 75% of the facility amount, and (ii) 0.75% per annum on any unused portion of the Citi Facility when the outstanding borrowings are equal to or greater than 75% of the facility amount. Interest expense and unused commitment fees under the facility totaled $12,458,013 for the year ended December 31, 2022, and were included within interest and credit facility financing expenses on the Consolidated Statement of Operations. (dollars in thousands) Primary Valuation Unobservable Weighted Asset Category Fair Value Technique Inputs Minimum Maximum Average (a) Senior Secured First Lien Debt 129,703$ Yield Analysis Market Yield 8.59% 24.27% 12.11% Senior Secured First Lien Debt (b) 3,711 Waterfall Analysis Revenue Multiple 0.62x 0.62x 0.62x Senior Secured First Lien Debt 6,722 Waterfall Analysis EBITDA Multiple 5.00x 8.50x 6.38x Senior Secured Second Lien Debt 8,186 Yield Analysis Market Yield 12.97% 13.80% 13.47% Collateralized Securities 75,116 Discounted Cash Flow Discount Rate 8.23% 14.20% 11.07% Total Level 3 Assets 223,438$ Range
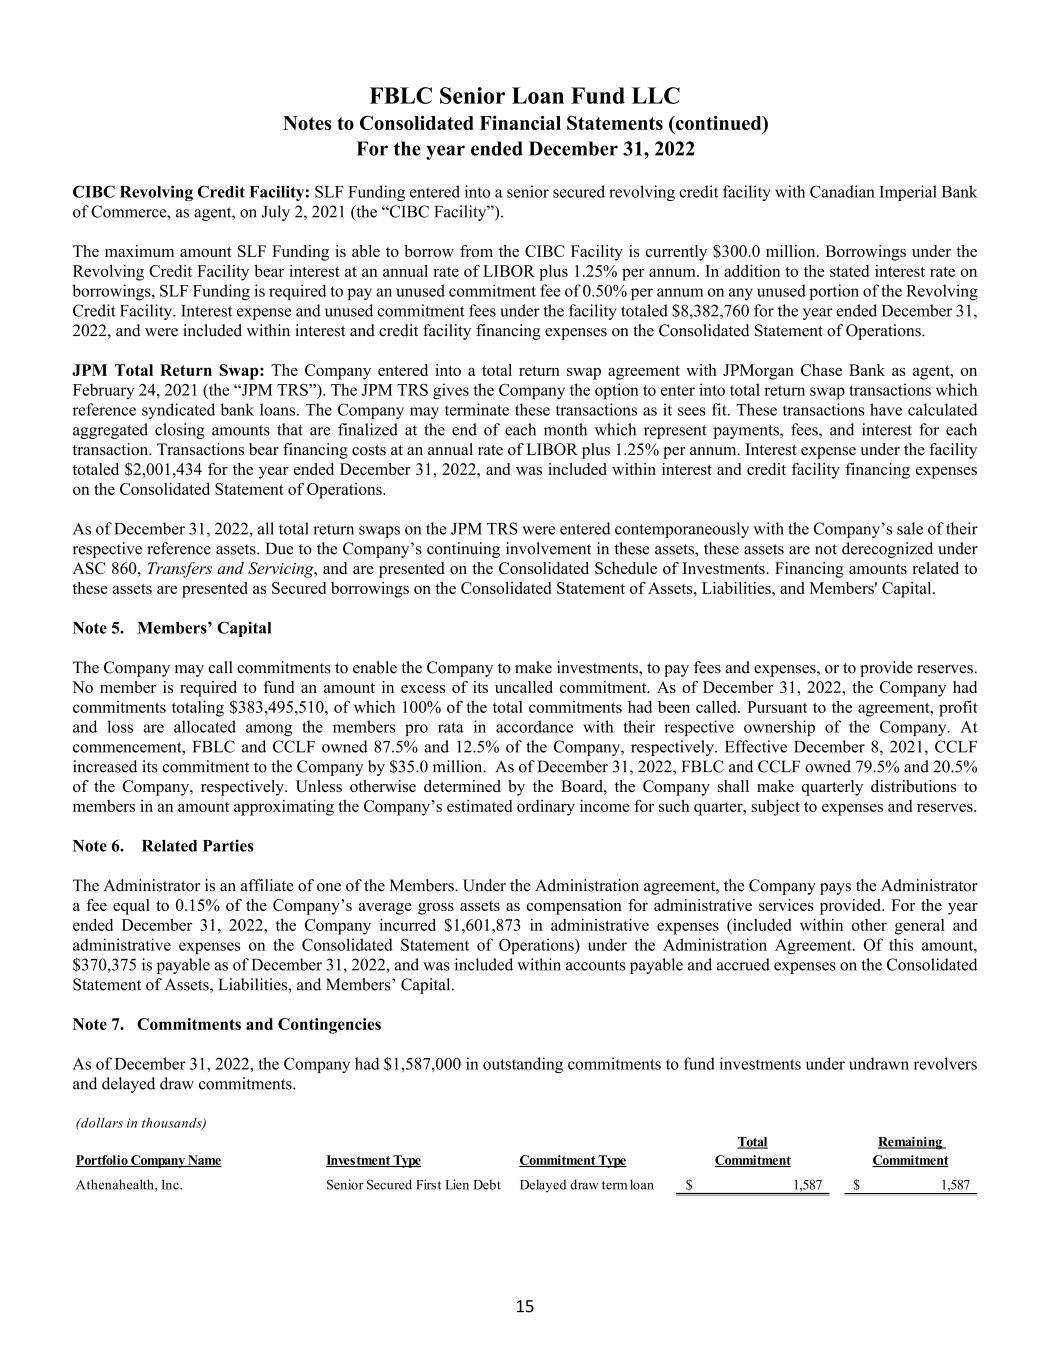
FBLC Senior Loan Fund LLC Notes to Consolidated Financial Statements (continued) For the year ended December 31, 2022 15 CIBC Revolving Credit Facility: SLF Funding entered into a senior secured revolving credit facility with Canadian Imperial Bank of Commerce, as agent, on July 2, 2021 (the “CIBC Facility”). The maximum amount SLF Funding is able to borrow from the CIBC Facility is currently $300.0 million. Borrowings under the Revolving Credit Facility bear interest at an annual rate of LIBOR plus 1.25% per annum. In addition to the stated interest rate on borrowings, SLF Funding is required to pay an unused commitment fee of 0.50% per annum on any unused portion of the Revolving Credit Facility. Interest expense and unused commitment fees under the facility totaled $8,382,760 for the year ended December 31, 2022, and were included within interest and credit facility financing expenses on the Consolidated Statement of Operations. JPM Total Return Swap: The Company entered into a total return swap agreement with JPMorgan Chase Bank as agent, on February 24, 2021 (the “JPM TRS”). The JPM TRS gives the Company the option to enter into total return swap transactions which reference syndicated bank loans. The Company may terminate these transactions as it sees fit. These transactions have calculated aggregated closing amounts that are finalized at the end of each month which represent payments, fees, and interest for each transaction. Transactions bear financing costs at an annual rate of LIBOR plus 1.25% per annum. Interest expense under the facility totaled $2,001,434 for the year ended December 31, 2022, and was included within interest and credit facility financing expenses on the Consolidated Statement of Operations. As of December 31, 2022, all total return swaps on the JPM TRS were entered contemporaneously with the Company’s sale of their respective reference assets. Due to the Company’s continuing involvement in these assets, these assets are not derecognized under ASC 860, Transfers and Servicing, and are presented on the Consolidated Schedule of Investments. Financing amounts related to these assets are presented as Secured borrowings on the Consolidated Statement of Assets, Liabilities, and Members' Capital. Note 5. Members’ Capital The Company may call commitments to enable the Company to make investments, to pay fees and expenses, or to provide reserves. No member is required to fund an amount in excess of its uncalled commitment. As of December 31, 2022, the Company had commitments totaling $383,495,510, of which 100% of the total commitments had been called. Pursuant to the agreement, profit and loss are allocated among the members pro rata in accordance with their respective ownership of the Company. At commencement, FBLC and CCLF owned 87.5% and 12.5% of the Company, respectively. Effective December 8, 2021, CCLF increased its commitment to the Company by $35.0 million. As of December 31, 2022, FBLC and CCLF owned 79.5% and 20.5% of the Company, respectively. Unless otherwise determined by the Board, the Company shall make quarterly distributions to members in an amount approximating the Company’s estimated ordinary income for such quarter, subject to expenses and reserves. Note 6. Related Parties The Administrator is an affiliate of one of the Members. Under the Administration agreement, the Company pays the Administrator a fee equal to 0.15% of the Company’s average gross assets as compensation for administrative services provided. For the year ended December 31, 2022, the Company incurred $1,601,873 in administrative expenses (included within other general and administrative expenses on the Consolidated Statement of Operations) under the Administration Agreement. Of this amount, $370,375 is payable as of December 31, 2022, and was included within accounts payable and accrued expenses on the Consolidated Statement of Assets, Liabilities, and Members’ Capital. Note 7. Commitments and Contingencies As of December 31, 2022, the Company had $1,587,000 in outstanding commitments to fund investments under undrawn revolvers and delayed draw commitments. (dollars in thousands) Portfolio Company Name Investment Type Commitment Type Total Commitment Remaining Commitment Athenahealth, Inc. Senior Secured First Lien Debt Delayed draw term loan 1,587$ 1,587$
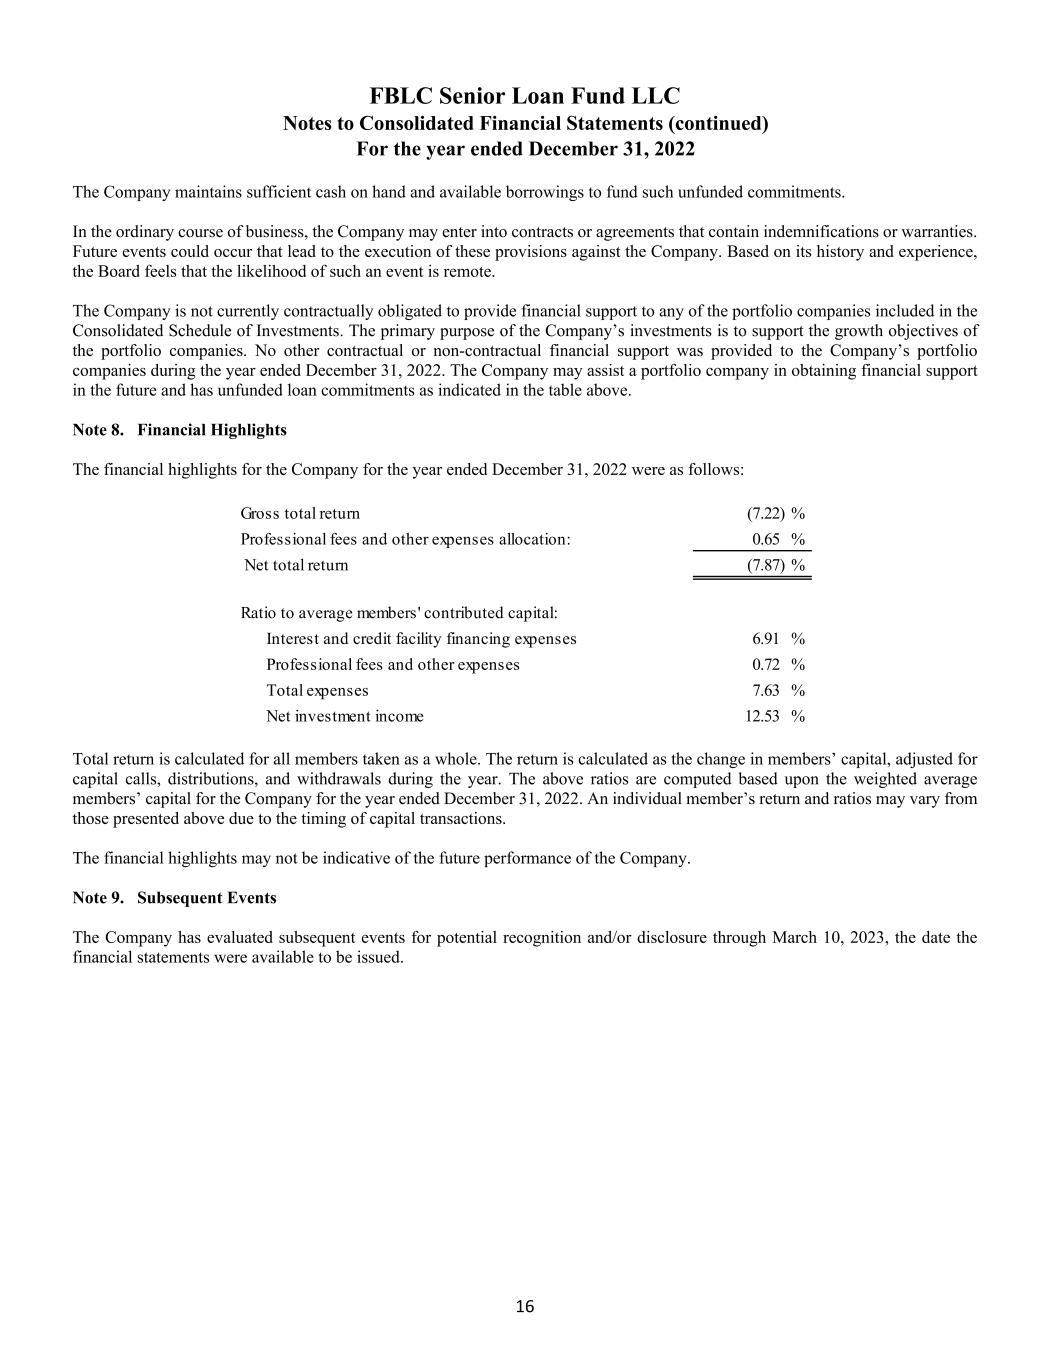
FBLC Senior Loan Fund LLC Notes to Consolidated Financial Statements (continued) For the year ended December 31, 2022 16 The Company maintains sufficient cash on hand and available borrowings to fund such unfunded commitments. In the ordinary course of business, the Company may enter into contracts or agreements that contain indemnifications or warranties. Future events could occur that lead to the execution of these provisions against the Company. Based on its history and experience, the Board feels that the likelihood of such an event is remote. The Company is not currently contractually obligated to provide financial support to any of the portfolio companies included in the Consolidated Schedule of Investments. The primary purpose of the Company’s investments is to support the growth objectives of the portfolio companies. No other contractual or non-contractual financial support was provided to the Company’s portfolio companies during the year ended December 31, 2022. The Company may assist a portfolio company in obtaining financial support in the future and has unfunded loan commitments as indicated in the table above. Note 8. Financial Highlights The financial highlights for the Company for the year ended December 31, 2022 were as follows: Total return is calculated for all members taken as a whole. The return is calculated as the change in members’ capital, adjusted for capital calls, distributions, and withdrawals during the year. The above ratios are computed based upon the weighted average members’ capital for the Company for the year ended December 31, 2022. An individual member’s return and ratios may vary from those presented above due to the timing of capital transactions. The financial highlights may not be indicative of the future performance of the Company. Note 9. Subsequent Events The Company has evaluated subsequent events for potential recognition and/or disclosure through March 10, 2023, the date the financial statements were available to be issued. Gross total return (7.22) % Professional fees and other expenses allocation: 0.65 % Net total return (7.87) % Ratio to average members' contributed capital: Interest and credit facility financing expenses 6.91 % Professional fees and other expenses 0.72 % Total expenses 7.63 % Net investment income 12.53 %


