UNITED STATES
SECURITIES AND EXCHANGE COMMISSION
Washington, D.C. 20549
FORM N-CSR
CERTIFIED SHAREHOLDER REPORT OF REGISTERED MANAGEMENT
INVESTMENT COMPANIES
Investment Company Act File Number 811-22431
RiverPark Funds Trust
(Exact name of registrant as specified in charter)
156 West 56th Street, 17th Floor
New York, NY 10019
(Address of principal executive offices) (Zip code)
Morty Schaja
156 West 56th Street, 17th Floor
New York, NY 10019
(Name and address of agent for service)
With copies to:
Thomas R. Westle
Blank Rome LLP
405 Lexington Avenue
New York, NY 10174
Registrant’s telephone number, including area code: 212-484-2100
Date of fiscal year end: September 30, 2017
Date of reporting period: September 30, 2017
| Item 1. | Reports to Stockholders. |
 |
Table of Contents
| Management’s Discussion of Fund Performance and Analysis | |
| RiverPark Large Growth Fund | 1 |
| RiverPark/Wedgewood Fund | 3 |
| RiverPark Short Term High Yield Fund | 5 |
| RiverPark Long/Short Opportunity Fund | 8 |
| RiverPark Strategic Income Fund | 12 |
| RiverPark Focused Value Fund | 15 |
| Schedules of Investments | |
| RiverPark Large Growth Fund | 17 |
| RiverPark/Wedgewood Fund | 18 |
| RiverPark Short Term High Yield Fund | 19 |
| RiverPark Long/Short Opportunity Fund | 22 |
| RiverPark Strategic Income Fund | 25 |
| RiverPark Focused Value Fund | 29 |
| Statements of Assets and Liabilities | 30 |
| Statements of Operations | 32 |
| Statements of Changes in Net Assets | 34 |
| Financial Highlights | 38 |
| Notes to Financial Statements | 44 |
| Report of Independent Registered Public Accounting Firm | 60 |
| Trustees and Officers of the Trust | 61 |
| Disclosure of Fund Expenses | 63 |
| Approval of the Investment Advisory and Investment Sub-Advisory Agreements | 65 |
| Notice to Shareholders | 68 |
The RiverPark Funds file their complete schedules of fund holdings with the Securities and Exchange Commission (the “Commission”) for the first and third quarters of each fiscal year on Form N-Q within sixty days after the end of the period. The Funds’ Forms N-Q are available on the Commission’s website at http://www.sec.gov, and may be reviewed and copied at the Commission’s Public Reference Room in Washington, D.C. Information on the operation of the Public Reference Room may be obtained by calling 1-800-SEC-0330.
A description of the policies and procedures that the Funds use to determine how to vote proxies relating to fund securities, as well as information relating to how a Fund voted proxies relating to fund securities during the most recent period ended June 30 is available (i) without charge, upon request, by calling 888-564-4517; and (ii) on the Commission’s website at http://www.sec.gov.
 |
Management’s Discussion of Fund Performance and Analysis
RiverPark Large Growth Fund (Unaudited)
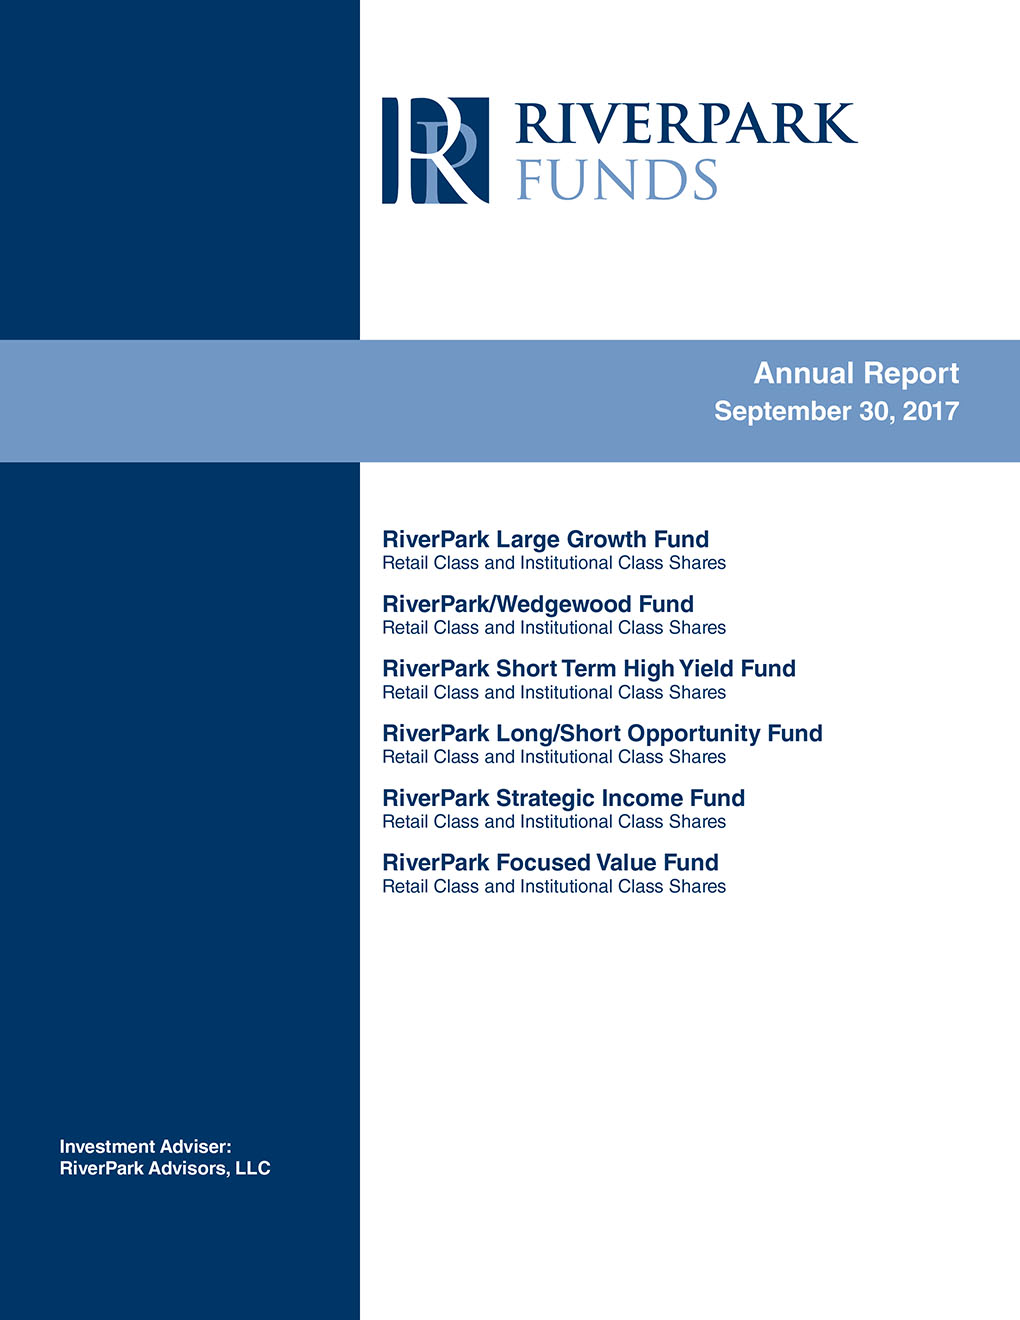
For the fiscal year ended September 30, 2017, the RiverPark Large Growth Fund (the “Fund”) gained 23.47% and 23.15% on its Institutional Class Shares and Retail Class Shares, respectively, while the Russell 1000 Growth Index TR gained 21.94% and the S&P 500 Index TR gained 18.61%.
Investment results for the fiscal year were not uniform across quarters. The Institutional Class Shares gained 1.08% for the December quarter, 9.78% for the March quarter, 5.31% for the June quarter, and 5.65% in the September quarter.
The Fund’s investment results were not uniform across sectors. The Fund’s best fiscal year-to-date performing sectors were Information Technology, Financials, Consumer Discretionary, and Real Estate. The Fund’s worst fiscal year-to-date performing sectors were Energy, Materials, and Health Care. The Fund’s best fiscal year-to-date performers were Blackstone Group, Align Technology, Apple, Facebook, and CarMax. The Fund’s worst fiscal year-to-date performers were Southwestern Energy, Chipotle Mexican Grill, Schlumberger, Monsanto, and Perrigo.
The RiverPark Large Growth Fund seeks to make investments in securities of large capitalization companies, which it defines as those in excess of $5 billion. The Fund invests in what it believes are exciting growth businesses with significant long-term growth potential, but patiently waits for opportunities to purchase these companies at attractive prices. RiverPark believes the style is best described as a “value orientation toward growth.” RiverPark believes that the current market environment provides it with an opportunity to own a diversified portfolio of growth stocks at attractive valuations. We are cautiously optimistic that we can achieve our long-term objective of realizing above average rates of return over the next few years.
This represents the manager’s assessment of the market environment at a specific point in time and should not be relied upon by the reader as research or investment advice.
The Russell 1000 Growth Total Return Index measures the performance of those Russell 1000 companies with higher price-to-book ratios and higher forecasted growth values.
The S&P 500 Total Return Index is an unmanaged capitalization-weighted index generally representative of large companies in the U.S. stock market and based on price changes and reinvested dividends.
Morningstar Large Growth portfolios invest primarily in big U.S. companies that are projected to grow faster than other large-cap stocks.
Index returns are for illustrative purposes only and do not reflect any management fees, transaction costs, or expenses. Indexes are unmanaged and one cannot invest directly in an index.
1
|
Comparison of Change in the Value of a $10,000 Investment in the RiverPark Large Growth Fund,
Retail Class Shares, versus the Russell 1000 Growth Index TR,
the S&P 500 Index TR and the Morningstar Large Growth Category
Retail Class Shares, versus the Russell 1000 Growth Index TR,
the S&P 500 Index TR and the Morningstar Large Growth Category
| AVERAGE ANNUAL TOTAL RETURNS FOR THE PERIOD ENDED SEPTEMBER 30, 2017 | ||||
| One Year Return | Annualized 3 Year Return | Annualized 5 Year Return | Annualized Inception to Date* | |
| Institutional Class Shares | 23.47% | 9.05% | 12.74% | 13.52% |
| Retail Class Shares | 23.15% | 8.80% | 12.46% | 13.24% |
| Russell 1000 Growth Index TR | 21.94% | 12.69% | 15.26% | 15.40% |
| S&P 500 Index TR | 18.61% | 10.81% | 14.22% | 14.36% |
| Morningstar Large Growth Category | 19.77% | 10.26% | 13.46% | 13.13% |
| * | Fund commenced operations on September 30, 2010. |
Returns shown above are calculated assuming reinvestment of all dividends and distributions. Returns do not reflect the deduction of taxes that a shareholder would pay on dividends or distributions or the redemption of shares from a fund. Returns reflect fee waivers and/or reimbursements in effect for the period; absent fee waivers and reimbursements, performance would have been lower. Effective July 31, 2016, the Fund fully recaptured previously waived investment advisory fees. Results represent past performance and do not indicate future results. The value of an investment in the Fund and the return on investment both will fluctuate and redemption proceeds may be higher or lower than a shareholder’s original cost. Performance of the Institutional Class Shares differs due to the differences in expenses. Current performance may be lower or higher than that shown here. Unlike the Fund’s comparative benchmarks, the Fund’s total returns are reduced by its annual operating expenses. Please note that one cannot invest directly in an unmanaged index.
2
|
Management’s Discussion of Fund Performance and Analysis
RiverPark/Wedgewood Fund (Unaudited)
For the fiscal year ended September 30, 2017, the RiverPark/Wedgewood Fund (the “Fund”) gained 12.85% and 12.62% on its Institutional Class Shares and Retail Class Shares, respectively, while the Russell 1000 Growth Index TR gained 21.94% and the S&P 500 Index TR gained 18.61%.
Investment results for the fiscal year were not uniform across quarters. The Institutional Class Shares gained 2.31% for the December quarter, 5.82% for the March quarter, lost 0.39% for the June quarter, and gained 4.64% in the September quarter.
The Fund’s investment results were not uniform across sectors. The Fund’s best fiscal year-to-date performing sectors were Information Technology, Financials, Health Care, and Consumer Discretionary. The Fund’s worst fiscal year-to-date performing sectors were Energy, Consumer Staples, and Industrials. The Fund’s best fiscal year-to-date performers were Apple, Berkshire Hathaway, PayPal Holdings, Priceline Group, and Cognizant Technology Solutions. The Fund’s worst fiscal year-to-date performers were QUALCOMM, Schlumberger, LKQ, Stericycle, and Core Laboratories.
The RiverPark/Wedgewood Fund seeks to make investments in about 19-21 companies, with market capitalizations in excess of $5 billion, which it believes have above-average growth prospects. The Fund invests in businesses that it believes are market leaders with a long-term sustainable competitive advantage. It patiently waits for opportunities to purchase what it believes are great businesses at attractive prices. While the Fund invests in growth it believes that valuation is the key to generating attractive returns over the long-term. Unlike most growth investors, Wedgewood is not a momentum investor but rather a contrarian growth investor. Wedgewood is a firm that believes in investing as opposed to trading and generally experiences an annual portfolio turnover of less than 50%. Wedgewood believes that the current market environment provides it with an opportunity to own a portfolio of growth stocks at attractive valuations. We are cautiously optimistic that we can achieve our long-term objective of realizing above average rates of return over the next few years.
This represents the manager’s assessment of the market environment at a specific point in time and should not be relied upon by the reader as research or investment advice.
The Russell 1000 Growth Total Return Index measures the performance of those Russell 1000 companies with higher price-to-book ratios and higher forecasted growth values.
The S&P 500 Total Return Index is an unmanaged capitalization-weighted index generally representative of large companies in the U.S. stock market and based on price changes and reinvested dividends.
Morningstar Large Growth portfolios invest primarily in big U.S. companies that are projected to grow faster than other large-cap stocks.
Index returns are for illustrative purposes only and do not reflect any management fees, transaction costs, or expenses. Indexes are unmanaged and one cannot invest directly in an index.
3
|
Comparison of Change in the Value of a $10,000 Investment in the RiverPark/Wedgewood Fund,
Retail Class Shares, versus the Russell 1000 Growth Index TR,
the S&P 500 Index TR and the Morningstar Large Growth Category
Retail Class Shares, versus the Russell 1000 Growth Index TR,
the S&P 500 Index TR and the Morningstar Large Growth Category
| AVERAGE ANNUAL TOTAL RETURNS FOR THE PERIOD ENDED SEPTEMBER 30, 2017 | ||||
| One Year Return | Annualized 3 Year Return | Annualized 5 Year Return | Annualized Inception to Date* | |
| Institutional Class Shares | 12.85% | 4.19% | 8.80% | 11.33% |
| Retail Class Shares | 12.62% | 4.09% | 8.64% | 11.14% |
| Russell 1000 Growth Index TR | 21.94% | 12.69% | 15.26% | 15.40% |
| S&P 500 Index TR | 18.61% | 10.81% | 14.22% | 14.36% |
| Morningstar Large Growth Category | 19.77% | 10.26% | 13.46% | 13.13% |

| * | Fund commenced operations on September 30, 2010. |
Returns shown above are calculated assuming reinvestment of all dividends and distributions. Returns do not reflect the deduction of taxes that a shareholder would pay on dividends or distributions or the redemption of shares from a fund. Returns reflect fee waivers and/or reimbursements in effect for the period; absent fee waivers and reimbursements, performance would have been lower. Effective June 30, 2013, the Fund fully recaptured previously waived investment advisory fees. Results represent past performance and do not indicate future results. The value of an investment in the Fund and the return on investment both will fluctuate and redemption proceeds may be higher or lower than a shareholder’s original cost. Performance of the Institutional Class Shares differs due to the differences in expenses. Current performance may be lower or higher than that shown here. Unlike the Fund’s comparative benchmarks, the Fund’s total returns are reduced by its annual operating expenses. Please note that one cannot invest directly in an unmanaged index.
4
|
Management’s Discussion of Fund Performance and Analysis
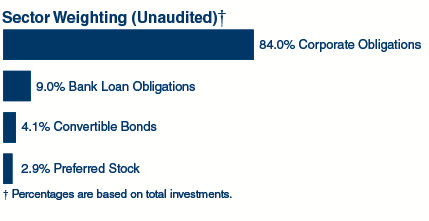
RiverPark Short Term High Yield Fund (Unaudited)
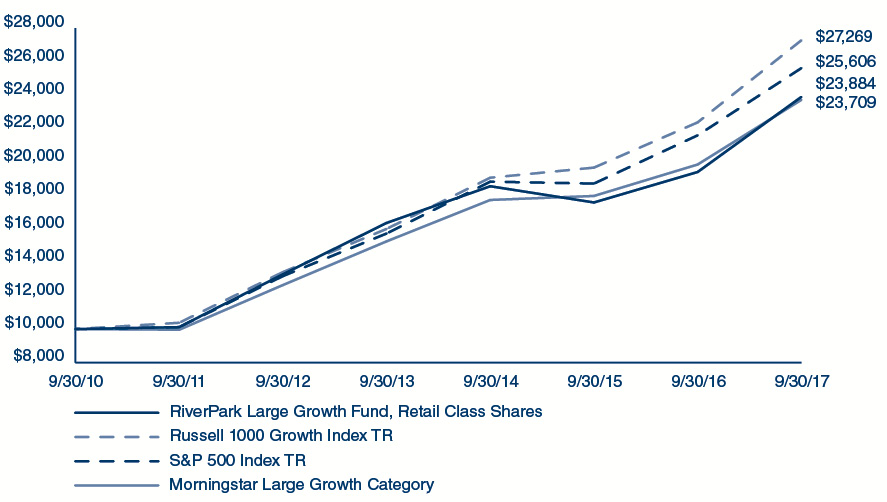
For the fiscal year ended September 30, 2017, the RiverPark Short Term High Yield Fund (the “Fund”) gained 2.67% and 2.42% on its Institutional Class Shares and Retail Class Shares, respectively, while the BofA Merrill Lynch 1-3 Year U.S. Corporate Bond Index gained 1.71%, the BofA Merrill Lynch 1-Year U.S. Treasury Index gained 0.60% and the BofA Merrill Lynch 0-3 Year U.S. High Yield Index Excluding Financials gained 8.00%.
Investment results for the fiscal year were fairly consistent across quarters. The Institutional Class Shares gained 0.65% for the December quarter, 0.76% for the March quarter, 0.59% for the June quarter, and 0.65% in the September quarter.
The Fund realized positive contributions from its investments in all five of its categories of investment. The Fund realized a contribution to its performance of 1.35% in the Short Term Maturities Category, 0.74% in Redeemed Debt, 0.63% in Cushion Bonds, 0.53% in Event-Driven, and 0.23% in Strategic Recap investments.
The Fund continues to strive for an attractive yield while maintaining a weighted average maturity of less than one year. As of September 30, 2017, 71% of the Fund’s invested portfolio is expected to mature or be repaid within 90 days, while 93% of the Fund’s invested portfolio is expected to mature or be repaid within 12 months. Over 59% of the invested portfolio is expected to be repaid as the result of a corporate event (redemption or early retirement due to an acquisition or recapitalization).
The RiverPark Short Term High Yield Fund focuses on short term high yield securities for which they believe credit ratings do not accurately reflect a company’s ability to meet their short term credit obligations. The RiverPark Short Term High Yield Fund seeks to make investments in fixed income securities of companies that have announced or, in Cohanzick’s opinion, will announce a funding event, reorganization or other corporate event that they believe will have a positive impact on a company’s ability to repay their debt. Additionally, the Fund will invest in securities in which it perceives there is limited near term risk of default. In Cohanzick’s view, the risks associated with investing in short term high yield debt are very different from investing in long-dated paper in which operating performance and business sustainability are of primary concern.
5
|
This represents the manager’s assessment of the market environment at a specific point in time and should not be relied upon by the reader as research or investment advice.
The BofA Merrill Lynch 1-3 Year U.S. Corporate Bond Index is an unmanaged index comprised of U.S. dollar denominated investment grade corporate debt securities publicly issued in the U.S. domestic market with at least one year remaining term to final maturity.
The BofA Merrill Lynch 1-Year U.S. Treasury Index tracks the performance of U.S. dollar denominated sovereign debt publicly issued by the U.S. government in its domestic market with at least one year remaining term to final maturity.
The BofA Merrill Lynch 0-3 Year U.S. High Yield Index Excluding Financials considers all securities from the BofA Merrill Lynch U.S. High Yield Master II Index and the BofA Merrill Lynch U.S. High Yield, 0-1 Year Index, and then applies the following filters: securities greater than or equal to one month but less than 3 years to final maturity, and exclude all securities with Level 2 sector classification = Financial (FNCL).
Index returns are for illustrative purposes only and do not reflect any management fees, transaction costs, or expenses. Indexes are unmanaged and one cannot invest directly in an index.
6
|
Comparison of Change in the Value of a $10,000 Investment in the RiverPark Short Term High Yield Fund,
Retail Class Shares, versus the BofA Merrill Lynch 1-3 Year U.S. Corporate Bond Index, the BofA Merrill Lynch 1-Year U.S. Treasury Index and the BofA Merrill Lynch 0-3 Year U.S. High Yield Index Excluding Financials
Retail Class Shares, versus the BofA Merrill Lynch 1-3 Year U.S. Corporate Bond Index, the BofA Merrill Lynch 1-Year U.S. Treasury Index and the BofA Merrill Lynch 0-3 Year U.S. High Yield Index Excluding Financials
| AVERAGE ANNUAL TOTAL RETURNS FOR THE PERIOD ENDED SEPTEMBER 30, 2017 | ||||
| One Year Return | Annualized 3 Year Return | Annualized 5 Year Return | Annualized Inception to Date* | |
| Institutional Class Shares | 2.67% | 2.48% | 2.86% | 3.26% |
| Retail Class Shares | 2.42% | 2.23% | 2.57% | 2.97% |
| BofA Merrill Lynch 1-3 Year U.S. Corporate Bond Index | 1.71% | 1.77% | 1.78% | 2.11% |
| BofA Merrill Lynch 1-Year U.S. Treasury Index | 0.60% | 0.46% | 0.39% | 0.40% |
| BofA Merrill Lynch 0-3 Year U.S. High Yield Index Excluding Financials | 8.00% | 6.00% | 5.70% | 5.86% |
| * | Fund commenced operations on September 30, 2010. |
Returns shown above are calculated assuming reinvestment of all dividends and distributions. Returns do not reflect the deduction of taxes that a shareholder would pay on dividends or distributions or the redemption of shares from a fund. Returns reflect fee waivers and/or reimbursements in effect for the period; absent fee waivers and reimbursements, performance would have been lower. Effective September 30, 2013, the Fund fully recaptured previously waived investment advisory fees. Results represent past performance and do not indicate future results. The value of an investment in the Fund and the return on investment both will fluctuate and redemption proceeds may be higher or lower than a shareholder’s original cost. Performance of the Institutional Class Shares differs due to the differences in expenses. Current performance may be lower or higher than that shown here. Unlike the Fund’s comparative benchmarks, the Fund’s total returns are reduced by its annual operating expenses. Please note that one cannot invest directly in an unmanaged index.
7
|
Management’s Discussion of Fund Performance and Analysis
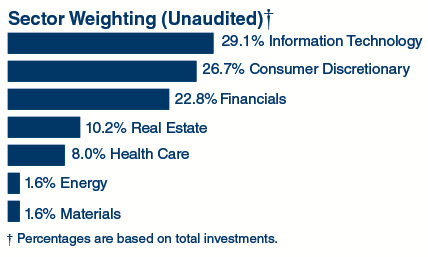
RiverPark Long/Short Opportunity Fund (Unaudited)
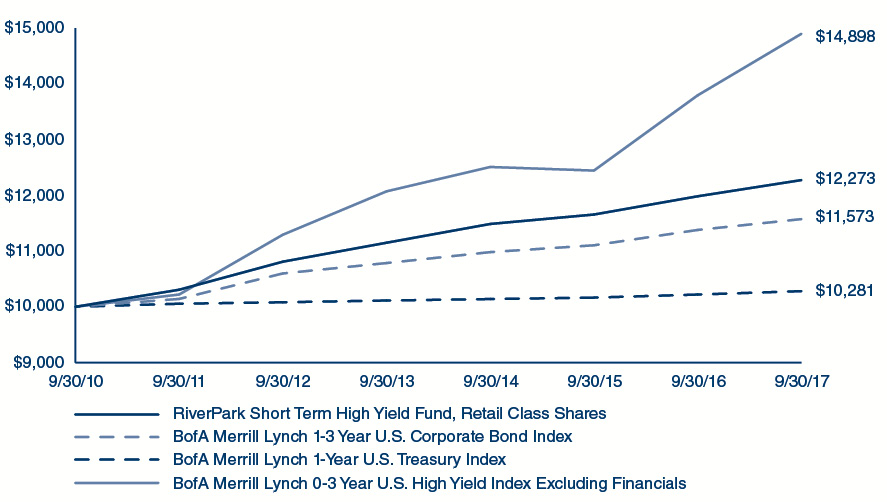
For the fiscal year ended September 30, 2017, the RiverPark Long/Short Opportunity Fund (the “Fund”) gained 20.21% and 19.88% on its Institutional Class Shares and Retail Class Shares respectively, while the S&P 500 Index TR gained 18.61% and the Morningstar Long/Short Equity Category gained 8.68%. The average gross and net month-end exposures of the Fund for the fiscal year were 178% and 62% (long 120%, short 58%), respectively.
The Fund’s long positions contributed approximately 27.8% for the fiscal year, as compared to the performance of the broad stock market as measured by the S&P 500 Index which gained 18.61%. The Fund was negatively affected by its short positions which detracted 5.3% for the fiscal year ended September 30, 2017. We still believe the Fund’s shorts are comprised of businesses facing major headwinds going forward and have flawed business models.
Investment results for the fiscal year were not uniform across quarters. The Institutional Class Shares gained 0.58% for the December quarter, 8.21% for the March quarter, 5.09% for the June quarter, and 5.10% in the September quarter.
The Fund’s investment results were not uniform across sectors. The Fund’s best fiscal year-to-date performing sectors were Information Technology, Financials, Consumer Discretionary, and Real Estate. The Fund’s worst fiscal year-to-date performing sectors were Energy, Consumer Staples, Telecommunication Services, and Materials. The Fund’s best fiscal year-to-date performers were The Blackstone Group LP, Align Technology, Facebook, Apple, and CarMax. The Fund’s worst fiscal year-to-date performers were Southwestern Energy, Green Dot, Best Buy, Whole Foods Market, and Gap.
Derivatives, which were used to marginally leverage the long positions through total return swaps or equity options, contributed approximately 2.37% to the Fund performance.
The RiverPark Long/Short Opportunity Fund seeks long-term capital appreciation while managing downside volatility by investing long in equity securities that the Fund’s investment adviser believes have above-average growth prospects and selling short equity securities the Adviser believes are competitively disadvantaged over the long-term. The Fund is an opportunistic long/short investment fund. The Fund’s investment goal is to achieve above average rates of return with less volatility and less downside risk as compared to U.S. equity markets. We believe the long book is currently comprised of businesses that are attractively priced as, on average, their businesses have experienced earnings growth in excess of their stock price gains. We believe the substantial appreciation of the short book, much of it due to valuation expansion along with or exceeding the market’s, has created an unusually attractive opportunity to short businesses that we believe are flawed at what we believe are full or excessive values.
8
|
This represents the manager’s assessment of the market environment at a specific point in time and should not be relied upon by the reader as research or investment advice.
The S&P 500 Total Return Index is an unmanaged capitalization-weighted index generally representative of large companies in the U.S. stock market and based on price changes and reinvested dividends.
The Morningstar Long/Short Equity Category portfolios hold sizable stakes in both long and short positions in equities, exchange-traded funds and related derivatives. Some funds that fall into this category are market neutral - dividing their exposure equally between long and short positions in an attempt to earn a modest return that is not tied to the market’s fortunes. Other portfolios that are not market neutral will shift their exposure to long and short positions depending upon their macro outlook or the opportunities they uncover through bottom-up research.
Index returns are for illustrative purposes only and do not reflect any management fees, transaction costs, or expenses. Indexes are unmanaged and one cannot invest directly in an index.
9
|
Management’s Discussion of Fund Performance and Analysis
RiverPark Long/Short Opportunity Fund
Supplemental Disclosure (Unaudited):
The following represents a reconciliation of accounting principles generally accepted in the United States of America (“GAAP”) to non-GAAP exposure for underlying investments that are held by the Fund through investments in common stock and total return swap transactions as of September 30, 2017. The total non-GAAP exposure is calculated by using the common stock plus the notional swap values divided by the net asset value of the Fund as of September 30, 2017.
| Common Stock and Total Return Swaps: | ||
| GAAP Exposure | Non-GAAP Exposure | |
| Alliance Data Systems | ||
| Common Stock | 2.2% | 2.2% |
| Total Return Swap | — | 1.8% |
| 2.2% | 4.0% | |
| Alphabet Inc, Class C | ||
| Common Stock | 1.9% | 1.9% |
| Total Return Swap | — | 0.4% |
| 1.9% | 2.3% | |
| Alphabet Inc, Class A | ||
| Common Stock | 2.3% | 2.3% |
| Total Return Swap | — | 0.1% |
| 2.3% | 2.4% | |
| American Tower Corp | ||
| Common Stock | 2.5% | 2.5% |
| Total Return Swap | — | 1.3% |
| 2.5% | 3.8% | |
| Apple Inc | ||
| Common Stock | 2.8% | 2.8% |
| Total Return Swap | — | 0.5% |
| 2.8% | 3.3% | |
| Carmax Inc | ||
| Common Stock | 3.2% | 3.2% |
| Total Return Swap | — | 0.9% |
| 3.2% | 4.1% | |
| CME Group Inc | ||
| Common Stock | 2.1% | 2.1% |
| Total Return Swap | — | 1.6% |
| 2.1% | 3.7% | |
| Dollar Tree Inc | ||
| Common Stock | 2.9% | 2.9% |
| Total Return Swap | — | 2.0% |
| 2.9% | 4.9% | |
| eBay Inc | ||
| Common Stock | 2.1% | 2.1% |
| Total Return Swap | — | 1.0% |
| 2.1% | 3.1% | |
| EOG Resources Inc | ||
| Common Stock | 0.6% | 0.6% |
| Total Return Swap | — | 1.7% |
| 0.6% | 2.3% | |
| GAAP Exposure | Non-GAAP Exposure | |
| Las Vegas Sands Corp | ||
| Common Stock | 0.3% | 0.3% |
| Total Return Swap | — | 3.4% |
| 0.3% | 3.7% | |
| Nike Inc | ||
| Common Stock | 1.8% | 1.8% |
| Total Return Swap | — | 0.5% |
| 1.8% | 2.3% | |
| Realogy Holdings Corp | ||
| Common Stock | 0.0% | 0.0% |
| Total Return Swap | — | 2.9% |
| 0.0% | 2.9% | |
| Schlumberger Ltd | ||
| Common Stock | 0.0% | 0.0% |
| Total Return Swap | — | 2.2% |
| 0.0% | 2.2% | |
| Southwestern Energy Co | ||
| Common Stock | 0.9% | 0.9% |
| Total Return Swap | — | 1.1% |
| 0.9% | 2.0% | |
| Visa Inc | ||
| Common Stock | 2.2% | 2.2% |
| Total Return Swap | — | 1.1% |
| 2.2% | 3.3% | |
| Walt Disney Co | �� | |
| Common Stock | 0.4% | 0.4% |
| Total Return Swap | — | 3.4% |
| 0.4% | 3.8% | |
| Remaining Underliers | ||
| Common Stock | 64.9% | 64.9% |
| Total Common Stock & | ||
| Total Return Swaps | 93.1% | 119.0% |
| Securities Sold Short, Not Yet Purchased: | ||
| GAAP Exposure | Non-GAAP Exposure | |
| Common Stock | (62.0%) | (62.0%) |
| Total, Securities Sold Short, | ||
| Not Yet Purchased | (62.0%) | (62.0%) |
10
|
Comparison of Change in the Value of a $10,000 Investment in the RiverPark Long/Short Opportunity Fund,
Retail Class Shares, versus the S&P 500 Index and the Morningstar Long/Short Equity Category
Retail Class Shares, versus the S&P 500 Index and the Morningstar Long/Short Equity Category
| AVERAGE ANNUAL TOTAL RETURNS FOR THE PERIOD ENDED SEPTEMBER 30, 2017 | ||||
| One Year Return | Annualized 3 Year Return | Annualized 5 Year Return* | Annualized Inception to Date* | |
| Institutional Class Shares | 20.21% | 5.58% | 4.25% | 7.20% |
| Retail Class Shares | 19.88% | 5.38% | 4.05% | 7.06% |
| S&P 500 Index TR | 18.61% | 10.81% | 14.22% | 13.83% |
| Morningstar Long/Short Equity Category | 8.68% | 2.67% | 4.64% | 3.69% |
| * | Fund commenced operations on March 30, 2012. The performance data quoted for periods prior to March 30, 2012 is that of the Predecessor Fund. The Predecessor Fund commenced operations on September 30, 2009. The Predecessor Fund was not a registered mutual fund and was not subject to the same investment and tax restrictions as the Fund. If it had been, the Predecessor Fund’s performance might have been lower. Performance shown for periods of one year and greater are annualized. |
For periods after March 30, 2012, the returns shown above are calculated assuming reinvestment of all dividends and distributions. Returns do not reflect the deduction of taxes that a shareholder would pay on dividends or distributions or the redemption of shares from a fund. Returns reflect fee waivers and/or reimbursements in effect for the period; absent fee waivers and reimbursements, performance would have been lower. Results represent past performance and do not indicate future results. The value of an investment in the Fund and the return on investment both will fluctuate and redemption proceeds may be higher or lower than a shareholder’s original cost. Performance of the Institutional Class Shares differs due to the differences in expenses. Current performance may be lower or higher than that shown here. Unlike the Fund’s comparative benchmarks, the Fund’s total returns are reduced by its annual operating expenses. Please note that one cannot invest directly in an unmanaged index.
11
|
Management’s Discussion of Fund Performance and Analysis
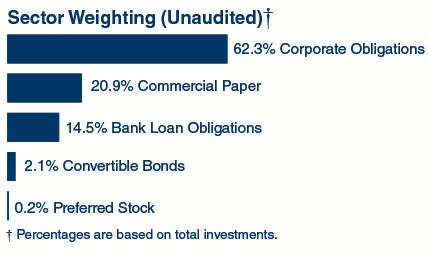
RiverPark Strategic Income Fund (Unaudited)
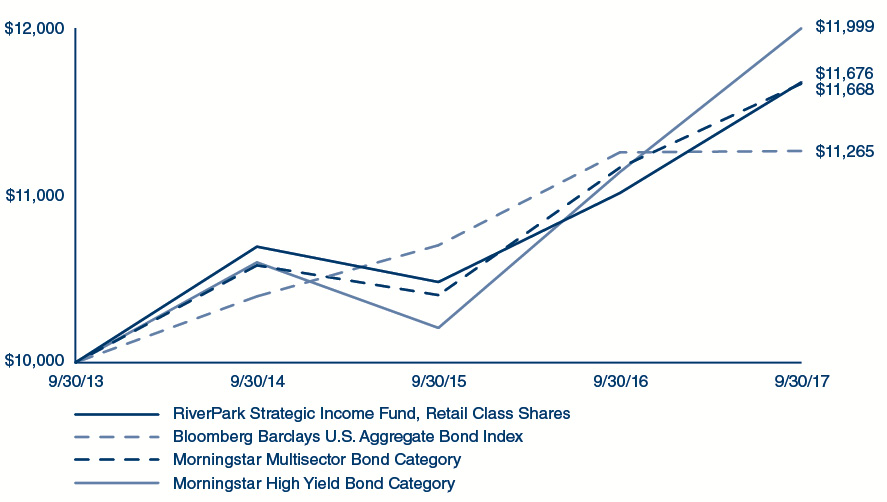
For the fiscal year ended September 30, 2017, the RiverPark Strategic Income Fund (the “Fund”) gained 6.39% and 6.01% on its Institutional Class Shares and Retail Class Shares, respectively, while the Bloomberg Barclays U.S. Aggregate Bond Index gained 0.07%, the Morningstar Multisector Bond Category gained 4.85%, and the Morningstar High Yield Bond Category gained 7.72%.
Investment results for the fiscal year were not uniform across quarters. The Institutional Class Shares gained 1.93% for the December quarter, 2.06% for the March quarter, 1.34% for the June quarter, and 0.92% in the September quarter.
The Fund realized positive contributions from its investments in five of its seven categories of investment. The Fund realized a contribution to its performance of 3.63% in its Buy & Hold “Money Good” investments, 1.16% in RiverPark Short Term High Yield Bond Fund Overlap, 1.11% in Off the Beaten Path, 0.76% in Priority Based (Above the Fray), and 0.49% in Interest Rate Resets (floaters, cushion bonds). The Fund had detraction to its performance of 0.10% in the Hedges category and 0.02% in Other (ABS) category of investments.
As of September 30, 2017, the Fund’s net assets were weighted by category as follows: 22.44% was held in RiverPark Short Term High Yield Bond Fund Overlap investments, 41.96% in the Buy & Hold “Money Good” category, 6.08% in Off The Beaten Path, 2.35% in Other (ABS), 6.74% in the Priority Based (Above the Fray), 16.32% in Interest Rate Resets (floaters, cushion bonds), -4.43% in Hedges, with the remaining 8.55% in cash and cash equivalents. Across all categories, 57.8% of the net assets were held in high yield securities and 33.3% was held in investment grade securities. The Fund held 109 positions as of this date, 15 of which were held in the RiverPark Short Term High Yield Bond Fund Overlap category and 94 of which were not.
RiverPark Strategic Income Fund seeks high current income and capital appreciation consistent with the preservation of capital by investing in investment grade and non-investment grade debt, preferred stock, convertible bonds, bank loans, high yield bonds and income producing equities that Cohanzick deems appropriate for the Fund’s investment objective. The Fund will primarily invest in both investment grade and non-investment grade “Money Good” securities, for which the enterprise value of the issuing company exceeds the value of the senior and equally ranked debt of the considered investment. Therefore, we believe the risk of loss of principal due to permanent impairment is minimal. The Fund expects to invest in securities that are not widely followed, which Cohanzick believes offer better returns with little or no additional credit risk.
Footnotes:
“Money Good” is a term used by the Adviser to describe debt it believes will be paid off in full under current market conditions and on a strict priority basis.
High yield and investment grade classification of securities was based on Bloomberg Composite Ratings comprised of Moody’s, Standard & Poors, Fitch & DBRS, Ltd.
12
|
This represents the manager’s assessment of the market environment at a specific point in time and should not be relied upon by the reader as research or investment advice.
The Bloomberg Barclays U.S. Aggregate Bond Index is weighted according to market capitalization, which means the securities represented in the index are weighted according to the market size of the bond category.
The Morningstar Multisector Bond Category portfolios seek income by diversifying their assets among several fixed-income sectors, usually U.S. government obligations, U.S. corporate bonds, foreign bonds, and high-yield U.S. debt securities.
The Morningstar High Yield Bond Category primarily invest in U.S. high-income debt securities where at least 65% or more of bond assets are not rated or are rated by a major agency such as Standard & Poor’s or Moody’s at the level of BB and below.
Index returns are for illustrative purposes only and do not reflect any management fees, transaction costs, or expenses. Indexes are unmanaged and one cannot invest directly in an index.
13
|
Comparison of Change in the Value of a $10,000 Investment in the RiverPark Strategic Income Fund,
Retail Class Shares, versus the Bloomberg Barclays U.S. Aggregate Bond Index, the Morningstar Multisector Bond Category and the Morningstar High Yield Bond Category
Retail Class Shares, versus the Bloomberg Barclays U.S. Aggregate Bond Index, the Morningstar Multisector Bond Category and the Morningstar High Yield Bond Category
| AVERAGE ANNUAL TOTAL RETURNS FOR THE PERIOD ENDED SEPTEMBER 30, 2017 | |||
| One Year Return | Annualized 3 Year Return | Annualized Inception to Date* | |
| Institutional Class Shares | 6.39% | 3.30% | 4.25% |
| Retail Class Shares | 6.01% | 2.98% | 3.95% |
| Bloomberg Barclays U.S. Aggregate Bond Index | 0.07% | 2.71% | 3.02% |
| Morningstar Multisector Bond Category | 4.85% | 3.29% | 3.93 % |
| Morningstar High Yield Bond Category | 7.72% | 4.22% | 4.66% |
| * | Fund commenced operations on September 30, 2013. |
Returns shown above are calculated assuming reinvestment of all dividends and distributions. Returns do not reflect the deduction of taxes that a shareholder would pay on dividends or distributions or the redemption of shares from a fund. Returns reflect fee waivers and/or reimbursements in effect for the period; absent fee waivers and reimbursements, performance would have been lower. Effective March 31, 2014, the Fund fully recaptured previously waived investment advisory fees. Results represent past performance and do not indicate future results. The value of an investment in the Fund and the return on investment both will fluctuate and redemption proceeds may be higher or lower than a shareholder’s original cost. Performance of the Institutional Class Shares differs due to the differences in expenses. Current performance may be lower or higher than that shown here. Unlike the Fund’s comparative benchmarks, the Fund’s total returns are reduced by its annual operating expenses. Please note that one cannot invest directly in an unmanaged index.
14
|
Management’s Discussion of Fund Performance and Analysis
RiverPark Focused Value Fund (Unaudited)
For the fiscal year ended September 30, 2017, the RiverPark Focused Value Fund (the “Fund”) gained 19.88% on the Institutional Class and 19.44% Retail Class Shares, while the Russell 1000 Value Index TR gained 15.12%, the Morningstar Large Value category gained 16.44% and the Morningstar Large Blend category gained 17.54%.
Investment results for the fiscal year were not uniform across quarters. The Institutional Class Shares gained 2.12% for the December quarter, 7.27% for the March quarter, 5.75% for the June quarter, and 3.48% in the September quarter.
The Fund’s investment results were not uniform across sectors. The Fund’s best fiscal year-to-date performing sectors were Information Technology, Materials, Financials, and Energy. The Fund’s worst fiscal year-to-date performing sectors were Health Care, Industrials, Utilities, and Real Estate. The Fund’s best fiscal year-to-date performers were Western Digital, Marathon Petroleum, CF Industries Holdings, The Blackstone Group LP, and Lyondellbasell Industries. The Fund’s worst fiscal year-to-date performers were Sunoco Logistics Partners LP, Express Scripts, VRX, Macquarie Infrastructure and Allergan.
The RiverPark Focused Value Fund seeks long-term capital appreciation by investing in large capitalization US equity securities that the Fund’s Investment Advisor believes are trading at substantial discounts to intrinsic value. The Fund is a high conviction strategy and intends to be concentrated, with generally 20-25 investments. The Fund’s investments will generally fall into two categories: high-quality businesses at reasonable prices and businesses impacted by temporary challenges. The Fund seeks to invest in businesses that are durable and predictable, run by shareholder-oriented management teams and where we believe our internally generated projections of future cash flows when combined with conservative valuation metrics can lead to expected returns in excess of 15% annually over a 3-5 year holding period. The Fund’s investment approach is bottom-up, fundamental, rigorous, research-intensive value-investing. We are cautiously optimistic that we can achieve our long-term objective of realizing above average rates of return over the next few years.
This represents the manager’s assessment of the market environment at a specific point in time and should not be relied upon by the reader as research or investment advice.
The Russell 1000 Value Total Return Index measures the performance of those Russell 1000 companies that have lower price-to book ratios and lower expected long-term mean earnings growth rates.
The Morningstar Large Value Category measures the performance of large-cap stocks with relatively low prices given anticipated per-share earnings, book value, cash flow, sales and dividends.
The Morningstar Large Blend Category funds invest in a variety of large U.S. stocks. Stocks in the top 70% of the capitalization of the U.S. equity market are defined as large-cap. The blend style is assigned to funds where neither growth nor value characteristics predominate.
Index returns are for illustrative purposes only and do not reflect any management fees, transaction costs, or expenses. Indexes are unmanaged and one cannot invest directly in an index.
15
|
Comparison of Change in the Value of a $10,000 Investment in the RiverPark Focused Value Fund,
Retail Class Shares, versus the Russell 1000 Value Index TR, the Morningstar Large Value Category and the Morningstar Large Blend Category
Retail Class Shares, versus the Russell 1000 Value Index TR, the Morningstar Large Value Category and the Morningstar Large Blend Category
AVERAGE ANNUAL TOTAL RETURNS FOR THE PERIOD ENDED SEPTEMBER 30, 2017 | ||
| One Year Return | Annualized Inception to Date* | |
| Institutional Class Shares | 19.88% | -1.36% |
| Retail Class Shares | 19.44% | -1.64% |
| Russell 1000 Value Index TR | 15.12% | 8.50% |
| Morningstar Large Value Category | 16.44% | 7.62% |
| Morningstar Large Blend Category | 17.54% | 8.06% |
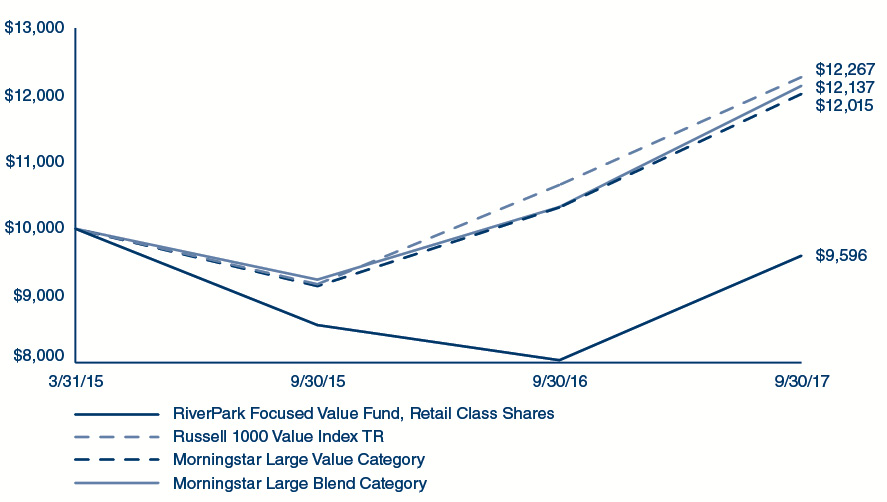
| * | Fund commenced operations on March 31, 2015. |
Returns shown above are calculated assuming reinvestment of all dividends and distributions. Returns do not reflect the deduction of taxes that a shareholder would pay on dividends or distributions or the redemption of shares from a fund. Returns reflect fee waivers and/or reimbursements in effect for the period; absent fee waivers and reimbursements, performance would have been lower. Results represent past performance and do not indicate future results. The value of an investment in the Fund and the return on investment both will fluctuate and redemption proceeds may be higher or lower than a shareholder’s original cost. Performance of the Institutional Class Shares differs due to the differences in expenses. Current performance may be lower or higher than that shown here. Unlike the Fund’s comparative benchmarks, the Fund’s total returns are reduced by its annual operating expenses. Please note that one cannot invest directly in an unmanaged index.
16
| RiverPark Large Growth Fund September 30, 2017 |
| Description | Shares | Value (000) | ||||||
| Schedule of Investments | ||||||||
| Common Stock — 98.1%** | ||||||||
| Consumer Discretionary – 29.4% | ||||||||
| adidas ADR | 5,229 | $ | 592 | |||||
| Amazon.com* | 1,418 | 1,364 | ||||||
| CarMax* | 20,652 | 1,566 | ||||||
| Chipotle Mexican Grill, Cl A* | 1,589 | 489 | ||||||
| Dollar Tree* | 25,968 | 2,255 | ||||||
| Dollarama^ | 9,326 | 1,020 | ||||||
| Las Vegas Sands | 22,919 | 1,470 | ||||||
| NIKE, Cl B | 17,189 | 891 | ||||||
| Priceline Group* | 738 | 1,351 | ||||||
| Starbucks | 12,841 | 690 | ||||||
| Ulta Beauty* | 2,687 | 607 | ||||||
| Walt Disney | 16,365 | 1,613 | ||||||
| 13,908 | ||||||||
| Energy – 5.2% | ||||||||
| EOG Resources | 10,007 | 968 | ||||||
| Schlumberger | 14,279 | 996 | ||||||
| Southwestern Energy* | 84,691 | 518 | ||||||
| 2,482 | ||||||||
| Financials – 17.7% | ||||||||
| Affiliated Managers Group | 3,212 | 610 | ||||||
| BlackRock, Cl A | 1,222 | 546 | ||||||
| Charles Schwab | 37,925 | 1,659 | ||||||
| CME Group, Cl A | 10,031 | 1,361 | ||||||
| Intercontinental Exchange | 14,194 | 975 | ||||||
| TD Ameritrade Holding | 22,059 | 1,077 | ||||||
| The Blackstone Group LP (a) | 63,802 | 2,129 | ||||||
| 8,357 | ||||||||
| Health Care – 5.5% | ||||||||
| Align Technology* | 5,221 | 973 | ||||||
| Illumina* | 3,304 | 658 | ||||||
| Intuitive Surgical* | 923 | 965 | ||||||
| 2,596 | ||||||||
| Information Technology – 29.1% | ||||||||
| Adobe Systems* | 9,672 | 1,443 | ||||||
| Alliance Data Systems | 6,499 | 1,440 | ||||||
| Alphabet, Cl A* | 1,140 | 1,110 | ||||||
| Alphabet, Cl C* | 1,159 | 1,112 | ||||||
| Apple | 10,117 | 1,559 | ||||||
| eBay* | 35,131 | 1,351 | ||||||
| Facebook, Cl A* | 12,870 | 2,199 | ||||||
| Mastercard, Cl A | 10,323 | 1,458 | ||||||
| Trimble* | 17,108 | 671 | ||||||
| Visa, Cl A | 13,288 | 1,398 | ||||||
| 13,741 | ||||||||
| Real Estate – 11.2% | ||||||||
| American Tower REIT, Cl A | 10,998 | 1,503 | ||||||
| CBRE Group, Cl A* | 31,329 | 1,187 | ||||||
| Equinix REIT | 3,439 | 1,535 | ||||||
| Realogy Holdings | 31,842 | 1,049 | ||||||
| 5,274 | ||||||||
| Total Common Stock | ||||||||
| (Cost $29,797) (000) | 46,358 | |||||||
| Total Investments — 98.1% | ||||||||
| (Cost $29,797) (000) | $ | 46,358 | ||||||
As of September 30, 2017, all of the Fund’s investments were considered Level 1 in accordance with the authoritative guidance on fair value measurements and disclosure under GAAP.
For the year ended September 30, 2017, there were no transfers between Level 1 and Level 2 assets and liabilities or between Level 2 and Level 3 assets and liabilities.
| Percentages are based on Net Assets of $47,274 (000). |
| * | Non-income producing security. |
| ** | More narrow industries are utilized for compliance purposes, whereas broad sectors are utilized for reporting purposes. |
| ^ | Traded in Canadian Dollar. |
| (a) | Security considered Master Limited Partnership. At September 30, 2017, these securities amounted to $2,129 (000) or 4.5% of Net Assets. |
ADR — American Depositary Receipt
Cl — Class
LP — Limited Partnership
REIT — Real Estate Investment Trust
The accompanying notes are an integral part of the financial statements.
17
| RiverPark/Wedgewood Fund September 30, 2017 |
| Description | Shares | Value (000) | ||||||
| Schedule of Investments | ||||||||
| Common Stock — 99.2%** | ||||||||
| Consumer Discretionary – 19.7% | ||||||||
| Priceline Group* | 20,000 | $ | 36,616 | |||||
| Ross Stores | 414,000 | 26,732 | ||||||
| TJX | 285,000 | 21,013 | ||||||
| Tractor Supply | 536,000 | 33,924 | ||||||
| 118,285 | ||||||||
| Consumer Staples – 4.8% | ||||||||
| Kraft Heinz | 374,500 | 29,043 | ||||||
| Energy – 9.9% | ||||||||
| Core Laboratories | 263,000 | 25,958 | ||||||
| Schlumberger | 483,500 | 33,729 | ||||||
| 59,687 | ||||||||
| Financials – 11.9% | ||||||||
| Berkshire Hathaway, Cl B* | 280,000 | 51,330 | ||||||
| Charles Schwab | 468,500 | 20,492 | ||||||
| 71,822 | ||||||||
| Health Care – 8.3% | ||||||||
| Celgene* | 127,000 | 18,519 | ||||||
| Edwards Lifesciences* | 287,000 | 31,372 | ||||||
| 49,891 | ||||||||
| Industrials – 9.8% | ||||||||
| Fastenal | 756,500 | 34,481 | ||||||
| Verisk Analytics, Cl A* | 290,000 | 24,125 | ||||||
| 58,606 | ||||||||
| Information Technology – 34.8% | ||||||||
| Alphabet, Cl A* | 44,500 | 43,331 | ||||||
| Apple | 295,000 | 45,465 | ||||||
| Cognizant Technology Solutions, Cl A | 267,500 | 19,404 | ||||||
| PayPal Holdings* | 482,000 | 30,863 | ||||||
| QUALCOMM | 660,000 | 34,214 | ||||||
| Visa, Cl A | 344,500 | 36,255 | ||||||
| 209,532 | ||||||||
| Total Common Stock | ||||||||
| (Cost $404,946) (000) | 596,866 | |||||||
| Total Investments — 99.2% | ||||||||
| (Cost $404,946) (000) | $ | 596,866 | ||||||
As of September 30, 2017, all of the Fund’s investments were considered Level 1 in accordance with the authoritative guidance on fair value measurements and disclosure under GAAP.
For the year ended September 30, 2017, there were no transfers between Level 1 and Level 2 assets and liabilities or between Level 2 and Level 3 assets and liabilities.
| Percentages are based on Net Assets of $601,432 (000). |
| * | Non-income producing security. |
| ** | More narrow industries are utilized for compliance purposes, whereas broad sectors are utilized for reporting purposes. |
Cl — Class
The accompanying notes are an integral part of the financial statements.
18
| RiverPark Short Term High Yield Fund September 30, 2017 |
| Description | Face Amount (000) | Value (000) | ||||||
| Schedule of Investments | ||||||||
| Corporate Obligations — 81.9% | ||||||||
| Consumer Discretionary – 35.8% | ||||||||
| 1011778 BC ULC/New Red Finance | ||||||||
| 6.000%, 04/01/22 (a) | $ | 45,616 | $ | 47,081 | ||||
| Caesars Entertainment Resort Properties | ||||||||
| 8.000%, 10/01/20 | 10,000 | 10,250 | ||||||
| Chester Downs & Marina | ||||||||
| 9.250%, 02/01/20 (a) | 4,082 | 4,153 | ||||||
| DISH DBS | ||||||||
| 4.250%, 04/01/18 | 20,912 | 21,121 | ||||||
| Golden Nugget | ||||||||
| 8.500%, 12/01/21 (a) | 31,451 | 33,164 | ||||||
| International Automotive Components Group | ||||||||
| 9.125%, 06/01/18 (a) | 23,642 | 23,701 | ||||||
| Lennar | ||||||||
| 4.750%, 12/15/17 | 19,028 | 19,075 | ||||||
| MHGE Parent | ||||||||
| 8.500% cash/9.250% PIK, 08/01/19 (a) | 20,887 | 20,939 | ||||||
| Michaels Stores | ||||||||
| 5.875%, 12/15/20 (a) | 17,516 | 17,932 | ||||||
| NAI Entertainment Holdings | ||||||||
| 5.000%, 08/01/18 (a) | 17,277 | 17,346 | ||||||
| Nathan's Famous | ||||||||
| 10.000%, 03/15/20 (a) | 19,500 | 20,451 | ||||||
| Staples | ||||||||
| 3.750%, 01/12/18 | 5,344 | 5,353 | ||||||
| Station Casinos | ||||||||
| 7.500%, 03/01/21 | 31,886 | 33,162 | ||||||
| TEGNA | ||||||||
| 5.125%, 10/15/19 | 9,615 | 9,771 | ||||||
| Viking Cruises | ||||||||
| 8.500%, 10/15/22 (a) | 25,300 | 26,468 | ||||||
| 309,967 | ||||||||
| Consumer Staples – 7.2% | ||||||||
| DS Services of America | ||||||||
| 10.000%, 09/01/21 (a) | 21,607 | 22,903 | ||||||
| HRG Group | ||||||||
| 7.875%, 07/15/19 | 16,338 | 16,669 | ||||||
| Wells Enterprises | ||||||||
| 6.750%, 02/01/20 (a) | 21,892 | 22,576 | ||||||
| 62,148 | ||||||||
| Energy – 4.2% | ||||||||
| Concho Resources | ||||||||
| 5.500%, 10/01/22 | 9,160 | 9,423 | ||||||
| 5.500%, 04/01/23 | 9,669 | 9,950 | ||||||
| Seven Generations Energy | ||||||||
| 8.250%, 05/15/20 (a) | 16,100 | 16,905 | ||||||
| 36,278 | ||||||||
| Health Care – 2.8% | ||||||||
| WebMD Health | ||||||||
| 2.625%, 06/15/23 | 24,609 | 24,621 | ||||||
| Industrials – 4.9% | ||||||||
| Allegion US Holding | ||||||||
| 5.750%, 10/01/21 | 1,525 | 1,569 | ||||||
| Clean Harbors | ||||||||
| 5.250%, 08/01/20 | 3,036 | 3,082 | ||||||
| Cleaver-Brooks | ||||||||
| 8.750%, 12/15/19 (a) | 4,593 | 4,719 | ||||||
| HC2 Holdings | ||||||||
| 11.000%, 12/01/19 (a) | 8,214 | 8,378 | ||||||
| Icahn Enterprises | ||||||||
| 4.875%, 03/15/19 | 14,501 | 14,642 | ||||||
| Nielsen Finance | ||||||||
| 4.500%, 10/01/20 | 9,999 | 10,137 | ||||||
| 42,527 | ||||||||
| Information Technology – 8.6% | ||||||||
| Arrow Electronics | ||||||||
| 3.000%, 03/01/18 | 19,268 | 19,358 | ||||||
| EMC | ||||||||
| 1.875%, 06/01/18 | 200 | 199 | ||||||
| IAC | ||||||||
| 4.875%, 11/30/18 | 9,210 | 9,256 | ||||||
| NXP BV | ||||||||
| 3.750%, 06/01/18 (a) | 5,785 | 5,857 | ||||||
| ViaSat | ||||||||
| 6.875%, 06/15/20 | 38,668 | 39,377 | ||||||
| 74,047 | ||||||||
| Materials – 6.3% | ||||||||
| CEMEX Finance | ||||||||
| 9.375%, 10/12/22 (a) | 365 | 383 | ||||||
| CF Industries | ||||||||
| 6.875%, 05/01/18 | 5,969 | 6,148 | ||||||
The accompanying notes are an integral part of the financial statements.
19
| RiverPark Short Term High Yield Fund September 30, 2017 |
| Description | Face Amount (000)/ Shares | Value (000) | ||||||
| Reynolds Group Issuer | ||||||||
| 5.750%, 10/15/20 | $ | 8,580 | $ | 8,742 | ||||
| Silgan Holdings | ||||||||
| 5.000%, 04/01/20 | 7,582 | 7,705 | ||||||
| Steel Dynamics | ||||||||
| 6.375%, 08/15/22 | 27,780 | 28,692 | ||||||
| 6.375%, 08/15/22 | 2,029 | 2,096 | ||||||
| TMS International | ||||||||
| 7.625%, 10/15/21 (a) | 375 | 390 | ||||||
| 54,156 | ||||||||
| Real estate – 10.8% | ||||||||
| Homefed | ||||||||
| 6.500%, 10/01/19 (a) | 17,489 | 17,489 | ||||||
| iStar | ||||||||
| 4.875%, 07/01/18 ‡ | 7,250 | 7,343 | ||||||
| 4.000%, 11/01/17 ‡ | 36,614 | 36,647 | ||||||
| MPT Operating Partnership | ||||||||
| 6.375%, 02/15/22 ‡ | 31,247 | 32,269 | ||||||
| 93,748 | ||||||||
| Telecommunication Services – 1.3% | ||||||||
| Millicom International Cellular | ||||||||
| 6.625%, 10/15/21 (a) | 10,677 | 11,064 | ||||||
| Utilities – 0.0% | ||||||||
| NRG Energy | ||||||||
| 7.875%, 05/15/21 | 366 | 377 | ||||||
| Total Corporate Obligations | ||||||||
| (Cost $710,558) (000) | 708,933 | |||||||
| Convertible Bonds — 4.0% | ||||||||
| Clearwire Communications | ||||||||
| 8.250%, 12/01/40 (a) | 10,234 | 10,387 | ||||||
| Detour | ||||||||
| 5.500%, 11/30/17 | 1,134 | 1,134 | ||||||
| Starwood Property Trust | ||||||||
| 3.750%, 10/15/17 ‡ | 23,035 | 23,035 | ||||||
| Total Convertible Bonds | ||||||||
| (Cost $34,780) (000) | 34,556 | |||||||
| Preferred Stock — 2.9% | ||||||||
| Apollo Investment | ||||||||
| 6.625%, 10/15/42 | 62,265 | 1,557 | ||||||
| Colony NorthStar | ||||||||
| 8.875%‡ | 68,786 | 1,742 | ||||||
| Georgia Power | ||||||||
| 6.500% | 28,564 | 2,865 | ||||||
| M/I Homes | ||||||||
| 9.750% | 56,415 | 1,421 | ||||||
| NextEra Energy Capital Holdings | ||||||||
| 5.700%, 03/01/72 | 364,811 | 9,189 | ||||||
| 5.625%, 06/15/72 | 2,300 | 58 | ||||||
| Pennsylvania Real Estate Investment Trust | ||||||||
| 8.250%‡ | 78,427 | 1,973 | ||||||
| TCF Financial | ||||||||
| 7.500% | 28,294 | 718 | ||||||
| Urstadt Biddle Properties | ||||||||
| 7.125%‡ | 200,747 | 5,093 | ||||||
| Total Preferred Stock | ||||||||
| (Cost $24,620) (000) | 24,616 | |||||||
| Bank Loan Obligations — 8.8% | ||||||||
| Dell International | ||||||||
| 3.200%, VAR LIBOR USD 1 Month+2.000%, 12/31/18 | 29,000 | 28,991 | ||||||
| Eastman Kodak | ||||||||
| 7.507%, VAR LIBOR USD 3 Month +6.250%, 09/03/19 | 14,914 | 14,681 | ||||||
| Lee Enterprises | ||||||||
| 7.489%, VAR LIBOR USD 1 Month +6.250%, 03/31/19 | 3,450 | 3,450 | ||||||
| Reddy Ice | ||||||||
| 8.750%, VAR PRIME +4.500%, 04/01/19 | 23 | 23 | ||||||
| 6.875%, VAR LIBOR USD 1 Month +5.500%, 04/01/19 | 7,725 | 7,586 | ||||||
| SunEdison | ||||||||
| 8.735%, VAR LIBOR USD 1 Month +7.500%, 05/02/18 | 21,350 | 21,323 | ||||||
| Total Bank Loan Obligations | ||||||||
| (Cost $76,452) (000) | 76,054 | |||||||
| Total Investments — 97.6% | ||||||||
| (Cost $846,410) (000) | $ | 844,159 | ||||||
The accompanying notes are an integral part of the financial statements.
20
| RiverPark Short Term High Yield Fund September 30, 2017 |
The following is a list of the inputs used as of September 30, 2017 in valuing the Fund’s investments, securities sold short, not yet purchased and other financial instruments carried at value (000), in accordance with the authoritative guidance on fair value measurements and disclosure under U.S. GAAP:
| Investments in Securities | Level 1 | Level 2 | Level 3 | Total | ||||||||||||
| Corporate Obligations | $ | — | $ | 708,933 | $ | — | $ | 708,933 | ||||||||
| Convertible Bonds | — | 34,556 | — | 34,556 | ||||||||||||
| Preferred Stock | 24,616 | — | — | 24,616 | ||||||||||||
| Bank Loan Obligations | — | 76,054 | — | 76,054 | ||||||||||||
| Total Investments in Securities | $ | 24,616 | $ | 819,543 | $ | — | $ | 844,159 | ||||||||
For the year ended September 30, 2017, there were no transfers between Level 1 and Level 2 assets and liabilities or between Level 2 and Level 3 assets and liabilities.
| Percentages are based on Net Assets of $865,148 (000). |
| (a) | Securities sold within terms of a private placement memorandum, exempt from registration under Section 144A of the Securities Act of 1933, as amended, and may be sold only to dealers in that program or other “accredited investors.” These securities have been determined to be liquid under guidelines established by the Board of Trustees. |
| ‡ | Real Estate Investment Trust |
PIK — Payment-in-Kind
LIBOR — London Interbank Offered Rate
USD — United States Dollar
VAR — Variable Rate
The accompanying notes are an integral part of the financial statements.
21
| RiverPark Long/Short Opportunity Fund September 30, 2017 |
| Description | Shares | Value (000) | ||||||
| Schedule of Investments | ||||||||
| Common Stock — 93.1%** | ||||||||
| Consumer Discretionary – 24.9% | ||||||||
| adidas ADR | 9,857 | $ | 1,116 | |||||
| Amazon.com* | 3,761 | 3,616 | ||||||
| CarMax* (a) | 37,195 | 2,820 | ||||||
| Chipotle Mexican Grill, Cl A* | 3,186 | 981 | ||||||
| Dollar Tree* (a) | 29,318 | 2,545 | ||||||
| Dollarama ^ | 23,970 | 2,623 | ||||||
| Las Vegas Sands (a) | 3,743 | 240 | ||||||
| NIKE, Cl B (a) | 31,165 | 1,616 | ||||||
| Priceline Group* (b) | 1,476 | 2,702 | ||||||
| Starbucks (b) | 32,832 | 1,763 | ||||||
| Ulta Beauty* | 7,087 | 1,602 | ||||||
| Walt Disney (a) (b) | 3,736 | 368 | ||||||
| 21,992 | ||||||||
| Energy – 1.5% | ||||||||
| EOG Resources (a) | 5,593 | 541 | ||||||
| Southwestern Energy* (a) (b) | 132,376 | 809 | ||||||
| 1,350 | ||||||||
| Financials – 21.3% | ||||||||
| Affiliated Managers Group | 7,180 | 1,363 | ||||||
| BlackRock, Cl A | 3,055 | 1,366 | ||||||
| Charles Schwab | 88,189 | 3,857 | ||||||
| CME Group, Cl A (a) | 14,052 | 1,907 | ||||||
| Intercontinental Exchange | 33,468 | 2,299 | ||||||
| TD Ameritrade Holding | 60,916 | 2,973 | ||||||
| The Blackstone Group LP (b) (c) | 151,241 | 5,047 | ||||||
| 18,812 | ||||||||
| Health Care – 7.4% | ||||||||
| Align Technology* | 9,590 | 1,786 | ||||||
| Illumina* | 8,656 | 1,724 | ||||||
| Intuitive Surgical* (b) | 1,733 | 1,813 | ||||||
| Pacira Pharmaceuticals* | 32,624 | 1,225 | ||||||
| 6,548 | ||||||||
| Information Technology – 27.1% | ||||||||
| Adobe Systems* | 18,212 | 2,717 | ||||||
| Alliance Data Systems (a) | 8,701 | 1,927 | ||||||
| Alphabet, Cl A* (a) (b) | 2,090 | 2,035 | ||||||
| Alphabet, Cl C* (a) (b) | 1,714 | 1,644 | ||||||
| Apple (a) (b) | 16,332 | 2,517 | ||||||
| eBay* (a) | 48,342 | 1,859 | ||||||
| Facebook, Cl A* | 27,165 | 4,642 | ||||||
| Mastercard, Cl A (b) | 20,693 | 2,922 | ||||||
| Trimble* (b) | 44,940 | 1,764 | ||||||
| Visa, Cl A (a) (b) | 18,348 | 1,931 | ||||||
| 23,958 | ||||||||
| Materials – 1.5% | ||||||||
| Monsanto (b) | 11,155 | 1,337 | ||||||
| Real Estate – 9.4% | ||||||||
| American Tower REIT, Cl A (a) (b) | 15,942 | 2,179 | ||||||
| CBRE Group, Cl A* | 72,622 | 2,751 | ||||||
| Equinix REIT (b) | 7,686 | 3,430 | ||||||
| 8,360 | ||||||||
| Total Common Stock | ||||||||
| (Cost $51,464) (000) | 82,357 | |||||||
| Total Investments — 93.1% | ||||||||
| (Cost $51,464) (000) | $ | 82,357 | ||||||
| Schedule of Securities Sold Short, Not Yet Purchased | ||||||||
| Common Stock — (62.0)%** | ||||||||
| Consumer Discretionary – (27.5)% | ||||||||
| Best Buy | (26,736 | ) | $ | (1,523 | ) | |||
| BJ's Restaurants* | (28,057 | ) | (854 | ) | ||||
| Coach | (37,211 | ) | (1,499 | ) | ||||
| Columbia Sportswear | (21,649 | ) | (1,333 | ) | ||||
| Darden Restaurants | (8,334 | ) | (657 | ) | ||||
| Dick's Sporting Goods | (14,966 | ) | (404 | ) | ||||
| Discovery Communications, Cl A* | (58,261 | ) | (1,240 | ) | ||||
| Gap | (62,926 | ) | (1,858 | ) | ||||
| Garmin | (34,115 | ) | (1,841 | ) | ||||
| Harley-Davidson | (27,507 | ) | (1,326 | ) | ||||
| Kohl's | (24,066 | ) | (1,099 | ) | ||||
| Lululemon Athletica* | (11,541 | ) | (719 | ) | ||||
| Nordstrom | (9,403 | ) | (443 | ) | ||||
| Omnicom Group | (17,154 | ) | (1,271 | ) | ||||
| Publicis Groupe | (18,536 | ) | (1,294 | ) | ||||
| Red Robin Gourmet Burgers* | (16,794 | ) | (1,125 | ) | ||||
| Sonic | (38,562 | ) | (981 | ) | ||||
| Sony ADR | (28,077 | ) | (1,049 | ) | ||||
| Target | (17,996 | ) | (1,062 | ) | ||||
| Under Armour, Cl C* | (27,419 | ) | (412 | ) | ||||
| VF | (22,060 | ) | (1,402 | ) | ||||
| WPP | (52,733 | ) | (979 | ) | ||||
| (24,371 | ) | |||||||
The accompanying notes are an integral part of the financial statements.
22
| RiverPark Long/Short Opportunity Fund September 30, 2017 |
| Description | Shares | Value (000) | ||||||
| Consumer Staples – (6.8)% | ||||||||
| Coca-Cola | (38,194 | ) | $ | (1,719 | ) | |||
| Costco Wholesale | (7,347 | ) | (1,207 | ) | ||||
| Kroger | (19,834 | ) | (398 | ) | ||||
| Spectrum Brands Holdings | (9,411 | ) | (997 | ) | ||||
| Wal-Mart Stores | (21,786 | ) | (1,702 | ) | ||||
| (6,023 | ) | |||||||
| Health Care – (1.3)% | ||||||||
| Cerner* | (15,650 | ) | (1,116 | ) | ||||
| Industrials – (1.5)% | ||||||||
| Nielsen Holdings | (30,976 | ) | (1,284 | ) | ||||
| Information Technology – (12.8)% | ||||||||
| Cars.com* | (13,210 | ) | (351 | ) | ||||
| Cimpress* | (14,761 | ) | (1,442 | ) | ||||
| CommScope Holding* | (27,289 | ) | (906 | ) | ||||
| Corning | (61,933 | ) | (1,853 | ) | ||||
| Flex* | (117,489 | ) | (1,947 | ) | ||||
| International Business Machines | (12,361 | ) | (1,793 | ) | ||||
| j2 Global | (14,665 | ) | (1,083 | ) | ||||
| Western Union | (80,593 | ) | (1,548 | ) | ||||
| Zillow Group, Cl A* | (10,555 | ) | (424 | ) | ||||
| (11,347 | ) | |||||||
| Real Estate – (6.9)% | ||||||||
| GGP REIT | (62,883 | ) | (1,306 | ) | ||||
| Iron Mountain REIT | (50,952 | ) | (1,982 | ) | ||||
| Macerich REIT | (25,028 | ) | (1,376 | ) | ||||
| Simon Property Group REIT | (8,924 | ) | (1,437 | ) | ||||
| (6,101 | ) | |||||||
| Telecommunication Services – (5.2)% | ||||||||
| AT&T | (41,261 | ) | (1,616 | ) | ||||
| Cogent Communications Holdings | (25,385 | ) | (1,241 | ) | ||||
| Verizon Communications | (34,806 | ) | (1,723 | ) | ||||
| (4,580 | ) | |||||||
| Total Common Stock | ||||||||
| (Proceeds $51,155) (000) | (54,822 | ) | ||||||
| Total Securities Sold Short, Not Yet Purchased | ||||||||
| (Proceeds $51,155) (000) | $ | (54,822 | ) | |||||
The following is a list of the inputs used as of September 30, 2017 in valuing the Fund’s investments, securities sold short, not yet purchased and other financial instruments carried at value (000), in accordance with the authoritative guidance on fair value measurements and disclosure under U.S. GAAP:
| Investments in Securities | Level 1 | Level 2 | Level 3 | Total | ||||||||||||
| Common Stock | $ | 82,357 | $ | — | $ | — | $ | 82,357 | ||||||||
| Total Investments in Securities | $ | 82,357 | $ | — | $ | — | $ | 82,357 | ||||||||
| Securities Sold Short, Not Yet Purchased | Level 1 | Level 2 | Level 3 | Total | ||||||||||||
| Common Stock | $ | (54,822 | ) | $ | — | $ | — | $ | (54,822 | ) | ||||||
| Total Securities Sold Short, Not Yet Purchased | $ | (54,822 | ) | $ | — | $ | — | $ | (54,822 | ) | ||||||
| Other Financial Instruments | Level 1 | Level 2 | Level 3 | Total | ||||||||||||
| Total Return Swaps^ | $ | — | $ | — | $ | — | $ | — | ||||||||
| Total Other Financial Instruments | $ | — | $ | — | $ | — | $ | — | ||||||||
| ^ | As of September 30, 2017, the swaps are considered Level 2. See Note 2 in Notes to Financial Statements for additional information |
For the year ended September 30, 2017, there were no transfers between Level 1 and Level 2 assets and liabilities or between Level 2 and Level 3 assets and liabilities.
The accompanying notes are an integral part of the financial statements.
23
| RiverPark Long/Short Opportunity Fund September 30, 2017 |
A list of open swap agreements held by the Fund at September 30, 2017 was as follows:
| Total Return Swaps | |||||||||||||||||
| Counterparty | Reference Entity/ Obligation | Fund Pays | Fund Receives | Payment Frequency | Termination Date | Notional Amount (000) | Value (000) | Net Unrealized Appreciation (Depreciation) (000) | |||||||||
| Goldman Sachs International | Alliance Data Systems | LIBOR 1-Month - 0.50% | Total Return | Monthly | 02/06/2018 | $ | 1,153 | $ | 1,133 | $ | — | ||||||
| Goldman Sachs International | Alliance Data Systems | Fed Funds 1-Day - 0.45% | Total Return | Monthly | 09/13/2018 | 463 | 478 | — | |||||||||
| Goldman Sachs International | Alphabet, Cl A | LIBOR 1-Month - 0.50% | Total Return | Monthly | 09/11/2018 | 54 | 56 | — | |||||||||
| Goldman Sachs International | Alphabet, Cl C | LIBOR 1-Month - 0.50% | Total Return | Monthly | 09/11/2018 | 431 | 445 | — | |||||||||
| Goldman Sachs International | American Tower | Fed Funds 1-Day - 0.45% | Total Return | Monthly | 10/13/2017 | 1,273 | 1,175 | — | |||||||||
| Goldman Sachs International | Apple | Fed Funds 1-Day - 0.45% | Total Return | Monthly | 09/07/2018 | 442 | 416 | — | |||||||||
| Goldman Sachs International | CarMax | LIBOR 1-Month - 0.50% | Total Return | Monthly | 04/18/2018 | 715 | 807 | — | |||||||||
| Goldman Sachs International | CME Group | Fed Funds 1-Day - 0.45% | Total Return | Monthly | 10/13/2017 | 1,295 | 1,397 | — | |||||||||
| Goldman Sachs International | Dollar Tree | Fed Funds 1-Day - 0.45% | Total Return | Monthly | 10/12/2017 | 138 | 150 | — | |||||||||
| Goldman Sachs International | Dollar Tree | LIBOR 1-Month - 0.50% | Total Return | Monthly | 02/22/2018 | 1,228 | 1,339 | — | |||||||||
| Goldman Sachs International | Dollar Tree | LIBOR 1-Month - 0.50% | Total Return | Monthly | 02/22/2018 | 239 | 261 | — | |||||||||
| Goldman Sachs International | eBay | Fed Funds 1-Day - 0.45% | Total Return | Monthly | 06/14/2018 | 796 | 848 | — | |||||||||
| Goldman Sachs International | EOG Resources | LIBOR 1-Month - 0.50% | Total Return | Monthly | 04/18/2018 | 1,283 | 1,460 | — | |||||||||
| Goldman Sachs International | Las Vegas Sands | LIBOR 1-Month - 0.50% | Total Return | Monthly | 02/22/2018 | 1,805 | 1,861 | — | |||||||||
| Goldman Sachs International | Las Vegas Sands | LIBOR 1-Month - 0.50% | Total Return | Monthly | 09/11/2018 | 1,116 | 1,132 | — | |||||||||
| Goldman Sachs International | Nike | LIBOR 1-Month - 0.50% | Total Return | Monthly | 04/18/2018 | 487 | 478 | — | |||||||||
| Goldman Sachs International | Realogy Holdings | LIBOR 1-Month - 0.50% | Total Return | Monthly | 08/17/2018 | 2,624 | 2,551 | — | |||||||||
| Goldman Sachs International | Schlumberger | LIBOR 1-Month - 0.50% | Total Return | Monthly | 09/05/2018 | 610 | 670 | — | |||||||||
| Goldman Sachs International | Schlumberger | LIBOR 1-Month - 0.50% | Total Return | Monthly | 08/02/2018 | 1.135 | 1,247 | — | |||||||||
| Goldman Sachs International | Southwestern Energy | LIBOR 1-Month - 0.50% | Total Return | Monthly | 02/23/2018 | 157 | 175 | — | |||||||||
| Goldman Sachs International | Southwestern Energy | Fed Funds 1-Day - 0.45% | Total Return | Monthly | 06/14/2018 | 388 | 435 | — | |||||||||
| Goldman Sachs International | Southwestern Energy | LIBOR 1-Month - 0.50% | Total Return | Monthly | 08/17/2018 | 398 | 447 | — | |||||||||
| Goldman Sachs International | Visa | LIBOR 1-Month - 0.50% | Total Return | Monthly | 02/13/2018 | 66 | 67 | — | |||||||||
| Goldman Sachs International | Visa | Fed Funds 1-Day - 0.45% | Total Return | Monthly | 06/06/2018 | 904 | 919 | — | |||||||||
| Goldman Sachs International | Walt Disney | LIBOR 1-Month - 0.50% | Total Return | Monthly | 09/20/2018 | 3.004 | 3,018 | — | |||||||||
| $ | — | ||||||||||||||||
| Percentages are based on Net Assets of $88,493 (000). |
| * | Non-income producing security. |
| ** | More narrow industries are utilized for compliance purposes, whereas broad sectors are utilized for reporting purposes. |
| ^ | Traded in Canadian Dollar. |
| (a) | Underlying security for a total return swap. |
| (b) | All or a portion of this security has been committed as collateral for open short positions. |
| (c) | Security considered Master Limited Partnership. At September 30, 2017, these securities amounted to $5,047 (000) or 5.7% of Net Assets. |
ADR — American Depositary Receipt
Cl — Class
LIBOR — London Interbank Offered Rate
LP — Limited Partnership
REIT — Real Estate Investment Trust
Amounts designated as “— “ are $0 or rounded to $0.
The accompanying notes are an integral part of the financial statements.
24
| RiverPark Strategic Income Fund September 30, 2017 |
| Description | Face Amount (000) | Value (000) | ||||||
| Schedule of Investments | ||||||||
| Corporate Obligations — 58.8% | ||||||||
| Consumer Discretionary – 22.8% | ||||||||
| Brunswick | ||||||||
| 4.625%, 05/15/21 (a) | $ | 7,016 | $ | 7,151 | ||||
| Chester Downs & Marina | ||||||||
| 9.250%, 02/01/20 (a) | 6,087 | 6,193 | ||||||
| Coach | ||||||||
| 4.250%, 04/01/25 (f) | 5,614 | 5,796 | ||||||
| 4.125%, 07/15/27 (f) | 638 | 643 | ||||||
| 3.000%, 07/15/22 (f) | 638 | 638 | ||||||
| Comcast | ||||||||
| 3.300%, 02/01/27 (f) | 314 | 319 | ||||||
| 3.000%, 02/01/24 (f) | 157 | 159 | ||||||
| Dollar Tree | ||||||||
| 5.750%, 03/01/23 | 4,933 | 5,229 | ||||||
| DPH Holdings | ||||||||
| 6.550%, 06/15/06 (b) | 96,848 | — | ||||||
| Ford Motor Credit | ||||||||
| 2.100%, VAR ICE LIBOR USD 3 Month+0.790%, 06/12/20 | 13,278 | 13,299 | ||||||
| Hot Topic | ||||||||
| 9.250%, 06/15/21 (a) | 1,276 | 1,083 | ||||||
| International Automotive Components Group | ||||||||
| 9.125%, 06/01/18 (a) | 11,673 | 11,702 | ||||||
| LBI Media | ||||||||
| 10.000%, 04/15/19 (a) | 4,628 | 4,628 | ||||||
| McGraw-Hill Global Education Holdings | ||||||||
| 7.875%, 05/15/24 (a) | 1,646 | 1,630 | ||||||
| MHGE Parent | ||||||||
| 8.500% cash/9.250% PIK, 08/01/19 (a) | 10,419 | 10,445 | ||||||
| Michaels Stores | ||||||||
| 5.875%, 12/15/20 (a) | 8,759 | 8,967 | ||||||
| Postmedia Network | ||||||||
| 8.250%, 07/15/21 (a) | 1,803 | 1,243 | ||||||
| Ruby Tuesday | ||||||||
| 7.625%, 05/15/20 | 2,977 | 2,962 | ||||||
| Salem Media Group | ||||||||
| 6.750%, 06/01/24 (a) | 821 | 858 | ||||||
| Sirius XM Radio | ||||||||
| 5.000%, 08/01/27 (a) | 2,362 | 2,421 | ||||||
| SiTV | ||||||||
| 10.375%, 07/01/19 (a) | 6,315 | 4,310 | ||||||
| TEGNA | ||||||||
| 5.125%, 10/15/19 | 4,298 | 4,368 | ||||||
| Walt Disney | ||||||||
| 2.950%, 06/15/27 (f) | 319 | 319 | ||||||
| 94,363 | ||||||||
| Consumer Staples – 8.1% | ||||||||
| BI-LO | ||||||||
| 9.250%, 02/15/19 (a) | 6,709 | 6,139 | ||||||
| Carolina Beverage Group | ||||||||
| 10.625%, 08/01/18 (a) | 7,196 | 7,295 | ||||||
| DS Services of America | ||||||||
| 10.000%, 09/01/21 (a) | 10,658 | 11,297 | ||||||
| Fresh Market | ||||||||
| 9.750%, 05/01/23 (a) | 3,439 | 2,132 | ||||||
| Simmons Foods | ||||||||
| 7.875%, 10/01/21 (a) | 2,094 | 2,226 | ||||||
| Southern States Cooperative | ||||||||
| 10.000%, 08/15/21 (a) | 4,318 | 4,318 | ||||||
| 33,407 | ||||||||
| Energy – 3.6% | ||||||||
| Crestwood Midstream Partners | ||||||||
| 6.250%, 04/01/23 | 3,505 | 3,632 | ||||||
| Express Pipeline | ||||||||
| 7.390%, 12/31/17 (a) | 69 | 70 | ||||||
| Golar LNG Partners | ||||||||
| 5.715%, VAR ICE LIBOR USD 3 Month+4.400%, 05/22/20 | 3,800 | 3,667 | ||||||
| Jones Energy Holdings | ||||||||
| 9.250%, 03/15/23 | 2,855 | 2,384 | ||||||
| McDermott International | ||||||||
| 8.000%, 05/01/21 (a) | 1,728 | 1,793 | ||||||
| Sanjel | ||||||||
| 7.500%, 06/19/19 (a) (b) | 2,700 | 14 | ||||||
| Westmoreland Coal | ||||||||
| 8.750%, 01/01/22 (a) | 4,664 | 3,381 | ||||||
| 14,941 | ||||||||
| Financials – 0.2% | ||||||||
| Toll Road Investors Partnership | ||||||||
| 5.414%, 02/15/45 (a) (c) | 3,721 | 908 | ||||||
The accompanying notes are an integral part of the financial statements.
25
| RiverPark Strategic Income Fund September 30, 2017 |
| Description | Face Amount (000) | Value (000) | ||||||
| Industrials – 14.5% | ||||||||
| America West Airlines Pass Through Trust, Ser 2000-1 | ||||||||
| 8.057%, 07/02/20 | $ | 261 | $ | 295 | ||||
| Continental Airlines Pass-Through Trust, Ser 2000-2, Cl A1 | ||||||||
| 7.707%, 04/02/21 | 1,096 | 1,185 | ||||||
| Continental Airlines Pass-Through Trust, Ser 1999-2, Cl C2 | ||||||||
| 6.236%, 03/15/20 | 209 | 218 | ||||||
| Continental Airlines Pass-Through Trust, Ser 2007-1, Cl A | ||||||||
| 5.983%, 04/19/22 | 716 | 790 | ||||||
| Euronav Luxembourg | ||||||||
| 7.500%, 05/31/22 (a) | 1,000 | 981 | ||||||
| HC2 Holdings | ||||||||
| 11.000%, 12/01/19 (a) | 11,216 | 11,440 | ||||||
| International Wire Group Holdings | ||||||||
| 10.750%, 08/01/21 (a) | 683 | 634 | ||||||
| Mueller Industries | ||||||||
| 6.000%, 03/01/27 | 18,712 | 19,367 | ||||||
| Spirit AeroSystems | ||||||||
| 5.250%, 03/15/22 | 10,610 | 11,025 | ||||||
| Stolt-Nielsen | ||||||||
| 6.375%, 09/21/22 | 6,700 | 6,667 | ||||||
| Techniplas | ||||||||
| 10.000%, 05/01/20 (a) | 843 | 594 | ||||||
| Triumph Group | ||||||||
| 7.750%, 08/15/25 (a) | 1,243 | 1,311 | ||||||
| Waste Italia | ||||||||
| 10.500%, 11/15/19 (a) (b) (e) | 4,585 | 461 | ||||||
| Xerium Technologies | ||||||||
| 9.500%, 08/15/21 | 4,645 | 4,819 | ||||||
| 59,787 | ||||||||
| Information Technology – 0.3% | ||||||||
| Apple | ||||||||
| 1.811%, VAR ICE LIBOR USD 3 Month+0.500%, 02/09/22 (f) | 627 | 636 | ||||||
| j2 Cloud Services | ||||||||
| 6.000%, 07/15/25 (a) | 638 | 671 | ||||||
| 1,307 | ||||||||
| Materials – 4.0% | ||||||||
| Hexion | ||||||||
| 13.750%, 02/01/22 (a) | 2,697 | 2,225 | ||||||
| 10.375%, 02/01/22 (a) | 4,230 | 4,082 | ||||||
| 10.000%, 04/15/20 | 1,887 | 1,816 | ||||||
| INVISTA Finance | ||||||||
| 4.250%, 10/15/19 (a) | 1,831 | 1,895 | ||||||
| Kraton Polymers | ||||||||
| 10.500%, 04/15/23 (a) | 2,131 | 2,445 | ||||||
| Real Alloy Holding | ||||||||
| 10.000%, 01/15/19 (a) | 4,058 | 3,835 | ||||||
| 16,298 | ||||||||
| Real Estate – 2.9% | ||||||||
| Avison Young Canada | ||||||||
| 9.500%, 12/15/21 (a) | 1,165 | 1,181 | ||||||
| Crescent Communities | ||||||||
| 8.875%, 10/15/21 (a) | 2,383 | 2,538 | ||||||
| Homefed | ||||||||
| 6.500%, 10/01/19 (a) | 8,378 | 8,378 | ||||||
| 12,097 | ||||||||
| Telecommunication Services – 2.4% | ||||||||
| SBA Tower Trust | ||||||||
| 3.598%, 04/10/18 (a) | 6,024 | 6,020 | ||||||
| T-Mobile USA | ||||||||
| 6.125%, 01/15/22 | 3,826 | 3,989 | ||||||
| 10,009 | ||||||||
| Total Corporate Obligations | ||||||||
| (Cost $252,715) (000) | 243,117 | |||||||
| Commercial Paper (c) — 19.8% | ||||||||
| Boston Scientific | ||||||||
| 1.602%, 10/10/17 | 8,900 | 8,896 | ||||||
| 1.602%, 10/18/17 | 4,161 | 4,158 | ||||||
| Kansas City Southern | ||||||||
| 1.652%, 10/05/17 | 8,795 | 8,792 | ||||||
| Marriott International | ||||||||
| 1.381%, 10/04/17 | 3,100 | 3,099 | ||||||
| Molson Coors Brewing | ||||||||
| 1.552%, 10/19/17 | 7,855 | 7,849 | ||||||
| 1.552%, 10/13/17 | 6,550 | 6,547 | ||||||
| Mondelez International | ||||||||
| 1.402%, 10/18/17 | 8,375 | 8,369 | ||||||
| NetApp | ||||||||
| 1.381%, 10/06/17 | 10,475 | 10,472 | ||||||
| ONEOK | ||||||||
| 1.872%, 10/17/17 | 4,161 | 4,158 | ||||||
| 1.872%, 10/04/17 | 4,161 | 4,160 | ||||||
| Waste Management | ||||||||
| 1.401%, 10/13/17 | 5,234 | 5,231 | ||||||
| 1.381%, 10/10/17 | 5,234 | 5,232 | ||||||
| Wyndham Worldwide | ||||||||
| 1.851%, 10/05/17 | 4,698 | 4,697 | ||||||
| Total Commercial Paper | ||||||||
| (Cost $81,664) (000) | 81,660 | |||||||
The accompanying notes are an integral part of the financial statements.
26
| RiverPark Strategic Income Fund September 30, 2017 |
| Description | Face Amount (000)/ Shares | Value (000) | ||||||
| Convertible Bonds — 2.0% | ||||||||
| Clearwire Communications | ||||||||
| 8.250%, 12/01/40 (a) | $ | 4,320 | $ | 4,385 | ||||
| ModusLink Global Solutions | ||||||||
| 5.250%, 03/01/19 | 698 | 676 | ||||||
| Prospect Capital | ||||||||
| 5.750%, 03/15/18 | 3,135 | 3,180 | ||||||
| Total Convertible Bonds | ||||||||
| (Cost $8,258) (000) | 8,241 | |||||||
| Preferred Stock — 0.2% | ||||||||
| Farmland Partners | ||||||||
| 6.000%, 09/30/24 | 30,752 | 833 | ||||||
| Total Preferred Stock | ||||||||
| (Cost $769) (000) | 833 | |||||||
| Bank Loan Obligations — 13.7% | ||||||||
| Appvion | ||||||||
| 7.750%, VAR LIBOR USD 1 Month +6.500%, 06/28/19 | 3,660 | 3,550 | ||||||
| Dell | ||||||||
| 3.740%, VAR LIBOR USD 1 Month +2.500%, 09/07/23 | 9,303 | 9,332 | ||||||
| 3.490%, VAR LIBOR USD 1 Month +2.250%, 09/07/21 | 3,417 | 3,419 | ||||||
| Eastman Kodak | ||||||||
| 7.507%, VAR LIBOR USD 3 Month +6.250%, 09/03/19 | 5,502 | 5,416 | ||||||
| Envigo Holdings | ||||||||
| 9.800%, VAR LIBOR USD 1 Month +8.500%, 10/31/21 | 3,716 | 3,697 | ||||||
| Fram Group Holdings | ||||||||
| 7.989%, VAR LIBOR USD 1 Month +6.750%, 12/23/21 | 3,501 | 3,528 | ||||||
| FXI Holdings | ||||||||
| 0.000%, 12/31/18 (d) | 12,323 | — | ||||||
| Hampton Rubber | ||||||||
| 5.235%, VAR LIBOR USD 1 Month +4.000%, 03/27/21 | 2,790 | 2,560 | ||||||
| Internap | ||||||||
| 8.240%, VAR LIBOR USD 1 Month +7.000%, 04/03/22 | 5,660 | 5,702 | ||||||
| Kingpin Holdings | ||||||||
| 5.570%, VAR LIBOR USD 1 Month +4.250%, 06/29/24 | 1,272 | 1,276 | ||||||
| Lee Enterprises | ||||||||
| 12.000%, 12/15/22 | 3,168 | 3,263 | ||||||
| 7.489%, VAR LIBOR USD 1 Month +6.250%, 03/31/19 | 474 | 474 | ||||||
| LSC Communications | ||||||||
| 7.239%, VAR LIBOR+6.000%, 09/30/22 | 4,047 | 4,062 | ||||||
| Melissa & Doug | ||||||||
| 5.833%, VAR LIBOR USD 3 Month +4.500%, 06/19/24 | 2,544 | 2,572 | ||||||
| Optima Specialty Steel | ||||||||
| 11.100%, 10/31/17 | 2,118 | 2,118 | ||||||
| Reddy Ice | ||||||||
| 8.750%, PRIME +4.500%, 04/01/19 | 16 | 16 | ||||||
| 6.875%, VAR LIBOR USD 1 Month +5.500%, 04/01/19 | 5,415 | 5,318 | ||||||
| Travel Leaders Group | ||||||||
| 5.814%, VAR LIBOR USD 1 Month +4.500%, 01/25/24 | 311 | 315 | ||||||
| Total Bank Loan Obligations | ||||||||
| (Cost $56,370) (000) | 56,618 | |||||||
| Total Investments — 94.5% | ||||||||
| (Cost $399,776) (000) | $ | 390,469 | ||||||
| Schedule of Securities Sold Short, Not Yet Purchased | ||||||||
| Corporate Obligations — (3.3)% | ||||||||
| Consumer Discretionary – (1.2)% | ||||||||
| L Brands | ||||||||
| 5.625%, 10/15/23 | (2,000 | ) | $ | (2,138 | ) | |||
| Mattel | ||||||||
| 3.150%, 03/15/23 | (2,000 | ) | (1,971 | ) | ||||
| Target | ||||||||
| 3.500%, 07/01/24 | (1,000 | ) | (1,047 | ) | ||||
| (5,156 | ) | |||||||
| Consumer Staples – (0.3)% | ||||||||
| Conagra Brands | ||||||||
| 7.125%, 10/01/26 | (1,000 | ) | (1,236 | ) | ||||
| Financials – (0.5)% | ||||||||
| Barclays | ||||||||
| 5.200%, 05/12/26 | (2,000 | ) | (2,138 | ) | ||||
| Industrials – (0.7)% | ||||||||
| Covanta Holding | ||||||||
| 5.875%, 03/01/24 | (2,000 | ) | (1,990 | ) | ||||
| WW Grainger | ||||||||
| 4.600%, 06/15/45 | (1,000 | ) | (1,080 | ) | ||||
| (3,070 | ) | |||||||
| Information Technology – (0.3)% | ||||||||
| Lam Research | ||||||||
| 3.800%, 03/15/25 | (1,000 | ) | (1,034 | ) | ||||
The accompanying notes are an integral part of the financial statements.
27
| RiverPark Strategic Income Fund September 30, 2017 |
| Description | Face Amount (000)/ Shares | Value (000) | ||||||
| Real Estate – (0.3)% | ||||||||
| DDR | ||||||||
| 4.700%, 06/01/27 ‡ | $ | (1,000 | ) | $ | (1,032 | ) | ||
| Total Corporate Obligations | ||||||||
| (Proceeds $13,494) (000) | (13,666 | ) | ||||||
| Exchange-Traded Fund — (1.1)% | ||||||||
| iShares iBoxx $ High Yield Corporate Bond ETF | (50,000 | ) | (4,438 | ) | ||||
| Total Exchange-Traded Fund | ||||||||
| (Proceeds $4,420) (000) | (4,438 | ) | ||||||
| Total Securities Sold Short, Not Yet Purchased | ||||||||
| (Proceeds $17,914) (000) | $ | (18,104 | ) | |||||
A list of the open forward foreign currency contracts held by the Fund at September 30, 2017 is as follows*:
| Counterparty | Settlement Date | Currency to Deliver (000) | Currency to Receive (000) | Unrealized Appreciation (000) | |||||||
| Brown Brothers Harriman | 10/5/17 | CAD | 1,860 | USD | 1,502 | $ | 12 | ||||
| Brown Brothers Harriman | 10/5/17 | EUR | 367 | USD | 437 | 3 | |||||
| $ | 15 | ||||||||||
| * | See Note 2 in Notes to Financial Statements for additional information. |
The following is a list of the inputs used as of September 30, 2017 in valuing the Fund’s investments and other financial instruments carried at value (000), in accordance with the authoritative guidance on fair value measurements and disclosure under U.S. GAAP:
| Investments in Securities | Level 1 | Level 2 | Level 3 | Total | ||||||||||||
| Corporate Obligations | $ | — | $ | 243,117 | $ | — | $ | 243,117 | ||||||||
| Commercial Paper | — | 81,660 | — | 81,660 | ||||||||||||
| Convertible Bonds | — | 8,241 | — | 8,241 | ||||||||||||
| Preferred Stock | 833 | — | — | 833 | ||||||||||||
| Bank Loan Obligations | — | 56,618 | — | 56,618 | ||||||||||||
| Total Investments in Securities | $ | 833 | $ | 389,636 | $ | — | $ | 390,469 | ||||||||
| Securities Sold Short, Not Yet Purchased | Level 1 | Level 2 | Level 3 | Total | ||||||||||||
| Corporate Obligations | $ | — | $ | (13,666 | ) | $ | — | $ | (13,666 | ) | ||||||
| Exchange-Traded Fund | (4,438 | ) | — | — | (4,438 | ) | ||||||||||
| Total Securities Sold Short, Not Yet Purchased | $ | (4,438 | ) | $ | (13,666 | ) | $ | — | $ | (18,104 | ) | |||||
| Other Financial Instruments | Level 1 | Level 2 | Level 3 | Total | ||||||||||||
| Forwards** | ||||||||||||||||
| Unrealized Appreciation | $ | 15 | $ | — | $ | — | $ | 15 | ||||||||
| Total Other Financial Instruments | $ | 15 | $ | — | $ | — | $ | 15 | ||||||||
| ** | Forward contracts are valued at the unrealized appreciation on the instrument. See Note 2 in Notes to Financial Statements for additional information. |
For the year ended September 30, 2017, there were no transfers between Level 1 and Level 2 assets and liabilities or between Level 2 and Level 3 assets and liabilities.
| Percentages are based on Net Assets of $413,152 (000). |
| (a) | Securities sold within terms of a private placement memorandum, exempt from registration under Section 144A of the Securities Act of 1933, as amended, and may be sold only to dealers in that program or other “accredited investors.” These securities have been determined to be liquid under guidelines established by the Board of Trustees. |
| (b) | Security in default on interest payments. |
| (c) | Zero coupon security. The rate reported on the Schedule of Investments is the effective yield at time of purchase. |
| (d) | Unfunded loan commitment. |
| (e) | Securities considered illiquid. The total value of such securities as of 9/30/2017 was $461 ($ Thousands) and represented 0.11% of Net Assets. |
| (f) | All or a portion of this security has been committed as collateral for open short positions. |
| ‡ | Real Estate Investment Trust |
CAD — Canadian Dollar
Cl — Class
ETF — Exchange-Traded Fund
EUR — Euro
ICE — Intercontinental Exchange
LIBOR — London Interbank Offered Rate
PIK — Payment-in-Kind
Ser — Series
USD — United States Dollar
VAR — Variable Rate
The accompanying notes are an integral part of the financial statements.
28
| RiverPark Focused Value Fund September 30, 2017 |
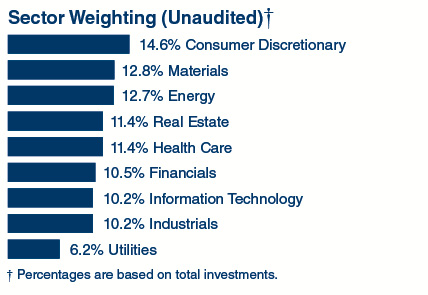
| Description | Shares | Value (000) | ||||||
| Schedule of Investments | ||||||||
| Common Stock — 91.5%** | ||||||||
| Consumer Discretionary – 13.4% | ||||||||
| Las Vegas Sands | 38,300 | $ | 2,457 | |||||
| Liberty Global, Cl A* | 6,000 | 204 | ||||||
| Liberty Global, Cl C* | 52,100 | 1,704 | ||||||
| Liberty Global LiLAC, Cl A* | 9,227 | 219 | ||||||
| Liberty Interactive QVC Group, Cl A* | 49,600 | 1,169 | ||||||
| 5,753 | ||||||||
| Energy – 11.6% | ||||||||
| Magellan Midstream Partners LP (a) | 18,900 | 1,343 | ||||||
| Marathon Petroleum | 65,100 | 3,651 | ||||||
| 4,994 | ||||||||
| Financials – 9.6% | ||||||||
| Ally Financial | 92,400 | 2,241 | ||||||
| The Blackstone Group LP (a) | 56,700 | 1,892 | ||||||
| 4,133 | ||||||||
| Health Care – 10.4% | ||||||||
| Allergan | 6,800 | 1,394 | ||||||
| Anthem | 7,000 | 1,329 | ||||||
| Express Scripts Holding* | 27,800 | 1,760 | ||||||
| 4,483 | ||||||||
| Industrials – 9.3% | ||||||||
| AerCap Holdings* | 39,900 | 2,039 | ||||||
| Macquarie Infrastructure | 27,300 | 1,971 | ||||||
| 4,010 | ||||||||
| Information Technology – 9.3% | ||||||||
| Alliance Data Systems | 7,700 | 1,706 | ||||||
| Broadcom | 5,100 | 1,237 | ||||||
| Western Digital | 12,500 | 1,080 | ||||||
| 4,023 | ||||||||
| Materials – 11.7% | ||||||||
| CF Industries Holdings | 79,200 | 2,785 | ||||||
| LyondellBasell Industries, Cl A | 22,800 | 2,258 | ||||||
| 5,043 | ||||||||
| Real Estate – 10.5% | ||||||||
| American Tower REIT, Cl A | 7,800 | 1,066 | ||||||
| Colony NorthStar REIT, Cl A | 142,400 | 1,789 | ||||||
| Realogy Holdings | 50,200 | 1,654 | ||||||
| 4,509 | ||||||||
| Utilities – 5.7% | ||||||||
| Calpine* | 166,600 | 2,457 | ||||||
| Total Common Stock | ||||||||
| (Cost $36,724) (000) | 39,405 | |||||||
| Total Investments — 91.5% | ||||||||
| (Cost $36,724) (000) | $ | 39,405 | ||||||
As of September 30, 2017, all of the Fund’s investments were considered Level 1 in accordance with the authoritative guidance on fair value measurements and disclosure under GAAP.
For the year ended September 30, 2017, there were no transfers between Level 1 and Level 2 assets and liabilities or between Level 2 and Level 3 assets and liabilities.
| Percentages are based on Net Assets of $43,057 (000). |
| * | Non-income producing security. |
| ** | More narrow industries are utilized for compliance purposes, whereas broad sectors are utilized for reporting purposes. |
| (a) | Security considered Master Limited Partnership. At September 30, 2017, these securities amounted to $3,235 (000) or 7.5% of Net Assets. |
Cl — Class
LP — Limited Partnership
REIT — Real Estate Investment Trust
The accompanying notes are an integral part of the financial statements.
29
Statements of Assets and Liabilities (000) September 30, 2017 | |
| RiverPark Large Growth Fund | RiverPark/ Wedgewood Fund | RiverPark Short Term High Yield Fund | ||||||||||
| Assets: | ||||||||||||
| Investments in Securities, at Value (Note 2) | $ | 46,358 | $ | 596,866 | $ | 844,159 | ||||||
| Cash | 943 | 2,408 | 13,073 | |||||||||
| Receivable for Dividend and Interest Income | 18 | 316 | 13,350 | |||||||||
| Prepaid Expenses | 16 | 31 | 26 | |||||||||
| Receivable for Investment Securities Sold | — | 6,776 | — | |||||||||
| Receivable for Capital Shares Sold | — | 118 | 8,018 | |||||||||
| Total Assets | 47,335 | 606,515 | 878,626 | |||||||||
| Liabilities: | ||||||||||||
| Payable for Capital Shares Redeemed | 2 | 4,386 | 672 | |||||||||
| Income Distribution Payable | — | — | 227 | |||||||||
| Payable for Investment Securities Purchased | — | — | 11,679 | |||||||||
| Payable Due to Adviser (Note 4) | 25 | 354 | 460 | |||||||||
| Payable Due to Shareholder Servicing Agent (Note 4) | 14 | 22 | 98 | |||||||||
| Payable Due to Administrative Services Plan, Retail Class Shares (Note 4) | 6 | 7 | 2 | |||||||||
| Payable Due to Administrative Services Plan, Institutional Class Shares (Note 4) | 3 | 163 | 142 | |||||||||
| Payable Due to Administrator | 2 | 32 | 42 | |||||||||
| Chief Compliance Officer Fees Payable | — | 2 | 2 | |||||||||
| Other Accrued Expenses | 9 | 117 | 154 | |||||||||
| Total Liabilities | 61 | 5,083 | 13,478 | |||||||||
| Net Assets | $ | 47,274 | $ | 601,432 | $ | 865,148 | ||||||
| Net Assets Consist of: | ||||||||||||
| Paid-in Capital | $ | 26,625 | $ | 351,836 | $ | 886,435 | ||||||
| Accumulated Undistributed (Distributions in Excess of) Net Investment Income | 741 | (874 | ) | 280 | ||||||||
| Accumulated Net Realized Gain (Loss) on Investments | 3,347 | 58,550 | (19,316 | ) | ||||||||
| Net Unrealized Appreciation (Depreciation) on Investments | 16,561 | 191,920 | (2,251 | ) | ||||||||
| Net Assets | $ | 47,274 | $ | 601,432 | $ | 865,148 | ||||||
| Investments in Securities, at Cost | $ | 29,797 | $ | 404,946 | $ | 846,410 | ||||||
Net Assets - Institutional Class Shares(1) | $ | 18,451,315 | $ | 558,475,516 | $ | 749,231,570 | ||||||
Net Assets - Retail Class Shares(1) | $ | 28,822,993 | $ | 42,956,137 | $ | 115,916,183 | ||||||
| Institutional Class Shares: | ||||||||||||
Outstanding Shares of Beneficial Interest(1) | ||||||||||||
| (Unlimited Authorization — No Par Value) | 816,028 | 29,465,945 | 76,745,014 | |||||||||
| Retail Class Shares: | ||||||||||||
Outstanding Shares of Beneficial Interest(1) | ||||||||||||
| (Unlimited Authorization — No Par Value) | 1,289,169 | 2,280,832 | 11,917,599 | |||||||||
| Institutional Class Shares: | ||||||||||||
| Net Asset Value, Offering and Redemption | ||||||||||||
| Price Per Share — Institutional Class Shares | $ | 22.61 | $ | 18.95 | $ | 9.76 | ||||||
| Retail Class Shares: | ||||||||||||
| Net Asset Value, Offering and Redemption | ||||||||||||
| Price Per Share — Retail Class Shares | $ | 22.36 | $ | 18.83 | $ | 9.73 | ||||||
(1) | Shares and Net Assets have not been rounded. |
Amounts designated as “—” are either not applicable, $0 or have been rounded to $0.
The accompanying notes are an integral part of the financial statements.
30
Statements of Assets and Liabilities (000) September 30, 2017 |  |
| RiverPark Long/Short Opportunity Fund | RiverPark Strategic Income Fund | RiverPark Focused Value Fund | ||||||||||
| Assets: | ||||||||||||
| Investments in Securities, at Value (Note 2) | $ | 82,357 | $ | 390,469 | $ | 39,405 | ||||||
| Deposits with Brokers for Securities Sold Short, Not Yet Purchased | 55,482 | 15,821 | — | |||||||||
| Cash | 3,811 | 20,528 | 2,685 | |||||||||
| Receivable for Investment Securities Sold | 770 | 2,213 | 1,027 | |||||||||
| Receivable for Swap Reset | 760 | — | — | |||||||||
| Cash Collateral on Swap Contracts | 250 | — | — | |||||||||
| Receivable for Dividend and Interest Income | 79 | 4,259 | 57 | |||||||||
| Receivable for Capital Shares Sold | 59 | 1,410 | — | |||||||||
| Prepaid Expenses | 12 | 32 | 12 | |||||||||
| Unrealized Appreciation on Forward Foreign Currency Contracts | — | 15 | — | |||||||||
| Total Assets | 143,580 | 434,747 | 43,186 | |||||||||
| Liabilities: | ||||||||||||
| Securities Sold Short, Not Yet Purchased (Note 2) | 54,822 | 18,104 | — | |||||||||
| Dividends Payable on Securities Sold Short | 73 | — | — | |||||||||
| Payable for Capital Shares Redeemed | 43 | 604 | 95 | |||||||||
| Income Distribution Payable | — | 157 | — | |||||||||
| Payable for Investment Securities Purchased | — | 2,305 | — | |||||||||
| Payable Due to Adviser (Note 4) | 107 | 221 | 23 | |||||||||
| Payable Due to Administrative Services Plan, Institutional Class Shares (Note 4) | 19 | 31 | 1 | |||||||||
| Payable Due to Administrator | 4 | 20 | 2 | |||||||||
| Payable Due to Shareholder Servicing Agent (Note 4) | 2 | 69 | — | |||||||||
| Payable Due to Trustees | — | — | — | |||||||||
| Payable Due to Administrative Services Plan, Retail Class Shares (Note 4) | — | 6 | — | |||||||||
| Chief Compliance Officer Fees Payable | — | 1 | — | |||||||||
| Other Accrued Expenses | 17 | 77 | 8 | |||||||||
| Total Liabilities | 55,087 | 21,595 | 129 | |||||||||
| Net Assets | $ | 88,493 | $ | 413,152 | $ | 43,057 | ||||||
| Net Assets Consist of: | ||||||||||||
| Paid-in Capital | $ | 61,784 | $ | 463,178 | $ | 43,670 | ||||||
| Accumulated Undistributed Net Investment Income | 1,712 | 83 | 779 | |||||||||
| Accumulated Net Realized Gain (Loss) on Investments | (2,229 | ) | (40,627 | ) | (4,073 | ) | ||||||
| Net Unrealized Appreciation (Depreciation) on Investments | 27,226 | (9,497 | ) | 2,681 | ||||||||
| Net Unrealized Appreciation on Forward Foreign Currency Contracts | — | 15 | — | |||||||||
| Net Assets | $ | 88,493 | $ | 413,152 | $ | 43,057 | ||||||
| Investments in Securities, at Cost | $ | 51,464 | $ | 399,776 | $ | 36,724 | ||||||
| Securities Sold Short, Not Yet Purchased, Proceeds | 51,155 | 17,914 | — | |||||||||
Net Assets - Institutional Class Shares(1) | $ | 85,001,296 | $ | 311,572,509 | $ | 42,470,084 | ||||||
Net Assets - Retail Class Shares(1) | $ | 3,492,041 | $ | 101,579,402 | $ | 587,083 | ||||||
| Institutional Class Shares: | ||||||||||||
Outstanding Shares of Beneficial Interest(1) | ||||||||||||
| (Unlimited Authorization — No Par Value) | 6,873,959 | 32,731,279 | 4,463,449 | |||||||||
| Retail Class Shares: | ||||||||||||
Outstanding Shares of Beneficial Interest(1) | ||||||||||||
| (Unlimited Authorization — No Par Value) | 285,260 | 10,687,654 | 61,780 | |||||||||
| Institutional Class Shares: | ||||||||||||
| Net Asset Value, Offering and Redemption | ||||||||||||
| Price Per Share — Institutional Class Shares | $ | 12.37 | $ | 9.52 | $ | 9.52 | ||||||
| Retail Class Shares: | ||||||||||||
| Net Asset Value, Offering and Redemption | ||||||||||||
| Price Per Share — Retail Class Shares | $ | 12.24 | $ | 9.50 | $ | 9.50 | ||||||
(1) | Shares and Net Assets have not been rounded. |
Amounts designated as “—” are either not applicable, $0 or have been rounded to $0.
The accompanying notes are an integral part of the financial statements.
31
Statements of Operations (000) For the Year Ended September 30, 2017 | |
| RiverPark Large Growth Fund | RiverPark/ Wedgewood Fund | RiverPark Short Term High Yield Fund | ||||||||||
| Investment Income: | ||||||||||||
| Dividends | $ | 684 | $ | 9,930 | $ | 349 | ||||||
| Interest | 2 | 95 | 32,457 | |||||||||
| Foreign Taxes Withheld | — | (158 | ) | — | ||||||||
| Total Investment Income | 686 | 9,867 | 32,806 | |||||||||
| Expenses: | ||||||||||||
| Investment Advisory Fees (Note 4) | 340 | 7,770 | 5,690 | |||||||||
Shareholder Service Fees(1) (Note 4) | 73 | 122 | 477 | |||||||||
| Administrative Services Fee, Retail Class Shares (Note 4) | 35 | 29 | 275 | |||||||||
| Administrator Fees (Note 4) | 30 | 680 | 501 | |||||||||
| Administrative Services Fee, Institutional Class Shares (Note 4) | 21 | 1,019 | 672 | |||||||||
| Trustees’ Fees (Note 4) | 2 | 36 | 25 | |||||||||
| Chief Compliance Officer Fees (Note 4) | 1 | 22 | 16 | |||||||||
| Registration Fees | 32 | 58 | 38 | |||||||||
| Transfer Agent Fees | 12 | 274 | 210 | |||||||||
| Custodian Fees | 8 | 21 | 20 | |||||||||
| Printing Fees | 6 | 99 | 86 | |||||||||
| Professional Fees | 5 | 80 | 85 | |||||||||
| Insurance and Other Fees | 6 | 79 | 61 | |||||||||
| Total Expenses | 571 | 10,289 | 8,156 | |||||||||
| Net Expenses | 571 | 10,289 | 8,156 | |||||||||
| Net Investment Income (Loss) | 115 | (422 | ) | 24,650 | ||||||||
| Net Realized and Unrealized Gain (Loss): | ||||||||||||
| Net Realized Gain (Loss) From: | ||||||||||||
| Investments | 5,266 | 223,857 | 294 | |||||||||
| Net Change in Unrealized Appreciation (Depreciation) on: | ||||||||||||
| Investments | 5,130 | (80,082 | ) | (2,050 | ) | |||||||
| Net Realized and Unrealized Gain (Loss) | 10,396 | 143,775 | (1,756 | ) | ||||||||
| Net Increase in Net Assets Resulting from Operations | $ | 10,511 | $ | 143,353 | $ | 22,894 | ||||||
(1) | Attributable to Retail Class Shares only. |
Amounts designated as “—” are either not applicable, $0 or have been rounded to $0.
The accompanying notes are an integral part of the financial statements.
32
Statements of Operations (000) For the Year Ended September 30, 2017 | |
| RiverPark Long/Short Opportunity Fund | RiverPark Strategic Income Fund | RiverPark Focused Value Fund | ||||||||||
| Investment Income: | ||||||||||||
| Dividends | $ | 1,187 | $ | 6 | $ | 970 | ||||||
| Interest | 165 | 34,588 | 10 | |||||||||
| Total Investment Income | 1,352 | 34,594 | 980 | |||||||||
| Expenses: | ||||||||||||
| Investment Advisory Fees (Note 4) | 1,487 | 3,365 | 271 | |||||||||
| Administrative Services Fee, Institutional Class Shares (Note 4) | 123 | 230 | 5 | |||||||||
| Administrator Fees (Note 4) | 57 | 295 | 24 | |||||||||
Shareholder Service Fees(1) (Note 4) | 8 | 607 | 1 | |||||||||
| Administrative Services Fee, Retail Class Shares (Note 4) | 7 | 329 | 1 | |||||||||
| Trustees’ Fees (Note 4) | 3 | 15 | 1 | |||||||||
| Chief Compliance Officer Fees (Note 4) | 2 | 10 | 1 | |||||||||
| Interest and Dividend Expense | 1,348 | 658 | — | |||||||||
| Stock Loan Fee | 23 | 19 | — | |||||||||
| Registration Fees | 40 | 62 | 36 | |||||||||
| Transfer Agent Fees | 24 | 122 | 10 | |||||||||
| Printing Fees | 13 | 51 | 4 | |||||||||
| Professional Fees | 9 | 47 | 4 | |||||||||
| Custodian Fees | 4 | 11 | 2 | |||||||||
| Insurance and Other Fees | 9 | 48 | 5 | |||||||||
| Total Expenses | 3,157 | 5,869 | 365 | |||||||||
| Fees Waived by Adviser (Note 4) | (4 | ) | — | — | ||||||||
| Advisor Waiver Recapture (Note 4) | — | — | 15 | |||||||||
| Net Expenses | 3,153 | 5,869 | 380 | |||||||||
| Net Investment Income (Loss) | (1,801 | ) | 28,725 | 600 | ||||||||
| Net Realized and Unrealized Gain (Loss): | ||||||||||||
| Net Realized Gain (Loss) From: | ||||||||||||
| Investments | 12,110 | (123 | ) | (3,403 | ) | |||||||
| Purchased Options | (282 | ) | — | — | ||||||||
| Written Options | 70 | — | — | |||||||||
| Securities Sold Short, Not Yet Purchased | (4,468 | ) | (567 | ) | — | |||||||
| Swaps Contracts | 2,480 | — | — | |||||||||
| Forward Foreign Currency Contracts | — | 34 | — | |||||||||
| Foreign Currency Transactions | — | (352 | ) | — | ||||||||
| Net Change in Unrealized Appreciation (Depreciation) on: | ||||||||||||
| Investments | 8,604 | 4,585 | 10,370 | |||||||||
| Purchased Options | — | (41 | ) | — | ||||||||
| Securities Sold Short, Not Yet Purchased | 1,144 | 645 | — | |||||||||
| Forward Foreign Currency Contracts | — | (9 | ) | — | ||||||||
| Foreign Currency Transactions | — | 1 | — | |||||||||
| Net Realized and Unrealized Gain (Loss) | 19,658 | 4,173 | 6,967 | |||||||||
| Net Increase in Net Assets Resulting from Operations | $ | 17,857 | $ | 32,898 | $ | 7,567 | ||||||
(1) | Attributable to Retail Class Shares only. |
Amounts designated as “—” are either not applicable, $0 or have been rounded to $0.
The accompanying notes are an integral part of the financial statements.
33
| Statements of Changes in Net Assets (000) | |
| RiverPark Large Growth Fund | RiverPark/Wedgewood Fund | |||||||||||||||
Year Ended September 30, 2017 | Year Ended September 30, 2016 | Year Ended September 30, 2017 | Year Ended September 30, 2016 | |||||||||||||
| Operations: | ||||||||||||||||
| Net Investment Income (Loss) | $ | 115 | $ | 327 | $ | (422 | ) | $ | 5,276 | |||||||
| Net Realized Gain (Loss) from Investments | 5,266 | (1,087 | ) | 223,857 | (148,231 | ) | ||||||||||
| Net Change in Unrealized Appreciation (Depreciation) on Investments | 5,130 | 7,904 | (80,082 | ) | 203,199 | |||||||||||
| Net Increase in Net Assets Resulting from Operations | 10,511 | 7,144 | 143,353 | 60,244 | ||||||||||||
| Distributions to Shareholders From: | ||||||||||||||||
| Net Investment Income: | ||||||||||||||||
| Institutional Class Shares | (167 | ) | (5 | ) | (2,353 | ) | (9,635 | ) | ||||||||
| Retail Class Shares | (69 | ) | — | — | (102 | ) | ||||||||||
| Net Realized Gains: | ||||||||||||||||
| Institutional Class Shares | — | (584 | ) | — | (76,296 | ) | ||||||||||
| Retail Class Shares | — | (752 | ) | — | (3,946 | ) | ||||||||||
| Total Distributions to Shareholders | (236 | ) | (1,341 | ) | (2,353 | ) | (89,979 | ) | ||||||||
| Capital Share Transactions: | ||||||||||||||||
| Institutional Class Shares: | ||||||||||||||||
| Shares Issued | 1,010 | 3,725 | 135,588 | 493,266 | ||||||||||||
| Shares Issued as Reinvestment of Distributions | 167 | 584 | 2,079 | 73,728 | ||||||||||||
| Shares Redeemed | (21,038 | ) | (8,140 | ) | (1,203,409 | ) | (1,025,151 | ) | ||||||||
| Net Decrease in Net Assets from Institutional Class Shares Transactions | (19,861 | ) | (3,831 | ) | (1,065,742 | ) | (458,157 | ) | ||||||||
| Retail Class Shares: | ||||||||||||||||
| Shares Issued | 2,736 | 3,318 | 6,583 | 16,920 | ||||||||||||
| Shares Issued as Reinvestment of Distributions | 68 | 751 | — | 4,005 | ||||||||||||
| Shares Redeemed | (10,793 | ) | (20,789 | ) | (23,208 | ) | (78,105 | ) | ||||||||
| Net Decrease in Net Assets from Retail Class Shares Transactions | (7,989 | ) | (16,720 | ) | (16,625 | ) | (57,180 | ) | ||||||||
| Net Decrease in Net Assets from Capital Share Transactions | (27,850 | ) | (20,551 | ) | (1,082,367 | ) | (515,337 | ) | ||||||||
| Net Decrease in Net Assets | (17,575 | ) | (14,748 | ) | (941,367 | ) | (545,072 | ) | ||||||||
| Net Assets: | ||||||||||||||||
| Beginning of year | 64,849 | 79,597 | 1,542,799 | 2,087,871 | ||||||||||||
| End of year | $ | 47,274 | $ | 64,849 | $ | 601,432 | $ | 1,542,799 | ||||||||
| Undistributed (Distributions in Excess of) Net Investment Income | $ | 741 | $ | 827 | $ | (874 | ) | $ | 1,404 | |||||||
| Shares Issued and Redeemed: | ||||||||||||||||
| Institutional Class Shares: | ||||||||||||||||
| Shares Issued | 52 | 218 | 7,691 | 29,368 | ||||||||||||
| Shares Issued as Reinvestment of Distributions | 9 | 33 | 121 | 4,388 | ||||||||||||
| Shares Redeemed | (1,095 | ) | (466 | ) | (66,895 | ) | (61,890 | ) | ||||||||
| Net Decrease in Institutional Class Shares | (1,034 | ) | (215 | ) | (59,083 | ) | (28,134 | ) | ||||||||
| Retail Class Shares: | ||||||||||||||||
| Shares Issued | 139 | 197 | 375 | 1,043 | ||||||||||||
| Shares Issued as Reinvestment of Distributions | 4 | 43 | — | 241 | ||||||||||||
| Shares Redeemed | (546 | ) | (1,209 | ) | (1,310 | ) | (4,753 | ) | ||||||||
| Net Decrease in Retail Class Shares | (403 | ) | (969 | ) | (935 | ) | (3,469 | ) | ||||||||
| Net Decrease in Share Transactions | (1,437 | ) | (1,184 | ) | (60,018 | ) | (31,603 | ) | ||||||||
Amounts designated as “—” are either not applicable, $0 or have been rounded to $0.
The accompanying notes are an integral part of the financial statements.
34
| Statements of Changes in Net Assets (000) | |
| RiverPark Short Term High Yield Fund | RiverPark Long/Short Opportunity Fund | |||||||||||||||
Year Ended September 30, 2017 | Year Ended September 30, 2016 | Year Ended September 30, 2017 | Year Ended September 30, 2016 | |||||||||||||
| Operations: | ||||||||||||||||
| Net Investment Income (Loss) | $ | 24,650 | $ | 24,754 | $ | (1,801 | ) | $ | (1,983 | ) | ||||||
| Net Realized Gain (Loss) from Investments, Written and Purchased Options, Securities Sold Short, Not Yet Purchased and Swap Contracts | 294 | (11,595 | ) | 9,910 | (213 | ) | ||||||||||
| Net Change in Unrealized Appreciation (Depreciation) on Investments, Securities Sold Short, Not Yet Purchased and Swap Contracts | (2,050 | ) | 11,681 | 9,748 | 4,099 | |||||||||||
| Net Increase in Net Assets Resulting from Operations | 22,894 | 24,840 | 17,857 | 1,903 | ||||||||||||
| Distributions to Shareholders From: | ||||||||||||||||
| Net Investment Income: | ||||||||||||||||
| Institutional Class Shares | (19,683 | ) | (18,488 | ) | — | — | ||||||||||
| Retail Class Shares | (4,734 | ) | (6,503 | ) | — | — | ||||||||||
| Net Realized Gains: | ||||||||||||||||
| Institutional Class Shares | — | — | — | — | ||||||||||||
| Retail Class Shares | — | — | — | — | ||||||||||||
| Total Distributions to Shareholders | (24,417 | ) | (24,991 | ) | — | — | ||||||||||
| Capital Share Transactions: | ||||||||||||||||
| Institutional Class Shares: | ||||||||||||||||
| Shares Issued | 369,251 | 213,842 | 16,075 | 48,516 | ||||||||||||
| Shares Issued as Reinvestment of Distributions | 17,114 | 15,151 | — | — | ||||||||||||
| Shares Redeemed | (242,269 | ) | (288,318 | ) | (52,387 | ) | (43,655 | ) | ||||||||
| Net Increase (Decrease) in Net Assets from Institutional Class Shares Transactions | 144,096 | (59,325 | ) | (36,312 | ) | 4,861 | ||||||||||
| Retail Class Shares: | ||||||||||||||||
| Shares Issued | 41,550 | 132,007 | 989 | 187 | ||||||||||||
| Shares Issued as Reinvestment of Distributions | 4,687 | 6,452 | — | — | ||||||||||||
| Shares Redeemed | (205,209 | ) | (67,706 | ) | (1,895 | ) | (9,539 | ) | ||||||||
| Net Increase (Decrease) in Net Assets from Retail Class Shares Transactions | (158,972 | ) | 70,753 | (906 | ) | (9,352 | ) | |||||||||
| Net Increase (Decrease) in Net Assets from Capital Share Transactions | (14,876 | ) | 11,428 | (37,218 | ) | (4,491 | ) | |||||||||
| Net Increase (Decrease) in Net Assets | (16,399 | ) | 11,277 | (19,361 | ) | (2,588 | ) | |||||||||
| Net Assets: | ||||||||||||||||
| Beginning of year | 881,547 | 870,270 | 107,854 | 110,442 | ||||||||||||
| End of year | $ | 865,148 | $ | 881,547 | $ | 88,493 | $ | 107,854 | ||||||||
| Undistributed Net Investment Income | $ | 280 | $ | 81 | $ | 1,712 | $ | 601 | ||||||||
| Shares Issued and Redeemed: | ||||||||||||||||
| Institutional Class Shares: | ||||||||||||||||
| Shares Issued | 37,729 | 21,930 | 1,472 | 4,786 | ||||||||||||
| Shares Issued as Reinvestment of Distributions | 1,751 | 1,553 | — | — | ||||||||||||
| Shares Redeemed | (24,755 | ) | (29,557 | ) | (4,709 | ) | (4,307 | ) | ||||||||
| Net Increase (Decrease) in Institutional Class Shares | 14,725 | (6,074 | ) | (3,237 | ) | 479 | ||||||||||
| Retail Class Shares: | ||||||||||||||||
| Shares Issued | 4,259 | 13,565 | 84 | 18 | ||||||||||||
| Shares Issued as Reinvestment of Distributions | 481 | 664 | — | — | ||||||||||||
| Shares Redeemed | (21,030 | ) | (6,965 | ) | (174 | ) | (964 | ) | ||||||||
| Net Increase in Retail Class Shares | (16,290 | ) | 7,264 | (90 | ) | (946 | ) | |||||||||
| Net Increase (Decrease) in Share Transactions | (1,565 | ) | 1,190 | (3,327 | ) | (467 | ) | |||||||||
Amounts designated as “—” are either not applicable, $0 or have been rounded to $0.
The accompanying notes are an integral part of the financial statements.
35
| Statements of Changes in Net Assets (000) | |
| RiverPark Strategic Income Fund | RiverPark Focused Value Fund | |||||||||||||||
Year Ended September 30, 2017 | Year Ended September 30, 2016 | Year Ended September 30, 2017 | Year Ended September 30, 2016 | |||||||||||||
| Operations: | ||||||||||||||||
| Net Investment Income | $ | 28,725 | $ | 32,341 | $ | 600 | $ | 663 | ||||||||
| Net Realized Loss from Investments, Purchased Options, Securities Sold Short, Not Yet Purchased, Swap Contracts, Forward Foreign Currency Contracts and Foreign Currency Transactions | (1,008 | ) | (28,879 | ) | (3,403 | ) | (615 | ) | ||||||||
| Net Change in Unrealized Appreciation (Depreciation) on Investments, Securities Sold Short, Not Yet Purchased, Swap Contracts, Forward Foreign Currency Contracts and Foreign Currency Transactions | 5,181 | 26,253 | 10,370 | (2,584 | ) | |||||||||||
| Net Increase (Decrease) in Net Assets Resulting from Operations | 32,898 | 29,715 | 7,567 | (2,536 | ) | |||||||||||
| Distributions to Shareholders From: | ||||||||||||||||
| Net Investment Income: | ||||||||||||||||
| Institutional Class Shares | (14,421 | ) | (13,264 | ) | (379 | ) | (256 | ) | ||||||||
| Retail Class Shares | (12,625 | ) | (20,263 | ) | (2 | ) | (1 | ) | ||||||||
| Net Realized Gains: | ||||||||||||||||
| Institutional Class Shares | — | — | — | (18 | ) | |||||||||||
| Retail Class Shares | — | — | — | — | ||||||||||||
| Total Distributions to Shareholders | (27,046 | ) | (33,527 | ) | (381 | ) | (275 | ) | ||||||||
| Capital Share Transactions: | ||||||||||||||||
| Institutional Class Shares: | ||||||||||||||||
| Shares Issued | 185,403 | 114,521 | 2,073 | 3,442 | ||||||||||||
| Shares Issued as Reinvestment of Distributions | 12,578 | 10,798 | 379 | 274 | ||||||||||||
| Shares Redeemed | (134,870 | ) | (125,341 | ) | (8,885 | ) | (2,334 | ) | ||||||||
| Net Increase (Decrease) in Net Assets from Institutional Class Shares Transactions | 63,111 | (22 | ) | (6,433 | ) | 1,382 | ||||||||||
| Retail Class Shares: | ||||||||||||||||
| Shares Issued | 61,823 | 82,177 | 301 | 503 | ||||||||||||
| Shares Issued as Reinvestment of Distributions | 12,556 | 20,212 | 2 | 2 | ||||||||||||
| Shares Redeemed | (337,867 | ) | (130,162 | ) | (213 | ) | (425 | ) | ||||||||
| Net Increase (Decrease) in Net Assets from Retail Class Shares Transactions | (263,488 | ) | (27,773 | ) | 90 | 80 | ||||||||||
| Net Increase (Decrease) in Net Assets from Capital Share Transactions | (200,377 | ) | (27,795 | ) | (6,343 | ) | 1,462 | |||||||||
| Net Increase (Decrease) in Net Assets | (194,525 | ) | (31,607 | ) | 843 | (1,349 | ) | |||||||||
| Net Assets: | ||||||||||||||||
| Beginning of year | 607,677 | 639,284 | 42,214 | 43,563 | ||||||||||||
| End of year | $ | 413,152 | $ | 607,677 | $ | 43,057 | $ | 42,214 | ||||||||
| Undistributed Net Investment Income | $ | 83 | $ | 29 | $ | 779 | $ | 557 | ||||||||
| Shares Issued and Redeemed: | ||||||||||||||||
| Institutional Class Shares: | ||||||||||||||||
| Shares Issued | 19,451 | 12,490 | 256 | 442 | ||||||||||||
| Shares Issued as Reinvestment of Distributions | 1,322 | 1,174 | 47 | 33 | ||||||||||||
| Shares Redeemed | (14,185 | ) | (13,631 | ) | (1,060 | ) | (299 | ) | ||||||||
| Net Increase (Decrease) in Institutional Class Shares | 6,588 | 33 | (757 | ) | 176 | |||||||||||
| Retail Class Shares: | ||||||||||||||||
| Shares Issued | 6,513 | 8,954 | 36 | 62 | ||||||||||||
| Shares Issued as Reinvestment of Distributions | 1,325 | 2,201 | — | — | ||||||||||||
| Shares Redeemed | (35,513 | ) | (14,085 | ) | (25 | ) | (53 | ) | ||||||||
| Net Increase (Decrease) in Retail Class Shares | (27,675 | ) | (2,930 | ) | 11 | 9 | ||||||||||
| Net Increase (Decrease) in Share Transactions | (21,087 | ) | (2,897 | ) | (746 | ) | 185 | |||||||||
Amounts designated as “—” are either not applicable, $0 or have been rounded to $0.
The accompanying notes are an integral part of the financial statements.
36
(This page intentionally left blank)
Financial Highlights
For a Share Outstanding Throughout Each Period
For the Year Ended September 30,
| Net Asset Value, Beginning of Period | Net Investment Income (Loss) (1) | Realized and Unrealized Gains (Losses) on Investments | Total from Investment Operations | Distributions of Dividends from Net Investment Income | Distributions from Net Realized Gains | Total Distributions | ||||||||||||||||||||||
| RiverPark Large Growth Fund | ||||||||||||||||||||||||||||
| Institutional Class Shares | ||||||||||||||||||||||||||||
| 2017 | $ | 18.41 | $ | 0.08 | $ | 4.22 | $ | 4.30 | $ | (0.10 | ) | $ | — | $ | (0.10 | ) | ||||||||||||
| 2016 | 16.93 | 0.09 | 1.69 | 1.78 | — | (2) | (0.30 | ) | (0.30 | ) | ||||||||||||||||||
| 2015 | 18.34 | 0.09 | (0.99 | ) | (0.90 | ) | — | (0.51 | ) | (0.51 | ) | |||||||||||||||||
| 2014 | 16.28 | 0.02 | 2.21 | 2.23 | (0.04 | ) | (0.13 | ) | (0.17 | ) | ||||||||||||||||||
| 2013 | 13.27 | 0.05 | 3.04 | 3.09 | (0.02 | ) | (0.06 | ) | (0.08 | ) | ||||||||||||||||||
| Retail Class Shares | ||||||||||||||||||||||||||||
| 2017 | $ | 18.20 | $ | 0.02 | $ | 4.18 | $ | 4.20 | $ | (0.04 | ) | $ | — | $ | (0.04 | ) | ||||||||||||
| 2016 | 16.77 | 0.06 | 1.67 | 1.73 | — | (0.30 | ) | (0.30 | ) | |||||||||||||||||||
| 2015 | 18.21 | 0.05 | (0.98 | ) | (0.93 | ) | — | (0.51 | ) | (0.51 | ) | |||||||||||||||||
| 2014 | 16.18 | (0.03 | ) | 2.19 | 2.16 | — | (2) | (0.13 | ) | (0.13 | ) | |||||||||||||||||
| 2013 | 13.21 | 0.01 | 3.03 | 3.04 | (0.01 | ) | (0.06 | ) | (0.07 | ) | ||||||||||||||||||
| RiverPark/Wedgewood Fund | ||||||||||||||||||||||||||||
| Institutional Class Shares | ||||||||||||||||||||||||||||
| 2017 | $ | 16.82 | $ | (0.01 | ) | $ | 2.17 | $ | 2.16 | $ | (0.03 | ) | $ | — | $ | (0.03 | ) | |||||||||||
| 2016 | 16.93 | 0.05 | 0.60 | 0.65 | (0.08 | ) | (0.68 | ) | (0.76 | ) | ||||||||||||||||||
| 2015 | 18.37 | 0.06 | (0.67 | ) | (0.61 | ) | (0.01 | ) | (0.82 | ) | (0.83 | ) | ||||||||||||||||
| 2014 | 16.21 | 0.01 | 2.41 | 2.42 | — | (0.26 | ) | (0.26 | ) | |||||||||||||||||||
| 2013 | 13.88 | (0.01 | ) | 2.38 | 2.37 | — | (0.04 | ) | (0.04 | ) | ||||||||||||||||||
| Retail Class Shares | ||||||||||||||||||||||||||||
| 2017 | $ | 16.72 | $ | (0.04 | ) | $ | 2.15 | $ | 2.11 | $ | — | $ | — | $ | — | |||||||||||||
| 2016 | 16.73 | 0.10 | (4) | 0.59 | 0.69 | (0.02 | ) | (0.68 | ) | (0.70 | ) | |||||||||||||||||
| 2015 | 18.21 | — | (2) | (0.66 | ) | (0.66 | ) | — | (0.82 | ) | (0.82 | ) | ||||||||||||||||
| 2014 | 16.09 | (0.03 | ) | 2.41 | 2.38 | — | (0.26 | ) | (0.26 | ) | ||||||||||||||||||
| 2013 | 13.82 | (0.05 | ) | 2.36 | 2.31 | — | (0.04 | ) | (0.04 | ) | ||||||||||||||||||
The accompanying notes are an integral part of the financial statements.
38
|
Net Asset Value, End of Period | Total Return†† | Net Assets, End of Period (000) | Ratio of Net Expenses to Average Net Assets, Including Dividend Expense and Stock Loan Fee | Ratio of Total Expenses to Average Net Assets, Including Dividend Expense and Stock Loan Fee, Excluding Advisor Waiver Recapture | Ratio of Net Investment Income (Loss) to Average Net Assets | Portfolio Turnover Rate | ||||||||||||||||||||
| $ | 22.61 | 23.47 | % | $ | 18,451 | 0.93 | % | 0.93 | % | 0.39 | % | 13 | % | |||||||||||||
| 18.41 | 10.58 | 34,056 | 0.98 | (3) | 0.90 | 0.54 | 33 | |||||||||||||||||||
| 16.93 | (5.03 | ) | 34,963 | 1.00 | (3) | 0.95 | 0.47 | 30 | ||||||||||||||||||
| 18.34 | 13.75 | † | 13,954 | 1.00 | (3) | 0.98 | 0.13 | 33 | ||||||||||||||||||
| 16.28 | 23.46 | † | 6,299 | 1.00 | 1.06 | 0.32 | 45 | |||||||||||||||||||
| $ | 22.36 | 23.15 | % | $ | 28,823 | 1.22 | % | 1.22 | % | 0.08 | % | 13 | % | |||||||||||||
| 18.20 | 10.36 | 30,793 | 1.17 | (3) | 1.11 | 0.37 | 33 | |||||||||||||||||||
| 16.77 | (5.23 | ) | 44,634 | 1.25 | (3) | 1.23 | 0.29 | 30 | ||||||||||||||||||
| 18.21 | 13.44 | † | 53,293 | 1.25 | 1.26 | (0.14 | ) | 33 | ||||||||||||||||||
| 16.18 | 23.15 | † | 26,221 | 1.25 | 1.31 | 0.06 | 45 | |||||||||||||||||||
| $ | 18.95 | 12.85 | % | $ | 558,476 | 0.85 | % | 0.85 | % | (0.03 | )% | 31 | % | |||||||||||||
| 16.82 | 3.88 | 1,489,036 | 0.82 | 0.82 | 0.28 | 24 | ||||||||||||||||||||
| 16.93 | (3.52 | ) | 1,975,999 | 0.85 | 0.85 | 0.34 | 24 | |||||||||||||||||||
| 18.37 | 15.04 | 1,700,475 | 0.88 | 0.88 | 0.06 | 24 | ||||||||||||||||||||
| 16.21 | 17.15 | 834,476 | 0.92 | (3) | 0.89 | (0.06 | ) | 20 | ||||||||||||||||||
| $ | 18.83 | 12.62 | % | $ | 42,956 | 1.08 | % | 1.08 | % | (0.20 | )% | 31 | % | |||||||||||||
| 16.72 | 4.13 | (5) | 53,763 | 0.54 | (6) | 0.54 | (6) | 0.58 | (7) | 24 | ||||||||||||||||
| 16.73 | (3.83 | ) | 111,872 | 1.16 | 1.16 | (0.02 | ) | 24 | ||||||||||||||||||
| 18.21 | 14.91 | 209,457 | 1.05 | 1.05 | (0.17 | ) | 24 | |||||||||||||||||||
| 16.09 | 16.79 | 346,211 | 1.17 | (3) | 1.14 | (0.32 | ) | 20 | ||||||||||||||||||
† | Total return would have been lower had certain fees not been waived and/or expenses assumed by Adviser during the period. |
†† | Returns shown do not reflect the deduction of taxes that a shareholder would pay on Fund distributions or upon the redemption of Fund shares. |
(1) | Per share data was calculated using average shares for the period. |
(2) | Amount represents less than $0.01 per share. |
(3) | Ratio includes previously waived investment advisory fees recovered. |
(4) | The net investment income per share has been increased by a one-time adjustment as a result of a management change in estimate relating to shareholder servicing and administrative servicing fees. Had this change in estimate not occurred, the net investment income per share would have been $0.01 per share. |
(5) | Total return has been increased by a one-time adjustment as a result of a management change in estimate relating to shareholder servicing and administrative servicing fees. Had this change in estimate not occurred, total return would have been 3.63%. |
(6) | The ratio of net expenses to average net assets has been reduced by a one-time adjustment as a result of a management change in estimate relating to shareholder servicing and administrative servicing fees. Had this change in estimate not occurred, the annualized ratio of net expenses to average net assets would have been 1.08%. |
(7) | The ratio of net investment income to average net assets has been increased by a one-time adjustment as a result of a management change in estimate relating to shareholder servicing and administrative servicing fees. Had this change in estimate not occurred, the annualized ratio of net investment income to average net assets would have been 0.04%. |
The accompanying notes are an integral part of the financial statements.
39
Financial Highlights
For a Share Outstanding Throughout Each Period
For the Year Ended September 30,
| Net Asset Value, Beginning of Period | Net Investment Income (Loss) (1) | Realized and Unrealized Gains (Losses) on Investments | Total from Investment Operations | Distributions of Dividends from Net Investment Income | Distributions from Net Realized Gains | Total Distributions | ||||||||||||||||||||||
| RiverPark Short Term High Yield Fund | ||||||||||||||||||||||||||||
| Institutional Class Shares | ||||||||||||||||||||||||||||
| 2017 | $ | 9.78 | $ | 0.28 | $ | (0.02 | ) | $ | 0.26 | $ | (0.28 | ) | $ | — | $ | (0.28 | ) | |||||||||||
| 2016 | 9.78 | 0.29 | — | (7) | 0.29 | (0.29 | ) | — | (0.29 | ) | ||||||||||||||||||
| 2015 | 9.94 | 0.33 | (0.16 | ) | 0.17 | (0.33 | ) | — | (0.33 | ) | ||||||||||||||||||
| 2014 | 9.98 | 0.38 | (0.04 | ) | 0.34 | (0.38 | ) | — | (0.38 | ) | ||||||||||||||||||
| 2013 | 10.01 | 0.39 | (0.07 | ) | 0.32 | (0.35 | ) | — | (0.35 | ) | ||||||||||||||||||
| Retail Class Shares | ||||||||||||||||||||||||||||
| 2017 | $ | 9.75 | $ | 0.25 | $ | (0.02 | ) | $ | 0.23 | $ | (0.25 | ) | $ | — | $ | (0.25 | ) | |||||||||||
| 2016 | 9.75 | 0.27 | — | (7) | 0.27 | (0.27 | ) | — | (0.27 | ) | ||||||||||||||||||
| 2015 | 9.92 | 0.30 | (0.16 | ) | 0.14 | (0.31 | ) | — | (0.31 | ) | ||||||||||||||||||
| 2014 | 9.97 | 0.36 | (0.05 | ) | 0.31 | (0.36 | ) | — | (0.36 | ) | ||||||||||||||||||
| 2013 | 9.99 | 0.37 | (0.06 | ) | 0.31 | (0.33 | ) | — | (0.33 | ) | ||||||||||||||||||
| RiverPark Long/Short Opportunity Fund | ||||||||||||||||||||||||||||
| Institutional Class Shares | ||||||||||||||||||||||||||||
| 2017 | $ | 10.29 | $ | (0.20 | ) | $ | 2.28 | $ | 2.08 | $ | — | $ | — | $ | — | |||||||||||||
| 2016 | 10.09 | (0.18 | ) | 0.38 | 0.20 | — | — | — | ||||||||||||||||||||
| 2015 | 10.51 | (0.15 | ) | (0.27 | ) | (0.42 | ) | — | — | — | ||||||||||||||||||
| 2014 | 10.10 | (0.21 | ) | 0.62 | 0.41 | — | — | — | ||||||||||||||||||||
| 2013 | 10.14 | (0.22 | ) | 0.27 | 0.05 | — | (0.09 | ) | (0.09 | ) | ||||||||||||||||||
| Retail Class Shares | ||||||||||||||||||||||||||||
| 2017 | $ | 10.21 | $ | (0.22 | ) | $ | 2.25 | $ | 2.03 | $ | — | $ | — | $ | — | |||||||||||||
| 2016 | 10.03 | (0.17 | ) | 0.35 | 0.18 | — | — | — | ||||||||||||||||||||
| 2015 | 10.46 | (0.16 | ) | (0.27 | ) | (0.43 | ) | — | — | — | ||||||||||||||||||
| 2014 | 10.08 | (0.22 | ) | 0.60 | 0.38 | — | — | — | ||||||||||||||||||||
| 2013 | 10.13 | (0.23 | ) | 0.27 | 0.04 | — | (0.09 | ) | (0.09 | ) | ||||||||||||||||||
The accompanying notes are an integral part of the financial statements.
40
|
| Net Asset Value, End of Period | Total Return†† | Net Assets, End of Period (000) | Ratio of Net Expenses to Average Net Assets, Including Dividend Expense and Stock Loan Fee | Ratio of Total Expenses to Average Net Assets, Including Dividend Expense and Stock Loan Fee, Excluding Advisor Waiver Recapture | Ratio of Net Investment Income (Loss) to Average Net Assets | Portfolio Turnover Rate | ||||||||||||||||||||
| $ | 9.76 | 2.67 | % | $ | 749,232 | 0.87 | % | 0.87 | % | 2.89 | % | 194 | % | |||||||||||||
| 9.78 | 3.05 | 606,510 | 0.84 | 0.84 | 2.98 | 114 | ||||||||||||||||||||
| 9.78 | 1.72 | 666,036 | 0.87 | 0.87 | 3.31 | 90 | ||||||||||||||||||||
| 9.94 | 3.48 | 680,443 | 0.90 | 0.90 | 3.81 | 195 | ||||||||||||||||||||
| 9.98 | 3.39 | 587,334 | 0.99 | (6) | 0.94 | 3.88 | 390 | |||||||||||||||||||
| $ | 9.73 | 2.42 | % | $ | 115,916 | 1.16 | % | 1.16 | % | 2.53 | % | 194 | % | |||||||||||||
| 9.75 | 2.81 | 275,037 | 1.08 | 1.08 | 2.74 | 114 | ||||||||||||||||||||
| 9.75 | 1.47 | 204,234 | 1.18 | 1.18 | 3.00 | 90 | ||||||||||||||||||||
| 9.92 | 3.02 | 225,058 | 1.18 | 1.18 | 3.62 | 195 | ||||||||||||||||||||
| 9.97 | 3.14 | 285,742 | 1.25 | (6) | 1.21 | 3.75 | 390 | |||||||||||||||||||
| $ | 12.37 | 20.21 | % | $ | 85,001 | 3.17 | %(8) | 3.17 | % | (1.81 | )% | 24 | % | |||||||||||||
| 10.29 | 1.98 | 104,030 | 3.13 | (5)(6) | 3.12 | (1.75 | ) | 40 | ||||||||||||||||||
| 10.09 | (4.00 | ) | 97,196 | 3.01 | (4)(6) | 3.00 | (1.41 | ) | 35 | |||||||||||||||||
| 10.51 | 4.06 | 107,276 | 3.22 | (3)(6) | 3.16 | (1.99 | ) | 59 | ||||||||||||||||||
| 10.10 | 0.55 | † | 26,686 | 3.46 | (2) | 3.60 | (2.22 | ) | 56 | |||||||||||||||||
| $ | 12.24 | 19.88 | % | $ | 3,492 | 3.38 | %(8) | 3.49 | % | (2.03 | )% | 24 | % | |||||||||||||
| 10.21 | 1.79 | 3,824 | 3.33 | (5)(6) | 3.31 | (1.70 | ) | 40 | ||||||||||||||||||
| 10.03 | (4.11 | ) | 13,246 | 3.16 | (4)(6) | 3.19 | (1.55 | ) | 35 | |||||||||||||||||
| 10.46 | 3.77 | 16,194 | 3.37 | (3)(6) | 3.29 | (2.03 | ) | 59 | ||||||||||||||||||
| 10.08 | 0.45 | † | 72,410 | 3.61 | (2) | 3.71 | (2.32 | ) | 56 | |||||||||||||||||
† | Total return would have been lower had certain fees not been waived and/or expenses assumed by Adviser during the period. |
†† | Returns shown do not reflect the deduction of taxes that a shareholder would pay on Fund distributions or upon the redemption of Fund shares. |
(1) | Per share data was calculated using average shares for the period. |
(2) | Dividend expense and stock loan fee totaled 1.61% of average net assets for the year ended September 30, 2013. Had these expenses not been included the ratios would have been 1.85% and 2.00%, respectively. |
(3) | Dividend expense and stock loan fee totaled 1.37% of average net assets for the year ended September 30, 2014. Had these expenses not been included the ratios would have been 1.85% and 2.00%, respectively. |
(4) | Dividend expense and stock loan fee totaled 1.16% of average net assets for the year ended September 30, 2015. Had these expenses not been included the ratios would have been 1.85% and 2.00%, respectively. |
(5) | Dividend expense and stock loan fee totaled 1.35% of average net assets for the year ended September 30, 2016. Had these expenses not been included the ratios would have been 1.78% and 1.98%, respectively. |
(6) | Ratios include previously waived investment advisory fees recovered. |
(7) | Amount represents less than $0.01 per share. |
(8) | Dividend expense and stock loan fee totaled 1.38% of average net assets for the period ended September 30, 2017. Had these expenses not been included the ratios would have been 1.79% and 2.00%, respectively. |
The accompanying notes are an integral part of the financial statements.
41
Financial Highlights
For a Share Outstanding Throughout Each Period
For the Year Ended September 30,
| Net Asset Value, Beginning of Period | Net Investment Income (Loss) (1) | Realized and Unrealized Gains (Losses) on Investments | Total from Investment Operations | Distributions of Dividends from Net Investment Income | Distributions from Net Realized Gains | Total Distributions | ||||||||||||||||||||||
| RiverPark Strategic Income Fund | ||||||||||||||||||||||||||||
| Institutional Class Shares | ||||||||||||||||||||||||||||
| 2017 | $ | 9.43 | $ | 0.54 | $ | 0.05 | $ | 0.59 | $ | (0.50 | ) | $ | — | $ | (0.50 | ) | ||||||||||||
| 2016 | 9.49 | 0.52 | (0.04 | ) | 0.48 | (0.54 | ) | — | (0.54 | ) | ||||||||||||||||||
| 2015 | 10.26 | 0.56 | (0.72 | ) | (0.16 | ) | (0.60 | ) | (0.01 | ) | (0.61 | ) | ||||||||||||||||
2014(2) | 10.00 | 0.59 | 0.12 | (6) | 0.71 | (0.45 | ) | — | (5) | (0.45 | ) | |||||||||||||||||
| Retail Class Shares | ||||||||||||||||||||||||||||
| 2017 | $ | 9.42 | $ | 0.52 | $ | 0.04 | $ | 0.56 | $ | (0.48 | ) | $ | — | $ | (0.48 | ) | ||||||||||||
| 2016 | 9.48 | 0.49 | (0.04 | ) | 0.45 | (0.51 | ) | — | (0.51 | ) | ||||||||||||||||||
| 2015 | 10.26 | 0.53 | (0.72 | ) | (0.19 | ) | (0.58 | ) | (0.01 | ) | (0.59 | ) | ||||||||||||||||
2014(2) | 10.00 | 0.55 | 0.14 | (6) | 0.69 | (0.43 | ) | — | (5) | (0.43 | ) | |||||||||||||||||
| RiverPark Focused Value Fund | ||||||||||||||||||||||||||||
| Institutional Class Shares | ||||||||||||||||||||||||||||
| 2017 | $ | 8.01 | $ | 0.12 | $ | 1.46 | $ | 1.58 | $ | (0.07 | ) | $ | — | $ | (0.07 | ) | ||||||||||||
2016(8) | 8.56 | 0.13 | (0.63 | ) | (0.50 | ) | (0.05 | ) | — | (5) | (0.05 | ) | ||||||||||||||||
2015(3) | 10.00 | 0.07 | (1.51 | ) | (1.44 | ) | — | — | — | |||||||||||||||||||
| Retail Class Shares | ||||||||||||||||||||||||||||
| 2017 | $ | 8.00 | $ | 0.10 | $ | 1.45 | $ | 1.55 | $ | (0.05 | ) | $ | — | $ | (0.05 | ) | ||||||||||||
2016(8) | 8.56 | 0.10 | (0.63 | ) | (0.53 | ) | (0.03 | ) | — | (5) | (0.03 | ) | ||||||||||||||||
2015(3) | 10.00 | 0.05 | (1.49 | ) | (1.44 | ) | — | — | — | |||||||||||||||||||
The accompanying notes are an integral part of the financial statements.
42
|
| Net Asset Value, End of Period | Total Return†† | Net Assets, End of Period (000) | Ratio of Net Expenses to Average Net Assets, Including Dividend Expense and Stock Loan Fee | Ratio of Total Expenses to Average Net Assets, Including Dividend Expense and Stock Loan Fee, Excluding Advisor Waiver Recapture | Ratio of Net Investment Income (Loss) to Average Net Assets | Portfolio Turnover Rate | ||||||||||||||||||||
| $ | 9.52 | 6.39 | % | $ | 311,573 | 1.00 | %(9) | 1.00 | % | 5.58 | % | 62 | % | |||||||||||||
| 9.43 | 5.34 | 246,474 | 0.93 | (7) | 0.93 | 5.64 | 69 | |||||||||||||||||||
| 9.49 | (1.63 | ) | 247,726 | 0.90 | 0.90 | 5.57 | 54 | |||||||||||||||||||
| 10.26 | 7.16 | 205,825 | 0.91 | 0.91 | 5.67 | 61 | ||||||||||||||||||||
| $ | 9.50 | 6.01 | % | $ | 101,579 | 1.29 | %(9) | 1.29 | % | 5.50 | % | 62 | % | |||||||||||||
| 9.42 | 5.08 | 361,203 | 1.24 | (7) | 1.24 | 5.32 | 69 | |||||||||||||||||||
| 9.48 | (1.98 | ) | 391,558 | 1.19 | 1.19 | 5.29 | 54 | |||||||||||||||||||
| 10.26 | 6.93 | 306,131 | 1.24 | 1.24 | 5.29 | 61 | ||||||||||||||||||||
| $ | 9.52 | 19.88 | % | $ | 42,470 | 0.91 | %(4) | 0.87 | % | 1.44 | % | 36 | % | |||||||||||||
| 8.01 | (5.83 | ) | 41,803 | 1.00 | (4) | 0.97 | 1.57 | 26 | ||||||||||||||||||
| 8.56 | (14.40 | )† | 43,200 | 1.00 | 1.25 | 1.35 | 14 | |||||||||||||||||||
| $ | 9.50 | 19.44 | % | $ | 587 | 1.25 | % | 1.28 | % | 1.10 | % | 36 | % | |||||||||||||
| 8.00 | (6.14 | ) | 411 | 1.25 | 1.35 | 1.29 | 26 | |||||||||||||||||||
| 8.56 | (14.40 | )† | 363 | 1.25 | 1.60 | 1.01 | 14 | |||||||||||||||||||
† | Total return would have been lower had certain fees not been waived and/or expenses assumed by Adviser during the period. |
†† | Returns shown do not reflect the deduction of taxes that a shareholder would pay on Fund distributions or upon the redemption of Fund shares. |
(1) | Per share data was calculated using average shares for the period. |
(2) | Commenced operations on September 30, 2013. All ratios for the period have been annualized, except for the Total Return and Portfolio Turnover Rate. |
(3) | Commenced operations on March 31, 2015. All ratios for the period have been annualized, except for the Total Return and Portfolio Turnover Rate. |
(4) | Ratios include previously waived investment advisory fees recovered. |
(5) | Amount represents less than $0.01 per share. |
(6) | Realized and unrealized gains and losses per share in this caption are balancing amounts necessary to reconcile the change in net asset value per share for the period, and may not reconcile with the aggregate gains and losses in the Statement of Operations due to share transactions for the period. |
(7) | Dividend expense and stock loan fee totaled 0.09% of average net assets for the year ended September 30, 2016. Had these expenses not been included the ratios would have been 0.84% and 1.15%, respectively. |
(8) | For the year ended September 30, 2016, the Adviser has recovered previously waived investment advisory fees in the Institutional Class while waiving investment advisory fees in the Retail Class. |
(9) | Dividend expense and stock loan fee totaled 0.13% of average net assets for the year ended September 30, 2017. Had these expenses not been included the ratios would have been 0.87% and 1.16%, respectively. |
The accompanying notes are an integral part of the financial statements.
43
Notes to Financial Statements September 30, 2017 | |
1. Organization
RiverPark Funds Trust (the “Trust”), was formed on June 22, 2010 as an open-end registered management investment company under the Investment Act of 1940. As of September 30, 2017, the Trust was comprised of six funds: the RiverPark Large Growth Fund, RiverPark/Wedgewood Fund, RiverPark Short Term High Yield Fund, RiverPark Long/Short Opportunity Fund, RiverPark Strategic Income Fund and the RiverPark Focused Value Fund (each a “Fund” and collectively the “Funds”). The investment objective of the RiverPark Large Growth Fund, RiverPark/Wedgewood Fund and RiverPark Focused Value Fund is to seek long term capital appreciation. The investment objective of the RiverPark Short Term High Yield Fund and RiverPark Strategic Income Fund is to seek high current income and capital appreciation consistent with the preservation of capital. The investment objective of the RiverPark Long/Short Opportunity Fund is to seek long-term capital appreciation while managing downside volatility. Each of the Funds is diversified with the exception of the RiverPark/Wedgewood Fund and RiverPark Focused Value Fund which are both non-diversified. Each Fund is registered to offer Institutional Class Shares and Retail Class Shares. Each of the Funds, except the RiverPark Short Term High Yield Fund, has registered Class C Shares but they are not intended to be offered at this time. Each class differs as to ongoing fees.
The RiverPark Short Term High Yield Fund was closed to new investors on June 21, 2013. Effective as of the close of business on April 5, 2017 (the “Re-Opening Date”), the RiverPark Short Term High Yield Fund was made publicly available for sale on a limited basis as set forth below.
The following groups will be permitted to purchase Fund shares after the Re-Opening Date:
| 1. | Shareholders of record of the Fund as of the Re-Opening Date (although if a shareholder closes all accounts in the Fund, additional investment in the Fund from that shareholder may not be accepted) may continue to purchase additional shares in their existing Fund accounts either directly from the Fund or through a financial intermediary and may continue to reinvest dividends or capital gains distributions from shares owned in the Fund, |
| 2. | New shareholders may open Fund accounts and purchase directly from the Fund (i.e. not through a financial intermediary), and |
| 3. | Members of the Fund’s Board of Trustees, persons affiliated with RiverPark Advisors, LLC or Cohanzick Management, LLC and their immediate families will be able to purchase shares of the Fund and establish new accounts. |
The Fund may from time to time, in its sole discretion, limit the types of investors permitted to open new accounts, limit new purchases or otherwise modify the above policy at any time on a case-by-case basis.
2. Summary of Significant Accounting Policies
The following is a summary of significant accounting policies followed by the Trust in preparation of its financial statements. These policies are in conformity with accounting principles generally accepted in the United States of America (“GAAP”). The preparation of the financial statements in conformity with GAAP requires management to make estimates and assumptions that affect the reported amounts of assets and liabilities and disclosure of contingent assets and liabilities at the date of the financial statements and the reported amounts of increases and decreases in net assets from operations during the reporting period. Actual results could differ from those estimates. The Funds are investment companies and accordingly follow investment company accounting and reporting guidance of the Financial Accounting Standards Board (FASB) Accounting Standards Codification Topic 946 Financial Services – Investment Companies.
44
Notes to Financial Statements September 30, 2017 | |
2. Summary of Significant Accounting Policies (continued)
Valuation of Investments — Securities listed on a national securities exchange or traded on the NASDAQ system are valued on their last sale price. Portfolio securities traded on NASDAQ will be valued at the NASDAQ Official Closing Price on each business day for the New York Stock Exchange (“NYSE”). If there is no such reported sale on an exchange or NASDAQ, the portfolio security will be valued at the mean between the most recent quoted bid and asked price. Price information on listed securities is taken from the exchange where the security is primarily traded. Other equity securities and debt securities for which market quotations are readily available are valued at the mean between their bid and asked price, except that debt securities maturing within 60 days are valued on an amortized cost basis. Debt securities are valued according to the broadest and most representative market, which will ordinarily be over-the-counter. Debt securities may be valued based on prices provided by a pricing service when such prices are believed to reflect the fair value of such securities. Securities for which market quotations are not readily available are valued at fair value as determined in good faith through consideration of other factors in accordance with procedures adopted by, and under the general supervision of, the Board of Trustees (“the Board”).
To the extent that a Fund invests in non-U.S. dollar denominated securities, the value of all assets and liabilities not denominated in United States dollars will be translated into United States dollars on the valuation date. Trading in securities on European and Far Eastern securities exchanges and over-the-counter markets is normally completed well before the close of business on each day the NYSE is open for business (a “business day”). In addition, European or Far Eastern securities trading generally or in a particular country or countries may not take place on all business days in New York. Furthermore, trading takes place in various foreign markets on days which are not business days in New York and on which net asset value is not calculated. Such calculation does not take place contemporaneously with the determination of the prices of the majority of the portfolio securities used in such calculation. Events affecting the values of portfolio securities that occur between the time their prices are determined and the close of the NYSE will not be reflected in a Fund’s calculation of net assets unless the Trustees deem that the particular event would materially affect net asset value, in which case an adjustment will be made.
In accordance with the authoritative guidance on fair value measurement and disclosure under GAAP, the Funds disclose the fair value of their investments in a hierarchy that prioritizes the inputs to valuation techniques used to measure the fair value. The objective of a fair value measurement is to determine the price that would be received to sell an asset or paid to transfer a liability in an orderly transaction between market participants at the measurement date (an exit price). Accordingly, the fair value hierarchy gives the highest priority to quoted prices (unadjusted) in active markets for identical assets or liabilities (Level 1) and the lowest priority to unobservable inputs (Level 3).
The three levels of the fair value hierarchy are described below:
| ● Level 1 — | Unadjusted quoted prices in active markets for identical, unrestricted assets or liabilities that the Funds have the ability to access at the measurement date; |
| ● Level 2 — | Other significant observable inputs (includes quoted prices for similar securities, interest rates, prepayment speeds, credit risk, referenced indices, quoted prices in inactive markets, adjusted quoted prices in active markets, etc.); and |
| ● Level 3 — | Prices, inputs or exotic modeling techniques which are both significant to the fair value measurement and unobservable (supported by little or no market activity). |
Investments are classified within the level of the lowest significant input considered in determining fair value. Investments classified within Level 3 whose fair value measurement considers several inputs may include Level 1 or Level 2 inputs as components of the overall fair value measurement.
For details of the investment classification, refer to the Schedules of Investments, Schedules of Securities Sold Short, Not Yet Purchased, Schedules of Open Options Purchased, Schedules of Open Options Written, open forward currency contracts and list of open swap contracts.
45
Notes to Financial Statements September 30, 2017 | |
2. Summary of Significant Accounting Policies (continued)
It is the Funds’ policy to recognize transfers into and out of Levels at the end of the reporting period. For the year ended September 30, 2017, there were no significant changes to the Funds’ fair value methodologies.
Securities Sold Short, Not Yet Purchased — As consistent with the RiverPark Long/Short Opportunity Fund’s investment objectives, the Fund intends to sell securities short so long as, as a result of that sale, the current value of securities sold short, not yet purchased by the Fund would not exceed 50% of the value of its gross assets (including the amounts borrowed) and 100% of the value of its net assets. As consistent with the RiverPark Strategic Income Fund’s investment objectives, the Fund intends to sell securities short so long as, as a result of that sale, the current value of securities sold short, not yet purchased by the Fund would not exceed 15% of the value of its net assets. A short sale is the sale by a fund of a security which it does not own in anticipation of purchasing the same security in the future. To complete such a transaction, the Funds must borrow the security to make delivery to the buyer. The Funds are then obligated to replace the security borrowed by purchasing the security at the market price at the time of the replacement. The price at such time may be more or less than the price at which the security was sold by the Funds. Until the security is replaced, the Funds are required to pay the lender amounts equal to any dividends that accrue during the period of the loan. Dividends and interest are shown as an expense for financial reporting purposes. To borrow the security, the Funds also may be required to pay a fee, which is shown as an expense for financial reporting purposes. The proceeds of the short sale are retained by the broker, to the extent necessary to meet margin requirements, until the short position is closed out. A realized gain, limited to the price at which the Funds sold the security short, or a realized loss, unlimited in size on a standalone basis, will be recognized upon the close of a short sale.
Until the Funds close their short position or replace the borrowed security, the Funds will maintain a segregated account with its custodian containing marginable securities. The Funds may be required to add to the segregated account as the market price of a shorted security increases. As a result of maintaining and adding to its segregated account, the Funds may maintain higher levels of marginable assets (for example, long equity positions) for collateral needs thus reducing their overall managed assets available for trading purposes.
Written/Purchased Options — Each of the Funds may purchase call and put options on securities to seek capital growth or for hedging purposes. Each Fund may also write and sell covered call and put options as well as purchase and write options on stock indices (such as the S&P 500 Index) listed on domestic or foreign securities exchanges or traded in the over-the-counter market for hedging purposes. Additionally, the RiverPark Long/Short Opportunity Fund and RiverPark Strategic Income Fund may sell uncovered call and put options on securities and stock indices.
The RiverPark Long/Short Opportunity Fund and RiverPark Strategic Income Fund may invest up to 50% of the value of their assets, represented by premiums paid, to purchase call and put options on securities and securities indices. The Funds may write covered call and put options on securities and securities indices, so long as the aggregate nominal value does not exceed 200% of the value of its assets.
An option on a security provides the purchaser, or “holder,” with the right, but not the obligation, to purchase, in the case of a “call” option, or sell, in the case of a “put” option, the security or securities underlying the option, for a fixed exercise price up to a stated expiration date. The holder pays a nonrefundable purchase price for the option, known as the “premium.” The maximum amount of risk the purchaser of the option assumes is equal to the premium plus related transaction costs, although the entire amount may be lost. The risk of the seller, or “writer,” however, is potentially unlimited, unless the option is “covered,” which is generally accomplished through the writer’s ownership of the underlying security, in the case of a call option, or the writer’s segregation of an amount of cash or securities equal to the exercise price, in the case of a put option. If the writer’s obligation is not covered, it is subject to the risk of the full change in value of the underlying security from the time the option is written until exercise.
46
Notes to Financial Statements September 30, 2017 | |
2. Summary of Significant Accounting Policies (continued)
Purchased and written equity options transactions entered into during the year ended September 30, 2017 are summarized as follows:
| RiverPark Long/Short Opportunity Fund | Purchased Options | Written Options | ||||||||||||||
| Number of Contracts | Cost | Number of Contracts | Premiums Received | |||||||||||||
| Balance at the beginning of the year | — | $ | — | — | $ | — | ||||||||||
| Written | — | — | 1,040 | 69,636 | ||||||||||||
| Purchased | 1,040 | 281,882 | — | — | ||||||||||||
| Expired | (1,040 | ) | (281,882 | ) | (1,040 | ) | (69,636 | ) | ||||||||
| Balance at the end of the year | — | $ | — | — | $ | — | ||||||||||
| RiverPark Strategic Income Fund | Purchased Options | Written Options | ||||||||||||||
| Number of Contracts | Cost | Number of Contracts | Premiums Received | |||||||||||||
| Balance at the beginning of the period | 500 | $ | 93,020 | — | $ | — | ||||||||||
| Excercised | (500 | ) | (93,020 | ) | — | — | ||||||||||
| Balance at the end of the period | — | $ | — | — | $ | — | ||||||||||
The realized and unrealized gain (loss) from purchased and written options are disclosed separately on the Statements of Operations.
All purchased and written options have equity risk exposure.
Swap Agreements — The Funds may invest in equity-linked securities, including, but not limited to, participation notes, certificates, and equity swaps. Equity-linked securities are privately issued securities whose investment results are designed to correspond generally to the performance of a specified stock index or “basket” of stocks, or a single stock. To the extent that the Funds invest in equity-linked securities whose return corresponds to the performance of a foreign security index or one or more foreign stocks, investing in equity-linked securities will involve risks similar to the risks of investing in foreign securities and subject to each Fund’s restrictions on investments in foreign securities.
Equity swaps allow the parties to a swap agreement to exchange the dividend income or other components of return on an equity investment (for example, a group of equity securities or an index) for a component of return on another non-equity or equity investment. An equity swap may be used by a Fund to invest in a market without owning or taking physical custody of securities in circumstances in which direct investment may be restricted for legal reasons or is otherwise deemed impractical or disadvantageous. Equity swaps may also be used for hedging purposes or to seek to increase exposure and total return. A Fund’s ability to enter into certain swap transactions may be limited by tax considerations. The counterparty to an equity swap contract will typically be a bank, investment banking firm or broker/dealer.
47
Notes to Financial Statements September 30, 2017 | |
2. Summary of Significant Accounting Policies (continued)
Equity swap contracts may be structured in different ways. For example, a counterparty may agree to pay the Fund the amount, if any, by which the notional amount of the equity swap contract would have increased in value had it been invested in particular stocks (or an index of stocks), plus the dividends that would have been received on those stocks. In these cases, the Fund may agree to pay to the counterparty a floating rate of interest on the notional amount of the equity swap contract plus the amount, if any, by which that notional amount would have decreased in value had it been invested in such stocks. Therefore, the return to the Fund on the equity swap contract should be the gain or loss on the notional amount plus dividends on the stocks less the interest paid by the Fund on the notional amount. In other cases, the counterparty and the Fund may each agree to pay the other the difference between the relative investment performances that would have been achieved if the notional amount of the equity swap contract had been invested in different stocks (or indices of stocks). A Fund will generally enter into equity swaps on a net basis, which means that the two payment streams are netted out, with the Fund receiving or paying, as the case may be, only the net amount of the two payments. Payments may be made at the conclusion of an equity swap contract or monthly during its term.
Equity swaps are derivatives and their value can be very volatile. Equity swaps normally do not involve the delivery of securities or other underlying assets. Accordingly, the risk of loss with respect to equity swaps is normally limited to the net amount of payments that a Fund is contractually obligated to make. If the counterparty to an equity swap defaults, a Fund’s risk of loss consists of the net amount of payments that such Fund is contractually entitled to receive. Because some swap agreements have a leverage component, adverse changes in the value or level of the underlying asset, reference rate, or index can result in a loss substantially greater than the cost of the underlying asset without the use of leverage. In addition, the value of some components of an equity swap (such as the dividends on a common stock) may also be sensitive to changes in interest rates. To the extent that the Adviser does not accurately analyze and predict the potential relative fluctuation of the components swapped with another party, a Fund may suffer a loss. Because equity swaps are normally illiquid, a Fund may be unable to terminate its obligations when desired. When entering into swap contracts, a Fund must “set aside” liquid assets, or engage in other appropriate measures to “cover” its obligation under the swap contract.
All swaps held by the RiverPark Long/Short Opportunity Fund during the year ended September 30, 2017 had equity risk exposure.
Swaps are marked-to-market daily and are valued at the unrealized appreciation or depreciation on the instrument based upon quotations from market makers and the resulting changes in market values, if any, are recorded as an unrealized gain or loss in the Statements of Operations. Monthly reset payments on the total return swap are inclusive of interest, commissions and dividends which are recorded as part of the net realized gains and losses in the Statement of Operations. Net realized gain on swap contracts was $2,480,185 for the year ended September 30, 2017. The total return swaps reset monthly, as such there was $0 unrealized appreciation (depreciation) as of September 30, 2017. The total return swaps that the RiverPark Long/Short Opportunity Fund transacts in are subject to a netting arrangement.
Total return swap transactions entered into during the year ended September 30, 2017 are summarized as follows:
| RiverPark Long/Short Opportunity Fund | Total Return Swaps | |||
| Number of Contracts | ||||
| Swap contracts outstanding at the beginning of the year | 444,287 | |||
| Opened | 514,315 | |||
| Closed | (487,523 | ) | ||
| Swap contracts outstanding at the end of the year | 471,079 | |||
This turnover is inclusive of monthly swap resets, swap expirations and swap transactions with the counterparty. The open swap contracts are collateralized by $250,000 in cash.
48
Notes to Financial Statements September 30, 2017 | |
2. Summary of Significant Accounting Policies (continued)
Master Limited Partnerships — The Funds may invest in master limited partnerships (“MLPs”). MLPs are limited partnerships or limited liability companies, whose partnership units or limited liability interests are listed and traded on a U.S. securities exchange, and are treated as publicly traded partnerships for federal income tax purposes. To qualify to be treated as a partnership for tax purposes, an MLP must receive at least 90% of its income from qualifying sources as set forth in Section 7704(d) of the Internal Revenue Code of 1986, as amended (the “Code”). These qualifying sources include interest, dividend, real property rent, gain from sale or other disposition of real property and income from activities such as the exploration, development, mining, production, processing, refining, transportation, storage and marketing of mineral or natural resources. MLPs generally have two classes of owners, the general partner and limited partners. MLPs that are formed as limited liability companies generally have two analogous classes of owners, the managing member and the members. For purposes of this section, references to general partners also apply to managing members and references to limited partners also apply to members. The general partner is typically owned by a major energy company, an investment fund, the direct management of the MLP or is an entity owned by one or more of such parties. The general partner may be structured as a private or publicly traded corporation or other entity. The general partner typically controls the operations and management of the MLP through an equity interest of as much as 2% in the MLP plus, in many cases, ownership of common units and subordinated units. Limited partners own the remainder of the MLP through ownership of common units and have a limited role in the MLP’s operations and management.
An investment in MLP units involves certain risks which differ from an investment in the securities of a corporation. Holders of MLP units have limited control and voting rights on matters affecting the partnership. In addition, there are certain tax risks associated with an investment in MLP units and conflicts of interest exist between common unit holders and the general partner, including those arising from incentive distribution payments. As a partnership, an MLP has no tax liability at the entity level. If, as a result of a change in current law or a change in an MLP’s business, an MLP were treated as a corporation for federal income tax purposes, such MLP would be obligated to pay federal income tax on its income at the corporate tax rate. If an MLP were classified as a corporation for federal income tax purposes, the amount of cash available for distribution by the MLP would be reduced and distributions received by investors would be taxed under federal income tax laws applicable to corporate dividends (as dividend income, return of capital, or capital gain). Therefore, treatment of an MLP as a corporation for federal income tax purposes would result in a reduction in the after-tax return to investors, likely causing a reduction in the value of the Funds’ shares. Dividends from MLPs are recorded on the ex-dividend date.
Investment Transactions — Security transactions are accounted for on the trade date, the date the order to buy or sell is executed. Costs used in determining realized gains and losses on the sales of investment securities are those of the specific securities sold. Discounts or premiums are accreted or amortized to interest income using the effective interest method. Interest income is recognized on the accrual basis from settlement date. Dividend income and expenses and other distributions are recorded on the ex-dividend date, except certain dividends and distributions from foreign securities which are recorded as soon as a Fund is informed after the ex-dividend date. Withholding taxes on foreign dividends have been provided for in accordance with the Funds’ understanding of the applicable country’s tax rules and rates. The ability of issuers of debt securities held by the Funds to meet their obligations may be affected by economic and political developments in a specific country or region.
Defaulted Investments — Debt obligations may be placed on non-accrual status and related interest income may be reduced by ceasing current accruals and writing off interest receivable when the collection of all or a portion of interest has become doubtful based on consistently applied procedures. A debt obligation is removed from non-accrual status when the issuer resumes interest payments or when collectability of interest is reasonably assured.
Expenses — Expenses of the Trust that can be directly attributed to a particular Fund are borne by that Fund. Expenses which cannot be directly attributed to a Fund are apportioned among the Funds of the Trust based on the number of Funds and/or relative net assets.
Classes — Class specific expenses are borne by that class of shares. Income, realized and unrealized gains and losses and non-class specific expenses are allocated to the respective class on the basis of relative daily net assets.
49
Notes to Financial Statements September 30, 2017 | |
2. Summary of Significant Accounting Policies (continued)
Foreign Currency Translation — The books and records of the Funds are maintained in U.S. dollars. Investment securities and other assets and liabilities denominated in a foreign currency are translated into U.S. dollars on the date of valuation. The Fund’s do not isolate that portion of realized or unrealized gains and losses resulting from changes in the foreign exchange rate from fluctuations arising from changes in the market prices of the securities. These gains and losses are included in net realized and unrealized gains and losses on investments on the Statements of Operations. Net realized and unrealized gains and losses on foreign currency transactions represent net foreign exchange gains or losses from foreign currency exchange contracts, disposition of foreign currencies, currency gains or losses realized between trade and settlement dates on securities transactions and the difference between the amount of the investment income and foreign withholding taxes recorded on the Fund’s books and the U.S. dollar equivalent amounts actually received or paid.
Forward Foreign Currency Exchange Contracts — Each Fund may, but is not obligated to, enter into forward foreign currency exchange contracts (“forward contracts”) in order to protect against uncertainty in the level of future foreign exchange rates in the purchases and sale of securities. A forward contract generally has no deposit requirement, and no commissions are charged at any stage for trades. Although foreign exchange dealers do not charge a fee for commissions, they do realize a profit based on the difference between the price at which they are buying and selling various currencies. Although forward contracts are intended to minimize currency risk — the risk of loss due to a decline in the value of the hedged currencies — at the same time, they tend to limit any potential gain which might result should the value of such currencies increase. As of September 30, 2017, the RiverPark Strategic Income Fund held forward contracts as currency hedges against foreign bonds. It is the Funds’ policy to present the gross unrealized appreciation and gross unrealized depreciation of the forward contracts separately on the Statements of Assets and Liabilities as the Funds do not have a master netting agreement with the counterparty to the forward contracts. In accordance with this policy, the unrealized appreciation as of September 30, 2017 is presented as unrealized appreciation on forward foreign currency contracts on the Statements of Assets and Liabilities. Realized and unrealized gains (losses) on forward contracts are disclosed separately on the Statements of Operations. For the year ended September 30, 2017, the total amount of open forward foreign currency contracts, as presented in the RiverPark Strategic Income Fund’s Schedule of Investments, are representative of the volume of activity for this derivative type during the period.
The forward foreign currency contracts held by the RiverPark Strategic Income Fund during the year ended September 30, 2017 had currency risk exposure.
Dividends and Distributions to Shareholders — Dividends from net investment income are declared and paid to shareholders annually for the RiverPark Large Growth Fund, RiverPark/Wedgewood Fund, RiverPark Long/Short Opportunity Fund and RiverPark Focused Value Fund and declared and paid monthly for the RiverPark Short Term High Yield Fund and RiverPark Strategic Income Fund. Dividends and distributions are recorded on the ex-dividend date. Any net realized capital gains will be distributed at least annually by the Funds.
Income Taxes — Each Fund intends to qualify or continue to qualify as a “regulated investment company” under Sub-chapter M of the Internal Revenue Code of 1986, as amended. If so qualified, each Fund will not be subject to federal income tax to the extent it distributes substantially all of its net investment income and net capital gains to its shareholders.
The Funds evaluate tax positions taken or expected to be taken in the course of preparing the Funds’ tax returns to determine whether it is “more-likely-than not” (i.e., greater than 50-percent) that each tax position will be sustained upon examination by a taxing authority based on the technical merits of the position. Tax positions not deemed to meet the more-likely-than-not threshold are recorded as a tax benefit or expense in the current year. The Funds did not record any tax provision in the current period. However, management’s conclusions regarding tax positions taken may be subject to review and adjustment at a later date based on factors including, but not limited to, examination by tax authorities (i.e., the last 3 tax year ends, as applicable), on-going analysis of, and changes to, tax laws, regulations and interpretations thereof.
As of and during the year ended September 30, 2017, the Funds did not have a tax liability for any unrecognized tax benefits. The Funds recognize interest and penalties, if any, related to unrecognized tax benefits as income tax expense in the Statements of Operations. During the year, the Funds did not incur any significant interest or penalties.
50
Notes to Financial Statements September 30, 2017 | |
3. Derivative Transactions
The fair value of derivative instruments as of September 30, 2017:
| Statement of Assets and Liabilities | |||||||||
| Fund | Location | Asset Derivatives | Liability Derivatives | ||||||
| RiverPark Strategic Income Fund | |||||||||
| Foreign exchange contracts (Currency Risk) | |||||||||
| Forward contracts | Unrealized appreciation on forward foreign currency contracts | $ | 15 | $ | — | ||||
| $ | 15 | $ | — | ||||||
The effect of derivative instruments on the Statements of Operations for the year ended September 30, 2017 was as follows:
The amount of net realized gain (loss) and change in unrealized appreciation (depreciation) on derivatives:
| Fund | Net Realized Gain/(Loss) | Change in Unrealized Appreciation (Depreciation) | Total | |||||||||
| RiverPark Long/Short Opportunity Fund | ||||||||||||
| Equity contracts (Equity Risk) | ||||||||||||
| Purchased Options | $ | (282 | ) | $ | — | $ | (282 | ) | ||||
| Written Options | 70 | — | 70 | |||||||||
| Swaps Contracts | 2,480 | — | * | 2,480 | ||||||||
| $ | 2,268 | $ | — | $ | 2,268 | |||||||
| RiverPark Strategic Income Fund | ||||||||||||
| Equity contracts (Equity Risk) | ||||||||||||
| Purchased Options | $ | — | $ | (41 | ) | $ | (41 | ) | ||||
| Foreign exchange contracts (Currency Risk) | ||||||||||||
| Forward Foreign Currency Contracts | 34 | (9 | ) | 25 | ||||||||
| $ | 34 | $ | (50 | ) | $ | (16 | ) | |||||
| * | As of September 30, 2016 and March 31, 2017, due to the nature of the monthly reset, the net unrealized on swap contracts was $0 for the RiverPark Long/Short Opportunity Fund. |
4. Agreements
Investment Advisory Agreement — RiverPark Advisors, LLC (“RiverPark”) serves as the Funds’ investment adviser (the “Adviser”). The Adviser has contractually agreed to waive its fees and to absorb expenses of each Fund through January 31, 2018 to the extent necessary to ensure that ordinary operating expenses of each class (excluding interest, brokerage commissions, dividends on short sales and interest expense on securities sold short, not yet purchased, acquired fund fees and expenses and extraordinary expenses) do not exceed, on an annual basis, certain levels as set forth below.
51
Notes to Financial Statements September 30, 2017 | |
4. Agreements (continued)
The table below shows the rate of each Fund’s investment advisory fee and the Adviser’s contractual expense limitation for each Fund:
| Fund | Advisory Fee Before Contractual Fee Reduction | Expense Limitation (Institutional Class) | Expense Limitation (Retail Class) | Expense Limitation (Class C)* |
| RiverPark Large Growth Fund | 0.65% | 1.00% | 1.25% | 2.00% |
| RiverPark/Wedgewood Fund | 0.65% | 1.00% | 1.25% | 2.00% |
| RiverPark Short Term High Yield Fund | 0.65% | 1.00% | 1.25% | N/A |
| RiverPark Long/Short Opportunity Fund | 1.50% | 1.85% | 2.00% | 2.85% |
| RiverPark Strategic Income Fund | 0.65% | 1.00% | 1.25% | 2.00% |
| RiverPark Focused Value Fund | 0.65% | 1.00% | 1.25% | 2.00% |
| * | Class C Shares are not currently being offered for sale to investors. |
The Funds have each agreed to repay the Adviser in the amount of any fees waived and Fund expenses absorbed, subject to the limitations that: (1) the reimbursement is made only for fees and expenses incurred not more than three years prior to the date of reimbursement; and (2) the reimbursement may not be made if it would cause the expense limitation in effect at the time the fees were waived or Fund expenses were absorbed, to be exceeded. This arrangement will remain in effect unless and until the Board approves its modification or termination. The Adviser can recapture any fees it has waived within a three-year period subject to the applicable annual rates in the above table.
For the year ended September 30, 2017, the Adviser fee waiver analysis is as follows:
| Fund | Unexpired Fee Waivers at September 30, 2016 | Fees Waived for the Period Ended September 30, 2017 | Fees Recaptured for the Period Ended September 30, 2017 | Fee Waivers Expired for the Period Ended September 30, 2017 | Unexpired Fee Waivers at September 30, 2017 | |||||||||||||||
| RiverPark Long/Short Opportunity Fund | $ | — | $ | 3,714 | $ | — | $ | — | $ | 3,714 | ||||||||||
| RiverPark Focused Value Fund | 15,289 | 209 | (15,289 | ) | — | 209 | ||||||||||||||
As of September 30, 2017, the Adviser may in the future seek reimbursement of previously waived fees for the Funds as follows:
| Fund | Expiring 2018 | Expiring 2019 | Expiring 2020 | Total | ||||||||||||
| RiverPark Long/Short Opportunity Fund | $ | — | $ | — | $ | 3,714 | $ | 3,714 | ||||||||
| RiverPark Focused Value Fund | — | — | 209 | 209 | ||||||||||||
RiverPark provides day-to-day portfolio management services to the RiverPark Large Growth Fund, RiverPark Long/Short Opportunity Fund and RiverPark Focused Value Fund. The Adviser has discretion to purchase and sell securities in accordance with these Funds’ objectives, policies, and restrictions.
52
Notes to Financial Statements September 30, 2017 | |
4. Agreements (continued)
RiverPark oversees the day-to-day portfolio management services provided by the following sub-advisers:
| Fund | Investment Sub-Adviser |
| RiverPark/Wedgewood Fund | Wedgewood Partners, Inc. |
| RiverPark Short Term High Yield Fund | Cohanzick Management, LLC |
| RiverPark Strategic Income Fund | Cohanzick Management, LLC |
The discretion to purchase and sell securities in accordance with these Funds’ objectives, policies, and restrictions has been delegated by the Adviser to Wedgewood Partners, Inc. (“Wedgewood”) and Cohanzick Management, LLC with regard to each respective Fund to which such parties serve as sub-adviser. The Adviser pays the sub-advisers a monthly fee based upon the net assets managed by such sub-adviser from the management fee paid to the Adviser pursuant to the Investment Advisory Agreement. The Funds are not responsible for the payment of the sub-advisory fees.
RiverPark (and its affiliated advisers) and Wedgewood may be considered to be affiliates as RiverPark shareholders own approximately 6% of Wedgewood Partners, and Wedgewood owns 2.5% of RiverPark’s holding company. For its services as sub-adviser to the RiverPark/Wedgewood Fund, Wedgewood is entitled to a fee to be paid from RiverPark’s adviser fee, and such fee is calculated daily and paid monthly at an annual rate of 0.325% of RiverPark/Wedgewood Fund’s average net assets in excess of $50,000,000.
Administrator, Custodian and Transfer Agent — SEI Investments Global Funds Services (the “Administrator”) serves as the Funds’ administrator pursuant to an Administration Agreement under which the Administrator provides administrative and accounting services. For these services, the Administrator is paid an asset-based fee, which will vary depending on the number of share classes and average daily net assets of the Fund. For the year ended September 30, 2017, the Funds were charged $1,586,046 for these services.
Brown Brothers Harriman & Co. (the “Custodian”) serves as the Funds’ custodian pursuant to a Custodian Agreement. DST Systems, Inc. (the Transfer Agent”) serves as the Funds’ transfer agent pursuant to an Agency Agreement.
Distribution Agreement — SEI Investments Distribution Co., a wholly-owned subsidiary of SEI Investments Company and an affiliate of the Administrator (the “Distributor”) serves as the Funds’ distributor pursuant to a Distribution Agreement.
The Trust has adopted a shareholder services plan under which a shareholder servicing fee may be paid at an annual rate of up to 0.25% of average daily net assets attributable to Retail Class Shares and Institutional Class Shares of the Funds to banks and their affiliates and other institutions, including broker-dealers, as compensation for providing non-distribution related shareholder services. Aggregate compensation for the Institutional Class Shares will not exceed on an annual basis 0.15% of the average daily net assets of such class. As of September 30, 2017, there were no shareholder servicing fees charged to Institutional Class Shares.
The Trust has adopted an administrative services plan under which each Fund may pay a non-distribution related administrative services fee at an annual rate of up to 0.20% and 0.15% of the average daily net assets of the Retail Class Shares and Institutional Class Shares, respectively, to financial institutions, retirement plans, broker-dealers, depository institutions, institutional shareholders of record, registered investment advisers and other financial intermediaries and various brokerage firms or other industry recognized service providers of fund supermarkets or similar programs who provide administrative, recordkeeping and support servicing to their customers.
Other — Certain officers and Trustees of the Trust are also officers of the Adviser and the Administrator. Such officers are paid no fees by the Trust for serving as officers of the Trust.
The services provided by the Chief Compliance Officer (“CCO”) and any staff are paid for by the Funds as incurred. The services include regulatory oversight of the Trust’s Adviser, sub-advisers and service providers as required by SEC regulations.
53
Notes to Financial Statements September 30, 2017 | |
5. Investment Transactions
The cost of security purchases and proceeds from security sales and maturities, other than short-term investments, short sales, purchases to cover, written and purchased options, and short-term securities for the year ended September 30, 2017, were as follows:
| Fund | Purchases (000) | Proceeds from Sales and Maturities (000) | ||||||
| RiverPark Large Growth Fund | $ | 6,870 | $ | 35,121 | ||||
| RiverPark/Wedgewood Fund | 349,564 | 1,351,984 | ||||||
| RiverPark Short Term High Yield Fund | 2,932,489 | 693,179 | ||||||
| RiverPark Long/Short Opportunity Fund | 23,278 | 63,938 | ||||||
| RiverPark Strategic Income Fund | 296,334 | 384,686 | ||||||
| RiverPark Focused Value Fund | 14,002 | 18,450 | ||||||
There were no purchases or sales of long-term U.S. Government securities for the year ended September 30, 2017.
The RiverPark Strategic Income Fund and the Destinations Global Fixed Income Opportunities Fund engaged in cross trades with each other during the year ended September 30, 2017 pursuant to Rule 17a-7 under the 1940 Act. The Board previously adopted procedures that apply to transactions between the Funds and its affiliates pursuant to Rule 17a-7. At its regularly scheduled meetings, the Board reviews such transactions as of the most current calendar quarter for compliance with the requirements set forth by Rule 17a-7 and the Funds’ procedures. The procedures require that the transactions be a purchase or sale for no consideration other than cash payment against prompt delivery of a security for which market quotations are readily available, and be consistent with the investment policies of each Fund. The RiverPark Strategic Income Fund sold securities to the affiliated Destinations Global Fixed Income Opportunities Fund in the amount of $157,314,505, resulting in a realized loss of $511,051 in the Strategic Income Fund.
6. Federal Tax Information
The amount and character of income and capital gain distributions to be paid, if any, are determined in accordance with Federal income tax regulations, which may differ from GAAP. As a result, net investment income (loss) and net realized gain (loss) on investment transactions for a reporting period may differ significantly from distributions during the year. The book/tax differences may be temporary or permanent. To the extent these differences are permanent in nature, they are charged or credited to undistributed net investment income (loss), accumulated net realized gain (loss) or paid-in capital as appropriate, in the period that the difference arises.
Accordingly the following permanent differences are primarily attributable to basis adjustment on carryover securities, distribution reclassification, equalization credits, non-deductible expenses, net operating losses, losses on paydowns, investments in swaps, currency transactions and REIT adjustments which have been classified to/from the following components of net assets (000):
| Fund | Undistributed Net Investment Income (Loss) | Accumulated Realized Gain (Loss) | Paid-in Capital | |||||||||
| RiverPark Large Growth Fund | $ | 35 | $ | (35 | ) | $ | — | |||||
| RiverPark/Wedgewood Fund | 497 | (14,477 | ) | 13,980 | ||||||||
| RiverPark Short Term High Yield Fund | (34 | ) | 34 | — | ||||||||
| RiverPark Long/Short Opportunity Fund | 2,912 | (2,418 | ) | (494 | ) | |||||||
| RiverPark Strategic Income Fund | (1,625 | ) | 1,625 | — | ||||||||
| RiverPark Focused Value Fund | 3 | (1 | ) | (2 | ) | |||||||
54
Notes to Financial Statements September 30, 2017 | |
6. Federal Tax Information (continued)
These reclassifications have no impact on net assets or net asset value per share.
The tax character of dividends and distributions declared during the last two years or periods ended September 30, 2017 was as follows (000):
| Fund | Ordinary Income | Long-Term Capital Gain | Return of Capital | Total | ||||||||||||
| RiverPark Large Growth Fund | ||||||||||||||||
| 2017 | $ | 206 | $ | 30 | $ | — | $ | 236 | ||||||||
| 2016 | 1 | 1,340 | — | 1,341 | ||||||||||||
| RiverPark/Wedgewood Fund | ||||||||||||||||
| 2017 | 2,353 | — | — | 2,353 | ||||||||||||
| 2016 | 11,249 | 78,730 | — | 89,979 | ||||||||||||
| RiverPark Short Term High Yield Fund | ||||||||||||||||
| 2017 | 24,417 | — | — | 24,417 | ||||||||||||
| 2016 | 24,991 | — | — | 24,991 | ||||||||||||
| RiverPark Strategic Income Fund | ||||||||||||||||
| 2017 | 27,046 | — | — | 27,046 | ||||||||||||
| 2016 | 33,527 | — | — | 33,527 | ||||||||||||
| RiverPark Focused Value Fund | ||||||||||||||||
| 2017 | 381 | — | — | 381 | ||||||||||||
| 2016 | 275 | — | — | 275 | ||||||||||||
There were no distributions declared during the last two years or periods ended September 30 in the RiverPark Long/Short Opportunity Fund.
As of September 30, 2017, the components of distributable earnings/(accumulated losses) on a tax basis were as follows (000):
| Fund | Undistributed Ordinary Income | Undistributed Long-Term Capital Gain | Capital Loss Carryforward | Post-October Losses | Unrealized Appreciation (Depreciation) | Other Temporary Differences | Current Year Loss Deferral | Total Distributable Earnings (Accumulated Losses) | ||||||||||||||||||||||||
| RiverPark Large Growth Fund | $ | — | $ | 4,117 | $ | — | $ | — | $ | 16,531 | $ | 1 | $ | — | $ | 20,649 | ||||||||||||||||
| RiverPark/Wedgewood Fund | — | 62,752 | — | — | 187,718 | 5 | (879 | ) | 249,596 | |||||||||||||||||||||||
| RiverPark Short Term High Yield Fund | 282 | — | (19,311 | ) | — | (2,257 | ) | (1 | ) | — | (21,287 | ) | ||||||||||||||||||||
| RiverPark Long/Short Opportunity Fund | — | 379 | — | — | 27,373 | (1,043 | ) | — | 26,709 | |||||||||||||||||||||||
| RiverPark Strategic Income Fund | 99 | — | (40,502 | ) | — | (9,624 | ) | 1 | — | (50,026 | ) | |||||||||||||||||||||
| RiverPark Focused Value Fund | 328 | — | (3,513 | ) | — | 2,572 | — | — | (613 | ) | ||||||||||||||||||||||
Deferred late-year losses represent ordinary losses realized on investment transactions from January 1, 2017 through September 30, 2017 and specified losses realized on investment transactions from November 1, 2016 through September 30, 2017. The RiverPark Wedgewood Fund elects to defer the late-year loss of $879,145 and to treat it as having arisen in the following fiscal year.
55
Notes to Financial Statements September 30, 2017 | |
6. Federal Tax Information (continued)
Under the Regulated Investment Company Modernization Act of 2010, the Funds are permitted to carry forward capital losses incurred in taxable years beginning after December 22, 2010 for an unlimited period. Post-enactment capital losses that are carried forward will retain their character as either short-term or long-term capital losses rather than being considered all short-term as under previous law. Capital loss carryforwards under the new provisions are as follows (000):
| Fund | Short Term Loss | Long Term Loss | Total | |||||||||
| RiverPark Short Term High Yield Fund | $ | 14,009 | $ | 5,302 | $ | 19,311 | ||||||
| RiverPark Strategic Income Fund | 6,411 | 34,091 | 40,502 | |||||||||
| RiverPark Focused Value Fund | 890 | 2,623 | 3,513 | |||||||||
During the year ended September 30, 2017, the following funds utilized capital loss carryforwards to offset capital gains as follows (000):
| Fund | Short Term Loss | Long Term Loss | Total | |||||||||
| RiverPark Large Growth Fund | $ | 451 | $ | 172 | $ | 623 | ||||||
| RiverPark/Wedgewood Fund | 2,326 | 27,783 | 30,109 | |||||||||
| RiverPark Long/Short Opportunity Fund | 1,860 | — | 1,860 | |||||||||
For federal income tax purposes, the cost of investments owned at September 30, 2017 and the net realized gains or losses on securities sold for the period could be different from amounts reported for financial reporting purposes, due to partnership basis adjustments and book versus tax adjustment such as wash sales which cannot be used for federal income tax purposes in the current year and have been deferred for use in future years. The federal tax cost and aggregate gross unrealized appreciation and depreciation on investments held by the Funds were as follows (000):
| Fund | Federal Tax Cost | Aggregate Gross Unrealized Appreciation | Aggregate Gross Unrealized Depreciation | Net Unrealized Appreciation (Depreciation) | ||||||||||||
| RiverPark Large Growth Fund | $ | 29,827 | $ | 18,426 | $ | (1,895 | ) | $ | 16,531 | |||||||
| RiverPark/Wedgewood Fund | 409,148 | 196,060 | (8,342 | ) | 187,718 | |||||||||||
| RiverPark Short Term High Yield Fund | 846,416 | 419 | (2,676 | ) | (2,257 | ) | ||||||||||
| RiverPark Long/Short Opportunity Fund | 51,317 | 34,931 | (7,558 | ) | 27,373 | |||||||||||
| RiverPark Strategic Income Fund | 399,903 | 3,611 | (13,235 | ) | (9,624 | ) | ||||||||||
| RiverPark Focused Value Fund | 36,833 | 5,090 | (2,518 | ) | 2,572 | |||||||||||
Subsequent to September 30, 2017, the following Funds paid distributions:
| Fund | Ex Date | Record Date | Payable Date | Rate (per share) |
| RiverPark Short Term High Yield Fund | ||||
| Institutional Class Shares | October 31, 2017 | October 30, 2017 | November 1, 2017 | 0.0136 |
| Retail Class Shares | October 31, 2017 | October 30, 2017 | November 1, 2017 | 0.0115 |
| RiverPark Strategic Income Fund | ||||
| Institutional Class Shares | October 31, 2017 | October 30, 2017 | November 1, 2017 | 0.0366 |
| Retail Class Shares | October 31, 2017 | October 30, 2017 | November 1, 2017 | 0.0345 |
56
Notes to Financial Statements September 30, 2017 | |
7. Risks
The RiverPark Short Term High Yield Fund and RiverPark Strategic Income Fund invest in fixed-income instruments that are or are rated below investment grade by Moody’s Investors Service, Inc. and Standard & Poor’s Corporation and accordingly involve greater risk. Such securities are regarded as predominantly speculative with respect to the issuer’s capacity to pay interest and repay principal in accordance with the terms of the obligations and involve major risk to adverse conditions. These securities offer higher returns than bonds with higher ratings as compensation for holding an obligation of an issuer perceived to be less creditworthy. Changes in economic conditions or developments regarding issuers of non-investment grade debt securities are more likely to cause price volatility and weaken the capacity of such issuers to make principal and interest payments than is the case for higher grade debt securities. In addition, the market for lower grade debt securities may be thinner and less active than for higher grade debt securities.
High-yield securities are generally not exchange-traded and, as a result, these instruments trade in a smaller secondary market than exchange-traded bonds. In addition, the Funds invest in bonds of issuers that do not have publicly traded equity securities, making it more difficult to hedge the risks associated with such investments.
The RiverPark Short Term High Yield Fund and RiverPark Strategic Income Fund may invest in securities of companies that are experiencing significant financial or business difficulties, including companies involved in bankruptcy or other reorganization and liquidation proceedings. Although such investments may result in significant returns to the Funds, they involve a substantial degree of risk.
The RiverPark Long/Short Opportunity Fund and RiverPark Strategic Income Fund are exposed to the risks of using leverage and short sales. The RiverPark Long/Short Opportunity Fund and RiverPark Strategic Income Fund may use leverage. Leverage is the practice of borrowing money to purchase securities. These investment practices involve special risks. Leverage can increase the investment returns of the RiverPark Long/Short Opportunity Fund and RiverPark Strategic Income Fund if the securities purchased increase in value in an amount exceeding the cost of the borrowing. However, if the securities decrease in value, the RiverPark Long/Short Opportunity Fund and RiverPark Strategic Income Fund will suffer a greater loss than would have resulted without the use of leverage. A short sale is the sale by the RiverPark Long/Short Opportunity Fund and RiverPark Strategic Income Fund of a security which it does not own in anticipation of purchasing the same security in the future at a lower price to close the short position. A short sale will be successful if the price of the shorted security decreases. However, if the underlying security goes up in price during the period in which the short position is outstanding, the RiverPark Long/Short Opportunity Fund and RiverPark Strategic Income Fund will recognize a loss. The risk on a standalone or unhedged short sale is unlimited because the RiverPark Long/Short Opportunity Fund and RiverPark Strategic Income Fund must buy the shorted security at the higher price to complete the transaction. Therefore, short sales may be subject to greater risks than investments in long positions. With a long position, the maximum sustainable loss is limited to the amount paid for the security plus the transaction costs, whereas there is no maximum attainable price of the shorted security.
The RiverPark Long/Short Opportunity Fund and RiverPark Strategic Income Fund are able to invest in options which expose investors to the risks inherent in trading options. These risks include, but are not limited to, volatile movements in the price of the underlying instrument and misjudgments as to the future prices of the options and/or the underlying instrument. Increased option volatility can increase both the profit potential and the risk associated with a fund’s trading. While volatility can be monitored and reacted to, there is no cost-effective means of hedging against market volatility.
Selling options creates additional risks. The seller of a “naked” call option (or the seller of a put option who has a short position in the underlying instrument) is subject to the risk of a rise in the price in the underlying instrument above the strike price, which risk is reduced only by the premium received for selling the option. In exchange for the proceeds received from selling the call option (in lieu of an outright short position), the option seller gives up (or will not participate in) all of the potential gain resulting from a decrease in the price of the underlying instrument below the strike price prior to expiration of the option.
57
Notes to Financial Statements September 30, 2017 | |
7. Risks (continued)
The seller of a “naked” put option (or the seller of a call option who has a long position in the underlying instrument) is subject to the risk of a decline in price of the underlying instrument below the strike price, which risk is reduced only by the proceeds received from selling the option. In exchange for the premium received for selling the put option (in lieu of an outright long position), the option seller gives up (or will not participate in) all of the potential gain resulting from an increase in the price of the underlying instrument above the strike price prior to the expiration of the option. Due to the inherent leveraged nature of options, a relatively small adverse move in the price of the underlying instrument may result in immediate and substantial losses to a Fund.
The RiverPark Long/Short Opportunity Fund invests in swaps. The use of swaps is a highly specialized activity that involves investment techniques, risk analyses and tax planning different from those associated with ordinary portfolio securities transactions. These transactions can result in sizeable realized and unrealized capital gains and losses relative to the gains and losses from the Fund’s direct investments in the reference assets and short sales. Transactions in swaps can involve greater risks than if the RiverPark Long/Short Opportunity Fund had invested directly in the reference asset because, in addition to general market risks, swaps are also subject to illiquidity risk, counterparty risk, credit risk and valuation risk. Because they are two-party contracts and because they may have terms of greater than seven days, swap transactions may be considered to be illiquid. Moreover, the Fund bears the risk of loss of the amount expected to be received under a swap in the event of the default or bankruptcy of the swap counterparty. Swaps may also be subject to pricing or “basis” risk, which exists when a particular swap becomes extraordinarily expensive relative to historical prices or the price of corresponding cash market instruments. Under certain market conditions it may not be economically feasible to initiate a transaction or liquidate a position in time to avoid a loss or take advantage of an opportunity. As a registered investment company, the Fund must “set aside” liquid assets (often referred to as “asset segregation”), or engage in other approved measures to “cover” open positions with respect to certain kinds of derivatives instruments. The Fund reserves the right to modify its asset segregation policies in the future to comply with any changes in the SEC’s positions regarding asset segregation.
The RiverPark Long/Short Opportunity Fund is exposed to counterparty credit risk through its investment in swap contracts. The RiverPark Long/Short Opportunity Fund bears the risk of loss of the amount expected to be received under a swap agreement in the event of default or bankruptcy of the counterparty, or if the counterparty fails to honor its obligations. The RiverPark Long/Short Opportunity Fund has entered into swap agreements with a single counterparty (Goldman Sachs International), focusing its exposure to the counterparty credit risk of that single counterparty. Furthermore, the swap counterparty’s obligation to the RiverPark Long/Short Opportunity Fund likely will not be collateralized. The RiverPark Long/Short Opportunity Fund settles swap agreements at least monthly.
The RiverPark Short Term High Yield Fund and RiverPark Strategic Income Fund may invest in bank loan obligations. The secondary market for loans is a private, unregulated inter-dealer or inter-bank resale market. Purchases and sales of loans are generally subject to contractual restrictions that must be satisfied before a loan can be bought or sold. These restrictions may impede the Fund’s ability to buy or sell loans and may negatively impact the transaction price. It may take longer than seven days for transactions in loans to settle. The Fund may hold cash, sell investments or temporarily borrow from banks or other lenders to meet short-term liquidity needs due to the extended loan settlement process, such as to satisfy redemption requests from Fund shareholders.
A more complete description of risks is included in each Fund’s prospectus and SAI.
58
Notes to Financial Statements September 30, 2017 | |
8. Other
As of September 30, 2017, the Funds had the following concentrations of shareholders holding 10% or more of the outstanding shares of the Funds. These represent omnibus shareholder accounts comprised of one or many individual shareholders.
Fund | |
| RiverPark Large Growth Fund | |
| Institutional Class Shares | 75% |
| Retail Class Shares | 88% |
| RiverPark/Wedgewood Fund | |
| Institutional Class Shares | 51% |
| Retail Class Shares | 73% |
| RiverPark Short Term High Yield Fund | |
| Institutional Class Shares | 73% |
| Retail Class Shares | 85% |
| RiverPark Long/Short Opportunity Fund | |
| Institutional Class Shares | 76% |
| Retail Class Shares | 84% |
| RiverPark Strategic Income Fund | |
| Institutional Class Shares | 69% |
| Retail Class Shares | 86% |
| RiverPark Focused Value Fund | |
| Institutional Class Shares | 88% |
| Retail Class Shares | 87% |
In the normal course of business, the Trust enters into contracts that contain a variety of representations which provide general indemnifications. The Trust’s maximum exposure under these arrangements cannot be known; however, the Trust expects any risk of loss to be remote.
9. Regulatory Matter
In October 2016, the U.S. Securities and Exchange Commission adopted new rules and amended existing rules (together, final rules) intended to modernize the reporting and disclosure of information by registered investment companies. In part, the final rules amended Regulation S-X and require standardized, enhanced disclosures about derivatives in investment company financial statements, as well as other amendments. As of August 1, 2017, management has implemented the amendments to Regulation S-X, which did not have a material impact on the Fund’s financial statements and related disclosures or impact the Fund’s net assets or results of operations.
10. Subsequent Events
The Funds have evaluated the need for additional disclosures and/or adjustments resulting from subsequent events through the date the financial statements were issued. Based on this evaluation, no adjustments were required to the financial statements.
59
| Report of Independent Registered Public Accounting Firm | |
To the Shareholders and Board of Trustees of
RiverPark Funds Trust
RiverPark Funds Trust
We have audited the accompanying statements of assets and liabilities, including the schedules of investments, schedules of securities sold short, not yet purchased, list of open swap agreements, and list of open forward foreign currency contracts of RiverPark Funds Trust (the “Trust”) comprising RiverPark Large Growth Fund, RiverPark Wedgewood Fund, RiverPark Short Term High Yield Fund, RiverPark Long/Short Opportunity Fund, RiverPark Strategic Income Fund, and RiverPark Focused Value Fund (the “Funds”) as of September 30, 2017, and the related statements of operations for the year then ended, the statements of changes in net assets for each of the two years in the period then ended, and the financial highlights for each of the years or periods indicated. These financial statements and financial highlights are the responsibility of the Funds’ management. Our responsibility is to express an opinion on these financial statements and financial highlights based on our audits.
We conducted our audits in accordance with the standards of the Public Company Accounting Oversight Board (United States). Those standards require that we plan and perform the audit to obtain reasonable assurance about whether the financial statements and financial highlights are free of material misstatement. An audit includes examining, on a test basis, evidence supporting the amounts and disclosures in the financial statements. Our procedures included confirmation of securities owned as of September 30, 2017, by correspondence with the custodian, brokers and agency banks or by other appropriate auditing procedures where replies from brokers or counterparties were not received. An audit also includes assessing the accounting principles used and significant estimates made by management, as well as evaluating the overall financial statement presentation. We believe that our audits provide a reasonable basis for our opinion.
In our opinion, the financial statements and financial highlights referred to above present fairly, in all material respects, the financial position of each of the Funds constituting RiverPark Funds Trust as of September 30, 2017, the results of their operations for the year then ended, the changes in their net assets for each of the two years in the period then ended, and the financial highlights for each of the years or periods indicated, in conformity with accounting principles generally accepted in the United States of America.
COHEN & COMPANY, LTD.
Cleveland, Ohio
November 29, 2017
Cleveland, Ohio
November 29, 2017
60
Trustees and Officers of the Trust (Unaudited) | |
Set forth below are the names, addresses, ages, position with the Trust, term of office and length of time served, the principal occupations for the last five years, number of portfolios in the Fund Complex overseen by Trustee, and other directorships outside the Fund Complex of each of the persons currently serving as Trustees and Officers of the Trust. The Trust’s Statement of Additional Information (“SAI”) includes additional information about the trustees and officers. The SAI may be obtained without charge by calling (888) 564-4517. The following chart lists Trustees and Officers as of September 30, 2017.
| Name, Address, and Age | Position(s) Held with the Trust | Term of Office and Length of Time Served | Principal Occupation(s) During Past Five Years | Number of Portfolios in Fund Complex** | Other Directorships held by Trustee |
Richard Browne, 156 West 56th Street, 17th Floor, New York, NY 10019 (57) | Independent Trustee | Indefinite; since September 20, 2010 | President, Rector Management Corporation (since 1986); Partner, Sterling Project Development (real estate and construction); Owners Representative, Queens Ballpark Company, LLC (since 2005); Trustee of RiverPark Floating Rate CMBS Fund (since 2016). | 7 | None |
David Sachs, 156 West 56th Street, 17th Floor, New York, NY 10019 (50) | Independent Trustee | Indefinite; since December 12, 2016 | Retired (since 2010); Managing Partner, Hocky Capital (1996-2010); Trustee of RiverPark Floating Rate CMBS Fund (since 2016). | 7 | None |
Ira Balsam, 156 West 56th Street, 17th Floor, New York, NY 10019 (52) | Independent Trustee | Indefinite; since March 1, 2012 | Retired (since 2011); Trustee of RiverPark Floating Rate CMBS Fund (since 2016). | 7 | None |
Morty Schaja*, 156 West 56th Street, 17th Floor, New York, NY 10019 (63) | Interested Trustee, President and Chairman of the Board | Indefinite; since June 22, 2010 | Chief Executive Officer and Managing Partner, RiverPark Advisors, LLC and RiverPark Capital Management LLC (since 2009); Chief Executive Officer and Managing Partner, RiverPark Capital LLC (since 2006); Trustee, President and Chairman of the Board of the RiverPark Floating Rate CMBS Fund (since 2016). | 7 | None |
Mitch Rubin*, 156 West 56th Street, 17th Floor, New York, NY 10019 (51) | Interested Trustee | Indefinite; since September 20, 2010 | Chief Investment Officer and Managing Partner, RiverPark Advisors, LLC and RiverPark Capital Management LLC (since 2009); Co-Chief Investment Officer; Interested Trustee of the Board of the RiverPark Floating Rate CMBS Fund (since 2016). | 7 | None |
61
Trustees and Officers of the Trust (Unaudited) (Concluded) | |
| Name, Address, and Age | Position(s) Held with the Trust | Term of Office and Length of Time Served | Principal Occupation(s) During Past Five Years | Number of Portfolios in Fund Complex** | Other Directorships held by Trustee |
Paul Genova, 156 West 56th Street, 17th Floor, New York, NY 10019 (41) | Secretary | Since September 20, 2010 | Chief Financial Officer, RiverPark Advisors, LLC and RiverPark Capital Management LLC (since 2009); Chief Financial Officer, RiverPark Capital LLC (since 2008); Secretary of the RiverPark Floating Rate CMBS Fund (since 2016). | N/A | N/A |
Matt Kelly, 156 West 56th Street, 17th Floor, New York, NY 10019 (48) | Vice President | Since September 20, 2010 | Chief Marketing Officer and Partner, RiverPark Advisors, LLC and RiverPark Capital Management LLC (since 2010); Vice President of the RiverPark Floating Rate CMBS Fund (since 2016). | N/A | N/A |
Stephen Connors, One Freedom Valley Drive, Oaks, PA 19456 (33) | Treasurer and Chief Financial Officer | Since 2016 | Director, SEI Investments, Fund Accounting since December 2014. Audit Manager, Deloitte & Touche LLP, from 2011 to 2014; Treasurer and Chief Financial Officer of the RiverPark Floating Rate CMBS Fund (since 2016). | N/A | N/A |
Stacey Gillespie, 480 E. Swedesford Road, Suite 300 Wayne, Pa 19087 (43) | Chief Compliance Officer | Since November 2015 | Managing Director, Cipperman Compliance Services; Chief Compliance Officer, Boenning & Scattergood, Inc (2007 to 2015); Chief Compliance Officer of the RiverPark Floating Rate CMBS Fund (since 2016). | N/A | N/A |
| * | Denotes Trustees who are “interested persons” of the Trust or Fund under the 1940 Act. |
| ** | The Fund complex includes each series of the Trust and the RiverPark Floating Rate CMBS Fund. |
62
Disclosure of Fund Expenses (Unaudited) | |
All mutual funds have operating expenses. As a shareholder of a mutual fund, your investment is affected by these ongoing costs, which include (among others) costs for portfolio management, administrative services, and shareholder reports like this one. It is important for you to understand the impact of these costs on your investment returns.
Operating expenses such as these are deducted from a mutual fund’s gross income and directly reduce its final investment return. These expenses are expressed as a percentage of a mutual fund’s average net assets; this percentage is known as a mutual fund’s expense ratio.
The following examples use the expense ratio and are intended to help you understand the ongoing costs (in dollars) of investing in your Fund and to compare these costs with those of other mutual funds. The examples are based on an investment of $1,000 made at the beginning of the period shown and held for the entire period.
The table on the following page illustrates your Fund’s costs in two ways.
● Actual Fund Return. This section helps you to estimate the actual expenses after fee waivers that your Fund incurred over the period. The “Expenses Paid During Period” column shows the actual dollar expense incurred by a $1,000 investment in the Fund, and the “Ending Account Value” number is derived from deducting that expense from the Fund’s gross investment return.
You can use this information, together with the actual amount you invested in the Fund, to estimate the expenses you paid over that period. Simply divide your actual account value by $1,000 to arrive at a ratio (for example, an $8,600 account value divided by $1,000 = 8.6), then multiply that ratio by the number shown for your Fund under “Expenses Paid During Period.”
● Hypothetical 5% Return. This section helps you compare your Fund’s costs with those of other mutual funds. It assumes that the Fund had an annual 5% return before expenses during the year, but that the expense ratio (Column 3) for the period is unchanged. This example is useful in making comparisons because the Securities and Exchange Commission requires all mutual funds to make this 5% calculation. You can assess your Fund’s comparative cost by comparing the hypothetical result for your Fund in the “Expenses Paid During Period” column with those that appear in the same charts in the shareholder reports for other mutual funds.
Note: Because the return is set at 5% for comparison purposes — NOT your Fund’s actual return—the account values shown may not apply to your specific investment.
Beginning Account Value 4/1/17 | Ending Account Value 9/30/17 | Net Annualized Expense Ratios | Expenses Paid During Period* | |
| RiverPark Large Growth Fund — Institutional Class Shares | ||||
| Actual Fund Return | $ 1,000.00 | $ 1,112.70 | 0.96% | $ 5.08 |
| Hypothetical 5% Return | 1,000.00 | 1,020.26 | 0.96 | 4.86 |
| RiverPark Large Growth Fund — Retail Class Shares | ||||
| Actual Fund Return | 1,000.00 | 1,111.30 | 1.24 | 6.56 |
| Hypothetical 5% Return | 1,000.00 | 1,018.85 | 1.24 | 6.28 |
| RiverPark/Wedgewood Fund — Institutional Class Shares | ||||
| Actual Fund Return | 1,000.00 | 1,042.40 | 0.89 | 4.56 |
| Hypothetical 5% Return | 1,000.00 | 1,020.61 | 0.89 | 4.51 |
| RiverPark/Wedgewood Fund — Retail Class Shares | ||||
| Actual Fund Return | 1,000.00 | 1,042.10 | 1.01 | 5.17 |
| Hypothetical 5% Return | 1,000.00 | 1,020.00 | 1.01 | 5.11 |
63
Disclosure of Fund Expenses (Unaudited) (Concluded) | |
Beginning Account Value 4/1/17 | Ending Account Value 9/30/17 | Net Annualized Expense Ratios | Expenses Paid During Period* | |
| RiverPark Short Term High Yield Fund — Institutional Class Shares | ||||
| Actual Fund Return | $ 1,000.00 | $ 1,012.40 | 0.88% | $ 4.44 |
| Hypothetical 5% Return | 1,000.00 | 1,020.66 | 0.88 | 4.46 |
| RiverPark Short Term High Yield Fund — Retail Class Shares | ||||
| Actual Fund Return | 1,000.00 | 1,011.20 | 1.17 | 5.90 |
| Hypothetical 5% Return | 1,000.00 | 1,019.20 | 1.17 | 5.92 |
| RiverPark Long/Short Opportunity Fund — Institutional Class Shares | ||||
| Actual Fund Return | 1,000.00 | 1,104.50 | 3.39† | 17.88 |
| Hypothetical 5% Return | 1,000.00 | 1,008.07 | 3.39 | 17.07 |
| RiverPark Long/Short Opportunity Fund — Retail Class Shares | ||||
| Actual Fund Return | 1,000.00 | 1,102.70 | 3.56† | 18.77 |
| Hypothetical 5% Return | 1,000.00 | 1,007.22 | 3.56 | 17.91 |
| RiverPark Strategic Income Fund — Institutional Class Shares | ||||
| Actual Fund Return | 1,000.00 | 1,022.70 | 0.97†† | 4.92 |
| Hypothetical 5% Return | 1,000.00 | 1,020.21 | 0.97 | 4.91 |
| RiverPark Strategic Income Fund — Retail Class Shares | ||||
| Actual Fund Return | 1,000.00 | 1,020.30 | 1.25†† | 6.33 |
| Hypothetical 5% Return | 1,000.00 | 1,018.80 | 1.25 | 6.33 |
| RiverPark Focused Value Fund — Institutional Class Shares | ||||
| Actual Fund Return | 1,000.00 | 1,094.30 | 0.91 | 4.78 |
| Hypothetical 5% Return | 1,000.00 | 1,020.51 | 0.91 | 4.61 |
| RiverPark Focused Value Fund — Retail Class Shares | ||||
| Actual Fund Return | 1,000.00 | 1,092.00 | 1.28 | 6.71 |
| Hypothetical 5% Return | 1,000.00 | 1,018.65 | 1.28 | 6.48 |
| * | Expenses are equal to the Fund’s annualized expense ratio multiplied by the average account value over the period, multiplied by 183/365 (to reflect the one-half year period). |
† | The annualized expense ratios include dividend expense and stock loan fees incurred during the six month period. Annualized dividend expense and stock loan fees of average net assets totaled 1.56%. Had these expenses not been included the ratios would have been 1.82% and 2.00%, respectively. |
†† | The annualized expense ratios include dividend expense and stock loan fees incurred during the six month period. Annualized dividend expense and stock loan fees of average net assets totaled 0.09%. Had these expenses not been included the ratios would have been 0.89% and 1.16%, respectively. |
64
Approval of the Investment Advisory and Investment Sub-Advisory Agreements (Unaudited) | |
Approval of Continuance of Investment Advisory, Sub-Advisory and Distribution Agreements
At the August 8, 2017 meeting of the Board of Trustees of the RiverPark Funds Trust, Fund Counsel reviewed with the Board of Trustees, a memorandum, a copy of which had been previously provided to the Board, that described certain factors that the Board should consider with respect to the continuation of the advisory and sub-advisory agreements, including: (i) the nature, extent and quality of services to be provided by the investment adviser and the sub-advisers, as appropriate, (ii) the investment performance of the investment adviser and the sub-advisers, as appropriate, with respect to each Fund, (iii) the proposed fees and expenses under the investment advisory and sub-advisory agreements, (iv) the economies of scale expected to be achieved, and (v) the investment adviser’s profitability. Fund Counsel emphasized that the Trustees should also consider any additional factors they deem relevant and should use their own business judgment in determining the material factors to consider in evaluating the investment advisory agreements and the weight to be given to each factor. Fund Counsel also noted that each Trustee may weigh the various factors differently in reaching his conclusions with respect to the investment advisory and sub-advisory agreements. Fund Counsel stated that to assist the Trustees in making a determination, comparative data (particularly as to fees and expenses) to other mutual funds and peer groups was provided to the Trustees by the Adviser as part of the board materials.
Executive Session of Independent Trustees
The Independent Trustees then met with Fund Counsel in executive session and considered, among other things, the Adviser’s and each sub-adviser’s responses to the 15(c) questionnaires provided to them by Fund counsel.
The Amended and Restated Investment Advisory Agreement dated February 14, 2012 between RiverPark Advisors, LLC and RiverPark Funds Trust
Nature, Extent and Quality of Service. The Trustees noted that the Adviser provides trading, accounting, compliance and marketing services to each of the Funds within the Trust. They further noted that the Adviser additionally provides portfolio management services to the Large Growth Fund, the Long/Short Opportunity Fund, and the Focused Value Fund. The Trustees reviewed the background information on the key personnel responsible for servicing the Funds. The Trustees recognized that the Adviser’s team has largely worked together for 15-20 years and has extensive experience and expertise in managing mutual funds and managing the operations of mutual funds. The Trustees stated that they were satisfied with such personnel’s experience in managing each of the Funds and implementing the Adviser’s principal investment strategies. The Trustees noted the Adviser’s investment processes for each of the Funds where it provides portfolio management services and the oversight and other investment management services provided to the Funds that use sub-advisers. The Trustees examined the risks associated with the investment strategies followed by the Adviser and the sub-advisers when investing the assets for each of the Funds and the steps being taken by the Adviser to mitigate these risks. The Trustees recognized and were comfortable with the Adviser’s approach to mitigating investment risk by thoroughly researching investments and diversifying each portfolio over many holdings, with specific position limits in place for each Fund. The Trustees noted the Adviser’s relationship with each of the two sub-advisers and were comfortable with the various steps taken when supervising each sub-advisory relationship. These steps include obtaining an annual (or more frequent) certification from each sub-adviser regarding material compliance matters, description of the sub-adviser’s written annual compliance review, material changes in each sub-adviser’s investment management process, material changes to how brokers are selected and average commission rate as well as other additional information. The Trustees concluded that the Adviser should continue to provide a high level quality of service to each Fund for the benefit of each Fund’s shareholders.
Performance. The Trustees reviewed the performance of each Fund relative to its peer group, Morningstar category and benchmark. The Trustees noted the contributions of each of the two sub-advisers to the overall performance of their respective Fund and the Adviser’s ability to select and work with high quality sub-advisers for the benefit of each Fund’s shareholders. After further discussion, the Trustees concluded that each Fund’s performance was reasonable.
Fees and Expenses. The Trustees noted the advisory fees paid by each Fund and reviewed the comparative data provided by the Adviser for each Fund. The Trustees agreed that the advisory fee structure was fair and competitive in comparison to other comparable mutual funds as well as other accounts managed by the Adviser. After discussion the Trustees, concluded that the advisory fee charged by each Fund was reasonable and within the range of fees charged by other comparable Funds.
65
Approval of the Investment Advisory and Investment Sub-Advisory Agreements (Unaudited) (Continued) | |
Economies of Scale. The Trustees considered the economies of scale and noted that the Adviser, in its earlier discussions with the Trustees, had agreed with the Trustees that they should consider breakpoints when asset levels for a Fund reach specific levels. After discussion, the Trustees agreed that based on the current size of each Fund, it does not appear that economies of scale sufficient to require a revision of the existing fee structure had been reached at this time, however, the matter would be revisited in the future as the Funds’ size increases.
Profitability. The Trustees reviewed the Adviser’s financial statements. The Trustees recognized that the Adviser was generally profitable for the year ended December 31, 2016. The Trustees recognized that the Funds are at asset levels where they are profitable to the Adviser. After a brief discussion, the Trustees concluded that the Adviser’s profitability on a Fund by Fund basis was not excessive with respect to each Fund.
Conclusion. Having requested and received such information from the Adviser as the Trustees believed to be reasonably necessary to evaluate the terms of the advisory agreement, and as assisted by Counsel, the Trustees concluded that the fee structure is reasonable and that renewal of the advisory agreement is in the best interests of the shareholders of each Fund.
The Amended and Restated Investment Advisory Agreement dated February 14, 2012 between RiverPark Advisors, LLC and RiverPark Funds Trust
Nature, Extent and Quality of Service. The Trustees noted that Cohanzick provides portfolio management and trading services to the Short Term High Yield Fund and the Strategic Income Fund. The Trustees recognized that Cohanzick’s investment approach is bottom up and credit specific. Cohanzick provides specific services that include but are limited to buy decisions, sell decisions, credit selection, credit review and analysis, and portfolio construction. The Trustees recognized that Cohanzick’s advised assets and assets under management continue to grow. The Trustees reviewed the background information on the key investment personnel who are responsible for servicing the Short Term High Yield Fund and the Strategic Income Fund and were comfortable with their credentials. The Trustees discussed Cohanzick’s role and investment approach as a sub-adviser to the Short Term High Yield Fund and the Strategic Income Fund. The Trustees noted that for the Short Term High Yield Fund, Cohanzick focuses on principal preservation with income for an effective short term holding period of three years or less. For the Strategic Income Fund, Cohanzick seeks high current income and capital appreciation consistent with preservation of capital by investing in investment grade and non-investment grade debt, preferred stock, convertible bonds, bank loans, high yield bonds, and income producing equities. The Trustees discussed that they were comfortable with the strategies for each of the Funds and concluded that Cohanzick will continue to deliver high quality service to the Funds and the Adviser for the benefit of each Fund’s shareholders.
Performance. The Trustees reviewed the performance of the Short Term High Yield Fund and the Strategic Income Fund relative to their peer groups, Morningstar category and benchmark. The Trustees noted the contributions of Cohanzick to the overall performance of both Funds. After further discussion, the Trustees concluded that each Fund’s performance was consistent with expectations given the investment strategy and was overall reasonable. The Trustees concluded that Cohanzick should be retained as sub-adviser for the benefit of the Short Term High Yield Fund and the Strategic Income Fund and their respective shareholders.
Fees and Expenses. The Trustees discussed the sub-advisory fees paid by the Adviser to Cohanzick and the services provided to each Fund by Cohanzick. The Trustees recognized that the sub-advisory fees were on the higher side compared to each Fund’s peer group but recognized that there were other sub-advisory fees that were still significantly higher. After discussion, the Trustees concluded that the sub-advisory fee was reasonable with respect to each of the Short Term High Yield Fund and the Strategic Income Fund.
Economies of Scale. The Trustees considered whether the sub-adviser had realized economies of scale with respect to the management of each Fund. The Trustees agreed that this was primarily an adviser level issue and should be considered with respect to the overall advisory contract, taking into consideration the impact of the sub-advisory expense. The Trustees noted earlier discussions that they had regarding breakpoints, and it was the consensus of the Trustees, that the lack of breakpoints at this time was acceptable but that this should be reviewed again next year.
66
Approval of the Investment Advisory and Investment Sub-Advisory Agreements (Unaudited) (Concluded) | |
Profitability. The Trustees reviewed Cohanzick’s financial statements. The Trustees recognized that Cohanzick was generally profitable for the year ended December 31, 2016. The Trustees noted that the Short Term High Yield Fund had attracted considerable assets over the last few years and had become a profitable fund for Cohanzick to sub-advise. The Trustees also recognized that Cohanzick was profitable in connection with the Strategic Income Fund. After a discussion, the Trustees concluded that Cohanzick’s profitability with respect to each Fund was not excessive.
Conclusion. Having requested and received such information from Cohanzick as the Trustees believed to be reasonably necessary to evaluate the terms of each sub-advisory agreement, and as assisted by Fund Counsel, the Trustees concluded that the fee structure is reasonable and that renewal of the sub-advisory agreement is in the best interests of the shareholders of the Short Term High Yield Fund and the Strategic Income Fund.
The Sub-Advisory Agreement dated September 20, 2010 by and among RiverPark Advisors, LLC, Wedgewood Partners, Inc. (“Wedgewood”) and the RiverPark Funds Trust
Nature, Extent and Quality of Service. The Trustees noted that Wedgewood provides portfolio management services to the Wedgewood Fund. The Trustees reviewed the background information on the key investment personnel who are responsible for servicing the Fund and were comfortable with their credentials. The Trustees discussed Wedgewood’s investment strategy of a focused portfolio of twenty or so carefully researched and studied, best-in-class growth companies, invested at compelling valuations as well as prudently diversified. The Trustees expressed that they are comfortable with Wedgewood’s investment approach and recognized that Wedgewood’s philosophy and process produces a portfolio that is routinely overweight relative to performance benchmark weightings. The Trustees discussed that they were comfortable with the strategies for the Wedgewood Fund and concluded that Wedgewood will continue to deliver high quality portfolio management services to the Fund for the benefit of the shareholders of the Fund and the Adviser.
Performance. The Trustees considered the investment performance for Wedgewood. The Trustees recognized that 2016 was a tough year for active investors. The Trustees agreed that the sub-adviser is contributing to the overall returns of the Wedgewood Fund, and they concluded that the performance was reasonable.
Fees and Expenses. The Trustees discussed Wedgewood’s sub-advisory fee. They noted that the fee was in line with other investment advisory contracts Wedgewood has with its other clients. The Trustees recognized that the fee is also comparable and similar to other funds with similar investment strategies. After discussion, the Trustees concluded that the sub-advisory fee was reasonable with respect to the Wedgewood Fund.
Economies of Scale. The Trustees considered whether it is likely that the sub-adviser had realized economies of scale with respect to the management of the Fund. The Trustees agreed that this was primarily an adviser level issue and should be considered with respect to the overall advisory contract, taking into consideration the impact of the sub-advisory expense. The Trustees noted earlier discussions that they had regarding breakpoints and it was the consensus of the Trustees, that the lack of breakpoints at this time was acceptable and that this should be reviewed again next year.
Profitability. The Trustees reviewed Wedgewood’s financial statements. The Trustees recognized that Wedgewood’s sub-advisory fee is profitable to Wedgewood’s and is incremental to its overall profitability and does not add materially to its expenses or overhead in any meaningful way nor necessary to maintain Wedgewood’s financial viability. After a brief discussion, the Trustees concluded that Wedgewood’s profitability was not excessive.
Conclusion. Having requested and received such information from Wedgewood as the Trustees believed to be reasonably necessary to evaluate the terms of the sub-advisory agreement, and as assisted by Fund Counsel, the Trustees concluded that the fee structure is reasonable and that renewal of the sub-advisory agreement is in the best interests of the shareholders of the Wedgewood Fund.
67
Notice to Shareholders (Unaudited) | |
For shareholders that do not have a September 30, 2017 tax year end, this notice is for informational purposes only. For shareholders with a September 30, 2017 tax year end, please consult your tax advisor as to the pertinence of this notice. For the fiscal year ended September 30, 2017, the Funds are designating the following items with regard to distributions paid during the year.
| Fund | Long Term Capital Gains Distributions | Ordinary Income Distributions | Total Distributions | Qualifying Dividends(1) |
| RiverPark Large Growth Fund | 13% | 87% | 100% | 100% |
| RiverPark/Wedgewood Fund | 89% | 11% | 100% | 75% |
| RiverPark Short Term High Yield Fund | 0% | 100% | 100% | 0% |
| RiverPark Strategic Income Fund | 0% | 100% | 100% | 0% |
| RiverPark Focused Value Fund | 0% | 100% | 100% | 100% |
| Fund | Qualifying Dividend Income(2) | U.S. Government Interest(3) | Qualified Interest Income(4) | Qualified Short-Term Capital Gain(5) |
| RiverPark Large Growth Fund | 100% | 0% | 0% | 0% |
| RiverPark/Wedgewood Fund | 75% | 0% | 0% | 0% |
| RiverPark Short Term High Yield Fund | 0% | 0% | 98% | 0% |
| RiverPark Strategic Income Fund | 0% | 0% | 62% | 0% |
| RiverPark Focused Value Fund | 100% | 0% | 1% | 0% |
(1) | Qualifying dividends represent dividends which qualify for the corporate dividends received deduction and is reflected as a percentage of ordinary income distributions (the total of short term capital gain and net investment income distributions). |
(2) | The percentage in this column represents the amount of “Qualifying Dividend Income” as created by the Jobs and Growth Tax Relief Reconciliation Act of 2003 and is reflected as a percentage of ordinary income distributions (the total of short term capital gain and net investment income distributions). It is the intention of each of the aforementioned funds to designate the maximum amount permitted by law. |
(3) | “U.S. Government Interest” represents the amount of interest that was derived from direct U.S. Government obligations and distributed during the fiscal year. This amount is reflected as a percentage of ordinary income. Generally, interest from direct U.S. Government obligations is exempt from state income tax. However, for shareholders who are residents of California, Connecticut and New York, the statutory threshold requirements were not satisfied to permit exemption of these amounts from state income. |
(4) | The percentage in this column represents the amount of “Interest Related Dividends” as created by the American Jobs Creation Act of 2004 and is reflected as a percentage of net investment income distributions that is exempt from U.S. withholding tax when paid to foreign investors. |
(5) | The percentage in this column represents the amount of “Short-Term Capital Gain Dividends” as created by the American Jobs Creation Act of 2004 and is reflected as a percentage of short-term capital gain distributions that is exempt from U.S. withholding tax when paid to foreign investors. |
There were no distributions declared during the last two years or periods ended September 30 in the RiverPark Long/Short Opportunity Fund.
68
(This page intentionally left blank)
INVESTMENT ADVISER
RiverPark Advisors, LLC
156 West 56th Street, 17th Floor
New York, New York 10019
CUSTODIAN
Brown Brothers Harriman & Co.
40 Water Street
Boston, Massachusetts 02109
PRIME BROKER:
Goldman Sachs & Co.
200 West Street, 3rd Floor
New York, NY 10282
TRANSFER AGENT
DST Systems, Inc.
333 West 11th Street, 5th Floor
Kansas City, Missouri 64105
ADMINISTRATOR
SEI Investments Global Funds Services
One Freedom Valley Drive
Oaks, Pennsylvania 19456
INDEPENDENT REGISTERED PUBLIC ACCOUNTING FIRM
Cohen & Company, Ltd.
1350 Euclid Ave., Suite 800
Cleveland, Ohio 44115
DISTRIBUTOR
SEI Investments Distribution Co.
One Freedom Valley Drive
Oaks, Pennsylvania 19456
FUND COUNSEL
Blank Rome LLP
405 Lexington Avenue
New York, New York 10174-0208
This information must be preceded or accompanied by a
current prospectus for the Trust.
current prospectus for the Trust.
RPF-AR-001-0700
| Item 2. | Code of Ethics. |
A code of ethics, as defined in Item 2 of Form N-CSR, adopted by the registrant and applicable to the registrant’s principal executive officer and principal financial officer, was in effect during the entire period covered by this report.
| Item 3. | Audit Committee Financial Expert. |
The registrant’s board of trustees has determined that David Sachs, member of the registrant’s Audit Committee, is an “audit committee financial expert” and is “independent” as that term is defined in Item 3 of Form N-CSR.
| Item 4. | Principal Accountant Fees and Services. |
(a)-(d) Aggregate fees billed to registrant for the fiscal years ended September 30, 2017 and September 30, 2016 for professional services rendered by registrant’s principal accountant were as follows:
| 2017 | 2016 | ||
| (a) | Audit Fees | $94,000 | $104,000 |
| (b) | Audit-Related Fees | $— | $— |
| (c) | Tax Fees | $21,000 | $24,000 |
| (d) | All Other Fees | $2,625 | $3,385 |
Audit Fees include amounts related to the audit of the registrant’s annual financial statements and services normally provided by the principal accountant in connection with statutory and regulatory filings.
All Other Fees include amounts billed for products and services other than those disclosed in paragraphs (a) through (c) of this Item. For the fiscal years ended September 30, 2017 and September 30, 2016, All Other Fees relate to the review of the March 31, 2017 and March 31, 2016 Semi-Annual Reports.
(e)(1) The registrant’s Audit Committee has adopted, and the Board of Trustees has ratified, an Audit and Non-Audit Services Pre-Approval Policy (the “Policy”), which requires the registrant’s Audit Committee to pre-approve all audit and non-audit services provided by the principal accountant to the registrant. The Policy also requires the Audit Committee to pre-approve any engagement of the principal accountant to provide non-audit services to the registrant’s investment adviser, if the services relate directly to the registrant’s operations and financial reporting.
(e)(2) No services included in (b)-(d) above were approved pursuant to paragraph (c)(7)(i)(C) of Rule 2-01 of Regulation S-X.
(f) Not applicable.
(g) The aggregate fees billed by registrant’s principal accountant for non-audit services rendered to the registrant, for non-audit services rendered to the registrant’s investment adviser, and for non-audit services rendered to entities controlled by the adviser for the last fiscal year was $0.
(h) During the past fiscal year, all non-audit services provided by registrant’s principal accountant to either registrant’s investment adviser or to any entity controlling, controlled by, or under common control with registrant’s investment adviser that provides ongoing services to registrant were pre-approved by the audit committee of registrant’s board of trustees. Included in the audit committee’s pre-approval was the review and consideration as to whether the provision of these non-audit services is compatible with maintaining the principal accountant’s independence.
| Item 5. | Audit Committee of Listed Registrants. |
Not applicable to open-end management investment companies.
| Item 6. | Schedule of Investments. |
See Item 1.
| Item 7. | Disclosure of Proxy Voting Policies and Procedures for Closed-End Management Investment Companies. |
Not applicable to open-end management investment companies.
| Item 8. | Portfolio Managers of Closed-End Management Investment Companies. |
Not applicable to open-end management investment companies.
| Item 9. | Purchases of Equity Securities by Closed-End Management Company and Affiliated Purchasers. |
Not applicable to open-end management investment companies.
| Item 10. | Submission of Matters to a Vote of Security Holders. |
None.
| Item 11. | Controls and Procedures. |
(a) The certifying officers, whose certifications are included herewith, have evaluated the registrant’s disclosure controls and procedures within 90 days of the filing date of this report. In their opinion, based on their evaluation, the registrant’s disclosure controls and procedures are adequately designed, and are operating effectively to ensure, that information required to be disclosed by the registrant in the reports it files or submits under the Securities Exchange Act of 1934 is recorded, processed, summarized and reported within the time periods specified in the Securities and Exchange Commission’s rules and forms.
(b) There were no significant changes in the registrant’s internal control over financial reporting that occurred during the registrant’s last fiscal half-year that have materially affected, or are reasonably likely to materially affect, the registrant’s internal control over financial reporting.
| Items 12. | Exhibits. |
(a)(1) The registrant’s code of ethics pursuant to Item 2 of Form N-CSR is attached.
(a)(2) A separate certification for the principal executive officer and the principal financial officer of the registrant as required by Rule 30a-2(a) under the Investment Company Act of 1940, as amended (17 CFR 270.30a-2(a)), are filed herewith.
(b) Officer certifications as required by Rule 30a-2(b) under the Investment Company Act of 1940, as amended (17 CFR 270.30a-2(b)) also accompany this filing as an Exhibit.
SIGNATURES
Pursuant to the requirements of the Securities Exchange Act of 1934 and the Investment Company Act of 1940, the registrant has duly caused this report to be signed on its behalf by the undersigned, thereunto duly authorized.
| (Registrant) | RiverPark Funds Trust | |
| By (Signature and Title)* | /s/ Morty Schaja | |
| Morty Schaja | ||
| President |
Date: December 8, 2017
Pursuant to the requirements of the Securities Exchange Act of 1934 and the Investment Company Act of 1940, this report has been signed below by the following persons on behalf of the registrant and in the capacities and on the dates indicated.
| By (Signature and Title)* | /s/ Morty Schaja | |
| Morty Schaja | ||
| President |
Date: December 8, 2017
| By (Signature and Title)* | /s/ Stephen P. Connors | |
| Stephen P. Connors | ||
| Chief Financial Officer and Treasurer |
Date: December 8, 2017
| * | Print the name and title of each signing officer under his or her signature. |