Washington, D.C. 20549
Kevin M. Robinson
Item 1. Reports to Stockholders.
The registrant's annual report transmitted to shareholders pursuant to Rule 30e-1 under the Investment Company Act of 1940, as amended (the “Investment Company Act”), is as follows: [Provide full text of annual report.]
WWW.GUGGENHEIMINVESTMENTS.COM/GBAB
... YOUR WINDOW TO THE LATEST, MOST UP-TO-DATE INFORMATION ABOUT THE GUGGENHEIM BUILD AMERICA BONDS MANAGED DURATION TRUST
The shareholder report you are reading right now is just the beginning of the story. Online at
www.guggenheiminvestments.com/gbab, you will find:
| • | Daily, weekly and monthly data on share prices, net asset values, distributions and more |
| | |
| • | Monthly portfolio overviews and performance analyses |
| | |
| • | Announcements, press releases and special notices |
| | |
| • | Fund and adviser contact information |
Guggenheim Partners Investment Management, LLC and Guggenheim Funds Investment Advisors, LLC are continually updating and expanding shareholder information services on the Trust’s website, in an ongoing effort to provide you with the most current information about how your Trust’s assets are managed, and the results of our efforts. It is just one more small way we are working to keep you better informed about your investment in the Trust.
| (Unaudited) | November 30, 2012 |
DEAR SHAREHOLDER
We thank you for your investment in the Guggenheim Build America Bonds Managed Duration Trust (the “Trust”). This report covers the Trust’s performance for the semiannual period ended November 30, 2012.
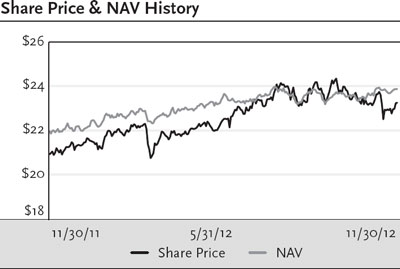
All Trust returns cited—whether based on net asset value (“NAV”) or market price—assume the reinvestment of all distributions. For the six-month period ended November 30, 2012, the Trust provided a total return based on market price of 7.01% and a total return based on NAV of 4.98%. As of November 30, 2012, the Trust’s market price of $23.25 per share represented a discount of 2.56% to its NAV of $23.86 per share. The market value of the Trust’s shares fluctuates from time to time, and it may be higher or lower than the Trust’s NAV.
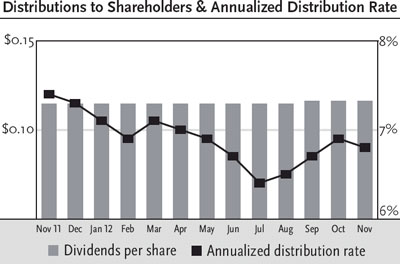
In each month from June 2012 through August 2012, the Trust paid a monthly dividend of $0.1290 per share. The Trust announced a 2.5% increase in its monthly dividend to $0.1322 per share, effective with its September 2012 dividend, and that amount was paid in September, October and November 2012. In November 2012, the Trust announced another increase to the monthly dividend, which took effect with the December 2012 dividend. The dividend as of November 30, 2012, represents an annualized distribution rate of 6.8% based on the Trust’s closing market price of $23.25 on November 30, 2012.
Guggenheim Funds Investment Advisors, LLC (“GFIA” or the “Adviser”) serves as the investment adviser to the Trust. Guggenheim Partners Investment Management, LLC (“GPIM” or the “Sub-Adviser”) serves as the Trust’s investment sub-adviser and is responsible for the management of the Trust’s portfolio of investments. Each of the Adviser and the Sub-Adviser is an affiliate of Guggenheim Partners, LLC (“Guggenheim”), a global diversified financial services firm.
We encourage shareholders to consider the opportunity to reinvest their distributions from the Trust through the Dividend Reinvestment Plan (“DRIP”), which is described in detail on page 36 of this report. When shares trade at a discount to NAV, the DRIP takes advantage of the discount by reinvesting the monthly dividend distribution in common shares of the Trust purchased in the market at a price less than NAV. Conversely, when the market price of the Trust’s common shares is at a premium above NAV, the DRIP reinvests participants’ dividends in newly-issued common shares at NAV, subject to an Internal Revenue Service (“IRS”) limitation that the purchase price cannot be more than 5% below the market price per share. The DRIP provides a cost effective means to accumulate additional shares and enjoy the benefits of compounding returns over time. Since the Trust endeavors to maintain a steady monthly distribution rate, the DRIP effectively provides an income averaging technique, which causes shareholders to accumulate a larger number of Trust shares when the share price is lower than when the price is higher.
To learn more about the Trust’s performance and investment strategy for the semiannual period ended November 30, 2012, we encourage you to read the Questions & Answers section of this report, which begins on page 4.
We are honored that you have chosen the Guggenheim Build America Bonds Managed Duration Trust as part of your investment portfolio. For the most up-to-date information regarding your investment, please visit the Trust’s website at www.guggenheiminvestments.com/gbab.
Sincerely,
Donald C. Cacciapaglia
Chief Executive Officer
Guggenheim Build America Bonds Duration Trust
December 31, 2012
GBAB | GUGGENHEIM BUILD AMERICA BONDS MANAGED DURATION TRUST SEMIANNUAL REPORT | 3 |
| QUESTIONS & ANSWERS (Unaudited) | November 30, 2012 |
The Guggenheim Build America Bonds Managed Duration Trust (the “Trust”) is managed by a team of seasoned professionals at Guggenheim Partners Investment Management, LLC (“GPIM” or the “Sub-Adviser”). This team includes B. Scott Minerd, Chief Executive Officer and Chief Investment Officer; Anne Bookwalter Walsh, CFA, JD, Senior Managing Director; and James E. Pass, Managing Director. In the following interview, the investment team discusses the market environment and the Trust’s strategy and performance for the six-month period ended November 30, 2012.
What were the most important developments in the Trust over the past six months?
Two related actions stand out. The Sub-Adviser has been actively managing the Trust to add value in the 20% allocation of the portfolio not dedicated to Build America Bonds, primarily by increasing exposure to bank loans and other floating-rate securities. The improved yield from these investments has also enabled the Trust to increase the distribution rate, as we raised the dividend twice, once by 2.5% in September and then by 2.0%, which took effect in December 2012 after the period ended.
GPIM believes the macroeconomic environment is constructive for the leveraged credit market, which includes bank loans and high-yield bonds, as markets awash with liquidity are supportive of refinancing and result in low default rates. Bank loans have attractive yields, secured status, seniority in the capital structure and covenant protection. All floating rate securities, including bank loans and asset-backed securities, are less sensitive to changes in interest rates, which is especially valuable in this era of historically low yields.
What is the Trust’s investment objective and how is it pursued?
The Trust’s primary investment objective is to provide current income with a secondary objective of long-term capital appreciation. The Trust seeks to achieve its investment objectives by investing primarily in a diversified portfolio of taxable municipal securities known as “Build America Bonds” (“BABs”). Under normal market conditions, the Trust will invest at least 80% of its Managed Assets (net assets plus leverage) (“Managed Assets”) in BABs. The Trust may invest up to 20% of its Managed Assets in securities other than BABs, including taxable municipal securities that do not qualify for federal subsidy payments under the American Recovery and Reinvestment Act of 2009 (the “Act”), municipal securities, the interest income from which is exempt from regular federal income tax (sometimes referred to as “tax-exempt municipal securities”), asset-backed securities (“ABS”), senior loans and other income-producing securities.
At least 80% of the Trust’s Managed Assets will be invested in securities that, at the time of investment, are investment grade quality. The Trust may invest up to 20% of its Managed Assets in securities that, at the time of investment, are below investment grade quality. Securities of below investment grade quality are regarded as having predominantly speculative characteristics with respect to capacity to pay interest and repay principal.
The Trust will not invest more than 25% of its Managed Assets in municipal securities in any one state of origin or more than 15% of its Managed Assets in municipal securities that, at the time of investment, are illiquid.
BABs are taxable municipal securities that include bonds issued by state and local governments to finance capital projects such as public schools, roads, transportation infrastructure, bridges, ports and public buildings, pursuant to the Act. In contrast to traditional municipal bonds, interest received on BABs is subject to federal income tax and may be subject to state income tax. However, issuers of Direct Payment BABs are eligible to receive a subsidy from the U.S. Treasury of up to 35% of the interest paid on the bonds, allowing such issuers to issue BABs that pay interest rates that are competitive with the rates typically paid by private bond issuers in the taxable fixed-income market.
The Sub-Adviser employs investment and trading strategies to seek to maintain the leverage-adjusted duration of the Trust’s portfolio at approximately 10 years. (Duration is a measure of a bond’s price sensitivity to changes in interest rates, expressed in years. Duration is a weighted average of the times that interest payments and the final return of principal are received. The weights are the amounts of the payments discounted by the yield to maturity of the bond.)
In addition, the Sub-Adviser may seek to manage the duration of the Trust’s portfolio through the use of derivative instruments, including U.S. Treasury swaps, credit default swaps, total return swaps and futures contracts, in an attempt to reduce the overall volatility of the Trust’s portfolio to changes in market interest rates. The Sub-Adviser does not currently use such derivative instruments to manage the duration of the Trust’s portfolio but may do so in the future. The Sub-Adviser may seek to manage the Trust’s duration in a flexible and opportunistic manner based primarily on then-current market conditions and interest rate levels. The Trust may incur costs in implementing the duration management strategy, but such strategy will seek to reduce the volatility of the Trust’s portfolio.
What were the significant events affecting the economy and market environment over the past six months?
The U.S. economic expansion has slowed as a result of declining margins and consumer demand and a knock-on effect from Europe. Unprecedented policy actions by the Federal Reserve (“the Fed”) continue to provide ample liquidity and accommodation to stimulate growth of the U.S.
| |
4 | GBAB | GUGGENHEIM BUILD AMERICA BONDS MANAGED DURATION TRUST SEMIANNUAL REPORT |
| QUESTIONS & ANSWERS (Unaudited) continued | November 30, 2012 |
economy. Recent action, such as the third round of quantitative easing announced in September 2012, shows an increased tolerance for potentially higher levels of inflation. The Fed was aggressive in its policy action by announcing an open-ended bond purchasing program that focused on agency mortgages. Operation Twist, the Fed’s program of buying longer duration Treasury securities while simultaneously selling shorter duration securities, was also extended.
The U.S. election at the beginning of November may have had a small effect on the market’s perception of the path and pace towards economic recovery. Improving housing data and private payrolls have largely driven U.S. GDP growth, though uncertainty surrounding consumer demand continues to make it difficult for the corporate sector to make investment decisions with respect to hiring and capital investment. U.S. capital markets late in the year were preoccupied with decisions about the U.S. fiscal cliff.
Central banks around the world have tagged along with U.S. policymakers and are engaging in their own forms of accommodative policy actions, which we believe should continue to benefit risk assets and assets linked to inflation bets.
How did the Trust perform for the six months ended November 30, 2012?
All Trust returns cited—whether based on net asset value (“NAV”) or market price—assume the reinvestment of all distributions. For the six-month period ended November 30, 2012, the Trust provided a total return based on market price of 7.01% and a total return based on NAV of 4.98%. The Trust’s NAV return surpassed the return of the Bank of America Build America Bond Index (the “Index”), which measures return of BABs as an asset class, even though the Trust has operating expenses that affect performance, while the Index has no expenses.
As of November 30, 2012, the Trust’s market price of $23.25 per share represented a discount of 2.56% to its NAV of $23.86 per share. On May 31, 2012, the Trust’s market price of $22.46 per share represented a discount of 4.38% to its NAV of $23.49 per share. As of November 30, 2011, the Trust’s market price of $20.92 per share represented a discount of 4.78% to its NAV of $21.97 per share. The market value of the Trust’s shares fluctuates from time to time and it may be higher or lower than the Trust’s NAV. Past performance is not a guarantee of future results.
In each month from June 2012 through August 2012, the Trust paid a monthly dividend of $0.1290 per share. The Trust announced a 2.5% increase in its monthly dividend to $0.1322 per share, effective with its September 2012 dividend, and that amount was paid in September, October and November 2012. In November 2012, the Trust announced another increase to the monthly dividend, which took effect with the December 2012 dividend. The dividend as of November 30, 2012, represents an annualized distribution rate of 6.8% based on the Trust’s closing market price of $23.25 on November 30, 2012. Of course, the Trust’s distribution rate is not constant and is subject to change based on the performance of the Trust.
What factors affected Trust performance during the six-month period ended November 30, 2012?
The entire portfolio has appreciated because of the relatively subdued rate environment, as spreads tightened over the period. BABs are strongly correlated with U.S. Treasuries, and both generally rallied over the period, particularly when financial events in Europe or Asia pushed investors into the relative safety of U.S. government debt. Factors aiding BABs performance were lack of primary issuance, which creates scarcity that helps support prices. Existing issues also typically carry high dollar prices, which limits activity in the sector. Another contributor to spread tightening was the outcome of recent elections in some big-issue states like California, which approved a ballot measure to increase taxes.
Describe how the Trust’s assets are invested?
As of November 30, 2012, approximately 83% of the Trust’s long-term investments were in BABs and Qualified School Construction Bonds (“QSCBs”), which are qualifying investments for purposes of the Trust’s policy of investing at least 80% of its managed assets in BABs. Within the Trust’s BABs holdings, we did add positions from time to time, although no single position was a significant contributor or detractor to return. No BABs have been sold since the inception of the portfolio.
The remainder of the Trust (approximately 17% of the Trust’s long-term investments as of November 30, 2012) was invested in non-BABs securities. These include asset-backed securities, bank loans, corporate bonds (including high yield bonds) and other securities, by which we were able to add incremental yield.
The most significant change within this allocation was increasing bank loans by about three percentage points. The Trust also regularly sold floating-rate instruments with yields in the low single digits in order to create more capacity for higher-yielding floaters.
How did other markets perform in this environment?
In the bond market, the lowest quality issues performed best during the six-month period ended November 30, 2012, as investors generally embraced risk. The return of the Barclays U.S. Treasury Composite Index, which includes Treasury securities of all maturities, was 0.57%. The Barclays U.S. Aggregate Bond Index (the “Barclays Aggregate”), which is a proxy for the U.S. investment grade bond market, returned 1.99% for the period, while
GBAB | GUGGENHEIM BUILD AMERICA BONDS MANAGED DURATION TRUST SEMIANNUAL REPORT | 5 |
| QUESTIONS & ANSWERS (Unaudited) continued | November 30, 2012 |
the Barclays U.S. Corporate High Yield Index returned 8.54%. BABs were among the best performing asset classes: return of the Index, which measures return of BABs as an asset class, was 3.98% for the 6 months ended November 30, 2012.
Reflecting the Federal Reserve’s (“the Fed”) continuing accommodative monetary policy, interest rates on short-term securities remained at their lowest levels in many years; the return of the Barclays 1–3 Month U.S. Treasury Bill Index was 0.04% for the same period.
What is the Trust’s leverage strategy?
Since leverage adds to performance when the cost of leverage is less than the total return generated by investments, the use of leverage contributed positively to the Trust’s total return during this period. The Trust utilizes leverage (borrowing) as part of its investment strategy, to finance the purchase of additional securities that provide increased income and potentially greater appreciation potential to common shareholders than could be achieved from a portfolio that is not leveraged. Leverage will not exceed 33% of the Trust’s Managed Assets.
As of November 30, 2012, the Trust’s leverage was approximately 25% of Managed Assets. GPIM currently employs leverage through reverse repurchase agreements with at least three different counterparties and a credit facility with a major bank. Under the reverse repurchase agreements, securities are transferred to another party, such as a bank or broker-dealer, in return for cash which can be used for additional investments.
There is no guarantee that the Trust’s leverage strategy will be successful. The Trust’s use of leverage may cause the Trust’s NAV and market price of common shares to be more volatile and can magnify the effect of any losses.
What is the state of the municipal market?
The credit situation has improved at the state level and in certain markets at the local level, offset by credits from some municipal issuers still dealing with fiscal stress. Another benefit for the portfolio is its diversification across industry groups and states. The top 10 holdings in the portfolio together represent only about 23% of the Trust’s long-term investments, and the largest position represents less than 3%.
What is the prospect for further issuance of BABs?
Remote, but it could be part of a comprehensive tax reform package. There was much discussion about whether the BAB program would be extended beyond December 31, 2010 when it expired, but in the end it was not. Many BABs issues remain outstanding, and there is a secondary market in these bonds, most of which have maturities of 20 to 30 years.
Index Definitions:
The Bank of America Build America Bond Index is designed to track the performance of U.S. dollar-denominated Build America Bonds publicly issued by U.S. states and territories, and their political subdivisions, in the U.S. market.
The Barclays U.S. Treasury Composite Index includes public obligations of the U.S. Treasury. Treasury bills are excluded by the maturity constraint but are part of a separate Short Treasury Index. In addition, certain special issues, such as state and local government series bonds (SLGs), as well as U.S. Treasury TIPS, are excluded. STRIPS are excluded from the index because their inclusion would result in double-counting. Securities in the index roll up to the U.S. Aggregate, U.S. Universal, and Global Aggregate Indices. The U.S. Treasury Index was launched on January 1, 1973.
The Barclays U.S. Aggregate Bond Index represents securities that are U.S. domestic, taxable, and dollar denominated. The index covers the U.S. investment grade fixed rate bond market, with index components for government and corporate securities, mortgage pass-through securities, and asset-backed securities.
The Barclays U.S. Corporate High Yield Index is an unmanaged index of below investment grade bonds issued by U.S. corporations.
The Barclays 1-3 Month U.S. Treasury Bill Index tracks the performance of U.S. Treasury bills with a remaining maturity of one to three months. U.S. Treasury bills, which are short-term loans to the U.S. government, are full-faith-and-credit obligations of the U.S. Treasury and are generally regarded as being free of any risk of default.
Risks and Other Considerations
The views expressed in this report reflect those of the Sub-Adviser only through the report period as stated on the cover. These views are subject to change at any time, based on market and other conditions and should not be construed as a recommendation of any kind. The material may also include forward looking statements that involve risk and uncertainty, and there is no guarantee that any predictions will come to pass. There can be no assurance that the Trust will achieve its investment objectives. The value of the Trust will fluctuate with the value of the underlying securities. Historically, closed-end funds often trade at a discount to their net asset value. There can be no assurance that the Trust will achieve its investment objectives.
Build America Bonds Risk. The BABs market is smaller and less diverse than the broader municipal securities market. In addition, because BABs are a new form of municipal financing and because bonds issued after December 31, 2010, currently do not qualify as BABs, it is impossible to predict market conditions for such bonds, meaning that BABs may experience less liquidity than other types of municipal securities. Because the ability to issue BABs was not extended beyond December 31, 2010, the number of BABs available in the market is limited and there can be no assurance that BABs will continue
6 | GBAB | GUGGENHEIM BUILD AMERICA BONDS MANAGED DURATION TRUST SEMIANNUAL REPORT |
| QUESTIONS & ANSWERS (Unaudited) continued | November 30, 2012 |
to be actively traded. Reduced liquidity may negatively affect the value of the BABs. Because issuers of direct payment BABs held in the Trust’s portfolio receive reimbursement from the U.S. Treasury with respect to interest payments on bonds, there is a risk that those municipal issuers will not receive timely payment from the U.S. Treasury and may remain obligated to pay the full interest due on direct payment BABs held by the Trust. Furthermore, it is possible that a municipal issuer may fail to comply with the requirements to receive the direct pay subsidy or that a future Congress may terminate the subsidy altogether. In addition, the Internal Revenue Code of 1986, as amended (the “Code”) contains a general offset rule (the “IRS Offset Rule”) which allows for the possibility that subsidy payments to be received by issuers of BABs may be subject to offset against amounts owed by them to the federal government. Moreover, the Internal Revenue Service (the “IRS”) may audit the agencies issuing BABs and such audits may, among other things, examine the price at which BABs are initially sold to investors. If the IRS concludes that a BAB was mis-priced based on its audit, it could disallow all or a portion of the interest subsidy received by the issuer of the BAB. The IRS Offset Rule and the disallowance of any interest subsidy as a result of an IRS audit could potentially adversely affect a BABs issuer’s credit rating, and adversely affect the issuer’s ability to repay or refinance BABs. This, in turn, could adversely affect the ratings and value of the BABs held by the Trust and the Trust’s net asset value.
Expiration of BAB Program. Bonds issued after December 31, 2010, do not qualify as BABs. From time to time the Obama administration and Congress may consider a variety of proposals to reinstate the BAB program or establish other similar programs. No assurance can be given as to whether these proposals or other changes in the BABs program will be enacted, nor can it be predicted whether such proposals or changes, if enacted, will have a positive or negative effect on the Trust.
If there are no new issuances of BABs or other taxable municipal securities with interest payments subsidized by the U.S. Government through direct pay subsidies, the Board of Trustees intends to evaluate potential actions with respect to the Trust. In such event the Board of Trustees may consider, among other things, changes to the non-fundamental investment policies of the Trust to permit the Trust to broaden its investment focus, for example to taxable municipal securities generally, merger of the Trust into another fund or termination of the Trust. If the Trust were to be terminated, the Trust would distribute all of its net assets to shareholders of record as of the date of termination after providing for all obligations of the Trust. The Trust’s investment objectives and policies are not designed to seek to return the initial offering price of the common shares in the offering on any future termination date. Investors who purchase common shares may receive more or less than their original investment upon any termination of the Trust.
General Municipal Securities Market Risk. Investing in the municipal securities market involves certain risks. The municipal market is one in which dealer firms make markets in bonds on a principal basis using their proprietary capital, and during the recent market turmoil these firms’ capital was severely constrained. As a result, some firms were unwilling to commit their capital to purchase and to serve as a dealer for municipal bonds. Certain municipal securities may not be registered with the SEC or any state securities commission and will not be listed on any national securities exchange. The amount of public information available about municipal securities is generally less than for corporate equities or bonds, and the Trust’s investment performance may therefore be more dependent on the sub-adviser’s analytical abilities. The secondary market for municipal securities, particularly the below investment-grade bonds in which the Trust may invest, also tends to be less developed or liquid than many other securities markets, which may adversely affect the Trust’s ability to sell its municipal securities at attractive prices or at prices approximating those at which the Trust currently values them. Municipal securities may contain redemption provisions, which may allow the securities to be called or redeemed prior to their stated maturity, potentially resulting in the distribution of principal and a reduction in subsequent interest distributions. Many state and municipal governments are currently under significant economic and financial stress and may not be able to satisfy their obligations. The ability of municipal issuers to make timely payments of interest and principal may be diminished during general economic downturns and as governmental cost burdens are reallocated among federal, state and local governments. The taxing powers of any governmental entity may be limited by provisions of state constitutions or laws and an entity’s credit will depend on many factors, including the entity’s tax base, the extent to which the entity relies on federal or state aid, and other factors which are beyond the entity’s control. In addition, laws enacted in the future by Congress or state legislatures or referenda could extend the time for payment of principal and/or interest, or impose other constraints on enforcement of such obligations, or on the ability of municipalities to levy taxes. Issuers of municipal securities might seek protection under Chapter 9 of the U.S. Bankruptcy Code. Although similar to other bankruptcy proceedings in some respects, municipal bankruptcy is significantly different in that there is no provision in the law for liquidation of the assets of the municipality and distribution of the proceeds to creditors. Municipal bankruptcy is available to issuers in certain states. In states in which municipal bankruptcy is not presently available, new legislation would be required to permit a municipal issuer in such state to file for bankruptcy. Municipalities must voluntarily seek protection under the Bankruptcy Code; municipal bankruptcy proceedings cannot be commenced by creditors. Due to the severe limitations placed upon the power of the bankruptcy court in Chapter 9 cases, the bankruptcy court generally is not as active in managing a municipal bankruptcy case as it is in corporate reorganizations. The bankruptcy court cannot appoint a trustee nor interfere with the municipality’s political or governmental powers or with its properties or revenues, for example by ordering reductions in expenditures, increases in taxes, or sales of property, without the municipality’s consent. In addition, the municipality can continue to borrow in the ordinary course without bankruptcy court approval if it is able to do so without affecting the rights of existing creditors. Neither creditors nor courts may control the affairs of the municipality indirectly by proposing a readjustment plan that would effectively determine the municipality’s future tax and spending decisions, so the Trust’s influence over any bankruptcy proceedings would be very limited. In the event of bankruptcy of a municipal
GBAB | GUGGENHEIM BUILD AMERICA BONDS MANAGED DURATION TRUST SEMIANNUAL REPORT | 7 |
| QUESTIONS & ANSWERS (Unaudited) continued | November 30, 2012 |
issuer, the Trust could experience delays in collecting principal and interest, and the Trust may not be able to collect all principal and interest to which it is entitled. There is no provision in municipal bankruptcy proceedings for liquidation of municipal assets in order to distribute proceeds to creditors such as the Trust.
Duration Management Risk. In connection with the Trust’s duration management strategy, the Trust may utilize certain strategies, including interest-rate swaps, in order to manage the duration of the Trust’s portfolio to reduce the interest-rate sensitivity of the Trust’s debt securities and decrease the Trust’s exposure to interest-rate risk. Until the duration management strategy is fully implemented, the Trust may be more subject to interest-rate risk. There can be no assurance that the sub- adviser’s duration management strategy will be successful at any given time in managing the duration of the Trust’s portfolio or helping the Trust to achieve its investment objectives.
Financial Leverage Risk. The Trust employs financial leverage through a bank credit facility and reverse repurchase agreements. The Adviser and the Sub-Adviser believe that the use of financial leverage will result in higher income to common shareholders over time. Use of Financial Leverage creates an opportunity for increased income and capital appreciation but, at the same time, creates special risks. There can be no assurance that a leveraging strategy will be utilized or will be successful. Financial Leverage is a speculative technique that exposes the Trust to greater risk and increased costs than if it were not implemented. Increases and decreases in the value of the Trust’s portfolio will be magnified when the Trust uses Financial Leverage. As a result, Financial Leverage may cause greater changes in the Trust’s net asset value and returns than if Financial Leverage had not been used. The Trust will also have to pay interest on its Indebtedness, if any, which may reduce the Trust’s return. This interest expense may be greater than the Trust’s return on the underlying investment, which would negatively affect the performance of the Trust. Certain types of Indebtedness subject the Trust to covenants in credit agreements relating to asset coverage and portfolio composition requirements. Certain Indebtedness issued by the Trust also may subject the Trust to certain restrictions on investments imposed by guidelines of one or more rating agencies, which may issue ratings for such Indebtedness. Such guidelines may impose asset coverage or portfolio composition requirements that are more stringent than those imposed by the 1940 Act. It is not anticipated that these covenants or guidelines will impede the Sub-Adviser from managing the Trust’s portfolio in accordance with the Trust’s investment objectives and policies. Reverse repurchase agreements involve the risks that the interest income earned on the investment of the proceeds will be less than the interest expense and Trust expenses, that the market value of the securities sold by the Trust may decline below the price at which the Trust is obligated to repurchase such securities and that the securities may not be returned to the Trust. There is no assurance that reverse repurchase agreements can be successfully employed. Dollar roll transactions involve the risk that the market value of the securities the Trust is required to purchase may decline below the agreed upon repurchase price of those securities. If the broker/dealer to whom the Trust sells securities becomes insolvent, the Trust’s right to purchase or repurchase securities may be restricted. Successful use of dollar rolls may depend upon the Sub-Adviser’s ability to correctly predict interest rates and prepayments. There is no assurance that dollar rolls can be successfully employed. Inverse floating rate securities represent beneficial interests in a special purpose trust (sometimes called a “tender option bond trust”) formed by a third party sponsor for the purpose of holding municipal bonds. Investing in such securities may expose the Trust to certain risks. In general, income on inverse floating rate securities will decrease when interest rates increase and increase when interest rates decrease. Investments in inverse floating rate securities may subject the Trust to the risks of reduced or eliminated interest payments and losses of principal. During the time in which the Trust is utilizing Financial Leverage, the amount of the fees paid to the Adviser and the Sub-Adviser for investment advisory services will be higher than if the Trust did not utilize Financial Leverage because the fees paid will be calculated based on the Trust’s Managed Assets, including proceeds of Financial Leverage. This may create a conflict of interest between the Adviser and the Sub-Adviser, on the one hand, and the Common Shareholders, on the other hand. Common Shareholders bear the portion of the investment advisory fee attributable to the assets purchased with the proceeds of Financial Leverage, which means that Common Shareholders effectively bear the entire advisory fee. In order to manage this conflict of interest, the maximum level of and types of Financial Leverage used by the Trust must be approved by the Board of Trustees, and the Board of Trustees will receive regular reports from the Adviser and the Sub-Adviser regarding the Trust’s use of Financial Leverage and the effect of Financial Leverage on the management of the Trust’s portfolio and the performance of the Trust. In addition the Trust may engage in certain derivative transactions, including swaps, that have characteristics similar to leverage. To the extent the terms of any such transaction obligate the Trust to make payments, the Trust intends to earmark or segregate cash or liquid securities in an amount at least equal to the current value of the amount then payable by the Trust under the terms of such transaction in accordance with applicable interpretations of the Staff of the SEC. To the extent the terms of any such transaction obligate the Trust to deliver particular securities to extinguish the Trust’s obligations under such transactions, the Trust may “cover” its obligations under such transaction by either (i) owning the securities or collateral underlying such transactions or (ii) having an absolute and immediate right to acquire such securities or collateral without additional cash consideration (or, if additional cash consideration is required, having earmarked or segregated cash or liquid securities). Securities so segregated or designated as “cover” will be unavailable for sale by the Sub-Adviser (unless replaced by other securities qualifying for segregation or cover requirements), which may adversely affect the ability of the Trust to pursue its investment objectives.
Below Investment-Grade Securities Risk. Under normal market conditions, the Trust may invest up to 20% of its Managed Assets in securities that at the time of investment are below investment-grade quality, which are commonly referred to as “junk” bonds and are regarded as predominately speculative with respect to the issuer’s capacity to pay interest and repay principal. Below investment-grade securities may be particularly susceptible to economic downturns. It is likely that an economic recession could severely disrupt the market for such securities and may have an adverse impact on the value of such securities. In addition, it is likely that any such economic down-
8 | GBAB | GUGGENHEIM BUILD AMERICA BONDS MANAGED DURATION TRUST SEMIANNUAL REPORT |
| QUESTIONS & ANSWERS (Unaudited) continued | November 30, 2012 |
turn could adversely affect the ability of the issuers of such securities to repay principal and pay interest thereon and increase the incidence of default for such securities. Lower grade securities, though high yielding, are characterized by high risk. They may be subject to certain risks with respect to the issuing entity and to greater market fluctuations than certain lower yielding, higher rated securities. The retail secondary market for lower grade securities may be less liquid than that for higher rated securities. Adverse conditions could make it difficult at times for the Trust to sell certain securities or could result in lower prices than those used in calculating the Trust’s net asset value. Because of the substantial risks associated with investments in lower grade securities, you could lose money on your investment in common shares of the Trust, both in the short-term and the long-term.
Special Risks Related to Certain Municipal Securities. The Trust may invest in municipal leases and certificates of participation in such leases. Municipal leases and certificates of participation involve special risks not normally associated with general obligations or revenue bonds. Leases and installment purchase or conditional sale contracts (which normally provide for title to the leased asset to pass eventually to the governmental issuer) have evolved as a means for governmental issuers to acquire property and equipment without meeting the constitutional and statutory requirements for the issuance of debt. The debt issuance limitations are deemed to be inapplicable because of the inclusion in many leases or contracts of “non-appropriation” clauses that relieve the governmental issuer of any obligation to make future payments under the lease or contract unless money is appropriated for such purpose by the appropriate legislative body on a yearly or other periodic basis. In addition, such leases or contracts may be subject to the temporary abatement of payments in the event the governmental issuer is prevented from maintaining occupancy of the leased premises or utilizing the leased equipment. Although the obligations may be secured by the leased equipment or facilities, the disposition of the property in the event of non-appropriation or foreclosure might prove difficult, time consuming and costly, and may result in a delay in recovering or the failure to fully recover the Trust’s original investment. In the event of non-appropriation, the issuer would be in default and taking ownership of the assets may be a remedy available to the Trust, although the Trust does not anticipate that such a remedy would normally be pursued. To the extent that the Trust invests in unrated municipal leases or participates in such leases, the credit quality and risk of cancellation of such unrated leases will be monitored on an ongoing basis. Certificates of participation, which represent interests in unmanaged pools of municipal leases or installment contracts, involve the same risks as the underlying municipal leases. In addition, the Trust may be dependent upon the municipal authority issuing the certificates of participation to exercise remedies with respect to the underlying securities. Certificates of participation entail a risk of default or bankruptcy not only of the issuer of the underlying lease but also of the municipal agency issuing the certificate of participation.
Asset-Backed Securities Risk. Investing in asset-backed securities (“ABS”) entails various risks, including credit risks, liquidity risks, interest-rate risks, market risks and legal risks. ABS are subject to significant credit risks because of the credit risks inherent in the underlying collateral and because issuers are primarily private entities. The structure of ABS and the terms of the investors’ interest in the collateral can vary widely depending on the type of collateral, the desires of investors and the use of credit enhancements. Although the basic elements of all ABS are similar, individual transactions can differ markedly in both structure and execution. Important determinants of the risk associated with issuing or holding the securities include the process by which principal and interest payments are allocated and distributed to investors, how credit losses affect the issuing vehicle and the return to investors in such ABS, whether collateral represents a fixed set of specific assets or accounts, whether the underlying collateral assets are revolving or closed-end, under what terms (including the maturity of the ABS itself) any remaining balance in the accounts may revert to the issuing entity and the extent to which the entity that is the actual source of the collateral assets is obligated to provide support to the issuing vehicle or to the investors in such ABS. The Trust may invest in ABS that are subordinate in right of payment and rank junior to other securities that are secured by or represent an ownership interest in the same pool of assets. In addition, many of the transactions in which such securities are issued have structural features that divert payments of interest and/or principal to more senior classes when the delinquency or loss experience of the pool exceeds certain levels. As a result, such securities have a higher risk of loss as a result of delinquencies or losses on the underlying assets.
Senior and Second Lien Secured Loans Risk: The Trust’s investments in senior loans and second lien secured floating-rate loans are typically below investment grade and are considered speculative because of the credit risk of their issuers. The risks associated with senior loans of below investment grade quality are similar to the risks of other lower-grade income securities. Second lien loans are second in right of payment to senior loans and therefore are subject to the additional risk that the cash flow of the borrower and any property securing the loan may be insufficient to meet scheduled payments after giving effect to the senior-secured obligations of the borrower. Second lien loans are expected to have greater price volatility and exposure to losses upon default than senior loans and may be less liquid.
Liquidity Risk. The Trust may invest up to 15% of its Managed Assets in municipal securities that are, at the time of investment, illiquid and certain other securities in which the Trust may invest may be illiquid. Illiquid securities are securities that cannot be disposed of within seven days in the ordinary course of business at approximately the value that the Trust values the securities. Illiquid securities may trade at a discount from comparable, more liquid securities and may be subject to wide fluctuations in market value. The Trust may be subject to significant delays in disposing of illiquid securities. Accordingly, the Trust may be forced to sell these securities at less than fair market value or may not be able to sell them when the sub-adviser believes it is desirable to do so. Illiquid securities also may entail registration expenses and other transaction costs that are higher than those for liquid securities. Restricted securities (i.e., securities subject to legal or contractual restrictions on resale) may be illiquid. However, some restricted securities (such as securities issued pursuant to Rule 144A under the Securities Act of 1933, as amended (the “1933 Act”) and certain commercial paper) may be treated as liquid for these purposes. Inverse floating-rate securities or the residual interest certificates of tender option bond trusts are not considered illiquid securities.
GBAB | GUGGENHEIM BUILD AMERICA BONDS MANAGED DURATION TRUST SEMIANNUAL REPORT | 9 |
| QUESTIONS & ANSWERS (Unaudited) continued | November 30, 2012 |
Volatility Risk. The use of financial leverage by the Trust will cause the net asset value, and possibly the market price, of the Trust’s common shares to fluctuate significantly in response to changes in interest rates and other economic indicators. In addition, the Trust may invest up to 20% of its Managed Assets in below investment-grade securities (i.e. “junk bonds”), which may be less liquid and therefore more volatile than investment-grade municipal securities. As a result, the net asset value and market price of the common shares of the Trust will be more volatile than those of a closed-end investment company that is not exposed to leverage or that does not invest in below investment-grade securities.
Government Intervention in the Financial Markets. The instability in the financial markets discussed above has led the U.S. Government to take a number of unprecedented actions designed to support certain financial institutions and segments of the financial markets that have experienced extreme volatility, and in some cases a lack of liquidity. Federal, state, and other governments, their regulatory agencies, or self regulatory organizations may take actions that affect the regulation of the instruments in which the Trust invests, or the issuers of such instruments. The Dodd-Frank Wall Street Reform and Consumer Protection Act (the “Dodd-Frank Act”), which was signed into law in July 2010, is expected to result in a significant revision of the U.S. financial regulatory framework. The Dodd-Frank Act covers a broad range of topics, including, among many others: a reorganization of federal financial regulators; the creation of a process designed to ensure financial system stability and the resolution of potentially insolvent financial firms; the enactment of new rules for derivatives trading; the creation of a consumer financial protection watchdog; the registration and regulation of managers of private funds; the regulation of credit rating agencies; and the enactment of new federal requirements for residential mortgage loans. The regulation of various types of derivative instruments pursuant to the Dodd-Frank Act may adversely affect issuers of securities in which the Trust invests that utilize derivatives strategies for hedging or other purposes. The ultimate impact of the Dodd-Frank Act, and any resulting regulation, is not yet certain and issuers of securities in which the Trust invests may also be affected by the new legislation and regulation in ways that are currently unknown and unforeseeable. Governments or their agencies may also acquire distressed assets from financial institutions and acquire ownership interests in those institutions. The implications of government ownership and disposition of these assets are unclear, and such a program may have positive or negative effects on the liquidity, valuation and performance of the Trust’s portfolio holdings.
Strategic Transactions Risk. The Trust may engage in various portfolio strategies, including derivatives transactions involving interest rate and foreign currency transactions, swaps, options and futures (“strategic transactions”), for hedging and risk management purposes and to enhance total return. The use of strategic transactions to enhance total return may be particularly speculative. Strategic transactions involve risks, including the imperfect correlation between the value of such instruments and the underlying assets, the possible default of the other party to the transaction and illiquidity of the derivative instruments. Furthermore, the Trust’s ability to successfully use strategic transactions depends on the sub-adviser’s ability to predict pertinent market movements, which cannot be assured. The use of strategic transactions may result in losses greater than if they had not been used, may require the Trust to sell or purchase portfolio securities at inopportune times or for prices other than current market values, may limit the amount of appreciation the Trust can realize on an investment or may cause the Trust to hold a security that it might otherwise sell. Additionally, amounts paid by the Trust as premiums and cash or other assets held in margin accounts with respect to strategic transactions are not otherwise available to the Trust for investment purposes.
Market Discount Risk. Shares of closed-end investment companies frequently trade at a discount from their net asset value, which is a risk separate and distinct from the risk that the Trust’s net asset value could decrease as a result of its investment activities. Although the value of the Trust’s net assets is generally considered by market participants in determining whether to purchase or sell common shares, whether investors will realize gains or losses upon the sale of common shares will depend entirely upon whether the market price of common shares at the time of sale is above or below the investor’s purchase price for common shares. Because the market price of common shares will be determined by factors such as net asset value, dividend and distribution levels (which are dependent, in part, on expenses), supply of and demand for common shares, stability of dividends or distributions, trading volume of common shares, general market and economic conditions and other factors beyond the control of the Trust, the Trust cannot predict whether common shares will trade at, below or above net asset value or at, below or above the initial public offering price. This risk may be greater for investors expecting to sell their common shares soon after the completion of the public offering, as the net asset value of the common shares will be reduced immediately following the offering as a result of the payment of certain offering costs. Common shares of the Trust are designed primarily for long-term investors; investors in common shares should not view the Trust as a vehicle for trading purposes.
Portfolio Turnover Risk. The Trust’s annual portfolio turnover rate may vary greatly from year to year. Portfolio turnover rate is not considered a limiting factor in the execution of investment decisions for the Trust. A higher portfolio turnover rate results in correspondingly greater brokerage commissions and other transactional expenses that are borne by the Trust. High portfolio turnover may result in an increased realization of net short-term capital gains by the Trust which, when distributed to common shareholders, will be taxable as ordinary income. Additionally, in a declining market, portfolio turnover may create realized capital losses. See “Taxation” in the Trust’s prospectus.
Market Disruption and Geopolitical Risk. Instability in the Middle East and terrorist attacks in the United States and around the world have contributed to increased market volatility, may have long-term effects on the U.S. and worldwide financial markets and may cause further economic uncertainties or deterioration in the United States and worldwide. The adviser and subadviser do not know how long the financial markets will continue to be affected by these events and cannot predict the effects of these or similar events in the future on the U.S. and global economies and securities markets. The Trust’s common share price will fluctuate and, at the time of sale, common shares may be worth more or less than the original investment or the Trust’s
10 | GBAB | GUGGENHEIM BUILD AMERICA BONDS MANAGED DURATION TRUST SEMIANNUAL REPORT |
| QUESTIONS & ANSWERS (Unaudited) continued | November 30, 2012 |
then-current net asset value. The Trust cannot predict whether its common shares will trade at, above or below net asset value.
In addition to the risks described above, the Trust is also subject to: Income Securities Risk, Foreign Currency Risk, Risks Associated with the Trust’s Covered Call Option Strategy, Risks of Real Property Asset Companies, Private Securities Risk, Investment Funds Risk, Private Investment Funds Risk, Affiliated Investment Funds Risk, Synthetic Investments Risk, Inflation/Deflation Risk, Anti-Takeover Provisions, Market Discount Risk, and Current Developments Risks.
Please see www.guggenheiminvestments.com/gbab for a more detailed discussion about the Trust’s risks and considerations.
GBAB | GUGGENHEIM BUILD AMERICA BONDS MANAGED DURATION TRUST SEMIANNUAL REPORT | 11 |
| TRUST SUMMARY (Unaudited) | November 30, 2012 |
| | | | | |
| Trust Statistics | | | | |
| Share Price | | $ | 23.25 |
| Common Share Net Asset Value | | $ | 23.86 |
| Premium/Discount to NAV | | | -2.56% |
| Net Assets Applicable to Common Shares ($000) | | $ | 415,483 |
| | | | | | | | |
| Total Returns | | | | | | | |
| (Inception 10/28/10) | | | Market | | NAV |
| Six Month | | | 7.01 | % | | 4.98 | % |
| One Year | | | 18.98 | % | | 16.11 | % |
| Since Inception - Average Annual | | | 14.61 | % | | 18.31 | % |
Performance data quoted represents past performance, which is no guarantee of future results and current performance may be lower or higher than the figures shown. For the most recent month-end performance figures, please visit www.guggenheiminvestments.com/gbab. The investment return and principal value of an investment will fluctuate with changes in the market conditions and other factors so that an investor’s shares, when sold, may be worth more or less than their original cost.
| | |
| | % of Municipal |
| State/Territory Allocations | Bonds |
| California | 19.9% |
| Illinois | 11.7% |
| Washington | 8.7% |
| New Jersey | 5.7% |
| Indiana | 5.6% |
| New York | 5.4% |
| Texas | 5.3% |
| Ohio | 4.7% |
| Michigan | 4.0% |
| Pennsylvania | 3.9% |
| Florida | 3.8% |
| West Virginia | 3.1% |
| Colorado | 2.8% |
| Alabama | 2.5% |
| Vermont | 2.4% |
| Nevada | 2.4% |
| Louisiana | 2.2% |
| Mississippi | 1.7% |
| South Carolina | 1.3% |
| Georgia | 1.2% |
| South Dakota | 0.9% |
| Minnesota | 0.8% |
| Portfolio composition and holdings are subject to change daily. For more information, please visit www.guggenheiminvestments.com/gbab. The above summaries are provided for informational purposes only and should not be viewed as recommendations. Past performance does not guarantee future results. |
| | |
| | % of Total |
| Portfolio Breakdown | Net Assets |
| Municipal Bonds | 109.5% |
| Corporate Bonds | 9.1% |
| Asset Backed Securities | 5.7% |
| Term Loans | 4.8% |
| Preferred Stock | 1.9% |
| Collateralized Mortgage Obligations | 0.5% |
| Total Long-Term Investments | 131.5% |
| Money Market Fund | 0.4% |
| Total Investments | 131.9% |
| Assets in excess of Liabilities | 1.7% |
| Borrowings | -13.9% |
| Reverse Repurchase Agreements | -19.7% |
| Total Net Assets | 100.0% |
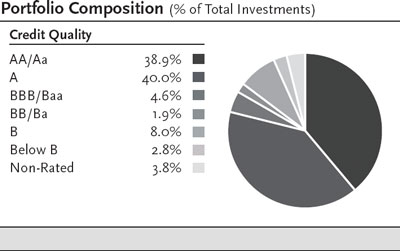
Ratings shown are assigned by one or more Nationally Recognized Statistical Credit Rating Organizations (“NRSRO”), such as Standard & Poor’s, Moody’s and Fitch. The ratings are an indication of an issuer’s creditworthiness and typically range from AAA or Aaa (highest) to D (lowest). When two or more ratings are available, the lower rating is used; and when only one is available, that rating is used. The Non-Rated category consists of securities that have not been rated by an NRSRO. U.S. Treasury securities and U.S. Government Agency securities are not rated but deemed to be equivalent to securities rated AA+/Aaa.
12 | GBAB | GUGGENHEIM BUILD AMERICA BONDS MANAGED DURATION TRUST SEMIANNUAL REPORT |
| PORTFOLIO OF INVESTMENTS (Unaudited) | November 30, 2012 |
| | Principal | | | | | | | Optional Call | | | |
| | Amount | | Description | | Rating * | Coupon | Maturity | Provisions** | | Value | |
| | | | | | | | | | | | |
| | | | Long-Term Investments – 131.5% | | | | | | | | |
| | | | Municipal Bonds – 109.5% | | | | | | | | |
| | | | Alabama – 2.8% | | | | | | | | |
| $ | 3,000,000 | | Alabama State University, General Tuition and Fee Revenue Bonds, Taxable Direct-Pay Build America Bonds, (Assured GTY)(a) (k) | | AA– | 7.100% | 09/01/2035 | 09/01/20 @ 100 | $ | 3,461,430 | |
| | 5,000,000 | | Alabama State University, General Tuition and Fee Revenue Bonds, Taxable Direct-Pay Build America Bonds, (Assured GTY)(a) (k) | | AA– | 7.200% | 09/01/2038 | 09/01/20 @ 100 | | 5,780,100 | |
| | 2,000,000 | | Alabama State University, General Tuition and Fee Revenue Bonds, Taxable Direct-Pay Build America Bonds, (Assured GTY)(a) (k) | | AA– | 7.250% | 09/01/2040 | 09/01/20 @ 100 | | 2,315,640 | |
| | | | | | | | | | | 11,557,170 | |
| | | | | | | | | | | | |
| | | | California – 21.8% | | | | | | | | |
| | 500,000 | | Alhambra Unified School District, Elementary Schools Improvement District, Los Angeles County, California, Election of 2008 General Obligation Bonds, Federally Taxable, Series B-1 | | A+ | 6.700% | 02/01/2026 | N/A | | 605,555 | |
| | 10,000,000 | | California, General Obligation Bonds, Various Purpose, Taxable Build America Bonds(a) | | A– | 7.700% | 11/01/2030 | 11/01/20 @ 100 | | 12,277,900 | |
| | 3,000,000 | | Culver City Redevelopment Agency, California, Taxable Tax Allocation Bonds, Culver City Redevelopment Project, Series 2011B(k) | | A | 8.000% | 11/01/2020 | N/A | | 3,338,640 | |
| | 340,000 | | Cypress Elementary School District (Orange County, California), General Obligation Bonds, Direct Pay Qualified School Construction Bonds, 2008 Election, Series B-2(k) | | A+ | 6.050% | 08/01/2021 | N/A | | 386,730 | |
| | 660,000 | | Cypress Elementary School District (Orange County, California), General Obligation Bonds, Direct Pay Qualified School Construction Bonds, 2008 Election, Series B-2(k) | | A+ | 6.650% | 08/01/2025 | N/A | | 766,300 | |
| | 7,500,000 | | Long Beach Unified School District, California, Qualified School Construction Bonds, Federally Taxable, Election of 2008, General Obligation Bonds, Series B-1(k) | | AA– | 5.914% | 08/01/2025 | N/A | | 9,478,800 | |
| | 10,000,000 | | Los Angeles, California, Department of Water & Power Revenue, Taxable Build America Bonds(a) | | AA– | 7.000% | 07/01/2041 | 07/01/21 @ 100 | | 12,100,100 | |
| | 10,000,000 | | Los Angeles, California, Department of Water & Power Revenue, Taxable Build America Bonds(a) | | AA | 7.003% | 07/01/2041 | 07/01/20 @ 100 | | 11,777,400 | |
| | 5,000,000 | | Metropolitan Water District, Southern California, Water Revenue Bonds, 2010 Authorization, Taxable Build America Bonds, Series A(a) | | AAA | 6.947% | 07/01/2040 | 07/01/20 @ 100 | | 6,272,650 | |
| | 1,025,000 | | Monrovia Unified School District, Los Angeles County, California, Election of 2006 General Obligation Bonds, Build America Bonds, Federally Taxable, Series C-1(a) (k) | | A+ | 7.250% | 08/01/2028 | N/A | | 1,214,112 | |
| | 8,000,000 | | Oakland Unified School District, County of Alameda, California, Taxable General Obligation Bonds, Election of 2006, Qualified School Construction Bonds, Series 2012B(k) | | NR | 6.877% | 08/01/2033 | 08/01/22 @ 100 | | 8,517,840 | |
| | 1,000,000 | | Placentia-Yorba Linda Unified School District (Orange County, California), General Obligation Bonds, Federally Taxable Direct-Pay Qualified School Construction Bonds, Election of 2008, Series E(a) (k) | | AA– | 5.400% | 02/01/2026 | N/A | | 1,123,600 | |
| | 5,000,000 | | Riverside Community College District, Riverside County, California, Election of 2004 General Obligation Bonds, Taxable Build America Bonds, Series 2010 D-1(a) | | AA | 7.021% | 08/01/2040 | 08/01/20 @ 100 | | 5,813,850 | |
| | 2,245,000 | | Santa Ana Unified School District, California, General Obligation Bonds, Federal Taxable Build America Bonds(a) | | Aa3 | 6.800% | 08/01/2030 | N/A | | 2,878,472 | |
| | 7,755,000 | | Santa Ana Unified School District, California, General Obligation Bonds, Federal Taxable Build America Bonds(a) | | Aa3 | 7.100% | 08/01/2040 | N/A | | 10,475,609 | |
| | 3,330,000 | | Sonoma Valley Unified School District, General Obligation, Federally Taxable Bonds(a) (k) | | AA– | 7.123% | 08/01/2028 | 08/01/20 @ 100 | | 3,699,863 | |
| | | | | | | | | | | 90,727,421 | |
| | | | | | | | | | | | |
| | | | Colorado – 3.0% | | | | | | | | |
| | 7,500,000 | | Colorado, Building Excellent Schools Today, Certificates of Participation, Taxable Build America Bonds, Series 2010E(a) | | AA– | 7.017% | 03/15/2031 | 03/15/21 @ 100 | | 9,294,150 | |
| | 2,500,000 | | Colorado, Building Excellent Schools Today, Certificates of Participation, Taxable Qualified School Construction, Series 2010-D | | AA– | 6.817% | 03/15/2028 | N/A | | 3,327,300 | |
| | | | | | | | | | | 12,621,450 | |
| See notes to financial statements. |
GBAB | GUGGENHEIM BUILD AMERICA BONDS MANAGED DURATION TRUST SEMIANNUAL REPORT | 13 |
| PORTFOLIO OF INVESTMENTS (Unaudited) continued | November 30, 2012 |
| | Principal | | | | | | | Optional Call | | | |
| | Amount | | Description | | Rating * | Coupon | Maturity | Provisions** | | Value | |
| | | | | | | | | | | | |
| | | | Florida – 4.2% | | | | | | | | |
| $ | 10,000,000 | | Miami-Dade County, Florida, Transit Sales Surtax Revenue, Taxable Build America Bonds, Series B(a) (k) | | AA | 6.910% | 07/01/2039 | 07/01/19 @ 100 | $ | 11,507,100 | |
| | 5,000,000 | | Orlando, Florida, Community Redevelopment Agency, Taxable Tax Increment Revenue Build America Bonds, Series 2010B(a) (k) | | A | 7.784% | 09/01/2040 | 09/01/20 @ 100 | | 5,743,700 | |
| | | | | | | | | | | 17,250,800 | |
| | | | | | | | | | | | |
| | | | Georgia – 1.3% | | | | | | | | |
| | 5,000,000 | | Georgia Municipal Association, Inc., Certificates of Participation, DeKalb County Public Schools Project, (AGM)(k) | | AA– | 5.210% | 12/01/2022 | N/A | | 5,489,150 | |
| | | | | | | | | | | | |
| | | | Illinois – 12.8% | | | | | | | | |
| | 5,000,000 | | Chicago, Illinois, Board of Education, Unlimited Tax General Obligation Bonds, Dedicated Revenues, Taxable Build America Bonds, Series 2010D(a) | | A+ | 6.519% | 12/01/2040 | N/A | | 5,762,150 | |
| | 5,100,000 | | Chicago, Illinois, Second Lien Wastewater Transmission Revenue Project Bonds, Taxable Build America Bonds, Series 2010B(a) | | A+ | 6.900% | 01/01/2040 | N/A | | 6,563,394 | |
| | 2,990,000 | | Chicago, Illinois, Second Lien Water Revenue Bonds, Taxable Build America Bonds, Series 2010B(a) | | AA– | 6.742% | 11/01/2040 | N/A | | 4,132,808 | |
| | 5,000,000 | | Illinois, General Obligation Bonds, Taxable Build America Bonds, Series 2010-5(a) | | A | 7.350% | 07/01/2035 | N/A | | 6,162,350 | |
| | 7,140,000 | | Northern Illinois Municipal Power Agency, Power Project Taxable Revenue Bonds, Prairie State Project Build America Bonds(a) (k) | | A2 | 7.620% | 01/01/2030 | N/A | | 9,182,040 | |
| | 2,860,000 | | Northern Illinois Municipal Power Agency, Power Project Taxable Revenue Bonds, Prairie State Project Build America Bonds(a) (k) | | A2 | 7.820% | 01/01/2040 | N/A | | 4,087,912 | |
| | 4,500,000 | | Northern Illinois University, Auxiliary Facilities System Revenue Bonds, Build America Program, Taxable, Series 2010, (AGM)(a) | | Aa3 | 7.947% | 04/01/2035 | 04/01/20 @ 100 | | 5,437,980 | |
| | 5,000,000 | | Northern Illinois University, Auxiliary Facilities System Revenue Bonds, Build America Program, Taxable, Series 2010, (AGM)(a) | | Aa3 | 8.147% | 04/01/2041 | 04/01/20 @ 100 | | 6,093,400 | |
| | 3,000,000 | | Southwestern Illinois, Development Authority, Taxable Local Government, Program Revenue Bonds, Flood Prevention District Council Project, Recovery Zone Economic Development Bonds, Series 2010C(k) | | AA | 7.230% | 10/15/2035 | 04/15/20 @ 100 | | 3,412,440 | |
| | 2,000,000 | | Southwestern Illinois, Development Authority, Taxable Local Government, Program Revenue Bonds, Flood Prevention District Project, Build America Bonds, Series 2010-B(a) (k) | | AA | 7.030% | 04/15/2032 | 04/15/20 @ 100 | | 2,181,000 | |
| | | | | | | | | | | 53,015,474 | |
| | | | | | | | | | | | |
| | | | Indiana – 6.2% | | | | | | | | |
| | 8,690,000 | | Evansville-Vanderburgh Independent School Building Corporation, Unlimited Taxable Ad Valorem Property Tax First Mortgage Bonds, Series 2010E | | AA+ | 6.500% | 01/15/2030 | 07/15/20 @ 100 | | 10,500,040 | |
| | 3,000,000 | | Knox County, Indiana, Good Samaritan Hospital Project, Taxable Economic Development Revenue Bonds, Qualified Energy Conservation Bonds – Direct Payment, Series 2012B(k) | | A3 | 5.900% | 04/01/2034 | N/A | | 3,296,610 | |
| | 10,000,000 | | Noblesville Multi-School Building Corporation, Hamilton County, Indiana, Taxable Unlimited Ad Valorem Property Tax First Mortgage Bonds, Build America Bonds, Series 2010(a) | | AA+ | 6.500% | 07/15/2030 | 01/15/21 @ 100 | | 11,759,700 | |
| | | | | | | | | | | 25,556,350 | |
| | | | | | | | | | | | |
| | | | Louisiana – 2.4% | | | | | | | | |
| | 8,000,000 | | Orleans Parish. School Board of the Parish of Orleans, Louisiana, (AGM)(k) | | AA– | 4.400% | 02/01/2021 | N/A | | 8,925,440 | |
| | 1,055,000 | | Tangipahoa Parish Hospital Service District No. 1, Louisiana, Taxable Hospital Revenue Bonds, North Oaks Health System Project, Build America Bonds, Series 2009A, (Assured GTY)(a) | | AA– | 7.200% | 02/01/2042 | 02/01/20 @ 100 | | 1,180,587 | |
| | | | | | | | | | | 10,106,027 | |
| | | | | | | | | | | | |
| | | | Michigan – 4.3% | | | | | | | | |
| | 415,000 | | Comstock Park Public Schools, Kent County, Michigan, 2011 School Building and Site Bonds, General Obligation – Unlimited Tax, Federally Taxable – Qualified School Construction Bonds – Direct Payment, Series A(k) | | AA– | 6.300% | 05/01/2026 | 05/01/21 @ 100 | | 465,439 | |
| | 690,000 | | Detroit, Michigan, School District, Build America Bonds(a) (k) | | AA– | 7.747% | 05/01/2039 | N/A | | 872,119 | |
| See notes to financial statements. |
14 | GBAB | GUGGENHEIM BUILD AMERICA BONDS MANAGED DURATION TRUST SEMIANNUAL REPORT |
| PORTFOLIO OF INVESTMENTS (Unaudited) continued | November 30, 2012 |
| | Principal | | | | | | | Optional Call | | | |
| | Amount | | Description | | Rating * | Coupon | Maturity | Provisions** | | Value | |
| | | | | | | | | | | | |
| | | | Michigan (continued) | | | | | | | | |
| $ | 5,000,000 | | Detroit, Michigan, School District, School Building and Site Bonds, Unlimited Tax General Obligation Bonds, Taxable Build America Bonds, Series, Series 2010B(a) (k) | | AA– | 6.845% | 05/01/2040 | 05/01/20 @ 100 | $ | 5,358,400 | |
| | 1,640,000 | | Detroit, Michigan, School District, School Building and Site Bonds, Unlimited Tax General Obligation Bonds, Taxable Qualified School Construction Bonds, Series 2010A(k) | | AA– | 6.645% | 05/01/2029 | N/A | | 1,935,807 | |
| | 3,000,000 | | Fraser Public School District, Macomb County, Michigan, General Obligation Federally Taxable School Construction Bonds, 2011 School Building and Site Bonds, Series B(k) | | AA– | 6.050% | 05/01/2026 | 05/01/21 @ 100 | | 3,361,680 | |
| | 1,000,000 | | Oakridge, Michigan, Public Schools, Unlimited Tax General Obligation Bonds(k) | | AA– | 6.750% | 05/01/2026 | 05/01/20 @ 100 | | 1,113,340 | |
| | 2,500,000 | | Whitehall District Schools, Muskegon County, Michigan, 2010 School Building and Site Bonds, General Obligation, Unlimited Tax Bonds, Taxable Qualified School Construction Bonds, Series A(k) | | AA– | 6.100% | 05/01/2026 | 05/01/20 @ 100 | | 2,756,875 | |
| | 2,000,000 | | Whitehall District Schools, Muskegon County, Michigan, 2010 School Building and Site Bonds, General Obligation, Unlimited Tax Bonds, Taxable Qualified School Construction Bonds, Series A(k) | | AA– | 6.500% | 05/01/2029 | 05/01/20 @ 100 | | 2,202,460 | |
| | | | | | | | | | | 18,066,120 | |
| | | | | | | | | | | | |
| | | | Minnesota – 0.9% | | | | | | | | |
| | 1,660,000 | | St. Paul Housing & Redevelopment Authority, Federally Taxable Revenue Bonds(j) (k) | | AA | 7.250% | 02/01/2035 | 02/01/21 @ 100 | | 1,860,927 | |
| | 1,540,000 | | St. Paul Housing & Redevelopment Authority, Federally Taxable Revenue Bonds(j) (k) | | AA | 7.500% | 02/01/2040 | 02/01/21 @ 100 | | 1,719,225 | |
| | | | | | | | | | | 3,580,152 | |
| | | | | | | | | | | | |
| | | | Mississippi – 1.8% | | | | | | | | |
| | 5,000,000 | | Medical Center Educational Building Corporation, Taxable Build America Bonds, University of Mississippi Medical Center Facilities Expansion and Renovation Project, Series 2010A(a) (k) | | AA– | 6.842% | 06/01/2035 | 06/01/20 @ 100 | | 5,584,250 | |
| | 1,000,000 | | Mississippi, Hospital Equipment and Facilities Authority, Taxable Build America Revenue Bonds, Forrest County General Hospital Project, Series 2010(a) (k) | | A2 | 7.265% | 01/01/2032 | 01/01/20 @ 100 | | 1,087,780 | |
| | 905,000 | | Mississippi, Hospital Equipment and Facilities Authority, Taxable Build America Revenue Bonds, Forrest County General Hospital Project, Series 2010(a) (k) | | A2 | 7.390% | 01/01/2040 | 01/01/20 @ 100 | | 974,051 | |
| | | | | | | | | | | 7,646,081 | |
| | | | | | | | | | | | |
| | | | Nevada – 2.6% | | | | | | | | |
| | 1,425,000 | | Clark County, Nevada, Airport Revenue Bonds, Build America Bonds, Series B(a) (k) | | AA– | 6.881% | 07/01/2042 | 07/01/19 @ 100 | | 1,631,269 | |
| | 1,200,000 | | Las Vegas Valley Water District, Nevada, Limited Tax General Obligation Water Bonds, Taxable Build America Bonds, Series 2009A(a) (k) | | AA+ | 7.100% | 06/01/2039 | 06/01/19 @ 100 | | 1,388,028 | |
| | 1,500,000 | | Nevada System of Higher Education University, Revenue Bonds, Build America Bonds(a) (k) | | AA– | 7.600% | 07/01/2030 | 07/01/20 @ 100 | | 1,794,030 | |
| | 5,050,000 | | Nevada System of Higher Education University, Revenue Bonds, Build America Bonds(a) | | AA– | 7.900% | 07/01/2040 | 07/01/20 @ 100 | | 6,060,757 | |
| | | | | | | | | | | 10,874,084 | |
| | | | | | | | | | | | |
| | | | New Jersey – 6.3% | | | | | | | | |
| | 8,000,000 | | Camden County Improvement Authority, Camden County, New Jersey, Lease Revenue Bonds, Cooper Medical School of Rowan University Project, Series 2010A (k) | | A+ | 7.747% | 07/01/2034 | 07/01/20 @ 100 | | 9,286,160 | |
| | 2,000,000 | | Camden County Improvement Authority, Camden County, New Jersey, Lease Revenue Bonds, Cooper Medical School of Rowan University Project, Series 2010A (k) | | A+ | 7.847% | 07/01/2035 | 07/01/20 @ 100 | | 2,320,340 | |
| | 10,000,000 | | New Jersey Turnpike Authority, Turnpike Revenue Bonds, Federally Taxable Issuer Subsidy, Build America Bonds, Series 2010A(a) | | A+ | 7.102% | 01/01/2041 | N/A | | 14,360,300 | |
| | | | | | | | | | | 25,966,800 | |
| | | | | | | | | | | | |
| | | | New York – 5.9% | | | | | | | | |
| | 5,000,000 | | Metropolitan Transportation Authority, New York, Transportation Revenue Bonds, Taxable Build America Bonds, Series 2010E(a) | | A | 7.134% | 11/15/2030 | 11/15/20 @ 100 | | 5,958,450 | |
| | 5,000,000 | | Metropolitan Transportation Authority, New York, Transportation Revenue Bonds, Taxable Build America Bonds, Series 2010B-1(a) | | A | 6.548% | 11/15/2031 | N/A | | 6,258,300 | |
| See notes to financial statements. |
GBAB | GUGGENHEIM BUILD AMERICA BONDS MANAGED DURATION TRUST SEMIANNUAL REPORT | 15 |
| PORTFOLIO OF INVESTMENTS (Unaudited) continued | November 30, 2012 |
| | Principal | | | | | | | Optional Call | | | |
| | Amount | | Description | | Rating * | Coupon | Maturity | Provisions** | | Value | |
| | | | | | | | | | | | |
| | | | New York (continued ) | | | | | | | | |
| $ | 10,000,000 | | Westchester County Health Care Corporation, Revenue Bonds, Taxable Build America Bonds, Series 2010(a) (k) | | BBB | 8.572% | 11/01/2040 | N/A | $ | 12,258,600 | |
| | | | | | | | | | | 24,475,350 | |
| | | | | | | | | | | | |
| | | | Ohio – 5.2% | | | | | | | | |
| | 5,000,000 | | American Municipal Power, Inc., Combined Hydroelectric Projects Revenue Bonds, New Clean Renewable Energy Bonds, Series 2010C(k) | | A | 7.334% | 02/15/2028 | N/A | | 6,514,850 | |
| | 1,950,000 | | Cuyahoga County, Ohio, Hospital Revenue Bonds, The Metrohealth System, Build America Bonds, Taxable, Series 2009B(a) (k) | | A– | 8.223% | 02/15/2040 | N/A | | 2,437,831 | |
| | 2,500,000 | | Madison Local School District, Richland County, Ohio, School Improvement, Taxable Build America Bonds, Series 2010A(a) (k) | | AA | 6.900% | 12/01/2034 | 12/01/20 @ 100 | | 2,756,975 | |
| | 2,500,000 | | Madison Local School District, Richland County, Ohio, School Improvement, Taxable Build America Bonds, Series 2010A(a) (k) | | AA | 7.150% | 12/01/2039 | 12/01/20 @ 100 | | 2,742,650 | |
| | 2,500,000 | | Madison Local School District, Richland County, Ohio, School Improvement, Taxable Build America Bonds, Series 2010A(a) (k) | | AA | 7.300% | 12/01/2043 | 12/01/20 @ 100 | | 2,741,250 | |
| | 2,500,000 | | Madison Local School District, Richland County, Ohio, School Improvement, Taxable Qualified School Construction Bonds, Series 2010B(k) | | AA | 6.650% | 12/01/2029 | 12/01/20 @ 100 | | 2,969,150 | |
| | 1,230,000 | | Toronto City School District, Ohio, Qualified School Construction Bonds General Obligation Bonds(k) | | AA | 7.000% | 12/01/2028 | 12/01/20 @ 100 | | 1,381,401 | |
| | | | | | | | | | | 21,544,107 | |
| | | | | | | | | | | | |
| | | | Pennsylvania – 4.3% | | | | | | | | |
| | 4,865,000 | | Lebanon, Pennsylvania, Sewer Revenue Bonds, Taxable Build America Bonds, Series B of 2010(a) (k) | | A+ | 7.140% | 12/15/2035 | 06/15/20 @ 100 | | 5,467,579 | |
| | 7,500,000 | | Pittsburgh, Pennsylvania, School District, Taxable Qualified School Construction Bonds, Series D | | A | 6.850% | 09/01/2029 | N/A | | 9,487,425 | |
| | 2,500,000 | | School District of Philadelphia, Pennsylvania, General Obligation Bonds, Series 2011A, Qualified School Construction Bonds - (Federally Taxable - Direct Subsidy)(k) | | A+ | 5.995% | 09/01/2030 | N/A | | 2,797,675 | |
| | | | | | | | | | | 17,752,679 | |
| | | | | | | | | | | | |
| | | | South Carolina – 1.4% | | | | | | | | |
| | 5,000,000 | | Horry County, South Carolina, Taxable Airport Revenue Bonds, Recovery Zone Economic Development Bonds, Series 2010B(a) (j) (k) | | A– | 7.328% | 07/01/2040 | N/A | | 5,972,600 | |
| | | | | | | | | | | | |
| | | | South Dakota – 0.9% | | | | | | | | |
| | 3,490,000 | | Pierre, South Dakota, Taxable Electric Revenue Bonds, Recovery Zone Economic Development Bonds, Series 2010C(a) (k) | | A2 | 7.500% | 12/15/2040 | 12/15/19 @ 100 | | 3,908,172 | |
| | | | | | | | | | | | |
| | | | Texas – 5.8% | | | | | | | | |
| | 10,000,000 | | Dallas, Texas, Convention Center Hotel Development Corporation, Hotel Revenue Bonds, Taxable Build America Bonds, Series 2009B(a) (k) | | A+ | 7.088% | 01/01/2042 | N/A | | 12,208,200 | |
| | 10,000,000 | | El Paso, Texas, Combination Tax and Revenue Certification of Obligation, Taxable Build America Bonds, Series 2010B(a) | | AA | 6.700% | 08/15/2036 | 08/15/20 @ 100 | | 11,820,500 | |
| | | | | | | | | | | 24,028,700 | |
| | | | | | | | | | | | |
| | | | Vermont – 2.6% | | | | | | | | |
| | 2,155,000 | | Vermont State Colleges, Revenue Bonds, Taxable Build America Bonds, Series 2010B(a) (k) | | A+ | 6.101% | 07/01/2025 | 07/01/20 @ 100 | | 2,373,539 | |
| | 7,500,000 | | Vermont State Colleges, Revenue Bonds, Taxable Build America Bonds, Series 2010B(a) (k) | | A+ | 7.211% | 07/01/2040 | 07/01/20 @ 100 | | 8,521,725 | |
| | | | | | | | | | | 10,895,264 | |
| | | | | | | | | | | | |
| | | | Washington – 9.6% | | | | | | | | |
| | 5,000,000 | | Anacortes, Washington, Utility System Improvement Revenue Bonds, Build America Bonds, Series 2010B(a) (k) | | AA– | 6.479% | 12/01/2030 | 12/01/20 @ 100 | | 5,688,800 | |
| | 2,000,000 | | Auburn, Washington, Utility System Revenue Bonds, Taxable Build America Bonds, Series 2010B(a) (k) | | AA | 6.396% | 12/01/2030 | 12/01/20 @ 100 | | 2,315,520 | |
| See notes to financial statements. |
16 | GBAB | GUGGENHEIM BUILD AMERICA BONDS MANAGED DURATION TRUST SEMIANNUAL REPORT |
| PORTFOLIO OF INVESTMENTS (Unaudited) continued | November 30, 2012 |
| | Principal | | | | | | | Optional Call | | | |
| | Amount | | Description | | Rating * | Coupon | Maturity | Provisions** | | Value | |
| | | | | | | | | | | | |
| | | | Washington (continued) | | | | | | | | |
| $ | 5,000,000 | | Central Washington University, System Revenue Bonds, 2010, Taxable Build America Bonds, Series B(a) (k) | | A1 | 6.500% | 05/01/2030 | N/A | $ | 5,815,000 | |
| | 5,800,000 | | Public Hospital District No. 1, King County, Washington, Valley Medical Center, Hospital Facilities Revenue Bonds, Series 2010B(a) (k) | | BBB+ | 8.000% | 06/15/2040 | 06/15/20 @ 100 | | 6,574,822 | |
| | 5,000,000 | | Washington State Convention Center Public Facilities District, Lodging Tax Bonds, Taxable Build America Bonds, Series 2010B(a) | | A+ | 6.790% | 07/01/2040 | N/A | | 6,195,800 | |
| | 3,325,000 | | Washington State University, Housing and Dining System Revenue Bonds, Taxable Build America Bonds, Series 2010B(a) (k) | | A+ | 7.099% | 04/01/2032 | N/A | | 4,257,197 | |
| | 6,675,000 | | Washington State University, Housing and Dining System Revenue Bonds, Taxable Build America Bonds, Series 2010B(a) (k) | | A+ | 7.399% | 04/01/2041 | N/A | | 8,840,770 | |
| | | | | | | | | | | 39,687,909 | |
| | | | | | | | | | | | |
| | | | West Virginia – 3.4% | | | | | | | | |
| | 10,000,000 | | State of West Virginia, Higher Education Policy Commission, Revenue Bonds, Federally Taxable Build America Bonds 2010, Series B(a) | | A+ | 7.650% | 04/01/2040 | N/A | | 14,145,100 | |
| | | | | | | | | | | | |
| | | | Total Municipal Bonds – 109.5% | | | | | | | | |
| | | | (Cost $378,852,425) | | | | | | | 454,866,960 | |
| | | | | | | | | | | | |
| | | | Corporate Bonds – 9.1% | | | | | | | | |
| | | | Advertising – 0.1% | | | | | | | | |
| | 200,000 | | Sitel, LLC / Sitel Finance Corp.(b) (k) | | B | 11.000% | 08/01/2017 | 08/01/14 @ 106 | | 201,000 | |
| | | | | | | | | | | | |
| | | | Airlines – 1.0% | | | | | | | | |
| | 137,276 | | Atlas Air 1999-1 Pass-Through Trust, Series 1999-1, Class A-1(k) | | NR | 7.200% | 07/02/2020 | N/A | | 137,276 | |
| | 2,092,726 | | Atlas Air 2000-1 Class A Pass Through Trust, Series 2000-1, Class A(k) | | NR | 8.707% | 07/02/2021 | N/A | | 2,092,726 | |
| | 2,000,000 | | Delta Air Lines 2011-1 Class B Pass-Through Trust, Series 2011-1, Class B(k) | | BB | 7.125% | 04/15/2016 | N/A | | 2,047,500 | |
| | 160,000 | | Global Aviation Holdings, Inc.(h) (j) (k) | | NR | 14.000% | 08/15/2013 | 01/04/13 @ 111 | | 46,800 | |
| | | | | | | | | | | 4,324,302 | |
| | | | | | | | | | | | |
| | | | Building Materials – 0.5% | | | | | | | | |
| | 2,000,000 | | Cemex SAB de CV (Mexico)(b) (k) | | B– | 9.000% | 01/11/2018 | 01/11/15 @ 105 | | 2,115,000 | |
| | | | | | | | | | | | |
| | | | Coal – 0.1% | | | | | | | | |
| | 275,000 | | Penn Virginia Resource Partners LP / Penn Virginia Resource Finance Corp.(k) | | B | 8.250% | 04/15/2018 | 04/15/14 @ 104 | | 287,375 | |
| | 200,000 | | Penn Virginia Resource Partners, LP / Penn Virginia Resource Finance Corp. II (b) (k) | | B | 8.375% | 06/01/2020 | 06/01/16 @ 104 | | 210,000 | |
| | | | | | | | | | | 497,375 | |
| | | | | | | | | | | | |
| | | | Commercial Services – 0.6% | | | | | | | | |
| | 400,000 | | Ceridian Corp.(b) (k) | | B– | 8.875% | 07/15/2019 | 07/15/15 @ 107 | | 428,000 | |
| | 2,200,000 | | DynCorp International, Inc.(k) | | B– | 10.375% | 07/01/2017 | 07/01/14 @ 105 | | 1,941,500 | |
| | 180,000 | | Rural Metro Corp.(b) | | CCC+ | 10.125% | 07/15/2019 | 07/15/15 @ 105 | | 170,100 | |
| | 100,000 | | Rural Metro Corp.(b) | | CCC+ | 10.125% | 07/15/2019 | 07/15/15 @ 105 | | 94,000 | |
| | | | | | | | | | | 2,633,600 | |
| | | | | | | | | | | | |
| | | | Computers – 0.1% | | | | | | | | |
| | 455,000 | | Stream Global Services, Inc. | | B+ | 11.250% | 10/01/2014 | 10/01/13 @ 100 | | 477,750 | |
| | | | | | | | | | | | |
| | | | Distribution & Wholesale – 0.1% | | | | | | | | |
| | 330,000 | | INTCOMEX, Inc.(k) | | B– | 13.250% | 12/15/2014 | 12/15/13 @ 100 | | 335,775 | |
| | | | | | | | | | | | |
| | | | Diversified Financial Services – 0.1% | | | | | | | | |
| | 200,000 | | Jefferies Group, Inc.(k) | | BBB | 6.875% | 04/15/2021 | N/A | | 221,500 | |
| | 39,000 | | LCP Dakota Fund, Series 2012-6, Class P | | NR | 10.000% | 12/16/2019 | N/A | | 39,336 | |
| | 140,000 | | Nationstar Mortgage, LLC / Nationstar Capital Corp.(b) (k) | | B+ | 9.625% | 05/01/2019 | 05/01/15 @ 107 | | 155,050 | |
| | | | | | | | | | | 415,886 | |
| See notes to financial statements. |
GBAB | GUGGENHEIM BUILD AMERICA BONDS MANAGED DURATION TRUST SEMIANNUAL REPORT | 17 |
| PORTFOLIO OF INVESTMENTS (Unaudited) continued | November 30, 2012 |
| | Principal | | | | | | | Optional Call | | | |
| | Amount | | Description | | Rating * | Coupon | Maturity | Provisions** | | Value | |
| | | | | | | | | | | | |
| | | | Engineering & Construction – 0.6% | | | | | | | | |
| $ | 2,266,667 | | Alion Science and Technology Corp.(c) (k) | | B– | 12.000% | 11/01/2014 | 04/01/13 @ 105 | $ | 2,108,000 | |
| | 1,000,000 | | Alion Science and Technology Corp.(k) | | CCC– | 10.250% | 02/01/2015 | 02/01/13 @ 100 | | 510,000 | |
| | | | | | | | | | | 2,618,000 | |
| | | | | | | | | | | | |
| | | | Entertainment – 1.2% | | | | | | | | |
| | 1,600,000 | | Diamond Resorts Corp.(k) | | B– | 12.000% | 08/15/2018 | 08/15/14 @ 106 | | 1,728,000 | |
| | 1,810,000 | | Lions Gate Entertainment, Inc.(b) (k) | | B | 10.250% | 11/01/2016 | 11/01/13 @ 105 | | 2,013,625 | |
| | 1,000,000 | | WMG Acquisition Corp.(k) | | B– | 11.500% | 10/01/2018 | 10/01/14 @ 109 | | 1,130,000 | |
| | 100,000 | | Yonkers Racing Corp.(b) (k) | | B+ | 11.375% | 07/15/2016 | 07/15/13 @ 106 | | 107,750 | |
| | | | | | | | | | | 4,979,375 | |
| | | | | | | | | | | | |
| | | | Food – 0.5% | | | | | | | | |
| | 2,009,000 | | Bumble Bee Acquisition Corp.(b) (k) | | B | 9.000% | 12/15/2017 | 12/15/14 @ 105 | | 2,119,495 | |
| | | | | | | | | | | | |
| | | | Health Care Services – 0.4% | | | | | | | | |
| | 750,000 | | Apria Healthcare Group, Inc.(k) | | BB | 11.250% | 11/01/2014 | 11/01/13 @ 100 | | 775,313 | |
| | 325,000 | | OnCure Holdings, Inc.(k) | | Caa3 | 11.750% | 05/15/2017 | 05/15/14 @ 106 | | 167,375 | |
| | 210,000 | | Physiotherapy Associates Holdings, Inc.(b) (k) | | B | 11.875% | 05/01/2019 | 05/01/15 @ 109 | | 207,900 | |
| | 423,503 | | Symbion, Inc.(d) (k) | | CCC+ | 11.000% | 08/23/2015 | 08/23/13 @ 100 | | 436,208 | |
| | 150,000 | | Symbion, Inc.(k) | | B | 8.000% | 06/15/2016 | 06/15/14 @ 104 | | 154,500 | |
| | | | | | | | | | | 1,741,296 | |
| | | | | | | | | | | | |
| | | | Internet – 1.1% | | | | | | | | |
| | 4,250,000 | | GXS Worldwide, Inc.(k) | | B | 9.750% | 06/15/2015 | 06/15/13 @ 102 | | 4,435,937 | |
| | 120,000 | | Open Solutions, Inc.(b) (k) | | CCC+ | 9.750% | 02/01/2015 | 02/01/13 @ 100 | | 96,600 | |
| | 100,000 | | Zayo Group LLC / Zayo Capital, Inc. | | B | 8.125% | 01/01/2020 | 07/01/15 @ 104 | | 109,250 | |
| | | | | | | | | | | 4,641,787 | |
| | | | | | | | | | | | |
| | | | Leisure Time – 0.0%*** | | | | | | | | |
| | 75,000 | | Sabre, Inc.(b) | | B | 8.500% | 05/15/2019 | 05/15/15 @ 106 | | 79,313 | |
| | | | | | | | | | | | |
| | | | Lodging – 0.2% | | | | | | | | |
| | 100,000 | | Caesars Entertainment Operating Co., Inc.(b) (k) | | B | 8.500% | 02/15/2020 | 02/15/16 @ 104 | | 98,000 | |
| | 900,000 | | Caesars Entertainment Operating Co., Inc.(b) (k) | | B | 9.000% | 02/15/2020 | 02/15/16 @ 105 | | 897,750 | |
| | | | | | | | | | | 995,750 | |
| | | | | | | | | | | | |
| | | | Machinery-Diversified – 0.1% | | | | | | | | |
| | 250,000 | | Tempel Steel Co.(b) (k) | | B | 12.000% | 08/15/2016 | 02/15/14 @ 109 | | 225,000 | |
| | | | | | | | | | | | |
| | | | Media – 0.1% | | | | | | | | |
| | 520,000 | | Baker & Taylor Acquisitions Corp.(b) (k) | | CCC | 15.000% | 04/01/2017 | N/A | | 390,000 | |
| | | | | | | | | | | | |
| | | | Mining – 0.2% | | | | | | | | |
| | 260,000 | | Horsehead Holding Corp.(b) | | B– | 10.500% | 06/01/2017 | 06/01/15 @ 105 | | 270,400 | |
| | 100,000 | | Kaiser Aluminum Corp.(k) | | BB– | 8.250% | 06/01/2020 | 06/01/16 @ 104 | | 109,500 | |
| | 400,000 | | Midwest Vanadium Pty Ltd. (Australia)(b) (k) | | CCC+ | 11.500% | 02/15/2018 | 02/15/15 @ 106 | | 250,000 | |
| | | | | | | | | | | 629,900 | |
| | | | | | | | | | | | |
| | | | Oil & Gas – 0.2% | | | | | | | | |
| | 100,000 | | EPL Oil & Gas, Inc.(b) | | B– | 8.250% | 02/15/2018 | 02/15/15 @ 104 | | 99,250 | |
| | 600,000 | | Midstates Petroleum Co., Inc./ Midstates Petroleum Co. LLC(b) | | B– | 10.750% | 10/01/2020 | 10/01/16 @ 105 | | 633,000 | |
| | | | | | | | | | | 732,250 | |
| | | | | | | | | | | | |
| | | | Oil & Gas Services – 0.1% | | | | | | | | |
| | 200,000 | | Exterran Holdings, Inc.(k) | | BB | 7.250% | 12/01/2018 | 12/01/13 @ 105 | | 210,000 | |
| | | | | | | | | | | | |
| | | | Packaging & Containers – 0.1% | | | | | | | | |
| | 300,000 | | Pretium Packaging, LLC / Pretium Finance, Inc.(k) | | B– | 11.500% | 04/01/2016 | 04/01/14 @ 106 | | 309,750 | |
| See notes to financial statements. |
18 | GBAB | GUGGENHEIM BUILD AMERICA BONDS MANAGED DURATION TRUST SEMIANNUAL REPORT |
| PORTFOLIO OF INVESTMENTS (Unaudited) continued | November 30, 2012 |
| | Principal | | | | | | | Optional Call | | | |
| | Amount | | Description | | Rating * | Coupon | Maturity | Provisions** | | Value | |
| | | | | | | | | | | | |
| | | | Real Estate Investment Trusts – 0.2% | | | | | | | | |
| $ | 750,000 | | Wells Operating Partnership II, LP(k) | | BBB– | 5.875% | 04/01/2018 | N/A | $ | 785,873 | |
| | | | | | | | | | | | |
| | | | Retail – 0.4% | | | | | | | | |
| | 100,000 | | Checkers Drive-In Restaurants, Inc.(b) | | B– | 11.000% | 12/01/2017 | 06/01/15 @ 108 | | 101,250 | |
| | 880,000 | | GRD Holdings III Corp.(b) (k) | | B | 10.750% | 06/01/2019 | 06/01/15 @ 108 | | 899,800 | |
| | 190,000 | | Logan’s Roadhouse, Inc.(k) | | B– | 10.750% | 10/15/2017 | 10/15/13 @ 108 | | 178,125 | |
| | 220,000 | | Mastro’s Restaurants, LLC/ RRG Finance Corp.(b) (k) | | B– | 15.000% | 06/01/2017 | 12/01/14 @ 109 | | 226,875 | |
| | 190,000 | | Wok Acquisition Corp.(b) | | CCC+ | 10.250% | 06/30/2020 | 06/30/16 @ 105 | | 199,975 | |
| | | | | | | | | | | 1,606,025 | |
| | | | | | | | | | | | |
| | | | Software – 0.1% | | | | | | | | |
| | 400,000 | | Infor US, Inc.(k) | | B– | 11.500% | 07/15/2018 | 07/15/15 @ 106 | | 464,000 | |
| | | | | | | | | | | | |
| | | | Textiles – 0.0%*** | | | | | | | | |
| | 150,000 | | Empire Today, LLC / Empire Today Finance Corp.(b) (k) | | B– | 11.375% | 02/01/2017 | 02/01/14 @ 106 | | 160,125 | |
| | | | | | | | | | | | |
| | | | Transportation – 0.6% | | | | | | | | |
| | 50,156 | | Atlas Air, Inc.(b) (k) | | NR | 8.707% | 07/02/2021 | N/A | | 50,156 | |
| | 985,000 | | CEVA Group PLC (United Kingdom)(b) (k) | | B– | 8.375% | 12/01/2017 | 12/01/13 @ 106 | | 955,450 | |
| | 1,450,000 | | Marquette Transportation Company/Marquette Transportation Finance Corp.(k) | | B– | 10.875% | 01/15/2017 | 01/15/14 @ 105 | | 1,518,875 | |
| | | | | | | | | | | 2,524,481 | |
| | | | | | | | | | | | |
| | | | Trucking & Leasing – 0.4% | | | | | | | | |
| | 1,616,000 | | AWAS Aviation Capital Ltd. (Ireland)(b) (k) | | BBB | 7.000% | 10/17/2016 | 10/18/13 @ 104 | | 1,704,880 | |
| | | | | | | | | | | | |
| | | | Total Corporate Bonds – 9.1% | | | | | | | | |
| | | | (Cost $37,694,366) | | | | | | | 37,917,988 | |
| | | | | | | | | | | | |
| | | | Asset Backed Securities – 5.7% | | | | | | | | |
| | | | Automobile – 0.0%*** | | | | | | | | |
| | 44,023 | | Bush Truck Leasing, LLC, Series 2011-AA, Class C(b) (k) | | NR | 5.000% | 09/25/2018 | N/A | | 43,901 | |
| | | | | | | | | | | | |
| | | | Collateralized Debt Obligation – 1.7% | | | | | | | | |
| | 143,312 | | Diversified Asset Securitization Holdings II LP, Series 1X, Class A1L (Cayman Islands)(e) | | BBB+ | 0.879% | 09/15/2035 | N/A | | 138,058 | |
| | 45,591 | | G-Star Ltd., Series 2003-A, Class A1 (Cayman Islands)(b) (e) (k) | | BBB– | 0.946% | 03/13/2038 | N/A | | 44,650 | |
| | 242,986 | | Independence I CDO Ltd., Series 1A, Class A (Cayman Islands)(b) (e) (k) | | BB+ | 0.709% | 12/30/2030 | N/A | | 234,008 | |
| | 6,718,135 | | Putnam Structured Product, Series 2003-1A, Class A1LB(b) (e) (k) | | CCC | 0.658% | 10/15/2038 | N/A | | 6,061,505 | |
| | 639,471 | | Putnam Structured Product CDO, Series 2002-1A, Class A2 (Cayman Islands)(b) (e) (k) | | CCC+ | 0.889% | 01/10/2038 | N/A | | 557,957 | |
| | 200,000 | | Stone Tower CDO Ltd., Series 2004-1A, Class A2L (Cayman Islands)(b) (e) (k) | | BBB– | 1.563% | 01/29/2040 | N/A | | 180,418 | |
| | | | | | | | | | | 7,216,596 | |
| | | | | | | | | | | | |
| | | | Collateralized Loan Obligation – 2.5% | | | | | | | | |
| | 500,000 | | Alm Loan Funding, Series 2010-3A, Class C(b) (e) (k) | | BBB | 4.312% | 11/20/2020 | N/A | | 477,658 | |
| | 250,000 | | Atlas Senior Loan Fund II Ltd., Series 2012-2A (Cayman Islands)(b) (l) | | NR | 0.000% | 01/30/2024 | N/A | | 238,440 | |
| | 100,000 | | BlackRock Senior Income Series Corp., Series 2004-1A (Cayman Islands)(b) (k) (l) | | NR | 0.000% | 09/15/2016 | N/A | | 53,500 | |
| | 889,201 | | CapitalSource Commercial Loan Trust, Series 2006-2A, Class D(b) (e) (k) | | B+ | 1.728% | 09/20/2022 | N/A | | 868,493 | |
| | 250,000 | | Carlyle Global Market Strategies, Series 2012-3A (Cayman Islands)(b) (l) | | NR | 0.000% | 10/04/2024 | N/A | | 245,862 | |
| | 250,000 | | Cerberus Offshore Levered I LP, Series 2012-1A, Class C (Cayman Islands)(b) (e) | | Baa2 | 6.447% | 11/30/2018 | N/A | | 251,985 | |
| | 2,000,000 | | Churchill Financial Cayman Ltd., Series 2007-1A, Class C (Cayman Islands)(b) (e) (k) | | A+ | 1.600% | 07/10/2019 | N/A | | 1,666,677 | |
| | 1,000,000 | | Churchill Financial Cayman Ltd., Series 2007-1A, Class D1 (Cayman Islands)(b) (e) (k) | | BBB+ | 2.950% | 07/10/2019 | N/A | | 878,200 | |
| | 1,000,000 | | Churchill Financial Cayman Ltd., Series 2007-1A, Class D2 (Cayman Islands)(b) (e) (k) | | BBB+ | 8.370% | 07/10/2019 | N/A | | 985,603 | |
| | 145,601 | | Colts Trust, Series 2005-2A, Class C (Cayman Islands)(b) (e) (k) | | AAA | 1.229% | 12/20/2018 | N/A | | 145,931 | |
| | 250,000 | | Colts Trust, Series 2007-1A, Class C (Cayman Islands)(b) (e) (k) | | AA | 1.179% | 03/20/2021 | N/A | | 205,300 | |
| | 300,000 | | Cratos CLO Ltd., Series 2007-1A, Class C (Cayman Islands)(b) (e) (k) | | AA– | 1.411% | 05/19/2021 | N/A | | 250,827 | |
| | 550,000 | | Eastland CLO Ltd., Series 2007-1A, Class A2B (Cayman Islands)(b) (e) (k) | | AA+ | 0.643% | 05/01/2022 | N/A | | 453,127 | |
| See notes to financial statements. |
GBAB | GUGGENHEIM BUILD AMERICA BONDS MANAGED DURATION TRUST SEMIANNUAL REPORT | 19 |
| PORTFOLIO OF INVESTMENTS (Unaudited) continued | November 30, 2012 |
| | Principal | | | | | | | Optional Call | | | |
| | Amount | | Description | | Rating * | Coupon | Maturity | Provisions** | | Value | |
| | | | | | | | | | | | |
| | | | Collateralized Loan Obligation (continued) | | | | | | | | |
| $ | 250,000 | | Emporia Preferred Funding (Cayman Islands)(b) (e) (k) | | AA | 1.293% | 10/12/2018 | N/A | $ | 223,340 | |
| | 250,000 | | Genesis CLO Ltd., Series 2007-2A, Class D (Cayman Islands)(b) (e) (k) | | BBB | 4.350% | 01/10/2016 | N/A | | 248,294 | |
| | 200,000 | | Katonah IX CLO Ltd., Series 2006-9A, Class A3L (Cayman Islands)(b) (e) (k) | | BBB+ | 1.035% | 01/25/2019 | N/A | | 164,820 | |
| | 500,000 | | KKR CLO Trust, Series 2007-1A, Class D (Cayman Islands)(b) (e) (k) | | A | 2.560% | 05/15/2021 | N/A | | 459,205 | |
| | 100,000 | | Knightsbridge CLO, Series 2007-1A, Class D (Cayman Islands)(b) (e) (k) | | BBB | 5.347% | 01/11/2022 | N/A | | 95,020 | |
| | 1,992,806 | | Newstar Trust, Series 2005-1A, Class C(b) (e) (k) | | B+ | 1.165% | 07/25/2018 | N/A | | 1,811,716 | |
| | 312,982 | | Sargas CLO II Ltd., Series 2006-1A, Class E (Cayman Islands)(b) (e) (k) | | B+ | 4.319% | 10/20/2018 | N/A | | 310,832 | |
| | 200,000 | | Summit Lake CLO Ltd., Series 2005-1A, Class C1A(l) | | NR | 0.000% | 02/24/2018 | N/A | | 121,826 | |
| | 250,000 | | T2 Income Fund CLO Ltd., Series 2007-1A, Class D (Cayman Islands)(b) (e) (k) | | A+ | 3.090% | 07/15/2019 | N/A | | 216,846 | |
| | | | | | | | | | | 10,373,502 | |
| | | | | | | | | | | | |
| | | | Commercial Receivables – 0.1% | | | | | | | | |
| | 400,000 | | Leaf II Receivables Funding, LLC, Series 2010-4, Class D(b) (k) | | NR | 5.000% | 01/20/2019 | N/A | | 371,080 | |
| | | | | | | | | | | | |
| | | | Credit Card – 0.1% | | | | | | | | |
| | 417,631 | | Citi Holdings Liquidating Unrated Performing Assets, Series 2012-Biz A(b) (l) | | NR | 0.000% | 12/15/2049 | N/A | | 301,943 | |
| | | | | | | | | | | | |
| | | | Insurance – 0.0%*** | | | | | | | | |
| | 94,600 | | Insurance Note Capital Term, Series 2005-1R1A(b) (e) (k) | | A– | 0.529% | 06/09/2033 | N/A | | 87,372 | |
| | | | | | | | | | | | |
| | | | Media – 0.8% | | | | | | | | |
| | 1,300,000 | | Adams Outdoor Advertising, LP, Series 2010-1, Class B(b) (k) | | Ba2 | 8.836% | 12/20/2040 | N/A | | 1,401,834 | |
| | 1,825,000 | | Adams Outdoor Advertising, LP, Series 2010-1, Class C(b) (k) | | B3 | 10.756% | 12/20/2040 | N/A | | 1,975,358 | |
| | | | | | | | | | | 3,377,192 | |
| | | | | | | | | | | | |
| | | | Other ABS – 0.0%*** | | | | | | | | |
| | 19,010 | | Aircraft Certificate Owner Trust, Series 2003-1A, Class D(b) (j) (k) | | BB | 6.455% | 09/20/2022 | N/A | | 19,295 | |
| | | | | | | | | | | | |
| | | | Timeshare – 0.1% | | | | | | | | |
| | 223,842 | | Silverleaf Finance LLC, Series 2011-A, Class A(b) (k) | | NR | 9.000% | 06/15/2023 | N/A | | 222,373 | |
| | | | | | | | | | | | |
| | | | Transportation – 0.4% | | | | | | | | |
| | 22,556 | | Castle Trust, Series 2003-1AW, Class A1(b) (e) (k) | | AA | 0.958% | 05/15/2027 | N/A | | 20,864 | |
| | 178,262 | | Raspro Trust, Series 2005-1A, Class G(b) (e) (k) | | A | 0.779% | 03/23/2024 | N/A | | 150,631 | |
| | 1,579,670 | | Vega Containervessel PLC, Series 2006-1A, Class A(b) (k) | | Ba3 | 5.562% | 02/10/2021 | N/A | | 1,516,484 | |
| | | | | | | | | | | 1,687,979 | |
| | | | | | | | | | | | |
| | | | Total Asset Backed Securities – 5.7% | | | | | | | | |
| | | | (Cost $22,585,412) | | | | | | | 23,701,233 | |
| | | | | | | | | | | | |
| | | | Collateralized Mortgage Obligations – 0.5% | | | | | | | | |
| | | | Commercial Mortgage Backed Security – Traditional – 0.5% | | | | | | | | |
| | 2,000,000 | | GS Mortgage Securities Corp. II, Series 2007-EOP, Class H(b) (e) (k) | | BBB– | 3.300% | 03/06/2020 | N/A | | 2,012,600 | |
| | | | | | | | | | | | |
| | | | Residential Mortgage Backed Security – 0.0%*** | | | | | | | | |
| | 92,692 | | Nomura Resecuritization Trust, Series 2012-1R, Class A(b) (e) (k) | | NR | 0.651% | 08/27/2047 | N/A | | 81,106 | |
| | | | | | | | | | | | |
| | | | Total Collateralized Mortgage Obligations – 0.5% | | | | | | | | |
| | | | (Cost $1,896,984) | | | | | | | 2,093,706 | |
| | | | | | | | | | | | |
| | | | Term Loans – 4.8%(f) | | | | | | | | |
| | | | Aerospace and Defense – 0.0%*** | | | | | | | | |
| | 98,521 | | API Technologies Corp.(j) | | B | 8.750% | 06/27/2016 | N/A | | 97,043 | |
| | | | | | | | | | | | |
| | | | Automotive – 0.1% | | | | | | | | |
| | 40,000 | | Fleetpride, 2nd Lien | | CCC+ | 9.250% | 05/15/2020 | N/A | | 39,333 | |
| | 19,950 | | Keystone Automotive | | Caa2 | 9.750% | 03/30/2016 | N/A | | 20,150 | |
| | 340,000 | | Navistar, Inc. | | B+ | 7.000% | 08/16/2017 | N/A | | 341,598 | |
| | | | | | | | | | | 401,081 | |
| See notes to financial statements. |
20 | GBAB | GUGGENHEIM BUILD AMERICA BONDS MANAGED DURATION TRUST SEMIANNUAL REPORT |
| PORTFOLIO OF INVESTMENTS (Unaudited) continued | November 30, 2012 |
| | Principal | | | | | | | Optional Call | | | |
| | Amount | | Description | | Rating * | Coupon | Maturity | Provisions** | | Value | |
| | | | | | | | | | | | |
| | | | Brokerage – 0.0%*** | | | | | | | | |
| $ | 30,000 | | AmWins Group, Inc., 2nd Lien | | CCC+ | 9.250% | 12/07/2019 | N/A | $ | 30,375 | |
| | | | | | | | | | | | |
| | | | Consumer Products – 0.1% | | | | | | | | |
| | 345,625 | | Targus Group International, Inc. | | B | 11.000% | 5/24/16 | N/A | | 349,945 | |
| | | | | | | | | | | | |
| | | | Consumer Services – 0.4% | | | | | | | | |
| | 350,000 | | Endurance International, Lien 1 | | B | 6.250% | 11/06/2019 | N/A | | 349,855 | |
| | 98,750 | | Nab Holdings, LLC, 1st Lien | | BB+ | 7.000% | 04/24/2018 | N/A | | 99,737 | |
| | 885,106 | | Osmose Holdings, Inc. | | B+ | 6.750% | 11/26/18 | N/A | | 889,531 | |
| | 112,394 | | Osmose Holdings, Inc. | | B+ | 0.500% | 11/26/2018 | N/A | | 112,956 | |
| | 30,000 | | Travelport Holdings Ltd. | | B+ | 4.860% | 08/21/2015 | N/A | | 28,554 | |
| | | | | | | | | | | 1,480,633 | |
| | | | | | | | | | | | |
| | | | Diversified Manufacturing – 0.1% | | | | | | | | |
| | 420,000 | | CPM Holdings, 1st Lien | | B+ | 6.250% | 08/16/2017 | N/A | | 424,200 | |
| | | | | | | | | | | | |
| | | | Electric – 0.0%*** | | | | | | | | |
| | 100,000 | | Astoria Generating Co. Acquisitions | | B | 8.500% | 10/26/2017 | N/A | | 100,407 | |
| | | | | | | | | | | | |
| | | | Entertainment – 0.0%*** | | | | | | | | |
| | 90,000 | | CKX Entertainment, Inc., 1st Lien | | B+ | 9.000% | 06/21/2017 | N/A | | 78,075 | |
| | | | | | | | | | | | |
| | | | Food – 0.1% | | | | | | | | |
| | 323,000 | | Arctic, 1st Lien | | B | 8.500% | 07/27/2018 | N/A | | 327,038 | |
| | | | | | | | | | | | |
| | | | Gaming – 0.1% | | | | | | | | |
| | 314,667 | | Rock Ohio Caesar LLC | | BB– | 8.500% | 08/11/2017 | N/A | | 323,713 | |
| | | | | | | | | | | | |
| | | | Health Care Services – 0.2% | | | | | | | | |
| | 100,000 | | Ardent Medical Services, Lien 1 | | B+ | 6.750% | 05/19/2018 | N/A | | 100,834 | |
| | 840,000 | | One Call Medical, Inc., Lein 1 | | B+ | 7.000% | 08/22/2019 | N/A | | 844,200 | |
| | | | | | | | | | | 945,034 | |
| | | | | | | | | | | | |
| | | | Insurance – 0.1% | | | | | | | | |
| | 100,000 | | Confie Seguros, Lien 1 | | B– | 6.500% | 11/08/2018 | N/A | | 99,438 | |
| | 200,000 | | Cunningham, Lien 2 | | B3 | 9.250% | 04/18/2020 | N/A | | 203,250 | |
| | | | | | | | | | | 302,688 | |
| | | | | | | | | | | | |
| | | | Media – 0.0%*** | | | | | | | | |
| | 39,973 | | Univision | | B+ | 4.460% | 03/31/2017 | N/A | | 39,129 | |
| | | | | | | | | | | | |
| | | | Oil Field Services – 0.9% | | | | | | | | |
| | 250,000 | | El Paso/EP Energy | | BB– | 5.000% | 04/24/2018 | N/A | | 253,021 | |
| | 229,425 | | Equipower Resources 1st Lien Term B Advance | | BB | 6.500% | 12/21/2018 | N/A | | 231,218 | |
| | 200,000 | | Shelf Drilling, 1st Lien(j) | | B+ | 7.250% | 05/31/2018 | N/A | | 200,000 | |
| | 2,947,500 | | Southern Pacific Resources, 2nd Lien | | CCC | 10.750% | 12/22/2016 | N/A | | 2,988,765 | |
| | | | | | | | | | | 3,673,004 | |
| | | | | | | | | | | | |
| | | | Other Finance – 0.0%*** | | | | | | | | |
| | 100,000 | | Flexera Software, Inc. | | B | 11.000% | 09/30/2018 | N/A | | 101,437 | |
| | 70,000 | | Homeward Residential Holdings, Inc. | | B+ | 8.250% | 08/07/2017 | N/A | | 70,175 | |
| | | | | | | | | | | 171,612 | |
| | | | | | �� | | | | | | |
| | | | Other Industrials – 0.2% | | | | | | | | |
| | 349,114 | | Laureate Education, Inc. | | B | 5.250% | 8/15/18 | N/A | | 347,260 | |
| | 477,094 | | Sirva Worldwide, Inc., 1st Lien(j) | | B | 10.750% | 03/31/2016 | N/A | | 485,443 | |
| | | | | | | | | | | 832,703 | |
| | | | | | | | | | | | |
| | | | Real Estate Investment Trusts – 0.0% | | | | | | | | |
| | 130,000 | | iStar Financial, Inc. Lien 1 | | BB– | 7.000% | 3/15/17 | N/A | | 134,745 | |
| See notes to financial statements. |
GBAB | GUGGENHEIM BUILD AMERICA BONDS MANAGED DURATION TRUST SEMIANNUAL REPORT | 21 |
| PORTFOLIO OF INVESTMENTS (Unaudited) continued | November 30, 2012 |
| | Principal | | | | | | | Optional Call | | | |
| | Amount | | Description | | Rating * | Coupon | Maturity | Provisions** | | Value | |
| | | | | | | | | | | | |
| | | | Retail – 0.5% | | | | | | | | |
| $ | 89,774 | | Container Store, Inc., Lien 1 | | B– | 6.250% | 4/3/19 | N/A | $ | 90,168 | |
| | 997,500 | | HD Supply Lien 1 Hybrid | | B+ | 7.250% | 10/05/2017 | N/A | | 1,026,961 | |
| | 750,000 | | Party City Holdings, Inc. | | B | 5.750% | 7/23/19 | N/A | | 758,359 | |
| | | | | | | | | | | 1,875,488 | |
| | | | | | | | | | | | |
| | | | Technology – 1.3% | | | | | | | | |
| | 920,000 | | Ceridian Corp. | | B– | 5.960% | 05/09/2017 | N/A | | 920,768 | |
| | 400,000 | | IPC Information Systems, Inc. | | B– | 7.750% | 07/31/2017 | N/A | | 395,000 | |
| | 997,500 | | Magic Newco LLC, 1st Lien | | B | 7.250% | 11/30/2018 | N/A | | 1,011,215 | |
| | 100,000 | | Magic Newco LLC, 2nd Lien | | CCC+ | 12.000% | 06/06/2019 | N/A | | 102,750 | |
| | 1,650,000 | | Mmodal, Inc. | | B– | 6.750% | 08/15/2019 | N/A | | 1,637,625 | |
| | 1,140,000 | | Paradigm TLB, 1st Lien | | B+ | 6.500% | 7/24/19 | N/A | | 1,142,565 | |
| | 19,950 | | Sophos, Lien 1 | | B+ | 6.500% | 05/10/2019 | N/A | | 20,013 | |
| | | | | | | | | | | 5,229,936 | |
| | | | | | | | | | | | |
| | | | Transportation – 0.2% | | | | | | | | |
| | 600,000 | | Evergreen Tank Solutions, Inc. | | B– | 9.500% | 09/26/2018 | N/A | | 600,000 | |
| | 51,210 | | Global Aviation Holdings, Inc.(j) | | NR | 9.490% | 12/31/2012 | N/A | | 51,082 | |
| | 200,000 | | Sabre Corp. | | B | 7.250% | 12/29/2017 | N/A | | 202,625 | |
| | | | | | | | | | | 853,707 | |
| | | | | | | | | | | | |
| | | | Wireless – 0.4% | | | | | | | | |
| | 987,500 | | Converge One, Lien 1(j) | | B+ | 8.500% | 06/08/2017 | N/A | | 975,156 | |
| | 199,500 | | Wideopenwest Finance LLC, Lien 1 | | B | 6.250% | 07/12/2018 | N/A | | 202,146 | |
| | 498,750 | | Zayo Group LLC | | B | 5.250% | 07/02/2019 | N/A | | 503,184 | |
| | | | | | | | | | | 1,680,486 | |
| | | | | | | | | | | | |
| | | | Wirelines – 0.1% | | | | | | | | |
| | 498,679 | | Avaya, Inc. | | B1 | 4.810% | 10/26/2017 | N/A | | 438,214 | |
| | | | | | | | | | | | |
| | | | Total Term Loans – 4.8% | | | | | | | | |
| | | | (Cost $19,342,685) | | | | | | | 19,789,256 | |
| | Number | | | | | | | | | | |
| | of Shares | | Description | | | | | | | Value | |
| | | | | | | | | | | | |
| | | | Preferred Stocks – 1.9% | | | | | | | | |
| | | | Diversified Financial Services – 0.6% | | | | | | | | |
| | 180 | | Ares VII CLO Ltd., Series 2004-8A (Cayman Islands)(b) (k) (l) | | | | | | | 102,583 | |
| | 1,900 | | Falcons Funding Trust I, 8.875%(b) (e) (k) | | | | | | | 1,977,306 | |
| | 475 | | GSC Partners CDO Fund Ltd./GSC Partners CDO Fund Corp. (Cayman Islands)(b) (l) | | | | | | | 202,923 | |
| | 200,000 | | Whitehorse II Ltd. Corp., Series 2005-2A(b) (k) | | | | | | | 100,000 | |
| | | | | | | | | | | 2,382,812 | |
| | | | | | | | | | | | |
| | | | Transportation – 1.3% | | | | | | | | |
| | 200,000 | | Seaspan Corp., Series C (Marshall Islands)(k) | | NR | 9.500% | – | | | 5,510,000 | |
| | | | | | | | | | | | |
| | | | Total Preferred Stocks – 1.9% | | | | | | | | |
| | | | (Cost $7,305,900) | | | | | | | 7,892,812 | |
| | | | | | | | | | | | |
| | | | Warrants – 0.0%*** | | | | | | | | |
| | 1,550 | | Alion Science and Technology Corp.(g) (i) (j) | | | | 03/15/2017 | | | – | |
| | | | (Cost $15) | | | | | | | | |
| | | | | | | | | | | | |
| | | | Total Long-Term Investments – 131.5% | | | | | | | | |
| | | | (Cost $467,677,787) | | | | | | | 546,261,955 | |
| See notes to financial statements. |
22 | GBAB | GUGGENHEIM BUILD AMERICA BONDS MANAGED DURATION TRUST SEMIANNUAL REPORT |
| PORTFOLIO OF INVESTMENTS (Unaudited) continued | November 30, 2012 |
| | Number | | | | | |
| | of Shares | | Description | | Value | |
| | | | | | | |
| | | | Short-Term Investments – 0.4% | | | |
| | | | Money Market – 0.4% | | | |
| | 1,953,512 | | Dreyfus Treasury Prime Cash Management Institutional Shares | $ | 1,953,512 | |
| | | | (Cost $1,953,512) | | | |
| | | | | | | |
| | | | Total Investments – 131.9% | | | |
| | | | (Cost $469,631,299) | | 548,215,467 | |
| | | | Assets in excess of Liabilities – 1.7% | | 6,707,251 | |
| | | | Borrowings – (13.9%) | | (57,713,936 | ) |
| | | | Reverse Repurchase Agreements – (19.7%) | | (81,725,561 | ) |
| | | | | | | |
| | | | Net Assets – 100.0% | $ | 415,483,221 | |
| AGM – Insured by Assured Guaranty Municipal Corporation |
| |
| Assured GTY – Insured by Assured Guaranty Corporation |
| |
| CDO – Collateralized Debt Obligation |
| |
| CLO – Collateralized Loan Obligation |
| |
| LLC – Limited Liability Company |
| |
| LP – Limited Partnership |
| |
| N/A- Not Applicable |
| |
| PLC – Public Limited Company |
| |
| Pty – Proprietary |
| |
| SAB de CV – Publicly Traded Company |
| |
| * | Ratings shown are per Standard & Poor’s Rating Group, Moody’s Investor Services, Inc. or Fitch Ratings. Securities classified as NR are not rated. (For securities not rated by Standard & Poor’s Rating Group, the rating by Moody’s Investor Services, Inc. is provided. Likewise, for securities not rated by Standard & Poor’s Rating Group and Moody’s Investor Services, Inc., the rating by Fitch Ratings is provided.) All ratings are unaudited. The ratings apply to the credit worthiness of the issuers of the underlying securities and not to the Trust or its shares. |
| | |
| ** | Date and price of the earliest optional call or put provision. There may be other call provisions at varying prices at later dates. |
| | |
| *** | Less than 0.1%. |
| | |
| (a) | Taxable municipal bond issued as part of the Build America Bond program. |
| | |
| (b) | Securities are exempt from registration under Rule 144A of the Securities Act of 1933. These securities may be resold in transactions exempt from registration, normally to qualified institutional buyers. At November 30, 2012, these securities amounted to $43,077,611, which represents 10.4% of net assets. |
| | |
| (c) | The issuer of this security will accrue interest on the secured note at a rate of 12% per annum and will make interest payments as follows: (1) 10% in cash and (2) 2% in-kind shares of the secured note. |
| | |
| (d) | The issuer of this security may elect to pay interest entirely in cash, entirely by issuing payment-in-kind shares, or pay 50% of the interest in cash and 50% of the interest by issuing payment- in-kind shares. |
| | |
| (e) | Floating or variable rate coupon. The rate shown is as of November 30, 2012. |
| | |
| (f) | Term loans held by the Trust have a variable interest rate feature which is periodically adjusted based on an underlying interest rate benchmark. In addition, term loans may include mandatory and/or optional prepayment terms. As a result, the actual maturity dates of the loan may be different than the amounts disclosed in the portfolios of investments. Term loans may be considered restricted in that the Trust may be contractually obligated to secure approval from the Agent Bank and/or Borrower prior to the sale or disposition of loan. |
| | |
| (g) | Non-income producing security. |
| | |
| (h) | Non-income producing as security is in default. |
| | |
| (i) | Security is valued in accordance with Fair Valuation procedures established in good faith by management and approved by the Board of Trustees. The total market value of such securities is $0, representing 0.0% of net assets. |
| | |
| (j) | Illiquid security. |
| | |
| (k) | All or portion of these securities have been physically segregated in connection with borrowings, reverse repurchase agreements, and unfunded loan commitments. As of November 30, 2012, the total amount segregated was $278,091,823. |
| | |
| (l) | Security has no stated coupon. However, it is expected to receive residual cash flow payments on deal defined payment dates. |
| See notes to financial statements. |
GBAB | GUGGENHEIM BUILD AMERICA BONDS MANAGED DURATION TRUST SEMIANNUAL REPORT | 23 |
| STATEMENT OF ASSETS AND LIABILITIES (Unaudited) | November 30, 2012 |
| Assets | | | | |
| Investments in securities, at value (cost $469,631,299) | | $ | 548,215,467 | |
| Interest receivable | | | 9,550,816 | |
| Receivable for securities sold | | | 153,438 | |
| Unrealized appreciation on unfunded commitments | | | 91 | |
| Other assets | | | 9,722 | |
| Total assets | | | 557,929,534 | |
| Liabilities | | | | |
| Reverse repurchase agreements | | | 81,725,561 | |
| Borrowings | | | 57,713,936 | |
| Payable for securities purchased | | | 1,499,445 | |
| Due to custodian | | | 960,638 | |
| Advisory fee payable | | | 271,832 | |
| Interest due on borrowings | | | 93,900 | |
| Administrative fee payable | | | 10,059 | |
| Accrued expenses and other liabilities | | | 170,942 | |
| Total liabilities | | | 142,446,313 | |
| Net Assets | | $ | 415,483,221 | |
| Composition of Net Assets | | | | |
| Common stock, $.01 par value per share; unlimited number of shares authorized, 17,413,674 shares issued and outstanding | | $ | 174,137 | |
| Additional paid-in capital | | | 331,599,140 | |
| Accumulated undistributed net investment income | | | 3,855,899 | |
| Accumulated net realized gain on investments | | | 1,269,786 | |
| Accumulated net unrealized appreciation on investments and unfunded commitments | | | 78,584,259 | |
| Net Assets | | $ | 415,483,221 | |
Net Asset Value (based on 17,413,674 common shares outstanding) | | $ | 23.86 | |
| See notes to financial statements. |
24 | GBAB | GUGGENHEIM BUILD AMERICA BONDS MANAGED DURATION TRUST SEMIANNUAL REPORT |
STATEMENT OF OPERATIONS For the six months ended November 30, 2012 (Unaudited) | November 30, 2012 |
| Investment Income | | | | | | | |
| Interest | | $ | 16,928,538 | | | | |
| Dividends | | | 321,812 | | | | |
| Total income | | | | | $ | 17,250,350 | |
| Expenses | | | | | | | |
| Advisory fee | | | 1,637,200 | | | | |
| Interest expense | | | 745,592 | | | | |
| Professional fees | | | 100,010 | | | | |
| Trust accounting | | | 64,182 | | | | |
| Administrative fee | | | 60,985 | | | | |
| Trustees’ fees and expenses | | | 42,871 | | | | |
| Custodian fee | | | 49,204 | | | | |
| Printing expenses | | | 33,842 | | | | |
| NYSE listing fee | | | 11,895 | | | | |
| Insurance expense | | | 14,700 | | | | |
| Transfer agent fee | | | 9,245 | | | | |
| Miscellaneous | | | 2,513 | | | | |
| Total expenses | | | | | | 2,772,239 | |
| Net investment income | | | | | | 14,478,111 | |
| Realized and Unrealized Gain (Loss) on Investments and Unfunded Commitments | | | | | | | |
| Net realized gain on: | | | | | | | |
| Investments | | | | | | 506,952 | |
| Net change in unrealized appreciation (depreciation) on: | | | | | | | |
| Investments | | | | | | 5,081,895 | |
| Unfunded commitments | | | | | | (123 | ) |
| Net realized and unrealized gain (loss) on investments and unfunded commitments | | | | | | 5,588,724 | |
| Net Increase in Net Assets Resulting from Operations | | | | | $ | 20,066,835 | |
| See notes to financial statements. |
GBAB | GUGGENHEIM BUILD AMERICA BONDS MANAGED DURATION TRUST SEMIANNUAL REPORT | 25 |
| STATEMENT OF CHANGES IN NET ASSETS | November 30, 2012 |
| | | | | | | | |
| | | | For the Six Months Ended November 30, 2012 (unaudited) | | | For the Year Ended May 31, 2012 | |
| Increase in Net Assets from Operations | | | | | | | |
| Net investment income | | $ | 14,478,111 | | $ | 27,679,900 | |
| Net realized gain on investments | | | 506,952 | | | 236,329 | |
| Net change in unrealized appreciation on investments and unfunded commitments | | | 5,081,772 | | | 47,505,359 | |
| Net increase in net assets resulting from operations | | | 20,066,835 | | | 75,421,588 | |
| Distributions to Common Shareholders | | | | | | | |
| From net investment income | | | (13,643,711 | ) | | (25,905,292 | ) |
| Capital Share Transactions | | | | | | | |
| Net proceeds from the issuance of common shares | | | 100,013 | | | 0 | |
| Common share offering costs charged to paid-in capital | | | 0 | | | 0 | |
| Net increase from capital share transactions | | | 100,013 | | | 0 | |
| Total increase in net assets | | | 6,523,137 | | | 49,516,296 | |
| Net Assets | | | | | | | |
| Beginning of period | | | 408,960,084 | | | 359,443,788 | |
| End of period (including undistributed net investment income of $3,855,899 and $3,021,499, respectively) | | $ | 415,483,221 | | $ | 408,960,084 | |
| See notes to financial statements. |
26 | GBAB | GUGGENHEIM BUILD AMERICA BONDS MANAGED DURATION TRUST SEMIANNUAL REPORT |
STATEMENT OF CASH FLOWS For the six months ended November 30, 2012 (Unaudited) | November 30, 2012 |
| Cash Flows from Operating Activities: | | | | |
| Net increase in net assets resulting from operations | | $ | 20,066,835 | |
| Adjustments to Reconcile Net Increase in Net Assets Resulting from Operations to | | | | |
| Net Cash Provided by Operating and Investing Activities: | | | | |
| Net unrealized appreciation on investments | | | (5,081,895 | ) |
| Net unrealized depreciation on unfunded commitments | | | 123 | |
| Net realized gain on investments | | | (506,952 | ) |
| Paydowns received | | | (340,756 | ) |
| Net accretion of bond discount and amortization of bond premium | | | (176,040 | ) |
| Purchase of long-term investments | | | (24,761,461 | ) |
| Proceeds from sale of long-term investments | | | 12,295,604 | |
| Net purchase of short-term investments | | | (1,086,764 | ) |
| Corporate actions and other payments | | | (8,593 | ) |
| Increase in interest receivable | | | (205,023 | ) |
| Increase in receivable for securities sold | | | (153,438 | ) |
| Decrease in other assets | | | 14,928 | |
| Decrease in payable for securities purchased | | | (1,597,305 | ) |
| Increase in due to custodian | | | 960,638 | |
| Increase in advisory fee payable | | | 3,118 | |
| Increase in interest due on borrowings | | | 10,909 | |
| Decrease in administration fee payable | | | (23 | ) |
| Decrease in accrued expenses and other liabilities | | | (26,870 | ) |
| Net Cash Used by Operating and Investing Activities | | | (592,965 | ) |
| Cash Flows From Financing Activities: | | | | |
| Distributions to common shareholders | | | (13,643,711 | ) |
| Dividend reinvestments | | | 100,013 | |
| Decrease in reverse repurchase agreements | | | (6,372,854 | ) |
| Proceeds from borrowings | | | 27,775,936 | |
| Payments made on borrowings | | | (7,506,000 | ) |
| Net Cash Provided by Financing Activities | | | 353,384 | |
| Net decrease in cash | | | (239,581 | ) |
| Cash at Beginning of Period | | | 239,581 | |
| Cash at End of Period | | $ | — | |
| Supplemental Disclosure of Cash Flow Information: Cash paid during the period for interest | | $ | 734,683 | |
| See notes to financial statements. |
GBAB | GUGGENHEIM BUILD AMERICA BONDS MANAGED DURATION TRUST SEMIANNUAL REPORT | 27 |
| FINANCIAL HIGHLIGHTS | November 30, 2012 |
Per share operating performance for a common share outstanding throughout the period | | | For the Six Months Ended November 30, 2012 (Unaudited) | | | For the Year Ended May 31, 2012 | | | For the Period October 28, 2010* through May 31, 2011 | |
| Net asset value, beginning of period | | $ | 23.49 | | $ | 20.65 | | $ | 19.10 | (a) |
| Income from investment operations | | | | | | | | | | |
Net investment income (b) | | | 0.83 | | | 1.59 | | | 0.68 | |
| Net realized and unrealized gain on investments and unfunded commitments | | | 0.32 | | | 2.74 | | | 1.50 | |
| Total from investment operations | | | 1.15 | | | 4.33 | | | 2.18 | |
| Common shares’ offering expenses charged to paid-in capital | | | — | | | — | | | (0.04 | ) |
| Distributions to Common Shareholders | | | | | | | | | | |
| From net investment income | | | (0.78 | ) | | (1.49 | ) | | (0.59 | ) |
| Net asset value, end of period | | $ | 23.86 | | $ | 23.49 | | $ | 20.65 | |
| Market value, end of period | | $ | 23.25 | | $ | 22.46 | | $ | 19.54 | |
Total investment return (c) | | | | | | | | | | |
| Net asset value | | | 4.98 | % | | 21.64 | % | | 11.34 | % |
| Market value | | | 7.01 | % | | 23.35 | % | | 0.80 | % |
| | | | | | | | | | | |
| Ratios and supplemental data | | | | | | | | | | |
| Net assets, end of period (thousands) | | $ | 415,483 | | $ | 408,960 | | $ | 359,444 | |
| Ratios to Average Net Assets applicable to Common Shares: | | | | | | | | | | |
| Total expenses, excluding interest expense | | | 0.99 | %(d) | | 1.04 | % | | 0.91 | %(d) |
| Total expenses, including interest expense | | | 1.35 | %(d) | | 1.36 | % | | 1.05 | %(d) |
| Net investment income, including interest expense | | | 7.04 | %(d) | | 7.33 | % | | 6.00 | %(d) |
Portfolio turnover rate (e) | | | 2 | % | | 7 | % | | 3 | % |
| Senior Indebtedness: | | | | | | | | | | |
| Total Borrowings outstanding (in thousands) | | $ | 139,439 | | $ | 125,542 | | $ | 104,906 | |
Asset Coverage per $1,000 of indebtedness(f) | | $ | 3,980 | | $ | 4,258 | | $ | 4,426 | |
| * | Commencement of investment operations. |
| | |
| (a) | Before deduction of offering expenses charged to capital. |
| | |
| (b) | Based on average shares outstanding during the period. |
| | |
| (c) | Total investment return is calculated assuming a purchase of a common share at the beginning of the period and a sale on the last day of the period reported either at net asset value (“NAV”) or market price per share. Dividends and distributions are assumed to be reinvested at NAV for NAV returns or the prices obtained under the Trust’s Dividend Reinvestment Plan for market value returns. Total investment return does not reflect brokerage commissions. A return calculated for a period of less than one year is not annualized. |
| | |
| (d) | Annualized. |
| | |
| (e) | Portfolio turnover is not annualized for periods of less than one year. |
| | |
| (f) | Calculated by subtracting the Trust’s total liabilities (not including borrowings) from the Trust’s total assets and dividing by the total borrowings. |
| See notes to financial statements. |
28 | GBAB | GUGGENHEIM BUILD AMERICA BONDS MANAGED DURATION TRUST SEMIANNUAL REPORT |
| NOTES TO FINANCIAL STATEMENTS (Unaudited) | November 30, 2012 |
Note 1 – Organization:
Guggenheim Build America Bonds Managed Duration Trust (the “Trust”) was organized as a Delaware statutory trust on June 30, 2010. The Trust is registered as a diversified closed-end management investment company under the Investment Company Act of 1940, as amended.
The Trust’s primary investment objective is to provide current income with a secondary objective of long-term capital appreciation. There can be no assurance that the Trust will achieve its investment objectives. The Trust’s investment objectives are considered fundamental and may not be changed without shareholder approval.
Note 2 – Accounting Policies:
The preparation of the financial statements in accordance with U.S. generally accepted accounting principles (“GAAP”) requires management to make estimates and assumptions that affect the reported amounts and disclosures in the financial statements. Actual results could differ from these estimates.
The following is a summary of significant accounting policies consistently followed by the Trust.
(a) Valuation of Investments
The Trust values equity securities at the last reported sale price on the principal exchange or in the principal over-the-counter (“OTC”) market in which such securities are traded, as of the close of regular trading on the New York Stock Exchange (“NYSE”) on the day the securities are being valued or, if there are no sales, at the mean between the last available bid and asked prices on that day. Securities traded on NASDAQ are valued at the NASDAQ Official Closing Price. The Trust values debt securities (including municipal securities, asset-backed securities, collateralized mortgage obligations and term loans) at the last available bid price for such securities or, if such prices are not available, at prices for securities of comparable maturity, quality, and type. Short-term securities with remaining maturities of 60 days or less are valued at amortized cost, which approximates fair value.
For those securities where quotations or prices are not available, the valuations are determined in accordance with procedures established in good faith by management and approved by the Board of Trustees. Valuations in accordance with these procedures are intended to reflect each security’s (or asset’s) “fair value”. Fair value is defined as the price that the Trust would receive to sell an investment or pay to transfer a liability in an orderly transaction with an independent buyer in the principal market, or in the absence of a principal market, the most advantageous market for the investment or liability. Each such determination should be based on a consideration of all relevant factors, which are likely to vary from one pricing context to another. Examples of such factors may include, but are not limited to: (i) the type of security, (ii) the initial cost of the security, (iii) the existence of any contractual restrictions on the security’s disposition, (iv) the price and extent of public trading in similar securities of the issuer or of comparable companies, (v) quotations or evaluated prices from broker-dealers and/or pricing services, (vi) information obtained from the issuer, analysts, and/or the appropriate stock exchange (for exchange traded securities), (vii) an analysis of the company’s financial statements, and (viii) an evaluation of the forces that influence the issuer and the market(s) in which the security is purchased and sold (e.g. the existence of pending merger activity, public offerings or tender offers that might affect the value of the security).
There are three different categories for valuations. Level 1 valuations are those based upon quoted prices in active markets. Level 2 valuations are those based upon quoted prices in inactive markets or based upon significant observable inputs (e.g. yield curves; benchmark interest rates; indices). Level 3 valuations are those based upon unobservable inputs (e.g. discounted cash flow analysis; non-market based methods used to determine fair valuation).
The Trust values Level 1 securities using readily available market quotations in active markets. Money Market Funds are valued at Net Asset Value. The Trust values Level 2 fixed income securities using independent pricing providers who employ matrix pricing models utilizing market prices, broker quotes and prices of securities with comparable maturities and qualities. The Trust values Level 2 equity securities using independent pricing providers who employ models using various observable market inputs. The fair value estimate for the Level 3 security in the Trust is determined in accordance with the Trust’s valuation procedures described above.
The following table represents the Trust’s investments carried on the Statement of Assets and Liabilities by caption and by level within the fair value hierarchy as of November 30, 2012.
| Description | | | Level 1 | | | Level 2 | | | Level 3 | | | Total | |
| (value in $000s) | | | | | | | | | | | | | |
| Assets: | | | | | | | | | | | | | |
| Municipal Bonds | | $ | — | | $ | 454,867 | | $ | — | | $ | 454,867 | |
| Corporate Bonds | | | — | | | 37,918 | | | — | | | 37,918 | |
| Asset Backed | | | | | | | | | | | | | |
| Securities | | | — | | | 23,701 | | | — | | | 23,701 | |
| Collateralized | | | | | | | | | | | | | |
| Mortgage | | | | | | | | | | | | | |
| Obligations | | | — | | | 2,094 | | | — | | | 2,094 | |
| Preferred Stocks | | | 7,893 | | | — | | | — | | | 7,893 | |
| Term Loans | | | — | | | 19,789 | | | — | | | 19,789 | |
| Warrants | | | — | | | — | | | | * | | — | |
| Money Market | | | 1,953 | | | — | | | — | | | 1,953 | |
| Unfunded | | | | | | | | | | | | | |
| Commitments | | | — | | | | * | | — | | | — | |
| Total | | $ | 9,846 | | $ | 538,369 | | $ | | * | $ | 548,215 | |
* Market value is less than minimum amount disclosed.
There was a transfer from Level 3 to Level 2 for the asset backed security, Insurance Note Capital Term, in the amount of $87,732, due to the availability of market price information at the period end.
GBAB | GUGGENHEIM BUILD AMERICA BONDS MANAGED DURATION TRUST SEMIANNUAL REPORT | 29 |
| NOTES TO FINANCIAL STATEMENTS (Unaudited) continued | November 30, 2012 |
With regard to the Level 3 securities:
The Trust received the Alion Science and Technology Warrants, which have a penny per share exercise price, as part of the purchase of Alion Science and Technology 12% corporate bonds which mature on November 1, 2014. The company has two bonds outstanding with the longer dated of the two bonds trading at a distressed level. The warrant and the underlying stock of the company are both unlisted securities. As a result of these factors, the Fund is assigning a price of $0.00 to the warrants. If the warrants begin trading on an exchange, the price of the warrants could increase.
The following table presents the activity for the Trust’s investments measured at fair value using significant unobservable inputs (Level 3 valuations) for the six months ended November 30, 2012.
| Level 3 holdings | | | | |
| (value in $000s) | | | | |
| Beginning Balance at May 31, 2012: | | | | |
| Asset Backed Securities | | $ | 87 | |
| Warrants | | | – | * |
| Transfers Out | | | | |
| Asset Backed Securities | | | (87 | ) |
| Ending Balance at 11/30/12: | | | | |
| Warrants | | | – | * |
| Total Level 3 holdings | | $ | – | * |
* Market value is less than minimum amount disclosed.
(b) Investment Transactions and Investment Income
Investment transactions are accounted for on the trade date. Realized gains and losses on investments are determined on the identified cost basis. Paydown gains and losses on mortgage and asset-backed securities are treated as an adjustment to interest income. For the six months ended November 30, 2012, the Trust recognized an increase of interest income and a decrease of net realized gain of $340,756. This reclassification is reflected on the Statement of Operations and had no effect on the net asset value of the Trust. Dividend income is recorded net of applicable withholding taxes on the ex-dividend date and interest income is recorded on an accrual basis. Discounts or premiums on debt securities purchased are accreted or amortized to interest income over the lives of the respective securities using the effective interest method.
(c) Swaps
A swap is an agreement to exchange the return generated by one instrument for the return generated by another instrument. The Trust may enter into swap agreements to manage its exposure to interest rates or to manage the duration of its portfolio. The swaps are valued daily at current market value and any unrealized gain or loss is included in the Statement of Operations. The Trust accrues for the interim payments on swap contracts on a daily basis, with the net amount recorded within unrealized appreciation/depreciation of swap contracts on the Statement of Assets and Liabilities. Once the interim payments are settled in cash, the net amount is recorded as realized gain/loss on swaps, in addition to realized gain/loss recorded upon the termination of swap contracts on the Statement of Operations. During the period that the swap agreement is open, the Trust may be subject to risk from the potential inability of the counterparty to meet the terms of the agreement. The swaps involve elements of both market and credit risk in excess of the amounts reflected on the Statement of Assets and Liabilities. During the six months ended November 30, 2012, there were no swaps outstanding.
(d) When-Issued and Delayed Delivery Transactions
The Trust may engage in when-issued or delayed delivery transactions. The Trust records when-issued securities on the trade date and maintains security positions such that sufficient liquid assets will be available to make payment for the securities purchased. Securities purchased on a when-issued or delayed delivery basis are marked to market daily and begin earning interest on the settlement date. Losses may occur on these transactions due to changes in a market conditions or the failure of counterparties to perform under the contract.
(e) Distributions
The Trust declares and pays monthly distributions to common shareholders. Any net realized long-term gains are distributed annually. Distributions to shareholders are recorded on the ex-dividend date. The amount and timing of distributions are determined in accordance with federal income tax regulations, which may differ from GAAP.
(f) Currency Translation
Assets and liabilities denominated in foreign currencies are translated into U.S. dollars at the mean of the bid and asked price of the respective exchange rates on the last day of the period. Purchases and sales of investments denominated in foreign currencies are translated at the mean of the bid and asked price of respective exchange rates on the date of the transaction.
Foreign exchange gain or loss resulting from holding of a foreign currency, expiration of a currency exchange contract, difference in the exchange rates between the trade date and settlement date of an investment purchased or sold, and the difference between dividends actually received compared to the amount shown in a Trust’s accounting records on the date of receipt are included as net realized gains or losses on foreign currency forwards and currency transactions in the Trust’s Statement of Operations.
Foreign exchange gain or loss on assets and liabilities, other than investments, is included in unrealized appreciation (depreciation) on foreign currency transactions. There were no currency gains or losses for the six months ended November 30, 2012.
(g) Recent Accounting Pronouncements
In December 2011, the Financial Accounting Standards Board issued Accounting Standards Update (ASU) No. 2011-11, “Disclosures about Offsetting Assets and Liabilities”. The update enhances disclosures about offsetting of financial assets and liabilities to enable investors to understand the effect of these arrangements on a trust’s financial position. The ASU is effective for interim and annual reporting periods beginning on or after January 1, 2013. The Trust believes the adoption of this ASU will not have a material impact on the financial statements.
30 | GBAB | GUGGENHEIM BUILD AMERICA BONDS MANAGED DURATION TRUST SEMIANNUAL REPORT |
| NOTES TO FINANCIAL STATEMENTS (Unaudited) continued | November 30, 2012 |
Note 3 – Investment Advisory Agreement, Sub-Advisory Agreement and Other Agreements:
Pursuant to an Investment Advisory Agreement between the Trust and Guggenheim Funds Investment Advisors, LLC (“the Adviser”), the Adviser furnishes offices, necessary facilities and equipment, provides administrative services, oversees the activities of Guggenheim Partners Investment Management, LLC (“GPIM”), provides personnel including certain officers required for the Trust’s administrative management and compensates the officers and trustees of the Trust who are affiliates of the Adviser. As compensation for these services, the Trust pays the Adviser a fee, payable monthly, in an amount equal to 0.60% of the Trust’s average daily managed assets (net assets applicable to common shareholders plus any assets attributable to financial leverage).
Pursuant to a Sub-Advisory Agreement among the Trust, the Adviser and GPIM, GPIM under the supervision of the Trust’s Board of Trustees and the Adviser, provides a continuous investment program for the Trust’s portfolio; provides investment research; makes and executes recommendations for the purchase and sale of securities; and provides certain facilities and personnel, including certain officers required for its administrative management and pays the compensation of all officers and trustees of the Trust who are GPIM’s affiliates. As compensation for its services, the Adviser pays GPIM a fee, payable monthly, in an annual amount equal to 0.30% of the Trust’s average daily managed assets.
Certain officers of the Trust may also be officers, directors and/or employees of the Adviser or GPIM. The Trust does not compensate its officers who are officers, directors and/or employees of the aforementioned firms.
Under a separate Fund Administration Agreement, the Adviser provides Fund Administration services to the Trust. As compensation for services performed under the Administration Agreement, the Adviser will receive an administration fee payable monthly at the annual rate set forth below as a percentage of the average daily managed assets of the Trust:
| | |
| Managed Assets | Rate |
| First $200,000,000 | 0.0275% |
| Next $300,000,000 | 0.0200% |
| Next $500,000,000 | 0.0150% |
| Over $1,000,000,000 | 0.0100% |
For the six months ended November 30, 2012, the Trust recognized expenses of approximately $60,985 for these services.
For purposes of calculating the fees payable under the foregoing agreements, “average daily managed assets” means the average daily value of the Trust’s total assets minus the sum of its accrued liabilities. “Total assets” means all of the Trust’s assets and is not limited to its investment securities. “Accrued liabilities” means all of the Trust’s liabilities other than borrowings for investment purposes.
The Bank of New York Mellon (“BNY”) acts as the Trust’s custodian and accounting agent. As custodian, BNY is responsible for the custody of the Trust’s assets. As accounting agent, BNY is responsible for maintaining the books and records of the Trust’s securities and cash.
Note 4 – Federal Income Taxes:
The Trust intends to comply with the requirements of Subchapter M of the Internal Revenue Code of 1986, as amended, applicable to regulated investment companies. Accordingly, no provision for U.S. federal income taxes is required. In addition, by distributing substantially all of its ordinary income and long-term capital gains, if any, during each calendar year, the Trust intends not to be subject to U.S. federal excise tax.
Information on the components of net assets on a tax basis as of November 30, 2012, is as follows:
| | | | | | | | | |
| | | | | | | | | Net Tax |
| | Cost of | | | | | | | Unrealized |
| | Investments | | Gross Tax | | Gross Tax | | | Appreciation |
| | for Tax | | Unrealized | | Unrealized | | | on |
| | Purposes | | Appreciation | | Depreciation | | | Investments |
| $ | 469,631,299 | $ | 79,930,979 | $ | (1,346,811 | ) | $ | 78,584,168 |
As of May 31, 2012 (the most recent fiscal year end for federal income tax purposes), the components of accumulated earnings/ (losses) (excluding paid-in capital) on a tax basis were as follows:
| | Undistributed | | Accumulated |
| | Ordinary | | Long-Term |
| | Income/ | | Gains/ |
| | (Accumulated | | (Accumulated |
| | Ordinary Loss) | | Capital Loss) |
| $ | 3,021,499 | $ | 762,834 |
For the year ended May 31, 2012, the tax character of distributions paid to common shareholders as reflected in the statement of changes in net assets was as follows:
| | | |
| Distributions paid from | | 2012 |
| Ordinary Income | $ | 25,905,292 |
For all open tax years and all major jurisdictions, management of the Trust has concluded that there are no significant uncertain tax positions that would require recognition in the financial statements. Uncertain tax positions are tax positions taken or expected to be taken in the course of preparing the Trust’s tax returns that would not meet a more-likely-than not threshold of being sustained by the applicable tax authority and would be recorded as a tax expense in the current year. Open tax years are those that are open for examination by taxing authorities (i.e. generally the last four tax year ends and the interim tax period since then). Furthermore, management of the Trust is also not aware of any tax positions for which it is reasonably possible that the total amounts of unrecognized tax benefits will significantly change in the next twelve months.
Note 5 – Investments in Securities:
For the six months ended November 30, 2012, the cost of purchases and proceeds from sales of investments, excluding short-term securities, were $24,739,019 and $12,295,604, respectively.
Note 6 – Capital:
Common Shares
In connection with its organization process, the Trust sold 5,240 common shares of beneficial interest to Guggenheim Funds Distributors, LLC, an
| |
GBAB | GUGGENHEIM BUILD AMERICA BONDS MANAGED DURATION TRUST SEMIANNUAL REPORT | 31 |
| NOTES TO FINANCIAL STATEMENTS (Unaudited) continued | November 30, 2012 |
affiliate of the Adviser, for consideration of $100,084 at a price of $19.10 per share. The Trust has an unlimited amount of common shares, $0.01 par value, authorized and 17,413,674 issued and outstanding. Of this amount, the Trust issued 17,000,000 common shares in its initial public offering. These shares were issued at $19.10 per share after deducting the sales load but before offering expenses incurred by the Trust.
In connection with the initial public offering of the Trust’s common shares, the underwriters were granted an option to purchase additional common shares. On December 14, 2010, the underwriters purchased, at a price of $19.10 per common share (after deducting the sales load but before offering expenses incurred by the Trust.), 404,230 common shares of the Trust pursuant to the over-allotment option.
Offering costs, equal to $696,169 or $0.04 per share, in connection with the issuance of common shares have been borne by the Trust and were charged to paid-in capital. The Adviser and GPIM paid offering expenses (other than sales load, but including reimbursement of expenses to the underwriters) in excess of $0.04 per common share.
Transactions in common shares were as follows:
| | | | | |
| | | Six months ended | | Year ended |
| | | November 30, 2012 | | May 31, 2012 |
| Beginning Shares | | 17,409,470 | | 17,409,470 |
| Shares issued through | | | | |
| dividend reinvestment | | 4,204 | | – |
| Ending Shares | | 17,413,674 | | 17,409,470 |
Note 7 – Leverage:
Reverse Repurchase Agreements
The Trust may enter into reverse repurchase agreements as part of its financial leverage strategy. Under a reverse repurchase agreement, the Trust temporarily transfers possession of a portfolio instrument to another party, such as a bank or broker-dealer, in return for cash. At the same time, the Trust agrees to repurchase the instrument at an agreed upon time and price, which reflects an interest payment. Such agreements have the economic effect of borrowings. The Trust may enter into such agreements when it is able to invest the cash acquired at a rate higher than the cost of the agreement, which would increase earned income. When the Trust enters into a reverse repurchase agreement, any fluctuations in the market value of either the instruments transferred to another party or the instruments in which the proceeds may be invested would affect the market value of the Trust’s assets. As a result, such transactions may increase fluctuations in the market value of the Trust’s assets. For the six months ended November 30, 2012, the average daily balance for which reverse repurchase agreements were outstanding amounted to $86,969,126. The weighted average interest rate was 0.86%. As of November 30, 2012, there was $81,725,561 in reverse repurchase agreements outstanding.
At November 30, 2012, the Trust had outstanding reverse repurchase agreements with various counterparties. Details of the reverse repurchase agreements by counterparty are as follows:
| | | | | | | |
| | | Range of | | Range of | | |
| | | Interest | | Maturity | | |
| Counterparty | | Rates | | Dates | | Face Value |
| BNP Paribas | | 0.87% | | 04/16/2014 | $ | 50,131,742 |
| Citigroup | | 0.82%-0.85% | | 01/22/2013-02/07/2013 | | 7,503,500 |
| Royal Bank of Canada | | 0.86-0.97% | | 01/22/2013-02/26/2013 | | 24,090,319 |
| | | | | | $ | 81,725,561 |
Borrowings
On December 7, 2011, the Trust entered into a $125,000,000 credit facility agreement. The interest rate on the amount borrowed is based on the 1 month LIBOR plus 90 basis points. An unused fee of 25 basis points is charged on the difference between the $125,000,000 and the amount borrowed. At November 30, 2012, there was $57,713,936 outstanding in connection with the Trust’s credit facility. The average daily amount of borrowings on the credit facility during the six months ended November 30, 2012, was $46,924,086 with a related average interest rate of 1.13%. The maximum amount outstanding during the six months ended November 30, 2012 was $57,713,936. As of November 30 2012, the total value of securities segregated and pledged as collateral in connection with borrowings was $84,193,063.
Note 8 – Loan Commitments
Pursuant to the terms of certain Term Loan agreements, the Trust held unfunded loan commitments of as of November 30, 2012. The Trust is obligated to fund these loan commitments at the borrower’s discretion. The Trust intends to reserve against such contingent obligations by designating cash, liquid securities, and liquid term loans as a reserve. As of November 30, 2012, the total amount segregated in connection with reverse repurchase agreements and unfunded commitments was $90,202,036. The unrealized appreciation on these commitments of $91 as of November 30, 2012, is reported as “Unrealized appreciation on unfunded commitments” on the Statement of Assets and Liabilities. At November 30, 2012, the Trust had the following unfunded loan commitments which could be extended at the option of the borrower:
| | | | | | | Unrealized | |
| | | | Principal | | | Appreciation/ | |
| Borrower | | | Amount | | | (Depreciation) | |
| Cequel Communications | | | | | | | |
| Holdings, LLC | | $ | 600,000 | | $ | — | |
| Clean Harbor | | | 1,000,000 | | | — | |
| Constellation Brands, Inc. | | | 1,500,000 | | | — | |
| Global Aviation | | | 14,265 | | | (36 | ) |
| Rock Ohio | | | 5,333 | | | 127 | |
| Spectrum Brands | | | 750,000 | | | — | |
| | | $ | 3,869,598 | | $ | 91 | |
32 | GBAB | GUGGENHEIM BUILD AMERICA BONDS MANAGED DURATION TRUST SEMIANNUAL REPORT |
| NOTES TO FINANCIAL STATEMENTS (Unaudited) continued | November 30, 2012 |
Note 9 – Indemnifications:
In the normal course of business, the Trust enters into contracts that contain a variety of representations, which provide general indemnifications. The Trust’s maximum exposure under these arrangements is unknown, as this would require future claims that may be made against the Trust that have not yet occurred. However, the Trust expects the risk of loss to be remote.
Note 10 – Subsequent Event:
The Trust evaluated subsequent events through the date the financial statements were available for issue and determined there were no additional material events that would require disclosure in the Trust’s financial statements, except as noted below.
On December 3, 2012, the Trust declared a monthly dividend of $0.1348 per common share. The dividend was payable on December 31, 2012, to shareholders of record on December 14, 2012.
On January 2, 2013, the Trust declared a monthly dividend of $0.1348 per common share. The dividend is payable on January 31, 2013, to shareholders of record on January 15, 2013.
| |
GBAB | GUGGENHEIM BUILD AMERICA BONDS MANAGED DURATION TRUST SEMIANNUAL REPORT | 33 |
| SUPPLEMENTAL INFORMATION (Unaudited) | November 30, 2012 |
Federal Income Tax Information
In January 2013, you will be advised on IRS Form 1099 DIV or substitute 1099 DIV as to the federal tax status of the distributions received by you in the calendar year 2012.
Trustees
The Trustees of the Guggenheim Build America Bonds Managed Duration Trust (the “Trust”) and their principal occupations during the past five years:
| | | | | | | | | |
Name, Address*, Year of Birth and Position(s) Held with Registrant | | Term of Office** and Length of Time Served | | Principal Occupations during the Past Five Years and Other Affiliations | | Number of Portfolios in the Fund Complex*** Overseen by Trustee | | Other Directorships Held by Trustee |
| Independent Trustees: | | | | | | | | |
Randall C. Barnes Year of Birth: 1951 Trustee | | Since 2010 | | Private Investor (2001-present). Formerly, Senior Vice President and Treasurer, PepsiCo, Inc. (1993-1997), President, Pizza Hut International (1991-1993) and Senior Vice President, Strategic Planning and New Business Development of PepsiCo, Inc. (1987-1990). | | 55 | | None |
Roman Friedrich III Year of birth: 1946 Trustee | | Since 2010 | | Founder and President of Roman Friedrich & Company, a US and Canadian-based business, which provides investment banking to the mining industry (1998-present). Formerly, Senior Managing Director of MLV & Co., LLC, an investment bank and institutional broker-dealer specializing in capital intensive industries such as energy, metals and mining (2010-2011). | | 50 | | Director of First Americas Gold Corp. (2012-present), Zincore Metals, Inc. (2009 – present). Previously, Director of Blue Sky Uranium Corp. (formerly Windstorm Resources Inc.) (April 2011– July 2012), Director of Axiom Gold and Silver Corp. (2011- 2012), Stratagold Corp. (2003-2009); Gateway Gold Corp. (2004-2008) and GFM Resources Ltd. (2005-2010). |
Robert B. Karn III Year of Birth: 1942 Trustee | | Since 2010 | | Consultant (1998-present). Previously, Managing Partner, Financial and Economic Consulting, St. Louis office of Arthur Andersen, LLP (1965-1998). | | 50 | | Director of Peabody Energy Company (2003-present), GP Natural Resource Partners LLC (2002-present). |
Ronald A. Nyberg Year of birth: 1953 Trustee | | Since 2010 | | Partner of Nyberg & Cassioppi, LLC, a law firm specializing in corporate law, estate planning and business transactions (2000 present). Formerly, Executive Vice President, General Counsel and Corporate Secretary of Van Kampen Investments (1982-1999). | | 57 | | None |
| Ronald E. Toupin, Jr. Year of birth: 1958 Trustee | | Since 2010 | | Portfolio Consultant (2010-present). Formerly, Vice President, Manager and Portfolio Manager of Nuveen Asset Management (1998-1999), Vice President of Nuveen Investment Advisory Corp. (1992-1999), Vice President and Manager of Nuveen Unit Investment Trusts (1991-1999), and Assistant Vice President and Portfolio Manager of Nuveen Unit Investment Trusts (1988-1999), each of John Nuveen & Co., Inc. (1982-1999). | | 54 | | Trustee, Bennett Group of Funds (2011-present). |
| Interested Trustee: | | | | | | | | |
Donald C. Cacciapaglia† Year of Birth: 1951 Trustee, Chief Executive Officer | | Since 2012 | | Senior Managing Director of Guggenheim Investments; President and Chief Executive Officer of Guggenheim Funds Distributors, LLC and President and Chief Executive Officer of Guggenheim Funds Investment Advisors, LLC (2010 – present); Chief Executive officer of funds in the Fund Complex and President and Chief Executive Officer of funds in the Rydex fund complex (2012-present). Formerly, Chief Operating Officer of Guggenheim Partners Asset Management, LLC (2010 – 2011); Chairman and CEO of Channel Capital Group Inc. and Channel Capital Group LLC (2002-2010); Managing Director of PaineWebber (1996-2002). | | 228 | | Trustee, Rydex Dynamic Funds, Rydex ETF Trust, Rydex Series Funds and Rydex Variable Trust (2012- present); Independent Board Member, Equitrust Life Insurance Company, Guggenheim Life and Annuity Company, and Paragon Life Insurance Company of Indiana. (2011-present). |
| | | |
| * | Address for all Trustees: 2455 Corporate West Drive, Lisle, IL 60532 |
| | | |
| ** | After a Trustee’s initial term, each Trustee is expected to serve a three-year term concurrent with the class of Trustees for which he serves: |
| | | |
| | - | Messrs. Barnes and Cacciapaglia, as Class I Trustees, are expected to stand for election or re-election at the Trust’s annual meeting of shareholders for fiscal year ending May 31, 2014. |
| | | |
| | - | Messrs. Friedrich and Nyberg, as Class II Trustees, are expected to stand for re-election at the Trust’s annual meeting of shareholders for fiscal year ending May 31, 2015. |
| | | |
| | - | Messrs. Karn and Toupin, as Class III Trustees, are expected to stand for re-election at the Trust’s annual meeting of shareholders for fiscal year ending May 31, 2013. |
| | | |
| *** | The Guggenheim Investments Fund Complex consists of U.S. registered investment companies advised or serviced by Guggenheim Funds Investment Advisors, LLC and/or its affiliates. |
| | | |
| † | Mr. Donald C. Cacciapaglia is an “interested person” (as defined in section 2(a)(19) of the 1940 Act) (“Interested Trustee”) of the Trust because of his position as the President and CEO of the Investment Adviser. |
Officers |
34 | GBAB | GUGGENHEIM BUILD AMERICA BONDS MANAGED DURATION TRUST SEMIANNUAL REPORT |
| SUPPLEMENTAL INFORMATION (Unaudited) continued | November 30, 2012 |
The executive officers of the Guggenheim Build America Bonds Managed Duration Trust who are not Trustees, and their principal occupations during the past five years:
| | | | | |
| Name, Address*, Year of Birth and | | Term of Office** and | | Principal Occupations During the Past Five Years and |
| Position(s) Held with Registrant | | Length of Time Served | | Other Affiliations |
| Officers: | | | | |
Kevin M. Robinson Year of Birth: 1959 Chief Legal Officer | | Since 2010 | | Senior Managing Director and General Counsel of Guggenheim Funds Investment Advisors, LLC, Guggenheim Funds Distributors, LLC and Guggenheim Funds Services LLC (2007-present). Chief Legal Officer and/or Chief Executive Officer of certain other funds in the Fund Complex. Formerly, Associate General Counsel and Assistant Corporate Secretary of NYSE Euronext, Inc. (2000-2007). |
John Sullivan Year of Birth: 1955 Chief Accounting Officer, Chief Financial Officer Treasurer | | Since 2010 | | Senior Managing Director of Guggenheim Funds Investment Advisors, LLC and Guggenheim Funds Distributors, LLC (2010-present). Chief Financial Officer, Chief Accounting Officer and Treasurer of certain other funds in the Fund Complex. Formerly, Chief Compliance Officer, Van Kampen Funds (2004-2010). |
Joanna M. Catalucci Year of birth: 1966 Interim Chief Compliance Officer | | Since 2012*** | | Interim Chief Compliance Officer of certain funds in the Fund Complex; and Managing Director of Compliance and Fund Board Relations, Guggenheim Investments (2012-present). Formerly, Chief Compliance Officer & Secretary, SBL Fund; Security Equity Fund; Security Income Fund; Security Large Cap Value Fund & Security Mid Cap Growth Fund; Vice President, Rydex Holdings, LLC; Vice President, Security Benefit Asset Management Holdings, LLC; and Senior Vice President & Chief Compliance Officer, Security Investors, LLC (2010-2012); Security Global Investors, LLC, Senior Vice President (2010-2011); Rydex Advisors, LLC (f/k/a PADCO Advisors, Inc.) and Rydex Advisors II, LLC (f/k/a PADCO Advisors II, Inc.), Chief Compliance Officer and Senior Vice President (2010-2011); Rydex Capital Partners I, LLC & Rydex Capital Partners II, LLC, Chief Compliance Officer (2006-2007); and Rydex Fund Services, LLC (f/k/a Rydex Fund Services, Inc.), Vice President (2001-2006) |
Mark E. Mathiasen Year of birth: 1978 Secretary | | Since 2010 | | Director, Associate General Counsel of Guggenheim Funds Services, LLC (2012-present). Secretary of certain other funds in the Fund Complex. Formerly, Vice President; Assistant General Counsel of Guggenheim Funds Services, LLC (2007-2012). |
* Address for all Officers: 2455 Corporate West Drive, Lisle, IL 60532
** Officers serve at the pleasure of the Board of Trustees and until his or her successor is appointed and qualified or until his or her earlier resignation or removal.
*** Effective September 26, 2012.
GBAB | GUGGENHEIM BUILD AMERICA BONDS MANAGED DURATION TRUST SEMIANNUAL REPORT | 35 |
| DIVIDEND REINVESTMENT PLAN (Unaudited) | November 30, 2012 |
Unless the registered owner of common shares elects to receive cash by contacting The Computershare Shareowner Services LLC (the “Plan Administrator”), all dividends declared on common shares of the Trust will be automatically reinvested by the Plan Administrator, administrator for shareholders in the Trust’s Dividend Reinvestment Plan (the “Plan”), in additional common shares of the Trust. Participation in the Plan is completely voluntary and may be terminated or resumed at any time without penalty by notice if received and processed by the Plan Administrator prior to the dividend record date; otherwise such termination or resumption will be effective with respect to any subsequently declared dividend or other distribution. Some brokers may automatically elect to receive cash on your behalf and may re-invest that cash in additional common shares of the Trust for you. If you wish for all dividends declared on your common shares of the Trust to be automatically reinvested pursuant to the Plan, please contact your broker.
The Plan Administrator will open an account for each common shareholder under the Plan in the same name in which such common shareholder’s common shares are registered. Whenever the Trust declares a dividend or other distribution (together, a “Dividend”) payable in cash, non-participants in the Plan will receive cash and participants in the Plan will receive the equivalent in common shares. The common shares will be acquired by the Plan Administrator for the participants’ accounts, depending upon the circumstances described below, either (i) through receipt of additional unissued but authorized common shares from the Trust (“Newly Issued Common Shares”) or (ii) by purchase of outstanding common shares on the open market (“Open-Market Purchases”) on the New York Stock Exchange or elsewhere. If, on the payment date for any Dividend, the closing market price plus estimated brokerage commission per common share is equal to or greater than the net asset value per common share, the Plan Administrator will invest the Dividend amount in Newly Issued Common Shares on behalf of the participants. The number of Newly Issued Common Shares to be credited to each participant’s account will be determined by dividing the dollar amount of the Dividend by the net asset value per common share on the payment date; provided that, if the net asset value is less than or equal to 95% of the closing market value on the payment date, the dollar amount of the Dividend will be divided by 95% of the closing market price per common share on the payment date. If, on the payment date for any Dividend, the net asset value per common share is greater than the closing market value plus estimated brokerage commission, the Plan Administrator will invest the Dividend amount in common shares acquired on behalf of the participants in Open-Market Purchases.
If, before the Plan Administrator has completed its Open-Market Purchases, the market price per common share exceeds the net asset value per common share, the average per common share purchase price paid by the Plan Administrator may exceed the net asset value of the common shares, resulting in the acquisition of fewer common shares than if the Dividend had been paid in Newly Issued Common Shares on the Dividend payment date. Because of the foregoing difficulty with respect to Open-Market Purchases, the Plan provides that if the Plan Administrator is unable to invest the full Dividend amount in Open-Market Purchases during the purchase period or if the market discount shifts to a market premium during the purchase period, the Plan Administrator may cease making Open-Market Purchases and may invest the uninvested portion of the Dividend amount in Newly Issued Common Shares at net asset value per common share at the close of business on the Last Purchase Date provided that, if the net asset value is less than or equal to 95% of the then current market price per common share; the dollar amount of the Dividend will be divided by 95% of the market price on the payment date.
The Plan Administrator maintains all shareholders’ accounts in the Plan and furnishes written confirmation of all transactions in the accounts, including information needed by shareholders for tax records. Common shares in the account of each Plan participant will be held by the Plan Administrator on behalf of the Plan participant, and each shareholder proxy will include those shares purchased or received pursuant to the Plan. The Plan Administrator will forward all proxy solicitation materials to participants and vote proxies for shares held under the Plan in accordance with the instruction of the participants.
There will be no brokerage charges with respect to common shares issued directly by the Trust. However, each participant will pay a pro rata share of brokerage commission incurred in connection with Open-Market Purchases. The automatic reinvestment of Dividends will not relieve participants of any Federal, state or local income tax that may be payable (or required to be withheld) on such Dividends.
The Trust reserves the right to amend or terminate the Plan. There is no direct service charge to participants with regard to purchases in the Plan; however, the Trust reserves the right to amend the Plan to include a service charge payable by the participants.
All correspondence or questions concerning the Plan should be directed to the Plan Administrator, Computershare Shareowner Services LLC, P.O. Box 358015, Pittsburgh, PA 15252-8015; Attention Shareholder Services Department, Phone Number: 866-488-3559.
36 | GBAB | GUGGENHEIM BUILD AMERICA BONDS MANAGED DURATION TRUST SEMIANNUAL REPORT |
This Page Intentionally Left Blank.
This Page Intentionally Left Blank.
| TRUST INFORMATION | November 30, 2012 |
| Board of Trustees | | Officers | | Investment Adviser | | Legal Counsel |
Randall C. Barnes Donald C. Cacciapaglia* Roman Friedrich III Robert B. Karn III Ronald A. Nyberg Ronald E. Toupin, Jr., Chairman | | Donald C. Cacciapaglia Chief Executive Officer Kevin M. Robinson Chief Legal Officer John Sullivan Chief Financial Officer, Chief Accounting Officer and Treasurer Joanna M. Catalucci Interim Chief Compliance Officer Mark E. Mathiasen Secretary | | and Administrator Guggenheim Funds Investment Advisors, LLC Lisle, Illinois Investment Sub-Adviser Guggenheim Partners Investment Management, LLC Santa Monica, California Accounting Agent and Custodian The Bank of New York Mellon New York, New York | | Skadden, Arps, Slate, Meagher & Flom LLP New York, New York Independent Registered Public Accounting Firm Ernst & Young LLP Chicago, Illinois |
| * | Trustee is an “interested person” (as defined in section 2(a)(19) of the 1940 Act) (“Interested Trustee”) of the Trust because of his position as the President and CEO of the Investment Adviser. | | | |
Privacy Principles of Guggenheim Build America Bonds Managed Duration Trust for Shareholders
The Trust is committed to maintaining the privacy of its shareholders and to safeguarding its non-public personal information. The following information is provided to help you understand what personal information the Trust collects, how we protect that information and why, in certain cases, we may share information with select other parties.
Generally, the Trust does not receive any non-public personal information relating to its shareholders, although certain non-public personal information of its shareholders may become available to the Trust. The Trust does not disclose any non-public personal information about its shareholders or former shareholders to anyone except as permitted by law or as is necessary in order to service shareholder accounts (for example, to a transfer agent or third party administrator).
The Trust restricts access to non-public personal information about the shareholders to Guggenheim Funds Investment Advisors, LLC employees with a legitimate business need for the information. The Trust maintains physical, electronic and procedural safeguards designed to protect the non-public personal information of its shareholders.
Questions concerning your shares of Guggenheim Build America Bonds Managed Duration Trust?
| • | If your shares are held in a Brokerage Account, contact your Broker. |
| | |
| • | If you have physical possession of your shares in certificate form, contact the Trust’s Transfer Agent: |
| | Computershare Shareowner Services LLC, 480 Washington Boulevard, Jersey City, NJ 07310; (866) 488-3559 |
This report is sent to shareholders of Guggenheim Build America Bonds Managed Duration Trust for their information. It is not a Prospectus, circular or representation intended for use in the purchase or sale of shares of the Trust or of any securities mentioned in this report.
A description of the Trust’s proxy voting policies and procedures related to portfolio securities is available without charge, upon request, by calling the Trust at (866) 392-3004.
Information regarding how the Trust voted proxies for portfolio securities, if applicable, during the most recent 12-month period ended June 30, is also available, without charge and upon request by calling (866) 392-3004, by visiting the Trust’s website at www.guggenheiminvestments.com/gbab or by accessing the Trust’s Form N-PX on the U.S. Securities and Exchange Commission’s (SEC) website at www.sec.gov.
The Trust files its complete schedule of portfolio holdings with the SEC for the first and third quarters of each fiscal year on Form N-Q. The Trust’s Form N-Q is available on the SEC website at www.sec.gov or the Trust’s website at www.guggenheiminvestments.com/gbab. The Trust’s Form N-Q may also be viewed and copied at the SEC’s Public Reference Room in Washington, DC; information on the operation of the Public Reference Room may be obtained by calling (800) SEC-0330.
GBAB | GUGGENHEIM BUILD AMERICA BONDS MANAGED DURATION TRUST SEMIANNUAL REPORT | 39 |
Guggenheim Partners Investment Management, LLC
Guggenheim Partners Investment Management, LLC (“GPIM”) is an indirect subsidiary of Guggenheim Partners, LLC, a diversified financial services firm. The firm provides capital markets services, portfolio and risk management expertise, wealth management, and investment advisory services. Clients of Guggenheim Partners, LLC subsidiaries are an elite mix of individuals, family offices, endowments, foundations, insurance companies and other institutions.
Investment Philosophy
GPIM’s investment philosophy is predicated upon the belief that thorough research and independent thought are rewarded with performance that has the potential to outperform benchmark indexes with both lower volatility and lower correlation of returns over time as compared to such benchmark indexes.
Investment Process
GPIM’s investment process is a collaborative effort between various groups including the Portfolio Construction Group, which utilize proprietary portfolio construction and risk modeling tools to determine allocation of assets among a variety of sectors, and its Sector Specialists, who are responsible for security selection within these sectors and for implementing securities transactions, including the structuring of certain securities directly with the issuers or with investment banks and dealers involved in the origination of such securities.
Guggenheim Funds Distributors, LLC
2455 Corporate West Drive
Lisle, IL 60532
Member FINRA/SIPC
(01/13)
NOT FDIC-INSURED | NOT BANK-GUARANTEED | MAY LOSE VALUE
CEF-GBAB-SAR-1112
Item 2. Code of Ethics.
Not applicable for a semi-annual reporting period.
Item 3. Audit Committee Financial Expert.
Not applicable for a semi-annual reporting period.
Item 4. Principal Accountant Fees and Services.
Not applicable for a semi-annual reporting period.
Item 5. Audit Committee of Listed Registrants.
Not applicable for a semi-annual reporting period.
Item 6. Schedule of Investments.
The Schedule of Investments is included as part of Item 1.
Item 7. Disclosure of Proxy Voting Policies and Procedures for Closed-End Management Investment Companies.
Not applicable for a semi-annual reporting period.
Item 8. Portfolio Managers of Closed-End Management Investment Companies.
Item 9. Purchases of Equity Securities by Closed-End Management Investment Company and Affiliated Purchasers.
None.
Item 10. Submission of Matters to a Vote of Security Holders.
The registrant has not made any material changes to the procedures by which shareholders may recommend nominees to the registrant’s Board of Trustees.
Item 11. Controls and Procedures.
(a) The registrant's principal executive officer and principal financial officer have evaluated the registrant's disclosure controls and procedures (as defined in Rule 30a-3(c) under the Investment Company Act) as of a date within 90 days of this filing and have concluded based on such evaluation, as required by Rule 30a-3(b) under the Investment Company Act, that the registrant's disclosure controls and procedures were effective, as of that date, in ensuring that information required to be disclosed by the registrant in this Form N-CSR was recorded, processed, summarized, and reported within the time periods specified in the Securities and Exchange Commission’s rules and forms.
(b) There were no changes in the registrant’s internal control over financial reporting (as defined in Rule 30a-3(d) under the Investment Company Act) that occurred during the registrant’s second fiscal quarter of the period covered by this report that have materially affected, or are reasonably likely to materially affect, the registrant’s internal control over financial reporting.
Item 12. Exhibits.
Name: Donald C. Cacciapaglia
Name: Donald C. Cacciapaglia