UNITED STATES
SECURITIES AND EXCHANGE COMMISSION
Washington, D.C. 20549
FORM N-CSR
CERTIFIED SHAREHOLDER REPORT OF REGISTERED MANAGEMENT INVESTMENT COMPANIES
Investment Company Act file number 811-22437
Guggenheim Build America Bonds Managed Duration Trust
(Exact name of registrant as specified in charter)
2455 Corporate West Drive, Lisle, IL 60532
(Address of principal executive offices) (Zip code)
Amy J. Lee
2455 Corporate West Drive, Lisle, IL 60532
(Name and address of agent for service)
Registrant's telephone number, including area code: (630) 505-3700
Date of fiscal year end: May 31
Date of reporting period: June 1, 2013 – November 30, 2013
Item 1. Reports to Stockholders.
The registrant's annual report transmitted to shareholders pursuant to Rule 30e-1 under the Investment Company Act of 1940, as amended (the “Investment Company Act”), is as follows:

GUGGENHEIMINVESTMENTS.COM/GBAB
... YOUR WINDOW TO THE LATEST, MOST UP-TO-DATE INFORMATION ABOUT THE GUGGENHEIM BUILD AMERICA BONDS MANAGED DURATION TRUST
The shareholder report you are reading right now is just the beginning of the story. Online at guggenheiminvestments.com/gbab, you will find:
| • | Daily, weekly and monthly data on share prices, net asset values, distributions and more |
| • | Monthly portfolio overviews and performance analyses |
| • | Announcements, press releases and special notices |
| • | Fund and adviser contact information |
Guggenheim Partners Investment Management, LLC and Guggenheim Funds Investment Advisors, LLC are continually updating and expanding shareholder information services on the Trust’s website in an ongoing effort to provide you with the most current information about how your Trust’s assets are managed and the results of our efforts. It is just one more small way we are working to keep you better informed about your investment in the Trust.
| November 30, 2013 |
DEAR SHAREHOLDER
We thank you for your investment in the Guggenheim Build America Bonds Managed Duration Trust (the “Trust”). This report covers the Trust’s performance for the six-month period ended November 30, 2013.
All Trust returns cited—whether based on net asset value (“NAV”) or market price—assume the reinvestment of all distributions. For the six-month period ended November 30, 2013, the Trust provided a total return based on market price of -11.98% and a total return based on NAV of -4.04%. As of November 30, 2013, the Trust’s market price of $19.19 per share represented a discount of 12.05% to its NAV of $21.82 per share. As of May 31, 2013, the Trust’s market price of $22.70 per share represented a discount of 3.85% to its NAV of $23.61 per share. The market value of the Trust’s shares fluctuates from time to time and it may be higher or lower than the Trust’s NAV. NAV performance data reflects fees and expenses of the Fund.
The Fund made a monthly distribution of $0.13817 for each month of the period. The dividend as of November 30, 2013, represents an annualized distribution rate of 8.64% based on the Trust’s closing market price of $19.19 on November 30, 2013.
Guggenheim Funds Investment Advisors, LLC (“GFIA” or the “Adviser”) serves as the investment adviser to the Trust. Guggenheim Partners Investment Management, LLC (“GPIM” or the “Sub-Adviser”) serves as the Trust’s investment sub-adviser and is responsible for the management of the Trust’s portfolio of investments. Each of the Adviser and the Sub-Adviser is an affiliate of Guggenheim Partners, LLC (“Guggenheim”), a global diversified financial services firm.
We encourage shareholders to consider the opportunity to reinvest their distributions from the Trust through the Dividend Reinvestment Plan (“DRIP”), which is described in detail on page 33 of this report. When shares trade at a discount to NAV, the DRIP takes advantage of the discount by reinvesting the monthly dividend distribution in common shares of the Trust purchased in the market at a price less than NAV. Conversely, when the market price of the Trust’s common shares is at a premium above NAV, the DRIP reinvests participants’ dividends in newly-issued common shares at the greater of NAV per share of 95% of the market price per share. The DRIP provides a cost effective means to accumulate additional shares and enjoy the benefits of compounding returns over time. Since the Trust endeavors to maintain a steady monthly distribution rate, the DRIP effectively provides an income averaging technique, which causes shareholders to accumulate a larger number of Trust shares when the share price is lower than when the price is higher.
To learn more about the Trust’s performance and investment strategy for the semiannual period ended November 30, 2013, we encourage you to read the Questions & Answers section of this report, which begins on page 4. We are honored that you have chosen the Guggenheim Build America Bonds Managed Duration Trust as part of your investment portfolio. For the most up-to-date information regarding your investment, please visit the Trust’s website at guggenheiminvestments.com/gbab.
Sincerely,

Donald C. Cacciapaglia
Chief Executive Officer
Guggenheim Build America Bonds Duration Trust
December 31, 2013
GBAB l GUGGENHEIM BUILD AMERICA BONDS MANAGED DURATION TRUST SEMIANNUAL REPORT l 3 |
| QUESTIONS & ANSWERS | November 30, 2013 |
Guggenheim Build America Bonds Managed Duration Trust (the “Trust”) is managed by a team of seasoned professionals at Guggenheim Partners Investment Management, LLC (“GPIM” or the “Sub-Adviser”). This team includes B. Scott Minerd, Global Chief Investment Officer; Anne B. Walsh, CFA, JD, Senior Managing Director; and James E. Pass, Senior Managing Director. In the following interview, the investment team discusses the market environment and the Trust’s strategy and performance for the six-month period ended November 30, 2013.
What were the most important developments in the Trust over the past six months?
The Trust continues to rank at or near the top of its peer group, generally driven by two factors: The portfolio construction within the Build America Bonds (BABs) segment has been a source of excess performance, with security selection and a lower duration target adding value over the past six months. Additionally, the Trust’s design, investing at least 80% of its Managed assets (net assets plus leverage) (“Managed Assets”) in BABs and up to 20% of its Managed Assets in securities other than BABs, provides an anchor to returns and mitigates the interest rate risk embedded in long-duration bonds. This structure has consistently enabled the portfolio managers to generate both higher absolute returns and lower risk than both peers and benchmarks, resulting in risk-adjusted performance which markedly outperforms competing products and indexes. Although the Trust had negative return for the period, it outperformed its benchmark, the Bank of America Merrill Lynch Build America Bond Index, by 54 basis points.
What is the Trust’s investment objective and how is it pursued?
The Trust’s primary investment objective is to provide current income with a secondary objective of long-term capital appreciation. The Trust seeks to achieve its investment objectives by investing primarily in a diversified portfolio of taxable municipal securities known as Build America Bonds or BABs. Under normal market conditions, the Trust invests at least 80% of its Managed Assets in BABs. The Trust may invest up to 20% of its Managed Assets in securities other than BABs, including taxable municipal securities that do not qualify for federal subsidy payments under the American Recovery and Reinvestment Act of 2009 (the “Act”), municipal securities, the interest income from which is exempt from regular federal income tax (sometimes referred to as “tax-exempt municipal securities”), asset-backed securities (“ABS”), senior loans and other income-producing securities.
At least 80% of the Trust’s Managed Assets are invested in securities that, at the time of investment, are investment grade quality. The Trust may invest up to 20% of its Managed Assets in securities that, at the time of investment, are below investment grade quality. Securities of below investment grade quality are regarded as having predominantly speculative characteristics with respect to capacity to pay interest and repay principal.
The Trust does not invest more than 25% of its Managed Assets in municipal securities in any one state of origin or more than 15% of its Managed Assets in municipal securities that, at the time of investment, are illiquid.
BABs are taxable municipal securities that include bonds issued by state and local governments to finance capital projects such as public schools, roads, transportation infrastructure, bridges, ports and public buildings, pursuant to the Act. In contrast to traditional municipal bonds, interest received on BABs is subject to federal income tax and may be subject to state income tax. However, issuers of Direct Payment BABs are eligible to receive a subsidy from the U.S. Treasury of up to 35% of the interest paid on the bonds, allowing such issuers to issue BABs that pay interest rates that are competitive with the rates typically paid by private bond issuers in the taxable fixed-income market.
The Sub-Adviser employs investment and trading strategies to seek to maintain the leverage-adjusted duration of the Trust’s portfolio to generally less than 10 years. (Duration is a measure of a bond’s price sensitivity to changes in interest rates, expressed in years. Duration is a weighted average of the times that interest payments and the final return of principal are received. The weights are the amounts of the payments discounted by the yield to maturity of the bond.)
In addition, the Sub-Adviser may seek to manage the duration of the Trust’s portfolio through the use of derivative instruments, including U.S. Treasury swaps, credit default swaps, total return swaps and futures contracts, in an attempt to reduce the overall volatility of the Trust’s portfolio to changes in market interest rates. The Sub-Adviser does not currently use such derivative instruments to manage the duration of the Trust’s portfolio but may do so in the future. The Sub-Adviser may seek to manage the Trust’s duration in a flexible and opportunistic manner based primarily on then-current market conditions and interest rate levels. The Trust may incur costs in implementing the duration management strategy, but such strategy will seek to reduce the volatility of the Trust’s portfolio.
What were the significant events affecting the economy and market environment over the past six months?
Speculation on the future of quantitative easing dominated financial headlines for much of the period, causing increased interest rate volatility and driving investor demand for shorter duration assets. The yield on the 10-year Treasury note hit a two-year high of 3.0% in early September, about 140 basis points above the lows seen in May.
The Federal Reserve (the “Fed”) surprised most market participants on September 18, 2013 with its inaction on what was expected to be the beginning of tapering its $85 billion per month asset purchase program. Given sluggish job growth and malaise in the housing data in recent
4 l GBAB l GUGGENHEIM BUILD AMERICA BONDS MANAGED DURATION TRUST SEMIANNUAL REPORT |
| QUESTIONS & ANSWERS continued | November 30, 2013 |
months, the Fed announced that it would continue to maintain the pace of purchases until there was significant improvement in the aforementioned areas. Investors that were positioned in longer-duration fixed income assets benefitted as benchmark 10-year U.S. Treasury bond yields declined in the wake of the Fed announcement, closing the third quarter at 2.6%. The soft patch in economic growth added downward pressure to interest rates in the short term, but reacceleration is expected to ultimately push interest rates higher over the long term.
The fundamental outlook for the global economy continues to improve. We are seeing a synchronous global economic expansion for the first time since 2007. In Europe, the periphery has struggled through several years of contraction, but lower prices and unit labor costs have led to the start of a recovery. Germany’s economy has been weighed down by the peripheral nations, but overall, Europe has shown signs of expansion from recent manufacturing data. Asian economies, notably China and Japan, have seen substantial monetary accommodation from their respective regimes and look to return to higher levels of growth in the coming years.
Here in the United States, we continue to see strong evidence of seasonal strength in the stock market. The data-distorting effects of the October U.S. government shutdown are being flushed from the system, providing a truer reading of what is occurring domestically. Despite a shutdown that lasted far longer than originally anticipated, the U.S. economy held up fairly well, indicating a high degree of underlying strength.
At period end, the likelihood of the Fed tapering quantitative easing in December appeared to be remote. However, given strong employment data released in early December, many market participants placed a higher probability of the Fed reducing purchases in the next few meetings. (After the period end, on December 18, 2013, the Fed announced that it would begin to taper in January 2014, reducing monthly asset purchases from $85 billion to $75 billion). Our expectation is interest rates are likely to remain range bound into 2014 before continuing an ascent higher.
How did the Trust perform for the six months ended November 30, 2013?
All Trust returns cited—whether based on net asset value (“NAV”) or market price—assume the reinvestment of all distributions. For the six-month period ended November 30, 2013, the Trust provided a total return based on market price of -11.98% and a total return based on NAV of -4.04%. As of November 30, 2013, the Trust’s market price of $19.19 per share represented a discount of 12.05% to its NAV of $21.82 per share. As of May 31, 2013, the Trust’s market price of $22.70 per share represented a discount of 3.85% to its NAV of $23.61 per share. The market value of the Trust’s shares fluctuates from time to time and it may be higher or lower than the Trust’s NAV. NAV performance data reflects fees and expenses of the Trust.
The Trust made the following monthly distributions per share during the six-month period ended November 30, 2013:
| Month | Distribution per Share |
| June 2013 | $0.13817 |
| July | $0.13817 |
| August | $0.13817 |
| September | $0.13817 |
| October | $0.13817 |
| November | $0.13817 |
| Total | $0.82902 |
The Trust’s monthly distribution represents an annualized distribution rate of 8.64% based on the Trust’s closing market price of $19.19 on November 30, 2013. The Trust’s distribution rate is not constant and is subject to change based on the performance of the Trust.
What factors affected Trust performance during the six-month period ended November 30, 2013?
During the time period ending November 30, 2013, the taxable municipal market faced various macro issues such as the partial shutdown of the federal government, the debt ceiling debate, and taper talk from the Federal Reserve. Like other fixed income asset classes, the taxable municipal market experienced significant volatility but performed better when compared to the tax-exempt municipal market. Towards the end of the period, credit spreads tightened, reflecting the general consensus that the Federal Reserve would not taper until March 2014.
The portfolio lost value during the period largely because of the volatile rate environment prompted by speculation over the end of Federal Reserve tapering, and the ongoing effects of the sequestration. Earlier, it appeared sequestration might impose automatic spending cuts in state and local government aid and reduce BABs subsidies. There was also concern that such cuts could lead some issuers to refinance outstanding BABs through an extraordinary redemption provision (ERP). Although certain issues did elect to exercise their ERPs, refunding volume, as the Sub-Adviser expected, was limited and did not materially impact the BABs market during the period.
Nonetheless, we expect more issuers to review their BABs and other direct payment indentures for refinancing alternatives as sequestration appears to be here to stay. Although we continue to believe BABs refinancings will be limited, market valuations of certain BABs, Qualified School Construction Bonds (“QSCBs”) and other direct payment bonds will be volatile in the near term.
Other factors affecting BABs performance were lack of primary issuance, which creates scarcity that helps support prices. Existing issues also typically carry high dollar prices, which limits activity in the sector.
GBAB l GUGGENHEIM BUILD AMERICA BONDS MANAGED DURATION TRUST SEMIANNUAL REPORT l 5 |
| QUESTIONS & ANSWERS continued | May 31, 2013 |
Describe how the Trust’s assets are invested.
As of November 30, 2013, approximately 84% of the Trust’s long-term investments were in BABs and QSCBs, which are qualifying investments for purposes of the Trust’s policy of investing at least 80% of its managed assets in BABs. The taxable municipal sector was a detractor from return for the period.
The rest of the Trust’s assets, approximately 16% of the Trust’s long-term investments as of November 30, 2013, were invested in non-BABs securities. These include asset-backed securities, bank loans, corporate bonds (including high yield bonds) and other securities, by which we were able to add incremental yield. The non-BABs portion of the portfolio was a contributor to return for the period.
The most significant change within non-BABs over the period was a decrease in below-investment-grade corporate debt and in bank loans as some assets were called away for refinancing. The Trust continues to seek new floating rate assets, primarily bank loans.
The Trust believes there is sufficient liquidity within non-BABs holdings to manage a decline in the BABs holdings, should a widespread increase in interest rates cause BABs to lose sufficient value to approach the 80% minimum.
How did other markets perform in this environment?
The return of the Bank of America Merrill Lynch Build America Bond Index was -4.58% for the six months ended November 30, 2013. The return of the Barclays U.S. Treasury Composite Index, which includes Treasury securities of all maturities, was -0.85% for the same period.
The Barclays U.S. Aggregate Bond Index (the “Barclays Aggregate”), which is a proxy for the U.S. investment grade bond market, returned -0.56% for the period, while the Barclays U.S. Corporate High Yield Index returned 2.61%.
Reflecting the Federal Reserve’s (“the Fed”) continuing accommodative monetary policy, interest rates on short-term securities remained at their lowest levels in many years; the return of the Barclays 1–3 Month U.S. Treasury Bill Index was 0.02% for the period.
What is the Trust’s exposure to bonds associated with Detroit or Puerto Rico?
Following Detroit’s bankruptcy filing in July, Federal courts were deciding if the bankruptcy could proceed. (In December, after the period end, a Federal judge ruled that the bankruptcy could proceed and that the city’s pensions would be treated the same as any other contract in bankruptcy.)
Puerto Rico has been coping with a weak economy, a huge debt burden and a constant flow of negative headlines from the financial press and media pundits. This has caused its municipal bonds to fall in value in 2013 as investors feared its financial condition could lead to a default.
The Trust owned and purchased bonds that fund the Detroit Public Schools through the Michigan School Bond Qualification and Loan Program (“Program”). These securities are not directly involved in the Detroit’s bankruptcy filing, as, under the Program, the State shall lend to Detroit Public Schools in amounts sufficient to pay debt service. However, the market has been treating them as impaired, which we believe creates investment opportunities for the Trust. The portfolio managers conduct continuous market analysis to ensure these bonds meet the Trust’s investment criteria, and they continue to perform as expected. On the other hand, the Trust does not have any exposure to Puerto Rico municipal credits but may do so in the future, if investment opportunities arise.
What is the Trust’s leverage strategy?
Since leverage adds to performance when the cost of leverage is less than the total return generated by investments, the use of leverage detracted from the Trust’s total return during this period. The Trust utilizes leverage (borrowing) as part of its investment strategy, to finance the purchase of additional securities that provide increased income and potentially greater appreciation potential to common shareholders than could be achieved from a portfolio that is not leveraged. Leverage will not exceed 331/3% of the Trust’s Managed Assets.
As of November 30, 2013, the Trust’s leverage was approximately 26% of Managed Assets, slightly more than six months ago. The Trust currently employs leverage through reverse repurchase agreements with at least three different counterparties and a credit facility with a major bank. Under the reverse repurchase agreements, securities are transferred to another party, such as a bank or broker-dealer, in return for cash which can be used for additional investments.
There is no guarantee that the Trust’s leverage strategy will be successful. The Trust’s use of leverage may cause the Trust’s NAV and market price of common shares to be more volatile and can magnify the effect of any losses.
What is the current outlook for the taxable municipal sector that includes Build America Bonds?
Since the 2010 expiration of the BABs and other federally sponsored programs, taxable municipal issuance has reverted back to historical figures – approximately $35 billion per year or roughly 10 percent of total municipal issuance. In 2011 and 2012, taxable issuance was approximately $35 billion and $38 billion, respectively.
The primary market has been relatively quiet as 2013 issuance remains on track to total approximately $35 billion, driven primarily by private and public universities, health care institutions and special purpose entities. Although issuance of taxable municipal bonds has been ahead of this pace through most of 2013, we expect a significant decline in activity given the rise in U.S. Treasury yields.
6 l GBAB l GUGGENHEIM BUILD AMERICA BONDS MANAGED DURATION TRUST SEMIANNUAL REPORT |
| QUESTIONS & ANSWERS continued | November 30, 2013 |
Secondary market activity was dominated by certain maturities of both State of California General Obligation Bonds and New York City General Obligation Bonds. However, the majority of this activity involved bonds with durations of 10 years and longer.
Against this backdrop, we continue to focus on revenue bonds, secured by a dedicated revenue stream, high grade general obligation bonds and story bonds rated BBB or better. Health care organizations, higher education institutions and large governmental issuers continue to garner the majority of our attention. In addition, we continue to monitor the market for investment opportunities involving BABs and QRSBs, respectively, as both type of direct payment obligations received negative media attention during the partial shutdown of the Federal government.
Index Definitions:
Indices are unmanaged and reflect no expenses. It is not possible to invest directly in an index.
The Bank of America Build America Bond Index is designed to track the performance of U.S. dollar-denominated Build America Bonds publicly issued by U.S. states and territories, and their political subdivisions, in the U.S. market.
The Barclays U.S. Treasury Composite Index includes public obligations of the U.S. Treasury. Treasury bills are excluded by the maturity constraint but are part of a separate Short Treasury Index. In addition, certain special issues, such as state and local government series bonds (SLGs), as well as U.S. Treasury TIPS, are excluded. STRIPS are excluded from the index because their inclusion would result in double-counting. Securities in the index roll up to the U.S. Aggregate, U.S. Universal, and Global Aggregate Indices. The U.S. Treasury Index was launched on January 1, 1973.
The Barclays U.S. Aggregate Bond Index represents securities that are U.S. domestic, taxable, and dollar denominated. The index covers the U.S. investment grade fixed rate bond market, with index components for government and corporate securities, mortgage pass-through securities, and asset-backed securities.
The Barclays U.S. Corporate High Yield Index is an unmanaged index of below investment grade bonds issued by U.S. corporations.
The Barclays 1-3 Month U.S. Treasury Bill Index tracks the performance of U.S. Treasury bills with a remaining maturity of one to three months. U.S. Treasury bills, which are short-term loans to the U.S. government, are full faith-and-credit obligations of the U.S. Treasury and are generally regarded as being free of any risk of default.
Risks and Other Considerations
The views expressed in this report reflect those of the portfolio managers only through the report period as stated on the cover. These views are subject to change at any time, based on market and other conditions and should not be construed as a recommendation of any kind. The material may also include forward looking statements that involve risk and uncertainty, and there is no guarantee that any predictions will come to pass. There can be no assurance that the Trust will achieve its investment objectives. The value of the Trust will fluctuate with the value of the underlying securities. Historically, closed-end funds often trade at a discount to their net asset value. There can be no assurance that the Trust will achieve its investment objectives.
Please see guggenheiminvestments.com/gbab for a detailed discussion of the Trust’s risks and considerations.
GBAB l GUGGENHEIM BUILD AMERICA BONDS MANAGED DURATION TRUST SEMIANNUAL REPORT l 7 |
| TRUST SUMMARY (Unaudited) | November 30, 2013 |
| Trust Statistics | ||||||
| Share Price | $ | 19.19 | ||||
| Common Share Net Asset Value | $ | 21.82 | ||||
| Premium/Discount to NAV | -12.05% | |||||
| Net Assets Applicable to Common Shares ($000) | $ | 379,897 | ||||
| Total Returns | ||||||
| (Inception 10/28/10) | Market | NAV | ||||
| Six Month | -11.98% | -4.04% | ||||
| One Year | -10.94% | -1.76% | ||||
| Three Year - Average Annual | 5.82% | 11.88% | ||||
| Since Inception - Average Annual | 5.64% | 11.41% |
Performance data quoted represents past performance, which is no guarantee of future results and current performance may be lower or higher than the figures shown. The NAV total returns reflect fees and expenses of the Trust. For the most recent month-end performance figures, please visit guggenheiminvestments.com/gbab. The investment return and principal value of an investment will fluctuate with changes in the market conditions and other factors so that an investor’s shares, when sold, may be worth more or less than their original cost.
| % of Municipal | |
| State/Territory Allocations | Bonds |
| California | 22.7% |
| Illinois | 12.3% |
| Washington | 9.5% |
| Indiana | 6.4% |
| New Jersey | 6.2% |
| Texas | 6.1% |
| New York | 5.8% |
| Ohio | 5.2% |
| Michigan | 5.1% |
| Florida | 4.3% |
| Pennsylvania | 4.2% |
| West Virginia | 3.3% |
| Colorado | 3.0% |
| Alabama | 2.9% |
| Nevada | 2.7% |
| Vermont | 2.7% |
| Louisiana | 2.5% |
| Mississippi | 1.9% |
| South Carolina | 1.4% |
| Georgia | 1.3% |
| South Dakota | 1.0% |
| Minnesota | 0.9% |
Portfolio composition and holdings are subject to change daily. For more information, please visit guggenheiminvestments.com/gbab. The above summaries are provided for informational purposes only and should not be viewed as recommendations. Past performance does not guarantee future results.


| % of Total | ||
| Portfolio Breakdown | Net Assets | |
| Municipal Bonds | 111.4% | |
| Corporate Bonds | 6.7% | |
| Asset Backed Securities | 5.6% | |
| Term Loans | 4.9% | |
| Preferred Stock | 2.0% | |
| Collateralized Mortgage Obligations | 0.7% | |
| Closed-End Fund | 0.3% | |
| Warrants | 0.0% | * |
| Common Stock | 0.0% | * |
| Total Long-Term Investments | 131.6% | |
| Short-Term Investment | 0.2% | |
| Total Investments | 131.8% | |
| Other Assets in excess of Liabilities | 2.6% | |
| Borrowings | -10.5% | |
| Reverse Repurchase Agreements | -23.9% | |
| Total Net Assets | 100.0% | |
| * Less than 0.1%. |
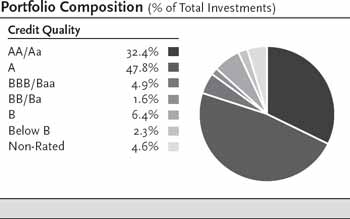
Ratings shown are assigned by one or more Nationally Recognized Statistical Credit Rating Organizations (“NRSRO”), such as Standard & Poor’s, Moody’s and Fitch. The ratings are an indication of an issuer’s credit-worthiness and typically range from AAA or Aaa (highest) to D (lowest). When two or more ratings are available, the lower rating is used; when only one is available, that rating is used. The Non-Rated category consists of securities that have not been rated by an NRSRO. U.S. Treasury securities and U.S. Government Agency securities are not rated but deemed to be equivalent to securities rated AA+/Aaa.
8 l GBAB l GUGGENHEIM BUILD AMERICA BONDS MANAGED DURATION TRUST SEMIANNUAL REPORT |
| PORTFOLIO OF INVESTMENTS (Unaudited) | November 30, 2013 |
| Principal | Optional Call | ||||||||||||
| Amount | Description | Rating * | Coupon | Maturity | Provisions** | Value | |||||||
| Long-Term Investments – 131.6% | |||||||||||||
| Municipal Bonds – 111.4% | |||||||||||||
| Alabama – 2.9% | |||||||||||||
| $ | 3,000,000 | Alabama State University, General Tuition and Fee Revenue Bonds, Taxable Direct-Pay Build America Bonds, (Assured GTY)(a) (k) | AA– | 7.100% | 09/01/2035 | 09/01/20 @ 100 | $ | 3,232,500 | |||||
| 5,000,000 | Alabama State University, General Tuition and Fee Revenue Bonds, Taxable Direct-Pay Build America Bonds, (Assured GTY)(a) (k) | AA– | 7.200% | 09/01/2038 | 09/01/20 @ 100 | 5,412,250 | |||||||
| 2,000,000 | Alabama State University, General Tuition and Fee Revenue Bonds, Taxable Direct-Pay Build America Bonds, (Assured GTY)(a) | AA– | 7.250% | 09/01/2040 | 09/01/20 @ 100 | 2,168,100 | |||||||
| 500,000 | Jefferson County, Alabama, Sewer Revenue Warrants, Series 2013-A to Series 2013-F(AGM) | AA– | 0.000% | 10/01/2034 | 10/01/23 @ 51 | 133,030 | |||||||
| 10,945,880 | |||||||||||||
| California – 22.7% | |||||||||||||
| 500,000 | Alhambra Unified School District, Elementary Schools Improvement District, Los Angeles County, California, Election of 2008 General Obligation Bonds, Federally Taxable, Series B– 1(k) | A+ | 6.700% | 02/01/2026 | N/A | 552,140 | |||||||
| 10,000,000 | California, General Obligation Bonds, Various Purpose, Taxable Build | ||||||||||||
| America Bonds(a) | A | 7.700% | 11/01/2030 | 11/01/20 @ 100 | 11,708,600 | ||||||||
| 3,000,000 | Culver City Redevelopment Agency, California, Taxable Tax Allocation Bonds, Culver City Redevelopment Project, Series 2011B(k) | A | 8.000% | 11/01/2020 | N/A | 3,192,750 | |||||||
| 340,000 | Cypress Elementary School District (Orange County, California), General Obligation Bonds, Direct Pay Qualified School Construction Bonds, 2008 Election, Series B– 2(a) (k) | AA– | 6.050% | 08/01/2021 | N/A | 365,412 | |||||||
| 660,000 | Cypress Elementary School District (Orange County, California), General Obligation Bonds, Direct Pay Qualified School Construction Bonds, 2008 Election, Series B-2(k) | AA– | 6.650% | 08/01/2025 | N/A | 709,012 | |||||||
| 7,500,000 | Long Beach Unified School District, California, Qualified School Construction Bonds, Federally Taxable, Election of 2008, General Obligation Bonds, Series B-1(k) | AA– | 5.914% | 08/01/2025 | N/A | 8,686,500 | |||||||
| 10,000,000 | Los Angeles, California, Department of Water & Power Revenue, Taxable Build America Bonds(a) | AA– | 7.000% | 07/01/2041 | 07/01/21 @ 100 | 11,516,900 | |||||||
| 10,000,000 | Los Angeles, California, Department of Water & Power Revenue, Taxable Build America Bonds(a) | AA | 7.003% | 07/01/2041 | 07/01/20 @ 100 | 11,153,500 | |||||||
| 5,000,000 | Metropolitan Water District, Southern California, Water Revenue Bonds, 2010 Authorization, Taxable Build America Bonds, Series A(a) | AAA | 6.947% | 07/01/2040 | 07/01/20 @ 100 | 5,614,600 | |||||||
| 1,025,000 | Monrovia Unified School District, Los Angeles County, California, Election of 2006 General Obligation Bonds, Build America Bonds, Federally Taxable, Series C-1(a) (k) | A+ | 7.250% | 08/01/2028 | N/A | 1,161,807 | |||||||
| 10,000,000 | Oakland Unified School District, County of Alameda, California, Taxable General Obligation Bonds, Election of 2006, Qualified School Construction Bonds, Series 2012B(k) (l) | NR | 6.877% | 08/01/2033 | 08/01/22 @ 100 | 9,575,900 | |||||||
| 1,000,000 | Placentia-Yorba Linda Unified School District (Orange County, California), General Obligation Bonds, Federally Taxable Direct-Pay Qualified School Construction Bonds, Election of 2008, Series E(k) | AA– | 5.400% | 02/01/2026 | N/A | 1,024,040 | |||||||
| 5,000,000 | Riverside Community College District, Riverside County, California, Election of 2004 General Obligation Bonds, Taxable Build America Bonds, Series 2010 D-1(a) | AA | 7.021% | 08/01/2040 | 08/01/20 @ 100 | 5,483,750 | |||||||
| 2,245,000 | Santa Ana Unified School District, California, General Obligation Bonds, Federal Taxable Build America Bonds(a) | Aa3 | 6.800% | 08/01/2030 | N/A | 2,636,191 | |||||||
| 7,755,000 | Santa Ana Unified School District, California, General Obligation Bonds, Federal Taxable Build America Bonds(a) | Aa3 | 7.100% | 08/01/2040 | N/A | 9,251,637 | |||||||
| 3,330,000 | Sonoma Valley Unified School District, General Obligation, Federally Taxable Bonds(k) | AA– | 7.123% | 08/01/2028 | 08/01/20 @ 100 | 3,542,221 | |||||||
| 86,174,960 |
| See notes to financial statements. | |
GBAB l GUGGENHEIM BUILD AMERICA BONDS MANAGED DURATION TRUST SEMIANNUAL REPORT l 9 |
| PORTFOLIO OF INVESTMENTS (Unaudited) continued | November 30, 2013 |
| Principal | Optional Call | ||||||||||||
| Amount | Description | Rating * | Coupon | Maturity | Provisions** | Value | |||||||
| Colorado – 3.0% | |||||||||||||
| $ | 7,500,000 | Colorado, Building Excellent Schools Today, Certificates of Participation, Taxable Build America Bonds, Series 2010E(a) | AA– | 7.017% | 03/15/2031 | 03/15/21 @ 100 | $ | 8,299,350 | |||||
| 2,500,000 | Colorado, Building Excellent Schools Today, Certificates of Participation, Taxable Qualified School Construction, Series 2010-D | AA– | 6.817% | 03/15/2028 | N/A | 2,965,450 | |||||||
| 11,264,800 | |||||||||||||
| Florida – 4.3% | |||||||||||||
| 10,000,000 | Miami-Dade County, Florida, Transit Sales Surtax Revenue, Taxable Build America Bonds, Series B(a) (k) | AA | 6.910% | 07/01/2039 | 07/01/19 @ 100 | 10,833,000 | |||||||
| 5,000,000 | Orlando, Florida, Community Redevelopment Agency, Taxable Tax Increment Revenue Build America Bonds, Series 2010B(a) (k) | A | 7.784% | 09/01/2040 | 09/01/20 @ 100 | 5,445,100 | |||||||
| 16,278,100 | |||||||||||||
| Georgia – 1.3% | |||||||||||||
| 5,000,000 | Georgia Municipal Association, Inc., Certificates of Participation, DeKalb County Public Schools Project, (AGM)(k) | AA– | 5.210% | 12/01/2022 | N/A | 5,135,900 | |||||||
| Illinois – 12.3% | |||||||||||||
| 5,000,000 | Chicago, Illinois, Board of Education, Unlimited Tax General Obligation Bonds, Dedicated Revenues, Taxable Build America Bonds, Series 2010D(a) (k) | A+ | 6.519% | 12/01/2040 | N/A | 4,549,400 | |||||||
| 5,100,000 | Chicago, Illinois, Second Lien Wastewater Transmission Revenue Project Bonds, Taxable Build America Bonds, Series 2010B(a) (k) | A+ | 6.900% | 01/01/2040 | N/A | 5,713,020 | |||||||
| 2,990,000 | Chicago, Illinois, Second Lien Water Revenue Bonds, Taxable Build America Bonds, Series 2010B(a) | AA– | 6.742% | 11/01/2040 | N/A | 3,315,342 | |||||||
| 5,000,000 | Illinois, General Obligation Bonds, Taxable Build America Bonds, Series 2010-5(a) | A– | 7.350% | 07/01/2035 | N/A | 5,444,600 | |||||||
| 7,140,000 | Northern Illinois Municipal Power Agency, Power Project Taxable Revenue Bonds, Prairie State Project Build America Bonds(a) (k) | A2 | 7.620% | 01/01/2030 | N/A | 8,329,381 | |||||||
| 2,860,000 | Northern Illinois Municipal Power Agency, Power Project Taxable Revenue Bonds, Prairie State Project Build America Bonds(a) (k) | A2 | 7.820% | 01/01/2040 | N/A | 3,445,299 | |||||||
| 4,500,000 | Northern Illinois University, Auxiliary Facilities System Revenue Bonds, Build America Program, Taxable, Series 2010, (AGM)(a) (k) | A2 | 7.947% | 04/01/2035 | 04/01/20 @ 100 | 5,084,235 | |||||||
| 5,000,000 | Northern Illinois University, Auxiliary Facilities System Revenue Bonds, Build America Program, Taxable, Series 2010, (AGM)(a) | A2 | 8.147% | 04/01/2041 | 04/01/20 @ 100 | 5,707,700 | |||||||
| 3,000,000 | Southwestern Illinois, Development Authority, Taxable Local Government, Program Revenue Bonds, Flood Prevention District Council Project, Recovery Zone Economic Development Bonds, Series 2010C(k) | AA | 7.230% | 10/15/2035 | 04/15/20 @ 100 | 3,197,670 | |||||||
| 2,000,000 | Southwestern Illinois, Development Authority, Taxable Local Government, Program Revenue Bonds, Flood Prevention District Project, Build America Bonds, Series 2010-B(a) (k) | AA | 7.030% | 04/15/2032 | 04/15/20 @ 100 | 2,055,460 | |||||||
| 46,842,107 | |||||||||||||
| Indiana – 6.4% | |||||||||||||
| 8,690,000 | Evansville-Vanderburgh Independent School Building Corporation, Unlimited Taxable Ad Valorem Property Tax First Mortgage Bonds, Series 2010E | AA+ | 6.500% | 01/15/2030 | 07/15/20 @ 100 | 9,797,888 | |||||||
| 3,000,000 | Knox County, Indiana, Good Samaritan Hospital Project, Taxable Economic Development Revenue Bonds, Qualified Energy Conservation Bonds - Direct Payment, Series 2012B(k) | A3 | 5.900% | 04/01/2034 | N/A | 2,925,960 | |||||||
| 10,000,000 | Noblesville Multi-School Building Corporation, Hamilton County, Indiana, Taxable Unlimited Ad Valorem Property Tax First Mortgage Bonds, Build America Bonds, Series 2010, (a) | AA+ | 6.500% | 07/15/2030 | 01/15/21 @ 100 | 11,577,700 | |||||||
| 24,301,548 | |||||||||||||
| Louisiana – 2.5% | |||||||||||||
| 8,000,000 | Orleans Parish, School Board of the Parish of Orleans, Louisiana, (AGM)(k) | AA– | 4.400% | 02/01/2021 | N/A | 8,413,040 | |||||||
| 1,055,000 | Tangipahoa Parish Hospital Service District No. 1, Louisiana, Taxable Hospital Revenue Bonds, North Oaks Health System Project, Build America Bonds, Series 2009A, (Assured GTY)(a) | AA+ | 7.200% | 02/01/2042 | 02/01/20 @ 100 | 1,112,107 | |||||||
| 9,525,147 |
| See notes to financial statements. |
10 l GBAB l GUGGENHEIM BUILD AMERICA BONDS MANAGED DURATION TRUST SEMIANNUAL REPORT |
| PORTFOLIO OF INVESTMENTS (Unaudited) continued | November 30, 2013 |
| Principal | Optional Call | ||||||||||||
| Amount | Description | Rating * | Coupon | Maturity | Provisions** | Value | |||||||
| Michigan – 5.1% | |||||||||||||
| $ | 415,000 | Comstock Park Public Schools, Kent County, Michigan, 2011 School Building | |||||||||||
| and Site Bonds, General Obligation - Unlimited Tax, Federally Taxable - Qualified | |||||||||||||
| School Construction Bonds - Direct Payment, Series A, (Q-SBLF)(k) | AA– | 6.300% | 05/01/2026 | 05/01/21 @ 100 | $ | 434,795 | |||||||
| 2,640,000 | Detroit, Michigan, School District, Build America Bonds, (Q-SBLF)(a) (k) | AA– | 7.747% | 05/01/2039 | N/A | 2,753,441 | |||||||
| 5,000,000 | Detroit, Michigan, School District, School Building and Site Bonds, | ||||||||||||
| Unlimited Tax General Obligation Bonds, Taxable Build America Bonds, | |||||||||||||
| Series 2010B, (Q-SBLF)(a) | AA– | 6.845% | 05/01/2040 | 05/01/20 @ 100 | 4,786,100 | ||||||||
| 2,640,000 | Detroit, Michigan, School District, School Building and Site Bonds, | ||||||||||||
| Unlimited Tax General Obligation Bonds, Taxable Qualified School | |||||||||||||
| Construction Bonds, Series 2010A, (Q-SBLF)(k) | AA– | 6.645% | 05/01/2029 | N/A | 2,586,118 | ||||||||
| 3,000,000 | Fraser Public School District, Macomb County, Michigan, General | ||||||||||||
| Obligation Federally Taxable School Construction Bonds, 2011 School | |||||||||||||
| Building and Site Bonds, Series B, (Q-SBLF)(k) | AA– | 6.050% | 05/01/2026 | 05/01/21 @ 100 | 3,138,810 | ||||||||
| 1,000,000 | Oakridge, Michigan, Public Schools, Unlimited Tax General Obligation | ||||||||||||
| Bonds, (Q-SBLF)(k) | AA– | 6.750% | 05/01/2026 | 05/01/20 @ 100 | 1,046,450 | ||||||||
| 2,500,000 | Whitehall District Schools, Muskegon County, Michigan, 2010 School | ||||||||||||
| Building and Site Bonds, General Obligation, Unlimited Tax Bonds, Taxable | |||||||||||||
| Qualified School Construction Bonds, Series A, (Q-SBLF)(k) | AA– | 6.100% | 05/01/2026 | 05/01/20 @ 100 | 2,591,100 | ||||||||
| 2,000,000 | Whitehall District Schools, Muskegon County, Michigan, 2010 School Building | ||||||||||||
| and Site Bonds, General Obligation, Unlimited Tax Bonds, Taxable Qualified | |||||||||||||
| School Construction Bonds, Series A, (Q-SBLF)(k) | AA– | 6.500% | 05/01/2029 | 05/01/20 @ 100 | 2,067,580 | ||||||||
| 19,404,394 | |||||||||||||
| Minnesota – 0.9% | |||||||||||||
| 1,660,000 | St. Paul Housing & Redevelopment Authority, Federally Taxable Revenue Bonds(k) (l) | AA | 7.250% | 02/01/2035 | 02/01/21 @ 100 | 1,741,074 | |||||||
| 1,540,000 | St. Paul Housing & Redevelopment Authority, Federally Taxable Revenue Bonds(k) (l) | AA | 7.500% | 02/01/2040 | 02/01/21 @ 100 | 1,614,536 | |||||||
| 3,355,610 | |||||||||||||
| Mississippi – 1.9% | |||||||||||||
| 5,000,000 | Medical Center Educational Building Corporation, Taxable Build America | ||||||||||||
| Bonds, University of Mississippi Medical Center Facilities Expansion and | |||||||||||||
| Renovation Project, Series 2010A(a) (k) | AA– | 6.842% | 06/01/2035 | 06/01/20 @ 100 | 5,237,700 | ||||||||
| 1,000,000 | Mississippi, Hospital Equipment and Facilities Authority, Taxable Build America | ||||||||||||
| Revenue Bonds, Forrest County General Hospital Project, Series 2010(a) (k) | A2 | 7.265% | 01/01/2032 | 01/01/20 @ 100 | 1,027,250 | ||||||||
| 905,000 | Mississippi, Hospital Equipment and Facilities Authority, Taxable Build America | ||||||||||||
| Revenue Bonds, Forrest County General Hospital Project, Series 2010(a) (k) | A2 | 7.390% | 01/01/2040 | 01/01/20 @ 100 | 922,584 | ||||||||
| 7,187,534 | |||||||||||||
| Nevada – 2.7% | |||||||||||||
| 1,425,000 | Clark County, Nevada, Airport Revenue Bonds, Build America Bonds, | ||||||||||||
| Series B(a) (k) | AA– | 6.881% | 07/01/2042 | 07/01/19 @ 100 | 1,525,349 | ||||||||
| 1,200,000 | Las Vegas Valley Water District, Nevada, Limited Tax General Obligation Water | ||||||||||||
| Bonds, Taxable Build America Bonds, Series 2009A(a) (k) | AA+ | 7.100% | 06/01/2039 | 06/01/19 @ 100 | 1,304,712 | ||||||||
| 1,500,000 | Nevada System of Higher Education University, Revenue Bonds, Build | ||||||||||||
| America Bonds(a) | AA– | 7.600% | 07/01/2030 | 07/01/20 @ 100 | 1,671,120 | ||||||||
| 5,050,000 | Nevada System of Higher Education University, Revenue Bonds, Build | ||||||||||||
| America Bonds(a) | AA– | 7.900% | 07/01/2040 | 07/01/20 @ 100 | 5,661,454 | ||||||||
| 10,162,635 | |||||||||||||
| New Jersey – 6.2% | |||||||||||||
| 8,000,000 | Camden County Improvement Authority, Camden County, New Jersey, Lease | ||||||||||||
| Revenue Bonds, Cooper Medical School of Rowan University Project, Series 2010A(k) | A+ | 7.747% | 07/01/2034 | 07/01/20 @ 100 | 8,437,440 | ||||||||
| 2,000,000 | Camden County Improvement Authority, Camden County, New Jersey, Lease | ||||||||||||
| Revenue Bonds, Cooper Medical School of Rowan University Project, Series 2010A(k) | A+ | 7.847% | 07/01/2035 | 07/01/20 @ 100 | 2,116,060 | ||||||||
| 10,000,000 | New Jersey Turnpike Authority, Turnpike Revenue Bonds, Federally Taxable | ||||||||||||
| Issuer Subsidy, Build America Bonds, Series 2010A(a) | A+ | 7.102% | 01/01/2041 | N/A | 13,060,200 | ||||||||
| 23,613,700 |
| See notes to financial statements. | |
GBAB l GUGGENHEIM BUILD AMERICA BONDS MANAGED DURATION TRUST SEMIANNUAL REPORT l 11 |
| PORTFOLIO OF INVESTMENTS (Unaudited) continued | November 30, 2013 |
| Principal | Optional Call | ||||||||||||
| Amount | Description | Rating * | Coupon | Maturity | Provisions** | Value | |||||||
| New York – 5.8% | |||||||||||||
| $ | 5,000,000 | Metropolitan Transportation Authority, New York, Transportation Revenue | |||||||||||
| Bonds, Taxable Build America Bonds, Series 2010E(a) | A | 7.134% | 11/15/2030 | 11/15/20 @ 100 | $ | 5,506,700 | |||||||
| 5,000,000 | Metropolitan Transportation Authority, New York, Transportation Revenue | ||||||||||||
| Bonds, Taxable Build America Bonds, Series 2010B-1(a) | A | 6.548% | 11/15/2031 | N/A | 5,757,150 | ||||||||
| 10,000,000 | Westchester County Health Care Corporation, Revenue Bonds, Taxable Build | ||||||||||||
| America Bonds, Series 2010(a) (k) (l) | BBB | 8.572% | 11/01/2040 | N/A | 10,994,400 | ||||||||
| 22,258,250 | |||||||||||||
| Ohio – 5.2% | |||||||||||||
| 5,000,000 | American Municipal Power, Inc., Combined Hydroelectric Projects Revenue | ||||||||||||
| Bonds, New Clean Renewable Energy Bonds, Series 2010C(k) | A | 7.334% | 02/15/2028 | N/A | 5,965,050 | ||||||||
| 1,950,000 | Cuyahoga County, Ohio, Hospital Revenue Bonds, The Metrohealth System, | ||||||||||||
| Build America Bonds, Taxable, Series 2009B(a) (k) | A– | 8.223% | 02/15/2040 | N/A | 2,187,179 | ||||||||
| 2,500,000 | Madison Local School District, Richland County, Ohio, School Improvement, | ||||||||||||
| Taxable Build America Bonds, Series 2010A,(a) (k) | AA | 6.900% | 12/01/2034 | 12/01/20 @ 100 | 2,585,550 | ||||||||
| 2,500,000 | Madison Local School District, Richland County, Ohio, School Improvement, | ||||||||||||
| Taxable Build America Bonds, Series 2010A,(a) (k) | AA | 7.150% | 12/01/2039 | 12/01/20 @ 100 | 2,580,550 | ||||||||
| 2,500,000 | Madison Local School District, Richland County, Ohio, School Improvement, | ||||||||||||
| Taxable Build America Bonds, Series 2010A,(a) (k) | AA | 7.300% | 12/01/2043 | 12/01/20 @ 100 | 2,580,125 | ||||||||
| 2,500,000 | Madison Local School District, Richland County, Ohio, School Improvement, | ||||||||||||
| Taxable Qualified School Construction Bonds, Series 2010B(k) | AA | 6.650% | 12/01/2029 | 12/01/20 @ 100 | 2,665,750 | ||||||||
| 1,230,000 | Toronto City School District, Ohio, Qualified School Construction Bonds | ||||||||||||
| General Obligation Bonds(k) | AA | 7.000% | 12/01/2028 | 12/01/20 @ 100 | 1,291,721 | ||||||||
| 19,855,925 | |||||||||||||
| Pennsylvania – 4.2% | |||||||||||||
| 4,865,000 | Lebanon, Pennsylvania, Sewer Revenue Bonds, Taxable Build America Bonds, | ||||||||||||
| Series B of 2010(a) (k) | A+ | 7.140% | 12/15/2035 | 06/15/20 @ 100 | 5,126,542 | ||||||||
| 7,500,000 | Pittsburgh, Pennsylvania, School District, Taxable Qualified School Construction | ||||||||||||
| Bonds, Series D(k) | A | 6.850% | 09/01/2029 | N/A | 8,497,800 | ||||||||
| 2,500,000 | School District of Philadelphia, Pennsylvania, General Obligation Bonds, Series | ||||||||||||
| 2011A, Qualified School Construction Bonds - (Federally Taxable - Direct Subsidy)(k) | A+ | 5.995% | 09/01/2030 | N/A | 2,491,725 | ||||||||
| 16,116,067 | |||||||||||||
| South Carolina – 1.4% | |||||||||||||
| 5,000,000 | Horry County, South Carolina, Taxable Airport Revenue Bonds, Recovery Zone | ||||||||||||
| Economic Development Bonds, Series 2010B(k) (l) | A– | 7.328% | 07/01/2040 | N/A | 5,337,600 | ||||||||
| South Dakota – 1.0% | |||||||||||||
| 3,490,000 | Pierre, South Dakota, Taxable Electric Revenue Bonds, Recovery Zone Economic | ||||||||||||
| Development Bonds, Series 2010C(k) | A2 | 7.500% | 12/15/2040 | 12/15/19 @ 100 | 3,684,917 | ||||||||
| Texas – 6.1% | |||||||||||||
| 10,000,000 | Dallas, Texas, Convention Center Hotel Development Corporation, Hotel | ||||||||||||
| Revenue Bonds, Taxable Build America Bonds, Series 2009B(a) (k) | A+ | 7.088% | 01/01/2042 | N/A | 11,564,500 | ||||||||
| 10,000,000 | El Paso, Texas, Combination Tax and Revenue Certification of Obligation, | ||||||||||||
| Taxable Build America Bonds, Series 2010B(a) | AA | 6.700% | 08/15/2036 | 08/15/20 @ 100 | 11,523,800 | ||||||||
| 23,088,300 | |||||||||||||
| Vermont – 2.7% | |||||||||||||
| 2,155,000 | Vermont State Colleges, Revenue Bonds, Taxable Build America Bonds, | ||||||||||||
| Series 2010B,(a) (k) | A+ | 6.101% | 07/01/2025 | 07/01/20 @ 100 | 2,236,631 | ||||||||
| 7,500,000 | Vermont State Colleges, Revenue Bonds, Taxable Build America Bonds, | ||||||||||||
| Series 2010B(a) (k) | A+ | 7.211% | 07/01/2040 | 07/01/20 @ 100 | 8,000,475 | ||||||||
| 10,237,106 |
| See notes to financial statements. |
12 l GBAB l GUGGENHEIM BUILD AMERICA BONDS MANAGED DURATION TRUST SEMIANNUAL REPORT |
| PORTFOLIO OF INVESTMENTS (Unaudited) continued | November 30, 2013 |
| Principal | Optional Call | ||||||||||||
| Amount | Description | Rating * | Coupon | Maturity | Provisions** | Value | |||||||
| Washington – 9.5% | |||||||||||||
| $ | 5,000,000 | Anacortes, Washington, Utility System Improvement Revenue Bonds, Build | |||||||||||
| America Bonds, Series 2010B(a) (k) | AA– | 6.479% | 12/01/2030 | 12/01/20 @ 100 | $ | 5,308,700 | |||||||
| 2,000,000 | Auburn, Washington, Utility System Revenue Bonds, Taxable Build America | ||||||||||||
| Bonds, Series 2010B(a) (k) | AA | 6.396% | 12/01/2030 | 12/01/20 @ 100 | 2,156,140 | ||||||||
| 5,000,000 | Central Washington University, System Revenue Bonds, 2010, Taxable Build | ||||||||||||
| America Bonds, Series B(a) (k) | A1 | 6.500% | 05/01/2030 | N/A | 5,221,350 | ||||||||
| 5,800,000 | Public Hospital District No. 1, King County, Washington, Valley Medical | ||||||||||||
| Center, Hospital Facilities Revenue Bonds, Series 2010B(k) | BBB+ | 8.000% | 06/15/2040 | 06/15/20 @ 100 | 6,184,424 | ||||||||
| 5,000,000 | Washington State Convention Center Public Facilities District, Lodging Tax | ||||||||||||
| Bonds, Taxable Build America Bonds, Series 2010B(a) | A+ | 6.790% | 07/01/2040 | N/A | 5,432,300 | ||||||||
| 3,325,000 | Washington State University, Housing and Dining System Revenue Bonds, | ||||||||||||
| Taxable Build America Bonds, Series 2010B(a) (k) | A+ | 7.099% | 04/01/2032 | N/A | 3,829,935 | ||||||||
| 6,675,000 | Washington State University, Housing and Dining System Revenue Bonds, | ||||||||||||
| Taxable Build America Bonds, Series 2010B(a) (k) | A+ | 7.399% | 04/01/2041 | N/A | 7,829,708 | ||||||||
| 35,962,557 | |||||||||||||
| West Virginia – 3.3% | |||||||||||||
| 10,000,000 | State of West Virginia, Higher Education Policy Commission, Revenue Bonds, | ||||||||||||
| Federally Taxable Build America Bonds 2010, Series B(a) | A+ | 7.650% | 04/01/2040 | N/A | 12,525,300 | ||||||||
| Total Municipal Bonds – 111.4% | |||||||||||||
| (Cost $383,968,462) | 423,258,337 | ||||||||||||
| Corporate Bonds – 6.7% | |||||||||||||
| Advertising – 0.1% | |||||||||||||
| 375,000 | Sitel, LLC / Sitel Finance Corp.(b) (k) | B | 11.000% | 08/01/2017 | 08/01/14 @ 106 | 404,062 | |||||||
| Airlines – 1.0% | |||||||||||||
| 112,939 | Atlas Air 1999-1 Pass-Through Trust, Series 1999-1, Class A-1(k) (l) | NR | 7.200% | 1/2/19 | N/A | 120,280 | |||||||
| 1,641,422 | Atlas Air 2000-1 Class A Pass Through Trust, Series 2000-1, Class A(k) (l) | NR | 8.707% | 1/2/19 | N/A | 1,748,114 | |||||||
| 2,000,000 | Delta Air Lines 2011-1 Class B Pass-Through Trust, Series 2011-1, Class B(k) | BB+ | 7.125% | 10/15/14 | N/A | 2,040,000 | |||||||
| 3,908,394 | |||||||||||||
| Banks – 0.5% | |||||||||||||
| 1,700,000 | Barclays PLC (United Kingdom)(d) (h) | B+ | 8.250% | – | 12/15/18 @ 100 | 1,754,400 | |||||||
| Chemicals – 0.1% | |||||||||||||
| 350,000 | TPC Group, Inc.(b) (k) | B | 8.750% | 12/15/2020 | 12/15/16 @ 104 | 369,688 | |||||||
| Coal – 0.1% | |||||||||||||
| 200,000 | Penn Virginia Resource Partners, LP / Penn Virginia Resource Finance Corp. II(k) | B– | 8.375% | 06/01/2020 | 06/01/16 @ 104 | 221,000 | |||||||
| Commercial Services – 0.1% | |||||||||||||
| 200,000 | ADT Corp.(b) | BB– | 6.250% | 10/15/2021 | N/A | 208,750 | |||||||
| 2,000 | RR Donnelley & Sons Co. | BB– | 6.500% | 11/15/2023 | N/A | 1,995 | |||||||
| 60,000 | ServiceMaster Co. | CCC+ | 7.000% | 08/15/2020 | 08/15/15 @ 105 | 57,375 | |||||||
| 268,120 | |||||||||||||
| Distribution & Wholesale – 0.2% | |||||||||||||
| 300,000 | INTCOMEX, Inc.(k) | CCC | 13.250% | 12/15/2014 | 01/03/14 @ 100 | 291,000 | |||||||
| Diversified Financial Services – 0.1% | |||||||||||||
| 125,000 | Jefferies Finance, LLC / JFIN Co-Issuer Corp.(b) (k) | B+ | 7.375% | 04/01/2020 | 04/01/16 @ 106 | 129,531 | |||||||
| 200,000 | Jefferies Group, Inc.(k) | BBB | 6.875% | 04/15/2021 | N/A | 226,000 | |||||||
| 60,000 | KCG Holdings, Inc.(b) | B | 8.250% | 06/15/2018 | 06/15/15 @ 104 | 61,725 | |||||||
| 31,200 | LCP Dakota Fund, Series VI-P(k) (l) | NR | 10.000% | 08/17/2015 | N/A | 31,200 | |||||||
| 140,000 | Nationstar Mortgage, LLC / Nationstar Capital Corp.(k) | B+ | 9.625% | 05/01/2019 | 05/01/15 @ 107 | 157,500 | |||||||
| 605,956 |
| See notes to financial statements. | |
GBAB l GUGGENHEIM BUILD AMERICA BONDS MANAGED DURATION TRUST SEMIANNUAL REPORT l 13 |
| PORTFOLIO OF INVESTMENTS (Unaudited) continued | November 30, 2013 |
| Principal | Optional Call | ||||||||||||
| Amount | Description | Rating * | Coupon | Maturity | Provisions** | Value | |||||||
| Engineering & Construction – 0.6% | |||||||||||||
| $ | 2,246,576 | Alion Science and Technology Corp.(c) | B– | 12.000% | 11/01/2014 | 04/01/14 @ 100 | $ | 2,297,124 | |||||
| Entertainment – 0.5% | |||||||||||||
| 1,600,000 | Diamond Resorts Corp.(k) | B– | 12.000% | 08/15/2018 | 08/15/14 @ 106 | 1,776,000 | |||||||
| Food – 0.0%*** | |||||||||||||
| 100,000 | KeHE Distributors, LLC / KeHE Finance Corp.(b) | B | 7.625% | 08/15/2021 | 08/15/17 @ 104 | 104,500 | |||||||
| Health Care Services – 0.0%*** | |||||||||||||
| 150,000 | Symbion, Inc.(k) | B | 8.000% | 06/15/2016 | 06/15/14 @ 104 | 159,187 | |||||||
| Healthcare-Services – 0.4% | |||||||||||||
| 1,500,000 | Tufts Medical Center, Inc. | BBB | 7.000% | 01/01/2038 | N/A | 1,450,583 | |||||||
| Internet – 0.8% | |||||||||||||
| 3,000,000 | GXS Worldwide, Inc.(k) | B | 9.750% | 06/15/2015 | 06/15/14 @ 100 | 3,112,800 | |||||||
| Leisure Time – 0.0% | |||||||||||||
| 75,000 | Sabre, Inc.(b) (k) | B | 8.500% | 05/15/2019 | 05/15/15 @ 106 | 82,969 | |||||||
| Machinery-Diversified – 0.1% | |||||||||||||
| 250,000 | Tempel Steel Co.(b) (k) | B– | 12.000% | 08/15/2016 | 08/15/14 @ 106 | 241,250 | |||||||
| Media – 0.0%*** | |||||||||||||
| 485,000 | Baker & Taylor Acquisitions Corp.(b) (k) | CCC | 15.000% | 04/01/2017 | 10/01/14 @ 108 | 413,462 | |||||||
| 200,000 | Expo Event Transco, Inc.(b) | B– | 9.000% | 06/15/2021 | 06/15/16 @ 105 | 202,500 | |||||||
| 615,962 | |||||||||||||
| Mining – 0.1% | |||||||||||||
| 400,000 | Midwest Vanadium Pty. Ltd. (Australia)(b) (k) | CCC | 11.500% | 02/15/2018 | 02/15/15 @ 106 | 332,000 | |||||||
| 150,000 | Mirabela Nickel Ltd. (Australia)(b) (k) (l) (m) | D | 8.750% | 04/15/2018 | 04/15/15 @ 104 | 36,000 | |||||||
| 368,000 | |||||||||||||
| Oil & Gas – 0.3% | |||||||||||||
| 750,000 | Midstates Petroleum Co., Inc. / Midstates Petroleum Co., LLC(k) | B– | 10.750% | 10/01/2020 | 10/01/16 @ 105 | 817,500 | |||||||
| 200,000 | Summit Midstream Holdings, LLC / Summit Midstream Finance Corp.(b) | B | 7.500% | 07/01/2021 | 07/01/16 @ 106 | 209,000 | |||||||
| 1,026,500 | |||||||||||||
| Oil & Gas Services – 0.1% | |||||||||||||
| 200,000 | Exterran Holdings, Inc.(k) | BB | 7.250% | 12/01/2018 | 12/01/14 @ 104 | 211,500 | |||||||
| Packaging & Containers – 0.1% | |||||||||||||
| 300,000 | Pretium Packaging, LLC / Pretium Finance, Inc.(k) | B– | 11.500% | 04/01/2016 | 04/01/14 @ 106 | 320,250 | |||||||
| Pharmaceuticals – 0.0%*** | |||||||||||||
| 180,000 | Valeant Pharmaceuticals International (Canada)(b) | B | 6.750% | 08/15/2018 | 08/15/15 @ 105 | 198,225 | |||||||
| Real Estate Investment Trusts – 0.2% | |||||||||||||
| 750,000 | Columbia Property Trust Operating Partnership, LP(k) | BBB– | 5.875% | 04/01/2018 | N/A | 788,944 | |||||||
| Retail – 0.4% | |||||||||||||
| 150,000 | Checkers Drive-In Restaurants, Inc.(b) (k) | B– | 11.000% | 12/01/2017 | 06/01/15 @ 108 | 166,875 | |||||||
| 980,000 | GRD Holdings III Corp.(b) (k) | B | 10.750% | 06/01/2019 | 06/01/15 @ 108 | 1,068,200 | |||||||
| 125,000 | Wok Acquisition Corp.(b) (k) | CCC | 10.250% | 06/30/2020 | 06/30/16 @ 105 | 135,000 | |||||||
| 1,370,075 | |||||||||||||
| Software – 0.2% | |||||||||||||
| 290,000 | Aspect Software, Inc.(k) | CCC+ | 10.625% | 05/15/2017 | 05/15/14 @ 105 | 296,525 | |||||||
| 200,000 | Eagle Midco, Inc.(b) (f) | CCC+ | 9.000% | 06/15/2018 | 12/15/14 @ 102 | 205,000 | |||||||
| 400,000 | Infor US, Inc.(k) | B– | 11.500% | 07/15/2018 | 07/15/15 @ 106 | 462,000 | |||||||
| 963,525 |
| See notes to financial statements. |
14 l GBAB l GUGGENHEIM BUILD AMERICA BONDS MANAGED DURATION TRUST SEMIANNUAL REPORT |
| PORTFOLIO OF INVESTMENTS (Unaudited) continued | November 30, 2013 |
| Principal | Optional Call | ||||||||||||
| Amount | Description | Rating * | Coupon | Maturity | Provisions** | Value | |||||||
| Textiles – 0.0%*** | |||||||||||||
| $ | 140,000 | Empire Today, LLC / Empire Today Finance Corp.(b) | B– | 11.375% | 02/01/2017 | 02/01/15 @ 103 | $ | 138,950 | |||||
| Transportation – 0.7% | |||||||||||||
| 39,340 | Atlas Air, Inc.(b) (k) (l) | NR | 8.707% | 1/2/19 | N/A | 41,897 | |||||||
| 985,000 | CEVA Group PLC (United Kingdom)(b) (k) | CCC+ | 8.375% | 12/01/2017 | 12/01/14 @ 104 | 1,034,250 | |||||||
| 1,385,000 | Marquette Transportation Co., LLC / Marquette Transportation Finance Corp.(k) | B– | 10.875% | 01/15/2017 | 01/15/14 @ 105 | 1,468,100 | |||||||
| 2,544,247 | |||||||||||||
| Total Corporate Bonds – 6.7% | |||||||||||||
| (Cost $24,662,108) | 25,593,211 | ||||||||||||
| Asset Backed Securities – 5.6% | |||||||||||||
| Automobile – 0.0%*** | |||||||||||||
| 23,331 | Bush Truck Leasing, LLC, Series 2011-AA, Class C(b) (k) | NR | 5.000% | 09/25/2018 | N/A | 23,219 | |||||||
| Collateralized Debt Obligation – 1.6% | |||||||||||||
| 178,600 | Cedarwoods, Series 2006-1A, Class A1(i) | AAA | 0.435% | 07/25/2051 | N/A | 144,410 | |||||||
| 73,041 | Diversified Asset Securitization Holdings II LP, Series 1X, Class A1L | ||||||||||||
| (Cayman Islands)(d) | BBB+ | 0.744% | 09/15/2035 | N/A | 69,753 | ||||||||
| 15,750 | G-Star 2003-3 Ltd., Series 2003-A, Class A1 (Cayman Islands)(b) (d) (k) | BBB– | 0.816% | 03/13/2038 | N/A | 15,625 | |||||||
| 159,679 | Highland Park CDO I Ltd., Series 2006-1A, Class A1 (Cayman Islands)(b) (d) (k) | B+ | 0.568% | 11/25/2051 | N/A | 138,068 | |||||||
| 66,396 | Independence I CDO Ltd., Series 1A, Class A (Cayman Islands)(b) (d) (k) | BB+ | 0.667% | 12/30/2030 | N/A | 65,791 | |||||||
| 1,000,000 | N-Star REL CDO VIII Ltd.(b) (d) (k) | B1 | 0.529% | 02/01/2041 | N/A | 774,763 | |||||||
| 4,110,636 | Putnam Structured Product, Series 2003-1A, Class A1LB(b) (d) (k) | CCC | 0.617% | 10/15/2038 | N/A | 3,818,954 | |||||||
| 573,308 | Putnam Structured Product CDO, Series 2002-1A, Class A2 (Cayman | ||||||||||||
| Islands)(b) (d) (k) | CCC+ | 0.849% | 01/10/2038 | N/A | 504,542 | ||||||||
| 754,647 | SRERS Funding Ltd., Series 2011-RS, Class A1B1 (Cayman Islands)(b) (d) | Baa3 | 0.418% | 05/09/2046 | N/A | 678,982 | |||||||
| 6,210,888 | |||||||||||||
| Collateralized Loan Obligation – 2.1% | |||||||||||||
| 250,000 | Ares XXV CLO Ltd., Series 2012-3A (Cayman Islands)(b) (g) (k) | NR | 0.000% | 01/17/2024 | N/A | 202,050 | |||||||
| 250,000 | ARES XXVI CLO Ltd., Series 2013-1A (Cayman Islands)(b) (g) (i) (k) | NR | 0.000% | 04/15/2025 | N/A | 195,000 | |||||||
| 250,000 | Atlas Senior Loan Fund II Ltd., Series 2012-2A (Cayman Islands)(b) (g) (i) (k) | NR | 0.000% | 01/30/2024 | N/A | 223,844 | |||||||
| 100,000 | BlackRock Senior Income Series Corp., Series 2004-1A (Cayman Islands)(b) (g) | NR | 0.000% | 09/15/2016 | N/A | 9,750 | |||||||
| 250,000 | Carlyle Global Market Strategies CLO 2012-3 Ltd., Series 2012-3A (Cayman | ||||||||||||
| Islands)(b) (g) (k) | NR | 0.000% | 10/14/2024 | N/A | 240,850 | ||||||||
| 250,000 | Cerberus Offshore Levered I LP, Series 2012-1A, Class C (Cayman | ||||||||||||
| Islands)(b) (d) (k) | A3 | 6.243% | 11/30/2018 | N/A | 249,520 | ||||||||
| 2,000,000 | Churchill Financial Cayman Ltd., Series 2007-1A, Class C (Cayman | ||||||||||||
| Islands)(b) (d) (k) | A+ | 1.494% | 07/10/2019 | N/A | 1,842,943 | ||||||||
| 1,000,000 | Churchill Financial Cayman Ltd., Series 2007-1A, Class D1 (Cayman | ||||||||||||
| Islands)(b) (d) (k) | BBB+ | 2.844% | 07/10/2019 | N/A | 904,531 | ||||||||
| 1,000,000 | Churchill Financial Cayman Ltd., Series 2007-1A, Class D2 (Cayman | ||||||||||||
| Islands)(b) (d) (k) | BBB+ | 8.370% | 07/10/2019 | N/A | 1,008,329 | ||||||||
| 300,000 | Cratos CLO Ltd., Series 2007-1A, Class C (Cayman Islands)(b) (d) (k) | AA+ | 1.338% | 05/19/2021 | N/A | 284,244 | |||||||
| 250,000 | Divcore CLO Ltd., Series 2013-1A, Class B(d) | Baa3 | 4.100% | 11/15/2032 | N/A | 249,081 | |||||||
| 550,000 | Eastland CLO Ltd., Series 2007-1A, Class A2B (Cayman Islands)(b) (d) (k) | AA+ | 0.572% | 05/01/2022 | N/A | 506,420 | |||||||
| 215,919 | Emporia Preferred Funding I Corp., Series 2005-1A, Class C (Cayman | ||||||||||||
| Islands)(b) (d) (k) | AAA | 1.194% | 10/12/2018 | N/A | 214,645 | ||||||||
| 250,000 | Finn Square CLO Ltd., Series 2012-1A (Cayman Islands)(b) (g) | NR | 0.000% | 12/24/23 | N/A | 232,850 | |||||||
| 250,000 | Great Lakes CLO 2012-1 Ltd., Series 2012-1A (Cayman Islands)(b) (g) (k) | NR | 0.000% | 01/15/2023 | N/A | 231,693 | |||||||
| 200,000 | Katonah IX CLO Ltd., Series 2006-9A, Class A3L (Cayman Islands)(b) (d) (k) | A+ | 0.958% | 01/25/2019 | N/A | 186,264 | |||||||
| 500,000 | KKR CLO Trust, Series 2007-1A, Class D (Cayman Islands)(b) (d) (k) | A | 2.491% | 05/15/2021 | N/A | 479,030 |
| See notes to financial statements. | |
GBAB l GUGGENHEIM BUILD AMERICA BONDS MANAGED DURATION TRUST SEMIANNUAL REPORT l 15 |
| PORTFOLIO OF INVESTMENTS (Unaudited) continued | November 30, 2013 |
| Principal | Optional Call | ||||||||||||
| Amount | Description | Rating * | Coupon | Maturity | Provisions** | Value | |||||||
| Collateralized Loan Obligation (continued) | |||||||||||||
| $ | 250,000 | Newstar Commercial Loan Funding 2013-1, LLC(b) (d) | BBB | 4.951% | 09/20/2023 | N/A | $ | 250,017 | |||||
| 200,000 | Summit Lake CLO Ltd., Series 2005-1A, Class C1A(b) (g) | NR | 0.000% | 02/24/2018 | N/A | 69,798 | |||||||
| 250,000 | T2 Income Fund CLO Ltd., Series 2007-1A, Class D (Cayman | ||||||||||||
| Islands)(b) (d) (k) | A+ | 2.994% | 07/15/2019 | N/A | 240,271 | ||||||||
| 7,821,130 | |||||||||||||
| Commercial Receivables – 0.0%*** | |||||||||||||
| 3,905 | Leaf Receivables Funding 5, LLC, Series 2010-4, Class D(b) (k) | NR | 5.000% | 01/20/2019 | 12/20/13 @ 100 | 3,864 | |||||||
| Credit Card – 0.1% | |||||||||||||
| 245,154 | Credit Card Pass-Through Trust 2012-BIZ, Series 2012-Biz A(b) (g) (h) (k) | CCC | 0.000% | – | N/A | 200,313 | |||||||
| Insurance – 0.0%*** | |||||||||||||
| 80,650 | Insurance Note Capital VII, Series 2005-1R1A(b) (d) (k) | A– | 0.489% | 06/09/2033 | N/A | 75,005 | |||||||
| Media – 0.9% | |||||||||||||
| 1,300,000 | Adams Outdoor Advertising, LP, Series 2010-1, Class B(b) (k) | BBB | 8.836% | 12/20/2040 | N/A | 1,415,394 | |||||||
| 1,825,000 | Adams Outdoor Advertising, LP, Series 2010-1, Class C(b) (k) | BB | 10.756% | 12/20/2040 | N/A | 2,031,530 | |||||||
| 3,446,924 | |||||||||||||
| Other ABS – 0.5% | |||||||||||||
| 262,180 | Aircraft Certificate Owner Trust, Series 2003-1A, Class D(b) (k) (l) | BBB | 6.455% | 09/20/2022 | N/A | 263,285 | |||||||
| 322,249 | Bristol Bay Funding Ltd., Series 2004-1A, Class A2(b) (d) | AA+ | 1.242% | 02/01/2016 | N/A | 319,027 | |||||||
| 1,097,389 | Gramercy Real Estate CDO 2007-1 Ltd., Class A1(b) (d) | B | 0.521% | 08/15/2056 | N/A | 866,619 | |||||||
| 667,294 | West Coast Funding Ltd., Series 2006-1A, Class A1A(b) (d) | Caa3 | 0.389% | 11/02/2041 | N/A | 643,581 | |||||||
| 2,092,512 | |||||||||||||
| Transportation – 0.4% | |||||||||||||
| 11,885 | Castle Trust, Series 2003-1AW, Class A1(b) (d) (k) | AA | 0.917% | 05/15/2027 | N/A | 10,815 | |||||||
| 159,103 | Raspro Trust, Series 2005-1A, Class G(b) (d) (k) | A | 0.645% | 03/23/2024 | N/A | 147,965 | |||||||
| 1,278,781 | Vega Containervessel PLC, Series 2006-1A, Class A(b) (k) | Ba3 | 5.562% | 02/10/2021 | N/A | 1,241,652 | |||||||
| 1,400,432 | |||||||||||||
| Total Asset Backed Securities – 5.6% | |||||||||||||
| (Cost $20,268,959) | 21,274,287 | ||||||||||||
| Collateralized Mortgage Obligations– 0.7% | |||||||||||||
| Commercial Mortgage Backed Security – Traditional – 0.5% | |||||||||||||
| 2,000,000 | GS Mortgage Securities Corp. II Trust 2007-EOP, Series 2007-EOP, | ||||||||||||
| Class H(b) (d) (k) | BBB– | 3.300% | 03/06/2020 | N/A | 2,005,000 | ||||||||
| Residential Mortgage Backed Security – 0.2% | |||||||||||||
| 781,905 | Nomura Resecuritization Trust, Series 2012-1R, Class A(b) (d) (k) | NR | 0.604% | 08/27/2047 | N/A | 719,353 | |||||||
| Total Collateralized Mortgage Obligations – 0.7% | |||||||||||||
| (Cost $2,557,904) | 2,724,353 | ||||||||||||
| Term Loans – 4.9%(e) | |||||||||||||
| Aerospace & Defense – 0.2% | |||||||||||||
| 900,000 | Nana Development | B+ | 8.000% | 03/15/2018 | N/A | 913,500 | |||||||
| Automotive – 0.1% | |||||||||||||
| 40,000 | Fleetpride | CCC+ | 9.250% | 05/15/2020 | N/A | 38,200 | |||||||
| 236,111 | Navistar, Inc. | B | 5.750% | 08/17/2017 | N/A | 240,391 | |||||||
| 278,591 | |||||||||||||
| �� | Consumer Products – 0.1% | ||||||||||||
| 330,469 | Targus Group International, Inc. | B | 12.000% | 05/24/2016 | N/A | 285,135 | |||||||
| 85,583 | Totes Isotoner Corp. | B | 7.252% | 07/07/2017 | N/A | 86,118 | |||||||
| 371,253 |
| See notes to financial statements. |
16 l GBAB l GUGGENHEIM BUILD AMERICA BONDS MANAGED DURATION TRUST SEMIANNUAL REPORT |
| PORTFOLIO OF INVESTMENTS (Unaudited) continued | November 30, 2013 |
| Principal | Optional Call | ||||||||||||
| Amount | Description | Rating * | Coupon | Maturity | Provisions** | Value | |||||||
| Consumer Services – 0.4% | |||||||||||||
| $ | 96,250 | Edmentum, Inc. | BB– | 6.000% | 05/17/2018 | N/A | $ | 96,906 | |||||
| 447,124 | Endurance International Group | B | 5.000% | 11/09/2019 | N/A | 450,198 | |||||||
| 93,750 | Nab Holdings First Lien | BB+ | 7.000% | 04/24/2018 | N/A | 94,395 | |||||||
| 214,915 | Patheon, Inc. - 1st Lien | B+ | 7.250% | 12/14/2018 | N/A | 217,602 | |||||||
| 182,576 | Sutherland Global Cayman Tranche | BB– | 7.250% | 03/06/2019 | N/A | 183,032 | |||||||
| 404,275 | Sutherland Global U.S. Tranche | B | 7.250% | 03/06/2019 | N/A | 405,286 | |||||||
| 1,447,419 | |||||||||||||
| Diversified Manufacturing – 0.1% | |||||||||||||
| 415,800 | CPM Acquisition Corp. | B+ | 6.250% | 08/29/2017 | N/A | 417,879 | |||||||
| Electric – 0.0%*** | |||||||||||||
| 98,750 | Astoria Generating Co. Acquisitions | B | 8.500% | 10/26/2017 | N/A | 101,713 | |||||||
| Energy-Alternate Sources – 0.1% | |||||||||||||
| 150,000 | Atlas Energy, LP | B | 6.500% | 07/31/2019 | N/A | 153,750 | |||||||
| Entertainment – 0.0%*** | |||||||||||||
| 73,800 | CKX Entertainment, Inc.(l) | B+ | 9.000% | 06/21/2017 | N/A | 67,158 | |||||||
| Food & Beverage – 0.0%*** | |||||||||||||
| 35,000 | Hostess Brands, Inc. | B– | 6.750% | 04/09/2020 | N/A | 36,116 | |||||||
| Health Care – 0.4% | |||||||||||||
| 249,375 | Apria Healthcare | BB– | 6.750% | 04/06/2020 | N/A | 250,829 | |||||||
| 1,120,066 | Merge Healthcare Inc. (l) | CCC | 6.000% | 04/23/2019 | N/A | 1,075,263 | |||||||
| 1,326,092 | |||||||||||||
| Insurance – 0.1% | |||||||||||||
| 100,000 | Cetera Financial Group, Lien 1 | B+ | 6.500% | 08/07/2019 | N/A | 101,000 | |||||||
| 222,828 | Confie Seguros | B– | 6.500% | 11/09/2018 | N/A | 223,664 | |||||||
| 155,909 | Cunningham | B– | 9.250% | 06/10/2020 | N/A | 155,714 | |||||||
| 480,378 | |||||||||||||
| Media – 0.1% | |||||||||||||
| 119,372 | Cengage Learning Acquisitions, Inc. (Thomson Learning) | D | 0.000% | 07/03/2014 | N/A | 90,325 | |||||||
| 109,446 | Cengage Learning Acquisitions, Inc. (Thomson Learning) | D | 0.000% | 07/31/2017 | N/A | 82,996 | |||||||
| 223,125 | Mitel US Holdings First Lien | B+ | 7.000% | 02/27/2019 | N/A | 223,125 | |||||||
| 396,446 | |||||||||||||
| Oil Field Services – 0.3% | |||||||||||||
| 225,205 | Equipower Resources Holdings, LLC | BB | 4.250% | 12/21/2018 | N/A | 226,682 | |||||||
| 399,000 | Ocean RIG ASA | B+ | 5.500% | 07/15/2016 | N/A | 404,654 | |||||||
| 99,500 | Rice Energy | CCC+ | 8.500% | 10/25/2018 | N/A | 101,739 | |||||||
| 198,500 | Shelf Drilling Holdings Ltd. | B+ | 6.250% | 05/31/2018 | N/A | 199,492 | |||||||
| 195,500 | Varel International Energy Funding Corp. | B | 9.250% | 07/17/2017 | N/A | 200,388 | |||||||
| 1,132,955 | |||||||||||||
| Other Finance – 0.4% | |||||||||||||
| 917,986 | Ceridian Corp. | B– | 4.416% | 05/09/2017 | N/A | 923,838 | |||||||
| 199,000 | First Advantage | B | 6.250% | 02/28/2019 | N/A | 199,373 | |||||||
| 62,617 | Knight/Getco, 1st Lien | BB– | 5.750% | 11/30/2017 | N/A | 63,008 | |||||||
| 1,186,219 | |||||||||||||
| Other Financial Institution – 0.5% | |||||||||||||
| 2,000,000 | AP Alternative Assets LP (l) | BB | 6.677% | 12/21/2015 | N/A | 2,005,000 |
| See notes to financial statements. | |
GBAB l GUGGENHEIM BUILD AMERICA BONDS MANAGED DURATION TRUST SEMIANNUAL REPORT l 17 |
| PORTFOLIO OF INVESTMENTS (Unaudited) continued | November 30, 2013 |
| Principal | Optional Call | ||||||||||||
| Amount | Description | Rating * | Coupon | Maturity | Provisions** | Value | |||||||
| Other Industrials – 0.1% | |||||||||||||
| $ | 99,500 | Hunter Fan Company 1st Lien | B+ | 6.500% | 12/20/2017 | N/A | $ | 99,707 | |||||
| 248,750 | Sirva Worldwide, Inc. | B | 7.500% | 03/27/2019 | N/A | 254,347 | |||||||
| 354,054 | |||||||||||||
| Retail – 0.3% | |||||||||||||
| 81,233 | Container Store, Lien 1 | B | 4.250% | 04/06/2019 | N/A | 81,672 | |||||||
| 987,500 | HD Supply | B+ | 4.500% | 10/12/2017 | N/A | 995,030 | |||||||
| 1,076,702 | |||||||||||||
| Technology – 1.0% | |||||||||||||
| 99,250 | Ascensus, Inc. | B | 8.000% | 12/21/2018 | N/A | 101,235 | |||||||
| 297,500 | Aspect Software, Inc. | B | 7.000% | 05/07/2016 | N/A | 298,763 | |||||||
| 650,000 | Greenway Medical Tech | B+ | 6.000% | 11/04/2020 | N/A | 650,000 | |||||||
| 396,000 | IPC Information Systems, Inc. | B– | 7.750% | 07/31/2017 | N/A | 393,772 | |||||||
| 100,000 | Misys PLC 2nd Lien | CCC+ | 12.000% | 06/12/2019 | N/A | 115,375 | |||||||
| 987,464 | Misys PLC First Lien | B+ | 5.000% | 12/12/2018 | N/A | 994,253 | |||||||
| 1,128,621 | Paradigm, Ltd. - First Lien(l) | B+ | 4.750% | 07/30/2019 | N/A | 1,124,863 | |||||||
| 19,750 | Sophos TLB - Lien 1 | B+ | 6.500% | 05/10/2019 | N/A | 19,849 | |||||||
| 3,698,110 | |||||||||||||
| Transportation – 0.3% | |||||||||||||
| 577,500 | Evergreen Tank Solutions, Inc. | B– | 9.500% | 09/28/2018 | N/A | 576,056 | |||||||
| 119,273 | Global Aviation Holdings, Inc.(i) (l) (m) | NR | 10.000% | 07/13/2017 | N/A | – | |||||||
| 38,602 | Global Aviation Holdings, Inc.(i) (l) (m) | NR | 3.000% | 02/13/2018 | N/A | – | |||||||
| 198,004 | Sabre, Inc. | B | 5.250% | 02/19/2019 | N/A | 199,598 | |||||||
| 399,000 | US Shipping Corp. | B | 9.000% | 04/30/2018 | N/A | 410,970 | |||||||
| 129,675 | Travelport Holdings Ltd. | B | 6.250% | 06/26/2019 | N/A | 132,767 | |||||||
| 204,108 | Travelport Holdings, LTD 2nd Lien | CCC+ | 4.000% | 12/01/2016 | N/A | 208,276 | |||||||
| 1,527,667 | |||||||||||||
| Wireless – 0.1% | |||||||||||||
| 493,750 | Zayo Group LLC | B | 4.500% | 07/02/2019 | N/A | 494,619 | |||||||
| Wirelines – 0.3% | |||||||||||||
| 691,322 | Avaya, Inc. | B | 4.762% | 10/26/2017 | N/A | 663,766 | |||||||
| 346,971 | Avaya, Inc. | B | 8.000% | 03/31/2018 | N/A | 346,366 | |||||||
| 1,010,132 | |||||||||||||
| Total Term Loans – 4.9% | |||||||||||||
| (Cost $18,340,461) | 18,475,753 | ||||||||||||
| Number | |||||||||||||
| of Shares | Description | Value | |||||||||||
| Common Stock – 0.0%*** | |||||||||||||
| Airlines – 0.0%*** | |||||||||||||
| 6,232 | Global Aviation Holdings, Inc.(i) (j) (k) (l) | 1 | |||||||||||
| (Cost $0) | |||||||||||||
| Preferred Stocks – 2.0% | |||||||||||||
| Diversified Financial Services – 0.6% | |||||||||||||
| 1,900 | Falcons Funding Trust I(b) (d) (k) | 1,955,931 | |||||||||||
| 475 | GSC Partners CDO Fund Ltd./GSC Partners CDO Fund Corp. | ||||||||||||
| (Cayman Islands)(b) (d) | 198,121 | ||||||||||||
| 200,000 | WhiteHorse II Ltd., Series 2005-2A (Cayman Islands)(b) (d) (k) | 112,000 | |||||||||||
| 2,266,052 |
| See notes to financial statements. |
18 l GBAB l GUGGENHEIM BUILD AMERICA BONDS MANAGED DURATION TRUST SEMIANNUAL REPORT |
| PORTFOLIO OF INVESTMENTS (Unaudited) continued | November 30, 2013 |
| Number | |||||||||||||
| of Shares | Description | Value | |||||||||||
| Transportation – 1.4% | |||||||||||||
| 200,000 | Seaspan Corp., Series C (Marshall Islands)(k) | NR | 9.500% | – | $ | 5,328,000 | |||||||
| Total Preferred Stocks – 2.0% | |||||||||||||
| (Cost $7,201,500) | 7,594,052 | ||||||||||||
| Close End Fund – 0.3% | |||||||||||||
| 50,618 | BlackRock Build America Bond Trust | 931,877 | |||||||||||
| (Cost $930,410) | |||||||||||||
| Warrants – 0.0%*** | |||||||||||||
| Engineering & Construction – 0.0%*** | |||||||||||||
| 1,550 | Alion Science and Technology Corp.(i) (j) (l) | 03/15/2017 | – | ||||||||||
| (Cost $16) | |||||||||||||
| Total Long-Term Investments – 131.6% | |||||||||||||
| (Cost $457,929,820) | 499,851,871 | ||||||||||||
| Short-Term Investments – 0.2% | |||||||||||||
| Principal | Optional Call | ||||||||||||
| Amount | Description | Rating * | Coupon | Maturity | Provisions** | Value | |||||||
| Municipal Bond – 0.2% | |||||||||||||
| Michigan – 0.2% | |||||||||||||
| $ | 1,000,000 | Michigan Finance Authority, State Aid Revenue Notes, School District of the City of Detroit, Series 2013C(k) | SP-1 | 4.375% | 08/20/2014 | N/A | 1,003,560 | ||||||
| (Cost $1,000,000) | |||||||||||||
| Total Investments – 131.8% | |||||||||||||
| (Cost $458,929,820) | 500,855,431 | ||||||||||||
| Other Assets in excess of Liabilities – 2.6% | 9,911,812 | ||||||||||||
| Borrowings – (10.5%) | (39,963,936 | ) | |||||||||||
| Reverse Repurchase Agreements – (23.9%) | (90,906,742 | ) | |||||||||||
| Net Assets – 100.0% | $ | 379,896,565 |
AGM – Insured by Assured Guaranty Municipal Corporation
ASA – Stock Company
CDO – Collateralized Debt Obligation
CLO – Collateralized Loan Obligation
LLC – Limited Liability Company
LP – Limited Partnership
N/A – Not Applicable
PLC – Public Limited Company
Pty – Proprietary
| * | Ratings shown are per Standard & Poor’s Rating Group, Moody’s Investor Services, Inc. or Fitch Ratings. Securities classified as NR are not rated. (For securities not rated by Standard & Poor’s Rating Group, the rating by Moody’s Investor Services, Inc. is provided. Likewise, for securities not rated by Standard & Poor’s Rating Group and Moody’s Investor Services, Inc., the rating by Fitch Ratings is provided.) All ratings are unaudited. The ratings apply to the credit worthiness of the issuers of the underlying securities and not to the Trust or its shares. |
| ** | Date and price of the earliest optional call or put provision. There may be other call provisions at varying prices at later dates. |
| *** | Less than 0.1%. |
| (a) | Taxable municipal bond issued as part of the Build America Bond program. |
| (b) | Securities are exempt from registration under Rule 144A of the Securities Act of 1933. These securities may be resold in transactions exempt from registration, normally to qualified institutional buyers. At November 30, 2013 these securities amounted to $31,585,282, which represents 8.3% of net assets. |
| (c) | The issuer of this security will accrue interest on the secured note at a rate of 12% annum and will make interest payments as follows: (1) 10% in cash and (2) 2% in-kind shares of the secured note. |
| (d) | Floating or variable rate coupon. The rate shown is as of November 30, 2013. |
| See notes to financial statements. | |
GBAB l GUGGENHEIM BUILD AMERICA BONDS MANAGED DURATION TRUST SEMIANNUAL REPORT l 19 |
| PORTFOLIO OF INVESTMENTS (Unaudited) continued | November 30, 2013 |
| (e) | Term loans held by the Trust have a variable interest rate feature which is periodically adjusted based on an underlying interest rate benchmark. In addition, term loans may include mandatory and/or optional prepayment terms. As a result, the actual maturity dates of the loan may be different than the amounts disclosed in the portfolios of investments. Term loans may be considered restricted in that the Trust may be contractually obligated to secure approval from the Agent Bank and/or Borrower prior to the sale or disposition of loan. |
| (f) | Pay-in-kind toggle note. |
| (g) | Security had no stated coupon. However, it is expected to receive residual cash flow payments on deal defined payment dates. |
| (h) | Security is perpetual and, thus does not have a predetermined maturity date. |
| (i) | Security is valued in accordance with Fair Valuation procedures established in good faith by management and approved by the Board of Trustees. The total market value of such securities is $563,255, representing 0.1% in net assets. |
| (j) | Non-income producing security. |
| (k) | All or a portion of these securities have been physically segregated in connection with borrowings, reverse repurchase agreements, and unfunded loan commitments. As of November 30, 2013, the total amount segregated was $252,928,587. |
| (l) | Illiquid security. |
| (m) | Non-income producing as security is in default. |
| See notes to financial statements. |
20 l GBAB l GUGGENHEIM BUILD AMERICA BONDS MANAGED DURATION TRUST SEMIANNUAL REPORT |
| STATEMENT OF ASSETS AND LIABILITIES (Unaudited) | November 30, 2013 |
| Assets | ||||
| Investments in securities, at value (cost $458,929,820) | $ | 500,855,431 | ||
| Interest receivable | 9,180,661 | |||
| Cash | 1,344,712 | |||
| Receivable for securities sold | 776,437 | |||
| Other assets | 21,553 | |||
| Total assets | 512,178,794 | |||
| Liabilities | ||||
| Reverse repurchase agreements | 90,906,742 | |||
| Borrowings | 39,963,936 | |||
| Payable for securities purchased | 629,813 | |||
| Advisory fee payable | 250,787 | |||
| Excise tax payable | 250,000 | |||
| Interest due on borrowings | 70,773 | |||
| Administrative fee payable | 9,534 | |||
| Accrued expenses and other liabilities | 200,644 | |||
| Total liabilities | 132,282,229 | |||
| Net Assets | $ | 379,896,565 | ||
| Composition of Net Assets | ||||
| Common stock, $.01 par value per share; unlimited number of shares authorized, 17,413,674 shares issued and outstanding | $ | 174,137 | ||
| Additional paid-in capital | 331,422,142 | |||
| Undistributed net investment income | 4,654,299 | |||
| Accumulated net realized gain on investments | 1,720,376 | |||
| Net unrealized appreciation on investments and unfunded commitments | 41,925,611 | |||
| Net Assets | $ | 379,896,565 | ||
Net Asset Value (based on 17,413,674 common shares outstanding) | $ | 21.82 |
| See notes to financial statements. | |
GBAB l GUGGENHEIM BUILD AMERICA BONDS MANAGED DURATION TRUST SEMIANNUAL REPORT l 21 |
STATEMENT OF OPERATIONS For the six months ended November 30, 2013 (Unaudited) | November 30, 2013 |
| Investment Income | |||||||
| Interest | $ | 17,237,828 | |||||
| Total income | $ | 17,237,828 | |||||
| Expenses | |||||||
| Advisory fee | 1,546,529 | ||||||
| Interest expense | 655,890 | ||||||
| Excise tax expense | 250,000 | ||||||
| Professional fees | 69,621 | ||||||
| Trust accounting | 64,113 | ||||||
| Administrative fee | 58,718 | ||||||
| Trustees’ fees and expenses | 40,638 | ||||||
| Custodian fee | 12,507 | ||||||
| Printing expenses | 36,691 | ||||||
| NYSE listing fee | 11,895 | ||||||
| Insurance expense | 6,954 | ||||||
| Transfer agent fee | 9,189 | ||||||
| Miscellaneous | 835 | ||||||
| Total expenses | 2,763,580 | ||||||
| Net investment income | 14,474,248 | ||||||
| Realized and Unrealized Gain (Loss) on Investments and Unfunded Commitments | |||||||
| Net realized loss on: | |||||||
| Investments | (140,770 | ) | |||||
| Net change in unrealized appreciation (depreciation) on: | |||||||
| Investments | (31,135,679 | ) | |||||
| Unfunded commitments | 3 | ||||||
| Net realized and unrealized gain (loss) on investments and unfunded commitments | (31,276,446 | ) | |||||
| Net Decrease in Net Assets Resulting from Operations | $ | (16,802,198 | ) |
| See notes to financial statements. |
22 l GBAB l GUGGENHEIM BUILD AMERICA BONDS MANAGED DURATION TRUST SEMIANNUAL REPORT |
| STATEMENT OF CHANGES IN NET ASSETS | November 30, 2013 |
| For the Six Months | |||||||
| Ended | For the Year | ||||||
| November 30, 2013 | Ended | ||||||
| (unaudited | ) | May 31, 2013 | |||||
| Increase (Decrease) in Net Assets from Operations | |||||||
| Net investment income | $ | 14,474,248 | $ | 28,865,070 | |||
| Net realized gain (loss) on investments | (140,770 | ) | 1,496,339 | ||||
| Net change in unrealized appreciation (depreciation) on investments and unfunded commitments | (31,135,676 | ) | (441,200 | ) | |||
| Net increase (decrease) in net assets resulting from operations | (16,802,198 | ) | 29,920,209 | ||||
| Distributions to Common Shareholders | |||||||
| From net investment income | (14,436,284 | ) | (27,845,259 | ) | |||
| Capital Share Transactions | |||||||
| Reinvestment of dividends | 0 | 100,013 | |||||
| Net increase from capital share transactions | 0 | 100,013 | |||||
| Total increase (decrease) in net assets | (31,238,482 | ) | 2,174,963 | ||||
| Net Assets | |||||||
| Beginning of period | 411,135,047 | 408,960,084 | |||||
| End of period (including undistributed net investment income of $4,654,299 and $4,616,335, respectively) | $ | 379,896,565 | $ | 411,135,047 |
| See notes to financial statements. | |
GBAB l GUGGENHEIM BUILD AMERICA BONDS MANAGED DURATION TRUST SEMIANNUAL REPORT l 23 |
STATEMENT OF CASH FLOWS For the six months ended November 30, 2013 (Unaudited) | November 30, 2013 |
| Cash Flows from Operating Activities: | ||||
| Net decrease in net assets resulting from operations | $ | (16,802,198 | ) | |
| Adjustments to Reconcile Net Decrease in Net Assets Resulting from Operations to | ||||
| Net Cash Provided by Operating and Investing Activities: | ||||
| Net depreciation appreciation on investments | 31,135,679 | |||
| Net unrealized appreciation on unfunded commitments | (3 | ) | ||
| Net realized loss on investments | 140,770 | |||
| Paydowns received | (586,850 | ) | ||
| Net accretion of bond discount and amortization of bond premium | (170,510 | ) | ||
| Purchase of long-term investments | (26,547,069 | ) | ||
| Proceeds from sale of long-term investments | 27,673,906 | |||
| Net sales of short-term investments | 174,430 | |||
| Decrease in interest receivable | 71,577 | |||
| Increase in receivable for securities sold | (173,692 | ) | ||
| Increase in other assets | (21,553 | ) | ||
| Decrease in payable for securities purchased | (205,541 | ) | ||
| Decrease in advisory fee payable | (29,645 | ) | ||
| Increase in excise tax payable | 250,000 | |||
| Decrease in interest due on borrowings | (63,723 | ) | ||
| Decrease in administration fee payable | (850 | ) | ||
| Decrease in accrued expenses and other liabilities | (38,858 | ) | ||
| Net Cash Provided by Operating and Investing Activities | 14,805,870 | |||
| Cash Flows From Financing Activities: | ||||
| Distributions to common shareholders | (14,436,284 | ) | ||
| Increase in reverse repurchase agreements | 5,128,360 | |||
| Proceeds from borrowings | 22,500,000 | |||
| Payments made on borrowings | (26,750,000 | ) | ||
| Net Cash Used in Financing Activities | (13,557,924 | ) | ||
| Net increase in cash | 1,247,946 | |||
| Cash at Beginning of Period | 96,766 | |||
| Cash at End of Period | $ | 1,344,712 | ||
| Supplemental Disclosure of Cash Flow Information: Cash paid during the period for interest | $ | 719,613 |
| See notes to financial statements. |
24 l GBAB l GUGGENHEIM BUILD AMERICA BONDS MANAGED DURATION TRUST SEMIANNUAL REPORT |
| FINANCIAL HIGHLIGHTS | November 30, 2013 |
| For the Six Months | For the Period | ||||||||||||
| Ended | For the Year | For the Year | October 28, 2010* | ||||||||||
| Per share operating performance | November 30, 2013 | Ended | Ended | through | |||||||||
| for a common share outstanding throughout the period | (unaudited | ) | May 31, 2013 | May 31, 2012 | May 31, 2011 | ||||||||
| Net asset value, beginning of period | $ | 23.61 | $ | 23.49 | $ | 20.65 | $ | 19.10 | (a) | ||||
| Income from investment operations | |||||||||||||
Net investment income (b) | 0.83 | 1.63 | 1.59 | 0.68 | |||||||||
| Net realized and unrealized gain (loss) on investments and unfunded commitments | (1.79 | ) | 0.09 | 2.74 | 1.50 | ||||||||
| Total from investment operations | (0.96 | ) | 1.72 | 4.33 | 2.18 | ||||||||
| Common shares’ offering expenses charged to paid-in capital | — | — | — | (0.04 | ) | ||||||||
| Distributions to Common Shareholders | |||||||||||||
| From net investment income | (0.83 | ) | (1.60 | ) | (1.49 | ) | (0.59 | ) | |||||
| Net asset value, end of period | $ | 21.82 | $ | 23.61 | $ | 23.49 | $ | 20.65 | |||||
| Market value, end of period | $ | 19.19 | $ | 22.70 | $ | 22.46 | $ | 19.54 | |||||
Total investment return (c) | |||||||||||||
| Net asset value | -4.04 | % | 7.48 | % | 21.64 | % | 11.34 | % | |||||
| Market value | -11.98 | % | 8.27 | % | 23.35 | % | 0.80 | % | |||||
| Ratios and supplemental data | |||||||||||||
| Net assets, end of period (thousands) | $ | 379,897 | $ | 411,135 | $ | 408,960 | $ | 359,444 | |||||
| Ratios to Average Net Assets applicable to Common Shares: | |||||||||||||
| Total expenses, excluding interest expense | 1.09 | %(d) | 1.02 | % | 1.04 | % | 0.91 | %(d) | |||||
| Total expenses, including interest expense | 1.43 | %(d) | 1.38 | % | 1.36 | % | 1.05 | %(d) | |||||
| Net investment income, including interest expense | 7.51 | %(d) | 6.90 | % | 7.33 | % | 6.00 | %(d) | |||||
Portfolio turnover rate (e) | 5 | % | 12 | % | 7 | % | 3 | % | |||||
| Senior Indebtedness: | |||||||||||||
| Total Borrowings outstanding (in thousands) | $ | 130,871 | $ | 129,992 | $ | 125,542 | $ | 104,906 | |||||
Asset Coverage per $1,000 of indebtedness(f) | $ | 3,903 | $ | 4,163 | $ | 4,258 | $ | 4,426 | |||||
| * | Commencement of investment operations. |
| (a) | Before deduction of offering expenses charged to capital. |
| (b) | Based on average shares outstanding during the period. |
| (c) | Total investment return is calculated assuming a purchase of a common share at the beginning of the period and a sale on the last day of the period reported either at net asset value (“NAV”) or market price per share. Dividends and distributions are assumed to be reinvested at NAV for NAV returns or the prices obtained under the Trust’s Dividend Reinvestment Plan for market value returns. Total investment return does not reflect brokerage commissions. A return calculated for a period of less than one year is not annualized. |
| (d) | Annualized. |
| (e) | Portfolio turnover is not annualized for periods of less than one year. |
| (f) | Calculated by subtracting the Trust’s total liabilities (not including borrowings) from the Trust’s total assets and dividing by the total borrowings. |
| See notes to financial statements. | |
GBAB l GUGGENHEIM BUILD AMERICA BONDS MANAGED DURATION TRUST SEMIANNUAL REPORT l 25 |
| NOTES TO FINANCIAL STATEMENTS (Unaudited) | November 30, 2013 |
Note 1 – Organization:
Guggenheim Build America Bonds Managed Duration Trust (the “Trust”) was organized as a Delaware statutory trust on June 30, 2010. The Trust is registered as a diversified closed-end management investment company under the Investment Company Act of 1940, as amended.
The Trust’s primary investment objective is to provide current income with a secondary objective of long-term capital appreciation. There can be no assurance that the Trust will achieve its investment objectives. The Trust’s investment objectives are considered fundamental and may not be changed without shareholder approval.
Note 2 – Accounting Policies:
The preparation of the financial statements in accordance with U.S. generally accepted accounting principles (“GAAP”) requires management to make estimates and assumptions that affect the reported amounts and disclosures in the financial statements. Actual results could differ from these estimates.
The following is a summary of significant accounting policies consistently followed by the Trust.
(a) Valuation of Investments
The Trust values equity securities at the last reported sale price on the principal exchange or in the principal over-the-counter (“OTC”) market in which such securities are traded, as of the close of regular trading on the New York Stock Exchange (“NYSE”) on the day the securities are being valued or, if there are no sales, at the mean between the last available bid and ask prices on that day. Securities traded on NASDAQ are valued at the NASDAQ Official Closing Price. The Trust values debt securities (including municipal securities, asset-backed securities, collateralized mortgage obligations and term loans) at the last available bid price for such securities or, if such prices are not available, at prices for securities of comparable maturity, quality, and type. Short-term securities with remaining maturities of 60 days or less are valued at amortized cost, which approximates fair value.
For those securities where quotations or prices are not available, the valuations are determined in accordance with procedures established in good faith by management and approved by the Board of Trustees (“Trustees”). A valuation committee consisting of representatives from investment management, fund administration, legal and compliance is responsible for the oversight of the valuation process of the Trust and convenes monthly, or more frequently as needed. The valuation committee reviews monthly Level 3 fair valued securities methodology, price overrides, broker quoted securities, price source changes, illiquid securities, unchanged valuations, halted securities, price challenges, fair valued securities sold and back testing trade prices in relation to prior day closing prices. On a quarterly basis, the valuations and methodologies of all Level 3 fair valued securities are presented to the Trust’s Trustees.
Valuations in accordance with these procedures are intended to reflect each security’s (or asset’s) fair value. Such fair value is the amount that the Trust might reasonably expect to receive for the security (or asset) upon its current sale. Each such determination is based on a consideration of all relevant factors, which are likely to vary from one pricing context to another. Examples of such factors may include, but are not limited to: (i) the type of security, (ii) the initial cost of the security, (iii) the existence of any contractual restrictions on the security’s disposition, (iv) the price and extent of public trading in similar securities of the issuer or of comparable companies, (v) quotations or evaluated prices from broker-dealers and/or pricing services, (vi) information obtained from the issuer, analysts, and/or the appropriate stock exchange (for exchange traded securities), (vii) an analysis of the company’s financial statements, and (viii) an evaluation of the forces that influence the issuer and the market(s) in which the security is purchased and sold (e.g. the existence of pending merger activity, public offerings or tender offers that might affect the value of the security).
For fixed income securities, fair valuations may include input from Guggenheim Partners Investment Management, LLC (“GPIM”) utilizing a wide variety of market data including yields or prices of investments of comparable quality, type of issue, coupon, maturity, rating, indications of value from security dealers, evaluations of anticipated cash flows or collateral, spread over Treasuries, and other information and analysis. GPIM also uses third party service providers to model certain securities using cash flow models to represent a fair market value.
There are three different categories for valuations. Level 1 valuations are those based upon quoted prices in active markets. Level 2 valuations are those based upon quoted prices in inactive markets or based upon significant observable inputs (e.g. yield curves; benchmark interest rates; indices). Level 3 valuations are those based upon unobservable inputs (e.g. discounted cash flow analysis; non-market based methods used to determine fair valuation).
The Trust values Level 1 securities using readily available market quotations in active markets. Money Market Funds are valued at Net Asset Value. The Trust values Level 2 fixed income securities using independent pricing providers who employ matrix pricing models utilizing market prices, broker quotes and prices of securities with comparable maturities and qualities. The Trust values Level 2 equity securities using independent pricing providers who employ models using various observable market inputs. The fair value estimate for the Level 3 security in the Trust is determined in accordance with the Trust’s valuation procedures described above.
Transfers between valuation levels, if any, are in comparison to the valuation levels at the end of the previous fiscal year, and are effective using the fair value as of the end of the current fiscal period.
26 l GBAB l GUGGENHEIM BUILD AMERICA BONDS MANAGED DURATION TRUST SEMIANNUAL REPORT |
| NOTES TO FINANCIAL STATEMENTS (Unaudited) continued | November 30, 2013 |
The following table represents the Trust’s investments carried on the Statement of Assets and Liabilities by caption and by level within the fair value hierarchy as of November 30, 2013.
| Description | Level 1 | Level 2 | Level 3 | Total | |||||||||
| (value in $000s) | |||||||||||||
| Assets: | |||||||||||||
| Municipal Bonds | $ | — | $ | 424,262 | $ | — | $ | 424,262 | |||||
| Corporate Bonds | — | 25,593 | — | 25,593 | |||||||||
| Asset Backed | |||||||||||||
| Securities: | |||||||||||||
| Automobile | — | 23 | — | 23 | |||||||||
| Collateralized Debt | |||||||||||||
| Obligations | — | 6,066 | 145 | 6,211 | |||||||||
| Collateralized Loan | |||||||||||||
| Obligations | — | 7,402 | 419 | 7,821 | |||||||||
| Commercial Receivables | — | 4 | — | 4 | |||||||||
| Credit Card | — | 200 | — | 200 | |||||||||
| Insurance | — | 75 | — | 75 | |||||||||
| Media | — | 3,447 | — | 3,447 | |||||||||
| Other ABS | — | 2,093 | — | 2,093 | |||||||||
| Transportation | — | 1,400 | — | 1,400 | |||||||||
| Collateralized Mortgage | |||||||||||||
| Obligations | — | 2,724 | — | 2,724 | |||||||||
| Preferred Stock | 7,594 | — | — | 7,594 | |||||||||
| Term Loans | — | 18,476 | — | * | 18,476 | ||||||||
| Common Stock | — | — | — | * | — | * | |||||||
| Closed End Fund | 932 | — | — | 932 | |||||||||
| Warrants | — | — | — | * | — | * | |||||||
| Total | $ | 8,526 | $ | 491,765 | $ | 564 | $ | 500,855 |
| * | Market value is less than minimum amount disclosed. |
The transfers in and out of the valuation levels for the Fund as of the report date when compared to the valuation levels at the end of the previous fiscal year are detailed below:
A collateralized loan obligation, Atlas Senior Loan Fund II, LTD. in the amount of $223,844, transferred from Level 2 to Level 3 due to the lack of a timely third-party price.
Two term loans, Global Aviation Holdings Inc. in the amount of $0 each, transferred from Level 2 to Level 3 due to liquidity issues of the company and the lack of a third-party price. The following table presents the activity for the Trust’s investments measured at fair value using significant unobservable inputs (Level 3 valuations) for the six months ended November 30, 2013.
| Level 3 holdings | ||||
| (value in $000s) | ||||
| Beginning Balance at May 31, 2013 | ||||
| Warrants | $ | — | * | |
| Common Stock | — | * | ||
| Collateralized Loan Obligations | 207 | |||
| Net Purchases | ||||
| Collateralized Debt Obligations | 154 | |||
| Transfers In | ||||
| Collateralized Loan Obligation | 224 | |||
| Term Loans | — | * | ||
| Realized Gain/Loss | ||||
| Collateralized Debt Obligations | 3 | |||
| Paydowns Received | ||||
| Collateralized Debt Obligation | (13 | ) | ||
| Change in unrealized gain/loss | ||||
| Warrants | — | |||
| Common Stock | — | |||
| Collateralized Debt Obligation | 1 | |||
| Collateralized Loan Obligations | (12 | ) | ||
| Ending Balance at November 30, 2013 | ||||
| Warrants | — | * | ||
| Common Stock | — | * | ||
| Collateralized Debt Obligation | 145 | |||
| Collateralized Loan Obligations | 419 | |||
| Term Loans | — | * | ||
| Total Level 3 holdings | $ | 564 |
The following table summarizes valuation techniques and inputs used in determining the fair value of Guggenheim Build America Bonds Managed Duration Trust holdings categorized as Level 3 at November 30, 2013:
| Value as of | ||||||||||||
| Investments, | November 30, | Valuation | Unobservable | Unobservable | ||||||||
| at value | 2013 | Technique | Inputs | Inputs | ||||||||
| Common Stock: | ||||||||||||
| Airlines | $ | 1 | Model Price | Unlisted Security | $ | 0.0001 | ||||||
| Warrant: | ||||||||||||
| Engineering | ||||||||||||
| and Construction | 0 | Model Price | Unlisted Security | 0.0000 | ||||||||
| Asset Backed | ||||||||||||
| Securities: | ||||||||||||
| Collateralized | ||||||||||||
| Debt Obligation | 144,410 | Third-Party | Single Broker | |||||||||
| Pricing Vendor | Quote | 80.8567 | ||||||||||
| Collateralized | ||||||||||||
| Loan Obligation | 195,000 | Third-Party | Single Broker | |||||||||
| Pricing Vendor | Quote | 78.0000 | ||||||||||
| Collateralized | ||||||||||||
| Loan Obligation | 223,844 | Third-Party | Single Broker | |||||||||
| Pricing Vendor | Quote | 89.5376 | ||||||||||
| Term Loans: | ||||||||||||
| Transportation | 0 | Model Price | Unlisted Security | 0.0000 |
A significant change in unobservable inputs would have the following impact to Level 3 valuations:
| Impact to Value | Impact to Value | |
| Unobservable Input | if Input Increases | if Input Decreases |
| Unlisted Security | Increases | Decreases |
| Single Broker Quote | Increases | Decreases |
GBAB l GUGGENHEIM BUILD AMERICA BONDS MANAGED DURATION TRUST SEMIANNUAL REPORT l 27 |
| NOTES TO FINANCIAL STATEMENTS (Unaudited) continued | November 30, 2013 |
(b) Investment Transactions and Investment Income
Investment transactions are accounted for on the trade date. Realized gains and losses on investments are determined on the identified cost basis. Paydown gains and losses on mortgage and asset-backed securities are treated as an adjustment to interest income. For the six-months ended November 30, 2013, the Trust recognized an increase of interest income and a decrease of net realized gain of $586,850. This reclassification is reflected on the Statement of Operations and had no effect on the net asset value of the Trust. Dividend income is recorded net of applicable withholding taxes on the ex-dividend date and interest income is recorded on an accrual basis. Discounts or premiums on debt securities purchased are accreted or amortized to interest income over the lives of the respective securities using the effective interest method.
(c) Swaps
A swap is an agreement to exchange the return generated by one instrument for the return generated by another instrument. The Trust may enter into swap agreements to manage its exposure to interest rates or to manage the duration of its portfolio. The swaps are valued daily at current market value and any unrealized gain or loss is included in the Statement of Operations. The Trust accrues for the interim payments on swap contracts on a daily basis, with the net amount recorded within unrealized appreciation/depreciation of swap contracts on the Statement of Assets and Liabilities. Once the interim payments are settled in cash, the net amount is recorded as realized gain/loss on swaps, in addition to realized gain/loss recorded upon the termination of swap contracts on the Statement of Operations. During the period that the swap agreement is open, the Trust may be subject to risk from the potential inability of the counterparty to meet the terms of the agreement. The swaps involve elements of both market and credit risk in excess of the amounts reflected on the Statement of Assets and Liabilities. During the six months ended November 30, 2013, there were no swaps outstanding.
(d) When-Issued and Delayed Delivery Transactions
The Trust may engage in when-issued or delayed delivery transactions. The Trust records when-issued securities on the trade date and maintains security positions such that sufficient liquid assets will be available to make payment for the securities purchased. Securities purchased on a when-issued or delayed delivery basis are marked to market daily and begin earning interest on the settlement date. Losses may occur on these transactions due to changes in a market conditions or the failure of counterparties to perform under the contract.
(e) Distributions
The Trust declares and pays monthly distributions to common shareholders. Any net realized long-term gains are distributed annually. Distributions to shareholders are recorded on the ex-dividend date. The amount and timing of distributions are determined in accordance with federal income tax regulations, which may differ from GAAP.
(f) Currency Translation
Assets and liabilities denominated in foreign currencies are translated into U.S. dollars at the mean of the bid and asked price of the respective exchange rates on the last day of the period. Purchases and sales of investments denominated in foreign currencies are translated at the mean of the bid and asked price of respective exchange rates on the date of the transaction.
Foreign exchange gain or loss resulting from holding of a foreign currency, expiration of a currency exchange contract, difference in the exchange rates between the trade date and settlement date of an investment purchased or sold, and the difference between dividends actually received compared to the amount shown in a Trust’s accounting records on the date of receipt are included as net realized gains or losses on foreign currency forwards and currency transactions in the Trust’s Statement of Operations.
Foreign exchange gain or loss on assets and liabilities, other than investments, is included in unrealized appreciation (depreciation) on foreign currency transactions. There were no currency gains or losses for the six months ended November 30, 2013.
Note 3 – Investment Advisory Agreement, Sub-Advisory Agreement and Other Agreements:
Pursuant to an Investment Advisory Agreement between the Trust and Guggenheim Funds Investment Advisors, LLC (“GFIA” or “the Adviser”), the Adviser furnishes offices, necessary facilities and equipment, provides administrative services, oversees the activities of Guggenheim Partners Investment Management, LLC (“GPIM”), provides personnel including certain officers required for the Trust’s administrative management and compensates the officers and trustees of the Trust who are affiliates of the Adviser. As compensation for these services, the Trust pays the Adviser a fee, payable monthly, in an amount equal to 0.60% of the Trust’s average daily managed assets (net assets applicable to common shareholders plus any assets attributable to financial leverage).
Pursuant to a Sub-Advisory Agreement among the Trust, the Adviser and GPIM, GPIM under the supervision of the Trust’s Board of Trustees and the Adviser, provides a continuous investment program for the Trust’s portfolio; provides investment research; makes and executes recommendations for the purchase and sale of securities; and provides certain facilities and personnel, including certain officers required for its administrative management and pays the compensation of all officers and trustees of the Trust who are GPIM ‘s affiliates. As compensation for its services, the Adviser pays GPIM a fee, payable monthly, in an annual amount equal to 0.30% of the Trust’s average daily managed assets.
Certain officers of the Trust may also be officers, directors and/or employees of the Adviser or GPIM. The Trust does not compensate its officers who are officers, directors and/or employees of the aforementioned firms.
Prior to May 14, 2013 under a separate Fund Administration agreement, the Adviser provided Fund Administration services to the Trust. Effective May 14, 2013, the Trustees approved Rydex Fund Services, LLC (“RFS”) as the Administrator of the Trust. The Adviser previously received and RFS currently receives a fund administration fee payable monthly at the annual rate set forth below as a percentage of the average daily managed assets of the Trust:
| Managed Assets | Rate |
| First $200,000,000 | 0.0275% |
| Next $300,000,000 | 0.0200% |
| Next $500,000,000 | 0.0150% |
| Over $1,000,000,000 | 0.0100% |
28 l GBAB l GUGGENHEIM BUILD AMERICA BONDS MANAGED DURATION TRUST SEMIANNUAL REPORT |
| NOTES TO FINANCIAL STATEMENTS (Unaudited) continued | November 30, 2013 |
There is no impact to the Trust as a result of this change.
For purposes of calculating the fees payable under the foregoing agreements, “average daily managed assets” means the average daily value of the Trust’s total assets minus the sum of its accrued liabilities. “Total assets” means all of the Trust’s assets and is not limited to its investment securities. “Accrued liabilities” means all of the Trust’s liabilities other than borrowings for investment purposes.
The Bank of New York Mellon (“BNY”) acts as the Trust’s custodian. As custodian, BNY is responsible for the custody of the Trust’s assets. Effective June 1, 2013, the Board of Trustees approved RFS to replace BNY as the accounting agent of the Trust. As accounting agent, RFS is responsible for maintaining the books and records of the Trust’s securities and cash. RFS receives an accounting fee payable monthly at the annual rate set forth below as a percentage of the average daily managed assets of the Trust:
| Managed Assets | Rate |
| First $200,000,000 | 0.0300% |
| Next $300,000,000 | 0.0150% |
| Next $500,000,000 | 0.0100% |
| Over $1,000,000,000 | 0.0075% |
Note 4 – Federal Income Taxes:
The Trust intends to comply with the requirements of Subchapter M of the Internal Revenue Code of 1986, as amended, applicable to regulated investment companies. Information on the components of net assets on a tax basis as of November 30, 2013, is as follows:
| Net Tax | ||||||||||
| Cost of | Unrealized | |||||||||
| Investments | Gross Tax | Gross Tax | Appreciation | |||||||
| for Tax | Unrealized | Unrealized | on | |||||||
| Purposes | Appreciation | Depreciation | Investments | |||||||
| $ 458,564,828 | $ | 43,725,719 | $ | (1,435,116 | ) | $ | 42,290,603 |
As of May 31, 2013, (the most recent fiscal year end for federal income tax purposes), the components of accumulated earnings/ (losses) (excluding paid-in capital) on a tax basis were as follows:
| Undistributed | Accumulated | ||||||
| Ordinary | Long-Term | ||||||
| Income/ | Gains/ | ||||||
| (Accumulated | (Accumulated | ||||||
| Ordinary Loss | ) | Capital Loss | ) | ||||
| $ | 5,136,538 | $ | 975,951 |
For the year ended May 31, 2013, the tax character of distributions paid to common shareholders as reflected in the statement of changes in net assets was as follows:
| Distributions paid from | 2013 | |||
| Ordinary Income | $ | 27,845,259 |
For all open tax years and all major jurisdictions, management of the Trust has concluded that there are no significant uncertain tax positions that would require recognition in the financial statements. Uncertain tax positions are tax positions taken or expected to be taken in the course of preparing the Trust’s tax returns that would not meet a more-likely-than not threshold of being sustained by the applicable tax authority and would be recorded as a tax expense in the current year. Open tax years are those that are open for examination by taxing authorities (i.e. generally the last four tax year ends and the interim tax period since then). Furthermore, management of the Trust is also not aware of any tax positions for which it is reasonably possible that the total amounts of unrecognized tax benefits will significantly change in the next twelve months.
Note 5 – Investments in Securities:
For the six months ended November 30, 2013, the cost of purchases and proceeds from sales of investments, excluding short-term securities, were $26,547,069 and $27,673,906, respectively.
Note 6 – Capital:
Common Shares
In connection with its organization process, the Trust sold 5,240 common shares of beneficial interest to Guggenheim Funds Distributors, LLC, an affiliate of the Adviser, for consideration of $100,084 at a price of $19.10 per share. The Trust has an unlimited amount of common shares, $0.01 par value, authorized and 17,413,674 issued and outstanding. Of this amount, the Trust issued 17,000,000 common shares in its initial public offering. These shares were issued at $19.10 per share after deducting the sales load but before offering expenses incurred by the Trust.
In connection with the initial public offering of the Trust’s common shares, the underwriters were granted an option to purchase additional common shares. On December 14, 2010, the underwriters purchased, at a price of $19.10 per common share (after deducting the sales load but before offering expenses incurred by the Trust.), 404,230 common shares of the Trust pursuant to the over-allotment option.
Offering costs, equal to $696,169 or $0.04 per share, in connection with the issuance of common shares have been borne by the Trust and were charged to paid-in capital. The Adviser and GPIM paid offering expenses (other than sales load, but including reimbursement of expenses to the underwriters) in excess of $0.04 per common share.
Transactions in common shares were as follows:
| Six Months Ended | Year ended | ||||||
| November 30, 2013 | May 31, 2013 | ||||||
| Beginning Shares | 17,413,674 | 17,409,470 | |||||
| Shares issued through | |||||||
| dividend reinvestment | — | 4,204 | |||||
| Ending Shares | 17,413,674 | 17,413,674 |
Note 7 – Leverage:
Reverse Repurchase Agreements
The Trust may enter into reverse repurchase agreements as part of its financial leverage strategy. Under a reverse repurchase agreement, the Trust temporarily transfers possession of a portfolio instrument to another party, such as a bank or broker-dealer, in return for cash. At the same time, the Trust agrees to repurchase the instrument at an agreed upon time and price, which reflects an interest payment. Such agreements have the
GBAB l GUGGENHEIM BUILD AMERICA BONDS MANAGED DURATION TRUST SEMIANNUAL REPORT l 29 |
| NOTES TO FINANCIAL STATEMENTS (Unaudited) continued | November 30, 2013 |
economic effect of borrowings. The Trust may enter into such agreements when it is able to invest the cash acquired at a rate higher than the cost of the agreement, which would increase earned income. When the Trust enters into a reverse repurchase agreement, any fluctuations in the market value of either the instruments transferred to another party or the instruments in which the proceeds may be invested would affect the market value of the Trust’s assets. As a result, such transactions may increase fluctuations in the market value of the Trust’s assets. For the six months ended November 30, 2013, the average daily balance for which reverse repurchase agreements were outstanding amounted to $88,503,520. The weighted average interest rate was 0.71%. As of November 30, 2013, there was $90,906,742 in reverse repurchase agreements outstanding. At November 30, 2013, the Trust had outstanding reverse repurchase agreements with various counterparties. Details of the reverse repurchase agreements by counterparty are as follows:
| Range of | Range of | |||||||||
| Interest | Maturity | Face | ||||||||
| Counterparty | Rates | Dates | Value | |||||||
| BNP Paribas | 0.78% | 4/16/14 | $ | 60,081,742 | ||||||
| Credit Suisse Securities, LLC | 0.64%-0.75% | 08/23/2013-01/15/2014 | 4,497,000 | |||||||
| Royal Bank of Canada | 0.49%-0.55% | 06/24/2013-02/28/2014 | 26,328,000 | |||||||
| $ | 90,906,742 |
Borrowings
On December 7, 2011, the Trust entered into a $125,000,000 credit facility agreement. The interest rate on the amount borrowed is based on the 1 month LIBOR plus 90 basis points. An unused fee of 25 basis points is charged on the difference between the $125,000,000 and the amount borrowed. At November 30, 2013, there was $39,963,936 outstanding in connection with the Trust’s credit facility. The average daily amount of borrowings on the credit facility during the six months ended was $41,405,457 with a related average interest rate of 1.08%. The maximum amount outstanding during the year ended was $47,713,936. As of November 30, 2013, the total value of securities segregated and pledged as collateral in connection with borrowings was $59,695,129.
Note 8 – Loan Commitments
Pursuant to the terms of certain Term Loan agreements, the Trust held unfunded loan commitments of as of May 31, 2013. The Trust is obligated to fund these loan commitments at the borrower’s discretion. The Trust intends to segregate against such contingent obligations by designating cash, liquid assets. As of November 30, 2013, the total amount segregated in connection with reverse repurchase agreements and unfunded commitments was $193,233,458.
At November 30, 2013, the Trust had the following unfunded loan commitments which could be extended at the option of the borrower:
| Unrealized | |||||||
| Principal | Appreciation/ | ||||||
| Borrower | Amount | (Depreciation | ) | ||||
| Darling International | $ | 4,200,000 | $ | — | |||
| $ | 4,200,000 | $ | — |
Note 9 – Indemnifications:
In the normal course of business, the Trust enters into contracts that contain a variety of representations, which provide general indemnifications. The Trust’s maximum exposure under these arrangements is unknown, as this would require future claims that may be made against the Trust that have not yet occurred. However, the Trust expects the risk of loss to be remote.
Note 10 – Subsequent Event:
The Trust evaluated subsequent events through the date the financial statements were available for issue and determined there were no additional material events that would require disclosure in the Trust’s financial statements, except as noted below.
On December 2, 2013, the Trust declared a monthly dividend of $0.13817 per common share. The dividend was payable on December 31, 2013, to shareholders of record on December 13, 2013.
On January 2, 2014, the Trust declared a monthly dividend of $0.13817 per common share. The dividend is payable on January 31, 2014, to shareholders of record on January 15, 2014.
30 l GBAB l GUGGENHEIM BUILD AMERICA BONDS MANAGED DURATION TRUST SEMIANNUAL REPORT |
| SUPPLEMENTAL INFORMATION (Unaudited) | November 30, 2013 |
Federal Income Tax Information
In January 2014, you will be advised on IRS Form 1099 DIV or substitute 1099 DIV as to the federal tax status of the distributions received by you in the calendar year 2013.
Trustees
The Trustees of the Guggenheim Build America Bonds Managed Duration Trust (the “Trust”) and their principal occupations during the past five years:
| Name, Address*, | Number of | |||||||
| Year of Birth and | Term of Office** | Portfolios in the | ||||||
| Position(s) Held | and Length | Principal Occupations during the Past Five Years and | Fund Complex*** | Other Directorships | ||||
| with Registrant | of Time Served | Other Affiliations | Overseen by Trustee | Held by Trustee | ||||
| Independent Trustees: | ||||||||
Randall C. Barnes Year of Birth: 1951 Trustee | Since 2010 | Private Investor (2001-present). Formerly, Senior Vice President and Treasurer, PepsiCo, Inc. (1993-1997), President, Pizza Hut International (1991-1993) and Senior Vice President, Strategic Planning and New Business Development of PepsiCo, Inc. (1987-1990). | 52 | None. | ||||
Roman Friedrich III Year of birth: 1946 Trustee | Since 2010 | Founder and President of Roman Friedrich & Company, a U.S. and Canadian-based business, which provides investment banking to the mining industry (1998-present). Formerly, Senior Managing Director of MLV & Co., LLC, an investment bank and institutional broker-dealer specializing in capital intensive industries such as energy, metals and mining (2010-2011). | 48 | Director of Mercator Minerals Ltd. (September 2013-present), First Americas Gold Corp. (2012-present) and Zincore Metals, Inc. (2009 – present). Previously, Director of Blue Sky Uranium Corp. (formerly, Windstorm Resources Inc.) (2011– 2012); Axiom Gold and Silver Corp. (2011-2012); Stratagold Corp. (2003-2009); Gateway Gold Corp. (2004-2008) and GFM Resources Ltd. (2005-2010). | ||||
Robert B. Karn III Year of Birth: 1942 Trustee | Since 2010 | Consultant (1998-present). Formerly, Arthur Andersen (1965-1997) and Managing Partner, Financial and Economic Consulting, St. Louis office (1987-1997). | 48 | Director of Peabody Energy Company (2003-present) and GP Natural Resource Partners LLC (2002-present). | ||||
Ronald A. Nyberg Year of birth: 1953 Trustee | Since 2010 | Partner of Nyberg & Cassioppi, LLC, a law firm specializing in corporate law, estate planning and business transactions (2000-present). Formerly, Executive Vice President, General Counsel and Corporate Secretary of Van Kampen Investments (1982-1999). | 54 | None. | ||||
Ronald E. Toupin, Jr. Year of birth: 1958 Trustee | Since 2010 | Portfolio Consultant (2010-present). Formerly, Vice President, Manager and Portfolio Manager of Nuveen Asset Management (1998-1999), Vice President of Nuveen Investment Advisory Corp. (1992-1999), Vice President and Manager of Nuveen Unit Investment Trusts (1991-1999), and Assistant Vice President and Portfolio Manager of Nuveen Unit Investment Trusts (1988-1999), each of John Nuveen & Co., Inc. (1982-1999). | 51 | Previously, Trustee, Bennett Group of Funds (2011-September/2013). | ||||
| Interested Trustee: | ||||||||
Donald C. Cacciapaglia† Year of Birth: 1951 Trustee, Chief Executive Officer | Since 2012 | Senior Managing Director of Guggenheim Investments (2010-present); Chief Executive Officer of Guggenheim Funds Services, LLC (2012-present); Chief Executive Officer (2012-present) and President (2010-present), Guggenheim Funds Distributors, LLC and Guggenheim Funds Investment Advisors, LLC; Chief Executive Officer of certain funds in the Fund Complex (2012-present); President and Director of SBL Fund, Security Equity Fund, Security Income Fund, Security Large Cap Value Fund, and Security Mid Cap Growth Fund (2012-present); President, CEO and Trustee of Rydex Dynamic Funds, Rydex ETF Trust, Rydex Series Funds and Rydex Variable Trust (2012-present); Formerly, Chairman and CEO of Channel Capital Group Inc. and Channel Capital Group LLC (2002-2010). | 212 | Trustee, Rydex Dynamic Funds, Rydex ETF Trust, Rydex Series Funds and Rydex Variable Trust (2012-present); Independent Board Member, Equitrust Life Insurance Company, Guggenheim Life and Annuity Company, and Paragon Life Insurance Company of Indiana 2011-present). | ||||
| * | Address for all Trustees: 2455 Corporate West Drive, Lisle, IL 60532 |
| ** | After a Trustee’s initial term, each Trustee is expected to serve a three-year term concurrent with the class of Trustees for which he serves: |
| - | Messrs. Barnes and Cacciapaglia are Class I Trustees. The Class I Trustees are expected to stand for election or re-election at the Trust’s annual meeting of shareholders for fiscal year ending May 31, 2014. |
| - | Messrs. Friedrich and Nyberg are Class II Trustees. The Class II Trustees are expected to stand for re-election at the Trust’s annual meeting of shareholders for fiscal year ending May 31, 2015. |
| - | Messrs. Karn and Toupin are Class III Trustees. The Class III Trustees are expected to stand for re-election at the Trust’s annual meeting of shareholders for fiscal year ending May 31, 2016. |
| *** | As of period end. The Guggenheim Investments Fund Complex consists of U.S. registered investment companies advised or serviced by Guggenheim Funds Investment Advisors, LLC, Guggenheim Funds Distributors, LLC and/or its affiliates. |
| † | Mr. Donald C. Cacciapaglia is an “interested person” (as defined in section 2(a)(19) of the 1940 Act) (“Interested Trustee”) of the Trust because of his position as the President and CEO of the Adviser. |
GBAB l GUGGENHEIM BUILD AMERICA BONDS MANAGED DURATION TRUST SEMIANNUAL REPORT l 31 |
| SUPPLEMENTAL INFORMATION (Unaudited) continued | November 30, 2013 |
Officers
The officers of the Guggenheim Build America Bonds Managed Duration Trust who are not trustees, and their principal occupations during the past five years:
| Name, Address*, Year of Birth and | Term of Office** and | Principal Occupations During the Past Five Years and | ||
| Position(s) Held with Registrant | Length of Time Served | Other Affiliations | ||
| Officers: | ||||
Amy J. Lee Year of Birth: 1961 Chief Legal Officer | Since 2013 | Managing Director, Guggenheim Investments (2012-present); Senior Vice President & Secretary, Security Investors, LLC (2010-present); Secretary & Chief Compliance Officer, Security Distributors, Inc. (1987-2012); Vice President, Associate General Counsel & Assistant Secretary, Security Benefit Life Insurance Company and Security Benefit Corporation (1987-2012); Vice President & Secretary, Rydex Series Funds, Rydex ETF Trust, Rydex Dynamic Funds, and Rydex Variable Trust (2008-present). Officer of certain funds in the Fund Complex (2012-present). | ||
John L. Sullivan Year of Birth: 1955 Chief Financial Officer, Chief Accounting Officer, and Treasurer | Since 2010 | Senior Managing Director – Fund Administration, Guggenheim Investments (2010-present). Chief Financial Officer, Chief Accounting Officer and Treasurer of certain funds in the Fund Complex. Formerly, Chief Compliance Officer, Van Kampen Funds (2004-2010). Head of Fund Accounting, Morgan Stanley Investment Management (2002-2004). Chief Financial Officer, Treasurer, Van Kampen Funds (1996-2004). | ||
Joanna M. Catalucci Year of birth: 1966 Chief Compliance Officer | Since 2012 | Managing Director of Compliance and Fund Board Relations, Guggenheim Investments (2012-present). Formerly, Chief Compliance Officer & Secretary, SBL Fund; Security Equity Fund; Security Income Fund; Security Large Cap Value Fund & Security Mid Cap Growth Fund; Vice President, Rydex Holdings, LLC; Vice President, Security Benefit Asset Management Holdings, LLC; and Senior Vice President & Chief Compliance Officer, Security Investors, LLC (2010-2012); Security Global Investors, LLC, Senior Vice President (2010-2011); Rydex Advisors, LLC (f/k/a PADCO Advisors, Inc.) and Rydex Advisors II, LLC (f/k/a PADCO Advisors II, Inc.), Chief Compliance Officer and Senior Vice President (2010-2011); Rydex Capital Partners I, LLC & Rydex Capital Partners II, LLC, Chief Compliance Officer (2006-2007); and Rydex Fund Services, LLC (f/k/a Rydex Fund Services, Inc.), Vice President (2001-2006). Chief Compliance Officer of certain funds in the Fund Complex. | ||
Mark E. Mathiasen Year of birth: 1978 Secretary | Since 2010 | Director, Associate General Counsel of Guggenheim Funds Services, LLC (2007-present). Secretary of certain funds in the Fund Complex. |
| * | Address for all Officers: 2455 Corporate West Drive, Lisle, IL 60532 |
| ** | Officers serve at the pleasure of the Board of Trustees and until his or her successor is appointed and qualified or until his or her earlier resignation or removal. |
32 l GBAB l GUGGENHEIM BUILD AMERICA BONDS MANAGED DURATION TRUST SEMIANNUAL REPORT |
| DIVIDEND REINVESTMENT PLAN (Unaudited) | November 30, 2013 |
Unless the registered owner of common shares elects to receive cash by contacting The Computershare Shareowner Services LLC (the “Plan Administrator”), all dividends declared on common shares of the Trust will be automatically reinvested by the Plan Administrator, administrator for shareholders in the Trust’s Dividend Reinvestment Plan (the “Plan”), in additional common shares of the Trust. Participation in the Plan is completely voluntary and may be terminated or resumed at any time without penalty by notice if received and processed by the Plan Administrator prior to the dividend record date; otherwise such termination or resumption will be effective with respect to any subsequently declared dividend or other distribution. Some brokers may automatically elect to receive cash on your behalf and may re-invest that cash in additional common shares of the Trust for you. If you wish for all dividends declared on your common shares of the Trust to be automatically reinvested pursuant to the Plan, please contact your broker.
The Plan Administrator will open an account for each common shareholder under the Plan in the same name in which such common shareholder’s common shares are registered. Whenever the Trust declares a dividend or other distribution (together, a “Dividend”) payable in cash, non-participants in the Plan will receive cash and participants in the Plan will receive the equivalent in common shares. The common shares will be acquired by the Plan Administrator for the participants’ accounts, depending upon the circumstances described below, either (i) through receipt of additional unissued but authorized common shares from the Trust (“Newly Issued Common Shares”) or (ii) by purchase of outstanding common shares on the open market (“Open-Market Purchases”) on the New York Stock Exchange or elsewhere. If, on the payment date for any Dividend, the closing market price plus estimated brokerage commission per common share is equal to or greater than the net asset value per common share, the Plan Administrator will invest the Dividend amount in Newly Issued Common Shares on behalf of the participants. The number of Newly Issued Common Shares to be credited to each participant’s account will be determined by dividing the dollar amount of the Dividend by the net asset value per common share on the payment date; provided that, if the net asset value is less than or equal to 95% of the closing market value on the payment date, the dollar amount of the Dividend will be divided by 95% of the closing market price per common share on the payment date. If, on the payment date for any Dividend, the net asset value per common share is greater than the closing market value plus estimated brokerage commission, the Plan Administrator will invest the Dividend amount in common shares acquired on behalf of the participants in Open-Market Purchases.
If, before the Plan Administrator has completed its Open-Market Purchases, the market price per common share exceeds the net asset value per common share, the average per common share purchase price paid by the Plan Administrator may exceed the net asset value of the common shares, resulting in the acquisition of fewer common shares than if the Dividend had been paid in Newly Issued Common Shares on the Dividend payment date. Because of the foregoing difficulty with respect to Open-Market Purchases, the Plan provides that if the Plan Administrator is unable to invest the full Dividend amount in Open-Market Purchases during the purchase period or if the market discount shifts to a market premium during the purchase period, the Plan Administrator may cease making Open-Market Purchases and may invest the uninvested portion of the Dividend amount in Newly Issued Common Shares at net asset value per common share at the close of business on the Last Purchase Date provided that, if the net asset value is less than or equal to 95% of the then current market price per common share; the dollar amount of the Dividend will be divided by 95% of the market price on the payment date.
The Plan Administrator maintains all shareholders’ accounts in the Plan and furnishes written confirmation of all transactions in the accounts, including information needed by shareholders for tax records. Common shares in the account of each Plan participant will be held by the Plan Administrator on behalf of the Plan participant, and each shareholder proxy will include those shares purchased or received pursuant to the Plan. The Plan Administrator will forward all proxy solicitation materials to participants and vote proxies for shares held under the Plan in accordance with the instruction of the participants.
There will be no brokerage charges with respect to common shares issued directly by the Trust. However, each participant will pay a pro rata share of brokerage commission incurred in connection with Open-Market Purchases. The automatic reinvestment of Dividends will not relieve participants of any Federal, state or local income tax that may be payable (or required to be withheld) on such Dividends.
The Trust reserves the right to amend or terminate the Plan. There is no direct service charge to participants with regard to purchases in the Plan; however, the Trust reserves the right to amend the Plan to include a service charge payable by the participants.
All correspondence or questions concerning the Plan should be directed to the Plan Administrator, Computershare Shareowner Services LLC, P.O. Box 30170, College Station, TX 77842-3170; Attention Shareholder Services Department, Phone Number: 866-488-3559.
GBAB l GUGGENHEIM BUILD AMERICA BONDS MANAGED DURATION TRUST SEMIANNUAL REPORT l 33 |
This Page Intentionally Left Blank.
| TRUST INFORMATION | November 30, 2013 |
Board of Trustees Randall C. Barnes Donald C. Cacciapaglia* Roman Friedrich III Robert B. Karn III Ronald A. Nyberg Ronald E. Toupin, Jr., Chairperson * Trustee is an “interested person” (as defined in section 2(a)(19) of the 1940 Act) (“Interested Trustee”) of the Trust because of his position as the President and CEO of the Adviser. | Officers Donald C. Cacciapaglia Chief Executive Officer Amy J. Lee Chief Legal Officer John L. Sullivan Chief Financial Officer, Chief Accounting Officer and Treasurer Joanna M. Catalucci Chief Compliance Officer Mark E. Mathiasen Secretary | Investment Adviser Guggenheim Funds Investment Advisors, LLC Lisle, Illinois Investment Sub-Adviser Guggenheim Partners Investment Management, LLC Santa Monica, California Administrator and Accounting Agent Rydex Fund Services, LLC Rockville, Maryland Custodian The Bank of New York Mellon New York, New York | Legal Counsel Skadden, Arps, Slate, Meagher & Flom LLP New York, New York Independent Registered Public Accounting Firm Ernst & Young LLP Chicago, Illinois |
Privacy Principles of Guggenheim Build America Bonds Managed Duration Trust for Shareholders
The Trust is committed to maintaining the privacy of its shareholders and to safeguarding its non-public personal information. The following information is provided to help you understand what personal information the Trust collects, how we protect that information and why, in certain cases, we may share information with select other parties.
Generally, the Trust does not receive any non-public personal information relating to its shareholders, although certain non-public personal information of its shareholders may become available to the Trust. The Trust does not disclose any non-public personal information about its shareholders or former shareholders to anyone except as permitted by law or as is necessary in order to service shareholder accounts (for example, to a transfer agent or third party administrator).
The Trust restricts access to non-public personal information about the shareholders to Guggenheim Funds Investment Advisors, LLC employees with a legitimate business need for the information. The Trust maintains physical, electronic and procedural safeguards designed to protect the non-public personal information of its shareholders.
Questions concerning your shares of Guggenheim Build America Bonds Managed Duration Trust?
| • | If your shares are held in a Brokerage Account, contact your Broker. |
| • | If you have physical possession of your shares in certificate form, contact the Trust’s Transfer Agent: Computershare Shareowner Services LLC, P.O. Box 30170, College Station, TX 77842-3170; (866) 488-3559 |
This report is sent to shareholders of Guggenheim Build America Bonds Managed Duration Trust for their information. It is not a Prospectus, circular or representation intended for use in the purchase or sale of shares of the Trust or of any securities mentioned in this report.
A description of the Trust’s proxy voting policies and procedures related to portfolio securities is available without charge, upon request, by calling the Trust at (866) 392-3004.
Information regarding how the Trust voted proxies for portfolio securities, if applicable, during the most recent 12-month period ended June 30, is also available, without charge and upon request by calling (866) 392-3004, by visiting the Trust’s website at guggenheiminvestments.com/gbab or by accessing the Trust’s Form N-PX on the U.S. Securities and Exchange Commission’s (SEC) website at www.sec.gov.
The Trust files its complete schedule of portfolio holdings with the SEC for the first and third quarters of each fiscal year on Form N-Q. The Trust’s Form N-Q is available on the SEC website at www.sec.gov or the Trust’s website at guggenheiminvestments.com/gbab. The Trust’s Form N-Q may also be viewed and copied at the SEC’s Public Reference Room in Washington, DC; information on the operation of the Public Reference Room may be obtained by calling (800) SEC-0330.
Notice to Shareholders
Notice is hereby given in accordance with Section 23(c) of the Investment Company Act of 1940, as amended, that the Trust from time to time may purchase shares of its common stock in the open market.
GBAB l GUGGENHEIM BUILD AMERICA BONDS MANAGED DURATION TRUST SEMIANNUAL REPORT l 35 |
| ABOUT THE TRUST MANAGERS |
Guggenheim Partners Investment Management, LLC
Guggenheim Partners Investment Management, LLC (“GPIM”) is an indirect subsidiary of Guggenheim Partners, LLC, a diversified financial services firm. The firm provides capital markets services, portfolio and risk management expertise, wealth management, and investment advisory services. Clients of Guggenheim Partners, LLC subsidiaries are an elite mix of individuals, family offices, endowments, foundations, insurance companies and other institutions.
Investment Philosophy
GPIM’s investment philosophy is predicated upon the belief that thorough research and independent thought are rewarded with performance that has the potential to outperform benchmark indexes with both lower volatility and lower correlation of returns over time as compared to such benchmark indexes.
Investment Process
GPIM’s investment process is a collaborative effort between various groups including the Portfolio Construction Group, which utilize proprietary portfolio construction and risk modeling tools to determine allocation of assets among a variety of sectors, and its Sector Specialists, who are responsible for security selection within these sectors and for implementing securities transactions, including the structuring of certain securities directly with the issuers or with investment banks and dealers involved in the origination of such securities.
Guggenheim Funds Distributors, LLC
2455 Corporate West Drive
Lisle, IL 60532
Member FINRA/SIPC
(01/14)
NOT FDIC-INSURED l NOT BANK-GUARANTEED l MAY LOSE VALUE
CEF-GBAB-SAR-1113
Item 2. Code of Ethics.
Not applicable for a semi-annual reporting period.
Item 3. Audit Committee Financial Expert.
Not applicable for a semi-annual reporting period.
Item 4. Principal Accountant Fees and Services.
Not applicable for a semi-annual reporting period.
Item 5. Audit Committee of Listed Registrants.
Not applicable for a semi-annual reporting period.
Item 6. Schedule of Investments.
The Schedule of Investments is included as part of Item 1.
Item 7. Disclosure of Proxy Voting Policies and Procedures for Closed-End Management Investment Companies.
Not applicable for a semi-annual reporting period.
Item 8. Portfolio Managers of Closed-End Management Investment Companies.
(a) Not applicable for a semi-annual reporting period.
(b) There has been no change, as of the date of filing, in any of the Portfolio Managers identified in response to paragraph (a)(1) of this Item in the registrant’s most recent annual report on Form N-CSR.
Item 9. Purchases of Equity Securities by Closed-End Management Investment Company and Affiliated Purchasers.
None.
Item 10. Submission of Matters to a Vote of Security Holders.
The registrant has not made any material changes to the procedures by which shareholders may recommend nominees to the registrant’s Board of Trustees.
Item 11. Controls and Procedures.
(a) The registrant's principal executive officer and principal financial officer have evaluated the registrant's disclosure controls and procedures (as defined in Rule 30a-3(c) under the Investment Company Act) as of a date within 90 days of this filing and have concluded based on such evaluation, as required by Rule 30a-3(b) under the Investment Company Act, that the registrant's disclosure controls and procedures were effective, as of that date, in ensuring that information required to be disclosed by the registrant in this Form N-CSR was recorded, processed, summarized, and reported within the time periods specified in the Securities and Exchange Commission’s rules and forms.
(b) There were no changes in the registrant’s internal control over financial reporting (as defined in Rule 30a-3(d) under the Investment Company Act) that occurred during the registrant’s second fiscal quarter of the period covered by this report that have materially affected, or are reasonably likely to materially affect, the registrant’s internal control over financial reporting.
Item 12. Exhibits.
(a)(1) Not applicable
(a)(2) Certifications of principal executive officer and principal financial officer pursuant to Rule 30a-2(a) under the Investment Company Act.
(a)(3) Not applicable.
(b) Certification of principal executive officer and principal financial officer pursuant to Rule 30a-2(b) under the Investment Company Act and Section 906 of the Sarbanes-Oxley Act of 2002.
SIGNATURES
Pursuant to the requirements of the Securities Exchange Act of 1934 and the Investment Company Act of 1940, the registrant has duly caused this report to be signed on its behalf by the undersigned, thereunto duly authorized.
(Registrant) Guggenheim Build America Bonds Managed Duration Trust
By: /s/ Donald C. Cacciapaglia
Name: Donald C. Cacciapaglia
Title: Chief Executive Officer
Date: February 6, 2014
Pursuant to the requirements of the Securities Exchange Act of 1934 and the Investment Company Act of 1940, this report has been signed by the following persons on behalf of the registrant and in the capacities and on the dates indicated.
By: /s/ Donald C. Cacciapaglia
Name: Donald C. Cacciapaglia
Title: Chief Executive Officer
Date: February 6, 2014
By: /s/ John L. Sullivan
Name: John L. Sullivan
Title: Chief Financial Officer, Chief Accounting Officer and Treasurer
Date: February 6, 2014