UNITED STATES
SECURITIES AND EXCHANGE COMMISSION
Washington, D.C. 20549
FORM N-CSR
CERTIFIED SHAREHOLDER REPORT OF REGISTERED MANAGEMENT
INVESTMENT COMPANIES
Investment Company Act file number 811-22437
Guggenheim Build America Bonds Managed Duration Trust
(Exact name of registrant as specified in charter)
227 West Monroe Street, Chicago, IL 60606
(Address of principal executive offices) (Zip code)
Amy J. Lee
227 West Monroe Street, Chicago, IL 60606
(Name and address of agent for service)
Registrant's telephone number, including area code: (312) 827-0100
Date of fiscal year end: May 31
Date of reporting period: June 1, 2014 – November 30, 2014
Item 1. Reports to Stockholders.
The registrant's annual report transmitted to shareholders pursuant to Rule 30e-1 under the Investment Company Act of 1940, as amended (the “Investment Company Act”), is as follows:
GUGGENHEIMINVESTMENTS.COM/GBAB
... YOUR WINDOW TO THE LATEST, MOST UP-TO-DATE INFORMATION ABOUT THE GUGGENHEIM
BUILD AMERICA BONDS MANAGED DURATION TRUST
The shareholder report you are reading right now is just the beginning of the story. Online at guggenheiminvestments.com/gbab, you will find:
| · | Daily, weekly and monthly data on share prices, net asset values, distributions and more |
| · | Monthly portfolio overviews and performance analyses |
| · | Announcements, press releases and special notices |
| · | Fund and adviser contact information |
Guggenheim Partners Investment Management, LLC and Guggenheim Funds Investment Advisors, LLC are continually updating and expanding shareholder information services on the Trust’s website in an ongoing effort to provide you with the most current information about how your Trust’s assets are managed and the results of our efforts. It is just one more small way we are working to keep you better informed about your investment in the Trust.
DEAR SHAREHOLDER
We thank you for your investment in the Guggenheim Build America Bonds Managed Duration Trust (the “Trust”). This report covers the Trust’s performance for the six-month period ended November 30, 2014.
The Trust’s primary investment objective is to provide current income with a secondary objective of long-term capital appreciation. Under normal market conditions, the Trust invests at least 80% of its net assets, plus the amount of any borrowings for investment purposes, in a diversified portfolio of taxable municipal securities known as Build America Bonds.
All Trust returns cited—whether based on net asset value (“NAV”) or market price—assume the reinvestment of all distributions.
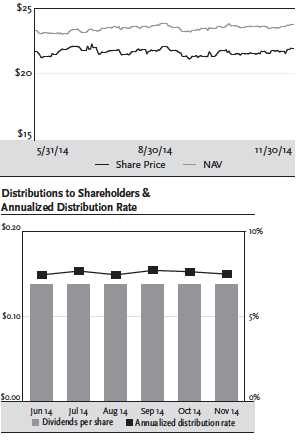
For the six-month period ended November 30, 2014, the Trust provided a total return based on market price of 5.09% and a total return based on NAV of 5.80%. As of November 30, 2014, the Trust’s market price of $21.94 per share represented a discount of 7.66% to its NAV of $23.76 per share. The market value of the Trust’s shares fluctuates from time to time and it may be higher or lower than the Trust’s NAV. NAV performance data reflects fees and expenses of the Trust.
The Trust made a distribution of $0.13817 for each month of the period. This represents an annualized distribution rate of 7.56% based on the Trust’s closing market price of $21.94 on November 30, 2014.
Guggenheim Funds Investment Advisors, LLC (“GFIA” or the “Adviser”) serves as the investment adviser to the Trust. Guggenheim Partners Investment Management, LLC (“GPIM” or the “Sub-Adviser”) serves as the Trust’s investment sub-adviser and is responsible for the management of the Trust’s portfolio of investments. Each of the Adviser and the Sub-Adviser is an affiliate of Guggenheim Partners, LLC (“Guggenheim”), a global diversified financial services firm.
We encourage shareholders to consider the opportunity to reinvest their distributions from the Trust through the Dividend Reinvestment Plan (“DRIP”), which is described in detail on page 36 of this report. When shares trade at a discount to NAV, the DRIP takes advantage of the discount by reinvesting the monthly dividend distribution in common shares of the Trust purchased in the market at a price less than NAV. Conversely, when the market price of the Trust’s common shares is at a premium above NAV, the DRIP reinvests participants’ dividends in newly-issued common shares at the greater of NAV per share of 95% of the market price per share. The DRIP provides a cost effective means to accumulate additional shares and enjoy the benefits of compounding returns over time. Since the Trust endeavors to maintain a steady monthly distribution rate, the DRIP effectively provides an income averaging technique, which causes shareholders to accumulate a larger number of Trust shares when the share price is lower than when the price is higher.
To learn more about the Trust’s performance and investment strategy for the semiannual period ended November 30, 2014, we encourage you to read the Questions & Answers section of this report, which begins on page 4. We are honored that you have chosen the Guggenheim Build America Bonds Managed Duration Trust as part of your investment portfolio. For the most up-to-date information regarding your investment, please visit the Trust’s website at guggenheiminvestments.com/gbab.
Sincerely,
Donald C. Cacciapaglia
President and Chief Executive Officer
Guggenheim Build America Bonds Duration Trust
December 31, 2014
GBAB l GUGGENHEIM BUILD AMERICA BONDS MANAGED DURATION TRUST SEMIANNUAL REPORT l 3
| QUESTIONS & ANSWERS | November 30, 2014 |
Guggenheim Build America Bonds Managed Duration Trust (the “Trust”) is managed by a team of seasoned professionals at Guggenheim Partners Investment Management, LLC (“GPIM” or the “Sub-Adviser”). This team includes B. Scott Minerd, Chairman of Investments and Global Chief Investment Officer; Anne B. Walsh, CFA, JD, Senior Managing Director; and James E. Pass, Senior Managing Director. In the following interview, the investment team discusses the market environment and the Trust’s strategy and performance for the six-month period ended November 30, 2014.
What were the most important developments in the Trust over the past six months?
The Trust’s performance remained strong for the period, as interest rates remained low and spreads continued to contract. The Trust’s market price return experienced excess performance for the period, outperforming its benchmark, the Bank of America Merrill Lynch Build America Bond Index, by 31 basis points, and many other sectors of the bond market. The Trust during the period entered into interest rate swaps to help manage the cost of leverage and, indirectly, to manage duration. One issue facing the Build American Bonds (“BABs”) market is the reduction in the federal government subsidy to issuers. The 35% subsidy in effect when the bonds were first issued was reduced with the sequestration in 2013. For fiscal 2015, the subsidy is 27.5%. Thus far, the lower subsidy has not negatively affected the BABs market.
What is the Trust’s investment objective and how is it pursued?
The Trust’s primary investment objective is to provide current income with a secondary objective of long-term capital appreciation. The Trust seeks to achieve its investment objectives by investing primarily in a diversified portfolio of taxable municipal securities known as Build America Bonds or BABs. Under normal market conditions, the Trust invests at least 80% of its managed assets (net assets plus leverage) (“managed assets”) in BABs. The Trust may invest up to 20% of its managed assets in securities other than BABs, including taxable municipal securities that do not qualify for federal subsidy payments under the American Recovery and Reinvestment Act of 2009 (the “Act”), municipal securities, the interest income from which is exempt from regular federal income tax (sometimes referred to as “tax-exempt municipal securities”), asset-backed securities (“ABS”), senior loans and other income-producing securities.
At least 80% of the Trust’s Managed Assets are invested in securities that, at the time of investment, are investment grade quality. The Trust may invest up to 20% of its Managed Assets in securities that, at the time of investment, are below investment grade quality. Securities of below investment grade quality are regarded as having predominantly speculative characteristics with respect to capacity to pay interest and repay principal. The Trust does not invest more than 25% of its Managed Assets in municipal securities in any one state of origin or more than 15% of its Managed Assets in municipal securities that, at the time of investment, are illiquid.
BABs are taxable municipal securities that include bonds issued by state and local governments to finance capital projects such as public schools, roads, transportation infrastructure, bridges, ports and public buildings, pursuant to the Act. In contrast to traditional municipal bonds, interest received on BABs is subject to federal income tax and may be subject to state income tax. However, issuers of Direct Payment BABs are eligible to receive a subsidy from the U.S. Treasury of up to 35% of the interest paid on the bonds, allowing such issuers to issue BABs that pay interest rates that are competitive with the rates typically paid by private bond issuers in the taxable fixed-income market.
The Sub-Adviser employs investment and trading strategies to seek to maintain the leverage-adjusted duration of the Trust’s portfolio to generally less than 10 years. At November 30, 2014 the Trust’s duration was approximately 9 years. (Duration is a measure of a bond’s price sensitivity to changes in interest rates, expressed in years. Duration is a weighted average of the times that interest payments and the final return of principal are received. The weights are the amounts of the payments discounted by the yield to maturity of the bond.)
In addition, the Sub-Adviser may seek to manage the duration of the Trust’s portfolio through the use of derivative instruments, including U.S. Treasury swaps, credit default swaps, total return swaps and futures contracts, in an attempt to reduce the overall volatility of the Trust’s portfolio to changes in market interest rates. As noted, the Sub-Adviser did use such derivative instruments to manage the duration of the Trust’s portfolio during the period. The Sub-Adviser may seek to manage the Trust’s duration in a flexible and opportunistic manner based primarily on then-current market conditions and interest rate levels. The Trust may incur costs in implementing the duration management strategy, but such strategy will seek to reduce the volatility of the Trust’s portfolio.
What were the significant events affecting the economy and market environment over the past six months?
The U.S. economy continued to grow through the six months ended November 30, 2014, despite some seasonal volatility in September and October that caused spreads in leveraged credit to widen and upward momentum in U.S. stocks to deteriorate. By the end of October, the spread widening had reversed and equities regained their footing, with some key indices shooting to new highs. Markets similarly overcame a weather-related winter soft patch in the first quarter of 2014. The benchmark U.S. 10 year Treasury rate declined from 2.5% to 2.165% over the period, a positive stimulant to continued economic expansion.
4 l GBAB l GUGGENHEIM BUILD AMERICA BONDS MANAGED DURATION TRUST SEMIANNUAL REPORT
| QUESTIONS & ANSWERS continued | November 30, 2014 |
U.S. economic data remain strong, with the third quarter’s 3.5% GDP growth signaling that the economy was doing well across the spectrum. Among the highlights: strong net exports, unemployment that had fallen faster than expected and consumer confidence that was at seven year highs. The fact that government at the state and local level was contributing to GDP growth suggested that a major headwind for the economy—contracting government spending—has gone away. While falling oil prices are helping consumer spending in the near term, they could be signaling that the global economy is not growing fast enough.
The U.S. is adding close to 225,000 jobs per month on average in 2014, considerably more than 2013’s monthly average of 194,000. Employment levels are transitioning from the recovery phase to the expansion phase, which typically coincides with accelerating economic activity. The downward trend in labor force participation has begun to flatten and, as fewer people leave the workforce, the rapid decline in the nation’s unemployment rate could begin to slow. Until unemployment falls below 5.5%, it’s unlikely that the U.S. economy will experience the kind of meaningful wage pressure that would spur action by the Federal Reserve (the “Fed”). An improving labor market, subdued mortgage rates, and tight housing inventory all point to a rebound in the housing market.
The economies of Europe and Asia continue to deteriorate. The ECB is attempting to inject liquidity into the system, as their current program is not large enough to boost growth. Germany just barely avoided a recession in the third quarter. The Japanese economy is now officially in a recession. The first two arrows of Abenomics, monetary accommodation and fiscal stimulus, were relatively easy, but the third arrow of structural reform has been much more elusive.
Overseas geopolitical concerns and comparatively attractive yields have pushed global investors to U.S. Treasuries. Such “beggar thy neighbor” policies from Europe and Asia were a driving force behind the most recent rally in U.S. fixed income, and indicate that U.S. long-term rate should continue to be well supported. Momentum in the U.S. continued into the fourth quarter, with December’s seasonal effects and the boost from declining fuel prices. Fed tightening expectations continue to decrease on the back of concerns about a global growth slowdown.
How did the Trust perform for the six months ended November 30, 2014?
All Trust returns cited—whether based on net asset value (“NAV”) or market price—assume the reinvestment of all distributions. For the six-month period ended November 30, 2014, the Trust provided a total return based on market price of 5.09% and a total return based on NAV of 5.80%. As of November 30, 2014, the Trust’s market price of $21.94 per share represented a discount of 7.66% to its NAV of $23.76 per share. As of May 31, 2014, the Trust’s market price of $21.69 per share represented a discount of 6.75% to its NAV of $23.26 per share. The market value of the Trust’s shares fluctuates from time to time and it may be higher or lower than the Trust’s NAV. NAV performance data reflects fees and expenses of the Trust.
The Trust made a distribution of $0.13817 for each month of the period. This represents an annualized distribution rate of 7.56% based on the Trust’s closing market price of $21.94 on November 30, 2014. The Trust’s distribution rate is not constant and is subject to change based on the performance of the Trust.
Month | Distribution per Share |
June 2014 | $0.13817 |
July | $0.13817 |
August | $0.13817 |
September | $0.13817 |
October | $0.13817 |
November | $0.13817 |
Total | $0.82902 |
How did other markets perform in this environment?
The return of the Bank of America Merrill Lynch Build America Bond Index was 4.78% for the six months ended November 30, 2014. In other fixed income sectors, the Barclays U.S. Aggregate Bond Index returned 1.92% for the period, while the Barclays U.S. Corporate High Yield Index returned -0.60%. The Credit Suisse Leveraged Loan Index return was 1.02%.
What factors affected Trust performance during the six-month period ended November 30, 2014?
Contracting taxable municipal spreads, including BAB spreads, was the main contributor to performance for the period, despite the third-quarter sell-off in high yield bonds. The Trust benefited from good credit selection as part of its bottom-up, downside-protection-led approach. The Trust was helped by attractive risk-adjusted investment opportunities in the A rated category of taxable municipals, as well as in certain story bonds as long as strong legal covenants were present.
The portfolio continues to deal with some price movement of BABs and Qualified School Construction Bonds (“QSCBs”) due to the potential for refinancing in these sectors. Certain issuers have elected to refinance outstanding BABs at par as a result of sequestration and lower expense subsidy. Nonetheless, refunding volume, as the Sub-Adviser expected, was limited and did not materially impact the BABs market during the period. Nonetheless, we expect more issuers to review their BABs and other direct payment indentures for refinancing alternatives as sequestration continues to have an impact on the market.
GBAB l GUGGENHEIM BUILD AMERICA BONDS MANAGED DURATION TRUST SEMIANNUAL REPORT l 5
| QUESTIONS & ANSWERS continued | November 30, 2014 |
In the non-BABs component of the portfolio, the sell-off in high yield in the third quarter was the biggest factor affecting performance. Over the quarter, for example, high-yield bonds fell by 1.9 percent, with CCC bonds underperforming higher rated BB bonds and B bonds by 200 basis points and 150 basis points, respectively. We continue to see opportunity for strong returns in the high yield market, though we are conscious of a larger number of issues coming to market that exhibit lower credit quality and weaker security structures.
The lowest quality credits remain highly vulnerable to volatility in the current environment. The Trust took opportunities during the sell-off to carefully analyze bonds we believed may have been oversold and trading below fair value. We remain positive on credit, but with the potential for more volatility ahead, we continued to gradually move up in quality.
The Trust’s exposure to floating rate assets (primarily bank loans) acted as a buffer to market volatility and their position higher in the capital structure makes them a defensive asset class during periods of market/interest rate volatility. They function as an attractive asset as the credit cycle changes, particularly as interest rates rise. The loan market benefited from strong institutional demand from collateralized loan obligations (“CLOs”) and loan funds over much of the period. For example, CLO issuance is ahead of 2013 full-year volume and has already set a new annual record.
Discuss Trust asset allocation for the six-month period ended November 30, 2014?
As of November 30, 2014, approximately 81% of the Trust’s long-term investments were in the taxable municipal sector, including BABs and QSCBs, which are qualifying investments for purposes of the Trust’s policy of investing at least 80% of its managed assets in BABs. The rest of the Trust’s assets, approximately 19% of the Trust’s long-term investments, were invested in non-BABs securities. These include asset-backed securities, bank loans, corporate bonds (including high yield bonds) and other securities, by which the Trust was able to add incremental yield.
The most significant change within non-BABs over the period was a decrease in below-investment-grade corporate debt, as the Trust sold high yield securities given rich valuations and weak legal covenants. The Trust also sold some bank loans for similar reasons, but continued adding new bank loans for their floating rate feature that helped spread duration decline. The Trust also increased floating rate exposure to better align the non-BABs portion of the Trust with funding costs.
The Trust believes there is sufficient liquidity within non-BABs holdings to manage a decline in the value of BABs holdings, in the event an increase in interest rates causes BABs prices to decline enough to approach the 80% minimum.
What is the Trust’s leverage strategy?
Since leverage adds to performance when the cost of leverage is less than the total return generated by investments, the use of leverage contributed to the Trust’s total return during this period. The Trust utilizes leverage (borrowing) as part of its investment strategy, to finance the purchase of additional securities that provide increased income and potentially greater appreciation potential to common shareholders than could be achieved from a portfolio that is not leveraged. Leverage will not exceed 33 1/ 3% of the Trust’s Managed Assets.
As of November 30, 2014, the Trust’s leverage was approximately 25% of Managed Assets. The Trust currently employs leverage through reverse repurchase agreements with at least three different counterparties and a credit facility with a major bank. We have been notified that the bank plans to terminate this facility. The Trust is taking steps to substitute the line of credit with another provider.
There is no guarantee that the Trust’s leverage strategy will be successful. The Trust’s use of leverage may cause the Trust’s NAV and market price of common shares to be more volatile and can magnify the effect of any losses.
Why did the Trust accrue excise tax during the period?
While the Trust generally intends to distribute income and capital gains in the manner necessary to minimize imposition of the 4% excise tax imposed on a registered investment company that does not distribute by the end of any calendar year at least the sum of (i) 98% of its ordinary income (not taking into account any capital gain or loss) for the calendar year and (ii) 98.2% of its capital gain in excess of its capital loss (adjusted for certain ordinary losses) for a one-year period generally ending on October 31 of the calendar year (unless an election is made to use the fund’s fiscal year), there can be no assurance that sufficient amounts of the Trust’s taxable income and capital gain will be distributed to entirely avoid the imposition of the excise tax. In certain circumstances, the Trust may elect to retain income or capital gain and pay the excise tax on such undistributed amount, to the extent that the Board of Trustees, in consultation with Trust management, determines it to be in the best interest of shareholders at that time.
What is the current outlook for the taxable municipal sector that includes Build America Bonds?
The creation of BABs in 2009 helped issuance of taxable municipal bonds exceed $84 billion in 2009 and $100 billion in 2010, but since the BAB program was allowed to expire, issuance has fallen to historical figures, approximately $30-$35 billion per year, or about 10% of total municipal issuance.
6 l GBAB l GUGGENHEIM BUILD AMERICA BONDS MANAGED DURATION TRUST SEMIANNUAL REPORT
| QUESTIONS & ANSWERS continued | November 30, 2014 |
As investors begin to look towards 2015, low yields and tight credit spreads have created a market environment with little room for error. Taxable issuance should remain muted next year. With limited issuance and the fact that municipal defaults continue to remain low, attractive risk-adjusted investment opportunities do exist, but remain limited as technical issues continue to support this market segment. Potential for increased volatility remains high due to macroeconomic issues and geopolitical concerns. With the end of quantitative easing, municipals generally should move in concert with Treasury price movements, given global economic concerns and accommodative Fed policies.
Index Definitions:
Indices are unmanaged and reflect no expenses. It is not possible to invest directly in an index.
The Barclays U.S. Aggregate Bond Index represents securities that are U.S. domestic, taxable, and dollar denominated. The index covers the U.S. investment grade fixed rate bond market, with index components for government and corporate securities, mortgage pass-through securities, and asset-backed securities.
The Barclays U.S. Corporate High Yield Index is an unmanaged index of below investment grade bonds issued by U.S. corporations.
The Credit Suisse Leveraged Loan Index is an index designed to mirror the investable universe of the $US-denominated leveraged loan market.
Risks and Other Considerations
The views expressed in this report reflect those of the portfolio managers only through the report period as stated on the cover. These views are subject to change at any time, based on market and other conditions and should not be construed as a recommendation of any kind. The material may also include forward looking statements that involve risk and uncertainty, and there is no guarantee that any predictions will come to pass. There can be no assurance that the Trust will achieve its investment objectives. The value of the Trust will fluctuate with the value of the underlying securities. Historically, closed-end funds often trade at a discount to their net asset value.
Please see guggenheiminvestments.com/ggm for a detailed discussion of the Trust’s risks and considerations.
GBAB l GUGGENHEIM BUILD AMERICA BONDS MANAGED DURATION TRUST SEMIANNUAL REPORT l 7
| TRUST SUMMARY (Unaudited) | November 30, 2014 |
Fund Statistics | |
Share Price | $21.94 |
Net Asset Value | $23.76 |
Discount to NAV | -7.66% |
Net Assets ($000) | $413,765 |
AVERAGE ANNUAL TOTAL RETURNS FOR THE |
PERIOD ENDED NOVEMBER 30, 2014 | | |
| | Six | | | Since |
| | Months | One | Three | Inception |
| | (non-annualized) | Year | Year | (10/28/10) |
Guggenheim Build America Bonds Managed Duration Trust | |
NAV | 5.80% | 17.04% | 10.11% | 12.76% |
Market | 5.09% | 23.60% | 9.41% | 9.77% |
Performance data quoted represents past performance, which is no guarantee of future results and current performance may be lower or higher than the figures shown. The NAV total returns reflect the Trust’s total annual expenses. For the most recent month-end performance figures, please visit guggenheiminvestments.com/gbab. The investment return and principal value of an investment will fluctuate with changes in the market conditions and other factors so that an investor’s shares, when sold, may be worth more or less than their original cost.
Holdings Diversification | |
(Market Exposure as % of Net Assets) | |
Investments | % of Net Assets |
Investments: | |
Municipal Bond | 108.3% |
Asset Backed Securities | 8.7% |
Senior Floating Rate Interests | 5.3% |
Corporate Bonds | 4.3% |
Preferred Stocks | 1.8% |
Collateralized Mortgage Obligation | 0.3% |
Money Market Fund | 0.1% |
Other | 0.0%* |
Total Investments | 128.8% |
Other Assets & Liabilities, net | -28.8% |
Net Assets | 100.0% |
*Less than 0.1% | |
Ten Largest Holdings | |
(% of Total Net Assets) | |
State of West Virginia, Higher Education Policy Commission, | |
Revenue Bonds, Federally Taxable Build America Bonds 2010 | 3.5% |
New Jersey Turnpike Authority, Turnpike Revenue Bonds, | |
Federally Taxable Issuer Subsidy, Build America Bonds | 3.4% |
Dallas, Texas, Convention Center Hotel Development | |
Corporation, Hotel Revenue Bonds, Taxable Build | |
America Bonds | 3.2% |
California, General Obligation Bonds, Various Purpose, | |
Taxable Build America Bonds | 3.0% |
Los Angeles, California, Department of Water & Power | |
Revenue, Taxable Build America Bonds | 3.0% |
Westchester County Health Care Corporation, Revenue | |
Bonds, Taxable Build America Bonds | 2.9% |
Los Angeles, California, Department of Water & Power | |
Revenue, Taxable Build America Bonds | 2.9% |
Noblesville Multi-School Building Corporation, Hamilton | |
County, Indiana, Taxable Unlimited Ad Valorem Property | |
Tax First Mortgage Bonds, Build America Bonds | 2.9% |
El Paso, Texas, Combination Tax and Revenue Certification | |
of Obligation, Taxable Build America Bonds | 2.9% |
Miami-Dade County, Florida, Transit Sales Surtax Revenue, | |
Taxable Build America Bonds | 2.8% |
Top Ten Total | 30.5% |
Share Price & NAV History
8 l GBAB l GUGGENHEIM BUILD AMERICA BONDS MANAGED DURATION TRUST SEMIANNUAL REPORT
| PORTFOLIO OF INVESTMENTS (Unaudited) | November 30, 2014 |
| | Shares | Value |
COMMON STOCKS† - 0.0%** | | |
Communications - 0.0%** | | |
Cengage Learning Acquisitions, Inc.* | 3,457 | $ 91,403 |
Basic Materials - 0.0%** | | |
Mirabela Nickel Ltd.* | 335,401 | 9,987 |
Consumer, Cyclical - 0.0% | | |
Global Aviation Holdings, Inc. — Class A*,†††,1,6 | 6,232 | 1 |
Total Common Stocks | | |
(Cost $196,350) | | 101,391 |
PREFERRED STOCKS† - 1.8% | | |
Seaspan Corp. | | |
9.50%2 | 200,000 | 5,318,000 |
Falcons Funding Trust I | | |
8.88%2,3,4,6 | 1,900 | 1,939,900 |
GSC Partners CDO Fund Limited / GSC Partners CDO Fund Corp. | |
0.00% due 11/20/16*,3,4 | 475 | 8,759 |
WhiteHorse II Ltd. | | |
0.00% due 06/15/17*,3,4,6 | 200,000 | 2,000 |
Total Preferred Stocks | | |
(Cost $6,961,640) | | 7,268,659 |
WARRANTS††† - 0.0%** | | |
Alion Science & Technology Corp. | | |
03/15/17 | 1,550 | – |
Total Warrants | | |
(Cost $16) | | – |
MONEY MARKET FUND† - 0.1% | | |
Dreyfus Treasury Prime Cash Management Institutional Shares | 213,382 | 213,382 |
Total Money Market Fund | | |
(Cost $213,382) | | 213,382 |
| | Face | |
| | Amount | Value |
MUNICIPAL BONDS†† - 108.3% | | |
California - 22.4% | | |
Los Angeles, California, Department of Water & Power | | |
Revenue, Taxable Build America Bonds | | |
7.00% due 07/01/417 | $ 10,000,000 | $ 12,231,000 |
7.00% due 07/01/417 | 10,000,000 | 12,001,100 |
Santa Ana Unified School District, California, General | | |
Obligation Bonds, Federal Taxable Build America Bonds | | |
7.10% due 08/01/407 | 7,755,000 | 10,197,282 |
6.80% due 08/01/307 | 2,245,000 | 2,816,308 |
California, General Obligation Bonds, Various Purpose, | | |
Taxable Build America Bonds | | |
7.70% due 11/01/307 | 10,000,000 | 12,597,899 |
Oakland Unified School District, County of Alameda, | | |
California, Taxable General Obligation Bonds, Election of | | |
2006, Qualified School Construction Bonds, Series 2012B | | |
6.88% due 08/01/336 | 10,000,000 | 10,499,300 |
Long Beach Unified School District, California, Qualified | | |
School Construction Bonds, Federally Taxable, Election of | | |
2008, General Obligation Bonds | | |
5.91% due 08/01/256 | 7,500,000 | 8,877,375 |
Metropolitan Water District, Southern California, Water | | |
Revenue Bonds, 2010 Authorization, Taxable Build | | |
America Bonds | | |
6.95% due 07/01/407 | 5,000,000 | 6,000,950 |
Riverside Community College District, Riverside County, | | |
California, Election of 2004 General Obligation Bonds, | | |
Taxable Build America Bonds | | |
7.02% due 08/01/407 | 5,000,000 | 5,739,150 |
Sonoma Valley Unified School District, General Obligation, | | |
Federally Taxable Bonds | | |
7.12% due 08/01/286 | 3,330,000 | 3,858,671 |
Culver City Redevelopment Agency, California, Taxable Tax | | |
Allocation Bonds, Culver City Redevelopment Project | | |
8.00% due 11/01/206 | 3,000,000 | 3,336,990 |
Monrovia Unified School District, Los Angeles County, | | |
California, Election of 2006 General Obligation Bonds, | | |
Build America Bonds, Federally Taxable | | |
7.25% due 08/01/286,7 | 1,025,000 | 1,224,803 |
Cypress Elementary School District (Orange County, | | |
California), General Obligation Bonds, Direct Pay | | |
Qualified School Construction Bonds, 2008 Election | | |
6.65% due 08/01/256 | 660,000 | 739,662 |
6.05% due 08/01/216 | 340,000 | 371,572 |
Placentia-Yorba Linda Unified School District (Orange | | |
County, California), General Obligation Bonds, Federally | | |
Taxable Direct-Pay Qualified School Construction Bonds, | | |
Election of 2008 | | |
5.40% due 02/01/266 | 1,000,000 | 1,087,310 |
Alhambra Unified School District, Elementary Schools | | |
Improvement District, Los Angeles County, California, | | |
Election of 2008 General Obligation Bonds, Federally Taxable | | |
6.70% due 02/01/266 | 500,000 | 582,225 |
Total California | | 92,161,597 |
Illinois - 10.6% | | |
Northern Illinois University, Auxiliary Facilities System | | |
Revenue Bonds, Build America Program, Taxable | | |
8.15% due 04/01/417 | 5,000,000 | 5,920,050 |
7.95% due 04/01/356,7 | 4,500,000 | 5,304,330 |
Chicago, Illinois, Second Lien Wastewater Transmission | | |
Revenue Project Bonds, Taxable Build America Bonds | | |
6.90% due 01/01/407 | 5,100,000 | 6,741,078 |
Illinois, General Obligation Bonds, Taxable Build | | |
America Bonds | | |
7.35% due 07/01/357 | 5,000,000 | 5,841,800 |
Chicago, Illinois, Board of Education, Unlimited Tax General | | |
Obligation Bonds, Dedicated Revenues, Taxable Build | | |
America Bonds | | |
6.52% due 12/01/406,7 | 5,000,000 | 5,131,850 |
County of Cook Illinois General Obligation Unlimited | | |
6.22% due 11/15/346 | 4,210,000 | 4,664,932 |
Chicago, Illinois, Second Lien Water Revenue Bonds, | | |
Taxable Build America Bonds | | |
6.74% due 11/01/406,7 | 2,990,000 | 3,894,236 |
See notes to financial statements.
GBAB l GUGGENHEIM BUILD AMERICA BONDS MANAGED DURATION TRUST SEMIANNUAL REPORT l 9
| PORTFOLIO OF INVESTMENTS (Unaudited) continued | November 30, 2014 |
| | Face | |
| | Amount | Value |
MUNICIPAL BONDS†† - 108.3% (continued) | | |
Illinois - 10.6% (continued) | | |
Southwestern Illinois, Development Authority, Taxable | | |
Local Government, Program Revenue Bonds, Flood | | |
Prevention District Council Project, Recovery Zone | | |
Economic Development Bonds | | |
7.23% due 10/15/356 | $ 3,000,000 | $ 3,386,520 |
Southwestern Illinois, Development Authority, Taxable | | |
Local Government, Program Revenue Bonds, Flood | | |
Prevention District Project, Build America Bonds | | |
7.03% due 04/15/326,7 | 2,000,000 | 2,238,280 |
State of Illinois General Obligation Unlimited | | |
6.63% due 02/01/35 | 930,000 | 1,032,412 |
6.73% due 04/01/35 | 200,000 | 223,108 |
Total Illinois | | 44,378,596 |
Washington - 10.0% | | |
Washington State University, Housing and Dining System | | |
Revenue Bonds, Taxable Build America Bonds | | |
7.40% due 04/01/416,7 | 6,675,000 | 9,507,669 |
7.10% due 04/01/326,7 | 3,325,000 | 4,397,845 |
Public Hospital District No. 1, King County, Washington, | | |
Valley Medical Center, Hospital Facilities Revenue Bonds | | |
8.00% due 06/15/406 | 5,800,000 | 6,591,178 |
Washington State Convention Center Public Facilities | | |
District, Lodging Tax Bonds, Taxable Build America Bonds | | |
6.79% due 07/01/407 | 5,000,000 | 6,249,700 |
Central Washington University, System Revenue Bonds, 2010, | | |
Taxable Build America Bonds | | |
6.50% due 05/01/306,7 | 5,000,000 | 6,228,200 |
Anacortes, Washington, Utility System Improvement | | |
Revenue Bonds, Build America Bonds | | |
6.48% due 12/01/306,7 | 5,000,000 | 5,860,500 |
Auburn, Washington, Utility System Revenue Bonds, | | |
Taxable Build America Bonds | | |
6.40% due 12/01/306,7 | 2,000,000 | 2,237,040 |
Total Washington | | 41,072,132 |
New Jersey - 6.3% | | |
New Jersey Turnpike Authority, Turnpike Revenue Bonds, | | |
Federally Taxable Issuer Subsidy, Build America Bonds | | |
7.10% due 01/01/417 | 10,000,000 | 14,250,700 |
Camden County Improvement Authority, Camden County, | | |
New Jersey, Lease Revenue Bonds, Cooper Medical School | | |
of Rowan University Project | | |
7.75% due 07/01/346 | 8,000,000 | 9,547,600 |
7.85% due 07/01/356 | 2,000,000 | 2,385,780 |
Total New Jersey | | 26,184,080 |
Michigan - 6.2% | | |
Detroit, Michigan, School District, School Building and Site | | |
Bonds, Unlimited Tax General Obligation Bonds, Taxable | | |
Build America Bonds, | | |
6.85% due 05/01/406,7 | 5,000,000 | 5,329,800 |
Whitehall District Schools, Muskegon County, Michigan, | | |
2010 School Building and Site Bonds, General Obligation, | | |
Unlimited Tax Bonds, Taxable Qualified School | | |
Construction Bonds | | |
6.10% due 05/01/266 | 2,500,000 | 2,716,675 |
6.50% due 05/01/296 | 2,000,000 | 2,179,400 |
Detroit City School District General Obligation Unlimited | | |
7.74% due 05/01/396 | 2,640,000 | 3,460,644 |
Fraser Public School District, Macomb County, Michigan, | | |
General Obligation Federally Taxable School Construction | | |
Bonds, 2011 School Building and Site Bonds | | |
6.05% due 05/01/266 | 3,000,000 | 3,374,940 |
Detroit, Michigan, School District, School Building and Site | | |
Bonds, Unlimited Tax General Obligation Bonds, Taxable | | |
Qualified School Construction Bonds | | |
6.65% due 05/01/296 | 2,640,000 | 3,099,782 |
City of Detroit Michigan Water Supply System Revenue | | |
Revenue Bonds | | |
5.00% due 07/01/41 | 1,555,000 | 1,625,799 |
Michigan Finance Authority Revenue Bonds | | |
5.00% due 07/01/31 | 600,000 | 667,008 |
5.00% due 07/01/32 | 400,000 | 442,964 |
5.00% due 07/01/33 | 200,000 | 220,632 |
Oakridge, Michigan, Public Schools, Unlimited Tax General | | |
Obligation Bonds | | |
6.75% due 05/01/263,6 | 1,000,000 | 1,083,230 |
City of Detroit Michigan General Obligation Unlimited | | |
3.49% due 10/07/166 | 1,000,000 | 1,000,000 |
Comstock Park Public Schools, Kent County, Michigan, 2011 | | |
School Building and Site Bonds, General Obligation - | | |
Unlimited Tax, Federally Taxable - Qualified School | | |
Construction Bonds - Direct Payment | | |
6.30% due 05/01/266 | 415,000 | 453,471 |
Total Michigan | | 25,654,345 |
Indiana - 6.2% | | |
Noblesville Multi-School Building Corporation, Hamilton | | |
County, Indiana, Taxable Unlimited Ad Valorem Property Tax | | |
First Mortgage Bonds, Build America Bonds | | |
6.50% due 07/15/307 | 10,000,000 | 11,858,500 |
Evansville-Vanderburgh Independent School Building | | |
Corporation, Unlimited Taxable Ad Valorem Property Tax | | |
First Mortgage Bonds | | |
6.50% due 01/15/306 | 8,690,000 | 10,489,438 |
Knox County, Indiana, Good Samaritan Hospital Project, | | |
Taxable Economic Development Revenue Bonds, Qualified | | |
Energy Conservation Bonds - Direct Payment, Series 2012B | | |
5.90% due 04/01/346 | 3,000,000 | 3,278,640 |
Total Indiana | | 25,626,578 |
See notes to financial statements.
10 l GBAB l GUGGENHEIM BUILD AMERICA BONDS MANAGED DURATION TRUST SEMIANNUAL REPORT
| PORTFOLIO OF INVESTMENTS (Unaudited) continued | November 30, 2014 |
| | | |
| | Face | |
| | Amount | Value |
MUNICIPAL BONDS†† - 108.3% (continued) | | |
Texas - 6.0% | | |
Dallas, Texas, Convention Center Hotel Development | | |
Corporation, Hotel Revenue Bonds, Taxable Build | | |
America Bonds | | |
7.09% due 01/01/426,7 | $ 10,000,000 | $ 13,130,800 |
El Paso, Texas, Combination Tax and Revenue Certification | | |
of Obligation, Taxable Build America Bonds | | |
6.70% due 08/15/366,7 | 10,000,000 | 11,851,400 |
Total Texas | | 24,982,200 |
New York - 5.9% | | |
Metropolitan Transportation Authority, New York, | | |
Transportation Revenue Bonds, Taxable Build | | |
America Bonds | | |
6.55% due 11/15/317 | 5,000,000 | 6,489,000 |
7.13% due 11/15/307 | 5,000,000 | 6,066,250 |
Westchester County Health Care Corporation, Revenue | | |
Bonds, Taxable Build America Bonds | | |
8.57% due 11/01/406,7 | 10,000,000 | 12,033,600 |
Total New York | | 24,588,850 |
Florida - 4.2% | | |
Miami-Dade County, Florida, Transit Sales Surtax Revenue, | | |
Taxable Build America Bonds | | |
6.91% due 07/01/396,7 | 10,000,000 | 11,494,300 |
Orlando, Florida, Community Redevelopment Agency, | | |
Taxable Tax Increment Revenue Build America Bonds | | |
7.78% due 09/01/406,7 | 5,000,000 | 5,825,800 |
Total Florida | | 17,320,100 |
Pennsylvania - 4.1% | | |
Pittsburgh, Pennsylvania, School District, Taxable Qualified | | |
School Construction Bonds | | |
6.85% due 09/01/296 | 6,870,000 | 8,933,061 |
Lebanon, Pennsylvania, Sewer Revenue Bonds, Taxable Build | | |
America Bonds | | |
7.14% due 12/15/356,7 | 4,865,000 | 5,642,524 |
School District of Philadelphia, Pennsylvania, General | | |
Obligation Bonds, Series 2011A, Qualified School | | |
Construction Bonds - (Federally Taxable - Direct Subsidy) | | |
6.00% due 09/01/306 | 2,380,000 | 2,549,623 |
Total Pennsylvania | | 17,125,208 |
West Virginia - 3.5% | | |
State of West Virginia, Higher Education Policy Commission, | | |
Revenue Bonds, Federally Taxable Build America Bonds 2010 | | |
7.65% due 04/01/407 | 10,000,000 | 14,532,300 |
Ohio - 3.2% | | |
American Municipal Power, Inc., Combined Hydroelectric | | |
Projects Revenue Bonds, New Clean Renewable | | |
Energy Bonds | | |
7.33% due 02/15/286 | 5,000,000 | 6,566,650 |
Madison Local School District, Richland County, Ohio, | | |
School Improvement, Taxable Qualified School | | |
Construction Bonds | | |
6.65% due 12/01/296 | 2,500,000 | 2,897,550 |
Cuyahoga County, Ohio, Hospital Revenue Bonds, The | | |
Metrohealth System, Build America Bonds, Taxable | | |
8.22% due 02/15/406,7 | 1,950,000 | 2,387,132 |
Toronto City School District, Ohio, Qualified School | | |
Construction Bonds General Obligation Bonds | | |
7.00% due 12/01/286 | 1,230,000 | 1,343,861 |
Total Ohio | | 13,195,193 |
Colorado - 2.9% | | |
Colorado, Building Excellent Schools Today, Certificates of | | |
Participation, Taxable Build America Bonds | | |
7.02% due 03/15/316,7 | 7,500,000 | 8,706,000 |
Colorado, Building Excellent Schools Today, Certificates of | | |
Participation, Taxable Qualified School Construction | | |
6.82% due 03/15/28 | 2,500,000 | 3,155,250 |
Total Colorado | | 11,861,250 |
Vermont - 2.7% | | |
Vermont State Colleges, Revenue Bonds, Taxable Build | | |
America Bonds | | |
7.21% due 07/01/406,7 | 7,500,000 | 8,728,425 |
6.10% due 07/01/256,7 | 2,155,000 | 2,451,528 |
Total Vermont | | 11,179,953 |
Alabama - 2.7% | | |
Alabama State University, General Tuition and Fee Revenue | | |
Bonds, Taxable Direct-Pay Build America Bonds | | |
7.20% due 09/01/386,7 | 5,000,000 | 5,503,800 |
7.10% due 09/01/356,7 | 3,000,000 | 3,293,760 |
7.25% due 09/01/406,7 | 2,000,000 | 2,204,340 |
Total Alabama | | 11,001,900 |
Nevada - 2.6% | | |
Nevada System of Higher Education University, Revenue | | |
Bonds, Build America Bonds | | |
7.90% due 07/01/407 | 5,050,000 | 5,846,941 |
7.60% due 07/01/307 | 1,500,000 | 1,719,585 |
Clark County, Nevada, Airport Revenue Bonds, Build | | |
America Bonds | | |
6.88% due 07/01/426,7 | 1,425,000 | 1,647,257 |
Las Vegas Valley Water District, Nevada, Limited Tax General | | |
Obligation Water Bonds, Taxable Build America Bonds | | |
7.10% due 06/01/396,7 | 1,200,000 | 1,379,976 |
Total Nevada | | 10,593,759 |
Louisiana - 2.3% | | |
Orleans Parish, School Board of the Parish of | | |
Orleans, Louisiana | | |
4.40% due 02/01/216 | 8,000,000 | 8,554,480 |
Tangipahoa Parish Hospital Service District No. 1, Louisiana, | | |
Taxable Hospital Revenue Bonds, North Oaks Health | | |
System Project, Build America Bonds | | |
7.20% due 02/01/427 | 1,055,000 | 1,137,111 |
Total Louisiana | | 9,691,591 |
See notes to financial statements.
GBAB l GUGGENHEIM BUILD AMERICA BONDS MANAGED DURATION TRUST SEMIANNUAL REPORT l 11
| PORTFOLIO OF INVESTMENTS (Unaudited) continued | November 30, 2014 |
| | Face | |
| | Amount | Value |
MUNICIPAL BONDS†† - 108.3% (continued) | | |
Mississippi - 1.9% | | |
Medical Center Educational Building Corporation, Taxable | | |
Build America Bonds, University of Mississippi Medical | | |
Center Facilities Expansion and Renovation Project | | |
6.84% due 06/01/356,7 | $ 5,000,000 | $ 5,928,000 |
Mississippi, Hospital Equipment and Facilities Authority, | | |
Taxable Build America Revenue Bonds, Forrest County | | |
General Hospital Project | | |
7.27% due 01/01/326,7 | 1,000,000 | 1,105,550 |
7.39% due 01/01/406,7 | 905,000 | 995,310 |
Total Mississippi | | 8,028,860 |
South Carolina - 1.6% | | |
Horry County, South Carolina, Taxable Airport Revenue Bonds, | | |
Recovery Zone Economic Development Bonds | | |
7.33% due 07/01/406 | 5,000,000 | 6,531,150 |
Georgia - 1.3% | | |
Georgia Municipal Association, Inc., Certificates of | | |
Participation, DeKalb County Public Schools Project | | |
5.21% due 12/01/226 | 5,000,000 | 5,581,550 |
South Dakota - 0.9% | | |
Pierre, South Dakota, Taxable Electric Revenue Bonds, | | |
Recovery Zone Economic Development Bonds | | |
7.50% due 12/15/406 | 3,490,000 | 3,811,289 |
Minnesota - 0.8% | | |
St. Paul Housing & Redevelopment Authority, Federally | | |
Taxable Revenue Bonds | | |
7.25% due 02/01/356 | 1,660,000 | 1,814,579 |
7.50% due 02/01/406 | 1,540,000 | 1,688,564 |
Total Minnesota | | 3,503,143 |
Total Municipal Bonds | | |
(Cost $375,104,688) | | 448,605,624 |
ASSET BACKED SECURITIES†† - 8.7% | | |
Churchill Financial Cayman Ltd. | | |
2007-1A, 1.48% due 07/10/193,4,6 | 2,000,000 | 1,913,800 |
2007-1A, 8.37% due 07/10/194,6 | 1,000,000 | 1,007,100 |
2007-1A, 2.83% due 07/10/193,4,6 | 1,000,000 | 937,300 |
Adams Outdoor Advertising, LP | | |
2010-1, 10.76% due 12/20/404,6 | 1,825,000 | 1,919,126 |
2010-1, 8.84% due 12/20/404,6 | 1,300,000 | 1,394,835 |
KVK CLO Ltd. | | |
2014-3A, 2.33% due 10/15/263,4 | 2,000,000 | 1,928,600 |
2014-3A, 3.23% due 10/15/263,4 | 1,000,000 | 958,000 |
Putnam Structured Product Funding 2003-1 Ltd. | | |
2008-1A, 0.60% due 10/15/383,4,6 | 2,592,281 | 2,487,034 |
THL Credit Wind River 2014-2 CLO Ltd. | | |
2014-2A, 2.39% due 07/15/263,4 | 1,000,000 | 964,700 |
2014-2A, 3.39% due 07/15/263,4 | 750,000 | 726,375 |
Gramercy Real Estate CDO 2007-1 Ltd. | | |
2007-1A, 0.51% due 08/15/563,4 | 1,868,833 | 1,652,049 |
N-Star REL CDO VIII Ltd. | | |
2006-8A, 0.51% due 02/01/413,4,6 | 1,500,000 | 1,335,450 |
SRERS Funding Ltd. | | |
2011-RS, 0.40% due 05/09/463,4 | 1,045,282 | 995,631 |
LSTAR Securities Investment Trust 2014-1 | | |
2014-1, 3.25% due 09/01/21†††,3,4 | 981,509 | 982,196 |
Anchorage Capital CLO 2012-1 Ltd. | | |
2012-1A, 3.03% due 01/13/253,4,6 | 1,000,000 | 971,100 |
Vega Containervessel plc | | |
2006-1A, 5.56% due 02/10/214,6 | 977,891 | 965,570 |
Atlas Senior Loan Fund IV Ltd. | | |
2014-2A, 2.93% due 02/17/263,4,6 | 1,000,000 | 943,800 |
Eastland CLO Ltd. | | |
2007-1A, 0.56% due 05/01/223,4,6 | 550,000 | 523,875 |
Marathon CLO Ltd., | | |
3.73% due 10/28/253,4 | 500,000 | 502,250 |
KKR Financial CLO 2007-1 Ltd. | | |
2007-1A, 2.48% due 05/15/213,4,6 | 500,000 | 496,650 |
T2 Income Fund CLO Ltd. | | |
2007-1A, 2.98% due 07/15/193,4,6 | 500,000 | 493,850 |
Neuberger Berman CLO XV | | |
2013-15A, 3.08% due 10/15/253,4 | 500,000 | 479,950 |
Silver Spring CLO Ltd. | | |
2014-1A, 2.32% due 10/15/263,4 | 500,000 | 479,500 |
MCF CLO I LLC | | |
2013-1A, 5.98% due 04/20/233,4 | 500,000 | 468,700 |
Gramercy Park CLO Ltd. | | |
2014-1AR, 4.28% due 07/17/233,4,6 | 250,000 | 246,125 |
0.00% due 07/17/234,5 | 250,000 | 210,075 |
CIFC Funding 2012-I Ltd. | | |
2014-1AR, 3.30% due 08/14/243,4 | 400,000 | 394,960 |
Putnam Structured Product CDO 2002-1 Ltd. | | |
2002-1A, 0.84% due 01/10/383,4,6 | 424,747 | 391,404 |
CIFC Funding 2012-II Ltd. | | |
2012-2A, 3.23% due 12/05/244 | 400,000 | 391,040 |
TICP CLO II Ltd. | | |
2014-2A, 3.23% due 07/20/263,4 | 400,000 | 382,080 |
Cratos CLO Ltd. | | |
2007-1A, 1.33% due 05/19/213,4,6 | 300,000 | 288,690 |
Cerberus Offshore Levered I, LP | | |
2012-1A, 6.23% due 11/30/183,4,6 | 250,000 | 250,150 |
DIVCORE CLO Ltd. | | |
2013-1A B, 4.05% due 11/15/326 | 250,000 | 250,150 |
Regatta V Funding Ltd., | | |
3.38% due 10/25/263,4 | 250,000 | 249,775 |
Race Point V CLO Ltd. | | |
2014-5AR, 3.98% due 12/15/223,4 | 250,000 | 249,425 |
Newstar Commercial Loan Funding 2013-1 LLC | | |
2013-1A, 4.78% due 09/20/233,4 | 250,000 | 245,550 |
Battalion Clo 2007-I Ltd. | | |
2007-1A, 2.38% due 07/14/223,4 | 250,000 | 243,750 |
NewStar Arlington Senior Loan Program LLC | | |
2014-1A, 3.53% due 07/25/253,4 | 250,000 | 243,650 |
See notes to financial statements.
12 l GBAB l GUGGENHEIM BUILD AMERICA BONDS MANAGED DURATION TRUST SEMIANNUAL REPORT
| PORTFOLIO OF INVESTMENTS (Unaudited) continued | November 30, 2014 |
| | Face | |
| | Amount | Value |
ASSET BACKED SECURITIES†† - 8.7% (continued) | | |
Golub Capital Partners CLO 18 Ltd. | | |
2014-18A, 4.23% due 04/25/263,4,6 | $ 250,000 | $ 242,750 |
ING IM CLO 2011-1 Ltd. | | |
2011-1A, 3.53% due 06/22/213,4 | 250,000 | 242,650 |
Fortress Credit Opportunities V CLO Ltd. | | |
2014-5A, 3.78% due 10/15/263,4 | 250,000 | 242,500 |
Black Diamond CLO 2005-2 Delaware Corp. | | |
2005-2A, 2.03% due 01/07/183,4 | 250,000 | 242,07 |
Golub Capital Partners CLO 21M Ltd., | | |
3.53% due 10/25/263,4 | 250,000 | 241,025 |
Ocean Trails CLO IV | | |
2013-4A, 3.23% due 08/13/253,4 | 250,000 | 240,525 |
Monroe Capital CLO 2014-1 Ltd. | | |
2014-1A, 3.82% due 10/22/263,4 | 250,000 | 240,325 |
CIFC Funding 2014-II Ltd. | | |
2014-2A, 3.08% due 05/24/263,4 | 250,000 | 237,600 |
WhiteHorse VIII Ltd. | | |
2014-1A, 2.98% due 05/01/263,4 | 250,000 | 236,250 |
Cerberus Onshore II CLO LLC | | |
2014-1A, 4.23% due 10/15/233,4 | 250,000 | 235,950 |
West Coast Funding Ltd. | | |
2006-1A, 0.37% due 11/02/413,4 | 239,910 | 235,928 |
ALM VII R Ltd. | | |
2013-7RA, 3.68% due 04/24/243,4 | 250,000 | 235,225 |
Wrightwood Capital Real Estate CDO 2005-1 Ltd. | | |
2005-1A, 0.66% due 11/21/403,4 | 250,000 | 230,275 |
Atlas Senior Loan Fund II Ltd. | | |
2012-2A, 0.00% due 01/30/244,5,6 | 250,000 | 227,000 |
Rockwall CDO II Ltd. | | |
2007-1A, 0.78% due 08/01/243,4 | 250,000 | 226,950 |
Mountain Hawk II CLO Ltd., | | |
3.38% due 07/22/243,4 | 250,000 | 224,450 |
Carlyle Global Market Strategies CLO 2012-3 Ltd. | | |
2012-3A, 0.00% due 10/14/244,5,6 | 250,000 | 220,225 |
Finn Square CLO Ltd. | | |
2012-1A, 0.00% due 12/24/234,5 | 250,000 | 213,700 |
Great Lakes CLO 2012-1 Ltd. | | |
2012-1A, 0.00% due 01/15/234,5,6 | 250,000 | 204,150 |
Gallatin CLO VII 2014-1 Ltd. | | |
2014-1A, 3.99% due 07/15/233,4,6 | 200,000 | 193,640 |
Katonah IX CLO Ltd. | | |
2006-9A, 0.95% due 01/25/193,4,6 | 200,000 | 191,500 |
CIFC Funding 2013-II Ltd., | | |
3.83% due 04/21/253,4 | 200,000 | 190,760 |
CIFC Funding 2007-I Ltd. | | |
2007-1A, 1.73% due 05/10/213,4 | 200,000 | 190,420 |
West CLO 2013-1 Ltd., | | |
0.00% due 11/07/254,5 | 250,000 | 184,100 |
Ares XXV CLO Ltd. | | |
2013-3A, 0.00% due 01/17/244,5,6 | 250,000 | 183,225 |
ARES XXVI CLO Ltd. | | |
2013-1A, 0.00% due 04/15/254,5,6 | 250,000 | 181,125 |
Cedar Woods CRE CDO Ltd. | | |
2006-1A, 0.42% due 07/25/51 | 154,114 | 137,624 |
Credit Card Pass-Through Trust 2012-BIZ | | |
2012-BIZ, 0.00% due 12/15/49†††,4,5,6 | 140,391 | 124,330 |
Highland Park CDO I Ltd. | | |
2006-1A, 0.56% due 11/25/513,4,6 | 107,353 | 102,898 |
Raspro Trust | | |
2005-1A, 0.63% due 03/23/243,4,6 | 88,850 | 86,851 |
Insurance Note Capital VII | | |
2005-1R1A, 0.48% due 06/09/333,4,6 | 67,600 | 63,882 |
Diversified Asset Securitization Holdings II, LP | | |
2000-1X, 0.72% due 09/15/353 | 37,240 | 36,570 |
Bush Truck Leasing LLC | | |
2011-AA, 5.00% due 09/25/184,6 | 21,607 | 18,814 |
BlackRock Senior Income Series Corp. | | |
2004-1A, 0.00% due 09/15/164,5,6 | 100,000 | 10 |
Total Asset Backed Securities | | |
(Cost $34,714,147) | | 35,869,567 |
SENIOR FLOATING RATE INTERESTS††,3 - 5.3% | | |
Industrial - 1.6% | | |
HD Supply, Inc. | | |
4.00% due 06/28/18 | 977,500 | 973,834 |
Ceridian Corp. | | |
4.50% due 09/15/20 | 738,760 | 732,296 |
NaNa Development Corp. | | |
8.00% due 03/15/18 | 700,000 | 668,500 |
NVA Holdings, Inc. | | |
4.75% due 08/14/21 | 600,000 | 599,628 |
Transdigm, Inc. | | |
3.75% due 06/04/21 | 498,750 | 493,842 |
Multiplan, Inc. | | |
3.75% due 03/31/21 | 476,636 | 468,804 |
CPM Acquisition Corp. | | |
6.25% due 08/29/17 | 396,051 | 394,071 |
Hunter Defense Technologies | | |
6.50% due 08/05/19 | 400,000 | 394,000 |
Goodpack Ltd. | | |
4.75% due 09/09/21 | 300,000 | 300,000 |
Sabre, Inc. | | |
4.00% due 02/19/19 | 295,755 | 293,377 |
Amber Bidco Foster + Partners | | |
4.73% due 06/30/21†††,1 | 250,000 | 245,207 |
SIRVA Worldwide, Inc. | | |
7.50% due 03/27/19 | 246,250 | 244,403 |
Element Materials Technology | | |
5.25% due 08/06/21 | 200,000 | 198,500 |
SI Organization | | |
5.75% due 11/23/19 | 187,876 | 187,760 |
See notes to financial statements.
GBAB l GUGGENHEIM BUILD AMERICA BONDS MANAGED DURATION TRUST SEMIANNUAL REPORT l 13
| PORTFOLIO OF INVESTMENTS (Unaudited) continued | November 30, 2014 |
| | Face | |
| | Amount | Value |
SENIOR FLOATING RATE INTERESTS†† - 5.3% (continued) | | |
Industrial - 1.6% (continued) | | |
Minimax Viking | | |
4.25% due 08/14/20 | $ 150,000 | $ 150,000 |
Univision Communications, Inc. | | |
4.00% due 03/01/20 | 99,747 | 98,656 |
Hunter Fan Co. | | |
6.55% due 12/20/17 | 88,505 | 88,173 |
Global Aviation Holdings, Inc. | | |
3.00% due 02/13/18†††,1 | 38,996 | – |
10.00% due 07/13/17†††,1 | 119,273 | – |
Total Industrial | | 6,531,051 |
Technology - 1.0% | | |
Paradigm Ltd | | |
4.75% due 07/30/19 | 715,556 | 697,667 |
Greenway Medical Technologies | | |
6.00% due 11/04/20 | 645,125 | 643,512 |
Aspect Software, Inc. | | |
7.25% due 05/07/16 | 568,464 | 562,779 |
TIBCO Software, Inc. | | |
6.50% due 11/25/20 | 500,000 | 489,585 |
EIG Investors Corp. | | |
5.00% due 11/09/19 | 442,653 | 442,653 |
GlobalLogic Holdings, Inc. | | |
6.25% due 05/31/19 | 347,375 | 342,164 |
Data Device Corp. | | |
5.75% due 07/15/20 | 298,125 | 297,380 |
Quorum Business Solutions | | |
5.75% due 08/07/21 | 300,000 | 296,250 |
Wall Street Systems | | |
4.50% due 04/30/21 | 238,533 | 235,849 |
Total Technology | | 4,007,839 |
Communications - 0.8% | | |
Charter Communications Operating LLC | | |
4.25% due 09/10/21 | 1,000,000 | 1,006,480 |
Cengage Learning Acquisitions, Inc. | | |
7.00% due 03/31/20 | 995,000 | 994,841 |
Avaya, Inc. | | |
4.65% due 10/26/17 | 534,589 | 518,888 |
6.50% due 03/31/18 | 442,058 | 439,724 |
Zayo Group LLC | | |
4.00% due 07/02/19 | 488,755 | 487,411 |
Total Communications | | 3,447,344 |
Consumer, Non-cyclical - 0.7% | | |
Post Holdings | | |
3.75% due 06/02/21 | 1,496,250 | 1,493,751 |
Albertson's (Safeway) Holdings LLC | | |
4.50% due 08/25/21 | 800,000 | 802,000 |
Targus Group International, Inc. | | |
12.00% due 05/24/16†††,1 | 316,177 | 264,008 |
Mitel Networks Corp. | | |
5.25% due 01/31/20 | 137,065 | 137,065 |
ABG Intermediate Holdings 2 LLC | | |
5.50% due 05/27/21 | 99,500 | 98,754 |
Hostess Brands | | |
6.75% due 04/09/20 | 34,825 | 35,543 |
Total Consumer, Non-cyclical | | 2,831,121 |
Financial - 0.6% | | |
Magic Newco, LLC | | |
5.00% due 12/12/18 | 977,515 | 978,913 |
12.00% due 06/12/19 | 100,000 | 108,500 |
Safe-Guard | | |
6.25% due 08/19/21 | 600,000 | 597,000 |
First Data Corp. | | |
3.66% due 03/23/18 | 350,000 | 345,408 |
Cunningham Lindsey U.S., Inc. | | |
9.25% due 06/10/20 | 155,909 | 152,011 |
Expert Global Solutions | | |
8.50% due 04/03/18 | 102,371 | 101,860 |
Total Financial | | 2,283,692 |
Consumer, Cyclical - 0.5% | | |
Fitness International LLC | | |
5.50% due 07/01/20 | 498,750 | 492,516 |
American Tire Distributors, Inc. | | |
5.75% due 06/01/18 | 298,595 | 298,968 |
Neiman Marcus Group, Inc. | | |
4.25% due 10/25/20 | 248,747 | 247,050 |
Navistar, Inc. | | |
5.75% due 08/17/17 | 236,111 | 237,882 |
BJ's Wholesale Club, Inc. | | |
4.50% due 09/26/19 | 199,497 | 198,251 |
STG-Fairway Acquisitions, Inc. | | |
6.25% due 02/28/19 | 197,001 | 196,509 |
Dave & Busters, Inc. | | |
4.50% due 07/25/20 | 121,698 | 121,576 |
J. Crew Group, Inc. | | |
4.00% due 03/05/21 | 99,749 | 94,720 |
Container Store, Inc. | | |
4.25% due 04/06/19 | 80,340 | 78,833 |
CKX Entertainment, Inc. | | |
9.00% due 06/21/17 | 73,800 | 62,730 |
Total Consumer, Cyclical | | 2,029,035 |
Utilities - 0.1% | | |
Expro Holdings UK 3 Ltd. | | |
5.75% due 09/02/21 | 400,000 | 385,332 |
Terraform Power, Inc | | |
4.75% due 07/23/19 | 199,500 | 199,500 |
Total Utilities | | 584,832 |
See notes to financial statements.
14 l GBAB l GUGGENHEIM BUILD AMERICA BONDS MANAGED DURATION TRUST SEMIANNUAL REPORT
| PORTFOLIO OF INVESTMENTS (Unaudited) continued | November 30, 2014 |
| | Face | |
| | Amount | Value |
SENIOR FLOATING RATE INTERESTS†† - 5.3% (continued) | | |
Energy - 0.0%** | | |
PSS Companies | | |
5.50% due 01/28/20 | $ 198,980 | $ 195,996 |
Total Senior Floating Rate Interests | | |
(Cost $22,019,793) | | 21,910,910 |
CORPORATE BONDS†† - 4.3% | | |
Financial - 1.4% | | |
SunTrust Banks, Inc. | | |
5.63% due 12/29/49 | 5,000,000 | 5,012,499 |
Columbia Property Trust Operating Partnership LP | | |
5.88% due 04/01/186 | 750,000 | 792,128 |
Credit Suisse Group AG | | |
6.24% due 12/29/494 | 250,000 | 243,125 |
Jefferies Finance LLC / JFIN Company-Issuer Corp. | | |
7.38% due 04/01/204,6 | 125,000 | 120,625 |
LCP Dakota Fund | | |
10.00% due 08/17/156 | 23,400 | 23,400 |
Total Financial | | 6,191,777 |
Basic Materials - 0.8% | | |
Yamana Gold, Inc. | | |
4.95% due 07/15/24 | 3,000,000 | 2,916,446 |
TPC Group, Inc. | | |
8.75% due 12/15/204,6 | 255,000 | 264,563 |
Mirabela Nickel Ltd. | | |
9.50% due 06/24/19†††,1 | 80,000 | 80,000 |
1.00% due 07/31/44†††,1 | 1,899 | – |
Total Basic Materials | | 3,261,009 |
Consumer, Non-cyclical - 0.6% | | |
Tufts Medical Center, Inc. | | |
7.00% due 01/01/38 | 1,500,000 | 1,708,565 |
JBS USA LLC / JBS USA Finance, Inc. | | |
5.88% due 07/15/244 | 500,000 | 506,250 |
ADT Corp. | | |
6.25% due 10/15/216 | 200,000 | 209,500 |
KeHE Distributors LLC / KeHE Finance Corp. | | |
7.63% due 08/15/214 | 100,000 | 106,000 |
American Seafoods Group LLC / American Seafoods Finance, Inc. | | |
10.75% due 05/15/164,6 | 100,000 | 89,000 |
Total Consumer, Non-cyclical | | 2,619,315 |
Industrial - 0.6% | | |
Atlas Air 2000-1 Class A Pass Through Trust | | |
8.71% due 01/02/196 | 1,131,233 | 1,167,998 |
8.71% due 07/02/214,6 | 27,112 | 27,993 |
Dynagas LNG Partners Limited Partnership / Dynagas | | |
Finance, Inc. | | |
6.25% due 10/30/19 | 800,000 | 768,000 |
CEVA Group plc | | |
7.00% due 03/01/214 | 300,000 | 291,000 |
Tempel Steel Co. | | |
12.00% due 08/15/164,6 | 250,000 | 250,625 |
Total Industrial | | 2,505,616 |
Consumer, Cyclical - 0.4% | | |
GRD Holdings III Corp. | | |
10.75% due 06/01/194,6 | 980,000 | 1,078,000 |
Checkers Drive-In Restaurants, Inc. | | |
11.00% due 12/01/174,6 | 150,000 | 162,750 |
PF Chang's China Bistro, Inc. | | |
10.25% due 06/30/204,6 | 125,000 | 125,938 |
Atlas Air 1999-1 Class A-1 Pass Through Trust | | |
7.20% due 01/02/196 | 81,187 | 83,216 |
Total Consumer, Cyclical | | 1,449,904 |
Energy - 0.2% | | |
Schahin II Finance Company SPV Ltd. | | |
5.88% due 09/25/224 | 449,667 | 395,707 |
Summit Midstream Holdings LLC / Summit Midstream | | |
Finance Corp. | | |
7.50% due 07/01/21 | 200,000 | 216,000 |
Penn Virginia Resource Partners Limited Partnership / Penn | | |
Virginia Resource Finance Corp. | | |
8.38% due 06/01/204 | 138,000 | 149,730 |
Total Energy | | 761,437 |
Communications - 0.2% | | |
SITEL LLC / Sitel Finance Corp. | | |
11.00% due 08/01/174,6 | 500,000 | 516,250 |
Avaya, Inc. | | |
7.00% due 04/01/194 | 150,000 | 146,625 |
Total Communications | | 662,875 |
Technology - 0.1% | | |
Aspect Software, Inc. | | |
10.63% due 05/15/176 | 290,000 | 274,775 |
Eagle Midco, Inc. | | |
9.00% due 06/15/184,6 | 200,000 | 204,000 |
Total Technology | | 478,775 |
Total Corporate Bonds | | |
(Cost $17,600,452) | | 17,930,708 |
COLLATERALIZED MORTGAGE OBLIGATION†† - 0.3% | | |
Nomura Resecuritization Trust 2012-1R | | |
2012-1R,0.59% due 08/27/473,4,6 | 631,811 | 584,426 |
ACRE Commercial Mortgage Trust 2014-FL2 | | |
2014-FL2,2.65% due 08/15/314,6 | 500,000 | 500,519 |
Structured Asset Mortgage Investments II Trust 2006-AR1 | | |
2006-AR1,0.38% due 02/25/36 | 34,373 | 29,357 |
Total Collateralized Mortgage Obligation | | |
(Cost $1,108,008) | | 1,114,302 |
Total Investments - 128.8% | | |
(Cost $457,918,476) | | $ 533,014,543 |
Other Assets & Liabilities, net - (28.8)% | | (119,249,655) |
Total Net Assets - 100.0% | | $ 413,764,888 |
See notes to financial statements.
GBAB l GUGGENHEIM BUILD AMERICA BONDS MANAGED DURATION TRUST SEMIANNUAL REPORT l 15
| PORTFOLIO OF INVESTMENTS (Unaudited) continued | November 30, 2014 |
| * | | Non-income producing security. |
| ** | | Less than 0.1%. |
| † | | Value determined based on Level 1 inputs —See Note 4. |
| †† | | Value determined based on Level 2 inputs —See Note 4. |
| ††† | | Value determined based on Level 3 inputs —See Note 4. |
| 1 | | Security was fair valued by the Valuation Committee at November 30, 2014. The total market value of fair valued securities amounts to $589,215, or 0.1% of total net assets. |
| 2 | | Perpetual maturity. |
| 3 | | Variable rate security. Rate indicated is rate effective at November 30, 2014. |
| 4 | | Security is a 144A or Section 4(a)(2) security. The total market value of 144A or Section 4(a)(2) securities is $43,009,276 (cost $42,221,372), or 10.4% of total net assets. |
| 5 | | Security has no stated coupon. However, it is expected to receive residual cashflow payments on deal defined payment dates. |
| 6 | | All or a portion of these securities have been physically segregated in connection with borrowings, reverse repurchase agreements, and unfunded loan commitments. As of November 30, 2014, the total amount segregated was $314,831,549. |
7 | | Taxable municipal bond issued as part of the Build America Bond program. |
| plc | | Public Limited Company |
See notes to financial statements.
16 l GBAB l GUGGENHEIM BUILD AMERICA BONDS MANAGED DURATION TRUST SEMIANNUAL REPORT
| STATEMENT OF ASSETS AND LIABILITIES (Unaudited) | November 30, 2014 |
| | |
ASSETS: | |
Investments, at value | $ | 533,014,543 |
Restricted cash | | 917,062 |
Cash | | 504 |
Receivables: | | |
Investments sold | | 10,248,908 |
Interest | | 8,430,818 |
Other assets | | 11,387 |
Total assets | | 552,623,222 |
LIABILITIES: | | |
Reverse repurchase agreements | | 101,159,117 |
Borrowings | | 35,963,936 |
Interest due on borrowings | | 223,462 |
Unrealized depreciation on swaps | | 86,599 |
Payable for: | | |
Investments purchased | | 675,000 |
Excise tax | | 294,000 |
Investment advisory fees | | 264,098 |
Administration fees | | 9,880 |
Other fees | | 182,242 |
Total liabilities | | 138,858,334 |
NET ASSETS | $ | 413,764,888 |
NET ASSETS CONSIST OF: | | |
Common Stock, $0.01 par value per share, unlimited number of shares authorized, | | |
17,413,674 shares issued and outstanding | | 174,137 |
Paid-in capital | | 331,227,326 |
Undistributed net investment income | | 3,998,488 |
Undistributed net realized gain on investments | | 3,355,469 |
Net unrealized appreciation on investments | | 75,009,468 |
NET ASSETS | | 413,764,888 |
Shares outstanding ($0.01 par value with unlimited amount authorized) | | 17,413,674 |
Net asset value, offering price and repurchase price per share | $ | 23.76 |
Investments in securities, at cost | | 457,918,476 |
See notes to financial statements.
GBAB l GUGGENHEIM BUILD AMERICA BONDS MANAGED DURATION TRUST SEMIANNUAL REPORT l 17
STATEMENT OF OPERATIONS For the six months ended November 30, 2014 (Unaudited) | November 30, 2014 |
| | | |
INVESTMENT INCOME: | | |
Interest | $ | 15,176,192 | |
Dividends | | 508,178 | |
Total investment income | | 15,684,370 | |
EXPENSES: | | | |
Management fees | | 1,607,341 | |
Interest expense | | 708,593 | |
Excise tax | | 294,000 | |
Professional fees | | 77,575 | |
Trustee fees | | 67,045 | |
Fund accounting fees | | 66,753 | |
Administration fees | | 60,239 | |
Printing fees | | 34,961 | |
Registration and filings | | 12,500 | |
Custodian fees | | 11,580 | |
Insurance | | 9,663 | |
Transfer agent fees | | 9,454 | |
Other fees | | 651 | |
Total expenses | | 2,960,355 | |
Net investment income | | 12,724,015 | |
NET REALIZED AND UNREALIZED GAIN (LOSS): | | | |
Net realized gain (loss) on: | | | |
Investments | | 2,516,121 | |
Foreign currency transactions | | (57 | ) |
Net realized gain | | 2,516,064 | |
Net change in unrealized appreciation (depreciation) on: | | | |
Investments | | 8,008,827 | |
Unfunded commitments | | (30 | ) |
Swaps | | (86,599 | ) |
Net change in unrealized appreciation | | 7,922,198 | |
Net realized and unrealized gain | | 10,438,262 | |
Net increase in net assets resulting from operations | $ | 23,162,277 | |
See notes to financial statements.
18 l GBAB l GUGGENHEIM BUILD AMERICA BONDS MANAGED DURATION TRUST SEMIANNUAL REPORT
| STATEMENT OF CHANGES IN NET ASSETS | November 30, 2014 |
| | | | | |
| | Period Ended | | | |
| | November 30, 2014 | | Year ended | |
| | (Unaudited) | | May 31, 2014 | |
INCREASE (DECREASE) IN NET ASSETS FROM OPERATIONS: | | | | |
Net investment income | $ | 12,724,015 | | $ | 28,371,160 | |
Net realized gain on investments and foreign currency | | 2,516,064 | | | 379,273 | |
Net change in unrealized (depreciation) appreciation on investments, | | | | | | |
unfunded commitments and swaps | | 7,922,198 | | | (5,974,017 | ) |
Net increase in net assets resulting from operations | | 23,162,277 | | | 22,776,416 | |
DISTRIBUTIONS TO SHAREHOLDERS FROM: | | | | | | |
Net investment income | | (14,436,284 | ) | | (27,896,617 | ) |
Capital gains | | – | | | (975,951 | ) |
Total distributions | | (14,436,284 | ) | | (28,872,568 | ) |
Net increase (decrease) in net assets | | 8,725,993 | | | (6,096,152 | ) |
NET ASSETS: | | | | | | |
Beginning of period | | 405,038,895 | | | 411,135,047 | |
End of period | $ | 413,764,888 | | $ | 405,038,895 | |
Undistributed net investment income at end of period | | 3,998,488 | | | 5,710,757 | |
See notes to financial statements.
GBAB l GUGGENHEIM BUILD AMERICA BONDS MANAGED DURATION TRUST SEMIANNUAL REPORT l 19
STATEMENT OF CASH FLOWS For the six months ended November 30, 2014 (Unaudited) | November 30, 2014 |
| | | |
Cash Flows from Operating Activities: | | |
Net Increase in net assets resulting from operations | $ | 23,162,277 | |
Adjustments to Reconcile Net Increase in Net Assets Resulting from Operations to | | | |
Net Cash Used by Operating and Investing Activities: | | | |
Net change in unrealized appreciation on investments | | (8,008,827 | ) |
Net change in unrealized depreciation on unfunded commitments | | 30 | |
Net change in unrealized depreciation on swaps | | 86,599 | |
Net realized gain on investments | | (2,516,121 | ) |
Net realized gains on paydowns received | | (46,656 | ) |
Net accretion of bond discount and amortization of bond premium | | (274,983 | ) |
Purchase of long-term investments | | (58,085,604 | ) |
Proceeds from sale of long-term investments | | 43,184,671 | |
Paydowns received on mortgage and asset backed securities | | 6,877,422 | |
Net proceeds of short-term investments | | 4,890,777 | |
Corporate actions and other payments | | 55,761 | |
Decrease in interest receivable | | 345,262 | |
Increase in securities sold receivable | | (9,801,055 | ) |
Increase in other assets | | (3,930 | ) |
Decrease in payable for securities purchased | | (2,137,057 | ) |
Increase in excise tax payable | | 294,000 | |
Increase in interest due on borrowings | | 157,046 | |
Decrease in advisory fee payable | | (548 | ) |
Decrease in administration fee payable | | (123 | ) |
Increase in accrued expenses and other liabilities | | 10,553 | |
Net Cash Used by Operating and Investing Activities | | (1,810,506 | ) |
Cash Flows From Financing Activities: | | | |
Distributions to common shareholders | | (14,436,284 | ) |
Decrease in overdraft due to custodian | | (71,406 | ) |
Increase in reverse repurchase agreements | | 12,235,762 | |
Proceeds from borrowings | | 18,000,000 | |
Payments made on borrowings | | (13,000,000 | ) |
Net Cash Provided by Financing Activities | | 2,728,072 | |
Net increase in cash | | 917,566 | |
Cash at Beginning of Period | | – | |
Cash at End of Period (including restricted cash) | | 917,566 | |
Supplemental Disclosure of Cash Flow Information: Cash paid during the period for interest | | 551,547 | |
See notes to financial statements.
20 l GBAB l GUGGENHEIM BUILD AMERICA BONDS MANAGED DURATION TRUST SEMIANNUAL REPORT
| FINANCIAL HIGHLIGHTS | November 30, 2014 |
| | | | | | | | | | | |
| | For the | | | | | | | | | |
| | Six Months | | | | | | | | For the period | |
| | Ended | | | | | | | | October 28, 2010 | |
| | November 30, 2014 | | Period Ended | | Period Ended | | Period Ended | | through | |
| | (Unaudited) | | May 31, 2014 | | May 31, 2013 | | May 31, 2012 | | May 31, 2011 | (a) |
Per Share Data: | | | | | | | | | | |
Net asset value, beginning of period | $ | 23.26 | | $ | 23.61 | | $ | 23.49 | | $ | 20.65 | | $ | 19.10 | (b) |
Income from investment operations: | | | | | | | | | | | | | | | |
Net investment income(c) | | 0.73 | | | 1.63 | | | 1.65 | | | 1.59 | | | 0.68 | |
Net (loss) gain on investments (realized and unrealized) | | 0.60 | | | (0.32 | ) | | 0.07 | | | 2.74 | | | 1.50 | |
Total from investment operations | | 1.33 | | | 1.31 | | | 1.72 | | | 4.33 | | | 2.18 | |
Common shares’ offering expenses charged to paid-in capital | | – | | | – | | | – | | | – | | | (0.04 | ) |
Less distributions from: | | | | | | | | | | | | | | | |
Net investment income | | (0.83 | ) | | (1.60 | ) | | (1.60 | ) | | (1.49 | ) | | (0.59 | ) |
Capital Gains | | – | | | (0.06 | ) | | – | | | – | | | – | |
Total distributions to shareholders | | (0.83 | ) | | (1.66 | ) | | (1.60 | ) | | (1.49 | ) | | (0.59 | ) |
Net asset value, end of period | $ | 23.76 | | $ | 23.26 | | $ | 23.61 | | $ | 23.49 | | $ | 20.65 | |
Market Value, end of period | $ | 21.94 | | $ | 21.69 | | $ | 22.70 | | $ | 22.46 | | $ | 19.54 | |
Total Return(d) | | | | | | | | | | | | | | | |
Net asset value | | 5.80 | % | | 6.15 | % | | 7.48 | % | | 21.64 | % | | 11.34 | % |
Market value | | 5.09 | % | | 3.54 | % | | 8.27 | % | | 23.35 | % | | 0.80 | % |
Ratios/Supplemental Data: | | | | | | | | | | | | | | | |
Net assets, end of period (in thousands) | $ | 413,765 | | $ | 405,039 | | $ | 411,135 | | $ | 408,960 | | $ | 359,444 | |
Ratio to average net assets of: | | | | | | | | | | | | | | | |
Total expenses, including interest expense(g)(h) | | 1.38 | % | | 1.35 | % | | 1.38 | % | | 1.36 | % | | 1.05 | % |
Net investment income, including interest expense(h) | | 6.22 | % | | 7.37 | % | | 6.99 | % | | 7.33 | % | | 6.00 | % |
Portfolio turnover rate(e) | | 8 | % | | 10 | % | | 12 | % | | 7 | % | | 3 | % |
Senior Indebtedness | | | | | | | | | | | | | | | |
Total Borrowings outstanding (in thousands) | $ | 137,123 | | $ | 119,887 | | $ | 129,992 | | $ | 125,542 | | $ | 104,906 | |
Asset Coverage per $1,000 of indebtedness(f) | $ | 4,018 | | $ | 4,379 | | $ | 4,163 | | $ | 4,258 | | $ | 4,426 | |
| (a) | Since commencement of operations: October 28, 2010. Percentage amounts for the period, except total return and portfolio turnover rate, have been annualized. |
| (b) | Before deduction of offering expenses charged to capital. |
| (c) | Based on average shares outstanding. |
| (d) | Total investment return is calculated assuming a purchase of a common share at the beginning of the period and a sale on the last day of the period reported either at net asset value (“NAV”) or market price per share. Dividends and distributions are assumed to be reinvested at NAV for NAV returns or the prices obtained under the Trust’s Dividend Reinvestment Plan for market value returns. Total investment return does not reflect brokerage commissions. A return calculated for a period of less than one year is not annualized. |
| (e) | Portfolio turnover is not annualized for periods of less than one year. |
| (f) | Calculated by subtracting the Trust’s total liabilities (not including borrowings) from the Trust’s total assets and dividing by the total borrowings. |
| (g) | Excluding interest expense, the operating expense ratio for the periods would be: |
November 30, | May 31, | May 31, | May 31, | May 31, |
2014 | 2014 | 2013 | 2012 | 2011 |
1.03% | 1.02% | 1.02% | 1.04% | 0.91%(e) |
See notes to financial statements.
GBAB l GUGGENHEIM BUILD AMERICA BONDS MANAGED DURATION TRUST SEMIANNUAL REPORT l 21
| NOTES TO FINANCIAL STATEMENTS (Unaudited) | November 30, 2014 |
Note 1 – Organization:
Guggenheim Build America Bonds Managed Duration Trust (the “Trust”) was organized as a Delaware statutory trust on June 30, 2010. The Trust is registered as a diversified closed-end management investment company under the Investment Company Act of 1940, as amended (the “1940 Act”).
The Trust’s primary investment objective is to provide current income with a secondary objective of long-term capital appreciation. There can be no assurance that the Trust will achieve its investment objectives. The Trust’s investment objectives are considered fundamental and may not be changed without shareholder approval.
Note 2 – Accounting Policies:
The preparation of the financial statements in accordance with U.S. generally accepted accounting principles (“GAAP”) requires management to make estimates and assumptions that affect the reported amounts and disclosures in the financial statements. Actual results could differ from these estimates.
The following is a summary of the significant accounting policies followed by the Trust.
(a) Valuation of Investments
The Board of Trustees of the Trust (the “Board”) has adopted policies and procedures for the valuation of the Trust’s investments (the “Valuation Procedures”). Pursuant to the Valuation Procedures, the Board has delegated to a valuation committee, consisting of representatives from Guggenheim’s investment management, fund administration, legal and compliance departments (the “Valuation Committee”), the day-to-day responsibility for implementing the Valuation Procedures, including, under most circumstances, the responsibility for determining the fair value of the Trust’s securities or other assets.
Valuations of the Trust’s securities are supplied primarily by pricing services appointed pursuant to the processes set forth in the Valuation Procedures. The Valuation Committee convenes monthly, or more frequently as needed and will review the valuation of all assets which have been fair valued for reasonableness. The Trust’s officers, through the Valuation Committee and consistent with the monitoring and review responsibilities set forth in the Valuation Procedures, regularly review procedures used by, and valuations provided by, the pricing services.
Equity securities listed on an exchange (New York Stock Exchange (“NYSE”) or American Stock Exchange) are valued at the last quoted sales price as of the close of business on the NYSE, usually 4:00 p.m. on the valuation date. Equity securities listed on the NASDAQ market system are valued at the NASDAQ Official Closing Price on the valuation date, which may not necessarily represent the last sale price. If there has been no sale on such exchange or NASDAQ on such day, the security is valued at the mean between the last available bid and ask prices on such day.
Open-end investment companies (“Mutual Funds”) are valued at their NAV as of the close of business on the valuation date. Exchange Traded Funds (“ETFs”) and closed-end investment companies are valued at the last quoted sales price.
Debt securities with a maturity of greater than 60 days at acquisition are valued at prices that reflect broker/dealer supplied valuations or are obtained from independent pricing services, which may consider the trade activity, treasury spreads, yields or price of bonds of comparable quality, coupon, maturity, and type, as well as prices quoted by dealers who make markets in such securities. Short-term debt securities with a maturity of 60 days or less at acquisition and repurchase agreements are valued at amortized cost, which approximates market value.
Typically loans are valued using information provided by an independent third party pricing service which uses broker quotes. If the pricing service cannot or does not provide a valuation for a particular loan or such valuation is deemed unreliable, such loan is fair valued by the Valuation Committee.
The value of interest rate swap agreements are accounted for using the unrealized gain or loss on the agreements that is determined using the spread priced off the CME price.
Generally, trading in foreign securities markets is substantially completed each day at various times prior to the close of the NYSE. The values of foreign securities are determined as of the close of such foreign markets or the close of the NYSE, if earlier. All investments quoted in foreign currency are valued in U.S. dollars on the basis of the foreign currency exchange rates prevailing at the close of U.S. business at 4:00 p.m. Investments in foreign securities may involve risks not present in domestic investments. The Valuation Committee will determine the current value of such foreign securities by taking into consideration certain factors which may include those discussed above, as well as the following factors, among others: the value of the securities traded on other foreign markets, ADR trading, closed-end fund trading, foreign currency exchange activity, and the trading prices of financial products that are tied to foreign securities such as World Equity Benchmark Securities. In addition, under the Valuation Procedures, the Valuation Committee and the Adviser are authorized to use prices and other information supplied by a third party pricing vendor in valuing foreign securities.
Investments for which market quotations are not readily available are fair valued as determined in good faith by the Guggenheim Funds Investment Advisors, LLC (“GFIA” or the “Adviser”), subject to review by the Valuation Committee, pursuant to methods established or ratified by the Board. Valuations in accordance with these methods are intended to reflect each security’s (or asset’s) “fair value.” Each such determination is based on a consideration of all relevant factors, which are likely to vary from one pricing context to another. Examples of such factors may include, but are not limited to: (i) the type of security, (ii) the initial cost of the security, (iii) the existence of any contractual restrictions on the security’s disposition, (iv) the price and extent of public trading in similar securities of the issuer or of comparable companies, (v) quotations or evaluated prices from broker-dealers and/or pricing services, (vi) information obtained from the issuer, analysts, and/or the appropriate stock exchange (for exchange traded securities), (vii) an analysis of the company’s financial statements, and (viii) an evaluation of the forces that influence the issuer and the market(s) in which the security is purchased and sold (e.g. the existence of pending merger activity, public offerings or tender offers that might affect the value of the security).
22 l GBAB l GUGGENHEIM BUILD AMERICA BONDS MANAGED DURATION TRUST SEMIANNUAL REPORT
| NOTES TO FINANCIAL STATEMENTS (Unaudited) continued | November 30, 2014 |
(b) Investment Transactions and Investment Income
Investment transactions are accounted for on the trade date. Realized gains and losses on investments are determined on the identified cost basis. Paydown gains and losses on mortgage and asset-backed securities are treated as interest income. Dividend income is recorded net of applicable withholding taxes on the ex-dividend date and interest income is recorded on an accrual basis. Discounts or premiums on debt securities purchased are accreted or amortized to interest income over the lives of the respective securities using the effective interest method.
(c) When-Issued and Delayed Delivery Transactions
The Trust may engage in when-issued or delayed delivery transactions. The Trust records when-issued securities on the trade date and maintains security positions such that sufficient liquid assets will be available to make payment for the securities purchased. Securities purchased on a when-issued or delayed delivery basis are marked to market daily and begin earning interest on the settlement date. Losses may occur on these transactions due to changes in a market conditions or the failure of counterparties to perform under the contract.
(d) Distributions
The Trust declares and pays monthly distributions to common shareholders. Any net realized long-term gains are distributed annually. Distributions to shareholders are recorded on the ex-dividend date. The amount and timing of distributions are determined in accordance with federal income tax regulations, which may differ from GAAP.
(e) Swaps
A swap is an agreement to exchange the return generated by one instrument for the return generated by another instrument. The Fund may enter into swap agreements to manage its exposure to interest rates and/or credit risk, to generate income or to manage duration. The swaps are valued daily at current market value and any unrealized gain or loss is included in the Statement of Assets and Liabilities. Gain or loss is realized on the termination date of the swap and is equal to the difference between the Fund’s basis in the swap and the proceeds of the closing transaction, including any fees. During the period that the swap agreement is open, the Fund may be subject to risk from the potential inability of the counterparty to meet the terms of the agreement. The swaps involve elements of both market and credit risk in excess of the amounts reflected on the Statement of Assets and Liabilities. Upon termination of a swap agreement, a payable to or receivable from swap counterparty is established on the Statement of Assets and Liabilities to reflect the net gain/loss, including interest income/expense, on terminated swap positions. The line item is removed upon settlement according to the terms of the swap agreement.
Realized gain (loss) upon termination of swap contracts is recorded on the Statement of Operations. Fluctuations in the value of swap contracts are recorded as a component of net change in unrealized appreciation (depreciation) of swap contracts. Net periodic payments received by the Fund are included as part of realized gain (loss) and, in the case of accruals for periodic payments, are included as part of unrealized appreciation (depreciation) on the Statement of Operations.
(f) Offsetting Assets and Liabilities
In December 2011, the Financial Accounting Standards Board (“FASB”) issued an Accounting Standards Update (“ASU”) No. 2011-11: Disclosures about Offsetting Assets and Liabilities (“netting”) on the Statements of Assets and Liabilities that are subject to master netting arrangements or similar agreements. ASU 2011-11, was amended by ASU No. 2013-01, clarifying which investments and transactions are subject to the netting disclosure. The scope of the disclosure requirements is limited to derivative instruments, repurchase agreements and reverse repurchase agreements, and securities borrowing and securities lending transactions to the extent they are subject to an enforceable master netting arrangement or similar agreement. This information will enable users of the Trust’s financial statements to evaluate the effect or potential effect of netting arrangements on the Trust’s financial position. The ASU is effective for financial statements with fiscal years beginning on or after January 1, 2013, and interim periods within those fiscal years. The Trust adopted the disclosure requirement on netting for the current reporting period. For financial reporting purposes, the Trust does not offset financial assets and financial liabilities across derivative types that are subject to master netting arrangements or similar agreements on the Statement of Assets and Liabilities. Therefore, all qualifying transactions are presented on a gross basis in the Statement of Assets and Liabilities. As of November 30, 2014, the impact of netting of assets and liabilities and the offsetting of collateral pledged or received based on contractual netting/offsetting provisions are detailed in the following table.
| | | | Net Amounts of | | Gross Amounts Not | |
| | | Gross Amounts | Liabilities | | Offset in the Statement | |
| | | Offset in the | Presented in | | of Assets & Liabilities | |
| | Gross Amounts | the Statement | the Statement | | | |
| | of Recognized | of Assets & | of Assets & | | Financial | Net |
Investment Type | Liabilities | Liabilities | Liabilities | | Instruments | Amount |
Reverse Repurchase Agreement | $101,159,117 | $ – | $101,159,117 | | $101,159,117 | $ – |
Note 3 – Investment Advisory Agreement, Sub-Advisory Agreement and Other Agreements:
Pursuant to an Investment Advisory Agreement between the Trust and the Adviser, the Adviser furnishes offices, necessary facilities and equipment, provides administrative services, oversees the activities of Guggenheim Partners Investment Management, LLC (“GPIM” or “Sub-Adviser”), provides personnel including certain officers required for the Trust’s administrative management and compensates the officers and trustees of the Trust who are affiliates of the Adviser. As compensation for these services, the Trust pays the Adviser a fee, payable monthly, in an amount equal to 0.60% of the Trust’s average daily managed assets (net assets applicable to common shareholders plus any assets attributable to financial leverage).
GBAB l GUGGENHEIM BUILD AMERICA BONDS MANAGED DURATION TRUST SEMIANNUAL REPORT l 23
| NOTES TO FINANCIAL STATEMENTS (Unaudited) continued | November 30, 2014 |
Pursuant to a Sub-Advisory Agreement among the Trust, the Adviser and GPIM, GPIM under the supervision of the Trust’s Board of Trustees and the Adviser, provides a continuous investment program for the Trust’s portfolio; provides investment research; makes and executes recommendations for the purchase and sale of securities; and provides certain facilities and personnel, including certain officers required for its administrative management and pays the compensation of all officers and trustees of the Trust who are GPIM‘s affiliates. As compensation for its services, the Adviser pays GPIM a fee, payable monthly, in an annual amount equal to 0.30% of the Trust’s average daily managed assets.
Certain officers of the Trust may also be officers, directors and/or employees of the Adviser or GPIM. The Trust does not compensate its officers who are officers, directors and/or employees of the aforementioned firms.
Rydex Fund Services, LLC (“RFS”), an affiliate of the Adviser and the Sub-Adviser, provides fund administration services to the Trust. As compensation for these services RFS receives a fund administration fee payable monthly at the annual rate set forth below as a percentage of the average daily managed assets of the Trust:
Managed Assets | Rate |
First $200,000,000 | 0.0275% |
Next $300,000,000 | 0.0200% |
Next $500,000,000 | 0.0150% |
Over $1,000,000,000 | 0.0100% |
For the period ended November 30, 2014, the Trust recognized expenses of approximately $60,239 for these services.
RFS serves as the accounting agent of the Trust. As accounting agent, RFS is responsible for maintaining the books and records of the Trust’s securities and cash. RFS receives an accounting fee payable monthly at the annual rate set forth below as a percentage of the average daily managed assets of the Trust.
Managed Assets | Rate |
First $200,000,000 | 0.0300% |
Next $300,000,000 | 0.0150% |
Next $500,000,000 | 0.0100% |
Over $1,000,000,000 | 0.0075% |
Minimum annual charge | $50,000 |
Certain out-of-pocket charges | Varies |
For the period ended November 30, 2014, the Trust recognized expenses of approximately $66,753 for these services.
For purposes of calculating the fees payable under the foregoing agreements, “average daily managed assets” means the average daily value of the Trust’s total assets minus the sum of its accrued liabilities. “Total assets” means all of the Trust’s assets and is not limited to its investment securities. “Accrued liabilities” means all of the Trust’s liabilities other than borrowings for investment purposes.
The Bank of New York Mellon (“BNY”) acts as the Trust’s custodian. As custodian, BNY is responsible for the custody of the Trust’s assets.
Note 4 – Fair Value Measurement:
In accordance with U.S. GAAP, fair value is defined as the price that the Trust would receive to sell an investment or pay to transfer a liability in an orderly transaction with an independent buyer in the principal market, or in the absence of a principal market, the most advantageous market for the investment or liability. U.S GAAP establishes a three-tier fair value hierarchy based on the types of inputs used to value assets and liabilities and requires corresponding disclosure. The hierarchy and the corresponding inputs are summarized below:
Level 1 - quoted prices in active markets for identical assets or liabilities.
Level 2 - significant other observable inputs (for example quoted prices for securities that are similar based on characteristics such as interest rates, prepayment speeds, credit risk, etc.).
Level 3 - significant unobservable inputs based on the best information available under the circumstances, to the extent observable inputs are not available, which may include assumptions.
The types of inputs available depend on a variety of factors, such as the type of security and the characteristics of the markets in which it trades, if any. Fair valuation determinations that rely on fewer or no observable inputs require greater judgment. Accordingly, fair value determinations for Level 3 securities require the greatest amount of judgment.
The following table represents the Trust’s investments carried on the Statement of Assets and Liabilities by caption and by level within the fair value hierarchy as of November 30, 2014:
Description | Level 1 | | Level 2 | | Level 3 | | Total |
Assets | | | | | | | |
Municipal Bonds | $ | – | | $ | 448,605,624 | | $ | – | | $ | 448,605,624 |
Asset Backed | | | | | | | | | | | |
Securities | | – | | | 34,763,041 | | | 1,106,526 | | | 35,869,567 |
Senior Floating | | | | | | | | | | | |
Rate Interests | | – | | | 21,401,695 | | | 509,215 | | | 21,910,910 |
Corporate Bonds | | – | | | 17,850,708 | | | 80,000 | | | 17,930,708 |
Preferred Stocks | | 7,268,659 | | | – | | | – | | | 7,268,659 |
Collaterized Mortgage | | | | | | | | | | | |
Obligation | | – | | | 1,114,302 | | | – | | | 1,114,302 |
Money Market Fund | | 213,382 | | | – | | | – | | | 213,382 |
Common Stocks | | 101,390 | | | – | | | 1 | | | 101,391 |
Warrants | | – | | | – | | | – | | | – |
Unfunded | | | | | | | | | | | |
Commitments | | – | | | – | | | – | | | – |
Total Assets | $ | 7,583,431 | | $ | 523,735,370 | | $ | 1,695,742 | | $ | 533,014,543 |
| |
Liabilities | | | | | | | | | | | |
Swaps | $ | – | | $ | 86,599 | | $ | – | | $ | 86,599 |
Total Liabilities | $ | – | | $ | 86,599 | | $ | – | | $ | 86,599 |
Independent pricing services are used to value a majority of the Trust’s investments. When values are not available from a pricing service, they will be determined under the valuation policies that have been reviewed and approved by the Board of Trustees. In any event, values are determined using a variety of sources and techniques, including: market prices; broker quotes; and models which derive prices based on inputs such as prices of
24 l GBAB l GUGGENHEIM BUILD AMERICA BONDS MANAGED DURATION TRUST SEMIANNUAL REPORT
| NOTES TO FINANCIAL STATEMENTS (Unaudited) continued | November 30, 2014 |
securities with comparable maturities and characteristics or based on inputs such as anticipated cash flows or collateral, spread over Treasuries, and other information and analysis.
Indicative quotes from broker-dealers, adjusted for fluctuations in criteria such as credit spreads and interest rates, may be also used to value the Trust’s assets and liabilities, i.e. prices provided by a broker-dealer or other market participant who has not committed to trade at that price. Although indicative quotes are typically received from established market participants, the Trust may not have the transparency to view the underlying inputs which support the market quotations.
Certain fixed income securities are valued by obtaining a monthly indicative quote from a broker-dealer, adjusted for fluctuations in criteria such as credit spreads and interest rates. The Trust’s fair valuation guidelines were recently revised to transition such monthly indicative quoted securities from Level 2 to Level 3.
The inputs or methodologies used for valuing securities are not necessarily an indication of the risk associated with investing in those securities. The suitability of the techniques and sources employed to determine fair valuation are regularly monitored and subject to change.
The following is a summary of the significant unobservable inputs used in the fair valuation of assets and liabilities categorized within the Level 3 of the fair value hierarchy:
| | Ending Balance | | Valuation | Unobservable |
Category | at 11/30/14 | | Technique | Input |
Asset Backed Securities | $1,106,526 | | Option adjusted spread off the | Indicative |
| | | | month end broker quote mark | Quote |
| | | | over the 3 month LIBOR | |
Senior Floating | | | | |
Rate Interests | 264,008 | | Broker mark | Indicative |
| | | | | Quote |
Senior Floating | | | | |
Rate Interests | 245,207 | | Monthly Model Price | Purchase |
| | | | | Price |
Corporate Bonds | 80,000 | | Monthly Model Price | Purchase |
| | | | | Price |
* Valuation multiples utilized ranged from 11 to 15. | |
Any remaining Level 3 securities held by the Trust and excluded from the table above were not considered material to the Trust.
Transfers between investment levels may occur as the markets fluctuate and/or the availability of data used in an investment’s valuation changes. Transfers between valuation levels, if any, are in comparison to the valuation levels at the end of the previous fiscal year, and are effective using the fair value as of the end of the current fiscal period.
As of November 30, 2014, the Trust had securities with a total value of $4,030,912 transfer from Level 3 to Level 2 due to the availability of a vendor price. The Trust had securities with a total value of $264,008 transfer from Level 2 to Level 3 due to the lack of a vendor price.
Summary of Fair Value of Level 3 Activity
Following is a reconciliation of Level 3 assets for which significant unobservable inputs were used to determine fair value for the period ended November 30, 2014:
LEVEL 3 – Fair value measurement using significant unobservable inputs
| | |
Guggenheim Build America Bonds Managed Duration Trust | |
Beginning Balance at May 31, 2014: | |
Asset Backed Securities | $ 4,193,112 |
Senior Floating Rate Interests | 2,005,000 |
Common Stock | 1 |
Realized gains or losses | |
Senior Floating Rate Interests | 18,126 |
Total change in unrealized gains or losses included in earnings | |
Asset Backed Securities | (37,870) |
Senior Floating Rate Interests | (18,123) |
Purchases | |
Asset Backed Securities | 982,196 |
Senior Floating Rate Interests | 245,204 |
Corporate Bonds | 80,000 |
Sales | |
Senior Floating Rate Interests | (2,005,000) |
Transfers into Level 3 | |
Senior Floating Rate Interests | 264,008 |
Transfers out of Level 3 | |
Asset Backed Securities | (4,030,912) |
Ending Balance at November 30, 2014: | |
Asset Backed Securities | 1,106,526 |
Corporate Bonds | 80,000 |
Senior Floating Rate Interests | 509,215 |
Common Stock | 1 |
Ending Balance | $ 1,695,742 |
Note 5 – Federal Income Taxes:
The Trust intends to comply with the requirements of Subchapter M of the Internal Revenue Code of 1986, as amended, applicable to regulated investment companies.
The Trust is subject to an excise tax of 4% of the amount by which 98% of the Trust’s annual taxable income and 98.2% of net realized gains exceed the distributions from such taxable income and realized gains for the calendar year.
As of November 30, 2014, the cost of investments and accumulated unrealized appreciation/depreciation on investments for federal income tax purposes were as follows:
Cost of | | | |
Investments | Gross Tax | Gross Tax | Net Tax |
for Tax | Unrealized | Unrealized | Unrealized |
Purposes | Appreciation | Depreciation | Appreciation |
$457,269,923 | $76,503,467 | $(1,193,755) | $75,309,712 |
The difference between book basis and tax basis unrealized appreciation (depreciation) is primarily attributable to the tax deferral of losses on wash sales, Passive Foreign Investment Companies (PFICs), non-real estate investment trust return of capital and collateralized loan obligations.
GBAB l GUGGENHEIM BUILD AMERICA BONDS MANAGED DURATION TRUST SEMIANNUAL REPORT l 25
| NOTES TO FINANCIAL STATEMENTS (Unaudited) continued | November 30, 2014 |
As of May 31, 2014, (the most recent fiscal year end for federal income tax purposes) tax components of accumulated earnings (excluding paid-in capital) were as follows:
Undistributed | Accumulated |
Ordinary Income | Long-Term Gains |
$5,901,607 | $ – |
For the year ended May 31, 2014, the tax character of distributions paid to shareholders as reflected in the Statement of Changes in Net Assets was as follows:
Distributions paid from: | 2014 |
Ordinary Income | $27,896,617 |
Long-Term Capital Gain | 975,951 |
| | $28,872,568 |
For all open tax years and all major jurisdictions, management of the Trust has concluded that there are no significant uncertain tax positions that would require recognition in the financial statements. Uncertain tax positions are tax positions taken or expected to be taken in the course of preparing the Trust’s tax returns that would not meet a more-likely-than not threshold of being sustained by the applicable tax authority and would be recorded as a tax expense in the current year. Open tax years are those that are open for examination by taxing authorities (i.e. generally the last four tax year ends and the interim tax period since then).
Note 6 – Investments in Securities:
For the six months ended November 30, 2014, the cost of purchases and proceeds from sales of investments, excluding short-term securities, were $58,085,604 and $43,184,671, respectively.
Note 7 – Derivatives:
(a) Swaps
Swap agreements are contracts between parties in which one party agrees to make periodic payments to the other party (the “Counterparty”) based on the change in market value or level of a specified rate, index or asset. In return, the Counterparty agrees to make periodic payments to the first party based on the return of a different specified rate, index or asset. Swap agreements will usually be done on a net basis, the Trust receiving or paying only the net amount of the two payments. The net amount of the excess, if any, of each Trust’s obligations over its entitlements with respect to each swap is accrued on a daily basis and an amount of cash or liquid securities having an aggregate value at least equal to the accrued excess is maintained in an account at the Trust’s custodian bank.
The Trust may enter into swap agreements to manage its exposure to interest rates and/or credit risk, to generate income or to manage duration. Interest rate swap agreements involve the exchange by the Trust with another party of their respective commitments to pay or receive interest. The swaps are valued daily at current market value and any unrealized gain or loss is included in the Statement of Assets and Liabilities. Gain or loss is realized on the termination date of the swap and is equal to the difference between the Trust’s basis in the swap and the proceeds of the closing transaction, including any fees. During the period that the swap agreement is open, the Trust may be subject to risk from the potential inability of the counterparty to meet the terms of the agreement. The swaps involve elements of both market and credit risk in excess of the amounts reflected on the Statement of Assets and Liabilities.
The Trust had interest rate swap agreements outstanding during the period ended November 30, 2014, in order to help manage the cost of leverage and, indirectly, to manage duration. As of November 30, 2014, the total amount segregated in connection with swap agreements was $917,062. As of November 30, 2014, the Trust had swaps with a total notional value of $82,000,000 outstanding. Details of the swap agreements outstanding as of November 30, 2014, were as follows:
| | | | | Receive | Unrealized |
| | | Notional Amount | Fixed | Floating | Appreciation |
Counterparty | Termination Date | ($000) | Rate | Rate | (Depreciation) |
Bank of America | 10/16/2019 | $57,000 | 1.6440% | 3 Month LIBOR | $(216,599) |
Bank of America | 10/17/2019 | $25,000 | 1.4605% | 3 Month LIBOR | 130,000 |
| | | | | | $ (86,599) |
For each swap noted, the Trust is obligated to pay the fixed rate and entitled to receive the floating rate.
The unrealized depreciation on interest rate swaps of $86,599 is presented as a liability on the Statement of Assets and Liabilities.
(b) Summary of Derivatives Information
The following table presents the types of derivatives in the Trust by location as presented on the Statement of Assets Liabilities as of November 30, 2014.
| | Statement of Assets and Liabilities Presentation of Fair Values of Derivative Instruments: |
| | Asset Derivatives | | Liability Derivatives |
| Primary Risk Exposure | Statement of Assets and Liabilities Location | Fair Value | | Statement of Assets and Liabilities Location | Fair Value |
| Interest Rate risk | N/A | $ – | | Unrealized depreciation on swaps | $86,599 |
| Total | | $ – | | | $86,599 |
26 l GBAB l GUGGENHEIM BUILD AMERICA BONDS MANAGED DURATION TRUST SEMIANNUAL REPORT
| NOTES TO FINANCIAL STATEMENTS (Unaudited) continued | November 30, 2014 |
The following table presents the effect of derivatives instruments on the Statement of Operations for the period ended November 30, 2014.
| Effect of Derivative Instruments on the Statement of Operations: |
| | Amount of | Net Change in | |
| | Net Realized | Unrealized | |
Primary Risk | Gain on | Depreciation on | |
Exposure | Derivatives | Derivatives | Total |
| | Swaps | Swaps | |
Interest Rate risk | $ – | $(86,599) | $(86,599) |
Total | $ – | $(86,599) | $(86,599) |
Note 8 – Capital:
Common Shares
The Trust has an unlimited amount of common shares, $0.01 par value, authorized and 17,413,674 issued and outstanding. Transactions in common shares were as follows:
| | Six Months | |
| | Ended | Year Ended |
| | November 30, 2014 | May 31, 2014 |
Beginning Shares | 17,413,674 | 17,413,674 |
Shares issued through | | |
dividend reinvestment | – | – |
Ending Shares | 17,413,674 | 17,413,674 |
Note 9 – Leverage:
Reverse Repurchase Agreements
The Trust may enter into reverse repurchase agreements as part of its financial leverage strategy. Under a reverse repurchase agreement, the Trust temporarily transfers possession of a portfolio instrument to another party, such as a bank or broker-dealer, in return for cash. At the same time, the Trust agrees to repurchase the instrument at an agreed upon time and price, which reflects an interest payment. Such agreements have the economic effect of borrowings. The Trust may enter into such agreements when it is able to invest the cash acquired at a rate higher than the cost of the agreement, which would increase earned income. When the Trust enters into a reverse repurchase agreement, any fluctuations in the market value of either the instruments transferred to another party or the instruments in which the proceeds may be invested would affect the market value of the Trust’s assets. As a result, such transactions may increase fluctuations in the market value of the Trust’s assets. For the period ended November 30, 2014, the average daily balance for which reverse repurchase agreements were outstanding amounted to $91,039,495. The weighted average interest rate was 0.89%. As of November 30, 2014, there was $101,159,117 in reverse repurchase agreements outstanding. As of November 30, 2014, the Trust had outstanding reverse repurchase agreements with various counterparties. Details of the reverse repurchase agreements by counterparty are as follows:
| | Range of | Range of | |
| | Interest | Maturity | Face |
Counterparty | Rates | Dates | Value |
BNP Paribas | 0.78% | 01/05/2015-06/30/2015 | $55,581,742 |
RBC Capital Markets | 0.50%-0.57% | 12/01/2014-02/27/2015 | 25,255,250 |
Credit Suisse | 0.60%-0.70% | 12/01/2014-01/20/2015 | 20,322,125 |
| | | | $101,159,117 |
Borrowings
On December 7, 2011, the Trust entered into a $125,000,000 credit facility agreement. The interest rate on the amount borrowed is based on the 1 month LIBOR plus 90 basis points. An unused fee of 25 basis points is charged on the difference between the $125,000,000 and the amount borrowed. As of November 30, 2014, there was $35,963,936 outstanding in connection with the Trust’s credit facility. The average daily amount of borrowings on the credit facility during the period was $35,242,625 with a related average interest rate of 1.06%. The maximum amount outstanding during the year ended was $43,963,936. As November 30, 2014, the total value of securities segregated and pledged as collateral in connection with borrowings was $64,765,315.
There is no guarantee that the Trust’s leverage strategy will be successful. The Trust’s use of leverage may cause the Trust’s NAV and market price of common shares to be more volatile and can magnify the effect of any losses.
Note 10 – Loan Commitments
Pursuant to the terms of certain Term Loan agreements, the Trust held unfunded loan commitments of as of November 30, 2014. The Trust is obligated to fund these loan commitments at the borrower’s discretion. The Trust intends to reserve against such contingent obligations by designating cash, liquid securities, and liquid term loans as a reserve. As of November 30, 2014, the total amount segregated in connection with reverse repurchase agreements and unfunded commitments was $250,066,234. The unrealized appreciation on these commitments of $0 as of November 30, 2014 is reported as “Unrealized appreciation on unfunded commitments” on the Statement of Assets and Liabilities.
As of November 30, 2014, the Trust had the following unfunded loan commitments which could be extended at the option of the borrower:
| | Expiration | Principal | Unrealized |
Borrower | Date | Amount | Appreciation |
CareCore National LLC | 06/10/2015 | $1,500,000 | $ – |
Note 11 – Indemnifications:
In the normal course of business, the Trust enters into contracts that contain a variety of representations, which provide general indemnifications. The Trust’s maximum exposure under these arrangements is unknown, as this would require future claims that may be made against the Trust that have not yet occurred. However, the Trust expects the risk of loss to be remote.
Note 12 – Subsequent Event:
The Trust evaluated subsequent events through the date the financial statements were available for issue and determined there were no additional material events that would require disclosure in the Trust’s financial statements, except as noted below.
On December 1, 2014, the Trust declared a monthly dividend of $0.13817 per common share. The dividend was payable on December 31, 2014, to shareholders of record on December 15, 2014.
On January 2, 2015, the Trust declared a monthly dividend of $0.13817 per common share. The dividend is payable on January 30, 2015, to shareholders of record on January 15, 2015.
GBAB l GUGGENHEIM BUILD AMERICA BONDS MANAGED DURATION TRUST SEMIANNUAL REPORT l 27
| SUPPLEMENTAL INFORMATION (Unaudited) | November 30, 2014 |
Federal Income Tax Information
In January 2015, you will be advised on IRS Form 1099 DIV or substitute 1099 DIV as to the federal tax status of the distributions received by you in the calendar year 2014.
Results of Shareholder Votes
The Annual Meeting of Shareholders of the Fund was held on April 3, 2014. Shareholders voted on the election of Trustees and the approval of the amendment to the Fund’s Agreement and Declaration of Trust.
With regards to the approval of the amendment to the Fund’s Agreement and Declaration of Trust by shareholders of the Fund:
# of Shares | # of Shares | # of Shares |
in Favor | Against | Withheld |
13,851,354 | 207,704 | 298,499 |
Trustees
The Trustees of the Guggenheim Build America Bonds Managed Duration Trust and their principal business occupations during the past five years:
Name, Address* and Year of Birth | | Term of Office and Length of | Principal Occupation(s) During Past Five Years | | Other Directorships Held by Trustees |
Independent Trustees: | | | | | |
| Trustee | Since 2010 | Current: Private Investor (2001-present). | 92 | None. |
| | | | | | |
| | | | Former: Senior Vice President and Treasurer, PepsiCo, Inc. (1993-1997); President, Pizza Hut International (1991-1993); Senior Vice President, Strategic Planning and New Business Development, PepsiCo, Inc. (1987-1990). | | |
Donald A. Chubb, Jr. (1946) | Trustee and Vice Chairman of the Board | Since 2014 | Current: Business broker and manager of commercial real estate, Griffith & Blair, Inc. (1997-present). | 88 | None. |
| | Since 2014 | Current: President, Washburn University (1997-present). | 88 | Current: Westar Energy, Inc. (2004-present); CoreFirst Bank & Trust (2000-present). |
Roman Friedrich III (1946) | Trustee and Chairman of the Contracts Review Committee | Since 2010 | Current: Founder and President, Roman Friedrich & Company (1998-present). Former: Senior Managing Director, MLV & Co. LLC (2010-2011). | 88 | Current: Zincore Metals, Inc. (2009-present). Former: Mercator Minerals Ltd. (2013-2014); First Americas Gold Corp. (2012-2014); Blue Sky Uranium Corp. (2011-2012); Axiom Gold and Silver Corp. (2011-2012); Stratagold Corp. (2003-2009); GFM Resources Ltd. (2005-2010). |
Robert B. Karn III (1942) | Trustee and Chairman of the Audit Committee | Since 2010 | Current: Consultant (1998-present). Former: Arthur Andersen (1965-1997) and Managing Partner, Financial and Economic Consulting, St. Louis office (1987-1997). | 88 | Current: Peabody Energy Company (2003-present); GP Natural Resource Partners, LLC (2002- present). |
| | Since 2010 | Current: Partner, Nyberg & Cassioppi, LLC (2000-present). Former: Executive Vice President, General Counsel, and Corporate Secretary, Van Kampen Investments (1982-1999). | 94 | Current: Edward-Elmhurst Healthcare System (2012-present). |
28 l GBAB l GUGGENHEIM BUILD AMERICA BONDS MANAGED DURATION TRUST SEMIANNUAL REPORT
| SUPPLEMENTAL INFORMATION (Unaudited) continued | November 30, 2014 |
Name, Address* and Year of Birth | | Term of Office and Length of | Principal Occupation(s) During Past Five Years | | Other Directorships Held by Trustees |
Independent Trustees continued: | | | | |
Maynard F. Oliverius (1943) | Trustee and Vice Chairman of the Contracts Review Committee | Since 2014 | Current: Retired. Former: President and CEO, Stormont-Vail HealthCare (1996-2012). | 88 | Current: Fort Hays State University Foundation (1999-present); Stormont-Vail Foundation (2013-present); Topeka Community Foundation (2009-present); University of Minnesota HealthCare Alumni Association Foundation (2009-present). |
Ronald E. Toupin, Jr. (1958) | | Since 2010 | Current: Portfolio Consultant (2010-present). Former: Vice President, Manager and Portfolio Manager, Nuveen Asset Management (1998-1999); Vice President, Nuveen Investment Advisory Corp. (1992-1999); Vice President and Manager, Nuveen Unit Investment Trusts (1991-1999); and Assistant Vice President and Portfolio Manager, Nuveen UnitInvestment Trusts (1988-1999), each of John Nuveen & Co., Inc. (1982-1999). | 91 | Former: Bennett Group of Funds (2011-2013). |
Interested Trustee | | | | | |
| President, Chief Executive Officer and Trustee | Since 2012 | Current: President and CEO, certain other funds in the Fund Complex (2012-present); Vice Chairman, Guggenheim Investments (2010-present). Former: Chairman and CEO, Channel Capital Group, Inc. (2002-2010). | 222 | Current: Guggenheim Partners Japan, Ltd. (2014-present); Delaware Life (2013-present); Guggenheim Life and Annuity Company (2011-present); Paragon Life Insurance Company of Indiana (2011-present). |
| * | The business address of each Trustee is c/o Guggenheim Investments, 227 West Monroe Street, Chicago, IL 60606. |
| ** | Each Trustee serves an indefinite term, until his successor is elected and qualified. Time served includes time served in the respective position for the Predecessor Corporation. |
| | -Messrs. Barnes and Nyberg are Class II Trustees. The Class II Trustees are expected to stand for re-election at the Trust’s annual meeting of shareholders for fiscal year ending May 31, 2015. -Messrs. Karn and Toupin are Class III Trustees. Class III Trustees are expected to stand for re-election at the Fund’s annual meeting of shareholders for the fiscal year ended May 31, 2016. |
| *** | This Trustee is deemed to be an "interested person" of the Funds under the 1940 Act by reason of his position with the Funds' Investment Manager and/or the parent of the Investment Manager. |
Officers
The Officers of the the Guggenheim Build America Bonds Managed Duration Trust, who are not Trustees, and their principal occupations during the past five years:
| | | Term of Office | |
Name, Address* | Position(s) held | and Length of | |
and Year of Birth | with the Trust | Time Served** | Principal Occupations During Past Five Years |
Officers: | | | |
| Assistant Treasurer | Since 2014 | Current: Assistant Treasurer, certain other funds in the Fund Complex (2006-present); Vice President, Security Investors, LLC (2010-present); CFO and Manager, Guggenheim Specialized Products, LLC (2009-present). |
| |
| | | | Former: Vice President, Security Global Investors, LLC (2010-2011); Vice President, Rydex Advisors, LLC (2010); Vice President, Rydex Advisors II, LLC (2010). |
William H. Belden, III (1965) | Vice President | Since 2014 | Current: Vice President, certain other funds in the Fund Complex (2006-present); Managing Director, Guggenheim Funds Investment Advisors, LLC (2005-present). |
| |
| | | | Former: Vice President of Management, Northern Trust Global Investments (1999-2005). |
GBAB l GUGGENHEIM BUILD AMERICA BONDS MANAGED DURATION TRUST SEMIANNUAL REPORT l 29
| SUPPLEMENTAL INFORMATION (Unaudited) continued | November 30, 2014 |
| | | Term of Office | |
Name, Address* | Position(s) held | and Length of | |
and Year of Birth | with the Trust | Time Served** | Principal Occupations During Past Five Years |
Officers continued: | | | |
Joanna M. Catalucci (1966) | Chief Compliance Officer | Since 2012 | Current: Chief Compliance Officer, certain funds in the Fund Complex (2012-present); Managing Director, Guggenheim Investments (2012-present). |
| | | | |
| | | | Former: Chief Compliance Officer and Secretary, certain other funds in the Fund Complex (2008-2012); Senior Vice President & Chief Compliance Officer, Security Investors, LLC and certain affiliates (2010-2012); Chief Compliance Officer and Senior Vice President, Rydex Advisors, LLC and certain affiliates (2010-2011). |
| Assistant Treasurer | Since 2010 | Current: Vice President, Guggenheim Investments (2005-present); Assistant Treasurer, certain other funds in the Fund Complex (2008-present). |
| |
| | | | Former: Senior Manager, Ernst & Young LLP (1999-2005). |
| Assistant Treasurer | Since 2010 | Current: Director, Guggenheim Investments (2004-present); Assistant Treasurer, certain other funds in the Fund Complex (2006-present). |
| |
| | | | Former: Manager, Mutual Fund Administration, Van Kampen Investments, Inc. (1996-2004). |
| | Since 2012 | Current: Chief Legal Officer, certain other funds in the Fund Complex (2012-present); Senior Managing Director, Guggenheim Investments (2012-present). |
| | Legal Officer | | |
| | | | Former: Vice President, Associate General Counsel and Assistant Secretary, Security Benefit Life Insurance Company and Security Benefit Corporation (2004-2012). |
| Secretary | Since 2010 | Current: Secretary, certain other funds in the Fund Complex (2007-present); Managing Director, Guggenheim Investments (2007-present). |
Michael P. Megaris (1984) | Assistant Secretary | Since 2014 | Current: Assistant Secretary, certain other funds in the Fund Complex (2014-present); Associate, Guggenheim Investments (2012-present). |
| |
| | | | Former: J.D., University of Kansas School of Law (2009-2012). |
| Assistant Treasurer | Since 2012 | Current: Vice President, Guggenheim Investments (2012-present); Assistant Treasurer, certain other funds in the Fund Complex (2012-present). |
| |
| | | | Former: Financial Reporting Manager, Invesco, Ltd. (2010-2011); Vice President/Assistant Treasurer, Mutual Fund Administration, Van Kampen Investments, Inc./Morgan Stanley Investment Management (2009-2010); Manager of Mutual Fund Administration, Van Kampen Investments, Inc./Morgan Stanley Investment Management (2005-2009). |
| Vice President | Since 2014 | Current: Vice President, certain other funds in the Fund Complex (2014-present); Director, Guggenheim Investments (2013-present). |
| |
| | | | Former: Senior Vice President, Neuberger Berman Group LLC (2009-2013); Vice President, Morgan Stanley (2002-2009). |
| Chief Financial Officer, Chief | Since 2010 | Current: CFO, Chief Accounting Officer and Treasurer, certain other funds in the Fund Complex (2010-present); Senior Managing Director, Guggenheim Investments (2010-present). |
| | Accounting Officer | | |
| | and Treasurer | | Former: Managing Director and CCO, each of the funds in the Van Kampen Investments fund complex (2004-2010); Managing Director and Head of Fund Accounting and Administration, Morgan Stanley Investment Management (2002-2004); CFO and Treasurer, Van Kampen Funds (1996-2004). |
| * | The business address of each officer is c/o Guggenheim Investments, 227 West Monroe Street, Chicago, IL 60606. |
| ** | Each officer serves an indefinite term, until his or her successor is duly elected and qualified. The date reflects the commencement date upon which the officer held any officer position with the Trust. |
30 l GBAB l GUGGENHEIM BUILD AMERICA BONDS MANAGED DURATION TRUST SEMIANNUAL REPORT
| DIVIDEND REINVESTMENT PLAN (Unaudited) | November 30, 2014 |
Unless the registered owner of common shares elects to receive cash by contacting The Computershare Shareowner Services LLC (the “Plan Administrator”), all dividends declared on common shares of the Trust will be automatically reinvested by the Plan Administrator, administrator for shareholders in the Trust’s Dividend Reinvestment Plan (the “Plan”), in additional common shares of the Trust. Participation in the Plan is completely voluntary and may be terminated or resumed at any time without penalty by notice if received and processed by the Plan Administrator prior to the dividend record date; otherwise such termination or resumption will be effective with respect to any subsequently declared dividend or other distribution. Some brokers may automatically elect to receive cash on your behalf and may re-invest that cash in additional common shares of the Trust for you. If you wish for all dividends declared on your common shares of the Trust to be automatically reinvested pursuant to the Plan, please contact your broker.
The Plan Administrator will open an account for each common shareholder under the Plan in the same name in which such common shareholder’s common shares are registered. Whenever the Trust declares a dividend or other distribution (together, a “Dividend”) payable in cash, non-participants in the Plan will receive cash and participants in the Plan will receive the equivalent in common shares. The common shares will be acquired by the Plan Administrator for the participants’ accounts, depending upon the circumstances described below, either (i) through receipt of additional unissued but authorized common shares from the Trust (“Newly Issued Common Shares”) or (ii) by purchase of outstanding common shares on the open market (“Open-Market Purchases”) on the New York Stock Exchange or elsewhere. If, on the payment date for any Dividend, the closing market price plus estimated brokerage commission per common share is equal to or greater than the net asset value per common share, the Plan Administrator will invest the Dividend amount in Newly Issued Common Shares on behalf of the participants. The number of Newly Issued Common Shares to be credited to each participant’s account will be determined by dividing the dollar amount of the Dividend by the net asset value per common share on the payment date; provided that, if the net asset value is less than or equal to 95% of the closing market value on the payment date, the dollar amount of the Dividend will be divided by 95% of the closing market price per common share on the payment date. If, on the payment date for any Dividend, the net asset value per common share is greater than the closing market value plus estimated brokerage commission, the Plan Administrator will invest the Dividend amount in common shares acquired on behalf of the participants in Open-Market Purchases.
If, before the Plan Administrator has completed its Open-Market Purchases, the market price per common share exceeds the net asset value per common share, the average per common share purchase price paid by the Plan Administrator may exceed the net asset value of the common shares, resulting in the acquisition of fewer common shares than if the Dividend had been paid in Newly Issued Common Shares on the Dividend payment date. Because of the foregoing difficulty with respect to Open-Market Purchases, the Plan provides that if the Plan Administrator is unable to invest the full Dividend amount in Open-Market Purchases during the purchase period or if the market discount shifts to a market premium during the purchase period, the Plan Administrator may cease making Open-Market Purchases and may invest the uninvested portion of the Dividend amount in Newly Issued Common Shares at net asset value per common share at the close of business on the Last Purchase Date provided that, if the net asset value is less than or equal to 95% of the then current market price per common share; the dollar amount of the Dividend will be divided by 95% of the market price on the payment date.
The Plan Administrator maintains all shareholders’ accounts in the Plan and furnishes written confirmation of all transactions in the accounts, including information needed by shareholders for tax records. Common shares in the account of each Plan participant will be held by the Plan Administrator on behalf of the Plan participant, and each shareholder proxy will include those shares purchased or received pursuant to the Plan. The Plan Administrator will forward all proxy solicitation materials to participants and vote proxies for shares held under the Plan in accordance with the instruction of the participants.
There will be no brokerage charges with respect to common shares issued directly by the Trust. However, each participant will pay a pro rata share of brokerage commission incurred in connection with Open-Market Purchases. The automatic reinvestment of Dividends will not relieve participants of any Federal, state or local income tax that may be payable (or required to be withheld) on such Dividends.
The Trust reserves the right to amend or terminate the Plan. There is no direct service charge to participants with regard to purchases in the Plan; however, the Trust reserves the right to amend the Plan to include a service charge payable by the participants.
All correspondence or questions concerning the Plan should be directed to the Plan Administrator, Computershare Shareowner Services LLC, P.O. Box 30170, College Station, TX 77842-3170; Attention Shareholder Services Department, Phone Number: 866-488-3559.
GBAB l GUGGENHEIM BUILD AMERICA BONDS MANAGED DURATION TRUST SEMIANNUAL REPORT l 31
This Page Intentionally Left Blank.
This Page Intentionally Left Blank.
This Page Intentionally Left Blank.
TRUST INFORMATION November 30, 2014
Board of Trustees | Principal Executive Officers | Investment Adviser | Legal Counsel |
Randall C. Barnes | Donald C. Cacciapaglia | Guggenheim Funds | Skadden, Arps, Slate, |
| | Chief Executive Officer | Investment Advisors, LLC | Meagher & Flom LLP |
Donald C. Cacciapaglia* | | Chicago, IL | New York, NY |
| | Joanna M. Catalucci | | |
Donald A. Chubb | Chief Compliance Officer | Investment Sub-Adviser | Independent Registered |
| | | Guggenheim Partners | Public Accounting Firm |
Jerry B. Farley | Amy J. Lee | Investment | Ernst & Young LLP |
| | Chief Legal Officer | Management, LLC | McLean, VA |
Roman Friedrich III | | Santa Monica, CA | |
| | Mark M. Mathiasen | | |
Robert B. Karn III | Secretary | Administrator and | |
| | | Accounting Agent | |
Ronald A. Nyberg | John L. Sullivan | Rydex Fund Services, LLC | |
| | Chief Financial Officer, | Rockville, MD | |
Maynard F. Oliverius | Chief Accounting Officer | | |
| | and Treasurer | Custodian | |
Ronald E. Toupin, Jr. , | | The Bank of New York Mellon | |
Chairman | | New York, NY | |
| | | | |
* Trustee is an “interested | | | |
person” (as defined in section | | | |
2(a)(19) of the 1940 Act) | | | |
(“Interested Trustee”) of the | | | |
Fund because of his position as | | | |
the President and CEO of the | | | |
Investment Adviser and | | | |
Administrator. | | | |
Privacy Principles of Guggenheim Build America Bonds Managed Duration Trust for Shareholders
The Trust is committed to maintaining the privacy of its shareholders and to safeguarding its non-public personal information. The following information is provided to help you understand what personal information the Trust collects, how we protect that information and why, in certain cases, we may share information with select other parties.
Generally, the Trust does not receive any non-public personal information relating to its shareholders, although certain non-public personal information of its shareholders may become available to the Trust. The Trust does not disclose any non-public personal information about its shareholders or former shareholders to anyone except as permitted by law or as is necessary in order to service shareholder accounts (for example, to a transfer agent or third party administrator).
The Trust restricts access to non-public personal information about the shareholders to Guggenheim Funds Investment Advisors, LLC employees with a legitimate business need for the information. The Trust maintains physical, electronic and procedural safeguards designed to protect the non-public personal information of its shareholders.
Questions concerning your shares of Guggenheim Build America Bonds Managed Duration Trust?
| · | If your shares are held in a Brokerage Account, contact your Broker. |
| · | If you have physical possession of your shares in certificate form, contact the Trust’s Transfer Agent: |
| | Computershare Shareowner Services LLC, P.O. Box 30170, College Station, TX 77842-3170; (866) 488-3559 |
This report is sent to shareholders of Guggenheim Build America Bonds Managed Duration Trust for their information. It is not a Prospectus, circular or representation intended for use in the purchase or sale of shares of the Trust or of any securities mentioned in this report.
A description of the Trust’s proxy voting policies and procedures related to portfolio securities is available without charge, upon request, by calling the Trust at (866) 392-3004.
Information regarding how the Trust voted proxies for portfolio securities, if applicable, during the most recent 12-month period ended June 30, is also available, without charge and upon request by calling (866) 392-3004, by visiting the Trust’s website at guggenheiminvestments.com/gbab or by accessing the Trust’s Form N-PX on the U.S. Securities and Exchange Commission’s (SEC) website at www.sec.gov.
The Trust files its complete schedule of portfolio holdings with the SEC for the first and third quarters of each fiscal year on Form N-Q. The Trust’s Form N-Q is available on the SEC website at www.sec.gov or the Trust’s website at guggenheiminvestments.com/gbab. The Trust’s Form N-Q may also be viewed and copied at the SEC’s Public Reference Room in Washington, DC; information on the operation of the Public Reference Room may be obtained by calling (800) SEC-0330.
Notice to Shareholders
Notice is hereby given in accordance with Section 23(c) of the Investment Company Act of 1940, as amended, that the Trust from time to time may purchase shares of its common stock in the open market.
GBAB l GUGGENHEIM BUILD AMERICA BONDS MANAGED DURATION TRUST SEMIANNUAL REPORT l 35
Guggenheim Partners Investment Management, LLC
Guggenheim Partners Investment Management, LLC (“GPIM”) is an indirect subsidiary of Guggenheim Partners, LLC, a diversified financial services firm. The firm provides capital markets services, portfolio and risk management expertise, wealth management, and investment advisory services. Clients of Guggenheim Partners, LLC subsidiaries are an elite mix of individuals, family offices, endowments, foundations, insurance companies and other institutions.
Investment Philosophy
GPIM’s investment philosophy is predicated upon the belief that thorough research and independent thought are rewarded with performance that has the potential to outperform benchmark indexes with both lower volatility and lower correlation of returns over time as compared to such benchmark indexes.
Investment Process
GPIM’s investment process is a collaborative effort between various groups including the Portfolio Construction Group, which utilize proprietary portfolio construction and risk modeling tools to determine allocation of assets among a variety of sectors, and its Sector Specialists, who are responsible for security selection within these sectors and for implementing securities transactions, including the structuring of certain securities directly with the issuers or with investment banks and dealers involved in the origination of such securities.
| | | |
Guggenheim Funds Distributors, LLC | | |
227 West Monroe Street | | |
Chicago, IL 60606 | | |
Member FINRA/SIPC | | |
(01/15) | | |
| | NOT FDIC-INSURED l NOT BANK-GUARANTEED l MAY LOSE VALUE | CEF - GBAB - SAR - 1114 |
Item 2. Code of Ethics.
Not applicable for a semi-annual reporting period.
Item 3. Audit Committee Financial Expert.
Not applicable for a semi-annual reporting period.
Item 4. Principal Accountant Fees and Services.
Not applicable for a semi-annual reporting period.
Item 5. Audit Committee of Listed Registrants.
Not applicable for a semi-annual reporting period.
Item 6. Schedule of Investments.
The Schedule of Investments is included as part of Item 1.
Item 7. Disclosure of Proxy Voting Policies and Procedures for Closed-End Management Investment Companies.
Not applicable for a semi-annual reporting period.
Item 8. Portfolio Managers of Closed-End Management Investment Companies.
(a) Not applicable for a semi-annual reporting period.
(b) There has been no change, as of the date of filing, in any of the Portfolio Managers identified in response to paragraph (a)(1) of this Item in the registrant’s most recent annual report on Form N-CSR.
Item 9. Purchases of Equity Securities by Closed-End Management Investment Company and Affiliated Purchasers.
None.
Item 10. Submission of Matters to a Vote of Security Holders.
The registrant has not made any material changes to the procedures by which shareholders may recommend nominees to the registrant’s Board of Trustees.
Item 11. Controls and Procedures.
(a) The registrant's principal executive officer and principal financial officer have evaluated the registrant's disclosure controls and procedures (as defined in Rule 30a-3(c) under the Investment Company Act) as of a date within 90 days of this filing and have concluded based on such
evaluation, as required by Rule 30a-3(b) under the Investment Company Act, that the registrant's disclosure controls and procedures were effective, as of that date, in ensuring that information required to be disclosed by the registrant in this Form N-CSR was recorded, processed, summarized, and reported within the time periods specified in the Securities and Exchange Commission’s rules and forms.
(b) There were no changes in the registrant’s internal control over financial reporting (as defined in Rule 30a-3(d) under the Investment Company Act) that occurred during the registrant’s second fiscal quarter of the period covered by this report that have materially affected, or are reasonably likely to materially affect, the registrant’s internal control over financial reporting.
Item 12. Exhibits.
(a)(1) Not applicable
(a)(2) Certifications of principal executive officer and principal financial officer pursuant to Rule 30a-2(a) under the Investment Company Act.
(a)(3) Not applicable.
(b) Certification of principal executive officer and principal financial officer pursuant to Rule 30a-2(b) under the Investment Company Act and Section 906 of the Sarbanes-Oxley Act of 2002.
SIGNATURES
Pursuant to the requirements of the Securities Exchange Act of 1934 and the Investment Company Act of 1940, the registrant has duly caused this report to be signed on its behalf by the undersigned, thereunto duly authorized.
(Registrant) Guggenheim Build America Bonds Managed Duration Trust
By: /s/ Donald C. Cacciapaglia
Name: Donald C. Cacciapaglia
Title: Chief Executive Officer
Date: February 4, 2015
Pursuant to the requirements of the Securities Exchange Act of 1934 and the Investment Company Act of 1940, this report has been signed by the following persons on behalf of the registrant and in the capacities and on the dates indicated.
By: /s/ Donald C. Cacciapaglia
Name: Donald C. Cacciapaglia
Title: Chief Executive Officer
Date: February 4, 2015
Name: John L. Sullivan
Title: Chief Financial Officer, Chief Accounting Officer and Treasurer
Date: February 4, 2015