united states
securities and exchange commission
washington, d.c. 20549
form n-csr
certified shareholder report of registered management
investment companies
Investment Company Act file number 811-22447
Equinox Funds Trust
(Exact name of registrant as specified in charter)
17605 Wright Street Omaha, Nebraska 68130
(Address of principal executive offices) (Zip code)
James Ash, Gemini Fund Services, LLC.
80 Arkay Drive, Suite 110, Hauppauge, NY 11788
(Name and address of agent for service)
Registrant's telephone number, including area code: 631-470-2619
Date of fiscal year end: 9/30
Date of reporting period: 9/30/17
Item 1. Reports to Stockholders.
| |
| EQUINOX FUNDS TRUST |
| |
| |
| |
| |
| EQUINOX BH-DG STRATEGY FUND |
| |
| CLASS I SHARES : EBHIX |
| |
| EQUINOX CHESAPEAKE STRATEGY FUND |
| |
| CLASS A SHARES : ECHAX |
| |
| CLASS C SHARES : ECHCX |
| |
| CLASS I SHARES : EQCHX |
| |
| EQUINOX CRABEL STRATEGY FUND |
| |
| CLASS I SHARES : EQCRX |
| |
| |
| |
| ANNUAL REPORT |
| |
| SEPTEMBER 30, 2017 |
| |
| 1-888-643-3431 |
| WWW.EQUINOXFUNDS.COM |
This report and the financial statements contained herein are submitted for the general information of shareholders and are not authorized for distribution to prospective investors unless preceded or accompanied by an effective prospectus. Nothing herein contained is to be considered an offer to buy shares of the Equinox Funds. Such offering is made only by prospectus, which includes details as to offering price and other material information.
Distributed by Northern Lights Distributors, LLC
Member FINRA

EQUINOX ALTERNATIVE STRATEGY PLATFORM
Annual Letter to Shareholders for the year ended September 30, 2017
Seven Equinox single-CTA strategy funds (the “Funds”) were on the Equinox Alternative Strategy Platform (“EASP”) as of September 30, 2017, the end of the fiscal year.1
The EASP Funds’ investment objective is to seek long-term capital appreciation, which they pursue by investing (a) directly or (b) indirectly through their wholly-owned subsidiaries, in a combination of
| (i) | trading companies that employ the managed futures programs of a single commodity trading advisor (“CTA”) registered with the US Commodity Futures Trading Commission, and/or derivative instruments such as swap agreements that provide exposure to the managed futures program of said CTA2; and |
| (ii) | a fixed-income portfolio. |
PERFORMANCE OF THE FUND (10/1/2016 to 9/30/2017)
| NAME | TICKER | 12 MO RETURN
(10/1/16-9/30/17) | CUMULATIVE RETURN
SINCE INCEPTION | INCEPTION
DATE |
| Equinox BH-DG Strategy Fund – I | EBHIX | -1.83% | 15.53% | 12/31/2013 |
| Equinox Chesapeake Strategy Fund – A | ECHAX | -1.26% | -4.86% | 8/21/2015 |
Equinox Chesapeake Strategy Fund – A
(with 5.75% maximum sales charge) | ECHAX | -6.97% | -10.31% | 8/21/2015 |
| Equinox Chesapeake Strategy Fund – C | ECHCX | -1.95% | -6.23% | 8/21/2015 |
| Equinox Chesapeake Strategy Fund – I | EQCHX | -0.92% | 43.49% | 9/10/2012 |
| Equinox Crabel Strategy Fund – I | EQCRX | -8.29% | -11.17% | 3/7/2013 |
PAST PERFORMANCE DOES NOT GUARANTEE FUTURE RESULTS.
Investments in Managed Futures are speculative, involve substantial risk, and are not suitable for all investors.
Returns of various share classes are displayed above, for the fiscal year ending 9/30/2017 and for the period since inception. Given the diversity of these CTA programs, this divergence in their performance is not too surprising. Chesapeake’s “classic” medium to long-term trend-following program had another close to flat year, its second in a row, but the Fund’s Class I shares remain
| 1 | The Equinox Campbell Strategy Fund and the Equinox Aspect Core Diversified Strategy Fund are not included in this exposition, as they are discussed separately. The Equinox Systematica Macro Fund and Equinox IPM Systematic Macro Fund are not included in this exposition because they do not have a 9/30 fiscal year end. |
| 2 | A “Managed Futures Program” generally is a trading program that a CTA uses to guide its investments in futures, forwards, options or spot contracts. A “Trading Company” is a pooled investment vehicle organized as a limited liability company and operated as a commodity pool. Please see each Fund’s Prospectus for a detailed description of the individual CTA trading programs. |
| 47 Hulfish Street, Suite 510, Princeton, NJ 08542 • T 609.430.0404 • F 609.454.5010 • www.equinoxfunds.com |
up handsomely, almost +44% since inception. After a strong previous year, BH-DG, which can be classified primarily as a medium-term trend-following program, had a slightly negative year, and is still up about +15.5% since inception. Crabel, a very short-term trading program, also following a very good year, had a negative year and is now down about –11% since inception. Based on the longer-term historical track record of all three of these CTAs, we remain optimistic about the future prospects for all these Funds.
Equity Indices was the only sector that contributed positively for both trend-followers, Chesapeake and BH-DG. The biggest detractor from performance for both was the Fixed Income sector, followed by Commodities (Energy, Metals, and Agricultural Commodities combined) and Currencies. For Crabel, the Currencies sector was the smallest detractor from performance, and was close to flat for the year. The biggest detractor from performance was the Commodities sector, followed by Equity Indices and Fixed Income.
MARKET COMMENTARY AND OUTLOOK
After three good years, bonds have started showing signs of stress, as the Fed starts to downsize its balance sheet, and rate hikes loom on the horizon. Global equity markets, however, continue their upward march, and we are now in the ninth year of the bull run, with most global indices at or near all-time highs. Energy prices have been volatile, and may continue to do so, especially given the specter of Trump’s reneging on the Iran deal. All these factors combine to create a less than favorable market climate for the managed futures asset class as a whole.
The VIX® Index, known to investors as the “fear index,” has remained in an extremely narrow range since January 2017. After recording only 9 readings below 10% in the 27 years since its inception (in 1990), the Index proceeded to record 24 readings below 10% during the first nine months of 2017. Noted academic and industry pundits began to question the value of the VIX® as a predictor of market uncertainty; one academic called the low levels of the VIX® “the biggest financial mystery of our time.” Many people are now deriding the VIX® as “a fake fear index,” and contending that it is time to switch to other more useful indicators.
The rationale for these types of statements is that there is still rampant uncertainty in the markets. In the US, it centers mainly on Trump’s healthcare, fiscal, and tax policies, and the escalating Russia scandal and its potential outcome(s). In addition, US-North Korea tensions have added a new dimension to previously existing geopolitical stresses. Surprisingly, equity markets have continued to rally but not without an occasional case of the jitters. The Fed itself has remarked that equity prices are “quite high relative to standard valuation measures.” The widely followed Cyclically Adjusted Price-to-earnings (CAPE) Ratio stands at a historical high of almost 31.0, according to creator Nobel Laureate Robert Shiller, who has commented that the U.S. stock market “hasn’t been this overvalued except a couple of times around 1929 (the Great Depression) and around 2000.” We are well above the 2007 valuations right before the global
| 47 Hulfish Street, Suite 510, Princeton, NJ 08542 • T 609.430.0404 • F 609.454.5010 • www.equinoxfunds.com |
financial crisis; still, to be fair, Shiller has also expressed his belief the market could still have room to run. Meanwhile, other market professionals have expressed concerns about increases in the level and volatility of interest rates.
We are a little leery of beginning to sound like a “broken record” in repeating that we believe there is still a lot of latent uncertainty in the markets. In the US, concerns about the Trump administration and the potential outcome of multiple investigations into Russia-related financial and electoral scandals continue, as do the geopolitical stresses in Europe and the Middle East. Climate change continues to rear its ugly head, this year in the form of an unprecedented hurricane season. Surprisingly, equity markets continue to scale new heights while raising the question: how much longer? Opinions about the Fed’s policy on interest rates and its impact still seem likely to evolve over time, depending on the strength of the economy and evidence of inflation.
Although the Funds have been in operation for a relatively short period of time, all three CTAs have traded similar strategies/programs for many years (almost three decades, in the case of Chesapeake), which have historically offered useful diversification benefits, along with what we view as attractive risk-adjusted long-term returns over multiple market cycles. In our opinion, the Funds and the managed futures asset class should continue to offer these potential benefits in a market environment that is still challenging and a geopolitical outlook that remains fraught with uncertainty. In fact, managed futures, although not a hedge for equities in the true sense of the word, have historically displayed the ability to earn what has been termed as “crisis alpha”: positive returns during periods when equity markets have melted down and volatility has increased.
Difficult market conditions, the prevailing climate of economic and geopolitical uncertainty, and the unpredictable nature of financial markets all pose challenges for investors. The EASP Funds are, we believe, positioned to potentially perform well under these conditions. As always, we encourage investors to focus on holding a portfolio that blends traditional assets with a strategic and meaningful allocation to alternative assets, appropriate for their long-term goals. A well-balanced portfolio may display lower volatility, while also affording opportunities for potential long-term growth. We believe that the managed futures asset class should play an important role in such a portfolio.
Thank you for investing in the Equinox Alternative Strategy Platform Funds.
| 47 Hulfish Street, Suite 510, Princeton, NJ 08542 • T 609.430.0404 • F 609.454.5010 • www.equinoxfunds.com |
DEFINITIONS OF TERMS AND INDICES
Alpha is a measure of performance on a risk-adjusted basis. Alpha takes the volatility (price risk) of a fund and compares its risk-adjusted performance to a benchmark index. The excess return of the fund relative to the return of the benchmark index is a fund’s alpha.
A Commodity Trading Advisor (“CTA”) is a trader who may invest in more than 150 global futures markets. They seek to generate profit in both bull or bear markets, due to their ability to go long (buy) futures positions, in anticipation of rising markets, or go short (sell) futures positions, in anticipation of falling markets.
Crisis Alpha refers to the fact that some strategies earn superior risk-adjusted returns during crises The Cyclically Adjusted Price-to-Earnings Ratio is a valuation measure usually applied to the US S&P 500 equity market. It is defined as price divided by the average of ten years of earnings, adjusted for inflation. The VIX® Index (VIX) is a forward-looking measure of equity market volatility. Since its introduction, the VIX is considered by many to be the world’s premier barometer of investor sentiment and market volatility. Investors cannot directly invest in an index and unmanaged index returns do not reflect any fees, expenses or sales charges.
5845-NLD-11/07/2017
| 47 Hulfish Street, Suite 510, Princeton, NJ 08542 • T 609.430.0404 • F 609.454.5010 • www.equinoxfunds.com |
Equinox BH-DG Strategy Fund
PORTFOLIO REVIEW (Unaudited)
September 30, 2017
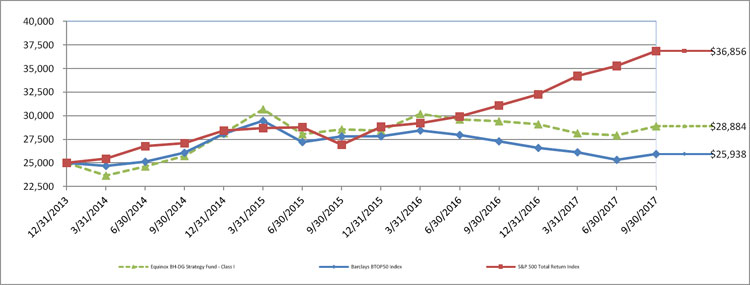
The Fund’s performance figures* for the periods ended September 30, 2017, as compared to its benchmarks:
| | | Annualized |
| | | | Since Inception** |
| | One Year | Three Years | (12/31/2013) |
| Equinox BH-DG Strategy Fund | | | |
| Class I | (1.83)% | 3.94% | 3.93% |
| Barclays BTOP50 Index *** | (4.95)% | (0.18)% | 0.99% |
| S&P 500 Total Return Index + | 18.61% | 10.81% | 10.91% |
| * | The performance data quoted is historical. The performance comparison includes reinvestment of all dividends and capital gains. Past performance is no guarantee of future results. Current performance may be higher or lower than the performance data quoted. The principal value and investment return of an investment will fluctuate so that your shares, when redeemed, may be worth more or less than their original cost. The returns shown do not reflect the deduction of taxes that a shareholder would pay on portfolio distributions or on the redemptions of portfolio shares. Performance figures for periods greater than one year are annualized. The returns would have been lower had the Advisor not waived its fees or reimbursed a portion of the Fund’s expenses. Per the fee table in the Fund’s prospectus dated February 1, 2017, the Fund’s “Total Annual Fund Operating Expenses” are 94.09.% and the Fund’s “Total Annual Fund Operating Expenses (after Fee Waiver and/or Expense Reimbursement)” are 1.10% for Class I shares, of the Fund’s average daily net assets. These expenses may differ from the actual expenses incurred by the Fund for the period covered by this report. Additional information regarding the Fund’s expense ratios is available in the Financial Highlights. For performance information current to the most recent month-end please call 1-888-643-3431. |
| ** | Commencement of operations and start of performance was December 31, 2013. |
| *** | The Barclay BTOP50 Index (“BTOP50 Index”) seeks to replicate the overall composition of the managed futures industry with regard to trading style and overall market exposure. The BTOP50 Index employs a top-down approach in selecting its constituents. The largest investable trading advisor programs, as measured by assets under management, are selected for inclusion in the BTOP50 Index. In each calendar year the selected trading advisors represent, in aggregate, no less than 50% of the investable assets of the Barclay CTA Universe. For 2017 there are 20 funds in the BTOP50 Index. Investors cannot invest directly in an index. |
| + | The S&P 500 Total Return Index is a widely accepted, unmanaged index of U.S. stock market performance which does not take into account charges, fees, and other expenses. Investors cannot invest directly in an index. |
Comparison of the Change in Value of a $25,000 Investment
| Holdings by Asset Class | | % of Net Assets | |
| Other Assets Less Liabilities | | | 100.0 | % |
| | | | 100.0 | % |
Please refer to the Consolidated Portfolio of Investments in this annual report for a detail of the Fund’s holdings. The value of the Fund’s derivative positions that provide exposure to a managed futures program is included in “other assets less liabilities;” however, the portfolio composition detailed above does not include derivatives exposure. See the accompanying notes for more information on the impact of the Fund’s derivative positions on the consolidated financial statements.
Equinox Chesapeake Strategy Fund
PORTFOLIO REVIEW (Unaudited)
September 30, 2017
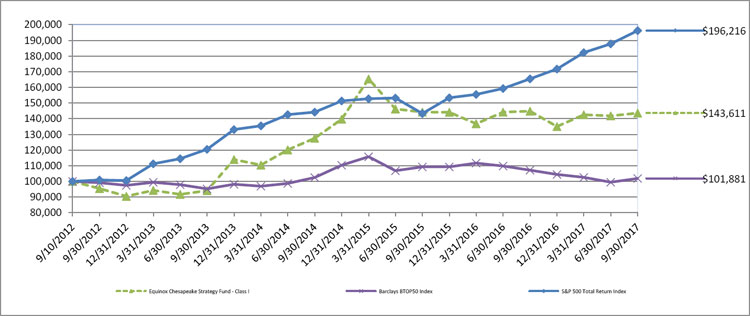
The Fund’s performance figures* for the periods ended September 30, 2017, as compared to its benchmarks:
| | | Annualized |
| | | | | Start of | |
| | | | | Performance | Since Inception |
| | One Year | Three Years | Five Years | (09/10/2012) | (08/21/2015) |
| Equinox Chesapeake Strategy Fund | | | | | |
| Class A with load^ | (6.81)% | N/A | N/A | N/A | (4.95)% |
| Class A ^ | (1.09)% | N/A | N/A | N/A | (2.25)% |
| Class C ^ | (1.86)% | N/A | N/A | N/A | (2.97)% |
| Class I ** | (0.84)% | 4.05% | 8.52% | 7.42% | N/A |
| Barclay BTOP50 Index *** | (4.95)% | (0.18)% | 0.55% | 0.37% | (3.34) |
| S&P 500 Total Return Index + | 18.61% | 10.18% | 14.22% | 14.26% | 14.75% |
| * | The performance data quoted is historical. The performance comparison includes reinvestment of all dividends and capital gains and has been adjusted for Class A maximum applicable sales charge of 5.75%. Past performance is no guarantee of future results. Current performance may be higher or lower than the performance data quoted. The principal value and investment return of an investment will fluctuate so that your shares, when redeemed, may be worth more or less than their original cost. The returns shown do not reflect the deduction of taxes that a shareholder would pay on portfolio distributions or on the redemptions of portfolio shares. Performance figures for periods greater than one year are annualized. The returns would have been lower had the Advisor not waived its fees or reimbursed a portion of the Fund’s expenses. Per the fee table in the supplement to the Fund’s prospectus dated February 1, 2017, the Fund’s “Total Annual Fund Operating Expenses” are 1.43%, 2.16%, and 1.18% and the Fund’s “Total Annual Fund Operating Expenses (after Fee Waiver and/or Expense Reimbursement)” are 1.36%, 2.11%, and 1.11% for Class A, Class C and Class I shares, respectively, of the Fund’s average daily net assets. These expenses may differ from the actual expenses incurred by the Fund for the period covered by this report. Additional information regarding the Fund’s expense ratios is available in the Financial Highlights. For performance information current to the most recent month-end please call 1-888-643-3431. |
| ** | Commencement of operations for Class I was April 19, 2012. Start of performance was September 10, 2012. |
| ^ | Commencement of operations and start of performance for Class A and Class C was August 21, 2015. |
| *** | The Barclay BTOP50 Index (“BTOP50 Index”) seeks to replicate the overall composition of the managed futures industry with regard to trading style and overall market exposure. The BTOP50 Index employs a top-down approach in selecting its constituents. The largest investable trading advisor programs, as measured by assets under management, are selected for inclusion in the BTOP50 Index. In each calendar year the selected trading advisors represent, in aggregate, no less than 50% of the investable assets of the Barclays CTA Universe. For 2017 there are 20 funds in the BTOP50 Index. Investors cannot invest directly in an index. |
| + | The S&P 500 Total Return Index is a widely accepted, unmanaged index of U.S. stock market performance which does not take into account charges, fees, and other expenses. Investors cannot invest directly in an index. |
Comparison of the Change in Value of a $100,000 Investment
| Holdings by Asset Class | | % of Net Assets | |
| U.S. Treasury Notes | | | 45.2 | % |
| Other Assets Less Liabilities | | | 54.8 | % |
| | | | 100.0 | % |
Please refer to the Consolidated Portfolio of Investments in this annual report for a detail of the Fund’s holdings. The value of the Fund’s derivative positions that provide exposure to a managed futures program is included in “other assets less liabilities;” however, the portfolio composition detailed above does not include derivatives exposure. See the accompanying notes for more information on the impact of the Fund’s derivative positions on the consolidated financial statements.
Equinox Crabel Strategy Fund
PORTFOLIO REVIEW (Unaudited)
September 30, 2017
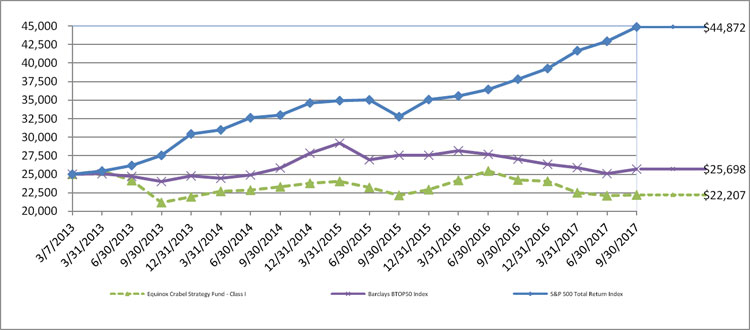
The Fund’s performance figures* for the periods ended September 30, 2017, as compared to its benchmarks:
| | | Annualized |
| | | | Start of |
| | | | Performance |
| | One Year | Three Years | (03/07/2013)** |
| Equinox Crabel Strategy Fund | | | |
| Class I | (8.29)% | 1.59)% | (2.56)% |
| Barclay BTOP50 Index *** | (4.95)% | (0.18)% | 0.60% |
| S&P 500 Total Return Index + | 18.61% | 10.81% | 13.66% |
| * | The performance data quoted is historical. The performance comparison includes reinvestment of all dividends and capital gains. Past performance is no guarantee of future results. Current performance may be higher or lower than the performance data quoted. The principal value and investment return of an investment will fluctuate so that your shares, when redeemed, may be worth more or less than their original cost. The returns shown do not reflect the deduction of taxes that a shareholder would pay on portfolio distributions or on the redemptions of portfolio shares. Performance figures for periods greater than one year are annualized. The returns would have been lower had the Advisor not waived its fees or reimbursed a portion of the Fund’s expenses. Per the fee table in the Fund’s prospectus dated February 1, 2017, the Fund’s “Total Annual Fund Operating Expenses” are 6.45.% and the Fund’s “Total Annual Fund Operating Expenses (after Fee Waiver and/or Expense Reimbursement)” are 1.27% for Class I shares, of the Fund’s average daily net assets. These expenses may differ from the actual expenses incurred by the Fund for the period covered by this report. Additional information regarding the Fund’s expense ratios is available in the Financial Highlights. For performance information current to the most recent month-end please call 1-888-643-3431. |
| ** | Commencement of operations was April 19, 2012. Start of performance was March 7, 2013. |
| *** | The Barclay BTOP50 Index (“BTOP50 Index”) seeks to replicate the overall composition of the managed futures industry with regard to trading style and overall market exposure. The BTOP50 Index employs a top-down approach in selecting its constituents. The largest investable trading advisor programs, as measured by assets under management, are selected for inclusion in the BTOP50 Index. In each calendar year the selected trading advisors represent, in aggregate, no less than 50% of the investable assets of the Barclay CTA Universe. For 2017 there are 20 funds in the BTOP50 Index. Investors cannot invest directly in an index. |
| + | The S&P 500 Total Return Index is a widely accepted, unmanaged index of U.S. stock market performance which does not take into account charges, fees, and other expenses. Investors cannot invest directly in an index. |
Comparison of the Change in Value of a $25,000 Investment
| Holdings by Asset Class | | % of Net Assets | |
| U.S. Treasury Note | | | 61.8 | % |
| Short Term Investments | | | 28.8 | % |
| Other Assets Less Liabilities | | | 9.4 | % |
| | | | 100.0 | % |
Please refer to the Consolidated Portfolio of Investments in this annual report for a detail of the Fund’s holdings. The value of the Fund’s derivative positions that provide exposure to a managed futures program is included in “other assets less liabilities;” however, the portfolio composition detailed above does not include derivatives exposure. See the accompanying notes for more information on the impact of the Fund’s derivative positions on the consolidated financial statements.
Equinox BH-DG Strategy Fund
CONSOLIDATED PORTFOLIO OF INVESTMENTS
September 30, 2017
| | | | Value | |
| | TOTAL INVESTMENTS - 0.0% (Cost - $0) | | $ | — | |
| | OTHER ASSETS AND LIABILITIES - NET - 100.0% | | | 79,162 | |
| | TOTAL NET ASSETS - 100.0% | | $ | 79,162 | |
| TOTAL RETURN SWAP | |
| Notional Value at | | | | | | | | | Variable Rate | | Maturity | | Unrealized | |
| September 30, 2017 | | | Description | | Counterparty | | Fixed Rate Paid | | Received | | Date | | Appreciation | |
| | | | | | | | | | | | | | | | | |
| | | | | | | | | | | Total returns | | | | | | |
| | | | | | | | | | | from the BH-DG | | | | | | |
| | | | | BH-DG Systematic Trading Program Total | | | | 0.35% of the | | Systematic | | | | | | |
| | 81,600 | | | Return Swap + | | Deutsche Bank | | notional value | | Trading Program | | 12/31/2018 | | $ | 699 | |
| | | | | | | Total Net Unrealized Appreciation on Swap Contract | | $ | 699 | |
| + | This investment is a holding of Equinox BH-DG Strategy Fund Limited. |
See accompanying notes to consolidated financial statements.
Equinox BH-DG Strategy Fund
CONSOLIDATED PORTFOLIO OF INVESTMENTS (Continued)
September 30, 2017
Total Return Swap Top 50 Holdings ^
| FUTURES CONTRACTS |
| Short Positions |
| | | | | | | | | | | | | Unrealized | |
| Number of | | | | | | | | | Notional Value at | | | Appreciation/ | |
| Contracts* | | | Description | | Counterparty | | Expiration Date | | September 30, 2017 | | | (Depreciation) | |
| | — | | | 2 Year U.S. Treasury Notes Future | | Deutsche Bank | | Dec-17 | | $ | 17,011 | | | $ | 5 | |
| | — | | | 3 Month Euro (EURIBOR) | | Deutsche Bank | | Mar-20 | | | 11,631 | | | | (1 | ) |
| | — | | | 3 Month Euro (EURIBOR) | | Deutsche Bank | | Mar-19 | | | 5,831 | | | | — | |
| | — | | | 3 Month Sterling | | Deutsche Bank | | Sep-18 | | | 42,618 | | | | 10 | |
| | — | | | 3 Month Sterling | | Deutsche Bank | | Sep-19 | | | 39,256 | | | | 6 | |
| | — | | | 3 Month Sterling | | Deutsche Bank | | Mar-19 | | | 36,021 | | | | 13 | |
| | — | | | 3 Month Sterling | | Deutsche Bank | | Mar-20 | | | 35,952 | | | | 17 | |
| | — | | | 3 Year Australian Treasury Bond Future | | Deutsche Bank | | Dec-17 | | | 41,883 | | | | 33 | |
| | — | | | 3 Year Korean Treasury Bond Future | | Deutsche Bank | | Dec-17 | | | 20,555 | | | | 1 | |
| | — | | | 5 Year U.S. Treasury Notes Future | | Deutsche Bank | | Dec-17 | | | 4,634 | | | | 8 | |
| | — | | | 10 Year Australian Treasury Bond Future | | Deutsche Bank | | Dec-17 | | | 14,987 | | | | — | |
| | — | | | 10 Year Canadian Govt Bond Future | | Deutsche Bank | | Dec-17 | | | 6,423 | | | | (4 | ) |
| | — | | | 10 Year Korean Treasury Bond Future | | Deutsche Bank | | Dec-17 | | | 6,340 | | | | 21 | |
| | — | | | 10 Year U.S. Treasury Notes Future | | Deutsche Bank | | Dec-17 | | | 4,944 | | | | 2 | |
| | — | | | Copper Grade A Future | | Deutsche Bank | | Nov-17 | | | 6,422 | | | | 131 | |
| | — | | | Eurodollar | | Deutsche Bank | | Sep-19 | | | 28,981 | | | | 13 | |
| | — | | | Eurodollar | | Deutsche Bank | | Mar-20 | | | 24,130 | | | | 13 | |
| | — | | | Eurodollar | | Deutsche Bank | | Mar-19 | | | 19,336 | | | | 9 | |
| | — | | | Eurodollar | | Deutsche Bank | | Mar-21 | | | 14,456 | | | | 6 | |
| | — | | | Primary High Grade Aluminium Future | | Deutsche Bank | | Oct-17 | | | 5,200 | | | | (449 | ) |
| | — | | | Three Month Canadian Bankers Acceptance Future | | Deutsche Bank | | Jun-18 | | | 27,082 | | | | (8 | ) |
| | — | | | Three Month Canadian Bankers Acceptance Future | | Deutsche Bank | | Sep-18 | | | 27,064 | | | | (23 | ) |
| | | | | | | | | | | | | | | | | |
| Long Positions |
| | | | | Description | | | | | | | | | | | | |
| | — | | | 2 Year Euro-Schatz Future | | Deutsche Bank | | Dec-17 | | | 44,399 | | | | (14 | ) |
| | — | | | 3 Month Euro (EURIBOR) | | Deutsche Bank | | Sep-18 | | | 40,863 | | | | (1 | ) |
| | — | | | 3 Month Euro (EURIBOR) | | Deutsche Bank | | Mar-19 | | | 29,154 | | | | (3 | ) |
| | — | | | 3 Month Euro (EURIBOR) | | Deutsche Bank | | Mar-20 | | | 5,815 | | | | (1 | ) |
| | — | | | Brent Crude Monthly Future | | Deutsche Bank | | Oct-17 | | | 5,615 | | | | 47 | |
| | — | | | CAC 40 | | Deutsche Bank | | Oct-17 | | | 3,710 | | | | 72 | |
| | — | | | Copper Grade A Future | | Deutsche Bank | | Nov-17 | | | 6,422 | | | | 8 | |
| | — | | | E-Mini S&P 500 | | Deutsche Bank | | Dec-17 | | | 12,379 | | | | 148 | |
| | — | | | Euro-BOBL Future | | Deutsche Bank | | Dec-17 | | | 9,166 | | | | (21 | ) |
| | — | | | Euro-BUND Future | | Deutsche Bank | | Dec-17 | | | 7,501 | | | | (32 | ) |
| | — | | | Euro-OAT Futures | | Deutsche Bank | | Dec-17 | | | 3,614 | | | | (12 | ) |
| | — | | | Gas Oil Monthly Future | | Deutsche Bank | | Oct-17 | | | 6,483 | | | | 211 | |
| | — | | | MSCI Taiwan Index Future | | Deutsche Bank | | Oct-17 | | | 3,801 | | | | (18 | ) |
| | — | | | Nikkei 225 Mini (JPY) Future | | Deutsche Bank | | Dec-17 | | | 4,987 | | | | 88 | |
| | — | | | NY Harbour ULSD Future | | Deutsche Bank | | Oct-17 | | | 4,516 | | | | 16 | |
| | — | | | Primary High Grade Aluminium Future | | Deutsche Bank | | Oct-17 | | | 5,200 | | | | 423 | |
| | — | | | Primary High Grade Aluminium Future | | Deutsche Bank | | Dec-17 | | | 4,196 | | | | 38 | |
| | — | | | Russell 2000 Mini Index | | Deutsche Bank | | Dec-17 | | | 5,887 | | | | 277 | |
| ^ | This investment is not a direct holding of Equinox BH-DG Strategy Fund Limited. The top 50 holdings were determined based on the absolute notional values of the positions within the underlying swap basket. |
| * | Number of contracts is less than 0.5. |
See accompanying notes to consolidated financial statements.
Equinox BH-DG Strategy Fund
CONSOLIDATED PORTFOLIO OF INVESTMENTS (Continued)
September 30, 2017
Total Return Swap Top 50 Holdings ^
| FORWARD FOREIGN CURRENCY CONTRACTS |
| | | | | | | | | | | | | | | | Unrealized | |
| Settlement | | | | Currency to | | | | | | | Foreign | | | | Appreciation/ | |
| Date | | Counterparty | | Deliver/Receive | | Value | | | In Exchange For | | Currency Value | | U.S. Dollar Value | | (Depreciation) | |
| 12/20/2017 | | Deutsche Bank | | BRO | | | 14,982 | | | USD | | 4,754 | | 4,691 | | $ | (63 | ) |
| 12/20/2017 | | Deutsche Bank | | CAD | | | 5,717 | | | USD | | 4,690 | | 4,578 | | | (113 | ) |
| 12/20/2017 | | Deutsche Bank | | INO | | | 340,641 | | | USD | | 5,271 | | 5,169 | | | (102 | ) |
| 12/20/2017 | | Deutsche Bank | | JPY | | | 407,271 | | | USD | | 3,720 | | 3,630 | | | (90 | ) |
| 12/20/2017 | | Deutsche Bank | | JPY | | | 398,740 | | | AUD | | 4,534 | | 3,540 | | | (1 | ) |
| 12/20/2017 | | Deutsche Bank | | MXN | | | 113,350 | | | USD | | 6,285 | | 6,158 | | | (127 | ) |
| 12/20/2017 | | Deutsche Bank | | SGO | | | 9,659 | | | USD | | 7,187 | | 7,119 | | | (68 | ) |
| 12/20/2017 | | Deutsche Bank | | USD | | | 7,752 | | | AUD | | 9,659 | | 9,843 | | | (183 | ) |
| 12/20/2017 | | Deutsche Bank | | USD | | | 9,015 | | | EUR | | 7,491 | | 7,617 | | | (126 | ) |
| 12/20/2017 | | Deutsche Bank | | USD | | | 4,718 | | | GBP | | 3,548 | | 3,495 | | | 53 | |
| ^ | This investment is not a direct holding of Equinox BH-DG Strategy Fund Limited. The top 50 holdings were determined based on the absolute notional values of the positions within the underlying swap basket. |
| AUD - Austrailian Dollar |
| |
| BRO - Brazilian Real |
| |
| CAD - Canadian Dollar |
| |
| EUR - Euro |
| |
| GBP - Pound Sterling |
| |
| INO - Indian Rupee |
| |
| JPY - Japanese Yen |
| |
| MXN - Mexican Peso |
| |
| SGO - Singapore Dollar |
| |
| USD - U.S. Dollar |
See accompanying notes to consolidated financial statements.
Equinox Chesapeake Strategy Fund
CONSOLIDATED PORTFOLIO OF INVESTMENTS
September 30, 2017
| | | | | | Coupon Rate | | Maturity | | | |
| Principal Amount | | | | | (%) | | Date | | Value | |
| | | | | U.S. TREASURY NOTES - 45.1% | | | | | | | | |
| $ | 9,000,000 | | | United States Treasury Note | | 0.875 | | 1/15/2018 | | $ | 8,992,906 | |
| | 8,000,000 | | | United States Treasury Note | | 1.000 | | 3/15/2018 | | | 7,992,843 | |
| | 5,000,000 | | | United States Treasury Note | | 1.000 | | 8/15/2018 | | | 4,985,156 | |
| | 2,000,000 | | | United States Treasury Note | | 1.875 | | 10/31/2017 | | | 2,001,286 | |
| | | | | TOTAL U.S TREASURY NOTES (Cost - $23,992,550) | | | | | 23,972,191 | |
| | | | | | | | | | | | | |
| | | | | TOTAL INVESTMENTS - 45.1% (Cost - $23,992,550) | | | | $ | 23,972,191 | |
| | | | | OTHER ASSETS AND LIABILITIES - NET - 54.9% | | | | | 29,149,630 | |
| | | | | TOTAL NET ASSETS - 100.0% | | | | | | $ | 53,121,821 | |
See accompanying notes to consolidated financial statements.
Equinox Chesapeake Strategy Fund
CONSOLIDATED PORTFOLIO OF INVESTMENTS (Continued)
September 30, 2017
SHORT FUTURES CONTRACTS
| | | | | | | | | Notional Value at | | | | |
| | | | | | | | | September 30, | | | Unrealized Appreciation/ | |
| Description | | Contracts | | Counterparty | | Expiration Date | | 2017 | | | (Depreciation) | |
| Altria Group, Inc. | | 206 | | Morgan Stanley | | Dec-17 | | $ | 1,309,954 | | | $ | (51,494 | ) |
| AT&T, Inc. | | 186 | | Morgan Stanley | | Dec-17 | | | 730,422 | | | | (67,638 | ) |
| Bank Accept Future | | 190 | | Morgan Stanley | | Mar-18 | | | 37,292,808 | | | | 87,579 | |
| Cocoa Future+ | | 160 | | Morgan Stanley | | Dec-17 | | | 3,268,800 | | | | (54,850 | ) |
| Coffee ‘C’ Future+ | | 68 | | Morgan Stanley | | Dec-17 | | | 3,265,275 | | | | 368,925 | |
| Corn Future+ | | 119 | | Morgan Stanley | | Dec-17 | | | 2,113,737 | | | | (25,125 | ) |
| Mill Wheat Euro+ | | 140 | | Morgan Stanley | | Dec-17 | | | 1,373,716 | | | | (22,114 | ) |
| Platinum Future+ | | 15 | | Morgan Stanley | | Jan-18 | | | 686,625 | | | | 14,400 | |
| Silver Future+ | | 18 | | Morgan Stanley | | Dec-17 | | | 1,500,840 | | | | 43,380 | |
| USD/SEK Future | | 93 | | Morgan Stanley | | Dec-17 | | | 9,245,196 | | | | (176,897 | ) |
| Verizon Communications, Inc. | | 211 | | Morgan Stanley | | Dec-17 | | | 1,046,982 | | | | (43,282 | ) |
| World Sugar #11 Future+ | | 68 | | Morgan Stanley | | Mar-18 | | | 1,073,856 | | | | 51,027 | |
| | | | | | | | | | | | | | 123,911 | |
| | | | | | | | | | | | | | | |
| LONG FUTURES CONTRACTS | | | | | | | | | | | | |
| 3M Co. Div | | 143 | | Morgan Stanley | | Dec-17 | | | 3,009,435 | | | | 122,071 | |
| Abbott Laboratories | | 393 | | Morgan Stanley | | Dec-17 | | | 2,102,550 | | | | 98,219 | |
| Alphabet, Inc. | | 18 | | Morgan Stanley | | Dec-17 | | | 1,757,304 | | | | 55,849 | |
| Amazon.com, Inc. | | 18 | | Morgan Stanley | | Dec-17 | | | 1,734,984 | | | | (8,218 | ) |
| Apple, Inc. | | 171 | | Morgan Stanley | | Dec-17 | | | 2,642,463 | | | | (132,093 | ) |
| Australian Dollar Future | | 103 | | Morgan Stanley | | Dec-17 | | | 8,071,080 | | | | (237,705 | ) |
| Bank of America Corp. | | 511 | | Morgan Stanley | | Dec-17 | | | 1,298,451 | | | | 93,838 | |
| Biogen IDEC, Inc. | | 5 | | Morgan Stanley | | Dec-17 | | | 156,970 | | | | (7,546 | ) |
| Brazilian Real Future | | 161 | | Morgan Stanley | | Oct-17 | | | 5,065,865 | | | | (34,775 | ) |
| Bristol-Myers Squibb Co. | | 193 | | Morgan Stanley | | Dec-17 | | | 1,233,463 | | | | 47,664 | |
| British Pound Future | | 119 | | Morgan Stanley | | Dec-17 | | | 9,995,256 | | | | (644 | ) |
| Canadian Dollar Future | | 129 | | Morgan Stanley | | Dec-17 | | | 10,352,895 | | | | (273,480 | ) |
| Chevron Corp. | | 100 | | Morgan Stanley | | Dec-17 | | | 1,178,100 | | | | 51,443 | |
| Cisco Systems, Inc. | | 394 | | Morgan Stanley | | Dec-17 | | | 1,328,568 | | | | 76,297 | |
| Citigroup, Inc. | | 246 | | Morgan Stanley | | Dec-17 | | | 1,794,078 | | | | 136,786 | |
| Coca-Cola Co. | | 486 | | Morgan Stanley | | Dec-17 | | | 2,193,318 | | | | (20,789 | ) |
| Comcast Corp. | | 279 | | Morgan Stanley | | Dec-17 | | | 1,076,382 | | | | (59,101 | ) |
| ConocoPhillips Corp. | | 43 | | Morgan Stanley | | Dec-17 | | | 215,774 | | | | 23,036 | |
| Copper Future+ | | 84 | | Morgan Stanley | | Dec-17 | | | 6,205,500 | | | | (223,475 | ) |
| Euro FX Future | | 67 | | Morgan Stanley | | Dec-17 | | | 9,936,519 | | | | (152,425 | ) |
| FedEx Corp. | | 90 | | Morgan Stanley | | Dec-17 | | | 2,035,530 | | | | 108,085 | |
| Gasoline RBOB Future+ | | 12 | | Morgan Stanley | | Nov-17 | | | 801,864 | | | | (10,433 | ) |
| Gilead Sciences, Inc. | | 136 | | Morgan Stanley | | Dec-17 | | | 1,104,728 | | | | (19,186 | ) |
| Gold 100 Oz. Future+ | | 21 | | Morgan Stanley | | Dec-17 | | | 2,698,080 | | | | (139,360 | ) |
| Home Depot, Inc. | | 165 | | Morgan Stanley | | Dec-17 | | | 2,705,835 | | | | 166,115 | |
| Intel Corp. | | 360 | | Morgan Stanley | | Dec-17 | | | 1,374,480 | | | | 81,650 | |
| JP Morgan Chase & Co. | | 249 | | Morgan Stanley | | Dec-17 | | | 2,384,424 | | | | 150,090 | |
| Live Cattle Future+ | | 60 | | Morgan Stanley | | Dec-17 | | | 2,766,000 | | | | 53,180 | |
| LME Aluminum Future+ | | 43 | | Morgan Stanley | | Nov-17 | | | 2,245,675 | | | | 35,205 | |
| LME Nickel Future+ | | 10 | | Morgan Stanley | | Nov-17 | | | 627,510 | | | | (62,490 | ) |
| LME Zinc Future+ | | 12 | | Morgan Stanley | | Nov-17 | | | 950,475 | | | | 21,978 | |
| McDonald’s Corp. | | 240 | | Morgan Stanley | | Dec-17 | | | 3,770,160 | | | | (47,979 | ) |
| Mexican Peso Future | | 259 | | Morgan Stanley | | Dec-17 | | | 7,025,375 | | | | (203,315 | ) |
| Microsoft Corp. | | 213 | | Morgan Stanley | | Dec-17 | | | 1,590,897 | | | | 11,714 | |
| New Zealand Dollar Future | | 87 | | Morgan Stanley | | Dec-17 | | | 6,274,440 | | | | (39,585 | ) |
See accompanying notes to consolidated financial statements.
Equinox Chesapeake Strategy Fund
CONSOLIDATED PORTFOLIO OF INVESTMENTS (Continued)
September 30, 2017
LONG FUTURES CONTRACTS (Continued)
| | | | | | | | | Notional Value at | | | | |
| | | | | | | | | September 30, | | | Unrealized Appreciation/ | |
| Description | | Contracts | | Counterparty | | Expiration Date | | 2017 | | | (Depreciation) | |
| Nike, Inc. | | 68 | | Morgan Stanley | | Dec-17 | | $ | 353,532 | | | $ | (5,928 | ) |
| NY Harbor ULSD Heating Oil Future+ | | 18 | | Morgan Stanley | | Nov-17 | | | 1,368,360 | | | | 3,801 | |
| Oracle Corp. | | 411 | | Morgan Stanley | | Dec-17 | | | 1,992,528 | | | | (117,747 | ) |
| Palladium Future+ | | 43 | | Morgan Stanley | | Dec-17 | | | 4,028,455 | | | | 16,340 | |
| PepsiCo., Inc. | | 192 | | Morgan Stanley | | Dec-17 | | | 2,145,024 | | | | (91,617 | ) |
| Pfizer, Inc. | | 486 | | Morgan Stanley | | Dec-17 | | | 1,739,394 | | | | 19,654 | |
| Priceline Group, Inc. | | 11 | | Morgan Stanley | | Dec-17 | | | 2,019,204 | | | | 2,180 | |
| Procter & Gamble Co. | | 218 | | Morgan Stanley | | Dec-17 | | | 1,988,596 | | | | (42,610 | ) |
| Russian Ruble Future | | 144 | | Morgan Stanley | | Dec-17 | | | 6,174,000 | | | | (12,600 | ) |
| Southern Co. | | 91 | | Morgan Stanley | | Dec-17 | | | 448,357 | | | | (2,776 | ) |
| Swiss Franc Future | | 15 | | Morgan Stanley | | Dec-17 | | | 1,945,875 | | | | (50,625 | ) |
| Wal-Mart Stores, Inc. | | 246 | | Morgan Stanley | | Dec-17 | | | 1,927,164 | | | | (52,511 | ) |
| | | | | | | | | | | | | | (673,818 | ) |
| NET UNREALIZED DEPRECIATION ON FUTURES CONTRACTS | | | | | | $ | (549,907 | ) |
| + | This investment is a holding of Equinox Chesapeake Strategy Fund Limited. |
See accompanying notes to consolidated financial statements.
Equinox Crabel Strategy Fund
CONSOLIDATED PORTFOLIO OF INVESTMENTS
September 30, 2017
| Principal | | | | | | | | | | | | |
| Amount | | | | | Coupon Rate (%) | | Coupon Rate (%) | | Maturity Date | | Value | |
| | | | | U.S. TREASURY NOTES - 61.8% | | | | | | | | |
| $ | 100,000 | | | United States Treasury Note | | 0.750 | | 0.750 | | 10/31/2017 | | $ | 99,978 | |
| | 300,000 | | | United States Treasury Note | | 1.000 | | 1.000 | | 8/15/2018 | | | 299,110 | |
| | 800,000 | | | United States Treasury Note | | 1.000 | | 1.000 | | 3/15/2018 | | | 799,284 | |
| | | | | TOTAL U.S TREASURY NOTES (Cost - $1,199,219) | | | | | 1,198,372 | |
| | | | | | | | | | | |
| Shares | | | | | | | | | | | | | |
| | | | | SHORT-TERM INVESTMENTS - 28.8% | | | | | | |
| | | | | MONEY MARKET FUNDS - 28.8% | | | | | | |
| | 277,764 | | | Goldman Sachs Funds PLC - US Dollar Liquid Reserves Fund - Institutional Share Class, 0.66%* + | | | 277,764 | |
| | 281,399 | | | JPMorgan Liquidity Funds - US Dollar Liquidity Fund - Institutional Share Class, 0.57% * + | | | 281,399 | |
| | | | | TOTAL SHORT-TERM INVESTMENTS (Cost $559,163) | | | 559,163 | |
| | | | | | | | | | | | | | | |
| | | | | TOTAL INVESTMENTS - 90.6% (Cost - $1,758,382) | | $ | 1,757,535 | |
| | | | | OTHER ASSETS AND LIABILITIES - NET - 9.4% | | | 182,524 | |
| | | | | TOTAL NET ASSETS - 100.0% | | | | | $ | 1,940,059 | |
| Notional Value | | | | | | | | | | | | | |
| at September | | | | | | | | Variable Rate | | Maturity | | Unrealized | |
| 30, 2017 | | Description | | Counterparty | | Fixed Rate Paid | | Received | | Date | | Depreciation | |
| | | | | | | | | | | | | | | |
| | | | | | | | | Total returns | | | | | | |
| | | | | | | | | from the Crabel | | | | | | |
| 2,089,900 | | Crabel Systematic Trading | | | | 0.35% of the | | Systematic | | | | | | |
| | | Program Total Return Swap + | | Deutsche Bank | | notional value | | Trading Program | | 3/4/2018 | | $ | (153,904 | ) |
| | | | | Total Net Unrealized Depreciation on Swap Contract | | $ | (153,904 | ) |
| * | Pledged as collateral for swap contract. |
| + | This investment is a holding of Equinox Crabel Strategy Fund Limited. |
See accompanying notes to consolidated financial statements.
Equinox Crabel Strategy Fund
CONSOLIDATED PORTFOLIO OF INVESTMENTS (Continued)
September 30, 2017
Total Return Swap Top 50 Holdings ^
| FUTURES CONTRACTS |
| Short Contracts |
| | | | | | | | | | | | | Unrealized | |
| Number of | | | | | | | | | Notional Value at | | | Appreciation/ | |
| Contracts | | | Description | | Counterparty | | Expiration Date | | September 30, 2017 | | | (Depreciation) | |
| | 7 | | | 2 Year Euro-Schatz Future | | Deutsche Bank | | Dec-17 | | $ | 992,141 | | | $ | 201 | |
| | 3 | | | 2 Year U.S. Treasury Notes Future | | Deutsche Bank | | Dec-17 | | | 594,871 | | | | (21 | ) |
| | 5 | | | 5 Year U.S. Treasury Notes Future | | Deutsche Bank | | Dec-17 | | | 535,626 | | | | 219 | |
| | 1 | | | 10 Year Australian Treasury Bond Future | | Deutsche Bank | | Dec-17 | | | 463,412 | | | | 115 | |
| | 8 | | | 10 Year U.S. Treasury Notes Future | | Deutsche Bank | | Dec-17 | | | 949,916 | | | | 744 | |
| | 2 | | | 30 Year U.S. Treasury Bonds Future | | Deutsche Bank | | Dec-17 | | | 248,233 | | | | 53 | |
| | 6 | | | Copper Grade A Future | | Deutsche Bank | | Oct-17 | | | 1,028,070 | | | | (66,885 | ) |
| | 6 | | | Copper Grade A Future | | Deutsche Bank | | Nov-17 | | | 955,107 | | | | (908 | ) |
| | 4 | | | Copper Grade A Future | | Deutsche Bank | | Dec-17 | | | 687,228 | | | | 10,542 | |
| | 5 | | | E-Mini S&P 500 | | Deutsche Bank | | Dec-17 | | | 659,788 | | | | (1,057 | ) |
| | 6 | | | EURO STOXX 50 Index Future | | Deutsche Bank | | Dec-17 | | | 245,141 | | | | (1,080 | ) |
| | 1 | | | Euro-BOBL Future | | Deutsche Bank | | Dec-17 | | | 184,452 | | | | 11 | |
| | 2 | | | Euro-Bund Future | | Deutsche Bank | | Dec-17 | | | 381,055 | | | | (178 | ) |
| | 1 | | | Euro Dollar | | Deutsche Bank | | Dec-18 | | | 206,510 | | | | 40 | |
| | 1 | | | Euro Dollar | | Deutsche Bank | | Dec-19 | | | 227,455 | | | | 34 | |
| | 2 | | | JPY/USD | | Deutsche Bank | | Dec-17 | | | 197,218 | | | | 155 | |
| | 6 | | | Primary High Grade Aluminium Future | | Deutsche Bank | | Oct-17 | | | 321,549 | | | | (27,944 | ) |
| | 7 | | | Primary High Grade Aluminium Future | | Deutsche Bank | | Nov-17 | | | 370,437 | | | | (13,813 | ) |
| | 5 | | | Primary High Grade Aluminium Future | | Deutsche Bank | | Dec-17 | | | 264,144 | | | | (760 | ) |
| | 4 | | | Primary Nickel Future | | Deutsche Bank | | Oct-17 | | | 230,644 | | | | (23,326 | ) |
| | 4 | | | Primary Nickel Future | | Deutsche Bank | | Nov-17 | | | 253,430 | | | | 9,429 | |
| | 5 | | | Primary Nickel Future | | Deutsche Bank | | Dec-17 | | | 311,595 | | | | 24,350 | |
| | 3 | | | Standard Lead Future | | Deutsche Bank | | Nov-17 | | | 168,432 | | | | (8,838 | ) |
| | 1 | | | Ultra Long-Term Treasury Bond Future | | Deutsche Bank | | Dec-17 | | | 176,932 | | | | (127 | ) |
| | 6 | | | ZincFuture | | Deutsche Bank | | Oct-17 | | | 466,293 | | | | (57,665 | ) |
| | 8 | | | ZincFuture | | Deutsche Bank | | Nov-17 | | | 634,969 | | | | (40,548 | ) |
| | 5 | | | ZincFuture | | Deutsche Bank | | Dec-17 | | | 410,804 | | | | (11,535 | ) |
| | | | | | | | | | | | | | | | | |
| Long Contracts | | | | | | | |
| | 5 | | | 5 Year U.S. Treasury Notes Future | | Deutsche Bank | | Dec-17 | | | 539,038 | | | | (382 | ) |
| | — | | | 10 Year Japanese Goverment Bond Future * | | Deutsche Bank | | Dec-17 | | | 503,689 | | | | (77 | ) |
| | 6 | | | 10 Year US Treasury Notes Future | | Deutsche Bank | | Dec-17 | | | 807,975 | | | | (554 | ) |
| | 6 | | | Copper Grade A Future | | Deutsche Bank | | Oct-17 | | | 1,028,070 | | | | 68,312 | |
| | 6 | | | Copper Grade A Future | | Deutsche Bank | | Nov-17 | | | 959,836 | | | | 1,547 | |
| | 4 | | | Copper Grade A Future | | Deutsche Bank | | Dec-17 | | | 706,186 | | | | (9,941 | ) |
| | 1 | | | E-Mini S&P 500 | | Deutsche Bank | | Dec-17 | | | 171,326 | | | | 256 | |
| | 4 | | | EURO STOXX 50 Index Future | | Deutsche Bank | | Dec-17 | | | 186,307 | | | | 901 | |
| | 3 | | | Euro-BOBL Future | | Deutsche Bank | | Dec-17 | | | 521,864 | | | | 105 | |
| | 3 | | | Euro-Bund Future | | Deutsche Bank | | Dec-17 | | | 657,182 | | | | (201 | ) |
| | 1 | | | Euro-OAT Futures | | Deutsche Bank | | Dec-17 | | | 234,134 | | | | (178 | ) |
| | 6 | | | Primary High Grade Aluminium Future | | Deutsche Bank | | Oct-17 | | | 323,080 | | | | 28,037 | |
| | 7 | | | Primary High Grade Aluminium Future | | Deutsche Bank | | Nov-17 | | | 370,437 | | | | 15,379 | |
| | 5 | | | Primary High Grade Aluminium Future | | Deutsche Bank | | Dec-17 | | | 264,144 | | | | 649 | |
| | 4 | | | Primary Nickel Future | | Deutsche Bank | | Oct-17 | | | 230,644 | | | | 24,350 | |
| | 4 | | | Primary Nickel Future | | Deutsche Bank | | Nov-17 | | | 253,430 | | | | (8,637 | ) |
| | 5 | | | Primary Nickel Future | | Deutsche Bank | | Dec-17 | | | 307,885 | | | | (21,875 | ) |
| | 3 | | | Standard Lead Future | | Deutsche Bank | | Nov-17 | | | 168,432 | | | | 8,527 | |
| | 6 | | | Zinc Future | | Deutsche Bank | | Oct-17 | | | 466,293 | | | | 58,072 | |
| | 8 | | | Zinc Future | | Deutsche Bank | | Nov-17 | | | 637,278 | | | | 41,388 | |
| | 5 | | | Zinc Future | | Deutsche Bank | | Dec-17 | | | 420,036 | | | | 11,620 | |
| + | This investment is not a direct holding of Equinox Crabel Strategy Fund Limited. The top 50 holdings were determined based on the absolute notional values of the positions within the underlying swap basket. |
| * | Number of contracts is less than 0.5. |
See accompanying notes to consolidated financial statements.
Equinox Crabel Strategy Fund
CONSOLIDATED PORTFOLIO OF INVESTMENTS (Continued)
September 30, 2017
Total Return Swap Top 50 Holdings ^
| TOTAL RETURN SWAPS ON FORWARD FOREIGN CURRENCY CONTRACTS |
| | | | | | | | | | | | | | | Unrealized | |
| Settlement | | | | Currency to | | | | | | Foreign Currency | | | | Appreciation/ | |
| Date | | Counterparty | | Deliver/Receive | | Value | | In Exchange For | | Value | | U.S. Dollar Value | | (Depreciation) | |
| 09/29/2017 | | Deutsche Bank | | JPY | | 21,769,126 | | USD | | 192,778 | | 192,354 | | $ | (425 | ) |
| 10/2/2017 | | Deutsche Bank | | JPY | | 19,955,032 | | USD | | 176,842 | | 176,840 | | | (2 | ) |
| + | This investment is not a direct holding of Equinox Crabel Strategy Fund Limited. The top 50 holdings were determined based on the absolute notional values of the positions within the underlying swap basket. |
| EUR - Euro |
| |
| GBP - Pound Sterling |
| |
| USD - U.S. Dollar |
See accompanying notes to consolidated financial statements.
Equinox Funds Trust
CONSOLIDATED STATEMENTS OF ASSETS AND LIABILITIES
September 30, 2017
| | | BH-DG | | | Chesapeake | | | Crabel | |
| | | Strategy Fund | | | Strategy Fund | | | Strategy Fund | |
| ASSETS | | | | | | | | | |
| Investment securities: | | | | | | | | | | | | |
| At cost | | $ | — | | | $ | 23,992,550 | | | $ | 1,758,382 | |
| At fair value | | $ | — | | | $ | 23,972,191 | | | $ | 1,757,535 | |
| Cash | | | 54,757 | | | | 12,602,181 | | | | 308,441 | |
| Cash pledged to broker | | | 17,300 | (1) | | | 15,282,048 | | | | — | |
| Unrealized appreciation on swap contract | | | 699 | | | | — | | | | — | |
| Receivable for Fund shares sold | | | — | | | | 1,859,205 | | | | — | |
| Receivable for swap | | | — | | | | — | | | | 27,891 | |
| Interest receivable | | | — | | | | 35,234 | | | | 1,051 | |
| Receivable due from affiliates | | | — | | | | — | | | | 5,275 | |
| Receivable due from Advisor | | | 15,668 | | | | — | | | | — | |
| Prepaid expenses & other assets | | | 21,165 | | | | 47,650 | | | | 29,496 | |
| TOTAL ASSETS | | | 109,589 | | | | 53,798,509 | | | | 2,129,689 | |
| | | | | | | | | | | | | |
| LIABILITIES | | | | | | | | | | | | |
| Unrealized depreciation on swap contract | | | — | | | | — | | | | 153,904 | |
| Unrealized depreciation on futures contracts | | | — | | | | 549,907 | | | | — | |
| Due to broker - swap contract | | | 2,218 | | | | — | | | | — | |
| Payable for fund shares redeemed | | | — | | | | 11,430 | | | | 2,814 | |
| Advisory fees payable | | | — | | | | 40,672 | | | | 1,054 | |
| Distribution (12b-1) fees payable | | | — | | | | 547 | | | | — | |
| Printing expense | | | — | | | | 12,641 | | | | — | |
| Audit and tax fees | | | 24,770 | | | | 25,872 | | | | 27,020 | |
| Payable to related parties | | | 2,031 | | | | 6,859 | | | | 742 | |
| Accrued expenses and other liabilities | | | 1,408 | | | | 28,760 | | | | 4,096 | |
| TOTAL LIABILITIES | | | 30,427 | | | | 676,688 | | | | 189,630 | |
| NET ASSETS | | $ | 79,162 | | | $ | 53,121,821 | | | $ | 1,940,059 | |
| | | | | | | | | | | | | |
| Net Assets Consist Of: | | | | | | | | | | | | |
| Paid in capital ($0 par value, unlimited shares authorized) | | $ | 82,894 | | | $ | 54,649,401 | | | $ | 2,269,745 | |
| Accumulated net investment loss | | | (2,198 | ) | | | (3,067,350 | ) | | | (195,965 | ) |
| Accumulated net realized gain/(loss) on investments, futures and swap contracts | | | (2,233 | ) | | | 2,112,061 | | | | 21,030 | |
| Net unrealized appreciation (depreciation) on investments, futures and swap contracts | | | 699 | | | | (572,291 | ) | | | (154,751 | ) |
| NET ASSETS | | $ | 79,162 | | | $ | 53,121,821 | | | $ | 1,940,059 | |
| (1) | Segregated in the custodian account as collateral for future contracts. |
See accompanying notes to consolidated financial statements.
Equinox Funds Trust
CONSOLIDATED STATEMENTS OF ASSETS AND LIABILITIES (Continued)
September 30, 2017
| | | BH-DG | | | Chesapeake | | | Crabel | |
| | | Strategy Fund | | | Strategy Fund | | | Strategy Fund | |
| Net Asset Value Per Share: | | | | | | | | | | | | |
| Class A Shares: | | | | | | | | | | | | |
| Net Assets | | $ | — | | | $ | 1,180,806 | | | $ | — | |
| Shares of beneficial interest outstanding | | | | | | | | | | | | |
| ($0 par value, unlimited shares authorized) | | | — | | | | 100,336 | | | | — | |
| Net asset value (Net Assets ÷ Shares Outstanding) redemption price per share | | $ | — | | | $ | 11.77 | | | $ | — | |
| Maximum offering price per share | | | | | | | | | | | | |
| (maximum sales charges of 5.75%) (a) | | $ | — | | | $ | 12.49 | | | $ | — | |
| | | | | | | | | | | | | |
| Class C Shares: | | | | | | | | | | | | |
| Net Assets | | $ | — | | | $ | 513,837 | | | $ | — | |
| Shares of beneficial interest outstanding | | | | | | | | | | | | |
| ($0 par value, unlimited shares authorized) | | | — | | | | 44,350 | | | | — | |
| Net asset value (Net Assets ÷ Shares Outstanding), offering price and redemption price per share (a) | | $ | — | | | $ | 11.59 | | | $ | — | |
| | | | | | | | | | | | | |
| Class I Shares: | | | | | | | | | | | | |
| Net Assets | | $ | 79,162 | | | $ | 51,427,178 | | | $ | 1,940,059 | |
| Shares of beneficial interest outstanding | | | | | | | | | | | | |
| ($0 par value, unlimited shares authorized) | | | 7,015 | | | | 4,347,883 | | | | 234,657 | |
| Net asset value (Net Assets ÷ Shares Outstanding), offering price and redemption price per share | | $ | 11.28 | | | $ | 11.83 | | | $ | 8.27 | |
| (a) | A contingent deferred sales charge (“CDSC”) of 1.00% is assessed on certain redemptions of Class A shares made within 12 months after a purchase of Class A shares where no initial sales charge was paid at the time of purchase as part of an investment of $1,000,000 or more. A contingent deferred sales charge (“CDSC”) of 1.00% is assessed on redemptions of Class C shares made within one year after a purchase of such shares. |
See accompanying notes to consolidated financial statements.
Equinox Funds Trust
CONSOLIDATED STATEMENTS OF OPERATIONS
For the Year Ended September 30, 2017
| | | BH-DG | | | Chesapeake | | | Crabel | |
| | | Strategy Fund | | | Strategy Fund | | | Strategy Fund | |
| INVESTMENT INCOME | | | | | | | | | | | | |
| Dividends | | $ | — | | | $ | — | | | $ | — | |
| Interest | | | — | | | | 277,544 | | | | 12,830 | |
| TOTAL INVESTMENT INCOME | | | — | | | | 277,544 | | | | 12,830 | |
| | | | | | | | | | | | | |
| EXPENSES | | | | | | | | | | | | |
| Investment advisory fees | | | 372 | | | | 440,808 | | | | 16,948 | |
| Distribution (12b-1) fees | | | | | | | | | | | | |
| Class A | | | — | | | | 5,546 | | | | — | |
| Class C | | | — | | | | 4,213 | | | | — | |
| Registration fees | | | 26,094 | | | | 47,499 | | | | 22,013 | |
| Accounting services fees | | | 29,695 | | | | 38,357 | | | | 29,947 | |
| Printing and postage expenses | | | 19,834 | | | | 37,849 | | | | 9,076 | |
| Audit and tax fees | | | 24,770 | | | | 18,000 | | | | 27,020 | |
| Transfer agent fees | | | 10,682 | | | | 20,644 | | | | 9,946 | |
| Legal fees | | | 10,890 | | | | 190,000 | | | | 1,608 | |
| Compliance officer fees | | | 4,625 | | | | 13,004 | | | | 5,408 | |
| Custodian fees | | | 5,033 | | | | 5,501 | | | | 5,234 | |
| Administrative services fees | | | 6,282 | | | | 35,185 | | | | 7,526 | |
| Insurance fees | | | 25 | | | | 25,571 | | | | 1,512 | |
| Trustees fees and expenses | | | 11 | | | | 7,194 | | | | 124 | |
| Non 12b-1 Shareholder services fees | | | — | | | | 35,890 | | | | 171 | |
| Other expenses | | | 323 | | | | 14,500 | | | | 247 | |
| TOTAL EXPENSES | | | 138,636 | | | | 939,761 | | | | 136,780 | |
| | | | | | | | | | | | | |
| Less: Fees waived by the administrator | | | (12,596 | ) | | | (20,416 | ) | | | (12,792 | ) |
| Less: Fees waived/reimbursed by the Advisor | | | (125,484 | ) | | | (291,568 | ) | | | (99,144 | ) |
| TOTAL WAIVERS/REIMBURSEMENTS | | | (138,080 | ) | | | (311,984 | ) | | | (111,936 | ) |
| | | | | | | | | | | | | |
| NET EXPENSES | | | 556 | | | | 627,777 | | | | 24,844 | |
| NET INVESTMENT LOSS | | | (556 | ) | | | (350,233 | ) | | | (12,014 | ) |
| | | | | | | | | | | | | |
| REALIZED AND UNREALIZED GAIN (LOSS) ON INVESTMENTS | | | | | | | | | | | | |
| Net realized gain/(loss) on: | | | | | | | | | | | | |
| Investments | | | — | | | | 4,019 | | | | (2 | ) |
| Swap contracts | | | (1,497 | ) | | | (111,544 | ) | | | (28,629 | ) |
| Futures contracts | | | — | | | | (597,610 | ) | | | — | |
| Futures commissions | | | — | | | | (44,172 | ) | | | — | |
| Foreign curency translations | | | — | | | | (1,615 | ) | | | — | |
| | | | (1,497 | ) | | | (750,922 | ) | | | (28,631 | ) |
| Net change in unrealized appreciation/(depreciation) on: | | | | | | | | | | | | |
| Investments | | | — | | | | (37,561 | ) | | | (578 | ) |
| Swap contracts | | | 755 | | | | 295,543 | | | | (159,370 | ) |
| Futures contracts | | | — | | | | (549,907 | ) | | | — | |
| Foreign currency translations | | | — | | | | (2,025 | ) | | | — | |
| | | | 755 | | | | (293,950 | ) | | | (159,948 | ) |
| | | | | | | | | | | | | |
| NET REALIZED AND UNREALIZED GAIN/(LOSS) ON INVESTMENTS | | | (742 | ) | | | (1,044,872 | ) | | | (188,579 | ) |
| | | | | | | | | | | | | |
| NET INCREASE/(DECREASE) IN NET ASSETS RESULTING FROM OPERATIONS | | $ | (1,298 | ) | | $ | (1,395,105 | ) | | $ | (200,593 | ) |
See accompanying notes to consolidated financial statements.
Equinox Funds Trust
CONSOLIDATED STATEMENTS OF CHANGES IN NET ASSETS
| | | BH-DG Strategy Fund | |
| | | Year Ended | | | Year Ended | |
| | | September 30, | | | September 30, | |
| | | 2017 | | | 2016 | |
| FROM OPERATIONS | | | | | | | | |
| Net investment loss | | $ | (556 | ) | | $ | (1,219 | ) |
| Net realized loss on investments and swap contracts | | | (1,497 | ) | | | (3,495 | ) |
| Net change in unrealized appreciation/(depreciation) on investments and swap contracts | | | 755 | | | | 4,746 | |
| Net increase (decrease) in net assets resulting from operations | | | (1,298 | ) | | | 32 | |
| | | | | | | | | |
| FROM SHARES OF BENEFICIAL INTEREST | | | | | | | | |
| Proceeds from shares sold: | | | 206,253 | | | | 126,953 | |
| Payments for shares redeemed: | | | (160,615 | ) | | | (200,339 | ) |
| Net increase/(decrease) in net assets from shares of beneficial interest | | | 45,638 | | | | (73,386 | ) |
| | | | | | | �� | | |
| TOTAL INCREASE/(DECREASE) IN NET ASSETS | | | 44,340 | | | | (73,354 | ) |
| | | | | | | | | |
| NET ASSETS | | | | | | | | |
| Beginning of Period | | | 34,822 | | | | 108,176 | |
| End of Period* | | $ | 79,162 | | | $ | 34,822 | |
| * Includes accumulated net investment loss of: | | $ | (2,198 | ) | | $ | (1,736 | ) |
| | | | | | | | | |
| SHARE ACTIVITY | | | | | | | | |
| Class I: | | | | | | | | |
| Shares Sold | | | 18,634 | | | | 10,933 | |
| Shares Redeemed | | | (14,646 | ) | | | (17,600 | ) |
| Net increase/(decrease) in shares of beneficial interest outstanding | | | 3,988 | | | | (6,667 | ) |
See accompanying notes to consolidated financial statements.
Equinox Funds Trust
CONSOLIDATED STATEMENTS OF CHANGES IN NET ASSETS (Continued)
| | | Chesapeake Strategy Fund | |
| | | Year Ended | | | Year Ended | |
| | | September 30, | | | September 30, | |
| | | 2017 | | | 2016 | |
| FROM OPERATIONS | | | | | | | | |
| Net investment loss | | $ | (350,233 | ) | | $ | (412,707 | ) |
| Net realized gain/(loss) from investments, futures and swap contracts | | | (750,922 | ) | | | 1,248,272 | |
| Net change in unrealized appreciation/(depreciation) on investments and swap contracts | | | (293,950 | ) | | | (1,327,294 | ) |
| Net decrease in net assets resulting from operations | | | (1,395,105 | ) | | | (491,729 | ) |
| | | | | | | | | |
| FROM SHARES OF BENEFICIAL INTEREST | | | | | | | | |
| Proceeds from shares sold: | | | | | | | | |
| Class A | | | 1,191,899 | | | | 5,698,283 | |
| Class C | | | 358,953 | | | | 602,749 | |
| Class I | | | 20,997,772 | | | | 50,728,577 | |
| Payments for shares redeemed: | | | | | | | | |
| Class A | | | (3,536,107 | ) | | | (2,029,172 | ) |
| Class C | | | (195,762 | ) | | | (210,278 | ) |
| Class I | | | (26,773,518 | ) | | | (19,373,875 | ) |
| Net increase/(decrease) in net assets from shares of beneficial interest | | | (7,956,763 | ) | | | 35,416,284 | |
| | | | | | | | | |
| TOTAL INCREASE/(DECREASE) IN NET ASSETS | | | (9,351,868 | ) | | | 34,924,555 | |
| | | | | | | | | |
| NET ASSETS | | | | | | | | |
| Beginning of Period | | | 62,473,689 | | | | 27,549,134 | |
| End of Period* | | $ | 53,121,821 | | | $ | 62,473,689 | |
| * Includes accumulated net investment loss of: | | $ | (3,067,350 | ) | | $ | (3,078,427 | ) |
| | | | | | | | | |
| SHARE ACTIVITY | | | | | | | | |
| Class A: | | | | | | | | |
| Shares Sold | | | 101,713 | | | | 477,534 | |
| Shares Redeemed | | | (310,499 | ) | | | (179,282 | ) |
| Net increase/(decrease) in shares of beneficial interest outstanding | | | (208,786 | ) | | | 298,252 | |
| | | | | | | | | |
| Class C: | | | | | | | | |
| Shares Sold | | | 31,085 | | | | 49,542 | |
| Shares Redeemed | | | (17,097 | ) | | | (19,382 | ) |
| Net increase in shares of beneficial interest outstanding | | | 13,988 | | | | 30,160 | |
| | | | | | | | | |
| Class I: | | | | | | | | |
| Shares Sold | | | 1,788,786 | | | | 4,274,630 | |
| Shares Redeemed | | | (2,338,194 | ) | | | (1,684,362 | ) |
| Net increase/(decrease) in shares of beneficial interest outstanding | | | (549,408 | ) | | | 2,590,268 | |
See accompanying notes to consolidated financial statements.
Equinox Funds Trust
CONSOLIDATED STATEMENTS OF CHANGES IN NET ASSETS (Continued)
| | | Crabel Strategy Fund | |
| | | Year Ended | | | Year Ended | |
| | | September 30, | | | September 30, | |
| | | 2017 | | | 2016 | |
| FROM OPERATIONS | | | | | | | | |
| Net investment loss | | $ | (12,014 | ) | | $ | (19,857 | ) |
| Net realized gain/(loss) from investments and swap contracts | | | (28,631 | ) | | | 42,759 | |
| Net change in unrealized appreciation/(depreciation) on investments and swap contracts | | | (159,948 | ) | | | 107,895 | |
| Net increase/(decrease) in net assets resulting from operations | | | (200,593 | ) | | | 130,797 | |
| | | | | | | | | |
| DISTRIBUTIONS TO SHAREHOLDERS | | | | | | | | |
| From net investment income: | | | (113,818 | ) | | | — | |
| From return of capital | | | (12,687 | ) | | | — | |
| From distributions to shareholders | | | (126,505 | ) | | | — | |
| | | | | | | | | |
| FROM SHARES OF BENEFICIAL INTEREST | | | | | | | | |
| Proceeds from shares sold: | | | 846,713 | | | | 1,654,646 | |
| Net asset value of shares issued in reinvestment of distributions: | | | 124,803 | | | | — | |
| Payments for shares redeemed: | | | (1,078,902 | ) | | | (1,412,118 | ) |
| Net increase/(decrease) in net assets from shares of beneficial interest | | | (107,386 | ) | | | 242,528 | |
| | | | | | | | | |
| TOTAL INCREASE/(DECREASE) IN NET ASSETS | | | (434,484 | ) | | | 373,325 | |
| | | | | | | | | |
| NET ASSETS | | | | | | | | |
| Beginning of Period | | | 2,374,543 | | | | 2,001,218 | |
| End of Period* | | $ | 1,940,059 | | | $ | 2,374,543 | |
| * Includes accumulated net investment loss of: | | $ | (195,965 | ) | | $ | (74,648 | ) |
| | | | | | | | | |
| SHARE ACTIVITY | | | | | | | | |
| Class I: | | | | | | | | |
| Shares Sold | | | 98,591 | | | | 170,827 | |
| Shares Reinvested | | | 13,836 | | | | — | |
| Shares Redeemed | | | (127,558 | ) | | | (151,007 | ) |
| Net increase/(decrease) in shares of beneficial interest outstanding | | | (15,131 | ) | | | 19,820 | |
See accompanying notes to consolidated financial statements.
Equinox BH-DG Strategy Fund
CONSOLIDATED FINANCIAL HIGHLIGHTS
Per Share Data and Ratios for a Share of Beneficial Interest Outstanding Throughout Each Period
| | | Class I | |
| | | Year Ended | | | Year Ended | | | Year Ended | | | Period Ended | |
| | | September 30, | | | September 30, | | | September 30, | | | September 30, | |
| | | 2017 | | | 2016 | | | 2015 | | | 2014 (1) | |
| Net asset value, beginning of period | | $ | 11.50 | | | $ | 11.16 | | | $ | 10.29 | | | $ | 10.00 | |
| Activity from investment operations: | | | | | | | | | | | | | | | | |
| Net investment loss (2) | | | (0.12 | ) | | | (0.11 | ) | | | (0.13 | ) | | | (0.08 | ) |
| Net realized and unrealized gain/(loss) on investments | | | (0.10 | ) | | | 0.45 | | | | 1.26 | | | | 0.37 | |
| Total from investment operations | | | (0.22 | ) | | | 0.34 | | | | 1.13 | | | | 0.29 | |
| Less distributions from: | | | | | | | | | | | | | | | | |
| Net investment income | | | — | | | | — | | | | (0.26 | ) | | | — | |
| Net asset value, end of period | | $ | 11.28 | | | $ | 11.50 | | | $ | 11.16 | | | $ | 10.29 | |
| Total return (3) | | | (1.91 | )% | | | 3.05 | % | | | 10.99 | % | | | 2.90 | % |
| Net assets, at end of period (000’s) | | $ | 79 | | | $ | 35 | | | $ | 108 | | | $ | 15 | |
| Ratio of net expenses to average net assets (including interest expense) (4)(7)(8) | | | 1.10 | % | | | 1.10 | % | | | 1.11 | % | | | 1.10 | % (5) |
| Ratio of net investment loss to average net assets | | | (1.10 | )% | | | (0.96 | )% | | | (1.09 | )% | | | (1.10 | )% (5) |
| Portfolio Turnover Rate | | | 0 | % | | | 0 | % | | | 0 | % | | | 0 | % (6) |
| (1) | | The Equinox BH-DG Strategy Fund commenced operations on December 31, 2013. | | |
| | | | | | | | | | | | | | | | | | | |
| (2) | | Per share amounts calculated using the average shares method, which more appropriately presents the per share data for the period. |
| | | | | | | | | | | | | | | | | | | |
| (3) | | Total returns are historical and assume changes in share price and reinvestment of dividends and distributions. Total returns for periods of less than one year are not annualized. Total returns would be lower absent fee waivers. |
| | | | | | | | | | | | �� | | | | | | | |
| (4) | | Represents the ratio of expenses to average net assets net of fee waivers and/or expense reimbursements by the Advisor. Had these waivers not been in place, the expense ratio would have been: | | | 274.22 | % | | | 94.09 | % | | | 170.88 | % | | | 1241.12 | % (5) |
| | | | | | | | | | | | | | | | | | | |
| (5) | | Annualized. | | | | | | | | | | | | | | | | |
| | | | | | | | | | | | | | | | | | | |
| (6) | | Not annualized. | | | | | | | | | | | | | | | | |
| | | | | | | | | | | | | | | | | | | |
| (7) | | Ratio of gross expenses to average net assets (excluding interest expense) (4) | | | 274.22 | % | | | 94.09 | % | | | 170.87 | % | | | 1241.12 | % (5) |
| | | | | | | | | | | | | | | | | | | |
| (8) | | Ratio of net expenses to average net assets (excluding interest expense) | | | 1.10 | % | | | 1.10 | % | | | 1.10 | % | | | 1.10 | % (5) |
See accompanying notes to consolidated financial statements.
Equinox Chesapeake Strategy Fund
CONSOLIDATED FINANCIAL HIGHLIGHTS
Per Share Data and Ratios for a Share of Beneficial Interest Outstanding Throughout Each Period
| | | Class A | |
| | | Year Ended | | | Year Ended | | | Period Ended | |
| | | September 30, | | | September 30, | | | September 30, | |
| | | 2017 | | | 2016 | | | 2015 (1) | |
| Net asset value, beginning of period | | $ | 11.90 | | | $ | 11.88 | | | $ | 12.35 | |
| Activity from investment operations: | | | | | | | | | | | | |
| Net investment loss (2) | | | (0.10 | ) | | | (0.11 | ) | | | (0.02 | ) |
| Net realized and unrealized gain/(loss) on investments | | | (0.03 | ) | | | 0.13 | | | | (0.45 | ) |
| Total from investment operations | | | (0.13 | ) | | | 0.02 | | | | (0.47 | ) |
| Net asset value, end of period | | $ | 11.77 | | | $ | 11.90 | | | $ | 11.88 | |
| Total return (3) | | | (1.09 | )% | | | 0.17 | % | | | (3.81 | )% |
| Net assets, at end of period (000’s) | | $ | 1,181 | | | $ | 3,678 | | | $ | 129 | |
| Ratio of net expenses to average net assets (including interest expense) (4)(5)(8)(9) | | | 1.42 | % | | | 1.36 | % | | | 1.57 | % (6) |
| Ratio of net investment loss to average net assets | | | (0.88 | )% | | | (0.96 | )% | | | (1.41 | )% (6) |
| Portfolio Turnover Rate | | | 0 | % | | | 0 | % | | | 0 | % (7) |
| (1) | | The Equinox Chesapeake Strategy Fund Class A shares commenced operations on August 21, 2015. | |
| | | | |
| (2) | | Per share amounts calculated using the average shares method, which more appropriately presents the per share data for the period. |
| | | |
| (3) | | Total returns are historical and assume changes in share price and reinvestment of dividends and distributions. Total returns for periods of less than one year are not annualized. Total returns shown exclude the effect of maximum applicable sales charge of 5.75% and wire redemption fees, if applicable. Total returns would be lower absent fee waivers. |
| | | | | | | | | | | | | | | |
| (4) | | Represents the ratio of expenses to average net assets net of fee waivers and/or expense reimbursements by the Advisor. Had these waivers not been in place, the expense ratio would have been: | | | 1.86 | % | | | 1.43 | % | | | 1.73 | % (6) |
| | | | | | | | | | | | | | | |
| (5) | | Does not include the expenses of other investment companies in which the Fund invests, if any. | | | | | | | | | | | | |
| | | | | | | | | | | | | | | |
| (6) | | Annualized. | | | | | | | | | | | | |
| | | | | | | | | | | | | | | |
| (7) | | Not annualized. | | | | | | | | | | | | |
| | | | | | | | | | | | | | | |
| (8) | | Ratio of gross expenses to average net assets (excluding interest expense) (4)(5) | | | 1.86 | % | | | 1.42 | % | | | 1.51 | % (6) |
| | | | | | | | | | | | | | | |
| (9) | | Ratio of net expenses to average net assets (excluding interest expense) (5) | | | 1.42 | % | | | 1.35 | % | | | 1.35 | % (6) |
See accompanying notes to consolidated financial statements.
Equinox Chesapeake Strategy Fund
CONSOLIDATED FINANCIAL HIGHLIGHTS
Per Share Data and Ratios for a Share of Beneficial Interest Outstanding Throughout Each Period
| | | Class C | |
| | | Year Ended | | | Year Ended | | | Perod Ended | |
| | | September 30, | | | September 30, | | | September 30, | |
| | | 2017 | | | 2016 | | | 2015 (1) | |
| Net asset value, beginning of period | | $ | 11.81 | | | $ | 11.87 | | | $ | 12.35 | |
| Activity from investment operations: | | | | | | | | | | | | |
| Net investment loss (2) | | | (0.19 | ) | | | (0.20 | ) | | | (0.03 | ) |
| Net realized and unrealized gain/(loss) on investments | | | (0.03 | ) | | | 0.14 | | | | (0.45 | ) |
| Total from investment operations | | | (0.22 | ) | | | (0.06 | ) | | | (0.48 | ) |
| Net asset value, end of period | | $ | 11.59 | | | $ | 11.81 | | | $ | 11.87 | |
| Total return (3) | | | (1.86 | )% | | | (0.51 | )% | | | (3.89 | )% |
| Net assets, at end of period (000’s) | | $ | 514 | | | $ | 359 | | | $ | 2 | |
| Ratio of net expenses to average net assets (including interest expense) (4)(5)(8)(9) | | | 2.24 | % | | | 2.11 | % | | | 2.32 | % (6) |
| Ratio of net investment loss to average net assets | | | (1.68 | )% | | | (1.70 | )% | | | (2.16 | )% (6) |
| Portfolio Turnover Rate | | | 0 | % | | | 0 | % | | | 0 | % (7) |
| (1) | The Equinox Chesapeake Strategy Fund Class C commenced operations on August 21, 2015. |
| | |
| (2) | Per share amounts calculated using the average shares method, which more appropriately presents the per share data for the period. |
| | |
| (3) | Total returns are historical and assume changes in share price and reinvestment of dividends and distributions. Total returns for periods of less than one year are not annualized. Total returns would be lower absent fee waivers. |
| (4) | | Represents the ratio of expenses to average net assets net of fee waivers and/or expense reimbursements by the Advisor. Had these waivers not been in place, the expense ratio would have been: | | | 2.90 | % | | | 2.16 | % | | | 2.35 | % (6) |
| | | | | | | | | | | | | | | |
| (5) | | Does not include the expenses of other investment companies in which the Fund invests, if any. | | |
| | | | | | | | | | | | | | | |
| (6) | | Annualized. | | | | | | | | | | | | |
| | | | | | | | | | | | | | | |
| (7) | | Not annualized. | | | | | | | | | | | | |
| | | | | | | | | | | | | | | |
| (8) | | Ratio of gross expenses to average net assets (excluding interest expense) (4)(5) | | 2.90 | % | | | 2.16 | % | | | 2.13 | % (6) |
| | | | | | | | | | | | | | | |
| (9) | | Ratio of net expenses to average net assets (excluding interest expense) (5) | | 2.24 | % | | | 2.10 | % | | | 2.10 | % (6) |
See accompanying notes to consolidated financial statements.
Equinox Chesapeake Strategy Fund
CONSOLIDATED FINANCIAL HIGHLIGHTS
Per Share Data and Ratios for a Share of Beneficial Interest Outstanding Throughout Each Period
| | | Class I (1) | |
| | | Year Ended | | | Year Ended | | | Year Ended | | | Year Ended | | | Year Ended | |
| | | September 30, | | | September 30, | | | September 30, | | | September 30, | | | September 30, | |
| | | 2017 | | | 2016 | | | 2015 | | | 2014 | | | 2013 | |
| Net asset value, beginning of period | | $ | 11.93 | | | $ | 11.88 | | | $ | 13.14 | | | $ | 9.41 | | | $ | 9.53 | |
| Activity from investment operations: | | | | | | | | | | | | | | | | | | | | |
| Net investment loss (2) | | | (0.08 | ) | | | (0.09 | ) | | | (0.13 | ) | | | (0.12 | ) | | | (0.06 | ) |
| Net realized and unrealized gain/(loss) on investments | | | (0.02 | ) | | | 0.14 | | | | 1.20 | (3) | | | 3.85 | | | | (0.06 | ) |
| Total from investment operations | | | (0.10 | ) | | | 0.05 | | | | 1.07 | | | | 3.73 | | | | (0.12 | ) |
| Capital contribution by swap counterparty (Note 4) | | | — | | | | — | | | | 0.11 | | | | — | | | | — | |
| Less distributions from: | | | | | | | | | | | | | | | | | | | | |
| Net investment income | | | — | | | | — | | | | (2.41 | ) | | | — | | | | — | |
| Net realized gains | | | — | | | | — | | | | (0.03 | ) | | | — | | | | — | |
| Total distributions | | | — | | | | — | | | | (2.44 | ) | | | — | | | | — | |
| Net asset value, end of period | | $ | 11.83 | | | $ | 11.93 | | | $ | 11.88 | | | $ | 13.14 | | | $ | 9.41 | |
| Total return (4) | | | (0.84 | )% | | | 0.42 | % | | | 9.76 | % | | | 39.64 | % | | | (1.36 | )% |
| Net assets, at end of period (000’s) | | $ | 51,427 | | | $ | 58,438 | | | $ | 27,418 | | | $ | 12,335 | | | $ | 5,600 | |
| Ratio of net expenses to average net assets (including interest expense) (5)(6)(7)(8) | | | 1.24 | % | | | 1.11 | % | | | 1.15 | % | | | 1.10 | % | | | 1.10 | % |
| Ratio of net investment loss to average net assets | | | (0.68 | )% | | | (0.74 | )% | | | (1.05 | )% | | | (1.08 | )% | | | (0.68 | )% |
| Portfolio Turnover Rate | | | 0 | % | | | 0 | % | | | 0 | % | | | 0 | % | | | 298 | % |
| (1) | | The Equinox Chesapeake Strategy Fund Class I shares commenced operations on April 19, 2012. | |
| | | | | | | | | | | | | | | | | | | | | | | |
| (2) | | Per share amounts calculated using the average shares method, which more appropriately presents the per share data for the period. |
| | | | | | | | | | | | | | | | | | | | | | | |
| (3) | | Realized and unrealized gains per share in this caption are balancing amounts necessary to reconcile the change in net asset value per share for the period, and may not reconcile with the aggregate gains and losses in the statement of operations due to the timing of share transactions for the period. |
| | | | | | | | | | | | | | | | | | | | | | | |
| (4) | | Total returns are historical and assume changes in share price and reinvestment of dividends and distributions. Total returns for periods of less than one year are not annualized. Total returns would be lower absent fee waivers. |
| | | | | | | | | | | | | | | | | | | | | | | |
| (5) | | Represents the ratio of expenses to average net assets net of fee waivers and/or expense reimbursements by the Advisor. Had these waivers not been in place, the expense ratio would have been: | | | 1.87 | % | | | 1.18 | % | | | 1.42 | % | | | 2.62 | % | | | 5.44 | % |
| | | | | | | | | | | | | | | | | | | | | | | |
| (6) | | Does not include the expenses of other investment companies in which the Fund invests, if any. | | | | | | | | | | | | | | | | | | | | |
| | | | | | | | | | | | | | | | | | | | | | | |
| (7) | | Ratio of gross expenses to average net assets (excluding interest expense) (5)(6) | | | 1.87 | % | | | 1.17 | % | | | 1.38 | % | | | 2.62 | % | | | 5.44 | % |
| | | | | | | | | | | | | | | | | | | | | | | |
| (8) | | Ratio of net expenses to average net assets (excluding interest expense) (6) | | | 1.24 | % | | | 1.10 | % | | | 1.10 | % | | | 1.10 | % | | | 1.10 | % |
See accompanying notes to consolidated financial statements.
Equinox Crabel Strategy Fund
CONSOLIDATED FINANCIAL HIGHLIGHTS
Per Share Data and Ratios for a Share of Beneficial Interest Outstanding Throughout Each Period
| | | Class I (1) | |
| | | Year Ended | | | Year Ended | | | Year Ended | | | Year Ended | | | Year Ended | |
| | | September 30, | | | September 30, | | | September 30, | | | September 30, | | | September 30, | |
| | | 2017 | | | 2016 | | | 2015 | | | 2014 | | | 2013 | |
| Net asset value, beginning of period | | $ | 9.51 | | | $ | 8.70 | | | $ | 9.32 | | | $ | 8.47 | | | $ | 10.00 | |
| Activity from investment operations: | | | | | | | | | | | | | | | | | | | | |
| Net investment loss (2) | | | (0.05 | ) | | | (0.10 | ) | | | (0.09 | ) | | | (0.10 | ) | | | (0.06 | ) |
| Net realized and unrealized gain/(loss) on investments and swap contract | | | (0.65 | ) | | | 0.91 | | | | (0.36 | ) | | | 0.95 | | | | (1.47 | ) |
| Total from investment operations | | | (0.70 | ) | | | 0.81 | | | | (0.45 | ) | | | 0.85 | | | | (1.53 | ) |
| Less distributions from: | | | | | | | | | | | | | | | | | | | | |
| Net investment income | | | (0.49 | ) | | | — | | | | (0.17 | ) | | | — | | | | — | |
| Return of Capital | | | (0.05 | ) | | | — | | | | — | | | | — | | | | — | |
| Total distributions | | | (0.54 | ) | | | — | | | | — | | | | — | | | | — | |
| Net asset value, end of period | | $ | 8.27 | | | $ | 9.51 | | | $ | 8.70 | | | $ | 9.32 | | | $ | 8.47 | |
| Total return (3) | | | (8.29 | )% | | | 9.31 | % | | | (4.92 | )% | | | 10.04 | % | | | (16.39 | )% |
| Net assets, at end of period (000’s) | | $ | 1,940 | | | $ | 2,375 | | | $ | 2,001 | | | $ | 1,398 | | | $ | 15 | |
| Ratio of net expenses to average net assets (including interest expense) (4)(5)(6)(7) | | | 1.10 | % | | | 1.27 | % | | | 1.10 | % | | | 1.10 | % | | | 1.10 | % |
| Ratio of net investment loss to average net assets | | | (0.53 | )% | | | (1.05 | )% | | | (1.03 | )% | | | (1.09 | )% | | | (1.08 | )% |
| Portfolio Turnover Rate | | | 0 | % | | | 0 | % | | | 0 | % | | | 0 | % | | | 0 | % |
| (1) | | The Equinox Crabel Strategy Fund commenced operations on April 19, 2012. |
| | | |
| (2) | | Per share amounts calculated using the average shares method, which more appropriately presents the per share data for the period. |
| | | |
| (3) | | Total returns are historical and assume changes in share price and reinvestment of dividends and distributions. Total returns for periods of less than one year are not annualized. Total returns would be lower absent fee waivers. |
| | | | | | | | | | | | | | | | | | | | | | | |
| (4) | | Represents the ratio of expenses to average net assets net of fee waivers and/or expense reimbursements by the Advisor. Had these waivers not been in place, the expense ratio would have been: | | | 6.06 | % | | | 6.45 | % | | | 5.66 | % | | | 27.88 | % | | | 1536.25 | % |
| | | | | | | | | | | | | | | | | | | | | | | |
| (5) | | Does not include the expenses of other investment companies in which the fund invests, if any. | | | | | | | | | | | | | | | | | | | | |
| | | | | | | | | | | | | | | | | | | | | | | |
| (6) | | Ratio of gross expenses to average net assets (excluding interest expense) (4)(5) | | | 6.06 | % | | | 6.28 | % | | | 5.66 | % | | | 27.88 | % | | | 1536.25 | % |
| | | | | | | | | | | | | | | | | | | | | | | |
| (7) | | Ratio of net expenses to average net assets (excluding interest expense) (5) | | | 1.10 | % | | | 1.10 | % | | | 1.10 | % | | | 1.10 | % | | | 1.10 | % |
See accompanying notes to consolidated financial statements.
Equinox Funds Trust
NOTES TO CONSOLIDATED FINANCIAL STATEMENTS
September 30, 2017
The Equinox BH-DG Strategy Fund (“BH-DG Strategy”), Equinox Chesapeake Strategy Fund (“Chesapeake Strategy”) and Equinox Crabel Strategy Fund (“Crabel Strategy”) (each a “Fund”, collectively the “Funds”) are non-diversified series of shares of beneficial interest of Equinox Funds Trust (the “Trust”), a statutory trust organized under the laws of the State of Delaware on June 2, 2010, and are registered under the Investment Company Act of 1940, as amended (the “1940 Act”), as open-end management investment companies. The investment objective of each Fund is to achieve long term capital appreciation.
BH-DG Strategy and Crabel Strategy offer Class I (“Institutional”) Shares that are offered at net asset value. Chesapeake Strategy offers Class A shares, Class C shares and Class I shares. Chesapeake Strategy Class C shares and Class I shares are offered at net asset value. Chesapeake Strategy Class A shares are offered at net asset value plus a maximum sales charge of 5.75%. A contingent deferred sales charge (“CDSC”) of 1.00% is assessed on certain redemptions of Chesapeake Strategy Class A shares made within 12 months after a purchase of Chesapeake Strategy Class A shares where no initial sales charge was paid at the time of purchase as part of an investment of $1,000,000 or more. A CDSC of 1.00% is assessed on redemptions of Chesapeake Strategy Class C shares made within one year after a purchase of such shares. Each class represents an interest in the same assets of the Fund and classes are identical except for differences in their sales charge structures and ongoing service and distribution charges. All classes of shares have equal voting privileges except that each class has exclusive voting rights with respect to its service and/or distribution plans. The Chesapeake Strategy Fund’s income, expenses (other than class specific distribution fees) and realized and unrealized gains and losses are allocated proportionately each day based upon the relative net assets of each class.
| 2. | SIGNIFICANT ACCOUNTING POLICIES |
The following is a summary of significant accounting policies followed by the Funds in preparation of their consolidated financial statements. The policies are in conformity with accounting principles generally accepted in the United States of America (“GAAP”). The preparation of the consolidated financial statements requires management to make estimates and assumptions that affect the reported amounts of assets and liabilities and disclosure of contingent assets and liabilities at the date of the consolidated financial statements and the reported amounts of income and expenses for the period. Actual results could differ from those estimates. The Fund is an investment company and accordingly follows the investment company accounting and reporting guidance of the Financial Accounting Standards Board (“FASB”) Accounting Standard Codification Topic 946 “Financial Services – Investment Companies” including FASB Accounting Standard Update ASU 2013-08.
Security Valuation – Securities, including exchange traded funds, listed on an exchange are valued at the last reported sale price at the close of the regular trading session of the exchange on the business day the value is being determined, or in the case of securities listed on NASDAQ at the NASDAQ Official Closing Price (“NOCP”). In the absence of a sale such securities shall be valued at the mean between the current bid and ask prices on the primary exchange on the day of valuation. Debt securities (other than short-term obligations) are valued each day by an independent pricing service approved by the Board of Trustees (the “Board”) using methods which include current market
Equinox Funds Trust
NOTES TO CONSOLIDATED FINANCIAL STATEMENTS (Continued)
September 30, 2017
quotations from a major market maker in the securities and based on methods which include the consideration of yields or prices of securities of comparable quality, coupon, maturity and type. Short-term debt obligations having 60 days or less remaining until maturity, at time of purchase, may be valued at amortized cost. Investments in open-end investment companies are valued at net asset value. Investments in swap contracts are reported at fair value based on daily price reporting from the swap counterparty.
The Fund may hold securities, such as private investments, interests in commodity pools, other non-traded securities or temporarily illiquid securities, for which market quotations are not readily available or are determined to be unreliable. These securities will be valued using the “fair value” procedures approved by the Board. The Board has delegated execution of these procedures to a fair value team composed of one or more representatives from each of the (i) Trust, (ii) administrator, and (iii) Advisor. The team may also enlist third party consultants such as a valuation specialist at a public accounting firm, valuation consultant or financial officer of a security issuer on an as-needed basis to assist in determining a security-specific fair value. The Board reviews and ratifies the execution of this process and the resultant fair value prices at least quarterly to assure the process produces reliable results.
Fair Valuation Process – As noted above, the fair value team is composed of one or more representatives from each of the (i) Trust, (ii) administrator, and (iii) Advisor. The applicable investments are valued collectively via inputs from each of these groups. For example, fair value determinations are required for the following securities: (i) securities for which market quotations are insufficient or not readily available on a particular business day (including securities for which there is a short and temporary lapse in the provision of a price by the regular pricing source), (ii) securities for which, in the judgment of the Advisor, the prices or values available do not represent the fair value of the instrument. Factors which may cause the Advisor to make such a judgment include, but are not limited to, the following: only a bid price or an ask price is available; the spread between bid and ask prices is substantial; the frequency of sales; the thinness of the market; the size of reported trades; and actions of the securities markets, such as the suspension or limitation of trading; (iii) securities determined to be illiquid; (iv) securities with respect to which an event that will affect the value thereof has occurred (a “significant event”) since the closing prices were established on the principal exchange on which they are traded, but prior to a Fund’s calculation of its net asset value. Specifically, interests in commodity pools or managed futures pools are valued on a daily basis by reference to the closing market prices of each futures contract or other asset held by a pool, as adjusted for pool expenses. Restricted or illiquid securities, such as private investments or non-traded securities are valued via inputs from the Advisor based upon the current bid for the security from two or more independent dealers or other parties reasonably familiar with the facts and circumstances of the security (who should take into consideration all relevant factors as may be appropriate under the circumstances). If the Advisor is unable to obtain a current bid from such independent dealers or other independent parties, the fair value team shall determine the fair value of such security using the following factors: (i) the type of security; (ii) the cost at date of purchase; (iii) the size and nature of the Fund’s holdings; (iv) the discount from market value of unrestricted securities of the same class at the time of purchase and subsequent thereto; (v) information as to any transactions or offers with respect to the security; (vi) the nature and duration of restrictions on disposition of the security and the existence of any registration rights; (vii) how the yield of the security compares to similar securities of companies of
Equinox Funds Trust
NOTES TO CONSOLIDATED FINANCIAL STATEMENTS (Continued)
September 30, 2017
similar or equal creditworthiness; (viii) the level of recent trades of similar or comparable securities; (ix) the liquidity characteristics of the security; (x) current market conditions; and (xi) the market value of any securities into which the security is convertible or exchangeable.
The Funds utilize various methods to measure the fair value of all of their investments on a recurring basis. GAAP establishes a hierarchy that prioritizes inputs to valuation methods. The three levels of input are:
Level 1 – Unadjusted quoted prices in active markets for identical assets and liabilities that the Fund has the ability to access.
Level 2 – Observable inputs other than quoted prices included in Level 1 that are observable for the asset or liability, either directly or indirectly. These inputs may include quoted prices for the identical instrument in an inactive market, prices for similar instruments, interest rates, prepayment speeds, credit risk, yield curves, default rates and similar data.
Level 3 – Unobservable inputs for the asset or liability, to the extent relevant observable inputs are not available, representing the Fund’s own assumptions about the assumptions a market participant would use in valuing the asset or liability, and would be based on the best information available.
The availability of observable inputs can vary from security to security and is affected by a wide variety of factors, including, for example, the type of security, whether the security is new and not yet established in the marketplace, the liquidity of markets, and other characteristics particular to the security. To the extent that valuation is based on models or inputs that are less observable or unobservable in the market, the determination of fair value requires more judgment. Accordingly, the degree of judgment exercised in determining fair value is greatest for instruments categorized in Level 3.
The inputs used to measure fair value may fall into different levels of the fair value hierarchy. In such cases, for disclosure purposes, the level in the fair value hierarchy within which the fair value measurement falls in its entirety, is determined based on the lowest level input that is significant to the fair value measurement in its entirety.
Equinox Funds Trust
NOTES TO CONSOLIDATED FINANCIAL STATEMENTS (Continued)
September 30, 2017
The inputs or methodology used for valuing securities are not necessarily an indication of the risk associated with investing in those securities. The following tables summarize the inputs used as of September 30, 2017 for the Funds’ assets and liabilities measured at fair value:
BH-DG Strategy
| Assets | | Level 1 | | | Level 2 | | | Level 3 | | | Total | |
| Swap Contract | | $ | — | | | $ | 699 | | | $ | — | | | $ | 699 | |
| Total | | $ | — | | | $ | 699 | | | $ | — | | | $ | 699 | |
| | | | | | | | | | | | | | | | | |
| Chesapeake Strategy | | | | | | | | | | | | | | | | |
| | | | | | | | | | | | | | | | | |
| Assets | | Level 1 | | | Level 2 | | | Level 3 | | | Total | |
| U.S. Treasury Notes | | $ | — | | | $ | 23,972,191 | | | $ | — | | | $ | 23,972,191 | |
| Total | | $ | — | | | $ | 23,972,191 | | | $ | — | | | $ | 23,972,191 | |
| Liabilities | | Level 1 | | | Level 2 | | | Level 3 | | | Total | |
| Futures Contracts | | $ | — | | | $ | 580,677 | | | $ | — | | | $ | 580,677 | |
| Total | | $ | — | | | $ | 580,677 | | | $ | — | | | $ | 580,677 | |
| | | | | | | | | | | | | | | | | |
| Crabel Strategy | | | | | | | | | | | | | | | | |
| | | | | | | | | | | | | | | | | |
| Assets | | Level 1 | | | Level 2 | | | Level 3 | | | Total | |
| U.S. Treasury Notes | | $ | — | | | $ | 1,198,372 | | | $ | — | | | $ | 1,198,372 | |
| Money Market Funds | | | 559,163 | | | | — | | | | — | | | | 559,163 | |
| Total | | $ | 559,163 | | | $ | 1,198,372 | | | $ | — | | | $ | 1,757,535 | |
| Liabilities | | Level 1 | | | Level 2 | | | Level 3 | | | Total | |
| Swap Contract | | $ | — | | | $ | 153,904 | | | $ | — | | | $ | 153,904 | |
| Total | | $ | — | | | $ | 153,904 | | | $ | — | | | $ | 153,904 | |
There were no transfers between levels during the period.
It is the Fund’s policy to record transfers between levels the end of the reporting period.
The Fund did not hold any Level 3 securities during the period.
See Consolidated Portfolio of Investments for more information related to the Fund’s investments.
Consolidation of Subsidiaries – The consolidated financial statements of Equinox BH-DG Strategy Fund with its subsidiary Equinox BH-DG Strategy Fund Limited (“BH-DG-CFC”), Equinox Chesapeake Strategy Fund with its subsidiary Equinox Chesapeake Strategy Fund Limited (“ECS-CFC”), and Equinox Crabel Strategy Fund with its subsidiary Equinox Crabel Strategy Fund Limited (“ECRS-CFC”) include the accounts of BH-DG-CFC, ECS-CFC and ECRS-CFC, collectively the “CFCs”, as wholly-owned and controlled foreign corporations. All inter-company accounts and transactions have been eliminated in consolidation.
The Funds may each invest approximately 25% of their total assets in their CFCs which act as investment vehicles in order to effect certain investments consistent with each Fund’s respective investment objectives and policies.
Equinox Funds Trust
NOTES TO CONSOLIDATED FINANCIAL STATEMENTS (Continued)
September 30, 2017
Each CFC utilizes a total return swap with Deutsche Bank AG, London Branch or futures contracts, that provide exposure to the total returns of the BH-DG Systematic Trading Program of BH-DG Systematic Trading LLP (the “BH-DG Program”) with respect to the BH-DG Strategy, the managed futures program of Chesapeake Capital Corporation (the “Chesapeake Program”) with respect to the Chesapeake Strategy, and the Multi-Product Program of Crabel Capital Management, LLP (the “Crabel Program”) with respect to the Crabel Strategy (collectively with the BH-DG Program and the Chesapeake Program, the “Programs”), to facilitate each Fund’s pursuit of their respective investment objectives. In accordance with their investment objectives and through their respective exposure to the Programs, the Funds may have increased or decreased exposure to one or more of the risk factors including, with respect to the Programs, swap agreements, defined in the Principal Investment Risks section of each Fund’s prospectus.
A summary of the Funds’ investments in the CFCs are as follows:
| | | | | | | | % Of the Fund’s Total | |
| | | Inception Date | | CFC Net Assets at | | | Net Assets at | |
| | | of CFC | | September 30, 2017 | | | September 30, 2017 | |
| BH-DG-CFC | | 12/31/2013 | | $ | 15,782 | | | | 19.94% | |
| ECS-CFC | | 4/19/2012 | | $ | 2,051,333 | | | | 3.86% | |
| ECRS-CFC | | 3/8/2013 | | $ | 433,150 | | | | 22.33% | |
For tax purposes, the CFCs are exempted Cayman investment companies. The CFCs have received an undertaking from the Government of the Cayman Islands exempting them from all local income, profits and capital gains taxes. No such taxes are levied in the Cayman Islands at the present time. For U.S. income tax purposes, the CFCs are controlled foreign corporations and as such are not subject to U.S. income tax. However, as wholly-owned controlled foreign corporations, the CFCs net income and capital gain, to the extent of its earnings and profits, will be included each year in each Fund’s investment company taxable income.
Market Risk – Market risk is the risk that changes in interest rates, foreign exchange rates or equity prices will affect the positions held by the Funds. The Funds are exposed to market risk on financial instruments that are valued at market prices as disclosed in the schedule of investments. The prices of derivative instruments, including options, forwards and futures prices, can be highly volatile. Price movements of derivative contracts in which each Fund’s assets may be invested are influenced by, among other things, interest rates, changing supply and demand relationships, trade, fiscal, monetary and exchange control programs and policies of governments, and national and international political and economic events and policies. The Funds are exposed to market risk on derivative contracts in that the Funds may not be able to readily dispose of its holdings when it chooses and also that the price obtained on disposal is below that at which the investment is included in each Fund’s consolidated financial statements. All financial instruments are recognized at fair value, and all changes in market conditions directly affect net income. Each Fund’s investments in derivative instruments are exposed to market risk and are disclosed in the consolidated portfolio of investments.
Equinox Funds Trust
NOTES TO CONSOLIDATED FINANCIAL STATEMENTS (Continued)
September 30, 2017
Credit Risk – Credit risk relates to the ability of the issuer to meet interest and principal payments, or both, as they come due. In general, lower-grade, higher-yield bonds are subject to credit risk to a greater extent than lower-yield, higher-quality bonds.
Counterparty risk – Counterparty risk, including swap counterparty risk, is the risk that the counterparty to a financial instrument will cause a financial loss for the Funds by failing to discharge an obligation. A concentration of counterparty risk exists in that part of each Fund’s cash is held at the broker. The Fund could be unable to recover assets held at the broker, including assets directly traceable to a Fund, in the event of the broker’s bankruptcy. The Funds do not anticipate any material losses as a result of this concentration.
Security Transactions and Related Income – Security transactions are accounted for on trade date basis. Interest income is recognized on an accrual basis. Discounts are accreted and premiums are amortized on securities purchased over the lives of the respective securities. Dividend income is recorded on the ex-dividend date. Realized gains or losses from sales of securities are determined by comparing the identified cost of the security lot sold with the net sales proceeds.
Dividends and Distributions to Shareholders – Dividends from net investment income, if any, are declared and paid at least annually. Distributable net realized capital gains, if any, are declared and distributed annually. Dividends from net investment income and distributions from net realized gains are determined in accordance with federal income tax regulations, which may differ from GAAP. These “book/tax” differences are considered either temporary (i.e., deferred losses, capital loss carry forwards) or permanent in nature. To the extent these differences are permanent in nature, such amounts are reclassified within the composition of net assets based on their federal tax-basis treatment; temporary differences do not require reclassification. Dividends and distributions to shareholders are recorded on ex-dividend date.
Cash and cash equivalents – Cash and cash equivalents include cash and overnight investments in interest-bearing demand deposits with a financial institution with original maturities of three months or less. The Funds maintain deposits with a high quality financial institution in an amount that is in excess of federally insured limits.
Federal Income Taxes – Each Fund intends to continue to comply with the requirements of the Internal Revenue Code of 1986, as amended, applicable to regulated investment companies and to distribute all of its taxable income to its shareholders. Therefore, no provision for Federal income tax is required. Each Fund recognizes the tax benefits of uncertain tax positions only where the position is “more likely than not” to be sustained assuming examination by tax authorities. Management has analyzed the Fund’s tax positions and has concluded that no liability for unrecognized tax benefits should be recorded related to uncertain tax positions taken on returns filed for open tax years 2014-2016, or expected to be taken in the Fund’s 2017 tax returns. Each Fund identifies its major tax jurisdictions as U.S. Federal, Colorado and foreign jurisdictions where the Fund makes significant investments; however the Funds are not aware of any tax positions for which it is reasonably possible that the total amounts of unrecognized tax benefits will change materially in the next twelve months.
Equinox Funds Trust
NOTES TO CONSOLIDATED FINANCIAL STATEMENTS (Continued)
September 30, 2017
Allocation of Expenses – Expenses incurred by the Trust that do not relate to a specific fund of the Trust are allocated to the individual funds based on each Fund’s relative net assets or another appropriate basis. Expenses specifically attributable to a particular Fund in the Trust are borne by that Fund. Other expenses are allocated to each Fund based on its net assets in relation to the total net assets of all the applicable Funds in the Trust or another reasonable basis.
Swap Agreements – Each Fund is subject to equity price risk, interest rate risk and/or commodity risk in the normal course of pursuing its investment objective. Each Fund may enter into various swap transactions for investment purposes or to manage interest rate, commodity, equity, foreign exchange (currency), or credit risk. Currently, BH-DG Strategy Fund and Crabel Strategy Fund, through its respective CFC, utilizes a total return swap with Deutsche Bank AG, London Branch, that provides exposure to the total returns of such Fund’s Program (see, Consolidation of Subsidiaries above). These total return swaps are two-party contracts entered into primarily to exchange the returns (or differentials in rates of returns) earned or realized on particular pre-determined investments or instruments.
To help to reduce counterparty risk on the Fund, the Advisor has the right to reduce the Funds exposure and remove cash from the Funds total return swap with Deutsche Bank AG. This cash holding shall be in excess of $250,000, and may not exceed 40% of the Index exposure in total. Index exposure is defined as the total notional amount plus any profit. The funds are charged interest on this cash holding and any amount removed will be offset against the final settlement value of the swap. The BH-DG Strategy Fund and Crabel Strategy Fund did not have any outstanding advances as of September 30, 2017.
The gross returns exchanged or “swapped” between parties are calculated with respect to a notional amount, i.e., the return on or increase in value of a particular dollar amount invested at a particular interest rate, in a particular foreign currency, or in a “basket” of securities representing a particular index or market segment. Changes in the value of swap agreements are recognized as unrealized gains or losses in the Consolidated Statement of Operations by “marking to market” on a daily basis to reflect the value of the swap agreement at the end of each trading day. A liquidation payment received or made at the termination of the swap agreement is recorded as a realized gain or loss on the Consolidated Statement of Operations. Realized gains and losses from a decrease in the notional value of the swaps are recognized on trade date. Each Fund segregates liquid securities having a value at least equal to the amount of their current obligation under any swap transaction. Entering into these agreements involves, to varying degrees, lack of liquidity and elements of credit, market, and counterparty risk in excess of amounts recognized on the Consolidated Statement of Assets and Liabilities. Each Fund’s maximum risk of loss from counterparty credit risk is the discounted net value of the cash flows to be received from the counterparty over the contract’s remaining life, to the extent that that amount is positive.
BH-DG-CFC and ECRS-CFC maintain cash and investments in money market funds, approximately 20% of the notional value of the swap, as collateral to secure its obligations under the swap. Please refer to the Consolidated Portfolio of Investments for additional detail on the money market holdings. The cash maintained as collateral is recorded as cash held at broker on the Consolidated Statement of
Equinox Funds Trust
NOTES TO CONSOLIDATED FINANCIAL STATEMENTS (Continued)
September 30, 2017
Assets and Liabilities. Entering into these agreements involves, to varying degrees, lack of liquidity and elements of credit, market, and counterparty risk in excess of amounts recognized on the Consolidated Statement of Assets and Liabilities. Each Fund’s maximum risk of loss from counterparty credit risk is the discounted net value of the cash flows to be received from the counterparty over the contract’s remaining life, to the extent that that amount is positive. In order to maintain prudent risk exposure to the counterparty, the Advisor will reduce exposure to the counterparty whenever that exposure exceeds 5% of the net assets of a Fund for a period of one week or such lesser time as the Advisor may determine. If the Advisor determines that the counterparty presents an imprudent risk, each swap may be terminated in its entirety.
During the period of this report, the Funds used a swap contract to gain exposure to the respective managed futures trading program described in ‘Consolidation of Subsidiaries’ above in the implementation of their respective investment strategy. The Funds are permitted to use derivatives to gain exposure to the asset class and for risk management purposes, including to gain exposure to various markets in a cost efficient manner, to reduce transaction costs or to remain fully invested. The Funds may also invest in derivatives to protect from broad fluctuations in market prices, interest rates or foreign currency exchange rates (a practice known as “hedging”).
Foreign Currency Transactions – All assets and liabilities denominated in foreign currencies are translated into U.S. dollars based on the rate of exchange of such currencies against U.S. dollars on the date of valuation. Purchases and sales of securities and income and expenses are translated at the rate of exchange quoted on the respective date that such transactions are recorded. Such fluctuations are included with the net realized and unrealized gain or loss on investments.
Futures Contracts – The Chesapeake Strategy Fund may purchase or sell futures contracts to gain exposure to, or hedge against, changes in the value of equities, interest rates, foreign currencies or commodities. Initial margin deposits required upon entering into futures contracts are satisfied by the segregation of specific securities or cash as collateral for the account of the broker (the Fund’s agent in acquiring the futures position). During the period the futures contracts are open, changes in the value of the contracts are recognized as unrealized gains or losses by “marking to market” on a daily basis to reflect the market value of the contracts at the end of each day’s trading. Variation margin payments are received or made depending upon whether unrealized gains or losses are incurred. When the contracts are closed, the Fund recognizes a realized gain or loss equal to the difference between the proceeds from, or cost of, the closing transaction and the Fund’s basis in the contract. If the Fund was unable to liquidate a futures contract and/or enter into an offsetting closing transaction, the Fund would continue to be subject to market risk with respect to the value of the contracts and continue to be required to maintain the margin deposits on the futures contracts. The Fund segregates liquid securities or cash equivalents having a value at least equal to the amount of the current obligation under any open futures contract. Risks may exceed amounts recognized in the Statement of Assets and Liabilities. With futures, there is minimal counterparty credit risk to the Fund since futures are exchange traded and the exchange’s clearinghouse, as counterparty to all exchange traded futures, guarantees the futures against default.
Equinox Funds Trust
NOTES TO CONSOLIDATED FINANCIAL STATEMENTS (Continued)
September 30, 2017
During the period of this report, the Fund traded various futures contracts in a manner consistent with the Chesapeake managed futures trading program consistent with its investment strategy. The Fund is permitted to use derivatives to gain exposure to the asset class and for risk management purposes, including to gain exposure to various markets in a cost efficient manner, to reduce transaction costs or to remain fully invested. The Fund may also invest in derivatives to protect from broad fluctuations in market prices, interest rates or foreign currency exchange rates (a practice known as “hedging”).
For the year ended September 30, 2017, the net change in unrealized depreciation on futures contracts amounted to $580,667 for the Chesapeake Strategy Fund. For the year ended September 30, 2017, the Chesapeake Strategy Fund had a net realized loss of $724,750 from futures contracts.
Impact of Derivatives on the Consolidated Statement of Assets and Liabilities and Consolidated Statement of Operations
The following is a summary of the location of derivative investments on the Funds’ Consolidated Statement of Assets and Liabilities as of September 30, 2017:
| Location on the Consolidated Statement of Assets and Liabilities |
| | | |
| Derivatives Investment | Asset Derivatives | Liability Derivatives |
| Type | | |
| | | |
| Equity/Currency/ | Unrealized appreciation | Unrealized depreciation |
| Commodity/ | on swap contract | on swap contract |
| Interest Rate Contracts | | Unrealized depreciation |
| | | on futures contracts |
The following table sets forth the fair value of the Chesapeake Strategy Fund’s futures contracts by primary risk exposure as of September 30, 2017:
| | | | | | | | | | | | | | | Total as of | |
| | | Commodity | | | Currency | | | Equity | | | Interest Rate | | | September 30, 2017 | |
| Futures Contracts | | $ | 70,389 | | | $ | (1,182,051 | ) | | $ | 474,176 | | | $ | 87,579 | | | $ | (549,907 | ) |
Equinox Funds Trust
NOTES TO CONSOLIDATED FINANCIAL STATEMENTS (Continued)
September 30, 2017
The following is a summary of the location of derivative investments on the Funds’ Consolidated Statement of Operations for the year ended September 30, 2017.
| Location on the Consolidated Statement of Operations |
| | |
| Derivatives Investment Type | Location of Gain (Loss) on Derivatives |
| | |
| Equity/Currency/ Commodity/ Interest Rate Contracts | Net change in unrealized appreciation/
depreciation on swap contracts
Net realized gain/(loss) on swap contracts
Net change in unrealized appreciation/
(depreciation) on futures contracts
Net realized loss on futures contracts |
For the year ended September 30, 2017, the notional value, net change in unrealized appreciation/depreciation, and realized gain/losses from the swaps were as follows:
| | | Net Change in Unrealized | | | | | | | |
| Fund | | Appreciation/ (Depreciation) | | | Net Realized Loss | | | Notional | |
| BH-DG-CFC | | $ | 755 | | | $ | (1,497 | ) | | $ | 81,600 | |
| ECS-CFC | | | 295,543 | | | | (111,544 | ) | | | — | |
| ECRS-CFC | | | (159,370 | ) | | | (28,629 | ) | | | 2,089,900 | |
In addition, the agreement provides for an annual fee of $3,500 per swap due to the counterparty for serving as a financial intermediary. The swap also provides for an annual fee of 0.35% payable to Deutsche Bank accrued on the notional level of each swap.
The following is a summary of the Chesapeake Strategy Fund’s realized and unrealized gain/(loss) on futures contracts recognized in the Consolidated Statement of Operations categorized by primary risk exposure for the year ended September 30, 2017:
| Net Change in unrealized appreciation/(depreciation) on derivatives recognized in the Consolidated Statement of Operations |
| | | | | | | | | | | | | | | Total for the | |
| | | | | | | | | | | | | | | year ended | |
| Derivative Investment Type | | Commodity | | | Currency | | | Equity | | | Interest Rate | | | September 30, 2017 | |
| Futures | | $ | 70,389 | | | $ | (1,182,051 | ) | | $ | 474,176 | | | $ | 87,579 | | | $ | (549,907 | ) |
| | | | | | | | | | | | | | | | | | | | | |
| Realized gain/(loss) on derivatives recognized in the Consolidated Statement of Operations |
| | | | | | | | | | | | | | | Total for the | |
| | | | | | | | | | | | | | | year ended | |
| Derivative Investment Type | | Commodity | | | Currency | | | Equity | | | Interest Rate | | | September 30, 2017 | |
| Futures | | $ | (342,221 | ) | | $ | 979,401 | | | $ | (1,089,654 | ) | | $ | (272,276 | ) | | $ | (724,750 | ) |
Equinox Funds Trust
NOTES TO CONSOLIDATED FINANCIAL STATEMENTS (Continued)
September 30, 2017
The notional value of the derivative instruments outstanding as of September 30, 2017 as disclosed in the Consolidated Portfolios of Investments and the amounts of realized gains and losses and changes in unrealized depreciation on derivative instruments during the period as disclosed above and within the Consolidated Statements of Operations serve as indicators of the volume of derivative activity for the Funds.
Offsetting of Financial Assets and Derivative Assets
It is each Fund’s policy to recognize a net asset or liability equal to the unrealized appreciation/ (depreciation) for swap contracts and futures contract, respectively. During the year ended September 30, 2017, the Funds are subject to a master netting arrangement for the swaps. The following table shows additional information regarding the offsetting of assets and liabilities at September 30, 2017. The Funds may mitigate credit risk with respect to OTC derivative counterparties through credit support annexes included with International Swaps and Derivatives Association, Inc. (“ISDA”) Master Agreements or other master netting agreements which are the standard contracts governing most derivative transactions between the Fund and its counterparties. These agreements may allow a Fund and a counterparty to offset certain derivative instruments’ payables and/or receivables against each other and/or with collateral, which is generally held by the Fund’s custodian. To the extent amounts due to a Fund from a counterparty are not fully collateralized contractually or otherwise, the Fund bears the risk of loss from counterparty non-performance.
EQUINOX BH-DG STRATEGY FUND
| Assets | | | | | | | | | | | Gross Amounts Not Offset in the
Consolidated Statement of Assets
& Liabilities | | | | |
| Description | | Gross Amounts of
Recognized Assets | | | Gross Amounts
Offset in the
Consolidated
Statement of
Assets &
Liabilities | | | Net Amounts of
Assets Presented in
the Consolidated
Statement of Assets
& Liabilities | | | Cash or Financial
Instruments
Pledged (2) | | | Payable for
Swap | | | Net Amount | |
| Unrealized depreciation on Swap Contract | | $ | 699 | (1) | | $ | — | | | $ | 699 | | | $ | 1,519 | | | $ | 2,218 | (3) | | $ | — | |
| Total | | $ | 699 | | | $ | — | | | $ | 699 | | | $ | 1,519 | | | $ | 2,218 | | | $ | — | |
| (1) | Net unrealized appreciation as presented in the Consolidated Portfolio of Investments. |
| (2) | Amounts relate to master netting agreements and collateral agreements (for example, ISDA) which have been determined by the Fund to be legally enforceable in the event of default and where certain other criteria are met in accordance with applicable offsetting accounting guidance. |
| (3) | The table above does not include additional cash collateral pledged to the counterparty. Additional collateral pledged to broker as of September 30, 2017 was $15,781. |
Equinox Funds Trust
NOTES TO CONSOLIDATED FINANCIAL STATEMENTS (Continued)
September 30, 2017
EQUINOX CHESAPEAKE STRATEGY FUND
| Liabilities: | | | | | | | | Gross Amounts Not Offset in the
Consolidated Statement of Assets &
Liabilities | | | | | | | |
| Description | | Gross Amounts of
Recognized
Liabilities | | | Gross Amounts
Offset in the
Consolidated
Statement of
Assets &
Liabilities | | | Net Amounts of
Liabilities Presented
in the Consolidated
Statement of Assets
& Liabilities | | | Cash or Financial
Instruments
Pledged (2) | | | Receivable for
Futures | | | Net Amount | |
| Unrealized Depreciation on futures contracts | | $ | 2,490,413 | (1) | | $ | 1,940,506 | | | $ | (549,907 | ) | | $ | 549,907 | (3) | | $ | — | | | $ | — | |
| Total | | $ | 2,490,413 | | | $ | 1,940,506 | | | $ | (549,907 | ) | | $ | 549,907 | | | $ | — | | | $ | — | |
| (1) | Net unrealized depreciation as presented in the Consolidated Portfolio of Investments. |
| (2) | Amounts relate to master netting agreements and collateral agreements (for example, ISDA) which have been determined by the Fund to be legally enforceable in the event of default and where certain other criteria are met in accordance with applicable offsetting accounting guidance. |
| (3) | The table above does not include all collateral pledged to the counterparty. Additional collateral pledged to broker as of September 30, 2017 was $14,732,141. |
EQUINOX CRABEL STRATEGY FUND
| Liabilities: | | | | | | | | | | | Gross Amounts Not Offset in the
Consolidated Statement of Assets
& Liabilities | | | | |
| Description | | Gross Amounts of
Recognized
Liabilities | | | Gross Amounts
Offset in the
Consolidated
Statement of
Assets &
Liabilities | | | Net Amounts of
Assets Presented in
the Consolidated
Statement of Assets
& Liabilities | | | Financial
Instruments
Pledged (2) | | | Receivable for
Swap | | | Net Amount | |
| Unrealized Depreciation on Swap Contract | | $ | 153,904 | (1) | | $ | — | | | $ | 153,904 | | | $ | 126,013 | (3) | | $ | 27,891 | | | $ | — | |
| Total | | $ | 153,904 | | | $ | — | | | $ | 153,904 | | | $ | 126,013 | | | $ | 27,891 | | | $ | — | |
| (1) | Net unrealized appreciation as presented in the Consolidated Portfolio of Investments. |
| (2) | Amounts relate to master netting agreements and collateral agreements (for example, ISDA) which have been determined by the Fund to be legally enforceable in the event of default and where certain other criteria are met in accordance with applicable offsetting accounting guidance. |
| (3) | The table above does not include collateral pledged to the counterparty. Collateral pledged to broker as of September 30, 2017 was $433,150. |
Indemnification – The Trust indemnifies its officers and trustees for certain liabilities that may arise from the performance of their duties to the Trust. Additionally, in the normal course of business, the Funds enter into contracts that contain a variety of representations and warranties and which provide general indemnities. The Funds’ maximum exposure under these arrangements is unknown, as this would involve future claims that may be made against the Funds that have not yet occurred. However, based on experience, the risk of loss due to these warranties and indemnities appears to be remote.
| 3. | INVESTMENT TRANSACTIONS |
For the year ended September 30, 2017, there were no purchases or sales of portfolio securities, other than short-term investments and U.S. government securities.
Equinox Funds Trust
NOTES TO CONSOLIDATED FINANCIAL STATEMENTS (Continued)
September 30, 2017
| 4. | INVESTMENT ADVISORY AGREEMENT AND TRANSACTIONS WITH RELATED PARTIES |
Equinox Institutional Asset Management LP serves as the Fund’s Investment Advisor (the “Advisor”). Pursuant to an Advisory Agreement with the Trust, on behalf of the Funds, the Advisor, under the oversight of the Board, directs the daily operations of the Funds and supervises the performance of administrative and professional services provided by others. As compensation for its services and the related expenses borne by the Advisor, the Funds pay the Advisor a management fee, computed and accrued daily and paid monthly, at an annual rate of 0.75% of BH-DG Strategy Fund and Crabel Strategy Fund average daily net assets. Effective July 25, 2017, as compensation for its services and the related expenses borne by the Advisor, the Chesapeake Strategy Fund pays the Advisor a management fee, computed and accrued daily and paid monthly, at an annual rate of 1.50% of Chesapeake Strategy Fund’s average daily net assets. Prior to July 25, 2017, as compensation for its services and the related expenses borne by the Advisor, the Funds paid the Advisor a management fee, computed and accrued daily and paid monthly, at an annual rate of 0.75% of Chesapeake Strategy Fund’s average daily assets.
| Fund | | Receivable from Advisor | | | Payable to Advisor | |
| BH-DG Strategy | | $ | 15,668 | | | $ | — | |
| Chesapeake Strategy | | | — | | | | 40,672 | |
| Crabel Strategy | | | — | | | | 1,054 | |
The Advisor has contractually agreed to reduce its compensation and/or reimburse certain expenses for a Fund, to the extent necessary to ensure that such Fund’s total operating expenses, excluding taxes, any class-specific fees and expenses (such as Rule 12b-1 distribution fees, shareholder service fees, or transfer agency fees), interest, extraordinary items, “Acquired Fund fees and expenses” and brokerage commissions, do not exceed the contractual limits set forth below (the “Expense Limitation”). The Expense Limitation with respect to each Fund will remain in place for the periods set forth below unless the Board of Trustees approves its earlier termination, subject to 60 days’ written notice to the Advisor. The Advisor shall be entitled to recover, subject to approval by the Board of Trustees of the Trust, such waived or reimbursed amounts for a period of up to three (3) years from the year in which the Advisor reduced its compensation and/or assumed expenses for a Fund. No recoupment will occur unless a Fund’s operating expenses are below the expense limitation amount.
| | | Contractual Limit on | | | | | |
| | | Total Operating | | | | | |
| Funds | | Expenses | | | Effective Date | | Termination Date |
| Equinox BH-DG Strategy Fund | | | 1.10 | % | | Commencement
of Operations | | January 31, 2018 |
| | | | 2.00 | % | | January 31, 2018 | | January 31, 2027 |
| Equinox Chesapeake Strategy Fund | | | 1.85 | % | | July 26, 2017 | | January 31, 2018 |
| | | | 1.10 | % | | Commencement
of Operations | | July 25, 2017 |
| Equinox Crabel Strategy Fund | | | 1.10 | % | | January 31, 2016 | | January 31, 2018 |
| | | | 2.00 | % | | January 31, 2018 | | January 31, 2027 |
Equinox Funds Trust
NOTES TO CONSOLIDATED FINANCIAL STATEMENTS (Continued)
September 30, 2017
The Advisor may seek reimbursement only for expenses waived or paid by it during the three fiscal years prior to such reimbursement; provided, however, that such expenses may only be reimbursed to the extent they were waived or paid after the date of the Expense Limitation (or any similar agreement). The Advisor is permitted to seek reimbursement from a Fund, subject to certain limitations, for fees it waived and Fund expenses it paid to the extent the total annual fund operating expenses for a Class of such Fund do not exceed the limits described above or any lesser limits in effect at the time of reimbursement. The Board may terminate this expense reimbursement arrangement at any time. Pursuant to the Expense Limitation, the Advisor may seek reimbursement for the following amounts through the expiration dates listed below:
| Fund | | September 30, 2018 | | | September 30, 2019 | | | September 30, 2020 | |
| BH-DG Strategy | | $ | 100,447 | | | $ | 115,841 | | | $ | 116,066 | |
| Chesapeake Strategy | | | 60,931 | | | | 37,059 | | | | 291,568 | |
| Crabel Strategy | | | 96,821 | | | | 90,760 | | | | 104,468 | |
As of September 30, 2017, the following amounts expired unrecouped:
| BH-DG Strategy | | $ | 92,979 | |
| Chesapeake Strategy | | | 121,451 | |
| Crabel Strategy | | | 102,684 | |
The distributor of the Funds is Northern Lights Distributors, LLC (the “Distributor”), an affiliate of GFS. The Trust, on behalf of the Funds, has adopted the Trust’s Distribution Plan pursuant to Rule 12b-1 under the 1940 Act (the “Plan”), to pay for certain distribution activities and shareholder services. The Plan provides that a monthly service and/or distribution fee is calculated by each Fund at an annual rate of 0.25% and 1.00% of the average daily net assets attributable to Class A shares and Class C shares, respectively, and is paid to the Distributor to provide compensation for ongoing distribution-related activities or services and/or maintenance of the Fund’s shareholder accounts, not otherwise required to be provided by the Advisor. The Plan is a compensation plan, which means that compensation is provided regardless of 12b-1 expenses incurred. The Plan further provides for periodic payments to brokers, dealers and other financial intermediaries, including insurance companies, for providing shareholder services and for promotional and other sales-related costs. During the year ended September 30, 2017, pursuant to the Plan, Equinox Chesapeake Strategy Fund incurred $5,546 and $4,213 in 12b-1 fees for the Fund’s Class A and Class C shares, respectively. There are no 12b-1 fees for the BH-DG Strategy Fund and Crabel Strategy Fund.
The Distributor acts as the Funds’ principal underwriter in a continuous public offering of the Funds’ Class A, Class C, and Class I shares. For the year ended September 30, 2017, the Distributor received $746 and $3,793 in underwriting commissions for sales of Class A and Class C shares for the Chesapeake Fund, respectively, of which $98 and $758 were retained by the principal underwriter or other affiliated broker-dealers.
Equinox Funds Trust
NOTES TO CONSOLIDATED FINANCIAL STATEMENTS (Continued)
September 30, 2017
In addition, certain affiliates of the Distributor provide services to the Funds as follows:
Gemini Fund Services, LLC (“GFS”), an affiliate of the Distributor, provides administration, fund accounting, and transfer agent services to the Trust. Pursuant to separate servicing agreements with GFS, the Funds pay GFS customary fees for providing administration, fund accounting and transfer agency services to the Funds.
Northern Lights Compliance Services, LLC (“NLCS”), an affiliate of GFS and the Distributor, provides a Chief Compliance Officer to the Trust, as well as related compliance services, pursuant to a consulting agreement between NLCS and the Trust. Under the terms of such agreement, NLCS receives customary fees from the Funds.
BluGiant, LLC (“BluGiant”), an affiliate of GFS and the Distributor, provides EDGAR conversion and filing services as well as print management services for the Funds on an ad-hoc basis. For the provision of these services, BluGiant receives customary fees from the Funds.
| 5. | AGGREGATE UNREALIZED APPRECIATION AND DEPRECIATION – TAX BASIS |
The identified cost of investments in securities owned by each Fund for federal income tax purposes, and its respective gross unrealized appreciation and depreciation at September 30, 2017, were as follows:
| | | | | | Gross | | | Gross | | | Net Unrealized | |
| | | Tax | | | Unrealized | | | Unrealized | | | Appreciation/ | |
| | | Cost | | | Appreciation | | | Depreciation | | | (Depreciation) | |
| BH-DG Strategy | | $ | — | | | $ | — | | | $ | — | | | $ | — | |
| Chesapeake Strategy Fund | | | 23,992,550 | | | | — | | | | (20,359 | ) | | | (20,359 | ) |
| Crabel Strategy Fund | | | 1,758,382 | | | | — | | | | (847 | ) | | | (847 | ) |
| 6. | DISTRIBUTIONS AND TAX COMPONENTS OF CAPITAL |
The tax character of distributions paid during the fiscal years ended September 30, 2017 was as follows:
| For fiscal year ended | | Ordinary | | | Exempt | | | Long-Term | | | Return of | | | | |
| 9/30/2017 | | Income | | | Income | | | Capital Gains | | | Capital | | | Total | |
| BH-DG Strategy | | $ | — | | | $ | — | | | $ | — | | | $ | — | | | | — | |
| Chesapeake Strategy Fund | | | — | | | | — | | | | — | | | | — | | | | — | |
| Crabel Strategy Fund | | | 113,818 | | | | — | | | | — | | | | 12,687 | | | | 126,505 | |
There were no distributions for fiscal year ended September 30, 2016.
Equinox Funds Trust
NOTES TO CONSOLIDATED FINANCIAL STATEMENTS (Continued)
September 30, 2017
As of September 30, 2017, the components of accumulated earnings/(deficit) on a tax basis were as follows:
| | | Undistributed | | | Undistributed | | | Post October Loss | | | Capital Loss | | | Other | | | Unrealized | | | Total | |
| | | Ordinary | | | Long-Term | | | and | | | Carry | | | Book/Tax | | | Appreciation/ | | | Accumulated | |
| | | Income | | | Capital Gains | | | Late Year Loss | | | Forwards | | | Differences | | | (Depreciation) | | | Earnings/(Deficits) | |
| BH-DG Strategy | | $ | — | | | $ | — | | | $ | (462 | ) | | $ | (19 | ) | | $ | (3,251 | ) | | $ | — | | | $ | (3,732 | ) |
| Chesapeake Strategy Fund | | | — | | | | — | | | | (1,779,230 | ) | | | (1,285 | ) | | | (281,128 | ) | | | 534,063 | | | | (1,527,580 | ) |
| Crabel Strategy Fund | | | — | | | | — | | | | (10,212 | ) | | | (187 | ) | | | (318,440 | ) | | | (847 | ) | | | (329,686 | ) |
The differences between book basis and tax basis unrealized appreciation/(depreciation), accumulated net investment income/ loss and accumulated net realized gain/loss from investments are primarily attributable to adjustments for the Funds’ wholly owned subsidiaries.
Late year losses incurred after December 31 within the fiscal year are deemed to arise on the first business day of the following fiscal year for tax purposes. The Funds incurred and elected to defer such late year losses as follows:
| | | Late Year | |
| | | Losses | |
| BH-DG Strategy | | $ | 462 | |
| Chesapeake Strategy Fund | | | 379,377 | |
| Crabel Strategy Fund | | | 10,212 | |
Capital losses incurred after October 31 within the fiscal year are deemed to arise on the first business day of the following fiscal year for tax purposes. The Funds incurred and elected to defer such capital losses as follows:
| | | Post October | |
| | | Losses | |
| BH-DG Strategy | | $ | — | |
| Chesapeake Strategy Fund | | | 1,399,853 | |
| Crabel Strategy Fund | | | — | |
At September 30, 2017, the Fund had capital loss carry forwards for federal income tax purposes available to offset future capital gains as follows:
| | | | | | Non-Expiring | | | Non-Expiring | | | | |
| | | Expiring | | | Short-Term | | | Long-Term | | | Total | |
| BH-DG Strategy | | $ | — | | | $ | 19 | | | $ | — | | | $ | 19 | |
| Chesapeake Strategy Fund | | | — | | | | 1,285 | | | | — | | | | 1,285 | |
| Crabel Strategy Fund | | | — | | | | 187 | | | | — | | | | 187 | |
Equinox Funds Trust
NOTES TO CONSOLIDATED FINANCIAL STATEMENTS (Continued)
September 30, 2017
Permanent book and tax differences, primarily attributable to the reclass of net operating losses resulted in reclassifications for the following Funds for the year ended September 30, 2017 as follows:
| | | Paid | | | Undistributed | | | Accumulated | |
| | | In | | | Ordinary | | | Net Realized | |
| | | Capital | | | Income (Loss) | | | Gains (Loss) | |
| BH-DG Strategy | | $ | (94 | ) | | $ | 94 | | | $ | — | |
| Chesapeake Strategy Fund | | | (433,991 | ) | | | 361,310 | | | | 72,681 | |
| Crabel Strategy Fund | | | (4,515 | ) | | | 4,515 | | | | — | |
| | | | | | | | | | | | | |
The beneficial ownership, either directly or indirectly, of more than 25% of the voting securities of a Fund creates presumption of control of the Fund, under Section 2(a) 9 of the Act. As of September 30, 2017, beneficial ownership in excess of 25% is as follows:
| Portfolio | | Beneficial Owner | | % of Outstanding Shares |
| BH-DG Strategy | | FolioFN Investments, LLC | | 57% |
| Chesapeake Strategy | | Vandelay Fund, LLC | | 28% |
| | | | | |
| Crabel Strategy | | Pershing, LLC (for the benefit of others) | | 26% |
| | | Ameritrade Inc. (for the benefit of others) | | 57% |
The Trust has no knowledge as to whether all or any portion of the shares owned of record are also owned beneficially.
Subsequent events after the date of the Consolidated Statement of Assets and Liabilities have been evaluated through the date the consolidated financial statements were issued. Management has concluded that there were no events or transactions requiring adjustment or disclosure in the consolidated financial statements.
Report of Independent Registered Public Accounting Firm
To the Board of Trustees of Equinox Funds Trust
and the Shareholders of Equinox BH-DG Strategy Fund
We have audited the accompanying consolidated statement of assets and liabilities, including the consolidated portfolio of investments, of Equinox BH-DG Strategy Fund (the Fund), a series of the Equinox Funds Trust, as of September 30, 2017, and the related consolidated statements of operations for the year then ended, the statement of changes in net assets for each of the two years in the period then ended, and the financial highlights for each of the three years in the period then ended and for the period from December 31, 2013 (commencement of operations) through September 30, 2014. These financial statements and financial highlights are the responsibility of the Fund’s management. Our responsibility is to express an opinion on these financial statements and financial highlights based on our audits.
We conducted our audits in accordance with the standards of the Public Company Accounting Oversight Board (United States). Those standards require that we plan and perform the audit to obtain reasonable assurance about whether the financial statements and financial highlights are free of material misstatement. The Fund is not required to have, nor were we engaged to perform, an audit of its internal control over financial reporting. Our audits included consideration of internal control over financial reporting as a basis for designing audit procedures that are appropriate in the circumstances, but not for the purpose of expressing an opinion on the effectiveness of the Fund’s internal control over financial reporting. Accordingly, we express no such opinion. An audit also includes examining, on a test basis, evidence supporting the amounts and disclosures in the financial statements. Our procedures included confirmation of investments owned as of September 30, 2017, by correspondence with the custodian and brokers. An audit also includes assessing the accounting principles used and significant estimates made by management, as well as evaluating the overall financial statement presentation. We believe that our audits provide a reasonable basis for our opinion.
In our opinion, the consolidated financial statements and financial highlights referred to above present fairly, in all material respects, the financial position of Equinox BH-DG Strategy Fund as of September 30, 2017, and the results of their operations for the year then ended, the changes in their net assets for each of the two years in the period then ended, and the financial highlights for each of the three years in the period then ended and for the period from December 31, 2013 (commencement of operations) through September 30, 2014 in conformity with U.S. generally accepted accounting principles.
/s/ RSM US LLP
Denver, Colorado
November 29, 2017
Report of Independent Registered Public Accounting Firm
To the Board of Trustees of Equinox Funds Trust
and the Shareholders of Equinox Chesapeake Strategy Fund and Equinox Crabel Strategy Fund
We have audited the accompanying consolidated statements of assets and liabilities, including the consolidated portfolios of investments, of Equinox Chesapeake Strategy Fund and Equinox Crabel Strategy Fund (collectively, the Funds), each a series of the Equinox Funds Trust, as of September 30, 2017, and the related consolidated statements of operations for the year then ended, the statements of changes in net assets for each of the two years in the period then ended, and the financial highlights for each of the five years in the period then ended. These financial statements and financial highlights are the responsibility of the Funds’ management. Our responsibility is to express an opinion on these financial statements and financial highlights based on our audits.
We conducted our audits in accordance with the standards of the Public Company Accounting Oversight Board (United States). Those standards require that we plan and perform the audit to obtain reasonable assurance about whether the financial statements and financial highlights are free of material misstatement. The Fund is not required to have, nor were we engaged to perform, an audit of its internal control over financial reporting. Our audits included consideration of internal control over financial reporting as a basis for designing audit procedures that are appropriate in the circumstances, but not for the purpose of expressing an opinion on the effectiveness of the Funds’ internal control over financial reporting. Accordingly, we express no such opinion. An audit also includes examining, on a test basis, evidence supporting the amounts and disclosures in the financial statements. Our procedures included confirmation of investments owned as of September 30, 2017, by correspondence with the custodian and brokers. An audit also includes assessing the accounting principles used and significant estimates made by management, as well as evaluating the overall financial statement presentation. We believe that our audits provide a reasonable basis for our opinion.
In our opinion, the consolidated financial statements and financial highlights referred to above present fairly, in all material respects, the financial position of Equinox Chesapeake Strategy Fund and Equinox Crabel Strategy Fund as of September 30, 2017, and the results of their operations for the year then ended, the changes in their net assets for each of the two years in the period then ended, and the financial highlights for each of the five years in the period then ended in conformity with U.S. generally accepted accounting principles.
/s/ RSM US LLP
Denver, Colorado
November 29, 2017
Equinox Funds Trust
EXPENSE EXAMPLES (Unaudited)
September 30, 2017
As a shareholder of the Funds, you incur two types of costs: (1) transaction costs, including upfront and deferred sales charges (loads) on purchases of Class A shares and deferred sales charges (loads) on certain redemptions of Class C shares; (2) ongoing costs, including management fees; distribution and/or service (12b-1) fees; and other Fund expenses. This example is intended to help you understand your ongoing costs (in dollars) of investing in each Fund and to compare these costs with the ongoing costs of investing in other mutual funds.
The example is based on an investment of $1,000 invested at the beginning of the period and held for the entire six month period from April 1, 2017 through September 30, 2017.
Actual Expenses
The “Actual” expenses line in the table below provides information about actual account values and actual expenses. You may use the information below, together with the amount you invested, to estimate the expenses that you paid over the period. Simply divide your account value by $1,000 (for example, an $8,600 account value divided by $1,000 = 8.6), then multiply the result by the number in the table under the heading entitled “Expenses Paid During Period” to estimate the expenses you paid on your account during this period.
Hypothetical Example for Comparison Purposes
The “Hypothetical” line in the table below provides information about hypothetical account values and hypothetical expenses based on each of Fund’s actual expense ratios and an assumed rate of return of 5% per year before expenses, which is not the Fund’s actual return. The hypothetical account values and expenses may not be used to estimate the actual ending account balances or expenses you paid for the period. You may use this information to compare this 5% hypothetical example with the 5% hypothetical examples that appear in the shareholder reports of other funds.
Please note that the expenses shown in the table are meant to highlight your ongoing costs only and do not reflect any transactional costs, such as sales charges (loads), or redemption fees. Therefore, the table is useful in comparing ongoing costs only, and will not help you determine the relative total costs of owning different funds. In addition, if these transactional costs were included, your costs would have been higher.
| | | Beginning | | | Ending | | | Expenses Paid | | | |
| | | Account Value | | | Account Value | | | During Period | | | Annualized |
| Actual * | | 4/1/2017 | | | 9/30/2017 | | | 4/1/17 - 9/30/17 | | | Expense Ratio |
| BH-DG Strategy – Class I | | $ | 1,000.00 | | | $ | 1,026.40 | | | $ | 5.59 | | | 1.10% |
| Chesapeake Strategy – Class A | | | 1,000.00 | | | | 1,006.80 | | | | 7.90 | | | 1.57% |
| Chesapeake Strategy – Class C | | | 1,000.00 | | | | 1,002.60 | | | | 11.65 | | | 2.32% |
| Chesapeake Strategy – Class I | | | 1,000.00 | | | | 1,007.70 | | | | 6.64 | | | 1.32% |
| Crabel Strategy – Class I | | | 1,000.00 | | | | 986.90 | | | | 5.48 | | | 1.10% |
| | | | | | | | | | | | |
| | | Beginning | | | Ending | | | Expenses Paid | | | |
| Hypothetical * | | Account Value | | | Account Value | | | During Period | | | Annualized |
| (5% return before expenses) | | 4/1/2017 | | | 9/30/2017 | | | 4/1/17 - 9/30/17 | | | Expense Ratio |
| BH-DG Strategy – Class I | | $ | 1,000.00 | | | $ | 1,019.55 | | | $ | 5.57 | | | 1.10% |
| Chesapeake Strategy – Class A | | | 1,000.00 | | | | 1,017.20 | | | | 7.94 | | | 1.57% |
| Chesapeake Strategy – Class C | | | 1,000.00 | | | | 1,013.44 | | | | 11.71 | | | 2.32% |
| Chesapeake Strategy – Class I | | | 1,000.00 | | | | 1,018.45 | | | | 6.68 | | | 1.32% |
| Crabel Strategy – Class I | | | 1,000.00 | | | | 1,019.55 | | | | 5.57 | | | 1.10% |
| * | Expense information for is equal to the average account value over the period, multiplied by each Fund’s annualized expense ratio, multiplied by the number of days in the period (183) divided by the number of days in the fiscal year (365). |
Equinox Funds Trust
SUPPLEMENTAL INFORMATION (Unaudited)
September 30, 2017
The following tables present certain information regarding the Board of Trustees and officers of the Trust. Each person listed under “Interested Trustees” below is an “interested person” of the Trust, the Adviser, or Distributor, within the meaning of the 1940 Act. Each person who is not an “interested person” of the Trust, the Adviser or the Distributor within the meaning of the 1940 Act is referred to as an “Independent Trustee” and is listed under such heading below. Unless otherwise noted, the address of each Trustee and Officer is 17605 Wright Street, Suite 2, Omaha, NE 68130.
Independent Trustees
Name and Year of
Birth | Position(s)
Held/Term
of Office* | Principal Occupation
During the Last Five Years | Number of
Portfolios in Fund
Complex**
Overseen by
Trustee | Other Directorships*** held by
Trustee During Last Five Years |
David P. Demuth
9/1945 | Trustee Since December 2010 | Consultant, CFO Consulting Partners, LLC (since May 2004). | 8 | None |
Kevin R. Green
7/1954 | Trustee Since December 2010 | CEO of TripleTree Holdings, LLC an Investment Bank, Advisory and Principal Investing business (since 1997). | 8 | Director of BlueCross BlueShield of Minnesota (healthcare services). |
Jay Moorin
7/1951 | Trustee Since December 2010 | Managing Partner, ProQuest Management, LLC (since 1998). | 8 | None |
Interested Trustee
Name and Year of
Birth | Position(s)
Held/Term
of Office* | Principal Occupation
During the Past Five Years | Number of
Portfolios in Fund
Complex**
Overseen by
Trustee | Other Directorships*** held by
Trustee During the Last Five
Years |
Robert J. Enck
9/1962 | Chairman, Trustee, President and Principal Executive Officer Since December 2010 | President and Chief Executive Officer, Equinox Institutional Asset Management, LP (since 2015); President and Chief Executive Officer, Equinox Fund Management, LLC (since 2007). | 8 | Executive Committee Member of The Frontier Fund (commodity pool). |
Equinox Funds Trust
SUPPLEMENTAL INFORMATION (Unaudited)(Continued)
September 30, 2017
Executive Officers
Name and Year of
Birth | Position(s)
Held/Term
of Office* | Principal Occupation
During the Past Five Years | Number of
Portfolios in Fund
Complex**
Overseen by
Trustee | Other Directorships*** held by
Trustee During the Past Five
Years |
Laura Latella
4/1958 | Treasurer, Principal Financial Officer and Secretary Since November 2016 | Chief Administrative Officer, Equinox Institutional Asset Management, LP (since May 2016); Consultant, Equinox Institutional Asset Management, LP (January 2016 – April 2016); Treasurer, CFO, Principal, 6800 Capital, LLC (May 1994 – January 2016). | N/A | N/A |
Laura Szalyga
3/1978 | Assistant Treasurer since August 2014 | Vice President (since 2015) and Assistant Vice President (2011 to 2015) of Fund Administration, Gemini Fund Services, LLC | N/A | N/A |
| Doug Tyre | Chief Compliance Officer and Anti-Money Laundering Officer Since October 13, 2017 | Assistant Compliance Director of Cipperman Compliance Services LLC (since 2014); Client Services & Operations Specialist-Senior Associate of Echo Point Investment Management LLC (2010 – 2014). | N/A | N/A |
| * | Each Trustee and Officer shall serve until death, resignation or removal. |
| ** | The term “Fund Complex” refers to the Equinox Funds Trust. |
| *** | Directorships are held in a company with a class of securities registered pursuant to section 12 of the Securities Exchange Act or subject to the requirements of section 15(d) of the Securities Exchange Act or a company registered as an investment company under the 1940 Act. |
PRIVACY NOTICE
Rev. August 2011
| FACTS | WHAT DOES EQUINOX FUNDS TRUST DO WITH YOUR PERSONAL INFORMATION? |
| | |
| Why? | Financial companies choose how they share your personal information. Federal law gives consumers the right to limit some but not all sharing. Federal law also requires us to tell you how we collect, share, and protect your personal information. Please read this notice carefully to understand what we do. |
| | |
| What? | The types of personal information we collect and share depend on the product or service you have with us. This information can include: |
| | ■ Social Security number ■ Assets ■ Retirement Assets ■ Transaction History ■ Checking Account Information | ■ Purchase History ■ Account Balances ■ Account Transactions ■ Wire Transfer Instructions |
| | |
| | When you are no longer our customer, we continue to share your information as described in this notice. |
| | |
| How? | All financial companies need to share customers’ personal information to run their everyday business. In the section below, we list the reasons financial companies can share their customers’ personal information; the reasons Equinox Funds Trust chooses to share; and whether you can limit this sharing. |
| Reasons we can share your personal information | Does Equinox
Funds Trust
share? | Can you limit this sharing? |
For our everyday business purposes – such as to process your transactions, maintain your account(s), respond to court orders and legal investigations, or report to credit bureaus | Yes | No |
For our marketing purposes – to offer our products and services to you | No | We don’t share |
| For joint marketing with other financial companies | No | We don’t share |
For our affiliates’ everyday business purposes – information about your transactions and experiences | No | We don’t share |
For our affiliates’ everyday business purposes – information about your creditworthiness | No | We don’t share |
| For nonaffiliates to market to you | No | We don’t share |
| Questions? | Call 1-888-643-3431 |
Rev. August 2011
| Who we are |
| Who is providing this notice? | Equinox Funds Trust |
| What we do |
| How does Equinox Funds Trust protect my personal information? | To protect your personal information from unauthorized access and use, we use security measures that comply with federal law. These measures include computer safeguards and secured files and buildings. Our service providers are held accountable for adhering to strict policies and procedures to prevent any misuse of your nonpublic personal information. |
| How does Equinox Funds Trust collect my personal information? | We collect your personal information, for example, when you ■ Open an account ■ Provide account information ■ Give us your contact information ■ Make deposits or withdrawals from your account ■ Make a wire transfer ■ Tell us where to send the money ■ Tells us who receives the money ■ Show your government-issued ID ■ Show your driver’s license We also collect your personal information from other companies. |
| Why can’t I limit all sharing? | Federal law gives you the right to limit only ■ Sharing for affiliates’ everyday business purposes – information about your creditworthiness ■ Affiliates from using your information to market to you ■ Sharing for nonaffiliates to market to you State laws and individual companies may give you additional rights to limit sharing. |
| Definitions |
| Affiliates | Companies related by common ownership or control. They can be financial and nonfinancial companies. ■ Equinox Funds Trust does not share with our affiliates. |
| Nonaffiliates | Companies not related by common ownership or control. They can be financial and nonfinancial companies ■ Equinox Funds Trust does not share with nonaffiliates so they can market to you. |
| Joint marketing | A formal agreement between nonaffiliated financial companies that together market financial products or services to you. ■ Equinox Funds Trust doesn’t jointly market. |
This Page Intentionally Left Blank
This Page Intentionally Left Blank
PROXY VOTING POLICY
Information regarding how the Funds voted proxies relating to portfolio securities for the most recent period ended June 30 as well as a description of the policies and procedures that the Funds use to determine how to vote proxies is available without charge, upon request, by calling 1-888-643-3431 or by referring to the Securities and Exchange Commission’s (“SEC”) website at http://www.sec.gov.
PORTFOLIO HOLDINGS
The Funds file their complete schedules of portfolio holdings with the SEC for the first and third quarters of each fiscal year (quarters ending December and June) on Form N-Q. Form N-Q is available on the SEC’s website at http://www.sec.gov and may be reviewed and copied at the SEC’s Public Reference Room in Washington, DC (1-800-SEC-0330). The information on Form N-Q is available without charge, upon request, by calling 1-888-643-3431.
| |
| |
| INVESTMENT ADVISOR |
| Equinox Institutional Asset Management, LP |
| 47 Hulfish Street, Suite 510 |
| Princeton, NJ 08542 |
| |
| ADMINISTRATOR |
| Gemini Fund Services, LLC |
| 80 Arkay Drive, Suite 110 |
| Hauppauge, New York 11788 |
Item 2. Code of Ethics.
(a) As of the end of the period covered by this report, the registrant has adopted a code of ethics that applies to the registrant's Principal executive officer, Principal financial officer, Principal accounting officer or controller, or persons performing similar functions, regardless of whether these individuals are employed by the registrant or a third party.
(b) For purposes of this item, “code of ethics” means written standards that are reasonably designed to deter wrongdoing and to promote:
| (1) | Honest and ethical conduct, including the ethical handling of actual or apparent conflicts of interest between personal and professional relationships; |
| (2) | Full, fair, accurate, timely, and understandable disclosure in reports and documents that a registrant files with, or submits to, the Commission and in other public communications made by the registrant; |
(3) Compliance with applicable governmental laws, rules, and regulations;
| (4) | The prompt internal reporting of violations of the code to an appropriate person or persons identified in the code; and |
(5) Accountability for adherence to the code.
(c) Amendments: During the period covered by the report, there have not been any amendments to the provisions of the code of ethics.
(d) Waivers: During the period covered by the report, the registrant has not granted any express or implicit waivers from the provisions of the code of ethics.
(e) The Code of Ethics is not posted on Registrant’ website.
(f) A copy of the Code of Ethics is attached as an exhibit.
Item 3. Audit Committee Financial Expert.
(a)(1)ii The Registrant’s board of trustees has determined that David DeMuth is an audit committee financial expert, as defined in Item 3 of Form N-CSR. Mr. DeMuth is independent for purposes of this Item 3.
(a)(2) Not applicable.
(a)(3) In this regard, no member of the audit committee was identified as having all of the required technical attributes identified in instruction 2 (b) to item 3 of Form N-CSR to qualify as an “audit committee financial expert,” whether through the type of specialized education or experience required by that instruction. At this time, the board believes the experience provided by each member of the audit committee collectively offers the fund adequate oversight by its audit committee given the fund’s level of financial complexity. The board will from time to time reexamine such belief.
Item 4. Principal Accountant Fees and Services.
2017 - $52,500
2016 - $50,500
2015 - $67,500
2014 - $67,500
2013 - $135,000
2012 – None
2017 - None
2016 - None
2015 - None
2014 - None
2013 - None
2012 – None
2017 - $26,310
2016 - $24,000
2015 - $27,000
2014 - $27,000
2013 - $ 54,000
2012 - $ 16,000
Preparation of Federal & State income tax returns, assistance with calculation of required income, capital gain and excise distributions and preparation of Federal excise tax returns.
2017 - None
2016 - None
2015 - None
2014 - None
2013 - None
2012 – None
| (e) | (1) Audit Committee’s Pre-Approval Policies |
The registrant’s Audit Committee is required to pre-approve all audit services and, when appropriate, any non-audit services (including audit-related, tax and all other services) to the registrant. The registrant’s Audit Committee also is required to pre-approve, when appropriate, any non-audit services (including audit-related, tax and all other services) to its adviser, or any entity controlling, controlled by or under common control with the adviser that provides ongoing services to the registrant, to the extent that the services may be determined to have an impact on the operations or financial reporting of the registrant. Services are reviewed on an engagement by engagement basis by the Audit Committee.
| (2) | There were no services described in each of paragraphs (b) through (d) of this Item that were approved by the audit committee pursuant to paragraph (c)(7)(i)(C) of Rule 2-01 of Regulation S-X. |
| (f) | During the audit of registrant's financial statements for the most recent fiscal year, less than 50 percent of the hours expended on the Principal accountant's engagement were attributed to work performed by persons other than the Principal accountant's full-time, permanent employees. |
| (g) | The aggregate non-audit fees billed by the registrant's accountant for services rendered to the registrant, and rendered to the registrant's investment adviser (not including any sub-adviser whose role is primarily portfolio management and is subcontracted with or overseen by another investment adviser), and any entity controlling, controlled by, or under common control with the adviser that provides ongoing services to the registrant for each of the last two fiscal years of the registrant: |
2017 - None
2016 - None
2015 - None
2014 – None
2013 – None
2012 - None
| (h) | The registrant’s audit committee of the board of trustees has considered whether the provision of non-audit services that were rendered to the registrant’s investment adviser, and any entity controlling, controlled by, or under common control with the investment adviser that provides ongoing services to the registrant that were not pre-approved pursuant to paragraph (c)(7)(ii) of Rule 2-01 of Regulation S-X is compatible with maintaining the Principal accountant’s independence. No such services were rendered. |
Item 5. Audit Committee of Listed Companies. Not applicable to open-end investment companies.
Item 6. Schedule of Investments. See Item 1.
Item 7. Disclosure of Proxy Voting Policies and Procedures for Closed-End Funds. Not applicable to open-end investment companies.
Item 8. Portfolio Managers of Closed-End Management Investment Companies. Not applicable to open-end investment companies.
Item 9. Purchases of Equity Securities by Closed-End Funds. Not applicable to open-end investment companies.
Item 10. Submission of Matters to a Vote of Security Holders. None
Item 11. Controls and Procedures.
(a) Based on an evaluation of the Registrant’s disclosure controls and procedures as of a date within 90 days of filing date of this Form N-CSR, the Principal executive officer and Principal financial officer of the Registrant have concluded that the disclosure controls and procedures of the Registrant are reasonably designed to ensure that the information required in filings on Form N-CSR is recorded, processed, summarized, and reported by the filing date, including that information required to be disclosed is accumulated and communicated to the Registrant’s management, including the Registrant’s Principal executive officer and Principal financial officer, as appropriate to allow timely decisions regarding required disclosure.
(b) There were no significant changes in the Registrant’s internal control over financial reporting that occurred during the Registrant’s last fiscal half-year that have materially affected, or are reasonably likely to materially affect, the Registrant’s internal control over financial reporting.
Item 12. Exhibits.
(a)(1) Code of Ethics is filed herewith.
(a)(2) Certifications required by Section 302 of the Sarbanes-Oxley Act of 2002 (and Item 11(a)(2) of Form N-CSR) are filed herewith.
(a)(3) Not applicable for open-end investment companies.
(b) Certifications required by Section 906 of the Sarbanes-Oxley Act of 2002 (and Item 11(b) of Form N-CSR) are filed herewith.
SIGNATURES
Pursuant to the requirements of the Securities Exchange Act of 1934 and the Investment Company Act of 1940, the registrant has duly caused this report to be signed on its behalf by the undersigned, thereunto duly authorized.
(Registrant) Equinox Funds Trust
By (Signature and Title)
/s/ Robert J. Enck
Robert J. Enck, Principal Executive Officer
Date 12/7/2017
Pursuant to the requirements of the Securities Exchange Act of 1934 and the Investment Company Act of 1940, this report has been signed below by the following persons on behalf of the registrant and in the capacities and on the dates indicated.
By (Signature and Title)
/s/ Robert J. Enck
Robert J. Enck, Principal Executive Officer
Date 12/7/2017
By (Signature and Title)
/s/ Laura Latella
Laura Latella, Principal Financial Officer
Date 12/7/2017