united states
securities and exchange commission
washington, d.c. 20549
form n-csr
certified shareholder report of registered management
investment companies
Investment Company Act file number 811-22447
Equinox Funds Trust
(Exact name of registrant as specified in charter)
17605 Wright Street Omaha, Nebraska 68130
(Address of principal executive offices) (Zip code)
Rich Malinowski, Gemini Fund Services, LLC.
80 Arkay Drive, Suite 110, Hauppauge, NY 11788
(Name and address of agent for service)
Registrant's telephone number, including area code: 631-470-2619
Date of fiscal year end: 6/30
Date of reporting period: 6/30/18
| Item 1. | Reports to Stockholders. |
| EQUINOX AMPERSAND STRATEGY FUND |
| |
| (Formerly Equinox EquityHedge U.S. Strategy Fund) |
| |
| |
| |
| |
| |
| |
| CLASS A SHARES: EEHAX |
| |
| CLASS I SHARES: EEHIX |
| |
| |
| |
| |
| |
| |
| |
| |
| |
| |
| |
| ANNUAL REPORT |
| |
| June 30, 2018 |
| |
| |
| |
| |
| |
| |
| |
| |
| |
| |
| |
| |
| |
| |
| 1-888-643-3431 |
| |
| WWW.EQUINOXFUNDS.COM |
| |
| DISTRIBUTED BY NORTHERN LIGHTS DISTRIBUTORS, LLC |

| Equinox Ampersand Strategy Fund |
| Letter to Shareholders as of June 30, 2018 |
| |
For the year ended June 30, the Equinox Ampersand Strategy Fund (Class I) achieved a positive return of +10.15%, outperforming the HFRX Equity Hedge Index (up +6.27%) but underperforming the S&P500 Total Return Index® (“S&P500”) (up +14.37%) for the same period. Since the first full month since inception (10/1/2013), the Fund has earned +8.80% annualized, with a volatility of 9.70%. We feel this is not entirely unexpected, given the Fund’s objective of providing hedged equity returns; the return compares reasonably with (but is lower than) the S&P500’s annualized return of 12.95%, as shown in the table below. Much of the Fund’s underperformance vs. the S&P 500 Total Return Index® since inception can be attributed to its pre-November 2014 performance, before the change in its investment strategy. The Fund has, however, handsomely outperformed the HFRX Equity Hedge Index® (HFRX) since inception, however with more volatility. We feel the latter is not unexpected, given that the index contains multiple funds, and hence benefits from cross-sectional diversification when compared to a single fund.
| | Cumulative Return
I-Yr | Compound Rate
of Return (ROR)*
Since Inception
(A) | Standard
Deviation** Since
Inception (A) |
Equinox Ampersand Strategy Fund - I | 10.15% | 8.90% | 9.70% |
| HFRX Equity Hedge Index | 6.27% | 2.77% | 4.98% |
| S&P500 | 14.37% | 12.96% | 9.68% |
| * | Compound ROR represents the cumulative effect that a series of gains or losses have on an original amount of capital over a period of time. |
| ** | Standard Deviation is a quantity calculated to indicate the extent of deviation for a group as a whole. |
Performance data quoted here represents past performance. Current performance may be lower or higher than the performance quoted above. The value of an investor’s shares will fluctuate so that investor’s shares, when redeemed, may be worth more or less than their original cost. The Fund’s investment advisor, Equinox Institutional Asset Management, LP, has contractually agreed to reduce its fees and/or absorb expenses of the Fund at least until 10/31/2019 to ensure that the net annual fund operating expenses do not exceed 1.24% (Class A) and 0.99% (Class I) of the Fund’s average daily net assets, subject to possible recoupment from the Fund in future years subject to approval of the Fund’s Board of Trustees. Without the waiver, total annual operating expenses would be 3.17% (Class A) and 2.91% (Class I). For performance current to the most recent month end, please visit equinoxfunds.com.
The Gross/Net Expense Ratio for the Equinox Ampersand Strategy Fund does not include costs associated with any over-the-counter derivatives that provide the Fund exposure to the Overlay Strategy
| 47 Hulfish Street, Suite 510, Princeton, NJ 08542 ● T 609.430.0404 ● F 609.454.5010 ● www.equinoxfunds.com |
discussed below. The Investment Advisor anticipates that such exposure will indirectly subject the Fund to (i) counterparty fees of up to 0.50% (annualized) of notional exposure, and (ii) (annualized) management fees of up to 1.25% of notional exposure and performance-based incentive fees of up to 25% of new high net trading profits. The Adviser anticipates that the Fund’s average notional exposure to the Overlay Strategy generally range between approximately 100% and 200% of Fund assets. The performance of the Fund will be net of all such embedded counterparty, management and incentive/performance fees. Please review the Fund’s prospectus for more information regarding fees and expenses.
Prospectus Changes
Effective June 29, 2018, the Equinox EquityHedge US Strategy Fund (“EquityHedge”) has been restructured and renamed the Equinox Ampersand Strategy Fund (“the Ampersand Fund” or “the Fund”). The Ampersand Fund will assume the existing ticker symbols of EEHIX (Class-I) and EEHAX (Class-A). The Fund’s revised prospectus is currently available on the Equinox Funds website, equinoxfunds.com.
Revised Objective: The Ampersand Fund seeks to achieve returns and volatility comparable to the S&P 500® Total Return Index, while seeking to avoid the full impact of downside risk.
The major change to the EquityHedge strategy is that its current long Equity Strategy will be now combined with an enhanced Overlay Strategy.
The long Equity Strategy will continue to seek returns comparable to those of the S&P 500® Total Return Index. Equity index futures will be used to obtain market exposure that is expected to average somewhere between about 100% and 110% over market cycles.
The enhanced Overlay Strategy will seek to complement these equity returns with non-correlated and negatively correlated return streams so as to result in an overall Ampersand Fund portfolio with volatility comparable to the S&P 500®, while targeting improved returns by seeking to avoid the full impact of downside risk over a market cycle (generally 3 to 5 years or longer). The current EquityHedge hedging strategy uses only one negatively correlated return stream; we believe the enhanced overlay has the potential to provide better risk mitigation and greater returns in the long run.
Rationale
Over the years, we have observed that many investor portfolios are inadequately diversified because of the perceived opportunity cost of selling equities to gain exposure to diversifying alternative assets. We believe an overlay strategy offers the potential for
| 47 Hulfish Street, Suite 510, Princeton, NJ 08542 ● T 609.430.0404 ● F 609.454.5010 ● www.equinoxfunds.com |
superior and meaningful diversification without the need to reduce exposure to core holdings. This is the concept implemented in the Ampersand Fund. The Fund will provide futures-based exposure to the broad US equity market, while simultaneously seeking to diversify equity factor risk through strategic and meaningful exposure to a futures-based portfolio of (i) uncorrelated diversifiers and (ii) negatively-correlated dynamic equity-hedging strategies. The futures-based equity exposure and overlay will both be collateralized by the Fund’s core fixed-income holdings.
Over time, the Fund’s exposure will be adjusted, seeking to manage the volatility of realized returns to a target volatility that is close to that of the S&P 500® Index. The overlay itself will be managed using Equinox’s DyVoT® methodology when appropriate. This proprietary strategy seeks to add alpha by adjusting the size of the overlay based on market volatility and other parameters.
Why the Fee?
Evidence shows that the vast majority of active fund managers underperform their relevant investable indexes. Based on this finding, we believe that investors should be asking their managers: “Why the Fee?” In other words, since index returns can be approximated through passive investing, active managers should only be compensated for achieving superior long-term risk-adjusted performance, and not for simply matching or underperforming a benchmark.
Expressing its confidence in the Ampersand Fund, Equinox has agreed to waive its management fee for the subsequent twelve months if the fund underperforms the S&P 500® Total Return Index (“S&P 500®”) for a given fund-year. Thus, for the current 12-month period commencing on July 1, 2018, ending June 30, 2019 (“Performance Period”), the Equinox Management Fee will be subject to a performance-based voluntary waiver. If the Fund (EEHIX, I-Share) underperforms the S&P 500® Total Return Index over that Performance Period, Equinox will voluntarily waive its Management Fee for the subsequent fund-year, i.e, for the period July 1, 2019 to June 30, 2020. This will be the case as well for each annual period thereafter. Although the Advisor’s management fee is subject to a performance-based waiver, other fees and expenses do apply to an investment in the Fund.
Analysis and Commentary
Q3 2017
The Fund was up +3.36% for the quarter. The long Equity Strategy was up (+3.91%), while the Hedge Strategy had a small negative contribution of -0.69%. The Fund’s fixed-income investments contributed +0.14%. The market environment was unfavorable for the hedge, and it is not unexpected to see the hedge lose ground during a strong period of performance for equities. For the fifth quarter in a row, interest
| 47 Hulfish Street, Suite 510, Princeton, NJ 08542 ● T 609.430.0404 ● F 609.454.5010 ● www.equinoxfunds.com |
rates and equity indices detracted from performance, contributing -0.87% and -0.24%, respectively, while currencies were up +0.42%.
At the end of September 2017, the Hedge Strategy held positions in currency futures that represented a negative beta of about -0.06 versus the S&P 500® Index, while fixed income futures positions represented a negative beta of about -0.01. Equity index futures had small positive beta of about 0.04. Overall, the hedge was positioned with a negative beta of about -0.04 with respect to the S&P 500® Index, less defensive than the prior quarter’s beta of -0.11.
Politics continued to dominate the news headlines in July, although the actual effects of the news on most markets were relatively muted. The failure of “Repeal and Replace Obamacare” and continuing commotion in the White House weighed on the US Dollar. Meanwhile, in the UK, neither the Government nor the opposition seemed to elucidate what exactly Brexit means or implies. Saber-rattling over North Korea’s missile tests and chatter about reneging on the Iran deal added even more fuel to the fire.
Volatility returned to the markets during August, putting downward pressure on equity markets and the US dollar, and providing a boost to bonds and gold. Geopolitical tensions continued, culminating in a North Korean missile launch over Japan. In the US, the threat of a government shutdown loomed, and Hurricane Harvey stirred up volatility in energy and agricultural markets. Further downward pressure on the US dollar came from the Fed, whose Board appeared to be divided in its views on inflation. Comments by Federal Reserve Chair Janet Yellen at Jackson Hole seemed to confirm that the Fed would be slow to raise rates.
September turned out to be a “risk-on” month, as stocks rallied and bonds sold off. Oil prices continued their recent turnaround, rallying strongly during the month over fears of a supply gap. Sterling rallied after the Bank of England issued its strongest guidance in a decade that it is poised to raise rates, while Moody’s downgraded the UK’s credit rating, citing the challenges of Brexit. In Germany, Chancellor Angela Merkel won a fourth term, albeit with a reduced majority, while Japan’s Prime Minister Shinzo Abe became the latest leader to call a snap election based on favorable poll ratings.
For the second quarter in a row, the VIX® Index remained in an extremely narrow corridor (between about 9.4% and 12.5%), except for five days during August when it spiked briefly into the 13% -16% range. The 9.36% reading on July 21 was an all-time low, and there were 17 days on which the Index closed below 10%, out numbering the previous 16 such days that had been recorded since the index’s inception in 1990.
Q4 2017
The Fund was up +5.46% for the quarter. The long Equity Strategy was up (+5.94%), while the Hedge Strategy had a small negative contribution of -0.61%. The Fund’s fixed-income investments contributed +0.13%. For the second quarter in a row,
| 47 Hulfish Street, Suite 510, Princeton, NJ 08542 ● T 609.430.0404 ● F 609.454.5010 ● www.equinoxfunds.com |
the hedge lost some ground during a strong period of performance for equities. For the sixth quarter in a row, the contribution from interest rates was negative (-0.30%). Currencies were down even more (-0.57%), while equity indices contributed +0.26%.
At the end of December, the Hedge Strategy held positions in currency futures that represented a negative beta of about -0.11 versus the S&P 500® Index, while fixed income futures positions represented a negative beta of about -0.03. Equity index futures continued to have small positive beta, about 0.03. Overall, the hedge was positioned with a negative beta of about -0.11 with respect to the S&P 500® Index, more defensive than last quarter’s beta of -0.04.
It was another quarter dominated alternately by headlines out of Washington DC, natural disasters, geopolitical tensions, and … the seemingly endless rally in global stock markets. The passage of President Trump’s administration’s first major piece of legislation ended an eventful year, but the equity rally continued into 2018. There was some acceleration in economic growth, driven mainly by low interest rates and increased optimism about corporate taxes, even as some pundits wondered about its sustainability.
2017 was the ninth year of the stock market rally that began in 2009; this represented 105 months of positive returns for a balanced stock-bond portfolio, the previous record for which had been only about four years. Although they appeared to be in the minority, some of the global macro managers to whom we allocate were making the case that we may be nearing the end. They believed that central bank tapering, less liquidity, and higher rates would soon see markets jolted out of the surely low volatility (at least, as measured by the VIX) that had prevailed. They predicted that nominal asset returns would fall, and real returns could fall even more if inflation were to return and central banks scrambled into combat. The “bubble” that had been created by central bank support and exacerbated by growing investor complacency was expected to inevitably pop, they contended.
These concerns were certainly not reflected by the VIX® Index, which once again remained in an extremely narrow corridor (between about 9.14% and 11.8%), except for one day when it spiked briefly to just over 13%. The 9.14% reading was another all-time low.
Q1 2018
The Fund was down -0.38% for the quarter. The long Equity Strategy was down (-1.93%), while the Hedge Strategy had a positive contribution of +1.37%. The Fund’s fixed-income investments contributed +0.18%. We were pleased to see that the hedge more than made up for the negative performance of equities. After six quarters in a row, the contribution from interest rates finally turned positive (+0.53%). Currencies had their strongest quarter in quite a while (+1.47%), while equity indices contributed negatively (-0.63%).
| 47 Hulfish Street, Suite 510, Princeton, NJ 08542 ● T 609.430.0404 ● F 609.454.5010 ● www.equinoxfunds.com |
At the end of March, the Hedge Strategy held positions in currency futures that represented a beta of about zero versus the S&P 500® Index, while fixed income futures positions represented a negative beta of about -0.02. The beta of equity index futures flipped from being slightly positive last quarter to -0.20. Overall, the hedge was positioned with a negative beta of about -0.22 with respect to the S&P 500® Index, much more defensive than last quarter’s beta of -0.11.
The year began on a strong note for equities. US Markets rallied to record levels, with the Nasdaq breaking through 7000, driven by the expanding US economy, growth in corporate profits, and enthusiasm over recently enacted tax-cuts and other business-friendly policies. However, there was some pullback and higher volatility in the final few days of the month, portending perhaps the events that were to come in February. The US dollar sold off, posting its worst January in over a decade and closing at a three-year low following Treasury Secretary Mnuchin’s comments in Davos about “a weaker dollar being good for trade,” which represented a dramatic and unexpected departure from the traditional position long espoused by the US. Meanwhile, increased demand drove oil markets higher, while bonds declined, reflecting a return to a broad “risk-on” climate. The Fund had one of its best months in a long while.
February turned out to be a completely different ball-game. It began with an unexpected rise in US hourly earnings and strong employment numbers, which immediately ignited inflationary fears. This started the dominoes falling: equities lost 10% in a week, with the VIX hitting an intra-day high of 50%. We saw most CTA programs were caught with substantially long equity positions, boosted by the abnormally low equity market volatility that prevailed during the trailing months. Finally, the equity correction was unexpected and was not preceded by the warning of an increase in volatility, as has often historically been the case. Bonds, generally the normal asset of choice during a “risk-off” scenario, did rally slightly, but were judged to be less attractive than usual due to the inflationary jitters that had just been triggered.
Markets continued to be volatile during March. Tech stocks led markets lower following the revelation of Facebook’s data problems and President Trump’s administration’s comments on Amazon. The probability of a trade war between the U.S. and China seemed to increase as threats of tariffs were exchanged. The Fed announced another quarter-point rate hike to 1.50%–1.75% and policy makers shifted views in favor of further rate increases. The Bank of Japan announced no change in its commitment to an accommodative monetary policy. The European Central Bank also kept its policy steady, as expected. In the midst of all these developments, the month turned out to be far less turbulent than February, and the Fund ended the quarter on a positive note.
As alluded to, the impending market turmoil of February was not foreseen by the VIX® during almost the entire month of January, when the index continued to display the range-bound behavior it had shown during 2017 (fluctuating narrowly between about 9% and 12%). The last three days of the month saw a slight increase, but the sharp spike to
| 47 Hulfish Street, Suite 510, Princeton, NJ 08542 ● T 609.430.0404 ● F 609.454.5010 ● www.equinoxfunds.com |
over 37% on February 5 came as quite a shock. Volatility returned to the market with a vengeance; the rest of the quarter saw the VIX® range between about 15% and 30%. It ended the quarter at about 20%, almost twice its December 31 level.
Q2 2018
The Fund was up +1.44% for the quarter. The long Equity Strategy was up (+2.73%), while the Hedge Strategy had a significant negative contribution (-1.54%). The Fund’s fixed-income investments contributed +0.25%. This was, unfortunately, a quarter during which the hedge detracted quite a bit from the strong performance of equities. All three sectors contributed negatively to performance, with equities the biggest culprit (-1.17%), while interest rates (-0.29%) and currencies (-0.08%) did less damage.
At the end of June, the Hedge Strategy held positions in currency futures that represented a beta of about -0.07 versus the S&P 500® Index, while fixed income futures positions represented a negative beta of about -0.04. The beta of equity index futures stayed negative at -0.16. Overall, the hedge was positioned with a negative beta of about -0.27 with respect to the S&P 500® Index, more defensive than last quarter’s beta of -0.22.
Initially in April, trade tensions escalated, with the White House announcing additional tariffs on China. However, these concerns later eased, and stock markets recovered, boosted by strong earnings in the US, the ECB’s decision to maintain stimulus for the time being, and the Bank of England’s dovish tone. In fixed income, the yield on the US 10Y Treasury rose above 3% for the first time since 2014. Meanwhile, geopolitical tensions in the Middle East caused mostly by military action in Syria and the prospect of reinstated Iranian sanctions pushed oil prices higher.
May was dominated by mounting fears about political instability in Italy, which caused Italian bond yields to rise sharply towards the end of the month. Strong US economic data initially caused Treasury yields to rise further, before unexpectedly dovish rhetoric from the Federal Reserve later in the month saw them subside. Ongoing trade tensions between the US and China, together with President Trump’s administration’s decision to cancel his North Korea meeting, shook stock markets, while his reneging on the Iranian nuclear deal sent energy markets to multi-year highs.
During June, markets retained their focus on global trade concerns. The heated rhetoric between the US and its key trade partners, especially China, finally took equities into bear market territory. Continuing tensions rattled financial markets ahead of the G7 summit early in the month, and news of global trade tariffs continued to sour market sentiment. Central bank policy divergence was a key theme as the Federal Reserve announced a rate hike and adopted a generally more hawkish stance, while the European Central Bank announced plans to delay rate hikes.
| 47 Hulfish Street, Suite 510, Princeton, NJ 08542 ● T 609.430.0404 ● F 609.454.5010 ● www.equinoxfunds.com |
The VIX® index finally appeared to take notice of the global geopolitical turmoil this quarter. Starting at about 20%, the index hovered above that mark for the first few days of the quarter before settling down into a range between 12% and 18%, still significantly higher than the norm for the several previous quarters. However, the current values are much more typical of the US stock market’s longer-term average volatility of around 15%.
The basic Ampersand concept is that a potentially superior diversified investment portfolio can be built by adding an overlay of diversifiers and hedges on top of a core portfolio rather than by subtracting, or selling, core holdings in order to achieve this type of diversification. We call this the “Power of AND,” and hence the name Ampersand. We believe that the Fund’s strategy, which leverages the “Power of AND,” offers investors an interesting alternative to traditional long or long-short equity strategies. The combination of diversifying and dynamic hedging strategies in the form of an overlay seeks to provide the potential to gain meaningful and strategic diversification without the need to reduce core equity exposure. We believe this may provide investors the potential to earn higher risk-adjusted equity-like returns over full market cycles.
DEFINITIONS OF TERMS
Alpha is a measure of performance on a risk-adjusted basis. Alpha takes the volatility (price risk) of a fund and compares its risk-adjusted performance to a benchmark index. The excess return of the fund relative to the return of the benchmark index is a fund’s alpha.
Beta is a measure of the volatility, or systematic risk, of a security or a portfolio in comparison to the market as a whole. A beta of 1 indicates that the security’s return will move with the market. A beta of less than 1 means that the security’s return will be less volatile than the market. A beta of greater than 1 indicates that the security’s return will be more volatile than the market. For example, if a stock’s beta is 1.2, it’s return is theoretically 20% more volatile than the market’s return.
Brexit is an abbreviation of “British exit,” which refers to the June 23, 2016 referendum by British voters to exit the European Union. The referendum roiled global markets, including currencies, causing the British pound to fall to its lowest level in decades. Prime Minister David Cameron, who supported the UK remaining in the EU announced he would step down in October.
Equinox’s DyVoT™ methodology seeks to adjust the volatility target dynamically based on market conditions, using a proprietary statistical technology. DyVoT™ allows the exposure range for the portfolio to vary, depending on market conditions: it seeks to increase the exposure when market conditions are conducive for the strategy, and to decrease the exposure during adverse market climates, potentially resulting in higher risk-adjusted returns and lower drawdowns in the long-term. There is no guarantee that the objectives of the DyVoT™ methodology will be achieved.
Commodity Trading Advisors (CTA) provide advice and services related to trading in futures contracts. They are responsible for the trading within managed futures accounts.
Gilts are bonds that are issued by the British government, and they are generally considered low-risk investments.
Gross Domestic Product (GDP) is the monetary value of all the finished goods and services produced within a country’s borders in a specific time period.
| 47 Hulfish Street, Suite 510, Princeton, NJ 08542 ● T 609.430.0404 ● F 609.454.5010 ● www.equinoxfunds.com |
The HFRX Equity Hedge Index encompasses various equity hedge strategies, also known as long/short equity, that combine core long holdings of equities with short sales of stock, stock indices, related derivatives, or other financial instruments related to the equity markets.
Long-short equity is an investing strategy of taking long positions in stocks that are expected to appreciate and short positions in stocks that are expected to decline. A long/short equity strategy seeks to minimize market exposure, while profiting from stock gains in the long positions and price declines in the short positions.
The National Association of Securities Dealers Automated Quotations (NASDAQ) is a global electronic marketplace for buying and selling securities, as well as the benchmark index for US technology stocks.
Quantitative Easing (QE) is the introduction of new money into the money supply by a central bank.
The S&P500 Total Return Index®is widely regarded as the best single gauge of the U.S. equities market. This world-renowned Index includes 500 leading companies in leading industries of the U.S. economy.
The VIX® Index (VIX) is a forward-looking measure of equity market volatility. Since its introduction, the VIX is considered by many to be the world’s premier barometer of investor sentiment and market volatility.
Investors cannot directly invest in an index and unmanaged index returns do not reflect any fees, expenses or sales charges.
IMPORTANT RISK DISCLOSURES
Mutual funds involve risk including possible loss of principal. There is no assurance that the Fund will achieve its investment objective.
Exposure to the commodities markets may subject the Fund to greater volatility than investments in traditional securities. Many of the derivative contracts entered into by the Fund, the Subsidiary or a trading company will be privately negotiated in the OTC market. These contracts also involve exposure to credit risk, since contract performance depends in part on the financial condition of the counterparty. Credit risk refers to the possibility that the issuer of the security will not be able to make principal and interest payments when due.
Currency rates in foreign countries may fluctuate significantly over short periods of time for a number of reasons, including changes in interest rates and the imposition of currency controls or other political developments in the US or abroad. Derivative instruments come in many varieties and have a wide range of potential risks and rewards, and may include futures contracts, options on futures contracts, options, swaps, and forward currency exchange contracts. Derivatives typically have economic leverage inherent in their terms. The use of leverage tends to exaggerate the effect of any increase or decrease in the value of the Fund’s portfolio securities or other investments. Furthermore, derivative instruments and futures contracts are highly volatile and are subject to occasional rapid and substantial fluctuations. Investments in foreign securities could subject the Fund to greater risks including, currency fluctuation, economic conditions, and different governmental and accounting standards. Derivative instruments and futures contracts are highly volatile and are subject to occasional rapid and substantial fluctuations.
Investors should carefully consider the investment objectives, risks, charges and expenses of Equinox Ampersand Strategy Fund. This and other important information about the Fund
| 47 Hulfish Street, Suite 510, Princeton, NJ 08542 ● T 609.430.0404 ● F 609.454.5010 ● www.equinoxfunds.com |
is contained in the Prospectus, which can be obtained by calling 1.888.643.3431. The Prospectus should be read carefully before investing.
Equinox Ampersand Strategy Fund is distributed by Northern Lights Distributors, LLC, Member FINRA/SIPC.
Equinox Institutional Asset Management, LP, Equinox Group Distributors, LLC and Quest Partners, LLC are not affiliated with Northern Lights Distributors, LLC.
3781-NLD-8/9/2018
| 47 Hulfish Street, Suite 510, Princeton, NJ 08542 ● T 609.430.0404 ● F 609.454.5010 ● www.equinoxfunds.com |
| Equinox Ampersand Strategy Fund |
| PORTFOLIO REVIEW (Unaudited) |
| June 30, 2018 |
| |
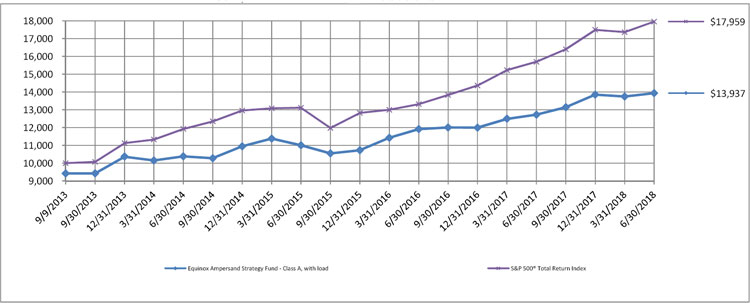
The Fund’s performance figures* for the periods ended June 30, 2018, as compared to its benchmark:
| | | Annualized |
| | | | Start of Performance **- |
| | One Year | Three Year | June 30, 2018 |
| Equinox Ampersand Strategy Fund | | | |
| Class A with Load | 3.22% | 6.04% | 7.15% |
| Class A | 9.50% | 8.17% | 8.48% |
| Class I | 10.15% | 8.54% | 8.80% |
| S&P 500® Total Return Index *** | 14.37% | 11.93% | 12.96% |
| | | | |
| * | The performance data quoted is historical. The performance comparison includes reinvestment of all dividends and capital gains and has been adjusted for Class A maximum applicable sales charge of 5.75%. Past performance is no guarantee of future results. Current performance may be higher or lower than the performance data quoted. The principal value and investment return of an investment will fluctuate so that your shares, when redeemed, may be worth more or less than their original cost. The returns shown in the table do not reflect the deduction of taxes that a shareholder would pay on Portfolio distributions or on the redemptions of Portfolio shares. Performance figures for periods greater than one year are annualized. Performance figures would have been lower had Equinox Institutional Asset Management, LP (the “Adviser”) not waived its fees or reimbursed a portion of the Fund’s expenses pursuant to an expense limitation agreement. Under the terms of the expense limitation agreement, the Adviser has contractually agreed to reduce its Advisory fee and/or reimburse certain expenses of the Fund, to ensure that the Fund’s total annual operating expenses, excluding (i) taxes, (ii) interest, (iii) extraordinary items, (iv) “Acquired Fund Fees and Expenses,” and (v) brokerage commissions, do not exceed, on an annual basis, 1.24% and 0.99% of the Fund’s average daily net assets for Class A and Class I shares, respectively. This expense limitation will remain in effect until October 31, 2019 but can be terminated by the Fund’s Board of Trustees on 60 days’ written notice to the Adviser. The Adviser shall be entitled to recover, subject to approval by the Board of Trustees of the Trust, such waived or reimbursed amounts for a period of up to three (3) years from the date on which the Adviser reduced its compensation and/or assumed expenses for the Fund. The Adviser is permitted to seek reimbursement for the Fund, subject to certain limitations, for fees it waived and Fund expenses it paid to the extent the total annual fund operating expenses do not exceed the limits described above or any lesser limits in effect at the time of reimbursement. No recoupment by the Adviser will occur unless the Fund’s operating expenses are below the expense limitation amount. The Fund’s “total annual fund operating expenses” and “total annual fund operating expenses after fee waiver and/or expense reimbursement,” respectively, are 3.17% and 1.24% for Class A shares and 2.91% and 0.99% for Class I Shares per the November 1, 2017 prospectus, as supplemented on June 29, 2018. More recent expense ratio information is available in the Consolidated Financial Highlights included in this report. For performance information current to the most recent month-end please call 1-888-643-3431. |
| ** | Start of performance is September 9, 2013. |
| *** | The S&P 500® Total Return Index is a widely accepted, unmanaged index of U.S. stock market performance which does not take into account charges, fees and other expenses. It is not possible to invest directly in an index. |
Comparison of the Change in Value of a $10,000 Investment
| Equinox Ampersand Strategy Fund |
| PORTFOLIO REVIEW (Unaudited)(Continued) |
| June 30, 2018 |
| |
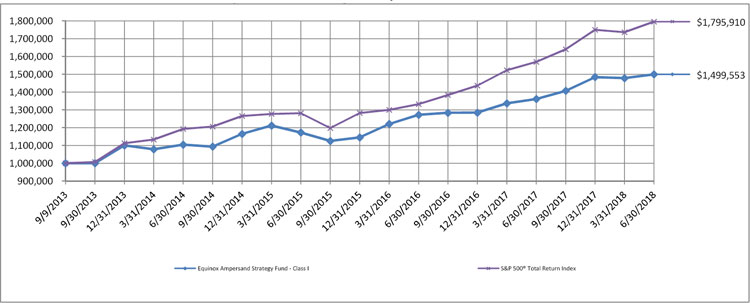
Comparison of the Change in Value of a $1,000,000 Investment
| Portfolio Composition | | % of Net Assets | |
| U.S. Treasury Notes | | | 46.6 | % |
| Other assets and liabilities - net * | | | 53.4 | % |
| | | | 100.0 | % |
| | | | | |
| * | Includes net unrealized depreciation on swap contract and long futures contracts. |
Please refer to the Consolidated Portfolio of Investments in this annual report for a detailed analysis of the Fund’s holdings.
| Equinox Ampersand Strategy Fund |
| CONSOLIDATED PORTFOLIO OF INVESTMENTS |
| June 30, 2018 |
| Principal | | | | | Coupon | | | | | | |
| Amount | | | | | Rate % | | | Maturity Date | | Fair Value | |
| | | | | U.S. TREASURY NOTES - 46.6% | | | | | | | | | | |
| $ | 1,800,000 | | | United States Treasury Note | | | 1.250 | | | 11/30/2018 | | $ | 1,793,883 | |
| | 750,000 | | | United States Treasury Note | | | 1.250 | | | 1/31/2020 | | | 735,747 | |
| | 750,000 | | | United States Treasury Note | | | 1.500 | | | 2/28/2019 | | | 746,382 | |
| | 750,000 | | | United States Treasury Note | | | 1.500 | | | 10/31/2019 | | | 740,786 | |
| | 750,000 | | | United States Treasury Note | | | 1.500 | | | 4/15/2020 | | | 736,758 | |
| | 750,000 | | | United States Treasury Note | | | 1.625 | | | 7/31/2019 | | | 743,921 | |
| | | | | TOTAL U.S. TREASURY NOTES (Cost - $5,501,307) | | | | | | 5,497,477 | |
| | | | | | | | | | | | | | | |
| | | | | TOTAL INVESTMENTS - 46.6% (Cost - $5,501,307) | | | | $ | 5,497,477 | |
| | | | | OTHER ASSETS AND LIABILITIES - NET - 53.4% | | | | | 6,289,619 | |
| | | | | TOTAL NET ASSETS - 100.0% | | | | | | | | $ | 11,787,096 | |
| | | | | | | | | | | | | | | |
See accompanying notes to consolidated financial statements.
| Equinox Ampersand Strategy Fund |
| CONSOLIDATED PORTFOLIO OF INVESTMENTS (Continued) |
| June 30, 2018 |
| LONG FUTURES CONTRACTS | |
| | |
| Number of | | | | | | | | | Notional Value at | | | Unrealized | |
| Contracts | | | Description | | Counterparty | | Expiration Date | | June 30, 2018 | | | Depreciation | |
| | 89 | | | S&P 500 E-Mini Future | | Morgan Stanley | | Sep-18 | | $ | 12,111,120 | | | $ | (242,080 | ) |
| SWAP CONTRACTS | |
| | |
| Notional Value at | | | | | | | | | | | Unrealized | |
| June 30, 2018 | | | Total Return Swap | | Counterparty | | Fixed Rate Paid | | Termination Date | | Depreciation | |
| | | | | | | | | | | | | | | |
| | 6,790,000 | | | Quest Dynamic Financial Hedge Program | | Deutsche Bank | | 0.35% of the notional value | | 7/8/2020 | | $ | (409,571 | ) |
| | | | | Total Net Unrealized Depreciation on Swap Contract | | $ | (409,571 | ) |
| Total Return Swap Holdings ^ |
| |
| FUTURES CONTRACTS |
| | | | | | | | | | | | | Unrealized | |
| Number of | | | | | | | | | Notional Value at | | | Appreciation/ | |
| Contracts | | | Description | | Counterparty | | Expiration Date | | June 30, 2018 | | | (Depreciation) | |
| SHORT CONTRACTS | | | | | | | |
| | 9 | | | AUD/USD | | Deutsche Bank | | Sep-18 | | | 665,280 | | | $ | 10,693 | |
| | 1 | | | CAC 40 | | Deutsche Bank | | Jul-18 | | | 62,293 | | | | 846 | |
| | 8 | | | CAD/USD | | Deutsche Bank | | Sep-18 | | | 608,240 | | | | 1,760 | |
| | 4 | | | CHF/USD | | Deutsche Bank | | Sep-18 | | | 506,650 | | | | 750 | |
| | 1 | | | DAX Index Future | | Deutsche Bank | | Sep-18 | | | 359,226 | | | | (2,756 | ) |
| | 5 | | | EUR/JPY | | Deutsche Bank | | Sep-18 | | | 729,622 | | | | (959 | ) |
| | 14 | | | EUR/USD | | Deutsche Bank | | Sep-18 | | | 2,053,275 | | | | 3,413 | |
| | 4 | | | EURO STOXX 50 Index Future | | Deutsche Bank | | Sep-18 | | | 158,431 | | | | (128 | ) |
| | 20 | | | FTSE China A50 Index Future | | Deutsche Bank | | Jul-18 | | | 230,000 | | | | 4,801 | |
| | 1 | | | FTSE MIB Index Future | | Deutsche Bank | | Sep-18 | | | 125,969 | | | | (1,662 | ) |
| | 8 | | | GBP/USD | | Deutsche Bank | | Sep-18 | | | 662,000 | | | | 8,852 | |
| | 3 | | | Hang Seng Index | | Deutsche Bank | | Jul-18 | | | 548,100 | | | | (2,136 | ) |
| | 5 | | | H-Shares Index | | Deutsche Bank | | Jul-18 | | | 345,964 | | | | 3,736 | |
| | 2 | | | IBEX-35 Future | | Deutsche Bank | | Jul-18 | | | 224,137 | | | | 1,884 | |
| | 6 | | | MSCI Taiwan Index Future | | Deutsche Bank | | Jul-18 | | | 232,680 | | | | (1,620 | ) |
| | 18 | | | MXN/USD | | Deutsche Bank | | Sep-18 | | | 452,970 | | | | (21,961 | ) |
| | 1 | | | TOPIX Future | | Deutsche Bank | | Sep-18 | | | 155,984 | | | | 90 | |
| | | | | | | | | | | | | | | | | |
| LONG CONTRACTS | | | | | | | |
| | 23 | | | 10 year Australian Treasury Bond Future | | Deutsche Bank | | Sep-18 | | | 16,883,876 | | | | 13,315 | |
| | 5 | | | 10 year Canadian Govt Bond Future | | Deutsche Bank | | Sep-18 | | | 519,437 | | | | 311 | |
| | 14 | | | 10 year Japanese Government Bond Future | | Deutsche Bank | | Sep-18 | | | 19,052,731 | | | | 16,238 | |
| | 5 | | | 10 year US Treasury Notes Future | | Deutsche Bank | | Sep-18 | | | 600,781 | | | | 828 | |
| | 49 | | | 3 month Euro (EURIBOR) | | Deutsche Bank | | Jun-20 | | | 14,287,890 | | | | (685 | ) |
| | 20 | | | 3 month Sterling | | Deutsche Bank | | Jun-20 | | | 3,258,382 | | | | (330 | ) |
| | 24 | | | 3 year Australian Treasury Bond Future | | Deutsche Bank | | Sep-18 | | | 5,362,978 | | | | 2,874 | |
| | 8 | | | 5 year US Treasury Notes Future | | Deutsche Bank | | Sep-18 | | | 908,625 | | | | (344 | ) |
| | 67 | | | 90 Day Bank Accepted Bill Future | | Deutsche Bank | | Jun-19 | | | 11,836,343 | | | | 7,108 | |
| | 1 | | | AEX Index Future | | Deutsche Bank | | Jul-18 | | | 129,142 | | | | (2,421 | ) |
| | 1 | | | E-Mini Nasdaq-100 | | Deutsche Bank | | Sep-18 | | | 142,225 | | | | (2,311 | ) |
| | 1 | | | E-Mini S&P 500 | | Deutsche Bank | | Sep-18 | | | 137,150 | | | | 775 | |
| | 5 | | | EUR/GBP | | Deutsche Bank | | Sep-18 | | | 730,934 | | | | 4,693 | |
| | 4 | | | Euro-BOBL Future | | Deutsche Bank | | Sep-18 | | | 616,785 | | | | 2,053 | |
| | 7 | | | Euro-BUND Future | | Deutsche Bank | | Sep-18 | | | 1,327,473 | | | | 9,088 | |
| | 36 | | | Eurodollar | | Deutsche Bank | | Jun-21 | | | 8,732,250 | | | | (3,326 | ) |
| | 21 | | | Three Month Canadian Bankers Acceptance Future | | Deutsche Bank | | Jun-19 | | | 3,892,757 | | | | (2,392 | ) |
| | | | | | | | | | | | | | | | | |
| ^ | These investments are not direct holdings of Equinox Ampersand Strategy Fund. The holdings were determined based on the absolute notional values of the positions within the underlying swap basket. |
See accompanying notes to consolidated financial statements.
| Equinox Ampersand Strategy Fund |
| CONSOLIDATED STATEMENT OF ASSETS AND LIABILITIES |
| June 30, 2018 |
| ASSETS | | | | |
| Investment securities: | | | | |
| At cost | | $ | 5,501,307 | |
| At fair value | | $ | 5,497,477 | |
| Cash | | | 1,533,313 | |
| Swap margin balance * | | | 4,622,457 | |
| Deposits for future contracts ** | | | 849,537 | |
| Receivable due from Adviser | | | 52,732 | |
| Interest receivable | | | 18,923 | |
| Prepaid expenses and other assets | | | 66,987 | |
| TOTAL ASSETS | | | 12,641,426 | |
| | | | | |
| LIABILITIES | | | | |
| Unrealized depreciation on futures contracts | | | 242,080 | |
| Unrealized depreciation on swap contract | | | 409,571 | |
| Due to Broker - Swap contract | | | 163,102 | |
| Payable for fund shares redeemed | | | 728 | |
| Distribution (12b-1) fees payable | | | 802 | |
| Payable to related parties | | | 1,861 | |
| Accrued legal fee | | | 11,659 | |
| Accrued audit fee | | | 23,118 | |
| Accrued expenses and other liabilities | | | 1,409 | |
| TOTAL LIABILITIES | | | 854,330 | |
| NET ASSETS | | $ | 11,787,096 | |
| | | | | |
| Net Assets Consist Of: | | | | |
| Paid in capital | | $ | 11,461,300 | |
| Undistributed net investment income | | | 372,725 | |
| Accumulated net realized gain from investments, futures contracts, and swap contract | | | 608,552 | |
| Net unrealized depreciation of investments, futures contracts, and swap contract | | | (655,481 | ) |
| NET ASSETS | | $ | 11,787,096 | |
| | | | | |
| * | Pledged as collateral for swap agreement. |
| ** | Pledged as collateral for futures contracts. |
See accompanying notes to consolidated financial statements.
| Equinox Ampersand Strategy Fund |
| CONSOLIDATED STATEMENT OF ASSETS AND LIABILITIES (Continued) |
| June 30, 2018 |
| Net Asset Value Per Share: | | | | |
| Class A Shares: | | | | |
| Net Assets | | $ | 4,029,010 | |
| Shares of beneficial interest outstanding ($0 par value, unlimited shares authorized) | | | 386,711 | |
| Net asset value (Net Assets ÷ Shares Outstanding) and redemption price per share (a)(b) | | $ | 10.42 | |
| Maximum offering price per share (maximum sales charges of 5.75%) | | $ | 11.06 | |
| | | | | |
| Class I Shares: | | | | |
| Net Assets | | $ | 7,758,086 | |
| Shares of beneficial interest outstanding ($0 par value, unlimited shares authorized) | | | 734,714 | |
| Net asset value (Net Assets ÷ Shares Outstanding), offering price and redemption price per share (b) | | $ | 10.56 | |
| | | | | |
| (a) | On investments of $1 million or more, the maximum sales charge will not apply. Instead, the investment may be subject to a 1.00% contingent deferred sales charge. |
| (b) | Redemptions made within 30 days of purchase may be assessed a redemption fee of 1%. |
See accompanying notes to consolidated financial statements.
| Equinox Ampersand Strategy Fund |
| CONSOLIDATED STATEMENT OF OPERATIONS |
| Year Ended June 30, 2018 |
| INVESTMENT INCOME | | | | |
| Interest | | $ | 81,290 | |
| | | | | |
| EXPENSES | | | | |
| Investment advisory fees | | | 98,198 | |
| Distribution (12b-1) fees | | | | |
| Class A | | | 10,799 | |
| Class C | | | 1,411 | |
| Legal fees | | | 108,733 | |
| Registration fees | | | 40,971 | |
| Audit fees | | | 20,229 | |
| Accounting services fees | | | 7,430 | |
| Transfer agent fees | | | 19,934 | |
| Compliance officer fees | | | 5,509 | |
| Custodian fees | | | 4,741 | |
| Administrative services fees | | | 8,200 | |
| Insurance expense | | | 2,722 | |
| Printing and postage expenses | | | 18,657 | |
| Trustees fees and expenses | | | 2,062 | |
| Shareholder Service Fees | | | 890 | |
| Other expenses | | | 2,412 | |
| TOTAL EXPENSES | | | 352,898 | |
| | | | | |
| Less: Fees waived and expenses reimbursed by the Adviser | | | (211,146 | ) |
| Less: Fees waived by the Administrator | | | (3,255 | ) |
| | | | | |
| NET EXPENSES | | | 138,497 | |
| NET INVESTMENT LOSS | | | (57,207 | ) |
| | | | | |
| REALIZED AND UNREALIZED GAIN/(LOSS) ON INVESTMENTS | | | | |
| Net realized gain/(loss) on: | | | | |
| Investments | | | (3,278 | ) |
| Futures contracts | | | 1,161,798 | |
| Futures commissions | | | (1,957 | ) |
| Swap contract | | | (120,284 | ) |
| | | | 1,036,279 | |
| Net change in unrealized appreciation/(depreciation) on: | | | | |
| Investments | | | 372 | |
| Futures contracts | | | (221,437 | ) |
| Swap contract | | | (132,075 | ) |
| | | | (353,140 | ) |
| | | | | |
| NET REALIZED AND UNREALIZED GAIN ON INVESTMENTS | | | 683,139 | |
| | | | | |
| NET INCREASE IN NET ASSETS RESULTING FROM OPERATIONS | | $ | 625,932 | |
| | | | | |
See accompanying notes to consolidated financial statements.
| Equinox Ampersand Strategy Fund |
| CONSOLIDATED STATEMENTS OF CHANGES IN NET ASSETS |
| | | For the Year Ended | | | For the Year Ended | |
| | | June 30, | | | June 30, | |
| | | 2018 | | | 2017 | |
| FROM OPERATIONS | | | | | | | | |
| Net investment loss | | $ | (57,207 | ) | | $ | (63,312 | ) |
| Net realized gain on investments, futures contracts and swap contract | | | 1,036,279 | | | | 1,002,159 | |
| Net change in unrealized appreciation/(depreciation) on Investments futures contracts and swap contract | | | (353,140 | ) | | | (513,221 | ) |
| Net increase in net assets resulting from operations | | | 625,932 | | | | 425,626 | |
| | | | | | | | | |
| DISTRIBUTIONS TO SHAREHOLDERS | | | | | | | | |
| From net Investment Income | | | | | | | | |
| Class A | | | — | | | | (102,357 | ) |
| Class C (a) | | | — | | | | (181 | ) |
| Class I | | | — | | | | (65,609 | ) |
| | | | — | | | | (168,147 | ) |
| From net realized gains | | | | | | | | |
| Class A | | | (371,278 | ) | | | (100,673 | ) |
| Class C (a) | | | (17,418 | ) | | | (204 | ) |
| Class I | | | (480,045 | ) | | | (58,654 | ) |
| | | | (868,741 | ) | | | (159,531 | ) |
| FROM SHARES OF BENEFICIAL INTEREST | | | | | | | | |
| Proceeds from shares sold: | | | | | | | | |
| Class A | | | 633,804 | | | | 236,011 | |
| Class C (a) | | | 86,450 | | | | 100,588 | |
| Class I | | | 8,947,043 | | | | 1,250,769 | |
| Net asset value of shares issued in reinvestment of distributions: | | | | | | | | |
| Class A | | | 357,134 | | | | 199,594 | |
| Class C (a) | | | 17,418 | | | | 385 | |
| Class I | | | 468,692 | | | | 124,263 | |
| Redemption fee proceeds: | | | | | | | | |
| Class A | | | 235 | | | | 1,045 | |
| Class C (a) | | | 91 | | | | — | |
| Class I | | | 21,175 | | | | — | |
| Payments for shares redeemed: | | | | | | | | |
| Class A | | | (1,087,696 | ) | | | (376,208 | ) |
| Class C (a) | | | (202,011 | ) | | | — | |
| Class I | | | (3,874,795 | ) | | | (597,214 | ) |
| Net increase in net assets from shares of beneficial interest | | | 5,367,540 | | | | 939,233 | |
| | | | | | | | | |
| TOTAL INCREASE IN NET ASSETS | | | 5,124,731 | | | | 1,037,181 | |
| | | | | | | | | |
| NET ASSETS | | | | | | | | |
| Beginning of Period | | | 6,662,365 | | | | 5,625,184 | |
| End of Period* | | $ | 11,787,096 | | | $ | 6,662,365 | |
| * Includes accumulated net investment income of: | | $ | 372,725 | | | $ | 35,064 | |
| | | | | | | | | |
| (a) | Effective April 9, 2018, all outstanding Class C shares were converted to Class A shares. |
See accompanying notes to consolidated financial statements.
| Equinox Ampersand Strategy Fund |
| CONSOLIDATED STATEMENT OF CHANGES IN NET ASSETS (Continued) |
| | | For the Year Ended | | | For the Year Ended | |
| | | June 30, | | | June 30, | |
| | | 2018 | | | 2017 | |
| SHARE ACTIVITY | | | | | | | | |
| Class A: | | | | | | | | |
| Shares Sold | | | 59,921 | | | | 23,127 | |
| Shares Reinvested | | | 34,572 | | | | 20,161 | |
| Shares Redeemed | | | (103,387 | ) | | | (36,651 | ) |
| Net increase/(decrease) in shares of beneficial interest outstanding | | | (8,894 | ) | | | 6,637 | |
| | | | | | | | | |
| | | | | | | | | |
| Class C: (a) | | | | | | | | |
| Shares Sold | | | 8,426 | | | | 10,239 | |
| Shares Reinvested | | | 1,754 | | | | 40 | |
| Shares Redeemed | | | (20,762 | ) | | | — | |
| Net increase/(decrease) in shares of beneficial interest outstanding | | | (10,582 | ) | | | 10,279 | |
| | | | | | | | | |
| Class I: | | | | | | | | |
| Shares Sold | | | 827,853 | | | | 120,735 | |
| Shares Reinvested | | | 44,980 | | | | 12,466 | |
| Shares Redeemed | | | (373,760 | ) | | | (58,046 | ) |
| Net increase in shares of beneficial interest outstanding | | | 499,073 | | | | 75,155 | |
| | | | | | | | | |
| (a) | Effective April 9, 2018, all outstanding Class C shares were converted to Class A shares. |
See accompanying notes to consolidated financial statements.
| Equinox Ampersand Strategy Fund |
| CONSOLIDATED FINANCIAL HIGHLIGHTS |
| |
| Per Share Data and Ratios for a Share of Beneficial Interest Outstanding Throughout Each Period |
| | | Class A | |
| | | For the
Year Ended | | | For the
Year Ended | | | For the
Year Ended | | | For the
Year Ended | | | For the
Period Ended | |
| | | June 30, | | | June 30, | | | June 30, | | | June 30, | | | June 30, | |
| | | 2018 | | | 2017 | | | 2016 | | | 2015 | | | 2014 (1) | |
| Net asset value, beginning of period | | $ | 10.36 | | | $ | 10.21 | | | $ | 10.11 | | | $ | 11.01 | | | $ | 10.00 | |
| Activity from investment operations: | | | | | | | | | | | | | | | | | | | | |
| Net investment loss (2) | | | (0.07 | ) | | | (0.11 | ) | | | (0.13 | ) | | | (0.15 | ) | | | (0.12 | ) |
| Net realized and unrealized gain on investments, futures contracts and swap contract | | | 1.05 | | | | 0.78 | | | | 0.89 | | | | 0.82 | | | | 1.14 | |
| Total from investment operations | | | 0.98 | | | | 0.67 | | | | 0.76 | | | | 0.67 | | | | 1.02 | |
| Less distributions from: | | | | | | | | | | | | | | | | | | | | |
| Net investment income | | | — | | | | (0.26 | ) | | | — | | | | — | | | | — | |
| Net realized gains | | | (0.92 | ) | | | (0.26 | ) | | | (0.66 | ) | | | (1.57 | ) | | | (0.01 | ) |
| Total distributions | | | (0.92 | ) | | | (0.52 | ) | | | (0.66 | ) | | | (1.57 | ) | | | (0.01 | ) |
| Paid-in-Capital From Redemption Fees | | | 0.00 | (3) | | | 0.00 | (3) | | | 0.00 | (3) | | | — | | | | 0.00 | (3) |
| Net asset value, end of period | | $ | 10.42 | | | $ | 10.36 | | | $ | 10.21 | | | $ | 10.11 | | | $ | 11.01 | |
| Total return (4) | | | 9.50 | % | | | 6.79 | % | | | 8.24 | % | | | 6.00 | % | | | 10.23 | % |
| Net assets, at end of period (000’s) | | $ | 4,029 | | | $ | 4,098 | | | $ | 3,972 | | | $ | 4,618 | | | $ | 5,079 | |
| Supplemental data and ratios: | | | | | | | | | | | | | | | | | | | | |
| Ratio of gross expenses to average net assets (6) | | | 3.36 | % | | | 3.37 | % | | | 4.08 | % | | | 4.15 | % (8) | | | 5.97 | % (7)(8) |
| Ratio of net expenses to average net assets | | | 1.45 | % | | | 1.45 | % | | | 1.45 | % | | | 1.81 | % (8)(10) | | | 2.49 | % (7)(8) |
| Ratio of net investment loss to average net assets | | | (0.70 | )% | | | (1.08 | )% | | | (1.28 | )% | | | (1.44 | )% (8)(9) | | | (1.40 | )% (7)(8)(9) |
| Portfolio Turnover Rate | | | 69 | % | | | 0 | % | | | 0 | % | | | 31 | % | | | 49 | % (5) |
| | | | | | | | | | | | | | | | | | | | | |
| (1) | The Equinox Ampersand Strategy Fund commenced operations on September 9, 2013. |
| (2) | Per share amounts calculated using the average shares method, which more appropriately presents the per share data for the period. |
| (3) | Represents less than $0.005 per share. |
| (4) | Total returns are historical and assume changes in share prices and reinvestment of dividends and distributions. Total returns for periods of less than one year are not annualized. Total returns shown exclude the effect of the maximum applicable sales charges of 5.75% and, if applicable, wire redemption fees. Had the Adviser and Administrator not waived its fees or reimbursed a portion of the Fund’s expense, the returns would have been lower. |
| (6) | Represents the ratio of expenses to average net assets absent fee waivers and/or expense reimbursements by the Adviser and Administrator. |
| (8) | Does not include the expenses of other investment companies in which the Fund invests. |
| (9) | Recognition of net investment income by the Fund is affected by the timing of the declaration of dividends by the underlying exchange traded funds in which the Fund invests. |
| (10) | Ratio exceeds the expense limit in place as of June 30, 2015 because the Adviser reduced the expense limit during the year. |
See accompanying notes to consolidated financial statements.
| Equinox Ampersand Strategy Fund |
| CONSOLIDATED FINANCIAL HIGHLIGHTS |
| |
| Per Share Data and Ratios for a Share of Beneficial Interest Outstanding Throughout Each Period |
| | | Class I | |
| | | For the
Year Ended | | | For the
Year Ended | | | For the
Year Ended | | | For the
Year Ended | | | For the
Period Ended | |
| | | June 30, | | | June 30, | | | June 30, | | | June 30, | | | June 30, | |
| | | 2018 | | | 2017 | | | 2016 | | | 2015 | | | 2014 (1) | |
| Net asset value, beginning of period | | $ | 10.43 | | | $ | 10.28 | | | $ | 10.15 | | | $ | 11.03 | | | $ | 10.00 | |
| Activity from investment operations: | | | | | | | | | | | | | | | | | | | | |
| Net investment loss (2) | | | (0.04 | ) | | | (0.09 | ) | | | (0.10 | ) | | | (0.13 | ) | | | (0.09 | ) |
| Net realized and unrealized gain on investments, futures contracts and swap contract | | | 1.05 | | | | 0.79 | | | | 0.89 | | | | 0.82 | | | | 1.13 | |
| Total from investment operations | | | 1.01 | | | | 0.70 | | | | 0.79 | | | | 0.69 | | | | 1.04 | |
| Less distributions from: | | | | | | | | | | | | | | | | | | | | |
| Net investment income | | | — | | | | (0.29 | ) | | | — | | | | — | | | | — | |
| Net realized gains | | | (0.92 | ) | | | (0.26 | ) | | | (0.66 | ) | | | (1.57 | ) | | | (0.01 | ) |
| Total distributions | | | (0.92 | ) | | | (0.55 | ) | | | (0.66 | ) | | | (1.57 | ) | | | (0.01 | ) |
| Paid-in-Capital From Redemption Fees | | | 0.04 | | | | — | | | | 0.00 | (3) | | | — | | | | 0.00 | (3) |
| Net asset value, end of period | | $ | 10.56 | | | $ | 10.43 | | | $ | 10.28 | | | $ | 10.15 | | | $ | 11.03 | |
| Total return (4) | | | 10.15 | % | | | 7.00 | % | | | 8.50 | % | | | 6.19 | % | | | 10.43 | % |
| Net assets, at end of period (000’s) | | $ | 7,758 | | | $ | 2,458 | | | $ | 1,650 | | | $ | 2,025 | | | $ | 4,378 | |
| Supplemental data and ratios: | | | | | | | | | | | | | | | | | | | | |
| Ratio of gross expenses to average net assets (6) | | | 3.32 | % | | | 3.11 | % | | | 3.77 | % | | | 4.13 | % (8) | | | 5.64 | % (7)(8) |
| Ratio of net expenses to average net assets | | | 1.20 | % | | | 1.20 | % | | | 1.20 | % | | | 1.60 | % (8)(10) | | | 2.24 | % (7)(8) |
| Ratio of net investment loss to average net assets | | | (0.41 | )% | | | (0.83 | )% | | | (1.04 | )% | | | (1.19 | )% (8)(9) | | | (1.14 | )% (7)(8)(9) |
| Portfolio Turnover Rate | | | 69 | % | | | 0 | % | | | 0 | % | | | 31 | % | | | 49 | % (5) |
| | | | | | | | | | | | | | | | | | | | | |
| (1) | The Equinox Ampersand Strategy Fund commenced operations on September 9, 2013. |
| (2) | Per share amounts calculated using the average shares method, which more appropriately presents the per share data for the period. |
| (3) | Represents less than $0.005 per share. |
| (4) | effect of the maximum applicable sales charge and, if applicable, wire redemption fees. Had the Adviser and Administrator not waived its fees or reimbursed a portion of the Fund’s expenses, the returns would have been lower. |
| (6) | Represents the ratio of expenses to average net assets absent fee waivers and/or expense reimbursements by the Adviser and Administrator. |
| (8) | Does not include the expenses of other investment companies in which the Fund invests. |
| (9) | Recognition of net investment income by the Fund is affected by the timing of the declaration of dividends by the underlying exchange traded funds in which the Fund invests. |
| (10) | Ratio exceeds the expense limit in place as of June 30, 2015 because the Adviser reduced the expense limit during the year. |
See accompanying notes to consolidated financial statements.
| Equinox Ampersand Strategy Fund |
| NOTES TO CONSOLIDATED FINANCIAL STATEMENTS |
| June 30, 2018 |
| |
The Equinox Ampersand Strategy Fund, formerly the Equinox EquityHedge U.S. Strategy Fund, (the “Fund”) is a non-diversified series of shares of beneficial interest of Equinox Funds Trust (the “Trust”), a statutory trust organized under the laws of the State of Delaware on August 5, 2010, and is registered under the Investment Company Act of 1940, as amended (the “1940 Act”), as an open-end management investment company. The Fund commenced operations on September 9, 2013. Effective June 29, 2018, the investment strategy of the Fund is to seek to achieve returns and volatility comparable to the S&P 500® Total Return Index, while seeking to avoid the full impact of downside risk. Prior to June 29, 2018, the investment objective of the Fund was to achieve capital appreciation with moderate correlation to and with less volatility than the S&P 500® Total Return Index.
The Fund currently offers Class A and Class I shares. Class I shares are offered at net asset value. Class A shares are offered at net asset value plus a maximum sales charge of 5.75%. Investors that purchase $1,000,000 or more each Fund’s Class A shares will not pay any initial sales charge on the purchase however, may be subject to a 1.00% contingent deferred sales charge (“CDSC”) on shares redeemed during the first 12 months after their purchase in the amount of the commissions paid on the shares redeemed. Effective March 23, 2018, the fund ceased offering Class C shares. The Fund converted any remaining Class C Shares into Class A Shares on April 9, 2018. Each class represents an interest in the same assets of the Fund and classes are identical except for differences in their sales charge structures and ongoing service and distribution charges. All classes of shares have equal voting privileges except that each class has exclusive voting rights with respect to its service and/or distribution plans. The Fund’s income, expenses (other than class specific distribution fees) and realized and unrealized gains and losses are allocated proportionately each day based upon the relative net assets of each class.
| 2. | SIGNIFICANT ACCOUNTING POLICIES |
The following is a summary of significant accounting policies followed by the Fund in preparation of its consolidated financial statements. The policies are in conformity with accounting principles generally accepted in the United States of America (“GAAP”). The preparation of the consolidated financial statements requires management to make estimates and assumptions that affect the reported amounts of assets and liabilities and disclosure of contingent assets and liabilities at the date of the consolidated financial statements and the reported amounts of income and expenses for the period. Actual results could differ from those estimates. The Fund is an investment company and accordingly follows the investment company accounting and reporting guidance of the Financial Accounting Standards Board (“FASB”) Accounting Standard Codification Topic 946 “Financial Services – Investment Companies” including FASB Accounting Standard Update ASU 2013-08.
Security Valuation – Securities, including exchange traded funds, listed on an exchange are valued at the last reported sale price at the close of the regular trading session of the exchange on the business day the value is being determined, or in the case of securities listed on NASDAQ at the NASDAQ Official Closing Price (“NOCP”). In the absence of a sale such securities shall be valued at the last bid price on the day of valuation. Debt securities (other than short-term obligations) are valued each day by an independent pricing service approved by the Board of Trustees of Equinox Funds Trust (the
| Equinox Ampersand Strategy Fund |
| NOTES TO CONSOLIDATED FINANCIAL STATEMENTS (Continued) |
| June 30, 2018 |
| |
“Board”) using methods which include current market quotations from a major market maker in the securities and based on methods which include the consideration of yields or prices of securities of comparable quality, coupon, maturity and type. Short-term debt obligations having 60 days or less remaining until maturity, at time of purchase, may be valued at amortized cost. Investments in open-end investment companies are valued at net asset value. Investments in swap contracts are reported at fair value based on daily price reporting from the swap counterparty. Futures are valued at the final settled price or, in the absence of a settled price, at the last sale price on the day of valuation.
The Fund may hold securities, such as private investments, interests in commodity pools, other non-traded securities or temporarily illiquid securities, for which market quotations are not readily available or are determined to be unreliable. These securities will be valued using the “fair value” procedures approved by the Board. The Board has delegated execution of these procedures to a fair value team composed of one or more representatives from each of the (i) Trust, (ii) administrator, and (iii) Adviser. The team may also enlist third party consultants such as a valuation specialist at a public accounting firm, valuation consultant, or financial officer of a security issuer on an as-needed basis to assist in determining a security-specific fair value. The Board reviews and ratifies the execution of this process and the resultant fair value prices at least quarterly to assure the process produces reliable results.
Fair Valuation Process – As noted above, the fair value team is composed of one or more representatives from each of the (i) Trust, (ii) administrator, and (iii) Adviser. The applicable investments are valued collectively via inputs from each of these groups. For example, fair value determinations are required for the following securities: (i) securities for which market quotations are insufficient or not readily available on a particular business day (including securities for which there is a short and temporary lapse in the provision of a price by the regular pricing source), (ii) securities for which, in the judgment of the Adviser, the prices or values available do not represent the fair value of the instrument. Factors which may cause the Adviser to make such a judgment include, but are not limited to, the following: only a bid price or an asked price is available; the spread between bid and asked prices is substantial; the frequency of sales; the thinness of the market; the size of reported trades; and actions of the securities markets, such as the suspension or limitation of trading; (iii) securities determined to be illiquid; and (iv) securities with respect to which an event that will affect the value thereof has occurred (a “significant event”) since the closing prices were established on the principal exchange on which they are traded, but prior to a Fund’s calculation of its net asset value. Specifically, interests in commodity pools or managed futures pools are valued on a daily basis by reference to the closing market prices of each futures contract or other asset held by a pool, as adjusted for pool expenses. Restricted or illiquid securities, such as private investments or non-traded securities are valued via inputs from the Adviser based upon the current bid for the security from two or more independent dealers or other parties reasonably familiar with the facts and circumstances of the security (who should take into consideration all relevant factors as may be appropriate under the circumstances). If the Adviser is unable to obtain a current bid from such independent dealers or other independent parties, the fair value team shall determine the fair value of such security using the following factors: (i) the type of security; (ii) the cost at date of purchase; (iii) the size and nature of the Fund’s holdings; (iv) the discount from market value of unrestricted securities of the same class at the time of purchase and subsequent thereto; (v) information as to any transactions or offers with respect to the security; (vi) the nature and duration of restrictions on disposition of the security and the
| Equinox Ampersand Strategy Fund |
| NOTES TO CONSOLIDATED FINANCIAL STATEMENTS (Continued) |
| June 30, 2018 |
| |
existence of any registration rights; (vii) how the yield of the security compares to similar securities of companies of similar or equal creditworthiness; (viii) the level of recent trades of similar or comparable securities; (ix) the liquidity characteristics of the security; (x) current market conditions; and (xi) the market value of any securities into which the security is convertible or exchangeable.
The Fund utilizes various methods to measure the fair value of all of its investments on a recurring basis. GAAP establishes a hierarchy that prioritizes inputs to valuation methods. The three levels of input are:
Level 1 – Unadjusted quoted prices in active markets for identical assets and liabilities that the Fund has the ability to access.
Level 2 – Observable inputs other than quoted prices included in Level 1 that are observable for the asset or liability, either directly or indirectly. These inputs may include quoted prices for the identical instrument in an inactive market, prices for similar instruments, interest rates, prepayment speeds, credit risk, yield curves, default rates and similar data.
Level 3 – Unobservable inputs for the asset or liability, to the extent relevant observable inputs are not available, representing the Fund’s own assumptions about the assumptions a market participant would use in valuing the asset or liability, and would be based on the best information available.
The availability of observable inputs can vary from security to security and is affected by a wide variety of factors, including, for example, the type of security, whether the security is new and not yet established in the marketplace, the liquidity of markets, and other characteristics particular to the security. To the extent that valuation is based on models or inputs that are less observable or unobservable in the market, the determination of fair value requires more judgment. Accordingly, the degree of judgment exercised in determining fair value is greatest for instruments categorized in Level 3.
The inputs used to measure fair value may fall into different levels of the fair value hierarchy. In such cases, for disclosure purposes, the level in the fair value hierarchy within which the fair value measurement falls in its entirety, is determined based on the lowest level input that is significant to the fair value measurement in its entirety.
The inputs or methodology used for valuing securities are not necessarily an indication of the risk associated with investing in those securities. The following tables summarize the inputs used as of June 30, 2018 for the Fund’s assets and liabilities measured at fair value:
| Assets | | Level 1 | | | Level 2 | | | Level 3 | | | Total | |
| U.S. Treasury Notes | | $ | — | | | $ | 5,497,477 | | | $ | — | | | $ | 5,497,477 | |
| Total | | $ | — | | | $ | 5,497,477 | | | $ | — | | | $ | 5,497,477 | |
| | | | | | | | | | | | | | | | | |
| Liabilities | | Level 1 | | | Level 2 | | | Level 3 | | | Total | |
| Swap Contract * | | $ | — | | | $ | 409,571 | | | $ | — | | | $ | 409,571 | |
| Futures Contract * | | | 242,080 | | | | — | | | | — | | | | 242,080 | |
| Total | | $ | 242,080 | | | $ | 409,571 | | | $ | — | | | $ | 651,651 | |
| Equinox Ampersand Strategy Fund |
| NOTES TO CONSOLIDATED FINANCIAL STATEMENTS (Continued) |
| June 30, 2018 |
| |
| * | Represents net unrealized depreciation on swap contracts and futures contracts. |
There were no transfers into or out of any level during the current period presented.
It is the Fund’s policy to record transfers between levels at the end of the reporting period. The Fund did not hold any Level 3 securities during the period.
See Consolidated Portfolio of Investments for more information related to the Fund’s investments.
Consolidation of Subsidiary – The Consolidated Financial Statements of the Fund include the accounts of its subsidiary, Equinox Equity Hedge Fund Limited (“EHS-CFC”), a wholly-owned and controlled foreign corporation (“CFC”). All inter-company accounts and transactions have been eliminated in consolidation.
The Fund may invest approximately 25% of its total assets in a CFC which acts as an investment vehicle in order to effect certain investments consistent with the Fund’s investment objectives and policies.
EHS-CFC utilizes a total return swap with Deutsche Bank AG, London Branch, that provides exposure to the total returns of the managed futures program of Quest Hedging Program (the “Program”) to facilitate the Fund’s pursuit of its investment objective. In accordance with its investment objective and through its exposure to the Program, the Fund may have increased or decreased exposure to one or more of the risk factors including, with respect to the Program, swap agreements, defined in the Principal Investment Risks section of the Fund’s prospectus.
A summary of the Fund’s investments in the EHS-CFC is as follows:
| | | | % Of the Fund’s |
| | Inception Date of | EHS-CFC Net Assets at | Total Net Assets at |
| | EHS-CFC | June 30, 2018 | June 30, 2018 |
| EHS-CFC | 6/27/2018 | $ 2,796,000 | 23.72% |
For tax purposes, EHS-CFC is an exempted Cayman investment company. EHS-CFC has received an undertaking from the Government of the Cayman Islands exempting it from all local income, profits and capital gains taxes. No such taxes are levied in the Cayman Islands at the present time. For U.S. income tax purposes, EHS-CFC is a CFC and as such is not subject to U.S. income tax. However, as a wholly-owned CFC, EHS-CFC’s net income and capital gains, to the extent of its earnings and profits, will be included each year in the Fund’s investment company taxable income.
Market Risk – Market risk is the risk that changes in interest rates, foreign exchange rates or equity prices will affect the positions held by the Fund. The Fund is exposed to market risk on financial instruments that are valued at market prices as disclosed in the schedule of investments. The prices of derivative instruments, including options, forwards and futures prices, can be highly volatile. Price movements of derivative contracts in which the Fund’s assets may be invested are influenced by, among other things, interest rates, changing supply and demand relationships, trade, fiscal, monetary and exchange control programs and policies of governments, and national and international political and economic events and policies. The Fund is exposed to market risk on derivative contracts in that the Fund may not be able to readily dispose of its holdings when it chooses and also that the price
| Equinox Ampersand Strategy Fund |
| NOTES TO CONSOLIDATED FINANCIAL STATEMENTS (Continued) |
| June 30, 2018 |
| |
obtained on disposal is below that at which the investment is included in Fund’s consolidated financial statements. All financial instruments are recognized at fair value, and all changes in market conditions directly affect net income. The Fund’s investments in derivative instruments are exposed to market risk and are disclosed in the consolidated portfolio of investments.
Credit Risk – Credit risk relates to the ability of the issuer to meet interest and principal payments, or both, as they come due. In general, lower-grade, higher-yield bonds are subject to credit risk to a greater extent than lower-yield, higher-quality bonds.
Counterparty Risk – Counterparty risk, including swap counterparty risk, is the risk that the counterparty to a financial instrument will cause a financial loss for the Fund by failing to discharge an obligation. A concentration of counterparty risk exists in that part of the Fund’s cash is held at the broker. The Fund could be unable to recover assets held at the broker, including assets directly traceable to the Fund, in the event of the broker’s bankruptcy. The Fund does not anticipate any material losses as a result of this concentration.
Security Transactions and Related Income – Security transactions are accounted for on trade date basis. Interest income is recognized on an accrual basis. Discounts are accreted and premiums are amortized on securities purchased over the lives of the respective securities. Dividend income is recorded on the ex-dividend date. Realized gains or losses from sales of securities are determined by comparing the identified cost of the security lot sold with the net sales proceeds.
Dividends and Distributions to Shareholders – Dividends from net investment income, if any, are declared and paid at least annually. Distributable net realized capital gains, if any, are declared and distributed annually. Dividends from net investment income and distributions from net realized gains are determined in accordance with federal income tax regulations, which may differ from GAAP. These “book/tax” differences are considered either temporary (i.e., deferred losses, capital loss carry forwards) or permanent in nature. To the extent these differences are permanent in nature, such amounts are reclassified within the composition of net assets based on their federal tax-basis treatment; temporary differences do not require reclassification. Dividends and distributions to shareholders are recorded on ex-dividend date.
Federal Income Tax – The Fund intends to continue to comply with the requirements of the Internal Revenue Code applicable to regulated investment companies and to distribute all of its taxable income to its shareholders. Therefore, no provision for Federal income tax is required. The Fund recognizes the tax benefits of uncertain tax positions only where the position is “more likely than not” to be sustained assuming examination by tax authorities. Management has analyzed the Fund’s tax positions and has concluded that no liability for unrecognized tax benefits should be recorded related to uncertain tax positions taken on returns filed for open tax years (June 30, 2015-2017) or expected to be taken in the Fund’s June 30, 2018 tax returns. The Fund identifies its major tax jurisdictions as U.S. Federal and Colorado where the Fund makes significant investments; however the Fund is not aware of any tax positions for which it is reasonably possible that the total amounts of unrecognized tax benefits will change materially in the next twelve months.
| Equinox Ampersand Strategy Fund |
| NOTES TO CONSOLIDATED FINANCIAL STATEMENTS (Continued) |
| June 30, 2018 |
| |
Allocation of Expenses – Expenses incurred by the Trust that do not relate to a specific fund of the Trust are allocated to the individual funds based on each fund’s relative net assets or another appropriate basis. Expenses specifically attributable to a particular fund in the Trust are borne by that fund. Other expenses are allocated to each fund based on its net assets in relation to the total net assets of all the applicable funds in the Trust or another reasonable basis.
Futures Contracts – The Fund is subject to equity price risk in the normal course of pursuing its investment objectives. The Fund purchases and sells futures contracts to pursue its investment objective, to hedge against market risk, and to reduce return volatility. Initial margin deposits required upon entering into futures contracts are satisfied by the segregation of specific securities or cash as collateral for the account of the broker (the Portfolio’s agent in acquiring the futures position). During the period the futures contracts are open, changes in the value of the contracts are recognized as unrealized gains or losses by “marking to market” on a daily basis to reflect the market value of the contracts at the end of each day’s trading. Variation margin payments are received or made depending upon whether unrealized gains or losses are incurred. When the contracts are closed, the Fund recognizes a realized gain or loss equal to the difference between the proceeds from, or cost of, the closing transaction and the Fund’s basis in the contract. If a Fund were unable to liquidate a futures contract and/or enter into an offsetting closing transaction, the Fund would continue to be subject to market risk with respect to the value of the contracts and continue to be required to maintain the margin deposits on the futures contracts. The Fund segregates liquid securities having a value at least equal to the amount of the current obligation under any open futures contract. Risks may exceed amounts recognized in the Consolidated Statement of Assets and Liabilities. With futures, there is minimal counterparty credit risk to a Fund since futures are exchange traded and the exchange’s clearinghouse, as counterparty to all exchange traded futures, guarantees the futures against default. For the year ended June 30, 2018, the Fund had a net change in unrealized depreciation of $221,437 from futures contracts. For the year ended June 30, 2018, the Fund had net realized gains of $1,161,798 from futures contracts subject to equity price risk.
Swap Contracts – The Fund is subject to equity price risk, interest rate risk and/or commodity risk in the normal course of pursuing its investment objective. The Fund enters into various swap transactions for investment purposes and to manage interest rate, equity, foreign exchange (currency), or credit risk. These two-party contracts are entered into primarily to exchange the returns (or differentials in rates of returns) earned or realized on particular pre-determined investments or instruments.
The gross returns exchanged or “swapped” between parties are calculated with respect to a notional amount, i.e., the return on or increase in value of a particular dollar amount invested at a particular interest rate, in a particular foreign currency, or in a “basket” of securities representing a particular index or market segment. Changes in the value of swap agreements are recognized as net change in unrealized appreciation or depreciation in the Consolidated Statement of Operations by “marking to market” on a daily basis to reflect the value of the swap agreement at the end of each trading day. A liquidation payment received or made at the termination of the swap agreement is recorded as a realized gain or loss on the Consolidated Statement of Operations. Realized gains and losses from a decrease in the notional value swap are recognized on trade date. Swap agreements may also involve
| Equinox Ampersand Strategy Fund |
| NOTES TO CONSOLIDATED FINANCIAL STATEMENTS (Continued) |
| June 30, 2018 |
| |
fees, commissions and other costs that may reduce the value of the swap agreement. These costs are not reflected in the Consolidated Statement of Operations, are deducted from the return of any such derivative instrument and, therefore, represent an indirect cost of investment in the Fund.
The Fund maintains cash and/or investments in money market funds, up to 20% of the notional value of the swap, as collateral to secure its obligations under the swap. The cash maintained as collateral is recorded as swap margin balance on the Consolidated Statement of Assets and Liabilities. As of June 30, 2018, the notional value of the swap was $6,790,000. Entering into these agreements involves, to varying degrees, lack of liquidity and elements of credit, market, and counterparty risk in excess of amounts recognized on the Consolidated Statement of Assets and Liabilities. The Fund’s maximum risk of loss from counterparty credit risk is the discounted net value of the cash flows to be received from the counterparty over the contract’s remaining life, to the extent that that amount is positive. In order to maintain prudent risk exposure to the counterparty, the Adviser will reduce exposure to the counterparty whenever the unrealized appreciation on the swap exceeds 5% of the net assets of the Fund for a period of one week or such lesser time as the Adviser may determine. If the Adviser determines that the counterparty presents an imprudent risk, the swap may be terminated in its entirety. As of June 30, 2018, the net change in unrealized depreciation on the swap contract was $132,075. For the year ended June 30, 2018, the Fund had net realized losses of $120,284 from the swap contract.
Please refer to the Fund’s prospectus for a full listing of risks associated with these investments.
Impact of Derivatives on the Consolidated Statement of Assets and Liabilities and Consolidated Statement of Operations
The following is a summary of the location of derivative investments on the Fund’s Consolidated Statement of Assets and Liabilities as of June 30, 2018:
| Location on the Consolidated Statement of Assets and Liabilities |
| Derivatives Investment Type | Liability Derivatives |
| Equity/Currency/ Interest Rate Contracts | Unrealized depreciation on swap contract and futures contract |
| | |
Fair Values of derivative instruments as of June 30, 2018:
| | | Liability Derivatives |
| Contract Type/ | | | | | |
| Primary Risk Exposure | | Balance Sheet Location | | Fair Value | |
| Mixed; interest rate, equity and foreign exchange contracts: | | Net unrealized depreciation on swap contract | | $ | 409,571 | * |
| | | | | | | |
| Equity contracts: | | Unrealized depreciation on futures contracts | | | 242,080 | * |
| | | | | $ | 651,651 | |
| * | Includes cumulative appreciation/depreciation of futures and swap contracts as reported in the Consolidated Portfolio of Investments. |
| Equinox Ampersand Strategy Fund |
| NOTES TO CONSOLIDATED FINANCIAL STATEMENTS (Continued) |
| June 30, 2018 |
| |
The effect of derivative instruments on the Consolidated Statement of Operations for the year ended June 30, 2018:
| | | Realized Gain | | | Change in Unrealized | |
| Location of Gain or (Loss) On | | or (Loss) on | | | Depreciation | |
| Derivatives | | Derivatives | | | on Derivatives | |
| Net realized gain on futures contracts | | $ | 1,161,798 | | | | | |
| Net change in unrealized depreciation on futures contracts | | | | | | $ | (221,437 | ) |
| Net realized loss on swap contract | | | (120,284 | ) | | | | |
| Net change in unrealized depreciation on swap contract | | | | | | | (132,075 | ) |
| | | $ | 1,041,514 | | | $ | (353,512 | ) |
| | | | | | | | | |
The notional value of the derivative instruments outstanding as of June 30, 2018 as disclosed in the Consolidated Portfolio of Investments and the amounts of realized and changes in unrealized gains and losses on derivative instruments during the period as disclosed above and within the Consolidated Statement of Operations serve as indicators of the volume of derivative activity for the Fund.
Offsetting of Financial Assets and Derivative Assets
It is the Fund’s policy to recognize a net asset or liability equal to the unrealized appreciation/(depreciation) of futures and swap contracts. As of June 30, 2018, the Fund is subject to a master netting arrangement for the swaps and futures. The following table shows additional information regarding the offsetting of assets and liabilities at June 30, 2018.
| | | | | | | | | | | | Gross Amounts Not Offset in the | | | | |
| | | | | | | | | | | | Consolidated Statement of Assets & | | | | |
| Liabilities: | | | | | | | | | | | Liabilities | | | | |
| | | | | | | | | | | | | | | | | | | |
| | | | | | Gross Amounts | | | Net Amounts of | | | | | | | | | | |
| | | | | | Offset in the | | | Liabilities Presented in | | | | | | | | | | |
| | | Gross Amounts | | | Consolidated | | | the Consolidated | | | | | | | | | | |
| | | of Recognized | | | Statement of Assets | | | Statement of Assets & | | | Financial | | | Cash Collateral | | | | |
| Description | | Liabilities | | | & Liabilities | | | Liabilities | | | Instruments | | | Pledged | | | Net Amount | |
| | | | | | | | | | | | | | | | | | | | | | | | | |
| Unrealized Depreciation on Swap Contract | | $ | 409,571 | (1) | | $ | — | | | $ | 409,571 | | | $ | — | | | $ | 409,571 | (2) | | $ | — | |
| | | | | | | | | | | | | | | | | | | | | | | | | |
| Unrealized Depreciation on Futures Contracts | | | 242,080 | (1) | | | — | | | | 242,080 | | | | — | | | | 242,080 | (2) | | | — | |
| Total | | $ | 651,651 | | | $ | — | | | $ | 651,651 | | | $ | — | | | $ | 651,651 | | | $ | — | |
| | | | | | | | | | | | | | | | | | | | | | | | | |
| (1) | Gross unrealized depreciation as presented in the Consolidated Portfolio of Investments. |
| (2) | The table above does not include additional cash collateral pledged to the counterparty. Additional cash pledged as collateral as of June 30, 2018 was $4,212,886 for the swap contract and $607,457 for the futures contract. |
| Equinox Ampersand Strategy Fund |
| NOTES TO CONSOLIDATED FINANCIAL STATEMENTS (Continued) |
| June 30, 2018 |
| |
Indemnification – The Trust indemnifies its officers and trustees for certain liabilities that may arise from the performance of their duties to the Trust. Additionally, in the normal course of business, the Fund enters into contracts that contain a variety of representations and warranties and which provide general indemnities. The Fund’s maximum exposure under these arrangements is unknown, as this would involve future claims that may be made against the Fund that have not yet occurred. However, based on experience, the risk of loss due to these warranties and indemnities appears to be remote.
| 3. | INVESTMENT TRANSACTIONS |
For the year ended June 30, 2018, cost of purchases and proceeds from sales of portfolio securities, other than short-term investments and U.S. Government securities, amounted to $0 and $0, respectively.
| 4. | INVESTMENT ADVISORY AGREEMENT AND TRANSACTIONS WITH RELATED PARTIES |
Equinox Institutional Asset Management, LP serves as the Fund’s Investment Adviser (the “Adviser”).
Pursuant to an Advisory Agreement with the Fund, the Adviser, under the oversight of the Board, directs the daily operations of the Fund and supervises the performance of administrative and professional services provided by others. As compensation for its services and the related expenses borne by the Adviser, the Fund paid the Adviser a management fee, computed and accrued daily and paid monthly, at an annual rate of 0.95% of the Fund’s average daily net assets. For the year ended June 30, 2018, the Fund incurred Advisory fees of $98,198.
Under the terms of the expense limitation agreement, the Adviser has contractually agreed to reduce its Advisory fee and/or reimburse certain expenses of the Fund, to ensure that the Fund’s total annual operating expenses, excluding (i) taxes, (ii) interest, (iii) extraordinary items, (iv) “Acquired Fund Fees and Expenses,” and (v) brokerage commissions, do not exceed, on an annual basis, 1.45% and 1.20% of the Fund’s average daily net assets for Class A and Class I shares, respectively. This expense limitation will remain in effect until October 31, 2019 but can be terminated by the Fund’s Board of Trustees on 60 days’ written notice to the Adviser.
For the year ended June 30, 2018, the Adviser waived fees and reimbursed expenses in the amount of $211,146.
If the Adviser waives any fee or reimburses any expense pursuant to the Waiver Agreement, and the Fund’s operating expenses are subsequently less than 1.45% and 1.20% of average daily net assets attributable to Class A and Class I shares, respectively, the Adviser shall be entitled to recoupment by the Fund for such waived fees or reimbursed expenses provided that such recoupment does not cause the Fund’s expenses to exceed 1.45% and 1.20% of average daily net assets for each share class. If Fund operating expenses attributable to Class A and Class I shares subsequently exceed 1.45% and 1.20% respectively per annum of the average daily net assets, the recoupment by the Adviser shall be suspended.
| Equinox Ampersand Strategy Fund |
| NOTES TO CONSOLIDATED FINANCIAL STATEMENTS (Continued) |
| June 30, 2018 |
| |
The following is subject to recapture by the Adviser:
| $ | 146,756 | | | June 30, 2019 |
| $ | 189,512 | | | June 30, 2020 |
| $ | 211,146 | | | June 30, 2021 |
| | | | | |
The Adviser may seek reimbursement only for fees waived or expenses reimbursed or paid by it during the three fiscal date on years from date on which the Adviser reduced its compensation and/or assumed expenses for the Fund; provided, however, that such expenses may only be reimbursed to the extent they were waived or paid after the date of the Waiver Agreement (or any similar agreement). The Board may terminate this expense reimbursement arrangement at any time.
On June 30, 2018, $175,340 of previously waived fees/reimbursed expenses expired without recoupment by the Adviser.
The Trust, with respect to the Fund, has adopted the Trust’s Distribution and Shareholder Servicing Plan for Class A and Class C shares (the “Plan”). The Plan provides that a monthly service and/or distribution fee is calculated by the Fund at an annual rate of 0.25% of its average daily net assets for Class A and 1.00% of its average daily net assets for Class C shares which is paid to Northern Lights Distributors, LLC (the “Distributor”), an affiliate of Gemini Fund Services, LLC, to provide compensation for ongoing shareholder servicing and distribution-related activities or services and/or maintenance of the Fund’s shareholder accounts not otherwise required to be provided by the Adviser. For the year ended June 30, 2018, Class A shares and Class C shares were charged as follows:
| Class A: | | $ | 10,799 | |
| Class C: | | $ | 1,411 | |
| | | | | |
The Distributor acts as the Fund’s principal underwriter in a continuous public offering of the Fund’s Class A and Class C shares. For the year ended June 30, 2018, the Distributor received $1,289 in underwriting commissions for sales of Class A shares, of which $164 was retained by the principal underwriter. As of April 9, 2018, Class C shares converted to Class A shares.
In addition, certain affiliates of the Distributor provide services to the Fund as follows:
Gemini Fund Services, LLC (“GFS”), an affiliate of the Distributor, provides administration, fund accounting, and transfer agent services to the Trust. Pursuant to separate servicing agreements with GFS, the Fund pays GFS customary fees for providing administration, fund accounting and transfer agency services to the Fund. Effective July 1, 2017, the servicing agreement was amended which included waiving fees for a five month period.
Northern Lights Compliance Services, LLC (“NLCS”), an affiliate of GFS and the Distributor, provided a Chief Compliance Officer to the Trust, as well as related compliance services, pursuant to a consulting agreement between NLCS and the Trust until November 16, 2017. Under the terms of such agreement, NLCS received customary fees from the Fund.
| Equinox Ampersand Strategy Fund |
| NOTES TO CONSOLIDATED FINANCIAL STATEMENTS (Continued) |
| June 30, 2018 |
| |
Blu Giant, LLC (“Blu Giant”), an affiliate of GFS and the Distributor, provides EDGAR conversion and filing services as well as print management services for the Fund on an ad-hoc basis. For the provision of these services, Blu Giant receives customary fees from the Fund.
The Fund may assess a short-term redemption fee of 1.00% of the total redemption amount if a shareholder sells their shares after holding them for less than 30 days. The redemption fee is paid directly to the Fund. For the year ended June 30, 2018, the Fund received $235, $91, and $21,175 for Class A, Class C, and Class I, respectively.
| 6. | AGGREGATE UNREALIZED APPRECIATION AND DEPRECIATION – TAX BASIS |
| | | | | | | | | | Net Unrealized | |
| | | | Gross Unrealized | | | Gross Unrealized | | | Appreciation/ | |
| Tax Cost | | | Appreciation | | | Depreciation | | | (Depreciation) | |
| $ | 5,501,307 | | | $ | 237 | | | $ | (4,067 | ) | | $ | (3,830 | ) |
| | | | | | | | | | | | | | | |
| 7. | DISTRIBUTIONS TO SHAREHOLDERS AND TAX COMPONENTS OF CAPITAL |
The tax character of distributions paid for the years ended June 30, 2018 and June 30, 2017 was as follows:
| | | Fiscal Year Ended | | | Fiscal Year Ended | |
| | | June 30, 2018 | | | June 30, 2017 | |
| Ordinary Income | | $ | 86,772 | | | $ | 253,123 | |
| Long-Term Capital Gain | | | 781,969 | | | | 74,555 | |
| Return of Capital | | | — | | | | — | |
| | | $ | 868,741 | | | $ | 327,678 | |
| | | | | | | | | |
As of June 30, 2018, the components of accumulated earnings/(deficit) on a tax basis were as follows:
| Undistributed | | | Undistributed | | | Post October Loss | | | Capital Loss | | | Other | | | Unrealized | | | Total | |
| Ordinary | | | Long-Term | | | and | | | Carry | | | Book/Tax | | | Appreciation/ | | | Accumulated | |
| Income | | | Gains | | | Late Year Loss | | | Forwards | | | Differences | | | (Depreciation) | | | Earnings/(Deficits) | |
| $ | — | | | $ | 366,472 | | | $ | (36,846 | ) | | $ | — | | | $ | — | | | $ | (3,830 | ) | | $ | 325,796 | |
| | | | | | | | | | | | | | | | | | | | | | | | | | | |
The difference between book basis and tax basis unrealized depreciation, undistributed net investment income (loss) and accumulated net realized gains from investments is primarily attributable to, the mark-to-market on open futures and swaps contracts.
Late year losses incurred after December 31 within the fiscal year are deemed to arise on the first business day of the following fiscal year for tax purposes. The Fund incurred and elected to defer such late year losses of $36,846.
| Equinox Ampersand Strategy Fund |
| NOTES TO CONSOLIDATED FINANCIAL STATEMENTS (Continued) |
| June 30, 2018 |
| |
Permanent book and tax differences, primarily attributable to the book/tax basis treatment of net operating losses and short-term capital gains, resulted in reclassification for the year ended June 30, 2018 as follows:
| Paid | | | Undistributed | | | Accumulated | |
| In | | | Net Investment | | | Net Realized | |
| Capital | | | Income (Loss) | | | Gains (Loss) | |
| $ | (143,069 | ) | | $ | 394,868 | | | $ | (251,799 | ) |
| | | | | | | | | | | |
| 8. | RECENT ACCOUNTING PRONOUNCEMENT |
On August 1, 2017, the Fund implemented amendments to Regulation S-X, issued by the Securities and Exchange Commission, which require standardized, enhanced disclosures, particularly related to derivatives, in investment company financial statements.
Subsequent events after the date of the Consolidated Statement of Assets and Liabilities have been evaluated through the date the financial statements were issued. Management has determined that no events or transactions occurred requiring adjustment or disclosure in the consolidated financial statements, except as noted below.
Effective July 2, 2018, as compensation for its services and the related expenses borne by the Adviser, the Fund will pay the Adviser a management fee, computed and accrued daily and paid monthly, at an annual rate of 0.75% of the Fund’s average daily net assets. In addition, under the terms of the expense limitation agreement, the Adviser has contractually agreed to reduce its Advisory fee and/or reimburse certain expenses of the Fund, to ensure that the Fund’s total annual operating expenses, excluding (i) taxes, (ii) interest, (iii) extraordinary items, (iv) “Acquired Fund Fees and Expenses,” and (v) brokerage commissions, do not exceed, on an annual basis, 1.24% and 0.99% of the Fund’s average daily net assets for Class A and Class I shares, respectively. This expense limitation will remain in effect until October 31, 2019 but can be terminated by the Fund’s Board of Trustees on 60 days’ written notice to the Adviser.
Effective July 2, 2018, the Board approved a reduction in the advisory fee of the Fund from 0.95% to 0.75%, in addition to a reduction in the Fund’s expense limitation from 1.50% to 1.24% of the Fund’s total operating expenses for Class A shares and 1.20% to 0.99% for Class I shares, respectively.
Report of Independent Registered Public Accounting Firm
To the Board of Trustees of Equinox Funds Trust
and the Class A and Class I Shareholders of Equinox Ampersand Strategy Fund
Opinion on the Financial Statements
We have audited the accompanying consolidated statement of assets and liabilities, including the consolidated schedule of investments, of Equinox Ampersand Strategy Fund (formerly Equinox EquityHedge U.S Strategy Fund) (the Fund) as of June 30, 2018, and the related consolidated statement of operations for the year then ended, the statements of changes in net assets for each of the two years in the period then ended, including the related notes, and the consolidated financial highlights for each of the four years in the period then ended and for the period from September 9, 2013 (commencement of operations) through June 30, 2014 (collectively, the financial statements). In our opinion, the financial statements present fairly, in all material respects, the financial position of the Fund as of June 30, 2018, and the results of their operations for the year then ended, the changes in their net assets for each of the two years in the period then ended, and the financial highlights for each of the four years in the period then ended and for the period from September 9, 2013 (commencement of operations) through June 30, 2014, in conformity with accounting principles generally accepted in the United States of America.
Basis for Opinion
These financial statements are the responsibility of the Fund’s management. Our responsibility is to express an opinion on the Fund’s financial statements based on our audits. We are a public accounting firm registered with the Public Company Accounting Oversight Board (United States) (PCAOB) and are required to be independent with respect to the Fund in accordance with U.S. federal securities laws and the applicable rules and regulations of the Securities and Exchange Commission and the PCAOB.
We conducted our audits in accordance with the standards of the PCAOB. Those standards require that we plan and perform the audit to obtain reasonable assurance about whether the financial statements are free of material misstatement, whether due to error or fraud. The Fund is not required to have, nor were we engaged to perform, an audit of its internal control over financial reporting. As part of our audits, we are required to obtain an understanding of internal control over financial reporting but not for the purpose of expressing an opinion on the effectiveness of the Fund’s internal control over financial reporting. Accordingly, we express no such opinion.
Our audits included performing procedures to assess the risks of material misstatement of the financial statements, whether due to error or fraud, and performing procedures that respond to those risks. Such procedures included examining, on a test basis, evidence regarding the amounts and disclosures in the financial statements. Our audits also included evaluating the accounting principles used and significant estimates made by management, as well as evaluating the overall presentation of the financial statements. Our procedures included confirmation of investments owned as of June 30, 2018, by correspondence with the custodians and swap counterparty. We believe that our audits provide a reasonable basis for our opinion.
/s/ RSM US LLP
We have served as the auditor of one or more Equinox advised funds since 2010.
Denver, Colorado
August 29, 2018
| Equinox Ampersand Strategy Fund |
| EXPENSE EXAMPLES (Unaudited) |
| June 30, 2018 |
| |
As a shareholder of the Equinox Ampersand Strategy Fund, you incur two types of costs: (1) transaction costs, including sales charges (loads) on purchases of Class A shares; (2) ongoing costs, including management fees; distribution and/or service (12b-1) fees; and other Fund expenses. This example is intended to help you understand your ongoing costs (in dollars) of investing in the Fund and to compare these costs with the ongoing costs of investing in other mutual funds.
The example is based on an investment of $1,000 invested at the beginning of the period and held for the entire six month period from January 1, 2018 through June 30, 2018.
Actual Expenses
The “Actual” expenses line in the table below provides information about actual account values and actual expenses. You may use the information below, together with the amount you invested, to estimate the expenses that you paid over the period. Simply divide your account value by $1,000 (for example, an $8,600 account value divided by $1,000 = 8.6), then multiply the result by the number in the table under the heading entitled “Expenses Paid During Period” to estimate the expenses you paid on your account during this period.
Hypothetical Example for Comparison Purposes
The “Hypothetical” expenses line in the table below provides information about hypothetical account values and hypothetical expenses based on the Fund’s actual expense ratio and an assumed rate of return of 5% per year before expenses, which is not the Fund’s actual return. The hypothetical account values and expenses may not be used to estimate the actual ending account balances or expenses you paid for the period. You may use this information to compare this 5% hypothetical example with the 5% hypothetical examples that appear in the shareholder reports of other funds.
Please note that the expenses shown in the table are meant to highlight your ongoing costs only and do not reflect any transactional costs, such as sales charges (loads), or redemption fees. Therefore, the table is useful in comparing ongoing costs only, and will not help you determine the relative total costs of owning different funds. In addition, if these transactional costs were included, your costs would have been higher.
| | | | | | | Hypothetical |
| | | | | | | (5% return before |
| | | | Actual | | expenses) |
| | | | | | | | |
| | | | Ending | Expenses | | Ending | Expenses |
| | Fund’s | Beginning | Account | Paid | | Account | Paid |
| Equinox Ampersand | Annualized | Account Value | Value | During | | Value | During |
| Strategy Fund | Expense Ratio | 1-1-18 | 6-30-18 | Period* | | 6-30-18 | Period |
| Class A | 1.45% | $1,000.00 | $1,005.80 | $7.21 | | $1,017.60 | $7.25 |
| Class I | 1.20% | $1,000.00 | $1,010.50 | $5.98 | | $1,018.84 | $6.01 |
| | | | | | | | |
| * | Expenses are equal to the average account value over the period, multiplied by the Fund’s annualized expense ratio, multiplied by the number of days in the period (181) divided by the number of days in the fiscal year (365). |
| Equinox Ampersand Strategy Fund |
| SUPPLEMENTAL INFORMATION (Unaudited) |
| June 30, 2018 |
| |
Board Consideration in Reducing the Fund’s Investment Advisory Fee
At a special meeting held on June 22, 2018 (the “Meeting”), the Board of Trustees (the “Board”) of Equinox Funds Trust (the “Trust”), including a majority of the Trustees who are not “interested persons” within the meaning of Section 2(a)(19) of the Investment Company Act of 1940, as amended (the “1940 Act”) (the “Independent Trustees”), unanimously approved, effective July 2, 2018, an amendment to the Fund’s investment advisory agreement between the Trust, on behalf of the Fund and Equinox Institutional Asset Management (“EIAM” or the “Adviser”). The investment advisory agreement was amended to reduce the Fund’s investment advisory fee from 0.95% to 0.75% as a percentage of the Fund’s average daily net assets in connection with the Board’s approval of changes to the Fund’s investment strategy to add an enhanced diversification sub-strategy to its overlay strategy. At the Meeting, the Board received and reviewed information from the Adviser regarding the Fund, the Adviser and the services to be provided by the Adviser to the Fund after the changes to the Fund’s investment strategy are implemented. The Adviser discussed the rationale for proposing the fee reduction and investment strategy changes, including market research conducted and the market’s view of funds with similar structures and advisory fee levels. In addition, to the information provided at the Meeting, the Board considered and relied on the information provided at the November 17, 2017 board meeting in connection with the Board’s annual continuation of the investment advisory agreement noting that the Adviser confirmed that the information provided, except for the advisory fee and strategy approved at the Meeting, continued to be materially the same. (Please refer to the Fund’s December 31, 2017 Semi-Annual Report to shareholders for a summary of the factors considered by the Board and the conclusions that formed the basis for the Board’s approval of the continuance of the Investment Advisory Agreement at the November 17, 2017 board meeting.)
Based on a consideration of all the factors in their totality, the Board determined that the new advisory fee was fair and reasonable relative to the services provided under the investment advisory agreement. This information, together with the information provided to the Board throughout the course of the year, formed the primary (but not exclusive) basis for the Board’s determination to approve the amendment to the Fund’s investment advisory agreement.
| Equinox Ampersand Strategy Fund |
| SUPPLEMENTAL INFORMATION (Unaudited)(Continued) |
| June 30, 2018 |
| |
The following tables present certain information regarding the Board of Trustees and officers of the Trust. Each person listed under “Interested Trustees” below is an “interested person” of the Trust, the Adviser, or Distributor, within the meaning of the 1940 Act. Each person who is not an “interested person” of the Trust, the Adviser or the Distributor within the meaning of the 1940 Act is referred to as an “Independent Trustee” and is listed under such heading below. Unless otherwise noted, the address of each Trustee and Officer is 17605 Wright Street, Suite 2, Omaha, NE 68130.
Independent Trustees
Name and Year of
Birth | Position(s)
Held/Term
of Office* | Principal Occupation
During the Last Five Years | Number of
Portfolios in Fund
Complex**
Overseen by
Trustee | Other Directorships*** held by
Trustee During Last Five Years |
David P. Demuth
9/1945 | Trustee Since December 2010 | Consultant, CFO Consulting Partners, LLC (since May 2004). | 5 | None |
Kevin R. Green
7/1954 | Trustee Since December 2010 | CEO of TripleTree Holdings, LLC an Investment Bank, Advisory and Principal Investing business (since 1997). | 5 | Director of BlueCross BlueShield of Minnesota (healthcare services). |
Jay Moorin
7/1951 | Trustee Since December 2010 | Managing Partner, ProQuest Management, LLC (since 1998). | 5 | None |
Interested Trustee
Name and Year of
Birth | Position(s)
Held/Term
of Office* | Principal Occupation
During the Past Five Years | Number of
Portfolios in Fund
Complex**
Overseen by
Trustee | Other Directorships*** held by
Trustee During the Last Five Years |
Robert J. Enck
9/1962 | Chairman, Trustee, President and Principal Executive Officer Since December 2010 | President and Chief Executive Officer, Equinox Institutional Asset Management, LP (since 2015); President and Chief Executive Officer, Equinox Fund Management, LLC (since 2007). | 5 | Executive Committee Member of The Frontier Fund (commodity pool). |
| Equinox Ampersand Strategy Fund |
| SUPPLEMENTAL INFORMATION (Unaudited)(Continued) |
| June 30, 2018 |
| |
Executive Officers
Name and Year of
Birth | Position(s)
Held/Term
of Office* | Principal Occupation
During the Past Five Years | Number of
Portfolios in Fund
Complex**
Overseen by
Trustee | Other Directorships*** held by
Trustee During the Past Five
Years |
Laura Latella
4/1958 | Treasurer, Principal Financial Officer and Secretary Since November 2016 | Chief Financial Officer, Equinox Institutional Asset Management, LP (since May 2016); Consultant, Equinox Institutional Asset Management, LP (January 2016 – April 2016); Treasurer, CFO, Principal, 6800 Capital, LLC (May 1994 – January 2016). Institutional Asset Management, LP (January 2016 – April 2016); Treasurer, CFO, Principal, 6800 Capital, LLC (May 1994 – January 2016). | N/A | N/A |
Laura Szalyga
3/1978 | Assistant Treasurer since August 2014 | Vice President (since 2015) and Assistant Vice President (2011 to 2015) of Fund Administration, Gemini Fund Services, LLC | N/A | N/A |
| Doug Tyre | Chief Compliance Officer and Anti-Money Laundering Officer Since October 13, 2017 | Assistant Compliance Director of Cipperman Compliance Services LLC (since 2014); Client Services & Operations Specialist-Senior Associate of Echo Point Investment Management LLC (2010 – 2014). | N/A | N/A |
| * | Each Trustee and Officer shall serve until death, resignation or removal. |
| ** | The term “Fund Complex” refers to the Equinox Funds Trust. |
| *** | Directorships are held in a company with a class of securities registered pursuant to section 12 of the Securities Exchange Act or subject to the requirements of section 15(d) of the Securities Exchange Act or a company registered as an investment company under the 1940 Act. |
PRIVACY NOTICE
Rev. August 2011
| FACTS | WHAT DOES EQUINOX FUNDS TRUST DO WITH YOUR PERSONAL INFORMATION? |
| | |
| Why? | Financial companies choose how they share your personal information. Federal law gives consumers the right to limit some but not all sharing. Federal law also requires us to tell you how we collect, share, and protect your personal information. Please read this notice carefully to understand what we do. |
| | |
| What? | The types of personal information we collect and share depend on the product or service you have with us. This information can include: |
| | ■ Social Security number ■ Assets ■ Retirement Assets ■ Transaction History ■ Checking Account Information | ■ Purchase History ■ Account Balances ■ Account Transactions ■ Wire Transfer Instructions |
| | |
| | When you are no longer our customer, we continue to share your information as described in this notice. |
| | |
| How? | All financial companies need to share customers’ personal information to run their everyday business. In the section below, we list the reasons financial companies can share their customers’ personal information; the reasons Equinox Funds Trust chooses to share; and whether you can limit this sharing. |
| Reasons we can share your personal information | Does Equinox
Funds Trust
share? | Can you limit this sharing? |
For our everyday business purposes – such as to process your transactions, maintain your account(s), respond to court orders and legal investigations, or report to credit bureaus | Yes | No |
For our marketing purposes – to offer our products and services to you | No | We don’t share |
| For joint marketing with other financial companies | No | We don’t share |
For our affiliates’ everyday business purposes – information about your transactions and experiences | No | We don’t share |
For our affiliates’ everyday business purposes – information about your creditworthiness | No | We don’t share |
| For nonaffiliates to market to you | No | We don’t share |
| Questions? | Call 1-888-643-3431 |
Rev. August 2011
| Who we are |
| Who is providing this notice? | Equinox Funds Trust |
| What we do |
| How does Equinox Funds Trust protect my personal information? | To protect your personal information from unauthorized access and use, we use security measures that comply with federal law. These measures include computer safeguards and secured files and buildings. Our service providers are held accountable for adhering to strict policies and procedures to prevent any misuse of your nonpublic personal information. |
| How does Equinox Funds Trust collect my personal information? | We collect your personal information, for example, when you ■ Open an account ■ Provide account information ■ Give us your contact information ■ Make deposits or withdrawals from your account ■ Make a wire transfer ■ Tell us where to send the money ■ Tells us who receives the money ■ Show your government-issued ID ■ Show your driver’s license We also collect your personal information from other companies. |
| Why can’t I limit all sharing? | Federal law gives you the right to limit only ■ Sharing for affiliates’ everyday business purposes – information about your creditworthiness ■ Affiliates from using your information to market to you ■ Sharing for nonaffiliates to market to you State laws and individual companies may give you additional rights to limit sharing. |
| Definitions |
| Affiliates | Companies related by common ownership or control. They can be financial and nonfinancial companies. ■ Equinox Funds Trust does not share with our affiliates. |
| Nonaffiliates | Companies not related by common ownership or control. They can be financial and nonfinancial companies ■ Equinox Funds Trust does not share with nonaffiliates so they can market to you. |
| Joint marketing | A formal agreement between nonaffiliated financial companies that together market financial products or services to you. ■ Equinox Funds Trust doesn’t jointly market. |
PROXY VOTING POLICY
Information regarding how the Fund voted proxies relating to portfolio securities for the most recent period ended June 30 as well as a description of the policies and procedures that the Fund uses to determine how to vote proxies is available without charge, upon request, by calling 1-888-643-3431 or by referring to the Securities and Exchange Commission’s (“SEC”) website at http://www.sec.gov.
PORTFOLIO HOLDINGS
The Fund files its complete schedule of portfolio holdings with the SEC for the first and third quarters of each fiscal year on Form N-Q. Form N-Q is available on the SEC’s website at http://www.sec.gov and may be reviewed and copied at the SEC’s Public Reference Room in Washington, DC (1-800-SEC-0330). The information on Form N-Q is available without charge, upon request, by calling 1-888-643-3431.
| INVESTMENT ADVISER |
| Equinox Institutional Asset Management, LP |
| 47 Hulfish Street, Suite 510 |
| Princeton, NJ 08542 |
| |
| ADMINISTRATOR |
| Gemini Fund Services, LLC |
| 80 Arkay Drive, Suite 110 |
| Hauppauge, New York 11788 |
(a) As of the end of the period covered by this report, the registrant has adopted a code of ethics that applies to the registrant's principal executive officer, principal financial officer, principal accounting officer or controller, or persons performing similar functions, regardless of whether these individuals are employed by the registrant or a third party.
(b) For purposes of this item, “code of ethics” means written standards that are reasonably designed to deter wrongdoing and to promote:
| (1) | Honest and ethical conduct, including the ethical handling of actual or apparent conflicts of interest between personal and professional relationships; |
| (2) | Full, fair, accurate, timely, and understandable disclosure in reports and documents that a registrant files with, or submits to, the Commission and in other public communications made by the registrant; |
(3) Compliance with applicable governmental laws, rules, and regulations;
| (4) | The prompt internal reporting of violations of the code to an appropriate person or persons identified in the code; and |
(5) Accountability for adherence to the code.
(c) Amendments: During the period covered by the report, there have not been any amendments to the provisions of the code of ethics.
(d) Waivers: During the period covered by the report, the registrant has not granted any express or implicit waivers from the provisions of the code of ethics.
(e) The Code of Ethics is not posted on Registrant’ website.
(f) A copy of the Code of Ethics is attached as an exhibit.
| Item 3. | Audit Committee Financial Expert. |
(a)(1)ii The board of directors of the fund has determined that the fund does not have an audit committee financial expert serving on its audit committee.
(a)(2) Not applicable.
(a)(3) In this regard, no member of the audit committee was identified as having all of the required technical attributes identified in instruction 2 (b) to item 3 of Form N-CSR to qualify as an “audit committee financial expert,” whether through the type of specialized education or experience required by that instruction. At this time, the board believes the experience provided by each member of the audit committee collectively offers the fund adequate oversight by its audit committee given the fund’s level of financial complexity. The board will from time to time reexamine such belief.
Item 4. Principal Accountant Fees and Services.
2018 - $ 17,750
2017 - $ 16,000
2016 - $ 16,000
2015 - $ 20,000
2014 - $ 20,000
2018 - None
2017 - None
2016 - None
2015 - None
2014 - None
2018 - $ 6,250
2017 - $ 6,000
2016 - $ 6,000
2015 - $ 6,000
2014 - $ 6,000
Preparation of Federal & State income tax returns, assistance with calculation of required income, capital gain and excise distributions and preparation of Federal excise tax returns.
2018 - None
2017 - None
2016 - None
2015 - None
2014 - None
(e) (1) Audit Committee’s Pre-Approval Policies
The registrant’s Audit Committee is required to pre-approve all audit services and, when appropriate, any non-audit services (including audit-related, tax and all other services) to the registrant. The registrant’s Audit Committee also is required to pre-approve, when appropriate, any non-audit services (including audit-related, tax and all other services) to its adviser, or any entity controlling, controlled by or under common control with the adviser that provides ongoing services to the registrant, to the extent that the services may be determined to have an impact on the operations or financial reporting of the registrant. Services are reviewed on an engagement by engagement basis by the Audit Committee.
(2) Percentages of Services Approved by the Audit Committee
| | 2018 | 2017 | 2016 | 2015 | 2014 |
| Audit-Related Fees: | 0.00% | 0.00% | 0.00% | 0.00% | 0.00% |
| Tax Fees: | 0.00% | 0.00% | 0.00% | 0.00% | 0.00% |
| All Other Fees: | 0.00% | 0.00% | 0.00% | 0.00% | 0.00% |
| (f) | During the audit of registrant's financial statements for the most recent fiscal year, less than 50 percent of the hours expended on the principal accountant's engagement were attributed to work performed by persons other than the principal accountant's full-time, permanent employees. |
| (g) | The aggregate non-audit fees billed by the registrant's accountant for services rendered to the registrant, and rendered to the registrant's investment adviser (not including any sub-adviser whose role is primarily portfolio management and is subcontracted with or overseen by another investment adviser), and any entity controlling, controlled by, or under common control with the adviser that provides ongoing services to the registrant: |
2018 - None
2017 - None
2016 - None
2015 - None
2014 - None
| (h) | The registrant’s audit committee of the board of trustees has considered whether the provision of non-audit services that were rendered to the registrant’s investment adviser, and any entity controlling, controlled by, or under common control with the investment adviser that provides ongoing services to the registrant that were not pre-approved pursuant to paragraph (c)(7)(ii) of Rule 2-01 of Regulation S-X is compatible with maintaining the principal accountant’s independence. No such services were rendered. |
Item 5. Audit Committee of Listed Companies. Not applicable to open-end investment companies.
Item 6. Schedule of Investments. See Item 1.
Item 7. Disclosure of Proxy Voting Policies and Procedures for Closed-End Funds. Not applicable to open-end investment companies.
Item 8. Portfolio Managers of Closed-End Management Investment Companies. Not applicable to open-end investment companies.
Item 9. Purchases of Equity Securities by Closed-End Funds. Not applicable to open-end investment companies.
Item 10. Submission of Matters to a Vote of Security Holders. None
Item 11. Controls and Procedures.
(a) Based on an evaluation of the Registrant’s disclosure controls and procedures as of a date within 90 days of filing date of this Form N-CSR, the principal executive officer and principal financial officer of the Registrant have concluded that the disclosure controls and procedures of the Registrant are reasonably designed to ensure that the information required in filings on Form N-CSR is recorded, processed, summarized, and reported by the filing date, including that information required to be disclosed is accumulated and communicated to the Registrant’s management, including the Registrant’s principal executive officer and principal financial officer, as appropriate to allow timely decisions regarding required disclosure.
(b) There were no significant changes in the Registrant’s internal control over financial reporting that occurred during the Registrant’s last fiscal half-year that have materially affected, or are reasonably likely to materially affect, the Registrant’s internal control over financial reporting.
Item 12. Exhibits.
(a)(1) Code of Ethics herewith.
(a)(2) Certifications required by Section 302 of the Sarbanes-Oxley Act of 2002 (and Item 12(a)(2) of Form N-CSR) are filed herewith.
(a)(3) Not applicable for open-end investment companies.
(b) Certifications required by Section 906 of the Sarbanes-Oxley Act of 2002 (and Item 12(b) of Form N-CSR) are filed herewith.
SIGNATURES
Pursuant to the requirements of the Securities Exchange Act of 1934 and the Investment Company Act of 1940, the registrant has duly caused this report to be signed on its behalf by the undersigned, thereunto duly authorized.
(Registrant) Equinox Funds Trust
By (Signature and Title)
/s/ Robert J. Enck
Robert J. Enck, Principal Executive Officer
Date 09/07/2018
Pursuant to the requirements of the Securities Exchange Act of 1934 and the Investment Company Act of 1940, this report has been signed below by the following persons on behalf of the registrant and in the capacities and on the dates indicated.
By (Signature and Title)
/s/ Robert J. Enck
Robert J. Enck, Principal Executive Officer
Date 09/07/2018
By (Signature and Title)
/s/ Laura Latella
Laura Latella, Principal Financial Officer
Date 09/07/2018