united states
securities and exchange commission
washington, d.c. 20549
form n-csr
certified shareholder report of registered management
investment companies
Investment Company Act file number 811-22447
Equinox Funds Trust
(Exact name of registrant as specified in charter)
17605 Wright Street Omaha, Nebraska 68130
(Address of principal executive offices) (Zip code)
Rich Malinowski, Gemini Fund Services, LLC.
80 Arkay Drive, Suite 110, Hauppauge, NY 11788
(Name and address of agent for service)
Registrant's telephone number, including area code: 631-470-2619
Date of fiscal year end: 9/30
Date of reporting period: 9/30/18
Item 1. Reports to Stockholders.
| |
| |
| |
| EQUINOX ASPECT CORE DIVERSIFIED |
| STRATEGY FUND |
| |
| |
| CLASS A SHARES: EQAAX |
| CLASS C SHARES: EQACX |
| CLASS I SHARES: EQAIX |
| |
| |
| |
| |
| |
| ANNUAL REPORT |
| SEPTEMBER 30, 2018 |
| |
| |
| |
| |
| 1-888-643-3431 |
| WWW.EQUINOXFUNDS.COM |
| |
| |
| |
| |
This report and the financial statements contained herein are submitted for the general information of shareholders and are not authorized for distribution to prospective investors unless preceded or accompanied by an effective prospectus. Nothing herein contained is to be considered an offer to buy shares of the Equinox Aspect Core Diversified Strategy Fund. Such offering is made only by prospectus, which includes details as to offering price and other material information.
Distributed by Northern Lights Distributors, LLC
Member FINRA

EQUINOX ASPECT CORE DIVERSIFIED STRATEGY FUND
Annual Letter to Shareholders for the year ended September 30, 2018
The Equinox Aspect Core Diversified Strategy Fund (the “Fund”) was launched on November 7, 2014 (Class I Shares, as shown in the table below; Class A and C shares were launched on August 21, 2015).
The Fund’s investment objective is to seek long-term capital appreciation, which is pursued by investing (a) directly or (b) indirectly through its wholly-owned subsidiary, in a combination of
| (i) | exposure to a managed futures trading program offered by Aspect Capital Limited (the “Aspect Program”)1; and |
| (ii) | a fixed-income portfolio. |
PERFORMANCE OF THE FUND
As of 9/30/2018
| NAME | | | TICKER | | | 12 MO
RETURN
(10/1/17-9/30/18) | | | CUMULATIVE
RETURN SINCE
INCEPTION | | | INCEPTION
DATE | |
| Equinox Aspect Core Diversified Strategy Fund – A (with 5.75% maximum sales charge) | | | EQAAX | | | -6.80% | | | -14.27% | | | 8/21/2015 | |
| Equinox Aspect Core Diversified Strategy Fund – A | | | EQAAX | | | -1.08% | | | -9.01% | | | 8/21/2015 | |
| Equinox Aspect Core Diversified Strategy Fund – C | | | EQACX | | | -1.75% | | | -11.17% | | | 8/21/2015 | |
| Equinox Aspect Core Diversified Strategy Fund – I | | | EQAIX | | | -0.76% | | | -1.69% | | | 11/7/2014^ | |
PAST PERFORMANCE DOES NOT GUARANTEE FUTURE RESULTS.
Investments in Managed Futures are speculative, involve substantial risk, and are not suitable for all investors.
Returns for the Fund’s shares for the fiscal year are shown in the table above. The Fund’s primary investment allocation is to the Aspect Program, which is a diversified intermediate to long-term trend-following program. For the year ended September 30, 2018, the Fund’s I shares were down (–0.76%), and performance since inception is also slightly in the red.
In terms of sector attribution, Commodities and Equity Indices were significant positive contributors to performance this year, +326 bps and +270 bps, respectively. Unfortunately, this was entirely
| 1A | “Managed Futures Program” generally is a trading program that a CTA uses to guide its investments in futures, forwards, options or spot contracts. Please see the Fund’s Prospectus for a detailed description of the Fund’s investment strategy. |

nullified by the large negative contribution from Currencies (–603 bps). Interest Rates (–79 bps) also detracted from performance.
As shown below, the Aspect Program’s (and consequently the Fund’s) market exposure is well-diversified across four major sectors. As of year-end, Currencies were the largest gross exposure, followed by Commodities, Equity Indices, and Interest Rates, in that order. It is worth noting that the Aspect Program has long-term target risk exposures to various sectors. The actual sector risk exposures at any time are a function of the signals generated by the trading models: when there are more trends in markets, whether up or down, actual sector risk exposures will tend to be higher. It is also worth distinguishing between “gross” and “net” risk exposures: for example, a sector that has long positions whose risk exposure is 10% and short positions whose risk exposure is –15% will be shown as having a gross risk exposure of 25%, even though its “net” exposure would be only –5% (short).
SECTOR ALLOCATION
As of 9/30/2018
| | COMMODITIES | | | CURRENCIES | | | INTEREST RATES | | | EQUITY INDICES | | | TOTAL | |
| | 28.0% | | | 32.0% | | | 18.7% | | | 21.3% | | | 100.0% | |
FUND PERFORMANCE HIGHLIGHTS
The Fund’s performance for the year was driven mainly by four months, two positive and two negative. Focusing on those months helps explain most of the Fund’s performance for the year.
October 2017
The Fund returned +4.75% in October, its second-best month of the year.
Global stock markets continued to strengthen through October, with major US equity indices setting a succession of record highs amid a general resurgence of risk appetite on both sides of the Atlantic. In the US, a series of news items boosted markets. The easing of tensions with North Korea and a slightly more dovish tone from the Federal Reserve were soon followed by news that the US Senate had adopted a fiscal 2018 budget resolution, opening the way for tax reforms. The end of the month saw a batch of well-received earnings reports from both new technology and established industrial companies, and reports that President Trump was leaning towards a more dovish new chair of the Federal Reserve. Meanwhile, the European Central Bank announced that it would extend its bond-buying scheme until at least September 2018, boosting European markets despite the instability
triggered by the Catalonia crisis. Profits came from long positions in stock indices, while long fixed- income positions also benefited from a general fall in yields. Long positions in the Italian 10Y bond performed particularly strongly, while short positions in the Canadian 10Y bond detracted from performance. In currencies, gains from short Swiss Franc exposure were reduced by losses from long Euro exposure. Oil markets rose amid mounting tensions in the Middle East, together with signs that both Saudi Arabia and Russia might extend output reductions, benefiting long positions. Long positions in industrial metals benefited from the resurgent risk appetite, with copper further boosted by supply concerns following an earthquake in Chile.
January 2018
The Fund returned +6.06% in January, its best month of the year.
Global stock markets continued to perform well in January amid optimism over the world economy for 2018. Robust global economic data early in the month boosted markets, which continued to rise despite concerns about a US government shutdown. The Fund made gains from its net long exposure to stock indices–in particular, Chinese and emerging market indices–which were further helped by strong Chinese export data. Fixed-income also performed strongly, with short positions in US markets among the top performers, as prices fell in line with continued expectations for interest rate rises. Meanwhile, the European Central Bank's hawkish stance weighed on German and French government bonds, leading to losses from long positions. At the World Economic Forum at Davos, the US Treasury Secretary's comments on the favorably weak US Dollar prompted a further sell-off in the currency, leading to gains from short US Dollar positions against Sterling, the Euro and the Australian Dollar. Meanwhile losses came from long US Dollar positions against the Swiss Franc and Japanese Yen. In metals, gains from long positions in nickel were reduced by losses from long copper positions, as prices fell on signs of sluggish demand. Short wheat positions also struggled as prices rose on low seeding figures combined with cold weather in the US. In energy markets, long oil positions performed well as political unrest in Iran and falls in crude stocks pushed prices higher.
February 2018
The Fund returned –8.42% in February, by far its worst month of the year.
Volatility returned to markets with a vengeance during February. Against the longer-term backdrop of a relentless rise in stock markets amid persistently low volatility, the release at the start of February of strong US wage growth – the largest year-on-year rise since the start of the financial crisis – led to inflation fears and expectations that the Federal Reserve might start hiking rates more aggressively than had previously been thought. Stock markets fell, with most of the Fund’s negative performance coming from long stock index positions, in particular from Asian and emerging market indices. As
yields rose in fixed income markets, with the US 10-year yield reaching its highest level since 2014, positive performance came from short positions in US bond and interest rate markets. In currency markets, the US Dollar rose, leading to losses from short US Dollar positions against the Euro and Sterling. In commodity markets, long positions in oils suffered as prices fell, driven by the stronger US Dollar and signs of rising inventories. The stronger US Dollar and rising yields pushed the price of gold lower, leading to losses from long positions.
May 2018
The Fund returned –4.65% in May, its second-worst month of the year.
May was dominated by major geopolitical news, most notably mounting fears about political instability in Italy, which caused Italian bond yields to rise sharply towards the end of the month. Meanwhile in the US, strong economic data initially caused Treasury yields to rise, but an unexpectedly dovish tone from the Federal Reserve later in the month saw them retract. Ongoing trade tensions between the US and China, together with President Trump's decision to cancel a meeting with the North Korean leader, adversely affected stock markets. Additionally, the US withdrawal from the Iranian nuclear deal sent energy markets to multi-year highs, while the US Dollar benefited from inflationary prospects. The political deadlock in Italy combined with the dovish tone in the US led to significant losses from long Italian and short North American fixed income positions. Losses also came from most of the long stock index positions–in particular, from European stock indices–amid the regional uncertainty. The Euro was also undermined, resulting in losses from long EUR/SEK positions. The Swedish Krona rallied on rate hike expectations and news that the Swedish National Debt Office announced that it will attempt to strengthen the currency. Gains, however, came from net short Brazilian Real exposure which fell amid uncertainty over the country's upcoming elections. News of US sanctions on both Iran and Venezuela pushed oil higher, with Brent crude topping $80 per barrel, leading to profits from commodities. Additionally, long nickel positions benefited from increased demand from the stainless steel and clean technology industries.
MARKET COMMENTARY AND OUTLOOK
The Fund’s first fiscal quarter, Q4 of 2017, was yet again dominated alternately by headlines out of Washington DC, natural disasters, geopolitical tensions, and … the seemingly endless rally in global stock markets. There was some acceleration in economic growth, driven mainly by low interest rates
and increased optimism about corporate taxes, even as some pundits wondered about its sustainability.
Still, calendar year 2017 was the ninth year of the stock market rally that began in 2009; this represented 105 months of positive returns for a balanced stock-bond portfolio, the previous record for which had been only about four years. Although they appeared to be in the minority, some of the global macro managers to whom we allocate began making the case that the good times could be nearing the end. They believed that central bank tapering, less liquidity, and higher rates would soon see markets jolted out of the surreally low volatility (at least, as measured by the VIX) that had prevailed. They predicted that nominal asset returns would fall, and real returns would fall even more as inflation returned with a vengeance and central banks scrambled into combat. The “bubble” that had been created by central bank support and exacerbated by growing investor complacency must inevitably pop at some time, they contended.
2018 began on a strong note for equities. US Markets rallied to record levels, with the Nasdaq breaking through 7000, driven by the expanding US economy, growth in corporate profits, and enthusiasm over recently enacted tax-cuts and other business-friendly policies. However, there was some pullback and higher volatility in the final few days of the month, portending perhaps the events that were to come in February. The US dollar sold off, posting its worst January in over a decade and closing at a three-year low following Treasury Secretary Mnuchin’s comments in Davos about “a weaker dollar being good for trade,” which represented a dramatic and unexpected departure from the traditional position long espoused by the US. Meanwhile, increased demand drove oil markets higher, while bonds declined, reflecting a return to a broad “risk-on” climate. The Fund had one of its best months in a long while.
February turned out to be a completely different ball-game. It began with an unexpected rise in US hourly earnings and strong employment numbers, which immediately ignited inflationary fears. This started the dominoes falling: equities lost 10% in a week, with the VIX hitting an intra-day high of 50%. Most CTA programs were caught with substantially long equity positions, boosted by the abnormally low equity market volatility that prevailed during the trailing months. Finally, the equity correction was unexpected and was not preceded by the warning of an increase in volatility, as has often been the case historically. Bonds, the normal asset of choice during a “risk-off” scenario, did rally slightly, but were judged to be less attractive than usual due to the inflationary jitters that had been triggered. All in all, these factors led to a dreadful month, and January’s entire gains were forfeited.
Markets continued to be volatile during March. Tech stocks led markets lower following the revelation of Facebook’s data problems, and President Trump’s attacks on Amazon. The probability of a trade war between the US and China increased as threats of tariffs were exchanged. The Fed announced another quarter-point rate hike and policy makers shifted views in favor of further rate increases. The Bank of Japan announced that there would be no change in its commitment to an accommodative monetary policy. The European Central Bank also kept its policy steady, as expected.
Initially in April, trade tensions escalated, with the Trump Administration proposing additional tariffs on China. However, these concerns later eased, and stock markets recovered, boosted by strong earnings in the US, the ECB's decision to maintain stimulus for the time being, and the Bank of England’s dovish tone. In fixed income, the yield on the US 10Y Treasury rose above 3% for the first time since 2014. Meanwhile, geopolitical tensions in the Middle East caused by military action in Syria and the prospect of reinstated Iranian sanctions pushed oil prices higher.
May was dominated by mounting fears about political instability in Italy, which caused Italian bond yields to rise sharply towards the end of the month. Strong US economic data initially caused Treasury yields to rise further, before unexpectedly dovish rhetoric from the Federal Reserve later in the month saw them subside. Ongoing trade tensions between the US and China, together with President Trump's decision to cancel his North Korea meeting, rattled stock markets, while his reneging on the Iranian nuclear deal sent energy markets to multi-year highs.
During June, markets retained their focus on global trade concerns. The heated rhetoric between the US and its key trade partners, especially China, finally took equities into bear market territory. Continuing tensions rattled financial markets ahead of the G7 summit early in the month, and news of global trade tariffs continued to sour market sentiment. Central bank policy divergence was a key theme as the Federal Reserve announced a rate hike and adopted a generally more hawkish stance, while the European Central Bank announced plans to delay rate hikes.
July began with an escalation of trade tensions as the US imposed tariffs on $34 billion worth of Chinese goods, and China retaliated. However, the risk of an imminent global trade war was alleviated as the US and the EU agreed to work towards trade agreements. Optimism surrounding quarterly corporate earnings coupled with stronger US economic data helped stocks to recover from June’s trade-war induced selloff. The Federal Reserve continued its announced commitment to gradual rate hikes, even as the US yield curve flattened more than it had in the last decade. The dollar came under pressure from trade uncertainty, as did the commodities sector. Global bond yields were temporarily lifted by speculation of shifting Japanese monetary policy and encouraging economic data. WTI crude suffered its worst month since 2016 following increased US and Libyan output and slowing global demand. Gold logged its fourth straight monthly loss.
August witnessed selloffs in emerging markets amid political and monetary policy uncertainty alongside ongoing trade tensions. The US and its major trading partners engaged in negotiations with a positive outcome in the case of Mexico whilst tensions escalated with Canada and others. Despite this backdrop, US stock markets made new highs, spurred on by bouts of optimism and robust earnings. Many European stock indices struggled on fears of contagion from emerging market crises, as evidenced by the mid-month crash in the Turkish Lira. Bonds witnessed a flight to safety. Sterling struggled after the EU expressed a new willingness to maintain a close post-Brexit relationship with the UK. Gold and industrial metal prices experienced extended declines due to a strong US Dollar and
weaker Chinese demand. WTI crude oil rebounded amid lower-than-expected US inventories and supply concerns from Iran and Venezuela.
September saw risk appetites return and US stock indices rally as President Trump's latest levies on Chinese goods were lower than anticipated. As expected, the Federal Reserve raised rates; however, its tone was notably more hawkish, based on stronger US growth and inflation prospects. European markets were shaken after Italy doubled down on its controversial fiscal plans, affecting both equities and Italian bonds. More positive Brexit news and upbeat UK sales data resulted in a Sterling rally. In fixed income, gains were made in short US bond and interest rate positions amid improving US economic conditions, while European bonds incurred offsetting losses. Gold continue to decline, while copper rallied on lower-than expected trade tariffs between the US and China. Oil prices were boosted by undersupply concerns amid Iranian sanctions.
At the risk of sounding like a “broken record,” we believe that there continues to be much latent uncertainty in the markets. In the US, concerns about the potential outcome of multiple investigations into Russia-related financial and electoral scandals fester, particularly against the backdrop of the upcoming elections. Geopolitical stresses continue in Europe (particularly with respect to Brexit and Italy) and the Middle East. Trade-related issues with China and other trading partners are not yet fully resolved. Climate change remains a concern in the form of more severe weather-related events. The Fed’s policy continues to be biased towards higher interest rates, and it will no doubt have an impact on the economy and on equity markets. Surprisingly, equity markets have continued to scale new heights, although October 2018 has seen some pullback.
Investors should bear in mind that CTA programs have historically offered useful diversification benefits, with the potential for attractive risk-adjusted returns over the long run. In fact, managed futures have historically tended to perform well in a wide variety of market conditions, perhaps particularly so during periods of equity market turbulence and volatility expansion. We continue to believe that a significant and strategic allocation to the asset class, while not a “hedge” for equities, nonetheless has the potential to serve investors well in the long run.
Although the Fund has been in operation for a relative short period of time, Aspect Capital has been trading a similar strategy dating back to 1999. Aspect’s program has historically offered useful diversification benefits, along with what we view as attractive risk-adjusted long-term returns over multiple market cycles. In our opinion, the Fund and the managed futures asset class should continue to offer these potential benefits in a market environment that is still challenging and a geopolitical outlook that remains fraught with uncertainty. In fact, managed futures, although not a hedge for equities in the true sense of the word, have historically displayed the ability to earn what has been termed as “crisis alpha:” positive returns during periods when equity markets have collapsed and volatility has increased (this is no guarantee of future results).
Difficult market conditions, the prevailing climate of economic and geopolitical uncertainty, and the unpredictable nature of financial markets all pose challenges for investors. The Aspect program is, we believe, positioned to potentially perform well under these conditions. As always, we encourage investors to focus on holding a portfolio that blends traditional assets with a strategic and meaningful allocation to alternative assets, appropriate for their long-term goals. A well-balanced portfolio may display lower volatility, while also affording opportunities for potential long-term growth. We believe that the managed futures asset class should play an important role in such a portfolio.
Thank you for investing in the Equinox Aspect Core Diversified Strategy Fund.
DEFINITIONS
A Commodity Trading Advisor (“CTA”) is a trader who may invest in more than 150 global futures markets. They seek to generate profit in both bull or bear markets, due to their ability to go long (buy) futures positions, in anticipation of rising markets, or go short (sell) futures positions, in anticipation of falling markets.
A Derivative Contract is a financial contract which derives its value from the performance of another entity such as an asset, index, or interest rate, called the "underlying". Derivatives are one of the three main categories of financial instruments, the other two being equities (i.e. stocks) and debt (i.e. bonds and mortgages).
Long Position refers to the buying of a security such as a stock, commodity or currency, with the expectation that the asset will rise in value.
Risk-adjusted return is a mesuare of the return on an investment relative to the risk of that investment, over a specific period, which is generally expressed as a number or rating.
Short Position is a position whereby an investor sells borrowed securities in anticipation of a price decline and is required to return an equal number of shares at some point in the future.
A Trend Following strategy generally seeks to identify the general direction of one or more global market segments (either up or down) using indicators such as current market prices and moving average prices, and buy or sell investments based on the assessment of these trade signals as determined before a trade is made. Trend-following generally focuses on the direction an investment or global market segment already has gone and not on the direction it may go.
9002-NLD-10/30/2018
| Equinox Aspect Core Diversified Strategy Fund |
| PORTFOLIO REVIEW (Unaudited) |
| September 30, 2018 |
The Fund's performance figures* for the periods ended September 30, 2018, as compared to its benchmark:
| | | | | | | Annualized |
| | | | | | | Since Inception | | Since Inception |
| | | One Year | | Three Years | | (8/21/15) | | (11/5/14) |
| Equinox Aspect Core Diversified Strategy Fund | | | | | | | | |
| Class A with load | | (6.80)% | | (4.92)% | | (4.83)% | | N/A |
| Class A | | (1.08)% | | (3.04)% | | (2.99)% | | N/A |
| Class C | | (1.75)% | | (3.78)% | | (3.74)% | | N/A |
| Class I | | (0.76)% | | (2.81)% | | N/A | | (0.41)% |
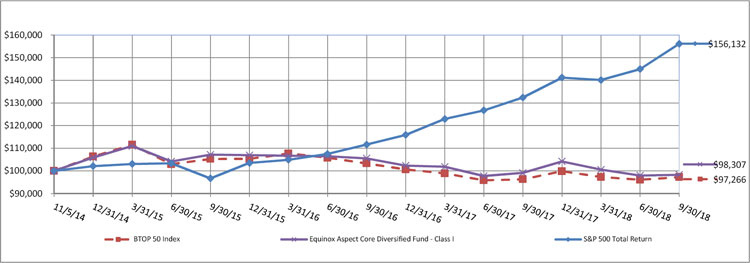
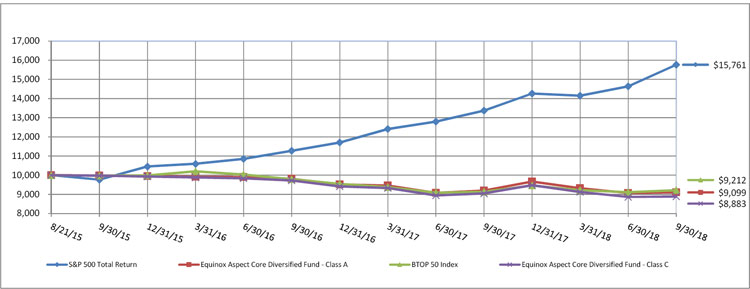
| S&P 500 Total Return Index ^ | | 17.91% | | 17.31% | | 15.76% | | 12.10% |
| BTOP 50 Index ** | | 0.98% | | (2.61)% | | (2.59)% | | (0.71)% |
| * | The performance data quoted is historical. The performance comparison includes reinvestment of all dividends and capital gains and has been adjusted for Class A maximum applicable sales charge of 5.75%. Past performance is no guarantee of future results. Current performance may be higher or lower than the performance data quoted. The principal value and investment return of an investment will fluctuate so that your shares, when redeemed, may be worth more or less than their original cost. The returns shown do not reflect the deduction of taxes that a shareholder would pay on portfolio distributions or on the redemptions of portfolio shares. Performance figures for periods greater than one year are annualized. The returns would have been lower had Equinox Institutional Asset Management, LP (the "Advisor") not waived its fees or reimbursed a portion of the Fund's expenses. Per the fee table in the Fund’s prospectus dated February 1, 2018, the Fund’s “Total Annual Fund Operating Expenses” are 2.47%, 3.17% and 2.18% and the Fund’s “Total Annual Fund Operating Expenses (after Fee Waiver and/or Expense Reimbursement)” are 1.70%, 2.45% and 1.45% for Class A, Class C and Class I shares, respectively, of the Fund’s average daily net assets. These expenses may differ from the actual expenses incurred by the Fund for the period covered by this report. Additional information regarding the Fund’s expense ratios is available in the Financial Highlights. For performance information current to the most recent month-end please call 1-888-643-3431. |
| ^ | The S&P 500 Total Return Index is a widely accepted, unmanaged index of U.S. stock market performance which does not take into account charges, fees and other expenses. Investors cannot invest directly in an index. |
| ** | The Barclay BTOP50 Index ("BTOP50 Index") seeks to replicate the overall composition of the managed futures industry with regard to trading style and overall market exposure. The BTOP50 Index employs a top-down approach in selecting its constituents. The largest investable trading advisor programs, as measured by assets under management, are selected for inclusion in the BTOP50 Index. In each calendar year the selected trading advisors represent, in aggregate, no less than 50% of the investable assets of the Barclay CTA Universe. For 2018, there are 20 funds in the BTOP50 Index. Investors cannot invest directly in an index. |
Comparison of the Change in Value of a $100,000 Investment
| Equinox Aspect Core Diversified Strategy Fund |
| PORTFOLIO REVIEW (Unaudited)(Continued) |
| September 30, 2018 |
Comparison of the Change in Value of a $10,000 Investment
| Holdings by Asset Class | | % of Net Assets | |
| U.S. Treasury Notes | | | 84.1 | % |
| Other Assets Less Liabilities | | | 15.9 | % |
| | | | 100.0 | % |
Please refer to the Consolidated Portfolio of Investments in this annual report for a detail of the Fund’s holdings. The value of the Fund’s derivative positions that provide exposure to a managed futures program is included in “other assets less liabilities;” however, the portfolio composition detailed above does not include derivatives exposure. See the accompanying notes for more information on the impact of the Fund’s derivative positions on the consolidated financial statements.
Equinox Aspect Core Diversified Strategy Fund
CONSOLIDATED PORTFOLIO OF INVESTMENTS
September 30, 2018
| Principal | | | | | Coupon Rate | | | | | |
| Amount | | | | | (%) | | Maturity | | Fair Value | |
| | | | | U.S. TREASURY NOTES - 84.1% | | | | | | | | |
| $ | 13,000,000 | | | United States Treasury Note | | 1.2500 | | 11/30/2018 | | $ | 12,980,695 | |
| | 3,750,000 | | | United States Treasury Note * | | 1.2500 | | 1/31/2020 | | | 3,677,783 | |
| | 1,500,000 | | | United States Treasury Note * | | 1.5000 | | 2/28/2019 | | | 1,494,668 | |
| | 3,000,000 | | | United States Treasury Note | | 1.5000 | | 10/31/2019 | | | 2,962,559 | |
| | 3,000,000 | | | United States Treasury Note | | 1.5000 | | 4/15/2020 | | | 2,943,164 | |
| | 3,750,000 | | | United States Treasury Note * | | 1.6250 | | 7/31/2019 | | | 3,720,557 | |
| | 3,750,000 | | | United States Treasury Note * | | 2.0000 | | 7/31/2020 | | | 3,696,753 | |
| | | | | TOTAL U.S. TREASURY NOTES (Cost - $31,532,663) | | | 31,476,179 | |
| | | | | | | | | | | | | |
| | | | | | | | | | | | | |
| | | | | TOTAL INVESTMENTS - 84.1% (Cost - $31,532,663) | | $ | 31,476,179 | |
| | | | | OTHER ASSETS AND LIABILITIES - NET - 15.9% | | | 5,938,258 | |
| | | | | TOTAL NET ASSETS - 100.0% | | | | $ | 37,414,437 | |
| * | All or a portion of the security is held as collateral. Total collateralized securities had a value of $2,966,355 on September 30, 2018. |
See accompanying notes to consolidated financial statements.
Equinox Aspect Core Diversified Strategy Fund
CONSOLIDATED PORTFOLIO OF INVESTMENTS (Continued)
September 30, 2018
SHORT FUTURES CONTRACTS
| | | | | | | | | | | | Unrealized | |
| | | Number of | | | | | | Notional Value at | | | Appreciation/ | |
| Description | | Contracts | | Counterparty | | Expiration Date | | September 30, 2018 | | | (Depreciation) | |
| 3 Month Euro (EURIBOR) | | 1 | | Morgan Stanley | | Dec-20 | | | 289,475 | | | $ | 148 | |
| 3 Month Euro (EURIBOR) | | 4 | | Morgan Stanley | | Mar-21 | | | 1,156,855 | | | | 460 | |
| 90 Day Euro Future | | 2 | | Morgan Stanley | | Mar-19 | | | 485,800 | | | | 338 | |
| 90 Day Euro Future | | 30 | | Morgan Stanley | | Jun-19 | | | 7,275,750 | | | | 5,375 | |
| 90 Day Euro Future | | 67 | | Morgan Stanley | | Sep-19 | | | 16,234,100 | | | | 16,700 | |
| 90 Day Euro Future | | 60 | | Morgan Stanley | | Dec-19 | | | 14,529,000 | | | | 17,375 | |
| 90 Day Euro Future | | 61 | | Morgan Stanley | | Mar-20 | | | 14,767,338 | | | | 17,900 | |
| 90 Day Euro Future | | 54 | | Morgan Stanley | | Jun-20 | | | 13,072,050 | | | | 17,375 | |
| 90 Day Euro Future | | 44 | | Morgan Stanley | | Sep-20 | | | 10,651,850 | | | | 13,625 | |
| 90 Day Euro Future | | 40 | | Morgan Stanley | | Dec-20 | | | 9,683,500 | | | | 11,688 | |
| 90 Day Euro Future | | 34 | | Morgan Stanley | | Mar-21 | | | 8,232,675 | | | | 10,838 | |
| 90 Day Sterling (Short Sterling) Future | | 8 | | Morgan Stanley | | Jun-19 | | | 1,290,359 | | | | 331 | |
| 90 Day Sterling (Short Sterling) Future | | 19 | | Morgan Stanley | | Sep-19 | | | 3,061,815 | | | | 2,270 | |
| 90 Day Sterling (Short Sterling) Future | | 13 | | Morgan Stanley | | Dec-19 | | | 2,093,230 | | | | 198 | |
| 90 Day Sterling (Short Sterling) Future | | 12 | | Morgan Stanley | | Mar-20 | | | 1,931,039 | | | | 265 | |
| 90 Day Sterling (Short Sterling) Future | | 18 | | Morgan Stanley | | Jun-20 | | | 2,894,798 | | | | 2,923 | |
| 90 Day Sterling (Short Sterling) Future | | 28 | | Morgan Stanley | | Sep-20 | | | 4,500,281 | | | | 678 | |
| 90 Day Sterling (Short Sterling) Future | | 31 | | Morgan Stanley | | Dec-20 | | | 4,979,927 | | | | 1,315 | |
| 90 Day Sterling (Short Sterling) Future | | 16 | | Morgan Stanley | | Mar-21 | | | 2,568,981 | | | | 345 | |
| Australian 3 Year Bond Future | | 18 | | Morgan Stanley | | Dec-18 | | | 1,449,122 | | | | (2,130 | ) |
| Australian 10 Year Bond Future | | 16 | | Morgan Stanley | | Dec-18 | | | 1,491,706 | | | | (5,847 | ) |
| Australian Dollar Future | | 12 | | Morgan Stanley | | Dec-18 | | | 867,240 | | | | (10,870 | ) |
| British Pound Future | | 16 | | Morgan Stanley | | Dec-18 | | | 1,308,600 | | | | 7,656 | |
| Canadian 10 Year Bond Future | | 29 | | Morgan Stanley | | Dec-18 | | | 2,975,383 | | | | (393 | ) |
| Canadian Dollar Future | | 57 | | Morgan Stanley | | Dec-18 | | | 4,417,785 | | | | (67,105 | ) |
| Cocoa Future + | | 2 | | Morgan Stanley | | Dec-18 | | | 41,140 | | | | 1,920 | |
| Cocoa Future + | | 2 | | Morgan Stanley | | Mar-19 | | | 41,640 | | | | 1,910 | |
| Coffee Future + | | 22 | | Morgan Stanley | | Dec-18 | | | 845,213 | | | | 55,369 | |
| Coffee Future + | | 16 | | Morgan Stanley | | Mar-19 | | | 635,100 | | | | 35,681 | |
| Coffee Future + | | 15 | | Morgan Stanley | | May-19 | | | 608,906 | | | | 32,663 | |
| Copper Future + | | 5 | | Morgan Stanley | | Dec-18 | | | 350,625 | | | | (22,088 | ) |
| Corn Future + | | 3 | | Morgan Stanley | | Dec-18 | | | 53,438 | | | | (1,200 | ) |
| Corn Future + | | 2 | | Morgan Stanley | | Mar-19 | | | 36,800 | | | | (862 | ) |
| Euro BOBL Future | | 54 | | Morgan Stanley | | Dec-18 | | | 8,197,641 | | | | 13,434 | |
| Euro-Bund Future | | 18 | | Morgan Stanley | | Dec-18 | | | 3,319,825 | | | | (1,644 | ) |
| Euro BUXL 30 Year Bond Future | | 5 | | Morgan Stanley | | Dec-18 | | | 1,012,364 | | | | (6,966 | ) |
| Euro FX Future | | 25 | | Morgan Stanley | | Dec-18 | | | 3,650,625 | | | | 9,681 | |
| Euro Schatz Future | | 21 | | Morgan Stanley | | Dec-18 | | | 2,726,362 | | | | 588 | |
| FTSE/JSE Africa Top 40 Index Future | | 1 | | Morgan Stanley | | Dec-18 | | | 35,417 | | | | 766 | |
| Gold 100 Oz. Future + | | 26 | | Morgan Stanley | | Dec-18 | | | 3,110,120 | | | | 49,440 | |
| Hard Red Winter Wheat Future + | | 4 | | Morgan Stanley | | Dec-18 | | | 102,250 | | | | 1,450 | |
| Japanese Yen Future | | 132 | | Morgan Stanley | | Dec-18 | | | 14,609,100 | | | | 209,331 | |
| Lean Hogs Future + | | 8 | | Morgan Stanley | | Dec-18 | | | 185,360 | | | | (20,330 | ) |
| Lean Hogs Future + | | 3 | | Morgan Stanley | | Feb-19 | | | 79,020 | | | | (2,400 | ) |
| Live Cattle Future + | | 3 | | Morgan Stanley | | Dec-18 | | | 142,620 | | | | (5,890 | ) |
| LME Copper Future + | | 1 | | Morgan Stanley | | Dec-18 | | | 156,563 | | | | (9,810 | ) |
| LME Nickle Future + | | 1 | | Morgan Stanley | | Dec-18 | | | 75,552 | | | | (1,240 | ) |
| LME Primary Aluminum Future + | | 6 | | Morgan Stanley | | Dec-18 | | | 311,325 | | | | (2,770 | ) |
| Long Gilt Future | | 19 | | Morgan Stanley | | Dec-18 | | | 2,996,527 | | | | (2,874 | ) |
| New Zealand Dollar Future | | 21 | | Morgan Stanley | | Dec-18 | | | 1,392,510 | | | | (24,255 | ) |
| Silver Future + | | 11 | | Morgan Stanley | | Dec-18 | | | 809,160 | | | | (14,390 | ) |
| Soybean Future + | | 31 | | Morgan Stanley | | Nov-18 | | | 1,310,525 | | | | (525 | ) |
See accompanying notes to consolidated financial statements.
| Equinox Aspect Core Diversified Strategy Fund |
| CONSOLIDATED PORTFOLIO OF INVESTMENTS (Continued) |
| September 30, 2018 |
SHORT FUTURES CONTRACTS (Continued)
| | | | | | | | | | | | Unrealized | |
| | | Number of | | | | | | Notional Value at | | | Appreciation/ | |
| Description | | Contracts | | Counterparty | | Expiration Date | | September 30, 2018 | | | (Depreciation) | |
| Soybean Meal Future + | | 24 | | Morgan Stanley | | Dec-18 | | | 741,600 | | | $ | 23,470 | |
| US 2 Year Note (CBT) Future | | 105 | | Morgan Stanley | | Dec-18 | | | 22,127,109 | | | | 46,922 | |
| US 5 Year Note (CBT) Future | | 162 | | Morgan Stanley | | Dec-18 | | | 18,221,203 | | | | 119,516 | |
| US 10 Year Note (CBT) Future | | 99 | | Morgan Stanley | | Dec-18 | | | 11,759,344 | | | | 116,875 | |
| US Long Bond Future | | 4 | | Morgan Stanley | | Dec-18 | | | 562,000 | | | | (625 | ) |
| US Ultra Bond Future | | 2 | | Morgan Stanley | | Dec-18 | | | 308,563 | | | | (719 | ) |
| Wheat (CBT) Future + | | 4 | | Morgan Stanley | | Dec-18 | | | 101,800 | | | | 1,200 | |
| Wheat (CBT) Future + | | 2 | | Morgan Stanley | | Mar-19 | | | 52,725 | | | | (75 | ) |
| World Sugar #11 Future + | | 1 | | Morgan Stanley | | Feb-19 | | | 12,544 | | | | (358 | ) |
| World Sugar #11 Future + | | 6 | | Morgan Stanley | | Apr-19 | | | 75,869 | | | | 661 | |
| | | | | | | | | | | | | | 643,314 | |
| LONG FUTURES CONTRACTS | | | | | | | | | | | | | | |
| 90 Day Bank Bill Future | | 7 | | Morgan Stanley | | Jun-19 | | | 5,040,366 | | | | (300 | ) |
| 90 Day Bank Bill Future | | 5 | | Morgan Stanley | | Sep-19 | | | 3,599,820 | | | | (229 | ) |
| 90 Day Bank Bill Future | | 13 | | Morgan Stanley | | Dec-19 | | | 9,358,154 | | | | (716 | ) |
| 90 Day Bank Bill Future | | 27 | | Morgan Stanley | | Mar-20 | | | 19,433,783 | | | | (3,662 | ) |
| 90 Day Bank Bill Future | | 4 | | Morgan Stanley | | Jun-20 | | | 2,878,655 | | | | (649 | ) |
| AEX Index (Amsterdam) Future | | 10 | | Morgan Stanley | | Oct-18 | | | 1,276,373 | | | | 10,915 | |
| Brent Crude Future + | | 13 | | Morgan Stanley | | Oct-18 | | | 1,075,490 | | | | 75,940 | |
| Brent Crude Future + | | 6 | | Morgan Stanley | | Nov-18 | | | 493,440 | | | | 25,280 | |
| CAC 40 10 Euro Future | | 27 | | Morgan Stanley | | Oct-18 | | | 1,721,536 | | | | 37,812 | |
| Swiss Franc Future | | 21 | | Morgan Stanley | | Dec-18 | | | 2,699,550 | | | | (43,525 | ) |
| Dax Index Future | | 3 | | Morgan Stanley | | Dec-18 | | | 1,066,388 | | | | 1,473 | |
| DJIA Index E-Mini Future | | 15 | | Morgan Stanley | | Dec-18 | | | 1,985,700 | | | | 14,545 | |
| E-Mini Russell 2000 Index Future | | 19 | | Morgan Stanley | | Dec-18 | | | 1,615,760 | | | | (17,735 | ) |
| Euro-BTP Italian Government Bond Future | | 1 | | Morgan Stanley | | Dec-18 | | | 143,840 | | | | (3,463 | ) |
| Euro OAT Future | | 10 | | Morgan Stanley | | Dec-18 | | | 1,754,447 | | | | (16,995 | ) |
| Euro STOXX 50 Future | | 31 | | Morgan Stanley | | Dec-18 | | | 1,219,541 | | | | 10,118 | |
| FTSE 100 Index Future | | 10 | | Morgan Stanley | | Dec-18 | | | 976,278 | | | | 19,944 | |
| Gasoline RBOB Future + | | 14 | | Morgan Stanley | | Oct-18 | | | 1,226,392 | | | | 48,590 | |
| Hang Seng Index Future | | 1 | | Morgan Stanley | | Oct-18 | | | 178,130 | | | | 1,509 | |
| HSCEI Future | | 1 | | Morgan Stanley | | Oct-18 | | | 70,697 | | | | 32 | |
| Japan 10 Year Bond Future | | 2 | | Morgan Stanley | | Dec-18 | | | 2,642,779 | | | | (3,378 | ) |
| Live Cattle Future + | | 1 | | Morgan Stanley | | Feb-19 | | | 49,120 | | | | 360 | |
| Live Cattle Future + | | 2 | | Morgan Stanley | | Apr-19 | | | 99,120 | | | | 880 | |
| Low Sulfur Gas Oil Future + | | 15 | | Morgan Stanley | | Nov-18 | | | 1,086,375 | | | | 62,225 | |
| Low Sulfur Gas Oil Future + | | 7 | | Morgan Stanley | | Dec-18 | | | 504,875 | | | | 30,700 | |
| Mexican Peso Future | | 43 | | Morgan Stanley | | Dec-18 | | | 1,134,985 | | | | 19,435 | |
| Mini MSCI EAFE Index Future | | 7 | | Morgan Stanley | | Dec-18 | | | 691,425 | | | | 1,030 | |
| Nasdaq 100 E-Mini Future | | 8 | | Morgan Stanley | | Dec-18 | | | 1,224,840 | | | | 17,973 | |
| Natural Gas Future + | | 2 | | Morgan Stanley | | Oct-18 | | | 60,160 | | | | 230 | |
| Natural Gas Future + | | 1 | | Morgan Stanley | | Nov-18 | | | 30,910 | | | | 200 | |
| Nikkei 225 Index (CME) Future | | 5 | | Morgan Stanley | | Dec-18 | | | 604,625 | | | | 30,600 | |
| Nikkei 225 Index (SGX) Future | | 6 | | Morgan Stanley | | Dec-18 | | | 637,716 | | | | 33,954 | |
| NY Harbor ULSD Heating Oil Future + | | 10 | | Morgan Stanley | | Oct-18 | | | 986,370 | | | | 48,997 | |
| NY Harbor ULSD Heating Oil Future + | | 5 | | Morgan Stanley | | Nov-18 | | | 494,046 | | | | 20,328 | |
| OMXS30 Index Future | | 161 | | Morgan Stanley | | Oct-18 | | | 3,005,218 | | | | 50,113 | |
| S&P 500 E-Mini Future | | 13 | | Morgan Stanley | | Dec-18 | | | 1,897,350 | | | | 5,140 | |
| S&P Midcap 400 E-Mini Future | | 9 | | Morgan Stanley | | Dec-18 | | | 1,822,680 | | | | (17,280 | ) |
| S&P/TSX 60 IX Future | | 13 | | Morgan Stanley | | Dec-18 | | | 1,911,481 | | | | 3,598 | |
| SPI 200 Future | | 17 | | Morgan Stanley | | Dec-18 | | | 1,904,709 | | | | 10,298 | |
See accompanying notes to consolidated financial statements.
Equinox Aspect Core Diversified Strategy Fund
CONSOLIDATED PORTFOLIO OF INVESTMENTS (Continued)
LONG FUTURES CONTRACTS (Continued)
| | | | | | | | | | | | Unrealized | |
| | | Number of | | | | | | Notional Value at | | | Appreciation/ | |
| Description | | Contracts | | Counterparty | | Expiration Date | | September 30, 2018 | | | (Depreciation) | |
| TOPIX Index Future | | 7 | | Morgan Stanley | | Dec-18 | | | 1,120,086 | | | $ | 62,391 | |
| WTI Crude Oil Future + | | 10 | | Morgan Stanley | | Oct-18 | | | 732,500 | | | | 46,210 | |
| WTI Crude Oil Future + | | 5 | | Morgan Stanley | | Nov-18 | | | 365,300 | | | | 21,230 | |
| | | | | | | | | | | | | | 604,118 | |
| NET UNREALIZED APPRECIATION ON FUTURES CONTRACTS | | | $ | 1,247,432 | |
| + | This investment is a holding of Equinox Aspect Core Diversified Strategy Fund Limited. |
See accompanying notes to consolidated financial statements.
| Equinox Aspect Core Diversified Fund |
| CONSOLIDATED PORTFOLIO OF INVESTMENTS (Continued) |
| September 30, 2018 |
Schedule of Forward Foreign Currency Contracts
| Settlement | | | | Currency Units to | | | | | | Unrealized Appreciation | |
| Date | | Counterparty | | Receive/Deliver | | In Exchange For | | (Depreciation) | |
| 12/19/2018 | | Morgan Stanley | | 420,696 | | BRL | | 100,000 | | USD | | $ | 4,673 | |
| 12/19/2018 | | Morgan Stanley | | 209,848 | | BRL | | 50,000 | | USD | | | 2,212 | |
| 12/19/2018 | | Morgan Stanley | | 206,098 | | BRL | | 50,000 | | USD | | | 1,279 | |
| 12/19/2018 | | Morgan Stanley | | 209,798 | | BRL | | 50,000 | | USD | | | 2,200 | |
| 12/19/2018 | | Morgan Stanley | | 207,723 | | BRL | | 50,000 | | USD | | | 1,683 | |
| 12/19/2018 | | Morgan Stanley | | 206,348 | | BRL | | 50,000 | | USD | | | 1,341 | |
| 12/19/2018 | | Morgan Stanley | | 208,350 | | BRL | | 50,000 | | USD | | | 1,839 | |
| 12/19/2018 | | Morgan Stanley | | 202,265 | | BRL | | 50,000 | | USD | | | 325 | |
| 12/19/2018 | | Morgan Stanley | | 33,409,175 | | CLP | | 50,000 | | USD | | | 696 | |
| 12/19/2018 | | Morgan Stanley | | 33,299,675 | | CLP | | 50,000 | | USD | | | 530 | |
| 12/19/2018 | | Morgan Stanley | | 33,644,675 | | CLP | | 50,000 | | USD | | | 1,053 | |
| 12/19/2018 | | Morgan Stanley | | 33,239,675 | | CLP | | 50,000 | | USD | | | 439 | |
| 12/19/2018 | | Morgan Stanley | | 32,964,675 | | CLP | | 50,000 | | USD | | | 22 | |
| 12/19/2018 | | Morgan Stanley | | 151,848,575 | | COP | | 50,000 | | USD | | | 1,053 | |
| 12/19/2018 | | Morgan Stanley | | 151,435,575 | | COP | | 50,000 | | USD | | | 914 | |
| 12/19/2018 | | Morgan Stanley | | 150,848,575 | | COP | | 50,000 | | USD | | | 717 | |
| 12/19/2018 | | Morgan Stanley | | 150,748,575 | | COP | | 50,000 | | USD | | | 683 | |
| 12/19/2018 | | Morgan Stanley | | 151,048,575 | | COP | | 50,000 | | USD | | | 784 | |
| 12/19/2018 | | Morgan Stanley | | 149,778,000 | | COP | | 50,000 | | USD | | | 357 | |
| 12/19/2018 | | Morgan Stanley | | 150,298,575 | | COP | | 50,000 | | USD | | | 532 | |
| 12/19/2018 | | Morgan Stanley | | 149,799,500 | | COP | | 50,000 | | USD | | | 364 | |
| 12/19/2018 | | Morgan Stanley | | 1,287,637 | | CZK | | 50,000 | | EUR | | | (172 | ) |
| 12/19/2018 | | Morgan Stanley | | 1,287,300 | | CZK | | 50,000 | | EUR | | | (187 | ) |
| 12/19/2018 | | Morgan Stanley | | 1,282,550 | | CZK | | 50,000 | | EUR | | | (402 | ) |
| 12/19/2018 | | Morgan Stanley | | 639,967 | | CZK | | 25,000 | | EUR | | | (260 | ) |
| 12/19/2018 | | Morgan Stanley | | 640,092 | | CZK | | 25,000 | | EUR | | | (255 | ) |
| 12/19/2018 | | Morgan Stanley | | 639,221 | | CZK | | 25,000 | | EUR | | | (294 | ) |
| 12/19/2018 | | Morgan Stanley | | 639,426 | | CZK | | 25,000 | | EUR | | | (285 | ) |
| 12/19/2018 | | Morgan Stanley | | 638,694 | | CZK | | 25,000 | | EUR | | | (318 | ) |
| 12/19/2018 | | Morgan Stanley | | 638,965 | | CZK | | 25,000 | | EUR | | | (306 | ) |
| 12/19/2018 | | Morgan Stanley | | 638,669 | | CZK | | 25,000 | | EUR | | | (319 | ) |
| 12/19/2018 | | Morgan Stanley | | 638,740 | | CZK | | 25,000 | | EUR | | | (316 | ) |
| 12/19/2018 | | Morgan Stanley | | 638,601 | | CZK | | 25,000 | | EUR | | | (322 | ) |
| 12/19/2018 | | Morgan Stanley | | 638,690 | | CZK | | 25,000 | | EUR | | | (318 | ) |
| 12/19/2018 | | Morgan Stanley | | 1,277,730 | | CZK | | 50,000 | | EUR | | | (620 | ) |
See accompanying notes to consolidated financial statements.
Equinox Aspect Core Diversified Fund
CONSOLIDATED PORTFOLIO OF INVESTMENTS (Continued)
September 30, 2018
Schedule of Forward Foreign Currency Contracts
| Settlement | | | | Currency Units to | | | | | | Unrealized Appreciation | |
| Date | | Counterparty | | Receive/Deliver | | In Exchange For | | (Depreciation) | |
| 12/19/2018 | | Morgan Stanley | | 638,394 | | CZK | | 25,000 | | EUR | | $ | (331 | ) |
| 12/19/2018 | | Morgan Stanley | | 638,415 | | CZK | | 25,000 | | EUR | | | (331 | ) |
| 12/19/2018 | | Morgan Stanley | | 637,849 | | CZK | | 25,000 | | EUR | | | (356 | ) |
| 12/19/2018 | | Morgan Stanley | | 637,874 | | CZK | | 25,000 | | EUR | | | (355 | ) |
| 12/19/2018 | | Morgan Stanley | | 637,799 | | CZK | | 25,000 | | EUR | | | (358 | ) |
| 12/19/2018 | | Morgan Stanley | | 637,845 | | CZK | | 25,000 | | EUR | | | (356 | ) |
| 12/19/2018 | | Morgan Stanley | | 1,279,160 | | CZK | | 50,000 | | EUR | | | (556 | ) |
| 12/19/2018 | | Morgan Stanley | | 640,777 | | CZK | | 25,000 | | EUR | | | (224 | ) |
| 12/19/2018 | | Morgan Stanley | | 640,902 | | CZK | | 25,000 | | EUR | | | (218 | ) |
| 12/19/2018 | | Morgan Stanley | | 1,282,210 | | CZK | | 50,000 | | EUR | | | (417 | ) |
| 12/19/2018 | | Morgan Stanley | | 25,000 | | EUR | | 641,948 | | CZK | | | 171 | |
| 12/19/2018 | | Morgan Stanley | | 25,000 | | EUR | | 642,073 | | CZK | | | 165 | |
| 12/19/2018 | | Morgan Stanley | | 25,000 | | EUR | | 644,963 | | CZK | | | 34 | |
| 12/19/2018 | | Morgan Stanley | | 25,000 | | EUR | | 645,163 | | CZK | | | 25 | |
| 12/19/2018 | | Morgan Stanley | | 25,000 | | EUR | | 646,430 | | CZK | | | (32 | ) |
| 12/19/2018 | | Morgan Stanley | | 25,000 | | EUR | | 646,605 | | CZK | | | (40 | ) |
| 12/19/2018 | | Morgan Stanley | | 600,000 | | EUR | | 195,311,734 | | HUF | | | (4,360 | ) |
| 12/19/2018 | | Morgan Stanley | | 500,000 | | EUR | | 162,568,279 | | HUF | | | (2,941 | ) |
| 12/19/2018 | | Morgan Stanley | | 800,000 | | EUR | | 7,778,878 | | NOK | | | (22,983 | ) |
| 12/19/2018 | | Morgan Stanley | | 1,600,000 | | EUR | | 16,858,859 | | SEK | | | (38,175 | ) |
| 12/19/2018 | | Morgan Stanley | | 3,200,000 | | EUR | | 33,718,077 | | SEK | | | (76,391 | ) |
| 12/19/2018 | | Morgan Stanley | | 100,000 | | EUR | | 1,053,943 | | SEK | | | (2,416 | ) |
| 12/19/2018 | | Morgan Stanley | | 2,400,000 | | EUR | | 25,392,118 | | SEK | | | (69,023 | ) |
| 12/19/2018 | | Morgan Stanley | | 1,100,000 | | EUR | | 11,647,239 | | SEK | | | (32,676 | ) |
| 12/19/2018 | | Morgan Stanley | | 1,200,000 | | EUR | | 12,595,619 | | SEK | | | (23,135 | ) |
| 12/19/2018 | | Morgan Stanley | | 32,538,179 | | HUF | | 100,000 | | EUR | | | 677 | |
| 12/19/2018 | | Morgan Stanley | | 32,367,449 | | HUF | | 100,000 | | EUR | | | 60 | |
| 12/19/2018 | | Morgan Stanley | | 32,421,829 | | HUF | | 100,000 | | EUR | | | 256 | |
| 12/19/2018 | | Morgan Stanley | | 177,860 | | ILS | | 50,000 | | USD | | | (775 | ) |
| 12/19/2018 | | Morgan Stanley | | 177,925 | | ILS | | 50,000 | | USD | | | (757 | ) |
| 12/19/2018 | | Morgan Stanley | | 178,077 | | ILS | | 50,000 | | USD | | | (715 | ) |
| 12/19/2018 | | Morgan Stanley | | 178,122 | | ILS | | 50,000 | | USD | | | (702 | ) |
| 12/19/2018 | | Morgan Stanley | | 355,253 | | ILS | | 100,000 | | USD | | | (1,679 | ) |
| 12/19/2018 | | Morgan Stanley | | 177,286 | | ILS | | 50,000 | | USD | | | (934 | ) |
| 12/19/2018 | | Morgan Stanley | | 88,649 | | ILS | | 25,000 | | USD | | | (465 | ) |
See accompanying notes to consolidated financial statements.
| Equinox Aspect Core Diversified Fund |
| CONSOLIDATED PORTFOLIO OF INVESTMENTS (Continued) |
| September 30, 2018 |
Schedule of Forward Foreign Currency Contracts
| Settlement | | | | Currency Units to | | | | | | Unrealized Appreciation | |
| Date | | Counterparty | | Receive/Deliver | | In Exchange For | | (Depreciation) | |
| 12/19/2018 | | Morgan Stanley | | 88,656 | | ILS | | 25,000 | | USD | | $ | (463 | ) |
| 12/19/2018 | | Morgan Stanley | | 55,420,935 | | KRW | | 50,000 | | USD | | | 65 | |
| 12/19/2018 | | Morgan Stanley | | 110,618,870 | | KRW | | 100,000 | | USD | | | (72 | ) |
| 12/19/2018 | | Morgan Stanley | | 55,264,435 | | KRW | | 50,000 | | USD | | | (77 | ) |
| 12/19/2018 | | Morgan Stanley | | 55,494,435 | | KRW | | 50,000 | | USD | | | 131 | |
| 12/19/2018 | | Morgan Stanley | | 55,619,435 | | KRW | | 50,000 | | USD | | | 244 | |
| 12/19/2018 | | Morgan Stanley | | 111,053,040 | | KRW | | 100,000 | | USD | | | 320 | |
| 12/19/2018 | | Morgan Stanley | | 110,728,870 | | KRW | | 100,000 | | USD | | | 28 | |
| 12/19/2018 | | Morgan Stanley | | 237,729 | | NOK | | 25,000 | | EUR | | | 58 | |
| 12/19/2018 | | Morgan Stanley | | 237,792 | | NOK | | 25,000 | | EUR | | | 65 | |
| 12/19/2018 | | Morgan Stanley | | 237,721 | | NOK | | 25,000 | | EUR | | | 57 | |
| 12/19/2018 | | Morgan Stanley | | 237,771 | | NOK | | 25,000 | | EUR | | | 63 | |
| 12/19/2018 | | Morgan Stanley | | 237,826 | | NOK | | 25,000 | | EUR | | | 70 | |
| 12/19/2018 | | Morgan Stanley | | 237,876 | | NOK | | 25,000 | | EUR | | | 76 | |
| 12/19/2018 | | Morgan Stanley | | 237,389 | | NOK | | 25,000 | | EUR | | | 16 | |
| 12/19/2018 | | Morgan Stanley | | 237,475 | | NOK | | 25,000 | | EUR | | | 26 | |
| 12/19/2018 | | Morgan Stanley | | 237,478 | | NOK | | 25,000 | | EUR | | | 27 | |
| 12/19/2018 | | Morgan Stanley | | 237,564 | | NOK | | 25,000 | | EUR | | | 37 | |
| 12/19/2018 | | Morgan Stanley | | 237,049 | | NOK | | 25,000 | | EUR | | | (26 | ) |
| 12/19/2018 | | Morgan Stanley | | 237,074 | | NOK | | 25,000 | | EUR | | | (23 | ) |
| 12/19/2018 | | Morgan Stanley | | 242,277 | | NOK | | 25,000 | | EUR | | | 618 | |
| 12/19/2018 | | Morgan Stanley | | 242,340 | | NOK | | 25,000 | | EUR | | | 626 | |
| 12/19/2018 | | Morgan Stanley | | 484,465 | | NOK | | 50,000 | | EUR | | | 1,225 | |
| 12/19/2018 | | Morgan Stanley | | 241,742 | | NOK | | 25,000 | | EUR | | | 552 | |
| 12/19/2018 | | Morgan Stanley | | 241,779 | | NOK | | 25,000 | | EUR | | | 557 | |
| 12/19/2018 | | Morgan Stanley | | 241,743 | | NOK | | 25,000 | | EUR | | | 552 | |
| 12/19/2018 | | Morgan Stanley | | 241,751 | | NOK | | 25,000 | | EUR | | | 553 | |
| 12/19/2018 | | Morgan Stanley | | 241,668 | | NOK | | 25,000 | | EUR | | | 543 | |
| 12/19/2018 | | Morgan Stanley | | 241,681 | | NOK | | 25,000 | | EUR | | | 545 | |
| 12/19/2018 | | Morgan Stanley | | 241,002 | | NOK | | 25,000 | | EUR | | | 462 | |
| 12/19/2018 | | Morgan Stanley | | 241,114 | | NOK | | 25,000 | | EUR | | | 475 | |
| 12/19/2018 | | Morgan Stanley | | 240,976 | | NOK | | 25,000 | | EUR | | | 458 | |
| 12/19/2018 | | Morgan Stanley | | 241,001 | | NOK | | 25,000 | | EUR | | | 461 | |
| 12/19/2018 | | Morgan Stanley | | 240,283 | | NOK | | 25,000 | | EUR | | | 372 | |
| 12/19/2018 | | Morgan Stanley | | 240,423 | | NOK | | 25,000 | | EUR | | | 390 | |
See accompanying notes to consolidated financial statements.
| Equinox Aspect Core Diversified Fund |
| CONSOLIDATED PORTFOLIO OF INVESTMENTS (Continued) |
| September 30, 2018 |
Schedule of Forward Foreign Currency Contracts
| Settlement | | | | Currency Units to | | | | | | Unrealized Appreciation | |
| Date | | Counterparty | | Receive/Deliver | | In Exchange For | | (Depreciation) | |
| 12/19/2018 | | Morgan Stanley | | 240,458 | | NOK | | 25,000 | | EUR | | $ | 394 | |
| 12/19/2018 | | Morgan Stanley | | 240,600 | | NOK | | 25,000 | | EUR | | | 411 | |
| 12/19/2018 | | Morgan Stanley | | 240,608 | | NOK | | 25,000 | | EUR | | | 412 | |
| 12/19/2018 | | Morgan Stanley | | 240,633 | | NOK | | 25,000 | | EUR | | | 415 | |
| 12/19/2018 | | Morgan Stanley | | 240,420 | | NOK | | 25,000 | | EUR | | | 389 | |
| 12/19/2018 | | Morgan Stanley | | 240,533 | | NOK | | 25,000 | | EUR | | | 403 | |
| 12/19/2018 | | Morgan Stanley | | 240,249 | | NOK | | 25,000 | | EUR | | | 368 | |
| 12/19/2018 | | Morgan Stanley | | 240,274 | | NOK | | 25,000 | | EUR | | | 371 | |
| 12/19/2018 | | Morgan Stanley | | 240,317 | | NOK | | 25,000 | | EUR | | | 376 | |
| 12/19/2018 | | Morgan Stanley | | 240,349 | | NOK | | 25,000 | | EUR | | | 380 | |
| 12/19/2018 | | Morgan Stanley | | 240,539 | | NOK | | 25,000 | | EUR | | | 404 | |
| 12/19/2018 | | Morgan Stanley | | 240,686 | | NOK | | 25,000 | | EUR | | | 422 | |
| 12/19/2018 | | Morgan Stanley | | 240,957 | | NOK | | 25,000 | | EUR | | | 455 | |
| 12/19/2018 | | Morgan Stanley | | 241,007 | | NOK | | 25,000 | | EUR | | | 461 | |
| 12/19/2018 | | Morgan Stanley | | 241,188 | | NOK | | 25,000 | | EUR | | | 484 | |
| 12/19/2018 | | Morgan Stanley | | 241,282 | | NOK | | 25,000 | | EUR | | | 495 | |
| 12/19/2018 | | Morgan Stanley | | 241,470 | | NOK | | 25,000 | | EUR | | | 519 | |
| 12/19/2018 | | Morgan Stanley | | 241,627 | | NOK | | 25,000 | | EUR | | | 538 | |
| 12/19/2018 | | Morgan Stanley | | 241,541 | | NOK | | 25,000 | | EUR | | | 527 | |
| 12/19/2018 | | Morgan Stanley | | 241,604 | | NOK | | 25,000 | | EUR | | | 535 | |
| 12/19/2018 | | Morgan Stanley | | 241,331 | | NOK | | 25,000 | | EUR | | | 501 | |
| 12/19/2018 | | Morgan Stanley | | 241,381 | | NOK | | 25,000 | | EUR | | | 508 | |
| 12/19/2018 | | Morgan Stanley | | 241,320 | | NOK | | 25,000 | | EUR | | | 500 | |
| 12/19/2018 | | Morgan Stanley | | 241,419 | | NOK | | 25,000 | | EUR | | | 512 | |
| 12/19/2018 | | Morgan Stanley | | 241,475 | | NOK | | 25,000 | | EUR | | | 519 | |
| 12/19/2018 | | Morgan Stanley | | 241,525 | | NOK | | 25,000 | | EUR | | | 525 | |
| 12/19/2018 | | Morgan Stanley | | 241,459 | | NOK | | 25,000 | | EUR | | | 517 | |
| 12/19/2018 | | Morgan Stanley | | 241,546 | | NOK | | 25,000 | | EUR | | | 528 | |
| 12/19/2018 | | Morgan Stanley | | 240,517 | | NOK | | 25,000 | | EUR | | | 401 | |
| 12/19/2018 | | Morgan Stanley | | 240,604 | | NOK | | 25,000 | | EUR | | | 412 | |
| 12/19/2018 | | Morgan Stanley | | 240,362 | | NOK | | 25,000 | | EUR | | | 382 | |
| 12/19/2018 | | Morgan Stanley | | 240,524 | | NOK | | 25,000 | | EUR | | | 402 | |
| 12/19/2018 | | Morgan Stanley | | 240,199 | | NOK | | 25,000 | | EUR | | | 362 | |
| 12/19/2018 | | Morgan Stanley | | 240,249 | | NOK | | 25,000 | | EUR | | | 368 | |
| 12/19/2018 | | Morgan Stanley | | 240,122 | | NOK | | 25,000 | | EUR | | | 353 | |
See accompanying notes to consolidated financial statements.
| Equinox Aspect Core Diversified Fund |
| CONSOLIDATED PORTFOLIO OF INVESTMENTS (Continued) |
| September 30, 2018 |
Schedule of Forward Foreign Currency Contracts
| Settlement | | | | Currency Units to | | | | | | Unrealized Appreciation | |
| Date | | Counterparty | | Receive/Deliver | | In Exchange For | | (Depreciation) | |
| 12/19/2018 | | Morgan Stanley | | 240,147 | | NOK | | 25,000 | | EUR | | $ | 356 | |
| 12/19/2018 | | Morgan Stanley | | 239,593 | | NOK | | 25,000 | | EUR | | | 287 | |
| 12/19/2018 | | Morgan Stanley | | 239,685 | | NOK | | 25,000 | | EUR | | | 299 | |
| 12/19/2018 | | Morgan Stanley | | 239,470 | | NOK | | 25,000 | | EUR | | | 272 | |
| 12/19/2018 | | Morgan Stanley | | 239,483 | | NOK | | 25,000 | | EUR | | | 274 | |
| 12/19/2018 | | Morgan Stanley | | 239,498 | | NOK | | 25,000 | | EUR | | | 276 | |
| 12/19/2018 | | Morgan Stanley | | 239,536 | | NOK | | 25,000 | | EUR | | | 280 | |
| 12/19/2018 | | Morgan Stanley | | 239,490 | | NOK | | 25,000 | | EUR | | | 275 | |
| 12/19/2018 | | Morgan Stanley | | 239,565 | | NOK | | 25,000 | | EUR | | | 284 | |
| 12/19/2018 | | Morgan Stanley | | 479,077 | | NOK | | 50,000 | | EUR | | | 561 | |
| 12/19/2018 | | Morgan Stanley | | 238,756 | | NOK | | 25,000 | | EUR | | | 184 | |
| 12/19/2018 | | Morgan Stanley | | 238,793 | | NOK | | 25,000 | | EUR | | | 189 | |
| 12/19/2018 | | Morgan Stanley | | 238,731 | | NOK | | 25,000 | | EUR | | | 181 | |
| 12/19/2018 | | Morgan Stanley | | 238,906 | | NOK | | 25,000 | | EUR | | | 203 | |
| 12/19/2018 | | Morgan Stanley | | 239,495 | | NOK | | 25,000 | | EUR | | | 275 | |
| 12/19/2018 | | Morgan Stanley | | 239,508 | | NOK | | 25,000 | | EUR | | | 277 | |
| 12/19/2018 | | Morgan Stanley | | 239,250 | | NOK | | 25,000 | | EUR | | | 245 | |
| 12/19/2018 | | Morgan Stanley | | 239,284 | | NOK | | 25,000 | | EUR | | | 249 | |
| 12/19/2018 | | Morgan Stanley | | 238,920 | | NOK | | 25,000 | | EUR | | | 204 | |
| 12/19/2018 | | Morgan Stanley | | 239,270 | | NOK | | 25,000 | | EUR | | | 247 | |
| 12/19/2018 | | Morgan Stanley | | 238,917 | | NOK | | 25,000 | | EUR | | | 204 | |
| 12/19/2018 | | Morgan Stanley | | 238,942 | | NOK | | 25,000 | | EUR | | | 207 | |
| 12/19/2018 | | Morgan Stanley | | 238,754 | | NOK | | 25,000 | | EUR | | | 184 | |
| 12/19/2018 | | Morgan Stanley | | 238,817 | | NOK | | 25,000 | | EUR | | | 192 | |
| 12/19/2018 | | Morgan Stanley | | 482,014 | | NOK | | 50,000 | | EUR | | | 923 | |
| 12/19/2018 | | Morgan Stanley | | 480,714 | | NOK | | 50,000 | | EUR | | | 763 | |
| 12/19/2018 | | Morgan Stanley | | 480,819 | | NOK | | 50,000 | | EUR | | | 776 | |
| 12/19/2018 | | Morgan Stanley | | 479,994 | | NOK | | 50,000 | | EUR | | | 674 | |
| 12/19/2018 | | Morgan Stanley | | 479,701 | | NOK | | 50,000 | | EUR | | | 638 | |
| 12/19/2018 | | Morgan Stanley | | 479,595 | | NOK | | 50,000 | | EUR | | | 625 | |
| 12/19/2018 | | Morgan Stanley | | 479,865 | | NOK | | 50,000 | | EUR | | | 658 | |
| 12/19/2018 | | Morgan Stanley | | 479,860 | | NOK | | 50,000 | | EUR | | | 658 | |
| 12/19/2018 | | Morgan Stanley | | 478,987 | | NOK | | 50,000 | | EUR | | | 550 | |
| 12/19/2018 | | Morgan Stanley | | 239,429 | | NOK | | 25,000 | | EUR | | | 267 | |
| 12/19/2018 | | Morgan Stanley | | 239,454 | | NOK | | 25,000 | | EUR | | | 270 | |
See accompanying notes to consolidated financial statements.
| Equinox Aspect Core Diversified Fund |
| CONSOLIDATED PORTFOLIO OF INVESTMENTS (Continued) |
| September 30, 2018 |
Schedule of Forward Foreign Currency Contracts
| Settlement | | | | Currency Units to | | | | | | Unrealized Appreciation | |
| Date | | Counterparty | | Receive/Deliver | | In Exchange For | | (Depreciation) | |
| 12/19/2018 | | Morgan Stanley | | 478,533 | | NOK | | 50,000 | | EUR | | $ | 494 | |
| 12/19/2018 | | Morgan Stanley | | 477,585 | | NOK | | 50,000 | | EUR | | | 377 | |
| 12/19/2018 | | Morgan Stanley | | 238,512 | | NOK | | 25,000 | | EUR | | | 154 | |
| 12/19/2018 | | Morgan Stanley | | 238,575 | | NOK | | 25,000 | | EUR | | | 162 | |
| 12/19/2018 | | Morgan Stanley | | 238,561 | | NOK | | 25,000 | | EUR | | | 160 | |
| 12/19/2018 | | Morgan Stanley | | 238,649 | | NOK | | 25,000 | | EUR | | | 171 | |
| 12/19/2018 | | Morgan Stanley | | 238,587 | | NOK | | 25,000 | | EUR | | | 163 | |
| 12/19/2018 | | Morgan Stanley | | 238,637 | | NOK | | 25,000 | | EUR | | | 169 | |
| 12/19/2018 | | Morgan Stanley | | 237,808 | | NOK | | 25,000 | | EUR | | | 67 | |
| 12/19/2018 | | Morgan Stanley | | 237,896 | | NOK | | 25,000 | | EUR | | | 78 | |
| 12/19/2018 | | Morgan Stanley | | 238,130 | | NOK | | 25,000 | | EUR | | | 107 | |
| 12/19/2018 | | Morgan Stanley | | 238,180 | | NOK | | 25,000 | | EUR | | | 113 | |
| 12/19/2018 | | Morgan Stanley | | 107,183 | | PLN | | 25,000 | | EUR | | | (101 | ) |
| 12/19/2018 | | Morgan Stanley | | 107,193 | | PLN | | 25,000 | | EUR | | | (98 | ) |
| 12/19/2018 | | Morgan Stanley | | 107,233 | | PLN | | 25,000 | | EUR | | | (88 | ) |
| 12/19/2018 | | Morgan Stanley | | 107,346 | | PLN | | 25,000 | | EUR | | | (57 | ) |
| 12/19/2018 | | Morgan Stanley | | 1,082,932 | | PLN | | 250,000 | | EUR | | | 2,006 | |
| 12/19/2018 | | Morgan Stanley | | 215,916 | | PLN | | 50,000 | | EUR | | | 219 | |
| 12/19/2018 | | Morgan Stanley | | 215,606 | | PLN | | 50,000 | | EUR | | | 135 | |
| 12/19/2018 | | Morgan Stanley | | 215,627 | | PLN | | 50,000 | | EUR | | | 140 | |
| 12/19/2018 | | Morgan Stanley | | 107,763 | | PLN | | 25,000 | | EUR | | | 57 | |
| 12/19/2018 | | Morgan Stanley | | 107,774 | | PLN | | 25,000 | | EUR | | | 60 | |
| 12/19/2018 | | Morgan Stanley | | 215,832 | | PLN | | 50,000 | | EUR | | | 196 | |
| 12/19/2018 | | Morgan Stanley | | 107,589 | | PLN | | 25,000 | | EUR | | | 9 | |
| 12/19/2018 | | Morgan Stanley | | 107,598 | | PLN | | 25,000 | | EUR | | | 12 | |
| 12/19/2018 | | Morgan Stanley | | 107,327 | | PLN | | 25,000 | | EUR | | | (62 | ) |
| 12/19/2018 | | Morgan Stanley | | 107,354 | | PLN | | 25,000 | | EUR | | | (55 | ) |
| 12/19/2018 | | Morgan Stanley | | 107,299 | | PLN | | 25,000 | | EUR | | | (70 | ) |
| 12/19/2018 | | Morgan Stanley | | 107,319 | | PLN | | 25,000 | | EUR | | | (64 | ) |
| 12/19/2018 | | Morgan Stanley | | 6,891,900 | | RUB | | 100,000 | | USD | | | 4,333 | |
| 12/19/2018 | | Morgan Stanley | | 3,379,486 | | RUB | | 50,000 | | USD | | | 1,161 | |
| 12/19/2018 | | Morgan Stanley | | 6,703,971 | | RUB | | 100,000 | | USD | | | 1,489 | |
| 12/19/2018 | | Morgan Stanley | | 6,674,971 | | RUB | | 100,000 | | USD | | | 1,049 | |
| 12/19/2018 | | Morgan Stanley | | 3,334,500 | | RUB | | 50,000 | | USD | | | 480 | |
| 12/19/2018 | | Morgan Stanley | | 6,623,971 | | RUB | | 100,000 | | USD | | | 277 | |
See accompanying notes to consolidated financial statements.
| Equinox Aspect Core Diversified Fund |
| CONSOLIDATED PORTFOLIO OF INVESTMENTS (Continued) |
| September 30, 2018 |
Schedule of Forward Foreign Currency Contracts
| Settlement | | | | Currency Units to | | | | | | Unrealized Appreciation | |
| Date | | Counterparty | | Receive/Deliver | | In Exchange For | | (Depreciation) | |
| 12/19/2018 | | Morgan Stanley | | 6,645,000 | | RUB | | 100,000 | | USD | | $ | 596 | |
| 12/19/2018 | | Morgan Stanley | | 3,320,000 | | RUB | | 50,000 | | USD | | | 260 | |
| 12/19/2018 | | Morgan Stanley | | 6,609,971 | | RUB | | 100,000 | | USD | | | 65 | |
| 12/19/2018 | | Morgan Stanley | | 514,652 | | SEK | | 50,000 | | EUR | | | (187 | ) |
| 12/19/2018 | | Morgan Stanley | | 257,389 | | SEK | | 25,000 | | EUR | | | (87 | ) |
| 12/19/2018 | | Morgan Stanley | | 257,451 | | SEK | | 25,000 | | EUR | | | (79 | ) |
| 12/19/2018 | | Morgan Stanley | | 1,029,154 | | SEK | | 100,000 | | EUR | | | (392 | ) |
| 12/19/2018 | | Morgan Stanley | | 774,147 | | SEK | | 75,000 | | EUR | | | (35 | ) |
| 12/19/2018 | | Morgan Stanley | | 258,111 | | SEK | | 25,000 | | EUR | | | (5 | ) |
| 12/19/2018 | | Morgan Stanley | | 262,117 | | SEK | | 25,000 | | EUR | | | 449 | |
| 12/19/2018 | | Morgan Stanley | | 262,154 | | SEK | | 25,000 | | EUR | | | 453 | |
| 12/19/2018 | | Morgan Stanley | | 524,359 | | SEK | | 50,000 | | EUR | | | 912 | |
| 12/19/2018 | | Morgan Stanley | | 1,043,684 | | SEK | | 100,000 | | EUR | | | 1,254 | |
| 12/19/2018 | | Morgan Stanley | | 1,043,063 | | SEK | | 100,000 | | EUR | | | 1,183 | |
| 12/19/2018 | | Morgan Stanley | | 525,457 | | SEK | | 50,000 | | EUR | | | 1,036 | |
| 12/19/2018 | | Morgan Stanley | | 526,408 | | SEK | | 50,000 | | EUR | | | 1,144 | |
| 12/19/2018 | | Morgan Stanley | | 527,164 | | SEK | | 50,000 | | EUR | | | 1,230 | |
| 12/19/2018 | | Morgan Stanley | | 263,632 | | SEK | | 25,000 | | EUR | | | 621 | |
| 12/19/2018 | | Morgan Stanley | | 263,645 | | SEK | | 25,000 | | EUR | | | 622 | |
| 12/19/2018 | | Morgan Stanley | | 260,678 | | SEK | | 25,000 | | EUR | | | 286 | |
| 12/19/2018 | | Morgan Stanley | | 260,728 | | SEK | | 25,000 | | EUR | | | 292 | |
| 12/19/2018 | | Morgan Stanley | | 260,753 | | SEK | | 25,000 | | EUR | | | 294 | |
| 12/19/2018 | | Morgan Stanley | | 260,766 | | SEK | | 25,000 | | EUR | | | 296 | |
| 12/19/2018 | | Morgan Stanley | | 1,038,690 | | SEK | | 100,000 | | EUR | | | 688 | |
| 12/19/2018 | | Morgan Stanley | | 1,037,633 | | SEK | | 100,000 | | EUR | | | 569 | |
| 12/19/2018 | | Morgan Stanley | | 518,495 | | SEK | | 50,000 | | EUR | | | 248 | |
| 12/19/2018 | | Morgan Stanley | | 259,273 | | SEK | | 25,000 | | EUR | | | 127 | |
| 12/19/2018 | | Morgan Stanley | | 259,310 | | SEK | | 25,000 | | EUR | | | 131 | |
| 12/19/2018 | | Morgan Stanley | | 516,303 | | SEK | | 50,000 | | EUR | | | — | |
| 12/19/2018 | | Morgan Stanley | | 516,378 | | SEK | | 50,000 | | EUR | | | 8 | |
| 12/19/2018 | | Morgan Stanley | | 516,542 | | SEK | | 50,000 | | EUR | | | 27 | |
| 12/19/2018 | | Morgan Stanley | | 258,309 | | SEK | | 25,000 | | EUR | | | 18 | |
| 12/19/2018 | | Morgan Stanley | | 258,359 | | SEK | | 25,000 | | EUR | | | 23 | |
| 12/19/2018 | | Morgan Stanley | | 516,471 | | SEK | | 50,000 | | EUR | | | 19 | |
| 12/19/2018 | | Morgan Stanley | | 516,721 | | SEK | | 50,000 | | EUR | | | 47 | |
See accompanying notes to consolidated financial statements.
| Equinox Aspect Core Diversified Fund |
| CONSOLIDATED PORTFOLIO OF INVESTMENTS (Continued) |
| September 30, 2018 |
Schedule of Forward Foreign Currency Contracts
| Settlement | | | | Currency Units to | | | | | | Unrealized Appreciation | |
| Date | | Counterparty | | Receive/Deliver | | In Exchange For | | (Depreciation) | |
| 12/19/2018 | | Morgan Stanley | | 258,213 | | SEK | | 25,000 | | EUR | | $ | 7 | |
| 12/19/2018 | | Morgan Stanley | | 258,218 | | SEK | | 25,000 | | EUR | | | 7 | |
| 12/19/2018 | | Morgan Stanley | | 258,371 | | SEK | | 25,000 | | EUR | | | 25 | |
| 12/19/2018 | | Morgan Stanley | | 258,409 | | SEK | | 25,000 | | EUR | | | 29 | |
| 12/19/2018 | | Morgan Stanley | | 258,229 | | SEK | | 25,000 | | EUR | | | 9 | |
| 12/19/2018 | | Morgan Stanley | | 516,582 | | SEK | | 50,000 | | EUR | | | 31 | |
| 12/19/2018 | | Morgan Stanley | | 258,404 | | SEK | | 25,000 | | EUR | | | 28 | |
| 12/19/2018 | | Morgan Stanley | | 259,064 | | SEK | | 25,000 | | EUR | | | 103 | |
| 12/19/2018 | | Morgan Stanley | | 518,253 | | SEK | | 50,000 | | EUR | | | 220 | |
| 12/19/2018 | | Morgan Stanley | | 259,189 | | SEK | | 25,000 | | EUR | | | 117 | |
| 12/19/2018 | | Morgan Stanley | | 257,820 | | SEK | | 25,000 | | EUR | | | (38 | ) |
| 12/19/2018 | | Morgan Stanley | | 257,907 | | SEK | | 25,000 | | EUR | | | (28 | ) |
| 12/19/2018 | | Morgan Stanley | | 257,917 | | SEK | | 25,000 | | EUR | | | (27 | ) |
| 12/19/2018 | | Morgan Stanley | | 257,932 | | SEK | | 25,000 | | EUR | | | (25 | ) |
| 12/19/2018 | | Morgan Stanley | | 776,528 | | SEK | | 75,000 | | EUR | | | 234 | |
| 12/19/2018 | | Morgan Stanley | | 258,943 | | SEK | | 25,000 | | EUR | | | 89 | |
| 12/19/2018 | | Morgan Stanley | | 1,036,977 | | SEK | | 100,000 | | EUR | | | 494 | |
| 12/19/2018 | | Morgan Stanley | | 1,034,649 | | SEK | | 100,000 | | EUR | | | 231 | |
| 12/19/2018 | | Morgan Stanley | | 514,983 | | SEK | | 50,000 | | EUR | | | (150 | ) |
| 12/19/2018 | | Morgan Stanley | | 515,283 | | SEK | | 50,000 | | EUR | | | (116 | ) |
| 12/19/2018 | | Morgan Stanley | | 68,513 | | SGD | | 50,000 | | USD | | | 233 | |
| 12/19/2018 | | Morgan Stanley | | 68,271 | | SGD | | 50,000 | | USD | | | 55 | |
| 12/19/2018 | | Morgan Stanley | | 68,447 | | SGD | | 50,000 | | USD | | | 184 | |
| 12/19/2018 | | Morgan Stanley | | 68,339 | | SGD | | 50,000 | | USD | | | 105 | |
| 12/19/2018 | | Morgan Stanley | | 68,302 | | SGD | | 50,000 | | USD | | | 78 | |
| 12/19/2018 | | Morgan Stanley | | 68,055 | | SGD | | 50,000 | | USD | | | (103 | ) |
| 12/19/2018 | | Morgan Stanley | | 68,195 | | SGD | | 50,000 | | USD | | | (1 | ) |
| 12/19/2018 | | Morgan Stanley | | 68,158 | | SGD | | 50,000 | | USD | | | (28 | ) |
| 12/19/2018 | | Morgan Stanley | | 34,088 | | SGD | | 25,000 | | USD | | | (7 | ) |
| 12/19/2018 | | Morgan Stanley | | 34,089 | | SGD | | 25,000 | | USD | | | (6 | ) |
| 12/19/2018 | | Morgan Stanley | | 68,114 | | SGD | | 50,000 | | USD | | | (60 | ) |
| 12/19/2018 | | Morgan Stanley | | 68,236 | | SGD | | 50,000 | | USD | | | 30 | |
| 12/19/2018 | | Morgan Stanley | | 1,621,234 | | THB | | 50,000 | | USD | | | 264 | |
| 12/19/2018 | | Morgan Stanley | | 1,618,789 | | THB | | 50,000 | | USD | | | 188 | |
| 12/19/2018 | | Morgan Stanley | | 1,610,119 | | THB | | 50,000 | | USD | | | (81 | ) |
See accompanying notes to consolidated financial statements.
Equinox Aspect Core Diversified Fund
CONSOLIDATED PORTFOLIO OF INVESTMENTS (Continued)
September 30, 2018
Schedule of Forward Foreign Currency Contracts
| Settlement | | | | Currency Units to | | | | | | Unrealized Appreciation | |
| Date | | Counterparty | | Receive/Deliver | | In Exchange For | | (Depreciation) | |
| 12/19/2018 | | Morgan Stanley | | 1,615,914 | | THB | | 50,000 | | USD | | $ | 99 | |
| 12/19/2018 | | Morgan Stanley | | 1,617,644 | | THB | | 50,000 | | USD | | | 152 | |
| 12/19/2018 | | Morgan Stanley | | 1,616,824 | | THB | | 50,000 | | USD | | | 127 | |
| 12/19/2018 | | Morgan Stanley | | 1,614,339 | | THB | | 50,000 | | USD | | | 50 | |
| 12/19/2018 | | Morgan Stanley | | 641,456 | | TRY | | 100,000 | | USD | | | 1,284 | |
| 12/19/2018 | | Morgan Stanley | | 3,060,800 | | TWD | | 100,000 | | USD | | | 828 | |
| 12/19/2018 | | Morgan Stanley | | 1,529,350 | | TWD | | 50,000 | | USD | | | 379 | |
| 12/19/2018 | | Morgan Stanley | | 1,527,743 | | TWD | | 50,000 | | USD | | | 327 | |
| 12/19/2018 | | Morgan Stanley | | 1,532,943 | | TWD | | 50,000 | | USD | | | 498 | |
| 12/19/2018 | | Morgan Stanley | | 1,530,243 | | TWD | | 50,000 | | USD | | | 409 | |
| 12/19/2018 | | Morgan Stanley | | 3,064,500 | | TWD | | 100,000 | | USD | | | 950 | |
| 12/19/2018 | | Morgan Stanley | | 1,200,000 | | USD | | 5,039,447 | | BRL | | | (53,861 | ) |
| 12/19/2018 | | Morgan Stanley | | 50,000 | | USD | | 210,007 | | BRL | | | (2,252 | ) |
| 12/19/2018 | | Morgan Stanley | | 550,000 | | USD | | 371,666,075 | | CLP | | | (13,978 | ) |
| 12/19/2018 | | Morgan Stanley | | 50,000 | | USD | | 33,970,325 | | CLP | | | (1,548 | ) |
| 12/19/2018 | | Morgan Stanley | | 50,000 | | USD | | 34,587,825 | | CLP | | | (2,485 | ) |
| 12/19/2018 | | Morgan Stanley | | 50,000 | | USD | | 34,380,325 | | CLP | | | (2,170 | ) |
| 12/19/2018 | | Morgan Stanley | | 50,000 | | USD | | 34,150,325 | | CLP | | | (1,821 | ) |
| 12/19/2018 | | Morgan Stanley | | 50,000 | | USD | | 34,425,325 | | CLP | | | (2,238 | ) |
| 12/19/2018 | | Morgan Stanley | | 50,000 | | USD | | 34,530,325 | | CLP | | | (2,397 | ) |
| 12/19/2018 | | Morgan Stanley | | 50,000 | | USD | | 34,940,325 | | CLP | | | (3,020 | ) |
| 12/19/2018 | | Morgan Stanley | | 50,000 | | USD | | 34,550,325 | | CLP | | | (2,428 | ) |
| 12/19/2018 | | Morgan Stanley | | 50,000 | | USD | | 34,120,325 | | CLP | | | (1,775 | ) |
| 12/19/2018 | | Morgan Stanley | | 50,000 | | USD | | 33,637,825 | | CLP | | | (1,043 | ) |
| 12/19/2018 | | Morgan Stanley | | 100,000 | | USD | | 304,692,850 | | COP | | | (2,441 | ) |
| 12/19/2018 | | Morgan Stanley | | 100,000 | | USD | | 310,102,850 | | COP | | | (4,260 | ) |
| 12/19/2018 | | Morgan Stanley | | 50,000 | | USD | | 155,801,425 | | COP | | | (2,382 | ) |
| 12/19/2018 | | Morgan Stanley | | 100,000 | | USD | | 310,102,850 | | COP | | | (4,260 | ) |
| 12/19/2018 | | Morgan Stanley | | 100,000 | | USD | | 309,402,850 | | COP | | | (4,024 | ) |
| 12/19/2018 | | Morgan Stanley | | 50,000 | | USD | | 155,551,425 | | COP | | | (2,298 | ) |
| 12/19/2018 | | Morgan Stanley | | 2,700,000 | | USD | | 9,621,045 | | ILS | | | 37,239 | |
| 12/19/2018 | | Morgan Stanley | | 100,000 | | USD | | 358,735 | | ILS | | | 715 | |
| 12/19/2018 | | Morgan Stanley | | 300,000 | | USD | | 21,467,280 | | INR | | | 6,830 | |
| 12/19/2018 | | Morgan Stanley | | 100,000 | | USD | | 7,187,532 | | INR | | | 1,843 | |
| 12/19/2018 | | Morgan Stanley | | 150,000 | | USD | | 10,803,048 | | INR | | | 2,467 | |
See accompanying notes to consolidated financial statements.
| Equinox Aspect Core Diversified Fund |
| CONSOLIDATED PORTFOLIO OF INVESTMENTS (Continued) |
| September 30, 2018 |
Schedule of Forward Foreign Currency Contracts
| Settlement | | | | Currency Units to | | | | | | Unrealized Appreciation | |
| Date | | Counterparty | | Receive/Deliver | | In Exchange For | | (Depreciation) | |
| 12/19/2018 | | Morgan Stanley | | 150,000 | | USD | | 10,779,048 | | INR | | $ | 2,795 | |
| 12/19/2018 | | Morgan Stanley | | 50,000 | | USD | | 3,621,016 | | INR | | | 549 | |
| 12/19/2018 | | Morgan Stanley | | 100,000 | | USD | | 7,309,532 | | INR | | | 177 | |
| 12/19/2018 | | Morgan Stanley | | 100,000 | | USD | | 7,309,032 | | INR | | | 184 | |
| 12/19/2018 | | Morgan Stanley | | 50,000 | | USD | | 3,642,016 | | INR | | | 263 | |
| 12/19/2018 | | Morgan Stanley | | 50,000 | | USD | | 3,666,750 | | INR | | | (75 | ) |
| 12/19/2018 | | Morgan Stanley | | 50,000 | | USD | | 3,679,516 | | INR | | | (250 | ) |
| 12/19/2018 | | Morgan Stanley | | 50,000 | | USD | | 3,696,016 | | INR | | | (475 | ) |
| 12/19/2018 | | Morgan Stanley | | 100,000 | | USD | | 7,264,032 | | INR | | | 798 | |
| 12/19/2018 | | Morgan Stanley | | 50,000 | | USD | | 3,677,516 | | INR | | | (222 | ) |
| 12/19/2018 | | Morgan Stanley | | 50,000 | | USD | | 3,673,016 | | INR | | | (161 | ) |
| 12/19/2018 | | Morgan Stanley | | 50,000 | | USD | | 3,686,766 | | INR | | | (349 | ) |
| 12/19/2018 | | Morgan Stanley | | 50,000 | | USD | | 3,658,016 | | INR | | | 44 | |
| 12/19/2018 | | Morgan Stanley | | 100,000 | | USD | | 7,348,750 | | INR | | | (359 | ) |
| 12/19/2018 | | Morgan Stanley | | 50,000 | | USD | | 3,695,516 | | INR | | | (468 | ) |
| 12/19/2018 | | Morgan Stanley | | 50,000 | | USD | | 3,681,581 | | INR | | | (278 | ) |
| 12/19/2018 | | Morgan Stanley | | 50,000 | | USD | | 56,045,565 | | KRW | | | (629 | ) |
| 12/19/2018 | | Morgan Stanley | | 50,000 | | USD | | 56,305,565 | | KRW | | | (864 | ) |
| 12/19/2018 | | Morgan Stanley | | 50,000 | | USD | | 56,143,065 | | KRW | | | (717 | ) |
| 12/19/2018 | | Morgan Stanley | | 50,000 | | USD | | 56,040,565 | | KRW | | | (625 | ) |
| 12/19/2018 | | Morgan Stanley | | 50,000 | | USD | | 2,731,563 | | PHP | | | (277 | ) |
| 12/19/2018 | | Morgan Stanley | | 500,000 | | USD | | 34,432,595 | | RUB | | | (21,260 | ) |
| 12/19/2018 | | Morgan Stanley | | 50,000 | | USD | | 3,448,265 | | RUB | | | (2,202 | ) |
| 12/19/2018 | | Morgan Stanley | | 50,000 | | USD | | 3,440,500 | | RUB | | | (2,084 | ) |
| 12/19/2018 | | Morgan Stanley | | 100,000 | | USD | | 6,886,000 | | RUB | | | (4,244 | ) |
| 12/19/2018 | | Morgan Stanley | | 50,000 | | USD | | 3,450,500 | | RUB | | | (2,236 | ) |
| 12/19/2018 | | Morgan Stanley | | 50,000 | | USD | | 3,461,000 | | RUB | | | (2,395 | ) |
| 12/19/2018 | | Morgan Stanley | | 50,000 | | USD | | 3,452,515 | | RUB | | | (2,266 | ) |
| 12/19/2018 | | Morgan Stanley | | 100,000 | | USD | | 6,966,029 | | RUB | | | (5,456 | ) |
| 12/19/2018 | | Morgan Stanley | | 100,000 | | USD | | 7,061,029 | | RUB | | | (6,894 | ) |
| 12/19/2018 | | Morgan Stanley | | 150,000 | | USD | | 10,609,544 | | RUB | | | (10,613 | ) |
| 12/19/2018 | | Morgan Stanley | | 100,000 | | USD | | 7,049,029 | | RUB | | | (6,712 | ) |
| 12/19/2018 | | Morgan Stanley | | 100,000 | | USD | | 6,932,029 | | RUB | | | (4,941 | ) |
| 12/19/2018 | | Morgan Stanley | | 50,000 | | USD | | 3,441,015 | | RUB | | | (2,092 | ) |
| 12/19/2018 | | Morgan Stanley | | 750,000 | | USD | | 1,029,758 | | SGD | | | (5,006 | ) |
See accompanying notes to consolidated financial statements.
| Equinox Aspect Core Diversified Fund |
| CONSOLIDATED PORTFOLIO OF INVESTMENTS (Continued) |
| September 30, 2018 |
Schedule of Forward Foreign Currency Contracts
| Settlement | | | | Currency Units to | | | | | | Unrealized Appreciation | |
| Date | | Counterparty | | Receive/Deliver | | In Exchange For | | (Depreciation) | |
| 12/19/2018 | | Morgan Stanley | | 50,000 | | USD | | 68,814 | | SGD | | $ | (453 | ) |
| 12/19/2018 | | Morgan Stanley | | 50,000 | | USD | | 68,739 | | SGD | | | (398 | ) |
| 12/19/2018 | | Morgan Stanley | | 550,000 | | USD | | 17,964,244 | | THB | | | (6,950 | ) |
| 12/19/2018 | | Morgan Stanley | | 300,000 | | USD | | 2,061,756 | | TRY | | | (25,546 | ) |
| 12/19/2018 | | Morgan Stanley | | 900,000 | | USD | | 27,394,334 | | TWD | | | (2,417 | ) |
| 12/19/2018 | | Morgan Stanley | | 150,000 | | USD | | 4,566,000 | | TWD | | | (412 | ) |
| 12/19/2018 | | Morgan Stanley | | 900,000 | | USD | | 27,406,934 | | TWD | | | (2,832 | ) |
| 12/19/2018 | | Morgan Stanley | | 150,000 | | USD | | 4,569,772 | | TWD | | | (536 | ) |
| 12/19/2018 | | Morgan Stanley | | 900,000 | | USD | | 27,415,934 | | TWD | | | (3,129 | ) |
| 12/19/2018 | | Morgan Stanley | | 200,000 | | USD | | 6,097,630 | | TWD | | | (867 | ) |
| 12/19/2018 | | Morgan Stanley | | 50,000 | | USD | | 1,524,007 | | TWD | | | (203 | ) |
| 12/19/2018 | | Morgan Stanley | | 50,000 | | USD | | 1,530,757 | | TWD | | | (426 | ) |
| 12/19/2018 | | Morgan Stanley | | 50,000 | | USD | | 1,528,850 | | TWD | | | (363 | ) |
| 12/19/2018 | | Morgan Stanley | | 100,000 | | USD | | 3,036,015 | | TWD | | | (12 | ) |
| 12/19/2018 | | Morgan Stanley | | 100,000 | | USD | | 3,047,805 | | TWD | | | (400 | ) |
| 12/19/2018 | | Morgan Stanley | | 50,000 | | USD | | 1,523,737 | | TWD | | | (195 | ) |
| 12/19/2018 | | Morgan Stanley | | 50,000 | | USD | | 1,518,232 | | TWD | | | (13 | ) |
| 12/19/2018 | | Morgan Stanley | | 100,000 | | USD | | 1,534,603 | | ZAR | | | (7,275 | ) |
| 12/19/2018 | | Morgan Stanley | | 50,000 | | USD | | 767,433 | | ZAR | | | (3,647 | ) |
| 12/19/2018 | | Morgan Stanley | | 50,000 | | USD | | 766,885 | | ZAR | | | (3,608 | ) |
| 12/19/2018 | | Morgan Stanley | | 750,388 | | ZAR | | 50,000 | | USD | | | 2,455 | |
| 12/19/2018 | | Morgan Stanley | | 731,019 | | ZAR | | 50,000 | | USD | | | 1,101 | |
| 12/19/2018 | | Morgan Stanley | | 720,037 | | ZAR | | 50,000 | | USD | | | 334 | |
| 12/19/2018 | | Morgan Stanley | | 724,625 | | ZAR | | 50,000 | | USD | | | 654 | |
| 12/19/2018 | | Morgan Stanley | | 727,586 | | ZAR | | 50,000 | | USD | | | 861 | |
| | | | | | | | | | | | | $ | (386,078 | ) |
| BRL - Brazilian Real | KRW - South Korean Won | INR - Indian Rupee |
| | | |
| CLP - Chilean Peso | NOK - Norwegian Krone | THB - Thai Baht |
| | | |
| COP - Colombian Peso | PHP - Philippine Piso | TRY - Turkish Lira |
| | | |
| CZK - Czech Koruna | PLN - Polish Zloty | TWD - Taiwan New Dollar |
| | | |
| EUR - Euro | RUB - Russian Ruble | USD - U.S. Dollar |
| | | |
| HUF - Hungarian Forint | SEK - Swedish Krona | ZAR - South African Rand |
| | | |
| ILS - Israeli Shekel | SGD - Singapore Dollar | |
See accompanying notes to consolidated financial statements.
Equinox Aspect Core Diversified Strategy Fund
CONSOLIDATED STATEMENT OF ASSETS AND LIABILITIES
September 30, 2018
| ASSETS | | | | |
| Investment securities: | | | | |
| At cost | | $ | 31,532,663 | |
| At fair value | | $ | 31,476,179 | |
| Cash | | | 2,200,000 | |
| Cash pledged to broker * | | | 2,760,182 | |
| Due from broker | | | 26,558 | |
| Net unrealized appreciation on futures contracts | | | 1,247,432 | |
| Interest receivable | | | 126,947 | |
| Prepaid expenses & other assets | | | 19,735 | |
| TOTAL ASSETS | | | 37,857,033 | |
| | | | | |
| LIABILITIES | | | | |
| Net unrealized depreciation on forward foreign currency contracts | | | 386,078 | |
| Advisory fee payable | | | 18,991 | |
| Distribution (12b-1) fees payable | | | 2,540 | |
| Audit and tax fees | | | 24,307 | |
| Printing fee | | | 2,415 | |
| Payable to related parties | | | 1,130 | |
| Accrued expenses and other liabilities | | | 7,135 | |
| TOTAL LIABILITIES | | | 442,596 | |
| NET ASSETS | | $ | 37,414,437 | |
| | | | | |
| Net Assets Consist Of: | | | | |
| Paid in capital | | $ | 40,156,574 | |
| Accumulated net investment loss | | | (2,935,329 | ) |
| Accumulated net realized loss from futures contacts and forward foreign currency contracts | | | (579,370 | ) |
| Net unrealized appreciation on investments, futures contacts and forward foreign currency contracts | | | 772,562 | |
| NET ASSETS | | $ | 37,414,437 | |
| | | | | |
| Net Asset Value Per Share: | | | | |
| Class A Shares: | | | | |
| Net Assets | | $ | 613,864 | |
| Shares of beneficial interest outstanding ($0 par value, unlimited shares authorized) | | | 66,799 | |
| Net asset value (Net Assets ÷ Shares Outstanding) and redemption price per share | | $ | 9.19 | |
| Maximum offering price per share (maximum sales charges of 5.75%) (a) | | $ | 9.75 | |
| | | | | |
| Class C Shares: | | | | |
| Net Assets | | $ | 2,962,974 | |
| Shares of beneficial interest outstanding ($0 par value, unlimited shares authorized) | | | 330,838 | |
| Net asset value (Net Assets ÷ Shares Outstanding), offering price, and redemption price per share (a) | | $ | 8.96 | |
| | | | | |
| Class I Shares: | | | | |
| Net Assets | | $ | 33,837,599 | |
| Shares of beneficial interest outstanding ($0 par value, unlimited shares authorized) | | | 3,679,947 | |
| Net asset value (Net Assets ÷ Shares Outstanding), offering price and redemption price per share | | $ | 9.20 | |
| * | Segregated in the custodian account as collateral for futures contracts. |
| (a) | A contingent deferred sales charge (“CDSC”) of 1.00% is assessed on certain redemptions of Class A shares made within 12 months after a purchase of Class A shares where no initial sales charge was paid at the time of purchase as part of an investment of $1,000,000 or more. A CDSC of 1.00% is assessed on redemptions of Class C shares made within one year after a purchase of such shares. |
See accompanying notes to consolidated financial statements.
Equinox Aspect Core Diversified Strategy Fund
CONSOLIDATED STATEMENT OF OPERATIONS
For the Year Ended September 30, 2018
| INVESTMENT INCOME | | | | |
| Interest | | $ | 410,913 | |
| | | | | |
| EXPENSES | | | | |
| Investment advisory fees | | | 472,534 | |
| Distribution (12b-1) fees | | | | |
| Class A | | | 1,084 | |
| Class C | | | 23,336 | |
| Registration fees | | | 53,747 | |
| Printing and postage expenses | | | 15,322 | |
| Audit fees | | | 24,169 | |
| Accounting services fees | | | 9,092 | |
| Administrative services fees | | | 20,337 | |
| Legal fees | | | 60,624 | |
| Transfer agent fees | | | 14,625 | |
| Compliance officer fees | | | 1,024 | |
| Custodian fees | | | 6,527 | |
| Trustees fees and expenses | | | 5,810 | |
| Shareholder services fee | | | 1,715 | |
| Other expenses | | | 3,803 | |
| TOTAL EXPENSES | | | 713,749 | |
| | | | | |
| Less fees waived by the Advisor | | | (160,460 | ) |
| | | | | |
| NET EXPENSES | | | 553,289 | |
| NET INVESTMENT LOSS | | | (142,376 | ) |
| | | | | |
| REALIZED AND UNREALIZED GAIN/(LOSS) ON INVESTMENTS | | | | |
| Net realized loss on: | | | | |
| Futures contracts | | | (918,840 | ) |
| Futures commissions | | | (53,826 | ) |
| Forward foreign currency contracts | | | (211,939 | ) |
| Foreign currency translations | | | (3,060 | ) |
| | | | (1,187,665 | ) |
| Net change in unrealized appreciation (depreciation) on: | | | | |
| Investments | | | (48,808 | ) |
| Futures contracts | | | 1,292,289 | |
| Forward foreign currency contracts | | | (386,078 | ) |
| Foreign currency translations | | | (26,344 | ) |
| | | | 831,059 | |
| | | | | |
| NET REALIZED AND UNREALIZED LOSS ON INVESTMENTS | | | (356,606 | ) |
| | | | | |
| NET DECREASE IN NET ASSETS RESULTING FROM OPERATIONS | | $ | (498,982 | ) |
See accompanying notes to consolidated financial statements.
Equinox Aspect Core Diversified Strategy Fund
CONSOLIDATED STATEMENTS OF CHANGES IN NET ASSETS
| | | Year Ended | | | Year Ended | |
| | | September 30, | | | September 30, | |
| | | 2018 | | | 2017 | |
| FROM OPERATIONS | | | | | | | | |
| Net investment loss | | $ | (142,376 | ) | | $ | (316,754 | ) |
| Net realized loss on futures contracts, forward foreign currency contracts and foreign currency transactions | | | (1,187,665 | ) | | | (1,536,718 | ) |
| Net change in unrealized appreciation/(depreciation) on investments, futures contracts, forward foreign currency contracts and foreign currency transactions | | | 831,059 | | | | (248,149 | ) |
| Net decrease in net assets resulting from operations | | | (498,982 | ) | | | (2,101,621 | ) |
| | | | | | | | | |
| DISTRIBUTIONS TO SHAREHOLDERS | | | | | | | | |
| From net investment income: | | | | | | | | |
| Class A | | | — | | | | (796 | ) |
| Class C | | | — | | | | (4,566 | ) |
| Class I | | | — | | | | (407,267 | ) |
| From distributions to shareholders | | | — | | | | (412,629 | ) |
| | | | | | | | | |
| FROM SHARES OF BENEFICIAL INTEREST | | | | | | | | |
| Proceeds from shares sold: | | | | | | | | |
| Class A | | | 688,553 | | | | 37,315 | |
| Class C | | | 2,993,950 | | | | 803,184 | |
| Class I | | | 4,770,963 | | | | 2,107,378 | |
| Net asset value of shares issued in reinvestment of distributions: | | | | | | | | |
| Class A | | | — | | | | 796 | |
| Class C | | | — | | | | 4,566 | |
| Class I | | | — | | | | 291,090 | |
| Payments for shares redeemed: | | | | | | | | |
| Class A | | | (174,487 | ) | | | (606,941 | ) |
| Class C | | | (372,057 | ) | | | (564,161 | ) |
| Class I | | | (2,593,750 | ) | | | (1,417,585 | ) |
| Net increase in net assets from shares of beneficial interest | | | 5,313,172 | | | | 655,642 | |
| TOTAL INCREASE/(DECREASE) IN NET ASSETS | | | 4,814,190 | | | | (1,858,608 | ) |
| | | | | | | | | |
| NET ASSETS | | | | | | | | |
| Beginning of Period | | | 32,600,247 | | | | 34,458,855 | |
| End of Period* | | $ | 37,414,437 | | | $ | 32,600,247 | |
| *Includes accumulated net investment loss of: | | $ | (2,935,329 | ) | | $ | (2,014,528 | ) |
| | | | | | | | | |
| SHARE ACTIVITY | | | | | | | | |
| Class A: | | | | | | | | |
| Shares Sold | | | 71,024 | | | | 3,877 | |
| Shares Reinvested | | | — | | | | 82 | |
| Shares Redeemed | | | (18,320 | ) | | | (63,425 | ) |
| Net increase/(decrease) in shares of beneficial interest outstanding | | | 52,704 | | | | (59,466 | ) |
| | | | | | | | | |
| Class C: | | | | | | | | |
| Shares Sold | | | 319,253 | | | | 85,168 | |
| Shares Reinvested | | | — | | | | 475 | |
| Shares Redeemed | | | (40,955 | ) | | | (59,491 | ) |
| Net increase in shares of beneficial interest outstanding | | | 278,298 | | | | 26,152 | |
| | | | | | | | | |
| Class I: | | | | | | | | |
| Shares Sold | | | 504,552 | | | | 222,818 | |
| Shares Reinvested | | | — | | | | 30,009 | |
| Shares Redeemed | | | (276,318 | ) | | | (149,425 | ) |
| Net increase in shares of beneficial interest outstanding | | | 228,234 | | | | 103,402 | |
See accompanying notes to consolidated financial statements.
Equinox Aspect Core Diversified Strategy Fund
CONSOLIDATED FINANCIAL HIGHLIGHTS
Per Share Data and Ratios for a Share of Beneficial Interest Outstanding Throughout Each Period
| | | Class A | |
| | | Year Ended | | | Year Ended | | | Year Ended | | | Period Ended | |
| | | September 30, | | | September 30, | | | September 30, | | | September 30, | |
| | | 2018 | | | 2017 | | | 2016 | | | 2015 (1) | |
| Net asset value, beginning of period | | $ | 9.29 | | | $ | 9.98 | | | $ | 10.73 | | | $ | 10.75 | |
| Activity from investment operations: | | | | | | | | | | | | | | | | |
| Net investment loss (2) | | | (0.04 | ) | | | (0.12 | ) | | | (0.15 | ) | | | (0.02 | ) |
| Net realized and unrealized gain/(loss) on investments | | | (0.06 | ) | | | (0.49 | ) | | | (0.04 | ) | | | 0.00 | (3,8) |
| Total from investment operations | | | (0.10 | ) | | | (0.61 | ) | | | (0.19 | ) | | | (0.02 | ) |
| Less distributions from: | | | | | | | | | | | | | | | | |
| Net investment income | | | — | | | | (0.08 | ) | | | (0.13 | ) | | | — | |
| Net realized gains | | | — | | | | — | | | | (0.43 | ) | | | — | |
| Total distributions | | | — | | | | (0.08 | ) | | | (0.56 | ) | | | — | |
| Net asset value, end of period | | $ | 9.19 | | | $ | 9.29 | | | $ | 9.98 | | | $ | 10.73 | |
| Total return (4) | | | (1.08 | )% | | | (6.18 | )% | | | (1.77 | )% | | | (0.19 | )% |
| Net assets, at end of period (000's) | | $ | 614 | | | $ | 131 | | | $ | 734 | | | $ | 2 | |
| Ratio of net expenses to average net assets (6) | | | 1.70 | % | | | 1.70 | % | | | 1.70 | % | | | 1.89 | % (7) |
| Ratio of net investment loss to average net assets | | | (0.44 | )% | | | (1.23 | )% | | | (1.44 | )% | | | (1.51 | )% (7) |
| Portfolio Turnover Rate | | | 20 | % | | | 0 | % | | | 0 | % | | | 0 | % (5) |
| (1) | The Equinox Aspect Core Diversified Strategy Fund Class A commenced operations on August 21, 2015. |
| (2) | Per share amounts calculated using the average shares method, which more appropriately presents the per share data for the period. |
| (3) | Realized and unrealized gains per share in this caption are balancing amounts necessary to reconcile the change in net asset value per share for the period, and may not reconcile with the aggregate gains and losses in the statement of operations due to the timing of share transactions for the period. |
| (4) | Total returns are historical and assume changes in share price and reinvestment of dividends and distributions. Total returns for periods of less than one year are not annualized. Total returns would be lower absent fee waivers. Total returns shown exclude the effect of the maximum appicable sales charge of 5.75% and, if applicable, wire redemption fees. |
| (6) | Represents the ratio of expenses to average net assets net of fee waivers and/or expense reimbursements by the Advisor. Had these waivers not been in place, the expense ratio would have been: | | | 2.14 | % | | | 2.47 | % | | | 2.29 | % | | | 2.26 | % (7) |
| (8) | Amount is less than $0.005. |
See accompanying notes to consolidated financial statements.
Equinox Aspect Core Diversified Strategy Fund
CONSOLIDATED FINANCIAL HIGHLIGHTS
Per Share Data and Ratios for a Share of Beneficial Interest Outstanding Throughout Each Period
| | | Class C | |
| | | Year Ended | | | Year Ended | | | Year Ended | | | Period Ended | |
| | | September 30, | | | September 30, | | | September 30, | | | September 30, | |
| | | 2018 | | | 2017 | | | 2016 | | | 2015 (1) | |
| Net asset value, beginning of period | | $ | 9.12 | | | $ | 9.89 | | | $ | 10.72 | | | $ | 10.75 | |
| Activity from investment operations: | | | | | | | | | | | | | | | | |
| Net investment loss (2) | | | (0.11 | ) | | | (0.18 | ) | | | (0.22 | ) | | | (0.03 | ) |
| Net realized and unrealized gain/(loss) on investments | | | (0.05 | ) | | | (0.51 | ) | | | (0.04 | ) | | | 0.00 | (3,8) |
| Total from investment operations | | | (0.16 | ) | | | (0.69 | ) | | | (0.26 | ) | | | (0.03 | ) |
| Less distributions from: | | | | | | | | | | | | | | | | |
| Net investment income | | | — | | | | (0.08 | ) | | | (0.14 | ) | | | — | |
| Net realized gains | | | — | | | | — | | | | (0.43 | ) | | | — | |
| Total distributions | | | — | | | | (0.08 | ) | | | (0.57 | ) | | | — | |
| Net asset value, end of period | | $ | 8.96 | | | $ | 9.12 | | | $ | 9.89 | | | $ | 10.72 | |
| Total return (4) | | | (1.75 | )% | | | (6.99 | )% | | | (2.52 | )% | | | (0.28 | )% |
| Net assets, at end of period (000's) | | $ | 2,963 | | | $ | 479 | | | $ | 261 | | | $ | 2 | |
| Ratio of net expenses to average net assets (6) | | | 2.45 | % | | | 2.45 | % | | | 2.45 | % | | | 2.64 | % (7) |
| Ratio of net investment loss to average net assets | | | (1.24 | )% | | | (1.96 | )% | | | (2.19 | )% | | | (2.26 | )% (7) |
| Portfolio Turnover Rate | | | 20 | % | | | 0 | % | | | 0 | % | | | 0 | % (5) |
| (1) | The Equinox Aspect Core Diversified Strategy Fund Class C commenced operations on August 21, 2015. |
| (2) | Per share amounts calculated using the average shares method, which more appropriately presents the per share data for the period. |
| (3) | Realized and unrealized gains per share in this caption are balancing amounts necessary to reconcile the change in net asset value per share for the period, and may not reconcile with the aggregate gains and losses in the statement of operations due to the timing of share transactions for the period. |
| (4) | Total returns are historical and assume changes in share price and reinvestment of dividends and distributions. Total returns for periods of less than one year are not annualized. Total returns would be lower absent fee waivers. Total returns shown exclude the effect of the maximum appicable sales charge and, if applicable, wire redemption fees. |
| (6) | Represents the ratio of expenses to average net assets net of fee waivers and/or expense reimbursements by the Advisor. Had these waivers not been in place, the expense ratio would have been: | | | 2.89 | % | | | 3.17 | % | | | 3.07 | % | | | 3.02 | % (7) |
| (8) | Amount is less than $0.005. |
See accompanying notes to consolidated financial statements.
Equinox Aspect Core Diversified Strategy Fund
CONSOLIDATED FINANCIAL HIGHLIGHTS
Per Share Data and Ratios for a Share of Beneficial Interest Outstanding Throughout Each Period
| | | Class I | |
| | | Year Ended | | | Year Ended | | | Year Ended | | | Period Ended | |
| | | September 30, | | | September 30, | | | September 30, | | | September 30, | |
| | | 2018 | | | 2017 | | | 2016 | | | 2015 (1) | |
| Net asset value, beginning of period | | $ | 9.27 | | | $ | 9.99 | | | $ | 10.72 | | | $ | 10.00 | |
| Activity from investment operations: | | | | | | | | | | | | | | | | |
| Net investment loss (2) | | | (0.03 | ) | | | (0.09 | ) | | | (0.12 | ) | | | (0.13 | ) |
| Net realized and unrealized gain/(loss) on investments | | | (0.04 | ) | | | (0.51 | ) | | | (0.04 | ) | | | 0.85 | |
| Total from investment operations | | | (0.07 | ) | | | (0.60 | ) | | | (0.16 | ) | | | 0.72 | |
| Less distributions from: | | | | | | | | | | | | | | | | |
| Net investment income | | | — | | | | (0.12 | ) | | | (0.14 | ) | | | — | |
| Net realized gains | | | — | | | | — | | | | (0.43 | ) | | | — | |
| Total distributions | | | — | | | | (0.12 | ) | | | (0.57 | ) | | | — | |
| Net asset value, end of period | | $ | 9.20 | | | $ | 9.27 | | | $ | 9.99 | | | $ | 10.72 | |
| Total return (3) | | | (0.76 | )% | | | (6.05 | )% | | | (1.54 | )% | | | 7.20 | % |
| Net assets, at end of period (000's) | | $ | 33,838 | | | $ | 31,991 | | | $ | 33,464 | | | $ | 32,140 | |
| Ratio of net expenses to average net assets (4) | | | 1.45 | % | | | 1.45 | % | | | 1.45 | % | | | 1.45 | % (5) |
| Ratio of net investment loss to average net assets | | | (0.33 | )% | | | (0.96 | )% | | | (1.20 | )% | | | (1.36 | )% (5) |
| Portfolio Turnover Rate | | | 20 | % | | | 0 | % | | | 0 | % | | | 0 | % (6) |
| (1) | The Equinox Aspect Core Diversified Strategy Fund Class I commenced operations on November 5, 2014. |
| (2) | Per share amounts calculated using the average shares method, which more appropriately presents the per share data for the period. |
| (3) | Total returns are historical and assume changes in share price and reinvestment of dividends and distributions. Total returns for periods of less than one year are not annualized. Total returns would be lower absent fee waivers. Total returns shown exclude the effect of wire redemption fees, if applicable. |
| (4) | Represents the ratio of expenses to average net assets net of fee waivers and/or expense reimbursements by the Advisor. Had these waivers not been in place, the expense ratio would have been: | | | 1.89 | % | | | 2.18 | % | | | 2.06 | % | | | 1.93 | % (5) |
See accompanying notes to consolidated financial statements.
| Equinox Aspect Core Diversified Strategy Fund |
| NOTES TO CONSOLIDATED FINANCIAL STATEMENTS |
| September 30, 2018 |
The Equinox Aspect Core Diversified Strategy Fund (the “Fund”) is a diversified series of shares of beneficial interest of Equinox Funds Trust (the “Trust”), a statutory trust organized under the laws of the State of Delaware on June 2, 2010, and is registered under the Investment Company Act of 1940, as amended (the “1940 Act”), as an open-end management investment company. The investment objective of the Fund is to achieve long term capital appreciation.
The Fund offers Class A, Class C, and Class I (“Institutional”) Shares. Class I shares commenced operations on November 5, 2014. Class A shares and Class C shares commenced operations on August 21, 2015. Class C and Class I shares are offered at net asset value. Class A shares are offered at net asset value plus a maximum sales charge of 5.75%. A contingent deferred sales charge (“CDSC”) of 1.00% is assessed on certain redemptions of Class A shares made within 12 months after a purchase of Class A shares where no initial sales charge was paid at the time of purchase as part of an investment of $1,000,000 or more. A CDSC of 1.00% is assessed on redemptions of Class C shares made within one year after a purchase of such shares. Each class represents an interest in the same assets of the Fund and classes are identical except for differences in their sales charge structures and ongoing service and distribution charges. All classes of shares have equal voting privileges except that each class has exclusive voting rights with respect to its service and/or distribution plans. The Fund’s income, expenses (other than class specific distribution fees) and realized and unrealized gains and losses are allocated proportionately each day based upon the relative net assets of each class.
| 2. | SIGNIFICANT ACCOUNTING POLICIES |
The following is a summary of significant accounting policies followed by the Fund in preparation of its financial statements. The policies are in conformity with accounting principles generally accepted in the United States of America (“GAAP”). The preparation of the financial statements requires management to make estimates and assumptions that affect the reported amounts of assets and liabilities and disclosure of contingent assets and liabilities at the date of the financial statements and the reported amounts of income and expenses for the period. Actual results could differ from those estimates. The Fund is an investment company and accordingly follows the investment company accounting and reporting guidance of the Financial Accounting Standards Board (“FASB”) Accounting Standard Codification Topic 946 “Financial Services – Investment Companies” including FASB Accounting Standard Update ASU 2013-08.
Security Valuation – Securities, including exchange traded funds, listed on an exchange are valued at the last reported sale price at the close of the regular trading session of the exchange on the business day the value is being determined, or in the case of securities listed on NASDAQ at the NASDAQ Official Closing Price (“NOCP”). In the absence of a sale such securities shall be valued at the mean between the current bid and ask prices on the primary exchange on the day of valuation. Debt securities (other than short-term obligations) are valued each day by an independent pricing service approved by the Board of Trustees (the “Board”) using methods which include current market quotations from a major market maker in the securities and based on methods which include the consideration of yields or prices of securities of comparable quality, coupon, maturity and type.
| Equinox Aspect Core Diversified Strategy Fund |
| NOTES TO CONSOLIDATED FINANCIAL STATEMENTS (Continued) |
| September 30, 2018 |
Futures shall be valued at the final settlement price (typically 4:00 P.M. Eastern Time) on the valuation date. Forward foreign exchange contracts are valued by reference to the forward foreign exchange rate corresponding to the remaining life of the contract. Short-term debt obligations having 60 days or less remaining until maturity, at time of purchase, may be valued at amortized cost.
The Fund may hold securities, such as private investments, interests in commodity pools, other non-traded securities or temporarily illiquid securities, for which market quotations are not readily available or are determined to be unreliable. These securities will be valued using the “fair value” procedures approved by the Board. The Board has delegated execution of these procedures to a fair value team composed of one or more representatives from each of the (i) Trust, (ii) administrator, and (iii) Advisor. The team may also enlist third party consultants such as a valuation specialist at a public accounting firm, valuation consultant or financial officer of a security issuer on an as-needed basis to assist in determining a security-specific fair value. The Board reviews and ratifies the execution of this process and the resultant fair value prices at least quarterly to assure the process produces reliable results.
Fair Valuation Process – As noted above, the fair value team is composed of one or more representatives from each of the (i) Trust, (ii) administrator, and (iii) Advisor. The applicable investments are valued collectively via inputs from each of these groups. For example, fair value determinations are required for the following securities: (i) securities for which market quotations are insufficient or not readily available on a particular business day (including securities for which there is a short and temporary lapse in the provision of a price by the regular pricing source), (ii) securities for which, in the judgment of the Advisor, the prices or values available do not represent the fair value of the instrument. Factors which may cause the Advisor to make such a judgment include, but are not limited to, the following: only a bid price or an ask price is available; the spread between bid and ask prices is substantial; the frequency of sales; the thinness of the market; the size of reported trades; and actions of the securities markets, such as the suspension or limitation of trading; (iii) securities determined to be illiquid; (iv) securities with respect to which an event that will affect the value thereof has occurred (a “significant event”) since the closing prices were established on the principal exchange on which they are traded, but prior to a Fund’s calculation of its net asset value. Specifically, interests in commodity pools or managed futures pools are valued on a daily basis by reference to the closing market prices of each futures contract or other asset held by a pool, as adjusted for pool expenses. Restricted or illiquid securities, such as private investments or non-traded securities are valued via inputs from the Advisor based upon the current bid for the security from two or more independent dealers or other parties reasonably familiar with the facts and circumstances of the security (who should take into consideration all relevant factors as may be appropriate under the circumstances). If the Advisor is unable to obtain a current bid from such independent dealers or other independent parties, the fair value team shall determine the fair value of such security using the following factors: (i) the type of security; (ii) the cost at date of purchase; (iii) the size and nature of the Fund’s holdings; (iv) the discount from market value of unrestricted securities of the same class at the time of purchase and subsequent thereto; (v) information as to any transactions or offers with respect to the security; (vi) the nature and duration of restrictions on disposition of the security and the existence of any registration rights; (vii) how the yield of the security compares to similar securities of companies of similar or equal creditworthiness; (viii) the level of recent trades of similar or comparable securities;
| Equinox Aspect Core Diversified Strategy Fund |
| NOTES TO CONSOLIDATED FINANCIAL STATEMENTS (Continued) |
| September 30, 2018 |
(ix) the liquidity characteristics of the security; (x) current market conditions; and (xi) the market value of any securities into which the security is convertible or exchangeable.
The Fund utilizes various methods to measure the fair value of all of their investments on a recurring basis. GAAP establishes a hierarchy that prioritizes inputs to valuation methods. The three levels of input are:
Level 1 – Unadjusted quoted prices in active markets for identical assets and liabilities that the Fund has the ability to access.
Level 2 – Observable inputs other than quoted prices included in Level 1 that are observable for the asset or liability, either directly or indirectly. These inputs may include quoted prices for the identical instrument in an inactive market, prices for similar instruments, interest rates, prepayment speeds, credit risk, yield curves, default rates and similar data.
Level 3 – Unobservable inputs for the asset or liability, to the extent relevant observable inputs are not available, representing the Fund’s own assumptions about the assumptions a market participant would use in valuing the asset or liability, and would be based on the best information available.
The availability of observable inputs can vary from security to security and is affected by a wide variety of factors, including, for example, the type of security, whether the security is new and not yet established in the marketplace, the liquidity of markets, and other characteristics particular to the security. To the extent that valuation is based on models or inputs that are less observable or unobservable in the market, the determination of fair value requires more judgment. Accordingly, the degree of judgment exercised in determining fair value is greatest for instruments categorized in Level 3.
The inputs used to measure fair value may fall into different levels of the fair value hierarchy. In such cases, for disclosure purposes, the level in the fair value hierarchy within which the fair value measurement falls in its entirety, is determined based on the lowest level input that is significant to the fair value measurement in its entirety.
The inputs or methodology used for valuing securities are not necessarily an indication of the risk associated with investing in those securities. The following tables summarize the inputs used as of September 30, 2018 for the Fund’s assets and liabilities measured at fair value:
| Assets | | Level 1 | | | Level 2 | | | Level 3 | | | Total | |
| U.S. Treasury Notes | | $ | — | | | $ | 31,476,179 | | | $ | — | | | $ | 31,476,179 | |
| Futures Contracts | | | 1,247,432 | | | | — | | | | — | | | | 1,247,432 | |
| Total | | $ | 1,247,432 | | | $ | 31,476,179 | | | $ | — | | | $ | 32,723,611 | |
| | | | | | | | | | | | | | | | | |
| Liabilities | | Level 1 | | | Level 2 | | | Level 3 | | | Total | |
| Forward Foreign Currency Contracts | | $ | — | | | $ | 386,078 | | | $ | — | | | $ | 386,078 | |
| Total | | $ | — | | | $ | 386,078 | | | $ | — | | | $ | 386,078 | |
| Equinox Aspect Core Diversified Strategy Fund |
| NOTES TO CONSOLIDATED FINANCIAL STATEMENTS (Continued) |
| September 30, 2018 |
There were no transfers between levels during the period.
It is the Fund’s policy to record transfers between levels the end of the reporting period.
The Fund did not hold any Level 3 securities during the period.
See Consolidated Portfolio of Investments for more information related to the Fund’s investments.
Consolidation of Subsidiary – The Consolidated Financial Statements of the Fund include the accounts of its subsidiary, Equinox Aspect Core Diversified Strategy Fund Limited (“EACDS-CFC”), a wholly-owned and controlled foreign corporation (“CFC”). All inter-company accounts and transactions have been eliminated in consolidation.
The Fund may invest approximately 25% of its total assets in a CFC which acts as an investment vehicle in order to effect certain investments consistent with the Fund’s investment objectives and policies.
To facilitate the Fund’s pursuit of its investment objective, EACDS-CFC utilizes futures contracts in broadly diversified global (i.e. U.S. and non- U.S.) markets across four major asset classes: commodities, currencies, fixed income, and stock indices. In accordance with its investment objective and through its exposure to these futures contracts, the Fund may have increased or decreased exposure to one or more of the risk factors defined in the Principal Investment Risks section of the Fund’s prospectus.
A summary of the Fund’s investments in the EACDS-CFC is as follows:
| | | | | | | | | | % Of the Fund’s Total | |
| | | | | Inception Date of | | EACDS-CFC Net Assets at | | | Net Assets at | |
| | | | | EACDS-CFC | | September 30, 2018 | | | September 30, 2018 | |
| | EACDS-CFC | | | 11/6/2014 | | $ | 828,017 | | | 2.21% | |
For tax purposes, EACDS-CFC is an exempted Cayman investment company. EACDS-CFC has received an undertaking from the Government of the Cayman Islands exempting it from all local income, profits and capital gains taxes. No such taxes are levied in the Cayman Islands at the present time. For U.S. income tax purposes, EACDS-CFC is a Controlled Foreign Corporation and as such is not subject to U.S. income tax. However, as a wholly-owned CFC, EACDS-CFC’s net income and capital gains, to the extent of its earnings and profits, will be included each year in the Fund’s investment company taxable income.
Market Risk – Market risk is the risk that changes in interest rates, foreign exchange rates or equity prices will affect the positions held by the Fund. The Fund is exposed to market risk on financial instruments that are valued at market prices as disclosed in the schedule of investments. The prices of derivative instruments, including options, forwards and futures prices, can be highly volatile. Price movements of derivative contracts in which the Fund’s assets may be invested are influenced by, among other things, interest rates, changing supply and demand relationships, trade, fiscal, monetary and exchange control programs and policies of governments, and national and international political and economic events and policies. The Fund is exposed to market risk on derivative contracts in that the Fund may not be able to readily dispose of its holdings when it chooses and also that the price
| Equinox Aspect Core Diversified Strategy Fund |
| NOTES TO CONSOLIDATED FINANCIAL STATEMENTS (Continued) |
| September 30, 2018 |
obtained on disposal is below that at which the investment is included in Fund’s consolidated financial statements. All financial instruments are recognized at fair value, and all changes in market conditions directly affect net income. The Fund’s investments in derivative instruments are exposed to market risk and are disclosed in the consolidated Fund of investments.
Credit Risk – Credit risk relates to the ability of the issuer to meet interest and principal payments, or both, as they come due. In general, lower-grade, higher-yield bonds are subject to credit risk to a greater extent than lower-yield, higher-quality bonds.
Counterparty Risk – Counterparty risk is the risk that the counterparty to a financial instrument will cause a financial loss for the Fund by failing to discharge an obligation. A concentration of counterparty risk exists in that part of the Fund’s cash is held at the broker. The Fund could be unable to recover assets held at the broker, including assets directly traceable to the Fund, in the event of the broker’s bankruptcy. The Fund does not anticipate any material losses as a result of this concentration.
Security Transactions and Related Income – Security transactions are accounted for on trade date basis. Interest income is recognized on an accrual basis. Discounts are accreted and premiums are amortized on securities purchased over the lives of the respective securities. Dividend income is recorded on the ex-dividend date. Realized gains or losses from sales of securities are determined by comparing the identified cost of the security lot sold with the net sales proceeds.
Dividends and Distributions to Shareholders – Dividends from net investment income, if any, are declared and paid at least annually. Distributable net realized capital gains, if any, are declared and distributed annually. Dividends from net investment income and distributions from net realized gains are determined in accordance with federal income tax regulations, which may differ from GAAP. These “book/tax” differences are considered either temporary (i.e., deferred losses, capital loss carry forwards) or permanent in nature. To the extent these differences are permanent in nature, such amounts are reclassified within the composition of net assets based on their federal tax-basis treatment; temporary differences do not require reclassification. Dividends and distributions to shareholders are recorded on ex-dividend date.
Cash and cash equivalents – Cash and cash equivalents include cash and overnight investments in interest-bearing demand deposits with a financial institution with original maturities of three months or less. The Fund maintains deposits with a high quality financial institution in an amount that is in excess of federally insured limits.
Federal Income Taxes – The Fund intends to continue to comply with the requirements of the Internal Revenue Code of 1986, as amended, applicable to regulated investment companies and to distribute all of its taxable income to its shareholders. Therefore, no provision for Federal income tax is required. The Fund recognizes the tax benefits of uncertain tax positions only where the position is “more likely than not” to be sustained assuming examination by tax authorities. Management has analyzed the Fund’s tax positions and has concluded that no liability for unrecognized tax benefits should be recorded related to uncertain tax positions taken on returns filed for open tax years 2015-2017, or expected to be taken in the Fund’s 2018 tax returns. The Fund identifies its major tax
| Equinox Aspect Core Diversified Strategy Fund |
| NOTES TO CONSOLIDATED FINANCIAL STATEMENTS (Continued) |
| September 30, 2018 |
jurisdictions as U.S. Federal, Colorado and foreign jurisdictions where the Fund makes significant investments; however the Fund is not aware of any tax positions for which it is reasonably possible that the total amounts of unrecognized tax benefits will change materially in the next twelve months.
Allocation of Expenses – Expenses incurred by the Trust that do not relate to a specific fund of the Trust are allocated to the individual funds based on each Fund’s relative net assets or another appropriate basis. Expenses specifically attributable to a particular Fund in the Trust are borne by that Fund. Other expenses are allocated to each Fund based on its net assets in relation to the total net assets of all the applicable Funds in the Trust or another reasonable basis.
Foreign Currency Transactions – All assets and liabilities denominated in foreign currencies are translated into U.S. dollars based on the rate of exchange of such currencies against U.S. dollars on the date of valuation. Purchases and sales of securities and income and expenses are translated at the rate of exchange quoted on the respective date that such transactions are recorded. Such fluctuations are included with the net realized and unrealized gain or loss on investments.
Futures Contracts – The Fund may purchase or sell futures contracts to gain exposure to, or hedge against, changes in the value of equities, interest rates, foreign currencies or commodities. Initial margin deposits required upon entering into futures contracts are satisfied by the segregation of specific securities or cash as collateral for the account of the broker (the Fund’s agent in acquiring the futures position). During the period the futures contracts are open, changes in the value of the contracts are recognized as unrealized gains or losses by “marking to market” on a daily basis to reflect the market value of the contracts at the end of each day’s trading. Variation margin payments are received or made depending upon whether unrealized gains or losses are incurred. When the contracts are closed, the Fund recognizes a realized gain or loss equal to the difference between the proceeds from, or cost of, the closing transaction and the Fund’s basis in the contract. If the Fund was unable to liquidate a futures contract and/or enter into an offsetting closing transaction, the Fund would continue to be subject to market risk with respect to the value of the contracts and continue to be required to maintain the margin deposits on the futures contracts. The Fund segregates liquid securities or cash equivalents having a value at least equal to the amount of the current obligation under any open futures contract. Risks may exceed amounts recognized in the Statement of Assets and Liabilities. With futures, there is minimal counterparty credit risk to the Fund since futures are exchange traded and the exchange’s clearinghouse, as counterparty to all exchange traded futures, guarantees the futures against default.
During the period of this report, the Fund traded various futures contracts in a manner consistent with the Aspect Core Diversified managed futures trading program consistent with its investment strategy. The Fund is permitted to use derivatives to gain exposure to the asset class and for risk management purposes, including to gain exposure to various markets in a cost efficient manner, to reduce transaction costs or to remain fully invested. The Fund may also invest in derivatives to protect from broad fluctuations in market prices, interest rates or foreign currency exchange rates (a practice known as “hedging”).
| Equinox Aspect Core Diversified Strategy Fund |
| NOTES TO CONSOLIDATED FINANCIAL STATEMENTS (Continued) |
| September 30, 2018 |
For the year ended September 30, 2018, the net change in unrealized appreciation on futures contracts amounted to $1,292,289. For the year ended September 30, 2018, the Fund had a net realized loss of $918,840 from futures contracts.
Forward Foreign Currency Contracts – A Fund may enter into forward currency exchange contracts in order to hedge against foreign currency exchange rate risks. A forward involves an obligation to purchase or sell a specific currency at a future date, which may be any fixed number of days from the date of the contract agreed upon by the parties, at a price set at the time of the contract. The market value of the contract fluctuates with changes in currency exchange rates. The contract is marked-to-market daily and the change in market value is recorded by the Fund as an unrealized gain or loss. As foreign securities are sold, a portion of the contract is generally closed and the Fund records a realized gain or loss equal to the difference between the value of the contract at the time it was opened and the value at the time it was closed. Realized gains and losses from contract transactions are included as a component of net realized gains/(losses) from forward foreign currency contracts in the statements of operations.
For the year ended September 30, 2018, the net change in unrealized depreciation on forward foreign currency contracts amounted to $386,078. For the year ended September 30, 2018, the Fund had a net realized loss of $211,939 from forward foreign currency contracts.
Impact of Derivatives on the Consolidated Statement of Assets and Liabilities and Consolidated Statement of Operations
The following is a summary of the location of derivative investments on the Fund’s Consolidated Statement of Assets and Liabilities as of September 30, 2018:
| | Location on the Consolidated Statement of Assets and Liabilities | |
| | Derivatives Investment | | | Asset Derivatives | | | Liability Derivatives | |
| | Type | | | | | | | |
| | Equity/Currency/ Commodity/
Interest Rate Contracts | | | Net unrealized appreciation on futures contracts | | | | |
| | | | | | | | | |
| | Currency Contracts | | | | | | Net unrealized depreciation on forward foreign currency contracts | |
The following table sets forth the fair value of the Fund’s derivative contracts by primary risk exposure as of September 30, 2018:
| Liability Derivatives Investment Fair Value |
| | | | | | | | | | | | | | | | |
| | | | | | | | | | | | | | | Total as of | |
| | | Commodity | | | Currency | | | Equity | | | Interest Rate | | | September 30, 2018 | |
| Futures Contracts | | $ | 502,995 | | | $ | 100,349 | | | $ | 277,196 | | | $ | 366,892 | | | $ | 1,247,432 | |
| Forward Foreign Currency Contracts | | | — | | | | (386,078 | ) | | | — | | | | — | | | | (386,078 | ) |
| | | $ | 502,995 | | | $ | (111,557 | ) | | $ | 103,024 | | | $ | 366,892 | | | $ | 861,354 | |
| Equinox Aspect Core Diversified Strategy Fund |
| NOTES TO CONSOLIDATED FINANCIAL STATEMENTS (Continued) |
| September 30, 2018 |
The following is a summary of the location of derivative investments on the Fund’s Consolidated Statement of Operations for the year ended September 30, 2018:
| Derivative Investment Type | | Location of Gain/(Loss) on Derivatives |
| Equity/Currency/Commodity/Interest | | Net realized gain on futures contracts |
| Rate Contracts | | Net realized loss on forward foreign currency contracts |
| | | Net change in unrealized appreciation/(depreciation) on futures contracts and forward foreign currency contracts |
The following is a summary of the Fund’s realized and unrealized gain/(loss) on derivative investments recognized in the Consolidated Statement of Operations categorized by primary risk exposure for the year ended September 30, 2018:
| Net Change in unrealized appreciation/(depreciation) on derivatives recognized in the Consolidated Statement of Operations |
| | | | | | | | | | | | | | | Total for the | |
| | | | | | | | | | | | | | | year ended | |
| Derivative Investment Type | | Commodity | | | Currency | | | Equity | | | Interest Rate | | | September 30, 2018 | |
| Futures contracts | | $ | 598,565 | | | $ | 132,420 | | | $ | 48,031 | | | $ | 513,273 | | | $ | 1,292,289 | |
| Forward Foreign Currency Contracts | | | — | | | | (386,078 | ) | | | — | | | | — | | | | (386,078 | ) |
| | | $ | 598,565 | | | $ | (79,486 | ) | | $ | (126,141 | ) | | $ | 513,273 | | | $ | 906,211 | |
| | | | | | | | | | | | | | | | | | | | | |
| Realized gain/(loss) on derivatives recognized in the Consolidated Statement of Operations |
| | | | | | | | | | | | | | | Total for the | |
| | | | | | | | | | | | | | | year ended | |
| Derivative Investment Type | | Commodity | | | Currency | | | Equity | | | Interest Rate | | | September 30, 2018 | |
| Futures | | $ | 638,883 | | | $ | (1,387,732 | ) | | $ | 553,775 | | | $ | (723,766 | ) | | $ | (918,840 | ) |
| Forward Foreign Currency Contracts | | | — | | | | (211,939 | ) | | | — | | | | — | | | | (211,939 | ) |
| | | $ | 638,883 | | | $ | (1,599,671 | ) | | $ | 553,775 | | | $ | (723,766 | ) | | $ | (1,130,779 | ) |
The notional value of the derivative instruments outstanding as of September 30, 2018 as disclosed in the Consolidated Portfolio of Investments and the amounts of realized gains and losses and changes in unrealized appreciation/(depreciation) on derivative instruments during the period as disclosed above and within the Consolidated Statement of Operations serve as indicators of the volume of derivative activity for the Fund.
Offsetting of Financial Assets and Derivative Assets
It is the Fund’s policy to recognize a net asset or liability equal to the unrealized appreciation/(depreciation) of futures contracts. During the year ended September 30, 2018, the Fund is subject to a master netting arrangement for futures. The following table shows additional information regarding the offsetting of assets and liabilities at September 30, 2018.
| Equinox Aspect Core Diversified Strategy Fund |
| NOTES TO CONSOLIDATED FINANCIAL STATEMENTS (Continued) |
| September 30, 2018 |
| | | | | | | | | | | | Gross Amounts Not Offset in the Statement of Assets & | |
| Assets | | | | | | | | | | | Liabilities | |
| | | | | | Gross Amounts of | | | Net Amounts of Assets | | | | | | | | | | |
| | | | | | Liabilities Offset in the | | | Presented in the | | | | | | | | | | |
| | | Gross Amounts of | | | Statement of Assets & | | | Statement of Assets & | | | Financial | | | Cash Collateral | | | | |
| | | Recognized Assets | | | Liabilities | | | Liabilities | | | Instruments | | | Pledged | | | Net Amount | |
| Description | | | | | | | | | | | | | | | | | | | | | | | | |
| Futures Contracts | | $ | 1,560,730 | (1) | | $ | (313,298 | ) (1) | | $ | 1,247,432 | | | $ | — | | | $ | — | (2) | | $ | 1,247,432 | |
| Total | | $ | 1,560,730 | (1) | | $ | (313,298 | ) (1) | | $ | 1,247,432 | | | $ | — | | | $ | — | (2) | | $ | 1,247,432 | |
| | | | | | | | | | | | | | | | | | | | | | | | | |
| | | | | | | | | | | | Gross Amounts Not Offset in the Statement of Assets & | |
| Liabilities | | | | | | | | | | | Liabilities | |
| | | | | | | | | Net Amounts of Assets | | | | | | | | | | |
| | | Gross Amounts of | | | Gross Amounts Offset | | | Presented in the | | | | | | | | | | |
| | | Recognized | | | in the Statement of | | | Statement of Assets & | | | Financial | | | Cash Collateral | | | | |
| | | Liabilities | | | Assets & Liabilities | | | Liabilities | | | Instruments | | | Received | | | Net Amount | |
| Description | | | | | | | | | | | | | | | | | | | | | | | | |
| Forward foreign currency contracts | | $ | (543,299 | ) (1) | | $ | 157,221 | (1) | | $ | (386,078 | ) | | $ | 386,078 | | | $ | — | | | $ | (386,078 | ) |
| Total | | $ | (543,299 | ) (1) | | $ | 157,221 | (1) | | $ | (386,078 | ) | | $ | 386,078 | | | $ | — | | | $ | (386,078 | ) |
| (1) | Gross unrealized appreciation (depreciation) as presented in the Consolidated Portfolio of Investments. |
| (2) | The amount is limited to the net liability on open futures contracts and, accordingly, does not include excess collateral pledged. See Portfolio of Investments and Statement of Assets & Liabilities within the financial statements for detailed collateral amounts. |
Allocation of Expenses – Expenses incurred by the Trust that do not relate to a specific fund of the Trust are allocated to the individual funds based on each fund’s relative net assets or another appropriate basis. Expenses specifically attributable to a particular Fund in the Trust are borne by that Fund. Other expenses are allocated to each Fund based on its net assets in relation to the total net assets of all the applicable Funds in the Trust or another reasonable basis.
Indemnification – The Trust indemnifies its officers and trustees for certain liabilities that may arise from the performance of their duties to the Trust. Additionally, in the normal course of business, the Fund enters into contracts that contain a variety of representations and warranties and which provide general indemnities. The Fund’s maximum exposure under these arrangements is unknown, as this would involve future claims that may be made against the Fund that have not yet occurred. However, based on experience, the risk of loss due to these warranties and indemnities appears to be remote.
| 3. | INVESTMENT TRANSACTIONS |
For the year ended September 30, 2018, the cost of purchases and proceeds from the sale of Fund securities, other than short-term investments and U.S. government securities amount to $0 and $0 respectively.
| 4. | INVESTMENT ADVISORY AGREEMENT AND TRANSACTIONS WITH RELATED PARTIES |
Equinox Institutional Asset Management, LP serves as the Fund’s Investment Advisor (the “Advisor”). The Advisor has engaged Aspect Capital Limited as the Fund’s Sub-Advisor (the “Sub-Advisor”). Pursuant to an Investment Advisory Agreement with the Trust on behalf of the Fund, the Advisor, under the oversight of the Board, directs the daily operations of the Fund and supervises the performance of administrative and professional services provided by others. As compensation for its services and the related expenses borne by the Advisor, the Fund pays the Advisor a management fee,
| Equinox Aspect Core Diversified Strategy Fund |
| NOTES TO CONSOLIDATED FINANCIAL STATEMENTS (Continued) |
| September 30, 2018 |
computed and accrued daily and paid monthly, at an annual rate of 1.30% of the Fund’s average daily net assets. Pursuant to a sub-advisory agreement between the Advisor and Sub-Advisor, on behalf of the Fund, the Advisor, not the Fund, pays the Sub-Advisor a fee, which is computed and accrued daily and paid monthly. For the year ended September 30, 2018, the Advisor earned fees of $472,534. For the year ended September 30, 2018, the amount payable to the Advisor was $18,991.
The Advisor has contractually agreed to reduce its advisory fee and/or reimburse certain expenses of the Fund, to ensure that the Fund’s total annual operating expenses, excluding (i) taxes, (ii) interest, (iii) extraordinary items, (iv) “Acquired Fund Fees and Expenses,” and (v) brokerage commissions, do not exceed, on an annual basis, 1.70% with respect to Class A shares, 2.45% with respect to Class C shares and 1.45% with respect to Class I shares of the Fund’s average daily net assets. The Advisor has contractually agreed to reduce its fees and/or reimburse expenses of the Fund until at least January 31, 2019. This agreement cannot be terminated without the consent of the Fund’s Board of Trustees on 60 days’ written notice to the Advisor. The Advisor shall be entitled to recover, subject to approval by the Board of Trustees of the Trust, such waived or reimbursed amounts for a period of up to three (3) years from the date on which the Advisor reduced its compensation and/or assumed expenses for the Fund. The Advisor is permitted to seek reimbursement from the Fund, subject to certain limitations, for fees it waived and Fund expenses it paid to the extent the total annual fund operating expenses for a Class do not exceed the limits described above or any lesser limits in effect at the time of reimbursement. No recoupment by the Advisor will occur unless the Fund’s operating expenses are below the expense limitation amount. The Advisor may seek reimbursement only for expenses waived or paid by it during the three fiscal years prior to the date of such reimbursement; provided, however, that such expenses may only be reimbursed to the extent they were waived or paid after the date of the Expense Limitation Agreement (or any similar agreement). The Board may terminate this expense reimbursement arrangement at any time. The Advisor may seek reimbursement for the following amounts through the expiration dates listed below:
| Expiration Date | | Amount |
| 9/30/2019 | | $201,985 |
| 9/30/2020 | | $237,149 |
| 9/30/2021 | | $160,460 |
For the year ended September 30, 2018, the Advisor waived fees in the amount of $160,460. As of September 30, 2018, $116,266 of previously waived fees expired unrecouped.
The distributor of the Fund is Northern Lights Distributors, LLC (the “Distributor”). The Trust, on behalf of the Fund, has adopted the Trust’s Distribution Plan. Pursuant to Rule 12b-1 under the 1940 Act, as amended (the “Plan”), to pay for certain distribution activities and shareholder services at an annual rate of 0.25% of its average daily net assets for Class A shares and 1.00% of its average daily net assets for Class C shares, which is paid to the Distributor. During the year ended September 30, 2018, the Fund accrued $1,084 and $23,336 in 12b-1 fees for Class A and Class C, respectively. For the year ended September 30, 2018, the Distributor received $19,395 and $26,249 in underwriting commissions for sales of Class A and Class C shares, respectively, of which $2,287 and $0 were retained.
| Equinox Aspect Core Diversified Strategy Fund |
| NOTES TO CONSOLIDATED FINANCIAL STATEMENTS (Continued) |
| September 30, 2018 |
In addition, certain affiliates of the Distributor provide services to the Fund as follows:
Gemini Fund Services, LLC (“GFS”), an affiliate of the Distributor, provides administration, fund accounting, and transfer agent services to the Trust. Pursuant to separate servicing agreements with GFS, the Fund pays GFS customary fees for providing administration, fund accounting and transfer agency services to the Fund.
BluGiant, LLC (“BluGiant”), an affiliate of GFS and the Distributor, provides EDGAR conversion and filing services as well as print management services for the Fund on an ad-hoc basis. For the provision of these services, BluGiant receives customary fees from the Fund.
| 5. | AGGREGATE UNREALIZED APPRECIATION AND DEPRECIATION – TAX BASIS |
The identified cost of investments in securities owned by the Fund for federal income tax purposes, and its respective gross unrealized appreciation and depreciation at September 30, 2018 were as follows:
| Cost for Federal Tax purposes | | $ | 32,165,772 | |
| | | | | |
| Unrealized Appreciation | | $ | 1,373,113 | |
| Unrealized Depreciation | | | (1,201,351 | ) |
| Tax Net Unrealized Appreciation | | | 171,762 | |
| 6. | DISTRIBUTIONS TO SHAREHOLDERS AND TAX COMPONENTS OF CAPITAL |
The tax character of distributions paid during the fiscal years ended September 30, 2018 and September 30, 2017 was as follows:
| | | Fiscal Year Ended | | | Fiscal Year Ended | |
| | | September 30, 2018 | | | September 30, 2017 | |
| Ordinary Income | | $ | — | | | $ | 412,550 | |
| Long-Term Capital Gain | | | — | | | | — | |
| Return of Capital | | | — | | | | 79 | |
| | | $ | — | | | $ | 412,629 | |
| Equinox Aspect Core Diversified Strategy Fund |
| NOTES TO CONSOLIDATED FINANCIAL STATEMENTS (Continued) |
| September 30, 2018 |
As of September 30, 2018, the components of accumulated earnings/(deficit) on a tax basis were as follows:
| Undistributed | | | Undistributed | | | Post October Loss | | | Capital Loss | | | Other | | | Unrealized | | | Total | |
| Ordinary | | | Long-Term | | | and | | | Carry | | | Book/Tax | | | Appreciation/ | | | Accumulated | |
| Income | | | Gains | | | Late Year Loss | | | Forwards | | | Differences | | | (Depreciation) | | | Earnings/(Deficits) | |
| $ | — | | | $ | — | | | $ | (1,056,547 | ) | | $ | (741,593 | ) | | $ | (1,083,450 | ) | | $ | 139,453 | | | $ | (2,742,137 | ) |
The differences between book basis and tax basis unrealized appreciation, net accumulated realized loss, and accumulated net investment loss are primarily attributable to the mark-to-market on open future and forward contracts and tax adjustments relating to the Fund’s holding in Equinox Aspect Core Strategy Fund Limited. The unrealized appreciation in the table above includes unrealized foreign currency losses of $32,309.
Late year losses incurred after December 31 within the fiscal year are deemed to arise on the first business day of the following fiscal year for tax purposes. The Fund incurred and elected to defer such capital losses of $1,056,547.
At September 30, 2018, the Fund had capital loss carry forwards for federal income tax purposes available to offset future capital gains as follows:
| Non-Expiring | | | Non-Expiring | | | | |
| Short-Term | | | Long-Term | | | Total | |
| $ | 197,001 | | | $ | 544,592 | | | $ | 741,593 | |
Permanent book and tax differences, primarily attributable to the book/tax basis treatment of foreign currency gains/(losses) and net operating losses, resulted in reclassifications for the Fund for the fiscal year ended September 30, 2018 as follows:
| Paid | | | Undistributed | | | Accumulated | |
| In | | | Net Investment | | | Net Realized | |
| Capital | | | Income (Loss) | | | Gains (Loss) | |
| $ | (363,750 | ) | | $ | (778,425 | ) | | $ | 1,142,175 | |
The beneficial ownership, either directly or indirectly, of more than 25% of the voting securities of a Fund creates presumption of control of the Fund, under Section 2(a) 9 of the Act. As of September 30, 2018, beneficial ownership in excess of 25% is as follows:
| Beneficial Owner | | % of Outstanding Shares | |
| Alyssum Investments Limited | | | 77 | % |
| Equinox Aspect Core Diversified Strategy Fund |
| NOTES TO CONSOLIDATED FINANCIAL STATEMENTS (Continued) |
| September 30, 2018 |
| 8. | RECENT ACCOUNTING PRONOUNCEMENTS |
In August 2018, the FASB issued Accounting Standards Update (“ASU”) No. 2018-13, which changes certain fair value measurement disclosure requirements. The new ASU, in addition to other modifications and additions, removes the requirement to disclose the amount and reasons for transfers between Level 1 and Level 2 of the fair value hierarchy, and the policy for the timing of transfers between levels. For investment companies, the amendments are effective for financial statements issued for fiscal years beginning after December 15, 2019, and interim periods within those fiscal years. Early adoption is allowed. At this time, management is evaluating the implications of the ASU and any impact on the financial statement disclosures.
In September 2018, the Securities and Exchange Commission released Final Rule 33-10532 captioned “Disclosure Update and Simplification” which is intended to amend certain disclosure requirements that have become redundant, duplicative, overlapping, outdated or superseded, in light of other Commission disclosure requirements, GAAP, or changes in the information environment. The effective date for these amendments is for any reports filed with the commission subsequent to November 5, 2018. Management has evaluated the impacts of these amendments and has determined that the updates are not material to the Fund’s consolidated financial statements. For this reason, the related changes have not been applied to these consolidated financial statements.
Subsequent events after the date of the Statement of Assets and Liabilities have been evaluated through the date the financial issues were issued. Management has determined that no events or transactions occurred requiring adjustment or disclosure in the financial statements.
Report of Independent Registered Public Accounting Firm
To the Board of Trustees of Equinox Funds Trust
and the Shareholders of Equinox Aspect Core Diversified Strategy Fund
Opinion on the Financial Statements
We have audited the accompanying consolidated statement of assets and liabilities, including the consolidated portfolio of investments, of Equinox Aspect Core Diversified Strategy Fund (the Fund), a series of the Equinox Funds Trust, as of September 30, 2018, and the related consolidated statement of operations for the year then ended, the statements of changes in net assets for each of the two years in the period then ended, and the financial highlights for each of the three years in the period then ended and for the period from November 5, 2014 (commencement of operations) through September 30, 2015 (collectively, the financial statements). In our opinion, the financial statements present fairly, in all material respects, the financial position of the Fund as of September 30, 2018, and the results of their operations for the year then ended, the changes in their net assets for each of the two years in the period then ended, and the financial highlights for each of the three years in the period then ended and for the period from November 5, 2014 (commencement of operations) through September 30, 2015, in conformity with accounting principles generally accepted in the United States of America.
Basis for Opinion
These financial statements are the responsibility of the Fund’s management. Our responsibility is to express an opinion on the Fund’s financial statements based on our audits. We are a public accounting firm registered with the Public Company Accounting Oversight Board (United States) (PCAOB) and are required to be independent with respect to the Fund in accordance with U.S. federal securities laws and the applicable rules and regulations of the Securities and Exchange Commission and the PCAOB.
We conducted our audits in accordance with the standards of the PCAOB. Those standards require that we plan and perform the audit to obtain reasonable assurance about whether the financial statements are free of material misstatement, whether due to error or fraud. The Fund is not required to have, nor were we engaged to perform, an audit of its internal control over financial reporting. As part of our audits, we are required to obtain an understanding of internal control over financial reporting but not for the purpose of expressing an opinion on the effectiveness of the Fund’s internal control over financial reporting. Accordingly, we express no such opinion.
Our audits included performing procedures to assess the risks of material misstatement of the financial statements, whether due to error or fraud, and performing procedures that respond to those risks. Such procedures included examining, on a test basis, evidence regarding the amounts and disclosures in the financial statements. Our audits also included evaluating the accounting principles used and significant estimates made by management, as well as evaluating the overall presentation of the financial statements. Our procedures included confirmation of investments owned as of September 30, 2018, by correspondence with the custodians and brokers. We believe that our audits provide a reasonable basis for our opinion.
/s/ RSM US LLP
We have served as the auditor of one or more Equinox Institutional Asset Management, LP advised investment companies since 2010.
Denver, Colorado
November 29, 2018
Equinox Aspect Core Diversified Strategy Fund
EXPENSE EXAMPLES (Unaudited)
September 30, 2018
As a shareholder of the Fund, you incur two types of costs: (1) transaction costs, including sales charges (loads) on purchases of Class A shares and Class C shares; and (2) ongoing costs, including management fees; distribution and/or services (12b-1) fees; and other Fund expenses. This example is intended to help you understand your ongoing costs (in dollars) of investing in the Fund and to compare these costs with the ongoing costs of investing in other mutual funds.
The example is based on an investment of $1,000 invested at the beginning of the period and held for the entire period from April 1, 2018 through September 30, 2018.
Actual Expenses
The “Actual” expenses line in the table below provides information about actual account values and actual expenses. You may use the information below, together with the amount you invested, to estimate the expenses that you paid over the period. Simply divide your account value by $1,000 (for example, an $8,600 account value divided by $1,000 = 8.6), then multiply the result by the number in the table under the heading entitled “Expenses Paid During Period” to estimate the expenses you paid on your account during this period.
Hypothetical Example for Comparison Purposes
The “Hypothetical” line in the table below provides information about hypothetical account values and hypothetical expenses based on the Fund’s actual expense ratio and an assumed rate of return of 5% per year before expenses, which is not the Fund’s actual return. The hypothetical account values and expenses may not be used to estimate the actual ending account balances or expenses you paid for the period. You may use this information to compare this 5% hypothetical example with the 5% hypothetical examples that appear in the shareholder reports of other funds.
Please note that the expenses shown in the table are meant to highlight your ongoing costs only and do not reflect any transactional costs, such as sales charges (loads), or redemption fees. Therefore, the table is useful in comparing ongoing costs only, and will not help you determine the relative total costs of owning different funds. In addition, if these transactional costs were included, your costs would have been higher.
| | | Ending | | |
| | Beginning | Account | Expenses Paid | Annualized |
| | Account Value | Value | During Period* | Expense |
| Actual | 4-1-18 | 9-30-18 | 4/1/18 – 9/30/18 | Ratio |
| Class A | $1,000.00 | $976.60 | $8.42 | 1.70% |
| Class C | 1,000.00 | 973.90 | 12.12 | 2.45% |
| Class I | 1,000.00 | 978.70 | 7.19 | 1.45% |
| | | | | |
| | | Ending | | |
| Hypothetical | Beginning | Account | Expenses Paid | Annualized |
| (5% return before expenses) | Account Value | Value | During Period* | Expense |
| | 4-1-18 | 9-30-18 | 4/1/18 – 9/30/18 | Ratio |
| Class A | $1,000.00 | $1,016.55 | $8.59 | 1.70% |
| Class C | 1,000.00 | 1,012.78 | 12.36 | 2.45% |
| Class I | 1,000.00 | 1,017.80 | 7.33 | 1.45% |
| | | | | |
| * | Actual expenses are equal to the average account value over the period, multiplied by the Fund’s annualized expense ratio, multiplied by the number of days in the period (183) divided by the number of days in the fiscal year (365). |
Equinox Aspect Core Diversified Strategy Fund
SUPPLEMENTAL INFORMATION (Unaudited)
September 30, 2018
Statement Regarding Basis for Approval of Investment Advisory Contract
At a meeting held on August 16, 2018 (the “Meeting”), the Board of Trustees (the “Board” or “Trustees”) of Equinox Funds Trust (the “Trust”), including a majority of the Trustees who are not “interested persons” as such term is defined in the Investment Company Act of 1940, as amended (the “1940 Act”) (“Independent Trustees”), unanimously approved the continuation of (a) the advisory agreement between the Trust on behalf of the Equinox Aspect Core Diversified Strategy Fund (the “Fund”), and Equinox Institutional Asset Management, LP (“EIAM” or the “Adviser”) (the “Agreement”); and (b) a sub-advisory agreement among the Trust, on behalf of the Fund, EIAM and Aspect Capital Limited (“Aspect” or the “Sub-Adviser”) (the “Sub-Advisory Agreement” and together with the Advisory Agreement, the “Agreements”). In determining whether to approve the Agreements, the Trustees considered information provided by the Adviser and Sub-Adviser in accordance with Section 15(c) of the 1940 Act, including information regarding (i) the services performed for the Fund; (ii) the size and qualifications of EIAM’s and Aspect’s portfolio management staff; (iii) any potential or actual material conflicts of interest which may arise in connection with EIAM’s or Aspect’s management of the Fund; (iv) investment performance; (v) the capitalization and financial condition of EIAM and Aspect; (vi) a comparison of the advisory fee charged by EIAM to the Fund and the expense ratios of the Fund to the advisory fees and expense ratios of comparable funds; (vii) Aspect’s sub-advisory fee arrangements with EIAM; (viii) brokerage selection procedures (including soft dollar arrangements, if any); (ix) the procedures for allocating investment opportunities between the Fund and other clients; (x) results of any regulatory examination, including any recommendations or deficiencies noted; (xi) any litigation, investigation or administrative proceeding which may have a material impact on EIAM’s or Aspect’s ability to service the Fund; (xii) EIAM’s and Aspect’s internal programs for ensuring compliance with the Fund’s investment objectives, policies and practices (including codes of ethics), federal securities laws and other regulatory requirements; (xiii) EIAM’s proxy voting policies, and (xiv) details regarding, and quantification of, any fee sharing arrangements with respect to the distribution of shares of the Fund.
The Board noted that EIAM had provided information regarding the advisory fees and an analysis of these fees in relation to the delivery of services to the Fund, the costs of providing such services and the profitability of the firm in general and as a result of the fees received from the Fund. The Board further discussed the services provided by EIAM and Aspect pursuant to the Agreements. The Trustees noted the reports provided at Board meetings throughout the year covering matters such as the relative performance of the Fund; compliance with the investment objectives, policies, strategies and limitations; the compliance of management personnel with the applicable code of ethics; and the adherence to fair value pricing procedures as established by the Board. The Trustees also noted their receipt of the memorandum from legal counsel regarding the legal standard applicable to their review of the Agreements.
The Board’s evaluation of the services provided by EIAM took into account the Trustees’ knowledge and familiarity gained as Trustees, including with respect to the scope and quality of EIAM’s investment management capabilities in selecting managed futures programs, allocating assets across various managed futures programs, and managing certain types of assets in-house
Equinox Aspect Core Diversified Strategy Fund
SUPPLEMENTAL INFORMATION (Unaudited)(Continued)
September 30, 2018
(e.g., fixed income securities and derivatives), and its compliance responsibilities. The Trustees considered EIAM’s and Aspect’s personnel and the depth of EIAM’s and Aspect’s personnel who possess the experience to provide investment management services to the Fund. Based on the information provided by EIAM and Aspect, the Trustees concluded that (i) the nature, extent and quality of the services to be provided by EIAM and Aspect are appropriate and consistent with the terms of the Agreements including the advisory fee and sub-advisory fee, (ii) the Fund is likely to benefit from the continued receipt of EIAM’s and Aspect’s services under the Aspect Agreements, and (iii) EIAM and Aspect have sufficient personnel, with the appropriate education and experience, to serve the Fund effectively and they have demonstrated continuing ability to attract and retain qualified personnel.
Investment Performance. The Trustees considered the overall investment performance of EIAM and the Fund. The Trustees reviewed performance information for the Fund for the one year period ended June 30, 2018, including a comparison to the Barclay BTOP50 (“Index”) and five other investment companies employing a managed futures strategy that were identified by EIAM as comparable (“Peer Funds”). The Trustees also received performance information for three other single CTA mutual funds managed by EIAM for the same period. The Trustees also reviewed EIAM’s commentary regarding the performance data and the various factors contributing to the Fund’s short-term performance, noting that longer-term performance was not available.
The Trustees noted that the Fund underperformed the Index and four out of five of the Peer Funds and three out of three of the EIAM managed funds for the one-year period ended June 30, 2018. The Trustees noted that the Fund underperformed the Index and three out of five of the Peer Funds and one out of two of the EIAM managed funds with performance data for the three-year period ended June 30, 2018. The Trustees further noted that the Fund underperformed the Index and five out of five of the Peer Funds and three of three of the EIAM managed funds with for the since inception period ended June 30, 2018.
The Trustees considered explanations provided by the Adviser regarding the various factors contributing to the Fund’s relative performance, including, among other things, differences in the Fund’s investment strategies and portfolio construction in comparison to the Peer Funds. In the case of lagging performance relevant to the Peer Funds or the Index for certain periods (but not necessarily all periods), the Trustees considered other factors that supported the continuation of the Agreements, including the following: (i) that EIAM’s investment decisions, such as security selection and sector allocation, contributing to such underperformance were reasonable and consistent with the Fund’s investment objective and policies; (ii) that the Fund had a limited history of investment performance having commenced operations on November 5, 2014; and (iii) that many of the Peer Funds are larger in size than the Fund, and this factor may be noted when considering the relative performance of the Fund. Taking note of the EIAM’s discussion of (i) the various factors contributing to the Fund’s performance and (ii) its continuing commitment to the Fund’s current investment strategy, respectively, the Independent Trustees concluded that the recent investment performance of the Fund was satisfactory.
Equinox Aspect Core Diversified Strategy Fund
SUPPLEMENTAL INFORMATION (Unaudited)(Continued)
September 30, 2018
Fees and Expenses. The Trustees considered the advisory fees paid to EIAM and Aspect, the total expenses of the Fund, and EIAM’s commitment to continue to waive its advisory fees and/or reimburse Fund expenses in order to maintain stated caps on Fund operating expenses. The Trustees considered the rate of the investment advisory fee and other expenses paid by the Fund under the Agreement as compared to those of representative comparable funds managed by Equinox and other investment advisers. The Trustees also discussed the limitations of the comparative expense information of the Fund, given the potential varying nature, extent and quality of the services provided by the advisers of the Peer Funds. The Trustees noted that the investment advisory fee and total operating expenses for the Fund were within the range of contractual advisory fee rates and total operating expenses for the Peer Funds, as indicated in materials prepared for the Board by Equinox, based on information contained in various publicly available documents. The Trustees noted that EIAM waived a portion of its advisory fee with respect to the Fund in order to maintain the stated cap on Fund operating expenses. The Trustees also considered the fees that Aspect charges to other accounts it manages and evaluated explanations provided by Aspect as to differences in fees to be received under the Sub-Advisory Agreement and other similarly managed accounts. The Trustees noted that the contractual sub-advisory fees under the Sub-Advisory Agreement would be paid by the EIAM out of the advisory fees it receives from the Fund, and considered the impact of such sub-advisory fee on the pro forma estimated profitability of EIAM expected to derive from its relationship with the Fund. The Trustees concluded that the advisory fee and services provided by EIAM are consistent with those of other advisers which manage mutual funds with investment objectives, strategies and policies similar to those of the Fund based on the information provided at the Meeting. The Trustees concluded that the investment advisory fees to be paid by the Fund to EIAM and to be paid by EIAM to Aspect were fair and reasonable.
Cost of Services and Profitability. Trustees also considered (i) the costs of the services provided by EIAM and Aspect, (ii) the compensation and benefits received by EIAM and Aspect in providing services to the Fund, and (iii) their profitability. The Trustees were provided with EIAM’s and Aspect’s most recent financial statements. The Trustees noted that the level of profitability of EIAM is an appropriate factor to consider in providing services to the Fund, and the Trustees should be satisfied that EIAM’s profits are sufficient to continue as healthy, ongoing concerns generally and as investment adviser of the Fund specifically. In considering the profitability of Aspect of its relationship with the Fund, the Board noted the undertakings of EIAM with respect to the expense limitation for the Fund and also noted that the sub-advisory fees under the Sub-Advisory Agreement are paid by EIAM out of the advisory fee it receives under the Advisory Agreement and, in addition, were negotiated at arm’s length. As a consequence, the profitability to Aspect of its relationship with the Fund was not a substantial factor in the Board’s deliberations. For similar reasons, the Board did not consider the economies of scale in Aspect’s management of the Fund to be a substantial factor in its consideration although the Board noted that the sub-advisory fee schedule for the Fund did not currently contemplate breakpoints that would reduce the sub-advisory fee rate payable by EIAM. Based on the information provided, the Trustees concluded that EIAM’s fees and any profit derived from its relationship with the Trust in light of the Fund’s expenses, are reasonable in relation to the nature and quality of the services provided, taking into account the fees charged by other advisers for managing comparable mutual funds with similar strategies. In so concluding, the
Equinox Aspect Core Diversified Strategy Fund
SUPPLEMENTAL INFORMATION (Unaudited)(Continued)
September 30, 2018
Trustees noted that EIAM has contractually agreed to waive the fee it receives from the Fund in an amount equal to the management fee paid to EIAM by the Fund’s wholly-owned subsidiary. The Trustees also concluded that the overall expense ratio of the Fund is reasonable, taking into account the size of the Fund, the quality of services provided by EIAM and the expense limitations agreed to by EIAM.
Economies of Scale. The Trustees considered the extent to which economies of scale would be realized relative to fee levels as the Fund grows, and whether the advisory fee levels reflect these economies of scale for the benefit of shareholders. The Board determined that economies of scale may be achieved at higher asset levels for the Fund for the benefit of Fund shareholders but that because such economies of scale did not yet exist and were not likely to exist in the near term, it was not appropriate to incorporate a mechanism for sharing the benefit of such economies with Fund shareholders in the advisory fee structure at this time.
In voting to approve the Agreements, the Trustees considered all factors that they deemed relevant to evaluating the Agreements. In arriving at its decision, the Board did not identify any particular information that was controlling, and different Trustees may have attributed different weights to the various factors. However, the Trustees determined that the overall arrangements between the Fund, EIAM and Aspect, as provided in the Agreements, are fair and reasonable in light of the services performed, expenses incurred and such other matters as the Trustees considered relevant. The Board determined that the approval of the Agreements would be in the best interests of the Fund and its shareholders. As a result, the Board, including a majority of Independent Trustees, unanimously approved the continuation of the Agreement and the Sub-Advisory Agreement, for an additional one year period each.
Equinox Aspect Core Diversified Strategy Fund
SUPPLEMENTAL INFORMATION (Unaudited)(Continued)
September 30, 2018
The following tables present certain information regarding the Board of Trustees and officers of the Trust. Each person listed under “Interested Trustees” below is an “interested person” of the Trust, the Adviser, or Distributor, within the meaning of the 1940 Act. Each person who is not an “interested person” of the Trust, the Adviser or the Distributor within the meaning of the 1940 Act is referred to as an “Independent Trustee” and is listed under such heading below. Unless otherwise noted, the address of each Trustee and Officer is 17605 Wright Street, Suite 2, Omaha, NE 68130.
Independent Trustees
Name and Year
of Birth | Position(s)
Held/Term
of Office* | Principal Occupation
During the Last Five Years | Number of
Portfolios in Fund
Complex**
Overseen by
Trustee | Other Directorships*** held by
Trustee During Last Five Years |
David P.
DeMuth
9/1945 | Trustee Since
December
2010 | Consultant, CFO Consulting Partners, LLC (since May 2004). | 5 | Executive Committee Member of The Frontier Fund (commodity pool) (from March 2007 to March 2017). |
Kevin R.
Green
7/1954 | Trustee Since
December
2010 | CEO of TripleTree Holdings, LLC an Investment Bank, Advisory and Principal Investing business (since 1997). | 5 | Director of BlueCross BlueShield of Minnesota (healthcare services). |
Jay Moorin
7/1951 | Trustee Since
December
2010 | Managing Partner, ProQuest Management, LLC (since 1998). | 5 | Director, Eagle Pharmaceuticals Inc. (from March 2007 to June 2016); Director, Pegasi Energy Resource Corp. (January 2014 to June 2015); Director, Aires Pharmaceuticals (November 2006 to February 2014); Director, Arno Therapeutics (from January 2016 to December 2017); Director, Corino Therapeutics (since November 2016); Director, Mevion Medical Systems (from January 2012 to June 2018). |
Equinox Aspect Core Diversified Strategy Fund
SUPPLEMENTAL INFORMATION (Unaudited)(Continued)
September 30, 2018
Interested Trustee
Name and Year
of Birth | Position(s)
Held/Term
of Office* | Principal Occupation
During the Past Five Years | Number of
Portfolios in Fund
Complex**
Overseen by
Trustee | Other Directorships*** held by
Trustee During the Last Five
Years |
Robert J.
Enck
9/1962 | Chairman,
Trustee,
President and
Principal
Executive
Officer
Since December
2010 | President and Chief Executive Officer, Equinox Institutional Asset Management, LP (since 2015); President and Chief Executive Officer, Equinox Fund Management, LLC (since 2007). | 5 | Executive Committee Member of The Frontier Fund (commodity pool) (from March 2007 to March 2017). |
Executive Officers
Name and Year
of Birth | Position(s)
Held/Term
of Office* | Principal Occupation
During the Past Five Years | Number of
Portfolios in Fund
Complex**
Overseen by
Trustee | Other Directorships*** held by
Trustee During the Past Five
Years |
Laura
Latella
4/1958 | Treasurer,
Principal
Financial Officer
and Secretary
Since November
2016 | Chief Financial Officer, Equinox Institutional Asset Management, LP (since May 2016); Consultant, Equinox Institutional Asset Management, LP (January 2016 – April 2016); Treasurer, CFO, Principal, 6800 Capital, LLC (May 1994 – January 2016). Institutional Asset Management, LP (January 2016 – April 2016); Treasurer, CFO, Principal, 6800 Capital, LLC (May 1994 – January 2016). | N/A | N/A |
Laura
Szalyga
3/1978 | Assistant
Treasurer since
August 2014 | Vice President (since 2015) and Assistant Vice President (2011 to 2015) of Fund Administration, Gemini Fund Services, LLC | N/A | N/A |
| Doug Tyre | Chief
Compliance
Officer and
Anti-
Money
Laundering
Officer Since
October 13, 2017 | Assistant Compliance Director of Cipperman Compliance Services LLC (since 2014); Client Services & Operations Specialist-Senior Associate of Echo Point Investment Management LLC (2010 – 2014). | N/A | N/A |
| * | Each Trustee and Officer shall serve until death, resignation or removal. |
| ** | The term “Fund Complex” refers to the Equinox Funds Trust. |
| *** | Directorships are held in a company with a class of securities registered pursuant to section 12 of the Securities Exchange Act or subject to the requirements of section 15(d) of the Securities Exchange Act or a company registered as an investment company under the 1940 Act. |
PRIVACY NOTICE
Rev. August 2011
| FACTS | WHAT DOES EQUINOX FUNDS TRUST DO WITH YOUR PERSONAL INFORMATION? |
| | |
| Why? | Financial companies choose how they share your personal information. Federal law gives consumers the right to limit some but not all sharing. Federal law also requires us to tell you how we collect, share, and protect your personal information. Please read this notice carefully to understand what we do. |
| | |
| What? | The types of personal information we collect and share depend on the product or service you have with us. This information can include: |
| | ■ Social Security number ■ Assets ■ Retirement Assets ■ Transaction History ■ Checking Account Information | ■ Purchase History ■ Account Balances ■ Account Transactions ■ Wire Transfer Instructions |
| | |
| | When you are no longer our customer, we continue to share your information as described in this notice. |
| | |
| How? | All financial companies need to share customers’ personal information to run their everyday business. In the section below, we list the reasons financial companies can share their customers’ personal information; the reasons Equinox Funds Trust chooses to share; and whether you can limit this sharing. |
| Reasons we can share your personal information | Does Equinox
Funds Trust
share? | Can you limit this sharing? |
For our everyday business purposes – such as to process your transactions, maintain your account(s), respond to court orders and legal investigations, or report to credit bureaus | Yes | No |
For our marketing purposes – to offer our products and services to you | No | We don’t share |
| For joint marketing with other financial companies | No | We don’t share |
For our affiliates’ everyday business purposes – information about your transactions and experiences | No | We don’t share |
For our affiliates’ everyday business purposes – information about your creditworthiness | No | We don’t share |
| For nonaffiliates to market to you | No | We don’t share |
| Questions? | Call 1-888-643-3431 |
Rev. August 2011
| Who we are |
| Who is providing this notice? | Equinox Funds Trust |
| What we do |
| How does Equinox Funds Trust protect my personal information? | To protect your personal information from unauthorized access and use, we use security measures that comply with federal law. These measures include computer safeguards and secured files and buildings. Our service providers are held accountable for adhering to strict policies and procedures to prevent any misuse of your nonpublic personal information. |
| How does Equinox Funds Trust collect my personal information? | We collect your personal information, for example, when you ■ Open an account ■ Provide account information ■ Give us your contact information ■ Make deposits or withdrawals from your account ■ Make a wire transfer ■ Tell us where to send the money ■ Tells us who receives the money ■ Show your government-issued ID ■ Show your driver’s license We also collect your personal information from other companies. |
| Why can’t I limit all sharing? | Federal law gives you the right to limit only ■ Sharing for affiliates’ everyday business purposes – information about your creditworthiness ■ Affiliates from using your information to market to you ■ Sharing for nonaffiliates to market to you State laws and individual companies may give you additional rights to limit sharing. |
| Definitions |
| Affiliates | Companies related by common ownership or control. They can be financial and nonfinancial companies. ■ Equinox Funds Trust does not share with our affiliates. |
| Nonaffiliates | Companies not related by common ownership or control. They can be financial and nonfinancial companies ■ Equinox Funds Trust does not share with nonaffiliates so they can market to you. |
| Joint marketing | A formal agreement between nonaffiliated financial companies that together market financial products or services to you. ■ Equinox Funds Trust doesn’t jointly market. |
This Page Intentionally Left Blank
This Page Intentionally Left Blank
PROXY VOTING POLICY
Information regarding how the Fund voted proxies relating to portfolio securities for the most recent period ended June 30 as well as a description of the policies and procedures that the Fund uses to determine how to vote proxies is available without charge, upon request, by calling 1-888-643-3431 or by referring to the Securities and Exchange Commission’s (“SEC”) website at http://www.sec.gov.
PORTFOLIO HOLDINGS
The Funds file their complete schedules of portfolio holdings with the SEC for the first and third quarters of each fiscal year (quarters ending December and June) on Form N-Q. Form N-Q is available on the SEC’s website at http://www.sec.gov. Form N-Q is being rescinded. Once Form N-Q is rescinded, disclosure of the Fund’s complete holdings will require to be made monthly on Form N-PORT, with every third month made available to the public by the Commission 60 days after the end of the Fund’s fiscal quarter. The information on Form N-Q is available without charge, upon request, by calling 1-888-643-3431.
| |
| INVESTMENT ADVISOR |
| Equinox Institutional Asset Management, LP |
| 47 Hulfish Street, Suite 510 |
| Princeton, NJ 08542 |
| |
| INVESTMENT SUB-ADVISOR |
| Aspect Capital Limited |
| 10 Portman Square |
| London, W1H6A2 |
| United Kingdom |
| |
| ADMINISTRATOR |
| Gemini Fund Services, LLC |
| 80 Arkay Drive, Suite 110 |
| Hauppauge, New York 11788 |
| Item 2. | Code of Ethics. (a) As of the end of the period covered by this report, the registrant has adopted a code of ethics that applies to the registrant's Principal executive officer, Principal financial officer, Principal accounting officer or controller, or persons performing similar functions, regardless of whether these individuals are employed by the registrant or a third party. |
(b) For purposes of this item, “code of ethics” means written standards that are reasonably designed to deter wrongdoing and to promote:
| (1) | Honest and ethical conduct, including the ethical handling of actual or apparent conflicts of interest between personal and professional relationships; |
| (2) | Full, fair, accurate, timely, and understandable disclosure in reports and documents that a registrant files with, or submits to, the Commission and in other public communications made by the registrant; |
(3) Compliance with applicable governmental laws, rules, and regulations;
| (4) | The prompt internal reporting of violations of the code to an appropriate person or persons identified in the code; and |
(5) Accountability for adherence to the code.
(c) Amendments: During the period covered by the report, there have not been any amendments to the provisions of the code of ethics.
(d) Waivers: During the period covered by the report, the registrant has not granted any express or implicit waivers from the provisions of the code of ethics.
(e) The Code of Ethics is not posted on Registrant’ website.
(f) A copy of the Code of Ethics is attached as an exhibit.
| Item 3. | Audit Committee Financial Expert. (a)(1)ii The Registrant’s board of trustees has determined that David DeMuth is an audit committee financial expert, as defined in Item 3 of Form N-CSR. Mr. DeMuth is independent for purposes of this Item 3. |
(a)(2) Not applicable.
(a)(3) In this regard, no member of the audit committee was identified as having all of the required technical attributes identified in instruction 2 (b) to item 3 of Form N-CSR to qualify as an “audit committee financial expert,” whether through the type of specialized education or experience required by that instruction. At this time, the board believes the experience provided by each member of the audit committee collectively offers the fund adequate oversight by its audit committee given the fund’s level of financial complexity. The board will from time to time reexamine such belief.
Item 4. Principal Accountant Fees and Services.
2018 - $15,000
2017 - $25,000
2016 - $25,000
2015 - $25,000
2018 – None
2017 – None
2016 – None
2015 – None
2018 - $8,770
2017 - $8,000
2016 - $8,000
2015 - $8,000
Preparation of Federal & State income tax returns, assistance with calculation of required income, capital gain and excise distributions and preparation of Federal excise tax returns.
2018 - None
2017 - None
2016 - None
2015 - None
| (e) | (1) Audit Committee’s Pre-Approval Policies |
The registrant’s Audit Committee is required to pre-approve all audit services and, when appropriate, any non-audit services (including audit-related, tax and all other services) to the registrant. The registrant’s Audit Committee also is required to pre-approve, when appropriate, any non-audit services (including audit-related, tax and all other services) to its adviser, or any entity controlling, controlled by or under common control with the adviser that provides ongoing services to the registrant, to the extent that the services may be determined to have an impact on the operations or financial reporting of the registrant. Services are reviewed on an engagement by engagement basis by the Audit Committee.
| (2) | There were no services described in each of paragraphs (b) through (d) of this Item that were approved by the audit committee pursuant to paragraph (c)(7)(i)(C) of Rule 2-01 of Regulation S-X. |
| (f) | During the audit of registrant's financial statements for the most recent fiscal year, less than 50 percent of the hours expended on the Principal accountant's engagement were attributed to work performed by persons other than the Principal accountant's full-time, permanent employees. |
| (g) | The aggregate non-audit fees billed by the registrant's accountant for services rendered to the registrant, and rendered to the registrant's investment adviser (not including any sub-adviser whose role is primarily portfolio management and is subcontracted with or overseen by another investment adviser), and any entity controlling, controlled by, or under common control with the adviser that provides ongoing services to the registrant for each of the last two fiscal years of the registrant: |
2018 – None
2017 – None
2016 – None
2015 – None
| (h) | The registrant’s audit committee of the board of trustees has considered whether the provision of non-audit services that were rendered to the registrant’s investment adviser, and any entity controlling, controlled by, or under common control with the investment adviser that provides ongoing services to the registrant that were not pre-approved pursuant to paragraph (c)(7)(ii) of Rule 2-01 of Regulation S-X is compatible with maintaining the Principal accountant’s independence. No such services were rendered. |
Item 5. Audit Committee of Listed Companies. Not applicable to open-end investment companies.
Item 6. Schedule of Investments. See Item 1.
Item 7. Disclosure of Proxy Voting Policies and Procedures for Closed-End Funds. Not applicable to open-end investment companies.
Item 8. Portfolio Managers of Closed-End Management Investment Companies. Not applicable to open-end investment companies.
Item 9. Purchases of Equity Securities by Closed-End Funds. Not applicable to open-end investment companies.
Item 10. Submission of Matters to a Vote of Security Holders. None
Item 11. Controls and Procedures.
(a) Based on an evaluation of the Registrant’s disclosure controls and procedures as of a date within 90 days of filing date of this Form N-CSR, the Principal executive officer and Principal financial officer of the Registrant have concluded that the disclosure controls and procedures of the Registrant are reasonably designed to ensure that the information required in filings on Form N-CSR is recorded, processed, summarized, and reported by the filing date, including that information required to be disclosed is accumulated and communicated to the Registrant’s management, including the Registrant’s Principal executive officer and Principal financial officer, as appropriate to allow timely decisions regarding required disclosure.
(b) There were no significant changes in the Registrant’s internal control over financial reporting that occurred during the Registrant’s last fiscal half-year that have materially affected, or are reasonably likely to materially affect, the Registrant’s internal control over financial reporting.
Item 12. Disclosure of Securities Lending Activities for Closed-End Management Investment Companies. Not applicable to open-end investment companies.
Item 13. Exhibits.
(a)(1) Code of Ethics is filed herewith.
(a)(2) Certifications required by Section 302 of the Sarbanes-Oxley Act of 2002 (and Item 11(a)(2) of Form N-CSR) are filed herewith.
(a)(3) Not applicable for open-end investment companies.
(b) Certifications required by Section 906 of the Sarbanes-Oxley Act of 2002 (and Item 11(b) of Form N-CSR) are filed herewith.
SIGNATURES
Pursuant to the requirements of the Securities Exchange Act of 1934 and the Investment Company Act of 1940, the registrant has duly caused this report to be signed on its behalf by the undersigned, thereunto duly authorized.
(Registrant) Equinox Funds Trust
By (Signature and Title)
/s/ Robert J. Enck
Robert J. Enck, Principal Executive Officer
Date 12/7/2018
Pursuant to the requirements of the Securities Exchange Act of 1934 and the Investment Company Act of 1940, this report has been signed below by the following persons on behalf of the registrant and in the capacities and on the dates indicated.
By (Signature and Title)
/s/ Robert J. Enck
Robert J. Enck, Principal Executive Officer
Date 12/7/2018
By (Signature and Title)
/s/ Laura Latella
Laura Latella, Principal Financial Officer
Date 12/7/2018