united states
securities and exchange commission
washington, d.c. 20549
form n-csr
certified shareholder report of registered management
investment companies
Investment Company Act file number 811-22447
Equinox Funds Trust
(Exact name of registrant as specified in charter)
17645 Wright Street, Suite 200, Omaha, Nebraska 68130
(Address of principal executive offices) (Zip code)
Rich Malinowski, Gemini Fund Services, LLC.
80 Arkay Drive, Suite 110, Hauppauge, NY 11788
(Name and address of agent for service)
Registrant's telephone number, including area code: 631-470-2619
Date of fiscal year end: 6/30
Date of reporting period:6/30/19
Item 1. Reports to Stockholders.
EQUINOX AMPERSAND STRATEGY FUND
CLASS A SHARES: EEHAX
CLASS I SHARES: EEHIX
ANNUAL REPORT
JUNE 30, 2019
1-888-643-3431
WWW.EQUINOXFUNDS.COM
DISTRIBUTED BY NORTHERN LIGHTS DISTRIBUTORS, LLC
Beginning on January 1, 2021, as permitted by regulations adopted by the Securities and Exchange Commission, paper copies of the Fund’s shareholder reports like this one will no longer be sent by mail, unless you specifically request paper copies of the reports. Instead, the reports will be made available on the Fund’s website www.equinoxfunds.com, and you will be notified by mail each time a report is posted and provided with a website link to access the report.
If you already elected to receive shareholder reports electronically, you will not be affected by this change and you need not take any action. If you invest through a financial intermediary, you may elect to receive shareholder reports and other communications electronically from the Fund by contacting your financial intermediary (such as a broker-dealer or bank). If you invest directly with the Fund, shareholder reports will be made available electronically beginning on January 1, 2021.
You may elect to receive shareholder reports in paper free of charge. You can request to continue receiving paper copies of your shareholder reports by contacting your financial intermediary, or, if you invest directly with the Fund, calling 1-888-643-3431 to let the Fund know your request.

Equinox Ampersand Strategy Fund
Letter to Shareholders as of June 30, 2019
For the year ended June 30, the Equinox Ampersand Strategy Fund (Class I) achieved a positive return of +16.19%, handily outperforming the S&P 500 Total Return Index® (“S&P 500® “), which was up +10.42%. We feel that investors were served well during the Fund’s first full year since it was restructured (as described in “Prospectus Changes” below). It was a satisfactory year from the Adviser’s perspective as well, because it means that the Adviser will be entitled to its management fee for the upcoming fund-year from July 1, 2019 to June 30, 2020. (see “Why the Fee?” below).
| | Cumulative Return
I-Yr | Compound Rate
of Return (ROR)*
Since Inception (A) | Standard
Deviation** Since
Inception (A) |
Equinox Ampersand Strategy Fund – I | 16.19% | 10.14% | 11.50% |
| S&P 500® | 10.04% | 12.52% | 11.64% |
| * | Compound ROR represents the cumulative effect that a series of gains or losses have on an original amount of capital over a period of time. |
| ** | Standard Deviation is a statistic calculated to indicate the extent of deviation for a group as a whole. |
Performance data quoted here represents past performance. Current performance may be lower or higher than the performance quoted above. The value of an investor’s shares will fluctuate so that investor’s shares, when redeemed, may be worth more or less than their original cost. The Fund’s investment advisor, Equinox Institutional Asset Management, LP, has contractually agreed to reduce its fees and/or absorb expenses of the Fund at least until 10/31/2019 to ensure that the net annual fund operating expenses do not exceed 1.24% (Class A) and 0.99% (Class I) of the Fund’s average daily net assets, subject to possible recoupment from the Fund in future years subject to approval of the Fund’s Board of Trustees. Without the waiver, total annual operating expenses would be 3.98% (Class A) and 3.57% (Class I). For performance current to the most recent month end, please visit equinoxfunds.com.
The Gross/Net Expense Ratio for the Equinox Ampersand Strategy Fund does not include costs associated with any over-the-counter derivatives that provide the Fund exposure to the Overlay Strategy discussed below. The Investment Adviser anticipates that such exposure will indirectly subject the Fund to (i) counterparty fees of up to 0.50% (annualized) of notional exposure, and (ii) (annualized) management fees of up to 1.25% of notional exposure and performance-based incentive fees of up to 25% of new high net trading profits. The Adviser anticipates that the Fund’s average notional exposure to the Overlay Strategy generally range between approximately 100% and 200% of Fund assets. The performance of the Fund will be net of all such embedded counterparty, management and incentive/performance fees. Please review the Fund’s prospectus for more information regarding fees and expenses.
Prospectus Changes
On June 29, 2018, the Equinox EquityHedge US Strategy Fund (“EquityHedge”) was restructured and renamed theEquinox Ampersand Strategy Fund (“the Ampersand Fund” or “the Fund”).
Revised Objective: The Ampersand Fund seeks to achieve returns and volatility comparable to the S&P 500®, while seeking to avoid the full impact of downside risk.
| 47 Hulfish Street, Suite 510, Princeton, NJ 08542 ● T 609.430.0404 ● F609.454.5010 ● www.equinoxfunds.com |
The major change made to the EquityHedge strategy was that thelong Equity Strategy is now combined with anenhanced Overlay Strategy.
Thelong Equity Strategy continues to seek returns comparable to those of the S&P 500®. Equity index futures are used to obtain market exposure that is expected to average somewhere between about 100% and 110% over market cycles.
Theenhanced Overlay Strategy seeks to complement these equity returns with non-correlated and negatively correlated return streams so that the overall Ampersand Fund portfolio’s long-term volatility is comparable to the S&P 500®, while targeting improved returns by seeking to avoid the full impact of downside risk over a market cycle (generally 3 to 5 years or longer). We believe the enhanced overlay has the potential to provide better risk mitigation and greater returns in the long run than the original EquityHedge strategy.
Rationale
Over the years, we have observed that many investor portfolios are inadequately diversified because of the perceived opportunity cost of selling equities to gain exposure to diversifying alternative assets. We believe an overlay strategy offers the potential for superior and meaningful diversification without the need to reduce exposure to core holdings. This is the concept implemented in the Ampersand Fund. The Fund provides futures-based exposure to the broad US equity market, while simultaneously seeking to diversify equity factor risk through strategic and meaningful exposure to a futures-based portfolio of (i) uncorrelated diversifiers and (ii) negatively correlated dynamic equity-hedging strategies. The equity exposure and overlay are both collateralized by the Fund’s core fixed-income holdings.
Why the Fee?
Evidence shows that the vast majority of active fund managers underperform their relevant investable indexes. Based on this finding, we believe that investors should be asking their managers: “Why the Fee?” In other words, since index returns can be approximated through passive investing, active managers should only be compensated for achieving superior long-term risk -adjusted performance, and not for simply matching or underperforming a benchmark.
Expressing its confidence in the Ampersand Fund, Equinox had agreed to waive its management fee if the fund underperformed the S&P 500®. Thus, for the 12-month period that commenced on July 1, 2018, and ended on June 30, 2019, the Equinox management fee was subject to a performance-based voluntary waiver. If the Fund (EEHIX, I-Share) had underperformed the S&P 500® over that period, Equinox would have voluntarily waived its management fee for the subsequent fund-year, i.e, for the period July 1, 2019 to June 30, 2020.1
| 1 | Although the Advisor’s management fee is subject to a performance-based waiver, other fees and expenses do apply to an investment in the Fund. |
| 47 Hulfish Street, Suite 510, Princeton, NJ 08542 ● T 609.430.0404 ● F609.454.5010 ● www.equinoxfunds.com |
As mentioned earlier, the Fund’s performance last year exceeded the benchmark, which means that the Adviser will be entitled to its management fee for the current year.
Analysis of Performance
Q3 2018
The Fund’s Class I shares earned a return of +1.52%, underperforming the S&P 500®, which was up +7.71%. The long Equity Strategy was up for the quarter (+7.68%), while the Hedge Strategy and the Diversifier Strategy both had negative contributions (–4.47% and –2.13%, respectively). The Fund’s fixed-income investments contributed +0.44%. This was a quarter during which the overlay detracted from the strong performance of equities.
Five of our fourteen diversifying CTA programs had a positive quarter, but they were swamped by the negative performance of the other nine. The highest positive contributor was a commodity relative-value trading program. The two largest detractors from performance were global macro programs, one systematic and the other discretionary. Both dynamic equity-hedging programs, which target negative long-term correlations to equities, made negative contributions.
At the sector level, bonds and interest rates were the largest detractors, while equity indices and currencies also had significant negative contributions. Metals and energy were down a little, while agricultural commodities were very slightly profitable.
The Fund’s largest gross exposure as of quarter-end was to the agricultural commodities sector (about 32%), followed by energy (about 19%). Currencies and fixed-income contributed almost equally (between 16% and 17%), followed by equity indices (at about 13%), while metals
For the 24-month period commencing July 1, 2018 and ending June 30, 2020 (the “Performance Period”), the Adviser’s entitlement to the Management Fee for the following 12-month period shall be subject to a performance-based voluntary waiver (the “Performance-Based Waiver”). Under the terms of the Performance-Based Waiver, the investment performance of the Institutional Class shares of the Fund will be measured against the S&P 500® (the “Benchmark”) over the Performance Period. In the event that the Fund underperforms the Benchmark over the Performance Period, the Adviser will voluntarily waive the Management Fee for the following 12-month period, excluding any portion of the Management Fee that the Adviser would otherwise be required to waive in order to satisfy its obligation under the Expense Limitation. For example, if the Adviser were required to waive its entire Management Fee under the terms of the contractual Expense Limitation, it would not have an additional obligation to make further waivers as a result of the Performance-Based Waiver. As a result, there is no guarantee that shareholders will benefit from the Performance-Based Waiver for any full or partial 12-month period. The Performance Period will be extended from 24 months to 36 months for the period ending June 30, 2021 (i.e., from July 1, 2018 to June 30, 2021). For each successive 36-month period ending on June 30 of each year thereafter, the Adviser’s entitlement to the Management Fee for the following 12-month period shall also be subject to the Performance-Based Waiver. The Adviser reserves the right to modify or terminate the voluntary Performance-Based Waiver upon notice to the Fund’s Board of Trustees. The Adviser will not seek recoupment of any fees waived as a result of the Performance-Based Waiver.
| 47 Hulfish Street, Suite 510, Princeton, NJ 08542 ● T 609.430.0404 ● F609.454.5010 ● www.equinoxfunds.com |
were the smallest (at about 3%). Together, the financial sectors represent about 46% of the Fund’s exposure.2
At the end of September, the dynamic hedging strategies had a negative beta of about –0.28 with respect to the S&P 500®. Positions in equity index futures represented a beta of about –0.19 versus the S&P 500®, while currency futures positions represented a negative beta of about –0.07. The beta of metals futures was slightly negative at about –0.02, while the betas of other sectors were close to zero.
Starting at just above 16%, the VIX® index traded for the most part in a tight range (between 12% and 14%), which is in line with (but still slightly below) the US stock market’s longer-term historical volatility.
Q4 2018
The Fund’s Class I shares earned a return of –10.26%, outperforming the S&P 500®, which was down –13.52% for the same period. The Fund’s long Equity Strategy was down significantly for the quarter (–16.70%). The Diversifier Strategy made a small negative contribution (–1.88%), but the star performer was the Hedge Strategy, which contributed an impressive +7.82%. This was a quarter during which the overlay offset a large portion of the negative performance of equities.
In October, we added a new trading program, SCT Capital Management’s AQT (Adaptive Quant Trading), which, through systematic trading, seeks to exploit signals generated by adaptive machine learning and other statistical methods. AQT contributed positively to performance during the quarter.
Eight of our fifteen diversifying CTA programs had a positive quarter; unfortunately, they were swamped by the negative performance of the other seven. The two highest positive contributors were global macro trading programs, while the largest detractors from performance were rather a mixed bag. Both dynamic equity-hedging programs, which target negative long-term correlations to equities, made very meaningful positive contributions.
At the sector level, interest rates and currencies were the largest positive contributors to overlay performance, followed by equity indices. Agricultural commodities and metals made negative contributions to performance, while energy was flat.
The overlay’s largest gross exposure as of quarter-end was to the energy sector (about 43%), followed by equities (about 17%). Fixed-income, currencies, and agricultural commodities contributed almost equal gross risk exposure (all between 11% and 13%), while metals were the smallest risk (at about 3%). Together, the financial sectors represent about 43% of the Fund’s exposure.
At the end of December, the dynamic hedging strategies had a negative beta of about –0.66 with respect to the S&P 500®, much higher than the prior quarter’s beta (–0.28). Positions in equity index futures represented a beta of about –0.39 versus the S&P 500®, while fixed-income and currency futures positions represented negative betas of about –0.16 and –0.10,
| 2 | Futures trading programs may have either long or short exposures to individual futures markets, and the size/risk of these exposures generally tends to be inversely related to the volatilities of those markets; more volatile markets usually imply smaller positions, all else equal. |
| 47 Hulfish Street, Suite 510, Princeton, NJ 08542 ● T 609.430.0404 ● F609.454.5010 ● www.equinoxfunds.com |
respectively. The combined beta of energy, metals, and agricultural commodities was relatively small, about –0.02.
During the quarter, volatility returned with a vengeance to equity markets. Starting at about 12%, the VIX® index more than doubled to a level of about 25% by October 11. Thereafter, it ranged between about 16% and 25% until December 17, after which it traded above 25%, peaking at about 36% on Christmas Eve before ending the year at 25%.
Q1 2019
The Fund’s Class I shares earned a return of 14.71%, once again outperforming the S&P 500®, which was up +13.65% for the same period. The Fund’s long Equity Strategy was up significantly for the quarter (+13.63%). The diversifier strategy made a small positive contribution (+0.65%). The hedge strategy was only slightly negative (–0.16%), which we are very pleased about in the face of such a strong quarter for equities. The Fund’s fixed-income holdings also contributed positively (+0.59%), helped by declining interest rates.
Eight of our fifteen diversifying CTA programs had a positive quarter. The four highest positive contributors were two trend-following programs, a contrarian program, and a machine-learning program. The top negative contributors were a mixed bag. One of the two dynamic equity hedging programs, which target negative long-term correlations to equities, also made an impressive and meaningful positive contribution, while the other was significantly negative.
At the sector level, fixed-income was the only positive contributor to overlay performance, while equity indices made the most significant negative contribution. The other four sectors were smaller detractors.
The overlay’s largest gross exposure as of quarter-end was to the fixed-income sector (about 25%), followed by agricultural commodities (about 22%), and currencies (about 21%). Equity indices (about 16%) and Energy (about 12%) followed, while metals had the smallest exposure (about 4%). Together, the financial sectors represent about 62% of the Fund’s exposure. Net exposure to fixed-income and equities was long, while currencies and agricultural commodity exposure were net short. Energy and metals had virtually flat net exposures.
At the end of March, the dynamic hedging strategies had a negative beta of about –0.22 with respect to the S&P 500®, much lower than the prior quarter’s beta (–0.66). Positions in equity index futures and agricultural commodities represented positive betas of about 0.11 and 0.07, respectively, versus the S&P 500®, while the other four sector betas were negative: fixed-income, currency, and energy futures positions represented negative betas of about –0.20, –0.13, and –0.07, respectively, while the beta of metals was negative but virtually zero.
During the quarter, volatility drifted downwards for the most part, as equity markets went into rally mode. Starting north of 25%, the VIX® index dipped below 20% by January 8th, and continued to decline steadily to an intra-quarter low of 13.5% entering the last week of February. Thereafter, it ranged mainly between about 13.5% and 15%, ending the quarter at about 13.7%.
Q2 2019
The Fund’s Class I shares earned a return of 11.20%, once again outperforming the S&P 500®, which was up +4.30% for the same period. The Fund’s long Equity Strategy was up for the
| 47 Hulfish Street, Suite 510, Princeton, NJ 08542 ● T 609.430.0404 ● F609.454.5010 ● www.equinoxfunds.com |
quarter (+3.08%). The diversifier strategy had a very good quarter, making a positive contribution (+3.28%), while the hedge strategy did even better (+4.25%). The Fund’s fixed-income holdings also contributed positively (+0.59%).
Nine of our fifteen diversifying CTA programs had a positive quarter. The four highest positive contributors were two trend-following programs, an EM currency trading program, and a short-term machine-learning program. In addition, both the dynamic equity hedging programs, which target negative long-term correlations to equities, made impressive positive contributions.
At the sector level, fixed-income was the biggest driver of overlay performance, with currencies and metals making smaller positive contributions. Equity indices made the largest negative contribution, albeit small, and energy and agricultural commodities were even smaller detractors.
The overlay’s largest gross exposure as of quarter-end was to the energy sector (about 35%), followed by fixed-income (about 21%), agricultural commodities (about 19%), and currencies (about 12%), equity indices (about 10%) and metals (about 3%). Together, the financial sectors represent about 43% of the Fund’s exposure. Net exposure to fixed-income, equities, and metals was long, while energy and agricultural commodity exposure was net short, and currency exposure was virtually flat.
At the end of June, the dynamic hedging strategies had a positive beta of about 0.02 with respect to the S&P 500®, much higher than the prior quarter’s beta (–0.22). It is expected that this beta over time will be, on average, negative. Positions in energy and equity index futures represented positive betas of about 0.43 and 0.22, respectively, versus the S&P 500®, while the other four sector betas were negative: fixed-income, currency, agricultural commodities and metals futures positions represented betas of about –0.36, –0.21, –0.06, and –0.01, respectively.
Equity market volatility as measured by the VIX® Index, was subdued and stayed within a narrow range (about 12% to 14%) during April. It spiked during the first week of May to about 19% and stayed in the 15%-20% range for the rest of the month, before subsiding again during June (about 14% to 17%).
Market Commentary
July began with an escalation of trade tensions as the US imposed tariffs on $34 billion worth of Chinese goods, and China retaliated. However, the risk of an imminent global trade war was alleviated as the US and the EU agreed to work towards trade agreements. Optimism surrounding quarterly corporate earnings coupled with stronger US economic data helped stocks to recover from June’s trade-war induced selloff. The Federal Reserve continued its announced commitment to gradual rate hikes, even as the US yield curve flattened more than it had in the last decade. The dollar came under pressure from trade uncertainty, as did the commodities sector. Global bond yields were temporarily lifted by speculation of shifting Japanese monetary policy and encouraging economic data. WTI crude suffered its worst month since 2016 following increased US and Libyan output and slowing global demand. Gold logged its fourth straight monthly loss.
August witnessed selloffs in emerging markets amid political and monetary policy uncertainty alongside ongoing trade tensions. The US and major trading partners engaged in negotiations with a positive outcome in the case of Mexico whilst tensions escalated with Canada and others. Despite this backdrop, US stock markets made new highs, spurred on by bouts of
| 47 Hulfish Street, Suite 510, Princeton, NJ 08542 ● T 609.430.0404 ● F609.454.5010 ● www.equinoxfunds.com |
optimism and robust earnings. Many European stock indices struggled on fears of contagion from emerging market crises, as evidenced by the mid-month crash in the Turkish Lira. Bonds witnessed a flight to safety. Sterling struggled after the EU expressed a new willingness to maintain a close post-Brexit relationship with the UK. Gold and industrial metal prices experienced extended declines due to a strong US Dollar and weaker Chinese demand. WTI crude oil rebounded amid lower-than-expected US inventories and supply concerns from Iran and Venezuela.
September saw risk appetites return, and US stock indices rallied as President Trump’s latest levies on Chinese goods were lower than anticipated. As expected, the Federal Reserve raised rates; however, its tone was notably more hawkish, based on stronger US growth and inflation prospects. European markets were shaken after Italy doubled down on its controversial fiscal plans, affecting both equities and Italian bonds. More positive Brexit news and upbeat UK sales data resulted in a Sterling rally. In fixed income, gains were made in short US bond and interest rate positions amid improving US economic conditions, while European bonds incurred offsetting losses. Gold continued to decline, while copper rallied on lower-than expected trade tariffs between the US and China. Oil prices were boosted by undersupply concerns amid Iranian sanctions.
During October, as global stock markets and growth-linked assets such as oil sold off amidst spiking volatility, demand for safe-haven assets increased. The panic was triggered by fresh concerns about the pace of rate hikes in the US and the late stage of the economic cycle, exacerbated by weaker corporate earnings and economic data, and stoked even further by a plethora of geopolitical uncertainties such as Brexit, Italy’s budget crisis, and ongoing friction between the US and its trading partners. Against this background, many of the CTA programs in the overlay struggled to adapt to the rapidly changing market conditions and abrupt trend reversals.
November kicked off with a sharp rise in the British Pound amid optimism about an impending Brexit deal. US midterm election results came in broadly as expected. Subsequently, the US Dollar weakened, but quickly reversed as the Fed signaled that further rate hikes would be more gradual. Volatility continued to rise amidst political anxiety in the UK and Italy, sharp stock market declines, and ongoing fragility within commodities highlighted by one of the worst months in oil price history. Investors also wrestled with mixed signals surrounding both the pace of US rate hikes and the potential for a US-China trade deal ahead of a high-stakes G20 summit. Increased optimism around the meeting between Presidents Xi Jinping and Trump towards the end of the month caused the equity market decline to reverse. While bonds rallied, oil markets declined steadily throughout the month amid the general risk-off sentiment and mounting concerns about over-supply. As might be expected, all this whipsawing in markets was not conducive to the Fund’s CTA programs.
Initially, in December, relief over the temporary US-China trade truce dissipated as anxiety about tightening monetary policies, slowing global growth, and geopolitical uncertainty took over. Stock market selloffs were deep and broad, exacerbated by thin trading over the holiday period, and several major stock indices entered bear market territory. Notable events included an inversion of the US yield curve, the partial US government shutdown, and the Federal Reserve’s rate hike (which was expected) accompanied by hawkish forward guidance (which was unexpected). Oil prices continued to plummet, credit spreads widened, and investors fretted over weak economic data from China and global economic prospects for 2019.
| 47 Hulfish Street, Suite 510, Princeton, NJ 08542 ● T 609.430.0404 ● F609.454.5010 ● www.equinoxfunds.com |
The new year began with an attempt by risk assets to recover some of their prior year’s losses. Major US stock indices had their best January in three decades, boosted by strong corporate earnings, an announced easing of the Federal Reserve’s hawkish stance, and the temporary reopening of the partially shuttered US government. Optimism was also sparked by progress in the trade talks between Beijing and Washington. The S&P 500®rallied more than 8%, leading a rebound in global equities after their sharp decline during Q4 of 2018. Double-digit gains for energy and real estate stocks led the recovery, while consumer staples, utilities and healthcare stocks lagged the wider market. Downtrends in oil and base metals also reversed course, with WTI crude and copper rising by 18% and 6%, respectively. Despite these developments, geopolitical risks and signs of European economic weakness still engendered investor cautiousness, with global bond yields drifting lower. The impending difficulties in overcoming the Brexit impasse ahead of the looming deadline generated further anxiety. Yields on most government bonds fell, while gold prices continued to climb, gaining a further 3% during the month.
Global stock markets continued to improve during February, with the S&P 500® adding another 3% to its January gains on reports of productive US-China trade developments and a delay in the imposition of additional tariffs on China. Meanwhile, the oil complex was bolstered by announcements of global supply cuts, with WTI crude rising 6%. The European Central Bank voiced concerns over weaker-than expected economic data, while the Federal Reserve reaffirmed its more neutral policy stance, with further rate hikes more likely to be reactive than pro-active. US and European government bonds fell, while gold and silver gave back some of their January gains. Gold prices were still 12% above their July 2018 levels. The US Dollar continued to strengthen against both the Yen and the Euro, but weakened against the British Pound, which reached a seven-month high versus the US dollar during the month as Brexit worries persisted.
In March, investors were spooked by the drop in US 10-year yields to their lowest since 2017, and the resulting (partial) inversion of the yield curve; these developments were driven by the Federal Reserve’s announcement that rates could stay lower for longer. Meanwhile, the European Central Bank’s increasingly accommodative stance helped push longer-term German bond yields into the red for the first time since 2016. Brexit uncertainty deepened considerably amid the delay in the UK’s departure date. US stock markets rose, pushing global equities to their third consecutive month of gains. Energy prices also continued to rise, while crops and metals generally fell. The US Dollar bounced back vs. the British Pound but weakened relative to the Yen. Global growth appeared to be slowing down amid weaker-than-expected US economic news and stimulus announcements by the Chinese government in an effort to shore up China’s economy.
April saw series of strong economic data, which eased concerns about a global growth slowdown and pushed major equity indices to record highs. Positive sentiment around US/China trade talks and the Fed’s policy shift also created support for stocks. Earnings season added a further boost as the vast majority of reporting companies beat analyst forecasts. The resulting resurgence of risk appetite caused global government debt yields to rise. Meanwhile, oil prices rallied on the more optimistic growth outlook, helped along by further US sanctions on Iran and Venezuela. Economic data from China generally met consensus expectations; yet, market participants, who had expected worse, rejoiced. We believe there are still some lingering concerns and market participants remain unconvinced that China is immune to the slowdown being seen by other Asian countries like Japan, South Korea, Taiwan and Singapore. Europe’s
| 47 Hulfish Street, Suite 510, Princeton, NJ 08542 ● T 609.430.0404 ● F609.454.5010 ● www.equinoxfunds.com |
story continued mixed but largely negative, as Germany’s export engine continued to sputter, while the rest of Europe offered little support amid continuing worries about Italy.
May started on a high note with the lowest reported US unemployment rate in decades. Initial optimism about a US-China trade deal evaporated as the Trump administration announced additional tariffs, claiming that China had backtracked on earlier negotiated compromises. In addition to the ongoing tensions with China, the US opened up a second front in the trade wars by threatening tariffs on Mexico. Equity markets turned negative, with energy and technology sectors leading the rout. Major US equity indices suffered their worst month of 2019 as investors fled into safe-haven assets. Increased speculation that the Federal Reserve will soon have to cut rates sent US treasury yields plunging to their lowest level since 2016. Brexit turmoil continued to remain firmly in focus as the UK witnessed the collapse of cross-party Brexit talks and Prime Minister May outlined her imminent departure plans. The populist League party gained in the Italian elections, reigniting the country’s budget battles with the EU and causing further volatility and risk-off sentiment. Against this backdrop of heightened trade concerns and geopolitical tensions, energies and most metals experienced declines as well.
During June, market participants remained focused on the global economy as multiple PMI surveys signaled contraction. The Federal Reserve left rates unchanged but its unexpectedly downbeat tone led investors to expect rate cuts as early as July. The ECB’s Mario Draghi hinted at the possibility of fresh rate cuts if inflation remained subdued, driving German government bond yields even more negative. Additional stimulus from the Bank of Japan pushed Japanese government bond yields lower. As central banks across the globe became unified in their dovish rhetoric, investors were once again sent flocking into safe-haven assets. US trade negotiations continued to dominate market headlines, with the demise of the proposed US tariffs on Mexico serving to improve the mood. Markets also kept a close eye on the G-20 summit, where the US and China agreed to resume trade talks and to hold off on further tariffs. During the month, the US dollar weakened considerably, which led to an oil price rally that was spurred on by US sanctions on Iran.
Conclusion
The basic Ampersand concept is that a potentially superior diversified investment portfolio can be built by adding an overlay of diversifiers and hedges on top of a core portfolio rather than by subtracting, or selling, core holdings in order to achieve this type of diversification. We call this the “Power of AND,” and hence the name Ampersand. We believe that the Fund’s strategy, which leverages the “Power of AND,” offers investors an interesting alternative to traditional long or long-short equity strategies. The combination of diversifying and dynamic hedging strategies in the form of an overlay seeks to provide the potential to gain meaningful and strategic diversification without the need to reduce core equity exposure.
We believe that the global economy and geopolitical backdrop remain volatile. Historically, futures trading programs have tended to perform well in a variety of market conditions, perhaps particularly so during periods of market turbulence and volatility expansion. The Fund seeks to provide returns that are comparable to or better than those of the S&P 500® with comparable volatility, while seeking to mitigate downside risk. We believe that a significant and strategic allocation to the Fund as a substitute for core equity exposure in a portfolio may provide “smarter” equity exposure: equity exposure that is dynamically hedged, coupled with the potential for uncorrelated alpha in the long run.
| 47 Hulfish Street, Suite 510, Princeton, NJ 08542 ● T 609.430.0404 ● F609.454.5010 ● www.equinoxfunds.com |
| Thank you for investing in the Equinox Ampersand Strategy Fund! |
| |
DEFINITIONS OF TERMS
Alphais a measure of performance on a risk-adjusted basis. Alpha takes the volatility (price risk) of a fund and compares its risk-adjusted performance to a benchmark index. The excess return of the fund relative to the return of the benchmark index is a fund’s alpha.
Betais a measure of the volatility, or systematic risk, of a security or a portfolio in comparison to the market as a whole. A beta of 1 indicates that the security’s return will move with the market. A beta of less than 1 means that the security’s return will be less volatile than the market. A beta of greater than 1 indicates that the security’s return will be more volatile than the market. For example, if a stock’s beta is 1.2, it’s return is theoretically 20% more volatile than the market’s return.
Brexitis an abbreviation of “British exit,” which refers to the June 23, 2016 referendum by British voters to exit the European Union. The referendum roiled global markets, including currencies, causing the British pound to fall to its lowest level in decades. Prime Minister David Cameron, who supported the UK remaining in the EU announced he would step down in October.
Commodity Trading Advisors (CTA) provide advice and services related to trading in futures contracts. They are responsible for the trading within managed futures accounts.
Giltsare bonds that are issued by the British government, and they are generally considered low-risk investments.
Gross Domestic Product (GDP) is the monetary value of all the finished goods and services produced within a country’s borders in a specific time period.
TheHFRX Equity Hedge Index encompasses various equity hedge strategies, also known as long/short equity, that combine core long holdings of equities with short sales of stock, stock indices, related derivatives, or other financial instruments related to the equity markets.
Long-shortequity is an investing strategy of taking long positions in stocks that are expected to appreciate and short positions in stocks that are expected to decline. A long/short equity strategy seeks to minimize market exposure, while profiting from stock gains in the long positions and price declines in the short positions.
TheNational Association of Securities Dealers Automated Quotations (NASDAQ) is a global electronic marketplace for buying and selling securities, as well as the benchmark index for US technology stocks.
Quantitative Easing (QE) is the introduction of new money into the money supply by a central bank.
TheS&P500 Total Return Index® is widely regarded as the best single gauge of the U.S. equities market.
This world-renowned Index includes 500 leading companies in leading industries of the U.S. economy.
TheVIX® Index (VIX) is a forward-looking measure of equity market volatility. Since its introduction, the VIX is considered by many to be the world’s premier barometer of investor sentiment and market volatility.
Investors cannot directly invest in an index and unmanaged index returns do not reflect any fees, expenses or sales charges.
| |
| IMPORTANT RISK DISCLOSURES |
| 47 Hulfish Street, Suite 510, Princeton, NJ 08542 ● T 609.430.0404 ● F609.454.5010 ● www.equinoxfunds.com |
Mutual funds involve risk including possible loss of principal. There is no assurance that the Fund will achieve its investment objective.
Exposure to the commodities markets may subject the Fund to greater volatility than investments in traditional securities. Many of the derivative contracts entered into by the Fund, the Subsidiary or a trading company will be privately negotiated in the OTC market. These contracts also involve exposure to credit risk, since contract performance depends in part on the financial condition of the counterparty. Credit risk refers to the possibility that the issuer of the security will not be able to make principal and interest payments when due.
Currency rates in foreign countries may fluctuate significantly over short periods of time for a number of reasons, including changes in interest rates and the imposition of currency controls or other political developments in the US or abroad. Derivative instruments come in many varieties and have a wide range of potential risks and rewards, and may include futures contracts, options on futures contracts, options, swaps, and forward currency exchange contracts. Derivatives typically have economic leverage inherent in their terms. The use of leverage tends to exaggerate the effect of any increase or decrease in the value of the Fund’s portfolio securities or other investments. Furthermore, derivative instruments and futures contracts are highly volatile and are subject to occasional rapid and substantial fluctuations. Investments in foreign securities could subject the Fund to greater risks including, currency fluctuation, economic conditions, and different governmental and accounting standards. Derivative instruments and futures contracts are highly volatile and are subject to occasional rapid and substantial fluctuations.
Investors should carefully consider the investment objectives, risks, charges and expenses of Equinox Ampersand Strategy Fund. This and other important information about the Fund is contained in the Prospectus, which can be obtained by calling 1.888.643.3431. The Prospectus should be read carefully before investing.
Equinox Ampersand Strategy Fund is distributed by Northern Lights Distributors, LLC, Member FINRA/SIPC.
Equinox Institutional Asset Management, LP, Equinox Group Distributors, LLC and Quest Partners, LLC are not affiliated with Northern Lights Distributors, LLC.
3566-NLD-7/30/2019
| 47 Hulfish Street, Suite 510, Princeton, NJ 08542 ● T 609.430.0404 ● F609.454.5010 ● www.equinoxfunds.com |
| Equinox Ampersand Strategy Fund |
| PORTFOLIO REVIEW (Unaudited) |
| June 30, 2019 |
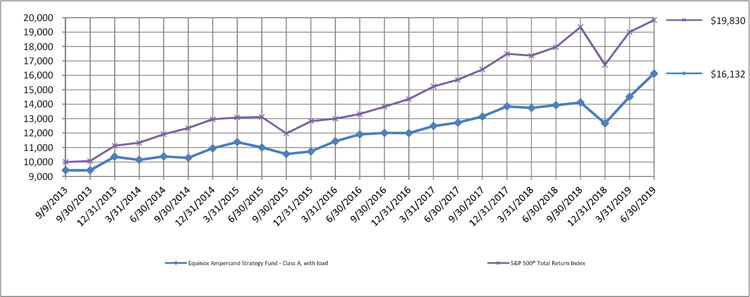
The Fund’s performance figures* for the periods ended June 30, 2019, as compared to its benchmark:
| | | Annualized |
| | | | | Start of Perfomance **- |
| | One Year | Three Year | Five Year | June 30, 2019 |
| Equinox Ampersand Strategy Fund | | | | |
| Class A with Load | 9.05% | 8.46% | 7.92% | 8.59% |
| Class A | 15.75% | 10.61% | 9.20% | 9.70% |
| Class I | 16.19% | 11.05% | 9.55% | 10.04% |
| S&P 500® Total Return Index *** | 10.42% | 14.19% | 10.71% | 12.52% |
| * | The performance data quoted is historical. The performance comparison includes reinvestment of all dividends and capital gains and has been adjusted for Class A maximum applicable sales charge of 5.75%. Past performance is no guarantee of future results. Current performance may be higher or lower than the performance data quoted. The principal value and investment return of an investment will fluctuate so that your shares, when redeemed, may be worth more or less than their original cost. The returns shown in the table do not reflect the deduction of taxes that a shareholder would pay on Portfolio distributions or on the redemptions of Portfolio shares. Performance figures for periods greater than one year are annualized. Performance figures would have been lower had Equinox Institutional Asset Management, LP (the “Adviser”) not waived its fees or reimbursed a portion of the Fund’s expenses pursuant to an expense limitation agreement. Under the terms of the expense limitation agreement, the Adviser has contractually agreed to reduce its Advisory fee and/or reimburse certain expenses of the Fund, to ensure that the Fund’s total annual operating expenses, excluding (i) taxes, (ii) interest, (iii) extraordinary items, (iv) “Acquired Fund Fees and Expenses,” and (v) brokerage commissions, do not exceed, on an annual basis, 1.24% and 0.99% of the Fund’s average daily net assets for Class A and Class I shares, respectively. This expense limitation will remain in effect until October 31, 2019 but can be terminated by the Fund’s Board of Trustees on 60 days’ written notice to the Adviser. The Adviser shall be entitled to recover, subject to approval by the Board of Trustees of the Trust, such waived or reimbursed amounts for a period of up to three (3) years from the date on which the Adviser reduced its compensation and/or assumed expenses for the Fund. The Adviser is permitted to seek reimbursement from the Fund, subject to certain limitations, for fees it waived and Fund expenses it paid to the extent the total annual fund operating expenses do not exceed the limits described above or any lesser limits in effect at the time of reimbursement. No recoupment by the Adviser will occur unless the Fund’s operating expenses are below the expense limitation amount. The Fund’s “total annual fund operating expenses” and “total annual fund operating expenses after fee waiver and/or expense reimbursement,” respectively, are 3.16% and 1.24% for Class A Shares and 3.12% and 0.99% for Class I Shares per the November 1, 2018 prospectus. More recent expense ratio information is available in the Consolidated Financial Highlights included in this report. For performance information current to the most recent month-end please call 1-888-643-3431. |
| ** | Start of performance is September 9, 2013. |
| *** | The S&P 500® Total Return Index is a widely accepted, unmanaged index of U.S. stock market performance which does not take into account charges, fees and other expenses. It is not possible to invest directly in an index. |
Comparison of the Change in Value of a $10,000 Investment
| Equinox Ampersand Strategy Fund |
| PORTFOLIO REVIEW (Unaudited)(Continued) |
| June 30, 2019 |
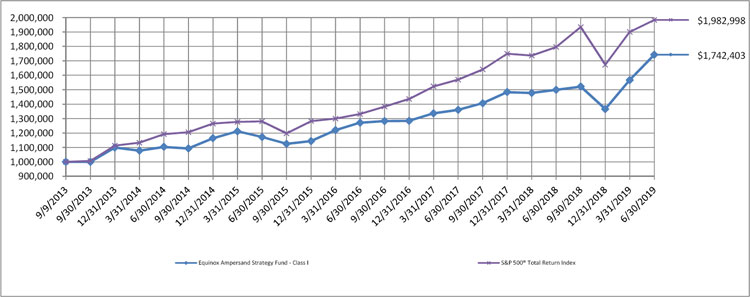
Comparison of the Change in Value of a $1,000,000 Investment
| Portfolio Composition | | % of Net Assets | |
| Exchange Traded Funds | | | 2.2 | % |
| U.S. Treasury Notes | | | 76.9 | % |
| Short-Term Investment | | | 16.1 | % |
| Other assets and liabilities - net ^ | | | 4.8 | % |
| | | | 100.0 | % |
| ^ | Includes net unrealized appreciation on swap contract and futures contracts. |
Please refer to the Consolidated Portfolio of Investments in this annual report for a detailed analysis of the Fund’s holdings.
| Equinox Ampersand Strategy Fund |
| CONSOLIDATED PORTFOLIO OF INVESTMENTS |
| June 30, 2019 |
| Shares | | | | | | | | | Fair Value | |
| | | | | EXCHANGE TRADED FUNDS - 2.2% | | | | | | | | |
| | 3,000 | | | Invesco BulletShares 2019 High Yield Corporate Bond ETF | | $ | 71,850 | |
| | 3,000 | | | Invesco BulletShares 2020 High Yield Corporate Bond ETF | | | | 72,270 | |
| | | | | TOTAL EXCHANGE TRADED FUNDS (Cost - $145,304) | | | 144,120 | |
| | | | | | | | | | | | | |
| Principal | | | | | Coupon | | | | | | |
| Amount | | | | | Rate % | | Maturity Date | | | | |
| | | | | U.S. TREASURY NOTES - 76.9% | | | | | | | | |
| $ | 1,625,000 | | | United States Treasury Note +* | | 1.250 | | 1/31/2020 | | | 1,617,097 | |
| | 1,000,000 | | | United States Treasury Note | | 1.500 | | 4/15/2020 | | | 995,938 | |
| | 285,000 | | | United States Treasury Note +* | | 1.625 | | 7/31/2019 | | | 284,853 | |
| | 2,225,000 | | | United States Treasury Note +* | | 2.000 | | 7/31/2020 | | | 2,226,738 | |
| | | | | TOTAL U.S. TREASURY NOTES (Cost - $5,100,328) | | | 5,124,626 | |
| | | | | | | | | | | | | |
| Shares | | | | | | | | | | | |
| | | | | SHORT-TERM INVESTMENT - 16.1% | | | | | | | | |
| | | | | MONEY MARKET FUND - 16.1% | | | | | | | | |
| | 1,076,245 | | | U.S. Bank Money Market Deposit Account | | | | | | | 1,076,245 | |
| | | | | TOTAL SHORT-TERM INVESTMENT (Cost - $1,076,245) | | | | |
| | | | | | | | | | | | | |
| | | | | TOTAL INVESTMENTS - 95.2% (Cost - $6,321,877) | | | | $ | 6,344,991 | |
| | | | | OTHER ASSETS AND LIABILITIES - NET - 4.8% | | | | | 321,511 | |
| | | | | TOTAL NET ASSETS - 100.0% | | | | | | $ | 6,666,502 | |
| + | All or a portion of this security is pledged as collateral for swap agreement. As of June 30, 2019, $1,397,448 is pledged as collateral for the swap agreement. |
| * | All or a portion of this investment is a holding of Equinox Equity Hedge Strategy Fund Limited. |
See accompanying notes to consolidated financial statements.
| Equinox Ampersand Strategy Fund |
| CONSOLIDATED PORTFOLIO OF INVESTMENTS (Continued) |
| June 30, 2019 |
LONG FUTURES CONTRACTS
| Number of | | | | | | | Notional Value at | | | Unrealized | |
| Contracts | | | Description | | Expiration Date | | June 30, 2019 | | | Appreciation | |
| | 51 | | | S&P 500 E-Mini Future | | Sep-19 | | $ | 7,507,710 | | | $ | 70,875 | |
SWAP CONTRACTS
| Notional Value at | | | | | | | | | | | Unrealized | |
| June 30, 2019 | | | Total Return Swap | | Counterparty | | Fixed Rate Paid | | Termination Date | | Appreciation | |
| | 11,747,107 | | | Equinox Ampersand Fund Basket * | | Deutsche Bank | | 0.50% of the
notional value | | 7/1/2023 | | $ | 409,227 | |
| | | | | Total Net Unrealized Appreciation on Swap | | $ | 409,227 | |
Total Return Swap Top 50 Holdings ^
| FUTURES CONTRACTS | |
| | | | | | | | | | | | | Unrealized | |
| Number of | | | | | | | | | Notional Value at | | | Appreciation/ | |
| Contracts | | | Description | | Counterparty | | Expiration Date | | June 30, 2019 | | | (Depreciation) | |
| SHORT CONTRACTS | | | | | | | | | | | | |
| | 5 | | | 10 year Australian Treasury Bond Future | | Deutsche Bank | | Sep-19 | | | 4,337,885 | | | $ | (3,508 | ) |
| | 7 | | | 2 year Euro-Schatz Future | | Deutsche Bank | | Sep-19 | | | 886,079 | | | | (1,514 | ) |
| | 13 | | | 3 month Euro (EURIBOR) | | Deutsche Bank | | Sep-19 | | | 3,646,953 | | | | (2,903 | ) |
| | 8 | | | 3 month Euro (EURIBOR) | | Deutsche Bank | | Dec-20 | | | 2,415,569 | | | | (6,582 | ) |
| | 35 | | | 3 month Sterling | | Deutsche Bank | | Sep-19 | | | 5,542,441 | | | | (480 | ) |
| | 10 | | | 5 year US Treasury Notes Future | | Deutsche Bank | | Oct-19 | | | 1,224,351 | | | | (7,013 | ) |
| | 52 | | | 90 Day Bank Accepted Bill Future | | Deutsche Bank | | Sep-19 | | | 8,795,544 | | | | (10,913 | ) |
| | 7 | | | Euro-BUND Future | | Deutsche Bank | | Sep-19 | | | 1,280,004 | | | | (6,208 | ) |
| | 4 | | | Eurodollar | | Deutsche Bank | | Jun-20 | | | 1,103,381 | | | | (4,077 | ) |
| | 5 | | | Eurodollar | | Deutsche Bank | | Mar-21 | | | 1,309,378 | | | | (8,002 | ) |
| | 4 | | | Nikkei 225 Future | | Deutsche Bank | | Sep-19 | | | 42,553,742 | | | | (4,301 | ) |
| | | | | | | | | | | | | | | | | |
| LONG CONTRACTS | | | | | | | | | | |
| | 5 | | | 10 year Australian Treasury Bond Future | | Deutsche Bank | | Sep-19 | | | 4,383,677 | | | | 3,000 | |
| | 6 | | | 10 year Italian Bond Future | | Deutsche Bank | | Sep-19 | | | 954,348 | | | | 37,831 | |
| | 5 | | | 10 year Japanese Government Bond Future | | Deutsche Bank | | Sep-19 | | | 6,685,790 | | | | 16,813 | |
| | 22 | | | 10 year US Treasury Notes Future | | Deutsche Bank | | Sep-19 | | | 2,852,031 | | | | 26,201 | |
| | 16 | | | 2 year Euro-Schatz Future | | Deutsche Bank | | Sep-19 | | | 2,074,041 | | | | 2,490 | |
| | 5 | | | 2 year US Treasury Notes Future | | Deutsche Bank | | Oct-19 | | | 1,157,160 | | | | 3,332 | |
| | 4 | | | 3 month Euro (EURIBOR) | | Deutsche Bank | | Sep-19 | | | 1,239,746 | | | | 665 | |
| | 6 | | | 3 month Euro (EURIBOR) | | Deutsche Bank | | Mar-20 | | | 1,835,977 | | | | 3,385 | |
| | 7 | | | 3 month Euro (EURIBOR) | | Deutsche Bank | | Jun-20 | | | 1,910,799 | | | | 2,945 | |
| | 6 | | | 3 month Euro (EURIBOR) | | Deutsche Bank | | Sep-20 | | | 1,590,670 | | | | 2,329 | |
| | 34 | | | 3 month Euro (EURIBOR) | | Deutsche Bank | | Mar-21 | | | 9,862,491 | | | | 19,240 | |
| | 12 | | | 3 month Sterling | | Deutsche Bank | | Dec-19 | | | 1,906,750 | | | | 288 | |
| | 8 | | | 3 month Sterling | | Deutsche Bank | | Jun-20 | | | 1,250,498 | | | | (59 | ) |
| | 11 | | | 3 month Sterling | | Deutsche Bank | | Sep-20 | | | 1,701,216 | | | | 3,441 | |
| | 23 | | | 3 month Sterling | | Deutsche Bank | | Dec-20 | | | 3,649,519 | | | | 6,935 | |
| | 19 | | | 3 month Sterling | | Deutsche Bank | | Mar-21 | | | 2,995,795 | | | | 6,923 | |
| | 13 | | | 3 year Australian Treasury Bond Future | | Deutsche Bank | | Sep-19 | | | 2,999,570 | | | | 1,035 | |
| | 7 | | | 30 year US Treasury Bonds Future | | Deutsche Bank | | Sep-19 | | | 1,012,013 | | | | 17,417 | |
| | 16 | | | 5 year US Treasury Notes Future | | Deutsche Bank | | Oct-19 | | | 1,851,929 | | | | 11,056 | |
| | 8 | | | 90 Day Bank Accepted Bill Future | | Deutsche Bank | | Dec-19 | | | 1,428,711 | | | | 4,796 | |
| | 22 | | | 90 Day Bank Accepted Bill Future | | Deutsche Bank | | Mar-20 | | | 3,733,395 | | | | 9,478 | |
| | 9 | | | 90 Day Bank Accepted Bill Future | | Deutsche Bank | | Jun-20 | | | 1,611,797 | | | | 3,555 | |
| | 40 | | | 90 Day Bank Accepted Bill Future | | Deutsche Bank | | Sep-20 | | | 6,781,275 | | | | 14,113 | |
| | 6 | | | E-Mini S&P 500 | | Deutsche Bank | | Sep-19 | | | 904,802 | | | | 17,892 | |
| | 14 | | | Euro-BOBL Future | | Deutsche Bank | | Sep-19 | | | 2,139,427 | | | | 8,209 | |
| | 11 | | | Euro-BUND Future | | Deutsche Bank | | Sep-19 | | | 2,126,625 | | | | 17,948 | |
| | 14 | | | Eurodollar | | Deutsche Bank | | Dec-19 | | | 3,340,389 | | | | 16,678 | |
| | 6 | | | Eurodollar | | Deutsche Bank | | Mar-20 | | | 1,352,253 | | | | 2,185 | |
| | 11 | | | Eurodollar | | Deutsche Bank | | Jun-20 | | | 2,771,671 | | | | 929 | |
| | 8 | | | Eurodollar | | Deutsche Bank | | Dec-20 | | | 1,992,228 | | | | 11,371 | |
| | 23 | | | Eurodollar | | Deutsche Bank | | Mar-22 | | | 5,611,980 | | | | 30,581 | |
| | 13 | | | JPY/USD | | Deutsche Bank | | Sep-19 | | | 1,506,677 | | | | 6,203 | |
| * | This investment is a holding of Equinox Equity Hedge Strategy Fund Limited. |
| ^ | These investments are not direct holdings of the Fund. The holdings were determined based on the absolute notional values of the positions within the underlying swap basket. |
See accompanying notes to consolidated financial statements.
| Equinox Ampersand Strategy Fund |
| CONSOLIDATED PORTFOLIO OF INVESTMENTS (Continued) |
| June 30, 2019 |
Total Return Swap Top 50 Holdings ^ (Continued)
| FUTURES CONTRACTS (Continued) | |
| | | | | | | | | | | | | Unrealized | |
| Number of | | | | | | | | | Notional Value at | | | Appreciation/ | |
| Contracts | | | Description | | Counterparty | | Expiration Date | | June 30, 2019 | | | (Depreciation) | |
| LONG CONTRACTS (Continued) | | | | | | | | |
| | 26 | | | Light Sweet Crude Oil (WTI) Future | | Deutsche Bank | | Jul-19 | | | 1,545,603 | | | $ | 122,961 | |
| | 5 | | | Long Gilt Future | | Deutsche Bank | | Sep-19 | | | 901,896 | | | | 5,930 | |
| | 2 | | | Nikkei 225 Future | | Deutsche Bank | | Sep-19 | | | 5,542,308 | | | | 1,103 | |
| | 9 | | | Three Month Canadian Bankers Acceptance Future | | Deutsche Bank | | Mar-20 | | | 1,671,546 | | | | (10 | ) |
| OPTIONS ON CURRENCY | |
| | | | | | | | | | | | | | | Unrealized | |
| | | | | | | | | | | | | | | Appreciation/ | |
| | | Put/Call | | Description | | Expiration | | Strike Price | | | Notional Value | | | (Depreciation) | |
| Written | | | | | | | | | | | | | | | | | | |
| | | Put | | JPY/USD | | Sep-19 | | | 100.00 | | | | 1,695,090 | | | $ | (119 | ) |
| | | Put | | JPY/USD | | Oct-19 | | | 101.00 | | | | 1,144,296 | | | | (846 | ) |
| | | Put | | USD/EUR | | Oct-19 | | | 1.06 | | | | 1,438,082 | | | | (109 | ) |
| ^ | These investments are not direct holdings of the Fund. The holdings were determined based on the absolute notional values of the positions within the underlying swap basket. |
See accompanying notes to consolidated financial statements.
Equinox Ampersand Strategy Fund
CONSOLIDATED STATEMENT OF ASSETS AND LIABILITIES
June 30, 2019
| ASSETS | | | | |
| Investment securities: | | | | |
| At cost | | $ | 6,321,877 | |
| At fair value | | $ | 6,344,991 | |
| Cash | | | 35,073 | |
| Swap margin balance * | | | 68,706 | |
| Deposits for future contracts ** | | | 30,348 | |
| Unrealized appreciation on swap contract | | | 409,227 | |
| Receivable due from Adviser | | | 24,051 | |
| Unrealized appreciation on futures contracts | | | 70,875 | |
| Receivable for Fund shares sold | | | 26,726 | |
| Interest receivable | | | 33,196 | |
| Prepaid expenses and other assets | | | 42,567 | |
| TOTAL ASSETS | | | 7,085,760 | |
| | | | | |
| LIABILITIES | | | | |
| Due to Broker - Swap contract | | | 387,053 | |
| Distribution (12b-1) fees payable | | | 259 | |
| Payable to related parties | | | 1,922 | |
| Accrued audit fee | | | 23,666 | |
| Accrued expenses and other liabilities | | | 6,358 | |
| TOTAL LIABILITIES | | | 419,258 | |
| NET ASSETS | | $ | 6,666,502 | |
| | | | | |
| Net Assets Consist Of: | | | | |
| Paid in capital | | $ | 6,177,901 | |
| Accumulated earnings | | | 488,601 | |
| NET ASSETS | | $ | 6,666,502 | |
| * | Pledged as collateral for swap agreement. |
| ** | Pledged as collateral for futures contracts. |
See accompanying notes to consolidated financial statements.
Equinox Ampersand Strategy Fund
CONSOLIDATED STATEMENT OF ASSETS AND LIABILITIES (Continued)
June 30, 2019
| Net Asset Value Per Share: | | | |
| Class A Shares: | | | | |
| Net Assets | | $ | 1,163,099 | |
| Shares of beneficial interest outstanding ($0 par value, unlimited shares authorized) | | | 101,430 | |
| Net asset value (Net Assets ÷ Shares Outstanding) and redemption price per share(a)(b) | | $ | 11.47 | |
| Maximum offering price per share (maximum sales charges of 5.75%) | | $ | 12.17 | |
| | | | | |
| Class I Shares: | | | | |
| Net Assets | | $ | 5,503,403 | |
| Shares of beneficial interest outstanding ($0 par value, unlimited shares authorized) | | | 473,760 | |
| Net asset value (Net Assets ÷ Shares Outstanding), offering price and redemption price per share(b) | | $ | 11.62 | |
| (a) | On investments of $1 million or more, the maximum sales charge will not apply. Instead, the investment may be subject to a 1.00% contingent deferred sales charge. |
| (b) | Redemptions made within 30 days of purchase may be assessed a redemption fee of 1.00%. |
See accompanying notes to consolidated financial statements.
Equinox Ampersand Strategy Fund
CONSOLIDATED STATEMENT OF OPERATIONS
Year Ended June 30, 2019
| INVESTMENT INCOME | | | | |
| Dividends | | $ | 5,042 | |
| Interest | | | 178,648 | |
| TOTAL INVESTMENT INCOME | | | 183,690 | |
| | | | | |
| EXPENSES | | | | |
| Investment advisory fees | | | 65,533 | |
| Distribution (12b-1) fees - Class A | | | 6,022 | |
| Legal fees | | | 71,613 | |
| Registration fees | | | 54,390 | |
| Audit fees | | | 24,548 | |
| Accounting services fees | | | 4,573 | |
| Transfer agent fees | | | 21,528 | |
| Compliance officer fees | | | 524 | |
| Custodian fees | | | 10,246 | |
| Administrative services fees | | | 9,963 | |
| Insurance expense | | | 2,269 | |
| Printing and postage expenses | | | 46,145 | |
| Trustees fees and expenses | | | 3,651 | |
| Third party administrative services fees | | | 2,113 | |
| Other expenses | | | 1,676 | |
| TOTAL EXPENSES | | | 324,794 | |
| | | | | |
| Less: Fees waived and expenses reimbursed by the Adviser | | | (231,363 | ) |
| | | | | |
| NET EXPENSES | | | 93,431 | |
| NET INVESTMENT INCOME | | | 90,259 | |
| | | | | |
| REALIZED AND UNREALIZED GAIN/(LOSS) ON INVESTMENTS | | | | |
| Net realized gain/(loss) on: | | | | |
| Investments | | | (8,496 | ) |
| Futures contracts | | | 44,709 | |
| Futures commissions | | | (1,666 | ) |
| Swap contracts | | | (723,694 | ) |
| | | | (689,147 | ) |
| Net change in unrealized appreciation on: | | | | |
| Investments | | | 26,944 | |
| Futures contracts | | | 312,955 | |
| Swap contracts | | | 818,798 | |
| | | | 1,158,697 | |
| | | | | |
| NET REALIZED AND UNREALIZED GAIN ON INVESTMENTS | | | 469,550 | |
| | | | | |
| NET INCREASE IN NET ASSETS RESULTING FROM OPERATIONS | | $ | 559,809 | |
See accompanying notes to consolidated financial statements.
Equinox Ampersand Strategy Fund
CONSOLIDATED STATEMENTS OF CHANGES IN NET ASSETS
| | | For the Year Ended | | | For the Year Ended | |
| | | June 30, | | | June 30, | |
| | | 2019 | | | 2018 | |
| FROM OPERATIONS | | | | | | | | |
| Net investment income/(loss) | | $ | 90,259 | | | $ | (57,207 | ) |
| Net realized gain/(loss) on investments, futures contracts, and swap contract | | | (689,147 | ) | | | 1,036,279 | |
| Net change in unrealized appreciation/(depreciation) on investments, futures contracts, and swap contract | | | 1,158,697 | | | | (353,140 | ) |
| Net increase in net assets resulting from operations | | | 559,809 | | | | 625,932 | |
| | | | | | | | | |
| DISTRIBUTIONS TO SHAREHOLDERS | | | | | | | | |
| From net realized gains | | | | | | | | |
| Class A | | | — | | | | (371,278 | ) |
| Class C(a) | | | — | | | | (17,418 | ) |
| Class I | | | — | | | | (480,045 | ) |
| | | | — | | | | (868,741 | ) |
| Total Distributions Paid* | | | | | | | | |
| Class A | | | (100,358 | ) | | | — | |
| Class I | | | (296,646 | ) | | | — | |
| | | | (397,004 | ) | | | — | |
| FROM SHARES OF BENEFICIAL INTEREST | | | | | | | | |
| Proceeds from shares sold: | | | | | | | | |
| Class A | | | 464,075 | | | | 633,804 | |
| Class C(a) | | | — | | | | 86,450 | |
| Class I | | | 1,931,169 | | | | 8,947,043 | |
| Net asset value of shares issued in reinvestment of distributions: | | | | | | | | |
| Class A | | | 93,700 | | | | 357,134 | |
| Class C(a) | | | — | | | | 17,418 | |
| Class I | | | 278,639 | | | | 468,692 | |
| Redemption fee proceeds: | | | | | | | | |
| Class A | | | 263 | | | | 235 | |
| Class C(a) | | | — | | | | 91 | |
| Class I | | | 1,218 | | | | 21,175 | |
| Payments for shares redeemed: | | | | | | | | |
| Class A | | | (3,275,338 | ) | | | (1,087,696 | ) |
| Class C(a) | | | — | | | | (202,011 | ) |
| Class I | | | (4,777,125 | ) | | | (3,874,795 | ) |
| Net increase/(decrease) in net assets from shares of beneficial interest | | | (5,283,399 | ) | | | 5,367,540 | |
| | | | | | | | | |
| TOTAL INCREASE/(DECREASE) IN NET ASSETS | | | (5,120,594 | ) | | | 5,124,731 | |
| | | | | | | | | |
| NET ASSETS | | | | | | | | |
| Beginning of Period | | | 11,787,096 | | | | 6,662,365 | |
| End of Period** | | $ | 6,666,502 | | | $ | 11,787,096 | |
| * | Distributions from net investment income and net realized capital gains are combined for the year ended June 30, 2019. See “New Accounting Pronouncements” in the Notes to Financial Statements for more information. The dividends and distributions to shareholders for the year ended June 30, 2018 have not been reclassified to conform to the current year presentation. |
| ** | Net Assets - End of Period includes distributions in excess of net investment income of $372,725 as of June 30, 2018. |
| (a) | Effective April 9, 2018, all outstanding Class C shares were converted to Class A shares. |
See accompanying notes to consolidated financial statements.
Equinox Ampersand Strategy Fund
CONSOLIDATED STATEMENT OF CHANGES IN NET ASSETS (Continued)
| | | For the Year Ended | | | For the Year Ended | |
| | | June 30, | | | June 30, | |
| | | 2019 | | | 2018 | |
| SHARE ACTIVITY | | | | | | | | |
| Class A: | | | | | | | | |
| Shares Sold | | | 44,726 | | | | 59,921 | |
| Shares Reinvested | | | 10,624 | | | | 34,572 | |
| Shares Redeemed | | | (340,631 | ) | | | (103,387 | ) |
| Net decrease in shares of beneficial interest outstanding | | | (285,281 | ) | | | (8,894 | ) |
| | | | | | | | | |
| Class C:(a) | | | | | | | | |
| Shares Sold | | | — | | | | 8,426 | |
| Shares Reinvested | | | — | | | | 1,754 | |
| Shares Redeemed | | | — | | | | (20,762 | ) |
| Net decrease in shares of beneficial interest outstanding | | | — | | | | (10,582 | ) |
| | | | | | | | | |
| Class I: | | | | | | | | |
| Shares Sold | | | 181,246 | | | | 827,853 | |
| Shares Reinvested | | | 31,238 | | | | 44,980 | |
| Shares Redeemed | | | (473,438 | ) | | | (373,760 | ) |
| Net increase/(decrease) in shares of beneficial interest outstanding | | | (260,954 | ) | | | 499,073 | |
| (a) | Effective April 9, 2018, all outstanding Class C shares were converted to Class A shares. |
See accompanying notes to consolidated financial statements.
Equinox Ampersand Strategy Fund
CONSOLIDATED FINANCIAL HIGHLIGHTS
Per Share Data and Ratios for a Share of Beneficial Interest Outstanding Throughout Each Period
| | | Class A | |
| | | For the Year Ended | | | For the Year Ended | | | For the Year Ended | | | For the Year Ended | | | For the Year Ended | |
| | | June 30, | | | June 30, | | | June 30, | | | June 30, | | | June 30, | |
| | | 2019 | | | 2018 | | | 2017 | | | 2016 | | | 2015 | |
| Net asset value, beginning of period | | $ | 10.42 | | | $ | 10.36 | | | $ | 10.21 | | | $ | 10.11 | | | $ | 11.01 | |
| Activity from investment operations: | | | | | | | | | | | | | | | | | | | | |
| Net investment income/(loss) (1) | | | 0.09 | | | | (0.07 | ) | | | (0.11 | ) | | | (0.13 | ) | | | (0.15 | ) |
| Net realized and unrealized gain on investments, futures contracts and swap contract | | | 1.41 | | | | 1.05 | | | | 0.78 | | | | 0.89 | | | | 0.82 | |
| Total from investment operations | | | 1.50 | | | | 0.98 | | | | 0.67 | | | | 0.76 | | | | 0.67 | |
| Less distributions from: | | | | | | | | | | | | | | | | | | | | |
| Net investment income | | | (0.00 | ) (2) | | | — | | | | (0.26 | ) | | | — | | | | — | |
| Net realized gains | | | (0.45 | ) | | | (0.92 | ) | | | (0.26 | ) | | | (0.66 | ) | | | (1.57 | ) |
| Total distributions | | | (0.45 | ) | | | (0.92 | ) | | | (0.52 | ) | | | (0.66 | ) | | | (1.57 | ) |
| Paid-in-Capital From Redemption Fees | | | 0.00 | (2) | | | 0.00 | (2) | | | 0.00 | (2) | | | 0.00 | (2) | | | — | |
| Net asset value, end of period | | $ | 11.47 | | | $ | 10.42 | | | $ | 10.36 | | | $ | 10.21 | | | $ | 10.11 | |
| Total return (3) | | | 15.75 | % | | | 9.50 | % | | | 6.79 | % | | | 8.24 | % | | | 6.00 | % |
| Net assets, at end of period (000’s) | | $ | 1,163 | | | $ | 4,029 | | | $ | 4,098 | | | $ | 3,972 | | | $ | 4,618 | |
| Supplemental data and ratios: | | | | | | | | | | | | | | | | | | | | |
| Ratio of gross expenses to average net assets (4) | | | 3.98 | % (5) | | | 3.36 | % | | | 3.37 | % | | | 4.08 | % | | | 4.15 | % (5) |
| Ratio of net expenses to average net assets | | | 1.24 | % (5) | | | 1.45 | % | | | 1.45 | % | | | 1.45 | % | | | 1.81 | % (5)(7) |
| Ratio of net investment income/(loss) to average net assets | | | 0.88 | % (5)(6) | | | (0.70 | )% | | | (1.08 | )% | | | (1.28 | )% | | | (1.44 | )% (5)(6) |
| Portfolio Turnover Rate | | | 80 | % | | | 69 | % | | | 0 | % | | | 0 | % | | | 31 | % |
| (1) | Per share amounts calculated using the average shares method, which more appropriately presents the per share data for the period. |
| (2) | Represents less than $0.005 per share. |
| (3) | Total returns are historical and assume changes in share prices and reinvestment of dividends and distributions. Total returns for periods of less than one year are not annualized. Total returns shown exclude the effect of the maximum applicable sales charges of 5.75% and, if applicable, wire redemption fees. Had the Adviser and Administrator not waived its fees or reimbursed a portion of the Fund’s expense, the returns would have been lower. |
| (4) | Represents the ratio of expenses to average net assets absent fee waivers and/or expense reimbursements by the Adviser and Administrator. |
| (5) | Does not include the expenses of other investment companies in which the Fund invests. |
| (6) | Recognition of net investment income by the Fund is affected by the timing of the declaration of dividends by the underlying exchange traded funds in which the Fund invests. |
| (7) | Ratio exceeds the expense limit in place as of June 30, 2015 because the Adviser reduced the expense limit during the year. |
See accompanying notes to consolidated financial statements.
Equinox Ampersand Strategy Fund
CONSOLIDATED FINANCIAL HIGHLIGHTS
Per Share Data and Ratios for a Share of Beneficial Interest Outstanding Throughout Each Period
| | | Class I | |
| | | For the Year Ended | | | For the Year Ended | | | For the Year Ended | | | For the Year Ended | | | For the Year Ended | |
| | | June 30, | | | June 30, | | | June 30, | | | June 30, | | | June 30, | |
| | | 2019 | | | 2018 | | | 2017 | | | 2016 | | | 2015 | |
| Net asset value, beginning of period | | $ | 10.56 | | | $ | 10.43 | | | $ | 10.28 | | | $ | 10.15 | | | $ | 11.03 | |
| Activity from investment operations: | | | | | | | | | | | | | | | | | | | | |
| Net investment income/(loss) (1) | | | 0.11 | | | | (0.04 | ) | | | (0.09 | ) | | | (0.10 | ) | | | (0.13 | ) |
| Net realized and unrealized gain on investments, futures contracts and swap contract | | | 1.45 | | | | 1.05 | | | | 0.79 | | | | 0.89 | | | | 0.82 | |
| Total from investment operations | | | 1.56 | | | | 1.01 | | | | 0.70 | | | | 0.79 | | | | 0.69 | |
| Less distributions from: | | | | | | | | | | | | | | | | | | | | |
| Net investment income | | | (0.05 | ) | | | — | | | | (0.29 | ) | | | — | | | | — | |
| Net realized gains | | | (0.45 | ) | | | (0.92 | ) | | | (0.26 | ) | | | (0.66 | ) | | | (1.57 | ) |
| Total distributions | | | (0.50 | ) | | | (0.92 | ) | | | (0.55 | ) | | | (0.66 | ) | | | (1.57 | ) |
| Paid-in-Capital From Redemption Fees | | | 0.00 | (2) | | | 0.04 | | | | — | | | | 0.00 | (2) | | | — | |
| Net asset value, end of period | | $ | 11.62 | | | $ | 10.56 | | | $ | 10.43 | | | $ | 10.28 | | | $ | 10.15 | |
| Total return (3) | | | 16.19 | % | | | 10.15 | % | | | 7.00 | % | | | 8.50 | % | | | 6.19 | % |
| Net assets, at end of period (000’s) | | $ | 5,503 | | | $ | 7,758 | | | $ | 2,458 | | | $ | 1,650 | | | $ | 2,025 | |
| Supplemental data and ratios: | | | | | | | | | | | | | | | | | | | | |
| Ratio of gross expenses to average net assets (4) | | | 3.57 | % (5) | | | 3.32 | % | | | 3.11 | % | | | 3.77 | % | | | 4.13 | % (5) |
| Ratio of net expenses to average net assets | | | 0.99 | % (5) | | | 1.20 | % | | | 1.20 | % | | | 1.20 | % | | | 1.60 | % (5)(7) |
| Ratio of net investment income/(loss) to average net assets | | | 1.08 | % (5)(6) | | | (0.41 | )% | | | (0.83 | )% | | | (1.04 | )% | | | (1.19 | )% (5)(6) |
| Portfolio Turnover Rate | | | 80 | % | | | 69 | % | | | 0 | % | | | 0 | % | | | 31 | % |
| (1) | Per share amounts calculated using the average shares method, which more appropriately presents the per share data for the period. |
| (2) | Represents less than $0.005 per share. |
| (3) | Total returns are historical and assume changes in share price and reinvestment of dividends and distributions. Total returns for periods of less than on year are not annualized. Total returns shown exclude the effect of the maximum applicable sales charge and, if applicable, wire redemption fees. Had the Adviser and Administrator not waived its fees or reimbursed a portion of the Fund’s expenses, the returns would have been lower. |
| (4) | Represents the ratio of expenses to average net assets absent fee waivers and/or expense reimbursements by the Adviser and Administrator. |
| (5) | Does not include the expenses of other investment companies in which the Fund invests. |
| (6) | Recognition of net investment income by the Fund is affected by the timing of the declaration of dividends by the underlying exchange traded funds in which the Fund invests. |
| (7) | Ratio exceeds the expense limit in place as of June 30, 2015 because the Adviser reduced the expense limit during the year. |
See accompanying notes to consolidated financial statements.
Equinox Ampersand Strategy Fund
NOTES TO CONSOLIDATED FINANCIAL STATEMENTS
June 30, 2019
The Equinox Ampersand Strategy Fund, (the “Fund”) is a non-diversified series of shares of beneficial interest of Equinox Funds Trust (the “Trust”), a statutory trust organized under the laws of the State of Delaware on August 5, 2010, and is registered under the Investment Company Act of 1940, as amended (the “1940 Act”), as an open-end management investment company. The Fund commenced operations on September 9, 2013. The investment objective of the Fund is to seek to achieve returns and volatility comparable to the S&P 500® Total Return Index, while seeking to avoid the full impact of downside risk.
The Fund currently offers Class A and Class I shares. Class I shares are offered at net asset value. Class A shares are offered at net asset value plus a maximum sales charge of 5.75%. Investors that purchase $1,000,000 or more the Fund’s Class A shares will not pay an initial sales charge on the purchase however, they may be subject to a 1.00% contingent deferred sales charge (“CDSC”) on shares redeemed during the first 12 months after their purchase in the amount of the commissions paid on the shares redeemed. Effective March 23, 2018, the fund ceased offering Class C shares. The Fund converted any remaining Class C Shares into Class A Shares on April 9, 2018. Each class represents an interest in the same assets of the Fund and classes are identical except for differences in their sales charge structures and ongoing service and distribution charges. All classes of shares have equal voting privileges except that each class has exclusive voting rights with respect to its service and/or distribution plans. The Fund’s income, expenses (other than class specific distribution fees) and realized and unrealized gains and losses are allocated proportionately each day based upon the relative net assets of each class.
The Trust’s Board of Trustees has approved an Agreement and Plan of Reorganization (“Plan”) that provides for the reorganization (“Reorganization”) of the Fund into the AXS Alternative Growth Fund (the “Successor Fund”), an existing series of the Investment Managers Series Trust II. If approved by the Fund’s shareholders, the Reorganization is expected to close in the third quarter of 2019, at which time each shareholder’s investment in the Fund will, in effect, be exchanged for an investment with an equal aggregate net asset value in the Successor Fund.
The Reorganizations is generally not expected to result in the recognition of gain or loss by the Fund or its shareholders for federal income tax purposes.
| 2. | SIGNIFICANT ACCOUNTING POLICIES |
The following is a summary of significant accounting policies followed by the Fund in preparation of its consolidated financial statements. The policies are in conformity with accounting principles generally accepted in the United States of America (“GAAP”). The preparation of the consolidated financial statements requires management to make estimates and assumptions that affect the reported amounts of assets and liabilities and disclosure of contingent assets and liabilities at the date of the consolidated financial statements and the reported amounts of income and expenses for the period. Actual results could differ from those estimates. The Fund is an investment company and accordingly follows the investment company accounting and reporting guidance of the Financial Accounting Standards Board
Equinox Ampersand Strategy Fund
NOTES TO CONSOLIDATED FINANCIAL STATEMENTS (Continued)
June 30, 2019
(“FASB”) Accounting Standard Codification Topic 946 “Financial Services – Investment Companies” including FASB Accounting Standard Update ASU 2013-08.
Security Valuation – Securities, including exchange traded funds, listed on an exchange are valued at the last reported sale price at the close of the regular trading session of the exchange on the business day the value is being determined, or in the case of securities listed on NASDAQ at the NASDAQ Official Closing Price (“NOCP”). In the absence of a sale such securities shall be valued at the last bid price on the day of valuation. Debt securities (other than short-term obligations) are valued each day by an independent pricing service approved by the Board of Trustees of Equinox Funds Trust (the “Board”) using methods which include current market quotations from a major market maker in the securities and based on methods which include the consideration of yields or prices of securities of comparable quality, coupon, maturity and type. Short-term debt obligations having 60 days or less remaining until maturity, at time of purchase, may be valued at amortized cost. Investments in open-end investment companies are valued at net asset value. Investments in swap contracts are reported at fair value based on daily price reporting from the swap counterparty. Futures are valued at the final settled price or, in the absence of a settled price, at the last sale price on the day of valuation.
The Fund may hold securities, such as private investments, interests in commodity pools, other non-traded securities or temporarily illiquid securities, for which market quotations are not readily available or are determined to be unreliable. These securities will be valued using the “fair value” procedures approved by the Board. The Board has delegated execution of these procedures to a fair value team composed of one or more representatives from each of the (i) Trust, (ii) administrator, and (iii) Adviser. The team may also enlist third party consultants such as a valuation specialist at a public accounting firm, valuation consultant, or financial officer of a security issuer on an as-needed basis to assist in determining a security-specific fair value. The Board reviews and ratifies the execution of this process and the resultant fair value prices at least quarterly to assure the process produces reliable results.
Fair Valuation Process –As noted above, the fair value team is composed of one or more representatives from each of the (i) Trust, (ii) administrator, and (iii) Adviser. The applicable investments are valued collectively via inputs from each of these groups. For example, fair value determinations are required for the following securities: (i) securities for which market quotations are insufficient or not readily available on a particular business day (including securities for which there is a short and temporary lapse in the provision of a price by the regular pricing source), (ii) securities for which, in the judgment of the Adviser, the prices or values available do not represent the fair value of the instrument. Factors which may cause the Adviser to make such a judgment include, but are not limited to, the following: only a bid price or an asked price is available; the spread between bid and asked prices is substantial; the frequency of sales; the thinness of the market; the size of reported trades; and actions of the securities markets, such as the suspension or limitation of trading; (iii) securities determined to be illiquid; and (iv) securities with respect to which an event that will affect the value thereof has occurred (a “significant event”) since the closing prices were established on the principal exchange on which they are traded, but prior to a Fund’s calculation of its net asset value. Specifically, interests in commodity pools or managed futures pools are valued on a daily basis by reference to the closing market prices of each futures contract or other asset held by a pool, as adjusted for pool expenses. Restricted or illiquid securities, such as private investments or non-traded
Equinox Ampersand Strategy Fund
NOTES TO CONSOLIDATED FINANCIAL STATEMENTS (Continued)
June 30, 2019
securities are valued via inputs from the Adviser based upon the current bid for the security from two or more independent dealers or other parties reasonably familiar with the facts and circumstances of the security (who should take into consideration all relevant factors as may be appropriate under the circumstances). If the Adviser is unable to obtain a current bid from such independent dealers or other independent parties, the fair value team shall determine the fair value of such security using the following factors: (i) the type of security; (ii) the cost at date of purchase; (iii) the size and nature of the Fund’s holdings; (iv) the discount from market value of unrestricted securities of the same class at the time of purchase and subsequent thereto; (v) information as to any transactions or offers with respect to the security; (vi) the nature and duration of restrictions on disposition of the security and the existence of any registration rights; (vii) how the yield of the security compares to similar securities of companies of similar or equal creditworthiness; (viii) the level of recent trades of similar or comparable securities; (ix) the liquidity characteristics of the security; (x) current market conditions; and (xi) the market value of any securities into which the security is convertible or exchangeable.
The Fund utilizes various methods to measure the fair value of all of its investments on a recurring basis. GAAP establishes a hierarchy that prioritizes inputs to valuation methods. The three levels of input are:
Level 1 – Unadjusted quoted prices in active markets for identical assets and liabilities that the Fund has the ability to access.
Level 2 – Observable inputs other than quoted prices included in Level 1 that are observable for the asset or liability, either directly or indirectly. These inputs may include quoted prices for the identical instrument in an inactive market, prices for similar instruments, interest rates, prepayment speeds, credit risk, yield curves, default rates and similar data.
Level 3 – Unobservable inputs for the asset or liability, to the extent relevant observable inputs are not available, representing the Fund’s own assumptions about the assumptions a market participant would use in valuing the asset or liability, and would be based on the best information available.
The availability of observable inputs can vary from security to security and is affected by a wide variety of factors, including, for example, the type of security, whether the security is new and not yet established in the marketplace, the liquidity of markets, and other characteristics particular to the security. To the extent that valuation is based on models or inputs that are less observable or unobservable in the market, the determination of fair value requires more judgment. Accordingly, the degree of judgment exercised in determining fair value is greatest for instruments categorized in Level 3.
The inputs used to measure fair value may fall into different levels of the fair value hierarchy. In such cases, for disclosure purposes, the level in the fair value hierarchy within which the fair value measurement falls in its entirety, is determined based on the lowest level input that is significant to the fair value measurement in its entirety.
Equinox Ampersand Strategy Fund
NOTES TO CONSOLIDATED FINANCIAL STATEMENTS (Continued)
June 30, 2019
The inputs or methodology used for valuing securities are not necessarily an indication of the risk associated with investing in those securities. The following tables summarize the inputs used as of June 30, 2019 for the Fund’s assets and liabilities measured at fair value:
| Assets | | Level 1 | | | Level 2 | | | Level 3 | | | Total | |
| Exchange Traded Funds | | $ | 144,120 | | | $ | — | | | $ | — | | | $ | 144,120 | |
| U.S. Treasury Notes | | | — | | | | 5,124,626 | | | | — | | | | 5,124,626 | |
| Short-Term Investment | | | 1,076,245 | | | | — | | | | — | | | | 1,076,245 | |
| Swap Contract * | | | — | | | | 409,227 | | | | — | | | | 409,227 | |
| Futures Contracts * | | | 70,875 | | | | — | | | | — | | | | 70,875 | |
| Total | | $ | 1,291,240 | | | $ | 5,533,853 | | | $ | — | | | $ | 6,825,093 | |
| * | Represents net unrealized appreciation on swap contracts and futures contracts. |
The Fund did not hold any Level 3 securities during the period.
See Consolidated Portfolio of Investments for more information related to the Fund’s investments.
Consolidation of Subsidiary –The Consolidated Financial Statements of the Fund include the accounts of its subsidiary, Equinox Equity Hedge Fund Limited (“EHS-CFC”), a wholly-owned and controlled foreign corporation (“CFC”). All inter-company accounts and transactions have been eliminated in consolidation.
The Fund may invest approximately 25% of its total assets in a CFC which acts as an investment vehicle in order to effect certain investments consistent with the Fund’s investment objectives and policies.
EHS-CFC utilizes a total return swap with Deutsche Bank AG, London Branch, that provides exposure to the total returns of the managed futures program of Equinox Ampersand Fund Basket (the “Program”) to facilitate the Fund’s pursuit of its investment objective. In accordance with its investment objective and through its exposure to the Program, the Fund may have increased or decreased exposure to one or more of the risk factors including, with respect to the Program, swap agreements, defined in the Principal Investment Risks section of the Fund’s prospectus.
A summary of the Fund’s investments in the EHS-CFC is as follows:
| | | | | | | | % Of the Fund’s | |
| | | Inception Date of | | EHS-CFC Net Assets at | | | Total Net Assets at | |
| | | EHS-CFC | | June 30, 2019 | | | June 30, 2019 | |
| EHS-CFC | | 6/27/2018 | | $ | 1,497,818 | | | | 22.46 | % |
Equinox Ampersand Strategy Fund
NOTES TO CONSOLIDATED FINANCIAL STATEMENTS (Continued)
June 30, 2019
For tax purposes, EHS-CFC is an exempted Cayman investment company. EHS-CFC has received an undertaking from the Government of the Cayman Islands exempting it from all local income, profits and capital gains taxes. No such taxes are levied in the Cayman Islands at the present time. For U.S. income tax purposes, EHS-CFC is a CFC and as such is not subject to U.S. income tax. However, as a wholly-owned CFC, EHS-CFC’s net income and capital gains, to the extent of its earnings and profits, will be included each year in the Fund’s investment company taxable income.
Market Risk – Market risk is the risk that changes in interest rates, foreign exchange rates or equity prices will affect the positions held by the Fund. The Fund is exposed to market risk on financial instruments that are valued at market prices as disclosed in the schedule of investments. The prices of derivative instruments, including options, forwards and futures prices, can be highly volatile. Price movements of derivative contracts in which the Fund’s assets may be invested are influenced by, among other things, interest rates, changing supply and demand relationships, trade, fiscal, monetary and exchange control programs and policies of governments, and national and international political and economic events and policies. The Fund is exposed to market risk on derivative contracts in that the Fund may not be able to readily dispose of its holdings when it chooses and also that the price obtained on disposal is below that at which the investment is included in Fund’s consolidated financial statements. All financial instruments are recognized at fair value, and all changes in market conditions directly affect net income. The Fund’s investments in derivative instruments are exposed to market risk and are disclosed in the consolidated portfolio of investments.
Credit Risk – Credit risk relates to the ability of the issuer to meet interest and principal payments, or both, as they come due. In general, lower-grade, higher-yield bonds are subject to credit risk to a greater extent than lower-yield, higher-quality bonds.
Counterparty Risk – Counterparty risk, including swap counterparty risk, is the risk that the counterparty to a financial instrument will cause a financial loss for the Fund by failing to discharge an obligation. A concentration of counterparty risk exists in that part of the Fund’s cash is held at the broker. The Fund could be unable to recover assets held at the broker, including assets directly traceable to the Fund, in the event of the broker’s bankruptcy. The Fund does not anticipate any material losses as a result of this concentration.
Security Transactions and Related Income – Security transactions are accounted for on trade date basis. Interest income is recognized on an accrual basis. Discounts are accreted and premiums are amortized on securities purchased over the lives of the respective securities. Dividend income is recorded on the ex-dividend date. Realized gains or losses from sales of securities are determined by comparing the identified cost of the security lot sold with the net sales proceeds.
Dividends and Distributions to Shareholders –Dividends from net investment income, if any, are declared and paid at least annually. Distributable net realized capital gains, if any, are declared and distributed annually. Dividends from net investment income and distributions from net realized gains are determined in accordance with federal income tax regulations, which may differ from GAAP. These “book/tax” differences are considered either temporary (i.e., deferred losses, capital loss carry forwards) or permanent in nature. To the extent these differences are permanent in nature, such amounts are reclassified within the composition of net assets based on their federal tax-basis
Equinox Ampersand Strategy Fund
NOTES TO CONSOLIDATED FINANCIAL STATEMENTS (Continued)
June 30, 2019
treatment; temporary differences do not require reclassification. Dividends and distributions to shareholders are recorded on ex-dividend date.
Federal Income Tax – The Fund intends to continue to comply with the requirements of the Internal Revenue Code applicable to regulated investment companies and to distribute all of its taxable income to its shareholders. Therefore, no provision for Federal income tax is required. The Fund recognizes the tax benefits of uncertain tax positions only where the position is “more likely than not” to be sustained assuming examination by tax authorities. Management has analyzed the Fund’s tax positions and has concluded that no liability for unrecognized tax benefits should be recorded related to uncertain tax positions taken on returns filed for open tax years (June 30, 2016-2018) or expected to be taken in the Fund’s June 30, 2019 tax returns. The Fund identifies its major tax jurisdictions as U.S. Federal and Colorado where the Fund makes significant investments; however the Fund is not aware of any tax positions for which it is reasonably possible that the total amounts of unrecognized tax benefits will change materially in the next twelve months.
Allocation of Expenses –Expenses incurred by the Trust that do not relate to a specific fund of the Trust are allocated to the individual funds based on each fund’s relative net assets or another appropriate basis. Expenses specifically attributable to a particular fund in the Trust are borne by that fund. Other expenses are allocated to each fund based on its net assets in relation to the total net assets of all the applicable funds in the Trust or another reasonable basis.
Exchange Traded Funds – The Fund may invest in exchange traded funds (“ETFs”). ETFs are a type of index fund bought and sold on a securities exchange. An ETF trades like common stock and represents a fixed portfolio of securities designed to track the performance and dividend yield of a particular domestic or foreign market index. The Fund may purchase an ETF to temporarily gain exposure to a portion of the U.S. or a foreign market while awaiting purchase of underlying securities. The risks of owning an ETF generally reflect the risks of owning the underlying securities they are designed to track, although the lack of liquidity on an ETF could result in it being more volatile. Additionally, ETFs have fees and expenses that reduce their value.
Futures Contracts – The Fund is subject to equity price risk in the normal course of pursuing its investment objectives. The Fund purchases and sells futures contracts to pursue its investment objective, to hedge against market risk, and to reduce return volatility. Initial margin deposits required upon entering into futures contracts are satisfied by the segregation of specific securities or cash as collateral for the account of the broker (the Portfolio’s agent in acquiring the futures position). During the period the futures contracts are open, changes in the value of the contracts are recognized as unrealized gains or losses by “marking to market” on a daily basis to reflect the market value of the contracts at the end of each day’s trading. Variation margin payments are received or made depending upon whether unrealized gains or losses are incurred. When the contracts are closed, the Fund recognizes a realized gain or loss equal to the difference between the proceeds from, or cost of, the closing transaction and the Fund’s basis in the contract. If a Fund were unable to liquidate a futures contract and/or enter into an offsetting closing transaction, the Fund would continue to be subject to market risk with respect to the value of the contracts and continue to be required to maintain the margin deposits on the futures contracts. The Fund segregates liquid securities having a value at least
Equinox Ampersand Strategy Fund
NOTES TO CONSOLIDATED FINANCIAL STATEMENTS (Continued)
June 30, 2019
equal to the amount of the current obligation under any open futures contract. Risks may exceed amounts recognized in the Consolidated Statement of Assets and Liabilities. With futures, there is minimal counterparty credit risk to a Fund since futures are exchange traded and the exchange’s clearinghouse, as counterparty to all exchange traded futures, guarantees the futures against default. For the year ended June 30, 2019, the Fund had a net change in unrealized appreciation of $312,955 from futures contracts. For the year ended June 30, 2019, the Fund had net realized gains of $44,709 from futures contracts subject to equity price risk.
Swap Contracts –The Fund is subject to equity price risk, interest rate risk and/or commodity risk in the normal course of pursuing its investment objective. The Fund enters into various swap transactions for investment purposes and to manage interest rate, equity, foreign exchange (currency), or credit risk. These two-party contracts are entered into primarily to exchange the returns (or differentials in rates of returns) earned or realized on particular pre-determined investments or instruments.
The gross returns exchanged or “swapped” between parties are calculated with respect to a notional amount, i.e., the return on or increase in value of a particular dollar amount invested at a particular interest rate, in a particular foreign currency, or in a “basket” of securities representing a particular index or market segment. Changes in the value of swap agreements are recognized as net change in unrealized appreciation or depreciation in the Consolidated Statement of Operations by “marking to market” on a daily basis to reflect the value of the swap agreement at the end of each trading day. A liquidation payment received or made at the termination of the swap agreement is recorded as a realized gain or loss on the Consolidated Statement of Operations. Realized gains and losses from a decrease in the notional value swap are recognized on trade date. Swap agreements may also involve fees, commissions and other costs that may reduce the value of the swap agreement. These costs are not reflected in the Consolidated Statement of Operations, are deducted from the return of any such derivative instrument and, therefore, represent an indirect cost of investment in the Fund.
The Fund maintains cash and/or investments in U.S. Treasury securities or money market funds, up to 20% of the notional value of the swap, as collateral to secure its obligations under the swap. The cash maintained as collateral is recorded as swap margin balance on the Consolidated Statement of Assets and Liabilities. As of June 30, 2019, the notional value of the swap was $11,747,107. Entering into these agreements involves, to varying degrees, lack of liquidity and elements of credit, market, and counterparty risk in excess of amounts recognized on the Consolidated Statement of Assets and Liabilities. The Fund’s maximum risk of loss from counterparty credit risk is the discounted net value of the cash flows to be received from the counterparty over the contract’s remaining life, to the extent that that amount is positive. In order to maintain prudent risk exposure to the counterparty, the Adviser will reduce exposure to the counterparty whenever the unrealized appreciation on the swap exceeds 5% of the net assets of the Fund for a period of one week or such lesser time as the Adviser may determine. If the Adviser determines that the counterparty presents an imprudent risk, the swap may be terminated in its entirety. As of June 30, 2019, the net change in unrealized appreciation on the swap contracts was $818,798. For the year ended June 30, 2019, the Fund had net realized losses of $723,694 from the swap contracts.
Please refer to the Fund’s prospectus for a full listing of risks associated with these investments.
Equinox Ampersand Strategy Fund
NOTES TO CONSOLIDATED FINANCIAL STATEMENTS (Continued)
June 30, 2019
Impact of Derivatives on the Consolidated Statement of Assets and Liabilities and Consolidated Statement of Operations
The following is a summary of the location of derivative investments on the Fund’s Consolidated Statement of Assets and Liabilities as of June 30, 2019:
| Location on the Consolidated Statement of Assets and Liabilities |
| Derivatives Investment Type | Asset Derivatives |
| | |
| Equity/Currency/ Interest Rate Contracts | Unrealized appreciation on swap contract and futures contracts |
Fair Values of derivative instruments as of June 30, 2019:
| | | Asset Derivatives | |
| Contract Type/ | | | | | |
| Primary Risk Exposure | | Balance Sheet Location | | Fair Value | |
| Mixed; interest rate, equity and foreign exchange contracts: | | Net unrealized appreciation on swap contract | | $ | 409,227 | * |
| | | | | | | |
| Equity contracts: | | Unrealized appreciation on futures contracts | | | 70,875 | * |
| | | | | $ | 480,102 | |
| * | Includes cumulative appreciation/depreciation of futures and swap contracts as reported in the Consolidated Portfolio of Investments. |
The effect of derivative instruments on the Consolidated Statement of Operations for the year ended June 30, 2019:
| | | Realized | | | Change in Unrealized | |
| Location of Gain or (Loss) On | | Gain/(Loss) on | | | Appreciation | |
| Derivatives | | Derivatives | | | on Derivatives | |
| Net realized gain on futures contracts | | $ | 44,709 | | | | | |
| Net change in unrealized appreciation on futures contracts | | | | | | $ | 312,955 | |
| Net realized loss on swap contract | | | (723,694 | ) | | | | |
| Net change in unrealized appreciation on swap contract | | | | | | | 818,798 | |
| | | $ | (678,985 | ) | | $ | 1,131,753 | |
The notional value of the derivative instruments outstanding as of June 30, 2019 as disclosed in the Consolidated Portfolio of Investments and the amounts of realized and changes in unrealized gains and losses on derivative instruments during the period as disclosed above and within the Consolidated Statement of Operations serve as indicators of the volume of derivative activity for the Fund.
Equinox Ampersand Strategy Fund
NOTES TO CONSOLIDATED FINANCIAL STATEMENTS (Continued)
June 30, 2019
Offsetting of Financial Assets and Derivative Assets
It is the Fund’s policy to recognize a net asset or liability equal to the unrealized appreciation/(depreciation) of futures and swap contracts. As of June 30, 2019, the Fund is subject to a master netting arrangement for the swaps and futures. The following table shows additional information regarding the offsetting of assets and liabilities at June 30, 2019.
| | | | | | | | | | | | Gross Amounts Not Offset in the | | | | |
| | | | | | | | | | | | Consolidated Statement of Assets & | | | | |
| Assets: | | | | | | | | | | | Liabilities | | | | |
| | | | | | | | | | | | | | | | | | | |
| | | | | | Gross Amounts | | | | | | | | | | | | | |
| | | | | | Offset in the | | | Net Amounts of Assets | | | | | | | | | | |
| | | Gross Amounts | | | Consolidated | | | Presented in the | | | | | | | | | | |
| | | of Recognized | | | Statement of Assets | | | Consolidated Statement | | | Financial | | | Cash Collateral | | | | |
| Description | | Assets | | | & Liabilities | | | of Assets & Liabilities | | | Instruments | | | Pledged | | | Net Amount | |
| | | | | | | | | | | | | | | | | | | | | | | | | |
| Unrealized Appreciation on Swap Contract | | $ | 409,227 | (1) | | $ | — | | | $ | 409,227 | | | $ | — | (3) | | $ | — | (2) | | $ | 409,227 | |
| Unrealized Appreciation on Futures Contracts | | $ | 70,875 | (1) | | $ | — | | | $ | 70,875 | | | $ | — | | | $ | — | (2) | | $ | 70,875 | |
| Total | | $ | 480,102 | | | $ | — | | | $ | 480,102 | | | $ | — | | | $ | — | | | $ | 480,102 | |
| (1) | Gross unrealized appreciation as presented in the Portfolio of Investments. |
| (2) | The table above does not include additional cash collateral pledged to the counterparty. Additional cash pledged as collateral as of June 30, 2019 was $68,706 for the swap contract and $30,348 for the futures contract. |
| (3) | The table above does not include financial instruments pledged to the counterparty. As of June 30, 2019, $1,397,448 of treasury notes are pledged as collateral for the swap agreement as denoted on the consolidated portfolio of investments. |
Indemnification – The Trust indemnifies its officers and trustees for certain liabilities that may arise from the performance of their duties to the Trust. Additionally, in the normal course of business, the Fund enters into contracts that contain a variety of representations and warranties and which provide general indemnities. The Fund’s maximum exposure under these arrangements is unknown, as this would involve future claims that may be made against the Fund that have not yet occurred. However, based on experience, the risk of loss due to these warranties and indemnities appears to be remote.
| 3. | INVESTMENT TRANSACTIONS |
For the year ended June 30, 2019, cost of purchases and proceeds from sales of portfolio securities, other than short-term investments and short-term U.S. Government securities, amounted to $5,228,326 and $4,864,504, respectively.
| 4. | INVESTMENT ADVISORY AGREEMENT AND TRANSACTIONS WITH RELATED PARTIES |
Equinox Institutional Asset Management, LP serves as the Fund’s Investment Adviser (the “Adviser”).
Pursuant to an Advisory Agreement with the Fund, the Adviser, under the oversight of the Board, directs the daily operations of the Fund and supervises the performance of administrative and
Equinox Ampersand Strategy Fund
NOTES TO CONSOLIDATED FINANCIAL STATEMENTS (Continued)
June 30, 2019
professional services provided by others. Effective July 2, 2018, as compensation for its services and the related expenses borne by the Adviser, the Fund paid the Adviser a management fee, computed and accrued daily and paid monthly, at an annual rate of 0.75% of the Fund’s average daily net assets. Prior to July 2, 2018, the Fund paid the Adviser a management fee, computed and accrued daily and paid monthly at an annual rate of 0.95%. For the year ended June 30, 2019, the Fund incurred Advisory fees of $65,533.
Under the terms of the expense limitation agreement, effective July 2, 2018, the Adviser has contractually agreed to reduce its Advisory fee and/or reimburse certain expenses of the Fund, to ensure that the Fund’s total annual operating expenses, excluding (i) taxes, (ii) interest, (iii) extraordinary items, (iv) “Acquired Fund Fees and Expenses,” and (v) brokerage commissions, do not exceed, on an annual basis, 1.24% and 0.99% of the Fund’s average daily net assets for Class A and Class I shares, respectively. This expense limitation will remain in effect until October 31, 2019 but can be terminated by the Fund’s Board of Trustees on 60 days’ written notice to the Adviser. Prior to July 2, 2018, the expense limitation was 1.45% and 1.20% for Class A and Class I shares, respectively.
For the year ended June 30, 2019, the Adviser waived fees and reimbursed expenses in the amount of $231,363.
If the Adviser waives any fee or reimburses any expense pursuant to the Waiver Agreement, and the Fund’s operating expenses are subsequently less than 1.24% and 0.99% of average daily net assets attributable to Class A and Class I shares, respectively, the Adviser shall be entitled to recoupment by the Fund for such waived fees or reimbursed expenses provided that such recoupment does not cause the Fund’s expenses to exceed 1.24% and 0.99% of average daily net assets for each share class. If Fund operating expenses attributable to Class A and Class I shares subsequently exceed 1.45% and 1.20% respectively per annum of the average daily net assets, the recoupment by the Adviser shall be suspended.
The following is subject to recapture by the Adviser:
| $189,512 | June 30, 2020 |
| $211,146 | June 30, 2021 |
| $231,363 | June 30, 2022 |
The Adviser may seek reimbursement only for fees waived or expenses reimbursed or paid by it during the three years from date on which the Adviser reduced its compensation and/or assumed expenses for the Fund; provided, however, that such expenses may only be reimbursed to the extent they were waived or paid after the date of the Waiver Agreement (or any similar agreement). The Board may terminate this expense reimbursement arrangement at any time.
For the period shown and for each successive annual period thereafter (each, a “Performance Period”), the Adviser’s Management Fee is subject to a performance-based voluntary waiver (the “Performance-Based Waiver”). Under the terms of the Performance-Based Waiver, the investment performance of the Institutional Class shares of the Fund (the “Measuring Class”) is measured against the S&P 500® Total Return Index (the “Benchmark”) over each Performance Period. In the event that the Fund
Equinox Ampersand Strategy Fund
NOTES TO CONSOLIDATED FINANCIAL STATEMENTS (Continued)
June 30, 2019
underperforms the Benchmark over any Performance Period, the Adviser voluntarily waives the Management Fee, excluding any portion of the Management Fee that the Adviser would otherwise be required to waive in order to satisfy its obligation under the Expense Limitation, for the next 12-month period following the Performance Period the Fund underperformed. For example, if the Adviser were required to waive its entire Management Fee under the terms of the contractual Expense Limitation, it would not have an additional obligation to make further waivers as a result of the Performance-Based Waiver. The Adviser reserves the right to terminate the voluntary Performance-Based Waiver upon notice to the Fund’s Board of Trustees. As a result, there is no guarantee that shareholders will benefit from the Performance-Based Waiver for any full or partial Performance Period. The Adviser will not seek recoupment of any fees waived as a result of the Performance-Based Waiver.
On June 30, 2019, $146,756 of previously waived fees/reimbursed expenses expired without recoupment by the Adviser.
The Trust, with respect to the Fund, has adopted the Trust’s Distribution and Shareholder Servicing Plan for Class A shares (the “Plan”). The Plan provides that a monthly service and/or distribution fee is calculated by the Fund at an annual rate of 0.25% of its average daily net assets for Class A shares which is paid to Northern Lights Distributors, LLC (the “Distributor”), an affiliate of Gemini Fund Services, LLC, to provide compensation for ongoing shareholder servicing and distribution-related activities or services and/or maintenance of the Fund’s shareholder accounts not otherwise required to be provided by the Adviser. For the year ended June 30, 2019, Class A shares were charged $6,022 in distribution fees.
The Distributor acts as the Fund’s principal underwriter in a continuous public offering of the Fund’s Class A shares. For the year ended June 30, 2019, the Distributor received $2,950 in underwriting commissions for sales of Class A shares, of which $450 was retained by the principal underwriter.
In addition, certain affiliates of the Distributor provide services to the Fund as follows:
Gemini Fund Services, LLC (“GFS”), an affiliate of the Distributor, provides administration, fund accounting, and transfer agent services to the Trust. Pursuant to separate servicing agreements with GFS, the Fund pays GFS customary fees for providing administration, fund accounting and transfer agency services to the Fund.
Blu Giant, LLC (“Blu Giant”), an affiliate of GFS and the Distributor, provides EDGAR conversion and filing services as well as print management services for the Fund on an ad-hoc basis. For the provision of these services, Blu Giant receives customary fees from the Fund.
On February 1, 2019, NorthStar Financial Services Group, LLC, the parent company of GFS and its affiliated companies including the Distributor, and Blu Giant, sold its interest in the Gemini Companies to a third party private equity firm that contemporaneously acquired Ultimus Fund Solutions, LLC (an independent mutual fund administration firm) and its affiliates (collectively, the “Ultimus Companies”). As a result of these separate transactions, the Gemini Companies and the Ultimus Companies are now
Equinox Ampersand Strategy Fund
NOTES TO CONSOLIDATED FINANCIAL STATEMENTS (Continued)
June 30, 2019
indirectly owned through a common parent entity, The Ultimus Group, LLC.
The Fund may assess a short-term redemption fee of 1.00% of the total redemption amount if a shareholder sells their shares after holding them for less than 30 days. The redemption fee is paid directly to the Fund. For the year ended June 30, 2019, the Fund received $263 and $1,218 for Class A and Class I, respectively.
| 6. | AGGREGATE UNREALIZED APPRECIATION AND DEPRECIATION – TAX BASIS |
| | | | | | | | | | Net Unrealized | |
| | | | Gross Unrealized | | | Gross Unrealized | | | Appreciation/ | |
| Tax Cost | | | Appreciation | | | Depreciation | | | (Depreciation) | |
| $ | 6,802,371 | | | $ | 24,298 | | | $ | (1,576 | ) | | $ | 22,722 | |
| 7. | DISTRIBUTIONS TO SHAREHOLDERS AND TAX COMPONENTS OF CAPITAL |
The tax character of distributions paid for the years ended June 30, 2019 and June 30, 2018 was as follows:
| | | Fiscal Year Ended | | | Fiscal Year Ended | |
| | | June 30, 2019 | | | June 30, 2018 | |
| Ordinary Income | | $ | 30,437 | | | $ | 86,772 | |
| Long-Term Capital Gain | | | 366,567 | | | | 781,969 | |
| | | $ | 397,004 | | | $ | 868,741 | |
As of June 30, 2019, the components of accumulated earnings/(deficit) on a tax basis were as follows:
| Undistributed | | | Undistributed | | | Post October Loss | | | Capital Loss | | | Other | | | Unrealized | | | Total | |
| Ordinary | | | Long-Term | | | and | | | Carry | | | Book/Tax | | | Appreciation/ | | | Accumulated | |
| Income | | | Gains | | | Late Year Loss | | | Forwards | | | Differences | | | (Depreciation) | | | Earnings/(Deficits) | |
| $ | 449,196 | | | $ | 16,683 | | | $ | — | | | $ | — | | | $ | — | | | $ | 22,722 | | | $ | 488,601 | |
The difference between book basis and tax basis undistributed net investment income, accumulated net realized gain/(loss), and unrealized appreciation from investments is primarily attributable to the tax deferral of losses on wash sales, mark-to-market on open futures contracts and tax adjustments relating to the Fund’s holding in Equinox Equity Hedge Fund Limited.
Equinox Ampersand Strategy Fund
NOTES TO CONSOLIDATED FINANCIAL STATEMENTS (Continued)
June 30, 2019
| 8. | RECENT ACCOUNTING PRONOUNCEMENT |
In August 2018, the Securities and Exchange Commission adopted amendments to certain disclosure requirements under Regulation S-X to conform to US GAAP, including: (i) an amendment to require presentation of the total, rather than the components, of distributable earnings on the Statement of Assets and Liabilities; and (ii) an amendment to require presentation of the total, rather than the components, of distributions to shareholders, except for tax return of capital distributions, if any, on the Statement of Changes in Net Assets. The amendments also removed the requirement for parenthetical disclosure of undistributed net investment income on the Statement of Changes in Net Assets. These amendments have been adopted effective with these financial statements.
In August 2018, the FASB issued Accounting Standards Update (“ASU”) No. 2018-13, which changes certain fair value measurement disclosure requirements. The new ASU, in addition to other modifications and additions, removes the requirement to disclose the amount and reasons for transfers between Level 1 and Level 2 of the fair value hierarchy, and the policy for the timing of transfers between levels. For investment companies, the amendments are effective for financial statements issued for fiscal years beginning after December 15, 2019, and interim periods within those fiscal years. Early adoption is allowed and the Fund has adopted this amendment early.
Subsequent events after the date of the Consolidated Statement of Assets and Liabilities have been evaluated through the date the financial statements were issued. Management has determined that no events or transactions occurred requiring adjustment or disclosure in the consolidated financial statements, other than the following:
On July 1, 2019, the Board of Trustees of the Trust approved a Plan of Reorganization (the “Plan”) for the Fund. The Plan is contingent upon the approval of the Fund’s shareholders. Under the terms of the Plan, if approved by the shareholders, the Fund will be reorganized into a corresponding newly created series of Investment Managers Series Trust II, a Delaware statutory trust.
Report of Independent Registered Public Accounting Firm
To the Board of Trustees of Equinox Funds Trust
and the Class A and Class I Shareholders of Equinox Ampersand Strategy Fund
Opinion on the Financial Statements
We have audited the accompanying consolidated statement of assets and liabilities, including the consolidated portfolio of investments, of Equinox Ampersand Strategy Fund (the Fund) as of June 30, 2019, the related consolidated statements of operations for the year then ended, the statements of changes in net assets for each of the two years in the period then ended, including the related notes, and the consolidated financial highlights for each of the five years in the period then ended (collectively, the financial statements). In our opinion, the financial statements present fairly, in all material respects, the financial position of the Fund as of June 30, 2019, the results of its operations for the year then ended, the changes in its net assets for each of the two years in the period then ended, and the financial highlights for each of the five years in the period then ended, in conformity with accounting principles generally accepted in the United States of America.
Basis for Opinion
These financial statements are the responsibility of the Fund’s management. Our responsibility is to express an opinion on the Fund’s financial statements based on our audits. We are a public accounting firm registered with the Public Company Accounting Oversight Board (United States) (PCAOB) and are required to be independent with respect to the Fund in accordance with U.S. federal securities laws and the applicable rules and regulations of the Securities and Exchange Commission and the PCAOB.
We conducted our audits in accordance with the standards of the PCAOB. Those standards require that we plan and perform the audit to obtain reasonable assurance about whether the financial statements are free of material misstatement, whether due to error or fraud. The Fund is not required to have, nor were we engaged to perform, an audit of its internal control over financial reporting. As part of our audits, we are required to obtain an understanding of internal control over financial reporting but not for the purpose of expressing an opinion on the effectiveness of the Fund’s internal control over financial reporting. Accordingly, we express no such opinion.
Our audits included performing procedures to assess the risks of material misstatement of the financial statements, whether due to error or fraud, and performing procedures that respond to those risks. Such procedures included examining, on a test basis, evidence regarding the amounts and disclosures in the financial statements. Our audits also included evaluating the accounting principles used and significant estimates made by management, as well as evaluating the overall presentation of the financial statements. Our procedures included confirmation of investments owned as of June 30, 2019, by correspondence with the custodians, brokers and swap counterparty. We believe that our audits provide a reasonable basis for our opinion.
/s/ RSM US LLP
We have served as the auditor of one or more Equinox advised funds since 2010.
Denver, Colorado
August 29, 2019
Equinox Ampersand Strategy Fund
EXPENSE EXAMPLES (Unaudited)
June 30, 2019
As a shareholder of the Equinox Ampersand Strategy Fund, you incur two types of costs: (1) transaction costs, including sales charges (loads) on purchases of Class A shares; (2) ongoing costs, including management fees; distribution and/or service (12b-1) fees; and other Fund expenses. This example is intended to help you understand your ongoing costs (in dollars) of investing in the Fund and to compare these costs with the ongoing costs of investing in other mutual funds.
The example is based on an investment of $1,000 invested at the beginning of the period and held for the entire six month period from January 1, 2019 through June 30, 2019.
Actual Expenses
The “Actual” expenses line in the table below provides information about actual account values and actual expenses. You may use the information below, together with the amount you invested, to estimate the expenses that you paid over the period. Simply divide your account value by $1,000 (for example, an $8,600 account value divided by $1,000 = 8.6), then multiply the result by the number in the table under the heading entitled “Expenses Paid During Period” to estimate the expenses you paid on your account during this period.
Hypothetical Example for Comparison Purposes
The “Hypothetical” expenses line in the table below provides information about hypothetical account values and hypothetical expenses based on the Fund’s actual expense ratio and an assumed rate of return of 5% per year before expenses, which is not the Fund’s actual return. The hypothetical account values and expenses may not be used to estimate the actual ending account balances or expenses you paid for the period. You may use this information to compare this 5% hypothetical example with the 5% hypothetical examples that appear in the shareholder reports of other funds.
Please note that the expenses shown in the table are meant to highlight your ongoing costs only and do not reflect any transactional costs, such as sales charges (loads), or redemption fees. Therefore, the table is useful in comparing ongoing costs only, and will not help you determine the relative total costs of owning different funds. In addition, if these transactional costs were included, your costs would have been higher.
| | | | | | | Hypothetical |
| | | | | | | (5% return before |
| | | | Actual | | expenses) |
| | | | | | | | |
| | | | Ending | Expenses | | Ending | Expenses |
| | Fund’s | Beginning | Account | Paid | | Account | Paid |
| Equinox Ampersand | Annualized | Account Value | Value | During | | Value | During |
| Strategy Fund | Expense Ratio | 1-1-19 | 6-30-19 | Period* | | 6-30-19 | Period |
| | | | | | | | |
| Class A | 1.24% | $1,000.00 | $1,273.00 | $6.99 | | $1,018.65 | $6.21 |
| | | | | | | | |
| Class I | 0.99% | $1,000.00 | $1,275.50 | $5.59 | | $1,019.89 | $4.96 |
| * | Expenses are equal to the average account value over the period, multiplied by the Fund’s annualized expense ratio, multiplied by the number of days in the period (181) divided by the number of days in the fiscal year (365). |
Equinox Ampersand Strategy Fund
SUPPLEMENTAL INFORMATION (Unaudited)
June 30, 2019
The following tables present certain information regarding the Board of Trustees and officers of the Trust. Each person listed under “Interested Trustees” below is an “interested person” of the Trust, the Adviser, or Distributor, within the meaning of the 1940 Act. Each person who is not an “interested person” of the Trust, the Adviser or the Distributor within the meaning of the 1940 Act is referred to as an “Independent Trustee” and is listed under such heading below. Unless otherwise noted, the address of each Trustee and Officer is 17645 Wright Street, Suite 200, Omaha, NE 68130.
Independent Trustees
Name and Year of
Birth | Position(s)
Held/Term
of Office* | Principal Occupation
During the Last Five Years | Number of
Portfolios in Fund
Complex**
Overseen by
Trustee | Other Directorships*** held by
Trustee During Last Five Years |
David P. DeMuth
9/1945 | Trustee Since December 2010 | Consultant, CFO Consulting Partners, LLC (since May 2004). | 5 | Executive Committee Member of The Frontier Fund (commodity pool) (from March 2007 to March 2017). |
Kevin R. Green
7/1954 | Trustee Since December 2010 | CEO of TripleTree Holdings, LLC an Investment Bank, Advisory and Principal Investing business (since 1997). | 5 | Director of BlueCross BlueShield of Minnesota (healthcare services). |
Jay Moorin
7/1951 | Trustee Since December 2010 | Managing Partner, ProQuest Management, LLC (since 1998). | 5 | Director, Eagle Pharmaceuticals Inc. (from March 2007 to June 2016); Director, Pegasi Energy Resource Corp. (January 2014 to June 2015); Director, Aires Pharmaceuticals (November 2006 to February 2014); Director, Arno Therapeutics (from January 2016 to December 2017); Director, Corino Therapeutics (since November 2016); Director, Mevion Medical Systems (from January 2012 to June 2018). |
Interested Trustee
Name and Year of
Birth | Position(s)
Held/Term
of Office* | Principal Occupation
During the Past Five Years | Number of
Portfolios in Fund
Complex**
Overseen by
Trustee | Other Directorships*** held by
Trustee During the Last Five
Years |
Robert J. Enck
9/1962 | Chairman, Trustee, President and Principal Executive Officer Since December 2010 | President and Chief Executive Officer, Equinox Institutional Asset Management, LP (since 2015); President and Chief Executive Officer, Equinox Fund Management, LLC (since 2007). | 5 | Executive Committee Member of The Frontier Fund (commodity pool) (from March 2007 to March 2017). |
Equinox Ampersand Strategy Fund
SUPPLEMENTAL INFORMATION (Unaudited)(Continued)
June 30, 2019
Executive Officers
Name and Year of
Birth | Position(s)
Held/Term
of Office* | Principal Occupation
During the Past Five Years | Number of
Portfolios in Fund
Complex**
Overseen by
Trustee | Other Directorships*** held by
Trustee During the Past Five
Years |
Laura Latella
4/1958 | Treasurer, Principal Financial Officer and Secretary Since November 2016 | Chief Financial Officer, Equinox Institutional Asset Management, LP (since May 2016); Consultant, Equinox Institutional Asset Management, LP (January 2016 – April 2016); Treasurer, CFO, Principal, 6800 Capital, LLC (May 1994 – January 2016). Institutional Asset Management, LP (January 2016 – April 2016); Treasurer, CFO, Principal, 6800 Capital, LLC (May 1994 – January 2016). | N/A | N/A |
Laura Szalyga
3/1978 | Assistant Treasurer since August 2014 | Vice President (since 2015) and Assistant Vice President (2011 to 2015) of Fund Administration, Gemini Fund Services, LLC | N/A | N/A |
| Doug Tyre | Chief Compliance Officer and Anti- Money Laundering Officer Since October 13, 2017 | Assistant Compliance Director of Cipperman Compliance Services LLC (since 2014); Client Services & Operations Specialist-Senior Associate of Echo Point Investment Management LLC (2010 – 2014). | N/A | N/A |
| * | Each Trustee and Officer shall serve until death, resignation or removal. |
| ** | The term “Fund Complex” refers to the Equinox Funds Trust. |
| *** | Directorships are held in a company with a class of securities registered pursuant to section 12 of the Securities Exchange Act or subject to the requirements of section 15(d) of the Securities Exchange Act or a company registered as an investment company under the 1940 Act. |
PRIVACY NOTICE
Rev. August 2011
| FACTS | WHAT DOES EQUINOX FUNDS TRUST DO WITH YOUR PERSONAL INFORMATION? |
| | |
| Why? | Financial companies choose how they share your personal information. Federal law gives consumers the right to limit some but not all sharing. Federal law also requires us to tell you how we collect, share, and protect your personal information. Please read this notice carefully to understand what we do. |
| | |
| What? | The types of personal information we collect and share depend on the product or service you have with us. This information can include: |
| | ■ Social Security number ■ Assets ■ Retirement Assets ■ Transaction History ■ Checking Account Information | ■ Purchase History ■ Account Balances ■ Account Transactions ■ Wire Transfer Instructions |
| | |
| | When you areno longer our customer, we continue to share your information as described in this notice. |
| | |
| How? | All financial companies need to share customers’ personal information to run their everyday business. In the section below, we list the reasons financial companies can share their customers’ personal information; the reasons Equinox Funds Trust chooses to share; and whether you can limit this sharing. |
| Reasons we can share your personal information | Does Equinox
Funds Trust
share? | Can you limit this sharing? |
For our everyday business purposes – such as to process your transactions, maintain your account(s), respond to court orders and legal investigations, or report to credit bureaus | Yes | No |
For our marketing purposes – to offer our products and services to you | No | We don’t share |
| For joint marketing with other financial companies | No | We don’t share |
For our affiliates’ everyday business purposes – information about your transactions and experiences | No | We don’t share |
For our affiliates’ everyday business purposes – information about your creditworthiness | No | We don’t share |
| For nonaffiliates to market to you | No | We don’t share |
| Questions? | Call 1-888-643-3431 |
Rev. August 2011
| Who we are |
| Who is providing this notice? | Equinox Funds Trust |
| What we do |
| How does Equinox Funds Trust protect my personal information? | To protect your personal information from unauthorized access and use, we use security measures that comply with federal law. These measures include computer safeguards and secured files and buildings. Our service providers are held accountable for adhering to strict policies and procedures to prevent any misuse of your nonpublic personal information. |
| How does Equinox Funds Trust collect my personal information? | We collect your personal information, for example, when you ■ Open an account ■ Provide account information ■ Give us your contact information ■ Make deposits or withdrawals from your account ■ Make a wire transfer ■ Tell us where to send the money ■ Tells us who receives the money ■ Show your government-issued ID ■ Show your driver’s license We also collect your personal information from other companies. |
| Why can’t I limit all sharing? | Federal law gives you the right to limit only ■ Sharing for affiliates’ everyday business purposes – information about your creditworthiness ■ Affiliates from using your information to market to you ■ Sharing for nonaffiliates to market to you State laws and individual companies may give you additional rights to limit sharing. |
| Definitions |
| Affiliates | Companies related by common ownership or control. They can be financial and nonfinancial companies. ■ Equinox Funds Trust does not share with our affiliates. |
| Nonaffiliates | Companies not related by common ownership or control. They can be financial and nonfinancial companies ■ Equinox Funds Trust does not share with nonaffiliates so they can market to you. |
| Joint marketing | A formal agreement between nonaffiliated financial companies that together market financial products or services to you. ■ Equinox Funds Trust doesn’t jointly market. |
PROXY VOTING POLICY
Information regarding how the Fund voted proxies relating to portfolio securities for the most recent period ended June 30 as well as a description of the policies and procedures that the Fund uses to determine how to vote proxies is available without charge, upon request, by calling 1-888-643-3431 or by referring to the Securities and Exchange Commission’s (“SEC”) website at http://www.sec.gov.
PORTFOLIO HOLDINGS
The Fund files its complete schedule of portfolio holdings with the SEC for the first and third quarters of each fiscal year on Form N-PORT (beginning with filings after March 31, 2019). Form N-Q or Part F of Form N-PORT is available on the SEC’s website at http://www.sec.gov and may be reviewed and copied at the SEC’s Public Reference Room in Washington, DC (1-800-SEC-0330). The information on Form N-Q or Part F of Form N-Port is available without charge, upon request, by calling 1-888-643-3431.
| |
| |
| INVESTMENT ADVISER |
| Equinox Institutional Asset Management, LP |
| 47 Hulfish Street, Suite 510 |
| Princeton, NJ 08542 |
| |
| ADMINISTRATOR |
| Gemini Fund Services, LLC |
| 17645 Wright St., Ste 200 |
| Omaha, NE 68130 |
| Item 2. Code of Ethics. | (a) As of the end of the period covered by this report, the registrant has adopted a code of ethics that applies to the registrant's principal executive officer, principal financial officer, principal accounting officer or controller, or persons performing similar functions, regardless of whether these individuals are employed by the registrant or a third party. |
(b) For purposes of this item, “code of ethics” means written standards that are reasonably designed to deter wrongdoing and to promote:
| (1) | Honest and ethical conduct, including the ethical handling of actual or apparent conflicts of interest between personal and professional relationships; |
| (2) | Full, fair, accurate, timely, and understandable disclosure in reports and documents that a registrant files with, or submits to, the Commission and in other public communications made by the registrant; |
(3) Compliance with applicable governmental laws, rules, and regulations;
| (4) | The prompt internal reporting of violations of the code to an appropriate person or persons identified in the code; and |
(5) Accountability for adherence to the code.
(c) Amendments: During the period covered by the report, there have not been any amendments to the provisions of the code of ethics.
(d) Waivers: During the period covered by the report, the registrant has not granted any express or implicit waivers from the provisions of the code of ethics.
(e) The Code of Ethics is not posted on Registrant’ website.
(f) A copy of the Code of Ethics is attached as an exhibit.
| Item 3. Audit Committee Financial Expert. | (a)(1)ii The board of directors of the fund has determined that the fund does not have an audit committee financial expert serving on its audit committee. |
(a)(2) Not applicable.
(a)(3) In this regard, no member of the audit committee was identified as having all of the required technical attributes identified in instruction 2 (b) to item 3 of Form N-CSR to qualify as an “audit committee financial expert,” whether through the type of specialized education or experience required by that instruction. At this time, the board believes the experience provided by each member of the audit committee collectively offers the fund adequate oversight by its audit committee given the fund’s level of financial complexity. The board will from time to time reexamine such belief.
Item 4. Principal Accountant Fees and Services.
2019 - $ 18,750
2018 - $ 17,750
2017 - $ 16,000
2016 - $ 16,000
2015 - $ 20,000
2014 - $ 20,000
2019 - None
2018 - None
2017 - None
2016 - None
2015 - None
2014 - None
2019 - $ 7,500
2018 - $ 6,250
2017 - $ 6,000
2016 - $ 6,000
2015 - $ 6,000
2014 - $ 6,000
Preparation of Federal & State income tax returns, assistance with calculation of required income, capital gain and excise distributions and preparation of Federal excise tax returns.
2019 - None
2018 - None
2017 - None
2016 - None
2015 - None
2014 - None
(e) (1)Audit Committee’s Pre-Approval Policies
The registrant’s Audit Committee is required to pre-approve all audit services and, when appropriate, any non-audit services (including audit-related, tax and all other services) to the registrant. The registrant’s Audit Committee also is required to pre-approve, when appropriate, any non-audit services (including audit-related, tax and all other services) to its adviser, or any entity controlling, controlled by or under common control with the adviser that provides ongoing services to the registrant, to the extent that the services may be determined to have an impact on the operations or financial reporting of the registrant. Services are reviewed on an engagement by engagement basis by the Audit Committee.
(2) Percentages of Services Approved by the Audit Committee
| | | 2019 | | 2018 | | 2017 | | 2016 | | 2015 | | | 2014 | |
| Audit-Related Fees: | | | 0.00 | % | | 0.00 | % | | 0.00 | % | | 0.00 | % | | 0.00 | % | | 0.00 | % |
| Tax Fees: | | | 0.00 | % | | 0.00 | % | | 0.00 | % | | 0.00 | % | | 0.00 | % | | 0.00 | % |
| All Other Fees: | | | 0.00 | % | | 0.00 | % | | 0.00 | % | | 0.00 | % | | 0.00 | % | | 0.00 | % |
| (f) | During the audit of registrant's financial statements for the most recent fiscal year, less than 50 percent of the hours expended on the principal accountant's engagement were attributed to work performed by persons other than the principal accountant's full-time, permanent employees. |
| (g) | The aggregate non-audit fees billed by the registrant's accountant for services rendered to the registrant, and rendered to the registrant's investment adviser (not including any sub-adviser whose role is primarily portfolio management and is subcontracted with or overseen by another investment adviser), and any entity controlling, controlled by, or under common control with the adviser that provides ongoing services to the registrant: |
2019 - None
2018 - None
2017 - None
2016 - None
2015 - None
2014 - None
| (h) | The registrant’s audit committee of the board of trustees has considered whether the provision of non-audit services that were rendered to the registrant’s investment adviser, and any entity controlling, controlled by, or under common control with the investment adviser that provides ongoing services to the registrant that were not pre-approved pursuant to paragraph (c)(7)(ii) of Rule 2-01 of Regulation S-X is compatible with maintaining the principal accountant’s independence. No such services were rendered. |
Item 5. Audit Committee of Listed Companies.Not applicable to open-end investment companies.
Item 6. Schedule of Investments.See Item 1.
Item 7. Disclosure of Proxy Voting Policies and Procedures for Closed-End Funds. Not applicable to open-end investment companies.
Item 8. Portfolio Managers of Closed-End Management Investment Companies. Not applicable to open-end investment companies.
Item 9. Purchases of Equity Securities by Closed-End Funds. Not applicable to open-end investment companies.
Item 10. Submission of Matters to a Vote of Security Holders. None
Item 11. Controls and Procedures.
(a) Based on an evaluation of the Registrant’s disclosure controls and procedures as of a date within 90 days of filing date of this Form N-CSR, the principal executive officer and principal financial officer of the Registrant have concluded that the disclosure controls and procedures of the Registrant are reasonably designed to ensure that the information required in filings on Form N-CSR is recorded, processed, summarized, and reported by the filing date, including that information required to be disclosed is accumulated and communicated to the Registrant’s management, including the Registrant’s principal executive officer and principal financial officer, as appropriate to allow timely decisions regarding required disclosure.
(b) There were no significant changes in the Registrant’s internal control over financial reporting that occurred during the Registrant’s last fiscal half-year that have materially affected, or are reasonably likely to materially affect, the Registrant’s internal control over financial reporting.
Item 12. Exhibits.
(a)(1) Code of Ethics herewith.
(a)(2) Certifications required by Section 302 of the Sarbanes-Oxley Act of 2002 (and Item 12(a)(2) of Form N-CSR) are filed herewith.
(a)(3) Not applicable for open-end investment companies.
(b) Certifications required by Section 906 of the Sarbanes-Oxley Act of 2002 (and Item 12(b) of Form N-CSR) are filed herewith.
SIGNATURES
Pursuant to the requirements of the Securities Exchange Act of 1934 and the Investment Company Act of 1940, the registrant has duly caused this report to be signed on its behalf by the undersigned, thereunto duly authorized.
(Registrant)Equinox Funds Trust
By (Signature and Title)
/s/ Robert J. Enck
Robert J. Enck, Principal Executive Officer
Date 09/03/2019
Pursuant to the requirements of the Securities Exchange Act of 1934 and the Investment Company Act of 1940, this report has been signed below by the following persons on behalf of the registrant and in the capacities and on the dates indicated.
By (Signature and Title)
/s/ Robert J. Enck
Robert J. Enck, Principal Executive Officer
Date 09/03/2019
By (Signature and Title)
/s/ Laura Latella
Laura Latella, Principal Financial Officer
Date 09/03/2019