united states
securities and exchange commission
washington, d.c. 20549
form n-csr
certified shareholder report of registered management
investment companies
Investment Company Act file number 811-22447
Equinox Funds Trust
(Exact name of registrant as specified in charter)
17645 Wright Street, Suite 200, Omaha, Nebraska 68130
(Address of principal executive offices) (Zip code)
Rich Malinowski, Gemini Fund Services, LLC.
80 Arkay Drive, Suite 110, Hauppauge, NY 11788
(Name and address of agent for service)
Registrant's telephone number, including area code: 631-470-2619
Date of fiscal year end: 9/30
Date of reporting period:9/30/19
Item 1. Reports to Stockholders.
EQUINOX CHESAPEAKE STRATEGY
FUND
CLASS A SHARES : ECHAX
CLASS C SHARES : ECHCX
CLASS I SHARES : EQCHX
ANNUAL REPORT
SEPTEMBER 30, 2019
1-888-643-3431
WWW.EQUINOXFUNDS.COM
This report and the consolidated financial statements contained herein are submitted for the general information of shareholders and are not authorized for distribution to prospective investors unless preceded or accompanied by an effective prospectus. Nothing herein contained is to be considered an offer to buy shares of the Equinox Funds. Such offering is made only by prospectus, which includes details as to offering price and other material information.
Distributed by Northern Lights Distributors, LLC
Member FINRA
Beginning on January 1, 2021, as permitted by regulations adopted by the Securities and Exchange Commission, paper copies of the Fund’s shareholder reports like this one will no longer be sent by mail, unless you specifically request paper copies of the reports. Instead, the reports will be made available on the Fund’s website www.equinoxfunds.com, and you will be notified by mail each time a report is posted and provided with a website link to access the report.
If you already elected to receive shareholder reports electronically, you will not be affected by this change and you need not take any action. If you invest through a financial intermediary, you may elect to receive shareholder reports and other communications electronically from the Fund by contacting your financial intermediary (such as a broker-dealer or bank). If you invest directly with the Fund, shareholder reports will be made available electronically beginning on January 1, 2021.
You may elect to receive shareholder reports in paper free of charge. You can request to continue receiving paper copies of your shareholder reports by contacting your financial intermediary, or, if you invest directly with the Fund, calling 1-888-643-3431 to let the Fund know your request.

EQUINOX CHESAPEAKE STRATEGY FUND
Annual Letter to Shareholders for the year ended September 30, 2019
The Equinox Chesapeake Strategy Fund (the “Fund”) was launched on September 10, 2012 (Class I Shares, as shown in the table below; Class A and C shares were launched on August 21, 2015).
The Fund’s investment objective is to seek long-term capital appreciation, which is pursued by investing (a) directly or (b) indirectly through its wholly-owned subsidiary, in a combination of
| (i) | exposure to a managed futures trading program offered by Chesapeake Capital Corporation (the “Chesapeake Program”)1; and |
| (ii) | a fixed-income portfolio. |
PERFORMANCE OF THE FUND
As of 9/30/2019
| NAME | TICKER | 12 MO RETURN
(10/1/18-9/30/19) | ANNUALIZED
RETURN SINCE
INCEPTION | CUMULATIVE
RETURN SINCE
INCEPTION | INCEPTION
DATE |
| Class A | ECHAX | -9.40% | -2.03% | -8.09% | 8/21/2015 |
| Class A (with 5.75% maximum sales charge) | ECHAX | -14.72% | -3.43% | -13.35% | 8/21/2015 |
| Class C | ECHCX | -10.04% | -2.74% | -10.78% | 8/21/2015 |
| Class I | EQCHX | -9.23% | 4.82% | 39.38% | 9/10/2012^ |
PAST PERFORMANCE DOES NOT GUARANTEE FUTURE RESULTS.
Investments in Managed Futures are speculative, involve substantial risk, and are not suitable for all investors.
Returns of the Fund’s shares for the fiscal year are shown in the table above. The Fund’s primary investment allocation is to the Chesapeake Program, which is a diversified intermediate to long-term trend-following program. For the year ended September 30, 2019, the Fund’s I shares were down - 9.23% and cumulative performance since inception is +39.38%.
| 1 | A “Managed Futures Program” generally is a trading program that a CTA uses to guide its investments in futures, forwards, options or spot contracts. Please see the Fund’s Prospectus for a detailed description of the Fund’s investment strategy. |

As shown on page 2, the Chesapeake Program’s (and consequently the Fund’s) market exposure is well diversified across four major sectors. As of year-end, Equities are the largest gross exposure, followed by Currencies, Commodities and Interest Rates, in that order. It is worth noting that the Chesapeake Program has long-termtarget risk exposures to various sectors. Theactual sector risk exposures at any time are a function of the signals generated by the trading models: when there are more trends in markets, whether up or down, actual sector risk exposures will tend to be higher. It is also worth distinguishing between “gross” and “net” risk exposures: for example, a sector that has long positions whose risk exposure is 10% and short positions whose risk exposure is -15% will be shown as having a gross risk exposure of 25%, even though its “net” exposure would be only -5% (short).
SECTOR ALLOCATION
As of 9/30/2019
| EQUITIES | CURRENCIES | COMMODITIES | INTEREST RATES | | TOTAL |
| 26.24% | 26.16% | 25.85% | 21.75% | | 100.0% |
SECTOR ATTRIBUTION*
(10/1/2018 to 9/30/2019)
| INTEREST RATES | CURRENCIES | EQUITIES | COMMODITIES |
| 2.10% | -1.17% | -6.08% | -7.72% |
| * | These numbers have been estimated by Equinox based on data provided by NAV Fund Administration and are net of fund fees and expenses. Data above excludes returns from cash management and dividend income. |
In terms of sector attribution, Interest Rates contributed positively to performance this year. Commodities, Equities and Currencies detracted from performance.
FUND PERFORMANCE HIGHLIGHTS
The Fund started the year with a negative month ofOctober 2018 (-5.54%). Concerns that the economy may have peaked coupled with rising rates and continued concerns about trade wars all took their toll. Losses were broad-based, with nearly all sectors other than currencies in negative territory. Gains for the portfolio came from short positions in the Swiss Franc, Russian Ruble & British Pound.
The commodity sector posted a loss that unfortunately offset our gains in the currencies. The combined performance in the grains, meats & metals was virtually flat, although some small gains accrued from copper and silver. Concerns of potential oversupply in global crude led to a price decline that hurt long positions in crude and heating Oil. Losses in soft commodities also contributed negatively, as a bounce in coffee prices hurt long-held short positions. Stocks were the overwhelming reason for negative performance in October, led by stocks that are hurt in times of uncertainty and decreased consumer spending such as Amazon and Nike.
Although equity markets rebounded inNovember, the Fund posted a small loss (-1.42%). Good macro-economic news buoyed the markets, and the US economy still seemed to be trending up. A decline in oil prices bolstered equity markets, as did the Federal Reserve, which held rates unchanged. The currency sector was the biggest detractor, reversing some of the gains from October. Our short positions in both the Aussie and Kiwi Dollars were hurt by signs that those economies were improving, and from the easing trade tensions between China and the US. Gains for the portfolio came from short positions in the Brazilian Real, as that economy braced for a downturn. The commodity sector was mixed for the month, with small gains in softs and metals, offset by some small losses from grains and meats. Notably, a nice gain came from a long position in palladium, as that metal pushed higher due to increased demand from the Chinese auto industry. Some losses were caused by a rally in the soybean complex, with investors betting that the disruption in global soybean flows would be resolved. Stock positions helped the portfolio, led by a rally in blue-chip pharmaceuticals. Apple, struggling to boost sales of the newest iPhone version, was the largest detractor.
Performance was again negative inDecember (-5.28%). Stocks were the biggest detractors as markets renewed their downward trend after a brief recovery in November. The S&P 500® was down more than 9% for the month. Once again, fears of a macro-economic slowdown and market overvaluation dominated the news. The currency sector was slightly positive for the month, buoyed by nice gains from short positions in both the Aussie and Canadian Dollar, as concerns about those economies hurt their currencies. Our largest detractor in the currencies was the Yen. The Japanese economy was not affected by fears of a worldwide slowdown quite as much as other nations, which helped to stabilize the Yen, hurting short positions. Commodities were once again mixed for the month and down overall. Small gains in softs and grains, notably coffee and soybeans, were erased by a sharp decline in natural gas prices, which hurt long positions. Short positions in gold and silver were affected adversely by a rebound in prices as investors fled to the safety of these precious metals and away from the equity markets.
January 2019 (-6.26%) was another negative month, with the new year bringing in fresh challenges. Currencies were the largest detractors, with the Brazilian Real in the lead, as it rallied on renewed optimism in the Brazilian economy after the most recent elections in which has the government moving forward with economic and pension reform as promised during the Presidential campaign. A short position in the Swiss Franc helped performance as that carry-trade currency continued to move lower. As a sector, commodities hurt performance. While the long position in the Palladium continued
to gain on demand from the Chinese market, grains and softs did not help our cause. The soybean complex rebounded on news of a possible breakthrough in trade talks between the US and China, hurting short positions.
After a losing streak,February was a nice bounce-back month (+4.74%), benefiting from a rally in nearly all sectors except energy. Commodities had a strong month, with the long palladium position continuing to prosper. Grains and softs rebounded nicely; canola was a leading performer, as was a short position in coffee, where a global surplus led to new price lows. Live cattle also had a nice month, helped by cold weather throughout the US and higher retail prices for beef. Short positions in most currencies led to gains for the portfolio, with the Yen at the forefront, as that currency finally weakened on concerns about trade and general pessimism in the Japanese economy. Our short position in the British Pound was the sole detractor, buoyed by some renewed hope of a positive Brexit outcome. We experienced a nice bounce across the equity sector with nearly all positions advancing. One detractor of note was Coca-Cola, which delivered some cautious sales and earnings guidance for 2019, hurting our long position.
March(+1.39%) was a nice continuation of February’s favorable results, anchored by a rally in equity markets. Commodities were mixed in March. Short positions in grains gained as prices continued to decline, led by canola. Palladium experienced a correction as some traders closed out their positions. Softs were mixed, with losses experienced by our short position in cotton, which rose on news of additional acreage being planted. Short positions in most currencies continued to benefit, with the British Pound leading the way on increasing negative concerns about Brexit. A decline in the Euro also helped, as business growth in the Eurozone continued to slow. The equity sector was a stellar performer, with gains across the board from the broad-based market rally. The leader for the month was Dollar Tree Store, which rose sharply on news that it would be closing many underperforming stores and would begin to sell alcohol at many locations.
Gains continued inApril (+3.10%) as all markets and sectors continued to show signs of improvement. Commodities were positive overall, with gains coming from grains, once again led by short positions in canola. Palladium prices bounced back from their March decline. Softs were up, again led by short positions in cotton. The energy sector was buoyed by the gain in carbon emissions. After tripling in price in 2018, the contract was flat during Q1 of 2019, but rebounded strongly in April on purchases by European energy producers. Meats were the only negative sector, with a long position in live cattle hurt by slumping beef prices, which fell to a six-week low. Currencies were positive overall. A strong month for the Mexican Peso helped performance, as did the continued decline in the Swiss Franc, where the central bank has not raised rates, unlike its European counterparts. In equities, Dollar Tree Store continued to rise. A long position in Coca-Cola also profited as analysts increased their estimates.
Mayproved to be a difficult month (-6.45%), particularly in the last week, as the Fund gave back most of the ground it had gained since February. With the notable exception of interest rates, all sectors
were down for the month. Commodities were hit hard, as the gains experienced in grains turned around, led by wheat and corn. Palladium also gave back some ground, although it was still up on the year. Softs were up for the month, due almost solely to a gain in cotton, which rose on tight supplies and tariff talk. Tariffs and renewed fears of a trade war also hurt the meats sector, as prices declined. Currencies were nearly flat for the month, despite a gain in the short British Pound position, as that currency was hurt by the ongoing Brexit crisis. In interest rates, Aussie and US bond positions profited from the flight to safety. The decline in stocks was the main detractor, with losses across the board.
The Fund bounced back inJune (+3.59%) as rising equity markets buoyed performance. Commodities were mixed in June. Gold and palladium yielded profits, but energy was mostly negative. Softs and grains were both slightly down in June, the lone bright spot continuing to be the short position in canola, which benefitted from reports that Canadian farmers were planting fewer acres on trade concerns with China. Trade concerns also hurt the meats sector, with long positions hurt by these fears and also by overall lower prices. Currencies hurt us this month; a long position in the Russian Ruble was the sole bright spot, as that currency was buoyed by the overall strength of the Russian equity markets, one of the strongest performing stock indexes thus far in 2019. Fixed income was led by our long position in Italian Government Bonds. Stocks were the main drivers of performance, with Dollar Tree Stores and Coca-Cola continuing to rise on positive fundamentals. Long positions in several pharmaceutical companies were also profitable.
Julywas another good month (+3.83%). The commodities sector was positive, although palladium gave back some earlier gains and nickel was down on decreased worldwide demand. Energy was mostly flat, but we continue to benefit from the long position in carbon emissions. Softs and grains were both up, with the short position in canola continuing to thrive on lower acreage planted and trade concerns with China. Our long position in corn offset this, with the harvest projected to be much larger than anticipated, driving down prices. In softs, a short position in coffee did well, as booming supply has driven prices down. Currencies were highly profitable in July, with short positions in many of the European currencies gaining nicely. The British Pound sank to a new low for the year, to the benefit of our short position. Fixed income continued to be a strong performer, again led by Italian Government Bonds. Stocks were mixed in the face of extreme volatility.
Positive performance continued intoAugust (+1.85%). Commodities were once again the leaders, driven by the precious metals, which were up on safe-haven demand. Energy was slightly negative, with carbon emissions giving back a little ground. Softs were mixed, but short positions in cotton and sugar both gained nicely. Grains were up slightly overall, with a wheat position driving positive performance that offset a continued sell-off in corn. We finally saw some gains in meats, where live cattle prices bounced back off their three-year lows. Currencies gave back some of their strong July performance. Most positions were down, the lone bright spot being the Brazilian Real, which plunged nearly 8%, helping our short position. Gains in fixed income were again led by our long position in Italian Government Bonds, which continued to rise strongly. Aussie and US bonds which were also up. Stocks were again mixed in August, as volatility persisted.
September(-2.07%) was hurt by commodities performance. Metal prices reversed course, with gold and silver leading the decline. Palladium, however, continued its rally. Energies, softs, meats and grains were down across the board. Currencies were a bright spot, bouncing back from the prior month’s losses, with nearly every position gaining ground. Our long position in the Russian Ruble continues to perform nicely as that currency rises on the back of a strong Russian economy. Fixed income was mixed but up a little in the aggregate, thanks yet again to Italian Government Bonds, which showed no signs of slowing down. Unfortunately, nor did volatility in the equity markets, although this sector did end up in positive territory.
OUTLOOK
We believe that there continues to be much latent uncertainty in the markets. In the US, the outcome of the impeachment proceedings is uppermost on people’s minds. Geopolitical stresses continue in Europe (particularly with respect to Brexit) and the Middle East (Iran, Syria, Saudi Arabia, Yemen). Trade-related issues with China and other trading partners are not yet fully resolved. Climate change remains a concern in the form of more severe weather-related events. The Fed’s policy reversed this year in the face of a slowing economy. Surprisingly, equity markets have continued to scale new heights; however, this has triggered fresh doubts about its sustainability.
Investors should bear in mind that managed futures programs have historically offered useful diversification benefits, with the potential for attractive risk-adjusted returns over the long run. In fact, managed futures have historically tended to perform well in a wide variety of market conditions, perhaps particularly so during periods of equity market turbulence and volatility expansion. We continue to believe that a significant and strategic allocation to the asset class has the potential to serve investors well in the long run.
Although the Fund has been in operation for a relatively short period of time, Chesapeake Capital has been trading a similar strategy dating back to the 1980s. Chesapeake’s program has historically offered useful diversification benefits, along with what we view as attractive risk-adjusted long-term returns over multiple market cycles. In our opinion, the Fund and the managed futures asset class should continue to offer these potential benefits in a market environment that is still challenging and a geopolitical outlook that remains fraught with uncertainty. In fact, managed futures, although not a hedge for equities in the true sense of the word, have historically displayed the ability to earn what has been termed as “crisis alpha:” positive returns during periods when equity markets have fallen, and volatility has increased.
Difficult market conditions, the prevailing climate of economic and geopolitical uncertainty, and the unpredictable nature of financial markets all pose challenges for investors. The Chesapeake program
is, we believe, positioned to potentially perform well under these conditions. As always, we encourage investors to focus on holding a portfolio that blends traditional assets with a strategic and meaningful allocation to alternative assets, appropriate for their long-term goals. A well-balanced portfolio may display lower volatility, while also affording opportunities for potential long-term growth. We believe that the managed futures asset class should play an important role in such a portfolio.
Thank you for investing in the Equinox Chesapeake Strategy Fund.
DEFINITIONS
Brexitis the popular term for the prospective withdrawal of the United Kingom from the European Union.
Carryis generally a strategy in which an investor sells a certain currency with a relatively low interest rate and uses the funds to purchase a different currency yielding a higher interest rate.
ACommodity Trading Advisor (“CTA”) is a trader who may invest in more than 150 global futures markets. They seek to generate profit in both bull or bear markets, due to their ability to go long (buy) futures positions, in anticipation of rising markets, or go short (sell) futures positions, in anticipation of falling markets.
ADerivative Contract is a financial contract which derives its value from the performance of another entity such as an asset, index, or interest rate, called the “underlying”. Derivatives are one of the three main categories of financial instruments, the other two being equities (i.e. stocks) and debt (i.e. bonds and mortgages).
Long Position refers to the buying of a security such as a stock, commodity or currency, with the expectation that the asset will rise in value.
Risk-adjusted return is a mesuare of the return on an investment relative to the risk of that investment, over a specific period, which is generally expressed as a number or rating.
Short Position is a position whereby an investor sells borrowed securities in anticipation of a price decline and is required to return an equal number of shares at some point in the future.
ATrend Following strategy generally seeks to identify the general direction of one or more global market segments (either up or down) using indicators such as current market prices and moving average prices, and buy or sell investments based on the assessment of these trade signals as determined before a trade is made. Trend-following generally focuses on the direction an investment or global market segment already has gone and not on the direction it may go.
3867-NLD-11/11/2019
| Equinox Chesapeake Strategy Fund |
| PORTFOLIO REVIEW (Unaudited) |
| September 30, 2019 |
The Fund’s performance figures* for the periods ended September 30, 2019, as compared to its benchmarks:
| | | Annualized |
| | | | | Start of | |
| | | | | Performance | Since Inception |
| | One Year | Three Years | Five Years | (09/10/2012) | (08/21/2015) |
| Equinox Chesapeake Strategy Fund | | | | | |
| Class A with load ^ | (14.64)% | (3.47)% | N/A | N/A | (3.41)% |
| Class A ^ | (9.40)% | (1.53)% | N/A | N/A | (2.01)% |
| Class C ^ | (10.04)% | (2.25)% | N/A | N/A | (2.71)% |
| Class I ** | (9.23)% | (1.27)% | 1.80% | 4.82% | N/A |
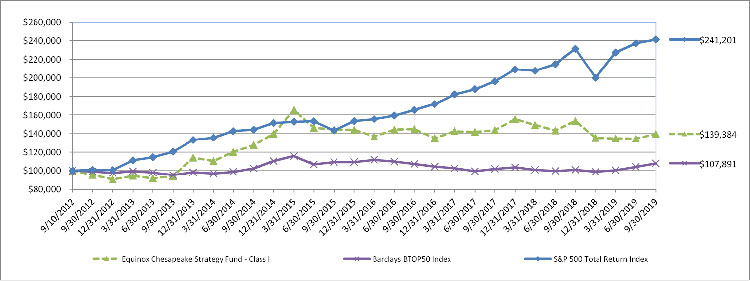
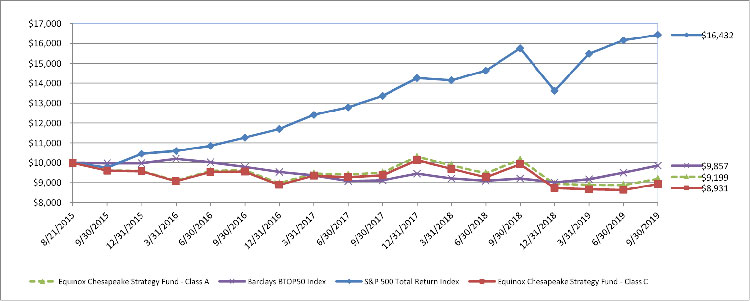
| Barclay BTOP50 Index *** | 6.95% | 0.22% | 1.04% | 1.08% | (0.35)% |
| S&P 500 Total Return Index + | 4.25% | 13.39% | 10.84% | 13.29% | 12.85% |
| * | The performance data quoted is historical. The performance comparison includes reinvestment of all dividends and capital gains and has been adjusted for Class A maximum applicable sales charge of 5.75%. Past performance is no guarantee of future results. Current performance may be higher or lower than the performance data quoted. The principal value and investment return of an investment will fluctuate so that your shares, when redeemed, may be worth more or less than their original cost. The returns shown do not reflect the deduction of taxes that a shareholder would pay on portfolio distributions or on the redemptions of portfolio shares. Performance figures for periods greater than one year are annualized. The returns would have been lower had the Advisor not waived its fees or reimbursed a portion of the Fund’s expenses. Per the fee table in the Fund’s prospectus dated February 1, 2019, the Fund’s “Total Annual Fund Operating Expenses” are 2.04%, 2.81%, and 1.81% of the Fund’s average daily net assets. These expenses may differ from the actual expenses incurred by the Fund for the period covered by this report. Additional information regarding the Fund’s expense ratios is available in the Consolidated Financial Highlights. For performance information current to the most recent month-end please call 1-888-643-3431. |
| ** | Commencement of operations for Class I was April 19, 2012. Start of performance was September 10, 2012. |
| ^ | Commencement of operations and start of performance for Class A and Class C was August 21, 2015. |
| *** | The Barclay BTOP50 Index (“BTOP50 Index”) seeks to replicate the overall composition of the managed futures industry with regard to trading style and overall market exposure. The BTOP50 Index employs a top-down approach in selecting its constituents. The largest investable trading advisor programs, as measured by assets under management, are selected for inclusion in the BTOP50 Index. In each calendar year the selected trading advisors represent, in aggregate, no less than 50% of the investable assets of the Barclays CTA Universe. For 2019, there are 20 funds in the BTOP50 Index. Investors cannot invest directly in an index. |
| + | The S&P 500 Total Return Index is a widely accepted, unmanaged index of U.S. stock market performance which does not take into account charges, fees, and other expenses. Investors cannot invest directly in an index. |
Comparison of the Change in Value of a $100,000 Investment
| Equinox Chesapeake Strategy Fund |
| PORTFOLIO REVIEW (Unaudited)(Continued) |
| September 30, 2019 |
Comparison of the Change in Value of a $10,000 Investment
| Holdings by Asset Class | | % of Net Assets | |
| U.S. Treasury Notes | | | 91.0 | % |
| Other Assets Less Liabilities | | | 9.0 | % |
| | | | 100.0 | % |
Please refer to the Consolidated Portfolio of Investments in this annual report for a detail of the Fund’s holdings. The value of the Fund’s derivative positions that provide exposure to a managed futures program is included in “other assets less liabilities;” however, the portfolio composition detailed above does not include derivatives exposure. See the accompanying notes for more information on the impact of the Fund’s derivative positions on the consolidated financial statements.
| Equinox Chesapeake Strategy Fund |
| CONSOLIDATED PORTFOLIO OF INVESTMENTS |
| September 30, 2019 |
| Principal Amount | | | | | Coupon Rate
(%) | | Maturity
Date | | Value | |
| | | | | U.S. TREASURY NOTES - 91.0% | | | | | | | | |
| $ | 5,500,000 | | | United States Treasury Note | | 1.125 | | 12/31/2019 | | $ | 5,489,043 | |
| | 18,200,000 | | | United States Treasury Note +* | | 1.250 | | 1/31/2020 | | | 18,160,188 | |
| | 10,740,000 | | | United States Treasury Note * | | 1.500 | | 10/31/2019 | | | 10,734,845 | |
| | 5,500,000 | | | United States Treasury Note | | 1.500 | | 11/30/2019 | | | 5,495,055 | |
| | 11,500,000 | | | United States Treasury Note | | 1.500 | | 4/15/2020 | | | 11,477,764 | |
| | 10,000,000 | | | United States Treasury Note * | | 1.625 | | 11/30/2020 | | | 9,980,859 | |
| | 18,200,000 | | | United States Treasury Note +* | | 2.000 | | 7/31/2020 | | | 18,220,617 | |
| | 7,500,000 | | | United States Treasury Note | | 2.250 | | 2/15/2021 | | | 7,549,951 | |
| | | | | TOTAL U.S TREASURY NOTES (Cost - $86,738,161) | | | 87,108,322 | |
| | | | | | | | | | | | | |
| | | | | TOTAL INVESTMENTS - 91.0% (Cost - $86,738,161) | | $ | 87,108,322 | |
| | | | | OTHER ASSETS AND LIABILITIES - NET - 9.0% | | | 8,636,482 | |
| | | | | TOTAL NET ASSETS - 100.0% | | | | | | $ | 95,744,804 | |
| + | All or a portion of this investment is a holding of Equinox Chesapeake Strategy Fund Limited. |
| * | All or a portion of this investment is held as collateral for futures contracts. As of September 30, 2019, $16,600,704 was pledged as collateral for Futures Contracts. |
See accompanying notes to consolidated financial statements.
| Equinox Chesapeake Strategy Fund |
| CONSOLIDATED PORTFOLIO OF INVESTMENTS (Continued) |
| September 30, 2019 |
| | | | | | | | | Notional Value | | | Unrealized | |
| | | Number of | | | | | | at September 30, | | | Appreciation/ | |
| Description | | Contracts | | Counterparty | | Expiration Date | | 2019 | | | (Depreciation) | |
| SHORT FUTURES CONTRACTS | | | | | | | | | | | | |
| Archer-Daniels-Midland Co. Future | | 725 | | Morgan Stanley | | Dec-19 | | $ | 2,994,250 | | | $ | (237,082 | ) |
| Australian Dollar Future | | 82 | | Morgan Stanley | | Dec-19 | | | 5,549,760 | | | | 68,880 | |
| BP PLC Future | | 526 | | Morgan Stanley | | Dec-19 | | | 2,009,320 | | | | (85,180 | ) |
| Brazil Real Future | | 112 | | Morgan Stanley | | Oct-19 | | | 2,693,040 | | | | (10,740 | ) |
| British Pound Future | | 190 | | Morgan Stanley | | Dec-19 | | | 14,644,250 | | | | 32,062 | |
| Canola Future + | | 574 | | Morgan Stanley | | Nov-19 | | | 3,913,085 | | | | 109,958 | |
| Coffee ‘C’ Future + | | 72 | | Morgan Stanley | | Dec-19 | | | 2,731,050 | | | | (19,575 | ) |
| Copper Future + | | 38 | | Morgan Stanley | | Dec-19 | | | 2,449,575 | | | | 4,913 | |
| Cotton No. 2 Future + | | 109 | | Morgan Stanley | | Dec-19 | | | 3,315,235 | | | | 229,020 | |
| Euro FX Future | | 53 | | Morgan Stanley | | Dec-19 | | | 7,262,656 | | | | 110,969 | |
| Live Cattle Future + | | 78 | | Morgan Stanley | | Dec-19 | | | 3,441,360 | | | | (205,950 | ) |
| LME Aluminum Future + | | 44 | | Morgan Stanley | | Nov-19 | | | 1,893,925 | | | | 62,125 | |
| LME Lead Future + | | 29 | | Morgan Stanley | | Nov-19 | | | 1,550,594 | | | | (55,281 | ) |
| LME Zinc Future + | | 7 | | Morgan Stanley | | Nov-19 | | | 422,013 | | | | (24,631 | ) |
| MSCI Emerging Markets Index Future | | 25 | | Morgan Stanley | | Dec-19 | | | 1,252,375 | | | | 35,500 | |
| Netflix, Inc. Future | | 19 | | Morgan Stanley | | Dec-19 | | | 511,290 | | | | 15,351 | |
| New Zealand Dollar Future | | 92 | | Morgan Stanley | | Dec-19 | | | 5,772,080 | | | | 136,620 | |
| Nikkei 225 Index Future | | 5 | | Morgan Stanley | | Dec-19 | | | 502,892 | | | | (19,145 | ) |
| Soybean Future + | | 57 | | Morgan Stanley | | Nov-19 | | | 2,582,100 | | | | 44,162 | |
| Soybean Oil Future + | | 150 | | Morgan Stanley | | Dec-19 | | | 2,617,200 | | | | (20,262 | ) |
| Swiss Franc Future | | 62 | | Morgan Stanley | | Dec-19 | | | 7,813,550 | | | | 104,238 | |
| Wheat (CBT) Future + | | 45 | | Morgan Stanley | | Dec-19 | | | 1,115,438 | | | | (84,638 | ) |
| World Sugar #11 Future + | | 293 | | Morgan Stanley | | Mar-20 | | | 4,151,224 | | | | (242,738 | ) |
| | | | | | | | | | | | | | (51,424 | ) |
| LONG FUTURES CONTRACTS | | | | | | | | | | | | | | |
| 90 Day Eurodollar Future | | 211 | | Morgan Stanley | | Dec-20 | | | 51,971,938 | | | | (28,288 | ) |
| Australian 10 Year Bond Future | | 120 | | Morgan Stanley | | Dec-19 | | | 11,925,573 | | | | 60,256 | |
| Broadcom, Inc. Future | | 63 | | Morgan Stanley | | Dec-19 | | | 1,748,817 | | | | 3,367 | |
| CAC 40 10 Euro Index Future | | 81 | | Morgan Stanley | | Oct-19 | | | 5,012,262 | | | | 65,090 | |
| Canadian 10 Year Bond Future | | 114 | | Morgan Stanley | | Dec-19 | | | 12,278,248 | | | | (198,431 | ) |
| Coca-Cola Co. Future | | 815 | | Morgan Stanley | | Dec-19 | | | 4,461,310 | | | | 12,828 | |
| Cocoa Future + | | 32 | | Morgan Stanley | | Dec-19 | | | 781,440 | | | | (22,400 | ) |
| CSX Corp. Future | | 36 | | Morgan Stanley | | Dec-19 | | | 250,596 | | | | 14,495 | |
| Dollar Tree, Inc. Future | | 37 | | Morgan Stanley | | Dec-19 | | | 424,723 | | | | 8,718 | |
| Euro-BTP Future | | 83 | | Morgan Stanley | | Dec-19 | | | 13,196,571 | | | | 131,650 | |
| Euro-Bund Future | | 54 | | Morgan Stanley | | Dec-19 | | | 10,258,241 | | | | (114,021 | ) |
| FTSE 100 Index Future | | 39 | | Morgan Stanley | | Dec-19 | | | 3,548,489 | | | | 39,619 | |
| FTSE China A50 Future | | 85 | | Morgan Stanley | | Oct-19 | | | 1,155,150 | | | | (16,178 | ) |
| Gold 100 Oz. Future + | | 25 | | Morgan Stanley | | Dec-19 | | | 3,682,250 | | | | 60,520 | |
| ICE ECX Emission Future + | | 81 | | Morgan Stanley | | Dec-19 | | | 2,182,930 | | | | 63,613 | |
| ILS/USD Future | | 82 | | Morgan Stanley | | Dec-19 | | | 23,682,420 | | | | 284,540 | |
| INR/USD Standard Future | | 142 | | Morgan Stanley | | Oct-19 | | | 10,022,360 | | | | 107,655 | |
| Japanese Yen Future | | 142 | | Morgan Stanley | | Dec-19 | | | 16,503,950 | | | | (197,380 | ) |
| LME Nickel Future + | | 16 | | Morgan Stanley | | Nov-19 | | | 1,642,560 | | | | 103,068 | |
| Long Gilt Future | | 63 | | Morgan Stanley | | Dec-19 | | | 10,421,712 | | | | 68,571 | |
| McDonald’s Corp. Future | | 153 | | Morgan Stanley | | Dec-19 | | | 3,303,423 | | | | (42,881 | ) |
| Medtronic PLC Future | | 388 | | Morgan Stanley | | Dec-19 | | | 4,214,844 | | | | 35,708 | |
| Merck & Co., Inc. Future | | 640 | | Morgan Stanley | | Dec-19 | | | 5,417,600 | | | | (110,861 | ) |
| Mexican Peso Future | | 375 | | Morgan Stanley | | Dec-19 | | | 9,386,250 | | | | (7,500 | ) |
| NASDAQ 100 E-Mini Future | | 6 | | Morgan Stanley | | Dec-19 | | | 932,460 | | | | (16,806 | ) |
| Nike, Inc. Future | | 219 | | Morgan Stanley | | Dec-19 | | | 2,068,236 | | | | 138,435 | |
| Oracle Corp. Future | | 682 | | Morgan Stanley | | Dec-19 | | | 3,774,188 | | | | 207,758 | |
See accompanying notes to consolidated financial statements.
| Equinox Chesapeake Strategy Fund |
| CONSOLIDATED PORTFOLIO OF INVESTMENTS (Continued) |
| September 30, 2019 |
| | | | | | | | | Notional Value | | | Unrealized | |
| | | Number of | | | | | | at September 30, | | | Appreciation/ | |
| Description | | Contracts | | Counterparty | | Expiration Date | | 2019 | | | (Depreciation) | |
| LONG FUTURES CONTRACTS (Continued) | | | | | | | | |
| Palladium Future + | | 18 | | Morgan Stanley | | Dec-19 | | $ | 2,965,500 | | | $ | 304,270 | |
| Platinum Future + | | 48 | | Morgan Stanley | | Jan-20 | | | 2,134,080 | | | | (137,040 | ) |
| Qualcomm, Inc. Future | | 147 | | Morgan Stanley | | Dec-19 | | | 1,127,196 | | | | 28,902 | |
| Russian Ruble Future | | 135 | | Morgan Stanley | | Dec-19 | | | 5,150,250 | | | | 87,750 | |
| S&P 500 E-Mini Future | | 17 | | Morgan Stanley | | Dec-19 | | | 2,531,725 | | | | (21,463 | ) |
| Silver Future + | | 27 | | Morgan Stanley | | Dec-19 | | | 2,294,730 | | | | (32,630 | ) |
| Southern Co. Future | | 730 | | Morgan Stanley | | Dec-19 | | | 4,534,030 | | | | 248,163 | |
| Southwest Airlines Co. Future | | 120 | | Morgan Stanley | | Dec-19 | | | 651,720 | | | | (18,558 | ) |
| Starbucks Corp. Future | | 279 | | Morgan Stanley | | Dec-19 | | | 2,480,589 | | | | (239,429 | ) |
| Target Corp. Future | | 146 | | Morgan Stanley | | Dec-19 | | | 1,569,500 | | | | 32,965 | |
| TRY/USD Future | | 95 | | Morgan Stanley | | Dec-19 | | | 8,206,575 | | | | 219,925 | |
| Twilio, Inc. Future | | 9 | | Morgan Stanley | | Dec-19 | | | 99,504 | | | | (19,184 | ) |
| U.S. 10 Year Note (CBT) Future | | 117 | | Morgan Stanley | | Dec-19 | | | 15,246,563 | | | | (92,391 | ) |
| U.S. Long Bond (CBT) Future | | 82 | | Morgan Stanley | | Dec-19 | | | 13,309,625 | | | | (110,359 | ) |
| U.S. Ultra Bond (CBT) Future | | 51 | | Morgan Stanley | | Dec-19 | | | 9,787,219 | | | | (107,344 | ) |
| USD/CNH Future | | 179 | | Morgan Stanley | | Dec-19 | | | 17,935,844 | | | | (31,318 | ) |
| USD/SEK Future | | 59 | | Morgan Stanley | | Dec-19 | | | 5,877,287 | | | | 119,700 | |
| USD/ZAR Future | | 29 | | Morgan Stanley | | Dec-19 | | | 2,925,820 | | | | 71,908 | |
| Verizon Communications, Inc. Future | | 452 | | Morgan Stanley | | Dec-19 | | | 2,743,640 | | | | 128,006 | |
| Wal-Mart Stores, Inc. Future | | 319 | | Morgan Stanley | | Dec-19 | | | 3,806,946 | | | | 205,216 | |
| | | | | | | | | | | | | | 1,288,234 | |
| NET UNREALIZED APPRECIATION ON FUTURES CONTRACTS | | | $ | 1,236,810 | |
| + | This investment is a holding of Equinox Chesapeake Strategy Fund Limited. |
See accompanying notes to consolidated financial statements.
| Equinox Chesapeake Strategy Fund |
| CONSOLIDATED STATEMENT OF ASSETS AND LIABILITIES |
| September 30, 2019 |
| ASSETS | | | | |
| Investment securities: | | | | |
| At cost | | $ | 86,738,161 | |
| At fair value | | $ | 87,108,322 | |
| Cash and cash equivalents | | | 5,038,557 | |
| Cash pledged to broker(1) | | | 2,147,075 | |
| Unrealized appreciation on futures contracts | | | 1,236,810 | |
| Receivable for Fund shares sold | | | 64,040 | |
| Interest receivable | | | 378,817 | |
| Prepaid expenses & other assets | | | 33,806 | |
| TOTAL ASSETS | | | 96,007,427 | |
| | | | | |
| LIABILITIES | | | | |
| Payable for Fund shares redeemed | | | 106,020 | |
| Advisory fees payable | | | 103,133 | |
| Distribution (12b-1) fees payable | | | 1,458 | |
| Accrued legal fees | | | 2,860 | |
| Accrued audit and tax fees | | | 27,270 | |
| Payable to related parties | | | 12,298 | |
| Accrued expenses and other liabilities | | | 9,584 | |
| TOTAL LIABILITIES | | | 262,623 | |
| NET ASSETS | | $ | 95,744,804 | |
| | | | | |
| Net Assets Consist Of: | | | | |
| Paid in capital ($0 par value, unlimited shares authorized) | | $ | 112,682,767 | |
| Accumulated losses | | | (16,937,963 | ) |
| NET ASSETS | | $ | 95,744,804 | |
| (1) | Segregated in the custodian account as collateral for future contracts. |
See accompanying notes to consolidated financial statements.
| Equinox Chesapeake Strategy Fund |
| CONSOLIDATED STATEMENT OF ASSETS AND LIABILITIES (Continued) |
| September 30, 2019 |
| Net Asset Value Per Share: | | | | |
| Class A Shares: | | | | |
| Net Assets | | $ | 5,047,861 | |
| Shares of beneficial interest outstanding ($0 par value, unlimited shares authorized) | | | 448,406 | |
| Net asset value (Net Assets ÷ Shares Outstanding) redemption price per share | | $ | 11.26 | |
| Maximum offering price per share (maximum sales charges of 5.75%) (a) | | $ | 11.95 | |
| | | | | |
| Class C Shares: | | | | |
| Net Assets | | $ | 592,232 | |
| Shares of beneficial interest outstanding ($0 par value, unlimited shares authorized) | | | 53,948 | |
| Net asset value (Net Assets ÷ Shares Outstanding), offering price and redemption price per share (a) | | $ | 10.98 | |
| | | | | |
| Class I Shares: | | | | |
| Net Assets | | $ | 90,104,711 | |
| Shares of beneficial interest outstanding ($0 par value, unlimited shares authorized) | | | 7,936,160 | |
| Net asset value (Net Assets ÷ Shares Outstanding), offering price and redemption price per share | | $ | 11.35 | |
| (a) | A contingent deferred sales charge (“CDSC”) of 1.00% is assessed on certain redemptions of Class A shares made within 12 months after a purchase of Class A shares where no initial sales charge was paid at the time of purchase as part of an investment of $1,000,000 or more. A contingent deferred sales charge (“CDSC”) of 1.00% is assessed on redemptions of Class C shares made within one year after a purchase of such shares. |
See accompanying notes to consolidated financial statements.
| Equinox Chesapeake Strategy Fund |
| CONSOLIDATED STATEMENT OF OPERATIONS |
| For the Year Ended September 30, 2019 |
| INVESTMENT INCOME | | | | |
| Interest | | $ | 2,705,632 | |
| | | | | |
| EXPENSES | | | | |
| Investment advisory fees | | | 1,731,163 | |
| Distribution (12b-1) fees | | | | |
| Class A | | | 11,845 | |
| Class C | | | 7,012 | |
| Legal fees | | | 115,268 | |
| Third party administrative service fees | | | 29,373 | |
| Transfer agent fees | | | 54,808 | |
| Accounting services fees | | | 57,394 | |
| Administrative services fees | | | 76,258 | |
| Trustees fees and expenses | | | 32,068 | |
| Printing and postage expenses | | | 44,285 | |
| Registration fees | | | 61,540 | |
| Audit and tax fees | | | 27,306 | |
| Custodian fees | | | 15,046 | |
| Compliance officer fees | | | 11,788 | |
| Insurance fees | | | 32,549 | |
| Other expenses | | | 2,502 | |
| TOTAL EXPENSES | | | 2,310,205 | |
| | | | | |
| Less: Fees waived by the Advisor | | | (148,881 | ) |
| | | | | |
| NET EXPENSES | | | 2,161,324 | |
| NET INVESTMENT INCOME | | | 544,308 | |
| | | | | |
| REALIZED AND UNREALIZED GAIN/(LOSS) ON INVESTMENTS | | | | |
| Net realized loss on: | | | | |
| Investments | | | (14,136 | ) |
| Futures contracts | | | (14,462,307 | ) |
| Futures commissions | | | (339,793 | ) |
| Foreign currency translations | | | (27,373 | ) |
| | | | (14,843,609 | ) |
| Net change in unrealized appreciation/(depreciation) on: | | | | |
| Investments | | | 608,159 | |
| Futures contracts | | | (4,844,385 | ) |
| Foreign currency translations | | | (15,756 | ) |
| | | | (4,251,982 | ) |
| | | | | |
| NET REALIZED AND UNREALIZED LOSS ON INVESTMENTS | | | (19,095,591 | ) |
| | | | | |
| NET DECREASE IN NET ASSETS RESULTING FROM OPERATIONS | | $ | (18,551,283 | ) |
See accompanying notes to consolidated financial statements.
| Equinox Chesapeake Strategy Fund |
| CONSOLIDATED STATEMENTS OF CHANGES IN NET ASSETS |
| | | Year Ended | | | Year Ended | |
| | | September 30, | | | September 30, | |
| | | 2019 | | | 2018 | |
| FROM OPERATIONS | | | | | | | | |
| Net investment income/(loss) | | $ | 544,308 | | | $ | (777,169 | ) |
| Net realized loss from investments, futures, and foreign currency translations | | | (14,843,609 | ) | | | (796,386 | ) |
| Net change in unrealized appreciation/(depreciation) on investments, futures and foreign currency translations | | | (4,251,982 | ) | | | 6,412,793 | |
| Net increase/(decrease) in net assets resulting from operations | | | (18,551,283 | ) | | | 4,839,238 | |
| | | | | | | | | |
| DISTRIBUTIONS TO SHAREHOLDERS | | | | | | | | |
| Total distributions paid*: | | | | | | | | |
| Class A | | | (47,608 | ) | | | — | |
| Class C | | | (3,479 | ) | | | — | |
| Class I | | | (1,647,251 | ) | | | — | |
| From distributions to shareholders | | | (1,698,338 | ) | | | — | |
| | | | | | | | | |
| FROM SHARES OF BENEFICIAL INTEREST | | | | | | | | |
| Proceeds from shares sold: | | | | | | | | |
| Class A | | | 2,275,722 | | | | 8,489,373 | |
| Class C | | | 67,270 | | | | 493,011 | |
| Class I | | | 65,429,277 | | | | 142,607,850 | |
| Net asset value of shares issued in reinvestment of distributions: | | | | | | | | |
| Class A | | | 45,919 | | | | — | |
| Class C | | | 3,205 | | | | — | |
| Class I | | | 1,504,780 | | | | — | |
| Payments for shares redeemed: | | | | | | | | |
| Class A | | | (2,458,605 | ) | | | (3,898,764 | ) |
| Class C | | | (315,569 | ) | | | (109,728 | ) |
| Class I | | | (116,164,021 | ) | | | (39,936,354 | ) |
| Net increase/(decrease) in net assets from shares of beneficial interest | | | (49,612,022 | ) | | | 107,645,388 | |
| | | | | | | | | |
| TOTAL INCREASE/(DECREASE) IN NET ASSETS | | | (69,861,643 | ) | | | 112,484,626 | |
| | | | | | | | | |
| NET ASSETS | | | | | | | | |
| Beginning of Period | | | 165,606,447 | | | | 53,121,821 | |
| End of Period** | | $ | 95,744,804 | | | $ | 165,606,447 | |
| * | Distributions from net investment income and net realized capital gains are combined for the year ended September 30, 2019. See Note 8 “New Accounting Pronouncements” in the Notes to Consolidated Financial Statements for more information. |
| ** | Net Assets - End of Year includes accumulated net investment loss of $(5,649,677) as of September 30, 2018. |
See accompanying notes to consolidated financial statements.
| Equinox Chesapeake Strategy Fund |
| CONSOLIDATED STATEMENTS OF CHANGES IN NET ASSETS (Continued) |
| | | Year Ended | | | Year Ended | |
| | | September 30, | | | September 30, | |
| | | 2019 | | | 2018 | |
| SHARE ACTIVITY | | | | | | | | |
| Class A: | | | | | | | | |
| Shares Sold | | | 204,164 | | | | 683,848 | |
| Shares Reinvested | | | 4,137 | | | | — | |
| Shares Redeemed | | | (222,347 | ) | | | (321,732 | ) |
| Net increase/(decrease) in shares of beneficial interest outstanding | | | (14,046 | ) | | | 362,116 | |
| | | | | | | | | |
| Class C: | | | | | | | | |
| Shares Sold | | | 6,099 | | | | 40,806 | |
| Shares Reinvested | | | 294 | | | | — | |
| Shares Redeemed | | | (28,383 | ) | | | (9,218 | ) |
| Net increase/(decrease) in shares of beneficial interest outstanding | | | (21,990 | ) | | | 31,588 | |
| | | | | | | | | |
| Class I: | | | | | | | | |
| Shares Sold | | | 5,714,068 | | | | 11,455,614 | |
| Shares Reinvested | | | 134,716 | | | | — | |
| Shares Redeemed | | | (10,475,001 | ) | | | (3,241,120 | ) |
| Net increase/(decrease) in shares of beneficial interest outstanding | | | (4,626,217 | ) | | | 8,214,494 | |
See accompanying notes to consolidated financial statements.
| Equinox Chesapeake Strategy Fund |
| CONSOLIDATED FINANCIAL HIGHLIGHTS |
Per Share Data and Ratios for a Share of Beneficial Interest Outstanding Throughout Each Period
| | | Class A | |
| | | Year Ended | | | Year Ended | | | Year Ended | | | Year Ended | | | Period Ended | |
| | | September 30, | | | September 30, | | | September 30, | | | September 30, | | | September 30, | |
| | | 2019 | | | 2018 | | | 2017 | | | 2016 | | | 2015 (1) | |
| Net asset value, beginning of period | | $ | 12.54 | | | $ | 11.77 | | | $ | 11.90 | | | $ | 11.88 | | | $ | 12.35 | |
| Activity from investment operations: | | | | | | | | | | | | | | | | | | | | |
| Net investment income/(loss) (2) | | | 0.03 | | | | (0.11 | ) | | | (0.10 | ) | | | (0.11 | ) | | | (0.02 | ) |
| Net realized and unrealized gain/(loss) on investments | | | (1.21 | ) | | | 0.88 | | | | (0.03 | ) | | | 0.13 | | | | (0.45 | ) |
| Total from investment operations | | | (1.18 | ) | | | 0.77 | | | | (0.13 | ) | | | 0.02 | | | | (0.47 | ) |
| Less distributions from: | | | | | | | | | | | | | | | | | | | | |
| Net investment income | | | (0.05 | ) | | | — | | | | — | | | | — | | | | — | |
| Net realized gains | | | (0.05 | ) | | | — | | | | — | | | | — | | | | — | |
| Total distributions | | | (0.10 | ) | | | — | | | | — | | | | — | | | | — | |
| Net asset value, end of period | | $ | 11.26 | | | $ | 12.54 | | | $ | 11.77 | | | $ | 11.90 | | | $ | 11.88 | |
| Total return (3) | | | (9.40 | )% | | | 6.54 | % | | | (1.09 | )% | | | 0.17 | % | | | (3.81 | )% |
| Net assets, at end of period (000’s) | | $ | 5,048 | | | $ | 5,799 | | | $ | 1,181 | | | $ | 3,678 | | | $ | 129 | |
| Ratio of net expenses to average net assets (including interest expense) (4,5,8,9) | | | 2.10 | % | | | 2.10 | % (10) | | | 1.42 | % | | | 1.36 | % | | | 1.57 | % (6) |
| Ratio of net investment income/(loss) to average net assets | | | 0.25 | % | | | (0.90 | )% | | | (0.88 | )% | | | (0.96 | )% | | | (1.41 | )% (6) |
| Portfolio Turnover Rate | | | 36 | % | | | 13 | % | | | 0 | % | | | 0 | % | | | 0 | % (7) |
| (1) | The Equinox Chesapeake Strategy Fund Class A shares commenced operations on August 21, 2015. |
| (2) | Per share amounts calculated using the average shares method, which more appropriately presents the per share data for the period. |
| (3) | Total returns are historical and assume changes in share price and reinvestment of dividends and distributions. Total returns for periods of less than one year are not annualized. Total returns shown exclude the effect of maximum applicable sales charge of 5.75% and wire redemption fees, if applicable. Total returns would be lower absent fee waivers. Total returns would have been higher absent the recapture in 2018. |
| (4) | Represents the ratio of expenses to average net assets net of fee waivers, expense reimbursements and/or waived fees recaptured by the Advisor. Had these waivers not been in place, the expense ratio would have been: | | | 2.24 | % | | | 2.04 | % (11) | | | 1.86 | % | | | 1.43 | % | | | 1.73 | % (6) |
| (5) | Does not include the expenses of other investment companies in which the Fund invests, if any. |
| (8) | Ratio of gross expenses to average net assets (excluding interest expense) (4,5) | | | 2.24 | % | | | 2.04 | % (11) | | | 1.86 | % | | | 1.42 | % | | | 1.51 | % (6) |
| | | | | | | | | | | | | | | | | | | | | | |
| (9) | Ratio of net expenses to average net assets (excluding interest expense) (5) | | | 2.10 | % | | | 2.10 | % (10) | | | 1.42 | % | | | 1.35 | % | | | 1.35 | % (6) |
| (10) | Represents the ratio of expenses to average net assets inclusive of the Advisor’s recapture of waived/reimbursed fees from prior periods. |
| (11) | Excludes the impact of the Advisor’s recapture of waived/reimbursed fees from prior periods. |
See accompanying notes to consolidated financial statements.
| Equinox Chesapeake Strategy Fund |
| CONSOLIDATED FINANCIAL HIGHLIGHTS |
Per Share Data and Ratios for a Share of Beneficial Interest Outstanding Throughout Each Period
| | | Class C | |
| | | Year Ended | | | Year Ended | | | Year Ended | | | Year Ended | | | Period Ended | |
| | | September 30, | | | September 30, | | | September 30, | | | September 30, | | | September 30, | |
| | | 2019 | | | 2018 | | | 2017 | | | 2016 | | | 2015 (1) | |
| Net asset value, beginning of period | | $ | 12.26 | | | $ | 11.59 | | | $ | 11.81 | | | $ | 11.87 | | | $ | 12.35 | |
| Activity from investment operations: | | | | | | | | | | | | | | | | | | | | |
| Net investment loss (2) | | | (0.05 | ) | | | (0.20 | ) | | | (0.19 | ) | | | (0.20 | ) | | | (0.03 | ) |
| Net realized and unrealized gain/(loss) on investments | | | (1.18 | ) | | | 0.87 | | | | (0.03 | ) | | | 0.14 | | | | (0.45 | ) |
| Total from investment operations | | | (1.23 | ) | | | 0.67 | | | | (0.22 | ) | | | (0.06 | ) | | | (0.48 | ) |
| Less distributions from: | | | | | | | | | | | | | | | | | | | | |
| Net realized gains | | | (0.05 | ) | | | — | | | | — | | | | — | | | | — | |
| Net asset value, end of period | | $ | 10.98 | | | $ | 12.26 | | | $ | 11.59 | | | $ | 11.81 | | | $ | 11.87 | |
| Total return (3) | | | (10.04 | )% | | | 5.78 | % | | | (1.86 | )% | | | (0.51 | )% | | | (3.89 | )% |
| Net assets, at end of period (000’s) | | $ | 592 | | | $ | 931 | | | $ | 514 | | | $ | 359 | | | $ | 2 | |
| Ratio of net expenses to average net assets (including interest expense) (4,5,8,9) | | | 2.85 | % | | | 2.85 | % (10) | | | 2.24 | % | | | 2.11 | % | | | 2.32 | % (6) |
| Ratio of net investment loss to average net assets | | | (0.49 | )% | | | (1.65 | )% | | | (1.68 | )% | | | (1.70 | )% | | | (2.16 | )% (6) |
| Portfolio Turnover Rate | | | 36 | % | | | 13 | % | | | 0 | % | | | 0 | % | | | 0 | % (7) |
| (1) | The Equinox Chesapeake Strategy Fund Class C commenced operations on August 21, 2015. |
| (2) | Per share amounts calculated using the average shares method, which more appropriately presents the per share data for the period. |
| (3) | Total returns are historical and assume changes in share price and reinvestment of dividends and distributions. Total returns for periods of less than one year are not annualized. Total returns would be lower absent fee waivers. Total returns would have been higher absent the recapture in 2018. |
| (4) | Represents the ratio of expenses to average net assets net of fee waivers, expense reimbursements and/or waived fees recaptured by the Advisor. Had these waivers not been in place, the expense ratio would have been: | | | 2.99 | % | | | 2.81 | % (11) | | | 2.90 | % | | | 2.16 | % | | | 2.35 | % (6) |
| (5) | Does not include the expenses of other investment companies in which the Fund invests, if any. |
| (8) | Ratio of gross expenses to average net assets (excluding interest expense) (4,5) | | | 2.99 | % | | | 2.81 | % (11) | | | 2.90 | % | | | 2.16 | % | | | 2.13 | % (6) |
| | | | | | | | | | | | | | | | | | | | | | |
| (9) | Ratio of net expenses to average net assets (excluding interest expense) (5) | | | 2.85 | % | | | 2.85 | % (10) | | | 2.24 | % | | | 2.10 | % | | | 2.10 | % (6) |
| (10) | Represents the ratio of expenses to average net assets inclusive of the Advisor’s recapture of waived/reimbursed fees from prior periods. |
| (11) | Excludes the impact of the Advisor’s recapture of waived/reimbursed fees from prior periods. |
See accompanying notes to consolidated financial statements.
| Equinox Chesapeake Strategy Fund |
| CONSOLIDATED FINANCIAL HIGHLIGHTS |
Per Share Data and Ratios for a Share of Beneficial Interest Outstanding Throughout Each Period
| | | Class I(1) | |
| | | Year Ended | | | Year Ended | | | Year Ended | | | Year Ended | | | Year Ended | |
| | | September 30, | | | September 30, | | | September 30, | | | September 30, | | | September 30, | |
| | | 2019 | | | 2018 | | | 2017 | | | 2016 | | | 2015 | |
| Net asset value, beginning of period | | $ | 12.65 | | | $ | 11.83 | | | $ | 11.93 | | | $ | 11.88 | | | $ | 13.14 | |
| Activity from investment operations: | | | | | | | | | | | | | | | | | | | | |
| Net investment income/(loss) (2) | | | 0.05 | | | | (0.08 | ) | | | (0.08 | ) | | | (0.09 | ) | | | (0.13 | ) |
| Net realized and unrealized gain/(loss) on investments | | | (1.22 | ) | | | 0.90 | | | | (0.02 | ) | | | 0.14 | | | | 1.20 | (3) |
| Total from investment operations | | | (1.17 | ) | | | 0.82 | | | | (0.10 | ) | | | 0.05 | | | | 1.07 | |
| Capital contribution by swap counterparty | | | — | | | | — | | | | — | | | | — | | | | 0.11 | (11) |
| Less distributions from: | | | | | | | | | | | | | | | | | | | | |
| Net investment income | | | (0.08 | ) | | | — | | | | — | | | | — | | | | (2.41 | ) |
| Net realized gains | | | (0.05 | ) | | | — | | | | — | | | | — | | | | (0.03 | ) |
| Total distributions | | | (0.13 | ) | | | — | | | | — | | | | — | | | | (2.44 | ) |
| Net asset value, end of period | | $ | 11.35 | | | $ | 12.65 | | | $ | 11.83 | | | $ | 11.93 | | | $ | 11.88 | |
| Total return (4) | | | (9.23 | )% | | | 6.93 | % | | | (0.84 | )% | | | 0.42 | % | | | 9.76 | % |
| Net assets, at end of period (000’s) | | $ | 90,105 | | | $ | 158,876 | | | $ | 51,427 | | | $ | 58,438 | | | $ | 27,418 | |
| Ratio of net expenses to average net assets (including interest expense) (5,6,7,8) | | | 1.85 | % | | | 1.85 | % (9) | | | 1.24 | % | | | 1.11 | % | | | 1.15 | % |
| Ratio of net investment income/(loss) to average net assets | | | 0.49 | % | | | (0.60 | )% | | | (0.68 | )% | | | (0.74 | )% | | | (1.05 | )% |
| Portfolio Turnover Rate | | | 36 | % | | | 13 | % | | | 0 | % | | | 0 | % | | | 0 | % |
| (1) | The Equinox Chesapeake Strategy Fund Class I shares commenced operations on April 19, 2012. |
| (2) | Per share amounts calculated using the average shares method, which more appropriately presents the per share data for the period. |
| (3) | Realized and unrealized gains per share in this caption are balancing amounts necessary to reconcile the change in net asset value per share for the period, and may not reconcile with the aggregate gains and losses in the statement of operations due to the timing of share transactions for the period. |
| (4) | Total returns are historical and assume changes in share price and reinvestment of dividends and distributions. Total returns for periods of less than one year are not annualized. Total returns would be lower absent fee waivers. Total returns would have been higher absent the recapture in 2018. |
| (5) | Represents the ratio of expenses to average net assets net of fee waivers, expense reimbursements and/or waived fees recaptured by the Advisor. Had these waivers not been in place, the expense ratio would have been: | | | 1.98 | % | | | 1.81 | % (10) | | | 1.87 | % | | | 1.18 | % | | | 1.42 | % |
| (6) | Does not include the expenses of other investment companies in which the Fund invests, if any. |
| (7) | Ratio of gross expenses to average net assets (excluding interest expense) (5,6) | | | 1.98 | % | | | 1.81 | % (10) | | | 1.87 | % | | | 1.17 | % | | | 1.38 | % |
| | | | | | | | | | | | | | | | | | | | | | |
| (8) | Ratio of net expenses to average net assets (excluding interest expense) (6) | | | 1.85 | % | | | 1.85 | % (9) | | | 1.24 | % | | | 1.10 | % | | | 1.10 | % |
| (9) | Represents the ratio of expenses to average net assets inclusive of the Advisor’s recapture of waived/reimbursed fees from prior periods. |
| (10) | Excludes the impact of the Advisor’s recapture of waived/reimbursed fees from prior periods. |
| (11) | On February 19, 2015, the Fund received notification from DeutscheBank, the Swap Counterparty, that the management and incentive fees within the swap were calculated incorrectly from December 13, 2013 through February 18, 2015 which caused the Fund to be undervalued. This resulted in a NAV error which compounded over the period to a maximum amount of $0.45 per share. DeutscheBank adjusted the value of the swap by $20,490 on February 19, 2015 and a receivable was put on the books of the Fund to account for losses due to shareholder activity during the period. On March 6, 2015, the Fund’s transfer agent reprocessed redemption activity. The losses due to subscription activity and the reprocessed redemption activity amounted to $219,330, all of which was reimbursed by DeutscheBank. |
See accompanying notes to consolidated financial statements.
| Equinox Chesapeake Strategy Fund |
| NOTES TO CONSOLIDATED FINANCIAL STATEMENTS |
| September 30, 2019 |
The Equinox Chesapeake Strategy Fund (“Chesapeake Strategy”) (the “Fund”) is a non-diversified series of shares of beneficial interest of Equinox Funds Trust (the “Trust”), a statutory trust organized under the laws of the State of Delaware on June 2, 2010, and is registered under the Investment Company Act of 1940, as amended (the “1940 Act”), as an open-end management investment company. The investment objective of the Fund is to achieve long term capital appreciation.
Chesapeake Strategy offers Class A shares, Class C shares, and Class I shares. Chesapeake Strategy Class C shares and Class I shares are offered at net asset value. Chesapeake Strategy Class A shares are offered at net asset value plus a maximum sales charge of 5.75%. A contingent deferred sales charge (“CDSC”) of 1.00% is assessed on certain redemptions of Chesapeake Strategy Class A shares made within 12 months after a purchase of Chesapeake Strategy Class A shares where no initial sales charge was paid at the time of purchase as part of an investment of $1,000,000 or more. A CDSC of 1.00% is assessed on redemptions of Chesapeake Strategy Class C shares made within one year after a purchase of such shares. Each class represents an interest in the same assets of the Fund and classes are identical except for differences in their sales charge structures and ongoing service and distribution charges. All classes of shares have equal voting privileges except that each class has exclusive voting rights with respect to its service and/or distribution plans. The Fund’s income, expenses (other than class specific distribution fees) and realized and unrealized gains and losses are allocated proportionately each day based upon the relative net assets of each class.
The Trust’s Board of Trustees approved an Agreement and Plan of Reorganization (“Plan”) that provided for the reorganization (“Reorganization”) of the Fund into the AXS Chesapeake Strategy Fund (the “Successor Fund”), a series of the Investment Managers Series Trust II. The Plan was approved by the Fund’s shareholders on November 6, 2019, and the Reorganization subsequently occurred on November 8, 2019, at which time each shareholder’s investment in the Fund was exchanged for an investment with an equal aggregate net asset value in the Successor Fund.
The Reorganizations is generally not expected to result in the recognition of gain or loss by the Fund or its shareholders for federal income tax purposes.
| 2. | SIGNIFICANT ACCOUNTING POLICIES |
The following is a summary of significant accounting policies followed by the Fund in preparation of its consolidated financial statements. The policies are in conformity with accounting principles generally accepted in the United States of America (“GAAP”). The preparation of the consolidated financial statements requires management to make estimates and assumptions that affect the reported amounts of assets and liabilities and disclosure of contingent assets and liabilities at the date of the consolidated financial statements and the reported amounts of income and expenses for the period. Actual results could differ from those estimates. The Fund is an investment company and accordingly follows the investment company accounting and reporting guidance of the Financial Accounting Standards Board (“FASB”) Accounting Standard Codification Topic 946 “Financial Services – Investment Companies” including FASB Accounting Standard Update ASU 2013-08.
| Equinox Chesapeake Strategy Fund |
| NOTES TO CONSOLIDATED FINANCIAL STATEMENTS (Continued) |
| September 30, 2019 |
Security Valuation – Securities, including exchange traded funds, listed on an exchange are valued at the last reported sale price at the close of the regular trading session of the exchange on the business day the value is being determined, or in the case of securities listed on NASDAQ at the NASDAQ Official Closing Price (“NOCP”). In the absence of a sale, such securities shall be valued at the mean between the current bid and ask prices on the primary exchange on the day of valuation. Debt securities (other than short-term obligations) are valued each day by an independent pricing service approved by the Board of Trustees (the “Board”) using methods which include current market quotations from a major market maker in the securities and based on methods which include the consideration of yields or prices of securities of comparable quality, coupon, maturity and type. Futures shall be valued at the final settlement price (typically 4:00 P.M. Eastern Time) on the valuation date. Short-term debt obligations having 60 days or less remaining until maturity, at time of purchase, may be valued at amortized cost. Investments in open-end investment companies, if any, are valued at net asset value.
The Fund may hold securities, such as private investments, interests in commodity pools, other non-traded securities or temporarily illiquid securities, for which market quotations are not readily available or are determined to be unreliable. These securities will be valued using the “fair value” procedures approved by the Board. The Board has delegated execution of these procedures to a fair value committee composed of one or more representatives from each of the (i) Trust, (ii) administrator, and (iii) Advisor. The committee may also enlist third party consultants such as a valuation specialist at a public accounting firm, valuation consultant or financial officer of a security issuer on an as-needed basis to assist in determining a security-specific fair value. The Board reviews and ratifies the execution of this process and the resultant fair value prices at least quarterly to assure the process produces reliable results.
Fair Valuation Process – As noted above, the fair value committee is composed of one or more representatives from each of the (i) Trust, (ii) administrator, and (iii) Advisor. The applicable investments are valued collectively via inputs from each of these groups. For example, fair value determinations are required for the following securities: (i) securities for which market quotations are insufficient or not readily available on a particular business day (including securities for which there is a short and temporary lapse in the provision of a price by the regular pricing source), (ii) securities for which, in the judgment of the Advisor, the prices or values available do not represent the fair value of the instrument. Factors which may cause the Advisor to make such a judgment include, but are not limited to, the following: only a bid price or an ask price is available; the spread between bid and ask prices is substantial; the frequency of sales; the thinness of the market; the size of reported trades; and actions of the securities markets, such as the suspension or limitation of trading; (iii) securities determined to be illiquid; (iv) securities with respect to which an event that will affect the value thereof has occurred (a “significant event”) since the closing prices were established on the principal exchange on which they are traded, but prior to the Fund’s calculation of its net asset value. Specifically, interests in commodity pools or managed futures pools are valued on a daily basis by reference to the closing market prices of each futures contract or other asset held by a pool, as adjusted for pool expenses. Restricted or illiquid securities, such as private investments or non-traded securities are valued via inputs from the Advisor based upon the current bid for the security from two or more independent dealers or other parties reasonably familiar with the facts and circumstances of the security (who should take into consideration all relevant factors as may be appropriate under the
| Equinox Chesapeake Strategy Fund |
| NOTES TO CONSOLIDATED FINANCIAL STATEMENTS (Continued) |
| September 30, 2019 |
circumstances). If the Advisor is unable to obtain a current bid from such independent dealers or other independent parties, the fair value committee shall determine the fair value of such security using the following factors: (i) the type of security; (ii) the cost at date of purchase; (iii) the size and nature of the Fund’s holdings; (iv) the discount from market value of unrestricted securities of the same class at the time of purchase and subsequent thereto; (v) information as to any transactions or offers with respect to the security; (vi) the nature and duration of restrictions on disposition of the security and the existence of any registration rights; (vii) how the yield of the security compares to similar securities of companies of similar or equal creditworthiness; (viii) the level of recent trades of similar or comparable securities; (ix) the liquidity characteristics of the security; (x) current market conditions; and (xi) the market value of any securities into which the security is convertible or exchangeable. The Fund utilizes various methods to measure the fair value of all of its investments on a recurring basis. GAAP establishes a hierarchy that prioritizes inputs to valuation methods. The three levels of input are:
Level 1 – Unadjusted quoted prices in active markets for identical assets and liabilities that the Fund has the ability to access.
Level 2 – Observable inputs other than quoted prices included in Level 1 that are observable for the asset or liability, either directly or indirectly. These inputs may include quoted prices for the identical instrument in an inactive market, prices for similar instruments, interest rates, prepayment speeds, credit risk, yield curves, default rates and similar data.
Level 3 – Unobservable inputs for the asset or liability, to the extent relevant observable inputs are not available, representing the Fund’s own assumptions about the assumptions a market participant would use in valuing the asset or liability, and would be based on the best information available.
The availability of observable inputs can vary from security to security and is affected by a wide variety of factors, including, for example, the type of security, whether the security is new and not yet established in the marketplace, the liquidity of markets, and other characteristics particular to the security. To the extent that valuation is based on models or inputs that are less observable or unobservable in the market, the determination of fair value requires more judgment. Accordingly, the degree of judgment exercised in determining fair value is greatest for instruments categorized in Level 3.
The inputs used to measure fair value may fall into different levels of the fair value hierarchy. In such cases, for disclosure purposes, the level in the fair value hierarchy within which the fair value measurement falls in its entirety, is determined based on the lowest level input that is significant to the fair value measurement in its entirety.
| Equinox Chesapeake Strategy Fund |
| NOTES TO CONSOLIDATED FINANCIAL STATEMENTS (Continued) |
| September 30, 2019 |
The inputs or methodology used for valuing securities are not necessarily an indication of the risk associated with investing in those securities. The following tables summarize the inputs used as of September 30, 2019 for the Funds’ assets and liabilities measured at fair value:
| Assets | | Level 1 | | | Level 2 | | | Level 3 | | | Total | |
| U.S. Treasury Notes | | $ | — | | | $ | 87,108,322 | | | $ | — | | | $ | 87,108,322 | |
| Futures Contracts* | | | 1,236,810 | | | | — | | | | — | | | | 1,236,810 | |
| Total | | $ | 1,236,810 | | | $ | 87,108,322 | | | $ | — | | | $ | 88,345,132 | |
| * | Represents net appreciation/(depreciation) on futures contracts is reported in the above table. |
The Fund did not hold any Level 3 securities during the period.
See Consolidated Portfolio of Investments for more information related to the Fund’s investments.
Consolidation of Subsidiary –The Consolidated Financial Statements of the Fund with its subsidiary Equinox Chesapeake Strategy Fund Limited (“ECS-CFC”) include the accounts of ECS-CFC (the “CFC”) as a wholly-owned and controlled foreign corporation. All inter-company accounts and transactions have been eliminated in consolidation.
The Fund may invest approximately 25% of its total assets in its CFC which acts as an investment vehicle in order to effect certain investments consistent with the Fund’s investment objectives and policies.
ECS-CFC utilizes futures contracts to facilitate the pursuit of its investment objective. In accordance with its investment objectives and through its exposure, the Fund may have increased or decreased exposure to one or more of the risk factors defined in the Principal Investment Risks section of the Fund’s prospectus. A summary of the Fund’s investment in the CFC is as follows:
| | | CFC Net Assets at | % Of the Fund’s Total Net Assets |
| | Inception Date of CFC | September 30, 2019 | at September 30, 2019 |
| ECS-CFC | 4/19/2012 | $ 3,369,014 | 3.52% |
For tax purposes, the CFC is an exempted Cayman investment company. The CFC has received an undertaking from the Government of the Cayman Islands exempting it from all local income, profits and capital gains taxes. No such taxes are levied in the Cayman Islands at the present time. For U.S. income tax purposes, the CFC is a controlled foreign corporations and as such is not subject to U.S. income tax. However, as a wholly-owned controlled foreign corporation, the CFC’s net income and capital gains, to the extent of its earnings and profits, will be included each year in the Fund’s investment company taxable income.
Market Risk – Market risk is the risk that changes in interest rates, foreign exchange rates, or equity prices will affect the positions held by the Fund. The Fund is exposed to market risk on financial instruments that are valued at market prices as disclosed in the schedule of investments. The prices of derivative instruments, including options, forwards, and futures prices, can be highly volatile. Price movements of derivative contracts in which the Fund’s assets may be invested are influenced by, among
| Equinox Chesapeake Strategy Fund |
| NOTES TO CONSOLIDATED FINANCIAL STATEMENTS (Continued) |
| September 30, 2019 |
other things, interest rates, changing supply and demand relationships, trade, fiscal, monetary and exchange control programs and policies of governments, and national and international political and economic events and policies. The Fund is exposed to market risk on derivative contracts in that the Fund may not be able to readily dispose of its holdings when it chooses and also that the price obtained on disposal is below that at which the investment is included in the Fund’s consolidated financial statements. All financial instruments are recognized at fair value, and all changes in market conditions directly affect net income. The Fund’s investments in derivative instruments are exposed to market risk and are disclosed in the consolidated portfolio of investments.
Credit Risk – Credit risk relates to the ability of the issuer to meet interest and principal payments, or both, as they come due. In general, lower-grade, higher-yield bonds are subject to credit risk to a greater extent than lower-yield, higher-quality bonds.
Counterparty Risk – Counterparty risk, including swap counterparty risk, is the risk that the counterparty to a financial instrument will cause a financial loss for the Fund by failing to discharge an obligation. A concentration of counterparty risk exists in that part of the Fund’s cash is held at the broker. The Fund could be unable to recover assets held at the broker, including assets directly traceable to the Fund, in the event of the broker’s bankruptcy. The Fund does not anticipate any material losses as a result of this concentration.
Security Transactions and Related Income – Security transactions are accounted for on trade date basis. Interest income is recognized on an accrual basis. Discounts are accreted and premiums are amortized on securities purchased over the lives of the respective securities. Dividend income is recorded on the ex-dividend date. Realized gains or losses from sales of securities are determined by comparing the identified cost of the security lot sold with the net sales proceeds.
Dividends and Distributions to Shareholders –Dividends from net investment income, if any, are declared and paid at least annually. Distributable net realized capital gains, if any, are declared and distributed annually. Dividends from net investment income and distributions from net realized gains are determined in accordance with federal income tax regulations, which may differ from GAAP. These “book/tax” differences are considered either temporary (i.e., deferred losses, capital loss carry forwards) or permanent in nature. To the extent these differences are permanent in nature, such amounts are reclassified within the composition of net assets based on their federal tax-basis treatment; temporary differences do not require reclassification. Dividends and distributions to shareholders are recorded on ex-dividend date.
Cash and Cash Equivalents –Cash and cash equivalents include cash and overnight investments in interest-bearing demand deposits with a financial institution with original maturities of three months or less. The Fund maintains deposits with a high quality financial institution in an amount that is in excess of federally insured limits.
Federal Income Taxes – The Fund intends to continue to comply with the requirements of the Internal Revenue Code of 1986, as amended, applicable to regulated investment companies and to distribute all of its taxable income to its shareholders. Therefore, no provision for Federal income tax is required. The Fund recognizes the tax benefits of uncertain tax positions only where the position is
| Equinox Chesapeake Strategy Fund |
| NOTES TO CONSOLIDATED FINANCIAL STATEMENTS (Continued) |
| September 30, 2019 |
“more likely than not” to be sustained assuming examination by tax authorities. Management has analyzed the Fund’s tax positions and has concluded that no liability for unrecognized tax benefits should be recorded related to uncertain tax positions taken on returns filed for open tax years 2016-2018, or expected to be taken in the Fund’s 2019 tax returns.
The Fund identifies its major tax jurisdictions as U.S. Federal, Colorado and foreign jurisdictions where the Fund makes significant investments; however, the Fund is not aware of any tax positions for which it is reasonably possible that the total amounts of unrecognized tax benefits will change materially in the next twelve months.
Allocation of Expenses –Expenses incurred by the Trust that do not relate to a specific fund of the Trust are allocated to the individual funds based on each Fund’s relative net assets or another appropriate basis. Expenses specifically attributable to a particular Fund in the Trust are borne by that Fund. Other expenses are allocated to each Fund based on its net assets in relation to the total net assets of all the applicable Funds in the Trust or another reasonable basis.
Foreign Currency Transactions –All assets and liabilities denominated in foreign currencies are translated into U.S. dollars based on the rate of exchange of such currencies against U.S. dollars on the date of valuation. Purchases and sales of securities and income and expenses are translated at the rate of exchange quoted on the respective date that such transactions are recorded. Such fluctuations are included with the net realized and unrealized gain or loss on investments.
Futures Contracts –The Fund may purchase or sell futures contracts to gain exposure to, or hedge against, changes in the value of equities, interest rates, foreign currencies or commodities. Initial margin deposits required upon entering into futures contracts are satisfied by the segregation of specific securities or cash as collateral for the account of the broker (the Fund’s agent in acquiring the futures position). During the period the futures contracts are open, changes in the value of the contracts are recognized as unrealized gains or losses by “marking to market” on a daily basis to reflect the market value of the contracts at the end of each day’s trading. Variation margin payments are received or made depending upon whether unrealized gains or losses are incurred. When the contracts are closed, the Fund recognizes a realized gain or loss equal to the difference between the proceeds from, or cost of, the closing transaction and the Fund’s basis in the contract. If the Fund was unable to liquidate a futures contract and/or enter into an offsetting closing transaction, the Fund would continue to be subject to market risk with respect to the value of the contracts and continue to be required to maintain the margin deposits on the futures contracts. The Fund segregates liquid securities or cash equivalents having a value at least equal to the amount of the current obligation under any open futures contract. Risks may exceed amounts recognized in the Statement of Assets and Liabilities. With futures, there is minimal counterparty credit risk to the Fund since futures are exchange traded and the exchange’s clearinghouse, as counterparty to all exchange traded futures, guarantees the futures against default.
During the period of this report, the Fund traded various futures contracts in a manner consistent with its investment strategy. The Fund is permitted to use derivatives to gain exposure to the asset class and for risk management purposes, including to gain exposure to various markets in a cost efficient
| Equinox Chesapeake Strategy Fund |
| NOTES TO CONSOLIDATED FINANCIAL STATEMENTS (Continued) |
| September 30, 2019 |
manner, to reduce transaction costs or to remain fully invested. The Fund may also invest in derivatives to protect from broad fluctuations in market prices, interest rates or foreign currency exchange rates (a practice known as “hedging”).
For the year ended September 30, 2019, the net change in unrealized depreciation on futures contracts amounted to $4,844,385 for the Fund. For the year ended September 30, 2019, the Fund had a net realized loss of $14,462,307 from futures contracts.
Impact of Derivatives on the Consolidated Statement of Assets and Liabilities and Consolidated Statement of Operations
The following is a summary of the location of derivative investments on the Fund’s Consolidated Statement of Assets and Liabilities as of September 30, 2019:
| Location on the Consolidated Statement of Assets and Liabilities |
| Derivatives Investment Type | Asset Derivatives |
Equity/Currency/
Commodity/
Interest Rate Contracts | Unrealized appreciation
on futures contracts |
The following table sets forth the fair value of the Fund’s futures contracts by primary risk exposure as of September 30, 2019:
| Futures Contracts Fair Value |
| | | | | | | | | | | | | | | Total as of | |
| | | Commodity | | | Currency | | | Equity | | | Interest Rate | | | September 30, 2019 | |
| Futures Contracts | | $ | 136,504 | | | $ | 1,097,308 | | | $ | 393,355 | | | $ | (390,357 | ) | | $ | 1,236,810 | |
The following is a summary of the location of derivative investments on the Fund’s Consolidated Statement of Operations for the year ended September 30, 2019.
| Location on the Consolidated Statement of Operations |
| Derivatives Investment Type | Location of Loss on Derivatives |
| Equity/Currency/ Commodity/ Interest Rate Contracts | Net change in unrealized appreciation/ (depreciation) on futures contracts;Net realized gain/(loss) on futures contracts |
| Equinox Chesapeake Strategy Fund |
| NOTES TO CONSOLIDATED FINANCIAL STATEMENTS (Continued) |
| September 30, 2019 |
The following is a summary of the Fund’s realized and unrealized gain/(loss) on futures contracts recognized in the Consolidated Statement of Operations categorized by primary risk exposure for the year ended September 30, 2019:
| Net Change in unrealized appreciation/(depreciation) on derivatives recognized in the Consolidated Statement of Operations |
| | | | | | | | | | | | | | | Total for the | |
| | | | | | | | | | | | | | | year ended | |
| Derivative Investment Type | | Commodity | | | Currency | | | Equity | | | Interest Rate | | | September 30, 2019 | |
| Futures | | $ | (3,737,461 | ) | | $ | 2,415,366 | | | $ | (1,832,650 | ) | | $ | (1,689,640 | ) | | $ | (4,844,385 | ) |
| | | | | | | | | | | | | | | | | | | | | |
| Realized gain/(loss) on derivatives recognized in the Consolidated Statement of Operations |
| | | | | | | | | | | | | | | Total for the | |
| | | | | | | | | | | | | | | year ended | |
| Derivative Investment Type | | Commodity | | | Currency | | | Equity | | | Interest Rate | | | September 30, 2019 | |
| Futures | | $ | (6,321,183 | ) | | $ | (3,344,713 | ) | | $ | (8,076,026 | ) | | $ | 3,279,615 | | | $ | (14,462,307 | ) |
The notional value of the derivative instruments outstanding as of September 30, 2019 as disclosed in the Consolidated Portfolio of Investments and the amounts of realized gains and losses and changes in unrealized depreciation on derivative instruments during the period as disclosed above and within the Consolidated Statement of Operations serve as indicators of the volume of derivative activity for the Fund.
Offsetting of Financial Assets and Derivative Assets
It is the Fund’s policy to recognize a net asset or liability equal to the unrealized appreciation/ (depreciation) and of futures contracts. During the year ended September 30, 2019, the Fund was subject to a master netting arrangement for the futures. The following table shows additional information regarding the offsetting of assets and liabilities at September 30, 2019. The Fund may mitigate credit risk with respect to OTC derivative counterparties through credit support annexes included with International Swaps and Derivatives Association, Inc. (“ISDA”) Master Agreements or other master netting agreements which are the standard contracts governing most derivative transactions between the Fund and its counterparties. These agreements may allow the Fund and a counterparty to offset certain derivative instruments’ payables and/or receivables against each other and/or with collateral, which is generally held by the Fund’s custodian. To the extent amounts due to the Fund from a counterparty are not fully collateralized contractually or otherwise, the Fund bears the risk of loss from counterparty non-performance.
| | | | | | | | | Gross Amounts Not Offset in the | | | | |
| | | | | | | | | Consolidated Statement of Assets & | | | | |
| Assets: | | | | | | | | Liabilities | | | | |
| | | | | | Gross Amounts | | | | | | | | | | | | | |
| | | | | | Offset in the | | | Net Amounts of | | | | | | | | | | |
| | | | | | Consolidated | | | Assets Presented in | | | | | | | | | | |
| | | | | | Statement of | | | the Consolidated | | | Cash or Financial | | | | | | | |
| | | Gross Amounts of | | | Assets & | | | Statement of Assets | | | Instruments | | | Receivable for | | | | |
| Description | | Recognized Assets | | | Liabilities | | | & Liabilities | | | Pledged (2) | | | Futures | | | Net Amount | |
Unrealized Appreciation on
futures contracts | | $ | 3,806,494 | (1) | | $ | (2,569,684 | ) (1) | | $ | 1,236,810 | | | $ | — | (3) | | $ | — | | | $ | 1,236,810 | |
| Total | | $ | 3,806,494 | | | $ | (2,569,684 | ) | | $ | 1,236,810 | | | $ | — | | | $ | — | | | $ | 1,236,810 | |
| (1) | See Consolidated Portfolio of Investments for breakout of gross unrealized appreciation & depreciation by futures contract. |
| (2) | Amounts (if any) relate to master netting agreements and collateral agreements (for example, ISDA) which have been determined by the Fund to be legally enforceable in the event of default and where certain other criteria are met in accordance with applicable offsetting accounting guidance. |
| (3) | No collateral amount is included in the table based on the derivative contracts maintaining an unrealized gain position. Total cash & treasury notes pledged to broker as collateral as of September 30, 2019 was $2,147,075 and $16,600,704, respectively. |
| Equinox Chesapeake Strategy Fund |
| NOTES TO CONSOLIDATED FINANCIAL STATEMENTS (Continued) |
| September 30, 2019 |
Indemnification – The Trust indemnifies its officers and trustees for certain liabilities that may arise from the performance of their duties to the Trust. Additionally, in the normal course of business, the Fund enters into contracts that contain a variety of representations and warranties and which provide general indemnities. The Fund’s maximum exposure under these arrangements is unknown, as this would involve future claims that may be made against the Fund that has not yet occurred. However, based on experience, the risk of loss due to these warranties and indemnities appears to be remote.
| 3. | INVESTMENT TRANSACTIONS |
For the year ended September 30, 2019, cost of purchases and proceeds from sales of portfolio securities, other than short-term investments and U.S. government securities, amounted to $32,222,942 and $83,544,742, respectively.
| 4. | INVESTMENT ADVISORY AGREEMENT AND TRANSACTIONS WITH RELATED PARTIES |
Equinox Institutional Asset Management LP serves as the Fund’s Investment Advisor (the “Advisor”). Pursuant to an Advisory Agreement with the Trust, on behalf of the Fund, the Advisor, under the oversight of the Board, directs the daily operations of the Fund and supervises the performance of administrative and professional services provided by others. As compensation for its services and the related expenses borne by the Advisor, the Fund pays the Advisor a management fee, computed and accrued daily and paid monthly, at an annual rate of 1.50% of the Fund’s average daily net assets. Pursuant to a sub-advisory agreement between the Advisor and Sub-Advisor, on behalf of the Fund, the Advisor, not the Fund, pays the Sub-Advisor a fee, which is computed and accrued daily and paid monthly. For the year ended September 30, 2019, the Advisor earned fees of $1,731,163.
The advisory fee payable for the year ended September 30, 2019 was amount of $103,133.
The Advisor has contractually agreed to reduce its compensation and/or reimburse certain expenses for the Fund, to the extent necessary to ensure that the Fund’s total operating expenses, excluding taxes, interest, extraordinary items, “Acquired Fund Fees and Expenses” and brokerage commissions, do not exceed the contractual limits set forth below (the “Expense Limitation”). The Expense Limitation with respect to the Fund will remain in place for the periods set forth below unless the Board of Trustees approves its earlier termination, subject to 60 days’ written notice to the Advisor. The Advisor shall be entitled to recover, subject to approval by the Board of Trustees of the Trust, such waived or reimbursed amounts for a period of up to three (3) years from the date on which the Advisor reduced its compensation and/or assumed expenses for the Fund. No recoupment will occur unless the Fund’s operating expenses are below the expense limitation amount.
| Equinox Chesapeake Strategy Fund |
| NOTES TO CONSOLIDATED FINANCIAL STATEMENTS (Continued) |
| September 30, 2019 |
| | | | | Contractual Limit on | | | | |
| | | | | Total Operating | | | | Termination |
| Fund | | Class | | Expenses | | Effective Date | | Date |
| Equinox | | A | | 2.10% | | Commencement | | January 31, |
| Chesapeake | | C | | 2.85% | | of Operations | | 2020 |
| Strategy Fund | | I | | 1.85% | | | | |
The Advisor may seek reimbursement only for expenses waived or paid by it during the three fiscal years prior to the date of such reimbursement; provided, however, that such expenses may only be reimbursed to the extent they were waived or paid after the date of the Expense Limitation (or any similar agreement). The Advisor is permitted to seek reimbursement from the Fund, subject to certain limitations, for fees it waived and Fund expenses it paid to the extent the total annual fund operating expenses for a Class of the Fund do not exceed the limits described above or any lesser limits in effect at the time of reimbursement or waiver. The Board may terminate this expense reimbursement arrangement at any time. Pursuant to the Expense Limitation, the Advisor may seek reimbursement for the following amounts through the expiration dates listed below:
| September 30, 2020 | | $ | 291,568 | |
| September 30, 2022 | | | 148,881 | |
For the year ended September 30, 2019, the Advisor waived $148,881 in advisory fees for Class A, Class C, and Class I.
As of September 30, 2019, $37,059 of previously waived fees expired without recoupment from the Advisor.
The distributor of the Fund is Northern Lights Distributors, LLC (“NLD” or the “Distributor”). The Trust, on behalf of the Fund, has adopted the Trust’s Distribution Plan. Pursuant to Rule 12b-1 under the 1940 Act (the “Plan”), to pay for certain distribution activities and shareholder services. The Plan provides that a monthly service and/or distribution fee is calculated by the Fund at an annual rate of 0.25% and 1.00% of the average daily net assets attributable to Class A shares and Class C shares, respectively, and is paid to the Distributor to provide compensation for ongoing distribution-related activities or services and/or maintenance of the Fund’s shareholder accounts, not otherwise required to be provided by the Advisor. The Plan is a compensation plan, which means that compensation is provided regardless of 12b-1 expenses incurred. The Plan further provides for periodic payments to brokers, dealers and other financial intermediaries, including insurance companies, for providing shareholder services and for promotional and other sales-related costs. During the year ended September 30, 2019, pursuant to the Plan, the Fund incurred $11,845 and $7,012 in 12b-1 fees for the Fund’s Class A and Class C shares, respectively.
| Equinox Chesapeake Strategy Fund |
| NOTES TO CONSOLIDATED FINANCIAL STATEMENTS (Continued) |
| September 30, 2019 |
The Distributor acts as the Fund’s principal underwriter in a continuous public offering of the Fund’s Class A, Class C, and Class I shares. For the year ended September 30, 2019, the Distributor received $17,457 and $651 in underwriting commissions for sales of Class A and Class C shares for the Fund, respectively, of which $2,534 and $166 were retained by the principal underwriter or other affiliated broker-dealers.
In addition, certain affiliates of the Distributor provide services to the Fund as follows:
Gemini Fund Services, LLC (“GFS”), an affiliate of the Distributor, provides administration, fund accounting, and transfer agent services to the Trust. Pursuant to a servicing agreement with GFS, the Fund pays GFS customary fees for providing administration, fund accounting, and transfer agency services to the Fund.
BluGiant, LLC (“BluGiant”), an affiliate of GFS and the Distributor, provides EDGAR conversion and filing services as well as print management services for the Fund on an ad-hoc basis. For the provision of these services, BluGiant receives customary fees from the Fund.
On February 1, 2019, NorthStar Financial Services Group, LLC, the parent company of GFS and its affiliated companies including NLD, NLCS and Blu Giant (collectively, the “Gemini Companies”), sold its interest in the Gemini Companies to a third party private equity firm that contemporaneously acquired Ultimus Fund Solutions, LLC (an independent mutual fund administration firm) and its affiliates (collectively, the “Ultimus Companies”). As a result of these separate transactions, the Gemini Companies and the Ultimus Companies are now indirectly owned through a common parent entity, The Ultimus Group, LLC.
| 5. | AGGREGATE UNREALIZED APPRECIATION AND DEPRECIATION – TAX BASIS |
The identified cost of investments in securities owned by the Fund for federal income tax purposes, and its respective gross unrealized appreciation and depreciation at September 30, 2019, were as follows:
| | | | Gross | | | Gross | | | Net | |
| Tax | | | Unrealized | | | Unrealized | | | Unrealized | |
| Cost | | | Appreciation | | | Depreciation | | | Appreciation | |
| $ | 87,616,481 | | | $ | 1,971,126 | | | $ | (1,242,475 | ) | | $ | 728,651 | |
| Equinox Chesapeake Strategy Fund |
| NOTES TO CONSOLIDATED FINANCIAL STATEMENTS (Continued) |
| September 30, 2019 |
| 6. | DISTRIBUTIONS AND TAX COMPONENTS OF CAPITAL |
The tax character of fund distributions paid for the years ended September 30, 2019 and September 30, 2018 was as follows:
| | | Fiscal Year Ended | | | Fiscal Year Ended | |
| | | September 30, 2019 | | | September 30, 2018 | |
| Ordinary Income | | $ | 1,698,338 | | | $ | — | |
| Long-Term Capital Gain | | | — | | | | — | |
| Return of Capital | | | — | | | | — | |
| | | $ | 1,698,338 | | | $ | — | |
As of September 30, 2019, the components of accumulated earnings/(deficit) on a tax basis were as follows:
| Undistributed | | | Undistributed | | | Post October Loss | | | Capital Loss | | | Other | | | Unrealized | | | Total | |
| Ordinary | | | Long-Term | | | and | | | Carry | | | Book/Tax | | | Appreciation/ | | | Accumulated | |
| Income | | | Gains | | | Late Year Loss | | | Forwards | | | Differences | | | (Depreciation) | | | Earnings/(Deficits) | |
| $ | 2,940,265 | | | $ | — | | | $ | — | | | $ | (10,103,193 | ) | | $ | (10,485,235 | ) | | $ | 710,200 | | | $ | (16,937,963 | ) |
The differences between book basis and tax basis unrealized appreciation, accumulated net investment income/ (loss) and accumulated net realized losses from investments are primarily attributable to the mark-to-market on open futures contracts, and adjustments for the Fund’s wholly owned subsidiaries. The unrealized appreciation in the table above includes unrealized foreign currency losses of $18,451.
At September 30, 2019, the Fund had capital loss carry forwards for federal income tax purposes available to offset future capital gains as follows:
| Non-Expiring | | | Non-Expiring | | | | |
| Short-Term | | | Long-Term | | | Total | |
| $ | 9,040,131 | | | $ | 1,063,062 | | | $ | 10,103,193 | |
The beneficial ownership, either directly or indirectly, of more than 25% of the voting securities of the Fund creates presumption of control of the Fund, under Section 2(a) 9 of the Act. As of September 30, 2019, the omnibus shareholder account with ownership in excess of 25% is as follows:
| Omnibus Shareholder Account | | % of Outstanding Shares |
| National Financial Services, LLC | | 50% |
The Trust has no knowledge as to whether all or any portion of the shares owned of record are also owned beneficially.
| 8. | NEW ACCOUNTING PRONOUNCEMENTS |
In August 2018, the FASB issued Accounting Standards Update (“ASU”) No. 2018-13, which changes certain fair value measurement disclosure requirements. The new ASU, in addition to other modifications and additions, removes the requirement to disclose the amount and reasons for transfers between Level 1 and Level 2 of the fair value hierarchy, and the policy for the timing of transfers between levels. For investment companies, the amendments are effective for financial statements
| Equinox Chesapeake Strategy Fund |
| NOTES TO CONSOLIDATED FINANCIAL STATEMENTS (Continued) |
| September 30, 2019 |
issued for fiscal years beginning after December 15, 2019, and interim periods within those fiscal years. Early adoption is allowed and the Fund has adopted these amendments early.
In August 2018, the Securities and Exchange Commission adopted amendments to certain disclosure requirements under Regulation S-X to conform to US GAAP, including: (i) an amendment to require presentation of the total, rather than the components, of distributable earnings on the Statement of Assets and Liabilities; and (ii) an amendment to require presentation of the total, rather than the components, of distributions to shareholders, except for tax return of capital distributions, if any, on the Statement of Changes in Net Assets. The amendments also removed the requirement for parenthetical disclosure of undistributed net investment income on the Statement of Changes in Net Assets. These amendments have been adopted with these consolidated financial statements.
Subsequent events after the date of the Consolidated Statement of Assets and Liabilities have been evaluated through the date the consolidated financial statements were issued. Management has determined that no events or transactions occurred requiring adjustment or disclosure in the consolidated financial statements.
Report of Independent Registered Public Accounting Firm
To the Board of Trustees of Equinox Funds Trust
and the Shareholders of Equinox Chesapeake Strategy Fund
Opinion on the Financial Statements
We have audited the accompanying consolidated statement of assets and liabilities, including the consolidated portfolio of investments, of Equinox Chesapeake Strategy Fund (the Fund), a series of the Equinox Funds Trust, as of September 30, 2019, the related consolidated statement of operations for the year then ended, the consolidated statements of changes in net assets for each of the two years in the period then ended, including the related notes, and the consolidated financial highlights for each of the five years in the period then ended (collectively, the financial statements). In our opinion, the financial statements present fairly, in all material respects, the financial position of the Fund as of September 30, 2019, and the results of their operations for the year then ended, the changes in their net assets for each of the two years in the period then ended, and the financial highlights for each of the five years in the period then ended, in conformity with accounting principles generally accepted in the United States of America.
Emphasis of Matter
As discussed in Note 1 to the financial statements, on November 8, 2019, the Fund was reorganized into the AXS Chesapeake Strategy Fund, a series of the Investment Managers Series Trust II. Our opinion is not modified with respect to this matter.
Basis for Opinion
These financial statements are the responsibility of the Fund’s management. Our responsibility is to express an opinion on the Fund’s financial statements based on our audits. We are a public accounting firm registered with the Public Company Accounting Oversight Board (United States) (PCAOB) and are required to be independent with respect to the Fund in accordance with U.S. federal securities laws and the applicable rules and regulations of the Securities and Exchange Commission and the PCAOB.
We conducted our audits in accordance with the standards of the PCAOB. Those standards require that we plan and perform the audit to obtain reasonable assurance about whether the financial statements are free of material misstatement, whether due to error or fraud. The Fund is not required to have, nor were we engaged to perform, an audit of its internal control over financial reporting. As part of our audits, we are required to obtain an understanding of internal control over financial reporting but not for the purpose of expressing an opinion on the effectiveness of the Fund’s internal control over financial reporting. Accordingly, we express no such opinion.
Our audits included performing procedures to assess the risks of material misstatement of the financial statements, whether due to error or fraud, and performing procedures that respond to those risks. Such procedures included examining, on a test basis, evidence regarding the amounts and disclosures in the financial statements. Our audits also included evaluating the accounting principles used and significant estimates made by management, as well as evaluating the overall presentation of the financial statements. Our procedures included confirmation of investments owned as of September 30, 2019, by correspondence with the custodians and brokers. We believe that our audits provide a reasonable basis for our opinion.
/s/ RSM US LLP
We have served as the auditor of one or more Equinox Institutional Asset Management, LP advised investment companies since 2010.
Denver, Colorado
November 27, 2019
| Equinox Chesapeake Strategy Fund |
| EXPENSE EXAMPLES (Unaudited) |
| September 30, 2019 |
As a shareholder of the Fund, you incur two types of costs: (1) transaction costs, including upfront and deferred sales charges (loads) on purchases of Class A shares and deferred sales charges (loads) on certain redemptions of Class C shares; (2) ongoing costs, including management fees; distribution and/or service (12b-1) fees; and other Fund expenses. This example is intended to help you understand your ongoing costs (in dollars) of investing in the Fund and to compare these costs with the ongoing costs of investing in other mutual funds.
The example is based on an investment of $1,000 invested at the beginning of the period and held for the entire six month period from April 1, 2019 through September 30, 2019.
Actual Expenses
The “Actual” expenses line in the table below provides information about actual account values and actual expenses. You may use the information below, together with the amount you invested, to estimate the expenses that you paid over the period. Simply divide your account value by $1,000 (for example, an $8,600 account value divided by $1,000 = 8.6), then multiply the result by the number in the table under the heading entitled “Expenses Paid During Period” to estimate the expenses you paid on your account during this period.
Hypothetical Example for Comparison Purposes
The “Hypothetical” line in the table below provides information about hypothetical account values and hypothetical expenses based on each of Fund’s actual expense ratios and an assumed rate of return of 5% per year before expenses, which is not the Fund’s actual return. The hypothetical account values and expenses may not be used to estimate the actual ending account balances or expenses you paid for the period. You may use this information to compare this 5% hypothetical example with the 5% hypothetical examples that appear in the shareholder reports of other funds.
Please note that the expenses shown in the table are meant to highlight your ongoing costs only and do not reflect any transactional costs, such as sales charges (loads), or redemption fees. Therefore, the table is useful in comparing ongoing costs only, and will not help you determine the relative total costs of owning different funds. In addition, if these transactional costs were included, your costs would have been higher.
| | | Beginning | | | Ending | | | Expenses Paid | | | | |
| | | Account Value | | | Account Value | | | During Period | | | Annualized | |
| Actual * | | 4/1/2019 | | | 9/30/2019 | | | 4/1/19 - 9/30/19 | | | Expense Ratio | |
| Class A | | $ | 1,000.00 | | | $ | 1,033.00 | | | $ | 10.70 | | | 2.10% | |
| Class C | | | 1,000.00 | | | | 1,030.00 | | | | 14.50 | | | 2.85% | |
| Class I | | | 1,000.00 | | | | 1,034.60 | | | | 9.44 | | | 1.85% | |
| | | | | | | | | | | | | | | | |
| | | Beginning | | | Ending | | | Expenses Paid | | | | |
| Hypothetical * | | Account Value | | | Account Value | | | During Period | | | Annualized | |
| (5% return before expenses) | | 4/1/2019 | | | 9/30/2019 | | | 4/1/19 - 9/30/19 | | | Expense Ratio | |
| Class A | | $ | 1,000.00 | | | $ | 1,014.54 | | | $ | 10.61 | | | 2.10% | |
| Class C | | | 1,000.00 | | | | 1,010.78 | | | | 14.37 | | | 2.85% | |
| Class I | | | 1,000.00 | | | | 1,015.79 | | | | 9.35 | | | 1.85% | |
| * | Expense information for is equal to the average account value over the period, multiplied by the Fund’s annualized expense ratio, multiplied by the number of days in the period (183) divided by the number of days in the fiscal year (365). |
| Equinox Chesapeake Strategy Fund |
| SUPPLEMENTAL INFORMATION (Unaudited) |
| September 30, 2019 |
The following tables present certain information regarding the Board of Trustees and officers of the Trust. Each person listed under “Interested Trustees” below is an “interested person” of the Trust, the Adviser, or Distributor, within the meaning of the 1940 Act. Each person who is not an “interested person” of the Trust, the Adviser or the Distributor within the meaning of the 1940 Act is referred to as an “Independent Trustee” and is listed under such heading below. Unless otherwise noted, the address of each Trustee and Officer is 17645 Wright Street, Suite 200, Omaha, NE 68130.
Independent Trustees
Name and Year of
Birth | Position(s)
Held/Term
of Office* | Principal Occupation
During the Last Five Years | Number of
Portfolios in Fund
Complex**
Overseen by
Trustee | Other Directorships*** held by
Trustee During Last Five Years |
David P. DeMuth
9/1945 | Trustee Since December 2010 | Consultant, CFO Consulting Partners, LLC (since May 2004). | 5 | Executive Committee Member of The Frontier Fund (commodity pool) (from March 2007 to March 2017). |
Kevin R. Green
7/1954 | Trustee Since December 2010 | CEO of TripleTree Holdings, LLC an Investment Bank, Advisory and Principal Investing business (since 1997). | 5 | Director of BlueCross BlueShield of Minnesota (healthcare services). |
Jay Moorin
7/1951 | Trustee Since December 2010 | Managing Partner, ProQuest Management, LLC (since 1998). | 5 | Director, Eagle Pharmaceuticals Inc. (from March 2007 to June 2016); Director, Pegasi Energy Resource Corp. (January 2014 to June 2015); Director, Aires Pharmaceuticals (November 2006 to February 2014); Director, Arno Therapeutics (from January 2016 to December 2017); Director, Corino Therapeutics (since November 2016); Director, Mevion Medical Systems (from January 2012 to June 2018). |
Interested Trustee
Name and Year of
Birth | Position(s)
Held/Term
of Office* | Principal Occupation
During the Past Five Years | Number of
Portfolios in Fund
Complex**
Overseen by
Trustee | Other Directorships*** held by
Trustee During the Last Five Years |
Robert J. Enck
9/1962 | Chairman, Trustee, President and Principal Executive Officer Since December 2010 | President and Chief Executive Officer, Equinox Institutional Asset Management, LP (since 2015); President and Chief Executive Officer, Equinox Fund Management, LLC (since 2007). | 5 | Executive Committee Member of The Frontier Fund (commodity pool) (from March 2007 to March 2017). |
| Equinox Chesapeake Strategy Fund |
| SUPPLEMENTAL INFORMATION (Unaudited)(Continued) |
| September 30, 2019 |
Executive Officers
Name and Year of
Birth | Position(s)
Held/Term
of Office* | Principal Occupation
During the Past Five Years | Number of
Portfolios in Fund
Complex**
Overseen by
Trustee | Other Directorships*** held by
Trustee During the Past Five Years |
Laura Latella
4/1958 | Treasurer, Principal Financial Officer and Secretary Since November 2016 | Chief Financial Officer, Equinox Institutional Asset Management, LP (since May 2016); Consultant, Equinox Institutional Asset Management, LP (January 2016 – April 2016); Treasurer, CFO, Principal, 6800 Capital, LLC (May 1994 – January 2016).Institutional Asset Management, LP (January 2016 – April 2016); Treasurer, CFO, Principal, 6800 Capital, LLC (May 1994 – January 2016). | N/A | N/A |
Laura Szalyga
3/1978 | Assistant Treasurer since August 2014 | Vice President (since 2015) and Assistant Vice President (2011 to 2015) of Fund Administration, Gemini Fund Services, LLC | N/A | N/A |
| Doug Tyre | Chief Compliance Officer and Anti- Money Laundering Officer Since October 13, 2017 | Assistant Compliance Director of Cipperman Compliance Services LLC (since 2014); Client Services & Operations Specialist-Senior Associate of Echo Point Investment Management LLC (2010 – 2014). | N/A | N/A |
| * | Each Trustee and Officer shall serve until death, resignation or removal. |
| ** | The term “Fund Complex” refers to the Equinox Funds Trust. |
| *** | Directorships are held in a company with a class of securities registered pursuant to section 12 of the Securities Exchange Act or subject to the requirements of section 15(d) of the Securities Exchange Act or a company registered as an investment company under the 1940 Act. |
PRIVACY NOTICE
Rev. August 2011
| FACTS | WHAT DOES EQUINOX FUNDS TRUST DO WITH YOUR PERSONAL INFORMATION? |
| | |
| Why? | Financial companies choose how they share your personal information. Federal law gives consumers the right to limit some but not all sharing. Federal law also requires us to tell you how we collect, share, and protect your personal information. Please read this notice carefully to understand what we do. |
| | |
| What? | The types of personal information we collect and share depend on the product or service you have with us. This information can include: |
| | ■ Social Security number ■ Assets ■ Retirement Assets ■ Transaction History ■ Checking Account Information | ■ Purchase History ■ Account Balances ■ Account Transactions ■ Wire Transfer Instructions |
| | |
| | When you areno longer our customer, we continue to share your information as described in this notice. |
| | |
| How? | All financial companies need to share customers’ personal information to run their everyday business. In the section below, we list the reasons financial companies can share their customers’ personal information; the reasons Equinox Funds Trust chooses to share; and whether you can limit this sharing. |
| Reasons we can share your personal information | Does Equinox
Funds Trust
share? | Can you limit this sharing? |
For our everyday business purposes – such as to process your transactions, maintain your account(s), respond to court orders and legal investigations, or report to credit bureaus | Yes | No |
For our marketing purposes – to offer our products and services to you | No | We don’t share |
| For joint marketing with other financial companies | No | We don’t share |
For our affiliates’ everyday business purposes – information about your transactions and experiences | No | We don’t share |
For our affiliates’ everyday business purposes – information about your creditworthiness | No | We don’t share |
| For nonaffiliates to market to you | No | We don’t share |
| Questions? | Call 1-888-643-3431 |
Rev. August 2011
| Who we are |
| Who is providing this notice? | Equinox Funds Trust |
| What we do |
| How does Equinox Funds Trust protect my personal information? | To protect your personal information from unauthorized access and use, we use security measures that comply with federal law. These measures include computer safeguards and secured files and buildings. Our service providers are held accountable for adhering to strict policies and procedures to prevent any misuse of your nonpublic personal information. |
| How does Equinox Funds Trust collect my personal information? | We collect your personal information, for example, when you ■ Open an account ■ Provide account information ■ Give us your contact information ■ Make deposits or withdrawals from your account ■ Make a wire transfer ■ Tell us where to send the money ■ Tells us who receives the money ■ Show your government-issued ID ■ Show your driver’s license We also collect your personal information from other companies. |
| Why can’t I limit all sharing? | Federal law gives you the right to limit only ■ Sharing for affiliates’ everyday business purposes – information about your creditworthiness ■ Affiliates from using your information to market to you ■ Sharing for nonaffiliates to market to you State laws and individual companies may give you additional rights to limit sharing. |
| Definitions |
| Affiliates | Companies related by common ownership or control. They can be financial and nonfinancial companies. ■ Equinox Funds Trust does not share with our affiliates. |
| Nonaffiliates | Companies not related by common ownership or control. They can be financial and nonfinancial companies ■ Equinox Funds Trust does not share with nonaffiliates so they can market to you. |
| Joint marketing | A formal agreement between nonaffiliated financial companies that together market financial products or services to you. ■ Equinox Funds Trust doesn’t jointly market. |
PROXY VOTING POLICY
Information regarding how the Funds voted proxies relating to portfolio securities for the most recent period ended June 30 as well as a description of the policies and procedures that the Funds use to determine how to vote proxies is available without charge, upon request, by calling 1-888-643-3431 or by referring to the Securities and Exchange Commission’s (“SEC”) website at http://www.sec.gov.
PORTFOLIO HOLDINGS
The Fund files its complete schedule of portfolio holdings with the SEC for the first and third quarters of each fiscal year on Form N-PORT (beginning with filings after March 31, 2019). Form N-Q or Part F of Form N-PORT is available on the SEC’s website at http://www.sec.gov and may be reviewed and copied at the SEC’s Public Reference Room in Washington, DC (1-800-SEC-0330). The information on Form N-Q or Part F of Form N-Port is available without charge, upon request, by calling 1-888-643-3431.
| |
| |
| INVESTMENT ADVISOR |
| Equinox Institutional Asset Management, LP |
| 47 Hulfish Street, Suite 510 |
| Princeton, NJ 08542 |
| |
| INVESTMENT SUB-ADVISOR |
| Chesapeake Capital Corporation |
| 1721 Summit Avenue |
| Richmond, VA 23230 |
| |
| ADMINISTRATOR |
| Gemini Fund Services, LLC |
| 17645 Wright Street, Ste. 200 |
| Omaha, NE 68130 |
Item 2. Code of Ethics.(a) As of the end of the period covered by this report, the registrant has adopted a code of ethics that applies to the registrant's Principal executive officer, Principal financial officer, Principal accounting officer or controller, or persons performing similar functions, regardless of whether these individuals are employed by the registrant or a third party.
(b) For purposes of this item, “code of ethics” means written standards that are reasonably designed to deter wrongdoing and to promote:
| (1) | Honest and ethical conduct, including the ethical handling of actual or apparent conflicts of interest between personal and professional relationships; |
| (2) | Full, fair, accurate, timely, and understandable disclosure in reports and documents that a registrant files with, or submits to, the Commission and in other public communications made by the registrant; |
(3) Compliance with applicable governmental laws, rules, and regulations;
| (4) | The prompt internal reporting of violations of the code to an appropriate person or persons identified in the code; and |
(5) Accountability for adherence to the code.
(c) Amendments: During the period covered by the report, there have not been any amendments to the provisions of the code of ethics.
(d) Waivers: During the period covered by the report, the registrant has not granted any express or implicit waivers from the provisions of the code of ethics.
(e) The Code of Ethics is not posted on Registrant’ website.
(f) A copy of the Code of Ethics is attached as an exhibit.
Item 3. Audit Committee Financial Expert.(a)(1)ii The Registrant’s board of trustees has determined that David DeMuth is an audit committee financial expert, as defined in Item 3 of Form N-CSR. Mr. DeMuth is independent for purposes of this Item 3.
(a)(2) Not applicable.
(a)(3) In this regard, no member of the audit committee was identified as having all of the required technical attributes identified in instruction 2 (b) to item 3 of Form N-CSR to qualify as an “audit committee financial expert,” whether through the type of specialized education or experience required by that instruction. At this time, the board believes the experience provided by each member of the audit committee collectively offers the fund adequate oversight by its audit committee given the fund’s level of financial complexity. The board will from time to time reexamine such belief.
Item 4. Principal Accountant Fees and Services.
2019 - $20,500
2018 - $18,500
2017 - $50,500
2016 - $50,500
2015 - $67,500
2014 - $67,500
2013 - $135,000
2012 – None
2019 - None
2018 - None
2017 - None
2016 - None
2015 - None
2014 - None
2013 - None
2012 - None
2019 - $7,500
2018 - $8,770
2017 - $24,000
2016 - $24,000
2015 - $27,000
2014 - $27,000
2013 - $ 54,000
2012 - $ 16,000
Preparation of Federal & State income tax returns, assistance with calculation of required income, capital gain and excise distributions and preparation of Federal excise tax returns.
2019 - None
2018 - None
2017 - None
2016 - None
2015 - None
2014 - None
2013 - None
2012 - None
| (e) | (1)Audit Committee’s Pre-Approval Policies |
The registrant’s Audit Committee is required to pre-approve all audit services and, when appropriate, any non-audit services (including audit-related, tax and all other services) to the registrant. The registrant’s Audit Committee also is required to pre-approve, when appropriate, any non-audit services (including audit-related, tax and all other services) to its adviser, or any entity controlling, controlled by or under common control with the adviser that provides ongoing services to the registrant, to the extent that the services may be determined to have an impact on the operations or financial reporting of the registrant. Services are reviewed on an engagement by engagement basis by the Audit Committee.
| (2) | There were no services described in each of paragraphs (b) through (d) of this Item that were approved by the audit committee pursuant to paragraph (c)(7)(i)(C) of Rule 2-01 of Regulation S-X. |
| (f) | During the audit of registrant's financial statements for the most recent fiscal year, less than 50 percent of the hours expended on the Principal accountant's engagement were attributed to work performed by persons other than the Principal accountant's full-time, permanent employees. |
| (g) | The aggregate non-audit fees billed by the registrant's accountant for services rendered to the registrant, and rendered to the registrant's investment adviser (not including any sub-adviser whose role is primarily portfolio management and is subcontracted with or overseen by another investment adviser), and any entity controlling, controlled by, or under common control with the adviser that provides ongoing services to the registrant for each of the last two fiscal years of the registrant: |
2019 - None
2018 - None
2017 - None
2016 - None
2015 - None
2014 - None
2013 - None
2012 - None
| (h) | The registrant’s audit committee of the board of trustees has considered whether the provision of non-audit services that were rendered to the registrant’s investment adviser, and any entity controlling, controlled by, or under common control with the investment adviser that provides ongoing services to the registrant that were not pre-approved pursuant to paragraph (c)(7)(ii) of Rule 2-01 of Regulation S-X is compatible with maintaining the Principal accountant’s independence. No such services were rendered. |
Item 5. Audit Committee of Listed Companies.Not applicable to open-end investment companies.
Item 6. Schedule of Investments.See Item 1.
Item 7. Disclosure of Proxy Voting Policies and Procedures for Closed-End Funds. Not applicable to open-end investment companies.
Item 8. Portfolio Managers of Closed-End Management Investment Companies. Not applicable to open-end investment companies.
Item 9. Purchases of Equity Securities by Closed-End Funds. Not applicable to open-end investment companies.
Item 10. Submission of Matters to a Vote of Security Holders. None
Item 11. Controls and Procedures.
(a) Based on an evaluation of the Registrant’s disclosure controls and procedures as of a date within 90 days of filing date of this Form N-CSR, the Principal executive officer and Principal financial officer of the Registrant have concluded that the disclosure controls and procedures of the Registrant are reasonably designed to ensure that the information required in filings on Form N-CSR is recorded, processed, summarized, and reported by the filing date, including that information required to be disclosed is accumulated and communicated to the Registrant’s management, including the Registrant’s Principal executive officer and Principal financial officer, as appropriate to allow timely decisions regarding required disclosure.
(b) There were no significant changes in the Registrant’s internal control over financial reporting that occurred during the Registrant’s last fiscal half-year that have materially affected, or are reasonably likely to materially affect, the Registrant’s internal control over financial reporting.
Item 12. Disclosure of Securities Lending Activities for Closed-End Management Investment Companies. Not applicable to open-end investment companies.
Item 13. Exhibits.
(a)(1) Code of Ethics is filed herewith.
(a)(2) Certifications required by Section 302 of the Sarbanes-Oxley Act of 2002 (and Item 11(a)(2) of Form N-CSR) are filed herewith.
(a)(3) Not applicable for open-end investment companies.
(b) Certifications required by Section 906 of the Sarbanes-Oxley Act of 2002 (and Item 11(b) of Form N-CSR) are filed herewith.
SIGNATURES
Pursuant to the requirements of the Securities Exchange Act of 1934 and the Investment Company Act of 1940, the registrant has duly caused this report to be signed on its behalf by the undersigned, thereunto duly authorized.
(Registrant)Equinox Funds Trust
By (Signature and Title)
/s/ Robert J. Enck
Robert J. Enck, Principal Executive Officer
Date 12/6/2019
Pursuant to the requirements of the Securities Exchange Act of 1934 and the Investment Company Act of 1940, this report has been signed below by the following persons on behalf of the registrant and in the capacities and on the dates indicated.
By (Signature and Title)
/s/ Robert J. Enck
Robert J. Enck, Principal Executive Officer
Date 12/6/2019
By (Signature and Title)
/s/ Laura Latella
Laura Latella, Principal Financial Officer
Date 12/6/2019