UNITED STATES
SECURITIES AND EXCHANGE COMMISSION
Washington, D.C. 20549
FORM N-CSR
CERTIFIED SHAREHOLDER REPORT OF REGISTERED MANAGEMENT INVESTMENT COMPANIES
Investment Company Act file number811-22447
Equinox Funds Trust
(Exact name of registrant as specified in charter)
47 Hulfish Street, Suite 510
Princeton, New Jersey 08542
(Address of principal executive offices) (Zip code)
Javier Jimenez
U.S. Bancorp Fund Services, LLC
2020 East Financial Way, Suite 100
Glendora, California 91741
(Name and address of agent for service)
(609) 430-0404
Registrant's telephone number, including area code
Date of fiscal year end:September 30
Date of reporting period:September 30, 2019
Item 1. Reports to Stockholders.
| EQUINOX CAMPBELL STRATEGY FUND |
| Class A Shares: EBSAX |
| Class C Shares: EBSCX |
| Class I Shares: EBSIX |
| Class P Shares: EBSPX |
| Annual Report |
| September 30, 2019 |
| 1-888-643-3431 |
| www.EQUINOXFUNDS.com |
| Distributed by Northern Lights Distributors, LLC |
Beginning in February 2021 for the Fund, as permitted by regulations adopted by the Securities and Exchange Commission, paper copies of the Fund’s shareholder reports like this one will no longer be sent by mail, unless you specifically request paper copies of the reports from the Fund or from your financial intermediary, such as a broker-dealer or bank. Instead, the reports will be made available on a website, and you will be notified by mail each time a report is posted and provided with a website link to access the report.
If you already elected to receive shareholder reports electronically, you will not be affected by this change and you need not take any action. If you invest through a financial intermediary, you may elect to receive shareholder reports and other communications electronically from the Fund by contacting your financial intermediary (such as a broker- dealer or bank). If you invest directly with the Fund, you will receive shareholder reports electronically beginning in February 2021.
You may elect to receive all future shareholder reports in paper free of charge. You can request to continue receiving paper copies of your shareholder reports by contacting your financial intermediary or, if you invest directly with the Fund, calling 1-888-643-3431 to let the Fund know of your request.

EQUINOX CAMPBELL STRATEGY FUND
Annual Letter to Shareholders for the year ended September 30, 2019
The Equinox Campbell Strategy Fund (the “Fund”) was launched on March 8, 2013 (except for Class C Shares, as shown in the table below).
The Fund’s investment objective is to seek long-term capital appreciation, which is pursued by making a combination of investments
| (i) | directly in an actively managed fixed-income portfolio (typically US Treasuries and other short-term US government obligations), and |
| (ii) | directly or indirectly in a diversified portfolio of futures contracts and futures-related instruments such as forwards and swaps1in broadly diversified global (i.e. US and non-US) markets across a wide range of asset classes, including equities, fixed income, currencies and commodities. The Fund’s Adviser delegates the management of this futures portfolio to a sub-adviser, Campbell & Company Investment Adviser LLC (“Campbell” or the “Sub-Adviser”), as specified below. The trading strategy employed by Campbell is a diversified intermediate to long-term multi-strategy (but predominantly trend-following) approach. |
Returns of the Fund’s shares for the fiscal year are shown in the table below. The Fund had positive performance for the fiscal year, and performance since inception is also positive.
PERFORMANCE OF THE FUND
As of 9/30/2019
| NAME | TICKER | 12 MO RETURN (10/1/18-9/30/19) | ANNUALIZED RETURN SINCE INCEPTION | CUMULATIVE RETURN SINCE INCEPTION | INCEPTION DATE |
| Class A | EBSAX | 17.73% | 2.89% | 20.59% | 3/8/2013^ |
| Class A (with 5.75% maximum sales charge) | EBSAX | 10.95% | 1.97% | 13.66% | 3/8/2013^ |
| 1 | A swap is a derivative contract pursuant to which two parties exchange financial instruments. Most swaps involve cash flows based on a notional principal amount that both parties agree to. Usually, the principal does not change hands. Each cash flow comprises one leg of the swap. One cash flow is generally fixed, while the other is variable, that is, based on a benchmark interest rate, floating currency exchange rate or index price. The most common kind of swap is an interest rate swap. Swaps do not trade on exchanges, and retail investors do not generally engage in swaps. Rather, swaps are over-the-counter contracts between businesses or financial institutions. |

1
| Class C | EBSCX | 16.88% | 3.36% | 20.44% | 2/11/2014 |
| Class I | EBSIX | 18.17% | 3.15% | 22.60% | 3/8/2013^ |
| Class P | EBSPX | 17.24% | 3.01% | 21.51% | 3/8/2013^ |
PAST PERFORMANCE DOES NOT GUARANTEE FUTURE RESULTS.
Investments in Managed Futures are speculative, involve substantial risk, and are not suitable for all investors.
| ^ | Start of performance. |
As shown below, the Campbell Program’s (and consequently the Fund’s) market exposure continues to be diversified across six sectors. As of the fiscal year-end, Currencies, Interest Rates, and Equity Indices, in that order, represent the largest gross exposures, and total almost 83% (vs. 77% last year), while the physical commodity sectors, Metals, Agricultural Commodities, and Energy (in that order) total the remaining 17%.
SECTOR ALLOCATION*
As of 9/30/2019
| Currencies | Interest Rates | Equity Indices | Ag Commodities | Metals | Energy | TOTAL |
| 37.7% | 24.6% | 20.9% | 7.6% | 6.1% | 3.1% | 100.00% |
In terms of sector attribution, all sectors except Energy and Metals were positive contributors to performance.
SECTOR ATTRIBUTION *
(10/1/2018 TO 9/30/2019)
| Interest Rates | Equity Indices | Currencies | Ag Commodities | Metals | Energy |
| 14.4% | 3.6% | 0.1% | 0.1% | -1.5% | -1.5% |
| * | Attribution performance of the sectors will not equate to the total return performance of the Fund. Relative performance in a particular sector due to asset allocation or stock selection over a short period is no indication or guarantee of the Fund’s performance over long time horizons. The sector allocations shown may not be representative of the Fund’s current or future investments and are subject to change. |
2
FUND PERFORMANCE AND MARKET COMMENTARY
October 2018was a month during which trend-following strategies were challenged, and the Fund did not perform well (-4.74%). From a market perspective, the repricing in global equities was undoubtedly the key theme in October, as stocks fell continually throughout the month. Another theme was a wholesale expansion in volatility, with realized and implied volatility in many markets moving markedly higher.
The rapid sell-off in global equity indices led to sizable losses for many trend-following programs, which were generally net long the sector (particularly in the US) at the start of the month. This was also the case for Campbell’s medium- and long-term trend models, which took losses in equity indices before reducing long exposure and eventually becoming net short in the latter half of the month. However, portfolio losses in the equity sector were substantially mitigated by short-term and macro strategies, which were both profitable. Short-term mean-reversion strategies were profitable in three of four sectors, contributing significantly to portfolio returns. Short-term momentum contributed small incremental profits as well. However, the gains from short-term and macro strategies were helpful but not enough to offset the losses from trend-following. By asset class, profits were made in fixed income and currencies, while losing in commodities and equity indices. In fixed income, gains were led by long-dated bond positions, including shorts in the US and longs in Europe and Japan. In currencies exchange, net long dollar exposure versus both developed and emerging currencies contributed further gains, as the greenback rose against most global currencies in its strongest month in two years. On the negative side, the commodity sector detracted from performance, with losses in soft commodities and precious metals. Energy was also down, as long positioning in trend-following strategies suffered as the oil complex fell from multi-year highs.
Novemberwas a volatile month for many markets, as a host of unresolved political and macro themes weighed on sentiment and spurred safe-haven flows. Reversals spanning all asset classes (most notably currencies and short-term rates in the US) led to a negative month for the broad managed futures industry. The Fund returned -0.33% with gains from systematic macro more than offset by losses from trend-following and short-term strategies.
While most equity indices finished the month close to unchanged, global bond markets rallied across the board as political uncertainty and dovish-leaning rhetoric from the central banks weighed on investors. A fall in short-term interest rates led to modest losses for short positions in the US (i.e., long interest rates). At the long end, performance was slightly positive; however, there was considerable variation in regional returns, with losses in the US and Canada offset by net profits in Europe and Asia.
3
In the currency sector, net long dollar positioning led to negative returns from both developed and emerging currencies. Currency trading was choppy throughout the month, but in the end the shift in Federal reserve policy and softening inflation in the US prevented the dollar from continuing its broad move higher. The program profited in the commodity sector, where P&L was dominated by energy. It was an extremely volatile month across the energy complex, with many markets moving 10% or more. Most moved sharply lower, leading to profits for short positions. An exception was Natural Gas, which surged almost 40% higher in November, yielding strong gains from a large long position in that market.
Trend-following strategies were generally positive inDecember, and the Fund returned 3.53%. Gains were focused in the medium-term time horizon (1-3 month holding period); longer-term trend strategies (>3 months) were negative. Campbell’s “market-based” trend-following strategies were also down for the month, while thematic and adaptive trend strategies both profited. Short-term strategies were by far the best performers, with both mean-reversion (10 days or less) and momentum (30 days or less) components posting strong gains.
Sector performance was also positive across the board in December. Currencies was the top-performing sector, with gains dominated by short positions in developed market currencies (versus the US Dollar). Interestingly, trend-following strategies were negative in currencies, but extremely strong performance from macro dynamics and value strategies boosted sector results. The US dollar Index was mixed against the majors, testing new highs before doing an about-face and finishing 1.1% lower on the month. Stock indices contributed modest gains in a very volatile month for global equities. The MSCI World Index dropped 7.7% in December, while the S&P 500 Index fell 9.2%, its worst month since October 2008. While equities plummeted, global bonds rallied for the second straight month. Sector gains were concentrated at the short end of the curve, as net long exposure in Europe and Asia drove profits. At the long end, long positioning in Australian and Japanese Government Bonds both profited as those markets rallied, largely offsetting losses from net short exposure in the US.
The Fund earned -1.34% inJanuary 2019. Trend-following incurred losses from numerous reversals, while non-trend strategies were profitable. The large rally in global stocks, right on the heels of the sobering December sell-off, caused headaches for many trend-following programs, which were positioned in a strongly “risk off” stance to start the new year. Short-term mean-reversion (<10-day holding period) and short-term momentum (<30-day holding period) strategies were very impactful in January, as their responsiveness helped the portfolio quickly reposition as market dynamics changed. Not surprisingly, gains from short-term strategies were concentrated in equity indices, helping to drive overall equity sector performance into positive territory, despite losses from trend. Mean-reversion strategies were particularly active, causing portfolio exposure to flip from net short to net long equities by mid-month, as global indices surged higher. Macro strategies also contributed to profits in the equity sector.
4
The portfolios posted further gains in fixed income, with gains dominated by positions at the longer end of the curve. A dovish lean by central bankers in the US, Europe, and Australia led to profits for long positions and contributed to an increase in net long exposure during the month. As of month-end, fixed income represented the largest sector exposure. Commodities and currencies were both negative. In the commodity sector, a weakening dollar contributed to a rebound in the energy complex, which bounced strongly off December’s multi-year lows and created losses for short positions. Short exposure in grains and softs added additional losses, as agricultural commodities moved broadly higher. In currencies, it was a choppy month of trading for the greenback, which ultimately finished lower against most global currencies amidst a less hawkish Federal Reserve and improving risk sentiment.
Februarywas a profitable month (+1.24%), with commodities driving overall portfolio results. There were large gains in short grain positions as the subsector traded lower on improved crop conditions, with wheat falling nearly 12%. Long energy positions also gained as the complex extended its rebound.
It was also another strong month for global equities, with most indices in Europe, Asia and North America finishing higher. Despite a slow start, market anxiety quickly dissipated as a second government shutdown in the US was avoided and progress was reported in US/China trade talks. Further support was provided by the largest central banks, which continue to sense danger and lean more dovish in both policy and rhetoric. Gains in equity indices were driven largely by long positions in Europe and Asia. There were small additional gains in currencies, with mostly offsetting results in developed market (positive) and emerging market (negative) currencies. The US dollar Index rose 0.6% in February, with the greenback rallying versus most traded currencies despite some weakness in the latter half of the month. An exception was the British Pound, which rallied on an increasing likelihood of a Brexit delay. Fixed income was the only negative sector for the portfolio, with moderate losses at both ends of the curve. At the long end, most traded markets finished lower (interest rates rose), driving losses for long positions. Aggressive selling by short-term strategies caused portfolio exposure to flip from net long to net short long-term contracts by the end of February. At the short end, the portfolios remained significantly net long.
The Fund had a strongMarch (+4.65%). Trend-following came back with a vengeance, with gains in both medium-term (1-3 months) and long-term (3-months or more) time horizons. Systematic macro was also positive, continuing its strong run of returns with gains in 12 of the last 13 months. Finally, short-term strategies, which include both mean-reversion and momentum signals, were also profitable.
One of the biggest stories in March, and in the first quarter more generally, was the rally in fixed income. More-dovish-than-expected commentary from central bankers, growing global growth
5
concerns and persistently weak economic data ignited a sharp rally in bonds worldwide. In the US, the Federal Reserve scaled back projected rate increases to zero, and 10 year Treasury yields plummeted by more than 30 basis points in March. By month-end, the yield curve had inverted (3-month bills and 10 year treasuries) for the first time since the financial crisis. The global bond rally led to strong profits at both ends of the curve in March, and in nearly all traded contracts in the sector. The decrease in yields was quite a change from 2017-2018, when interest rates in the US rose persistently in response to the steady drumbeat of Federal reserve tightening. By the end of March 2019, US 10 year Treasury yields were at 2.4%, right back where they had been in January 2018.
Strong performance in the latter half of the month led to gains for the Fund inApril (+2.92%). By sector, equity indices were the largest source of profits. Global indices pushed higher throughout the month, leading to profits from long positions in all regions. The large central banks helped support the continuing rally with dovish rhetoric, despite better-than-expected growth numbers for the US and China. Trend-following and systematic macro drove long exposure, while bearish signals from short-term strategies led to a moderate reduction in net long exposure by month end. While equities continued to climb, global bonds came under pressure in early April, reversing the strong March rally. This led to losses in both long-dated and short-dated instruments. At the long end, small gains in the US were offset by losses in Europe and Asia, as rising rates created losses for long positions.
In currencies, the US Dollar surged against developed currencies and was mixed against emerging currencies. The portfolio remained net long dollar at month-end. From a risk standpoint, currencies represented the largest sector exposure in the portfolio at the start of May. The commodity sector was profitable, with short grains positions profiting yet again as the sector came under pressure amid a strong US Dollar and ample supply expectations. Soybeans traded to a 6-month low, while wheat fell to a 6-week low during the month. In the energy space, long positions profited as the complex extended its rally. Despite a strengthening dollar, energy markets benefited from a broad demand for risk assets along with increasing concerns over an undersupplied market.
The Fund returned -1.82% inMay, as financial markets were driven largely by the escalating trade war between the US and China, resulting in a rally in global bonds, a sell-off in global equities and an appreciation in safe-haven currencies like the US Dollar and the Swiss Franc.
This produced significant gains in the fixed income sector, as net long exposure at both ends of the curve yielded profits. Long positioning in US short-term contracts led gains, as 2-year yields fell below 2.0% while the US yield curve remained inverted (3m/10y). The US Dollar’s move higher was also positive for the portfolios, which were bullish on the US currency throughout the month. Portfolio gains came primarily from developed currency markets, while P&L in emerging currencies was flat. A short Aussie Dollar position was the biggest winner in the sector, as trade tensions drove the Australian currency down nearly 2% versus the greenback. In equities, however, the reversal and
6
subsequent sell-off led to losses from long positions. With the exception of the ASX200 (Australian stock market Index), which finished 1.0% higher, all traded equity markets retreated in May, most falling between 5% and 9%. Portfolio losses were driven largely by trend-following strategies, with both medium-term and long-term models positioned long following the strong recent rally. Offsetting gains from macro dynamics strategies, which aim to exploit economic linkages among markets, reduced sector losses. Net long equity exposure was trimmed in the latter half of the month, though the portfolios continued to hold a net long position in North America, Europe and Asia as of month-end. The commodity sector was also negative, as short grain holdings produced sizable losses when the complex rallied sharply due to weather concerns. The portfolio lost in all traded grain markets, led by corn, which rallied 18% to a near 3-year high. Elsewhere in the sector, the portfolio profited in softs and meats, with further losses in energies and metals.
The Fund enjoyed a very strong month ofJune (+5.66%), as the environment for managed futures strategies improved vastly. It was a month characterized by monetary policy dovishness, as a number of central banks across the G10 either cut rates or set expectations for easing to come in the following months. The only exception was Norway, as the Norges Bank hiked rates by 25 basis points.
This theme of central bank accommodation set the tone for financial markets throughout the month as stocks rallied and bond yields continued to fall. The US Dollar weakened against most major currencies, particularly in the latter half of the month. The portfolio profited strongly in both equity and fixed income markets, with offsetting losses in foreign exchange and flattish performance in commodities. Stocks indices were the strongest performing sector in June, as long positioning rebounded strongly after the prior month’s drop. The portfolios profited in all regions, with relatively consistent gains throughout the month. Net long exposure rose somewhat by month’s end, with macro, momentum and short-term strategies all aligned in their positioning. Global fixed income positions also led to sizable gains. The dovish turn by central banks benefited long exposure, particularly in Australia where Aussie 10 year bonds rallied sharply after the Reserve Bank of Australia ended a 3-year pause with a 25 basis point rate cut. US treasuries also rallied, with the 10 year yield falling below 2% for the first time since 2016 as the Federal reserve signaled a growing willingness to cut interest rates. As the market priced in the increasing dovishness of the Federal Reserve, the US Dollar weakened against virtually every other currency. This led to negative returns for net long US Dollar positions versus developed currency markets. A short position in the Norwegian Krone led losses, as that currency strengthened against its peers following the rate hike on June 19th and commentary from the Norges Bank indicating that more hikes are likely. Sector losses were mitigated by emerging currency positions, where long Emerging Markets exposures profited from the dollar rout.
The Fund followed a strong June with a stellarJuly (+5.36%). Monetary policy accommodation was again the dominant feature of the market landscape. This theme picked up steam in July as emerging market bankers joined the fray, with a surprise cut by Korea, larger-than-expected reductions by
7
Turkey and Brazil, and expected cuts from Indonesia, South Africa, and Russia. We also saw continued dovishness, through either actions or words, from many of the G10 central banks, including the Federal reserve, the European Central Bank and the Reserve Bank of Australia.
All of this provided support for asset markets, with generally rising prices for fixed income and equity instruments. The global rally in fixed income was a significant source of profits. Net long positioning at the long end of the curve drove sector gains, with both directional and relative value strategies profiting. The portfolios were also profitable in all other traded asset classes, with foreign exchange providing the bulk of the gains. Net short exposure (versus US Dollar) drove profits with developed market currencies contributing all the gains. Systematic macro and trend-following both had strong performance in July, while short-term strategies were roughly flat. Trend following continued to recover from 2018’s drawdown. Carry was also a stand-out performer, with strong risk-adjusted returns in nearly all sectors.
An expansion in global asset volatility duringAugust led to another month of strong performance for the Fund (+4.57%). Short-term strategies contributed significant gains, with both mean-reversion and momentum styles profiting. Trend-based strategies, including adaptive (i.e., learning-based), thematic and traditional approaches, contributed further gains. The main detractor from August performance was systematic macro, as macro dynamics, multi-asset carry and value strategies were all negative for the month.
The vast majority of gains occurred in the fixed income sector, as net long exposure benefited from a further decline in global yields. Long positioning in long-dated instruments, particularly in Australia and Europe, led gains, profiting as the recent flight-to-quality picked up steam. Additional gains were captured from longs in short-dated instruments, led by US 2 year Treasuries. The accelerating flight-to-quality led to a surge in the greenback, particularly versus emerging currencies. As assets flowed away from risky assets, global equities sold off en masse. In contrast to June and July, the accommodative shift by the Federal Reserve and easing from central banks across the globe was not enough to appease equity investors, leading to the broad-based sell-off. The portfolio was approximately flat in the sector, as small gains in US and Asian indices offset losses in Europe. A short position in Hang Seng was the biggest gainer, as that market declined more than 7% amid an intensifying trade war between the US and China, and as political strife and civil unrest gripped Hong Kong.
The Fund’s strong run of performance ended inSeptember (-2.58%). Despite September finishing in a reasonably risk-heightened state (given the whistle-blower complaint, impeachment talks, etc.), market activity during the month generally showed riskier assets rallying and haven assets weakening. In the fixed income sector, a sharp rise in interest rates early on led to losses from net long positions across the curve. The increase in yields during the first two weeks of September felt jarring,
8
and indeed it was a significant move by historical standards: US 10 year bond yields spiked 40 basis points over this period. Indeed, for the most part, the move up in bond yields during early September was simply a reversal of the step down in yields the prior month. 10 year bond yields declined across the G6 during August, before the early-September spike. Following the large increase in the first half of September, yields generally fell once again, offsetting much of the earlier move.
Unsurprisingly, this environment was challenging for trend following strategies, which were whipsawed by the reversals. The moves in fixed income were primarily responsible for the poor performance of the Fund. In currencies, it was another month of choppy trading with a divergence in performance in both the developed and emerging markets (vs. US Dollar, and a moderate rise in the US dollar Index. The biggest underperformer was the Japanese Yen (-1.7% vs. US Dollar), which sold off amidst the broader move away from safe-haven assets. A bright spot for the portfolios was equity indices. The rally early in the month led to steady gains for momentum and macro models, which were both long-biased in their positioning. Gains were concentrated in European indices, where longs benefited from the 3% - 5% rise in traded markets. Small losses came from the commodity sector, with mixed returns within subsectors. A rally in agricultural commodities led to losses for short holdings, while the spike in oil prices contributed to negative performance in energies. On the positive side, precious metals added to gains in September, as the portfolios benefited from rising prices.
OUTLOOK
We believe that there continues to be much latent uncertainty in the markets. In the US, the outcome of the impeachment proceedings is uppermost on people’s minds. Geopolitical stresses continue in Europe (particularly with respect to Brexit) and the Middle East (Iran, Syria, Saudi Arabia, Yemen). Trade-related issues with China and other trading partners are not yet fully resolved. Climate change remains a concern in the form of more severe weather-related events. The Fed’s policy reversed this year in the face of a slowing economy. Surprisingly, equity markets have continued to scale new heights; however, this has triggered fresh doubts about its sustainability.
Investors should bear in mind that managed futures programs have historically offered useful diversification benefits, with the potential for attractive risk-adjusted returns over the long run. In fact, managed futures have historically tended to perform well in a wide variety of market conditions, perhaps particularly so during periods of equity market turbulence and volatility expansion. We continue to believe that a significant and strategic allocation to the asset class has the potential to serve investors well in the long run.
Although the Fund has been in operation for a relatively short period of time, Campbell has been trading a similar strategy dating back to the 1980s. Campbell’s program has historically offered useful diversification benefits, along with what we view as attractive risk-adjusted long-term returns over multiple market cycles. In our opinion, the Fund and the managed futures asset class should continue to offer these potential benefits in a market environment that is still challenging and a geopolitical
9
outlook that remains fraught with uncertainty. In fact, managed futures, although not a hedge for equities in the true sense of the word, have historically displayed the ability to earn what has been termed as “crisis alpha:” positive returns during periods when equity markets have fallen, and volatility has increased.
Difficult market conditions, the prevailing climate of economic and geopolitical uncertainty, and the unpredictable nature of financial markets all pose challenges for investors. The Campbell program is, we believe, positioned to potentially perform well under these conditions. As always, we encourage investors to focus on holding a portfolio that blends traditional assets with a strategic and meaningful allocation to alternative assets, appropriate for their long-term goals. A well-balanced portfolio may display lower volatility, while also affording opportunities for potential long-term growth. We believe that the managed futures asset class should play an important role in such a portfolio.
Thank you for investing in the Equinox Campbell Strategy Fund.
10
DEFINITIONS
Brexitis the popular term for the prospective withdrawal of the United Kingom from the European Union.
Carryis generally a strategy in which an investor sells a certain currency with a relatively low interest rate and uses the funds to purchase a different currency yielding a higher interest rate.
ACommodity Trading Advisor (“CTA”) is a trader who may invest in more than 150 global futures markets. They seek to generate profit in both bull or bear markets, due to their ability to go long (buy) futures positions, in anticipation of rising markets, or go short (sell) futures positions, in anticipation of falling markets.
ADerivative Contract is a financial contract which derives its value from the performance of another entity such as an asset, index, or interest rate, called the “underlying”. Derivatives are one of the three main categories of financial instruments, the other two being equities (i.e. stocks) and debt (i.e. bonds and mortgages).
Long Positionrefers to the buying of a security such as a stock, commodity or currency, with the expectation that the asset will rise in value.
Risk-adjusted returnis a mesuare of the return on an investment relative to the risk of that investment, over a specific period, which is generally expressed as a number or rating.
Short Positionis a position whereby an investor sells borrowed securities in anticipation of a price decline and is required to return an equal number of shares at some point in the future.
ATrend Following strategy generally seeks to identify the general direction of one or more global market segments (either up or down) using indicators such as current market prices and moving average prices, and buy or sell investments based on the assessment of these trade signals as determined before a trade is made. Trend-following generally focuses on the direction an investment or global market segment already has gone and not on the direction it may go.
3854-NLD-11/7/2019
11
| Equinox Campbell Strategy Fund |
| PORTFOLIO REVIEW |
| September 30, 2019 (Unaudited) |
The Fund’s performance figures for the periods ended September 30, 2019, as compared to its benchmarks(1):
| Annualized | |||||
| Since Inception | Since Inception | ||||
| One Year | Three Year | Five Year | (03/08/2013)(2) | (02/11/2014)(3) | |
| Equinox Campbell Strategy Fund | |||||
| Class A with Load | 10.95% | 1.29% | 0.64% | 1.97% | N/A |
| Class A | 17.73% | 3.32% | 1.84% | 2.89% | N/A |
| Class C | 16.88% | 2.52% | 1.10 | N/A | 3.36% |
| Class I | 18.17% | 3.54% | 2.10% | 3.15% | N/A |
| Class P | 17.24% | 3.26% | 1.92% | 3.01% | N/A |
| S&P 500 Total Return Index(4) | 4.25% | 13.39% | 10.84% | 12.73% | 11.40% |
| BTOP 50 Index(5) | 7.14% | 0.24% | 0.99% | 1.16% | 1.99% |
| (1) | The performance data quoted is historical. The performance comparison includes reinvestment of all dividends and capital gains and has been adjusted for Class A maximum applicable sales charge of 5.75%. Past performance is no guarantee of future results. Current performance may be higher or lower than the performance data quoted. The principal value and investment return of an investment will fluctuate so that your shares, when redeemed, may be worth more or less than their original cost. The returns shown do not reflect the deduction of taxes that a shareholder would pay on portfolio distributions or on the redemptions of portfolio shares. Performance returns would have been lower had Equinox Institutional Asset Management, LP (the “Adviser”) and Campbell & Company Investment Adviser LLC (the “Sub-Adviser”) not waived their fees or reimbursed a portion of the Fund’s expenses pursuant to an expense limitation agreement. Under the terms of the expense limitation agreement, the Adviser and Sub-Adviser have each contractually agreed to reduce their advisory fee and/or reimburse certain expenses of the Fund, to ensure that the Fund’s total annual operating expenses, excluding (i) taxes, (ii) interest, (iii) extraordinary items, (iv) “Acquired Fund Fees and Expenses,” and (v) brokerage commissions, do not exceed, on an annual basis, 2.14%, 2.89%, 1.89% and 2.14% for Class A, Class C, Class I and Class P, respectively, of the Fund’s average daily net assets. This expense limitation will remain in effect until January 31, 2020, but can be terminated by the Fund’s Board of Trustees on 60 days’ written notice to the Adviser. The Adviser and Sub-Adviser shall be entitled to recover, subject to approval by the Board of Trustees of the Trust, such waived or reimbursed amounts for a period of up to three (3) years from the date on which the Adviser and Sub -Adviser reduced their compensation and/or assumed expenses for the Fund. The Adviser and Sub-Adviser are permitted to seek reimbursement from the Fund, subject to certain limitations, for fees they waived and Fund expenses they paid to the extent the total annual fund operating expenses do not exceed the limits described above or any lesser limits in effect at the time of reimbursement. No recoupment by the Adviser or Sub-Adviser will occur unless the Fund’s operating expenses are below the expense limitation amount. Per the fee table in the Fund’s prospectus dated February 1, 2019, the Fund’s “Total Annual Fund Operating Expenses” are 2.43%, 3.19%, 2.14% and 2.44%, and the Fund’s “Total Annual Fund Operating Expenses (after Fee Waiver and/or Expense Reimbursement)” are 2.14%, 2.89%, 1.89% and 2.14% for Class A, Class C, Class I, and Class P shares, respectively, of the Fund’s average daily net assets. More recent expense ratio information is available in the Consolidated Financial Highlights included in this report. For performance information current to the most recent month-end please call 1-888-643-3431. |
| (2) | Commencement of operations was March 4, 2013. Start of performance is March 8, 2013. |
| (3) | Commencement of operations was February 11, 2014. |
| (4) | The S&P 500® Total Return Index is a widely accepted, unmanaged index of U.S. stock market performance which does not take into account charges, fees and other expenses. It is not possible to invest directly in an index. |
| (5) | The Barclay BTOP50 Index (“BTOP50 Index”) seeks to replicate the overall composition of the managed futures industry with regard to trading style and overall market exposure. The BTOP50 Index employs a top -down approach in selecting its constituents. The largest investable trading advisor programs, as measured by assets under management, are selected for inclusion in the BTOP50 Index. In each calendar year the selected trading advisors represent, in aggregate, no less than 50% of the investable assets of the Barclay CTA Universe. For 2019, there are 20 funds in the BTOP50 Index. Investors cannot invest directly in an index. |
Comparison of the Change in Value of a $100,000 Investment(6)
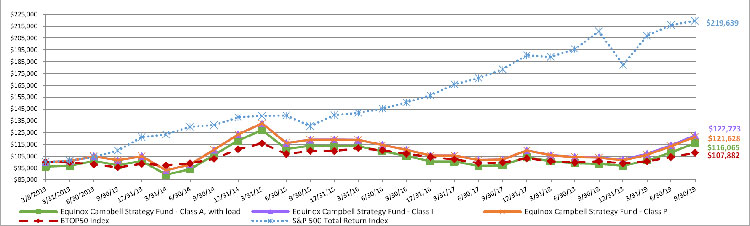
| (6) | Class C is not shown on the graph as it commenced operations on February 11, 2014. |
| Portfolio Composition | % of Net Assets | |||
| U.S. Treasury Notes | 73.6 | % | ||
| Short-Term Investments | 13.9 | % | ||
| Other assets and liabilities – net(7) | 12.5 | % | ||
| 100.0 | % | |||
| (7) | Includes net unrealized appreciation and depreciation on forward currency and futures contracts, respectively. |
Please refer to the Consolidated Portfolio of Investments in this annual report for a detailed analysis of the Fund’s holdings.
12
| Equinox Campbell Strategy Fund |
| CONSOLIDATED PORTFOLIO OF INVESTMENTS |
| September 30, 2019 |
| Principal | Coupon Rate | Maturity Date | Value | |||||||
| U.S. TREASURY NOTES - 73.6% (a) | ||||||||||
| $ | 21,000,000 | 1.500% | 10/31/2019 | $ | 20,989,920 | |||||
| 18,650,000 | (b) | 1.250% | 01/31/2020 | 18,609,203 | ||||||
| 12,000,000 | 1.500% | 04/15/2020 | 11,976,797 | |||||||
| 6,650,000 | (b) | 2.000% | 07/31/2020 | 6,657,533 | ||||||
| 250,000 | (b) | 1.625% | 11/30/2020 | 249,522 | ||||||
| Total U.S. Treasury Notes | ||||||||||
| (Cost $58,375,638) | 58,482,975 | |||||||||
| Total Investments - 73.6% | ||||||||||
| (Cost $58,375,638) (c) | 58,482,975 | |||||||||
| Other Assets in Excess of Liabilities - 26.4% | 20,953,093 | |||||||||
| TOTAL NET ASSETS - 100.0% | $ | 79,436,068 | ||||||||
| (a) | Partially pledged as collateral for open futures contracts. As of September 30, 2019, $5,804,268 was pledged as collateral for open futures contracts. |
| (b) | A portion of this security is held in a wholly-owned and controlled subsidiary organized in the Cayman Islands and consolidated for financial reporting purposes. |
| (c) | Represents cost for financial reporting purposes. Aggregate cost for federal tax purposes is $58,375,638 and differs from market value by net unrealized appreciation of securities as follows: |
| Unrealized Appreciation: | $ | 107,337 | ||
| Unrealized Depreciation: | — | |||
| Net Unrealized Appreciation: | $ | 107,337 | ||
The accompanying notes are an integral part of these consolidated financial statements.
13
| Equinox Campbell Strategy Fund |
| CONSOLIDATED PORTFOLIO OF INVESTMENTS |
| September 30, 2019 (Continued) |
FORWARD CURRENCY CONTRACTS(c)
| Currency | Unrealized | |||||||||||||||||||||||
| Settlement | to be | Amount | USD Value | Currency | Amount | USD Value | Appreciation/ | |||||||||||||||||
| Date | purchased | to be purchased | September 30, 2019 | to be sold | to be sold | September 30, 2019 | (Depreciation) | |||||||||||||||||
| 12/18/19 | AUD | 42,600,000 | $ | 28,826,075 | USD | 29,263,864 | $ | 29,263,864 | $ | (437,789 | ) | |||||||||||||
| 12/18/19 | BRL | 14,400,000 | 3,448,942 | USD | 3,479,599 | 3,479,599 | (30,657 | ) | ||||||||||||||||
| 12/18/19 | CAD | 77,450,000 | 58,539,380 | USD | 58,550,081 | 58,550,081 | (10,701 | ) | ||||||||||||||||
| 12/18/19 | CHF | 100,000 | 100,920 | USD | 101,948 | 101,948 | (1,028 | ) | ||||||||||||||||
| 12/18/19 | CLP | 200,000,000 | 274,740 | USD | 276,775 | 276,775 | (2,035 | ) | ||||||||||||||||
| 12/18/19 | CNH | 17,200,000 | 2,403,953 | USD | 2,399,917 | 2,399,917 | 4,036 | |||||||||||||||||
| 12/18/19 | COP | 8,730,000,000 | 2,499,162 | USD | 2,570,903 | 2,570,903 | (71,741 | ) | ||||||||||||||||
| 12/18/19 | CZK | 29,600,000 | 1,252,939 | USD | 1,262,079 | 1,262,079 | (9,140 | ) | ||||||||||||||||
| 12/18/19 | EUR | 25,550,000 | 28,023,417 | USD | 28,408,879 | 28,408,879 | (385,462 | ) | ||||||||||||||||
| 12/18/19 | GBP | 10,950,000 | 13,508,751 | USD | 13,611,416 | 13,611,416 | (102,665 | ) | ||||||||||||||||
| 12/18/19 | HUF | 1,533,000,000 | 5,015,026 | USD | 5,057,419 | 5,057,419 | (42,393 | ) | ||||||||||||||||
| 12/18/19 | IDR | 19,950,000,000 | 1,393,384 | USD | 1,389,760 | 1,389,760 | 3,624 | |||||||||||||||||
| 12/18/19 | ILS | 12,975,000 | 3,748,803 | USD | 3,703,744 | 3,703,744 | 45,059 | |||||||||||||||||
| 12/18/19 | INR | 911,000,000 | 12,744,963 | USD | 12,625,649 | 12,625,649 | 119,314 | |||||||||||||||||
| 12/18/19 | JPY | 2,536,500,000 | 23,600,443 | USD | 23,734,010 | 23,734,010 | (133,567 | ) | ||||||||||||||||
| 12/18/19 | KRW | 5,865,000,000 | 4,915,017 | USD | 4,944,771 | 4,944,771 | (29,754 | ) | ||||||||||||||||
| 12/18/19 | MXN | 207,600,000 | 10,386,329 | USD | 10,318,667 | 10,318,667 | 67,662 | |||||||||||||||||
| 12/18/19 | NOK | 99,150,000 | 10,912,592 | USD | 11,004,498 | 11,004,498 | (91,906 | ) | ||||||||||||||||
| 12/18/19 | NZD | 11,850,000 | 7,434,073 | USD | 7,550,390 | 7,550,390 | (116,317 | ) | ||||||||||||||||
| 12/18/19 | PHP | 152,250,000 | 2,927,781 | USD | 2,919,810 | 2,919,810 | 7,971 | |||||||||||||||||
| 12/18/19 | PLN | 32,925,000 | 8,220,224 | USD | 8,319,301 | 8,319,301 | (99,077 | ) | ||||||||||||||||
| 12/18/19 | RUB | 329,000,000 | 5,016,836 | USD | 4,923,547 | 4,923,547 | 93,289 | |||||||||||||||||
| 12/18/19 | SEK | 99,000,000 | 10,113,145 | USD | 10,290,857 | 10,290,857 | (177,712 | ) | ||||||||||||||||
| 12/18/19 | SGD | 2,805,000 | 2,031,357 | USD | 2,041,185 | 2,041,185 | (9,828 | ) | ||||||||||||||||
| 12/18/19 | TRY | 26,775,000 | 4,620,043 | USD | 4,570,071 | 4,570,071 | 49,972 | |||||||||||||||||
| 12/18/19 | TWD | 6,300,000 | 204,010 | USD | 205,349 | 205,349 | (1,339 | ) | ||||||||||||||||
| 12/18/19 | USD | 58,146,835 | 58,146,835 | AUD | 85,600,000 | 57,922,817 | 224,018 | |||||||||||||||||
| 12/18/19 | USD | 5,512,482 | 5,512,482 | BRL | 23,000,000 | 5,508,727 | 3,755 | |||||||||||||||||
| 12/18/19 | USD | 39,741,823 | 39,741,823 | CAD | 52,550,000 | 39,719,102 | 22,721 | |||||||||||||||||
| 12/18/19 | USD | 4,148,958 | 4,148,958 | CHF | 4,050,000 | 4,087,279 | 61,679 | |||||||||||||||||
| 12/18/19 | USD | 5,180,321 | 5,180,321 | CLP | 3,720,000,000 | 5,110,158 | 70,163 | |||||||||||||||||
| 12/18/19 | USD | 4,272,591 | 4,272,591 | CNH | 30,500,000 | 4,262,823 | 9,768 | |||||||||||||||||
| 12/18/19 | USD | 354,046 | 354,046 | COP | 1,200,000,000 | 343,528 | 10,518 | |||||||||||||||||
| 12/18/19 | USD | 5,130,128 | 5,130,128 | CZK | 120,000,000 | 5,079,483 | 50,645 | |||||||||||||||||
| 12/18/19 | USD | 55,799,062 | 55,799,062 | EUR | 50,350,000 | 55,224,229 | 574,833 | |||||||||||||||||
| 12/18/19 | USD | 27,287,075 | 27,287,075 | GBP | 21,950,000 | 27,079,186 | 207,889 | |||||||||||||||||
| 12/18/19 | USD | 8,604,715 | 8,604,715 | HUF | 2,568,000,000 | 8,400,904 | 203,811 | |||||||||||||||||
| 12/18/19 | USD | 73,723 | 73,723 | IDR | 1,050,000,000 | 73,336 | 387 | |||||||||||||||||
| 12/18/19 | USD | 9,700,983 | 9,700,983 | ILS | 34,050,000 | 9,837,898 | (136,915 | ) | ||||||||||||||||
| 12/18/19 | USD | 6,186,567 | 6,186,567 | INR | 451,000,000 | 6,309,526 | (122,959 | ) | ||||||||||||||||
| 12/18/19 | USD | 33,737,641 | 33,737,641 | JPY | 3,606,000,000 | 33,551,428 | 186,213 | |||||||||||||||||
| 12/18/19 | USD | 2,987,823 | 2,987,823 | KRW | 3,570,000,000 | 2,991,750 | (3,927 | ) | ||||||||||||||||
| 12/18/19 | USD | 8,508,123 | 8,508,123 | MXN | 168,300,000 | 8,420,131 | 87,992 | |||||||||||||||||
| 12/18/19 | USD | 1,875,090 | 1,875,090 | NOK | 16,950,000 | 1,865,542 | 9,548 | |||||||||||||||||
| 12/18/19 | USD | 28,480,860 | 28,480,860 | NZD | 44,850,000 | 28,136,554 | 344,306 | |||||||||||||||||
| 12/18/19 | USD | 1,804,235 | 1,804,235 | PHP | 94,500,000 | 1,817,244 | (13,009 | ) | ||||||||||||||||
| 12/18/19 | USD | 5,476,147 | 5,476,147 | PLN | 21,525,000 | 5,374,042 | 102,105 | |||||||||||||||||
| 12/18/19 | USD | 1,016,467 | 1,016,467 | RUB | 66,000,000 | 1,006,417 | 10,050 | |||||||||||||||||
| 12/18/19 | USD | 21,803,431 | 21,803,431 | SEK | 211,350,000 | 21,590,034 | 213,397 | |||||||||||||||||
| 12/18/19 | USD | 10,063,582 | 10,063,582 | SGD | 13,872,000 | 10,045,985 | 17,597 | |||||||||||||||||
| 12/18/19 | USD | 2,227,908 | 2,227,908 | TRY | 13,125,000 | 2,264,727 | (36,819 | ) | ||||||||||||||||
| 12/18/19 | USD | 8,688,540 | 8,688,540 | TWD | 269,550,000 | 8,728,696 | (40,156 | ) | ||||||||||||||||
| 12/18/19 | USD | 10,438,998 | 10,438,998 | ZAR | 157,600,000 | 10,298,158 | 140,840 | |||||||||||||||||
| 12/18/19 | ZAR | 156,400,000 | 10,219,745 | USD | 10,496,304 | 10,496,304 | (276,559 | ) | ||||||||||||||||
| Net Unrealized Apreciation on Forward Currency Contracts | $ | 559,707 | ||||||||||||||||||||||
| (c) | UBS is the counterparty to all contracts. |
The accompanying notes are an integral part of these consolidated financial statements.
14
| Equinox Campbell Strategy Fund |
| CONSOLIDATED PORTFOLIO OF INVESTMENTS |
| September 30, 2019 (Continued) |
FUTURES CONTRACTS
| Unrealized | ||||||||||||
| Appreciation/ | ||||||||||||
| Number of Contracts | Description | Expiration Date | Notional Amount | (Depreciation) | ||||||||
| Short Futures Contracts | ||||||||||||
| 176 | 90-Day Bank Accepted Bills Future | Mar-20 | $ | 118,563,267 | $ | (43,275 | ) | |||||
| 27 | Brent Crude Future (d) | Jan-20 | 1,578,960 | 50,623 | ||||||||
| 49 | Canadian 10-Year Government Bond Future | Dec-19 | 5,274,107 | 15,603 | ||||||||
| 32 | Corn Future (d) | Dec-19 | 620,800 | (26,192 | ) | |||||||
| 28 | Cotton No. 2 Future (d) | Dec-19 | 851,620 | (24,425 | ) | |||||||
| 53 | Crude Oil Future (d) | Nov-19 | 2,865,710 | 89,932 | ||||||||
| 74 | Euro-BOBL Future | Dec-19 | 10,941,066 | (7,266 | ) | |||||||
| 85 | Euro-Bund Future | Dec-19 | 16,143,580 | 31,906 | ||||||||
| 4 | Feeder Cattle Future (d) | Nov-19 | 283,850 | (17,549 | ) | |||||||
| 36 | Gasoline RBOB Future (d) | Nov-19 | 2,368,548 | 91,334 | ||||||||
| 119 | Hard Red Winter Wheat Future (d) | Dec-19 | 2,469,250 | (24,204 | ) | |||||||
| 13 | Lean Hogs Future (d) | Dec-19 | 377,520 | (62,968 | ) | |||||||
| 105 | London Metal Exchange Copper Future (d) | Dec-19 | 15,024,844 | 33,452 | ||||||||
| 22 | London Metal Exchange Nickel Future (d) | Dec-19 | 2,252,580 | (39,960 | ) | |||||||
| 227 | London Metal Exchange Primary Aluminum Future (d) | Dec-19 | 9,806,400 | 279,761 | ||||||||
| 52 | London Metal Exchange Zinc Future (d) | Dec-19 | 3,108,950 | (98,856 | ) | |||||||
| 157 | Long Gilt Future | Dec-19 | 25,913,465 | (193,017 | ) | |||||||
| 17 | Low Sulphur Gas Oil Future (d) | Nov-19 | 997,050 | 5,921 | ||||||||
| 57 | MSCI Taiwan Stock Index Future | Oct-19 | 2,320,470 | (23,778 | ) | |||||||
| 17 | NASDAQ 100 E-mini Future | Dec-19 | 2,641,970 | (15,866 | ) | |||||||
| 10 | NY Harbor ULSD Future (d) | Nov-19 | 796,824 | 39,683 | ||||||||
| 14 | OMXS30 Index Future | Oct-19 | 234,340 | (4,971 | ) | |||||||
| 5 | S&P/Toronto Stock Exchange 60 Index Future | Dec-19 | 751,859 | 1,485 | ||||||||
| 9 | Soybean Future (d) | Nov-19 | 407,700 | (14,888 | ) | |||||||
| 107 | Soybean Meal Future (d) | Dec-19 | 3,220,700 | (24,237 | ) | |||||||
| 122 | Sugar No. 11 Future (d) | Mar-20 | 1,728,496 | (87,225 | ) | |||||||
| 90 | U.S. 10-Year Treasury Note Future | Dec-19 | 11,728,125 | (7,462 | ) | |||||||
| 52 | U.S. Treasury Long Bond Future | Dec-19 | 8,440,250 | (14,307 | ) | |||||||
| (90,746 | ) | |||||||||||
| (d) | Position held in a wholly-owned and controlled subsidiary organized in the Cayman Islands and consolidated for financial reporting purposes. |
The accompanying notes are an integral part of these consolidated financial statements.
15
| Equinox Campbell Strategy Fund |
| CONSOLIDATED PORTFOLIO OF INVESTMENTS |
| September 30, 2019 (Continued) |
FUTURES CONTRACTS (Continued)
| Unrealized | ||||||||||||
| Appreciation/ | ||||||||||||
| Number of Contracts | Description | Expiration Date | Notional Amount | (Depreciation) | ||||||||
| Long Futures Contracts | ||||||||||||
| 398 | 3-Month Euro (EURIBOR) Interest Rate Future | Dec-20 | $ | 109,052,312 | $ | 25,637 | ||||||
| 40 | 90-Day Eurodollar Future | Sep-20 | 9,852,500 | (5,312 | ) | |||||||
| 513 | 90-Day Sterling Future | Dec-20 | 78,414,773 | 166,651 | ||||||||
| 21 | Amsterdam Exchanges Index Future | Oct-19 | 2,655,814 | 26,926 | ||||||||
| 281 | Australian 10-Year Treasury Bond Future | Dec-19 | 27,946,431 | 156,184 | ||||||||
| 287 | Australian 3-Year Treasury Bond Future | Dec-19 | 22,410,570 | 66,102 | ||||||||
| 87 | Bank Accept Future | Dec-19 | 16,086,151 | (31,761 | ) | |||||||
| 52 | CAC 40 10 Euro Future | Oct-19 | 3,217,021 | 50,473 | ||||||||
| 62 | Cocoa Future (d) | Dec-19 | 1,514,040 | (17,527 | ) | |||||||
| 10 | Coffee ‘C’ Future (d) | Dec-19 | 379,313 | 7,245 | ||||||||
| 23 | Copper Future (d) | Dec-19 | 1,482,638 | (25,081 | ) | |||||||
| 12 | E-mini Dow Future | Dec-19 | 1,614,060 | (11,090 | ) | |||||||
| 12 | E-Mini Russell 2000 Index Future | Dec-19 | 915,000 | (20,935 | ) | |||||||
| 23 | E-mini S&P 500 Future | Dec-19 | 3,425,275 | 239 | ||||||||
| 5 | E-mini S&P MidCap 400 Future | Dec-19 | 969,000 | (10,651 | ) | |||||||
| 189 | Euro STOXX 50 Future | Dec-19 | 7,323,346 | 86,020 | ||||||||
| 25 | Euro-BTP Italian Government Bond Future | Dec-19 | 3,973,972 | 39,385 | ||||||||
| 7 | Euro-BUXL 30-Year Bond Future | Dec-19 | 1,659,455 | (37,197 | ) | |||||||
| 30 | Euro-OAT Future | Dec-19 | 5,568,901 | (47,948 | ) | |||||||
| 865 | Euro-Schatz Future | Dec-19 | 105,905,861 | (301,482 | ) | |||||||
| 128 | FTSE 100 Index Future | Dec-19 | 11,620,268 | 63,608 | ||||||||
| 6 | FTSE/JSE Top 40 Index Future | Dec-19 | 195,399 | (9,527 | ) | |||||||
| 15 | FTSE/MIB Index Future | Dec-19 | 1,803,819 | 22,634 | ||||||||
| 10 | German Stock Index Future | Dec-19 | 3,381,854 | 24,438 | ||||||||
| 1 | Gold 100 oz. Future (d) | Dec-19 | 147,290 | (1,783 | ) | |||||||
| 13 | Hang Seng Index Future | Oct-19 | 2,159,728 | (525 | ) | |||||||
| 15 | IBEX 35 Index Future | Oct-19 | 1,509,450 | 37,334 | ||||||||
| 49 | Japanese 10-Year Government Bond Future | Dec-19 | 70,251,838 | (62,101 | ) | |||||||
| 40 | Live Cattle Future (d) | Dec-19 | 1,764,800 | 141,212 | ||||||||
| 118 | London Metal Exchange Copper Future (d) | Dec-19 | 16,885,063 | (210,812 | ) | |||||||
| 39 | London Metal Exchange Nickel Future (d) | Dec-19 | 3,993,210 | (6,658 | ) | |||||||
| 109 | London Metal Exchange Primary Aluminum Future (d) | Dec-19 | 4,708,800 | (167,245 | ) | |||||||
| 85 | London Metal Exchange Zinc Future (d) | Dec-19 | 5,081,938 | 214,503 | ||||||||
| 29 | Natural Gas Future (d) | Nov-19 | 675,700 | (49,390 | ) | |||||||
| 35 | Nikkei 225 Future | Dec-19 | 7,043,699 | 59,209 | ||||||||
| 8 | Palladium Future (d) | Dec-19 | 1,318,000 | 138,281 | ||||||||
| 21 | Platinum Future (d) | Jan-20 | 933,660 | (79,221 | ) | |||||||
| 45 | SGX MSCI Singapore Index Future | Oct-19 | 1,169,645 | (9,235 | ) | |||||||
| 8 | Silver Future (d) | Dec-19 | 679,920 | (14,349 | ) | |||||||
| 43 | Soybean Oil Future (d) | Dec-19 | 750,264 | (12,952 | ) | |||||||
| 130 | SPI 200 Index Future | Dec-19 | 14,657,564 | 16,221 | ||||||||
| 6 | Tokyo Price Index Future | Dec-19 | 881,202 | 20,863 | ||||||||
| 383 | U.S. 2-Year Treasury Note Future | Dec-19 | 82,536,500 | (189,992 | ) | |||||||
| 28 | U.S. 5-Year Treasury Note Future | Dec-19 | 3,336,156 | 2,081 | ||||||||
| 7 | U.S. Ultra Long Term Treasury Bond Future | Dec-19 | 1,343,344 | (22,520 | ) | |||||||
| 32 | Wheat Future (d) | Dec-19 | 793,200 | 13,033 | ||||||||
| 32,985 | ||||||||||||
| Net Unrealized Depreciation on Futures Contracts | $ | (57,761 | ) | |||||||||
| (d) | Position held in a wholly-owned and controlled subsidiary organized in the Cayman Islands and consolidated for financial reporting purposes. |
The accompanying notes are an integral part of these consolidated financial statements.
16
| Equinox Campbell Strategy Fund |
| CONSOLIDATED STATEMENT OF ASSETS AND LIABILITIES |
| September 30, 2019 |
| ASSETS: | ||||
| Investments at cost | $ | 58,375,638 | ||
| Investments at value | $ | 58,482,975 | ||
| Cash and cash equivalents | 11,017,335 | |||
| Deposits for futures contracts(1) | 2,231,560 | |||
| Deposits for forward currency contracts(2) | 7,048,323 | |||
| Net unrealized appreciation on forward currency contracts | 559,707 | |||
| Receivable for Fund shares sold | 192,556 | |||
| Interest receivable | 306,322 | |||
| Spot trades receivable | 72,187,298 | |||
| Prepaid expenses and other assets | 33,936 | |||
| Total assets | 152,060,012 | |||
| LIABILITIES: | ||||
| Net unrealized depreciation on futures contracts | 57,761 | |||
| Payable for Fund shares redeemed | 90,859 | |||
| Payable to Adviser | 138,005 | |||
| Accrued distribution fees | 14,081 | |||
| Spot trades payable | 72,187,298 | |||
| Accrued expenses | 135,940 | |||
| Total liabilities | 72,623,944 | |||
| Net Assets | $ | 79,436,068 | ||
| NET ASSETS CONSIST OF: | ||||
| Paid in capital | $ | 67,520,984 | ||
| Accumulated gains | 11,915,084 | |||
| Net Assets | $ | 79,436,068 | ||
| Class A Shares | ||||
| Net Assets | $ | 12,895,083 | ||
| Issued and outstanding (unlimited shares authorized, no par value) | 1,314,070 | |||
| Net Asset Value and Redemption Price Per Share | $ | 9.81 | ||
| Maximum offering price per share (maximum sales charge of 5.75%)(3) | $ | 10.41 | ||
| Class C Shares | ||||
| Net Assets | $ | 13,237,383 | ||
| Issued and outstanding (unlimited shares authorized, no par value) | 1,391,618 | |||
| Net Asset Value, Redemption Price and Offering Price Per Share(3) | $ | 9.51 | ||
| Class I Shares | ||||
| Net Assets | $ | 51,066,588 | ||
| Issued and outstanding (unlimited shares authorized, no par value) | 5,143,955 | |||
| Net Asset Value, Redemption Price and Offering Price Per Share | $ | 9.93 | ||
| Class P Shares | ||||
| Net Assets | $ | 2,237,014 | ||
| Issued and outstanding (unlimited shares authorized, no par value) | 221,523 | |||
| Net Asset Value, Redemption Price and Offering Price Per Share | $ | 10.10 | ||
| (1) | Pledged as collateral for open futures contracts. |
| (2) | Pledged as collateral for open forward currency contracts. |
| (3) | A contingent deferred sales charge (“CDSC”) of 1.00% is assessed on certain redemptions of Class A shares made within 12 months after a purchase of Class A shares where no initial sales charge was paid at the time of purchase as part of an investment of $1,000,000 or more. A CDSC of 1.00% is assessed on redemptions of Class C shares made within one year after a purchase of such shares. |
The accompanying notes are an integral part of these consolidated financial statements.
17
| Equinox Campbell Strategy Fund |
| CONSOLIDATED STATEMENT OF OPERATIONS |
| For the Year Ended September 30, 2019 |
| INVESTMENT INCOME: | ||||
| Interest income | $ | 1,889,872 | ||
| Total investment income | 1,889,872 | |||
| EXPENSES: | ||||
| Investment advisory fees | 1,489,384 | |||
| Distribution (12b-1) fees | 171,292 | |||
| Transfer agent fees | 157,827 | |||
| Fund administration and accounting fees | 72,977 | |||
| Federal and state registration fees | 57,676 | |||
| Audit and tax fees | 50,771 | |||
| Legal fees | 47,066 | |||
| Interest expense | 42,271 | |||
| Reports to shareholders | 34,895 | |||
| Compliance officer fees | 16,368 | |||
| Trustees fees and related expenses | 11,661 | |||
| Custody fees | 11,157 | |||
| Other | 81,786 | |||
| Total expenses before waiver and reimbursement | 2,245,131 | |||
| Less: Expenses waived/reimbursed by the Adviser | (393,523 | ) | ||
| Net expenses | 1,851,608 | |||
| Net Investment Income | 38,264 | |||
| REALIZED AND UNREALIZED GAIN (LOSS) ON INVESTMENTS | ||||
| Net realized gain (loss) on: | ||||
| Investments | (74,519 | ) | ||
| Futures contracts | 11,032,603 | |||
| Forward currency contracts | (118,937 | ) | ||
| Foreign currency translations | 125,760 | |||
| Change in net unrealized appreciation (depreciation) on: | ||||
| Investments | 359,337 | |||
| Futures contracts | (4,643,373 | ) | ||
| Forward currency contracts | 2,450,217 | |||
| Foreign currency | 26,859 | |||
| Net Realized and Unrealized Gain on Investments | 9,157,947 | |||
| Net Increase in Net Assets Resulting from Operations | $ | 9,196,211 | ||
The accompanying notes are an integral part of these consolidated financial statements.
18
| Equinox Campbell Strategy Fund |
| CONSOLIDATED STATEMENTS OF CHANGES IN NET ASSETS |
| For the | For the | |||||||
| Year Ended | Year Ended | |||||||
| September 30, 2019 | September 30, 2018 | |||||||
| OPERATIONS: | ||||||||
| Net investment gain (loss) | $ | 38,264 | $ | (546,129 | ) | |||
| Net realized gain (loss) on: | ||||||||
| Investments | (74,519 | ) | (168,491 | ) | ||||
| Futures contracts | 11,032,603 | (1,646,893 | ) | |||||
| Forward currency contracts | (118,937 | ) | (523,944 | ) | ||||
| Swap contract | — | (73,094,363 | ) | |||||
| Foreign currency translations | 125,760 | (62,634 | ) | |||||
| Change in net unrealized appreciation/depreciation on: | ||||||||
| Investments | 359,337 | (138,416 | ) | |||||
| Futures contracts | (4,643,373 | ) | 4,585,612 | |||||
| Forward currency contracts | 2,450,217 | (1,890,510 | ) | |||||
| Swap contract | — | 86,280,900 | ||||||
| Foreign currency | 26,859 | (11,380 | ) | |||||
| Net increase in net assets resulting from operations | 9,196,211 | 12,783,752 | ||||||
| DISTRIBUTIONS TO SHAREHOLDERS: | ||||||||
| Class A | (1,625,433 | ) | — | |||||
| Class C | (1,606,101 | ) | — | |||||
| Class I | (9,547,706 | ) | — | |||||
| Class P | (291,436 | ) | — | |||||
| Net decrease in net assets resulting from distributions paid | (13,070,676 | ) | — | |||||
| CAPITAL SHARE TRANSACTIONS: | ||||||||
| Shares sold - Class A | 1,740,013 | 5,197,511 | ||||||
| Shares sold - Class C | 807,341 | 957,031 | ||||||
| Shares sold - Class I | 48,432,554 | 25,060,799 | ||||||
| Shares sold - Class P | 242,864 | 6,757,945 | ||||||
| Shares issued to holders in reinvestment of distributions - Class A | 1,510,075 | — | ||||||
| Shares issued to holders in reinvestment of distributions - Class C | 1,569,438 | — | ||||||
| Shares issued to holders in reinvestment of distributions - Class I | 7,632,232 | — | ||||||
| Shares issued to holders in reinvestment of distributions - Class P | 263,166 | — | ||||||
| Shares redeemed - Class A | (5,361,030 | ) | (14,837,731 | ) | ||||
| Shares redeemed - Class C | (5,039,019 | ) | (8,438,161 | ) | ||||
| Shares redeemed - Class I | (92,370,875 | ) | (226,159,641 | ) | ||||
| Shares redeemed - Class P | (30,245,677 | ) | (17,055,399 | ) | ||||
| Net decrease in net assets resulting from capital share transactions | (70,818,918 | ) | (228,517,646 | ) | ||||
| Total Decrease in Net Assets | (74,693,383 | ) | (215,733,894 | ) | ||||
| NET ASSETS: | ||||||||
| Beginning of Period | 154,129,451 | 369,863,345 | ||||||
| End of Period | $ | 79,436,068 | $ | 154,129,451 | (1) | |||
| TRANSACTIONS IN SHARES - CLASS A: | ||||||||
| Shares sold | 190,779 | 514,019 | ||||||
| Shares issued to holders in reinvestment of distributions | 185,285 | — | ||||||
| Shares redeemed | (616,034 | ) | (1,533,737 | ) | ||||
| Net decrease in shares outstanding | (239,970 | ) | (1,019,718 | ) | ||||
| TRANSACTIONS IN SHARES - CLASS C: | ||||||||
| Shares sold | 90,650 | 100,123 | ||||||
| Shares issued to holders in reinvestment of distributions | 197,413 | — | ||||||
| Shares redeemed | (600,031 | ) | (888,459 | ) | ||||
| Net decrease in shares outstanding | (311,968 | ) | (788,336 | ) | ||||
| TRANSACTIONS IN SHARES - CLASS I: | ||||||||
| Shares sold | 5,483,361 | 2,539,907 | ||||||
| Shares issued to holders in reinvestment of distributions | 927,366 | — | ||||||
| Shares redeemed | (10,591,009 | ) | (22,790,718 | ) | ||||
| Net decrease in shares outstanding | (4,180,282 | ) | (20,250,811 | ) | ||||
| TRANSACTIONS IN SHARES - CLASS P: | ||||||||
| Shares sold | 25,638 | 681,411 | ||||||
| Shares issued to holders in reinvestment of distributions | 31,367 | — | ||||||
| Shares redeemed | (3,411,713 | ) | (1,741,226 | ) | ||||
| Net decrease in shares outstanding | (3,354,708 | ) | (1,059,815 | ) | ||||
| (1) | Includes undistributed net investment income of $13,070,676. |
The accompanying notes are an integral part of these consolidated financial statements.
19
| Equinox Campbell Strategy Fund |
| CONSOLIDATED FINANCIAL HIGHLIGHTS |
| Per Share Data and Ratios for a Share of Beneficial Interest Outstanding Throughout Each Period |
| Class A | ||||||||||||||||||||
| Year Ended | Year Ended | Year Ended | Year Ended | Year Ended | ||||||||||||||||
| September 30, | September 30, | September 30, | September 30, | September 30, | ||||||||||||||||
| 2019 | 2018 | 2017 | 2016 | 2015 | ||||||||||||||||
| Net Asset Value, Beginning of Period | $ | 9.49 | $ | 9.36 | $ | 10.13 | $ | 11.17 | $ | 11.01 | ||||||||||
| INCOME (LOSS) FROM INVESTMENT OPERATIONS: | ||||||||||||||||||||
| Net investment income (loss)(1) | — | (2) | (0.03 | ) | (0.04 | ) | (0.09 | ) | (0.13 | ) | ||||||||||
| Net realized and unrealized gain (loss) on investments, futures, forward currency and swap contracts(3) | 1.45 | 0.16 | (0.73 | ) | (0.74 | ) | 0.97 | |||||||||||||
| Total Income (Loss) from Investment Operations | 1 .45 | 0.13 | (0.77 | ) | (0.83 | ) | 0.84 | |||||||||||||
| LESS DISTRIBUTIONS: | ||||||||||||||||||||
| From net investment income | (1.13 | ) | — | — | (0.21 | ) | (0.68 | ) | ||||||||||||
| Total Distributions | (1.13 | ) | — | — | (0.21 | ) | (0.68 | ) | ||||||||||||
| Net Asset Value, End of Period | $ | 9.81 | $ | 9.49 | $ | 9.36 | $ | 10.13 | $ | 11.17 | ||||||||||
| Total Return(4) | 17.73 | % | 1.39 | % | (7.60 | )% | (7.60 | )% | 7.48 | % | ||||||||||
| SUPPLEMENTAL DATA AND RATIOS: | ||||||||||||||||||||
| Net assets, end of period (in thousands) | $ | 12,895 | $ | 14,744 | $ | 24,092 | $ | 64,528 | $ | 83,077 | ||||||||||
| Ratio of gross expenses to average net assets (including interest expense)(5)(6)(7) | 2.54 | % | 1.96 | % | 1.33 | % | 1.25 | % | 1.24 | % | ||||||||||
| Ratio of net expenses to average net assets (including interest expense)(8)(7) | 2.12 | % | 1.58 | % | 1.15 | % | 1.17 | % | 1.15 | % | ||||||||||
| Ratio of net investment income (loss) to average net assets | (0.03 | )% | (0.32 | )% | (0.45 | )% | (0.83 | )% | (1.08 | )% | ||||||||||
| Portfolio turnover rate(9) | 15 | % | 122 | % | 0 | % | 0 | % | 0 | % | ||||||||||
| (1) | Per share amounts are calculated using the average shares method, which more appropriately presents the per share data for the period. |
| (2) | Less than $0.005 per share. |
| (3) | Realized and unrealized gain (loss) per share in this caption is a balancing amount necessary to reconcile the change in net asset value per share for the period, and may not reconcile with the aggregate gain (loss) in the statement of operations due to the timing of share transactions for the period. |
| (4) | Total returns are historical and assume changes in share price and reinvestment of dividends and distributions. Total returns shown exclude the effect of the maximum applicable sales charges of 5.75% and, if applicable, wire redemption fees. Had the Adviser not waived its fees or reimbursed a portion of the Fund’s expenses, the returns would have been lower. |
| (5) | Represents the ratio of expenses to average net assets absent fee waivers and/or expense reimbursements by the Adviser. |
| (6) | Ratio of gross expenses to average net assets excluding interest expense(5) | 2.49 | % | 1.96 | % | 1.33 | % | 1.23 | % | 1.24 | % |
| (7) | Ratio of net expenses to average net assets excluding interest expense | 2.07 | % | 1.58 | % | 1.15 | % | 1.15 | % | 1.15 | % |
| (8) | Portfolio turnover is calculated on the basis of the Fund as a whole without distinguishing between the classes of shares issued. |
| (9) | See Note 4 in Notes to Consolidated Financial Statements for changes to the Fund’s expense limitation agreement that took effect February 1, 2019. |
The accompanying notes are an integral part of these consolidated financial statements.
20
Equinox Campbell Strategy Fund
CONSOLIDATED FINANCIAL HIGHLIGHTS
Per Share Data and Ratios for a Share of Beneficial Interest Outstanding Throughout Each Period
| Class C | ||||||||||||||||||||
| Year Ended | Year Ended | Year Ended | Year Ended | Year Ended | ||||||||||||||||
| September 30, | September 30, | September 30, | September 30, | September 30, | ||||||||||||||||
| 2019 | 2018 | 2017 | 2016 | 2015 | ||||||||||||||||
| Net Asset Value, Beginning of Period | $ | 9.20 | $ | 9.15 | $ | 9.98 | $ | 11.03 | $ | 10.96 | ||||||||||
| INCOME (LOSS) FROM INVESTMENT OPERATIONS: | ||||||||||||||||||||
| Net investment loss(1) | (0.07 | ) | (0.10 | ) | (0.11 | ) | (0.17 | ) | (0.21 | ) | ||||||||||
| Net realized and unrealized gain (loss) on investments, futures, forward currency and swap contracts(2) | 1.42 | 0.15 | (0.72 | ) | (0.72 | ) | 0.97 | |||||||||||||
| Total Income (Loss) from Investment Operations | 1.35 | 0.05 | (0.83 | ) | (0.89 | ) | 0.76 | |||||||||||||
| LESS DISTRIBUTIONS: | ||||||||||||||||||||
| From net investment income | (1.04 | ) | — | — | (0.16 | ) | (0.69 | ) | ||||||||||||
| Total Distributions | (1.04 | ) | — | — | (0.16 | ) | (0.69 | ) | ||||||||||||
| Net Asset Value, End of Period | $ | 9.51 | $ | 9.20 | $ | 9.15 | $ | 9.98 | $ | 11.03 | ||||||||||
| Total Return(3) | 16.88 | % | 0.55 | % | (8.32 | )% | (8.16 | )% | 6.72 | % | ||||||||||
| SUPPLEMENTAL DATA AND RATIOS: | ||||||||||||||||||||
| Net assets, end of period (in thousands) | $ | 13,237 | $ | 15,676 | $ | 22,792 | $ | 48,712 | $ | 52,977 | ||||||||||
| Ratio of gross expenses to average net assets (including interest expense)(4)(5)(8) | 3.29 | % | 2.74 | % | 2.08 | % | 2.00 | % | 1.99 | % | ||||||||||
| Ratio of net expenses to average net assets (including interest expense)(6)(8) | 2.87 | % | 2.35 | % | 1.90 | % | 1.92 | % | 1.90 | % | ||||||||||
| Ratio of net investment loss to average net assets | (0.78 | )% | (1.05 | )% | (1.19 | )% | (1.58 | )% | (1.82 | )% | ||||||||||
| Portfolio turnover rate(7) | 15 | % | 122 | % | 0 | % | 0 | % | 0 | % | ||||||||||
| (1) | Per share amounts are calculated using the average shares method, which more appropriately presents the per share data for the period. |
| (2) | Realized and unrealized gain (loss) per share in this caption is a balancing amount necessary to reconcile the change in net asset value per share for the period, and may not reconcile with the aggregate gain (loss) in the statement of operations due to the timing of share transactions for the period. |
| (3) | Total returns are historical and assume changes in share price and reinvestment of dividends and distributions. Total returns for periods of less than one year are not annualized. Had the Adviser not waived its fees or reimbursed a portion of the Fund’s expenses, the returns would have been lower. |
| (4) | Represents the ratio of expenses to average net assets absent fee waivers and/or expense reimbursements by the Adviser. |
| (5) | Ratio of gross expenses to average net assets excluding interest expense(4) | 3.24 | % | 2.74 | % | 2.08 | % | 1.98 | % | 1.99 | % |
| (6) | Ratio of net expenses to average net assets excluding interest expense | 2.82 | % | 2.35 | % | 1.90 | % | 1.90 | % | 1.90 | % | ||||||||||
| (7) | Portfolio turnover is calculated on the basis of the Fund as a whole without distinguishing between the classes of shares issued. |
| (8) | See Note 4 in Notes to Consolidated Financial Statements for changes to the Fund’s expense limitation agreement that took effect February 1, 2019. |
The accompanying notes are an integral part of these consolidated financial statements.
21
Equinox Campbell Strategy Fund
CONSOLIDATED FINANCIAL HIGHLIGHTS
Per Share Data and Ratios for a Share of Beneficial Interest Outstanding Throughout Each Period
| Class I | ||||||||||||||||||||
| Year Ended | Year Ended | Year Ended | Year Ended | Year Ended | ||||||||||||||||
| September 30, | September 30, | September 30, | September 30, | September 30, | ||||||||||||||||
| 2019 | 2018 | 2017 | 2016 | 2015 | ||||||||||||||||
| Net Asset Value, Beginning of Period | $ | 9.59 | $ | 9.44 | $ | 10.20 | $ | 11.22 | $ | 11.05 | ||||||||||
| INCOME (LOSS) FROM INVESTMENT OPERATIONS: | ||||||||||||||||||||
| Net investment income (loss)(1) | 0.02 | (0.01 | ) | (0.02 | ) | (0.06 | ) | (0.09 | ) | |||||||||||
| Net realized and unrealized gain (loss) on investments, futures, forward currency and swap contracts(2) | 1.48 | 0.16 | (0.74 | ) | (0.73 | ) | 0.96 | |||||||||||||
| Total Income (Loss) from Investment Operations | 1.50 | 0.15 | (0.76 | ) | (0.79 | ) | 0.87 | |||||||||||||
| LESS DISTRIBUTIONS: | ||||||||||||||||||||
| From net investment income | (1.16 | ) | — | — | (0.23 | ) | (0.70 | ) | ||||||||||||
| Total Distributions | (1.16 | ) | — | — | (0.23 | ) | (0.70 | ) | ||||||||||||
| Net Asset Value, End of Period | $ | 9.93 | $ | 9.59 | $ | 9.44 | $ | 10.20 | $ | 11.22 | ||||||||||
| Total Return(3) | 18.17 | % | 1.59 | % | (7.45 | )% | (7.20 | )% | 7.72 | % | ||||||||||
| SUPPLEMENTAL DATA AND RATIOS: | ||||||||||||||||||||
| Net assets, end of period (in thousands) | $ | 51,067 | $ | 89,456 | $ | 279,212 | $ | 754,171 | $ | 984,152 | ||||||||||
| Ratio of gross expenses to average net assets (including interest expense)(4)(5)(8) | 2.28 | % | 1.64 | % | 1.07 | % | 1.00 | % | 0.99 | % | ||||||||||
| Ratio of net expenses to average net assets (including interest expense)(6)(8) | 1.84 | % | 1.30 | % | 0.90 | % | 0.92 | % | 0.90 | % | ||||||||||
| Ratio of net investment income (loss) to average net assets | 0.23 | % | (0.10 | )% | (0.20 | )% | (0.58 | )% | (0.81 | )% | ||||||||||
| Portfolio turnover rate(7) | 15 | % | 122 | % | 0 | % | 0 | % | 0 | % | ||||||||||
| (1) | Per share amounts are calculated using the average shares method, which more appropriately presents the per share data for the period. |
| (2) | Realized and unrealized gain (loss) per share in this caption is a balancing amount necessary to reconcile the change in net asset value per share for the period, and may not reconcile with the aggregate gain (loss) in the statement of operations due to the timing of share transactions for the period. |
| (3) | Total returns are historical and assume changes in share price and reinvestment of dividends and distributions. Total returns for periods of less than one year are not annualized. Had the Adviser not waived its fees or reimbursed a portion of the Fund’s expenses, the returns would have been lower. |
| (4) | Represents the ratio of expenses to average net assets absent fee waivers and/or expense reimbursements by the Adviser. |
| (5) | Ratio of gross expenses to average net assets excluding interest expense(4) | 2.24 | % | 1.64 | % | 1.07 | % | 0.98 | % | 0.99 | % |
| (6) | Ratio of net expenses to average net assets excluding interest expense | 1.80 | % | 1.30 | % | 0.90 | % | 0.90 | % | 0.90 | % | ||||||||||
| (7) | Portfolio turnover is calculated on the basis of the Fund as a whole without distinguishing between the classes of shares issued. |
| (8) | See Note 4 in Notes to Consolidated Financial Statements for changes to the Fund’s expense limitation agreement that took effect February 1, 2019. |
The accompanying notes are an integral part of these consolidated financial statements.
22
Equinox Campbell Strategy Fund
CONSOLIDATED FINANCIAL HIGHLIGHTS
Per Share Data and Ratios for a Share of Beneficial Interest Outstanding Throughout Each Period
| Class P | ||||||||||||||||||||
| Year Ended | Year Ended | Year Ended | Year Ended | Year Ended | ||||||||||||||||
| September 30, | September 30, | September 30, | September 30, | September 30, | ||||||||||||||||
| 2019 | 2018 | 2017 | 2016 | 2015 | ||||||||||||||||
| Net Asset Value, Beginning of Period | $ | 9.58 | $ | 9.44 | $ | 10.19 | $ | 11.22 | $ | 11.05 | ||||||||||
| INCOME (LOSS) FROM INVESTMENT OPERATIONS: | ||||||||||||||||||||
| Net investment income (loss)(1) | — | (2) | (0.02 | ) | (0.02 | ) | (0.06 | ) | (0.13 | ) | ||||||||||
| Net realized and unrealized gain (loss) on investments, futures, forward currency and swap contracts(3) | 1.46 | 0.16 | (0.73 | ) | (0.74 | ) | 1.00 | |||||||||||||
| Total Income (Loss) from Investment Operations | 1.46 | 0.14 | (0.75 | ) | (0.80 | ) | 0.87 | |||||||||||||
| LESS DISTRIBUTIONS: | ||||||||||||||||||||
| From net investment income | (0.94 | ) | — | — | (0.23 | ) | (0.70 | ) | ||||||||||||
| Total Distributions | (0.94 | ) | — | — | (0.23 | ) | (0.70 | ) | ||||||||||||
| Net Asset Value, End of Period | $ | 10.10 | $ | 9.58 | $ | 9.44 | $ | 10.19 | $ | 11.22 | ||||||||||
| Total Return(4) | 17.24 | % | 1.48 | % | (7.36 | )% | (7.29 | )% | 7.72 | % | ||||||||||
| SUPPLEMENTAL DATA AND RATIOS: | ||||||||||||||||||||
| Net assets, end of period (in thousands) | $ | 2,237 | $ | 34,253 | $ | 43,767 | $ | 99,612 | $ | 107,596 | ||||||||||
| Ratio of gross expenses to average net assets (including interest expense)(5)(6)(9) | 2.46 | % | 1.90 | % | 1.07 | % | 1.00 | % | 1.00 | % | ||||||||||
| Ratio of net expenses to average net assets (including interest expense)(7)(9) | 2.02 | % | 1.51 | % | 0.90 | % | 0.92 | % | 0.90 | % | ||||||||||
| Ratio of net investment income (loss) to average net assets | (0.01 | )% | (0.19 | )% | (0.19 | )% | (0.58 | )% | (1.09 | )% | ||||||||||
| Portfolio turnover rate(8) | 15 | % | 122 | % | 0 | % | 0 | % | 0 | % | ||||||||||
| (1) | Per share amounts are calculated using the average shares method, which more appropriately presents the per share data for the period. |
| (2) | Less than $0.005 per share. |
| (3) | Realized and unrealized gain (loss) per share in this caption is a balancing amount necessary to reconcile the change in net asset value per share for the period, and may not reconcile with the aggregate gain (loss) in the statement of operations due to the timing of share transactions for the period. |
| (4) | Total returns are historical and assume changes in share price and reinvestment of dividends and distributions. Total returns for periods of less than one year are not annualized. Had the Adviser not waived its fees or reimbursed a portion of the Fund’s expenses, the returns would have been lower. |
| (5) | Represents the ratio of expenses to average net assets absent fee waivers and/or expense reimbursements by the Adviser. |
| (6) | Ratio of gross expenses to average net assets excluding interest expense(5) | 2.46 | % | 1.90 | % | 1.07 | % | 0.98 | % | 1.00 | % |
| (7) | Ratio of net expenses to average net assets excluding interest expense | 2.02 | % | 1.51 | % | 0.90 | % | 0.90 | % | 0.90 | % | ||||||||||
| (8) | Portfolio turnover is calculated on the basis of the Fund as a whole without distinguishing between the classes of shares issued. |
| (9) | See Note 4 in Notes to Consolidated Financial Statements for changes to the Fund’s expense limitation agreement that took effect February 1, 2019. |
The accompanying notes are an integral part of these consolidated financial statements.
23
| Equinox Campbell Strategy Fund |
| NOTES TO CONSOLIDATED FINANCIAL STATEMENTS |
| September 30, 2019 |
| 1. | ORGANIZATION |
The Equinox Campbell Strategy Fund (the “Fund”) is a diversified series of shares of beneficial interest of Equinox Funds Trust (the “Trust”), a statutory trust organized under the laws of the State of Delaware on June 2, 2010, and is registered under the Investment Company Act of 1940, as amended (the “1940 Act”), as an open-end management investment company. The Fund began operations on March 4, 2013. The Fund currently offers Class A, Class C, Class I and Class P shares. Class A, Class I and Class P shares commenced operations on March 4, 2013. Class C commenced operations on February 11, 2014. The Fund has registered Class SI shares, however Class SI has not yet commenced operations. The investment objective of the Fund is to achieve long term capital appreciation.
Class C, Class I and Class P shares are offered at net asset value. Class A shares are offered at net asset value plus a maximum sales charge of 5.75%. A contingent deferred sales charge (“CDSC”) of 1.00% is assessed on certain redemptions of Class A shares made within twelve months after a purchase of Class A shares where no initial sales charge was paid at the time of purchase as part of an investment of $1,000,000 or more. A CDSC of 1.00% is assessed on redemptions of Class C shares made within twelve months after a purchase of such shares. Each class represents an interest in the same assets of the Fund and classes are identical except for differences in their sales charge structures and ongoing service and distribution charges. All classes of shares have equal voting privileges except that each class has exclusive voting rights with respect to its service and/or distribution plans. The Fund’s income, expenses (other than class specific distribution fees) and realized and unrealized gains and losses are allocated proportionately each day based upon the relative net assets of each class.
| 2. | SIGNIFICANT ACCOUNTING POLICIES |
The following is a summary of significant accounting policies followed by the Fund in preparation of its consolidated financial statements. The policies are in conformity with accounting principles generally accepted in the United States of America (“GAAP”). The preparation of the consolidated financial statements requires management to make estimates and assumptions that affect the reported amounts of assets and liabilities and disclosure of contingent assets and liabilities at the date of the consolidated financial statements and the reported amounts of income and expenses for the period. Actual results could differ from those estimates. The Fund is an investment company and accordingly follows the investment company accounting and reporting guidance of the Financial Accounting Standards Board (“FASB”) Accounting Standard Codification Topic 946 “Financial Services – Investment Companies” including FASB Accounting Standard Update ASU 2013-08.
Security Valuation– Securities, including exchange traded funds, listed on an exchange are valued at the last reported sale price at the close of the regular trading session of the exchange on the business day the value is being determined, or in the case of securities listed on NASDAQ at the NASDAQ Official Closing Price. In the absence of a sale such securities shall be valued at the mean between the current bid and ask prices on the primary exchange on the day of valuation. Debt securities (other than short-term obligations) are valued each day by an independent pricing service approved by the Board of Trustees (the “Board”) using methods which include current market quotations from a major market maker in the securities and based on methods which include the consideration of yields or prices of securities of comparable quality, coupon, maturity and type. Short-term debt obligations having 60 days or less remaining until maturity, at time of purchase, may be valued at amortized cost. Investments in open-end investment companies are valued at net asset value. Investments in swap contracts are reported at fair value based on daily price reporting from the swap counterparty. Forward currency contracts and futures are valued at the final settled price or, in the absence of a settled price, at the last sale price on the day of valuation.
The Fund may hold securities, such as private investments, interests in commodity pools, other non-traded securities or temporarily illiquid securities, for which market quotations are not readily available or are determined to be unreliable. These securities will be valued using the “fair value” procedures approved by the Board. The Board has delegated execution of these procedures to a fair value team composed of one or more representatives from each of the (i) Trust, (ii) administrator, and (iii) Adviser. The team may also enlist third party consultants such as a valuation specialist at a public accounting firm, valuation consultant, or financial officer of a security issuer on an as -needed basis to assist in determining a security-specific fair value. The Board reviews and ratifies the execution of this process and the resultant fair value prices at least quarterly to assure the process produces reliable results.
24
| Equinox Campbell Strategy Fund |
| NOTES TO CONSOLIDATED FINANCIAL STATEMENTS (Continued) |
| September 30, 2019 |
Fair Valuation Process– As noted above, the fair value team is composed of one or more representatives from each of the (i) Trust, (ii) administrator, and (iii) Adviser. The applicable investments are valued collectively via inputs from each of these groups. For example, fair value determinations are required for the following securities: (i) securities for which market quotations are insufficient or not readily available on a particular business day (including securities for which there is a short and temporary lapse in the provision of a price by the regular pricing source), (ii) securities for which, in the judgment of the Adviser, the prices or values available do not represent the fair value of the instrument. Factors which may cause the Adviser to make such a judgment include, but are not limited to, the following: only a bid price or an asked price is available; the spread between bid and asked prices is substantial; the frequency of sales; the thinness of the market; the size of reported trades; and actions of the securities markets, such as the suspension or limitation of trading; (iii) securities determined to be illiquid; and (iv) securities with respect to which an event that will affect the value thereof has occurred (a “significant event”) since the closing prices were established on the principal exchange on which they are traded, but prior to a Fund’s calculation of its net asset value. Specifically, interests in commodity pools or managed futures pools are valued on a daily basis by reference to the closing market prices of each futures contract or other asset held by a pool, as adjusted for pool expenses. Restricted or illiquid securities, such as private investments or non-traded securities are valued via inputs from the Adviser based upon the current bid for the security from two or more independent dealers or other parties reasonably familiar with the facts and circumstances of the security (who should take into consideration all relevant factors as may be appropriate under the circumstances). If the Adviser is unable to obtain a current bid from such independent dealers or other independent parties, the fair value team shall determine the fair value of such security using the following factors: (i) the type of security; (ii) the cost at date of purchase; (iii) the size and nature of the Fund’s holdings; (iv) the discount from market value of unrestricted securities of the same class at the time of purchase and subsequent thereto; (v) information as to any transactions or offers with respect to the security; (vi) the nature and duration of restrictions on disposition of the security and the existence of any registration rights; (vii) how the yield of the security compares to similar securities of companies of similar or equal creditworthiness; (viii) the level of recent trades of similar or comparable securities; (ix) the liquidity characteristics of the security; (x) current market conditions; and (xi) the market value of any securities into which the security is convertible or exchangeable.
The Fund utilizes various methods to measure the fair value of all of its investments on a recurring basis. GAAP establishes a hierarchy that prioritizes inputs to valuation methods. The three levels of input are:
Level 1 – Unadjusted quoted prices in active markets for identical assets and liabilities that the Fund has the ability to access.
Level 2 – Observable inputs other than quoted prices included in Level 1 that are observable for the asset or liability, either directly or indirectly. These inputs may include quoted prices for the identical instrument in an inactive market, prices for similar instruments, interest rates, prepayment speeds, credit risk, yield curves, default rates and similar data.
Level 3 – Unobservable inputs for the asset or liability, to the extent relevant observable inputs are not available, representing the Fund’s own assumptions about the assumptions a market participant would use in valuing the asset or liability, and would be based on the best information available.
The availability of observable inputs can vary from security to security and is affected by a wide variety of factors, including, for example, the type of security, whether the security is new and not yet established in the marketplace, the liquidity of markets, and other characteristics particular to the security. To the extent that valuation is based on models or inputs that are less observable or unobservable in the market, the determination of fair value requires more judgment. Accordingly, the degree of judgment exercised in determining fair value is greatest for instruments categorized in Level 3.
The inputs used to measure fair value may fall into different levels of the fair value hierarchy. In such cases, for disclosure purposes, the level in the fair value hierarchy within which the fair value measurement falls in its entirety, is determined based on the lowest level input that is significant to the fair value measurement in its entirety.
25
| Equinox Campbell Strategy Fund |
| NOTES TO CONSOLIDATED FINANCIAL STATEMENTS (Continued) |
| September 30, 2019 |
The inputs or methodology used for valuing securities are not necessarily an indication of the risk associated with investing in those securities. The following tables summarize the inputs used as of September 30, 2019 for the Fund’s assets and liabilities measured at fair value:
| Assets(a) | Level 1 | Level 2 | Level 3 | Total | ||||||||||||
| U.S. Treasury Notes | $ | — | $ | 58,482,975 | $ | — | $ | 58,482,975 | ||||||||
| Forward Currency Contracts(b) | 559,707 | — | — | 559,707 | ||||||||||||
| Total | $ | 559,707 | $ | 58,482,975 | $ | — | $ | 59,042,682 | ||||||||
| Liabilities(a) | Level 1 | Level 2 | Level 3 | Total | ||||||||||||
| Future Contracts(c) | $ | 57,761 | $ | — | $ | — | $ | 57,761 | ||||||||
| Total | $ | 57,761 | — | $ | — | $ | 57,761 | |||||||||
| (a) | See Consolidated Portfolio of Investments for more information related to the Fund’s investments. |
| (b) | Represents net unrealized appreciation of forward currency contracts. |
| (c) | Represents net unrealized depreciation of futures contracts. |
Consolidation of Subsidiaries– The Consolidated Financial Statements of the Fund include the accounts of its subsidiary, Equinox Campbell Strategy Fund Limited (“ECS-CFC”), a wholly-owned and controlled foreign corporation (“CFC”). All inter-company accounts and transactions have been eliminated in consolidation.
The Fund may invest up to 25% of its total assets in the ECS-CFC which acts as an investment vehicle in order to effect certain investments consistent with the Fund’s investment objectives and policies.
The ECS-CFC utilizes a diversified portfolio of futures contracts and futures-related instruments such as forwards and swaps in broadly diversified global markets across four major asset classes: currencies, fixed income, stock indices and commodities to facilitate the Fund’s pursuit of its investment objective. In accordance with its investment objective and through its exposure to the aforementioned derivative products, the Fund may have increased or decreased exposure to one or more of the risk factors defined in the Principal Investment Risks section of the Fund’s Prospectus.
A summary of the Fund’s investments in the ECS-CFC is as follows:
| ECS-CFC Net Assets at | % of Total Net Assets | |||||||
| Inception Date of ECS-CFC | September 30, 2019 | at September 30, 2019 | ||||||
| ECS-CFC | 3/4/2013 | $ | 2,480,105 | 3.12% | ||||
For tax purposes, ECS-CFC is an exempted Cayman investment company. ECS -CFC has received an undertaking from the Government of the Cayman Islands exempting it from all local income, profits and capital gains taxes. No such taxes are levied in the Cayman Islands at the present time. For U.S. income tax purposes, ECS-CFC is a CFC and as such is not subject to U.S. income tax. However, as a wholly-owned CFC, ECS-CFC’s net income and capital gains, to the extent of its earnings and profits, will be included each year in the Fund’s investment company taxable income.
Market Risk– Market risk is the risk that changes in interest rates, foreign exchange rates or equity prices will affect the positions held by the Fund. The Fund is exposed to market risk on financial instruments that are valued at market prices as disclosed in the schedule of investments. The prices of derivative instruments, including options, forwards and futures prices, can be highly volatile. Price movements of derivative contracts in which the Fund’s assets may be invested are influenced by, among other things, interest rates, changing supply and demand relationships, trade, fiscal, monetary and exchange control programs and policies of governments, and national and international political and economic events and policies. The Fund is exposed to market risk on derivative contracts in that the Fund may not be able to readily dispose of its holdings when it chooses and also that the price obtained on disposal is below that at which the investment is included in Fund’s consolidated financial statements. All financial instruments are recognized
26
| Equinox Campbell Strategy Fund |
| NOTES TO CONSOLIDATED FINANCIAL STATEMENTS (Continued) |
| September 30, 2019 |
at fair value, and all changes in market conditions directly affect net income. The Fund’s investments in derivative instruments are exposed to market risk and are disclosed in the consolidated portfolio of investments.
Credit Risk– Credit risk relates to the ability of the issuer to meet interest and principal payments, or both, as they come due. In general, lower-grade, higher-yield bonds are subject to credit risk to a greater extent than lower-yield, higher-quality bonds.
Counterparty Risk– Counterparty risk, including swap counterparty risk, is the risk that the counterparty to a financial instrument will cause a financial loss for the Fund by failing to discharge an obligation. A concentration of counterparty risk exists in that part of the Fund’s cash is held at the broker. The Fund could be unable to recover assets held at the broker, including assets directly traceable to the Fund, in the event of the broker’s bankruptcy. The Fund does not anticipate any material losses as a result of this concentration.
Security Transactions and Related Income– Security transactions are accounted for on trade date basis. Interest income is recognized on an accrual basis. Discounts are accreted and premiums are amortized on securities purchased over the lives of the respective securities. Dividend income is recorded on the ex-dividend date. Realized gains or losses from sales of securities are determined by comparing the identified cost of the security lot sold with the net sales proceeds.
Dividends and Distributions to Shareholders– Dividends from net investment income, if any, are declared and paid at least annually. Distributable net realized capital gains, if any, are declared and distributed annually. Dividends from net investment income and distributions from net realized gains are determined in accordance with federal income tax regulations, which may differ from GAAP. These “book/tax” differences are considered either temporary (i.e., deferred losses, capital loss carry forwards) or permanent in nature. To the extent these differences are permanent in nature, such amounts are reclassified within the composition of net assets based on their federal tax-basis treatment; temporary differences do not require reclassification. Dividends and distributions to shareholders are recorded on ex-dividend date.
Cash and Cash Equivalents– Cash and cash equivalents include cash and overnight investments in interest-bearing demand deposits with a financial institution with original maturities of three months or less. The Fund maintains deposits with a high quality financial institution in an amount that is in excess of federally insured limits.
Federal Income Tax– The Fund intends to continue to comply with the requirements of the Internal Revenue Code of 1986, as amended, applicable to regulated investment companies and to distribute all of its taxable income to its shareholders. Therefore, no provision for Federal income tax is required. The Fund recognizes the tax benefits of uncertain tax positions only where the position is “more likely than not” to be sustained assuming examination by tax authorities. Management has analyzed all open tax years and concluded that there is no effect to the Fund’s financial position or results of operations and no tax liability resulting from unrecognized tax benefits relating to uncertain income tax positions taken or expected to be taken on a tax return. Open tax years are those years that are open for examination by the relevant income taxing authority. As of September 30, 2019, open federal and state income tax years include the tax years ended September 30, 2016, September 30, 2017, September 30, 2018 and September 30, 2019. The Fund identifies its major tax jurisdictions as U.S. Federal, Colorado and foreign jurisdictions where the Fund makes significant investments; however, the Fund is not aware of any tax positions for which it is reasonably possible that the total amounts of unrecognized tax benefits will change materially in the next twelve months.
Allocation of Expenses– Expenses incurred by the Trust that do not relate to a specific fund of the Trust are allocated to the individual funds based on each fund’s relative net assets or another appropriate basis. Expenses specifically attributable to a particular fund in the Trust are borne by that fund. Other expenses are allocated to each fund based on its net assets in relation to the total net assets of all the applicable funds in the Trust or another reasonable basis.
Futures Contracts– The Fund is subject to equity price risk in the normal course of pursuing its investment objectives. The Fund purchases and sells futures contracts to pursue its investment objective, hedge against market risk, and to reduce return volatility. Initial margin deposits required upon entering into futures contracts are satisfied by the segregation of specific securities or cash as collateral for the account of the broker (the Portfolio’s agent in
27
| Equinox Campbell Strategy Fund |
| NOTES TO CONSOLIDATED FINANCIAL STATEMENTS (Continued) |
| September 30, 2019 |
acquiring the futures position). During the period the futures contracts are open, changes in the value of the contracts are recognized as unrealized gains or losses by “marking to market” on a daily basis to reflect the market value of the contracts at the end of each day’s trading. Variation margin payments are received or made depending upon whether unrealized gains or losses are incurred. When the contracts are closed, the Fund recognizes a realized gain or loss equal to the difference between the proceeds from, or cost of, the closing transaction and the Fund’s basis in the contract. If a Fund were unable to liquidate a futures contract and/or enter into an offsetting closing transaction, the Fund would continue to be subject to market risk with respect to the value of the contracts and continue to be required to maintain the margin deposits on the futures contracts. The Fund segregates liquid securities having a value at least equal to the amount of the current obligation under any open futures contract. Risks may exceed amounts recognized in the Consolidated Statement of Assets and Liabilities. With futures, there is minimal counterparty credit risk to the Fund since futures are exchange traded and the exchange’s clearinghouse, as counterparty to all exchange traded futures, guarantees the futures against default. The Fund’s Consolidated Statement of Operations includes interest income earned and interest expense paid in the amounts of $1,780,961 and $42,271, respectively, on deposits and margin balances held, respectively, at the counterparty. For the fiscal year ended September 30, 2019, the Fund had a net change in unrealized depreciation of $(4,643,373) and a net realized gain of $11,032,603 from futures contracts.
Forward Currency Contracts– The Fund may enter into forward currency contracts. When entering into a forward currency contract, in the case of a deliverable contract the Fund agrees to receive or deliver a fixed quantity of foreign currency for an agreed-upon price on an agreed future date or in the case of a non-deliverable contract to settle the equivalent in U.S. dollar. The Fund’s net equity therein, representing unrealized gain or loss on the contracts as measured by the difference between the forward foreign exchange rates at the dates of entry into the contracts and the forward rates at the reporting date. These instruments may involve market risk from movements in currencies or credit risk from the possible inability of counterparties to meet the terms of their contracts. For the fiscal year ended September 30, 2019, the Fund had a net change in unrealized appreciation of $2,450,217 and a net realized loss of $(118,937) from forward currency contracts.
Foreign Currency Spot Contracts– The Funds may enter into foreign currency spot contracts to facilitate transactions in foreign securities or to convert foreign currency receipts into U.S. dollars. A foreign currency spot contract is an agreement between two parties to buy and sell currencies at the current market rate, for settlement generally within two business days. The U.S. dollar value of the contracts is determined using current currency exchange rates supplied by a pricing service.
The contract is marked-to-market daily for settlements beyond one day and any change in market value is recorded as an unrealized gain or loss. When the contract is closed, a realized gain or loss is recorded equal to the difference between the value on the open and close date. Losses may arise from changes in the value of the foreign currency, or if the counterparties do not perform under the contract’s terms. The maximum potential loss from such contracts is the aggregate face value in U.S. dollars at the time the contract was opened.
28
| Equinox Campbell Strategy Fund |
| NOTES TO CONSOLIDATED FINANCIAL STATEMENTS (Continued) |
| September 30, 2019 |
Offsetting of Financial Assets and Derivative Assets -It is the Fund’s policy to recognize a net asset or liability equal to the unrealized appreciation (depreciation) of forward and futures contracts. As of September 30, 2019, the Fund is subject to a master netting arrangement for the forward and futures contracts. The following table sets forth the Fund’s net exposure for forward and futures contracts that are subject to an enforceable master netting arrangement as of September 30, 2019:
| Gross Amounts Not Offset in the | ||||||||||||||||||||||||
| Consolidated Statement of Assets & | ||||||||||||||||||||||||
| Liabilities | ||||||||||||||||||||||||
| Gross Amounts | ||||||||||||||||||||||||
| Offset in the | Net Amounts | |||||||||||||||||||||||
| Gross Amounts | Consolidated | Presented in the | ||||||||||||||||||||||
| of Recognized | Statement of Assets & | Consolidated Statement of | Financial | Cash Collateral | ||||||||||||||||||||
| Description | Liabilities | Liabilities | Assets & Liabilities | Instruments | Pledged* | Net Amount | ||||||||||||||||||
| Forward Contracts | $ | (2,383,455 | ) ** | $ | 2,943,162 | ** | $ | 559,707 | $ | — | $ | — | $ | 559,707 | ||||||||||
| Futures Contracts | (2,075,740 | ) ** | 2,017,979 | ** | (57,761 | ) | — | $ | 57,761 | $ | — | |||||||||||||
| Total | $ | (4,459,195 | ) | $ | 4,961,141 | $ | 501,946 | $ | — | $ | 57,761 | $ | 559,707 | |||||||||||
| * | Any over-collateralization of total financial instruments or cash is not shown. The amounts held as collateral for forwards and futures contracts are $7,048,323 and $2,231,560, respectively, and are shown on the Consolidated Statement of Assets and Liabilities. |
| ** | See Consolidated Portfolio of Investments for breakout of gross unrealized appreciation and depreciation by forward and futures contract. |
Impact of Derivatives on the Consolidated Statement of Assets and Liabilities and Consolidated Statement of Operations
The following is a summary of the location of derivative investments on the Consolidated Statement of Assets and Liabilities as of September 30, 2019:
| Location on the Consolidated Statement of Assets and Liabilities | ||||
| Derivatives Investment Type | Asset Derivatives | Liability Derivatives | ||
| Equity/Currency/Commodity/Interest Rate Contracts | Net unrealized appreciation on forward currency contracts | Net unrealized depreciation on futures contracts | ||
The following table sets forth the fair value of the Fund’s derivative contracts by primary risk exposure as of September 30, 2019:
| Derivatives Investment Fair Value | ||||||||||||||||||||
| Equity | Interest Rate | Currency | Commodity | Total | ||||||||||||||||
| Forward Contracts | $ | — | $ | — | $ | 559,707 | $ | — | $ | 559,707 | ||||||||||
| Futures Contracts | $ | 302,873 | $ | (460,093 | ) | $ | — | $ | 99,459 | $ | (57,761 | ) | ||||||||
| Total | $ | 302,873 | $ | (460,093 | ) | $ | 559,707 | $ | 99,459 | $ | 501,946 | |||||||||
The following is a summary of the location of derivative investments on the Fund’s Consolidated Statement of Operations for the period ended September 30, 2019:
| Derivative Investment Type | Location of Gain (Loss) on Derivatives |
| Equity/Currency/Commodity/Interest Rate Contracts | Net realized gain (loss) on forward currency and futures contracts; Net change in unrealized appreciation (depreciation) on forward currency and futures contracts |
29
| Equinox Campbell Strategy Fund |
| NOTES TO CONSOLIDATED FINANCIAL STATEMENTS (Continued) |
| September 30, 2019 |
The following table sets forth the Fund’s realized and unrealized gain (loss) on derivative investments recognized in the Consolidated Statement of Operations categorized by primary risk exposure for the period ended September 30, 2019:
| Net change in unrealized appreciation (depreciation) on derivatives recognized in the Consolidated Statement of | ||||||||||||||||||||
| Operations | ||||||||||||||||||||
| Equity | Interest Rate | Currency | Commodity | Total | ||||||||||||||||
| Forward Contracts | $ | — | $ | — | $ | 2,450,217 | $ | — | $ | 2,450,217 | ||||||||||
| Futures Contracts | $ | (1,138,674 | ) | $ | (1,333,836 | ) | $ | — | $ | (2,170,863 | ) | $ | (4,643,373 | ) | ||||||
| Total | $ | (1,138,674 | ) | $ | (1,333,836 | ) | $ | 2,450,217 | $ | (2,170,863 | ) | $ | (2,193,156 | ) | ||||||
| Net realized gain (loss) on derivatives recognized in the Consolidated Statement of Operations | ||||||||||||||||||||
| Equity | Interest Rate | Currency | Commodity | Total | ||||||||||||||||
| Forward Contracts | $ | — | $ | — | $ | (118,937 | ) | $ | — | $ | (118,937 | ) | ||||||||
| Futures Contracts | $ | (783,007 | ) | $ | 14,719,690 | $ | — | $ | (2,904,080 | ) | $ | 11,032,603 | ||||||||
| Total | $ | (783,007 | ) | $ | 14,719,690 | $ | (118,937 | ) | $ | (2,904,080 | ) | $ | 10,913,666 | |||||||
The average monthly volume of derivative instruments held by the Fund during the fiscal year ended September 30, 2019 is set forth below:
| Derivative Type | Unit of Measure | Average Quantity | ||||
| Futures – Long | Notional Amount | $ | 955,790,860 | |||
| Futures – Short | Notional Amount | $ | (344,375,248 | ) | ||
| Forwards – Long | Notional Amount | $ | 1,432,193,619 | |||
| Forwards – Short | Notional Amount | $ | (1,431,623,446 | ) | ||
Foreign Currency Transactions –All assets and liabilities denominated in foreign currencies are translated into U.S. dollars based on the rate of exchange of such currencies against U.S. dollars on the date of valuation. Purchases and sales of securities and income and expenses are translated at the rate of exchange quoted on the respective date that such transactions are recorded. The Fund does not isolate that portion of the results of operations resulting from changes in foreign exchange rates on investments from the fluctuations arising from changes in market prices of securities held. Such fluctuations are included with the net realized and unrealized gain or loss on investments.
Indemnification –The Trust indemnifies its officers and trustees for certain liabilities that may arise from the performance of their duties to the Trust. Additionally, in the normal course of business, the Fund enters into contracts that contain a variety of representations and warranties and which provide general indemnities. The Fund’s maximum exposure under these arrangements is unknown, as this would involve future claims that may be made against the Fund that have not yet occurred. However, based on experience, the risk of loss due to these warranties and indemnities appears to be remote.
| 3. | INVESTMENT TRANSACTIONS |
For the year ended September 30, 2019, the cost of purchases and proceeds from the sale of securities, other than short-term securities and short-term U.S. Government securities, amounted to $9,638,415 and $86,996,683 respectively.
30
| Equinox Campbell Strategy Fund |
| NOTES TO CONSOLIDATED FINANCIAL STATEMENTS (Continued) |
| September 30, 2019 |
| 4. | INVESTMENT ADVISORY AGREEMENT AND TRANSACTIONS WITH RELATED PARTIES |
Equinox Institutional Asset Management, LP serves as the Fund’s Investment Adviser (the “Adviser”). Pursuant to an Advisory Agreement with the Fund, the Adviser, under the oversight of the Board, directs the daily operations of the Fund and supervises the performance of administrative and professional services provided by others. As compensation for its services and the related expenses borne by the Adviser, the Fund pays the Adviser a management fee, computed and accrued daily and paid monthly, at an annual rate of 1.64% of the Fund’s average daily net assets. For the fiscal year ended September 30, 2019, the Fund incurred Advisory fees of $ 1,489,384. The advisory fee payable at September 30, 2019, in the amount of $138,005 was paid in October 2019. Effective February 15, 2018, the Adviser entered into a sub-advisory agreement with Campbell & Company Investment Adviser LLC (the “Sub-Adviser”) to serve as the Fund’s Sub -Adviser. The Sub -Adviser’s compensation is based on assets under management and is paid out of the Adviser’s fee received from the Fund.
Under the terms of the expense limitation agreement, effective February 1, 2019, the Adviser and Sub-Adviser have each contractually agreed to reduce its Advisory fee and/or reimburse certain expenses of the Fund, to ensure that the Fund’s total annual operating expenses, excluding (i) taxes, (ii) interest, (iii) extraordinary items, (iv) Acquired Fund Fees and Expenses, (v) brokerage commissions, and (vi) any class-specific expenses (such as Rule 12b-1 distribution fees, shareholder service fees, or transfer agency fees) do not exceed, on an annual basis, the expense limitations listed below. The expense limitations will remain in effect until January 31, 2020, but can be terminated by the Fund’s Board of Trustees on 60 days’ written notice to the Adviser.
| Expense Limitation | ||
| Class | As of September 30, 2019 | |
| Equinox Campbell Strategy Fund – Class A | 2.14% | |
| Equinox Campbell Strategy Fund – Class C | 2.89% | |
| Equinox Campbell Strategy Fund – Class I | 1.89% | |
| Equinox Campbell Strategy Fund – Class P | 2.14% | |
Prior to February 1, 2019, the Fund’s expense limitations were as listed below.
| Expense Limitation | ||
| Class | Prior to February 1, 2019 | |
| Equinox Campbell Strategy Fund – Class A | 1.94% | |
| Equinox Campbell Strategy Fund – Class C | 2.69% | |
| Equinox Campbell Strategy Fund – Class I | 1.69% | |
| Equinox Campbell Strategy Fund – Class P | 1.94% | |
The Adviser and Sub-Adviser shall be entitled to recover, subject to approval by the Board of Trustees of the Trust, such waived or reimbursed amounts for a period of up to three (3) years from the year in which the Adviser and Sub-Adviser reduced their compensation and/or assumed expenses of the Fund. The Adviser and Sub-Adviser are permitted to seek reimbursement from the Fund, subject to certain limitations, for fees they waived and Fund expenses they paid to the extent the total annual fund operating expenses for a Class do not exceed the lesser of the limits in effect at the time of reimbursement or the limits in effect at the time the expenses were waived. No recoupment will occur unless a Fund’s operating expenses are below the expense limitation amount. For the fiscal year ended September 30, 2019, the Adviser and Sub-Adviser waived fees of $393,523.
The following table shows the waived or reimbursed expenses subject to potential recovery by the Adviser and Sub-Adviser expiring on:
| September 30, 2020 | $ | 947,515 | ||
| September 30, 2021 | $ | 1,015,836 | ||
| September 30, 2022 | $ | 393,523 | ||
The Board has adopted a Distribution Plan (the “Plan”) pursuant to Rule 12b-1 under the 1940 Act. The Plan provides that a monthly service and/or distribution fee is calculated by the Fund at an annual rate of 0.25%, 1.00% and 0.25%
31
| Equinox Campbell Strategy Fund |
| NOTES TO CONSOLIDATED FINANCIAL STATEMENTS (Continued) |
| September 30, 2019 |
of the average daily net assets attributable to the Class A shares, Class C shares and Class P shares, respectively, and is paid to Northern Lights Distributors, LLC (the “Distributor”), an affiliate of Gemini Fund Services, LLC (“GFS”), to provide compensation for ongoing distribution -related activities or services and/or maintenance of the Fund’s shareholder accounts, not otherwise required to be provided by the Adviser. The Plan is a compensation plan, which means that compensation is provided regardless of 12b-1 expenses incurred. The Plan further provides for periodic payments to brokers, dealers and other financial intermediaries, including insurance companies, for providing shareholder services and for promotional and other sales-related costs. For the fiscal year ended September 30, 2019, the Fund incurred 12b-1 expenses as follows:
| Class A | $ | 31,260 | ||
| Class C | $ | 131,104 | ||
| Class P | $ | 8,928 | ||
The Distributor acts as the Fund’s principal underwriter in a continuous public offering of the Fund’s Class A, Class C, Class I, and Class P shares. For the fiscal year ended September 30, 2019, the Distributor received $38,298 and $7,865 in underwriting commissions for sales of Class A and Class C shares, respectively, of which $6,497 and $0 were retained by the principal underwriter or other affiliated broker-dealers.
BluGiant, LLC (“BluGiant”), an affiliate of GFS and the Distributor, provides EDGAR conversion and filing services as well as print management services for the Fund on an ad-hoc basis. For the provision of these services, BluGiant receives customary fees from the Fund.
| 5. | REDEMPTION FEE |
The Fund may assess a short-term redemption fee of 1.00% of the total redemption amount if shareholders sell their shares after holding them for less than 30 days. The redemption fee is paid directly to the Fund. For the fiscal year ended September 30, 2019, the Fund received $0 in redemption fees.
| 6. | DISTRIBUTIONS TO SHAREHOLDERS AND TAX COMPONENTS OF CAPITAL |
The tax character of distributions paid during the fiscal year ended September 30, 2019 were as follows:
| Fiscal Year Ended September 30, 2019 | ||
| Ordinary Income | $ 13,070,676 | |
As of September 30, 2019, the components of accumulated earnings/(deficit) on a tax basis were as follows:
| Undistributed | Undistributed | Post October Loss | Capital Loss | Other | Unrealized | Total | ||||||||||||||||||||
| Ordinary | Long-Term | and | Carry | Book/Tax | Appreciation/ | Accumulated | ||||||||||||||||||||
| Income | Gains | Late Year Loss | Forwards | Differences | (Depreciation) | Earnings/(Deficits) | ||||||||||||||||||||
| $ | 6,320,769 | $ | 5,118,935 | $ | — | $ | — | $ | — | $ | 475,380 | $ | 11,915,084 | |||||||||||||
The differences between book basis and tax basis unrealized appreciation/(depreciation), net accumulated realized gain/(loss), and accumulated net investment loss are primarily attributable to the tax adjustments relating to the Fund’s holding in ECS-CFC.
Late year losses incurred after December 31 within the fiscal year are deemed to arise on the first business day of the following fiscal year for tax purposes. At September 30, 2019, the Fund did not defer, on a tax basis, late year losses.
Capital losses incurred after October 31 within the fiscal year are deemed to arise on the first business day of the following fiscal year for tax purposes. At September 30, 2019, the Fund did not defer, on a tax basis, post-October losses.
32
| Equinox Campbell Strategy Fund |
| NOTES TO CONSOLIDATED FINANCIAL STATEMENTS (Continued) |
| September 30, 2019 |
At September 30, 2019, the Fund had capital loss carry forwards for federal income tax purposes available to offset future capital gains as follows:
| Non-Expiring | Non-Expiring | |||||||||
| Short-Term | Long-Term | Total | ||||||||
| $ | — | $ | — | $ | — | |||||
Permanent book and tax differences, primarily attributable to the book/tax basis treatment of net operating losses and short-term capital gains, resulted in reclassifications for the Fund for the fiscal year ended September 30, 2019, as follows:
| Paid | Undistributed | Accumulated | ||||||||
| In | Net Investment | Net Realized | ||||||||
| Capital | Income (Loss) | Gains (Loss) | ||||||||
| $ | (2,816,221 | ) | $ | 6,282,506 | $ | (3,466,285 | ) | |||
| 7. | RECENT ACCOUNTING PRONOUNCEMENT |
In August 2018, the Securities and Exchange Commission adopted amendments to certain disclosure requirements under Regulation S-X to conform to US GAAP, including: (i) an amendment to require presentation of the total, rather than the components, of distributable earnings on the Consolidated Statement of Assets and Liabilities; and (ii) an amendment to require presentation of the total, rather than the components, of distributions to shareholders, except for tax return of capital distributions, on the Consolidated Statement of Changes in Net Assets. The amendments also removed the requirement for parenthetical disclosure of undistributed net investment income on the Consolidated Statement of Changes in Net Assets. These amendments have been adopted with these consolidated financial statements.
In August 2018, FASB issued ASU 2018 -13, Fair Value Measurement (Topic 820): Disclosure Framework— Changes to the Disclosure Requirements for Fair Value Measurement (“ASU 2018-13”). The primary focus of ASU 2018-13 is to improve the effectiveness of the disclosure requirements for fair value measurements. The changes affect all companies that are required to include fair value measurement disclosures. In general, the amendments in ASU 2018-13 are effective for all entities for fiscal years and interim periods within those fiscal years, beginning after December 15, 2019. An entity is permitted to early adopt the removed or modified disclosures upon the issuance of ASU 2018-13 and may delay adoption of the additional disclosures, which are required for public companies only, until their effective date. ASU 2018 -13 has been adopted by the Fund and the related disclosure updates have been incorporated in these consolidated financial statements.
| 8. | CONTROL OWNERSHIP |
The beneficial ownership, either directly or indirectly, of more than 25% of a fund’s voting securities creates a presumption of control. As of September 30, 2019, the Fund had an omnibus shareholder account (comprised of a group of individual shareholders), which amounted to more than 25% of the total shares outstanding of the Fund. Shareholders with a controlling interest could affect the outcome of proxy voting or direction of management of the Fund.
| 9. | SUBSEQUENT EVENTS |
Subsequent events after the date of the Consolidated Statement of Assets and Liabilities have been evaluated through the date the consolidated financial statements were available to be issued. Management has concluded that there were no subsequent events requiring adjustment and/or disclosure in the consolidated financial statements, except as noted below.
33
| Equinox Campbell Strategy Fund |
| NOTES TO CONSOLIDATED FINANCIAL STATEMENTS (Continued) |
| September 30, 2019 |
On October 2, 2019, the Board of Trustees of the Trust approved a Plan of Reorganization (“Plan”) for the Fund. The Plan is contingent upon the approval of the shareholders of the Fund. Under the terms of the Plan, if approved by the shareholders, the Fund will be reorganized into a newly created series of The RBB Fund, Inc., a Maryland corporation.
34
Report of Independent Registered Public Accounting Firm
To the Board of Trustees of Equinox Funds Trust
and the Shareholders of Equinox Campbell Strategy Fund
Opinion on the Financial Statements
We have audited the accompanying consolidated statement of assets and liabilities, including the consolidated portfolio of investments, of Equinox Campbell Strategy Fund (the Fund), a series of the Equinox Funds Trust, as of September 30, 2019, the related consolidated statement of operations for the year then ended, the consolidated statements of changes in net assets for each of the two years in the period then ended, including the related notes, and the consolidated financial highlights for each of the five years in the period then ended (collectively, the financial statements) . In our opinion, the financial statements present fairly, in all material respects, the financial position of the Fund as of September 30, 2019, and the results of their operations for the year then ended, the changes in their net assets for each of the two years in the period then ended, and the financial highlights for each of the five years in the period then ended, in conformity with accounting principles generally accepted in the United States of America.
Basis for Opinion
These financial statements are the responsibility of the Fund’s management. Our responsibility is to express an opinion on the Fund’s financial statements based on our audits. We are a public accounting firm registered with the Public Company Accounting Oversight Board (United States) (PCAOB) and are required to be independent with respect to the Fund in accordance with U.S. federal securities laws and the applicable rules and regulations of the Securities and Exchange Commission and the PCAOB.
We conducted our audits in accordance with the standards of the PCAOB. Those standards require that we plan and perform the audit to obtain reasonable assurance about whether the financial statements are free of material misstatement, whether due to error or fraud. The Fund is not required to have, nor were we engaged to perform, an audit of its internal control over financial reporting. As part of our audits, we are required to obtain an understanding of internal control over financial reporting but not for the purpose of expressing an opinion on the effectiveness of the Fund’s internal control over financial reporting. Accordingly, we express no such opinion.
Our audits included performing procedures to assess the risks of material misstatement of the financial statements, whether due to error or fraud, and performing procedures that respond to those risks. Such procedures included examining, on a test basis, evidence regarding the amounts and disclosures in the financial statements. Our audits also included evaluating the accounting principles used and significant estimates made by management, as well as evaluating the overall presentation of the financial statements. Our procedures included confirmation of investments owned as of September 30, 2019, by correspondence with the custodians and brokers. We believe that our audits provide a reasonable basis for our opinion.
/s/ RSM US LLP
We have served as the auditor of one or more Equinox Institutional Asset Management, LP advised investment companies since 2010.
Denver, Colorado
November 27, 2019
35
| Equinox Campbell Strategy Fund |
| EXPENSE EXAMPLES |
| September 30, 2019 (Unaudited) |
As a shareholder of the Fund, you incur two types of costs: (1) transaction costs, including sales charges (loads) on purchases of Class A shares and Class C shares; (2) ongoing costs, including management fees; distribution and/or service (12b-1) fees; and other Fund expenses. This example is intended to help you understand your ongoing costs (in dollars) of investing in the Fund and to compare these costs with the ongoing costs of investing in other mutual funds.
The example is based on an investment of $1,000 invested at the beginning of the period and held for the entire six month period from April 1, 2019 through September 30, 2019.
Actual Expenses
The “Actual” expenses line in the table below provides information about actual account values and actual expenses. You may use the information below, together with the amount you invested, to estimate the expenses that you paid over the period. Simply divide your account value by $1,000 (for example, an $8,600 account value divided by $1,000 = 8.6), then multiply the result by the number in the table under the heading entitled “Expenses Paid During Period” to estimate the expenses you paid on your account during this period.
Hypothetical Example for Comparison Purposes
The “Hypothetical” expenses line in the table below provides information about hypothetical account values and hypothetical expenses based on the Fund’s actual expense ratio and an assumed rate of return of 5% per year before expenses, which is not the Fund’s actual return. The hypothetical account values and expenses may not be used to estimate the actual ending account balances or expenses you paid for the period. You may use this information to compare this 5% hypothetical example with the 5% hypothetical examples that appear in the shareholder reports of other funds.
Please note that the expenses shown in the table are meant to highlight your ongoing costs only and do not reflect any transactional costs, such as sales charges (loads), or redemption fees. Therefore, the table is useful in comparing ongoing costs only, and will not help you determine the relative total costs of owning different funds. In addition, if these transactional costs were included, your costs would have been higher.
| Beginning | Ending | Expenses Paid | Annualized | |
| Account Value | Account Value | During Period* | Expense | |
| Actual | 4/1/19 | 9/30/19 | 4/1/19-9/30/19 | Ratio |
| Class A | $1,000.00 | $1,146.00 | $11.14 | 2.07% |
| Class C | $1,000.00 | $1,141.70 | $15.14 | 2.82% |
| Class I | $1,000.00 | $1,146.80 | $9.69 | 1.80% |
| Class P | $1,000.00 | $1,145.30 | $8.17 | 1.52% |
| Beginning | Ending | Expenses Paid | Annualized | |
| Account Value | Account Value | During Period* | Expense | |
| Hypothetical (5% return before expenses) | 4/1/19 | 9/30/19 | 4/1/19-9/30/19 | Ratio |
| Class A | $1,000.00 | $1,014.69 | $10.45 | 2.07% |
| Class C | $1,000.00 | $1,010.93 | $14.22 | 2.82% |
| Class I | $1,000.00 | $1,016.04 | $9.10 | 1.80% |
| Class P | $1,000.00 | $1,017.45 | $7.69 | 1.52% |
| * | Expenses are equal to the average account value over the period, multiplied by the Fund’s annualized expense ratio, multiplied by the number of days in the period (183) divided by the number of days in the fiscal year (365). |
36
| Equinox Campbell Strategy Fund |
| SUPPLEMENTAL INFORMATION |
| September 30, 2019 (Unaudited) |
The following tables present certain information regarding the Board of Trustees and officers of the Trust. Each person listed under “Interested Trustee” below is an “interested person” of the Trust, the Adviser, or Distributor, within the meaning of the 1940 Act. Each person who is not an “interested person” of the Trust, the Adviser or the Distributor within the meaning of the 1940 Act is referred to as an “Independent Trustee” and is listed under such heading below. Unless otherwise noted, the address of each Trustee and Officer is 17605 Wright Street, Suite 2, Omaha, NE 68130. The Statement of Additional Information includes additional information about the Fund’s directors and officers and is available without charge, upon request by calling 1-888-643-3431.
Independent Trustees
| Number of | ||||
| Name and Year of Birth | Position(s) Held/Term of Office* | Principal Occupation During the Last Five Years | Portfolios in Fund Complex** Overseen by Trustee | Other Directorships*** held by Trustee During Last Five Years |
| David P. Demuth 9/1945 | Trustee Since December 2010 | Consultant, CFO Consulting Partners, LLC (since May 2004). | 5 | Executive Committee Member of The Frontier Fund (commodity pool) (from March 2007 to March 2017).
|
| Kevin R. Green 7/1954 | Trustee Since December 2010 | Chief Executive Officer of TripleTree Holdings, LLC an Investment Bank, Advisory and Principal Investing business (since 1997). | 5 | Director of BlueCross BlueShield of Minnesota (healthcare services). |
| Jay Moorin 7/1951 | Trustee Since December 2010 | Managing Partner, ProQuest Management, LLC (since 1998). | 5 | Director, Eagle Pharmaceuticals Inc. (from March 2007 to June 2016); Director, Pegasi Energy Resource Corp. (from January 2014 to June 2015); Director, Aires Pharmaceuticals (from November 2006 to February 2014); Director, Arno Therapeutics (from January 2016 to December 2017); Director, Corino Therapeutics (since November 2016); Director, Mevion Medical Systems (from January 2012 to June 2018). |
37
| Equinox Campbell Strategy Fund |
| SUPPLEMENTAL INFORMATION |
| September 30, 2019 (Unaudited) |
Interested Trustee
| Number of | ||||
| Portfolios in Fund | ||||
| Name and Year of Birth | Position(s) Held/Term of Office* | Principal Occupation During the Past Five Years | Complex** Overseen by Trustee | Other Directorships*** held by Trustee During the Last Five Years |
| Robert J. Enck 9/1962 | Chairman, Trustee, President and Principal Executive Officer Since December 2010 | President and Chief Executive Officer, Equinox Institutional Asset Management, LP (since 2015); President and Chief Executive Officer, Equinox Fund Management, LLC (since 2007). | 5 | Executive Committee Member of The Frontier Fund (commodity pool) (from March 2007 to March 2017). |
38
| Equinox Campbell Strategy Fund |
| SUPPLEMENTAL INFORMATION |
| September 30, 2019 (Unaudited) |
Executive Officers
| Name and Year of Birth | Position(s) Held/Term of Office* | Principal Occupation During the Past Five Years | Number of Portfolios in Fund Complex** Overseen by Trustee | Other Directorships*** held by Trustee During the Past Five Years |
| Laura Latella 4/1958 | Treasurer, Chief Financial Officer and Secretary Since November 2018 | Chief Financial Officer (“CFO”, since November 2017) and Chief Administrative Officer (May 2016 – October 2017), Equinox Institutional Asset Management, LP; Consultant, Equinox Institutional Asset Management, LP (January 2016 – April 2016); Treasurer, CFO, Principal, 6800 Capital, LLC (May 1994 – January 2016). | N/A | N/A |
| Javier Jimenez 5/1977 | Assistant Treasurer Since November 2017 | Assistant Vice President (since 2013) and Compliance Officer (2010 to 2013) of U.S. Bancorp Fund Services, LLC. | N/A | N/A |
| Douglas Tyre 7/1980 | Chief Compliance Officer and Anti-Money Laundering Officer Since October 13, 2017 | Assistant Compliance Director of Cipperman Compliance Services LLC (2014 – present); Client Services & Operations Specialist – Senior Associate of Echo Point Investment Management LLC (2010 – 2014). | N/A | N/A |
| * | Each Trustee and Officer shall serve until death, resignation or removal. |
| ** | The term “Fund Complex” refers to the Equinox Funds Trust. |
| *** | Directorships are held in a company with a class of securities registered pursuant to section 12 of the Securities Exchange Act or subject to the requirements of section 15(d) of the Securities Exchange Act or a company registered as an investment company under the 1940 Act. |
39
PRIVACY NOTICE
Rev. August 2011
| FACTS | WHAT DOES EQUINOX FUNDS TRUST DO WITH YOUR PERSONAL INFORMATION? | |
| Why? | Financial companies choose how they share your personal information. Federal law gives consumers the right to limit some but not all sharing. Federal law also requires us to tell you how we collect, share, and protect your personal information. Please read this notice carefully to understand what we do. | |
| What? | The types of personal information we collect and share depend on the product or service you have with us. This information can include: | |
■ Social Security number
■ Assets
■ Retirement Assets
■ Transaction History
■ Checking Account Information | ■ Purchase History
■ Account Balances
■ Account Transactions
■ Wire Transfer Instructions | |
| When you areno longer our customer, we continue to share your information as described in this notice. | ||
| How? | All financial companies need to share customers’ personal information to run their everyday business. In the section below, we list the reasons financial companies can share their customers’ personal information; the reasons Equinox Funds Trust chooses to share; and whether you can limit this sharing. | |
| Reasons we can share your personal information | Does Equinox Funds Trust share? | Can you limit this sharing? |
For our everyday business purposes – such as to process your transactions, maintain your account(s), respond to court orders and legal investigations, or report to credit bureaus | Yes | No |
For our marketing purposes – to offer our products and services to you | No | We don’t share |
| For joint marketing with other financial companies | No | We don’t share |
For our affiliates’ everyday business purposes – information about your transactions and experiences | No | We don’t share |
For our affiliates’ everyday business purposes – information about your creditworthiness | No | We don’t share |
| For nonaffiliates to market to you | No | We don’t share |
| Questions? | Call 1-888-643-3431 |
40
Rev. August 2011
| Who we are | |
| Who is providing this notice? | Equinox Funds Trust
|
| What we do | |
| How does Equinox Funds Trust protect my personal information? | To protect your personal information from unauthorized access and use, we use security measures that comply with federal law. These measures include computer safeguards and secured files and buildings.
Our service providers are held accountable for adhering to strict policies and procedures to prevent any misuse of your nonpublic personal information. |
| How does Equinox Funds Trust collect my personal information? | We collect your personal information, for example, when you
■ Open an account
■ Provide account information
■ Give us your contact information
■ Make deposits or withdrawals from your account
■ Make a wire transfer
■ Tell us where to send the money
■ Tells us who receives the money
■ Show your government-issued ID
■ Show your driver’s license
We also collect your personal information from other companies. |
| Why can’t I limit all sharing? | Federal law gives you the right to limit only
■ Sharing for affiliates’ everyday business purposes – information about your creditworthiness
■ Affiliates from using your information to market to you
■ Sharing for nonaffiliates to market to you
State laws and individual companies may give you additional rights to limit sharing. |
| Definitions | |
| Affiliates | Companies related by common ownership or control. They can be financial and nonfinancial companies.
■ Equinox Funds Trust does not share with our affiliates. |
| Nonaffiliates | Companies not related by common ownership or control. They can be financial and nonfinancial companies
■ Equinox Funds Trust does not share with nonaffiliates so they can market to you. |
| Joint marketing | A formal agreement between nonaffiliated financial companies that together market financial products or services to you.
■ Equinox Funds Trust doesn’t jointly market. |
41
PROXY VOTING POLICY
Information regarding how the Fund voted proxies relating to portfolio securities for the most recent period ended June 30 as well as a description of the policies and procedures that the Fund uses to determine how to vote proxies is available without charge, upon request, by calling 1-888-643-3431 or by referring to the Securities and Exchange Commission’s (“SEC”) website at http://www.sec.gov.
PORTFOLIO HOLDINGS
The Fund files its complete schedule of portfolio holdings with the SEC for the first and third quarters of each fiscal year on Form N-PORT. Form N-PORT is available on the SEC’s website at http://www.sec.gov and may be reviewed and copied at the SEC’s Public Reference Room in Washington, DC (1-800-SEC-0330). The information on Form N-PORT is available without charge, upon request, by calling 1-888-643-3431.
| INVESTMENT ADVISER |
| Equinox Institutional Asset Management, LP |
| 47 Hulfish Street, Suite 510 |
| Princeton, NJ 08542 |
| ADMINISTRATOR |
| U.S. Bancorp Fund Services, LLC |
| 777 E. Wisconsin Ave |
| Milwaukee, WI 53202 |
42
Item 2. Code of Ethics.
| (a) | As of the end of the period covered by this report, the registrant has adopted a code of ethics that applies to the registrant's Principal executive officer, Principal financial officer, Principal accounting officer or controller, or persons performing similar functions, regardless of whether these individuals are employed by the registrant or a third party. |
| (b) | For purposes of this item, “code of ethics” means written standards that are reasonably designed to deter wrongdoing and to promote: |
| (1) | Honest and ethical conduct, including the ethical handling of actual or apparent conflicts of interest between personal and professional relationships; |
| (2) | Full, fair, accurate, timely, and understandable disclosure in reports and documents that a registrant files with, or submits to, the Commission and in other public communications made by the registrant; |
| (3) | Compliance with applicable governmental laws, rules, and regulations; |
| (4) | The prompt internal reporting of violations of the code to an appropriate person or persons identified in the code; and |
| (5) | Accountability for adherence to the code. |
| (c) | Amendments: During the period covered by the report, there have not been any substantive amendments to the provisions of the code of ethics. |
| (d) | Waivers: During the period covered by the report, the registrant has not granted any express or implicit waivers from the provisions of the code of ethics. |
| (e) | The Code of Ethics is not posted on Registrant’ website. |
| (f) | A copy of the registrant’s Code of Ethics is incorporated by reference. See item 13(a)1. |
Item 3. Audit Committee Financial Expert.
| (a)(1)i The Registrant’s board of trustees has determined that David DeMuth is an audit committee financial expert, as defined in Item 3 of Form N-CSR. Mr. DeMuth is independent for purposes of this Item 3. |
(a)(2) Not applicable.
(a)(3) Not applicable.
Item 4. Principal Accountant Fees and Services.
(a) Audit Fees
2019 - $ 43,500
2018 - $ 55,000
(b) Audit-Related Fees
2019 - None
2018 - None
(c) Tax Fees
2019 - $ 7,500
2018 - $ 16,020
Preparation of Federal & State income tax returns, assistance with calculation of required income, capital gain and excise distributions and preparation of Federal excise tax returns.
(d) All Other Fees
2019 - None
2018 - None
(e) (1) Audit Committee’s Pre-Approval Policies
The registrant’s Audit Committee is required to pre-approve all audit services and, when appropriate, any non-audit services (including audit-related, tax and all other services) to the registrant. The registrant’s Audit Committee also is required to pre-approve, when appropriate, any non-audit services (including audit-related, tax and all other services) to its adviser, or any entity controlling, controlled by or under common control with the adviser that provides ongoing services to the registrant, to the extent that the services may be determined to have an impact on the operations or financial reporting of the registrant. Services are reviewed on an engagement by engagement basis by the Audit Committee.
(2) There were no services described in each of paragraphs (b) through (d) of this Item that were approved by the audit committee pursuant to paragraph (c)(7)(i)(C) of Rule 2-01 of Regulation S-X.
(f) All of the hours spent on auditing the registrant’s financial statements were attributed to work performed by full-time permanent employees of the principal accountant.
(g) The aggregate non-audit fees billed by the registrant's accountant for services rendered to the registrant, and rendered to the registrant's investment adviser (not including any sub-adviser whose role is primarily portfolio management and is subcontracted with or overseen by another investment adviser), and any entity controlling, controlled by, or under common control with the adviser that provides ongoing services to the registrant for each of the last two fiscal years of the registrant:
2019 - None
2018 - None
(h) The registrant’s audit committee of the board of trustees has considered whether the provision of non-audit services that were rendered to the registrant’s investment adviser, and any entity controlling, controlled by, or under common control with the investment adviser that provides ongoing services to the registrant that were not pre-approved pursuant to paragraph (c)(7)(ii) of Rule 2-01 of Regulation S-X is compatible with maintaining the Principal accountant’s independence. No such services were rendered.
Item 5. Audit Committee of Listed Registrants.
Not applicable to registrants who are not listed issuers (as defined in Rule 10A-3 under the Securities Exchange Act of 1934).
Item 6. Investments.
| (a) | Schedule of Investments is included as part of the report to shareholders filed under Item 1 of this Form. |
| (b) | Not Applicable. |
Item 7. Disclosure of Proxy Voting Policies and Procedures for Closed-End Management Investment Companies.
Not applicable to open-end investment companies.
Item 8. Portfolio Managers of Closed-End Management Investment Companies.
Not applicable to open-end investment companies.
Item 9. Purchases of Equity Securities by Closed-End Management Investment Company and Affiliated Purchasers.
Not applicable to open-end investment companies.
Item 10. Submission of Matters to a Vote of Security Holders.
Not Applicable.
Item 11. Controls and Procedures.
| (a) | Based on an evaluation of the Registrant’s disclosure controls and procedures as of a date within 90 days of filing date of this Form N-CSR, the Principal Executive Officer and Principal Financial Officer of the Registrant have concluded that the disclosure controls and procedures of the Registrant are reasonably designed to ensure that the information required in filings on Form N-CSR is recorded, processed, summarized, and reported by the filing date, including that information required to be disclosed is accumulated and communicated to the Registrant’s management, including the Registrant’s Principal Executive Officer and Principal Financial Officer, as appropriate to allow timely decisions regarding required disclosure. |
| (b) | There were no significant changes in the Registrant’s internal control over financial reporting that occurred during the Registrant’s last fiscal half-year that have materially affected, or are reasonably likely to materially affect, the Registrant’s internal control over financial reporting. |
Item 12. Disclosure of Securities Lending Activities for Closed-End Management Investment Companies.
Not applicable to open-end investment companies.
Item 13. Exhibits.
| (a) | (1)Any code of ethics or amendment thereto, that is the subject of the disclosure required by Item 2, to the extent that the registrant intends to satisfy Item 2 requirements through filing an exhibit.Incorporated by reference to the Registrant’s Form N-CSR filed December 11, 2017. |
(3)Any written solicitation to purchase securities under Rule 23c-1 under the Act sent or given during the period covered by the report by or on behalf of the registrant to 10 or more persons.Not applicable to open-end investment companies.
(4)Change in the registrant’s independent public accountant. Not Applicable.
| (b) | Certifications pursuant to Section 906 of the Sarbanes-Oxley Act of 2002. Filed herewith. |
SIGNATURES
Pursuant to the requirements of the Securities Exchange Act of 1934 and the Investment Company Act of 1940, the registrant has duly caused this report to be signed on its behalf by the undersigned, thereunto duly authorized.
Equinox Funds Trust
By:/s/ Robert J. Enck
Robert J. Enck, Principal Executive Officer
Date:12/02/2019_
Pursuant to the requirements of the Securities Exchange Act of 1934 and the Investment Company Act of 1940, this report has been signed below by the following persons on behalf of the registrant and in the capacities and on the dates indicated.
By:/s/ Robert J. Enck
Robert J. Enck, Principal Executive Officer
Date:12/02/2019_
By:/s/ Laura Latella
Laura Latella, Principal Financial Officer
Date:12/02/2019_