UNITED STATES
SECURITIES AND EXCHANGE COMMISSION
Washington, D.C. 20549
FORM N-CSR
CERTIFIED SHAREHOLDER REPORT OF REGISTERED MANAGEMENT INVESTMENT COMPANIES
Investment Company Act file number811-22447
Equinox Funds Trust
(Exact name of registrant as specified in charter)
47 Hulfish Street, Suite 510
Princeton, New Jersey 08542
(Address of principal executive offices) (Zip code)
Javier Jimenez
U.S. Bancorp Fund Services, LLC
2020 East Financial Way, Suite 100
Glendora, California 91741
(Name and address of agent for service)
(609) 430-0404
Registrant's telephone number, including area code
Date of fiscal year end:June 30
Date of reporting period:June 30, 2019
Item 1. Reports to Stockholders.
EQUINOX IPM SYSTEMATIC MACRO FUND
Class I Shares: EQIPX
Annual Report
June 30, 2019
1-888-643-3431
www.EQUINOXFUNDS.com
Distributed by Northern Lights Distributors, LLC
Beginning on January 1, 2021 for the Fund, as permitted by regulations adopted by the Securities and Exchange Commission, paper copies of the Fund’s shareholder reports like this one will no longer be sent by mail, unless you specifically request paper copies of the reports from the Fund or from your financial intermediary, such as a broker-dealer or bank. Instead, the reports will be made available on the Fund’s website at www.equinoxfunds.com, and you will be notified by mail each time a report is posted and provided with a website link to access the report.
If you already elected to receive shareholder reports electronically, you will not be affected by this change and you need not take any action. If you invest through a financial intermediary, you may elect to receive shareholder reports and other communications electronically from the Fund by contacting your financial intermediary (such as a broker-dealer or bank). If you invest directly with the Fund, you will receive shareholder reports electronically beginning in February 2021.
You may elect to receive all future shareholder reports in paper free of charge. You can request to continue receiving paper copies of your shareholder reports by contacting your financial intermediary or, if you invest directly with the Fund, calling 1-888-643-3431 to let the Fund know of your request.

Equinox IPM Systematic Macro Fund:
Annual Letter to Shareholders for the Year Ended June 30, 2019
The Equinox IPM Systematic Macro Fund (EQIPX) was launched on July 6, 2015. The Fund pursues its investment objective by making a combination of investments (i) directly in an actively managed fixed-income portfolio consisting of cash, cash equivalents, securities issued by the US government with a one year or shorter term to maturity, and money market funds, and (ii) directly, or indirectly through its wholly-owned subsidiary (the “Subsidiary”), in a diversified portfolio of futures contracts and futures-related instruments such as forwards and swaps in broadly diversified global (i.e. US and non-US) markets across three major asset classes: currencies, fixed income and stock indices. The Subsidiary’s investment in futures contracts and futures-related instruments is directed by IPM Informed Portfolio Management AB (“IPM”) in accordance with its Systematic Macro Trading Program (the “IPM Program”). The Fund targets a reduced level of volatility relative to the IPM Program.
The IPM Program takes a systematic, global macro approach to investment. Systematic trading strategies generally employ computer-driven, mathematical models to identify when to buy or sell an instrument according to rules determined before a trade is made, generally, with little or no human intervention once a mathematical formula has been entered. The IPM Program seeks to utilize models of short-term and long-term factors, based on market fundamentals, that affect investment returns. These quantitative models attempt to rank the relative attractiveness of global financial instruments in currency (developed as well as emerging markets), equity index, and fixed-income markets. The outputs from the models are used to establish trading positions (long or short) in these markets, using primarily futures contracts and futures-related instruments. IPM’s investment process is guided by the work of its research team, which regularly reviews and develops trading systems and financial models using a wide array of analytical techniques.
The IPM Program seeks to invest in a diversified portfolio that combines a large number of uncorrelated investment ideas derived from four broad fundamental themes: value, risk premia, macroeconomic, and market dynamic. “Value” themes seek to identify and take positions on the basis of discrepancies identified between prevailing market prices of assets and their long-term intrinsic values. “Risk premia” themes seek to exploit the time-varying nature of investment opportunities and returns that may be attributable at least in part to the preferences and actions of market participants. “Macroeconomic” themes seek to identify shifts in global economic, political or financial factors and to establish positions that may profit from expected market responses and adjustments. “Market dynamic” themes recognize that each market has its own set of specific characteristics (such as investment flows, interest rate volatility, and other
Definitions of Terms and Indices can be found on the back page.
| 47 Hulfish Street, Suite 510, Princeton, NJ 08542 ● T 609.430.0404 ● F609.454.5010 ● www.equinoxfunds.com |
attributes) that may offer trading opportunities. The investment ideas generated based on these four themes are combined into four relative value portfolios (Developed Market Currencies, Emerging Market Currencies, Relative Equities, and Relative Bonds) that comprise approximately 85% of the overall risk, and one Directional portfolio (Global Equities and Bonds) that accounts for the remaining 15% of risk.
Performance since inception of the Equinox IPM Systematic Macro Fund
| | | | | Annualized |
| | Fiscal Year | Cumulative | Annualized | Standard |
| As of 6/30/2019 | Return | Return | Return | Deviation |
| Class I | -3.33% | 5.68% | 1.40% | 8.29% |
Managed Futures
(Barclays BTOP50® Index) | 4.34% | -2.60% | -0.66% | 6.88% |
Equities
(S&P 500® TR Index) | 10.42% | 54.83% | 11.55% | 12.70% |
The inception date of EQIPX is 7/6/2015, displayed benchmark inception is 7/1/2015. Performance data quoted here represents past performance. Current performance may be lower or higher than the performance quoted above. Past performance does not guarantee future results. The value of an investor’s shares will fluctuate so that investor’s shares, when redeemed, may be worth more or less than their original cost. For performance current to the most recent month end, please visit equinoxfunds.com.
Gross/Net expense ratios: Class I: 2.01% / 1.83%. The expense ratios presented are based on the annualized expense ratios (excluding interest expense) as reported in the Fund’s current prospectus, which may differ from the expense ratios presented in the Fund’s financial highlights. The Gross/Net Expense Ratio does not include costs associated with any over the-counter derivatives utilized by the Fund. The Adviser has contractually agreed to reduce its management fee and/or reimburse certain expenses of the Fund, to ensure that the Fund’s total annual operating expenses, excluding (i) taxes, (ii) interest, (iii) extraordinary items, (iv) Acquired Fund Fees and Expenses (“AFFE”), (v) Rule 12b-1 distribution fees or shareholder service fees, and (vi) brokerage commissions, do not exceed, on an annual basis, 1.83% of the Fund’s average daily net assets. This expense limitation will remain in effect until at least November 30, 2019, but can be terminated by the Fund’s Board of Trustees on 60 days’ written notice to the Adviser. The Adviser shall be entitled to recover, subject to approval by the Board of Trustees of the Trust, such waived or reimbursed amounts for a period of up to three (3) years from the date on which the Adviser reduced its compensation and/or assumed expenses for the Fund. The Adviser is permitted to seek reimbursement from the Fund, subject to certain limitations, for fees it waived and Fund expenses it paid to the extent the total annual fund operating expenses do not exceed the limits described above or any lesser limits in effect at the time of reimbursement. No reimbursement will occur unless the Fund’s operating expenses are below the expense limitation amount. Please review the Fund’s prospectus for more information regarding fees and expenses.
Definitions of Terms and Indices can be found on the back page.
| 47 Hulfish Street, Suite 510, Princeton, NJ 08542 ● T 609.430.0404 ● F609.454.5010 ● www.equinoxfunds.com |
This systematic global macro investment and portfolio construction approach seeks to generate returns that tend to have low correlations, not only to traditional asset classes such as bonds and equities and alternative strategies other than managed futures, but even to most other managed futures trading programs, including those that are predominantly trend-following. Returns of the Fund’s Class I shares are shown in the table on page 2. For the fiscal year ended June 30, 2019, the Fund had negative performance; it underperformed the Barclay BTOP 50® Index (shown as a representative managed futures index) and its performance paled in comparison with yet another banner year experienced by the S&P 500® Total Return Index (shown as a representative US large-cap equity index). The Fund has outperformed the Barclay BTOP 50® since inception, however, albeit with a higher realized standard deviation.
Estimated Risk Exposures by Portfolio as of June 30, 2019 (1-day, 95% VaR)
| Portfolio | VaR | | Value at risk (VaR) is a statistical technique used to measure and quantify the level of financial risk within a firm or investment portfolio over a specific time-frame |
| Developed Currencies | 0.33% | |
| Emerging Currencies | 0.12% | |
| Relative Equities | 0.24% | |
| Relative Bonds | 0.43% | |
| Global Equities and Bonds (Directional) | 0.41% | |
| Fund | 0.78% | |
The Fund’s risk exposure is diversified across five portfolios. As of June 30, 2019, measured in terms of Value-at-Risk or VaR (1-day, 95%), Relative Bonds represented the largest risk exposure in the Fund, followed by Global Equities and Bonds, Developed Currencies, Relative Equities, and Emerging Currencies. Portfolio risk exposures tend to vary over time, as they are functions of the signals generated by trading models, modulated by the program’s risk management systems.
Estimated Performance Attribution by Portfolio for the fiscal year ended June 30, 2019
| Portfolio | Contribution |
| Developed Currencies | -0.26% |
| Emerging Currencies | -1.31% |
| Relative Equities | -0.65% |
| Relative Bonds | -0.99% |
| Global Equities and Bonds (Directional) | -0.12% |
| Fund | -3.33% |
In terms of estimated performance attribution, as shown above, Emerging Currencies were the biggest detractor performance, followed by Relative Bonds and Relative Equities. Developed Currencies and Directional strategies had relatively small negative impacts.
Definitions of Terms and Indices can be found on the back page.
| 47 Hulfish Street, Suite 510, Princeton, NJ 08542 ● T 609.430.0404 ● F609.454.5010 ● www.equinoxfunds.com |
Fund Commentary
July (2018) saw many earnings reports beat expectations for the second quarter in a row, except for some large U.S. tech firms like Facebook, Netflix and Twitter, which sold off heavily during the month. The Trump administration continued its global trade wars, imposing tariffs worth $34 billion on Chinese imports as well as having meetings with several leaders throughout Europe where trade talks were on top of the agendas. In the UK, Prime Minister Theresa May’s “soft Brexit” plans floundered, as several key allies within her government resigned. The Bank of Japan announced that it would allow the 10-year yield to trade 0.2 percent above or below its zero percent target and alter its ETF purchases. Despite the uncertain political backdrop, equities rallied as US growth proved resilient and earnings surprised on the upside. Global equities were up 3.1%, whereas global bonds returned -0.2%. The strategy was slightly down in July. The Developed Markets Currency portfolio, which had delivered strong returns during 2018, had a negative month, although its losses were mitigated by both the Directional and the Relative Equity portfolios. Developed Markets Currency losses were driven by long positions in the British Pound and Japanese Yen, and a short position in the Swedish Krona, while other positions were essentially flat. The biggest drag in the Emerging Markets Currency portfolio was the long position in the Turkish Lira, partly offset by a long position in the Mexican Peso. A short position in the Hang Seng contributed the most to the positive performance of the relative equity portfolio. The Relative Bond portfolio displayed a modest profit, benefitting from a short position in Canadian Government Bonds, offset somewhat by a short position in Japanese Government Bonds. All three positions in the Directional Portfolio were positive for the month, with the long position in global equities delivering the strongest performance.
InAugust, financial markets exhibited unusually high return dispersion. The US continued its strong run, largely unaffected by the “tit for tat” trade dispute and fueled by a strong general sentiment. On the flip side, core European markets suffered from Emerging Markets contagion fears and an increased risk of fragmentation within the EU. Turkey, with its macroeconomic
Definitions of Terms and Indices can be found on the back page.
| 47 Hulfish Street, Suite 510, Princeton, NJ 08542 ● T 609.430.0404 ● F609.454.5010 ● www.equinoxfunds.com |
imbalances and accelerating political dispute with the US, was center stage of the Emerging Markets weakness, seeing the lira (Turkish Lira) plunge and take several other markets with it. Developed Markets currencies also experienced a large – although less dramatic – return dispersion. The Swiss Franc strengthened significantly, likely related to safe-haven flows, whereas the Swedish Krona continued to weaken. The British Pound held up well despite the lack of progress in Brexit negotiations. In general, global equities were up 1.2% and global bonds added 0.1%. The strategy experienced a difficult month, with negative attribution from all but the Relative Bond portfolio. Most damage was seen in the Emerging Markets Currency portfolio, where the long Turkish Lira exposure was the key negative contributor, and its extreme volatility resulted in an automatic deleveraging of the position. Following a decision by IPM’s Risk Management Committee, the Turkish Lira was subsequently removed from the investment universe. Additionally, the weak Turkish Lira negatively impacted the long Emerging Markets vs. Developed Markets positioning in the directional portfolio. In the Developed Markets Currency portfolio, profits from the short Swedish Krona and long Japanese Yen exposure could not offset losses from the short Swiss Franc position. In the Relative Equity portfolio, the strong relative performance of the S&P 500 led to further losses. The main positive contributors in the Relative Bond portfolio were short positions in Japanese Government Bonds and UK Gilts and the long position in German Bunds.
Many of the same themes continued intoSeptember, with the US performing well and both the S&P and Dow Jones hitting all-time highs. The Nikkei reached levels not seen since the early 90’s, supported somewhat by a weaker Japanese Yen, as the markets turned towards risk-on, also evident from a declining Swiss Franc. The Emerging Markets contagion fears started to subside, giving some support to the European markets, only to be disrupted again towards month-end when Italy presented a budget for 2019 with a 2.4 percent deficit, higher than both the markets and EU officials had expected. The deadlock in the Brexit negotiations continued alongside the US-China trade war. A US rate hike was implemented as anticipated and Fed chair Powell indicated that no further monetary support is needed. Global equities were up 0.6% while global bonds lost 0.5%. The strategy finished positive for the month. The currency portfolios, including the long Emerging Markets vs. Developed Markets currency position in the Directional Portfolio, were the main drivers of the positive performance. In contrast to August the Developed Markets Currency portfolio saw gains from the short Swiss Franc and long Norwegian Krone positions, outweighing losses from the long Japanese Yen and short Swedish Krona exposure. A short position in the Czech Koruna was the winner in the Emerging Markets Currency portfolio, closely followed by a short position in the Indian Rupee and a long position in the Russian Ruble. The biggest drag in the Relative Equity portfolio were the European positions, with the long German Stock Index DAX and Amsterdam Index leading the losses, partly offset by a short position in the Toronto Stock Exchange Index and a short, later turning
Definitions of Terms and Indices can be found on the back page.
| 47 Hulfish Street, Suite 510, Princeton, NJ 08542 ● T 609.430.0404 ● F609.454.5010 ● www.equinoxfunds.com |
long, position in the Tokyo Stock Exchange Index. A loss was also seen in the Relative Bond portfolio, caused mainly by the short position in Japanese Government Bonds and the long position in German bunds, mitigated somewhat by profits from the short Canadian Government Bonds exposure.
The big debate inOctober centered around whether the drawdown seen in equity markets was merely a correction or the beginning of something bigger. The reasons mentioned for the drawdown included rising bond yields, unresolved and escalating global trade disputes, a budget crisis in Italy, the stalemate in the Brexit negotiations, and a worsened outlook for global economic growth. Most of the events had been in focus for a while, so either market participants began to place a higher weight on these risks, or it was solely a technical correction that was bound to happen. The risk-off sentiment drove safe-haven flows into the Japanese yen. In Brazil, the win of the right-wing Bolsonaro in the presidential election resulted in a considerable appreciation of the Brazilian real. Global equities were down 7.3%, while global bonds were flat for the month. Contrary to global equities, the strategy was up for the month. Strong profits were posted in the Developed Markets Currency portfolio, but the Relative Bond and Relative Equity portfolios also had a positive impact on performance. On a negative note, the Emerging Markets Currency portfolio detracted from performance due to negative contributions from the long Mexican Peso and short Brazilian Real positions. The minor loss in the Directional portfolio was attributable to the long, later turning short, position in global equities. The gains in the Developed Markets Currency portfolio were driven by the long Japanese Yen and short Swiss Franc positions although the long US dollar, mostly short Canadian dollar, and short Swedish Krona positions all proved beneficial. It was the long German Bunds and short Canadian Government Bonds positions that paved the way for the Relative Bond portfolio’s positive performance, which was partly offset by long US T-Notes and short UK Gilts positions. Finally, the Relative Equity portfolio benefitted primarily from the short Hang Seng position.
After the strong sell-off of risky assets in October, investors’ risk tolerance increased inNovember, but geopolitical events such as the US mid-terms, unresolved trade disputes, and Brexit negotiations resulted in large intra-month swings for most asset classes. Sector rotation continued in the global equity markets from cyclicals to non-cyclicals as investors sought to scale back equity risk while keeping equity allocations intact, on increasing worries about “peak earnings.” Triggered by worries about a slowing world economy in 2019, most major markets saw lower bond yields on the long end of the curve, with 10Y US treasuries again trading below the much-hyped 3%-level. Additionally, oil posted its worst monthly return in 10 years. In the currency markets, the New Zealand Dollar gained ground as strong domestic economic data resulted in revised expectations about coming interest rate hikes. Global equites gained +1.1%
Definitions of Terms and Indices can be found on the back page.
| 47 Hulfish Street, Suite 510, Princeton, NJ 08542 ● T 609.430.0404 ● F609.454.5010 ● www.equinoxfunds.com |
and global bonds +0.7%. The strategy ended the month in negative territory with the largest negative impact coming from the Developed Markets Currency and Relative Equities portfolios. On a positive note, the Directional portfolio added value, whereas the impact from both the Emerging Markets Currency and the Relative Bonds portfolios were marginal. The Developed Markets currency portfolio was mainly hurt by the short New Zealand Dollar position as stronger domestic data saw a repricing of Reserve Bank of New Zealand rate expectations, but the long British Pound and Norwegian Krone positions also detracted from performance. In contrast, the long Australian Dollar position proved beneficial. The short exposure to the Hang Seng and Toronto Stock Exchange Index indices as well as the long German Stock Index DAX position explained most of the negative impact from the Relative Equities portfolio. The main driver of the Emerging Markets Currency portfolio’s slightly positive return was the short Brazilian Real position, whereas the value added by the Directional portfolio was attributable to its long global bonds position.
A difficult calendar year in general was crowned by a renewed risky asset sell-off inDecember. The threat of a synchronized global economic slowdown and the uncertain impact from the ongoing quantitative tightening resulted in increased risk aversion. Reduced earnings forecasts and a fourth rate- hike by the US Fed further exacerbated the sell-off. This resulted in US equities again entering “correction” territory and global equites following suit, with many markets officially venturing into bear territory. By month-end, global equities were down 7.6%, whereas global bonds ended up 1.7%. In the currency markets, while the Japanese Yen strengthened, the Australian Dollar, Canadian dollar and New Zealand Dollar all weakened due to weaker economic data from China. Market volatility remained heightened across asset classes into year end. The strategy posted a solid positive return for the month and, except for the Relative Bond portfolio, all portfolios showed gains. The Directional portfolio was best positioned to gain from the market turmoil with its short equity and long bond positioning. The Developed Markets Currency portfolio benefitted from its short positioning in the New Zealand Dollar and the Canadian dollar, as well as its long position in the Japanese Yen. On the flip side, the portfolio experienced losses from its short Swiss Franc and long Australian Dollar positions. Gains in the Emerging Markets Currency portfolio were modest, with positive returns from the long Mexican Peso position partly offset by a loss from long Russian Ruble. The Relative Equity portfolio posted a decent gain, primarily driven by its short S&P 500-position, while a short position in Hang Seng and a long in the German Stock Index DAX 30 had a negative impact. In the Relative Bond portfolio, there were few gains, with the negative impact attributable to a combination of the long in Bunds and short in Canadian and Australian debt.
2019started with risky assets rebounding strongly from the December sell-off. Despite the outlook for corporate earnings continuously being lowered, investors again favored risky assets
Definitions of Terms and Indices can be found on the back page.
| 47 Hulfish Street, Suite 510, Princeton, NJ 08542 ● T 609.430.0404 ● F609.454.5010 ● www.equinoxfunds.com |
as they chose to rather focus on the ever-changing outlook for the global economy and actions taken by various central banks. The equity market benefited from stronger-than-expected economic data and the major U-turn taken by the US Fed as it signaled a more market-friendly policy stance. Another sign of investors’ decreased risk-aversion was the depreciation of the safe haven currencies (Swiss Franc, US dollar and Japanese Yen), while the Canadian dollar strengthened on the backdrop of oil posting its strongest January return on record. The British Pound strengthened as a “no-deal Brexit” was being viewed as a less likely outcome, as well as from strong wage and employment numbers. Global equities were up 7.8% and global bonds gained 0.9%. The strategy’s positive performance in January was attributable largely to strong gains in the Developed Markets Currency portfolio. The largest positive contribution came from the long British Pound position, with substantial positive contributions coming from the short Swiss Franc and long Australian Dollar positioning, while the short New Zealand Dollar and Canadian dollar positions detracted. The Directional portfolio took a hit from its short equity positioning, which overshadowed positive contributions from the portfolio’s other positions. The Relative Equity portfolio generally suffered from its short positions in strong markets and long positions in relatively weaker markets. The Relative Bond portfolio had a significant positive contribution the large long position in German bunds, which was partly offset by losses from short positions in Australia and Canada. The Emerging Markets Currency portfolio ended the month flat.
InFebruary, the Trump administration announced that it would postpone the additional tariffs on Chinese goods set to take effect on March 1st, citing “substantial progress” in the bilateral trade negotiations. British Prime Minister May delayed a Brexit deal vote to mid-March and expressed openness to extending the looming March 29 deadline if no deal was in place by then. This softened stance sent the British Pound rallying against most currencies. The Australian Dollar and Australian bond yields were hit by dovish statements from the Reserve Bank of Australia’s Governor Lowe, who indicated that an interest rate cut is as likely as a hike, shifting the previously hawkish Reserve Bank of Australia stance where an interest rate hike seemed more probable. Global equities were up 3.0%, while global bonds lost 0.1%. The strategy was down for the month. The largest negative contribution came from the Relative Bond portfolio, which suffered from a significant short position in Australian bonds, though this was partially offset by gains from a short position in Canadian bonds. The two currency portfolios cancelled each other out, with a loss in the Developed Markets Currency portfolio and a profit in the Emerging Markets Currency portfolio. Even though the strategy’s long British Pound position added substantial value, it could not outweigh the losses stemming from the long Australian Dollar, long Japanese Yen, and short Canadian dollar positioning. A minor profit was posted by the Relative Equity portfolio with numerous small gains leading to the portfolio’s
Definitions of Terms and Indices can be found on the back page.
| 47 Hulfish Street, Suite 510, Princeton, NJ 08542 ● T 609.430.0404 ● F609.454.5010 ● www.equinoxfunds.com |
overall positive contribution. The directional portfolio had a negative month largely due to the short, later turning long, position in global equities.
Driven by muted inflation data and increased fears of a slowing world economy, the main driver of asset returns inMarch was the dovish U-turn taken by both the FED and the European Central Bank. As a consequence, long-term yields fell across developed markets – many to record lows – leading to a bond rally with the global benchmark bond index gaining 1.9%. Despite the announcement by the US Fed that it expects no further interest rate hikes in 2019, the US dollar held its ground, along with other safe haven currencies. In the wake of the Fed’s revised economic outlook, the widely-watched 10Y vs. 3M-yield curve, an indicator that has historically foreshadowed recessions, briefly inverted for the first time since 2007. Somewhat surprisingly, despite the above-mentioned events in combination with stalling U.S.-China trade talks and the Brexit process lingering on, the sentiment for risky assets remained robust. Global equities ended the month up 1.3%. The strategy posted a loss for the month with negative contributions from four of the strategy’s five sub-portfolios. The strategy was particularly hurt by its bond exposure, with losses coming from the short global bonds positioning in the Directional portfolio and short positions in Australian and Canadian bonds in the Relative Bond portfolio. The Emerging Markets Currency portfolio had another positive month, with the main contributor again being the short Brazilian Real position. A minor negative contribution came from the Developed Markets Currency portfolio, where the long British Pound position suffered from uncertainties surrounding Brexit. This was balanced by the long Japanese Yen position, benefiting from its status as a safe haven and low inflation currency. Long positions, primarily in Germany, Spain and Sweden, caused losses in the Relative Equity portfolio, which were partly offset by gains from the long FTSE/MIB Italy Index and short Toronto Stock Exchange Index positioning.
Aprilsaw fears over global growth replaced by increasing optimism as positive developments on international trade and corporate earnings took center stage. Even though some countries such as Germany continued to struggle with an economic slowdown, the world’s two biggest economies - US and China - both beat the estimates for GDP growth in the first quarter. Additional good news came as the deadline for a deal on Brexit was postponed until October. Dovishness among central banks continued, as the central bank of Sweden said it would hold interest rates fixed for a longer period than previously forecast and would purchase Swedish Krona 45bn of sovereign bonds, sending the Swedish Krona lower. The Bank of Canada also took a more dovish stance, eliminating the possibility of an imminent rate hike. Risky assets rallied with global equities gaining 3.5% while global bonds lost 0.2%. The strategy posted gains across the portfolio in April, with 80% of market positions contributing positively and profits generated in four out of the five sub-portfolios. The biggest winner was the Directional
Definitions of Terms and Indices can be found on the back page.
| 47 Hulfish Street, Suite 510, Princeton, NJ 08542 ● T 609.430.0404 ● F609.454.5010 ● www.equinoxfunds.com |
portfolio which gained from all four positions, but primarily from the long global equity and short global bond positioning. This was closely followed by the Developed Markets Currency portfolio, where significant positive contributions came from the short New Zealand Dollar, long British Pound, short Swedish Krona, and short Swiss Franc positioning. All but two positions in the Relative Equity portfolio contributed positively. The Emerging Markets Currency portfolio delivered a robust gain, with long Mexican Peso, short Korean Won, short Brazilian Real, and long Russian Ruble positions adding value. The exception was the Relative Bonds portfolio which had a negative month, to a large degree attributable to the short position in Australian bonds.
May’sabrupt turn in sentiment sent equity markets worldwide plummeting and bond yields moving lower, with the German 10-year yield breaching the previous record low set in 2016. The risk-off environment was driven to a large extent by the escalating bilateral trade war between China and the US, and the likely overreaction to the negotiation tactics of the Trump administration. Additionally, a new potential trade war appeared on the horizon as the US threatened to impose a 5% duty on all Mexican goods, causing a drop in the Mexican peso. Theresa May threw in the towel and announced that she would resign from her role as the British Prime Minister after another failed attempt to get parliamentary support for a revised Brexit bill. The uncertainty around the process caused the British Pound to fall to the lowest level since the start of the year. By month-end, global equities were down 5.8%, whereas global bonds ended up 1.8%. It was a gloomy month for the strategy with negative returns in all five sub-portfolios. The strategy’s model’s models still saw the environment as being conducive to equities with fundamental supports to growth and risk appetite, while the fundamental outlook for global bonds looked unattractive, with yield curves globally continuing to flatten or even invert. The Relative Equity portfolio’s negative attribution was mostly due to a long position in the FTSE/MIB Italy Index and a short position in the S&P/Australian Stock Exchange Index 200, where the former suffered from a political crisis in the country and the latter from a conservative victory in the Australian elections. The Developed Markets Currency portfolio’s negative contribution came from the long positioning in the British Pound and Australian Dollar, which was partly offset by a positive contribution from the short New Zealand Dollar position. The Emerging Markets Currency portfolio suffered losses in the long Mexican Peso and short Brazilian Real positioning.
Junewas characterized by central banks’ continued shift towards looser monetary policy in the face of increased uncertainty, fragile global growth, and muted inflation. This dovishness among policymakers lifted risky assets, and global equities soared, ending the month up 6.6%. It also proved to be accommodative for global bonds, which ended up 1.4% as yields continued to compress. Trade wars and the Brexit process took a back seat and failed to have any real
Definitions of Terms and Indices can be found on the back page.
| 47 Hulfish Street, Suite 510, Princeton, NJ 08542 ● T 609.430.0404 ● F609.454.5010 ● www.equinoxfunds.com |
dampening effect on sentiment. Even escalating geopolitical tensions between the United States and Iran cast no more than a minor shadow on investors’ sunny outlook. The Federal Reserve removed language about being patient and paved the way for a rate cut, which, if it materialized, would be the first in more than a decade. This sent the US Dollar index lower, breaking the upward trend that has been in place since the beginning of the year. The strategy ended the month in positive territory. The Directional portfolio was the best performer with three of the four assets contributing positively and only the short global bonds position posting losses as bond prices edged higher. Both the Relative Equity and Relative Bond portfolios were flat for the month. Relative Equities balanced gains in Canada, Italy, and France against losses in Spain and the US. A negative attribution from short Australian bonds was mainly balanced by a gain from the long position in US T-notes, which has grown considerably. The Emerging Markets Currency portfolio gained slightly with primary positive contributions coming from the long Czech Koruna and short Brazilian Real positioning. Only the Developed Markets Currency portfolio was negative for the month, hurt by its long Australian Dollar, short New Zealand Dollar, and long British Pound positioning, although this was somewhat mitigated by the short US dollar positioning.
Outlook
We are more than nine years into the current equity bull market run, with many equity indexes at or near all-time highs, although there have been episodes of volatility and corrections, albeit short-lived. While all asset classes do inevitably go through cycles, it is increasingly clear that investors and pundits alike are inept at predicting the future accurately, and attempts to tactically time markets usually end up detracting from performance.
Although the Fund has been in operation for a relatively short period, the IPM program has a track record that dates back several years. These types of programs have historically offered useful diversification benefits, along with what we believe are attractive risk-adjusted long-term returns over multiple market cycles. In our opinion, the Fund could continue to offer these potential benefits in the future. The macro environment is still challenging and the outlook for markets remains fraught with uncertainty. Some of the risks we perceive on the horizon for the coming year include continuing political and geopolitical tensions in various parts of the world, and the potential for global economies being affected adversely by tariffs and sanctions.
We continue to believe that, by accepting some drawdown risk—and managed futures drawdowns have historically rarely been very deep, although they have at times dragged out painfully, as was the case in 2011-2013—investors tend to be compensated with a positive risk premium over time, a core hypothesis of most managed futures strategies. The IPM program
Definitions of Terms and Indices can be found on the back page.
| 47 Hulfish Street, Suite 510, Princeton, NJ 08542 ● T 609.430.0404 ● F609.454.5010 ● www.equinoxfunds.com |
strives to implement efficient risk management techniques that aim to protect gains and mitigate losses during difficult periods; based on historical experience, we believe this may yield positive risk-adjusted performance over the long run and over multiple market cycles.
As always, we encourage investors to focus on holding portfolios that contain a strategic mix of traditional assets and alternative asset classes, appropriate for their long-term goals. Well-balanced portfolios may display lower volatility, while also affording potential opportunities for long-term growth. We believe that a significant and strategic investment in the Fund could play an important role in such an investment portfolio.
DEFINITIONS OF TERMS AND INDICES
Annualized rate of return (AROR): The geometric average return for a period greater than or equal to one year, expressed on an annual basis or as a return per year.
Barclay BTOP50 Index® (BTOP50): The Index seeks to replicate the overall composition of the managed futures industry with regard to trading style and overall market exposure.
Basis point (BPS): Refers to a common unit of measure for interest rates and other percentages in finance. One basis point is equal to 1/100th of 1%, or 0.01% (0.0001), and is used to denote the percentage change in a financial instrument. The relationship between percentage changes and basis points can be summarized as follows: 1% change = 100 basis points, and 0.01% = 1 basis point.
Brexitis an abbreviation of “British exit”, which refers to the June 23, 2016 referendum by British voters to exit the European Union.
Cumulative return: The return or yield on an investment or portfolio over a given period of time, expressed in non-annualized terms.
Adrawdown is the peak-to-trough decline during a specific recorded period of an investment, fund, or commodity.
European Central Bank (European Central Bank) is the central bank responsible for the monetary system of the European Union (EU) and the euro currency. The bank was formed in Germany in June 1998 and works with the other national banks of each of the EU members to formulate monetary policy that helps maintain price stability in the European Union.
Giltsare bonds issued by the British government.
Gross Domestic Product (GDP) is the broadest quantitative measure of a nation’s total economic activity. More specifically, GDP represents the monetary value of all goods and services produced within a nation’s geographic borders over a specified period of time.
The Federal Reserve (the Fed) is the central bank of the US and is a system that comprises a central governmental agency (the Board of Governors) in Washington, DC and 12 regional
Definitions of Terms and Indices can be found on the back page.
| 47 Hulfish Street, Suite 510, Princeton, NJ 08542 ● T 609.430.0404 ● F609.454.5010 ● www.equinoxfunds.com |
Federal Reserve Banks each responsible for a specific geographic area of the US having broad regulatory powers over the country’s money supply and credit structure.
The Federal Open Market Committee (FOMC) is the branch of the Federal Reserve Board that determines the direction of monetary policy. The FOMC is composed of the board of governors, which has seven members, and five reserve bank presidents.
Aforward contract is a customized contract between two parties to buy or sell an asset at a specified price on a future date. Unlike standard futures contracts, a forward contract can be customized to any commodity, amount, and delivery date.
Long Position refers to the buying of a security with the expectation that the asset will rise in value. There is risk of loss. You can lose money by utilizing a long position. There is no assurance that any investment strategy will be profitable, or that they will be able to avoid losses.
OPECis an organization of countries that produce oil. It tries to develop a common policy and system of prices.OPEC is an abbreviation for ‘Organization of Petroleum-Exporting Countries.’
ThePurchasing Managers’ Index® (PMI®) is based on monthly surveys of carefully selected companies representing major and developing economies worldwide.
S&P 500® Total Return Index: Widely regarded as the best single gauge of the US equities market, this world-renowned Index includes 500 leading companies in leading industries of the US economy.
Short Position is a position whereby an investor sells a security in which they do not own in anticipation of a price decline. The investor is then required to return an equal number of shares at some point in the future. There is risk of loss. You can lose money by utilizing a short position. There is no assurance that any investment strategy will be profitable, or that they will be able to avoid losses.
Aswap is a derivative contract through which two parties exchange financial instruments.
ASystematic Trading Strategy (also known as Quantitative) employs computer driven, mathematical models to identify when to buy or sell an instrument according to rules determined before a trade is made, generally with little or no human intervention once a mathematical formula has been entered.
ATrend-Following Strategy seeks to capitalize on momentum or price trends across global asset classes by taking either long or short positions as a trend is underway. Price trends are created when investors are slow to act on new information or sell prematurely and hold on to losing investments to long. Price trends continue when investors continue to buy and investment that is going up in price or sell an investment that is going down in price.
Value at risk (VaR) is a statistical technique used to measure and quantify the level of financial risk within a firm or investment portfolio over a specific time-frame.
3639-NLD-8/19/2019
Definitions of Terms and Indices can be found on the back page.
| 47 Hulfish Street, Suite 510, Princeton, NJ 08542 ● T 609.430.0404 ● F609.454.5010 ● www.equinoxfunds.com |
| Equinox IPM Systematic Macro Fund |
| PORTFOLIO REVIEW |
| June 30, 2019 (Unaudited) |
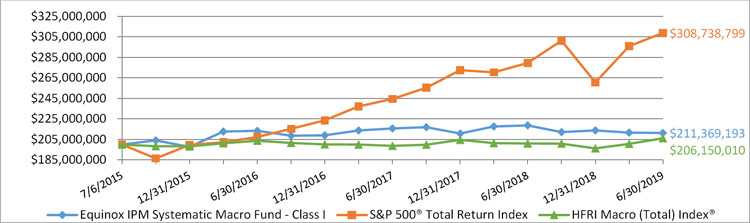
The Fund’s performance figures for the periods ended June 30, 2019, as compared to its benchmarks(1):
| | | Annualized |
| | One Year | Three Year | Start of Performance(2) |
| Equinox IPM Systematic Macro Fund | | | |
| Class I | (3.33)% | (0.32)% | 1.40% |
| S&P 500® Total Return Index(3) | 10.42% | 14.19% | 11.51% |
| HFRI Macro (Total) Index®(4) | 2.55% | 0.41% | 0.76% |
| (1) | The performance data quoted is historical. Past performance is no guarantee of future results. Current performance may be higher or lower than the performance data quoted. The principal value and investment return of an investment will fluctuate so that your shares, when redeemed, may be worth more or less than their original cost. The returns shown in the graph and table do not reflect the deduction of taxes that a shareholder would pay on portfolio distributions or on the redemptions of portfolio shares. Performance returns would have been lower had Equinox Institutional Asset Management, LP (the “Adviser”) not waived its fees or reimbursed a portion of the Fund’s expenses pursuant to an expense limitation agreement. Under the terms of the expense limitation agreement, the Adviser has contractually agreed to reduce its advisory fee and/or reimburse certain expenses of the Fund, to ensure that the Fund’s total annual operating expenses, excluding (i) taxes, (ii) interest, (iii) extraordinary items, (iv) “Acquired Fund Fees and Expenses,” and (v) brokerage commissions, do not exceed, on an annual basis, 1.83% of the Fund’s average daily net assets. This expense limitation will remain in effect until November 30, 2019, but can be terminated by the Fund’s Board of Trustees on 60 days’ written notice to the Adviser. The Adviser shall be entitled to recover, subject to approval by the Board of Trustees of the Trust, such waived or reimbursed amounts for a period of up to three (3) years from the date on which the Adviser reduced its compensation and/or assumed expenses for the Fund. The Adviser is permitted to seek reimbursement from the Fund, subject to certain limitations, for fees it waived and Fund expenses it paid to the extent the total annual fund operating expenses do not exceed the limits described above or any lesser limits in effect at the time of reimbursement. No recoupment by the Adviser will occur unless the Fund’s operating expenses are below the expense limitation amount. Per the fee table in the November 1, 2018 prospectus, the Fund’s “Total Annual Fund Operating Expenses” and “Total Annual Fund Operating Expenses (after Fee Waiver and/or Expense Reimbursement)” are 2.03% and 1.85%, respectively. More recent expense ratio information is available in the Consolidated Financial Highlights included in this report. For performance information current to the most recent month-end please call 1-888-643-3431. |
| (2) | Start of performance is July 7, 2015. |
| (3) | The S&P 500® Total Return Index is a widely accepted, unmanaged index of U.S. stock market performance which does not take into account charges, fees and other expenses. It is not possible to invest directly in an index. |
| (4) | The HFRI Macro (Total) Index® includes Investment Managers which trade a broad range of strategies in which the investment process is predicated on movements in underlying economic variables and the impact these have on equity, fixed income, hard currency and commodity markets. It is not possible to invest directly in an index. |
Comparison of the Change in Value of a $200,000,000 (Investment Minimum) Investment
| Portfolio Composition | | % of Net Assets | |
| U.S. Treasury Notes | | | 98.4 | % |
| Short-Term Investments | | | 1.0 | % |
| Other assets and liabilities – net(5) | | | 0.6 | % |
| | | | 100.0 | % |
| (5) | Includes net unrealized appreciation on futures contracts. |
Please refer to the Consolidated Portfolio of Investments in this annual report for a detailed analysis of the Fund’s holdings.
| Equinox IPM Systematic Macro Fund |
| CONSOLIDATED PORTFOLIO OF INVESTMENTS |
| June 30, 2019 |
U.S. TREASURY NOTES - 98.4%
| Principal | | | | | Coupon Rate | | Maturity Date | | Value | |
| $ | 54,000,000 | (a) | | | | 1.625% | | 07/31/2019 | | $ | 53,972,300 | |
| | 86,000,000 | (a) | | | | 1.500% | | 10/31/2019 | | | 85,835,391 | |
| | 59,000,000 | (a) | | | | 1.250% | | 01/31/2020 | | | 58,713,067 | |
| | 49,500,000 | (a) | | | | 1.500% | | 04/15/2020 | | | 49,298,906 | |
| | 75,500,000 | (a) | | | | 2.000% | | 07/31/2020 | | | 75,558,985 | |
| | 21,500,000 | | | | | 1.625% | | 11/30/2020 | | | 21,434,912 | |
| | 7,500,000 | | | | | 2.250% | | 02/15/2021 | | | 7,552,148 | |
| | | | | Total U.S. Treasury Notes | | | | | | | | |
| | | | | (Cost $351,007,696) | | | | | | | 352,365,709 | |
| | | | | | | | | | | | | |
| SHORT-TERM INVESTMENTS - 1.0% | | | | | | | | |
| | | | | | | | | |
| Number of Shares | | | Description | | | | | | Value | |
| | 3,773,140 | | | U.S. Bank Money Market Deposit Account | | | | | | | 3,773,140 | |
| | | | | Total Short-Term Investments | | | | | | | | |
| | | | | (Cost $3,773,140) | | | | | | | 3,773,140 | |
| | | | | | | | | | | | | |
| | | | | Total Investments - 99.4% | | | | | | | | |
| | | | | (Cost $354,780,836) (b) | | | | | | | 356,138,849 | |
| | | | | | | | | | | | | |
| | | | | Other Assets in Excess of Liabilities - 0.6% | | | | | | | 2,112,530 | |
| | | | | | | | | | | | | |
| | | | | TOTAL NET ASSETS - 100.0% | | | | | | $ | 358,251,379 | |
| (a) | A portion of this security is held in a wholly-owned and controlled subisdiary organized as a Delaware Limited Liability Company and consolidated for financial reporting purposes. |
| (b) | Represents cost for financial reporting purposes. Aggregate cost for federal tax purposes is $354,780,836 and differs from market value by net unrealized appreciation of securities as follows: |
| | Unrealized Appreciation: | | $ | 1,358,013 | |
| | Unrealized Depreciation: | | | — | |
| | Net Unrealized Appreciation: | | $ | 1,358,013 | |
FUTURES CONTRACTS (c)
| | | | | | | | | | | Unrealized | |
| | | | | | | | | | | Appreciation/ | |
| Number of Contracts | | | Description | | Expiration Date | | Notional Amount | | | (Depreciaion) | |
| Short Futures Contracts | | | | | | | | | | | | | |
| 1,766 | | | New Zealand Dollar Future | | Sep-19 | | $ | 118,798,820 | | | $ | (2,237,495 | ) |
| 1,609 | | | Australian 10-Year Treasury Bond Future | | Sep-19 | | | 162,266,961 | | | | (1,425,479 | ) |
| 675 | | | Long Gilt Future | | Sep-19 | | | 111,695,643 | | | | (152,502 | ) |
| 403 | | | OMXS30 Index Future | | Jul-19 | | | 7,033,725 | | | | (127,850 | ) |
| 383 | | | Brazilian Real Future | | Aug-19 | | | 9,958,000 | | | | 7,165 | |
| 281 | | | Swedish Krona Future | | Sep-19 | | | 60,903,940 | | | | (930,250 | ) |
| 251 | | | South Korean Won Future | | Jul-19 | | | 5,426,620 | | | | (100,708 | ) |
| 215 | | | Euro-Bund Future | | Sep-19 | | | 42,230,877 | | | | (138,219 | ) |
| 192 | | | Swiss Franc Future | | Sep-19 | | | 24,772,800 | | | | (418,800 | ) |
| 182 | | | Japanese Yen Future | | Sep-19 | | | 21,228,025 | | | | (80,315 | ) |
| 167 | | | S&P/Toronto Stock Exchange 60 Index Future | | Sep-19 | | | 24,936,184 | | | | (107,083 | ) |
| 116 | | | Czech Koruna Future | | Sep-19 | | | 11,585,812 | | | | 120,094 | |
| 111 | | | Swiss Market Index Future | | Sep-19 | | | 11,203,473 | | | | 31,270 | |
| 87 | | | Euro FX Future | | Sep-19 | | | 12,448,069 | | | | (71,891 | ) |
| 71 | | | Indian Rupee Future | | Jul-19 | | | 2,049,060 | | | | (16,230 | ) |
| 67 | | | Canadian 10-Year Government Bond Future | | Sep-19 | | | 7,312,672 | | | | (2,694 | ) |
| 52 | | | FTSE 100 Index Future | | Sep-19 | | | 4,866,312 | | | | (53,325 | ) |
| 41 | | | S&P 500 Index Future | | Sep-19 | | | 30,178,050 | | | | (506,863 | ) |
| 30 | | | Canadian Dollar Future | | Sep-19 | | | 2,296,650 | | | | (34,744 | ) |
| 22 | | | Hungarian Forint Future | | Sep-19 | | | 2,188,317 | | | | (5,421 | ) |
| 1 | | | Tokyo Price Index Future | | Sep-19 | | | 143,858 | | | | (1,239 | ) |
| | | | | | | | | | | | | (6,252,579 | ) |
| (c) | Futures contracts are held in a wholly-owned and controlled subisdiary organized as a Delaware Limited Liability Company and consolidated for financial reporting purposes. |
The accompanying notes are an integral part of these consolidated financial statements.
| Equinox IPM Systematic Macro Fund |
| CONSOLIDATED PORTFOLIO OF INVESTMENTS |
| June 30, 2019 (Continued) |
FUTURES CONTRACTS (c) (Continued)
| | | | | | | | | | | Unrealized | |
| | | | | | | | | | | Appreciation/ | |
| Number of Contracts | | | Description | | Expiration Date | | Notional Amount | | | (Depreciaion) | |
| Long Futures Contracts | | | | | | | | | | | | | |
| 2,479 | | | Australian Dollar Future | | Sep-19 | | $ | 174,422,440 | | | $ | 1,658,028 | |
| 1,365 | | | U.S. 10-Year Treasury Note Future | | Sep-19 | | | 174,677,344 | | | | 1,899,675 | |
| 1,051 | | | British Pound Future | | Sep-19 | | | 83,744,994 | | | | (102,655 | ) |
| 783 | | | Mexican Peso Future | | Sep-19 | | | 20,146,590 | | | | 1,958 | |
| 394 | | | IBEX 35 Index Future | | Jul-19 | | | 41,096,642 | | | | 321,479 | |
| 344 | | | CAC 40 10 Euro Future | | Jul-19 | | | 21,643,019 | | | | 319,413 | |
| 307 | | | Russian Ruble Future | | Sep-19 | | | 12,019,050 | | | | 310,838 | |
| 244 | | | FTSE/MIB Index Future | | Sep-19 | | | 29,348,919 | | | | 591,610 | |
| 147 | | | Norwegian Krone Future | | Sep-19 | | | 34,545,000 | | | | 406,020 | |
| 138 | | | Amsterdam Exchanges Index Future | | Jul-19 | | | 17,604,207 | | | | 206,271 | |
| 87 | | | German Stock Index Future | | Sep-19 | | | 30,637,913 | | | | 601,983 | |
| 65 | | | Polish Zloty Future | | Sep-19 | | | 8,724,300 | | | | 56,550 | |
| 63 | | | Singapore Dollar Future | | Jul-19 | | | 1,574,651 | | | | (9,503 | ) |
| 55 | | | SPI 200 Index Future | | Sep-19 | | | 6,331,526 | | | | (21,162 | ) |
| 18 | | | Hang Seng Index Future | | Jul-19 | | | 3,284,112 | | | | 35,239 | |
| 14 | | | South African Rand Future | | Sep-19 | | | 1,414,413 | | | | (35,055 | ) |
| 8 | | | Japanese 10-Year Government Bond Future | | Sep-19 | | | 11,415,851 | | | | 12,592 | |
| | | | | | | | | | | | | 6,253,281 | |
| | | | | | | | | | | | | | |
| Net Unrealized Appreciation on Futures Contracts | | | $ | 702 | |
| (c) | Futures contracts are held in a wholly-owned and controlled subisdiary organized as a Delaware Limited Liability Company and consolidated for financial reporting purposes. |
The accompanying notes are an integral part of these consolidated financial statements.
Equinox IPM Systematic Macro Fund
CONSOLIDATED STATEMENT OF ASSETS AND LIABILITIES
June 30, 2019
| ASSETS: | | | | |
| Investments at cost | | $ | 354,780,836 | |
| Investments at value | | $ | 356,138,849 | |
| Deposits for futures contracts(1) | | | 913,153 | |
| Net unrealized appreciation on futures contracts | | | 702 | |
| Receivable for Fund shares sold | | | 227,562 | |
| Interest receivable | | | 1,778,760 | |
| Prepaid expenses and other assets | | | 19,469 | |
| Total assets | | | 359,078,495 | |
| | | | | |
| LIABILITIES: | | | | |
| Payable for Fund shares redeemed | | | 194,190 | |
| Payable to Adviser | | | 424,847 | |
| Accrued expenses | | | 208,079 | |
| Total liabilities | | | 827,116 | |
| | | | | |
| Net Assets | | $ | 358,251,379 | |
| | | | | |
| NET ASSETS CONSIST OF: | | | | |
| Paid in capital | | $ | 379,469,992 | |
| Accumulated losses | | | (21,218,613 | ) |
| Net Assets | | $ | 358,251,379 | |
| | | | | |
| Class I Shares | | | | |
| Issued and outstanding (unlimited shares authorized, no par value) | | | 36,254,307 | |
| Net Asset Value, Redemption Price and Offering Price Per Share | | $ | 9.88 | |
| (1) | Pledged as collateral for open futures contracts. |
The accompanying notes are an integral part of these consolidated financial statements.
Equinox IPM Systematic Macro Fund
CONSOLIDATED STATEMENT OF OPERATIONS
For the Year Ended June 30, 2019
| INVESTMENT INCOME: | | | | |
| Interest income | | $ | 8,642,885 | |
| Total Investment Income | | | 8,642,885 | |
| | | | | |
| EXPENSES: | | | | |
| Investment advisory fees | | | 6,490,208 | |
| Transfer agent fees | | | 392,938 | |
| Legal fees | | | 265,798 | |
| Interest expense | | | 247,457 | |
| Fund administration and accounting fees | | | 199,247 | |
| Reports to shareholders | | | 83,765 | |
| Trustees fees and related expenses | | | 72,715 | |
| Audit fees | | | 54,500 | |
| Custody fees | | | 45,936 | |
| Federal and state registration fees | | | 39,240 | |
| Compliance officer fees | | | 31,790 | |
| Other | | | 158,324 | |
| Total expenses before waiver and reimbursement | | | 8,081,918 | |
| | | | | |
| Less: Expenses waived/reimbursed by the adviser | | | (764,703 | ) |
| | | | | |
| Net Expenses | | | 7,317,215 | |
| | | | | |
| Net Investment Income | | | 1,325,670 | |
| | | | | |
| REALIZED AND UNREALIZED GAIN (LOSS) ON INVESTMENTS | | | | |
| Net realized loss on: | | | | |
| Investments | | | (52,923 | ) |
| Futures contracts | | | (13,060,329 | ) |
| Foreign currency translations | | | (23,656 | ) |
| Commissions on futures contracts | | | (503,120 | ) |
| | | | | |
| Change in net unrealized appreciation (depreciation) on: | | | | |
| Investments | | | 1,604,382 | |
| Futures contracts | | | (3,233,832 | ) |
| Foreign currency translations | | | (88,690 | ) |
| | | | | |
| Net Realized and Unrealized Loss on Investments | | | (15,358,168 | ) |
| | | | | |
| Net Decrease in Net Assets Resulting from Operations | | $ | (14,032,498 | ) |
The accompanying notes are an integral part of these consolidated financial statements.
Equinox IPM Systematic Macro Fund
CONSOLIDATED STATEMENTS OF CHANGES IN NET ASSETS
| | | For the | | | For the | |
| | | Year Ended | | | Year Ended | |
| | | June 30, 2019 | | | June 30, 2018 | |
| OPERATIONS: | | | | | | | | |
| Net investment gain (loss) | | $ | 1,325,670 | | | $ | (4,667,568 | ) |
| Net realized gain (loss) on: | | | | | | | | |
| Investments | | | (52,923 | ) | | | (24,142 | ) |
| Futures contracts | | | (13,060,329 | ) | | | (360,208 | ) |
| Foreign currency translations | | | (23,656 | ) | | | 1,205,476 | |
| Commissions on futures contracts | | | (503,120 | ) | | | (545,842 | ) |
| Change in net unrealized appreciation/depreciation on: | | | | | | | | |
| Investments | | | 1,604,382 | | | | (61,344 | ) |
| Futures contracts | | | (3,233,832 | ) | | | 10,285,959 | |
| Foreign currency translations | | | (88,690 | ) | | | (303,211 | ) |
| Net increase (decrease) in net assets resulting from operations | | | (14,032,498 | ) | | | 5,529,120 | |
| | | | | | | | | |
| DISTRIBUTIONS TO SHAREHOLDERS: | | | | | | | | |
| Total distributions paid | | | (5,234,993 | ) | | | — | |
| Net decrease in net assets resulting from distributions paid | | | (5,234,993 | ) | | | — | |
| | | | | | | | | |
| CAPITAL SHARE TRANSACTIONS: | | | | | | | | |
| Shares sold | | | 146,527,652 | | | | 143,220,325 | |
| Shares issued to shareholders in reinvestment of distributions | | | 5,208,756 | | | | — | |
| Shares redeemed | | | (185,784,108 | ) | | | (219,040,437 | ) |
| Net decrease in net assets resulting from capital share transactions | | | (34,047,700 | ) | | | (75,820,112 | ) |
| | | | | | | | | |
| Total Decrease in Net Assets | | | (53,315,191 | ) | | | (70,290,992 | ) |
| | | | | | | | | |
| NET ASSETS: | | | | | | | | |
| Beginning of Period | | | 411,566,570 | | | | 481,857,562 | |
| | | | | | | | | |
| End of Period | | $ | 358,251,379 | | | $ | 411,566,570 | (1) |
| | | | | | | | | |
| TRANSACTIONS IN SHARES: | | | | | | | | |
| Shares sold | | | 14,466,862 | | | | 14,123,894 | |
| Shares issued to holders in reinvestment of distributions | | | 520,876 | | | | — | |
| Shares redeemed | | | (18,441,877 | ) | | | (21,545,096 | ) |
| Net decrease in shares outstanding | | | (3,454,139 | ) | | | (7,421,202 | ) |
| (1) | Includes undistributed net investment income of $5,234,993. |
The accompanying notes are an integral part of these consolidated financial statements.
Equinox IPM Systematic Macro Fund
CONSOLIDATED FINANCIAL HIGHLIGHTS
Per Share Data and Ratios for a Share of Beneficial Interest Outstanding Throughout Each Period
| | | Class I | |
| | | | | | | | | | | | | |
| | | For the Year | | | For the Year | | | For the Year | | | For the Period | |
| | | Ended | | | Ended | | | Ended | | | Ended | |
| | | June 30, 2019 | | | June 30, 2018 | | | June 30, 2017 | | | June 30, 2016(1) | |
| Net Asset Value, Beginning of Period | | $ | 10.36 | | | $ | 10.22 | | | $ | 10.67 | | | $ | 10.00 | |
| | | | | | | | | | | | | | | | | |
| INCOME (LOSS) FROM INVESTMENT OPERATIONS: | | | | | | | | | | | | | | | | |
| Net investment income (loss)(2) | | | 0.03 | | | | (0.13 | ) | | | (0.16 | ) | | | (0.17 | ) |
| Net realized and unrealized gain (loss) on investments and futures contracts | | | (0.37 | ) | | | 0.27 | | | | 0.26 | | | | 0.84 | |
| Total Income (Loss) from Investment Operations | | | (0.34 | ) | | | 0.14 | | | | 0.10 | | | | 0.67 | |
| | | | | | | | | | | | | | | | | |
| LESS DISTRIBUTIONS: | | | | | | | | | | | | | | | | |
| From net investment income | | | (0.14 | ) | | | — | | | | — | | | | — | |
| From net realized gains | | | — | | | | — | | | | (0.55 | ) | | | — | |
| Total Distributions | | | (0.14 | ) | | | — | | | | (0.55 | ) | | | — | |
| Net Asset Value, End of Period | | $ | 9.88 | | | $ | 10.36 | | | $ | 10.22 | | | $ | 10.67 | |
| Total Return(3) | | | (3.33 | )% | | | 1.37 | % | | | 1.08 | %(4) | | | 6.70 | % (5)(6) |
| | | | | | | | | | | | | | | | | |
| SUPPLEMENTAL DATA AND RATIOS: | | | | | | | | | | | | | | | | |
| Net assets, end of period (in thousands) | | $ | 358,251 | | | $ | 411,567 | | | $ | 481,858 | | | $ | 584,646 | |
| Ratio of gross expenses to average net assets (including interest expense)(7)(8) | | | 2.09 | % | | | 2.07 | % | | | 2.05 | % | | | 2.08 | % (10) |
| Ratio of net expenses to average net assets (including interest expense)(9) | | | 1.89 | % | | | 1.89 | % | | | 1.94 | % | | | 1.82 | % (10) |
| Ratio of net investment income (loss) to average net assets | | | 0.34 | % | | | (1.12 | )% | | | (1.59 | )% | | | (1.58 | )% (10) |
| Portfolio turnover rate | | | 54 | % | | | 0 | % | | | 0 | % | | | 0 | % (6) |
| (1) | The Equinox IPM Systematic Macro Fund commenced operations on July 6, 2015. |
| (2) | Per share amounts are calculated using the average shares method, which more appropriately presents the per share data for the period. |
| (3) | Total returns are historical and assume changes in share price and reinvestment of dividends and distributions. Total returns for periods of less than one year are not annualized. Total returns would be lower absent fee waivers. |
| (4) | For the period ended June 30, 2017, the Fund’s total return was not impacted by the voluntary reimbursement by a related party. |
| (5) | For the period ended June 30, 2016, 0.10% of the Fund’s total return consisted of a voluntary reimbursement by a related party. Excluding this item, the total return would have been 6.60%. |
| (7) | Represents the ratio of expenses to average net assets absent fee waivers and/or expense reimbursements by the Adviser. |
| (8) | Ratio of gross expenses to average net assets excluding interest expense (7): | | 2.03% | | 2.05% | | 2.00% | | 2.03%(10) |
| | | | | | | | | | |
| (9) | Ratio of net expenses to average net assets excluding interest expense: | | 1.83% | | 1.87% | | 1.89% | | 1.77%(10) |
| | | | | | | | | | |
The accompanying notes are an integral part of these consolidated financial statements.
Equinox IPM Systematic Macro Fund
NOTES TO CONSOLIDATED FINANCIAL STATEMENTS
June 30, 2019
The Equinox IPM Systematic Macro Fund (the “Fund”) is a diversified series of shares of beneficial interest of Equinox Funds Trust (the “Trust”), a statutory trust organized under the laws of the State of Delaware on June 2, 2010, and is registered under the Investment Company Act of 1940, as amended (the “1940 Act”), as an open-end management investment company. The Fund commenced operations on July 6, 2015. The Fund currently offers Class I institutional shares which are offered at net asset value. The investment objective of the Fund is to achieve long-term capital appreciation.
| 2. | SIGNIFICANT ACCOUNTING POLICIES |
The following is a summary of significant accounting policies followed by the Fund in preparation of its consolidated financial statements. The policies are in conformity with generally accepted accounting principles in the United States of America (“US GAAP”). The preparation of the consolidated financial statements requires management to make estimates and assumptions that affect the reported amounts of assets and liabilities and disclosure of contingent assets and liabilities at the date of the consolidated financial statements and the reported amounts of income and expenses for the period. Actual results could differ from those estimates. The Fund is an investment company and accordingly follows the investment company accounting and reporting guidance of the Financial Accounting Standards Board (“FASB”) Accounting Standard Codification Topic 946 “Financial Services – Investment Companies” including FASB Accounting Standard Update ASU 2013-08.
Security Valuation– Securities, including exchange traded funds, listed on an exchange are valued at the last reported sale price at the close of the regular trading session of the exchange on the business day the value is being determined, or in the case of securities listed on NASDAQ at the NASDAQ Official Closing Price (“NOCP”). In the absence of a sale such securities shall be valued at the mean between the current bid and ask prices on the primary exchange on the day of valuation. Debt securities (other than short-term obligations) are valued each day by an independent pricing service approved by the Board of Trustees of Equinox Funds Trust (the “Board”) using methods which include current market quotations from a major market maker in the securities and based on methods which include the consideration of yields or prices of securities of comparable quality, coupon, maturity and type. Short-term debt obligations having 60 days or less remaining until maturity, at time of purchase, may be valued at amortized cost. Investments in open-end investment companies are valued at net asset value. Investments in swap contracts are reported at fair value based on daily price reporting from the swap counterparty. Futures are valued at the final settled price or, in the absence of a settled price, at the last sale price on the day of valuation.
The Fund may hold securities, such as private investments, interests in commodity pools, other non-traded securities or temporarily illiquid securities, for which market quotations are not readily available or are determined to be unreliable. These securities will be valued using the “fair value” procedures approved by the Board. The Board has delegated execution of these procedures to a fair value team composed of one or more representatives from each of the (i) Trust, (ii) administrator, and (iii) Adviser. The team may also enlist third party consultants such as a valuation specialist at a public accounting firm, valuation consultant, or financial officer of a security issuer on an as-needed basis to assist in determining a security-specific fair value. The Board reviews and ratifies the execution of this process and the resultant fair value prices at least quarterly to assure the process produces reliable results.
Fair Valuation Process –As noted above, the fair value team is composed of one or more representatives from each of the (i) Trust, (ii) administrator, and (iii) Adviser. The applicable investments are valued collectively via inputs from each of these groups. For example, fair value determinations are required for the following securities: (i) securities for which market quotations are insufficient or not readily available on a particular business day (including securities for which there is a short and temporary lapse in the provision of a price by the regular pricing source), (ii) securities for which, in the judgment of the Adviser, the prices or values available do not represent the fair value of the instrument. Factors which may cause the Adviser to make such a judgment include, but are not limited to, the following: only a bid price or an asked price is available; the spread between bid and asked prices is substantial; the frequency of sales; the thinness of the market; the size of reported trades; and actions of the securities markets, such as the suspension or limitation of trading; (iii) securities determined to be illiquid; and (iv) securities with respect to which an event that will affect the value thereof has occurred (a “significant event”) since the closing prices were established on the
Equinox IPM Systematic Macro Fund
NOTES TO CONSOLIDATED FINANCIAL STATEMENTS (Continued)
June 30, 2019
principal exchange on which they are traded, but prior to a Fund’s calculation of its net asset value. Specifically, interests in commodity pools or managed futures pools are valued on a daily basis by reference to the closing market prices of each futures contract or other asset held by a pool, as adjusted for pool expenses. Restricted or illiquid securities, such as private investments or non-traded securities are valued via inputs from the Adviser based upon the current bid for the security from two or more independent dealers or other parties reasonably familiar with the facts and circumstances of the security (who should take into consideration all relevant factors as may be appropriate under the circumstances). If the Adviser is unable to obtain a current bid from such independent dealers or other independent parties, the fair value team shall determine the fair value of such security using the following factors: (i) the type of security; (ii) the cost at date of purchase; (iii) the size and nature of the Fund’s holdings; (iv) the discount from market value of unrestricted securities of the same class at the time of purchase and subsequent thereto; (v) information as to any transactions or offers with respect to the security; (vi) the nature and duration of restrictions on disposition of the security and the existence of any registration rights; (vii) how the yield of the security compares to similar securities of companies of similar or equal creditworthiness; (viii) the level of recent trades of similar or comparable securities; (ix) the liquidity characteristics of the security; (x) current market conditions; and (xi) the market value of any securities into which the security is convertible or exchangeable.
The Fund utilizes various methods to measure the fair value of all of its investments on a recurring basis. US GAAP establishes a hierarchy that prioritizes inputs to valuation methods. The three levels of inputs are:
Level 1 – Unadjusted quoted prices in active markets for identical assets and liabilities that the Fund has the ability to access.
Level 2 – Observable inputs other than quoted prices included in Level 1 that are observable for the asset or liability, either directly or indirectly. These inputs may include quoted prices for the identical instrument in an inactive market, prices for similar instruments, interest rates, prepayment speeds, credit risk, yield curves, default rates and similar data.
Level 3 – Unobservable inputs for the asset or liability, to the extent relevant observable inputs are not available, representing the Fund’s own assumptions about the assumptions a market participant would use in valuing the asset or liability, and would be based on the best information available.
The availability of observable inputs can vary from security to security and is affected by a wide variety of factors, including, for example, the type of security, whether the security is new and not yet established in the marketplace, the liquidity of markets, and other characteristics particular to the security. To the extent that valuation is based on models or inputs that are less observable or unobservable in the market, the determination of fair value requires more judgment. Accordingly, the degree of judgment exercised in determining fair value is greatest for instruments categorized in Level 3.
The inputs used to measure fair value may fall into different levels of the fair value hierarchy. In such cases, for disclosure purposes, the level in the fair value hierarchy within which the fair value measurement falls in its entirety, is determined based on the lowest level input that is significant to the fair value measurement in its entirety.
The inputs or methodology used for valuing securities are not necessarily an indication of the risk associated with investing in those securities. The following tables summarize the inputs used as of June 30, 2019 for the Fund’s assets and liabilities measured at fair value:
| Assets(a) | | Level 1 | | | Level 2 | | | Level 3 | | | Total | |
| U.S. Treasury Notes | | $ | — | | | $ | 352,365,709 | | | $ | — | | | $ | 352,365,709 | |
| Short-Term Investments | | | 3,773,140 | | | | — | | | | — | | | | 3,773,140 | |
| Futures Contracts(b) | | | 702 | | | | — | | | | — | | | | 702 | |
| Total | | $ | 3,773,842 | | | $ | 352,365,709 | | | $ | — | | | $ | 356,139,551 | |
| (a) | See Consolidated Portfolio of Investments for more information related to the Fund’s investments. |
| (b) | Represents net unrealized appreciation of futures contracts. |
Equinox IPM Systematic Macro Fund
NOTES TO CONSOLIDATED FINANCIAL STATEMENTS (Continued)
June 30, 2019
Consolidation of Subsidiaries –The consolidated financial statements of the Fund include the accounts of Equinox IPM Systematic Macro Fund Limited, a Delaware Limited Liability Company (“EISM-CDC”), a controlled domestic corporation and wholly-owned and controlled subsidiary. All inter-company accounts and transactions have been eliminated in consolidation.
The Fund may invest up to 25% of its total assets in the EISM-CDC which acts as an investment vehicle in order to effect certain investments consistent with the Fund’s investment objectives and policies.
The EISM-CDC utilizes a diversified portfolio of futures contracts in broadly diversified global markets across three major asset classes: currencies, fixed income and stock indices to facilitate the Fund’s pursuit of its investment objective. In accordance with its investment objective and through its exposure to the aforementioned derivative products, the Fund may have increased or decreased exposure to one or more of the risk factors defined in the Principal Investment Risks section of the Fund’s Prospectus.
A summary of the Fund’s investments in the EISM-CDC is as follows:
| | | | | EISM-CDC Net Assets at | | | % of Total Net Assets |
| | | Inception Date of EISM-CDC | | June 30, 2019 | | | at June 30, 2019 |
| EISM-CDC | | 7/8/2015 | | $ | 35,033,910 | | | 9.78% |
Security Transactions and Related Income –Security transactions are accounted for on trade date basis. Interest income is recognized on an accrual basis. Discounts are accreted and premiums are amortized on securities purchased over the lives of the respective securities. Dividend income is recorded on the ex-dividend date. Realized gains or losses from sales of securities are determined by comparing the identified cost of the security lot sold with the net sales proceeds.
Dividends and Distributions to Shareholders –Dividends from net investment income, if any, are declared and paid at least annually. Distributable net realized capital gains, if any, are declared and distributed annually. Dividends from net investment income and distributions from net realized gains are determined in accordance with federal income tax regulations, which may differ from US GAAP. These “book/tax” differences are considered either temporary (i.e., deferred losses, capital loss carry forwards) or permanent in nature. To the extent these differences are permanent in nature, such amounts are reclassified within the composition of net assets based on their federal tax-basis treatment; temporary differences do not require reclassification. Dividends and distributions to shareholders are recorded on ex-dividend date.
Federal Income Tax – The Fund intends to continue to comply with the requirements of the Internal Revenue Code of 1986, as amended, applicable to regulated investment companies and to distribute all of its taxable income to its shareholders. Therefore, no provision for Federal income tax is required. The Fund recognizes the tax benefits of uncertain tax positions only where the position is “more likely than not” to be sustained assuming examination by tax authorities. Management has analyzed all open tax years and concluded that there is no effect to the Fund’s financial position or results of operations and no tax liability resulting from unrecognized tax benefits relating to uncertain income tax positions taken or expected to be taken on a tax return. Open tax years are those years that are open for examination by the relevant income taxing authority. As of June 30, 2019, open federal and state income tax years include the tax years ended June 30, 2016, June 30, 2017, June 30, 2018 and June 30, 2019. The Fund identifies its major tax jurisdictions as U.S. Federal and Colorado where the Fund makes significant investments; however the Fund is not aware of any tax positions for which it is reasonably possible that the total amounts of unrecognized tax benefits will change materially in the next twelve months.
Allocation of Expenses –Expenses incurred by the Trust that do not relate to a specific fund of the Trust are allocated to the individual funds based on each fund’s relative net assets or another appropriate basis. Expenses specifically attributable to a particular fund in the Trust are borne by that fund. Other expenses are allocated to each fund based on its net assets in relation to the total net assets of all the applicable funds in the Trust or another reasonable basis.
Equinox IPM Systematic Macro Fund
NOTES TO CONSOLIDATED FINANCIAL STATEMENTS (Continued)
June 30, 2019
Futures Contracts – The Fund is subject to equity price risk in the normal course of pursuing its investment objectives. The Fund purchases and sells futures contracts to pursue its investment objective, hedge against market risk, and to reduce return volatility. Initial margin deposits required upon entering into futures contracts are satisfied by the segregation of specific securities or cash as collateral for the account of the broker (the Portfolio’s agent in acquiring the futures position). During the period the futures contracts are open, changes in the value of the contracts are recognized as unrealized gains or losses by “marking to market” on a daily basis to reflect the market value of the contracts at the end of each day’s trading. Variation margin payments are received or made depending upon whether unrealized gains or losses are incurred. When the contracts are closed, the Fund recognizes a realized gain or loss equal to the difference between the proceeds from, or cost of, the closing transaction and the Fund’s basis in the contract. If a Fund were unable to liquidate a futures contract and/or enter into an offsetting closing transaction, the Fund would continue to be subject to market risk with respect to the value of the contracts and continue to be required to maintain the margin deposits on the futures contracts. The Fund segregates liquid securities having a value at least equal to the amount of the current obligation under any open futures contract. Risks may exceed amounts recognized in the Consolidated Statement of Assets and Liabilities. With futures, there is minimal counterparty credit risk to a Fund since futures are exchange traded and the exchange’s clearinghouse, as counterparty to all exchange traded futures, guarantees the futures against default. The Fund’s Consolidated Statement of Operations includes interest income earned and interest expense paid in the amounts of $592,069 and $247,457, respectively, on collateral and margin balances held, respectively, at the counterparty. For the fiscal year ended June 30, 2019, the Fund had a net change in unrealized depreciation of $(3,233,832) from futures contracts included in the Consolidated Statement of Operations. For the fiscal year ended June 30, 2019, the Fund had a net realized loss of $(13,060,329) from futures contracts included in the Consolidated Statement of Operations.
Offsetting of Financial Assets and Derivative Assets –It is the Fund’s policy to recognize a net asset or liability equal to the unrealized appreciation (depreciation) of futures contracts. As of June 30, 2019, the Fund is subject to a master netting arrangement for the futures contracts. The following table sets forth the Fund’s net exposure for futures contracts that are subject to an enforceable master netting arrangement as of June 30, 2019:
| | | | | | | | | | | | | Gross Amounts Not Offset in the | | | | |
| | | | | | | | | | | | | Consolidated Statement of Assets & | | | | |
| Assets | | | | | | | | | | | | Liabilities | | | | |
| | | | | | | Gross Amounts | | | | | | | | | | | | | |
| | | | | | | Offset in the | | | Net Amounts | | | | | | | | | | |
| | | | Gross Amounts | | | Consolidated | | | Presented in the | | | | | | | | | | |
| | | | of Recognized | | | Statement of Assets & | | | Consolidated Statement of | | | Financial | | | Cash Collateral | | | | |
| Description | | | Liabilities | | | Liabilities | | | Assets & Liabilities | | | Instruments | | | Pledged* | | | Net Amount | |
| Futures | | | | | | | | | | | | | | | | | | | | | | | | | |
| Contracts | | | $ | (6,579,482 | ) ** | | $ | 6,580,184 | ** | | $ | 702 | | | $ | — | | | $ | — | | | $ | 702 | |
| Total | | | $ | (6,579,482 | ) | | $ | 6,580,184 | | | $ | 702 | | | $ | — | | | $ | — | | | $ | 702 | |
| * | Any over-collateralization of total financial instruments or cash is not shown. The amount held as total collateral is $913,153 and it is shown on the Consolidated Statement of Assets and Liabilities. |
| ** | See Consolidated Portfolio of Investments for breakout of gross unrealized appreciation and depreciation by futures contract. |
Equinox IPM Systematic Macro Fund
NOTES TO CONSOLIDATED FINANCIAL STATEMENTS (Continued)
June 30, 2019
Impact of Derivatives on the Consolidated Statement of Assets and Liabilities and Consolidated Statement of Operations
The following is a summary of the location of derivative investments on the Consolidated Statement of Assets and Liabilities as of June 30, 2019:
| Location on the Consolidated Statement of Assets and Liabilities |
| Derivatives Investment Type | | Asset Derivatives |
| Equity/Interest Rate/Currency Contracts | | Net unrealized appreciation on futures contracts |
The following table sets forth the fair value of the Fund’s derivative contracts by primary risk exposure as of June 30, 2019:
| Derivatives Investment Fair Value |
| | | Equity | | | Interest Rate | | | Currency | | | Total | |
| Futures Contracts | | $ | 1,289,743 | | | $ | 193,373 | | | $ | (1,482,414 | ) | | $ | 702 | |
The following is a summary of the location of derivative investments on the Fund’s Consolidated Statement of Operations for the period ended June 30, 2019:
| Derivative Investment Type | Location of Gain/(Loss) on Derivatives |
| Equity/Interest Rate/Currency Contracts | Net realized loss on futures contracts; Change in |
| | Net unrealized depreciation on futures contracts |
The following is a summary of the Fund’s realized and unrealized gain/(loss) on derivative investments recognized in the Consolidated Statement of Operations categorized by primary risk exposure for the period ended June 30, 2019:
Net change in unrealized appreciation/(depreciation) on derivatives recognized in the Consolidated Statement of Operations
| | | Equity | | | Interest Rate | | | Currency | | | Total | |
| Futures Contracts | | $ | 3,217,594 | | | $ | (436,810 | ) | | $ | (6,014,616 | ) | | $ | (3,233,832 | ) |
| Net realized gain/(loss) on derivatives recognized in the Consolidated Statement of Operations |
| | | Equity | | | Interest Rate | | | Currency | | | Total | |
| Futures Contracts | | $ | (7,209,897 | ) | | $ | (3,944,144 | ) | | $ | (1,906,288 | ) | | $ | (13,060,329 | ) |
The average monthly volume of derivative instruments held by the Fund during the fiscal year ended June 30, 2019 is set forth below:
| Derivative Type | | Unit of Measure | | Average Quantity | |
| Futures – Long | | Notional Amount | | $ | 744,453,692 | |
| Futures – Short | | Notional Amount | | $ | (733,540,737 | ) |
Foreign Currency Transactions –All assets and liabilities denominated in foreign currencies are translated into U.S. dollars based on the rate of exchange of such currencies against U.S. dollars on the date of valuation. Purchases and sales of securities and income and expenses are translated at the rate of exchange quoted on the respective date that such transactions are recorded. The Fund does not isolate that portion of the results of operations resulting from changes in foreign exchange rates on investments from the fluctuations arising from changes in market prices of securities held. Such fluctuations are included with the net realized and unrealized gain or loss on investments.
Indemnification –The Trust indemnifies its officers and trustees for certain liabilities that may arise from the performance of their duties to the Trust. Additionally, in the normal course of business, the Fund enters into contracts that contain a variety of representations and warranties and which provide general indemnities. The Fund’s maximum
Equinox IPM Systematic Macro Fund
NOTES TO CONSOLIDATED FINANCIAL STATEMENTS (Continued)
June 30, 2019
exposure under these arrangements is unknown, as this would involve future claims that may be made against the Fund that have not yet occurred. However, based on experience, the risk of loss due to these warranties and indemnities appears to be remote.
| 3. | INVESTMENT TRANSACTIONS |
For the year ended June 30, 2019, the cost of purchases and proceeds from the sale of securities, other than short-term securities and short-term U.S. Government securities, amounted to $139,947,952 and $139,927,817, respectively.
| 4. | INVESTMENT ADVISORY AGREEMENT AND TRANSACTIONS WITH RELATED PARTIES |
Equinox Institutional Asset Management, LP serves as the Fund’s Investment Adviser (the “Adviser”).
Pursuant to an Advisory Agreement with the Fund, the Adviser, under the oversight of the Board, directs the daily operations of the Fund and supervises the performance of administrative and professional services provided by others. The Adviser has engaged IPM Informed Portfolio Management AB (“IPM”) to direct the investment in futures contracts and futures-related instruments of EISM-CDC in accordance with its IPM Systematic Macro Trading Program (the “IPM Program”). As compensation for its services and the related expenses borne by the Adviser, the Fund pays the Adviser a management fee, computed and accrued daily and paid monthly, at an annual rate of 1.68% of the Fund’s average daily net assets. IPM is paid by the Adviser, not by the Fund. For the fiscal year ended June 30, 2019, the Fund incurred Advisory fees of $6,490,208. The advisory fee payable at June 30, 2019 in the amount of $424,847 was paid in July 2019.
Under the terms of the expense limitation agreement, the Adviser has contractually agreed to reduce its Advisory fee and/or reimburse certain expenses of the Fund, to ensure that the Fund’s total annual operating expenses, excluding (i) taxes, (ii) interest, (iii) extraordinary items, (iv) “Acquired Fund Fees and Expenses,” and (v) brokerage commissions, do not exceed, on an annual basis, 1.83% of the Fund’s average daily net assets. This expense limitation will remain in effect until November 30, 2019, but can be terminated by the Fund’s Board of Trustees on 60 days’ written notice to the Adviser.
The Adviser shall be entitled to recover, subject to approval by the Board of Trustees of the Trust, such waived or reimbursed amounts for a period of up to three (3) years from the date on which the Adviser reduced its compensation and/or assumed expenses for a Fund. The Adviser is permitted to seek reimbursement from the Fund, subject to certain limitations, for fees it waived and Fund expenses it paid to the extent the total annual fund operating expenses do not exceed the limits in effect at the time of reimbursement. No recoupment will occur unless the Fund’s operating expenses are below the lower of the expense limitation in effect at the time of the waiver or recoupment. For the fiscal year ended June 30, 2019, the Adviser voluntarily waived fees and/or reimbursed expenses in the amount of $764,703, all of which is subject to recapture by the Adviser.
The following table shows the waived or reimbursed expenses subject to potential recovery by the Adviser expiring on:
| June 30, 2020 | $615,371 |
| June 30, 2021 | $744,281 |
| June 30, 2022 | $764,703 |
The distributor of the Fund is Northern Lights Distributors, LLC (the “Distributor”). BluGiant, LLC (“BluGiant”), an affiliate of the Distributor, provides EDGAR conversion and filing services as well as print management services for the Fund on an ad-hoc basis. For the provision of these services, BluGiant receives customary fees from the Fund.
Equinox IPM Systematic Macro Fund
NOTES TO CONSOLIDATED FINANCIAL STATEMENTS (Continued)
June 30, 2019
| 5. | OTHER SERVICE PROVIDERS |
Cipperman Compliance Services, LLC (“Cipperman”), provides a Chief Compliance Officer to the Trust, as well as related compliance services, pursuant to a consulting agreement between Cipperman and the Trust. Under the terms of such agreement, Cipperman receives customary fees from the Fund.
| 6. | DISTRIBUTIONS TO SHAREHOLDERS AND TAX COMPONENTS OF CAPITAL |
The tax character of distributions paid during the fiscal year ended June 30, 2019 were as follows:
| | | Fiscal Year Ended June 30, 2019 | |
| Ordinary Income | | $ | 5,234,993 | |
As of June 30, 2019, the components of accumulated earnings/(losses) on a tax basis were as follows:
| Undistributed | | | Undistributed | | | Post October Loss | | | Capital Loss | | | Other | | | Unrealized | | | Total | |
| Ordinary | | | Long-Term | | | and | | | Carry | | | Book/Tax | | | Appreciation/ | | | Accumulated | |
| Income | | | Gains | | | Late Year Loss | | | Forwards | | | Differences | | | (Depreciation) | | | Earnings/(Deficits) | |
| $ | — | | | $ | — | | | $ | (18,102,448 | ) | | $ | (3,921,398 | ) | | $ | — | | | $ | 805,233 | | | $ | (21,218,613 | ) |
The differences between book basis and tax basis unrealized appreciation/(depreciation) and accumulated net realized gain/(loss) from investments are primarily attributable to the mark-to-market on open futures contracts.
Late year losses incurred after December 31 within the fiscal year are deemed to arise on the first business day of the following fiscal year for tax purposes. At June 30, 2019, the Fund deferred, on a tax basis, $18,102,448 of ordinary late year losses.
Capital losses incurred after October 31 within the fiscal year are deemed to arise on the first business day of the following fiscal year for tax purposes. At June 30, 2019, the Fund did not defer, on a tax basis, post-October losses.
| 7. | RECENT ACCOUNTING PRONOUNCEMENT |
In August 2018, the Securities and Exchange Commission adopted amendments to certain disclosure requirements under Regulation S-X to conform to US GAAP, including: (i) an amendment to require presentation of the total, rather than the components, of distributable earnings on the Consolidated Statement of Assets and Liabilities; and (ii) an amendment to require presentation of the total, rather than the components, of distributions to shareholders, except for tax return of capital distributions, on the Consolidated Statement of Changes in Net Assets. The amendments also removed the requirement for parenthetical disclosure of undistributed net investment income on the Consolidated Statement of Changes in Net Assets. These amendments have been adopted with these financial statements.
In August 2018, FASB issued ASU 2018-13, Fair Value Measurement (Topic 820): Disclosure Framework—Changes to the Disclosure Requirements for Fair Value Measurement (“ASU 2018-13”). The primary focus of ASU 2018-13 is to improve the effectiveness of the disclosure requirements for fair value measurements. The changes affect all companies that are required to include fair value measurement disclosures. In general, the amendments in ASU 2018-13 are effective for all entities for fiscal years and interim periods within those fiscal years, beginning after December 15, 2019. An entity is permitted to early adopt the removed or modified disclosures upon the issuance of ASU 2018-13 and may delay adoption of the additional disclosures, which are required for public companies only, until their effective date. Management has evaluated the ASU 2018-13 and has adopted the framework.
Equinox IPM Systematic Macro Fund
NOTES TO CONSOLIDATED FINANCIAL STATEMENTS (Continued)
June 30, 2019
The beneficial ownership, either directly or indirectly, of more than 25% of a fund’s voting securities creates a presumption of control. As of June 30, 2019, the Fund had an omnibus shareholder account (comprised of a group of individual shareholders), which amounted to more than 25% of the total shares outstanding of the Fund. Shareholders with a controlling interest could affect the outcome of proxy voting or direction of management of the Fund.
Subsequent events after the date of the Consolidated Statement of Assets and Liabilities have been evaluated through the date the consolidated financial statements were issued. Management has concluded that there were no subsequent events requiring adjustment and/or disclosure in the consolidated financial statements, except as noted below.
On July 1, 2019, the Board of Trustees of the Trust approved a Plan of Reorganization (the “Plan”) for the Fund. The Plan is contingent upon the approval of the Fund’s shareholders. Under the terms of the Plan, if approved by the shareholders, the Fund will be reorganized into a corresponding newly created series of Investment Managers Trust II, a Delaware statutory trust.
Report of Independent Registered Public Accounting Firm
To the Board of Trustees of Equinox Funds Trust
and the Shareholders of Equinox IPM Systematic Macro Fund
Opinion on the Financial Statements
We have audited the accompanying consolidated statement of assets and liabilities, including the consolidated portfolio of investments, of Equinox IPM Systematic Macro Fund (the Fund) as of June 30, 2019, the related consolidated statements of operations for the year then ended, the statements of changes in net assets for each of the two years in the period then ended, including the related notes, and the consolidated financial highlights for each of the three years in the period then ended and for the period from July 6, 2015 (commencement of operations) through June 30, 2016 (collectively, the financial statements). In our opinion, the financial statements present fairly, in all material respects, the financial position of the Fund as of June 30, 2019, the results of its operations for the year then ended, the changes in its net assets for each of the two years in the period then ended, and the financial highlights for each of the three years in the period then ended and for the period from July 6, 2015 (commencement of operations) through June 30, 2016, in conformity with accounting principles generally accepted in the United States of America.
Basis for Opinion
These financial statements are the responsibility of the Fund’s management. Our responsibility is to express an opinion on the Fund’s financial statements based on our audits. We are a public accounting firm registered with the Public Company Accounting Oversight Board (United States) (PCAOB) and are required to be independent with respect to the Fund in accordance with U.S. federal securities laws and the applicable rules and regulations of the Securities and Exchange Commission and the PCAOB.
We conducted our audits in accordance with the standards of the PCAOB. Those standards require that we plan and perform the audit to obtain reasonable assurance about whether the financial statements are free of material misstatement, whether due to error or fraud. The Fund is not required to have, nor were we engaged to perform, an audit of its internal control over financial reporting. As part of our audits, we are required to obtain an understanding of internal control over financial reporting but not for the purpose of expressing an opinion on the effectiveness of the Fund’s internal control over financial reporting. Accordingly, we express no such opinion.
Our audits included performing procedures to assess the risks of material misstatement of the financial statements, whether due to error or fraud, and performing procedures that respond to those risks. Such procedures included examining, on a test basis, evidence regarding the amounts and disclosures in the financial statements. Our audits also included evaluating the accounting principles used and significant estimates made by management, as well as evaluating the overall presentation of the financial statements. Our procedures included confirmation of investments owned as of June 30, 2019, by correspondence with the custodians and brokers. We believe that our audits provide a reasonable basis for our opinion.
/s/ RSM US LLP
We have served as the auditor of one or more Equinox advised funds since 2010.
Denver, Colorado
August 29, 2019
Equinox IPM Systematic Macro Fund
EXPENSE EXAMPLES
June 30, 2019 (Unaudited)
As a shareholder of the Fund, you incur ongoing costs, including management fees and other Fund expenses. This example is intended to help you understand your ongoing costs (in dollars) of investing in the Fund and to compare these costs with the ongoing costs of investing in other mutual funds.
The example is based on an investment of $1,000 invested at the beginning of the period and held for the entire six month period from January 1, 2019 through June 30, 2019.
Actual Expenses
The “Actual” expenses line in the table below provides information about actual account values and actual expenses. You may use the information below, together with the amount you invested, to estimate the expenses that you paid over the period. Simply divide your account value by $1,000 (for example, an $8,600 account value divided by $1,000 = 8.6), then multiply the result by the number in the table under the heading entitled “Expenses Paid During Period” to estimate the expenses you paid on your account during this period.
Hypothetical Example for Comparison Purposes
The “Hypothetical” expenses line in the table below provides information about hypothetical account values and hypothetical expenses based on the Fund’s actual expense ratio and an assumed rate of return of 5% per year before expenses, which is not the Fund’s actual return. The hypothetical account values and expenses may not be used to estimate the actual ending account balances or expenses you paid for the period. You may use this information to compare this 5% hypothetical example with the 5% hypothetical examples that appear in the shareholder reports of other funds.
Please note that the expenses shown in the table are meant to highlight your ongoing costs only and do not reflect any transactional costs, such as sales charges (loads), or redemption fees. Therefore, the table is useful in comparing ongoing costs only, and will not help you determine the relative total costs of owning different funds. In addition, if these transactional costs were included, your costs would have been higher.
| | | Fund’s | | | Beginning | | | Ending | | | Expenses | | | Ending | | | Expenses | |
| | | Annualized | | | Account | | | Account | | | Paid | | | Account | | | Paid | |
| Equinox IPM Systematic | | Expense | | | Value | | | Value | | | During | | | Value | | | During | |
| Macro Fund | | Ratio | | | 1-1-19 | | | 6-30-19 | | | Period* | | | 6-30-19 | | | Period* | |
| Class I | | | 1.89 | % | | $ | 1,000.00 | | | $ | 989.00 | | | $ | 9.32 | | | $ | 1,015.42 | | | $ | 9.44 | |
| * | Expenses are equal to the average account value over the period, multiplied by the Fund’s annualized expense ratio, multiplied by the number of days in the period (181) divided by the number of days in the fiscal year (365). |
Equinox Campbell StrategyFund
SUPPLEMENTAL INFORMATION
June 30, 2019 (Unaudited)
The following tables present certain information regarding the Board of Trustees and officers of the Trust. Each person listed under “Interested Trustee” below is an “interested person” of the Trust, the Adviser, or Distributor, within the meaning of the 1940 Act. Each person who is not an “interested person” of the Trust, the Adviser or the Distributor within the meaning of the 1940 Act is referred to as an “Independent Trustee” and is listed under such heading below. Unless otherwise noted, the address of each Trustee and Officer is 17605 Wright Street, Suite 2, Omaha, NE 68130. The Statement of Additional Information includes additional information about the Fund’s directors and officers and is available without charge, upon request by calling 1-888-643-3431.
Independent Trustees
Name and Year of
Birth | Position(s)
Held/Term
of Office* | Principal Occupation
During the Last Five Years | Number of
Portfolios in Fund
Complex**
Overseen by
Trustee | Other Directorships*** held by
Trustee During Last Five Years |
David P. Demuth
9/1945 | Trustee Since December 2010 | Consultant, CFO Consulting Partners, LLC (since May 2004). | 5 | Executive Committee Member of The Frontier Fund (commodity pool) (from March 2007 to March 2017). |
Kevin R. Green
7/1954 | Trustee Since December 2010 | Chief Executive Officer of TripleTree Holdings, LLC an Investment Bank, Advisory and Principal Investing business (since 1997). | 5 | Director of BlueCross BlueShield of Minnesota (healthcare services). |
Jay Moorin
7/1951 | Trustee Since December 2010 | Managing Partner, ProQuest Management, LLC (since 1998). | 5 | Director, Eagle Pharmaceuticals Inc. (from March 2007 to June 2016); Director, Pegasi Energy Resource Corp. (from January 2014 to June 2015); Director, Aires Pharmaceuticals (from November 2006 to February 2014); Director, Arno Therapeutics (from January 2016 to December 2017); Director, Corino Therapeutics (since November 2016); Director, Mevion Medical Systems (from January 2012 to June 2018). |
Equinox Campbell StrategyFund
SUPPLEMENTAL INFORMATION
June 30, 2019 (Unaudited)
Interested Trustee
Name and Year of
Birth | Position(s)
Held/Term
of Office* | Principal Occupation
During the Past Five Years | Number of
Portfolios in Fund
Complex**
Overseen by
Trustee | Other Directorships*** held by
Trustee During the Last Five
Years |
Robert J. Enck
9/1962 | Chairman, Trustee, President and Principal Executive Officer Since December 2010 | President and Chief Executive Officer, Equinox Institutional Asset Management, LP (since 2015); President and Chief Executive Officer, Equinox Fund Management, LLC (since 2007). | 5 | Executive Committee Member of The Frontier Fund (commodity pool) (from March 2007 to March 2017). |
Equinox Campbell StrategyFund
SUPPLEMENTAL INFORMATION
June 30, 2019 (Unaudited)
Executive Officers
Name and Year of
Birth | Position(s)
Held/Term
of Office* | Principal Occupation
During the Past Five Years | Number of
Portfolios in Fund
Complex**
Overseen by
Trustee | Other Directorships*** held by
Trustee During the Past Five
Years |
Laura Latella
4/1958 | Treasurer, Chief Financial Officer and Secretary Since November 2018 | Chief Financial Officer (“CFO”, since November 2017) and Chief Administrative Officer (May 2016 – October 2017), Equinox Institutional Asset Management, LP; Consultant, Equinox Institutional Asset Management, LP (January 2016 – April 2016); Treasurer, CFO, Principal, 6800 Capital, LLC (May 1994 – January 2016). | N/A | N/A |
Javier Jimenez
5/1977 | Assistant Treasurer Since November 2017 | Assistant Vice President (since 2013) and Compliance Officer (2010 to 2013) of U.S. Bancorp Fund Services, LLC. | N/A | N/A |
Douglas Tyre
7/1980 | Chief Compliance Officer and Anti-Money Laundering Officer Since October 13, 2017 | Assistant Compliance Director of Cipperman Compliance Services LLC (2014 – present); Client Services & Operations Specialist – Senior Associate of Echo Point Investment Management LLC (2010 – 2014). | N/A | N/A |
| * | Each Trustee and Officer shall serve until death, resignation or removal. |
| ** | The term “Fund Complex” refers to the Equinox Funds Trust. |
| *** | Directorships are held in a company with a class of securities registered pursuant to section 12 of the Securities Exchange Act or subject to the requirements of section 15(d) of the Securities Exchange Act or a company registered as an investment company under the 1940 Act. |
PRIVACY NOTICE
Rev. August 2011
| FACTS | WHAT DOES EQUINOX FUNDS TRUST DO WITH YOUR PERSONAL INFORMATION? |
| | |
| Why? | Financial companies choose how they share your personal information. Federal law gives consumers the right to limit some but not all sharing. Federal law also requires us to tell you how we collect, share, and protect your personal information. Please read this notice carefully to understand what we do. |
| | |
| What? | The types of personal information we collect and share depend on the product or service you have with us. This information can include: |
| | ■ Social Security number ■ Assets ■ Retirement Assets ■ Transaction History ■ Checking Account Information | ■ Purchase History ■ Account Balances ■ Account Transactions ■ Wire Transfer Instructions |
| | |
| | When you areno longer our customer, we continue to share your information as described in this notice. |
| | |
| How? | All financial companies need to share customers’ personal information to run their everyday business. In the section below, we list the reasons financial companies can share their customers’ personal information; the reasons Equinox Funds Trust chooses to share; and whether you can limit this sharing. |
| Reasons we can share your personal information | Does Equinox
Funds Trust
share? | Can you limit this sharing? |
For our everyday business purposes – such as to process your transactions, maintain your account(s), respond to court orders and legal investigations, or report to credit bureaus | Yes | No |
For our marketing purposes – to offer our products and services to you | No | We don’t share |
| For joint marketing with other financial companies | No | We don’t share |
For our affiliates’ everyday business purposes – information about your transactions and experiences | No | We don’t share |
For our affiliates’ everyday business purposes – information about your creditworthiness | No | We don’t share |
| For nonaffiliates to market to you | No | We don’t share |
| Questions? | Call 1-888-643-3431 |
Rev. August 2011
| Who we are |
| Who is providing this notice? | Equinox Funds Trust |
| What we do |
| How does Equinox Funds Trust protect my personal information? | To protect your personal information from unauthorized access and use, we use security measures that comply with federal law. These measures include computer safeguards and secured files and buildings. Our service providers are held accountable for adhering to strict policies and procedures to prevent any misuse of your nonpublic personal information. |
| How does Equinox Funds Trust collect my personal information? | We collect your personal information, for example, when you ■ Open an account ■ Provide account information ■ Give us your contact information ■ Make deposits or withdrawals from your account ■ Make a wire transfer ■ Tell us where to send the money ■ Tells us who receives the money ■ Show your government-issued ID ■ Show your driver’s license We also collect your personal information from other companies. |
| Why can’t I limit all sharing? | Federal law gives you the right to limit only ■ Sharing for affiliates’ everyday business purposes – information about your creditworthiness ■ Affiliates from using your information to market to you ■ Sharing for nonaffiliates to market to you State laws and individual companies may give you additional rights to limit sharing. |
| Definitions |
| Affiliates | Companies related by common ownership or control. They can be financial and nonfinancial companies. ■ Equinox Funds Trust does not share with our affiliates. |
| Nonaffiliates | Companies not related by common ownership or control. They can be financial and nonfinancial companies ■ Equinox Funds Trust does not share with nonaffiliates so they can market to you. |
| Joint marketing | A formal agreement between nonaffiliated financial companies that together market financial products or services to you. ■ Equinox Funds Trust does not jointly market. |
PROXY VOTING POLICY
Information regarding how the Fund voted proxies relating to portfolio securities for the most recent period ended June 30 as well as a description of the policies and procedures that the Fund uses to determine how to vote proxies is available without charge, upon request, by calling 1-888-643-3431 or by referring to the Securities and Exchange Commission’s (“SEC”) website at http://www.sec.gov.
PORTFOLIO HOLDINGS
The Fund files its complete schedule of portfolio holdings with the SEC for the first and third quarters of each fiscal year on Form N-PORT (beginning with filings after March 31, 2019). Form N-Q or Part F of Form N-PORT is available on the SEC’s website at http://www.sec.gov and may be reviewed and copied at the SEC’s Public Reference Room in Washington, DC (1-800-SEC-0330). The information on Form N-Q or Part F of Form N-Port is available without charge, upon request, by calling 1-888-643-3431.
| INVESTMENT ADVISER |
| Equinox Institutional Asset Management, LP |
| 47 Hulfish Street, Suite 510 |
| Princeton, NJ 08542 |
| |
| ADMINISTRATOR |
| U.S. Bank Global Fund Services, LLC |
| 777 E. Wisconsin Ave |
| Milwaukee, WI 53202 |
Item 2. Code of Ethics.
| (a) | As of the end of the period covered by this report, the registrant has adopted a code of ethics that applies to the registrant's Principal executive officer, Principal financial officer, Principal accounting officer or controller, or persons performing similar functions, regardless of whether these individuals are employed by the registrant or a third party. |
| (b) | For purposes of this item, “code of ethics” means written standards that are reasonably designed to deter wrongdoing and to promote: |
| (1) | Honest and ethical conduct, including the ethical handling of actual or apparent conflicts of interest between personal and professional relationships; |
| (2) | Full, fair, accurate, timely, and understandable disclosure in reports and documents that a registrant files with, or submits to, the Commission and in other public communications made by the registrant; |
| (3) | Compliance with applicable governmental laws, rules, and regulations; |
| (4) | The prompt internal reporting of violations of the code to an appropriate person or persons identified in the code; and |
| (5) | Accountability for adherence to the code. |
| (c) | Amendments: During the period covered by the report, there have not been any substantive amendments to the provisions of the code of ethics. |
| (d) | Waivers: During the period covered by the report, the registrant has not granted any express or implicit waivers from the provisions of the code of ethics. |
| (e) | The Code of Ethics is not posted on Registrant’ website. |
| (f) | A copy of the registrant’s Code of Ethics is incorporated by reference. See item 13(a)1. |
Item 3. Audit Committee Financial Expert.
| (a)(1)i The Registrant’s board of trustees has determined that David DeMuth is an audit committee financial expert, as defined in Item 3 of Form N-CSR. Mr. DeMuth is independent for purposes of this Item 3. |
(a)(2) Not applicable.
(a)(3) Not applicable.
Item 4. Principal Accountant Fees and Services.
(a) Audit Fees
2019 - $ 47,000
2018 - $ 47,000
(b) Audit-Related Fees
2019 - None
2018 - None
(c) Tax Fees
2019 - $ 7,500
2018 - $ 8,250
Preparation of Federal & State income tax returns, assistance with calculation of required income, capital gain and excise distributions and preparation of Federal excise tax returns.
(d) All Other Fees
2019 - None
2018 - None
(e) (1) Audit Committee’s Pre-Approval Policies
The registrant’s Audit Committee is required to pre-approve all audit services and, when appropriate, any non-audit services (including audit-related, tax and all other services) to the registrant. The registrant’s Audit Committee also is required to pre-approve, when appropriate, any non-audit services (including audit-related, tax and all other services) to its adviser, or any entity controlling, controlled by or under common control with the adviser that provides ongoing services to the registrant, to the extent that the services may be determined to have an impact on the operations or financial reporting of the registrant. Services are reviewed on an engagement by engagement basis by the Audit Committee.
(2) There were no services described in each of paragraphs (b) through (d) of this Item that were approved by the audit committee pursuant to paragraph (c)(7)(i)(C) of Rule 2-01 of Regulation S-X.
(f) All of the hours spent on auditing the registrant’s financial statements were attributed to work performed by full-time permanent employees of the principal accountant.
(g) The aggregate non-audit fees billed by the registrant's accountant for services rendered to the registrant, and rendered to the registrant's investment adviser (not including any sub-adviser whose role is primarily portfolio management and is subcontracted with or overseen by another investment adviser), and any entity controlling, controlled by, or under common control with the adviser that provides ongoing services to the registrant for each of the last two fiscal years of the registrant:
2019 - None
2018 - None
(h) The registrant’s audit committee of the board of trustees has considered whether the provision of non-audit services that were rendered to the registrant’s investment adviser, and any entity controlling, controlled by, or under common control with the investment adviser that provides ongoing services to the registrant that were not pre-approved pursuant to paragraph (c)(7)(ii) of Rule 2-01 of Regulation S-X is compatible with maintaining the Principal accountant’s independence. No such services were rendered.
Item 5. Audit Committee of Listed Registrants.
Not applicable to registrants who are not listed issuers (as defined in Rule 10A-3 under the Securities Exchange Act of 1934).
Item 6. Investments.
| (a) | Schedule of Investments is included as part of the report to shareholders filed under Item 1 of this Form. |
Item 7. Disclosure of Proxy Voting Policies and Procedures for Closed-End Management Investment Companies.
Not applicable to open-end investment companies.
Item 8. Portfolio Managers of Closed-End Management Investment Companies.
Not applicable to open-end investment companies.
Item 9. Purchases of Equity Securities by Closed-End Management Investment Company and Affiliated Purchasers.
Not applicable to open-end investment companies.
Item 10. Submission of Matters to a Vote of Security Holders.
Not Applicable.
Item 11. Controls and Procedures.
| (a) | Based on an evaluation of the Registrant’s disclosure controls and procedures as of a date within 90 days of filing date of this Form N-CSR, the Principal Executive Officer and Principal Financial Officer of the Registrant have concluded that the disclosure controls and procedures of the Registrant are reasonably designed to ensure that the information required in filings on Form N-CSR is recorded, processed, summarized, and reported by the filing date, including that information required to be disclosed is accumulated and communicated to the Registrant’s management, including the Registrant’s Principal Executive Officer and Principal Financial Officer, as appropriate to allow timely decisions regarding required disclosure. |
| (b) | There were no significant changes in the Registrant’s internal control over financial reporting that occurred during the Registrant’s last fiscal half-year that have materially affected, or are reasonably likely to materially affect, the Registrant’s internal control over financial reporting. |
Item 12. Disclosure of Securities Lending Activities for Closed-End Management Investment Companies.
Not applicable to open-end investment companies.
Item 13. Exhibits.
| (a) | (1)Any code of ethics or amendment thereto, that is the subject of the disclosure required by Item 2, to the extent that the registrant intends to satisfy Item 2 requirements through filing an exhibit.Incorporated by reference to the Registrant’s Form N-CSR filed September 8, 2017. |
(2)A separate certification for each principal executive officer and principal financial officer pursuant to Section 302 of the Sarbanes-Oxley Act of 2002.Filed herewith.
(3)Any written solicitation to purchase securities under Rule 23c-1 under the Act sent or given during the period covered by the report by or on behalf of the registrant to 10 or more persons.Not applicable to open-end investment companies.
SIGNATURES
Pursuant to the requirements of the Securities Exchange Act of 1934 and the Investment Company Act of 1940, the registrant has duly caused this report to be signed on its behalf by the undersigned, thereunto duly authorized.
Equinox Funds Trust
By:/s/ Robert J. Enck
Robert J. Enck, Principal Executive Officer
Date:8/29/2019
Pursuant to the requirements of the Securities Exchange Act of 1934 and the Investment Company Act of 1940, this report has been signed below by the following persons on behalf of the registrant and in the capacities and on the dates indicated.
By:/s/ Robert J. Enck
Robert J. Enck, Principal Executive Officer
Date:8/29/2019
By:/s/ Laura Latella
Laura Latella, Principal Financial Officer
Date:8/29/2019