UNITED STATES
SECURITIES AND EXCHANGE COMMISSION
Washington, D.C. 20549
FORM N-CSR
CERTIFIED SHAREHOLDER REPORT OF REGISTERED
MANAGEMENT INVESTMENT COMPANIES
Investment Company Act file number: 811-23112
JANUS DETROIT STREET TRUST
(Exact name of registrant as specified in charter)
151 Detroit Street, Denver, Colorado 80206-4805
(Address of principal executive offices)(Zip code)
| | |
(Name and Address of Agent for Service) | | Copy to: |
Kathyrn L. Santoro 151 Detroit Street Denver, Colorado 80206-4805 | | Eric S. Purple Stradley Ronon Stevens & Young, LLP 1250 Connecticut Avenue, N.W., Suite 500 Washington, District of Columbia 20036 |
Registrant’s telephone number, including area code: 303-333-3863
Date of fiscal year end: October 31
Date of reporting period: October 31, 2017
Item 1. Report to Shareholders.
ANNUAL REPORT
October 31, 2017
Janus Henderson Small Cap Growth Alpha ETF (formerly named Janus Small Cap Growth Alpha ETF)
Janus Detroit Street Trust

Table of Contents
Janus Henderson Small Cap Growth Alpha ETF (unaudited)
INVESTMENT OBJECTIVE
Janus Henderson Small Cap Growth Alpha ETF seeks investment results that correspond generally, before fees and expenses, to the performance of its underlying index, the Janus Small Cap Growth Alpha Index. It pursues its investment objective by using a passive index-based approach, normally investing at least 80% of its net assets in the securities that comprise its underlying index.
PERFORMANCE OVERVIEW
| • | | U.S. small-cap equities enjoyed strong returns during the period. Stocks rallied after the November U.S. presidential election as investors considered the potential impact of deregulation, increased fiscal spending, corporate tax cuts and other pro-growth policies under a Trump administration. Small-cap stocks enjoyed particularly large gains as investors sought exposure to areas of the market perceived to benefit most from Trump’s policies. Economic data suggested global economic growth was returning and also played a role in helping boost equities. Euphoria around small-cap stocks returned in the fall, as Republicans’ proposed tax overhaul again boosted small caps. |
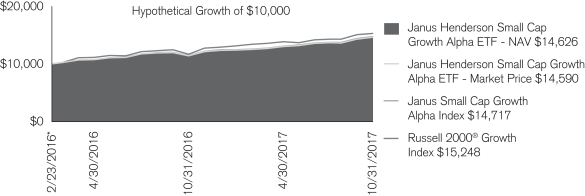
| • | | During the period, the Janus Henderson Small Cap Growth Alpha ETF (JSML) returned 28.82% (based on NAV); its primary benchmark, the Janus Small Cap Growth Alpha Index, returned 29.13%, and its secondary benchmark, the Russell 2000 Growth Index, returned 31.00%. |
| • | | JSML seeks investment results that correspond generally, before fees and expenses, to the performance of its primary benchmark. The strategy seeks to provide risk-adjusted outperformance by identifying top-tier small-cap companies with some of the strongest fundamentals that the adviser believes can deliver sustainable growth in a variety of market environments. |
| | |
| | Janus Detroit Street Trust ½ 1 |
Janus Henderson Small Cap Growth Alpha ETF (unaudited)
Fund At A Glance
October 31, 2017
| | | | |
| 5 Largest Equity Holdings – (% of Net Assets) | |
Paycom Software, Inc. | | | | |
Software | | | 3.1% | |
Ubiquiti Networks, Inc. | | | | |
Communications Equipment | | | 2.9% | |
Pegasystems, Inc. | | | | |
Software | | | 2.9% | |
INC Research Holdings, Inc. | | | | |
Life Sciences Tools & Services | | | 2.7% | |
Stamps.com, Inc. | | | | |
Internet Software & Services | | | 2.6% | |
| | | | |
| | | 14.2% | |
| | | | |
| Sector Allocation – (% of Net Assets) | |
Consumer, Non-cyclical | | | 27.5% | |
Technology | | | 16.1% | |
Communications | | | 15.4% | |
Industrial | | | 15.0% | |
Consumer, Cyclical | | | 11.9% | |
Financial | | | 9.9% | |
Investment Companies | | | 4.3% | |
Basic Materials | | | 3.1% | |
Energy | | | 1.1% | |
| | | | |
| | | 104.3% | |
Holdings are subject to change without notice.
Janus Henderson Small Cap Growth Alpha ETF (unaudited)
Performance
| | | | |
| Average Annual Total Return for the periods ended October 31, 2017 |
| | | One Year | | Since
Inception* |
Janus Henderson Small Cap Growth Alpha ETF – NAV | | 28.82% | | 25.27% |
Janus Henderson Small Cap Growth Alpha ETF – Market Price | | 28.45% | | 25.08% |
Janus Small Cap Growth Alpha Index | | 29.13% | | 25.73% |
Russell 2000® Growth Index | | 31.00% | | 28.40% |
Total annual expense ratio as stated in the February 28, 2017 prospectus: 0.50%.
Returns quoted are past performance and do not guarantee future results; current performance may be lower or higher. Investment returns and principal value will vary; there may be a gain or loss when shares are sold. For the most recent month-end performance call 800.668.0434 or visit janushenderson.com/performance.
Shares of ETFs are bought and sold at market price (not NAV) and are not individually redeemed from the Fund. Market returns are based upon the midpoint of the bid/ask spread at 4:00 p.m. Eastern time (when NAV is normally determined for most ETFs), and do not represent the returns you would receive if you traded shares at other times. Ordinary brokerage commissions apply and will reduce returns.
ETF shares are not individually redeemable and owners of the shares may acquire those shares from the Fund and tender those shares for redemption to the Fund in Creation Units only.
Investing involves risk, including the possible loss of principal and fluctuation of value.
Performance depends on that of the underlying index.
High absolute short-term performance is not typical and may not be achieved in the future. Such results should not be the sole basis for evaluating material facts in making an investment decision.
See the prospectus for a more complete discussion of objectives, risks and expenses.
Returns include reinvestment of dividends and capital gains. Returns greater than one year are annualized. Returns do not reflect the deduction of taxes that a shareholder would pay on Fund distributions or redemptions of Fund shares.
See Financial Highlights for actual expense ratios during the reporting period.
There is no assurance the stated objective(s) will be met.
See Notes to Schedule of Investments and Other Information for index definitions.
Index performance does not reflect the expenses of managing a portfolio as an index is unmanaged and not available for direct investment.
The index provider is Janus Index and Calculation Services LLC (“Janus Index”). Janus Index maintains the indices and calculates the index levels and performance shown or discussed, but does not manage actual assets. Janus index receives compensation in connection with licensing its indices to third parties including the provision of any related data.
Effective February 28, 2017 Edward Tom, Benjamin Wang and Scott Weiner are Co-Portfolio Managers of the Fund.
| * | The Fund commenced operations on February 23, 2016. |
| | |
| | Janus Detroit Street Trust ½ 3 |
Janus Henderson Small Cap Growth Alpha ETF (unaudited)
Disclosure of Fund Expenses
As a shareholder of the Fund, you incur two types of costs: (1) transaction costs, which may include creation and redemption fees or brokerage charges and (2) ongoing costs, including management fees and other Fund expenses. This example is intended to help you understand your ongoing costs (in dollars) of investing in the Fund and to compare these costs with the ongoing costs of investing in other ETFs. To do so, compare this 5% hypothetical example with the 5% hypothetical examples that appear in the shareholder reports of the other funds. The example is based upon an investment of $1,000 invested at the beginning of the period and held for the six-months indicated, unless noted otherwise in the table and footnotes below.
Actual Expenses
The information in the table under the heading “Actual” provides information about actual account values and actual expenses. You may use the information in these columns, together with the amount you invested, to estimate the expenses that you paid over the period. Simply divide your account value by $1,000 (for example, an $8,600 account value divided by $1,000 = 8.6), then multiply the result by the number under the heading entitled “Expenses Paid During Period” to estimate the expenses you paid on your account during the period.
Hypothetical Example for Comparison Purposes
The information in the table under the heading “Hypothetical (5% return before expenses)” provides information about hypothetical account values and hypothetical expenses based upon the Fund’s actual expense ratio and an assumed rate of return of 5% per year before expenses, which is not the Fund’s actual return. The hypothetical account values and expenses may not be used to determine the actual ending account balance or expenses you paid for the period. You may use this information to compare the ongoing costs of investing in the Fund and other funds. To do so, compare this 5% hypothetical example with the 5% hypothetical examples that appear in the shareholder reports of the other funds. Additionally, for an analysis of the fees associated with an investment or other similar funds, please visit www.finra.org/fundanalyzer.
Please note that the expenses shown in the table are meant to highlight your ongoing costs only and do not reflect any transaction costs, such as creation and redemption fees, or brokerage charges. These fees are fully described in the Fund’s prospectus. Therefore, the hypothetical examples are useful in comparing ongoing costs only, and will not help you determine the relative total costs of owning different funds. In addition, if these transaction costs were included, your costs would have been higher.
| | | | | | | | | | | | | | | | | | | | | | | | |
Actual | | | Hypothetical
(5% return before expenses) | | | | |
Beginning
Account
Value
(5/1/17) | | Ending
Account
Value
(10/31/2017) | | | Expenses
Paid During
Period
(5/1/17 - 10/31/2017)† | | | Beginning
Account
Value
(5/1/17) | | | Ending
Account
Value
(10/31/2017) | | | Expenses
Paid During
Period
(5/1/17 - 10/31/2017)† | | | Net Annualized
Expense Ratio
(5/1/17 - 10/31/2017) | |
| $1,000.00 | | $ | 1,130.80 | | | $ | 2.69 | | | $ | 1,000.00 | | | $ | 1,022.68 | | | $ | 2.55 | | | | 0.50% | |
| † | Expenses Paid During Period is equal to the Net Annualized Expense Ratio multiplied by the average account value over the period, multiplied by 184/365 (to reflect the one-half year period). |
Janus Henderson Small Cap Growth Alpha ETF
Report of Independent Registered Public Accounting Firm
To the Board of Trustees of Janus Detroit Street Trust and Shareholders of
Janus Henderson Small Cap Growth Alpha ETF:
In our opinion, the accompanying statement of assets and liabilities, including the schedule of investments, and the related statements of operations and of changes in net assets and the financial highlights present fairly, in all material respects, the financial position of the Janus Henderson Small Cap Growth Alpha ETF Fund (one of the funds constituting Janus Detroit Street Trust, hereafter referred to as the “Fund”) as of October 31, 2017, the results of its operations for the year then ended, and the changes in its net assets and financial highlights for the year then ended and for the period from February 23, 2016 (commencement of operations) through October 31, 2016, in conformity with accounting principles generally accepted in the United States of America. These financial statements and financial highlights (hereafter referred to as “financial statements”) are the responsibility of the Fund’s management. Our responsibility is to express an opinion on these financial statements based on our audits. We conducted our audits of these financial statements in accordance with the standards of the Public Company Accounting Oversight Board (United States). Those standards require that we plan and perform the audit to obtain reasonable assurance about whether the financial statements are free of material misstatement. An audit includes examining, on a test basis, evidence supporting the amounts and disclosures in the financial statements, assessing the accounting principles used and significant estimates made by management, and evaluating the overall financial statement presentation. We believe that our audits, which included confirmation of securities as of October 31, 2017 by correspondence with the custodian, brokers and transfer agent, provide a reasonable basis for our opinion.

Denver, Colorado
December 20, 2017
| | |
| | Janus Detroit Street Trust ½ 5 |
Janus Henderson Small Cap Growth Alpha ETF
Schedule of Investments
October 31, 2017
| | | | | | | | |
| | | Shares | | | Value | |
| Common Stocks – 100.0% | | | | | | |
| Aerospace & Defense – 2.6% | | | | | | |
Axon Enterprise, Inc.* | | | 1,523 | | | | $34,983 | |
HEICO Corp. | | | 2,213 | | | | 200,675 | |
| | | | | | | | |
| | | | | | | 235,658 | |
| Airlines – 0.7% | | | | | | |
Allegiant Travel Co. | | | 462 | | | | 63,017 | |
| Auto Components – 1.5% | | | | | | |
Dorman Products, Inc.* | | | 559 | | | | 38,632 | |
Fox Factory Holding Corp.* | | | 614 | | | | 26,126 | |
Gentherm, Inc.* | | | 606 | | | | 20,301 | |
LCI Industries | | | 410 | | | | 50,758 | |
| | | | | | | | |
| | | | | | | 135,817 | |
| Beverages – 0.7% | | | | | | |
National Beverage Corp. | | | 688 | | | | 67,355 | |
| Biotechnology – 1.5% | | | | | | |
AMAG Pharmaceuticals, Inc.* | | | 1,622 | | | | 25,465 | |
MiMedx Group, Inc.*,# | | | 5,176 | | | | 65,632 | |
Xencor, Inc.* | | | 2,161 | | | | 42,745 | |
| | | | | | | | |
| | | | | | | 133,842 | |
| Building Products – 4.0% | | | | | | |
AAON, Inc. | | | 1,515 | | | | 53,025 | |
American Woodmark Corp.* | | | 467 | | | | 45,112 | |
Apogee Enterprises, Inc. | | | 831 | | | | 39,664 | |
Patrick Industries, Inc.* | | | 484 | | | | 45,012 | |
PGT Innovations, Inc.* | | | 1,430 | | | | 20,163 | |
Trex Co., Inc.* | | | 848 | | | | 92,813 | |
Universal Forest Products, Inc. | | | 589 | | | | 66,498 | |
| | | | | | | | |
| | | | | | | 362,287 | |
| Capital Markets – 0.9% | | | | | | |
Diamond Hill Investment Group, Inc. | | | 38 | | | | 8,053 | |
Evercore, Inc. - Class A | | | 426 | | | | 34,123 | |
Houlihan Lokey, Inc. | | | 269 | | | | 11,198 | |
Moelis & Co. - Class A | | | 300 | | | | 12,825 | |
WisdomTree Investments, Inc.# | | | 1,485 | | | | 16,469 | |
| | | | | | | | |
| | | | | | | 82,668 | |
| Chemicals – 2.9% | | | | | | |
Balchem Corp. | | | 1,425 | | | | 120,113 | |
Chase Corp. | | | 418 | | | | 49,637 | |
GCP Applied Technologies, Inc.* | | | 3,187 | | | | 93,220 | |
| | | | | | | | |
| | | | | | | 262,970 | |
| Commercial Banks – 3.9% | | | | | | |
Ameris Bancorp | | | 404 | | | | 19,352 | |
Banc of California, Inc. | | | 543 | | | | 11,430 | |
Bankwell Financial Group, Inc. | | | 83 | | | | 3,038 | |
Banner Corp. | | | 360 | | | | 20,635 | |
Byline Bancorp, Inc.* | | | 319 | | | | 6,396 | |
CB Financial Services, Inc. | | | 45 | | | | 1,310 | |
CenterState Bank Corp. | | | 652 | | | | 17,369 | |
Customers Bancorp, Inc.* | | | 332 | | | | 9,077 | |
Eagle Bancorp, Inc.* | | | 371 | | | | 24,727 | |
FB Financial Corp.* | | | 330 | | | | 13,487 | |
Fidelity Southern Corp. | | | 289 | | | | 6,338 | |
Franklin Financial Network, Inc.* | | | 143 | | | | 4,905 | |
Guaranty Bancshares, Inc. | | | 121 | | | | 3,470 | |
Hilltop Holdings, Inc. | | | 1,045 | | | | 24,620 | |
LegacyTexas Financial Group, Inc. | | | 521 | | | | 20,783 | |
National Commerce Corp.* | | | 151 | | | | 6,153 | |
Nicolet Bankshares, Inc.* | | | 107 | | | | 6,093 | |
See Notes to Schedule of Investments and Other Information and Notes to Financial Statements.
Janus Henderson Small Cap Growth Alpha ETF
Schedule of Investments
October 31, 2017
| | | | | | | | |
| | | Shares | | | Value | |
| Common Stocks – (continued) | | | | | | |
| Commercial Banks – (continued) | | | | | | |
Opus Bank* | | | 371 | | | | $ 9,609 | |
PacWest Bancorp | | | 1 | | | | 44 | |
Paragon Commercial Corp.* | | | 61 | | | | 3,512 | |
Park Sterling Corp. | | | 578 | | | | 7,265 | |
People’s Utah Bancorp | | | 195 | | | | 6,064 | |
Pinnacle Financial Partners, Inc. | | | 842 | | | | 55,740 | |
ServisFirst Bancshares, Inc. | | | 575 | | | | 23,581 | |
South State Corp. | | | 316 | | | | 28,456 | |
Triumph Bancorp, Inc.* | | | 226 | | | | 7,006 | |
Veritex Holdings, Inc.* | | | 242 | | | | 6,379 | |
WashingtonFirst Bankshares, Inc. | | | 135 | | | | 4,717 | |
| | | | | | | | |
| | | | | | | 351,556 | |
| Commercial Services & Supplies – 1.3% | | | | | | |
Hudson Technologies, Inc.* | | | 1,199 | | | | 7,098 | |
Multi-Color Corp. | | | 493 | | | | 40,771 | |
UniFirst Corp. | | | 445 | | | | 70,088 | |
| | | | | | | | |
| | | | | | | 117,957 | |
| Communications Equipment – 6.6% | | | | | | |
Acacia Communications, Inc.*,# | | | 2,455 | | | | 103,871 | |
Applied Optoelectronics, Inc.*,# | | | 1,207 | | | | 49,173 | |
Clearfield, Inc.* | | | 872 | | | | 11,947 | |
Finisar Corp.* | | | 7,121 | | | | 167,628 | |
Ubiquiti Networks, Inc.*,# | | | 4,293 | | | | 266,939 | |
| | | | | | | | |
| | | | | | | 599,558 | |
| Computers & Peripherals – 0.2% | | | | | | |
USA Technologies, Inc.* | | | 3,130 | | | | 19,875 | |
| Construction & Engineering – 1.1% | | | | | | |
Argan, Inc. | | | 448 | | | | 30,800 | |
Comfort Systems USA, Inc. | | | 1,075 | | | | 47,623 | |
Goldfield Corp.* | | | 735 | | | | 4,226 | |
NV5 Global, Inc.* | | | 310 | | | | 18,011 | |
| | | | | | | | |
| | | | | | | 100,660 | |
| Construction Materials – 1.7% | | | | | | |
Summit Materials, Inc. - Class A* | | | 4,794 | | | | 150,532 | |
| Consumer Finance – 0.7% | | | | | | |
Credit Acceptance Corp.* | | | 208 | | | | 59,640 | |
| Diversified Consumer Services – 0.1% | | | | | | |
Collectors Universe, Inc. | | | 146 | | | | 3,615 | |
Laureate Education, Inc. - Class A* | | | 581 | | | | 7,768 | |
| | | | | | | | |
| | | | | | | 11,383 | |
| Electrical Equipment – 0.3% | | | | | | |
TPI Composites, Inc.* | | | 977 | | | | 24,474 | |
| Electronic Equipment & Instruments – 3.1% | | | | | | |
Airgain, Inc.* | | | 597 | | | | 5,206 | |
Control4 Corp.* | | | 1,554 | | | | 45,765 | |
ePlus, Inc.* | | | 886 | | | | 84,702 | |
Kimball Electronics, Inc.* | | | 1,678 | | | | 36,916 | |
Methode Electronics, Inc. | | | 2,304 | | | | 108,057 | |
| | | | | | | | |
| | | | | | | 280,646 | |
| Equity Real Estate Investment Trusts (REITs) – 2.1% | | | | | | |
CareTrust, Inc. | | | 1,400 | | | | 26,460 | |
Chatham Lodging Trust | | | 721 | | | | 15,682 | |
Chesapeake Lodging Trust | | | 1,114 | | | | 31,081 | |
Easterly Government Properties, Inc. | | | 713 | | | | 14,345 | |
Independence Realty Trust, Inc. | | | 1,270 | | | | 12,890 | |
Jernigan Capital, Inc. | | | 261 | | | | 5,356 | |
See Notes to Schedule of Investments and Other Information and Notes to Financial Statements.
| | |
| | Janus Detroit Street Trust ½ 7 |
Janus Henderson Small Cap Growth Alpha ETF
Schedule of Investments
October 31, 2017
| | | | | | | | |
| | | Shares | | | Value | |
| Common Stocks – (continued) | | | | | | |
| Equity Real Estate Investment Trusts (REITs) – (continued) | | | | | | |
Pebblebrook Hotel Trust | | | 1,274 | | | | $ 45,431 | |
Terreno Realty Corp. | | | 958 | | | | 35,178 | |
| | | | | | | | |
| | | | | | | 186,423 | |
| Food & Staples Retailing – 0.0% | | | | | | |
Natural Grocers by Vitamin Cottage, Inc.* | | | 331 | | | | 1,625 | |
| Food Products – 1.2% | | | | | | |
Amplify Snack Brands, Inc.*,# | | | 1,134 | | | | 7,246 | |
Blue Buffalo Pet Products, Inc.* | | | 2,909 | | | | 84,158 | |
Calavo Growers, Inc. | | | 259 | | | | 19,088 | |
| | | | | | | | |
| | | | | | | 110,492 | |
| Health Care Equipment & Supplies – 10.4% | | | | | | |
Abaxis, Inc. | | | 1,045 | | | | 50,578 | |
Anika Therapeutics, Inc.* | | | 675 | | | | 36,875 | |
Cantel Medical Corp. | | | 1,920 | | | | 188,313 | |
Glaukos Corp.* | | | 1,584 | | | | 55,931 | |
Globus Medical, Inc. - Class A* | | | 3,325 | | | | 105,968 | |
ICU Medical, Inc.* | | | 919 | | | | 175,621 | |
Inogen, Inc.* | | | 955 | | | | 94,478 | |
LeMaitre Vascular, Inc. | | | 875 | | | | 28,009 | |
Natus Medical, Inc.* | | | 1,523 | | | | 64,575 | |
Neogen Corp.* | | | 1,758 | | | | 140,992 | |
| | | | | | | | |
| | | | | | | 941,340 | |
| Health Care Providers & Services – 3.3% | | | | | | |
Addus HomeCare Corp.* | | | 535 | | | | 19,260 | |
AMN Healthcare Services, Inc.* | | | 2,207 | | | | 96,887 | |
Digirad Corp. | | | 920 | | | | 1,840 | |
HealthEquity, Inc.* | | | 2,760 | | | | 138,607 | |
National Research Corp. - Class A | | | 1,229 | | | | 46,149 | |
| | | | | | | | |
| | | | | | | 302,743 | |
| Health Care Technology – 0.1% | | | | | | |
Simulations Plus, Inc. | | | 792 | | | | 12,910 | |
| Hotels, Restaurants & Leisure – 4.4% | | | | | | |
BJ’s Restaurants, Inc.* | | | 351 | | | | 11,127 | |
Bojangles’, Inc.* | | | 608 | | | | 7,448 | |
Cheesecake Factory, Inc. | | | 770 | | | | 34,450 | |
Churchill Downs, Inc. | | | 253 | | | | 52,763 | |
Chuy’s Holdings, Inc.* | | | 278 | | | | 6,255 | |
Dave & Buster’s Entertainment, Inc.* | | | 691 | | | | 33,306 | |
Habit Restaurants, Inc. - Class A* | | | 332 | | | | 4,084 | |
Hilton Grand Vacations, Inc.* | | | 1,625 | | | | 66,560 | |
ILG, Inc. | | | 2,050 | | | | 60,823 | |
Monarch Casino & Resort, Inc.* | | | 289 | | | | 12,892 | |
Papa John’s International, Inc. | | | 597 | | | | 40,626 | |
Planet Fitness, Inc. - Class A | | | 1,406 | | | | 37,456 | |
Shake Shack, Inc. - Class A* | | | 426 | | | | 16,171 | |
Wingstop, Inc. | | | 475 | | | | 16,088 | |
| | | | | | | | |
| | | | | | | 400,049 | |
| Household Durables – 1.4% | | | | | | |
AV Homes, Inc.* | | | 369 | | | | 6,144 | |
Century Communities, Inc.* | | | 445 | | | | 12,705 | |
Hooker Furniture Corp. | | | 189 | | | | 8,958 | |
Installed Building Products, Inc.* | | | 524 | | | | 36,523 | |
LGI Homes, Inc.* | | | 354 | | | | 21,357 | |
M/I Homes, Inc.* | | | 412 | | | | 13,761 | |
Taylor Morrison Home Corp. - Class A* | | | 1,188 | | | | 28,690 | |
| | | | | | | | |
| | | | | | | 128,138 | |
See Notes to Schedule of Investments and Other Information and Notes to Financial Statements.
Janus Henderson Small Cap Growth Alpha ETF
Schedule of Investments
October 31, 2017
| | | | | | | | |
| | | Shares | | | Value | |
| Common Stocks – (continued) | | | | | | |
| Insurance – 1.0% | | | | | | |
AmTrust Financial Services, Inc. | | | 2,124 | | | | $ 26,677 | |
Health Insurance Innovations, Inc. - Class A* | | | 137 | | | | 2,946 | |
Heritage Insurance Holdings, Inc. | | | 316 | | | | 5,069 | |
Investors Title Co. | | | 19 | | | | 3,604 | |
Kingstone Cos., Inc. | | | 116 | | | | 1,879 | |
Kinsale Capital Group, Inc. | | | 229 | | | | 9,934 | |
National General Holdings Corp. | | | 1,161 | | | | 23,429 | |
State National Cos., Inc. | | | 457 | | | | 9,606 | |
Universal Insurance Holdings, Inc. | | | 377 | | | | 8,992 | |
| | | | | | | | |
| | | | | | | 92,136 | |
| Internet & Catalog Retail – 0.6% | | | | | | |
1-800-Flowers.com, Inc. - Class A* | | | 581 | | | | 5,461 | |
Duluth Holdings, Inc. - Class B* | | | 476 | | | | 9,834 | |
Liberty Expedia Holdings, Inc. - Class A* | | | 938 | | | | 43,242 | |
| | | | | | | | |
| | | | | | | 58,537 | |
| Internet Software & Services – 8.4% | | | | | | |
CommerceHub, Inc. - Series C* | | | 2,713 | | | | 57,868 | |
GTT Communications, Inc.* | | | 2,590 | | | | 94,406 | |
Match Group, Inc.* | | | 3,272 | | | | 87,493 | |
Meet Group, Inc.* | | | 4,492 | | | | 15,228 | |
NIC, Inc. | | | 4,147 | | | | 70,499 | |
Shutterstock, Inc.* | | | 2,165 | | | | 84,413 | |
Stamps.com, Inc.* | | | 1,056 | | | | 236,966 | |
Trade Desk, Inc. - Class A* | | | 1,802 | | | | 118,788 | |
| | | | | | | | |
| | | | | | | 765,661 | |
| IT Services – 2.2% | | | | | | |
ExlService Holdings, Inc.* | | | 2,107 | | | | 131,519 | |
Luxoft Holding, Inc.* | | | 1,383 | | | | 64,379 | |
| | | | | | | | |
| | | | | | | 195,898 | |
| Leisure Equipment & Products – 0.3% | | | | | | |
American Outdoor Brands Corp.* | | | 886 | | | | 12,696 | |
Escalade, Inc. | | | 237 | | | | 2,927 | |
Malibu Boats, Inc. - Class A* | | | 294 | | | | 9,173 | |
MCBC Holdings, Inc.* | | | 305 | | | | 6,975 | |
| | | | | | | | |
| | | | | | | 31,771 | |
| Life Sciences Tools & Services – 3.5% | | | | | | |
Cambrex Corp.* | | | 1,504 | | | | 65,048 | |
INC Research Holdings, Inc. - Class A* | | | 4,360 | | | | 249,174 | |
| | | | | | | | |
| | | | | | | 314,222 | |
| Machinery – 1.2% | | | | | | |
Greenbrier Cos., Inc. | | | 823 | | | | 42,961 | |
Proto Labs, Inc.* | | | 768 | | | | 67,008 | |
| | | | | | | | |
| | | | | | | 109,969 | |
| Mortgate Real Estate Investment Trusts (REITs) – 0.1% | | | | | | |
Cherry Hill Mortgage Investment Corp. | | | 140 | | | | 2,549 | |
Great Ajax Corp. | | | 199 | | | | 2,816 | |
Sutherland Asset Management Corp. | | | 355 | | | | 5,556 | |
| | | | | | | | |
| | | | | | | 10,921 | |
| Oil, Gas & Consumable Fuels – 0.9% | | | | | | |
Antero Midstream GP LP# | | | 1,271 | | | | 23,781 | |
Cheniere Energy Partners LP Holdings LLC | | | 1,582 | | | | 39,613 | |
DHT Holdings, Inc. | | | 971 | | | | 3,826 | |
Evolution Petroleum Corp. | | | 226 | | | | 1,672 | |
Tallgrass Energy GP LP | | | 396 | | | | 9,900 | |
| | | | | | | | |
| | | | | | | 78,792 | |
See Notes to Schedule of Investments and Other Information and Notes to Financial Statements.
| | |
| | Janus Detroit Street Trust ½ 9 |
Janus Henderson Small Cap Growth Alpha ETF
Schedule of Investments
October 31, 2017
| | | | | | | | |
| | | Shares | | | Value | |
| Common Stocks – (continued) | | | | | | |
| Paper & Forest Products – 0.7% | | | | | | |
Neenah Paper, Inc. | | | 748 | | | | $ 64,926 | |
| Personal Products – 0.3% | | | | | | |
Natural Health Trends Corp. | | | 168 | | | | 3,236 | |
USANA Health Sciences, Inc.* | | | 360 | | | | 23,652 | |
| | | | | | | | |
| | | | | | | 26,888 | |
| Pharmaceuticals – 2.4% | | | | | | |
Akorn, Inc.* | | | 5,748 | | | | 187,212 | |
Phibro Animal Health Corp. - Class A | | | 886 | | | | 33,358 | |
| | | | | | | | |
| | | | | | | 220,570 | |
| Professional Services – 1.6% | | | | | | |
Barrett Business Services, Inc. | | | 209 | | | | 12,705 | |
BG Staffing, Inc. | | | 250 | | | | 4,220 | |
Insperity, Inc. | | | 600 | | | | 56,940 | |
TriNet Group, Inc.* | | | 2,000 | | | | 69,440 | |
| | | | | | | | |
| | | | | | | 143,305 | |
| Real Estate Management & Development – 0.2% | | | | | | |
Marcus & Millichap, Inc.* | | | 697 | | | | 19,809 | |
| Road & Rail – 2.4% | | | | | | |
AMERCO | | | 565 | | | | 221,842 | |
| Semiconductors & Semiconductor Equipment – 3.0% | | | | | | |
Ambarella, Inc.* | | | 2,099 | | | | 118,468 | |
Ichor Holdings, Ltd.* | | | 1,568 | | | | 48,906 | |
MaxLinear, Inc.* | | | 4,165 | | | | 101,917 | |
| | | | | | | | |
| | | | | | | 269,291 | |
| Software – 10.6% | | | | | | |
Barracuda Networks, Inc.* | | | 3,314 | | | | 77,249 | |
Ebix, Inc. | | | 1,967 | | | | 133,658 | |
Globant SA* | | | 2,183 | | | | 82,343 | |
Paycom Software, Inc.* | | | 3,430 | | | | 281,946 | |
Pegasystems, Inc. | | | 4,444 | | | | 259,085 | |
Qualys, Inc.* | | | 2,347 | | | | 124,156 | |
| | | | | | | | |
| | | | | | | 958,437 | |
| Specialty Retail – 2.2% | | | | | | |
Asbury Automotive Group, Inc.* | | | 340 | | | | 20,876 | |
Boot Barn Holdings, Inc.* | | | 438 | | | | 3,605 | |
Five Below, Inc.* | | | 905 | | | | 50,001 | |
Francesca’s Holdings Corp.* | | | 608 | | | | 3,934 | |
Lithia Motors, Inc. - Class A | | | 393 | | | | 44,479 | |
Penske Automotive Group, Inc. | | | 1,411 | | | | 65,781 | |
Winmark Corp. | | | 69 | | | | 9,022 | |
| | | | | | | | |
| | | | | | | 197,698 | |
| Textiles, Apparel & Luxury Goods – 0.1% | | | | | | |
Culp, Inc. | | | 204 | | | | 6,467 | |
Superior Uniform Group, Inc. | | | 242 | | | | 5,680 | |
| | | | | | | | |
| | | | | | | 12,147 | |
| Thrifts & Mortgage Finance – 1.1% | | | | | | |
BofI Holding, Inc.* | | | 691 | | | | 18,588 | |
Essent Group, Ltd.* | | | 1,067 | | | | 45,476 | |
FS Bancorp, Inc. | | | 34 | | | | 1,845 | |
HomeStreet, Inc.* | | | 291 | | | | 8,454 | |
Meta Financial Group, Inc. | | | 102 | | | | 8,899 | |
NMI Holdings, Inc. - Class A* | | | 649 | | | | 9,443 | |
PennyMac Financial Services, Inc. - Class A* | | | 256 | | | | 4,864 | |
| | | | | | | | |
| | | | | | | 97,569 | |
See Notes to Schedule of Investments and Other Information and Notes to Financial Statements.
Janus Henderson Small Cap Growth Alpha ETF
Schedule of Investments
October 31, 2017
| | | | | | | | |
| | | Shares | | | Value | |
| Common Stocks – (continued) | | | | | | |
| Trading Companies & Distributors – 0.5% | | | | | | |
BMC Stock Holdings, Inc.* | | | 1,931 | | | | $ 41,420 | |
Huttig Building Products, Inc.* | | | 746 | | | | 5,013 | |
| | | | | | | | |
| | | | | | | | 46,433 | |
Total Common Stocks (cost $8,339,398) | | | | | | | 9,080,437 | |
| Investment Companies – 4.3% | | | | | | |
| Investments Purchased with Cash Collateral from Securities Lending – 4.3% | | | | | | |
Janus Cash Collateral Fund LLC, 1.0003%ºº,£ | | | 396,201 | | | | 396,201 | |
| Money Markets – 0.0% | | | | | | |
State Street Institutional U.S. Government Money Market Fund, 0.9569%ºº | | | 266 | | | | 266 | |
Total Investment Companies (cost $396,467) | | | | | | | 396,467 | |
Total Investments (total cost $8,735,865) – 104.3% | | | | | | | 9,476,904 | |
Liabilities, net of Cash, Receivables and Other Assets – (4.3%) | | | | | | | (393,545) | |
Net Assets – 100% | | | | | | | $9,083,359 | |
Summary of Investments by Country – (Long Positions) (unaudited)
| | | | | | | | |
| Country | | Value | | | % of
Investment
Securities | |
United States | | | $9,326,356 | | | | 98.4% | |
Luxembourg | | | 82,343 | | | | 0.9 | |
Switzerland | | | 64,379 | | | | 0.7 | |
Bermuda | | | 3,826 | | | | 0.0 | |
Total | | | $9,476,904 | | | | 100.0% | |
Schedules of Affiliated Investments – (% of Net Assets)
| | | | | | | | | | | | | | | | |
| | | Dividend
Income | | | Realized
Gain/(Loss) | | | Change in
Unrealized
Appreciation/
(Depreciation) | | | Value at
10/31/17 | |
Investment Companies – 4.3% | | | | | | | | | | | | | | | | |
Investments Purchased with Cash Collateral from Securities Lending – 4.3% | | | | | | | | | | | | | | | | |
Janus Cash Collateral Fund LLC, 1.0003%ºº | | | $27,454 | D | | | $ — | | | | $ — | | | | $396,201 | |
| | | | |
| | | Share Balance
at 10/31/16 | | | Purchases | | | Sales | | | Share Balance
at 10/31/17 | |
Investment Companies – 4.3% | | | | | | | | | | | | | | | | |
Investments Purchased with Cash Collateral from Securities Lending – 4.3% | | | | | | | | | | | | | | | | |
Janus Cash Collateral Fund LLC, 1.0003%ºº | | | — | | | | 2,571,571 | | | | (2,175,370) | | | | 396,201 | |
See Notes to Schedule of Investments and Other Information and Notes to Financial Statements.
| | |
| | Janus Detroit Street Trust ½ 11 |
Janus Henderson Small Cap Growth Alpha ETF
Notes to Schedule of Investments and Other Information
| | |
Janus Small Cap Growth Alpha
Index | | Janus Small Cap Growth Alpha Index is designed to systematically identify small-capitalization stocks that are poised for sustainable growth (Smart Growth®) by evaluating each company’s performance in three critical areas: growth, profitability, and capital efficiency. Janus uses a proprietary methodology to score stocks based on a wide range of fundamental measures and selects the top 10% (“top-tier”) of such eligible stocks. Stocks are market cap-weighted within sectors with a 3% maximum position size; sectors are weighted to align with the Janus Henderson Venture Fund. |
| |
| Russell 2000® Growth Index | | Russell 2000® Growth Index reflects the performance of U.S. small-cap equities with higher price-to-book ratios and higher forecasted growth values. |
| |
| LLC | | Limited Liability Company |
| |
| LP | | Limited Partnership |
| * | Non-income producing security. |
| # | Loaned security; a portion of the security is on loan at October 31, 2017. |
| ºº | Rate shown is the 7-day yield as of October 31, 2017. |
| £ | The Fund may invest in certain securities that are considered affiliated companies. As defined by the Investment Company Act of 1940, as amended, an affiliated company is one in which the Fund owns 5% or more of the outstanding voting securities, or a company which is under common ownership or control. |
| D | Net of income paid to the securities lending agent and rebates paid to the borrowing counterparties. |
The following is a summary of the inputs that were used to value the Fund’s investments in securities and other financial instruments as of October 31, 2017. See Notes to Financial Statements for more information.
Valuation Inputs Summary
| | | | | | | | | | | | |
| | | Level 1 -
Quoted Prices | | | Level 2 -
Other Significant
Observable Inputs | | | Level 3 -
Significant
Unobservable Inputs | |
Assets | | | | | | | | | | | | |
Investments in Securities: | | | | | | | | | | | | |
Common Stocks | | $ | 9,080,437 | | | $ | — | | | $ | — | |
Investment Companies | | | 266 | | | | 396,201 | | | | — | |
| | | | |
Total Assets | | $ | 9,080,703 | | | $ | 396,201 | | | $ | — | |
See Notes to Schedule of Investments and Other Information and Notes to Financial Statements.
Janus Henderson Small Cap Growth Alpha ETF
Statement of Assets and Liabilities
October 31, 2017
| | | | |
Assets: | | | | |
Unaffiliated investments, at value(1)(2) | | $ | 9,080,703 | |
Affiliated investments, at value(3) | | | 396,201 | |
Receivables: | | | | |
Dividends | | | 526 | |
Affiliated securities lending income, net | | | 5,821 | |
Total Assets | | | 9,483,251 | |
Liabilities: | | | | |
Collateral on securities loaned (Note 2) | | | 396,201 | |
Payables: | | | | |
Investments purchased | | | 5 | |
Management fees | | | 3,686 | |
Total Liabilities | | | 399,892 | |
Net Assets | | $ | 9,083,359 | |
Net Assets Consists of: | | | | |
Capital (par value and paid-in surplus) | | $ | 8,432,728 | |
Undistributed net investment income/(loss) | | | 5,687 | |
Undistributed net realized gain/(loss) from investments and foreign currency transactions | | | (96,095) | |
Unrealized net appreciation/(depreciation) on investments and foreign currency translations | | | 741,039 | |
Total Net Assets | | $ | 9,083,359 | |
Net Assets | | $ | 9,083,359 | |
Shares outstanding, $0.001 Par Value (unlimited shares authorized) | | | 252,000 | |
Net Asset Value Per Share | | $ | 36.05 | |
| (1) | Includes cost of $8,339,664 |
| (2) | Includes $386,947 of securities on loan. See Note 2 in Notes to Financial Statements. |
| (3) | Includes cost of $396,201. |
See Notes to Financial Statements.
| | |
| | Janus Detroit Street Trust ½ 13 |
Janus Henderson Small Cap Growth Alpha ETF
Statement of Operations
For the year ended October 31, 2017
| | | | |
Investment Income: | | | | |
Dividends | | $ | 36,739 | |
Affiliated securities lending income, net | | | 27,454 | |
Total Investment Income | | | 64,193 | |
Expenses: | | | | |
Management Fees | | | 35,342 | |
Total Expenses | | | 35,342 | |
Net Investment Income/(Loss) | | | 28,851 | |
Net Realized Gain/(Loss) on Investments: | | | | |
Investments and foreign currency transactions | | | 775,153 | |
Total Net Realized Gain/(Loss) on Investments | | | 775,153 | |
Change in Unrealized Net Appreciation/Depreciation: | | | | |
Investments and foreign currency translations | | | 886,912 | |
Total Change in Unrealized Net Appreciation/Depreciation | | | 886,912 | |
Net Increase/(Decrease) in Net Assets Resulting from Operations | | $ | 1,690,916 | |
See Notes to Financial Statements.
Janus Henderson Small Cap Growth Alpha ETF
Statements of Changes in Net Assets
| | | | | | | | |
| | | Year ended
October 31, 2017 | | | Period ended
October 31, 2016(1) | |
Operations: | | | | | | | | |
Net investment income/(loss) | | $ | 28,851 | | | $ | 30,617 | |
Net realized gain/(loss) on investments | | | 775,153 | | | | 428,953 | |
Change in unrealized net appreciation/depreciation | | | 886,912 | | | | (145,873) | |
Net Increase/(Decrease) in Net Assets Resulting from Operations | | | 1,690,916 | | | | 313,697 | |
Dividends and Distributions to Shareholders: | | | | | | | | |
Dividends from Net Investment Income | | | (46,606) | | | | (2,185) | |
Capital Share Transactions | | | 3,157,247 | | | | 3,970,290 | |
Net Increase/(Decrease) in Net Assets | | | 4,801,557 | | | | 4,281,802 | |
Net Assets: | | | | | | | | |
Beginning of period | | | 4,281,802 | | | | — | |
End of period | | $ | 9,083,359 | | | $ | 4,281,802 | |
| | |
| | | | | | | | |
Undistributed Net Investment Income/(Loss) | | $ | 5,687 | | | $ | 23,855 | |
| (1) | Period from February 23, 2016 (commencement of operations) through October 31, 2016. |
See Notes to Financial Statements.
| | |
| | Janus Detroit Street Trust ½ 15 |
Janus Henderson Small Cap Growth Alpha ETF
Financial Highlights
| | | | | | | | | | |
| For a share outstanding during each year or period ended October 31 | | 2017 | | | 2016(1) | |
| | Net Asset Value, Beginning of Period | | | $28.17 | | | | $24.83 | |
| | Income/(Loss) from Investment Operations: | | | | | | | | |
| | Net investment income/(loss)(2) | | | 0.13 | | | | 0.26 | |
| | Net realized and unrealized gain/(loss) | | | 7.97 | | | | 3.10 | |
| | Total from Investment Operations | | | 8.10 | | | | 3.36 | |
| | Less Dividends and Distributions: | | | | | | | | |
| | Dividends (from net investment income) | | | (0.22) | | | | (0.02) | |
| | Total Dividends and Distributions | | | (0.22) | | | | (0.02) | |
| | Net Asset Value, End of Period | | | $36.05 | | | | $28.17 | |
| | Total Return* | | | 28.86% | | | | 13.54% | |
| | Net assets, End of Period (in thousands) | | | $9,083 | | | | $4,282 | |
| | Average Net Assets for the Period (in thousands) | | | $7,068 | | | | $3,247 | |
| | Ratios to Average Net Assets**: | | | | | | | | |
| | Ratio of Gross Expenses | | | 0.50% | | | | 0.50% | |
| | Ratio of Net Investment Income/(Loss) | | | 0.41% | | | | 1.37% | |
| | Portfolio Turnover Rate(3) | | | 117% | | | | 86% | |
| * | Total return not annualized for periods of less than one full year. |
| ** | Annualized for periods of less than one full year. |
| (1) | Period from February 23, 2016 (commencement of operations) through October 31, 2016. |
| (2) | Per share amounts are calculated based on average shares outstanding during the year or period. |
| (3) | Portfolio turnover rate excludes securities received or delivered from in-kind processing of creation or redemptions. |
See Notes to Financial Statements.
Janus Henderson Small Cap Growth Alpha ETF
Notes to Financial Statements
1. Organization and Significant Accounting Policies
Janus Henderson Small Cap Growth Alpha ETF (the “Fund”) (formerly named Janus Small Cap Growth Alpha ETF) is a series fund. The Fund is part of Janus Detroit Street Trust (the “Trust”), which is organized as a Delaware statutory trust and is registered under the Investment Company Act of 1940, as amended (the “1940 Act”), as an open-end management investment company, and therefore has applied the specialized accounting and reporting guidance in Financial Accounting Standards Board (“FASB”) Accounting Standards Codification (“ASC”) Topic 946. The Trust offers nine Funds each of which represent shares of beneficial interest in a separate portfolio of securities and other assets with its own objective and policies. The Fund seeks investment results that correspond generally, before fees and expenses, to the performance of its underlying index, the Janus Small Cap Growth Alpha Index (the “Underlying Index”). The Fund is classified as diversified, as defined in the 1940 Act.
Unlike shares of traditional mutual funds, shares of the Fund are not individually redeemable and may only be purchased or redeemed directly from the Fund at net asset value (“NAV”) in large increments called “Creation Units” (50,000 or more shares per Creation Unit) through certain participants, known as “Authorized Participants.” The Fund will issue or redeem Creation Units in exchange for portfolio securities and/or cash. Except when aggregated in Creation Units, Fund shares are not redeemable securities of the Fund. Shares of the Fund are listed and trade on The NASDAQ Stock Market LLC (“NASDAQ”) and individual investors can purchase or sell shares in much smaller increments and for cash in the secondary market through a broker. These transactions, which do not involve the Fund, are made at market prices that may vary throughout the day and differ from the Fund’s NAV. As a result, you may pay more than NAV (at a premium) when you purchase shares, and receive less than NAV (at a discount) when you sell shares, in the secondary market.
An Authorized Participant may hold of record more than 25% of the outstanding shares of the Fund. From time to time, Authorized Participants may be a beneficial and/or legal owner of the Fund, may be affiliated with an index provider, may be deemed to have control of the Fund and/or may be able to affect the outcome of matters presented for a vote of the shareholders of the Fund. Authorized Participants may execute an irrevocable proxy granting the Distributor or an affiliate of Janus Capital Management LLC (“Janus Capital” or “Janus”) power to vote or abstain from voting such Authorized Participant’s beneficially or legally owned shares of the Fund. In such cases, the agent shall mirror vote (or abstain from voting) such shares in the same proportion as all other beneficial owners of the Fund.
The following accounting policies have been followed by the Fund and are in conformity with accounting principles generally accepted in the United States of America.
Investment Valuation
Securities held by the Fund are valued in accordance with policies and procedures established by and under the supervision of the Trustees (the “Valuation Procedures”). Equity securities, including shares of exchange-traded funds, traded on a domestic securities exchange are generally valued at the closing prices on the primary market or exchange on which they trade. If such price is lacking for the trading period immediately preceding the time of determination, such securities are valued at their current bid price. Equity securities that are traded on a foreign exchange are generally valued at the closing prices on such markets. In the event that there is no current trading volume on a particular security in such foreign exchange, the bid price from the primary exchange is generally used to value the security. Securities that are traded on the over-the-counter (“OTC”) markets are generally valued at their closing or latest bid prices as available. Foreign securities and currencies are converted to U.S. dollars using the applicable exchange rate in effect at the close of the New York Stock Exchange (“NYSE”). The Fund will determine the market value of individual securities held by it by using prices provided by one or more approved professional pricing services or, as needed, by obtaining market quotations from independent broker-dealers. Most debt securities are valued in accordance with the evaluated bid price supplied by the pricing service that is intended to reflect market value. The evaluated bid price supplied by the pricing service is an evaluation that may consider factors such as security prices, yields, maturities and ratings. Certain short-term securities maturing within 60 days or less may be evaluated and valued on an amortized cost basis provided that the amortized cost determined approximates market value. Securities for which market quotations or evaluated prices are not readily available or are deemed unreliable are valued at fair value determined in good faith under the Valuation Procedures. Circumstances in which fair value pricing may be utilized include, but are not limited to: (i) a significant event that may affect the securities of a single issuer, such as a merger, bankruptcy, or significant issuer-specific development; (ii) an event that may affect an entire market, such as a natural disaster or significant governmental action; (iii) a nonsignificant event such as a market closing early or not opening, or a security trading halt; and (iv) pricing of a nonvalued security and a restricted or nonpublic security. Special valuation considerations may apply with respect to “odd-lot” fixed-income transactions which, due to their small size, may receive evaluated prices by pricing services which reflect a large block trade and not what actually could be obtained for the odd-lot position.
| | |
| | Janus Detroit Street Trust ½ 17 |
Janus Henderson Small Cap Growth Alpha ETF
Notes to Financial Statements
Valuation Inputs Summary
FASB ASC 820, Fair Value Measurements and Disclosures (“ASC 820”), defines fair value, establishes a framework for measuring fair value, and expands disclosure requirements regarding fair value measurements. This standard emphasizes that fair value is a market-based measurement that should be determined based on the assumptions that market participants would use in pricing an asset or liability and establishes a hierarchy that prioritizes inputs to valuation techniques used to measure fair value. These inputs are summarized into three broad levels:
Level 1 – Unadjusted quoted prices in active markets the Fund has the ability to access for identical assets or liabilities.
Level 2 – Observable inputs other than unadjusted quoted prices included in Level 1 that are observable for the asset or liability either directly or indirectly. These inputs may include quoted prices for the identical instrument on an inactive market, prices for similar instruments, interest rates, prepayment speeds, credit risk, yield curves, default rates and similar data.
Assets or liabilities categorized as Level 2 in the hierarchy generally include: debt securities fair valued in accordance with the evaluated bid or ask prices supplied by a pricing service; securities traded on OTC markets and listed securities for which no sales are reported that are fair valued at the latest bid price (or yield equivalent thereof) obtained from one or more dealers transacting in a market for such securities or by a pricing service approved by the Fund’s Trustees; and certain short-term debt securities with maturities of 60 days or less that are fair valued at amortized cost. Other securities that may be categorized as Level 2 in the hierarchy include, but are not limited to, preferred stocks, bank loans, swaps, investments in unregistered investment companies, options, and forward contracts.
Level 3 – Unobservable inputs for the asset or liability to the extent that relevant observable inputs are not available, representing the Fund’s own assumptions about the assumptions that a market participant would use in valuing the asset or liability, and that would be based on the best information available.
There have been no significant changes in valuation techniques used in valuing any such positions held by the Fund since the beginning of the fiscal year.
The inputs or methodology used for fair valuing securities are not necessarily an indication of the risk associated with investing in those securities. The summary of inputs used as of October 31, 2017 to fair value the Fund’s investments in securities and other financial instruments is included in the “Valuation Inputs Summary” in the Notes to Schedule of Investments and Other Information.
The Fund recognizes transfers between the levels as of the beginning of the fiscal year. The following describes the amounts of transfers between Level 1, Level 2 and Level 3 of the fair value hierarchy during the year/period.
Financial assets of $3,870 were transferred out of Level 2 to Level 1 to reflect the investments unadjusted quoted price as of October 31, 2017.
Investment Transactions and Investment Income
Investment transactions are accounted for as of the date purchased or sold (trade date). Dividend income is recorded on the ex-dividend date. Certain dividends from foreign securities will be recorded as soon as the Fund is informed of the dividend, if such information is obtained subsequent to the ex-dividend date. Dividends from foreign securities may be subject to withholding taxes in foreign jurisdictions. Gains and losses are determined on the identified cost basis, which is the same basis used for federal income tax purposes.
Estimates
The preparation of financial statements in conformity with accounting principles generally accepted in the United States of America requires management to make estimates and assumptions that affect the reported amount of assets and liabilities and disclosure of contingent assets and liabilities at the date of the financial statements, and the reported amounts of income and expenses during the reporting period. Actual results could differ from those estimates.
Indemnifications
In the normal course of business, the Fund may enter into contracts that contain provisions for indemnification of other parties against certain potential liabilities. The Fund’s maximum exposure under these arrangements is unknown, and would involve future claims that may be made against the Fund that have not yet occurred. Currently, the risk of material loss from such claims is considered remote.
Janus Henderson Small Cap Growth Alpha ETF
Notes to Financial Statements
Foreign Currency Translations
The Fund does not isolate that portion of the results of operations resulting from the effect of changes in foreign exchange rates on investments from the fluctuations arising from changes in market prices of securities held at the date of the financial statements. Net unrealized appreciation or depreciation of investments and foreign currency translations arise from changes in the value of assets and liabilities, including investments in securities held at the date of the financial statements, resulting from changes in the exchange rates and changes in market prices of securities held.
Currency gains and losses are also calculated on payables and receivables that are denominated in foreign currencies. The payables and receivables are generally related to foreign security transactions and income translations.
Foreign currency-denominated assets and forward currency contracts may involve more risks than domestic transactions, including currency risk, counterparty risk, political and economic risk, regulatory risk and equity risk. Risks may arise from unanticipated movements in the value of foreign currencies relative to the U.S. dollar.
Dividends and Distributions
The Fund generally declares and distributes dividends of net investment income quarterly. Net realized capital gains (if any) are distributed annually. The Fund may treat a portion of the amount paid to redeem shares as a distribution of investment company taxable income and realized capital gains that are reflected in the NAV. This practice, commonly referred to as “equalization,” has no effect on the redeeming shareholder or a Fund’s total return, but may reduce the amounts that would otherwise be required to be paid as taxable dividends to the remaining shareholders. It is possible that the Internal Revenue Service (IRS) could challenge the Fund’s equalization methodology or calculations, and any such challenge could result in additional tax, interest, or penalties to be paid by the Fund.
The Fund may make certain investments in real estate investment trusts (“REITs”) which pay dividends to their shareholders based upon funds available from operations. It is quite common for these dividends to exceed the REITs’ taxable earnings and profits, resulting in the excess portion of such dividends being designated as a return of capital. If the Fund distributes such amounts, such distributions could constitute a return of capital to shareholders for federal income tax purposes.
Federal Income Taxes
The Fund intends to continue to qualify as a regulated investment company and distribute all of its taxable income in accordance with the requirements of Subchapter M of the Internal Revenue Code. Management has analyzed the Fund’s tax positions taken for all open federal income tax years, generally a three-year period, and has concluded that no provision for federal income tax is required in the Fund’s financial statements. The Fund is not aware of any tax positions for which it is reasonably possible that the total amounts of unrecognized tax benefits will significantly change in the next twelve months.
2. Other Investments and Strategies
Additional Investment Risk
The financial crisis in both the U.S. and global economies over the past several years has resulted, and may continue to result, in a significant decline in the value and liquidity of many securities of issuers worldwide in the equity and fixed income/credit markets. In response to the crisis, the United States and certain foreign governments, along with the U.S. Federal Reserve and certain foreign central banks, took steps to support the financial markets. The withdrawal of this support, a failure of measures put in place to respond to the crisis, or investor perception that such efforts were not sufficient could each negatively affect financial markets generally, and the value and liquidity of specific securities. In addition, policy and legislative changes in the United States and in other countries continue to impact many aspects of financial regulation. The effect of these changes on the markets, and the practical implications for market participants, including the Fund, may not be fully known for some time. As a result, it may also be unusually difficult to identify both investment risks and opportunities, which could limit or preclude the Fund’s ability to achieve its investment objective. Therefore, it is important to understand that the value of your investment may fall, sometimes sharply, and you could lose money.
The enactment of the Dodd-Frank Wall Street Reform and Consumer Protection Act (the “Dodd-Frank Act”) provided for widespread regulation of financial institutions, consumer financial products and services, broker-dealers, OTC derivatives, investment advisers, credit rating agencies, and mortgage lending, which expanded federal oversight in the financial sector, including the investment management industry. Certain provisions of the Dodd-Frank Act remain pending and will be implemented through future rulemaking. Therefore, the ultimate impact of the Dodd-Frank Act and the regulations under the Dodd-Frank Act on the Fund and the investment management industry as a whole, is not yet certain.
| | |
| | Janus Detroit Street Trust ½ 19 |
Janus Henderson Small Cap Growth Alpha ETF
Notes to Financial Statements
A number of countries in the European Union (“EU”) have experienced, and may continue to experience, severe economic and financial difficulties. In particular, many EU nations are susceptible to economic risks associated with high levels of debt, notably due to investments in sovereign debt of countries such as Greece, Italy, Spain, Portugal, and Ireland. Many non-governmental issuers, and even certain governments, have defaulted on, or been forced to restructure, their debts. Many other issuers have faced difficulties obtaining credit or refinancing existing obligations. Financial institutions have in many cases required government or central bank support, have needed to raise capital, and/or have been impaired in their ability to extend credit. As a result, financial markets in the EU experienced extreme volatility and declines in asset values and liquidity. Responses to these financial problems by European governments, central banks, and others, including austerity measures and reforms, may not work, may result in social unrest, and may limit future growth and economic recovery or have other unintended consequences. Further defaults or restructurings by governments and others of their debt could have additional adverse effects on economies, financial markets, and asset valuations around the world. Greece, Ireland, and Portugal have already received one or more “bailouts” from other Eurozone member states, and it is unclear how much additional funding they will require or if additional Eurozone member states will require bailouts in the future. The risk of investing in securities in the European markets may also be heightened due to the referendum in which the United Kingdom voted to exit the EU (known as “Brexit”). One or more other countries may also abandon the euro and/ or withdraw from the EU, placing its currency and banking system in jeopardy.
Certain areas of the world have historically been prone to and economically sensitive to environmental events such as, but not limited to, hurricanes, earthquakes, typhoons, flooding, tidal waves, tsunamis, erupting volcanoes, wildfires or droughts, tornadoes, mudslides, or other weather-related phenomena. Such disasters, and the resulting physical or economic damage, could have a severe and negative impact on the Fund’s investment portfolio and, in the longer term, could impair the ability of issuers in which the Fund invests to conduct their businesses as they would under normal conditions. Adverse weather conditions may also have a particularly significant negative effect on issuers in the agricultural sector and on insurance companies that insure against the impact of natural disasters.
Counterparties
Fund transactions involving a counterparty are subject to the risk that the counterparty or a third party will not fulfill its obligation to the Fund (“counterparty risk”). Counterparty risk may arise because of the counterparty’s financial condition (i.e., financial difficulties, bankruptcy, or insolvency), market activities and developments, or other reasons, whether foreseen or not. A counterparty’s inability to fulfill its obligation may result in significant financial loss to the Fund. The Fund may be unable to recover its investment from the counterparty or may obtain a limited recovery, and/or recovery may be delayed. The extent of the Fund’s exposure to counterparty risk with respect to financial assets and liabilities approximates its carrying value. See the “Offsetting Assets and Liabilities” section of this Note for further details.
The Fund may be exposed to counterparty risk through participation in various programs, including, but not limited to, lending its securities to third parties, cash sweep arrangements whereby the Fund’s cash balance is invested in one or more types of cash management vehicles, as well as investments in, but not limited to, repurchase agreements, and derivatives, including various types of swaps, futures and options. The Fund intends to enter into financial transactions with counterparties that Janus Capital believes to be creditworthy at the time of the transaction. There is always the risk that Janus Capital’s analysis of a counterparty’s creditworthiness is incorrect or may change due to market conditions. To the extent that the Fund focuses its transactions with a limited number of counterparties, it will have greater exposure to the risks associated with one or more counterparties.
Offsetting Assets and Liabilities
The Fund presents gross and net information about transactions that are either offset in the financial statements or subject to an enforceable master netting arrangement or similar agreement with a designated counterparty, regardless of whether the transactions are actually offset in the Statement of Assets and Liabilities.
Deutsche Bank AG acts as securities lending agent and a limited purpose custodian or subcustodian to receive and disburse cash balances and cash collateral, hold short-term investments, hold collateral, and perform other custodian functions in accordance with the Agency Securities Lending and Repurchase Agreement. For financial reporting purposes, the Fund does not offset financial instruments’ payables and receivables and related collateral on the Statement of Assets and Liabilities. Securities on loan will be continuously secured by collateral which may consist of cash, U.S. Government securities, domestic and foreign short-term debt instruments, letters of credit, time deposits, repurchase agreements, money market mutual funds or other money market accounts, or such other collateral as permitted by the SEC. The value of the collateral must be at least 102% of the market value of the loaned securities that are denominated in U.S. dollars and 105% of the market value of the loaned securities that are not denominated in U.S. dollars. Upon receipt of cash collateral, Janus Capital intends to invest the cash collateral in a cash management vehicle for which Janus Capital serves as investment
Janus Henderson Small Cap Growth Alpha ETF
Notes to Financial Statements
adviser, Janus Cash Collateral Fund LLC. Loaned securities and related collateral are marked-to-market each business day based upon the market value of the loaned securities at the close of business, employing the most recent available pricing information. Collateral levels are then adjusted based on this mark-to-market evaluation.
The following table presents gross amounts of recognized assets and/or liabilities and the net amounts after deducting collateral that has been pledged by counterparties or has been pledged to counterparties (if applicable). For corresponding information grouped by type of instrument, see the Fund’s Schedule of Investments.
Offsetting of Financial Assets and Derivative Assets
| | | | | | | | | | | | | | | | |
| Counterparty | | Gross Amounts of
Recognized Assets | | | Offsetting
Asset or
Liability(a) | | | Collateral
Pledged(b) | | | Net Amount | |
| Deutsche Bank AG | | $ | 386,947 | | | $ | — | | | $ | (386,947) | | | $ | — | |
| (a) | Represents the amount of assets or liabilities that could be offset with the same counterparty under master netting or similar agreements that management elects not to offset on the Statement of Assets and Liabilities. |
| (b) | Collateral pledged is limited to the net outstanding amount due to/from an individual counterparty. The actual collateral amounts pledged may exceed these amounts and may fluctuate in value. |
Real Estate Investing
The Fund may invest in equity securities of real estate-related companies to the extent such securities are included in the Underlying Index. Such companies may include those in the real estate industry or real estate-related industries. These securities may include common stocks, preferred stocks, and other equity securities, including, but not limited to, mortgage-backed securities, real estate-backed securities, securities of REITs and similar REIT-like entities. A REIT is a trust that invests in real estate-related projects, such as properties, mortgage loans, and construction loans. REITs are generally categorized as equity, mortgage, or hybrid REITs. A REIT may be listed on an exchange or traded OTC.
Securities Lending
Under procedures adopted by the Trustees, the Fund may seek to earn additional income by lending securities to qualified parties. Deutsche Bank AG acts as securities lending agent and a limited purpose custodian or subcustodian to receive and disburse cash balances and cash collateral, hold short-term investments, hold collateral, and perform other custodian functions. The Fund may lend portfolio securities in an amount equal to up to 1/3 of its total assets as determined at the time of the loan origination. There is the risk of delay in recovering a loaned security or the risk of loss in collateral rights if the borrower fails financially. In addition, Janus Capital makes efforts to balance the benefits and risks from granting such loans. All loans will be continuously secured by collateral which may consist of cash, U.S. Government securities, domestic and foreign short-term debt instruments, letters of credit, time deposits, repurchase agreements, money market mutual funds or other money market accounts, or such other collateral as permitted by the SEC. If the Fund is unable to recover a security on loan, the Fund may use the collateral to purchase replacement securities in the market. There is a risk that the value of the collateral could decrease below the cost of the replacement security by the time the replacement investment is made, resulting in a loss to the Fund.
Upon receipt of cash collateral, Janus Capital may invest it in affiliated or non-affiliated cash management vehicles, whether registered or unregistered entities, as permitted by the 1940 Act and rules promulgated thereunder. Janus Capital currently intends to invest the cash collateral in a cash management vehicle for which Janus Capital serves as investment adviser, Janus Cash Collateral Fund LLC. An investment in Janus Cash Collateral Fund LLC is generally subject to the same risks that shareholders experience when investing in similarly structured vehicles, such as the potential for significant fluctuations in assets as a result of the purchase and redemption activity of the securities lending program, a decline in the value of the collateral, and possible liquidity issues. Such risks may delay the return of the cash collateral and cause the Fund to violate its agreement to return the cash collateral to a borrower in a timely manner. As adviser to the Fund and Janus Cash Collateral Fund LLC, Janus Capital has an inherent conflict of interest as a result of its fiduciary duties to both the Fund and Janus Cash Collateral Fund LLC. Additionally, Janus Capital receives an investment advisory fee of 0.05% for managing Janus Cash Collateral Fund LLC, but it may not receive a fee for managing certain other affiliated cash management vehicles in which the Fund may invest, and therefore may have an incentive to allocate preferred investment opportunities to investment vehicles for which it is receiving a fee.
The value of the collateral must be at least 102% of the market value of the loaned securities that are denominated in U.S. dollars and 105% of the market value of the loaned securities that are not denominated in U.S. dollars. Loaned securities and related collateral are marked-to-market each business day based upon the market value of the loaned
| | |
| | Janus Detroit Street Trust ½ 21 |
Janus Henderson Small Cap Growth Alpha ETF
Notes to Financial Statements
securities at the close of business, employing the most recent available pricing information. Collateral levels are then adjusted based on this mark-to-market evaluation.
The cash collateral invested by Janus Capital is disclosed in the Schedule of Investments (if applicable). Income earned from the investment of the cash collateral, net of rebates paid to, or fees paid by, borrowers and less the fees paid to the lending agent are included as “Affiliated securities lending income, net” on the Statement of Operations. As of October 31, 2017, securities lending transactions accounted for as secured borrowings with an overnight and continuous contractual maturity are $386,947 for equity securities. Gross amounts of recognized liabilities for securities lending (collateral received) as of October 31, 2017 is $396,201, resulting in the net amount due to the counterparty of $9,254.
3. Investment Advisory Agreements and Other Transactions with Affiliates
Under its unitary fee structure, the Fund pays Janus Capital a management fee in return for providing certain investment advisory, supervisory, and administrative services to the Fund, including the costs of transfer agency, custody, fund administration, legal, audit, and other services. Janus Capital’s fee structure is designed to pay substantially all of the Fund’s expenses. However, the Fund bears other expenses which are not covered under the management fee which may vary and affect the total level of expenses paid by shareholders, such as distribution fees (if any), brokerage expenses or commissions, interest, dividends, taxes, litigation expenses, acquired fund fees and expenses (if any), and extraordinary expenses. The Fund’s management fee is calculated daily and paid monthly. The Fund’s contractual management fee rate (expressed as an annual rate) is 0.50% of the Fund’s average daily net assets.
State Street Bank and Trust Company (“State Street”) provides certain fund administration services to the Fund, including services related to the Fund’s accounting, including calculating the daily NAV, audit, tax, and reporting obligations, pursuant to an agreement with Janus Capital, on behalf of the Fund. As compensation for such services, Janus Capital pays State Street a fee based on a percentage of the Fund’s assets, with a minimum flat fee, for certain services. Janus Capital serves as administrator to the Fund, providing oversight and coordination of the Fund’s service providers, recordkeeping and other administrative services. Janus Capital does not receive any additional compensation, beyond the unitary fee, for serving as administrator. State Street also serves as transfer agent for the shares of the Fund.
The Trust has adopted a Distribution and Servicing Plan for shares of the Fund pursuant to Rule 12b-1 under the 1940 Act (the “Plan”). The Plan permits compensation in connection with the distribution and marketing of Fund shares and/or the provision of certain shareholder services. The Plan permits the Fund to pay ALPS Distributors, Inc. (the “Distributor”) or its designee, a fee for the sale and distribution and/or shareholder servicing of the shares at an annual rate of up to 0.25% of average daily net assets of the Fund. However, the Trustees have determined not to authorize payment under this Plan at this time. Under the terms of the Plan, the Trust is authorized to make payments to the Distributor or its designee for remittance to retirement plan service providers, broker-dealers, bank trust departments, financial advisors, and other financial intermediaries, as compensation for distribution and/or shareholder services performed by such entities for their customers who are investors in the Fund. The 12b-1 fee may only be imposed or increased when the Trustees determine that it is in the best interests of shareholders to do so. Because these fees are paid out of the Fund’s assets on an ongoing basis, to the extent that a fee is authorized, over time they will increase the cost of an investment in the Fund. The Plan fee may cost an investor more than other types of sales charges.
As of October 31, 2017, Janus Capital owned 2,000 shares or 0.79% of the Fund.
The Fund is permitted to purchase or sell securities (“cross-trade”) between itself and other funds or accounts managed by Janus Capital in accordance with Rule 17a-7 under the Investment Company Act of 1940 (“Rule 17a-7”), when the transaction is consistent with the investment objectives and policies of the Fund and in accordance with the Internal Cross Trade Procedures adopted by the Trust’s Board of Trustees. These procedures have been designed to ensure that any cross-trade of securities by the Fund from or to another fund or account that is or could be considered an affiliate of the Fund under certain limited circumstances by virtue of having a common investment adviser, common Officer, or common Trustee complies with Rule 17a-7. Under these procedures, each cross-trade is effected at the current market price to save costs where allowed. During the year ended October 31, 2017, the Fund engaged in cross trades amounting to $245,519 in purchases and $558,635 in sales, resulting in a net realized gain of $56,862. The net realized gain is included within the “Net Realized Gain/(Loss) on Investments” section of the Fund’s Statement of Operations.
4. Federal Income Tax
The tax components of capital shown in the table below represent: (1) distribution requirements the Fund must satisfy under the income tax regulations; (2) losses or deductions the Fund may be able to offset against income and gains realized in future years; and (3) unrealized appreciation or depreciation of investments for federal income tax purposes.
Janus Henderson Small Cap Growth Alpha ETF
Notes to Financial Statements
Other book to tax differences primarily consist of deferred compensation, derivatives, and foreign currency contract adjustments. The Fund has elected to treat gains and losses on forward foreign currency contracts as capital gains and losses, if applicable. Other foreign currency gains and losses on debt instruments are treated as ordinary income for federal income tax purposes pursuant to Section 988 of the Internal Revenue Code.
| | | | | | | | | | | | | | | | | | | | | | | | | | |
| | | | | | | | | | Loss Deferrals | | | | | | | |
Undistributed
Ordinary Income | | | Undistributed
Long-Term Gains | | | Accumulated
Capital Losses | | | Late-Year
Ordinary Loss | | | Post-October
Capital Loss | | | Other Book to Tax Differences | | | Net Tax Appreciation/ (Depreciation) | |
| $ | 5,687 | | | $ | — | | | $ | (80,060) | | | $ | — | | | $ | — | | | $ | — | | | $ | 725,004 | |
Accumulated capital losses noted below represent net capital loss carryovers, as of October 31, 2017, that may be available to offset future realized capital gains and thereby reduce future taxable gains distributions. The following table shows these capital loss carryovers.
| | | | | | | | | | |
Capital Loss Carryover Schedule
For the year ended October 31, 2017
No Expiration | | | Accumulated Capital Losses | |
| Short-Term | | | Long-Term | | |
| $ | (39,027) | | | $ | (41,033) | | | $ | (80,060) | |
During the year ended ended October 31, 2017, capital loss carryovers of $31,127 were utilized by the Fund.
The aggregate cost of investments and the composition of unrealized appreciation and depreciation of investment securities for federal income tax purposes as of October 31, 2017 are noted below. The primary difference between book and tax appreciation or depreciation of investments is wash sale loss deferrals.
| | | | | | | | | | | | | | |
| Federal Tax Cost | | | Unrealized Appreciation | | | Unrealized (Depreciation) | | | Net Tax Appreciation/ (Depreciation) | |
| $ | 8,751,900 | | | $ | 877,929 | | | $ | (152,925) | | | $ | 725,004 | |
Income and capital gains distributions are determined in accordance with income tax regulations that may differ from accounting principles generally accepted in the United States of America. These differences are due to differing treatments for items such as net short-term gains, deferral of wash sale losses, foreign currency transactions, passive foreign investment companies, net investment losses, in-kind transactions, and capital loss carryovers. Certain permanent differences such as tax returns of capital and net investment losses noted below have been reclassified to capital.
| | | | | | | | | | | | | | |
| For the year ended October 31, 2017 | |
| Distributions | | | | |
| From Ordinary Income | | | From Long-Term Capital Gains | | | Tax Return of Capital | | | Net Investment Loss | |
| $ | 46,606 | | | $ | — | | | $ | — | | | $ | — | |
|
| For the period ended October 31, 2016 | |
| Distributions | | | | |
| From Ordinary Income | | | From Long-Term Capital Gains | | | Tax Return of Capital | | | Net Investment Loss | |
| $ | 2,185 | | | $ | — | | | $ | — | | | $ | — | |
Permanent book to tax basis differences may result in reclassifications between the components of net assets. These differences have no impact on the results of operations or net assets. The following reclassifications have been made to the Fund:
| | | | | | | | | | |
| Increase/(Decrease) to Capital | | | Increase/(Decrease) to Undistributed
Net Investment Income/Loss | | | Increase/(Decrease) to Undistributed
Net realized Gain/Loss | |
| $ | 761,229 | | | $ | (413) | | | $ | (760,816) | |
| | |
| | Janus Detroit Street Trust ½ 23 |
Janus Henderson Small Cap Growth Alpha ETF
Notes to Financial Statements
5. Capital Share Transactions
| | | | | | | | | | | | | | | | |
| | | Year ended October 31, 2017 | | | Period ended October 31, 2016(1) | |
| | | Shares | | | Amount | | | Shares | | | Amount | |
| Shares sold | | | 200,000 | | | $ | 6,541,633 | | | | 302,000 | | | $ | 8,101,071 | |
Shares repurchased | | | (100,000) | | | | (3,384,386) | | | | (150,000) | | | | (4,130,781) | |
Net Increase/(Decrease) | | | 100,000 | | | $ | 3,157,247 | | | | 152,000 | | | $ | 3,970,290 | |
| (1) | Period from February 23, 2016 (commencement of operations) through October 31, 2016. |
6. Purchases and Sales of Investment Securities
For the year ended October 31, 2017, the aggregate cost of purchases and proceeds from sales of investment securities (excluding any short-term securities, short-term options contracts, and in-kind transactions) was as follows:
| | | | | | | | | | | | | | |
Purchases of Securities | | | Proceeds from Sales of Securities | | | Purchases of Long- Term U.S. Government Obligations | | | Proceeds from Sales of Long-Term U.S. Government Obligations | |
| $ | 8,211,104 | | | $ | 8,216,887 | | | $ | — | | | $ | — | |
For the year ended October 31, 2017, the cost of in-kind purchases and proceeds from in-kind sales, were as follows:
| | | | | | | | | | | | | | |
Purchases of Securities | | | Proceeds from Sales of Securities | | | Purchases of Long- Term U.S. Government Obligations | | | Proceeds from Sales of Long-Term U.S. Government Obligations | |
| $ | 6,541,633 | | | $ | 3,381,024 | | | $ | — | | | $ | — | |
During the year ended October 31, 2017, the Fund had net realized gain/(loss) of $762,029 from in-kind redemptions. Gains on in-kind transactions are not considered taxable for federal income tax purposes.
7. Recent Accounting Pronouncements
The Securities and Exchange Commission (“SEC”) adopted new rules as well as amendments to its rules to modernize the reporting and disclosure of information by registered investment companies. In addition, the SEC adopted amendments to Regulation S-X, which require standardized, enhanced disclosure about derivatives in investment company financial statements, as well as other amendments. The compliance date of the amendments to Regulation SX was August 1, 2017. This report incorporates the amendments to Regulation S-X.
The FASB issued Accounting Standards Update No. 2017-08, Receivables – Nonrefundable Fees and Other Costs (Subtopic 310-20), Premium Amortization on Purchased Callable Debt Securities (“ASU 2017-08”) to amend the amortization period for certain purchased callable debt securities held at a premium. The guidance requires certain premiums on callable debt securities to be amortized to the earliest call date. The amortization period for callable debt securities purchased at a discount will not be impacted. The amendments are effective for fiscal years, and interim periods within those fiscal years, beginning after December 15, 2018. Early adoption is permitted, including adoption in an interim period. Management is currently evaluating the impacts of ASU 2017-08 on the financial statements.
8. Merger Related Matters
On October 3, 2016, Janus Capital Group Inc. (“JCGI”), the direct parent of Janus Capital Management LLC, the investment adviser to the Fund (“Janus Capital”), and Henderson Group plc (“Henderson”) announced that they had entered into an Agreement and Plan of Merger (“Merger Agreement”) relating to the strategic combination of Henderson and JCGI (the “Merger”). Pursuant to the Merger Agreement, a newly formed, direct wholly-owned subsidiary of Henderson merged with and into JCGI, with JCGI as the surviving corporation and a direct wholly-owned subsidiary of Henderson.
The consummation of the Merger may have been deemed to cause an “assignment” (as defined in the Investment Company Act of 1940 Act, as amended) of the advisory agreement between the Fund and Janus Capital. As a result, the consummation of the Merger may have caused the pre-merger investment advisory agreement to terminate automatically in accordance with its terms.
Janus Henderson Small Cap Growth Alpha ETF
Notes to Financial Statements
On October 24, 2016, the Fund’s Board of Trustees approved, subject to shareholder approval, a new investment advisory agreement between the Fund and Janus Capital in order to permit Janus Capital to continue providing advisory services to the Fund following the closing of the Merger (“Post-Merger Advisory Agreement”). At the same meeting, the Trustees approved submitting the Post-Merger Advisory Agreement to Fund shareholders for approval.
On April 6, 2017, shareholders of the Fund approved the Post-Merger Advisory Agreement, which took effect upon the consummation of the Merger on May 30, 2017. In connection with the Merger, the Fund’s name was changed to Janus Henderson Small Cap Growth Alpha ETF effective June 5, 2017.
9. Subsequent Event
Management has evaluated whether any events or transactions occurred subsequent to October 31, 2017 and through the date of issuance of the Fund’s financial statements and determined that there were no material events or transactions that would require recognition or disclosure in the Fund’s financial statements.
| | |
| | Janus Detroit Street Trust ½ 25 |
Janus Henderson Small Cap Growth Alpha ETF
Additional Information (unaudited)
Proxy Voting Policies and Voting Record
A description of the policies and procedures that the Fund uses to determine how to vote proxies relating to its portfolio securities is available without charge: (i) upon request, by calling 1-800-525-0020 (toll free); (ii) on the Fund’s website at janushenderson.com/proxyvoting; and (iii) on the SEC’s website at http://www.sec.gov.
Quarterly Portfolio Holdings
The Fund files its complete portfolio holdings (schedule of investments) with the SEC for the first and third quarters of each fiscal year on Form N-Q within 60 days of the end of such fiscal quarter. The Fund’s Form N-Q: (i) is available on the SEC’s website at http://www.sec.gov; (ii) may be reviewed and copied at the SEC’s Public Reference Room in Washington, D.C. (information on the Public Reference Room may be obtained by calling 1-800-SEC-0330); and (iii) is available without charge, upon request, by calling Janus Henderson at 1-800-525-0020 (toll free).
Designation Requirements (Unaudited)
For federal income tax purposes, the Fund designated the following for the year ended October 31, 2017
| | | | |
| Dividends Received Deduction Percentage | | | 100% | |
| Qualified Dividend Income Percentage | | | 100% | |
Licensing Agreements
Janus Index & Calculation Services LLC (“Janus Index Services”) is the Index Provider for the Underlying Index. Janus Capital has entered into a license agreement with Janus Index Services to use the Underlying Index. Janus Index Services is affiliated with the Fund and Janus Capital. This affiliation may create potential conflicts for Janus Index Services as it may have an interest in the performance of the Fund, which could motivate it to alter the Underlying Index methodology for the Underlying Index. Janus Index Services has adopted procedures that it believes are reasonably designed to mitigate these and other potential conflicts.
Janus Index Services is the licensor of certain trademarks, service marks, and trade names. Neither Janus Index Services nor any of its affiliates make any representation or warranty, express or implied, to the owners of the Fund or any member of the public regarding the advisability of investing in securities generally or in the Fund particularly or the ability of the Underlying Index to track general market performance. The Underlying Index is determined, composed, and calculated by Janus Index Services without regard to Janus Capital or the Fund. Janus Index Services has no obligation to take the needs of Janus Capital or the owners of the Fund into consideration in determining, composing, or calculating the Underlying Index. Janus Index Services is not responsible for and has not participated in the determination of the timing of, prices at, or quantities of the Fund to be issued or in the determination or calculation of the equation by which the Fund is to be converted into cash.
ALTHOUGH JANUS INDEX SERVICES SHALL OBTAIN INFORMATION FOR INCLUSION IN OR FOR USE IN THE CALCULATION OF THE UNDERLYING INDEX FROM SOURCES WHICH IT CONSIDERS RELIABLE, IT DOES NOT GUARANTEE THE QUALITY, ACCURACY AND/OR THE COMPLETENESS OF THE UNDERLYING INDEX OR ANY DATA INCLUDED THEREIN AND SHALL HAVE NO LIABILITY FOR ERRORS OR OMISSIONS OF ANY KIND RELATED TO THE UNDERLYING INDEX OR DATA. JANUS INDEX SERVICES MAKES NO WARRANTY, EXPRESS OR IMPLIED, AS TO RESULTS TO BE OBTAINED BY JANUS CAPITAL, OWNERS OF THE FUND, OR ANY OTHER PERSON OR ENTITY FROM THE USE OF THE UNDERLYING INDEX OR ANY DATA INCLUDED THEREIN IN CONNECTION WITH THE RIGHTS LICENSED TO JANUS CAPITAL FOR ANY OTHER USE. JANUS INDEX SERVICES MAKES NO EXPRESS OR IMPLIED WARRANTIES, AND HEREBY EXPRESSLY DISCLAIMS ALL WARRANTIES OF MERCHANTABILITY OR FITNESS FOR A PARTICULAR PURPOSE OR USE WITH RESPECT TO THE UNDERLYING INDEX OR ANY DATA INCLUDED THEREIN. WITHOUT LIMITING ANY OF THE FOREGOING, IN NO EVENT SHALL IT HAVE ANY LIABILITY FOR ANY SPECIAL, PUNITIVE, INDIRECT, OR CONSEQUENTIAL DAMAGES (INCLUDING LOST PROFITS), EVEN IF NOTIFIED OF THE POSSIBILITY OF SUCH DAMAGES.
Janus Capital does not guarantee the accuracy and/or the completeness of the Underlying Index or any data included therein, and Janus Capital shall have no liability for any errors, omissions or interruptions therein. Janus Capital makes no warranty, express or implied, as to results to be obtained by the Fund, owners of the shares of the Fund or any other person or entity from the use of the Underlying Index or any data included therein. Janus Capital makes no express or
Janus Henderson Small Cap Growth Alpha ETF
Additional Information (unaudited)
implied warranties, and expressly disclaims all warranties of merchantability or fitness for a particular purpose or use with respect to the Underlying Index or any data included therein. Without limiting any of the foregoing, in no event shall Janus Capital have any liability for any special, punitive, direct, indirect or consequential damages (including lost profits) arising out of matters relating to the use of the Underlying Index even if notified of the possibility of such damages.
| | |
| | Janus Detroit Street Trust ½ 27 |
Janus Henderson Small Cap Growth Alpha ETF
Board Considerations Regarding Approval of Investment Advisory Agreements (unaudited)
APPROVAL OF ADVISORY AGREEMENT DURING THE PERIOD FOR JANUS SMALL CAP GROWTH ALPHA ETF AND JANUS SMALL/MID CAP GROWTH ALPHA ETF
The Trustees of Janus Detroit Street Trust (the “Trust”), the majority of whom serve as “independent” Trustees (the “Independent Trustees”) met on February 3, 2016 to consider the proposed investment management agreement (the “Investment Management Agreement”) for Janus Small Cap Growth Alpha ETF and Janus Small/Mid Cap Growth Alpha ETF (each a “New Fund” and collectively, the “New Funds”). In the course of their consideration of the Investment Management Agreement, the Trustees met in executive session and were advised by their independent counsel. In this regard, the Board, including the Independent Trustees, evaluated the terms of the Investment Management Agreement and reviewed the duties and responsibilities of the Trustees in evaluating and approving such agreements. In considering approval of the Investment Management Agreement, the Board, including the Independent Trustees, reviewed the Board Materials and other information from counsel and from Janus Capital Management LLC, the investment adviser (the “Adviser”), including: (i) a copy of the form of Investment Management Agreement, with respect to the Adviser’s management of the assets of each New Fund; (ii) information describing the nature, quality and extent of the services that the Adviser will provide to the New Fund, and the fees the Adviser will charge to the New Funds; (iii) information concerning the Adviser’s financial condition, business, operations, portfolio management teams and compliance programs; (iv) information describing each New Fund’s anticipated advisory fee and operating expenses; (v) a copy of the Adviser’s current Form ADV; and (vi) a memorandum from counsel on the responsibilities of trustees in considering investment advisory arrangements under the 1940 Act. The Board also considered presentations made by, and discussions held with, representatives of the Adviser. The Board also received information comparing the advisory fees and expenses of the New Funds to those from fund complexes that were defined as competitors.
During its review of this information, the Board focused on and analyzed the factors that the Board deemed relevant, including: the nature, extent and quality of the services to be provided to each New Fund by the Adviser; the Advisers’ personnel and operations; each New Fund’s proposed expense level; the anticipated profitability to the Adviser under the Investment Management Agreement at certain asset levels; any “fall-out” benefits to the Adviser and its affiliates (i.e., the ancillary benefits realized by the Adviser and its affiliates from the Adviser’s relationship with the Trust); the effect of asset growth on each New Fund’s expenses; and possible conflicts of interest.
The Trustees also considered benefits that accrue to the Adviser and its affiliates from their relationships with the New Funds. They recognized that an affiliate of the Adviser would separately serve the New Funds as index provider. The Trustees also concluded that, other than the services provided by the Adviser and its affiliates pursuant to the agreements and the fees to be paid by the New Funds therefor, the New Funds and the Adviser may potentially benefit from their relationship with each other in other ways. They concluded that the success of the New Funds could attract other business to the Adviser or other Janus funds, and that the success of the Adviser could enhance the Adviser’s ability to serve the New Funds.
The Board, including the Independent Trustees, considered the following in respect of each New Fund:
The nature, extent and quality of services to be provided by the Advisers; personnel and operations of the Adviser.
The Board reviewed the services that the Adviser would provide to each New Fund. In connection with the investment advisory services to be provided by the Adviser, the Board noted the responsibilities that the Adviser would have as the Funds’ investment adviser, including: the overall supervisory responsibility for the general management and investment of each New Fund’s securities portfolio; providing oversight of the investment performance and processes and compliance with the New Fund’s investment objectives, policies and limitations; the implementation of the investment management program of each New Fund; the management of the day-to-day investment and reinvestment of the assets of each New Fund; determining daily baskets of deposit securities and cash components; executing portfolio security trades for purchases and redemptions of New Fund shares conducted on a cash-in-lieu basis; the responsibility for daily monitoring of tracking error and quarterly reporting to the Board; the review of brokerage matters; the oversight of general portfolio compliance with relevant law; and the implementation of Board directives as they relate to the New Funds.
The Board reviewed the Adviser’s experience, resources and strengths in managing other pooled investment vehicles, including the Adviser’s personnel. Based on its consideration and review of the foregoing information, the Board determined that each New Fund was likely to benefit from the nature, quality and extent of these services, as well as the Adviser’s ability to render such services based on their experience, personnel, operations and resources.
Janus Henderson Small Cap Growth Alpha ETF
Board Considerations Regarding Approval of Investment Advisory Agreements (unaudited)
Comparison of services to be rendered and fees to be paid to those under other investment advisory contracts, and the cost of the services to be provided and profits to be realized by the Advisers from the relationship with the New Funds’; “fall-out” benefits.
The Board then compared both the services to be rendered and the proposed fees to be paid under other contracts of the Adviser, and under contracts of other investment advisers with respect to similar ETFs. In particular, the Board compared each New Fund’s proposed advisory fee and projected expense ratio to other investment companies considered to be in that New Fund’s peer group. With regard to each New Fund, the Board noted the following:
The Board noted that the Adviser was recommending a unitary fee that was lower than each New Fund’s respective peer group median total expense ratio.
The Board also discussed the anticipated costs and projected profitability of the Adviser in connection with its serving as investment adviser to each New Fund, including operational costs. In addition, the Board discussed the entrepreneurial risk undertaken by the Adviser in creating the Trust. After comparing each New Fund’s proposed fees with those of other funds in the New Fund’s peer group, and in light of the nature, extent and quality of services proposed to be provided by the Adviser and the costs expected to be incurred by the Adviser in rendering those services, the Board concluded that the level of fees proposed to be paid to the Adviser with respect to the New Funds were fair and reasonable.
The Board also considered that the Adviser may experience reputational “fall-out” benefits based on the success of the New Funds, but that such benefits are not easily quantifiable.
The extent to which economies of scale would be realized as the Funds grow and whether fee levels would reflect such economies of scale.
The Board next discussed potential economies of scale. Since the Trust is newly formed, the Trust and the New Funds had not commenced operations, and the eventual aggregate amount of assets was uncertain, the Adviser was not able to provide the Board New Fund specific information concerning the extent to which economies of scale would be realized as each New Fund grows and whether fee levels would reflect such economies of scale, if any. The Board recognized the uncertainty in launching a new investment product and estimating future asset levels.
Investment performance of the Funds and the Adviser.
Because each New Fund is newly formed and had not commenced operations, the Board did not consider the investment performance of the New Fund or the Adviser. The Board noted that it had received performance information of comparable operational New Funds tracking similar underlying indices.
Conclusion.
No single factor was determinative to the decision of the Board. Based on the foregoing and such other matters as were deemed relevant, the Board concluded that the proposed advisory fee rate and projected total expense ratio are reasonable in relation to the services to be provided by the Adviser to each New Fund, as well as the costs to be incurred and benefits to be gained by the Adviser in providing such services. The Board also found the proposed advisory fees to be reasonable in comparison to the fees charged by advisers to other comparable funds of similar actual or anticipated size. As a result, the Board concluded that the initial approval of the Investment Management Agreement was in the best interests of each New Fund.
After full consideration of the above factors, as well as other factors, the Trustees, including all of the independent Trustees voting separately, determined to approve the investment advisory agreement for each New Fund.
APPROVAL OF ADVISORY AGREEMENT DURING THE PERIOD WITH THE ADVISER POST-MERGER
On October 3, 2016, Janus Capital Group Inc. (“JCGI”), the direct parent of Janus Capital Management LLC, the investment adviser to the Funds (the “Adviser”), and Henderson Group plc (“Henderson”) announced that they had entered into an Agreement and Plan of Merger (“Merger Agreement”) relating to the business combination of Henderson and JCGI (the “Merger”). Pursuant to the Merger Agreement, a newly formed, direct wholly-owned subsidiary of Henderson will merge with and into JCGI, with JCGI as the surviving corporation and a direct wholly-owned subsidiary of Henderson. The Merger is expected to close in the second quarter of 2017, subject to requisite shareholder and regulatory approvals. The consummation of the Merger may be deemed to be an “assignment” (as defined in the Investment Company Act of 1940, as amended) of the advisory agreement between the Fund and Janus Capital. As a
| | |
| | Janus Detroit Street Trust ½ 29 |
Janus Henderson Small Cap Growth Alpha ETF
Board Considerations Regarding Approval of Investment Advisory Agreements (unaudited)
result, the consummation of the Merger will cause such advisory agreement to terminate automatically in accordance with its terms.
The Trustees of the Trust, the majority of whom are Independent Trustees met on October 24, 2016, and at various times in advance of that date, which meeting was called for the purpose of considering the proposed investment management agreement (the “New Investment Management Agreement”) between the Adviser as a subsidiary of Henderson following the consummation of the Merger and the following series of the Trust: Janus Small Cap Growth Alpha ETF, Janus Small/Mid Cap Growth Alpha ETF, The Organics ETF, The Long-Term Care ETF, The Obesity ETF, The Health and Fitness ETF, Janus Velocity Tail Risk Hedged Large Cap ETF and Janus Velocity Volatility Hedged Large Cap ETF (each a “Fund” and collectively, the “Funds”). The Independent Trustees met with representatives of the Adviser to discuss the anticipated effects of the Merger. During these meetings, the Adviser indicated its belief that the Merger would not adversely affect the continued operation of the Funds or the capabilities of the investment advisory personnel who currently manage the Funds to continue to provide these and other services to the Funds at the current levels. The Adviser also indicated that it believed that the Merger could provide certain benefits to the Funds but that there could be no assurance as to any particular benefits that might result.
In the course of their consideration of the New Investment Management Agreement, the Trustees met in executive session and were advised by their independent counsel. In this regard, the Board, including the Independent Trustees, evaluated the terms of the New Investment Management Agreement and reviewed the duties and responsibilities of the Trustees in evaluating and approving such agreements. In considering approval of the Investment Management Agreement, the Board, including the Independent Trustees, reviewed the board materials (the “Materials”) and other information provided in advance of the meeting from counsel, the Adviser, as well as from Henderson, including: (i) a copy of the form of New Investment Management Agreement, with respect to the Adviser’s management of the assets of each Fund; (ii) information describing the nature, quality and extent of the services that will be provided to each Fund, and the fees that will be charged to the Funds; (iii) information concerning the Adviser’s and Henderson’s financial condition, business, operations, portfolio management teams and compliance programs; (iv) information describing each Fund’s anticipated advisory fee and operating expenses; (v) information concerning the anticipated structure of the post-Merger entity (“Janus Henderson”); and (v) a memorandum from counsel on the responsibilities of trustees in considering investment advisory arrangements under the 1940 Act. The Board also considered presentations made by, and discussions held with, representatives of the Adviser. The Board also noted the information previously provided to the Board during 2016 related to the initial approvals of each Fund.
During its review of this information, the Board focused on and analyzed the factors that the Board deemed relevant, including, among other matters:
| 1) | That the material terms regarding advisory services pursuant to the New Investment Management Agreement are substantially identical to the terms of the current investment management agreement with the Adviser; |
| 2) | That there is not expected to be any diminution in the nature, extent and quality of the services provided to the Funds and their shareholders by Janus Henderson, including compliance services; |
| 3) | The commitment of the Adviser to retain key personnel currently employed by the Adviser who provide services to the Funds; |
| 4) | That the manner in which each Fund’s assets are managed would not change as a result of the Merger, and that the same portfolio managers managing each Fund’s assets are expected to continue to do so after the Merger; |
| 5) | The terms and conditions of the New Investment Management Agreement, including the current advisory fee rates and operational expenses, are the same as the current fee rates under the current investment management agreement; |
| 6) | That each Fund’s expense ratios are not expected to increase as a result of the Merger or approval of the New Investment Management Agreement; |
| 7) | That the fees and expense ratios of the Funds relative to comparable investment companies continued to be reasonable given the quality of services provided; |
| 8) | The history, reputation, qualification and background of Henderson, as well as its financial condition; |
| 9) | The reputation, financial strength, corporate structure and capital resources of Henderson and its investment advisory subsidiaries and the anticipated financial strength of Janus Henderson; |
Janus Henderson Small Cap Growth Alpha ETF
Board Considerations Regarding Approval of Investment Advisory Agreements (unaudited)
| 10) | The long-term business goals of the Adviser and Henderson with respect to the Funds; |
| 11) | That, pursuant to the terms of the Merger, Henderson has acknowledged the Advisor’s reliance upon the benefits and protections provided by Section 15(f) and has agreed not to take, and to cause its affiliates not to take, any action that would have the effect, directly or indirectly, of causing the requirements of any of the provisions of Section 15(f) not to be met in respect of the Merger; |
| 12) | That shareholders would not bear any costs in connection with the Merger, that the Adviser will bear the costs, fees and expenses incurred by the Funds in connection with the Proxy Statement, including all expenses in connection with the solicitation of proxies, the fees and expenses of attorneys relating to the Merger and Proxy Statement, and other fees and expenses incurred by the Funds, if any, in connection with the Merger; |
| 13) | The Adviser’s commitment to provide resources to the Funds and the potential for increased distribution capabilities as a result of the Merger, which have the potential to result in long-term economies of scale; and |
| 14) | That the Adviser and Henderson would derive benefits from the Merger and that, as a result, they have a different financial interest in the matters that were being considered than do Fund shareholders. |
In connection with their consideration of the New Investment Advisory Agreement on October 24 2016, the Board noted that, in February 2016, April 2016 and October 2016, the Board had initially approved the respective Funds’ current investment advisory agreements. The Trustees considered that, in connection with the foregoing approvals, the Board had determined that the Adviser had the capabilities, resources and personnel necessary to provide the services to each Fund required under the current investment advisory agreement, and the advisory fee rates paid by each Fund, taking into account the unitary fees charged to the Funds, represented reasonable compensation to the Adviser in light of the services provided. The Trustees noted that the Board also considered the cost to the Adviser of providing those services, potential economies of scale as each Fund’s assets grow, the fees and expenses paid by other comparable funds, and such other matters as the Board had considered relevant in the exercise of their reasonable business judgment.
To inform their consideration of the New Agreement, the Independent Trustees received and considered responses by the Adviser and Henderson to inquiries requesting information regarding: Henderson’s structure, operations, financial resources and key personnel; the material aspects of the Merger, the proposed operations of Janus Henderson and its compliance program, code of ethics, trading policies and key management and investment personnel, including each Fund’s portfolio managers; and anticipated changes to the management or operations of the Board and the Funds, including, if applicable, any changes to the Funds’ service providers, advisory fees and expense structure.
In considering the information and materials described above, the Independent Trustees received assistance from, and met separately with, independent legal counsel and were provided with a written description of their statutory responsibilities and the legal standards that are applicable to approvals of advisory agreements. The Board did not identify any particular information that was most relevant to its consideration to approve the New Investment Management Agreement for each Fund and each Trustee may have afforded different weight to the various factors. Legal counsel to the Independent Trustees provided the Board with a memorandum regarding its responsibilities pertaining to the approval of the New Agreement. In determining whether to approve the New Investment Management Agreement, the Board considered the best interests of each Fund separately.
In voting to approve the New Investment Management Agreement, the Board considered the overall fairness of the New Investment Management Agreement and factors it deemed relevant with respect to each Fund, including, but not limited to: (i) the nature, extent and quality of the services to be provided by Janus Henderson, (ii) that the investment personnel who currently manage the Funds would continue to manage the Funds as employees of Janus Henderson, (iii) that the fees and expenses of the Funds after the Transaction are expected to remain the same, (iv) the projected profitability of the Funds to Janus Henderson and its affiliates; (v) whether the projected economies of scale would be realized as the Funds grow and whether any breakpoints are appropriate at certain asset levels and (vi) other benefits that may accrue Janus Henderson from its relationship with the Funds. The Board also considered that the Transaction might not be consummated if the New Investment Management Agreement was not approved by the Board and the shareholders of each Fund.
Although not meant to be all-inclusive, set forth below is a description of the information and certain factors that were considered by the Board, including the Independent Trustees in deciding to approve the New Investment Management Agreement in respect of each Fund:
| | |
| | Janus Detroit Street Trust ½ 31 |
Janus Henderson Small Cap Growth Alpha ETF
Board Considerations Regarding Approval of Investment Advisory Agreements (unaudited)
The nature, extent and quality of services to be provided by Janus Henderson; personnel and operations of Janus Henderson.
In considering the nature, extent and quality of the services to be provided by Janus Henderson under the New Investment Management Agreement, the Board considered that the terms of the New Investment Management Agreement are substantially similar to the terms of the current investment management agreement. The Board considered that the level of service and manner in which each Fund’s assets are managed were expected to remain the same.
The Board considered that, for a period of time after closing, the Adviser expects that the operations of Janus Henderson, as they relate to the Funds, would be the same as those of the Adviser. The Board considered that the Adviser’s key personnel who provide services to the Funds are expected to provide those same services after the Merger. The Board also noted that the Merger is not expected to result in any change in the structure or operations of the Funds and that the Adviser does not currently anticipate any immediate changes to the Funds’ key service providers.
In evaluating Janus Henderson, the Board considered the history, background, reputation and qualification of the Adviser and Henderson, as well as their personnel and Henderson’s financial condition. The Board considered that Henderson is a global asset management firm that was established in 1934, and that it has a long history of asset management around the world. The Board also considered Henderson’s capabilities, experience, corporate structure and capital resources, as well as the Adviser’s long-term business goals with respect to the Janus Henderson Merger and the Funds.
Based on its consideration and review of the foregoing information, the Board determined that each Fund was likely to benefit from the nature, quality and extent of these services, as well as the Janus Henderson’s ability to render such services based on their experience, personnel, operations and resources.
Cost of the services to be provided and profits to be realized by Janus Henderson from the relationship with the Funds; “fall-out” benefits.
The Board noted that the unitary fee currently in place for each Fund will remain in place and unchanged under the New Investment Management Agreement.
The Board also discussed the anticipated costs and projected profitability of Janus Henderson in connection with its serving as investment adviser to each Fund, including operational costs. In addition, the Board discussed that the Funds’ expenses were not expected to increase materially as a result of the Merger. The Board also noted that Henderson does not currently provide any investment management services to other exchange traded funds. In light of the nature, extent and quality of services proposed to be provided by Janus Henderson and the costs expected to be incurred by Janus Henderson in rendering those services, the Board concluded that the level of fees proposed to be paid to Janus Henderson with respect to the Funds were fair and reasonable.
The extent to which economies of scale would be realized as the Funds grow and whether fee levels would reflect such economies of scale.
The Board next discussed potential economies of scale. The Board discussed the promised continued commitment to expand the distribution of Fund shares, and the potential for increased distribution capabilities as a result of the Merger, which have the potential to result in long-term economies of scale.
The Board also noted that since the Trust is newly formed, the eventual aggregate amount of assets was uncertain, and therefore specific information concerning the extent to which economies of scale would be realized as each Fund grows and whether fee levels would reflect such economies of scale, if any, was difficult to determine. The Board recognized the uncertainty in launching new investment products and estimating future asset levels.
Other Benefits to Janus Henderson.
The Board considered other potential benefits that may accrue to Janus Henderson as a result of its relationship with the Funds, which include reputational benefits that may enhance Janus Henderson’s ability to gain business opportunities from other clients.
Conclusion.
No single factor was determinative to the decision of the Board. Based on, but not limited to, the foregoing, and such other matters as were deemed relevant, the Board concluded that the New Investment Management Agreement was fair
Janus Henderson Small Cap Growth Alpha ETF
Board Considerations Regarding Approval of Investment Advisory Agreements (unaudited)
and reasonable in light of the services to be performed, fees, expenses and such other matters as the Board considered relevant in the exercise of its business judgment.
After full consideration of the above factors, as well as other factors, the Trustees, with the Independent Trustees voting separately, determined to approve the New Investment Management Agreement with respect to the Funds.
| | |
| | Janus Detroit Street Trust ½ 33 |
Janus Henderson Small Cap Growth Alpha ETF
Shareholder Meeting (unaudited)
A Special Meeting of Shareholders of the Fund was held on March 17, 2017 and adjourned and reconvened on April 6, 2017. At the meetings, the following matter was voted on and approved by the Shareholders. Each whole or fractional vote reported represents one whole or fractional dollar of net asset value held on the record date for the meetings. The results of the Special Meeting of Shareholders are noted below.
Proposal 1
To approve a new investment advisory agreement.
| | | | | | | | | | |
| | | | Number of Votes ($) |
| Record Date Votes ($) | | | Affirmative | | Against/Withhold | | Abstain | | Broker Non-Votes |
| | 6,270,080.000 | | | 3,118,464.640 | | 138,904.000 | | 161,966.720 | | 0.000 |
Janus Henderson Small Cap Growth Alpha ETF
Trustees and Officers (unaudited)
The Fund’s Statement of Additional Information includes additional information about the Trustees and officers and is available, without charge, by calling 1-877-335-2687.
The following are the Trustees and officers of the Trust, together with a brief description of their principal occupations during the last five years (principal occupations for certain Trustees may include periods over five years).
Each Trustee has served in that capacity since he or she was originally elected or appointed. The Trustees do not serve a specified term of office. Each Trustee will hold office until the termination of the Trust or his or her earlier death, resignation, retirement, incapacity, or removal. Under the Fund’s Governance Procedures and Guidelines, the policy is for Trustees to retire no later than the end of the calendar year in which the Trustee turns 75. The Trustees review the Fund’s Governance Procedures and Guidelines from time to time and may make changes they deem appropriate. The Fund’s Nominating and Governance Committee will consider nominees for the position of Trustee recommended by shareholders. Shareholders may submit the name of a candidate for consideration by the Committee by submitting their recommendations to the Trust’s Secretary. Each Trustee is currently a Trustee of one other registered investment company advised by Janus Capital: Clayton Street Trust. Collectively, these two registered investment companies consist of 12 series or funds.
The Trust’s officers are elected annually by the Trustees for a one-year term. Certain officers also serve as officers of Clayton Street Trust. Certain officers of the Fund may also be officers and/or directors of Janus Capital. Fund officers receive no compensation from the Fund, except for the Fund’s Chief Compliance Officer, as authorized by the Trustees.
| | | | | | | | | | | | | | | | | | |
| TRUSTEES | | | | | | | | | | | | | | |
| Name, Address, and Age | | Positions Held
with the Trust | | | Length of
Time Served | | | Principal Occupations
During the Past Five Years | | Number of
Portfolios/Funds
in Fund Complex
Overseen by
Trustee | | | Other Directorships
Held by Trustee
During the Past Five Years | |
Independent Trustees | | | | | | | | | | | | | | | | | | |
Clifford J. Weber 151 Detroit Street Denver, CO 80206 DOB: 1963 | |
| Chairman
Trustee |
| |
| 2/16-Present
2/16-Present |
| | Owner, Financial Products Consulting Group LLC (consulting services to financial institutions) (since 2015). Formerly, Executive Vice President of Global Index and Exchange- Traded Products, NYSE Market, Inc., a subsidiary of Intercontinental Exchange (ETF/ETP listing exchange) (2013-2015) and Executive Vice President and Head of Strategy and Product Development, NYSE Liffe U.S., a division of NYSE Euronext (U.S. futures exchange) (2008-2013). | | | 12 | | |
| Independent Trustee,
Clough Funds Trust
(investment company)
(since 2015);
Chairman, Clough
Funds Trust
(investment company)
(since 2017);
Independent Trustee,
Clough Dividend and
Income Fund (closed-
end fund) (since
2017); Independent
Trustee, Clough
Global Opportunities
Fund (closed-end
fund) (since 2017);
Independent Trustee,
Clough Global Equity
Fund (closed-end
fund) (since 2017);
Independent Trustee,
Elevation ETF Trust
(since 2016);
Chairman, Elevation
ETF Trust (since
2017)
|
|
| | |
| | Janus Detroit Street Trust ½ 35 |
Janus Henderson Small Cap Growth Alpha ETF
Trustees and Officers (unaudited)
| | | | | | | | | | | | | | | | | | |
| TRUSTEES | | | | | | | | | | | | | | |
| Name, Address, and Age | | Positions Held
with the Trust | | | Length of
Time Served | | | Principal Occupations
During the Past Five Years | | Number of
Portfolios/Funds
in Fund Complex
Overseen by
Trustee | | | Other Directorships
Held by Trustee
During the Past Five Years | |
| | | | | |
Maureen T. Upton 151 Detroit Street Denver, CO 80206 DOB: 1965 | | | Trustee | | | | 2/16-Present | | | Principal, Maureen Upton Ltd. (consulting services to developers of major infrastructure projects and investors) (since 2017). Formerly, Principal Consultant, SRK Consulting (U.S.), Inc. (consulting services to global mining, energy and water resource industries) (2015-2017) and Founder and Principal, Resource Initiatives LLC (sustainability consulting firm) (2006-2015). | | | 12 | | |
| Director, Denver
Metro Leadership
Foundation (non-
profit organization)
(2012-2014). |
|
Jeffrey B. Weeden 151 Detroit Street Denver, CO 80206 DOB: 1956 | | | Trustee | | | | 2/16-Present | | | Senior Advisor, BayBoston Capital LP (investment fund in banks and bank holdings companies) (since 2015). Management Advisor, BoxCast, Inc. (technology start-up company) (2014-2017). Formerly Senior Executive Vice President and Chief Financial Officer, KeyCorp (financial services) (2002-2013). | | | 12 | | |
| Director, State
Farm Bank (banking)
(since 2014). |
|
Interested Trustee | | | | | | | | | | | | | | | | | | |
Michael Drew Elder** 151 Detroit Street Denver, CO 80206 DOB: 1970 | | | Trustee | | | | 8/15-Present | | | Executive Vice President and Head of U.S. Intermediary Distribution, Janus Capital (since 2014) and President, Janus Distributors LLC (broker- dealer) (since 2014). Formerly, Senior Vice President, Janus Capital (2007-2014). | | | 12 | | |
| Director, Perkins
Investment
Management LLC
(since 2014). |
|
| ** | Michael Drew Elder is an Interested Trustee because of his employment with Janus Capital. |
Janus Henderson Small Cap Growth Alpha ETF
Trustees and Officers (unaudited)
| | | | | | |
| OFFICERS | | | | | | |
| Name, Address, and Age | | Positions Held with the Trust | | Term of Office* and
Length of Time Served | | Principal Occupations
During the Past Five Years |
Bruce L. Koepfgen 151 Detroit Street Denver, CO 80206 DOB: 1952 | | President and Chief Executive Officer | | 2/16-Present | | Head of North America for Janus Henderson Investors and Janus Capital Management (since 2017); Executive Vice President and Director of Janus International Holding LLC (since 2011); Executive Vice President of Janus Distributors LLC (since 2011); Vice President and Director of INTECH Investment Management LLC (since 2011); Executive Vice President and Director of Perkins Investment Management LLC (since 2011); and Executive Vice President and Director of Janus Management Holdings Corporation (since 2011). Formerly, President of Janus Capital Group Inc. and Janus Capital Management LLC (2013-2017); Executive Vice President of Janus Services LLC (2011-2015), Janus Capital Group Inc. and Janus Capital Management LLC (2011-2013); and Chief Financial Officer of Janus Capital Group Inc., Janus Capital Management LLC, Janus Distributors LLC, Janus Management Holdings Corporation, and Janus Services LLC (2011-2013). |
Susan K. Wold 151 Detroit Street Denver, CO 80206 DOB: 1960 | | Vice President, Chief Compliance Officer, and Anti-Money Laundering Officer | | 10/17-Present; Vice President, Provisional Chief Compliance Officer, and Anti-Money Laundering Officer (9/17-10/17) | | Senior Vice President and Head of Compliance, North America for Janus Henderson (since September 2017); Formerly, Vice President, Head of Global Corporate Compliance, and Chief Compliance Officer for Janus Capital Management (May 2017-September 2017); Vice President, Compliance at Janus Capital Group and Janus Capital Management (2005-2017). |
Jesper Nergaard 151 Detroit Street Denver, CO 80206 DOB: 1962 | | Vice President, Chief Financial Officer, Treasurer, and Principal Accounting Officer | | 2/16-Present | | Vice President of Janus Capital and Janus Services LLC. |
Kathryn L. Santoro 151 Detroit Street Denver, CO 80206 DOB: 1973 | | Vice President, Secretary and Chief Legal Counsel | | 1/17-Present | | Vice President of Janus Capital and Janus Services LLC (since 2016). Formerly, Vice President and Associate Counsel of Curian Capital, LLC and Curian Clearing LLC (2013- 2016); and General Counsel and Secretary (2011-2012) and Vice President (2009-2012) of Old Mutual Capital, Inc. |
| * | Officers are elected at least annually by the Trustees for a one-year term and may also be elected from time to time by the Trustees for an interim period. |
| | |
| | Janus Detroit Street Trust ½ 37 |
Knowledge. Shared
At Janus Henderson, we believe in the sharing of expert insight for better investment and business decisions. We call this ethos Knowledge. Shared.
Learn more by visiting janushenderson.com.
This report is submitted for the general information of shareholders of the Fund. It is not an offer or solicitation for the Fund and is not authorized for distribution to prospective investors unless preceded or accompanied by an effective prospectus.
Janus Henderson is a trademark of Janus Henderson Investors. © Janus Henderson Investors. The name Janus Henderson Investors includes HGI Group Limited, Henderson Global Investors (Brand Management) Sarl and Janus International Holding LLC.
Janus Capital Management LLC is the investment adviser and ALPS Distributors, Inc. is the distributor. ALPS is not affiliated with Janus Henderson or any of its subsidiaries.
ANNUAL REPORT
October 31, 2017
Janus Henderson Small/Mid Cap Growth Alpha ETF (formerly named Janus Small/Mid Cap Growth Alpha ETF)
Janus Detroit Street Trust

Table of Contents
Janus Henderson Small/Mid Cap Growth Alpha ETF (unaudited)
INVESTMENT OBJECTIVE
Janus Henderson Small/Mid Cap Growth Alpha ETF seeks investment results that correspond generally, before fees and expenses, to the performance of its underlying index, the Janus Small/Mid Cap Growth Alpha Index. It pursues its investment objective by using a passive index-based approach, normally investing at least 80% of its net assets in the securities that comprise its underlying index.
PERFORMANCE OVERVIEW
| • | | U.S. small- and mid-cap stocks enjoyed sharp gains during the 12-month period. President Trump’s election win and the prospect of tax cuts and de-regulation – both of which disproportionately benefit smaller U.S.-focused companies – drove stocks higher in the immediate months after the election. Signs of a healthier global economy and improving corporate earnings were also supportive of stocks. |
| • | | During the period, the Janus Henderson Small/Mid Cap Growth Alpha ETF (JSMD) returned 28.14% (based on NAV); its primary benchmark, the Janus Small/Mid Cap Growth Alpha Index, returned 28.64%, and its secondary benchmark, the Russell 2500 Growth Index, returned 30.07%. |
| • | | JSMD seeks investment results that correspond generally, before fees and expenses, to the performance of its primary benchmark. The strategy seeks to provide risk-adjusted outperformance by identifying top-tier small- and mid-cap companies with some of the strongest fundamentals that the adviser believes can deliver sustainable growth in a variety of market environments. |
| | |
| | Janus Detroit Street Trust ½ 1 |
Janus Henderson Small/Mid Cap Growth Alpha ETF (unaudited)
Fund At A Glance
October 31, 2017
| | | | |
| 5 Largest Equity Holdings – (% of Net Assets) | |
Align Technology, Inc. | | | | |
Health Care Equipment & Supplies | | | 3.4% | |
Arista Networks, Inc. | | | | |
Communications Equipment | | | 2.8% | |
VMware, Inc. | | | | |
Software | | | 2.5% | |
Sirius XM Holdings, Inc. | | | | |
Media | | | 2.2% | |
Eagle Materials, Inc. | | | | |
Building Material | | | 2.1% | |
| | | | |
| | | 13.0% | |
| | | | |
| Sector Allocation – (% of Net Assets) | |
Consumer, Non-cyclical | | | 26.5% | |
Technology | | | 19.8% | |
Consumer, Cyclical | | | 14.5% | |
Industrial | | | 13.5% | |
Communications | | | 12.4% | |
Financial | | | 10.5% | |
Investment Companies | | | 5.9% | |
Basic Materials | | | 1.4% | |
Energy | | | 1.3% | |
| | | | |
| | | 105.8% | |
Holdings are subject to change without notice.
Janus Henderson Small/Mid Cap Growth Alpha ETF (unaudited)
Performance
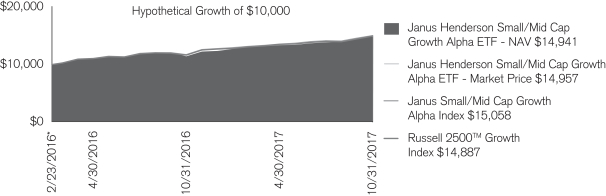
| | | | |
| Average Annual Total Return for the periods ended October 31, 2017 |
| | | One Year | | Since Inception* |
Janus Henderson Small/Mid Cap Growth Alpha ETF – NAV | | 28.14% | | 26.86% |
Janus Henderson Small/Mid Cap Growth Alpha ETF – Market Price | | 28.19% | | 26.94% |
Janus Small/Mid Cap Growth Alpha Index | | 28.64% | | 27.45% |
Russell 2500TM Growth Index | | 30.07% | | 26.59% |
Total annual expense ratio as stated in the February 28, 2017 prospectus: 0.50%.
Returns quoted are past performance and do not guarantee future results; current performance may be lower or higher. Investment returns and principal value will vary; there may be a gain or loss when shares are sold. For the most recent month-end performance call 800.668.0434 or visit janushenderson.com/performance.
Shares of ETFs are bought and sold at market price (not NAV) and are not individually redeemed from the Fund. Market returns are based upon the midpoint of the bid/ask spread at 4:00 p.m. Eastern time (when NAV is normally determined for most ETFs), and do not represent the returns you would receive if you traded shares at other times. Ordinary brokerage commissions apply and will reduce returns.
ETF shares are not individually redeemable and owners of the shares may acquire those shares from the Fund and tender those shares for redemption to the Fund in Creation Units only.
Investing involves risk, including the possible loss of principal and fluctuation of value.
Performance depends on that of the underlying index.
High absolute short-term performance is not typical and may not be achieved in the future. Such results should not be the sole basis for evaluating material facts in making an investment decision.
See the prospectus for a more complete discussion of objectives, risks and expenses.
Returns include reinvestment of dividends and capital gains. Returns greater than one year are annualized. Returns do not reflect the deduction of taxes that a shareholder would pay on Fund distributions or redemptions of Fund shares.
See Financial Highlights for actual expense ratios during the reporting period.
There is no assurance the stated objective(s) will be met.
See Notes to Schedule of Investments and Other Information for index definitions
Index performance does not reflect the expenses of managing a portfolio as an index is unmanaged and not available for direct investment.
The index provider is Janus Index and Calculation Services LLC (“Janus Index”). Janus Index maintains the indices and calculates the index levels and performance shown or discussed, but does not manage actual assets. Janus Index receives compensation in connection with licensing its indices to third parties including the provision of any related data.
Effective February 28, 2017 Edward Tom, Benjamin Wang and Scott Weiner are Co-Portfolio Managers of the Fund.
| * | The Fund commenced operations on February 23, 2016. |
| | |
| | Janus Detroit Street Trust ½ 3 |
Janus Henderson Small/Mid Cap Growth Alpha ETF (unaudited)
Disclosure of Fund Expenses
As a shareholder of the Fund, you incur two types of costs: (1) transaction costs, which may include creation and redemption fees or brokerage charges and (2) ongoing costs, including management fees and other Fund expenses. This example is intended to help you understand your ongoing costs (in dollars) of investing in the Fund and to compare these costs with the ongoing costs of investing in other ETFs. To do so, compare this 5% hypothetical example with the 5% hypothetical examples that appear in the shareholder reports of the other funds. The example is based upon an investment of $1,000 invested at the beginning of the period and held for the six-months indicated, unless noted otherwise in the table and footnotes below.
Actual Expenses
The information in the table under the heading “Actual” provides information about actual account values and actual expenses. You may use the information in these columns, together with the amount you invested, to estimate the expenses that you paid over the period. Simply divide your account value by $1,000 (for example, an $8,600 account value divided by $1,000 = 8.6), then multiply the result by the number under the heading entitled “Expenses Paid During Period” to estimate the expenses you paid on your account during the period.
Hypothetical Example for Comparison Purposes
The information in the table under the heading “Hypothetical (5% return before expenses)” provides information about hypothetical account values and hypothetical expenses based upon the Fund’s actual expense ratio and an assumed rate of return of 5% per year before expenses, which is not the Fund’s actual return. The hypothetical account values and expenses may not be used to determine the actual ending account balance or expenses you paid for the period. You may use this information to compare the ongoing costs of investing in the Fund and other funds. To do so, compare this 5% hypothetical example with the 5% hypothetical examples that appear in the shareholder reports of the other funds. Additionally, for an analysis of the fees associated with an investment or other similar funds, please visit www.finra.org/fundanalyzer.
Please note that the expenses shown in the table are meant to highlight your ongoing costs only and do not reflect any transaction costs, such as creation and redemption fees, or brokerage charges. These fees are fully described in the Fund’s prospectus. Therefore, the hypothetical examples are useful in comparing ongoing costs only, and will not help you determine the relative total costs of owning different funds. In addition, if these transaction costs were included, your costs would have been higher.
| | | | | | | | | | | | | | | | | | | | | | | | |
Actual | | | Hypothetical
(5% return before expenses) | | | | |
Beginning
Account
Value
(5/1/17) | | Ending
Account
Value
(10/31/2017) | | | Expenses
Paid During
Period
(5/1/17 - 10/31/2017)† | | | Beginning
Account
Value
(5/1/17) | | | Ending
Account
Value
(10/31/2017) | | | Expenses
Paid During
Period
(5/1/17 - 10/31/2017)† | | | Net Annualized
Expense Ratio
(5/1/17 - 10/31/2017) | |
| $1,000.00 | | $ | 1,108.50 | | | $ | 2.66 | | | $ | 1,000.00 | | | $ | 1,022.68 | | | $ | 2.55 | | | | 0.50% | |
| † | Expenses Paid During Period is equal to the Net Annualized Expense Ratio multiplied by the average account value over the period, multiplied by 184/365 (to reflect the one-half year period). |
Janus Henderson Small/Mid Cap Growth Alpha ETF
Report of Independent Registered Public Accounting Firm
To the Board of Trustees of Janus Detroit Street Trust and Shareholders of
Janus Henderson Small/Mid Cap Growth Alpha ETF:
In our opinion, the accompanying statement of assets and liabilities, including the schedule of investments, and the related statements of operations and of changes in net assets and the financial highlights present fairly, in all material respects, the financial position of the Janus Henderson Small/Mid Cap Growth Alpha ETF Fund (one of the funds constituting Janus Detroit Street Trust, hereafter referred to as the “Fund”) as of October 31, 2017, the results of its operations for the year then ended, and the changes in its net assets and financial highlights for the year then ended and for the period from February 23, 2016 (commencement of operations) through October 31, 2016, in conformity with accounting principles generally accepted in the United States of America. These financial statements and financial highlights (hereafter referred to as “financial statements”) are the responsibility of the Fund’s management. Our responsibility is to express an opinion on these financial statements based on our audits. We conducted our audits of these financial statements in accordance with the standards of the Public Company Accounting Oversight Board (United States). Those standards require that we plan and perform the audit to obtain reasonable assurance about whether the financial statements are free of material misstatement. An audit includes examining, on a test basis, evidence supporting the amounts and disclosures in the financial statements, assessing the accounting principles used and significant estimates made by management, and evaluating the overall financial statement presentation. We believe that our audits, which included confirmation of securities as of October 31, 2017 by correspondence with the custodian, brokers and transfer agent, provide a reasonable basis for our opinion.

Denver, Colorado
December 20, 2017
| | |
| | Janus Detroit Street Trust ½ 5 |
Janus Henderson Small/Mid Cap Growth Alpha ETF
Schedule of Investments
October 31, 2017
| | | | | | | | |
| | | Shares | | | Value | |
| Common Stocks – 100.0% | | | | | | |
| Aerospace & Defense – 1.7% | | | | | | |
Axon Enterprise, Inc.* | | | 2,450 | | | | $56,277 | |
HEICO Corp. | | | 3,562 | | | | 323,002 | |
| | | | | | | | |
| | | | | | | 379,279 | |
| Airlines – 2.7% | | | | | | |
Allegiant Travel Co. | | | 743 | | | | 101,345 | |
Hawaiian Holdings, Inc.* | | | 2,488 | | | | 83,348 | |
JetBlue Airways Corp.* | | | 15,268 | | | | 292,382 | |
Spirit Airlines, Inc.* | | | 3,220 | | | | 119,430 | |
| | | | | | | | |
| | | | | | | 596,505 | |
| Auto Components – 1.2% | | | | | | |
Dorman Products, Inc.* | | | 659 | | | | 45,543 | |
Fox Factory Holding Corp.* | | | 724 | | | | 30,806 | |
Gentex Corp. | | | 5,507 | | | | 106,891 | |
Gentherm, Inc.* | | | 711 | | | | 23,819 | |
LCI Industries | | | 478 | | | | 59,176 | |
| | | | | | | | |
| | | | | | | 266,235 | |
| Beverages – 0.3% | | | | | | |
National Beverage Corp. | | | 685 | | | | 67,062 | |
| Biotechnology – 2.4% | | | | | | |
Bioverativ, Inc.* | | | 4,215 | | | | 238,148 | |
MiMedx Group, Inc.*,# | | | 4,383 | | | | 55,576 | |
United Therapeutics Corp.* | | | 1,694 | | | | 200,891 | |
Xencor, Inc.* | | | 1,829 | | | | 36,178 | |
| | | | | | | | |
| | | | | | | 530,793 | |
| Building Products – 1.7% | | | | | | |
AAON, Inc. | | | 2,443 | | | | 85,505 | |
American Woodmark Corp.* | | | 756 | | | | 73,029 | |
Patrick Industries, Inc.* | | | 775 | | | | 72,075 | |
Trex Co., Inc.* | | | 1,364 | | | | 149,290 | |
| | | | | | | | |
| | | | | | | 379,899 | |
| Capital Markets – 1.5% | | | | | | |
Diamond Hill Investment Group, Inc. | | | 52 | | | | 11,020 | |
Evercore, Inc. - Class A | | | 588 | | | | 47,099 | |
FactSet Research Systems, Inc. | | | 588 | | | | 111,643 | |
Houlihan Lokey, Inc. | | | 375 | | | | 15,611 | |
MarketAxess Holdings, Inc. | | | 563 | | | | 97,962 | |
Moelis & Co. - Class A | | | 413 | | | | 17,656 | |
WisdomTree Investments, Inc.# | | | 2,062 | | | | 22,868 | |
| | | | | | | | |
| | | | | | | 323,859 | |
| Chemicals – 1.3% | | | | | | |
Chase Corp. | | | 840 | | | | 99,750 | |
GCP Applied Technologies, Inc.* | | | 6,400 | | | | 187,200 | |
| | | | | | | | |
| | | | | | | 286,950 | |
| Commercial Banks – 4.2% | | | | | | |
Allegiance Bancshares, Inc.* | | | 194 | | | | 7,605 | |
Ameris Bancorp | | | 563 | | | | 26,968 | |
Banc of California, Inc. | | | 750 | | | | 15,787 | |
Bank of the Ozarks, Inc. | | | 1,946 | | | | 90,723 | |
Bankwell Financial Group, Inc. | | | 117 | | | | 4,282 | |
Banner Corp. | | | 497 | | | | 28,488 | |
Byline Bancorp, Inc.* | | | 439 | | | | 8,802 | |
CB Financial Services, Inc. | | | 64 | | | | 1,862 | |
CenterState Bank Corp. | | | 905 | | | | 24,109 | |
Customers Bancorp, Inc.* | | | 459 | | | | 12,549 | |
Eagle Bancorp, Inc.* | | | 518 | | | | 34,525 | |
FB Financial Corp.* | | | 459 | | | | 18,759 | |
Fidelity Southern Corp. | | | 401 | | | | 8,794 | |
See Notes to Schedule of Investments and Other Information and Notes to Financial Statements.
Janus Henderson Small/Mid Cap Growth Alpha ETF
Schedule of Investments
October 31, 2017
| | | | | | | | |
| | | Shares | | | Value | |
| Common Stocks – (continued) | | | | | | |
| Commercial Banks – (continued) | | | | | | |
Franklin Financial Network, Inc.* | | | 201 | | | | $ 6,894 | |
Guaranty Bancshares, Inc. | | | 169 | | | | 4,847 | |
Hilltop Holdings, Inc. | | | 1,448 | | | | 34,115 | |
Home BancShares, Inc. | | | 2,618 | | | | 58,853 | |
Independent Bank Group, Inc. | | | 420 | | | | 26,418 | |
National Commerce Corp.* | | | 214 | | | | 8,720 | |
Nicolet Bankshares, Inc.* | | | 149 | | | | 8,484 | |
Opus Bank* | | | 518 | | | | 13,416 | |
PacWest Bancorp | | | 1,943 | | | | 93,918 | |
Paragon Commercial Corp.* | | | 85 | | | | 4,893 | |
Park Sterling Corp. | | | 801 | | | | 10,069 | |
People’s Utah Bancorp | | | 272 | | | | 8,459 | |
Pinnacle Financial Partners, Inc. | | | 1,170 | | | | 77,454 | |
ServisFirst Bancshares, Inc. | | | 795 | | | | 32,603 | |
Signature Bank* | | | 808 | | | | 105,048 | |
Sterling Bancorp | | | 2,036 | | | | 51,002 | |
Triumph Bancorp, Inc.* | | | 310 | | | | 9,610 | |
WashingtonFirst Bankshares, Inc. | | | 188 | | | | 6,569 | |
Western Alliance Bancorp* | | | 1,590 | | | | 88,722 | |
| | | | | | | | |
| | | | | | | 933,347 | |
| Commercial Services & Supplies – 4.6% | | | | | | |
Copart, Inc.* | | | 10,692 | | | | 388,012 | |
Healthcare Services Group, Inc. | | | 3,400 | | | | 179,826 | |
Hudson Technologies, Inc.* | | | 1,927 | | | | 11,408 | |
Rollins, Inc. | | | 10,123 | | | | 444,501 | |
| | | | | | | | |
| | | | | | | 1,023,747 | |
| Communications Equipment – 4.7% | | | | | | |
Acacia Communications, Inc.*,# | | | 1,655 | | | | 70,023 | |
Applied Optoelectronics, Inc.*,# | | | 814 | | | | 33,162 | |
Arista Networks, Inc.* | | | 3,057 | | | | 611,064 | |
Clearfield, Inc.* | | | 588 | | | | 8,055 | |
Finisar Corp.* | | | 4,803 | | | | 113,063 | |
Ubiquiti Networks, Inc.*,# | | | 3,387 | | | | 210,604 | |
| | | | | | | | |
| | | | | | | 1,045,971 | |
| Construction & Engineering – 1.3% | | | | | | |
Argan, Inc. | | | 717 | | | | 49,294 | |
Comfort Systems USA, Inc. | | | 1,732 | | | | 76,727 | |
Dycom Industries, Inc.* | | | 1,441 | | | | 126,563 | |
Goldfield Corp.* | | | 1,183 | | | | 6,802 | |
NV5 Global, Inc.* | | | 497 | | | | 28,876 | |
| | | | | | | | |
| | | | | | | 288,262 | |
| Construction Materials – 3.4% | | | | | | |
Eagle Materials, Inc. | | | 4,344 | | | | 458,596 | |
Summit Materials, Inc. - Class A* | | | 9,626 | | | | 302,257 | |
| | | | | | | | |
| | | | | | | 760,853 | |
| Consumer Finance – 0.4% | | | | | | |
Credit Acceptance Corp.* | | | 291 | | | | 83,438 | |
| Diversified Consumer Services – 0.4% | | | | | | |
Collectors Universe, Inc. | | | 175 | | | | 4,333 | |
Grand Canyon Education, Inc.* | | | 931 | | | | 83,334 | |
Laureate Education, Inc. - Class A* | | | 685 | | | | 9,158 | |
| | | | | | | | |
| | | | | | | 96,825 | |
| Electrical Equipment – 0.2% | | | | | | |
TPI Composites, Inc.* | | | 1,571 | | | | 39,354 | |
| Electronic Equipment & Instruments – 2.0% | | | | | | |
Airgain, Inc.* | | | 401 | | | | 3,497 | |
ePlus, Inc.* | | | 595 | | | | 56,882 | |
See Notes to Schedule of Investments and Other Information and Notes to Financial Statements.
| | |
| | Janus Detroit Street Trust ½ 7 |
Janus Henderson Small/Mid Cap Growth Alpha ETF
Schedule of Investments
October 31, 2017
| | | | | | | | |
| | | Shares | | | Value | |
| Common Stocks – (continued) | | | | | | |
| Electronic Equipment & Instruments – (continued) | | | | | | |
Kimball Electronics, Inc.* | | | 1,131 | | | | $ 24,882 | |
Methode Electronics, Inc. | | | 1,552 | | | | 72,789 | |
Universal Display Corp. | | | 1,985 | | | | 290,802 | |
| | | | | | | | |
| | | | | | | 448,852 | |
| Equity Real Estate Investment Trusts (REITs) – 1.9% | | | | | | |
Chatham Lodging Trust | | | 388 | | | | 8,439 | |
Chesapeake Lodging Trust | | | 595 | | | | 16,601 | |
CoreSite Realty Corp. | | | 336 | | | | 37,212 | |
Healthcare Trust of America, Inc. - Class A | | | 1,965 | | | | 59,048 | |
Hudson Pacific Properties, Inc. | | | 1,532 | | | | 51,812 | |
Jernigan Capital, Inc. | | | 143 | | | | 2,935 | |
Medical Properties Trust, Inc. | | | 3,569 | | | | 47,218 | |
National Health Investors, Inc. | | | 407 | | | | 31,009 | |
Pebblebrook Hotel Trust | | | 685 | | | | 24,427 | |
STORE Capital Corp. | | | 1,882 | | | | 46,467 | |
Sun Communities, Inc. | | | 782 | | | | 70,583 | |
Terreno Realty Corp. | | | 511 | | | | 18,764 | |
| | | | | | | | |
| | | | | | | 414,515 | |
| Food & Staples Retailing – 0.3% | | | | | | |
Natural Grocers by Vitamin Cottage, Inc.* | | | 330 | | | | 1,620 | |
PriceSmart, Inc. | | | 446 | | | | 37,375 | |
Sprouts Farmers Market, Inc.* | | | 1,985 | | | | 36,703 | |
| | | | | | | | |
| | | | | | | 75,698 | |
| Food Products – 1.2% | | | | | | |
Amplify Snack Brands, Inc.*,# | | | 1,124 | | | | 7,182 | |
Blue Buffalo Pet Products, Inc.* | | | 2,890 | | | | 83,608 | |
Calavo Growers, Inc. | | | 259 | | | | 19,088 | |
J&J Snack Foods Corp. | | | 272 | | | | 36,222 | |
Lamb Weston Holdings, Inc. | | | 2,139 | | | | 109,068 | |
| | | | | | | | |
| | | | | | | 255,168 | |
| Health Care Equipment & Supplies – 9.7% | | | | | | |
Abaxis, Inc. | | | 886 | | | | 42,882 | |
ABIOMED, Inc.* | | | 1,719 | | | | 331,630 | |
Align Technology, Inc.* | | | 3,122 | | | | 746,096 | |
Anika Therapeutics, Inc.* | | | 569 | | | | 31,085 | |
Cantel Medical Corp. | | | 1,629 | | | | 159,772 | |
Glaukos Corp.* | | | 1,345 | | | | 47,492 | |
Globus Medical, Inc. - Class A* | | | 2,812 | | | | 89,618 | |
Inogen, Inc.* | | | 808 | | | | 79,935 | |
LeMaitre Vascular, Inc. | | | 743 | | | | 23,783 | |
Masimo Corp.* | | | 2,023 | | | | 177,539 | |
Neogen Corp.* | | | 1,486 | | | | 119,177 | |
West Pharmaceutical Services, Inc. | | | 2,883 | | | | 292,336 | |
| | | | | | | | |
| | | | | | | 2,141,345 | |
| Health Care Providers & Services – 2.4% | | | | | | |
Acadia Healthcare Co., Inc.* | | | 3,426 | | | | 107,439 | |
Addus HomeCare Corp.* | | | 452 | | | | 16,272 | |
AMN Healthcare Services, Inc.* | | | 1,869 | | | | 82,049 | |
Digirad Corp. | | | 776 | | | | 1,552 | |
HealthEquity, Inc.* | | | 2,340 | | | | 117,515 | |
Mednax, Inc.* | | | 3,646 | | | | 159,658 | |
National Research Corp. - Class A | | | 1,041 | | | | 39,090 | |
| | | | | | | | |
| | | | | | | 523,575 | |
| Health Care Technology – 1.2% | | | | | | |
Simulations Plus, Inc. | | | 672 | | | | 10,954 | |
Veeva Systems, Inc. - Class A* | | | 4,241 | | | | 258,446 | |
| | | | | | | | |
| | | | | | | 269,400 | |
See Notes to Schedule of Investments and Other Information and Notes to Financial Statements.
Janus Henderson Small/Mid Cap Growth Alpha ETF
Schedule of Investments
October 31, 2017
| | | | | | | | |
| | | Shares | | | Value | |
| Common Stocks – (continued) | | | | | | |
| Hotels, Restaurants & Leisure – 2.5% | | | | | | |
BJ’s Restaurants, Inc.* | | | 413 | | | | $ 13,092 | |
Bojangles’, Inc.* | | | 711 | | | | 8,710 | |
Buffalo Wild Wings, Inc.* | | | 297 | | | | 35,105 | |
Cheesecake Factory, Inc. | | | 905 | | | | 40,490 | |
Chuy’s Holdings, Inc.* | | | 323 | | | | 7,268 | |
Cracker Barrel Old Country Store, Inc.# | | | 465 | | | | 72,600 | |
Dave & Buster’s Entertainment, Inc.* | | | 814 | | | | 39,235 | |
Habit Restaurants, Inc. - Class A* | | | 394 | | | | 4,846 | |
Hilton Grand Vacations, Inc.* | | | 1,914 | | | | 78,397 | |
ILG, Inc. | | | 2,411 | | | | 71,534 | |
Monarch Casino & Resort, Inc.* | | | 336 | | | | 14,989 | |
Nathan’s Famous, Inc.* | | | 78 | | | | 6,326 | |
Papa John’s International, Inc. | | | 705 | | | | 47,975 | |
Shake Shack, Inc. - Class A* | | | 504 | | | | 19,132 | |
Texas Roadhouse, Inc. | | | 1,370 | | | | 68,514 | |
Wingstop, Inc. | | | 556 | | | | 18,832 | |
| | | | | | | | |
| | | | | | | 547,045 | |
| Household Durables – 1.2% | | | | | | |
AV Homes, Inc.* | | | 433 | | | | 7,209 | |
CalAtlantic Group, Inc. | | | 2,126 | | | | 104,897 | |
Century Communities, Inc.* | | | 524 | | | | 14,960 | |
Hooker Furniture Corp. | | | 227 | | | | 10,760 | |
Installed Building Products, Inc.* | | | 614 | | | | 42,796 | |
LGI Homes, Inc.* | | | 420 | | | | 25,339 | |
M/I Homes, Inc.* | | | 484 | | | | 16,166 | |
Taylor Morrison Home Corp. - Class A* | | | 1,396 | | | | 33,713 | |
| | | | | | | | |
| | | | | | | 255,840 | |
| Insurance – 1.0% | | | | | | |
AmTrust Financial Services, Inc. | | | 2,948 | | | | 37,027 | |
First American Financial Corp. | | | 1,668 | | | | 90,773 | |
Health Insurance Innovations, Inc. - Class A* | | | 188 | | | | 4,042 | |
Heritage Insurance Holdings, Inc. | | | 439 | | | | 7,042 | |
Investors Title Co. | | | 26 | | | | 4,932 | |
Kingstone Cos., Inc. | | | 162 | | | | 2,624 | |
Kinsale Capital Group, Inc. | | | 317 | | | | 13,751 | |
National General Holdings Corp. | | | 1,610 | | | | 32,490 | |
State National Cos., Inc. | | | 634 | | | | 13,327 | |
Universal Insurance Holdings, Inc. | | | 524 | | | | 12,497 | |
| | | | | | | | |
| | | | | | | 218,505 | |
| Internet & Catalog Retail – 0.3% | | | | | | |
Duluth Holdings, Inc. - Class B* | | | 563 | | | | 11,632 | |
Liberty Expedia Holdings, Inc. - Class A* | | | 1,105 | | | | 50,940 | |
| | | | | | | | |
| | | | | | | 62,572 | |
| Internet Software & Services – 4.0% | | | | | | |
CommerceHub, Inc. - Series C* | | | 1,829 | | | | 39,013 | |
GrubHub, Inc.* | | | 3,646 | | | | 222,479 | |
GTT Communications, Inc.* | | | 1,745 | | | | 63,605 | |
j2 Global, Inc. | | | 2,036 | | | | 150,949 | |
Match Group, Inc.* | | | 2,205 | | | | 58,962 | |
NIC, Inc. | | | 2,799 | | | | 47,583 | |
Shutterstock, Inc.* | | | 1,461 | | | | 56,964 | |
Stamps.com, Inc.* | | | 711 | | | | 159,548 | |
Trade Desk, Inc. - Class A* | | | 1,216 | | | | 80,159 | |
| | | | | | | | |
| | | | | | | 879,262 | |
| IT Services – 7.8% | | | | | | |
Broadridge Financial Solutions, Inc. | | | 4,913 | | | | 422,125 | |
CSRA, Inc. | | | 6,897 | | | | 220,635 | |
EPAM Systems, Inc.* | | | 2,211 | | | | 201,533 | |
See Notes to Schedule of Investments and Other Information and Notes to Financial Statements.
| | |
| | Janus Detroit Street Trust ½ 9 |
Janus Henderson Small/Mid Cap Growth Alpha ETF
Schedule of Investments
October 31, 2017
| | | | | | | | |
| | | Shares | | | Value | |
| Common Stocks – (continued) | | | | | | |
| IT Services – (continued) | | | | | | |
Euronet Worldwide, Inc.* | | | 2,218 | | | | $ 214,348 | |
ExlService Holdings, Inc.* | | | 1,422 | | | | 88,761 | |
Jack Henry & Associates, Inc. | | | 3,265 | | | | 359,574 | |
Luxoft Holding, Inc.* | | | 931 | | | | 43,338 | |
MAXIMUS, Inc. | | | 2,734 | | | | 181,620 | |
| | | | | | | | |
| | | | | | | 1,731,934 | |
| Leisure Equipment & Products – 0.2% | | | | | | |
American Outdoor Brands Corp.* | | | 1,041 | | | | 14,917 | |
Malibu Boats, Inc. - Class A* | | | 349 | | | | 10,889 | |
MCBC Holdings, Inc.* | | | 355 | | | | 8,119 | |
| | | | | | | | |
| | | | | | | 33,925 | |
| Life Sciences Tools & Services – 2.4% | | | | | | |
Cambrex Corp.* | | | 1,274 | | | | 55,101 | |
ICON PLC* | | | 2,107 | | | | 250,438 | |
INC Research Holdings, Inc. - Class A* | | | 4,034 | | | | 230,543 | |
| | | | | | | | |
| | | | | | | 536,082 | |
| Machinery – 2.2% | | | | | | |
Greenbrier Cos., Inc. | | | 1,325 | | | | 69,165 | |
Middleby Corp.* | | | 2,676 | | | | 310,148 | |
Proto Labs, Inc.* | | | 1,235 | | | | 107,754 | |
| | | | | | | | |
| | | | | | | 487,067 | |
| Media – 3.7% | | | | | | |
AMC Networks, Inc. - Class A* | | | 1,002 | | | | 50,982 | |
Cable One, Inc. | | | 110 | | | | 78,079 | |
Nexstar Media Group, Inc. - Class A | | | 892 | | | | 56,910 | |
Scripps Networks Interactive, Inc. - Class A | | | 1,848 | | | | 153,901 | |
Sirius XM Holdings, Inc.# | | | 88,999 | | | | 484,154 | |
| | | | | | | | |
| | | | | | | 824,026 | |
| Mortgate Real Estate Investment Trusts (REITs) – 0.4% | | | | | | |
New Residential Investment Corp. | | | 4,622 | | | | 81,486 | |
Sutherland Asset Management Corp. | | | 492 | | | | 7,700 | |
| | | | | | | | |
| | | | | | | 89,186 | |
| Oil, Gas & Consumable Fuels – 1.2% | | | | | | |
Antero Midstream GP LP# | | | 3,038 | | | | 56,841 | |
Cheniere Energy Partners LP Holdings LLC | | | 3,781 | | | | 94,676 | |
DHT Holdings, Inc. | | | 2,321 | | | | 9,145 | |
Evolution Petroleum Corp. | | | 537 | | | | 3,974 | |
Rice Energy, Inc.* | | | 3,490 | | | | 98,941 | |
| | | | | | | | |
| | | | | | | 263,577 | |
| Paper & Forest Products – 0.6% | | | | | | |
Neenah Paper, Inc. | | | 1,506 | | | | 130,721 | |
| Personal Products – 0.1% | | | | | | |
Natural Health Trends Corp. | | | 169 | | | | 3,255 | |
USANA Health Sciences, Inc.* | | | 362 | | | | 23,783 | |
| | | | | | | | |
| | | | | | | 27,038 | |
| Pharmaceuticals – 1.0% | | | | | | |
Akorn, Inc.* | | | 4,867 | | | | 158,518 | |
Lannett Co., Inc.*,# | | | 1,454 | | | | 28,935 | |
Phibro Animal Health Corp. - Class A | | | 750 | | | | 28,237 | |
| | | | | | | | |
| | | | | | | 215,690 | |
| Professional Services – 0.6% | | | | | | |
Barrett Business Services, Inc. | | | 336 | | | | 20,426 | |
BG Staffing, Inc. | | | 401 | | | | 6,769 | |
TriNet Group, Inc.* | | | 3,220 | | | | 111,798 | |
| | | | | | | | |
| | | | | | | 138,993 | |
See Notes to Schedule of Investments and Other Information and Notes to Financial Statements.
Janus Henderson Small/Mid Cap Growth Alpha ETF
Schedule of Investments
October 31, 2017
| | | | | | | | |
| | | Shares | | | Value | |
| Common Stocks – (continued) | | | | | | |
| Real Estate Management & Development – 0.0% | | | | | | |
Marcus & Millichap, Inc.* | | | 375 | | | | $ 10,658 | |
| Road & Rail – 1.6% | |
AMERCO | | | 912 | | | | 358,088 | |
| Semiconductors & Semiconductor Equipment – 2.5% | |
Ambarella, Inc.* | | | 1,415 | | | | 79,863 | |
Cirrus Logic, Inc.* | | | 2,689 | | | | 150,584 | |
Ichor Holdings, Ltd.* | | | 1,060 | | | | 33,061 | |
MaxLinear, Inc.* | | | 2,805 | | | | 68,638 | |
Monolithic Power Systems, Inc. | | | 1,752 | | | | 213,166 | |
| | | | | | | | |
| | | | | | | 545,312 | |
| Software – 9.1% | | | | | | |
Barracuda Networks, Inc.* | | | 2,237 | | | | 52,144 | |
Ebix, Inc. | | | 1,325 | | | | 90,034 | |
Ellie Mae, Inc.* | | | 1,448 | | | | 130,248 | |
Globant SA* | | | 1,473 | | | | 55,561 | |
Manhattan Associates, Inc.* | | | 2,909 | | | | 121,771 | |
Paycom Software, Inc.* | | | 2,514 | | | | 206,651 | |
Pegasystems, Inc. | | | 3,278 | | | | 191,107 | |
Qualys, Inc.* | | | 1,584 | | | | 83,794 | |
Tyler Technologies, Inc.* | | | 1,571 | | | | 278,523 | |
Ultimate Software Group, Inc.* | | | 1,261 | | | | 255,466 | |
VMware, Inc. - Class A*,# | | | 4,629 | | | | 554,045 | |
| | | | | | | | |
| | | | | | | 2,019,344 | |
| Specialty Retail – 1.9% | | | | | | |
Asbury Automotive Group, Inc.* | | | 401 | | | | 24,621 | |
Boot Barn Holdings, Inc.* | | | 511 | | | | 4,206 | |
Burlington Stores, Inc.* | | | 1,332 | | | | 125,061 | |
Five Below, Inc.* | | | 1,060 | | | | 58,565 | |
Francesca’s Holdings Corp.* | | | 717 | | | | 4,639 | |
Lithia Motors, Inc. - Class A | | | 465 | | | | 52,629 | |
Michaels Cos., Inc.* | | | 3,490 | | | | 67,776 | |
Penske Automotive Group, Inc. | | | 1,661 | | | | 77,436 | |
Winmark Corp. | | | 84 | | | | 10,983 | |
| | | | | | | | |
| | | | | | | 425,916 | |
| Textiles, Apparel & Luxury Goods – 1.9% | | | | | | |
Carter’s, Inc. | | | 925 | | | | 89,475 | |
Culp, Inc. | | | 239 | | | | 7,576 | |
Michael Kors Holdings, Ltd.* | | | 2,922 | | | | 142,623 | |
Skechers U.S.A., Inc. - Class A* | | | 2,586 | | | | 82,545 | |
Superior Uniform Group, Inc. | | | 285 | | | | 6,689 | |
Under Armour, Inc. - Class A*,# | | | 7,524 | | | | 94,201 | |
| | | | | | | | |
| | | | | | | 423,109 | |
| Thrifts & Mortgage Finance – 0.6% | | | | | | |
BofI Holding, Inc.* | | | 957 | | | | 25,743 | |
Essent Group, Ltd.* | | | 1,480 | | | | 63,078 | |
FS Bancorp, Inc. | | | 45 | | | | 2,443 | |
HomeStreet, Inc.* | | | 407 | | | | 11,823 | |
NMI Holdings, Inc. - Class A* | | | 899 | | | | 13,080 | |
PennyMac Financial Services, Inc. - Class A* | | | 355 | | | | 6,745 | |
| | | | | | | | |
| | | | | | | 122,912 | |
| Trading Companies & Distributors – 2.5% | | | | | | |
Air Lease Corp. | | | 4,790 | | | | 208,125 | |
BMC Stock Holdings, Inc.* | | | 3,109 | | | | 66,688 | |
Watsco, Inc. | | | 1,661 | | | | 276,673 | |
| | | | | | | | |
| | | | | | | | 551,486 | |
Total Common Stocks (cost $19,705,610) | | | | | | | 22,129,220 | |
See Notes to Schedule of Investments and Other Information and Notes to Financial Statements.
| | |
| | Janus Detroit Street Trust ½ 11 |
Janus Henderson Small/Mid Cap Growth Alpha ETF
Schedule of Investments
October 31, 2017
| | | | | | | | |
| | | Shares | | | Value | |
| Investment Companies – 5.8% | | | | | | |
| Investments Purchased with Cash Collateral from Securities Lending – 5.8% | | | | | | |
Janus Cash Collateral Fund LLC, 1.0003%ºº,£ | | | 1,290,848 | | | | $ 1,290,848 | |
| Money Markets – 0.0% | | | | | | |
State Street Institutional U.S. Government Money Market Fund, 0.9569%ºº | | | 9,761 | | | | 9,761 | |
Total Investment Companies (cost $1,300,609) | | | | | | | 1,300,609 | |
Total Investments (total cost $21,006,219) – 105.8% | | | | | | | 23,429,829 | |
Liabilities, net of Cash, Receivables and Other Assets – (5.8%) | | | | | | | (1,291,917) | |
Net Assets – 100% | | | | | | | $22,137,912 | |
Summary of Investments by Country – (Long Positions) (unaudited)
| | | | | | | | |
| Country | | Value | | | % of
Investment
Securities | |
United States | | | $22,928,724 | | | | 97.9% | |
Ireland | | | 250,438 | | | | 1.1 | |
United Kingdom | | | 142,623 | | | | 0.6 | |
Luxembourg | | | 55,561 | | | | 0.2 | |
Switzerland | | | 43,338 | | | | 0.2 | |
Bermuda | | | 9,145 | | | | 0.0 | |
Total | | | $23,429,829 | | | | 100.0% | |
Schedules of Affiliated Investments – (% of Net Assets)
| | | | | | | | | | | | | | | | |
| | | Dividend Income | | | Realized
Gain/(Loss) | | | Change in Unrealized
Appreciation/
(Depreciation) | | | Value at
10/31/17 | |
Investment Companies – 5.8% | |
Investments Purchased with Cash Collateral from Securities Lending – 5.8% | |
Janus Cash Collateral Fund LLC, 1.0003%ºº | | | $29,568 | D | | | $ — | | | | $ — | | | | $1,290,848 | |
| | | | |
| | | Share Balance
at 10/31/16 | | | Purchases | | | Sales | | | Share Balance
at 10/31/17 | |
Investment Companies – 5.8% | |
Investments Purchased with Cash Collateral from Securities Lending – 5.8% | |
Janus Cash Collateral Fund LLC, 1.0003%ºº | | | — | | | | 7,019,307 | | | | (5,728,459) | | | | 1,290,848 | |
See Notes to Schedule of Investments and Other Information and Notes to Financial Statements.
Janus Henderson Small/Mid Cap Growth Alpha ETF
Notes to Schedule of Investments and Other Information
| | |
| Janus Small/Mid Cap Growth Alpha Index | | Janus Small/Mid Cap Growth Alpha Index is designed to systematically identify small- and mid-capitalization stocks that are poised for sustainable growth (Smart Growth®) by evaluating each company’s performance in three critical areas: growth, profitability, and capital efficiency. Janus uses a proprietary methodology to score stocks based on a wide range fundamental measures and selects the top 10% (“top-tier”) of such eligible stocks. Stocks are market cap-weighted within sectors with a 3% maximum position size; sectors are weighted to align with the Janus Henderson Triton Fund. |
| |
| Russell 2500™ Growth Index | | Russell 2500™ Growth Index reflects the performance of U.S. small to mid-cap equities with higher price-to-book ratios and higher forecasted growth values. |
| |
| LLC | | Limited Liability Company |
| |
| LP | | Limited Partnership |
| |
| PLC | | Public Limited Company |
| * | Non-income producing security. |
| # | Loaned security; a portion of the security is on loan at October 31, 2017. |
| ºº | Rate shown is the 7-day yield as of October 31, 2017. |
| £ | The Fund may invest in certain securities that are considered affiliated companies. As defined by the Investment Company Act of 1940, as amended, an affiliated company is one in which the Fund owns 5% or more of the outstanding voting securities, or a company which is under common ownership or control. |
| D | Net of income paid to the securities lending agent and rebates paid to the borrowing counterparties. |
The following is a summary of the inputs that were used to value the Fund’s investments in securities and other financial instruments as of October 31, 2017. See Notes to Financial Statements for more information.
Valuation Inputs Summary
| | | | | | | | | | | | |
| | | Level 1 -
Quoted Prices | | | Level 2 -
Other Significant
Observable Inputs | | | Level 3 -
Significant
Unobservable Inputs | |
Assets | | | | | | | | | | | | |
Investments in Securities: | | | | | | | | | | | | |
Common Stocks | | $ | 22,129,220 | | | $ | — | | | $ | — | |
Investment Companies | | | 9,761 | | | | 1,290,848 | | | | — | |
| | | | |
Total Assets | | $ | 22,138,981 | | | $ | 1,290,848 | | | $ | — | |
| | |
| | Janus Detroit Street Trust ½ 13 |
Janus Henderson Small/Mid Cap Growth Alpha ETF
Statement of Assets and Liabilities
October 31, 2017
| | | | |
Assets: | | | | |
Unaffiliated investments, at value(1)(2) | | $ | 22,138,981 | |
Affiliated investments, at value(3) | | | 1,290,848 | |
Receivables: | | | | |
Dividends | | | 2,048 | |
Affiliated securities lending income, net | | | 5,839 | |
Total Assets | | | 23,437,716 | |
Liabilities: | | | | |
Collateral on securities loaned (Note 2) | | | 1,290,848 | |
Payables: | | | | |
Investments purchased | | | 3 | |
Management fees | | | 8,953 | |
Total Liabilities | | | 1,299,804 | |
Net Assets | | $ | 22,137,912 | |
Net Assets Consists of: | | | | |
Capital (par value and paid-in surplus) | | $ | 19,754,728 | |
Undistributed net investment income/(loss) | | | 8,663 | |
Undistributed net realized gain/(loss) from investments and foreign currency transactions | | | (49,089) | |
Unrealized net appreciation/(depreciation) on investments and foreign currency translations | | | 2,423,610 | |
Total Net Assets | | $ | 22,137,912 | |
Net Assets | | $ | 22,137,912 | |
Shares outstanding, $0.001 Par Value (unlimited shares authorized) | | | 602,000 | |
Net Asset Value Per Share | | $ | 36.77 | |
| (1) | Includes cost of $19,715,371. |
| (2) | Includes $1,254,703 of securities on loan. See Note 2 in Notes to Financial Statements. |
| (3) | Includes cost of $1,290,848. |
See Notes to Financial Statements.
Janus Henderson Small/Mid Cap Growth Alpha ETF
Statement of Operations
For the year ended October 31, 2017
| | | | |
Investment Income: | |
Dividends | | $ | 104,472 | |
Affiliated securities lending income, net | | | 29,568 | |
Total Investment Income | | | 134,040 | |
Expenses: | | | | |
Management Fees | | | 82,970 | |
Total Expenses | | | 82,970 | |
Net Investment Income/(Loss) | | | 51,070 | |
Net Realized Gain/(Loss) on Investments: | | | | |
Investments and foreign currency transactions | | | 1,182,193 | |
Total Net Realized Gain/(Loss) on Investments | | | 1,182,193 | |
Change in Unrealized Net Appreciation/Depreciation: | | | | |
Investments and foreign currency translations | | | 2,633,801 | |
Total Change in Unrealized Net Appreciation/Depreciation | | | 2,633,801 | |
Net Increase/(Decrease) in Net Assets Resulting from Operations | | $ | 3,867,064 | |
See Notes to Financial Statements.
| | |
| | Janus Detroit Street Trust ½ 15 |
Janus Henderson Small/Mid Cap Growth Alpha ETF
Statements of Changes in Net Assets
| | | | | | | | |
| | | Year ended
October 31, 2017 | | | Period ended
October 31, 2016(1) | |
Operations: | | | | | | | | |
Net investment income/(loss) | | $ | 51,070 | | | $ | 34,876 | |
Net realized gain/(loss) on investments | | | 1,182,193 | | | | 439,901 | |
Change in unrealized net appreciation/depreciation | | | 2,633,801 | | | | (210,191) | |
Net Increase/(Decrease) in Net Assets Resulting from Operations | | | 3,867,064 | | | | 264,586 | |
Dividends and Distributions to Shareholders: | | | | | | | | |
Dividends from Net Investment Income | | | (65,865) | | | | (6,210) | |
Capital Share Transactions | | | 8,190,682 | | | | 9,887,655 | |
Net Increase/(Decrease) in Net Assets | | | 11,991,881 | | | | 10,146,031 | |
Net Assets: | | | | | | | | |
Beginning of period | | | 10,146,031 | | | | — | |
End of period | | $ | 22,137,912 | | | $ | 10,146,031 | |
| | |
| | | | | | | | |
Undistributed Net Investment Income/(Loss) | | $ | 8,663 | | | $ | 24,142 | |
| (1) | Period from February 23, 2016 (commencement of operations) through October 31, 2016. |
See Notes to Financial Statements.
Janus Henderson Small/Mid Cap Growth Alpha ETF
Financial Highlights
| | | | | | | | | | |
| For a share outstanding during each year or period ended October 31 | | 2017 | | | 2016(1) | |
| | Net Asset Value, Beginning of Period | | | $28.82 | | | | $24.75 | |
| | Income/(Loss) from Investment Operations: | | | | | | | | |
| | Net investment income/(loss)(2) | | | 0.10 | | | | 0.18 | |
| | Net realized and unrealized gain/(loss) | | | 7.99 | | | | 3.93 | |
| | Total from Investment Operations | | | 8.09 | | | | 4.11 | |
| | Less Dividends and Distributions: | | | | | | | | |
| | Dividends (from net investment income) | | | (0.14) | | | | (0.04) | |
| | Total Dividends and Distributions | | | (0.14) | | | | (0.04) | |
| | Net Asset Value, End of Period | | | $36.77 | | | | $28.82 | |
| | Total Return* | | | 28.14% | | | | 16.60% | |
| | Net assets, End of Period (in thousands) | | | $22,138 | | | | $10,146 | |
| | Average Net Assets for the Period (in thousands) | | | $16,594 | | | | $5,482 | |
| | Ratios to Average Net Assets**: | | | | | | | | |
| | Ratio of Gross Expenses | | | 0.50% | | | | 0.50% | |
| | Ratio of Net Investment Income/(Loss) | | | 0.31% | | | | 0.93% | |
| | Portfolio Turnover Rate(3) | | | 76% | | | | 65% | |
| * | Total return not annualized for periods of less than one full year. |
| ** | Annualized for periods of less than one full year. |
| (1) | Period from February 23, 2016 (commencement of operations) through October 31, 2016. |
| (2) | Per share amounts are calculated based on average shares outstanding during the year or period. |
| (3) | Portfolio turnover rate excludes securities received or delivered from in-kind processing of creation or redemptions. |
See Notes to Financial Statements.
| | |
| | Janus Detroit Street Trust ½ 17 |
Janus Henderson Small/Mid Cap Growth Alpha ETF
Notes to Financial Statements
1. Organization and Significant Accounting Policies
Janus Henderson Small/Mid Cap Growth Alpha ETF (the “Fund”) (formerly named Janus Small/Mid Cap Growth Alpha ETF) is a series fund. The Fund is part of Janus Detroit Street Trust (the “Trust”), which is organized as a Delaware statutory trust and is registered under the Investment Company Act of 1940, as amended (the “1940 Act”), as an open-end management investment company, and therefore has applied the specialized accounting and reporting guidance in Financial Accounting Standards Board (“FASB”) Accounting Standards Codification (“ASC”) Topic 946. The Trust offers nine Funds each of which represent shares of beneficial interest in a separate portfolio of securities and other assets with its own objective and policies. The Fund seeks investment results that correspond generally, before fees and expenses, to the performance of its underlying index, the Janus Small/Mid Cap Growth Alpha Index (the “Underlying Index”). The Fund is classified as diversified, as defined in the 1940 Act.
Unlike shares of traditional mutual funds, shares of the Fund are not individually redeemable and may only be purchased or redeemed directly from the Fund at net asset value (“NAV”) in large increments called “Creation Units” (50,000 or more shares per Creation Unit) through certain participants, known as “Authorized Participants.” The Fund will issue or redeem Creation Units in exchange for portfolio securities and/or cash. Except when aggregated in Creation Units, Fund shares are not redeemable securities of the Fund. Shares of the Fund are listed and trade on The NASDAQ Stock Market LLC (“NASDAQ”) and individual investors can purchase or sell shares in much smaller increments and for cash in the secondary market through a broker. These transactions, which do not involve the Fund, are made at market prices that may vary throughout the day and differ from the Fund’s NAV. As a result, you may pay more than NAV (at a premium) when you purchase shares, and receive less than NAV (at a discount) when you sell shares, in the secondary market.
An Authorized Participant may hold of record more than 25% of the outstanding shares of the Fund. From time to time, Authorized Participants may be a beneficial and/or legal owner of the Fund, may be affiliated with an index provider, may be deemed to have control of the Fund and/or may be able to affect the outcome of matters presented for a vote of the shareholders of the Fund. Authorized Participants may execute an irrevocable proxy granting the Distributor or an affiliate of Janus Capital Management LLC (“Janus Capital” or “Janus”) power to vote or abstain from voting such Authorized Participant’s beneficially or legally owned shares of the Fund. In such cases, the agent shall mirror vote (or abstain from voting) such shares in the same proportion as all other beneficial owners of the Fund.
The following accounting policies have been followed by the Fund and are in conformity with accounting principles generally accepted in the United States of America.
Investment Valuation
Securities held by the Fund are valued in accordance with policies and procedures established by and under the supervision of the Trustees (the “Valuation Procedures”). Equity securities, including shares of exchange-traded funds, traded on a domestic securities exchange are generally valued at the closing prices on the primary market or exchange on which they trade. If such price is lacking for the trading period immediately preceding the time of determination, such securities are valued at their current bid price. Equity securities that are traded on a foreign exchange are generally valued at the closing prices on such markets. In the event that there is no current trading volume on a particular security in such foreign exchange, the bid price from the primary exchange is generally used to value the security. Securities that are traded on the over-the-counter (“OTC”) markets are generally valued at their closing or latest bid prices as available. Foreign securities and currencies are converted to U.S. dollars using the applicable exchange rate in effect at the close of the New York Stock Exchange (“NYSE”). The Fund will determine the market value of individual securities held by it by using prices provided by one or more approved professional pricing services or, as needed, by obtaining market quotations from independent broker-dealers. Most debt securities are valued in accordance with the evaluated bid price supplied by the pricing service that is intended to reflect market value. The evaluated bid price supplied by the pricing service is an evaluation that may consider factors such as security prices, yields, maturities and ratings. Certain short-term securities maturing within 60 days or less may be evaluated and valued on an amortized cost basis provided that the amortized cost determined approximates market value. Securities for which market quotations or evaluated prices are not readily available or are deemed unreliable are valued at fair value determined in good faith under the Valuation Procedures. Circumstances in which fair value pricing may be utilized include, but are not limited to: (i) a significant event that may affect the securities of a single issuer, such as a merger, bankruptcy, or significant issuer-specific development; (ii) an event that may affect an entire market, such as a natural disaster or significant governmental action; (iii) a nonsignificant event such as a market closing early or not opening, or a security trading halt; and (iv) pricing of a nonvalued security and a restricted or nonpublic security. Special valuation considerations may apply with respect to “odd-lot” fixed-income transactions which, due to their small size, may receive evaluated prices by pricing services which reflect a large block trade and not what actually could be obtained for the odd-lot position.
Janus Henderson Small/Mid Cap Growth Alpha ETF
Notes to Financial Statements
Valuation Inputs Summary
FASB ASC 820, Fair Value Measurements and Disclosures (“ASC 820”), defines fair value, establishes a framework for measuring fair value, and expands disclosure requirements regarding fair value measurements. This standard emphasizes that fair value is a market-based measurement that should be determined based on the assumptions that market participants would use in pricing an asset or liability and establishes a hierarchy that prioritizes inputs to valuation techniques used to measure fair value. These inputs are summarized into three broad levels:
Level 1 – Unadjusted quoted prices in active markets the Fund has the ability to access for identical assets or liabilities.
Level 2 – Observable inputs other than unadjusted quoted prices included in Level 1 that are observable for the asset or liability either directly or indirectly. These inputs may include quoted prices for the identical instrument on an inactive market, prices for similar instruments, interest rates, prepayment speeds, credit risk, yield curves, default rates and similar data.
Assets or liabilities categorized as Level 2 in the hierarchy generally include: debt securities fair valued in accordance with the evaluated bid or ask prices supplied by a pricing service; securities traded on OTC markets and listed securities for which no sales are reported that are fair valued at the latest bid price (or yield equivalent thereof) obtained from one or more dealers transacting in a market for such securities or by a pricing service approved by the Fund’s Trustees; and certain short-term debt securities with maturities of 60 days or less that are fair valued at amortized cost. Other securities that may be categorized as Level 2 in the hierarchy include, but are not limited to, preferred stocks, bank loans, swaps, investments in unregistered investment companies, options, and forward contracts.
Level 3 – Unobservable inputs for the asset or liability to the extent that relevant observable inputs are not available, representing the Fund’s own assumptions about the assumptions that a market participant would use in valuing the asset or liability, and that would be based on the best information available.
There have been no significant changes in valuation techniques used in valuing any such positions held by the Fund since the beginning of the fiscal year.
The inputs or methodology used for fair valuing securities are not necessarily an indication of the risk associated with investing in those securities. The summary of inputs used as of October 31, 2017 to fair value the Fund’s investments in securities and other financial instruments is included in the “Valuation Inputs Summary” in the Notes to Schedule of Investments and Other Information.
The Fund recognizes transfers between the levels as of the beginning of the fiscal year. The following describes the amounts of transfers between Level 1, Level 2 and Level 3 of the fair value hierarchy during the year/period.
Financial assets of $6,973 were transferred out of Level 2 to Level 1 to reflect the investments unadjusted quoted price as of October 31, 2017.
Investment Transactions and Investment Income
Investment transactions are accounted for as of the date purchased or sold (trade date). Dividend income is recorded on the ex-dividend date. Certain dividends from foreign securities will be recorded as soon as the Fund is informed of the dividend, if such information is obtained subsequent to the ex-dividend date. Dividends from foreign securities may be subject to withholding taxes in foreign jurisdictions. Gains and losses are determined on the identified cost basis, which is the same basis used for federal income tax purposes.
Estimates
The preparation of financial statements in conformity with accounting principles generally accepted in the United States of America requires management to make estimates and assumptions that affect the reported amount of assets and liabilities and disclosure of contingent assets and liabilities at the date of the financial statements and the reported amounts of income and expenses during the reporting period. Actual results could differ from those estimates.
Indemnifications
In the normal course of business, the Fund may enter into contracts that contain provisions for indemnification of other parties against certain potential liabilities. The Fund’s maximum exposure under these arrangements is unknown, and would involve future claims that may be made against the Fund that have not yet occurred. Currently, the risk of material loss from such claims is considered remote.
Foreign Currency Translations
The Fund does not isolate that portion of the results of operations resulting from the effect of changes in foreign exchange rates on investments from the fluctuations arising from changes in market prices of securities held at the date
| | |
| | Janus Detroit Street Trust ½ 19 |
Janus Henderson Small/Mid Cap Growth Alpha ETF
Notes to Financial Statements
of the financial statements. Net unrealized appreciation or depreciation of investments and foreign currency translations arise from changes in the value of assets and liabilities, including investments in securities held at the date of the financial statements, resulting from changes in the exchange rates and changes in market prices of securities held.
Currency gains and losses are also calculated on payables and receivables that are denominated in foreign currencies. The payables and receivables are generally related to foreign security transactions and income translations.
Foreign currency-denominated assets and forward currency contracts may involve more risks than domestic transactions, including currency risk, counterparty risk, political and economic risk, regulatory risk and equity risk. Risks may arise from unanticipated movements in the value of foreign currencies relative to the U.S. dollar.
Dividends and Distributions
The Fund generally declares and distributes dividends of net investment income quarterly. Net realized capital gains (if any) are distributed annually. The Fund may treat a portion of the amount paid to redeem shares as a distribution of investment company taxable income and realized capital gains that are reflected in the NAV. This practice, commonly referred to as “equalization,” has no effect on the redeeming shareholder or a Fund’s total return, but may reduce the amounts that would otherwise be required to be paid as taxable dividends to the remaining shareholders. It is possible that the Internal Revenue Service (IRS) could challenge the Fund’s equalization methodology or calculations, and any such challenge could result in additional tax, interest, or penalties to be paid by the Fund.
The Fund may make certain investments in real estate investment trusts (“REITs”) which pay dividends to their shareholders based upon funds available from operations. It is quite common for these dividends to exceed the REITs’ taxable earnings and profits, resulting in the excess portion of such dividends being designated as a return of capital. If the Fund distributes such amounts, such distributions could constitute a return of capital to shareholders for federal income tax purposes.
Federal Income Taxes
The Fund intends to continue to qualify as a regulated investment company and distribute all of its taxable income in accordance with the requirements of Subchapter M of the Internal Revenue Code. Management has analyzed the Fund’s tax positions taken for all open federal income tax years, generally a three-year period, and has concluded that no provision for federal income tax is required in the Fund’s financial statements. The Fund is not aware of any tax positions for which it is reasonably possible that the total amounts of unrecognized tax benefits will significantly change in the next twelve months.
2. Other Investments and Strategies
Additional Investment Risk
The financial crisis in both the U.S. and global economies over the past several years has resulted, and may continue to result, in a significant decline in the value and liquidity of many securities of issuers worldwide in the equity and fixed income/credit markets. In response to the crisis, the United States and certain foreign governments, along with the U.S. Federal Reserve and certain foreign central banks, took steps to support the financial markets. The withdrawal of this support, a failure of measures put in place to respond to the crisis, or investor perception that such efforts were not sufficient could each negatively affect financial markets generally, and the value and liquidity of specific securities. In addition, policy and legislative changes in the United States and in other countries continue to impact many aspects of financial regulation. The effect of these changes on the markets, and the practical implications for market participants, including the Fund, may not be fully known for some time. As a result, it may also be unusually difficult to identify both investment risks and opportunities, which could limit or preclude the Fund’s ability to achieve its investment objective. Therefore, it is important to understand that the value of your investment may fall, sometimes sharply, and you could lose money.
The enactment of the Dodd-Frank Wall Street Reform and Consumer Protection Act (the “Dodd-Frank Act”) provided for widespread regulation of financial institutions, consumer financial products and services, broker-dealers, OTC derivatives, investment advisers, credit rating agencies, and mortgage lending, which expanded federal oversight in the financial sector, including the investment management industry. Certain provisions of the Dodd-Frank Act remain pending and will be implemented through future rulemaking. Therefore, the ultimate impact of the Dodd-Frank Act and the regulations under the Dodd-Frank Act on the Fund and the investment management industry as a whole, is not yet certain.
A number of countries in the European Union (“EU”) have experienced, and may continue to experience, severe economic and financial difficulties. In particular, many EU nations are susceptible to economic risks associated with high levels of debt, notably due to investments in sovereign debt of countries such as Greece, Italy, Spain, Portugal, and Ireland. Many
Janus Henderson Small/Mid Cap Growth Alpha ETF
Notes to Financial Statements
non-governmental issuers, and even certain governments, have defaulted on, or been forced to restructure, their debts. Many other issuers have faced difficulties obtaining credit or refinancing existing obligations. Financial institutions have in many cases required government or central bank support, have needed to raise capital, and/or have been impaired in their ability to extend credit. As a result, financial markets in the EU experienced extreme volatility and declines in asset values and liquidity. Responses to these financial problems by European governments, central banks, and others, including austerity measures and reforms, may not work, may result in social unrest, and may limit future growth and economic recovery or have other unintended consequences. Further defaults or restructurings by governments and others of their debt could have additional adverse effects on economies, financial markets, and asset valuations around the world. Greece, Ireland, and Portugal have already received one or more “bailouts” from other Eurozone member states, and it is unclear how much additional funding they will require or if additional Eurozone member states will require bailouts in the future. The risk of investing in securities in the European markets may also be heightened due to the referendum in which the United Kingdom voted to exit the EU (known as “Brexit”). One or more other countries may also abandon the euro and/ or withdraw from the EU, placing its currency and banking system in jeopardy.
Certain areas of the world have historically been prone to and economically sensitive to environmental events such as, but not limited to, hurricanes, earthquakes, typhoons, flooding, tidal waves, tsunamis, erupting volcanoes, wildfires or droughts, tornadoes, mudslides, or other weather-related phenomena. Such disasters, and the resulting physical or economic damage, could have a severe and negative impact on the Fund’s investment portfolio and, in the longer term, could impair the ability of issuers in which the Fund invests to conduct their businesses as they would under normal conditions. Adverse weather conditions may also have a particularly significant negative effect on issuers in the agricultural sector and on insurance companies that insure against the impact of natural disasters.
Counterparties
Fund transactions involving a counterparty are subject to the risk that the counterparty or a third party will not fulfill its obligation to the Fund (“counterparty risk”). Counterparty risk may arise because of the counterparty’s financial condition (i.e., financial difficulties, bankruptcy, or insolvency), market activities and developments, or other reasons, whether foreseen or not. A counterparty’s inability to fulfill its obligation may result in significant financial loss to the Fund. The Fund may be unable to recover its investment from the counterparty or may obtain a limited recovery, and/or recovery may be delayed. The extent of the Fund’s exposure to counterparty risk with respect to financial assets and liabilities approximates its carrying value. See the “Offsetting Assets and Liabilities” section of this Note for further details.
The Fund may be exposed to counterparty risk through participation in various programs, including, but not limited to, lending its securities to third parties, cash sweep arrangements whereby the Fund’s cash balance is invested in one or more types of cash management vehicles, as well as investments in, but not limited to, repurchase agreements, and derivatives, including various types of swaps, futures and options. The Fund intends to enter into financial transactions with counterparties that Janus Capital believes to be creditworthy at the time of the transaction. There is always the risk that Janus Capital’s analysis of a counterparty’s creditworthiness is incorrect or may change due to market conditions. To the extent that the Fund focuses its transactions with a limited number of counterparties, it will have greater exposure to the risks associated with one or more counterparties.
Offsetting Assets and Liabilities
The Fund presents gross and net information about transactions that are either offset in the financial statements or subject to an enforceable master netting arrangement or similar agreement with a designated counterparty, regardless of whether the transactions are actually offset in the Statement of Assets and Liabilities.
Deutsche Bank AG acts as securities lending agent and a limited purpose custodian or subcustodian to receive and disburse cash balances and cash collateral, hold short-term investments, hold collateral, and perform other custodian functions in accordance with the Agency Securities Lending and Repurchase Agreement. For financial reporting purposes, the Fund does not offset financial instruments’ payables and receivables and related collateral on the Statement of Assets and Liabilities. Securities on loan will be continuously secured by collateral which may consist of cash, U.S. Government securities, domestic and foreign short-term debt instruments, letters of credit, time deposits, repurchase agreements, money market mutual funds or other money market accounts, or such other collateral as permitted by the SEC. The value of the collateral must be at least 102% of the market value of the loaned securities that are denominated in U.S. dollars and 105% of the market value of the loaned securities that are not denominated in U.S. dollars. Upon receipt of cash collateral, Janus Capital intends to invest the cash collateral in a cash management vehicle for which Janus Capital serves as investment adviser, Janus Cash Collateral Fund LLC. Loaned securities and related collateral are marked-to-market each business day based upon the market value of the loaned securities at the close of business, employing the most recent available pricing information. Collateral levels are then adjusted based on this mark-to-market evaluation.
| | |
| | Janus Detroit Street Trust ½ 21 |
Janus Henderson Small/Mid Cap Growth Alpha ETF
Notes to Financial Statements
The following table presents gross amounts of recognized assets and/or liabilities and the net amounts after deducting collateral that has been pledged by counterparties or has been pledged to counterparties (if applicable). For corresponding information grouped by type of instrument, see the Fund’s Schedule of Investments.
Offsetting of Financial Assets and Derivative Assets
| | | | | | | | | | | | | | | | |
| Counterparty | | Gross Amounts
of Recognized Assets | | | Offsetting Asset
or Liability(a) | | | Collateral Pledged(b) | | | Net Amount | |
| Deutsche Bank AG | | $ | 1,254,703 | | | $ | — | | | $ | (1,254,703) | | | $ | — | |
| (a) | Represents the amount of assets or liabilities that could be offset with the same counterparty under master netting or similar agreements that management elects not to offset on the Statement of Assets and Liabilities. |
| (b) | Collateral pledged is limited to the net outstanding amount due to/from an individual counterparty. The actual collateral amounts pledged may exceed these amounts and may fluctuate in value. |
Real Estate Investing
The Fund may invest in equity securities of real estate-related companies to the extent such securities are included in the Underlying Index. Such companies may include those in the real estate industry or real estate-related industries. These securities may include common stocks, preferred stocks, and other equity securities, including, but not limited to, mortgage-backed securities, real estate-backed securities, securities of REITs and similar REIT-like entities. A REIT is a trust that invests in real estate-related projects, such as properties, mortgage loans, and construction loans. REITs are generally categorized as equity, mortgage, or hybrid REITs. A REIT may be listed on an exchange or traded OTC.
Securities Lending
Under procedures adopted by the Trustees, the Fund may seek to earn additional income by lending securities to qualified parties. Deutsche Bank AG acts as securities lending agent and a limited purpose custodian or subcustodian to receive and disburse cash balances and cash collateral, hold short-term investments, hold collateral, and perform other custodian functions. The Fund may lend portfolio securities in an amount equal to up to 1/3 of its total assets as determined at the time of the loan origination. There is the risk of delay in recovering a loaned security or the risk of loss in collateral rights if the borrower fails financially. In addition, Janus Capital makes efforts to balance the benefits and risks from granting such loans. All loans will be continuously secured by collateral which may consist of cash, U.S. Government securities, domestic and foreign short-term debt instruments, letters of credit, time deposits, repurchase agreements, money market mutual funds or other money market accounts, or such other collateral as permitted by the SEC. If the Fund is unable to recover a security on loan, the Fund may use the collateral to purchase replacement securities in the market. There is a risk that the value of the collateral could decrease below the cost of the replacement security by the time the replacement investment is made, resulting in a loss to the Fund.
Upon receipt of cash collateral, Janus Capital may invest it in affiliated or non-affiliated cash management vehicles, whether registered or unregistered entities, as permitted by the 1940 Act and rules promulgated thereunder. Janus Capital currently intends to invest the cash collateral in a cash management vehicle for which Janus Capital serves as investment adviser, Janus Cash Collateral Fund LLC. An investment in Janus Cash Collateral Fund LLC is generally subject to the same risks that shareholders experience when investing in similarly structured vehicles, such as the potential for significant fluctuations in assets as a result of the purchase and redemption activity of the securities lending program, a decline in the value of the collateral, and possible liquidity issues. Such risks may delay the return of the cash collateral and cause the Fund to violate its agreement to return the cash collateral to a borrower in a timely manner. As adviser to the Fund and Janus Cash Collateral Fund LLC, Janus Capital has an inherent conflict of interest as a result of its fiduciary duties to both the Fund and Janus Cash Collateral Fund LLC. Additionally, Janus Capital receives an investment advisory fee of 0.05% for managing Janus Cash Collateral Fund LLC, but it may not receive a fee for managing certain other affiliated cash management vehicles in which the Fund may invest, and therefore may have an incentive to allocate preferred investment opportunities to investment vehicles for which it is receiving a fee.
The value of the collateral must be at least 102% of the market value of the loaned securities that are denominated in U.S. dollars and 105% of the market value of the loaned securities that are not denominated in U.S. dollars. Loaned
securities and related collateral are marked-to-market each business day based upon the market value of the loaned securities at the close of business, employing the most recent available pricing information. Collateral levels are then adjusted based on this mark-to-market evaluation.
Janus Henderson Small/Mid Cap Growth Alpha ETF
Notes to Financial Statements
The cash collateral invested by Janus Capital is disclosed in the Schedule of Investments (if applicable). Income earned from the investment of the cash collateral, net of rebates paid to, or fees paid by, borrowers and less the fees paid to the lending agent are included as “Affiliated securities lending income, net” on the Statement of Operations. As of October 31, 2017, securities lending transactions accounted for as secured borrowings with an overnight and continuous contractual maturity are $1,254,703 for equity securities. Gross amounts of recognized liabilities for securities lending (collateral received) as of October 31, 2017 is $1,290,848, resulting in the net amount due to the counterparty of $36,145.
3. Investment Advisory Agreements and Other Transactions with Affiliates
Under its unitary fee structure, the Fund pays Janus Capital a management fee in return for providing certain investment advisory, supervisory, and administrative services to the Fund, including the costs of transfer agency, custody, fund administration, legal, audit, and other services. Janus Capital’s fee structure is designed to pay substantially all of the Fund’s expenses. However, the Fund bears other expenses which are not covered under the management fee which may vary and affect the total level of expenses paid by shareholders, such as distribution fees (if any), brokerage expenses or commissions, interest, dividends, taxes, litigation expenses, acquired fund fees and expenses (if any), and extraordinary expenses. The Fund’s management fee is calculated daily and paid monthly. The Fund’s contractual management fee rate (expressed as an annual rate) is 0.50% of the Fund’s average daily net assets.
State Street Bank and Trust Company (“State Street”) provides certain fund administration services to the Fund, including services related to the Fund’s accounting, including calculating the daily NAV, audit, tax, and reporting obligations, pursuant to an agreement with Janus Capital, on behalf of the Fund. As compensation for such services, Janus Capital pays State Street a fee based on a percentage of the Fund’s assets, with a minimum flat fee, for certain services. Janus Capital serves as administrator to the Fund, providing oversight and coordination of the Fund’s service providers, recordkeeping and other administrative services. Janus Capital does not receive any additional compensation, beyond the unitary fee, for serving as administrator. State Street also serves as transfer agent for the shares of the Fund.
The Trust has adopted a Distribution and Servicing Plan for shares of the Fund pursuant to Rule 12b-1 under the 1940 Act (the “Plan”). The Plan permits compensation in connection with the distribution and marketing of Fund shares and/or the provision of certain shareholder services. The Plan permits the Fund to pay ALPS Distributors, Inc. (the “Distributor”) or its designee, a fee for the sale and distribution and/or shareholder servicing of the shares at an annual rate of up to 0.25% of average daily net assets of the Fund. However, the Trustees have determined not to authorize payment under this Plan at this time. Under the terms of the Plan, the Trust is authorized to make payments to the Distributor or its designee for remittance to retirement plan service providers, broker-dealers, bank trust departments, financial advisors, and other financial intermediaries, as compensation for distribution and/or shareholder services performed by such entities for their customers who are investors in the Fund. The 12b-1 fee may only be imposed or increased when the Trustees determine that it is in the best interests of shareholders to do so. Because these fees are paid out of the Fund’s assets on an ongoing basis, to the extent that a fee is authorized, over time they will increase the cost of an investment in the Fund. The Plan fee may cost an investor more than other types of sales charges.
As of October 31, 2017, Janus Capital owned 2,000 shares or 0.33% of the Fund.
The Fund is permitted to purchase or sell securities (“cross-trade”) between itself and other funds or accounts managed by Janus Capital in accordance with Rule 17a-7 under the Investment Company Act of 1940 (“Rule 17a-7”), when the transaction is consistent with the investment objectives and policies of the Fund and in accordance with the Internal Cross Trade Procedures adopted by the Trust’s Board of Trustees. These procedures have been designed to ensure that any cross-trade of securities by the Fund from or to another fund or account that is or could be considered an affiliate of the Fund under certain limited circumstances by virtue of having a common investment adviser, common Officer, or common Trustee complies with Rule 17a-7. Under these procedures, each cross-trade is effected at the current market price to save costs where allowed. During the year ended October 31, 2017, the Fund engaged in cross trades amounting to $558,635 in purchases and $245,519 in sales, resulting in a net realized loss of $(3,146). The net realized loss is included within the “Net Realized Gain/(Loss) on Investments” section of the Fund’s Statement of Operations.
4. Federal Income Tax
The tax components of capital shown in the table below represent: (1) distribution requirements the Fund must satisfy under the income tax regulations; (2) losses or deductions the Fund may be able to offset against income and gains realized in future years; and (3) unrealized appreciation or depreciation of investments for federal income tax purposes.
Other book to tax differences primarily consist of deferred compensation, derivatives, and foreign currency contract adjustments. The Fund has elected to treat gains and losses on forward foreign currency contracts as capital gains and
| | |
| | Janus Detroit Street Trust ½ 23 |
Janus Henderson Small/Mid Cap Growth Alpha ETF
Notes to Financial Statements
losses, if applicable. Other foreign currency gains and losses on debt instruments are treated as ordinary income for federal income tax purposes pursuant to Section 988 of the Internal Revenue Code.
| | | | | | | | | | | | | | | | | | | | | | | | | | |
| | | | | | | | | | Loss Deferrals | | | | | | | |
Undistributed
Ordinary Income | | | Undistributed
Long-Term Gains | | | Accumulated
Capital Losses | | | Late-Year
Ordinary Loss | | | Post-October
Capital Loss | | | Other Book
to Tax Differences | | | Net Tax Appreciation/ (Depreciation) | |
| $ | 8,663 | | | $ | — | | | $ | (36,004) | | | $ | — | | | $ | — | | | $ | — | | | $ | 2,410,525 | |
Accumulated capital losses noted below represent net capital loss carryovers, as of October 31, 2017, that may be available to offset future realized capital gains and thereby reduce future taxable gains distributions. The following table shows these capital loss carryovers.
| | | | | | | | | | |
Capital Loss Carryover Schedule
For the year ended October 31, 2017
No Expiration | | | Accumulated Capital Losses | |
| Short-Term | | | Long-Term | | |
| $ | (27,676) | | | $ | (8,328) | | | $ | (36,004) | |
During the year ended ended October 31, 2017, capital loss carryovers of $41,365 were utilized by the Fund.
The aggregate cost of investments and the composition of unrealized appreciation and depreciation of investment securities for federal income tax purposes as of October 31, 2017 are noted below. The primary difference between book and tax appreciation or depreciation of investments is wash sale loss deferrals.
| | | | | | | | | | | | | | |
| Federal Tax Cost | | | Unrealized Appreciation | | | Unrealized (Depreciation) | | | Net Tax Appreciation/
(Depreciation) | |
| $ | 21,019,304 | | | $ | 2,942,677 | | | $ | (532,152) | | | $ | 2,410,525 | |
Income and capital gains distributions are determined in accordance with income tax regulations that may differ from accounting principles generally accepted in the United States of America. These differences are due to differing treatments for items such as net short-term gains, deferral of wash sale losses, foreign currency transactions, passive foreign investment companies, net investment losses, in-kind transactions, and capital loss carryovers. Certain permanent differences such as tax returns of capital and net investment losses noted below have
been reclassified to capital.
| | | | | | | | | | | | | | |
| For the year ended October 31, 2017 | |
| Distributions | | | | |
| From Ordinary Income | | | From Long-Term Capital Gains | | | Tax Return of Capital | | | Net Investment Loss | |
| $ | 65,865 | | | $ | — | | | $ | — | | | $ | — | |
|
| For the period ended October 31, 2016 | |
| Distributions | | | | |
| From Ordinary Income | | | From Long-Term Capital Gains | | | Tax Return of Capital | | | Net Investment Loss | |
| $ | 6,210 | | | $ | — | | | $ | — | | | $ | — | |
Permanent book to tax basis differences may result in reclassifications between the components of net assets. These differences have no impact on the results of operations or net assets. The following reclassifications have been made to the Fund:
| | | | | | | | | | |
| Increase/(Decrease) to Capital | | | Increase/(Decrease) to Undistributed
Net Investment Income/Loss | | | Increase/(Decrease) to Undistributed
Net realized Gain/Loss | |
| $ | 1,154,931 | | | $ | (684) | | | $ | (1,154,247) | |
Janus Henderson Small/Mid Cap Growth Alpha ETF
Notes to Financial Statements
5. Capital Share Transactions
| | | | | | | | | | | | | | | | |
| | | Year ended October 31, 2017 | | | Period ended October 31, 2016(1) | |
| | | Shares | | | Amount | | | Shares | | | Amount | |
| Shares sold | | | 350,000 | | | $ | 11,660,083 | | | | 502,000 | | | $ | 14,075,370 | |
| Shares repurchased | | | (100,000) | | | | (3,469,401) | | | | (150,000) | | | | (4,187,715) | |
Net Increase/(Decrease) | | | 250,000 | | | $ | 8,190,682 | | | | 352,000 | | | $ | 9,887,655 | |
| (1) | Period from February 23, 2016 (commencement of operations) through October 31, 2016. |
6. Purchases and Sales of Investment Securities
For the year ended October 31, 2017, the aggregate cost of purchases and proceeds from sales of investment securities (excluding any short-term securities, short-term options contracts, and in-kind transactions) was as follows:
| | | | | | | | | | | | | | |
Purchases of Securities | | | Proceeds from Sales of Securities | | | Purchases of Long- Term U.S. Government Obligations | | | Proceeds from Sales of Long-Term U.S. Government Obligations | |
| $ | 12,625,952 | | | $ | 12,627,339 | | | $ | — | | | $ | — | |
For the year ended October 31, 2017, the cost of in-kind purchases and proceeds from in-kind sales, were as follows:
| | | | | | | | | | | | | | |
Purchases of Securities | | | Proceeds from Sales of Securities | | | Purchases of Long- Term U.S. Government Obligations | | | Proceeds from Sales of Long-Term U.S. Government Obligations | |
| $ | 11,649,999 | | | $ | 3,461,168 | | | $ | — | | | $ | — | |
During the period ended October 31, 2017, the Fund had net realized gain/(loss) of $1,155,669 from in-kind redemptions. Gains on in-kind transactions are not considered taxable for federal income tax purposes.
7. Recent Accounting Pronouncements
The Securities and Exchange Commission (“SEC”) adopted new rules as well as amendments to its rules to modernize the reporting and disclosure of information by registered investment companies. In addition, the SEC adopted amendments to Regulation S-X, which require standardized, enhanced disclosure about derivatives in investment company financial statements, as well as other amendments. The compliance date of the amendments to Regulation SX was August 1, 2017. This report incorporates the amendments to Regulation S-X.
The FASB issued Accounting Standards Update No. 2017-08, Receivables – Nonrefundable Fees and Other Costs (Subtopic 310-20), Premium Amortization on Purchased Callable Debt Securities (“ASU 2017-08”) to amend the amortization period for certain purchased callable debt securities held at a premium. The guidance requires certain premiums on callable debt securities to be amortized to the earliest call date. The amortization period for callable debt securities purchased at a discount will not be impacted. The amendments are effective for fiscal years, and interim periods within those fiscal years, beginning after December 15, 2018. Early adoption is permitted, including adoption in an interim period. Management is currently evaluating the impacts of ASU 2017-08 on the financial statements.
8. Merger Related Matters
On October 3, 2016, Janus Capital Group Inc. (“JCGI”), the direct parent of Janus Capital Management LLC, the investment adviser to the Fund (“Janus Capital”), and Henderson Group plc (“Henderson”) announced that they had entered into an Agreement and Plan of Merger (“Merger Agreement”) relating to the strategic combination of Henderson and JCGI (the “Merger”). Pursuant to the Merger Agreement, a newly formed, direct wholly-owned subsidiary of Henderson merged with and into JCGI, with JCGI as the surviving corporation and a direct wholly-owned subsidiary of Henderson.
The consummation of the Merger may have been deemed to cause an “assignment” (as defined in the Investment Company Act of 1940 Act, as amended) of the advisory agreement between the Fund and Janus Capital. As a result, the consummation of the Merger may have caused the pre-merger investment advisory agreement to terminate automatically in accordance with its terms.
| | |
| | Janus Detroit Street Trust ½ 25 |
Janus Henderson Small/Mid Cap Growth Alpha ETF
Notes to Financial Statements
On October 24, 2016, the Fund’s Board of Trustees approved, subject to shareholder approval, a new investment advisory agreement between the Fund and Janus Capital in order to permit Janus Capital to continue providing advisory services to the Fund following the closing of the Merger (“Post-Merger Advisory Agreement”). At the same meeting, the Trustees approved submitting the Post-Merger Advisory Agreement to Fund shareholders for approval.
On April 6, 2017, shareholders of the Fund approved the Post-Merger Advisory Agreement, which took effect upon the consummation of the Merger on May 30, 2017. In connection with the Merger, the Fund’s name was changed to Janus Henderson Small/Mid Cap Growth Alpha ETF effective June 5, 2017.
9. Subsequent Event
Management has evaluated whether any events or transactions occurred subsequent to October 31, 2017 and through the date of issuance of the Fund’s financial statements and determined that there were no material events or transactions that would require recognition or disclosure in the Fund’s financial statements.
Janus Henderson Small/Mid Cap Growth Alpha ETF
Additional Information (unaudited)
Proxy Voting Policies and Voting Record
A description of the policies and procedures that the Fund uses to determine how to vote proxies relating to its portfolio securities is available without charge: (i) upon request, by calling 1-800-525-0020 (toll free); (ii) on the Fund’s website at janushenderson.com/proxyvoting; and (iii) on the SEC’s website at http://www.sec.gov.
Quarterly Portfolio Holdings
The Fund files its complete portfolio holdings (schedule of investments) with the SEC for the first and third quarters of each fiscal year on Form N-Q within 60 days of the end of such fiscal quarter. The Fund’s Form N-Q: (i) is available on the SEC’s website at http://www.sec.gov; (ii) may be reviewed and copied at the SEC’s Public Reference Room in Washington, D.C. (information on the Public Reference Room may be obtained by calling 1-800-SEC-0330); and (iii) is available without charge, upon request, by calling Janus Henderson at 1-800-525-0020 (toll free).
Designation Requirements (unaudited)
For federal income tax purposes, the Fund designated the following for the year ended October 31, 2017
| | | | |
Dividends Received Deduction Percentage | | | 100% | |
Qualified Dividend Income Percentage | | | 100% | |
Licensing Agreements
Janus Index & Calculation Services LLC (“Janus Index Services”) is the Index Provider for the Underlying Index. Janus Capital has entered into a license agreement with Janus Index Services to use the Underlying Index. Janus Index Services is affiliated with the Fund and Janus Capital. This affiliation may create potential conflicts for Janus Index Services as it may have an interest in the performance of the Fund, which could motivate it to alter the Underlying Index methodology for the Underlying Index. Janus Index Services has adopted procedures that it believes are reasonably designed to mitigate these and other potential conflicts.
Janus Index Services is the licensor of certain trademarks, service marks, and trade names. Neither Janus Index Services nor any of its affiliates make any representation or warranty, express or implied, to the owners of the Fund or any member of the public regarding the advisability of investing in securities generally or in the Fund particularly or the ability of the Underlying Index to track general market performance. The Underlying Index is determined, composed, and calculated by Janus Index Services without regard to Janus Capital or the Fund. Janus Index Services has no obligation to take the needs of Janus Capital or the owners of the Fund into consideration in determining, composing, or calculating the Underlying Index. Janus Index Services is not responsible for and has not participated in the determination of the timing of, prices at, or quantities of the Fund to be issued or in the determination or calculation of the equation by which the Fund is to be converted into cash.
ALTHOUGH JANUS INDEX SERVICES SHALL OBTAIN INFORMATION FOR INCLUSION IN OR FOR USE IN THE CALCULATION OF THE UNDERLYING INDEX FROM SOURCES WHICH IT CONSIDERS RELIABLE, IT DOES NOT GUARANTEE THE QUALITY, ACCURACY AND/OR THE COMPLETENESS OF THE UNDERLYING INDEX OR ANY DATA INCLUDED THEREIN AND SHALL HAVE NO LIABILITY FOR ERRORS OR OMISSIONS OF ANY KIND RELATED TO THE UNDERLYING INDEX OR DATA. JANUS INDEX SERVICES MAKES NO WARRANTY, EXPRESS OR IMPLIED, AS TO RESULTS TO BE OBTAINED BY JANUS CAPITAL, OWNERS OF THE FUND, OR ANY OTHER PERSON OR ENTITY FROM THE USE OF THE UNDERLYING INDEX OR ANY DATA INCLUDED THEREIN IN CONNECTION WITH THE RIGHTS LICENSED TO JANUS CAPITAL FOR ANY OTHER USE. JANUS INDEX SERVICES MAKES NO EXPRESS OR IMPLIED WARRANTIES, AND HEREBY EXPRESSLY DISCLAIMS ALL WARRANTIES OF MERCHANTABILITY OR FITNESS FOR A PARTICULAR PURPOSE OR USE WITH RESPECT TO THE UNDERLYING INDEX OR ANY DATA INCLUDED THEREIN. WITHOUT LIMITING ANY OF THE FOREGOING, IN NO EVENT SHALL IT HAVE ANY LIABILITY FOR ANY SPECIAL, PUNITIVE, INDIRECT, OR CONSEQUENTIAL DAMAGES (INCLUDING LOST PROFITS), EVEN IF NOTIFIED OF THE POSSIBILITY OF SUCH DAMAGES.
Janus Capital does not guarantee the accuracy and/or the completeness of the Underlying Index or any data included therein, and Janus Capital shall have no liability for any errors, omissions or interruptions therein. Janus Capital makes no warranty, express or implied, as to results to be obtained by the Fund, owners of the shares of the Fund or any other person or entity from the use of the Underlying Index or any data included therein. Janus Capital makes no express or implied warranties, and expressly disclaims all warranties of merchantability or fitness for a particular purpose or use with respect to the Underlying Index or any data included therein. Without limiting any of the foregoing, in no event shall Janus Capital have any liability for any special, punitive, direct, indirect or consequential damages (including lost profits) arising out of matters relating to the use of the Underlying Index even if notified of the possibility of such damages.
| | |
| | Janus Detroit Street Trust ½ 27 |
Janus Henderson Small/Mid Cap Growth Alpha ETF
Board Considerations Regarding Approval of Investment Advisory Agreements (unaudited)
APPROVAL OF ADVISORY AGREEMENT DURING THE PERIOD FOR JANUS SMALL CAP GROWTH ALPHA ETF AND JANUS SMALL/MID CAP GROWTH ALPHA ETF
The Trustees of Janus Detroit Street Trust (the “Trust”), the majority of whom serve as “independent” Trustees (the “Independent Trustees”) met on February 3, 2016 to consider the proposed investment management agreement (the “Investment Management Agreement”) for Janus Small Cap Growth Alpha ETF and Janus Small/Mid Cap Growth Alpha ETF (each a “New Fund” and collectively, the “New Funds”). In the course of their consideration of the Investment Management Agreement, the Trustees met in executive session and were advised by their independent counsel. In this regard, the Board, including the Independent Trustees, evaluated the terms of the Investment Management Agreement and reviewed the duties and responsibilities of the Trustees in evaluating and approving such agreements. In considering approval of the Investment Management Agreement, the Board, including the Independent Trustees, reviewed the Board Materials and other information from counsel and from Janus Capital Management LLC, the investment adviser (the “Adviser”), including: (i) a copy of the form of Investment Management Agreement, with respect to the Adviser’s management of the assets of each New Fund; (ii) information describing the nature, quality and extent of the services that the Adviser will provide to the New Fund, and the fees the Adviser will charge to the New Funds; (iii) information concerning the Adviser’s financial condition, business, operations, portfolio management teams and compliance programs; (iv) information describing each New Fund’s anticipated advisory fee and operating expenses; (v) a copy of the Adviser’s current Form ADV; and (vi) a memorandum from counsel on the responsibilities of trustees in considering investment advisory arrangements under the 1940 Act. The Board also considered presentations made by, and discussions held with, representatives of the Adviser. The Board also received information comparing the advisory fees and expenses of the New Funds to those from fund complexes that were defined as competitors.
During its review of this information, the Board focused on and analyzed the factors that the Board deemed relevant, including: the nature, extent and quality of the services to be provided to each New Fund by the Adviser; the Advisers’ personnel and operations; each New Fund’s proposed expense level; the anticipated profitability to the Adviser under the Investment Management Agreement at certain asset levels; any “fall-out” benefits to the Adviser and its affiliates (i.e., the ancillary benefits realized by the Adviser and its affiliates from the Adviser’s relationship with the Trust); the effect of asset growth on each New Fund’s expenses; and possible conflicts of interest.
The Trustees also considered benefits that accrue to the Adviser and its affiliates from their relationships with the New Funds. They recognized that an affiliate of the Adviser would separately serve the New Funds as index provider. The Trustees also concluded that, other than the services provided by the Adviser and its affiliates pursuant to the agreements and the fees to be paid by the New Funds therefor, the New Funds and the Adviser may potentially benefit from their relationship with each other in other ways. They concluded that the success of the New Funds could attract other business to the Adviser or other Janus funds, and that the success of the Adviser could enhance the Adviser’s ability to serve the New Funds.
The Board, including the Independent Trustees, considered the following in respect of each New Fund:
The nature, extent and quality of services to be provided by the Advisers; personnel and operations of the Adviser.
The Board reviewed the services that the Adviser would provide to each New Fund. In connection with the investment advisory services to be provided by the Adviser, the Board noted the responsibilities that the Adviser would have as the Funds’ investment adviser, including: the overall supervisory responsibility for the general management and investment of each New Fund’s securities portfolio; providing oversight of the investment performance and processes and compliance with the New Fund’s investment objectives, policies and limitations; the implementation of the investment management program of each New Fund; the management of the day-to-day investment and reinvestment of the assets of each New Fund; determining daily baskets of deposit securities and cash components; executing portfolio security trades for purchases and redemptions of New Fund shares conducted on a cash-in-lieu basis; the responsibility for daily monitoring of tracking error and quarterly reporting to the Board; the review of brokerage matters; the oversight of general portfolio compliance with relevant law; and the implementation of Board directives as they relate to the New Funds.
The Board reviewed the Adviser’s experience, resources and strengths in managing other pooled investment vehicles, including the Adviser’s personnel. Based on its consideration and review of the foregoing information, the Board determined that each New Fund was likely to benefit from the nature, quality and extent of these services, as well as the Adviser’s ability to render such services based on their experience, personnel, operations and resources.
Janus Henderson Small/Mid Cap Growth Alpha ETF
Board Considerations Regarding Approval of Investment Advisory Agreements (unaudited)
Comparison of services to be rendered and fees to be paid to those under other investment advisory contracts, and the cost of the services to be provided and profits to be realized by the Advisers from the relationship with the New Funds’; “fall-out” benefits.
The Board then compared both the services to be rendered and the proposed fees to be paid under other contracts of the Adviser, and under contracts of other investment advisers with respect to similar ETFs. In particular, the Board compared each New Fund’s proposed advisory fee and projected expense ratio to other investment companies considered to be in that New Fund’s peer group. With regard to each New Fund, the Board noted the following:
The Board noted that the Adviser was recommending a unitary fee that was lower than each New Fund’s respective peer group median total expense ratio.
The Board also discussed the anticipated costs and projected profitability of the Adviser in connection with its serving as investment adviser to each New Fund, including operational costs. In addition, the Board discussed the entrepreneurial risk undertaken by the Adviser in creating the Trust. After comparing each New Fund’s proposed fees with those of other funds in the New Fund’s peer group, and in light of the nature, extent and quality of services proposed to be provided by the Adviser and the costs expected to be incurred by the Adviser in rendering those services, the Board concluded that the level of fees proposed to be paid to the Adviser with respect to the New Funds were fair and reasonable.
The Board also considered that the Adviser may experience reputational “fall-out” benefits based on the success of the New Funds, but that such benefits are not easily quantifiable.
The extent to which economies of scale would be realized as the Funds grow and whether fee levels would reflect such economies of scale.
The Board next discussed potential economies of scale. Since the Trust is newly formed, the Trust and the New Funds had not commenced operations, and the eventual aggregate amount of assets was uncertain, the Adviser was not able to provide the Board New Fund specific information concerning the extent to which economies of scale would be realized as each New Fund grows and whether fee levels would reflect such economies of scale, if any. The Board recognized the uncertainty in launching a new investment product and estimating future asset levels.
Investment performance of the Funds and the Adviser.
Because each New Fund is newly formed and had not commenced operations, the Board did not consider the investment performance of the New Fund or the Adviser. The Board noted that it had received performance information of comparable operational New Funds tracking similar underlying indices.
Conclusion.
No single factor was determinative to the decision of the Board. Based on the foregoing and such other matters as were deemed relevant, the Board concluded that the proposed advisory fee rate and projected total expense ratio are reasonable in relation to the services to be provided by the Adviser to each New Fund, as well as the costs to be incurred and benefits to be gained by the Adviser in providing such services. The Board also found the proposed advisory fees to be reasonable in comparison to the fees charged by advisers to other comparable funds of similar
actual or anticipated size. As a result, the Board concluded that the initial approval of the Investment Management Agreement was in the best interests of each New Fund.
After full consideration of the above factors, as well as other factors, the Trustees, including all of the independent Trustees voting separately, determined to approve the investment advisory agreement for each New Fund.
APPROVAL OF ADVISORY AGREEMENT DURING THE PERIOD WITH THE ADVISER POST-MERGER
On October 3, 2016, Janus Capital Group Inc. (“JCGI”), the direct parent of Janus Capital Management LLC, the investment adviser to the Funds (the “Adviser”), and Henderson Group plc (“Henderson”) announced that they had entered into an Agreement and Plan of Merger (“Merger Agreement”) relating to the business combination of Henderson and JCGI (the “Merger”). Pursuant to the Merger Agreement, a newly formed, direct wholly-owned subsidiary of Henderson will merge with and into JCGI, with JCGI as the surviving corporation and a direct wholly-owned subsidiary of Henderson. The Merger is expected to close in the second quarter of 2017, subject to requisite shareholder and regulatory approvals. The consummation of the Merger may be deemed to be an “assignment” (as defined in the Investment Company Act of 1940, as amended) of the advisory agreement between the Fund and Janus Capital. As a result, the consummation of the Merger will cause such advisory agreement to terminate automatically in accordance with its terms.
| | |
| | Janus Detroit Street Trust ½ 29 |
Janus Henderson Small/Mid Cap Growth Alpha ETF
Board Considerations Regarding Approval of Investment Advisory Agreements (unaudited)
The Trustees of the Trust, the majority of whom are Independent Trustees met on October 24, 2016, and at various times in advance of that date, which meeting was called for the purpose of considering the proposed investment management agreement (the “New Investment Management Agreement”) between the Adviser as a subsidiary of Henderson following the consummation of the Merger and the following series of the Trust: Janus Small Cap Growth Alpha ETF, Janus Small/ Mid Cap Growth Alpha ETF, The Organics ETF, The Long-Term Care ETF, The Obesity ETF, The Health and Fitness ETF, Janus Velocity Tail Risk Hedged Large Cap ETF and Janus Velocity Volatility Hedged Large Cap ETF (each a “Fund” and collectively, the “Funds”). The Independent Trustees met with representatives of the Adviser to discuss the anticipated effects of the Merger. During these meetings, the Adviser indicated its belief that the Merger would not adversely affect the continued operation of the Funds or the capabilities of the investment advisory personnel who currently manage the Funds to continue to provide these and other services to the Funds at the current levels. The Adviser also indicated that it believed that the Merger could provide certain benefits to the Funds but that there could be no assurance as to any particular benefits that might result.
In the course of their consideration of the New Investment Management Agreement, the Trustees met in executive session and were advised by their independent counsel. In this regard, the Board, including the Independent Trustees, evaluated the terms of the New Investment Management Agreement and reviewed the duties and responsibilities of the Trustees in evaluating and approving such agreements. In considering approval of the Investment Management Agreement, the Board, including the Independent Trustees, reviewed the board materials (the “Materials”) and other information provided in advance of the meeting from counsel, the Adviser, as well as from Henderson, including: (i) a copy of the form of New Investment Management Agreement, with respect to the Adviser’s management of the assets of each Fund; (ii) information describing the nature, quality and extent of the services that will be provided to each Fund, and the fees that will be charged to the Funds; (iii) information concerning the Adviser’s and Henderson’s financial condition, business, operations, portfolio management teams and compliance programs; (iv) information describing each Fund’s anticipated advisory fee and operating expenses; (v) information concerning the anticipated structure of the post-Merger entity (“Janus Henderson”); and (v) a memorandum from counsel on the responsibilities of trustees in considering investment advisory arrangements under the 1940 Act. The Board also considered presentations made by, and discussions held with, representatives of the Adviser. The Board also noted the information previously provided to the Board during 2016 related to the initial approvals of each Fund.
During its review of this information, the Board focused on and analyzed the factors that the Board deemed relevant, including, among other matters:
| 1) | That the material terms regarding advisory services pursuant to the New Investment Management Agreement are substantially identical to the terms of the current investment management agreement with the Adviser; |
| 2) | That there is not expected to be any diminution in the nature, extent and quality of the services provided to the Funds and their shareholders by Janus Henderson, including compliance services; |
| 3) | The commitment of the Adviser to retain key personnel currently employed by the Adviser who provide services to the Funds; |
| 4) | That the manner in which each Fund’s assets are managed would not change as a result of the Merger, and that the same portfolio managers managing each Fund’s assets are expected to continue to do so after the Merger; |
| 5) | The terms and conditions of the New Investment Management Agreement, including the current advisory fee rates and operational expenses, are the same as the current fee rates under the current investment management agreement; |
| 6) | That each Fund’s expense ratios are not expected to increase as a result of the Merger or approval of the New Investment Management Agreement; |
| 7) | That the fees and expense ratios of the Funds relative to comparable investment companies continued to be reasonable given the quality of services provided; |
| 8) | The history, reputation, qualification and background of Henderson, as well as its financial condition; |
| 9) | The reputation, financial strength, corporate structure and capital resources of Henderson and its investment advisory subsidiaries and the anticipated financial strength of Janus Henderson; |
| 10) | The long-term business goals of the Adviser and Henderson with respect to the Funds; |
Janus Henderson Small/Mid Cap Growth Alpha ETF
Board Considerations Regarding Approval of Investment Advisory Agreements (unaudited)
| 11) | That, pursuant to the terms of the Merger, Henderson has acknowledged the Advisor’s reliance upon the benefits and protections provided by Section 15(f) and has agreed not to take, and to cause its affiliates not to take, any action that would have the effect, directly or indirectly, of causing the requirements of any of the provisions of Section 15(f) not to be met in respect of the Merger; |
| 12) | That shareholders would not bear any costs in connection with the Merger, that the Adviser will bear the costs, fees and expenses incurred by the Funds in connection with the Proxy Statement, including all expenses in connection with the solicitation of proxies, the fees and expenses of attorneys relating to the Merger and Proxy Statement, and other fees and expenses incurred by the Funds, if any, in connection with the Merger; |
| 13) | The Adviser’s commitment to provide resources to the Funds and the potential for increased distribution capabilities as a result of the Merger, which have the potential to result in long-term economies of scale; and |
| 14) | That the Adviser and Henderson would derive benefits from the Merger and that, as a result, they have a different financial interest in the matters that were being considered than do Fund shareholders. |
In connection with their consideration of the New Investment Advisory Agreement on October 24 2016, the Board noted that, in February 2016, April 2016 and October 2016, the Board had initially approved the respective Funds’ current investment advisory agreements. The Trustees considered that, in connection with the foregoing approvals, the Board had determined that the Adviser had the capabilities, resources and personnel necessary to provide the services to each Fund required under the current investment advisory agreement, and the advisory fee rates paid by each Fund, taking into account the unitary fees charged to the Funds, represented reasonable compensation to the Adviser in light of the services provided. The Trustees noted that the Board also considered the cost to the Adviser of providing those services, potential economies of scale as each Fund’s assets grow, the fees and expenses paid by other comparable funds, and such other matters as the Board had considered relevant in the exercise of their reasonable business judgment.
To inform their consideration of the New Agreement, the Independent Trustees received and considered responses by the Adviser and Henderson to inquiries requesting information regarding: Henderson’s structure, operations, financial resources and key personnel; the material aspects of the Merger, the proposed operations of Janus Henderson and its compliance program, code of ethics, trading policies and key management and investment personnel, including each Fund’s portfolio managers; and anticipated changes to the management or operations of the Board and the Funds, including, if applicable, any changes to the Funds’ service providers, advisory fees and expense structure.
In considering the information and materials described above, the Independent Trustees received assistance from, and met separately with, independent legal counsel and were provided with a written description of their statutory responsibilities and the legal standards that are applicable to approvals of advisory agreements. The Board did not identify any particular information that was most relevant to its consideration to approve the New Investment Management Agreement for each Fund and each Trustee may have afforded different weight to the various factors. Legal counsel to the Independent Trustees provided the Board with a memorandum regarding its responsibilities pertaining to the approval of the New Agreement. In determining whether to approve the New Investment Management Agreement, the Board considered the best interests of each Fund separately.
In voting to approve the New Investment Management Agreement, the Board considered the overall fairness of the New Investment Management Agreement and factors it deemed relevant with respect to each Fund, including, but not limited to: (i) the nature, extent and quality of the services to be provided by Janus Henderson, (ii) that the investment personnel who currently manage the Funds would continue to manage the Funds as employees of Janus Henderson, (iii) that the fees and expenses of the Funds after the Transaction are expected to remain the same, (iv) the projected profitability of the Funds to Janus Henderson and its affiliates; (v) whether the projected economies of scale would be realized as the Funds grow and whether any breakpoints are appropriate at certain asset levels and (vi) other benefits that may accrue Janus Henderson from its relationship with the Funds. The Board also considered that the Transaction might not be consummated if the New Investment Management Agreement was not approved by the Board and the shareholders of each Fund.
Although not meant to be all-inclusive, set forth below is a description of the information and certain factors that were considered by the Board, including the Independent Trustees in deciding to approve the New Investment Management Agreement in respect of each Fund:
The nature, extent and quality of services to be provided by Janus Henderson; personnel and operations of Janus Henderson.
In considering the nature, extent and quality of the services to be provided by Janus Henderson under the New Investment Management Agreement, the Board considered that the terms of the New Investment Management
| | |
| | Janus Detroit Street Trust ½ 31 |
Janus Henderson Small/Mid Cap Growth Alpha ETF
Board Considerations Regarding Approval of Investment Advisory Agreements (unaudited)
Agreement are substantially similar to the terms of the current investment management agreement. The Board considered that the level of service and manner in which each Fund’s assets are managed were expected to remain the same.
The Board considered that, for a period of time after closing, the Adviser expects that the operations of Janus Henderson, as they relate to the Funds, would be the same as those of the Adviser. The Board considered that the Adviser’s key personnel who provide services to the Funds are expected to provide those same services after the Merger. The Board also noted that the Merger is not expected to result in any change in the structure or operations of the Funds and that the Adviser does not currently anticipate any immediate changes to the Funds’ key service providers.
In evaluating Janus Henderson, the Board considered the history, background, reputation and qualification of the Adviser and Henderson, as well as their personnel and Henderson’s financial condition. The Board considered that Henderson is a global asset management firm that was established in 1934, and that it has a long history of asset management around the world. The Board also considered Henderson’s capabilities, experience, corporate structure and capital resources, as well as the Adviser’s long-term business goals with respect to the Janus Henderson Merger and the Funds.
Based on its consideration and review of the foregoing information, the Board determined that each Fund was likely to benefit from the nature, quality and extent of these services, as well as the Janus Henderson’s ability to render such services based on their experience, personnel, operations and resources.
Cost of the services to be provided and profits to be realized by Janus Henderson from the relationship with the Funds; “fall-out” benefits.
The Board noted that the unitary fee currently in place for each Fund will remain in place and unchanged under the New Investment Management Agreement.
The Board also discussed the anticipated costs and projected profitability of Janus Henderson in connection with its serving as investment adviser to each Fund, including operational costs. In addition, the Board discussed that the Funds’ expenses were not expected to increase materially as a result of the Merger. The Board also noted that Henderson does not currently provide any investment management services to other exchange traded funds. In light of the nature, extent and quality of services proposed to be provided by Janus Henderson and the costs expected to be incurred by Janus Henderson in rendering those services, the Board concluded that the level of fees proposed to be paid to Janus Henderson with respect to the Funds were fair and reasonable.
The extent to which economies of scale would be realized as the Funds grow and whether fee levels would reflect such economies of scale.
The Board next discussed potential economies of scale. The Board discussed the promised continued commitment to expand the distribution of Fund shares, and the potential for increased distribution capabilities as a result of the Merger, which have the potential to result in long-term economies of scale.
The Board also noted that since the Trust is newly formed, the eventual aggregate amount of assets was uncertain, and therefore specific information concerning the extent to which economies of scale would be realized as each Fund grows and whether fee levels would reflect such economies of scale, if any, was difficult to determine. The Board recognized the uncertainty in launching new investment products and estimating future asset levels.
Other Benefits to Janus Henderson.
The Board considered other potential benefits that may accrue to Janus Henderson as a result of its relationship with the Funds, which include reputational benefits that may enhance Janus Henderson’s ability to gain business opportunities from other clients.
Conclusion.
No single factor was determinative to the decision of the Board. Based on, but not limited to, the foregoing, and such other matters as were deemed relevant, the Board concluded that the New Investment Management Agreement was fair and reasonable in light of the services to be performed, fees, expenses and such other matters as the Board considered relevant in the exercise of its business judgment.
After full consideration of the above factors, as well as other factors, the Trustees, with the Independent Trustees voting separately, determined to approve the New Investment Management Agreement with respect to the Funds.
Janus Henderson Small/Mid Cap Growth Alpha ETF
Shareholder Meeting (unaudited)
A Special Meeting of Shareholders of the Fund was held on March 17, 2017 and adjourned and reconvened on April 6, 2017. At the meetings, the following matter was voted on and approved by the Shareholders. Each whole or fractional vote reported represents one whole or fractional dollar of net asset value held on the record date for the meetings. The results of the Special Meeting of Shareholders are noted below.
Proposal 1
To approve a new investment advisory agreement.
| | | | | | | | | | |
| | | | Number of Votes ($) |
| Record Date Votes ($) | | | Affirmative | | Against/Withhold | | Abstain | | Broker Non-Votes |
| | 12,827,820.000 | | | 6,044,583.660 | | 64,107.190 | | 404,459.250 | | 0.000 |
| | |
| | Janus Detroit Street Trust ½ 33 |
Janus Henderson Small/Mid Cap Growth Alpha ETF
Trustees and Officers (unaudited)
The Fund’s Statement of Additional Information includes additional information about the Trustees and officers and is available, without charge, by calling 1-877-335-2687.
The following are the Trustees and officers of the Trust, together with a brief description of their principal occupations during the last five years (principal occupations for certain Trustees may include periods over five years).
Each Trustee has served in that capacity since he or she was originally elected or appointed. The Trustees do not serve a specified term of office. Each Trustee will hold office until the termination of the Trust or his or her earlier death, resignation, retirement, incapacity, or removal. Under the Fund’s Governance Procedures and Guidelines, the policy is for Trustees to retire no later than the end of the calendar year in which the Trustee turns 75. The Trustees review the Fund’s Governance Procedures and Guidelines from time to time and may make changes they deem appropriate. The Fund’s Nominating and Governance Committee will consider nominees for the position of Trustee recommended by shareholders. Shareholders may submit the name of a candidate for consideration by the Committee by submitting their recommendations to the Trust’s Secretary. Each Trustee is currently a Trustee of one other registered investment company advised by Janus Capital: Clayton Street Trust. Collectively, these two registered investment companies consist of 12 series or funds.
The Trust’s officers are elected annually by the Trustees for a one-year term. Certain officers also serve as officers of Clayton Street Trust. Certain officers of the Fund may also be officers and/or directors of Janus Capital. Fund officers receive no compensation from the Fund, except for the Fund’s Chief Compliance Officer, as authorized by the Trustees.
| | | | | | | | | | | | | | | | | | |
| TRUSTEES | | | | | | | | | | | | | | |
| Name, Address, and Age | | Positions Held
with the Trust | | | Length of
Time Served | | | Principal Occupations
During the Past Five Years | | Number of
Portfolios/Funds
in Fund Complex
Overseen by
Trustee | | | Other Directorships
Held by Trustee
During the Past Five Years | |
Independent Trustees | | | | | | | | | | | | | | | | | | |
Clifford J. Weber 151 Detroit Street Denver, CO 80206 DOB: 1963 | |
| Chairman
Trustee |
| |
| 2/16-Present
2/16-Present |
| | Owner, Financial Products Consulting Group LLC (consulting services to financial institutions) (since 2015). Formerly, Executive Vice President of Global Index and Exchange- Traded Products, NYSE Market, Inc., a subsidiary of Intercontinental Exchange (ETF/ETP listing exchange) (2013-2015) and Executive Vice President and Head of Strategy and Product Development, NYSE Liffe U.S., a division of NYSE Euronext (U.S. futures exchange) (2008-2013). | | | 12 | | |
| Independent Trustee,
Clough Funds Trust
(investment
company) (since
2015); Chairman,
Clough Funds Trust
(investment
company) (since
2017); Independent
Trustee, Clough
Dividend and Income
Fund (closed-end
fund) (since 2017);
Independent Trustee,
Clough Global
Opportunities Fund
(closed-end fund)
(since 2017);
Independent Trustee,
Clough Global Equity
Fund (closed-end
fund) (since 2017);
Independent Trustee,
Elevation ETF Trust
(since 2016);
Chairman, Elevation
ETF Trust (since
2017) |
|
Janus Henderson Small/Mid Cap Growth Alpha ETF
Trustees and Officers (unaudited)
| | | | | | | | | | | | | | | | | | |
| TRUSTEES | | | | | | | | | | | | | | |
| Name, Address, and Age | | Positions Held
with the Trust | | | Length of
Time Served | | | Principal Occupations
During the Past Five Years | | Number of
Portfolios/Funds
in Fund Complex
Overseen by
Trustee | | | Other Directorships
Held by Trustee
During the Past Five Years | |
| | | | | |
Maureen T. Upton 151 Detroit Street Denver, CO 80206 DOB: 1965 | | | Trustee | | | | 2/16-Present | | | Principal, Maureen Upton Ltd. (consulting services to developers of major infrastructure projects and investors) (since 2017). Formerly, Principal Consultant, SRK Consulting (U.S.), Inc. (consulting services to global mining, energy and water resource industries) (2015-2017) and Founder and Principal, Resource Initiatives LLC (sustainability consulting firm) (2006-2015). | | | 12 | | |
| Director, Denver
Metro Leadership
Foundation (non-
profit
organization)
(2012-2014). |
|
Jeffrey B. Weeden 151 Detroit Street Denver, CO 80206 DOB: 1956 | | | Trustee | | | | 2/16-Present | | | Senior Advisor, BayBoston Capital LP (investment fund in banks and bank holdings companies) (since 2015). Management Advisor, BoxCast, Inc. (technology start-up company) (2014-2017). Formerly Senior Executive Vice President and Chief Financial Officer, KeyCorp (financial services) (2002-2013). | | | 12 | | |
| Director, State
Farm
Bank (banking)
(since 2014). |
|
Interested Trustee | | | | | | | | | | | | | | | | | | |
Michael Drew Elder** 151 Detroit Street Denver, CO 80206 DOB: 1970 | | | Trustee | | | | 8/15-Present | | | Executive Vice President and Head of U.S. Intermediary Distribution, Janus Capital (since 2014) and President, Janus Distributors LLC (broker- dealer) (since 2014). Formerly, Senior Vice President, Janus Capital (2007-2014). | | | 12 | | |
| Director, Perkins
Investment
Management
LLC
(since 2014). |
|
| ** | Michael Drew Elder is an Interested Trustee because of his employment with Janus Capital. |
| | |
| | Janus Detroit Street Trust ½ 35 |
Janus Henderson Small/Mid Cap Growth Alpha ETF
Trustees and Officers (unaudited)
| | | | | | |
| OFFICERS | | | | | | |
| Name, Address, and Age | | Positions Held with the Trust | | Term of Office* and
Length of Time Served | | Principal Occupations During the Past Five Years |
Bruce L. Koepfgen 151 Detroit Street Denver, CO 80206 DOB: 1952 | | President and Chief Executive Officer | | 2/16-Present | | Head of North America for Janus Henderson Investors and Janus Capital Management (since 2017); Executive Vice President and Director of Janus International Holding LLC (since 2011); Executive Vice President of Janus Distributors LLC (since 2011); Vice President and Director of INTECH Investment Management LLC (since 2011); Executive Vice President and Director of Perkins Investment Management LLC (since 2011); and Executive Vice President and Director of Janus Management Holdings Corporation (since 2011). Formerly, President of Janus Capital Group Inc. and Janus Capital Management LLC (2013-2017); Executive Vice President of Janus Services LLC (2011-2015), Janus Capital Group Inc. and Janus Capital Management LLC (2011-2013); and Chief Financial Officer of Janus Capital Group Inc., Janus Capital Management LLC, Janus Distributors LLC, Janus Management Holdings Corporation, and Janus Services LLC (2011-2013). |
| | | |
Susan K. Wold 151 Detroit Street Denver, CO 80206 DOB: 1960 | | Vice President, Chief Compliance Officer, and Anti-Money Laundering Officer | | 10/17-Present; Vice President, Provisional Chief Compliance Officer, and Anti-Money Laundering Officer (9/17-10/17) | | Senior Vice President and Head of Compliance, North America for Janus Henderson (since September 2017); Formerly, Vice President, Head of Global Corporate Compliance, and Chief Compliance Officer for Janus Capital Management (May 2017-September 2017); Vice President, Compliance at Janus Capital Group and Janus Capital Management (2005-2017). |
| | | |
Jesper Nergaard 151 Detroit Street Denver, CO 80206 DOB: 1962 | | Vice President, Chief Financial Officer, Treasurer, and Principal Accounting Officer | | 2/16-Present | | Vice President of Janus Capital and Janus Services LLC. |
| | | |
Kathryn L. Santoro 151 Detroit Street Denver, CO 80206 DOB: 1973 | | Vice President, Secretary and Chief Legal Counsel | | 1/17-Present | | Vice President of Janus Capital and Janus Services LLC (since 2016). Formerly, Vice President and Associate Counsel of Curian Capital, LLC and Curian Clearing LLC (2013- 2016); and General Counsel and Secretary (2011-2012) and Vice President (2009-2012) of Old Mutual Capital, Inc. |
| * | Officers are elected at least annually by the Trustees for a one-year term and may also be elected from time to time by the Trustees for an interim period. |
Janus Henderson Small/Mid Cap Growth Alpha ETF
Notes
| | |
| | Janus Detroit Street Trust ½ 37 |
Knowledge. Shared
At Janus Henderson, we believe in the sharing of expert insight for better investment and business decisions. We call this ethos Knowledge. Shared.
Learn more by visiting janushenderson.com.
This report is submitted for the general information of shareholders of the Fund. It is not an offer or solicitation for the Fund and is not authorized for distribution to prospective investors unless preceded or accompanied by an effective prospectus.
Janus Henderson is a trademark of Janus Henderson Investors. © Janus Henderson Investors. The name Janus Henderson Investors includes HGI Group Limited, Henderson Global Investors (Brand Management) Sarl and Janus International Holding LLC.
Janus Capital Management LLC is the investment adviser and ALPS Distributors, Inc. is the distributor. ALPS is not affiliated with Janus Henderson or any of its subsidiaries.
ANNUAL REPORT
October 31, 2017
Janus Velocity Tail Risk Hedged Large Cap ETF
Janus Detroit Street Trust

Table of Contents
Janus Velocity Tail Risk Hedged Large Cap ETF (unaudited)
INVESTMENT OBJECTIVE
The Janus Velocity Tail Risk Hedged Large Cap ETF (“Exchange Traded Fund” or “ETF”) seeks to provide investment results that correspond generally, before fees and expenses, to the performance of the VelocityShares Tail Risk Hedged Large Cap Index (the “Underlying Index”). The Underlying Index is an index comprised of three large capitalization equity ETFs and two volatility related ETFs (“Underlying Index ETFs”). The ETF will seek to achieve its investment objective by investing at least 80% of its total assets in Underlying Index ETFs. The ETF also intends to invest 15%, but may invest up to 20%, of its assets in swap agreements or other derivatives instead of investing directly in certain Underlying Index ETFs.
PERFORMANCE OVERVIEW
| • | | Stocks rallied after the November U.S. presidential election on the expectation the new administration would champion pro-growth initiatives that would benefit the U.S. economy. Signs of synchronized economic growth in major world economies and corporate earnings strength were also supportive of stocks. During the period, the market experienced some volatility as investors questioned whether Congress would be able to successfully implement the administration’s proposed policies. However, stocks delivered strong returns during the 12-month period. |
| • | | During the period, the Janus Velocity Tail Risk Hedged Large Cap ETF (TRSK) returned 14.09% (based on NAV); its primary benchmark, the VelocityShares Tail Risk Hedged Large Cap Index, returned 14.72%, and its secondary benchmark, the S&P 500 Index, returned 23.63%. |
| • | | TRSK seeks to provide investment results that correspond generally, before fees and expenses, to the performance of its primary benchmark. This liquid alternative ETF addresses the challenge of efficiently hedging the downside risk of an equity portfolio, and is designed to provide a systematic solution to that problem via exposure to VIX® futures. It’s comprised of an 85% exposure to large-cap equities (S&P 500® Index) and a 15% exposure to a volatility component designed to efficiently hedge against large market declines. TRSK automatically rebalances back to these target allocations at each month end. |
| | |
| | Janus Detroit Street Trust ½ 1 |
Janus Velocity Tail Risk Hedged Large Cap ETF (unaudited)
Fund At A Glance
October 31, 2017
| | | | |
| Top Holdings – (% of Net Assets) | |
SPDR S&P 500 Trust | | | 28.4% | |
Vanguard S&P 500 | | | 28.3% | |
iShares Core S&P 500 | | | 28.3% | |
State Street Institutional U.S. Government | | | | |
Money Market Fund | | | 10.4% | |
| | | | |
| | | 95.4% | |
Holdings are subject to change without notice.
Janus Velocity Tail Risk Hedged Large Cap ETF (unaudited)
Performance
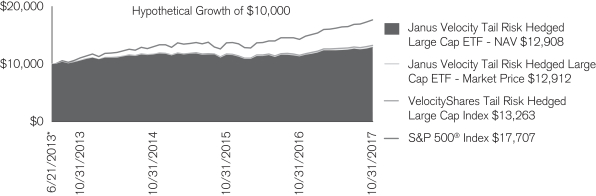
| | | | |
| Average Annual Total Return for the periods ended October 31, 2017 |
| | | One Year | | Since
Inception* |
Janus Velocity Tail Risk Hedged Large Cap ETF – NAV | | 14.09% | | 6.03% |
Janus Velocity Tail Risk Hedged Large Cap ETF – Market Price | | 14.00% | | 6.03% |
VelocityShares Tail Risk Hedged Large Cap Index | | 14.72% | | 6.69% |
S&P 500® Index | | 23.63% | | 14.00% |
Total annual expense ratio as stated in the February 28, 2017 prospectus: 0.70%.
Returns quoted are past performance and do not guarantee future results; current performance may be lower or higher. Investment returns and principal value will vary; there may be a gain or loss when shares are sold. For the most recent month-end performance call 800.668.0434 or visit janushenderson.com/performance.
Shares of ETFs are bought and sold at market price (not NAV) and are not individually redeemed from the Fund. Market returns are based upon the midpoint of the bid/ask spread at 4:00 p.m. Eastern time (when NAV is normally determined for most ETFs), and do not represent the returns you would receive if you traded shares at other times. Ordinary brokerage commissions apply and will reduce returns.
ETF shares are not individually redeemable and owners of the shares may acquire those shares from the Fund and tender those shares for redemption to the Fund in Creation Units only.
Investing involves risk, including the possible loss of principal and fluctuation of value.
Performance depends on that of the underlying index.
See the prospectus for a more complete discussion of objectives, risks and expenses.
Returns include reinvestment of dividends and capital gains. Returns greater than one year are annualized. Returns do not reflect the deduction of taxes that a shareholder would pay on Fund distributions or redemptions of Fund shares.
See Financial Highlights for actual expense ratios during the reporting period.
The Fund commenced operations on July 18, 2016, after the reorganization of Janus Velocity Tail Risk Hedged Large Cap ETF, the Fund’s predecessor fund (“Predecessor Fund”), into the Fund. The performance shown prior to July 18, 2016 reflects the historical performance of the Predecessor Fund prior to the reorganization, calculated using the fees and expenses of the Predecessor Fund. If the Fund had been available during periods prior to July 18, 2016, the performance shown may have been different. The Fund’s financial statements incorporate the financial statements of the Predecessor Fund for periods prior to July 18, 2016.
There is no assurance the stated objective(s) will be met.
See Notes to Schedule of Investments and Other Information for index definitions.
Index performance does not reflect the expenses of managing a portfolio as an index is unmanaged and not available for direct investment.
The index provider is Janus Index and Calculation Services LLC (“Janus Index”). Janus Index maintains the indices and calculates the index levels and performance shown or discussed, but does not manage actual assets. Janus Index receives compensation in connection with licensing its indices to third parties including the provision of any related data.
Effective February 28, 2017 Edward Tom, Benjamin Wang and Scott Weiner are Co-Portfolio Managers of the Fund.
| * | The Predecessor Fund’s inception date is June 21, 2013. |
| | |
| | Janus Detroit Street Trust ½ 3 |
Janus Velocity Tail Risk Hedged Large Cap ETF (unaudited)
Disclosure of Fund Expenses
As a shareholder of the Fund, you incur two types of costs: (1) transaction costs, which may include creation and redemption fees or brokerage charges and (2) ongoing costs, including management fees and other Fund expenses. This example is intended to help you understand your ongoing costs (in dollars) of investing in the Fund and to compare these costs with the ongoing costs of investing in other ETFs. To do so, compare this 5% hypothetical example with the 5% hypothetical examples that appear in the shareholder reports of the other funds. The example is based upon an investment of $1,000 invested at the beginning of the period and held for the six-months indicated, unless noted otherwise in the table and footnotes below.
Actual Expenses
The information in the table under the heading “Actual” provides information about actual account values and actual expenses. You may use the information in these columns, together with the amount you invested, to estimate the expenses that you paid over the period. Simply divide your account value by $1,000 (for example, an $8,600 account value divided by $1,000 = 8.6), then multiply the result by the number under the heading entitled “Expenses Paid During Period” to estimate the expenses you paid on your account during the period.
Hypothetical Example for Comparison Purposes
The information in the table under the heading “Hypothetical (5% return before expenses)” provides information about hypothetical account values and hypothetical expenses based upon the Fund’s actual expense ratio and an assumed rate of return of 5% per year before expenses, which is not the Fund’s actual return. The hypothetical account values and expenses may not be used to determine the actual ending account balance or expenses you paid for the period. You may use this information to compare the ongoing costs of investing in the Fund and other funds. To do so, compare this 5% hypothetical example with the 5% hypothetical examples that appear in the shareholder reports of the other funds. Additionally, for an analysis of the fees associated with an investment or other similar funds, please visit www.finra.org/fundanalyzer.
Please note that the expenses shown in the table are meant to highlight your ongoing costs only and do not reflect any transaction costs, such as creation and redemption fees, or brokerage charges. These fees are fully described in the Fund’s prospectus. Therefore, the hypothetical examples are useful in comparing ongoing costs only, and will not help you determine the relative total costs of owning different funds. In addition, if these transaction costs were included, your costs would have been higher.
| | | | | | | | | | | | | | | | | | | | | | | | |
Actual | | | Hypothetical
(5% return before expenses) | | | | |
Beginning
Account
Value
(5/1/17) | | Ending
Account
Value
(10/31/2017) | | | Expenses
Paid During
Period
(5/1/17 - 10/31/2017)† | | | Beginning
Account
Value
(5/1/17) | | | Ending
Account
Value
(10/31/2017) | | | Expenses
Paid During
Period
(5/1/17 - 10/31/2017)† | | | Net Annualized
Expense Ratio
(5/1/17 - 10/31/2017)†† | |
| $1,000.00 | | $ | 1,043.50 | | | $ | 3.35 | | | $ | 1,000.00 | | | $ | 1,021.93 | | | $ | 3.31 | | | | 0.65% | |
| † | Expenses Paid During Period is equal to the Net Annualized Expense Ratio multiplied by the average account value over the period, multiplied by 184/365 (to reflect the one-half year period). |
| †† | Ratios do not include indirect expenses of the underlying funds and/ or investment companies in which the Fund invests. |
Janus Velocity Tail Risk Hedged Large Cap ETF
Report of Independent Registered Public Accounting Firm
To the Board of Trustees of Janus Detroit Street Trust and Shareholders of
Janus Velocity Tail Risk Hedged Large Cap ETF:
In our opinion, the accompanying statement of assets and liabilities, including the schedule of investments, and the related statements of operations and of changes in net assets and the financial highlights present fairly, in all material respects, the financial position of the Janus Velocity Tail Risk Hedged Large Cap ETF (one of the funds constituting Janus Detroit Street Trust, hereafter referred to as the “Fund”) as of October 31, 2017, the results of its operations for the year then ended, and the changes in its net assets and the financial highlights for the year then ended and for the period from December 1, 2015 through October 31, 2016 , in conformity with accounting principles generally accepted in the United States of America. These financial statements and financial highlights (hereafter referred to as “financial statements”) are the responsibility of the Fund’s management. Our responsibility is to express an opinion on these financial statements based on our audits. We conducted our audits of these financial statements in accordance with the standards of the Public Company Accounting Oversight Board (United States). Those standards require that we plan and perform the audit to obtain reasonable assurance about whether the financial statements are free of material misstatement. An audit includes examining, on a test basis, evidence supporting the amounts and disclosures in the financial statements, assessing the accounting principles used and significant estimates made by management, and evaluating the overall financial statement presentation. We believe that our audits, which included confirmation of securities as of October 31, 2017 by correspondence with the custodian and brokers, provide a reasonable basis for our opinion. The financial statements of the Fund as of and for the year ended November 30, 2015, and the financial highlights for each of the periods ended on or prior to November 30, 2015 (not presented herein, other than the statement of changes in net assets and the financial highlights) were audited by other auditors whose report dated January 28, 2016 expressed an unqualified opinion on those financial statements and financial highlights.

Denver, Colorado
December 20, 2017
| | |
| | Janus Detroit Street Trust ½ 5 |
Janus Velocity Tail Risk Hedged Large Cap ETF
Schedule of Investments
October 31, 2017
| | | | | | | | |
| | | Shares | | | Value | |
| Investment Companies – 95.4% | | | | | | |
| Exchange-Traded Funds (ETFs) – 85.0% | | | | | | |
iShares Core S&P 500 | | | 14,909 | | | | $3,858,598 | |
SPDR S&P 500 Trust | | | 15,011 | | | | 3,860,079 | |
Vanguard S&P 500 | | | 16,342 | | | | 3,858,836 | |
| | | | | | | | |
| | | | | | | 11,577,513 | |
| Money Markets – 10.4% | | | | | | |
State Street Institutional U.S. Government Money Market Fund, 0.9569%ºº | | | 1,422,693 | | | | 1,422,693 | |
Total Investments (total cost $10,932,747) – 95.4% | | | | | | | 13,000,206 | |
Cash, Receivables and Other Assets, net of Liabilities – 4.6% | | | | | | | 625,668 | |
Net Assets – 100% | | | | | | | $13,625,874 | |
The Fund may invest in certain securities that are considered affiliated companies. As defined by the Investment Company Act of 1940, as amended, an affiliated company is one in which the Fund owns 5% or more of the outstanding voting securities, or a company which is under common ownership or control.
Schedules of Affiliated Investments – (% of Net Assets)
| | | | | | | | | | | | | | | | |
| | | Dividend Income | | | Realized
Gain/(Loss) | | | Change in Unrealized
Appreciation/
(Depreciation) | | | Value at
10/31/17 | |
Investment Companies – 0% | | | | | | | | | | | | | | | | |
Investments Purchased with Cash Collateral from Securities Lending – 0% | | | | | | | | | | | | | | | | |
Janus Cash Collateral Fund LLC, 1.0003%ºº | | | $36 | D | | | $— | | | | $— | | | | $— | |
| | | | |
| | | Share Balance
at 10/31/16 | | | Purchases | | | Sales | | | Share Balance
at 10/31/17 | |
Investment Companies – 0% | | | | | | | | | | | | | | | | |
Investments Purchased with Cash Collateral from Securities Lending – 0% | | | | | | | | | | | | | | | | |
Janus Cash Collateral Fund LLC, 1.0003%ºº | | | — | | | | 2,942,800 | | | | (2,942,800) | | | | — | |
Schedule of Total Return Swaps
| | | | | | | | | | | | | | | | | | |
Counterparty/
Return Paid by
the Fund | | Return Received
by the Fund | | Payment
Frequency | | | Termination
Date | | | Notional
Amount | | | Value and
Unrealized
Appreciation/
(Depreciation) | |
BNP Paribas S.A.: | | | | | | | | | | | | | | | | | | |
1.970% | | S&P 500 VIX Futures Tail Risk Index | | | Monthly | | | | 12/1/17 | | | | 140,327 USD | | | | $(60,844) | |
1.970 | | S&P 500 VIX Futures Tail Risk Index | | | Monthly | | | | 1/2/18 | | | | 310,000 USD | | | | (128,645) | |
1.970 | | S&P 500 VIX Futures Tail Risk Index | | | Monthly | | | | 1/2/18 | | | | 194,540 USD | | | | (75,346) | |
1.970 | | S&P 500 VIX Futures Tail Risk Index | | | Monthly | | | | 2/1/18 | | | | 445,000 USD | | | | (132,669) | |
1.970 | | S&P 500 VIX Futures Tail Risk Index | | | Monthly | | | | 3/1/18 | | | | 51,000 USD | | | | (15,197) | |
1.970 | | S&P 500 VIX Futures Tail Risk Index | | | Monthly | | | | 4/2/18 | | | | 109,000 USD | | | | (28,506) | |
1.970 | | S&P 500 VIX Futures Tail Risk Index | | | Monthly | | | | 6/1/18 | | | | 175,000 USD | | | | (36,845) | |
1.970 | | S&P 500 VIX Futures Tail Risk Index | | | Monthly | | | | 7/2/18 | | | | 208,000 USD | | | | (42,180) | |
1.970 | | S&P 500 VIX Futures Tail Risk Index | | | Monthly | | | | 7/2/18 | | | | 200,500 USD | | | | (40,653) | |
1.970 | | S&P 500 VIX Futures Tail Risk Index | | | Monthly | | | | 7/2/18 | | | | 47,000 USD | | | | (9,514) | |
1.970 | | S&P 500 VIX Futures Tail Risk Index | | | Monthly | | | | 9/3/18 | | | | 76,000 USD | | | | (16,833) | |
1.970 | | S&P 500 VIX Futures Tail Risk Index | | | Monthly | | | | 10/1/18 | | | | 17,000 USD | | | | (3,629) | |
1.970 | | S&P 500 VIX Futures Tail Risk Index | | | Monthly | | | | 11/1/18 | | | | 100,000 USD | | | | (18,207) | |
1.970 | | S&P 500 VIX Futures Tail Risk Index | | | Monthly | | | | 12/3/18 | | | | 140,000 USD | | | | (19,299) | |
1.970 | | S&P 500 VIX Futures Tail Risk Index | | | Monthly | | | | 1/2/19 | | | | 19,500 USD | | | | (2,549) | |
1.970 | | S&P 500 VIX Futures Tail Risk Index | | | Monthly | | | | 2/1/19 | | | | 72,000 USD | | | | (9,370) | |
1.970 | | S&P 500 VIX Futures Tail Risk Index | | | Monthly | | | | 3/1/19 | | | | 198,000 USD | | | | (6,376) | |
1.970 | | S&P 500 VIX Futures Tail Risk Index | | | Monthly | | | | 4/1/19 | | | | 103,000 USD | | | | (260) | |
1.970 | | S&P 500 VIX Futures Tail Risk Index | | | Monthly | | | | 5/1/19 | | | | 42,000 USD | | | | — | |
Total | | | | | | | | | | | | $(646,922) | |
See Notes to Schedule of Investments and Other Information and Notes to Financial Statements.
Janus Velocity Tail Risk Hedged Large Cap ETF
Schedule of Investments
OCTOBER 31, 2017
The following table, grouped by derivative type, provides information about the fair value and location of derivatives within the Statement of Assets and Liabilities as of October 31, 2017.
Fair Value of Derivative Instruments (not accounted for as hedging instruments) as of October 31, 2017
| | | | |
| | | Equity Contracts | |
| Liability Derivatives: | | | | |
| Outstanding swap contracts, at value | | $ | 646,922 | |
The following tables provide information about the effect of derivatives and hedging activities on the Fund’s Statement of Operations for the year ended October 31, 2017.
The effect of Derivative Instruments (not accounted for as hedging instruments) on the Statement of Operations for the year ended October 31, 2017
| | | | |
| Amount of Realized Gain/(Loss) Recognized on Derivatives | |
| Derivative | | Equity Contracts | |
| Swap contracts | | $ | (585,433) | |
|
| Amount of Change in Unrealized Appreciation/Depreciation Recognized on Derivatives | |
| Derivative | | Equity Contracts | |
| Swap contracts | | $ | (138,184) | |
Please see the “Net Realized Gain/(Loss) on Investments” and “Change in Unrealized Net Appreciation/Depreciation” sections of the Fund’s Statement of Operations.
Average Ending Monthly Market Value of Derivative Instruments During the Year Ended October 31, 2017
| | | | |
| | | Market Value | |
| Total return swaps, long | | $ | 681,737 | |
See Notes to Schedule of Investments and Other Information and Notes to Financial Statements.
| | |
| | Janus Detroit Street Trust ½ 7 |
Janus Velocity Tail Risk Hedged Large Cap ETF
Notes to Schedule of Investments and Other Information
| | |
| CBOE Volatility Index® or VIX® Index® | | Shows the market’s expectation of 30-day volatility. It is constructed using the implied volatilities of a wide range of S&P 500® Index options and is a widely used measure of market risk. The VIX methodology is the property of Chicago Board of Options Exchange, which is not affiliated with Janus Henderson. |
| |
| VelocityShares Tail Risk Hedged Large Cap Index | | VelocityShares Tail Risk Hedged Large Cap Index (TRSKID) combines 85% exposure to a large cap equity portfolio with a 15% exposure to a volatility strategy intended to hedge against tail risk events in the S&P 500 Index. |
| |
| S&P 500® Index | | S&P 500® Index reflects U.S. large-cap equity performance and represents broad U.S. equity market performance. |
| |
| SPDR | | Standard & Poor’s Depositary Receipt |
| ºº | Rate shown is 7-day yield as of October 31, 2017. |
| D | Net of income paid to the securities lending agent and rebates paid to the borrowing counterparties. |
The following is a summary of the inputs that were used to value the Fund’s investments in securities and other financial instruments as of October 31, 2017. See Notes to Financial Statements for more information.
Valuation Inputs Summary
| | | | | | | | | | | | |
| | | Level 1 -
Quoted Prices | | | Level 2 -
Other Significant
Observable Inputs | | | Level 3 -
Significant
Unobservable Inputs | |
Assets | | | | | | | | | | | | |
Investments in Securities: | | | | | | | | | | | | |
Investment Companies | | $ | 13,000,206 | | | $ | — | | | $ | — | |
| | | | |
Total Assets | | $ | 13,000,206 | | | $ | — | | | $ | — | |
| | | | |
Liabilities | | | | | | | | | | | | |
Other Financial Instruments(a): | | | | | | | | | | | | |
Outstanding Swap Contracts, at Value | | $ | — | | | $ | 646,922 | | | $ | — | |
| (a) | Other financial instruments include forward foreign currency exchange, futures, written options, written swaptions, and swap contracts. Forward foreign currency exchange contracts are reported at their unrealized appreciation/(depreciation) at measurement date, which represents the change in the contract’s value from trade date. Futures, certain written options on futures, and centrally cleared swap contracts are reported at their variation margin at measurement date, which represents the amount due to/from the Fund at that date. Written options, written swaptions, and other swap contracts are reported at their market value at measurement date. |
Janus Velocity Tail Risk Hedged Large Cap ETF
Statement of Assets and Liabilities
October 31, 2017
| | | | |
Assets: | | | | |
Investments, at value(1) | | $ | 13,000,206 | |
Deposits with brokers for OTC derivatives | | | 1,220,000 | |
Receivables: | | | | |
Investments sold | | | 102,312 | |
Dividends | | | 1,560 | |
Affiliated securities lending income, net | | | 36 | |
Total Assets | | | 14,324,114 | |
Liabilities: | | | | |
Outstanding swap contracts, at value | | | 646,922 | |
Payables: | | | | |
Investments purchased | | | 43,421 | |
Management fees | | | 7,897 | |
Total Liabilities | | | 698,240 | |
Net Assets | | $ | 13,625,874 | |
Net Assets Consists of: | | | | |
Capital (par value and paid-in surplus) | | $ | 15,991,929 | |
Undistributed net investment income/(loss) | | | — | |
Undistributed net realized gain/(loss) from investments and foreign currency transactions | | | (3,786,592) | |
Unrealized net appreciation/(depreciation) on investments and foreign currency translations | | | 1,420,537 | |
Total Net Assets | | $ | 13,625,874 | |
Net Assets | | $ | 13,625,874 | |
Shares outstanding, $0.001 Par Value (unlimited shares authorized) | | | 450,000 | |
Net Asset Value Per Share | | $ | 30.28 | |
| (1) | Includes cost of $10,932,747. |
See Notes to Financial Statements.
| | |
| | Janus Detroit Street Trust ½ 9 |
Janus Velocity Tail Risk Hedged Large Cap ETF
Statement of Operations
For the year ended October 31, 2017
| | | | |
Investment Income: | | | | |
Dividends | | $ | 320,937 | |
Affiliated securities lending income, net | | | 36 | |
Total Investment Income | | | 320,973 | |
Expenses: | | | | |
Management Fees | | | 111,682 | |
Total Expenses | | | 111,682 | |
Net Investment Income/(Loss) | | | 209,291 | |
Net Realized Gain/(Loss) on Investments: | | | | |
Investments and foreign currency transactions | | | 885,012 | |
Swap contracts | | | (585,433) | |
Total Net Realized Gain/(Loss) on Investments | | | 299,579 | |
Change in Unrealized Net Appreciation/Depreciation: | | | | |
Investments and foreign currency translations | | | 1,844,299 | |
Swap contracts | | | (138,184) | |
Total Change in Unrealized Net Appreciation/Depreciation | | | 1,706,115 | |
Net Increase/(Decrease) in Net Assets Resulting from Operations | | $ | 2,214,985 | |
See Notes to Financial Statements.
Janus Velocity Tail Risk Hedged Large Cap ETF
Statements of Changes in Net Assets
| | | | | | | | | | | | |
| | | Year ended
October 31, 2017 | | | Period ended
October 31, 2016(1) | | | Year ended
November 30, 2015(2) | |
Operations: | | | | | | | | | | | | |
Net investment income/(loss) | | $ | 209,291 | | | $ | 338,549 | | | $ | 418,723 | |
Net realized gain/(loss) on investments | | | 299,579 | | | | (775,616) | | | | (151,064) | |
Change in unrealized net appreciation/depreciation | | | 1,706,115 | | | | (1,314,689) | | | | (1,329,787) | |
Net Increase/(Decrease) in Net Assets Resulting from Operations | | | 2,214,985 | | | | (1,751,756) | | | | (1,062,128) | |
Dividends and Distributions to Shareholders: | | | | | | | | | | | | |
Dividends from Net Investment Income | | | (233,493) | | | | (438,800) | | | | (307,279) | |
Capital Share Transactions | | | (3,146,387) | | | | (23,462,044) | | | | 7,189,804 | |
Net Increase/(Decrease) in Net Assets | | | (1,164,895) | | | | (25,652,600) | | | | 5,820,397 | |
Net Assets: | | | | | | | | | | | | |
Beginning of period | | | 14,790,769 | | | | 40,443,369 | | | | 34,622,972 | |
End of period | | $ | 13,625,874 | | | $ | 14,790,769 | | | $ | 40,443,369 | |
| | | |
| | | | | | | | | | | | |
Undistributed Net Investment Income/(Loss) | | $ | — | | | $ | 16,453 | | | $ | 111,444 | |
| (1) | Period from December 1, 2015 through October 31, 2016. The Fund changed its fiscal year end from November 30 to October 31. |
| (2) | Period from December 1, 2014 through November 30, 2015. |
See Notes to Financial Statements.
| | |
| | Janus Detroit Street Trust ½ 11 |
Janus Velocity Tail Risk Hedged Large Cap ETF
Financial Highlights
| | | | | | | | | | | | | | | | | | | | | | |
For a share outstanding during year ended October 31, 2017 and period
ended October 31, 2016, and each year and period ended November 30 | | 2017 | | | 2016(1) | | | 2015 | | | 2014 | | | 2013(2) | |
| | Net Asset Value, Beginning of Period | | | $26.89 | | | | $27.89 | | | | $28.85 | | | | $26.75 | | | | $25.00 | |
| | Income/(Loss) from Investment Operations: | | | | | | | | | | | | | | | | | | | | |
| | Net investment income/(loss)(3) | | | 0.35 | | | | 0.39 | | | | 0.29 | | | | 0.24 | | | | 0.24 | |
| | Net realized and unrealized gain/(loss) | | | 3.42 | | | | (0.94) | | | | (1.02) | | | | 2.14 | | | | 1.91 | |
| | Total from Investment Operations | | | 3.77 | | | | (0.55) | | | | (0.73) | | | | 2.38 | | | | 2.15 | |
| | Less Dividends and Distributions: | | | | | | | | | | | | | | | | | | | | |
| | Dividends (from net investment income) | | | (0.38) | | | | (0.45) | | | | (0.23) | | | | (0.23) | | | | (0.37) | |
| | Return of Capital | | | — | | | | — | | | | — | | | | (0.05) | | | | (0.03) | |
| | Total Dividends and Distributions | | | (0.38) | | | | (0.45) | | | | (0.23) | | | | (0.28) | | | | (0.40) | |
| | Net Asset Value, End of Period | | | $30.28 | | | | $26.89 | | | | $27.89 | | | | $28.85 | | | | $26.75 | |
| | Total Return* | | | 14.09% | | | | (1.95)% | | | | (2.52)% | | | | 8.94% | | | | 8.66% | |
| | Net assets, End of Period (in thousands) | | | $13,626 | | | | $14,791 | | | | $40,443 | | | | $34,623 | | | | $1,338 | |
| | Average Net Assets for the Period (in thousands) | | | $17,182 | | | | $23,456 | | | | $40,633 | | | | $23,370 | | | | $2,170 | |
| | Ratios to Average Net Assets**: | | | | | | | | | | | | | | | | | | | | |
| | Ratio of Gross Expenses | | | 0.65% | | | | 0.65% | | | | 0.65% | | | | 0.65% | | | | 0.65% | |
| | Ratio of Net Investment Income/(Loss) | | | 1.22% | | | | 1.57% | | | | 1.03% | | | | 0.89% | | | | 2.21% | |
| | Portfolio Turnover Rate(4) | | | 0%(5) | | | | 2% | | | | 11% | | | | 2% | | | | 4% | |
| * | Total return not annualized for periods of less than one full year. |
| ** | Annualized for periods of less than one full year. |
| (1) | Period from December 1, 2015 through October 31, 2016. The Fund changed its fiscal year end from November 30 to October 31. |
| (2) | Period from June 21, 2013 (inception date) through November 30, 2013. |
| (3) | Per share amounts are calculated based on average shares outstanding during the year or period. |
| (4) | Portfolio turnover rate excludes securities received or delivered from in-kind processing of creation or redemptions. |
See Notes to Financial Statements.
Janus Velocity Tail Risk Hedged Large Cap ETF
Notes to Financial Statements
1. Organization and Significant Accounting Policies
Janus Velocity Tail Risk Hedged Large Cap ETF (the “Fund”) is a series fund. The Fund is part of Janus Detroit Street Trust (the “Trust”), which is organized as a Delaware statutory trust and is registered under the Investment Company Act of 1940, as amended (the “1940 Act”), as an open-end management investment company, and therefore has applied the specialized accounting and reporting guidance in Financial Accounting Standards Board (“FASB”) Accounting Standards Codification (“ASC”) Topic 946. The Trust offers nine Funds each of which represent shares of beneficial interest in a separate portfolio of securities and other assets with its own objective and policies. The Fund is a fund of funds and seeks its investment objective by investing 85% of its net assets in unaffiliated underlying ETFs that provide exposure to large capitalization securities and 15% of its net assets to a volatility strategy. For additional information on the underlying ETFs, visit the Securities and Exchange Commission website at www.SEC.GOV. The Fund seeks investment results that correspond generally, before fees and expenses, to the performance of its underlying index, the VelocityShares Tail Risk Hedged Large Cap Index (the “Underlying Index”). The Fund is classified as nondiversified, as defined in the 1940 Act.
Pursuant to the Agreement and Plan of Reorganization and Termination (the “Reorganization”), the Fund acquired all of the assets and liabilities of Janus Velocity Tail Risk Hedged Large Cap ETF (the “Predecessor Fund”), a series of ALPS ETF Trust, on July 18, 2016. The shareholders of the Predecessor Fund received shares of the Fund with an aggregate net asset value (“NAV”) equal to the aggregate NAV of their shares in the Predecessor Fund immediately prior to the Reorganization at the following conversion ratios:
| | | | | | | | |
Predecessor Fund Shares
Prior to Reorganization | | Conversion Ratio | | | New Shares Issued by the Fund | |
| 950,000 | | | 1.00 | | | | 950,000 | |
The Reorganization was treated as a tax-free exchange for federal income tax purposes, and accordingly, the basis of the assets of the Fund reflected the historical basis of the assets of the Predecessor Fund as of the date of the Reorganization.
The net assets and composition of net assets of the Fund and the Predecessor Fund on July 15, 2016, were as follows:
| | | | | | | | | | | | |
| | | Fund | | | Predecessor Fund | | | Combined Funds | |
| Paid-in-Capital | | $ | — | | | $ | 27,633,999 | | | $ | 27,633,999 | |
| Accumulated Net Investment Income | | | — | | | | (64,003) | | | | (64,003) | |
| Accumulated Net Realized Gain | | | — | | | | (1,858,162) | | | | (1,858,162) | |
| Net Unrealized Appreciation | | | — | | | | 263,108 | | | | 263,108 | |
| Net Assets | | | — | | | | 25,974,942 | | | | 25,974,942 | |
| Cost of Investments | | | — | | | | 21,015,197 | | | | 21,015,197 | |
The Predecessor Fund and the Fund had identical investment objectives and substantially similar investment policies and principal risks. For financial reporting purposes, the Predecessor Fund’s financial and performance history prior to the Reorganization is carried forward and reflected in the Fund’s financial statements and financial highlights. For the year ended November 30, 2015, and prior periods, the audit of those financial statements were performed by auditors different from the auditors of this report.
The fiscal year end of the Predecessor Fund was November 30. Subsequent to November 30, 2015, the Fund changed its fiscal year end to October 31, 2016, to reflect the fiscal year end of the Trust.
Unlike shares of traditional mutual funds, shares of the Fund are not individually redeemable and may only be purchased or redeemed directly from the Fund at NAV in large increments called “Creation Units” (50,000 or more shares per Creation Unit) through certain participants, known as “Authorized Participants.” The Fund will issue or redeem Creation Units in exchange for portfolio securities and/or cash. Except when aggregated in Creation Units, Fund shares are not redeemable securities of the Fund. Shares of the Fund are listed and trade on the NYSE Arc, Inc., and individual investors can purchase or sell shares in much smaller increments and for cash in the secondary market through a broker. These transactions, which do not involve the Fund, are made at market prices that may vary throughout the day and differ from the Fund’s NAV. As a result, you may pay more than NAV (at a premium) when you purchase shares, and receive less than NAV (at a discount) when you sell shares, in the secondary market.
An Authorized Participant may hold of record more than 25% of the outstanding shares of the Fund. From time to time, Authorized Participants may be a beneficial and/or legal owner of the Fund, may be affiliated with an index provider, may
| | |
| | Janus Detroit Street Trust ½ 13 |
Janus Velocity Tail Risk Hedged Large Cap ETF
Notes to Financial Statements
be deemed to have control of the Fund and/or may be able to affect the outcome of matters presented for a vote of the shareholders of the Fund. Authorized Participants may execute an irrevocable proxy granting the Distributor or an affiliate of Janus Capital Management LLC (“Janus Capital” or “Janus”) power to vote or abstain from voting such Authorized Participant’s beneficially or legally owned shares of the Fund. In such cases, the agent shall mirror vote (or abstain from voting) such shares in the same proportion as all other beneficial owners of the Fund.
The following accounting policies have been followed by the Fund and are in conformity with accounting principles generally accepted in the United States of America.
Investment Valuation
Securities held by the Fund are valued in accordance with policies and procedures established by and under the supervision of the Trustees (the “Valuation Procedures”). Equity securities, including shares of exchange-traded funds, traded on a domestic securities exchange are generally valued at the closing prices on the primary market or exchange on which they trade. If such price is lacking for the trading period immediately preceding the time of determination, such securities are valued at their current bid price. Equity securities that are traded on a foreign exchange are generally valued at the closing prices on such markets. In the event that there is no current trading volume on a particular security in such foreign exchange, the bid price from the primary exchange is generally used to value the security. Securities that are traded on the over-the-counter (“OTC”) markets are generally valued at their closing or latest bid prices as available. Foreign securities and currencies are converted to U.S. dollars using the applicable exchange rate in effect at the close of the New York Stock Exchange (“NYSE”). The Fund will determine the market value of individual securities held by it by using prices provided by one or more approved professional pricing services or, as needed, by obtaining market quotations from independent broker-dealers. Most debt securities are valued in accordance with the evaluated bid price supplied by the pricing service that is intended to reflect market value. The evaluated bid price supplied by the pricing service is an evaluation that may consider factors such as security prices, yields, maturities and ratings. Certain short-term securities maturing within 60 days or less may be evaluated and valued on an amortized cost basis provided that the amortized cost determined approximates market value. Securities for which market quotations or evaluated prices are not readily available or are deemed unreliable are valued at fair value determined in good faith under the Valuation Procedures. Circumstances in which fair value pricing may be utilized include, but are not limited to: (i) a significant event that may affect the securities of a single issuer, such as a merger, bankruptcy, or significant issuer-specific development; (ii) an event that may affect an entire market, such as a natural disaster or significant governmental action; (iii) a nonsignificant event such as a market closing early or not opening, or a security trading halt; and (iv) pricing of a nonvalued security and a restricted or nonpublic security. Special valuation considerations may apply with respect to “odd-lot” fixed-income transactions which, due to their small size, may receive evaluated prices by pricing services which reflect a large block trade and not what actually could be obtained for the odd-lot position.
Valuation Inputs Summary
FASB ASC 820, Fair Value Measurements and Disclosures (“ASC 820”), defines fair value, establishes a framework for measuring fair value, and expands disclosure requirements regarding fair value measurements. This standard emphasizes that fair value is a market-based measurement that should be determined based on the assumptions that market participants would use in pricing an asset or liability and establishes a hierarchy that prioritizes inputs to valuation techniques used to measure fair value. These inputs are summarized into three broad levels:
Level 1 – Unadjusted quoted prices in active markets the Fund has the ability to access for identical assets or liabilities.
Level 2 – Observable inputs other than unadjusted quoted prices included in Level 1 that are observable for the asset or liability either directly or indirectly. These inputs may include quoted prices for the identical instrument on an inactive market, prices for similar instruments, interest rates, prepayment speeds, credit risk, yield curves, default rates and similar data.
Assets or liabilities categorized as Level 2 in the hierarchy generally include: debt securities fair valued in accordance with the evaluated bid or ask prices supplied by a pricing service; securities traded on OTC markets and listed securities for which no sales are reported that are fair valued at the latest bid price (or yield equivalent thereof) obtained from one or more dealers transacting in a market for such securities or by a pricing service approved by the Fund’s Trustees; and certain short-term debt securities with maturities of 60 days or less that are fair valued at amortized cost. Other securities that may be categorized as Level 2 in the hierarchy include, but are not limited to, preferred stocks, bank loans, swaps, investments in unregistered investment companies, options, and forward contracts.
Janus Velocity Tail Risk Hedged Large Cap ETF
Notes to Financial Statements
Level 3 – Unobservable inputs for the asset or liability to the extent that relevant observable inputs are not available, representing the Fund’s own assumptions about the assumptions that a market participant would use in valuing the asset or liability, and that would be based on the best information available.
There have been no significant changes in valuation techniques used in valuing any such positions held by the Fund since the beginning of the fiscal year.
The inputs or methodology used for fair valuing securities are not necessarily an indication of the risk associated with investing in those securities. The summary of inputs used as of October 31, 2017 to fair value the Fund’s investments in securities and other financial instruments is included in the “Valuation Inputs Summary” in the Notes to Schedule of Investments and Other Information.
The Fund recognizes transfers between the levels as of the beginning of the fiscal year. The following describes the amounts of transfers between Level 1, Level 2 and Level 3 of the fair value hierarchy during the year/period.
Financial assets of $2,100,934 were transferred out of Level 2 to Level 1 to reflect the investments unadjusted quoted price as of October 31, 2017.
Investment Transactions and Investment Income
Investment transactions are accounted for as of the date purchased or sold (trade date). Dividend income is recorded on the ex-dividend date. Gains and losses are determined on the identified cost basis, which is the same basis used for federal income tax purposes.
Estimates
The preparation of financial statements in conformity with accounting principles generally accepted in the United States of America requires management to make estimates and assumptions that affect the reported amount of assets and liabilities and disclosure of contingent assets and liabilities at the date of the financial statements and the reported amounts of income and expenses during the reporting period. Actual results could differ from those estimates.
Indemnifications
In the normal course of business, the Fund may enter into contracts that contain provisions for indemnification of other parties against certain potential liabilities. The Fund’s maximum exposure under these arrangements is unknown, and would involve future claims that may be made against the Fund that have not yet occurred. Currently, the risk of material loss from such claims is considered remote.
Dividends and Distributions
The Fund generally declares and distributes dividends of net investment income quarterly. Net realized capital gains (if any) are distributed annually. The Fund may treat a portion of the amount paid to redeem shares as a distribution of investment company taxable income and realized capital gains that are reflected in the NAV. This practice, commonly referred to as “equalization,” has no effect on the redeeming shareholder or a Fund’s total return, but may reduce the amounts that would otherwise be required to be paid as taxable dividends to the remaining shareholders. It is possible that the Internal Revenue Service (IRS) could challenge the Fund’s equalization methodology or calculations, and any such challenge could result in additional tax, interest, or penalties to be paid by the Fund.
Federal Income Taxes
The Fund intends to continue to qualify as a regulated investment company and distribute all of its taxable income in accordance with the requirements of Subchapter M of the Internal Revenue Code. Management has analyzed the Fund’s tax positions taken for all open federal income tax years, generally a three-year period, and has concluded that no provision for federal income tax is required in the Fund’s financial statements. The Fund is not aware of any tax positions for which it is reasonably possible that the total amounts of unrecognized tax benefits will significantly change in the next twelve months.
2. Derivative Instruments
The Fund may invest in various types of derivatives. A derivative is a financial instrument whose performance is derived from the performance of another asset. The Fund may invest in derivative instruments including, but not limited to: futures contracts, options, and swaps. Each derivative instrument that was held by the Fund during the year ended October 31, 2017 is discussed in further detail below.
The Fund may use derivative instruments for risk management purposes or as part of its investment strategies. The Fund’s use of derivative instruments involves risks different from, or possibly greater than, the risks associated with
| | |
| | Janus Detroit Street Trust ½ 15 |
Janus Velocity Tail Risk Hedged Large Cap ETF
Notes to Financial Statements
investing directly in securities and other traditional investments. Derivatives are subject to a number of risks including liquidity risk, market risk, credit risk, default risk, counterparty risk and management risk. They also involve the risk of mispricing or improper valuation and the risk that changes in the value of the derivative may not correlate exactly with the change in the value of the underlying asset, rate or index. Also, suitable derivative transactions may not be available in all circumstances and there can be no assurance that the Fund will engage in these transactions to reduce exposure to other risks when that would be beneficial. The Fund’s ability to use derivatives may also be limited by certain regulatory and tax considerations.
In pursuit of its investment objective, the Fund may seek to use derivatives to increase or decrease exposure to the following market risk factors:
| • | | Counterparty Risk – the risk that the counterparty (the party on the other side of the transaction) on a derivative transaction will be unable to honor its financial obligation to the Fund. |
| • | | Credit Risk – the risk an issuer will be unable to make principal and interest payments when due, or will default on its obligations. |
| • | | Equity Risk – the risk related to the change in value of equity securities as they relate to increases or decreases in the general market. |
| • | | Index Risk – if the derivative is linked to the performance of an index, it will be subject to the risks associated with changes in that index. If the index changes, the Fund could receive lower interest payments or experience a reduction in the value of the derivative to below what the Fund paid. Certain indexed securities, including inverse securities (which move in an opposite direction to the index), may create leverage, to the extent that they increase or decrease in value at a rate that is a multiple of the changes in the applicable index. |
| • | | Interest Rate Risk – the risk that the value of fixed-income securities will generally decline as prevailing interest rates rise, which may cause the Fund’s NAV to likewise decrease. |
| • | | Liquidity Risk – the risk that certain securities may be difficult or impossible to sell at the time that the seller would like or at the price that the seller believes the security is currently worth. |
Derivatives may generally be traded OTC or on an exchange. Derivatives traded OTC are agreements that are individually negotiated between parties and can be tailored to meet a purchaser’s needs. OTC derivatives are not guaranteed by a clearing agency and may be subject to increased credit risk.
Swaps
Swap agreements are two-party contracts entered into primarily by institutional investors for periods ranging from a day to more than one year to exchange one set of cash flows for another. The most significant factor in the performance of swap agreements is the change in value of the specific index, security, or currency, or other factors that determine the amounts of payments due to and from the Fund. The use of swaps is a highly specialized activity which involves investment techniques and risks different from those associated with ordinary portfolio securities transactions. Swap agreements entail the risk that a party will default on its payment obligations to the Fund. If the other party to a swap defaults, the Fund would risk the loss of the net amount of the payments that it contractually is entitled to receive. If the Fund utilizes a swap at the wrong time or judges market conditions incorrectly, the swap may result in a loss to the Fund and reduce the Fund’s total return.
Swap agreements also bear the risk that the Fund will not be able to meet its obligation to the counterparty. Swap agreements are typically privately negotiated and entered into in the OTC market. However, certain swap agreements are required to be cleared through a clearinghouse and traded on an exchange or swap execution facility. Swaps that are required to be cleared are required to post initial and variation margins in accordance with the exchange requirements. Regulations enacted require the Fund to centrally clear certain interest rate and credit default index swaps through a clearinghouse or central counterparty (“CCP”). To clear a swap with a CCP, the Fund will submit the swap to, and post collateral with, a futures clearing merchant (“FCM”) that is a clearinghouse member.
Index swaps, interest rate swaps, and credit default swaps are valued using an approved vendor supplied price. Basket swaps are valued using a broker supplied price. Equity swaps that consist of a single underlying equity are valued either at the closing price, the latest bid price, or the last sale price on the primary market or exchange it trades. The market value of swap contracts are aggregated by positive and negative values and are disclosed separately as an asset or liability on the Fund’s Statement of Assets and Liabilities (if applicable). Realized gains and losses are reported on the Statement of Operations (if applicable). The change in unrealized net appreciation or depreciation during the period is included in the Statement of Operations (if applicable).
The Fund’s maximum risk of loss from counterparty risk or credit risk is the discounted value of the payments to be received from/paid to the counterparty over the contract’s remaining life, to the extent that the amount is positive. The
Janus Velocity Tail Risk Hedged Large Cap ETF
Notes to Financial Statements
risk is mitigated by having a netting arrangement between the Fund and the counterparty and by the posting of collateral by the counterparty to cover the Fund’s exposure to the counterparty.
Total return swaps involve an exchange by two parties in which one party makes payments based on a set rate, either fixed or variable, while the other party makes payments based on the return of an underlying asset, which includes both the income it generates and any capital gains over the payment period. A fixed-income total return swap may be written on many different kinds of underlying reference assets, and may include different indices for various kinds of debt securities (e.g., U.S. investment grade bonds, high-yield bonds, or emerging market bonds).
During the year, the Fund entered into total return swaps on equity volatility indices in order to track the funds underlying index. These total return swaps require the Fund to pay a floating reference interest rate, and an amount equal to the negative price movement of the index multiplied by the notional amount of the contract. The Fund will receive payments equal to the positive price movement of the same index multiplied by the notional amount of the contract and, in some cases, dividends paid on the securities.
3. Other Investments and Strategies
Additional Investment Risk
The financial crisis in both the U.S. and global economies over the past several years has resulted, and may continue to result, in a significant decline in the value and liquidity of many securities of issuers worldwide in the equity and fixed income/credit markets. In response to the crisis, the United States and certain foreign governments, along with the U.S. Federal Reserve and certain foreign central banks, took steps to support the financial markets. The withdrawal of this support, a failure of measures put in place to respond to the crisis, or investor perception that such efforts were not sufficient could each negatively affect financial markets generally, and the value and liquidity of specific securities. In addition, policy and legislative changes in the United States and in other countries continue to impact many aspects of financial regulation. The effect of these changes on the markets, and the practical implications for market participants, including the Fund, may not be fully known for some time. As a result, it may also be unusually difficult to identify both investment risks and opportunities, which could limit or preclude the Fund’s ability to achieve its investment objective. Therefore, it is important to understand that the value of your investment may fall, sometimes sharply, and you could lose money.
The enactment of the Dodd-Frank Wall Street Reform and Consumer Protection Act (the “Dodd-Frank Act”) provided for widespread regulation of financial institutions, consumer financial products and services, broker-dealers, OTC derivatives, investment advisers, credit rating agencies, and mortgage lending, which expanded federal oversight in the financial sector, including the investment management industry. Certain provisions of the Dodd-Frank Act remain pending and will be implemented through future rulemaking. Therefore, the ultimate impact of the Dodd-Frank Act and the regulations under the Dodd-Frank Act on the Fund and the investment management industry as a whole, is not yet certain.
A number of countries in the European Union (“EU”) have experienced, and may continue to experience, severe economic and financial difficulties. In particular, many EU nations are susceptible to economic risks associated with high levels of debt, notably due to investments in sovereign debt of countries such as Greece, Italy, Spain, Portugal, and Ireland. Many non-governmental issuers, and even certain governments, have defaulted on, or been forced to restructure, their debts. Many other issuers have faced difficulties obtaining credit or refinancing existing obligations. Financial institutions have in many cases required government or central bank support, have needed to raise capital, and/or have been impaired in their ability to extend credit. As a result, financial markets in the EU experienced extreme volatility and declines in asset values and liquidity. Responses to these financial problems by European governments, central banks, and others, including austerity measures and reforms, may not work, may result in social unrest, and may limit future growth and economic recovery or have other unintended consequences. Further defaults or restructurings by governments and others of their debt could have additional adverse effects on economies, financial markets, and asset valuations around the world. Greece, Ireland, and Portugal have already received one or more “bailouts” from other Eurozone member states, and it is unclear how much additional funding they will require or if additional Eurozone member states will require bailouts in the future. The risk of investing in securities in the European markets may also be heightened due to the referendum in which the United Kingdom voted to exit the EU (known as “Brexit”). One or more other countries may also abandon the euro and/ or withdraw from the EU, placing its currency and banking system in jeopardy.
Certain areas of the world have historically been prone to and economically sensitive to environmental events such as, but not limited to, hurricanes, earthquakes, typhoons, flooding, tidal waves, tsunamis, erupting volcanoes, wildfires or droughts, tornadoes, mudslides, or other weather-related phenomena. Such disasters, and the resulting physical or economic damage, could have a severe and negative impact on the Fund’s investment portfolio and, in the longer term, could impair the ability of issuers in which the Fund invests to conduct their businesses as they would under normal conditions.
| | |
| | Janus Detroit Street Trust ½ 17 |
Janus Velocity Tail Risk Hedged Large Cap ETF
Notes to Financial Statements
Adverse weather conditions may also have a particularly significant negative effect on issuers in the agricultural sector and on insurance companies that insure against the impact of natural disasters.
Counterparties
Fund transactions involving a counterparty are subject to the risk that the counterparty or a third party will not fulfill its obligation to the Fund (“counterparty risk”). Counterparty risk may arise because of the counterparty’s financial condition (i.e., financial difficulties, bankruptcy, or insolvency), market activities and developments, or other reasons, whether foreseen or not. A counterparty’s inability to fulfill its obligation may result in significant financial loss to the Fund. The Fund may be unable to recover its investment from the counterparty or may obtain a limited recovery, and/or recovery may be delayed. The extent of the Fund’s exposure to counterparty risk with respect to financial assets and liabilities approximates its carrying value. See the “Offsetting Assets and Liabilities” section of this Note for further details.
The Fund may be exposed to counterparty risk through participation in various programs, including, but not limited to, lending its securities to third parties, cash sweep arrangements whereby the Fund’s cash balance is invested in one or more types of cash management vehicles, as well as investments in, but not limited to, repurchase agreements, and derivatives, including various types of swaps, futures and options. The Fund intends to enter into financial transactions with counterparties that Janus Capital believes to be creditworthy at the time of the transaction. There is always the risk that Janus Capital’s analysis of a counterparty’s creditworthiness is incorrect or may change due to market conditions. To the extent that the Fund focuses its transactions with a limited number of counterparties, it will have greater exposure to the risks associated with one or more counterparties.
Exchange-Traded Funds
The Fund may invest in exchange-traded funds (“ETFs”) to gain exposure to a particular portion of the market. ETFs are typically open-end investment companies, which may be actively managed or passively managed, that generally seek to track the performance of a specific index. ETFs are traded on a national securities exchange at market prices that may vary from the NAV of their underlying investments. Accordingly, there may be times when an ETF trades at a premium or discount. When the Fund invests in an ETF, in addition to directly bearing the expenses associated with its own operations, it will bear a pro rata portion of the ETF’s expenses. As a result, the cost of investing in the Fund may be higher than the cost of investing directly in ETFs and may be higher than other mutual funds that invest directly in stocks and bonds. ETFs also involve the risk that an active trading market for an ETF’s shares may not develop or be maintained. Similarly, because the value of ETF shares depends on the demand in the market, the Fund may not be able to purchase or sell an ETF at the most optimal time, which could adversely affect the Fund’s performance. In addition, ETFs that track particular indices may be unable to match the performance of such underlying indices due to the temporary unavailability of certain index securities in the secondary market or other factors, such as discrepancies with respect to the weighting of securities. Because the Fund may invest in ETFs that provide exposure to a broad range of securities, such risks may include, but are not limited to, leverage risk, foreign exposure risk, interest rate risk, and commodity-linked investments risk. The Fund is also subject to substantially the same risks as those associated with direct exposure to the securities held by the ETF.
Offsetting Assets and Liabilities
The Fund presents gross and net information about transactions that are either offset in the financial statements or subject to an enforceable master netting arrangement or similar agreement with a designated counterparty, regardless of whether the transactions are actually offset in the Statement of Assets and Liabilities.
In order to better define its contractual rights and to secure rights that will help the Fund mitigate its counterparty risk, the Fund may enter into an International Swaps and Derivatives Association, Inc. Master Agreement (“ISDA Master Agreement”) or similar agreement with its derivative contract counterparties. An ISDA Master Agreement is a bilateral agreement between the Fund and a counterparty that governs OTC derivatives and forward foreign currency exchange contracts and typically contains, among other things, collateral posting terms and netting provisions in the event of a default and/or termination event. Under an ISDA Master Agreement, in the event of a default and/or termination event, the Fund may offset with each counterparty certain derivative financial instruments’ payables and/or receivables with collateral held and/or posted and create one single net payment. For financial reporting purposes, the Fund does not offset financial instruments’ payables and receivables and related collateral on the Statement of Assets and Liabilities.
Janus Velocity Tail Risk Hedged Large Cap ETF
Notes to Financial Statements
The following table presents gross amounts of recognized assets and/or liabilities and the net amounts after deducting collateral that has been pledged by counterparties or has been pledged to counterparties (if applicable). For corresponding information grouped by type of instrument, see either the “Fair Value of Derivative Instruments as of October 31, 2017” table located in Note 2 of these Notes to Financial Statements and/or the Fund’s Schedule of Investments.
Offsetting of Financial Liabilities and Derivative Liabilities
| | | | | | | | | | | | | | | | |
| Counterparty | | Gross Amounts of
Recognized Liabilities | | | Offsetting Asset
or Liability(a) | | | Collateral
Pledged(b) | | | Net Amount | |
| BNP Paribas S.A. | | $ | 646,922 | | | $ | — | | | $ | (646,922) | | | $ | — | |
| (a) | Represents the amount of assets or liabilities that could be offset with the same counterparty under master netting or similar agreements that management elects not to offset on the Statement of Assets and Liabilities. |
| (b) | Collateral pledged is limited to the net outstanding amount due to/from an individual counterparty. The actual collateral amounts pledged may exceed these amounts and may fluctuate in value. |
The Fund may require the counterparty to pledge securities as collateral daily (based on the daily valuation of the financial asset) if the Fund has a net aggregate unrealized gain on OTC derivative contracts with a particular counterparty. The Fund may deposit cash as collateral with the counterparty and/or custodian daily (based on the daily valuation of the financial asset) if the Fund has a net aggregate unrealized loss on OTC derivative contracts with a particular counterparty. The collateral amounts are subject to minimum exposure requirements and initial margin requirements. Collateral amounts are monitored and subsequently adjusted up or down as valuations fluctuate by at least the minimum exposure requirement. Collateral may reduce the risk of loss.
Securities Lending
Under procedures adopted by the Trustees, the Fund may seek to earn additional income by lending securities to qualified parties. Deutsche Bank AG acts as securities lending agent and a limited purpose custodian or subcustodian to receive and disburse cash balances and cash collateral, hold short-term investments, hold collateral, and perform other custodian functions. The Fund may lend portfolio securities in an amount equal to up to 1/3 of its total assets as determined at the time of the loan origination. There is the risk of delay in recovering a loaned security or the risk of loss in collateral rights if the borrower fails financially. In addition, Janus Capital makes efforts to balance the benefits and risks from granting such loans. All loans will be continuously secured by collateral which may consist of cash, U.S. Government securities, domestic and foreign short-term debt instruments, letters of credit, time deposits, repurchase agreements, money market mutual funds or other money market accounts, or such other collateral as permitted by the SEC. If the Fund is unable to recover a security on loan, the Fund may use the collateral to purchase replacement securities in the market. There is a risk that the value of the collateral could decrease below the cost of the replacement security by the time the replacement investment is made, resulting in a loss to the Fund.
Upon receipt of cash collateral, Janus Capital may invest it in affiliated or non-affiliated cash management vehicles, whether registered or unregistered entities, as permitted by the 1940 Act and rules promulgated thereunder. Janus Capital currently intends to invest the cash collateral in a cash management vehicle for which Janus Capital serves as investment adviser, Janus Cash Collateral Fund LLC. An investment in Janus Cash Collateral Fund LLC is generally subject to the same risks that shareholders experience when investing in similarly structured vehicles, such as the potential for significant fluctuations in assets as a result of the purchase and redemption activity of the securities lending program, a decline in the value of the collateral, and possible liquidity issues. Such risks may delay the return of the cash collateral and cause the Fund to violate its agreement to return the cash collateral to a borrower in a timely manner. As adviser to the Fund and Janus Cash Collateral Fund LLC, Janus Capital has an inherent conflict of interest as a result of its fiduciary duties to both the Fund and Janus Cash Collateral Fund LLC. Additionally, Janus Capital receives an investment advisory fee of 0.05% for managing Janus Cash Collateral Fund LLC, but it may not receive a fee for managing certain other affiliated cash management vehicles in which the Fund may invest, and therefore may have an incentive to allocate preferred investment opportunities to investment vehicles for which it is receiving a fee.
The value of the collateral must be at least 102% of the market value of the loaned securities that are denominated in U.S. dollars and 105% of the market value of the loaned securities that are not denominated in U.S. dollars. Loaned securities and related collateral are marked-to-market each business day based upon the market value of the loaned securities at the close of business, employing the most recent available pricing information. Collateral levels are then adjusted based on this mark-to-market evaluation.
The cash collateral invested by Janus Capital is disclosed in the Schedule of Investments (if applicable). Income earned from the investment of the cash collateral, net of rebates paid to, or fees paid by, borrowers and less the fees paid to the
| | |
| | Janus Detroit Street Trust ½ 19 |
Janus Velocity Tail Risk Hedged Large Cap ETF
Notes to Financial Statements
lending agent are included as “Affiliated securities lending income, net” on the Statement of Operations. There were no securities on loan as of October 31, 2017.
4. Investment Advisory Agreements and Other Transactions with Affiliates
Effective February 22, 2016, the Fund entered into an investment advisory agreement with Janus Capital. Under its unitary fee structure, the Fund pays Janus Capital a management fee in return for providing certain investment advisory, supervisory, and administrative services to the Fund, including the costs of transfer agency, custody, fund administration, legal, audit, and other services. Janus Capital’s fee structure is designed to pay substantially all of the Fund’s expenses. However, the Fund bears other expenses which are not covered under the management fee which may vary and affect the total level of expenses paid by shareholders, such as distribution fees (if any), brokerage expenses or commissions, interest, dividends, taxes, litigation expenses, acquired fund fees and expenses (if any), and extraordinary expenses. The Fund’s management fee is calculated daily and paid monthly. The Fund’s contractual management fee rate (expressed as an annual rate) is 0.65% of the Fund’s average daily net assets.
Prior to the Reorganization on July 18, 2016, ALPS Advisors, Inc. (“ALPS”), the Predecessor Fund’s investment advisor, had entered into an investment advisory agreement with ALPS ETF Trust, whereby ALPS earned, on a monthly basis, an advisory fee equal to an annual rate of 0.65% of the Predecessor Fund’s average daily net assets.
Prior to the Reorganization on July 18, 2016, ALPS Fund Services, Inc. served as the Predecessor Fund’s administrator. ALPS Fund Services, Inc. did not receive any additional compensation for serving as administrator for the Predecessor Fund.
Effective February 22, 2016, Janus Capital serves as administrator to the Fund, providing oversight and coordination of the Fund’s service providers, recordkeeping and other administrative services.
State Street Bank and Trust Company (“State Street”) provides certain fund administration services to the Fund, including services related to the Fund’s accounting, including calculating the daily NAV, audit, tax, and reporting obligations, pursuant to an agreement with Janus Capital, on behalf of the Fund. As compensation for such services, Janus Capital pays State Street a fee based on a percentage of the Fund’s assets, with a minimum flat fee, for certain services. Janus Capital serves as administrator to the Fund, providing oversight and coordination of the Fund’s service providers, recordkeeping and other administrative services. Janus Capital does not receive any additional compensation, beyond the unitary fee, for serving as administrator. State Street also serves as transfer agent for the shares of the Fund.
The Trust has adopted a Distribution and Servicing Plan for shares of the Fund pursuant to Rule 12b-1 under the 1940 Act (the “Plan”). The Plan permits compensation in connection with the distribution and marketing of Fund shares and/or the provision of certain shareholder services. The Plan permits the Fund to pay ALPS Distributors, Inc. (the “Distributor”) or its designee, a fee for the sale and distribution and/or shareholder servicing of the shares at an annual rate of up to 0.25% of average daily net assets of the Fund. However, the Trustees have determined not to authorize payment under this Plan at this time. Under the terms of the Plan, the Trust is authorized to make payments to the Distributor or its designee for remittance to retirement plan service providers, broker-dealers, bank trust departments, financial advisors, and other financial intermediaries, as compensation for distribution and/or shareholder services performed by such entities for their customers who are investors in the Fund. The 12b-1 fee may only be imposed or increased when the Trustees determine that it is in the best interests of shareholders to do so. Because these fees are paid out of the Fund’s assets on an ongoing basis, to the extent that a fee is authorized, over time they will increase the cost of an investment in the Fund. The Plan fee may cost an investor more than other types of sales charges.
As of October 31, 2017, Janus Capital owned 1 share or less than 0.01% of the Fund.
The Fund is permitted to purchase or sell securities (“cross-trade”) between itself and other funds or accounts managed by Janus Capital in accordance with Rule 17a-7 under the Investment Company Act of 1940 (“Rule 17a-7”), when the transaction is consistent with the investment objectives and policies of the Fund and in accordance with the Internal Cross Trade Procedures adopted by the Trust’s Board of Trustees. These procedures have been designed to ensure that any cross-trade of securities by the Fund from or to another fund or account that is or could be considered an affiliate of the Fund under certain limited circumstances by virtue of having a common investment adviser, common Officer, or common Trustee complies with Rule 17a-7. Under these procedures, each cross-trade is effected at the current market price to save costs where allowed. During the year ended October 31, 2017, the Fund engaged in cross trades amounting to $81,293 in sales, resulting in a net realized gain of $6,347. The net realized gain is included within the “Net Realized Gain/(Loss) on Investments” section of the Fund’s Statement of Operations.
Janus Velocity Tail Risk Hedged Large Cap ETF
Notes to Financial Statements
5. Federal Income Tax
The tax components of capital shown in the table below represent: (1) distribution requirements the Fund must satisfy under the income tax regulations; (2) losses or deductions the Fund may be able to offset against income and gains realized in future years; and (3) unrealized appreciation or depreciation of investments for federal income tax purposes.
Other book to tax differences primarily consist of deferred compensation, derivatives, and foreign currency contract adjustments. The Fund has elected to treat gains and losses on forward foreign currency contracts as capital gains and losses, if applicable. Other foreign currency gains and losses on debt instruments are treated as ordinary income for federal income tax purposes pursuant to Section 988 of the Internal Revenue Code.
| | | | | | | | | | | | | | | | | | | | | | | | | | |
| | | | | | | | | | Loss Deferrals | | | | | | | |
Undistributed
Ordinary Income | | | Undistributed Long-Term Gains | | | Accumulated
Capital Losses | | | Late-Year
Ordinary Loss | | | Post-October
Capital Loss | | | Other Book to Tax Differences | | | Net Tax Appreciation/
(Depreciation) | |
| $ | — | | | $ | — | | | $ | (3,781,983) | | | $ | — | | | $ | — | | | $ | (646,922) | | | $ | 2,062,850 | |
Accumulated capital losses noted below represent net capital loss carryovers, as of October 31, 2017, that may be available to offset future realized capital gains and thereby reduce future taxable gains distributions. The following table shows these capital loss carryovers.
| | | | | | | | | | |
Capital Loss Carryover Schedule
For the year ended October 31, 2017
No Expiration | | | Accumulated
Capital Losses | |
| Short-Term | | | Long-Term | | |
| $ | (2,969,522) | | | $ | (812,461) | | | $ | (3,781,983) | |
The aggregate cost of investments and the composition of unrealized appreciation and depreciation of investment securities for federal income tax purposes as of October 31, 2017 are noted below. The primary difference between book and tax appreciation or depreciation of investments is wash sale loss deferrals.
| | | | | | | | | | | | | | |
| Federal Tax Cost | | | Unrealized Appreciation | | | Unrealized (Depreciation) | | | Net Tax Appreciation/
(Depreciation) | |
| $ | 10,937,356 | | | $ | 2,062,850 | | | $ | — | | | $ | 2,062,850 | |
Information on the tax components of derivatives as of October 31, 2017 is as follows:
| | | | | | | | | | | | | | |
| Federal Tax Cost | | | Unrealized Appreciation | | | Unrealized (Depreciation) | | | Net Tax Appreciation/
(Depreciation) | |
| $ | — | | | $ | — | | | $ | (646,922) | | | $ | (646,922) | |
Income and capital gains distributions are determined in accordance with income tax regulations that may differ from accounting principles generally accepted in the United States of America. These differences are due to differing treatments for items such as net short-term gains, deferral of wash sale losses, foreign currency transactions, passive foreign investment companies, net investment losses, in-kind transactions, and capital loss carryovers. Certain permanent differences such as tax returns of capital and net investment losses noted below have been reclassified to capital.
| | | | | | | | | | | | | | |
| For the year ended October 31, 2017 | |
| Distributions | | | | |
| From Ordinary Income | | | From Long-Term Capital Gains | | | Tax Return of Capital | | | Net Investment Loss | |
| $ | 233,493 | | | $ | — | | | $ | — | | | $ | — | |
|
| For the year ended October 31, 2016 | |
| Distributions | | | | |
| From Ordinary Income | | | From Long-Term Capital Gains | | | Tax Return of Capital | | | Net Investment Loss | |
| $ | 438,800 | | | $ | — | | | $ | — | | | $ | — | |
| | |
| | Janus Detroit Street Trust ½ 21 |
Janus Velocity Tail Risk Hedged Large Cap ETF
Notes to Financial Statements
| | | | | | | | | | | | | | |
| For the year ended November 30, 2015 | |
| Distributions | | | | |
| From Ordinary Income | | | From Long-Term Capital Gains | | | Tax Return of Capital | | | Net Investment Loss | |
| $ | 307,279 | | | $ | — | | | $ | — | | | $ | — | |
Permanent book to tax basis differences may result in reclassifications between the components of net assets. These differences have no impact on the results of operations or net assets. The following reclassifications have been made to the Fund:
| | | | | | | | | | |
| Increase/(Decrease) to Capital | | | Increase/(Decrease) to Undistributed
Net Investment Income/Loss | | | Increase/(Decrease) to Undistributed
Net realized Gain/Loss | |
| $ | 761,313 | | | $ | 7,749 | | | $ | (769,062) | |
6. Capital Share Transactions
| | | | | | | | | | | | | | | | | | | | | | | | |
| | | Year ended October 31, 2017 | | | Period ended October 31, 2016(1) | | | Year ended November 30, 2015(2) | |
| | | Shares | | | Amount | | | Shares | | | Amount | | | Shares | | | Amount | |
| Shares sold | | | 100,000 | | | $ | 2,773,215 | | | | 750,000 | | | $ | 20,452,406 | | | | 450,000 | | | $ | 12,811,839 | |
| Shares repurchased | | | (200,000) | | | | (5,919,602) | | | | (1,650,000) | | | | (43,914,450) | | | | (200,002) | | | | (5,622,035) | |
| Net Increase/(Decrease) | | | (100,000) | | | $ | (3,146,387) | | | | (900,000) | | | $ | (23,462,044) | | | | 249,998 | | | $ | 7,189,804 | |
| (1) | Period from December 1, 2015 through October 31, 2016. The Fund changed its fiscal year end from November 30 to October 31. |
| (2) | Period from December 1, 2014 through November 30, 2015. |
7. Purchases and Sales of Investment Securities
For the year ended October 31, 2017, the aggregate cost of purchases and proceeds from sales of investment securities (excluding any short-term securities, short-term options contracts, and in-kind transactions) was as follows:
| | | | | | | | | | | | | | |
Purchases of Securities | | | Proceeds from Sales of Securities | | | Purchases of Long- Term U.S. Government Obligations | | | Proceeds from Sales of Long-Term U.S. Government Obligations | |
| $ | 31,122 | | | $ | 1,077,288 | | | $ | — | | | $ | — | |
For the year ended October 31, 2017, the cost of in-kind purchases and proceeds from in-kind sales, were as follows:
| | | | | | | | | | | | | | |
Purchases of Securities | | | Proceeds from Sales of Securities | | | Purchases of Long- Term U.S. Government Obligations | | | Proceeds from Sales of Long-Term U.S. Government Obligations | |
| $ | 2,363,848 | | | $ | 5,038,094 | | | $ | — | | | $ | — | |
During the year ended October 31, 2017, the Fund had net realized gain/(loss) of $813,223 from in-kind redemptions. Gains on in-kind transactions are not considered taxable for federal income tax purposes.
8. Recent Accounting Pronouncements
The Securities and Exchange Commission (“SEC”) adopted new rules as well as amendments to its rules to modernize the reporting and disclosure of information by registered investment companies. In addition, the SEC adopted amendments to Regulation S-X, which require standardized, enhanced disclosure about derivatives in investment company financial statements, as well as other amendments. The compliance date of the amendments to Regulation SX was August 1, 2017. This report incorporates the amendments to Regulation S-X.
The FASB issued Accounting Standards Update No. 2017-08, Receivables – Nonrefundable Fees and Other Costs (Subtopic 310-20), Premium Amortization on Purchased Callable Debt Securities (“ASU 2017-08”) to amend the amortization period for certain purchased callable debt securities held at a premium. The guidance requires certain premiums on callable debt securities to be amortized to the earliest call date. The amortization period for callable debt
Janus Velocity Tail Risk Hedged Large Cap ETF
Notes to Financial Statements
securities purchased at a discount will not be impacted. The amendments are effective for fiscal years, and interim periods within those fiscal years, beginning after December 15, 2018. Early adoption is permitted, including adoption in an interim period. Management is currently evaluating the impacts of ASU 2017-08 on the financial statements.
9. Merger Related Matters
On October 3, 2016, Janus Capital Group Inc. (“JCGI”), the direct parent of Janus Capital Management LLC, the investment adviser to the Fund (“Janus Capital”), and Henderson Group plc (“Henderson”) announced that they had entered into an Agreement and Plan of Merger (“Merger Agreement”) relating to the strategic combination of Henderson and JCGI (the “Merger”). Pursuant to the Merger Agreement, a newly formed, direct wholly-owned subsidiary of Henderson merged with and into JCGI, with JCGI as the surviving corporation and a direct wholly-owned subsidiary of Henderson.
The consummation of the Merger may have been deemed to cause an “assignment” (as defined in the Investment Company Act of 1940 Act, as amended) of the advisory agreement between the Fund and Janus Capital. As a result, the consummation of the Merger may have caused the pre-merger investment advisory agreement to terminate automatically in accordance with its terms.
On October 24, 2016, the Fund’s Board of Trustees approved, subject to shareholder approval, a new investment advisory agreement between the Fund and Janus Capital in order to permit Janus Capital to continue providing advisory services to the Fund following the closing of the Merger (“Post-Merger Advisory Agreement”). At the same meeting, the Trustees approved submitting the Post-Merger Advisory Agreement to Fund shareholders for approval.
On March 17, 2017, shareholders of the Fund approved the Post-Merger Advisory Agreement, which took effect upon the consummation of the Merger on May 30, 2017.
10. Subsequent Event
Management has evaluated whether any events or transactions occurred subsequent to October 31, 2017 and through the date of issuance of the Fund’s financial statements and determined that there were no material events or transactions that would require recognition or disclosure in the Fund’s financial statements.
| | |
| | Janus Detroit Street Trust ½ 23 |
Janus Velocity Tail Risk Hedged Large Cap ETF
Additional Information (unaudited)
Proxy Voting Policies and Voting Record
A description of the policies and procedures that the Fund uses to determine how to vote proxies relating to its portfolio securities is available without charge: (i) upon request, by calling 1-800-525-0020 (toll free); (ii) on the Fund’s website at janushenderson.com/proxyvoting; and (iii) on the SEC’s website at http://www.sec.gov.
Quarterly Portfolio Holdings
The Fund files its complete portfolio holdings (schedule of investments) with the SEC for the first and third quarters of each fiscal year on Form N-Q within 60 days of the end of such fiscal quarter. The Fund’s Form N-Q: (i) is available on the SEC’s website at http://www.sec.gov; (ii) may be reviewed and copied at the SEC’s Public Reference Room in Washington, D.C. (information on the Public Reference Room may be obtained by calling 1-800-SEC-0330); and (iii) is available without charge, upon request, by calling Janus Henderson at 1-800-525-0020 (toll free).
Designation Requirements (Unaudited)
For federal income tax purposes, the Fund designated the following for the year ended October 31, 2017
| | | | |
| Dividends Received Deduction Percentage | | | 89% | |
| Qualified Dividend Income Percentage | | | 100% | |
Licensing Agreements
Janus Index & Calculation Services LLC (“Janus Index Services”) is the Index Provider for the Underlying Index. Janus Capital has entered into a license agreement with Janus Index Services to use the Underlying Index. Janus Index Services is affiliated with the Fund and Janus Capital. This affiliation may create potential conflicts for Janus Index Services as it may have an interest in the performance of the Fund, which could motivate it to alter the Underlying Index methodology for the Underlying Index. Janus Index Services has adopted procedures that it believes are reasonably designed to mitigate these and other potential conflicts.
Janus Index Services is the licensor of certain trademarks, service marks, and trade names. Neither Janus Index Services nor any of its affiliates make any representation or warranty, express or implied, to the owners of the Fund or any member of the public regarding the advisability of investing in securities generally or in the Fund particularly or the ability of the Underlying Index to track general market performance. The Underlying Index is determined, composed, and calculated by Janus Index Services without regard to Janus Capital or the Fund. Janus Index Services has no obligation to take the needs of Janus Capital or the owners of the Fund into consideration in determining, composing, or calculating the Underlying Index. Janus Index Services is not responsible for and has not participated in the determination of the timing of, prices at, or quantities of the Fund to be issued or in the determination or calculation of the equation by which the Fund is to be converted into cash.
ALTHOUGH JANUS INDEX SERVICES SHALL OBTAIN INFORMATION FOR INCLUSION IN OR FOR USE IN THE CALCULATION OF THE UNDERLYING INDEX FROM SOURCES WHICH IT CONSIDERS RELIABLE, IT DOES NOT GUARANTEE THE QUALITY, ACCURACY AND/OR THE COMPLETENESS OF THE UNDERLYING INDEX OR ANY DATA INCLUDED THEREIN AND SHALL HAVE NO LIABILITY FOR ERRORS OR OMISSIONS OF ANY KIND RELATED TO THE UNDERLYING INDEX OR DATA. JANUS INDEX SERVICES MAKES NO WARRANTY, EXPRESS OR IMPLIED, AS TO RESULTS TO BE OBTAINED BY JANUS CAPITAL, OWNERS OF THE FUND, OR ANY OTHER PERSON OR ENTITY FROM THE USE OF THE UNDERLYING INDEX OR ANY DATA INCLUDED THEREIN IN CONNECTION WITH THE RIGHTS LICENSED TO JANUS CAPITAL FOR ANY OTHER USE. JANUS INDEX SERVICES MAKES NO EXPRESS OR IMPLIED WARRANTIES, AND HEREBY EXPRESSLY DISCLAIMS ALL WARRANTIES OF MERCHANTABILITY OR FITNESS FOR A PARTICULAR PURPOSE OR USE WITH RESPECT TO THE UNDERLYING INDEX OR ANY DATA INCLUDED THEREIN. WITHOUT LIMITING ANY OF THE FOREGOING, IN NO EVENT SHALL IT HAVE ANY LIABILITY FOR ANY SPECIAL, PUNITIVE, INDIRECT, OR CONSEQUENTIAL DAMAGES (INCLUDING LOST PROFITS), EVEN IF NOTIFIED OF THE POSSIBILITY OF SUCH DAMAGES.
Janus Capital does not guarantee the accuracy and/or the completeness of the Underlying Index or any data included therein, and Janus Capital shall have no liability for any errors, omissions or interruptions therein. Janus Capital makes no warranty, express or implied, as to results to be obtained by the Fund, owners of the shares of the Fund or any other person or entity from the use of the Underlying Index or any data included therein. Janus Capital makes no express or implied warranties, and expressly disclaims all warranties of merchantability or fitness for a particular purpose or use with respect to the Underlying Index or any data included therein. Without limiting any of the foregoing, in no event shall Janus Capital have any liability for any special, punitive, direct, indirect or consequential damages (including lost profits) arising out of matters relating to the use of the Underlying Index even if notified of the possibility of such damages.
Janus Velocity Tail Risk Hedged Large Cap ETF
Board Considerations Regarding Approval of Investment Advisory Agreements (unaudited)
APPROVAL OF ADVISORY AGREEMENT DURING THE PERIOD FOR JANUS VELOCITY TAIL RISK HEDGED LARGE CAP ETF AND JANUS VELOCITY VOLATILITY HEDGED LARGE CAP ETF
The Trustees of Janus Detroit Street Trust (the “Trust”), the majority of whom serve as “independent” Trustees (the “Independent Trustees”) met on February 3, 2016 to consider the proposed investment management agreement (the “Investment Management Agreement”) for Janus Velocity Tail Risk Hedged Large Cap ETF and Janus Velocity Volatility Hedged Large Cap ETF (each a “New Hedged Equity Fund” and collectively, the “New Hedged Equity Funds”). In the course of their consideration of the Investment Management Agreement, the Trustees met in executive session and were advised by their independent counsel. In this regard, the Board, including the Independent Trustees, evaluated the terms of the Investment Management Agreement and reviewed the duties and responsibilities of the Trustees in evaluating and approving such agreements. In considering approval of the Investment Management Agreement, the Board, including the Independent Trustees, reviewed the Board Materials and other information from counsel and from Janus Capital Management LLC, the investment adviser (the “Adviser”), including: (i) a copy of the form of Investment Management Agreement, with respect to the Adviser’s management of the assets of each New Hedged Equity Fund; (ii) information describing the nature, quality and extent of the services that the Adviser will provide to the New Hedged Equity Fund, and the fees the Adviser will charge to the New Hedged Equity Funds; (iii) information concerning the Adviser’s financial condition, business, operations, portfolio management teams and compliance programs; (iv) information describing each New Hedged Equity Fund’s anticipated advisory fee and operating expenses; (v) a copy of the Adviser’s current Form ADV; and (vi) a memorandum from counsel on the responsibilities of trustees in considering investment advisory arrangements under the 1940 Act. The Board also considered presentations made by, and discussions held with, representatives of the Adviser. The Board also received information comparing the advisory fees and expenses of the New Hedged Equity Funds to those from fund complexes that were defined as competitors.
During its review of this information, the Board focused on and analyzed the factors that the Board deemed relevant, including: the nature, extent and quality of the services to be provided to each New Hedged Equity Fund by the Adviser; the Adviser’s personnel and operations; each New Hedged Equity Fund’s proposed expense level; the anticipated profitability to the Adviser under the Investment Management Agreement at certain asset levels; any “fall-out” benefits to the Adviser and its affiliates (i.e., the ancillary benefits realized by the Adviser and its affiliates from the Adviser’s relationship with the Trust); the effect of asset growth on each New Hedged Equity Fund’s expenses; and possible conflicts of interest.
The Trustees also considered benefits that accrue to the Adviser and its affiliates from their relationships with the New Hedged Equity Funds. They recognized that an affiliate of the Adviser would separately serve the New Hedged Equity Funds as index provider. The Trustees also concluded that, other than the services provided by the Adviser and its affiliates pursuant to the agreements and the fees to be paid by the New Hedged Equity Funds therefor, the New Hedged Equity Funds and the Adviser may potentially benefit from their relationship with each other in other ways. They concluded that the success of the New Hedged Equity Funds could attract other business to the Adviser or other Janus funds, and that the success of the Adviser could enhance the Adviser’s ability to serve the New Hedged Equity Funds. The Board considered and determined that the services provided by the Adviser to the New Hedged Equity Funds were in addition to, rather than duplicative of, services provided under the advisory contracts of the ETFs in which these funds intended on investing.
The Board, including the Independent Trustees, considered the following in respect of each New Hedged Equity Fund:
The nature, extent and quality of services to be provided by the Adviser; personnel and operations of the Adviser.
The Board reviewed the services that the Adviser would provide to each New Hedged Equity Fund. In connection with the investment advisory services to be provided by the Adviser, the Board noted the responsibilities that the Adviser would have as the Funds’ investment adviser, including: the overall supervisory responsibility for the general management and investment of each New Hedged Equity Fund’s securities portfolio; providing oversight of the investment performance and processes and compliance with each New Hedged Equity Fund’s investment objectives, policies and limitations; the implementation of the investment management program of each New Hedged Equity Fund; the management of the day-to-day investment and reinvestment of the assets of each New Hedged Equity Fund; determining daily baskets of deposit securities and cash components; executing portfolio security trades for purchases and redemptions of New Hedged Equity Fund shares conducted on a cash-in-lieu basis; the responsibility for daily monitoring of tracking error and quarterly reporting to the Board; the review of brokerage matters; the oversight of general portfolio compliance with relevant law; and the implementation of Board directives as they relate to the New Hedged Equity Funds.
| | |
| | Janus Detroit Street Trust ½ 25 |
Janus Velocity Tail Risk Hedged Large Cap ETF
Board Considerations Regarding Approval of Investment Advisory Agreements (unaudited)
The Board reviewed the Adviser’s experience, resources and strengths in managing other pooled investment vehicles, including the Adviser’s personnel. Based on its consideration and review of the foregoing information, the Board determined that each New Hedged Equity Fund was likely to benefit from the nature, quality and extent of these services, as well as the Adviser’s ability to render such services based on their experience, personnel, operations and resources.
Comparison of services to be rendered and fees to be paid to those under other investment advisory contracts, and the cost of the services to be provided and profits to be realized by the Advisers from the relationship with the New Hedged Equity Funds; “fall-out” benefits.
The Board then compared both the services to be rendered and the proposed fees to be paid under other contracts of the Adviser, and under contracts of other investment advisers with respect to similar ETFs. In particular, the Board compared each New Hedged Equity Fund’s proposed advisory fee and projected expense ratio to other investment companies considered to be in that New Hedged Equity Fund’s peer group. The Board also received and considered information about the fee rates charged to other accounts and clients that are managed by the Adviser, including information about the differences in services provided to the non-registered investment company clients. With regard to each New Hedged Equity Fund, the Board noted the following:
The Board noted that the Adviser was recommending a unitary fee that was lower than each New Hedged Equity Fund’s respective peer group median total expense ratio.
The Board also discussed the anticipated costs and projected profitability of the Adviser in connection with its serving as investment adviser to each New Hedged Equity Fund, including operational costs. In addition, the Board discussed the entrepreneurial risk undertaken by the Adviser in creating the Trust. After comparing each New Hedged Equity Fund’s proposed fees with those of other funds in the New Hedged Equity Fund’s peer group, and in light of the nature, extent and quality of services proposed to be provided by the Adviser and the costs expected to be incurred by the Adviser in rendering those services, the Board concluded that the level of fees proposed to be paid to the Adviser with respect to the New Hedged Equity Funds were fair and reasonable.
The Board also considered that the Adviser may experience reputational “fall-out” benefits based on the success of the New Hedged Equity Funds, but that such benefits are not easily quantifiable.
The extent to which economies of scale would be realized as the Funds grow and whether fee levels would reflect such economies of scale.
The Board next discussed potential economies of scale. Since the Trust is newly formed, the Trust and the New Hedged Equity Funds had not commenced operations, and the eventual aggregate amount of assets was uncertain, the Adviser was not able to provide the Board with specific information concerning the extent to which economies of scale would be realized as each New Hedged Equity Fund grows and whether fee levels would reflect such economies of scale, if any. The Board recognized the uncertainty in launching a new investment product and estimating future asset levels.
Investment performance of the Funds and the Adviser.
Because each New Hedged Equity Fund is newly formed and had not commenced operations, the Board did not consider the investment performance of the New Hedged Equity Funds or the Adviser. The Board noted that it had received performance information of comparable operational ETFs tracking similar underlying indices.
Conclusion.
No single factor was determinative to the decision of the Board. Based on the foregoing and such other matters as were deemed relevant, the Board concluded that the proposed advisory fee rate and projected total expense ratio are reasonable in relation to the services to be provided by the Adviser to each New Hedged Equity Fund, as well as the costs to be incurred and benefits to be gained by the Adviser in providing such services. The Board also found the proposed advisory fees to be reasonable in comparison to the fees charged by advisers to other comparable funds of similar actual or anticipated size. As a result, the Board concluded that the initial approval of the Investment Management Agreement was in the best interests of each New Hedged Equity Fund.
After full consideration of the above factors, as well as other factors, the Trustees, with the Independent Trustees voting separately, determined to approve the investment advisory agreement for each New Hedged Equity Fund.
Janus Velocity Tail Risk Hedged Large Cap ETF
Board Considerations Regarding Approval of Investment Advisory Agreements (unaudited)
APPROVAL OF ADVISORY AGREEMENT DURING THE PERIOD WITH THE ADVISER POST-MERGER
On October 3, 2016, Janus Capital Group Inc. (“JCGI”), the direct parent of Janus Capital Management LLC, the investment adviser to the Funds (the “Adviser”), and Henderson Group plc (“Henderson”) announced that they had entered into an Agreement and Plan of Merger (“Merger Agreement”) relating to the business combination of Henderson and JCGI (the “Merger”). Pursuant to the Merger Agreement, a newly formed, direct wholly-owned subsidiary of Henderson will merge with and into JCGI, with JCGI as the surviving corporation and a direct wholly-owned subsidiary of Henderson. The Merger is expected to close in the second quarter of 2017, subject to requisite shareholder and regulatory approvals. The consummation of the Merger may be deemed to be an “assignment” (as defined in the Investment Company Act of 1940, as amended) of the advisory agreement between the Fund and Janus Capital. As a result, the consummation of the Merger will cause such advisory agreement to terminate automatically in accordance with its terms.
The Trustees of the Trust, the majority of whom are Independent Trustees met on October 24, 2016, and at various times in advance of that date, which meeting was called for the purpose of considering the proposed investment management agreement (the “New Investment Management Agreement”) between the Adviser as a subsidiary of Henderson following the consummation of the Merger and the following series of the Trust: Janus Small Cap Growth Alpha ETF, Janus Small/Mid Cap Growth Alpha ETF, The Organics ETF, The Long-Term Care ETF, The Obesity ETF, The Health and Fitness ETF, Janus Velocity Tail Risk Hedged Large Cap ETF and Janus Velocity Volatility Hedged Large Cap ETF (each a “Fund” and collectively, the “Funds”). The Independent Trustees met with representatives of the Adviser to discuss the anticipated effects of the Merger. During these meetings, the Adviser indicated its belief that the Merger would not adversely affect the continued operation of the Funds or the capabilities of the investment advisory personnel who currently manage the Funds to continue to provide these and other services to the Funds at the current levels. The Adviser also indicated that it believed that the Merger could provide certain benefits to the Funds but that there could be no assurance as to any particular benefits that might result.
In the course of their consideration of the New Investment Management Agreement, the Trustees met in executive session and were advised by their independent counsel. In this regard, the Board, including the Independent Trustees, evaluated the terms of the New Investment Management Agreement and reviewed the duties and responsibilities of the Trustees in evaluating and approving such agreements. In considering approval of the Investment Management Agreement, the Board, including the Independent Trustees, reviewed the board materials (the “Materials”) and other information provided in advance of the meeting from counsel, the Adviser, as well as from Henderson, including: (i) a copy of the form of New Investment Management Agreement, with respect to the Adviser’s management of the assets of each Fund; (ii) information describing the nature, quality and extent of the services that will be provided to each Fund, and the fees that will be charged to the Funds; (iii) information concerning the Adviser’s and Henderson’s financial condition, business, operations, portfolio management teams and compliance programs; (iv) information describing each Fund’s anticipated advisory fee and operating expenses; (v) information concerning the anticipated structure of the post-Merger entity (“Janus Henderson”); and (v) a memorandum from counsel on the responsibilities of trustees in considering investment advisory arrangements under the 1940 Act. The Board also considered presentations made by, and discussions held with, representatives of the Adviser. The Board also noted the information previously provided to the Board during 2016 related to the initial approvals of each Fund.
During its review of this information, the Board focused on and analyzed the factors that the Board deemed relevant, including, among other matters:
| 1) | That the material terms regarding advisory services pursuant to the New Investment Management Agreement are substantially identical to the terms of the current investment management agreement with the Adviser; |
| 2) | That there is not expected to be any diminution in the nature, extent and quality of the services provided to the Funds and their shareholders by Janus Henderson, including compliance services; |
| 3) | The commitment of the Adviser to retain key personnel currently employed by the Adviser who provide services to the Funds; |
| 4) | That the manner in which each Fund’s assets are managed would not change as a result of the Merger, and that the same portfolio managers managing each Fund’s assets are expected to continue to do so after the Merger; |
| 5) | The terms and conditions of the New Investment Management Agreement, including the current advisory fee rates and operational expenses, are the same as the current fee rates under the current investment management agreement; |
| | |
| | Janus Detroit Street Trust ½ 27 |
Janus Velocity Tail Risk Hedged Large Cap ETF
Board Considerations Regarding Approval of Investment Advisory Agreements (unaudited)
| 6) | That each Fund’s expense ratios are not expected to increase as a result of the Merger or approval of the New Investment Management Agreement; |
| 7) | That the fees and expense ratios of the Funds relative to comparable investment companies continued to be reasonable given the quality of services provided; |
| 8) | The history, reputation, qualification and background of Henderson, as well as its financial condition; |
| 9) | The reputation, financial strength, corporate structure and capital resources of Henderson and its investment advisory subsidiaries and the anticipated financial strength of Janus Henderson; |
| 10) | The long-term business goals of the Adviser and Henderson with respect to the Funds; |
| 11) | That, pursuant to the terms of the Merger, Henderson has acknowledged the Advisor’s reliance upon the benefits and protections provided by Section 15(f) and has agreed not to take, and to cause its affiliates not to take, any action that would have the effect, directly or indirectly, of causing the requirements of any of the provisions of Section 15(f) not to be met in respect of the Merger; |
| 12) | That shareholders would not bear any costs in connection with the Merger, that the Adviser will bear the costs, fees and expenses incurred by the Funds in connection with the Proxy Statement, including all expenses in connection with the solicitation of proxies, the fees and expenses of attorneys relating to the Merger and Proxy Statement, and other fees and expenses incurred by the Funds, if any, in connection with the Merger; |
| 13) | The Adviser’s commitment to provide resources to the Funds and the potential for increased distribution capabilities as a result of the Merger, which have the potential to result in long-term economies of scale; and |
| 14) | That the Adviser and Henderson would derive benefits from the Merger and that, as a result, they have a different financial interest in the matters that were being considered than do Fund shareholders. |
In connection with their consideration of the New Investment Advisory Agreement on October 24 2016, the Board noted that, in February 2016, April 2016 and October 2016, the Board had initially approved the respective Funds’ current investment advisory agreements. The Trustees considered that, in connection with the foregoing approvals, the Board had determined that the Adviser had the capabilities, resources and personnel necessary to provide the services to each Fund required under the current investment advisory agreement, and the advisory fee rates paid by each Fund, taking into account the unitary fees charged to the Funds, represented reasonable compensation to the Adviser in light of the services provided. The Trustees noted that the Board also considered the cost to the Adviser of providing those services, potential economies of scale as each Fund’s assets grow, the fees and expenses paid by other comparable funds, and such other matters as the Board had considered relevant in the exercise of their reasonable business judgment.
To inform their consideration of the New Agreement, the Independent Trustees received and considered responses by the Adviser and Henderson to inquiries requesting information regarding: Henderson’s structure, operations, financial resources and key personnel; the material aspects of the Merger, the proposed operations of Janus Henderson and its compliance program, code of ethics, trading policies and key management and investment personnel, including each Fund’s portfolio managers; and anticipated changes to the management or operations of the Board and the Funds, including, if applicable, any changes to the Funds’ service providers, advisory fees and expense structure.
In considering the information and materials described above, the Independent Trustees received assistance from, and met separately with, independent legal counsel and were provided with a written description of their statutory responsibilities and the legal standards that are applicable to approvals of advisory agreements. The Board did not identify any particular information that was most relevant to its consideration to approve the New Investment Management Agreement for each Fund and each Trustee may have afforded different weight to the various factors. Legal counsel to the Independent Trustees provided the Board with a memorandum regarding its responsibilities pertaining to the approval of the New Agreement. In determining whether to approve the New Investment Management Agreement, the Board considered the best interests of each Fund separately.
In voting to approve the New Investment Management Agreement, the Board considered the overall fairness of the New Investment Management Agreement and factors it deemed relevant with respect to each Fund, including, but not limited to: (i) the nature, extent and quality of the services to be provided by Janus Henderson, (ii) that the investment personnel who currently manage the Funds would continue to manage the Funds as employees of Janus Henderson, (iii) that the fees and expenses of the Funds after the Transaction are expected to remain the same, (iv) the projected profitability of the Funds to Janus Henderson and its affiliates; (v) whether the projected economies of scale would be realized as the Funds grow and whether any breakpoints are appropriate at certain asset levels and (vi) other benefits that may accrue
Janus Velocity Tail Risk Hedged Large Cap ETF
Board Considerations Regarding Approval of Investment Advisory Agreements (unaudited)
Janus Henderson from its relationship with the Funds. The Board also considered that the Transaction might not be consummated if the New Investment Management Agreement was not approved by the Board and the shareholders of each Fund.
Although not meant to be all-inclusive, set forth below is a description of the information and certain factors that were considered by the Board, including the Independent Trustees in deciding to approve the New Investment Management Agreement in respect of each Fund:
The nature, extent and quality of services to be provided by Janus Henderson; personnel and operations of Janus Henderson.
In considering the nature, extent and quality of the services to be provided by Janus Henderson under the New Investment Management Agreement, the Board considered that the terms of the New Investment Management Agreement are substantially similar to the terms of the current investment management agreement. The Board considered that the level of service and manner in which each Fund’s assets are managed were expected to remain the same.
The Board considered that, for a period of time after closing, the Adviser expects that the operations of Janus Henderson, as they relate to the Funds, would be the same as those of the Adviser. The Board considered that the Adviser’s key personnel who provide services to the Funds are expected to provide those same services after the Merger. The Board also noted that the Merger is not expected to result in any change in the structure or operations of the Funds and that the Adviser does not currently anticipate any immediate changes to the Funds’ key service providers.
In evaluating Janus Henderson, the Board considered the history, background, reputation and qualification of the Adviser and Henderson, as well as their personnel and Henderson’s financial condition. The Board considered that Henderson is a global asset management firm that was established in 1934, and that it has a long history of asset management around the world. The Board also considered Henderson’s capabilities, experience, corporate structure and capital resources, as well as the Adviser’s long-term business goals with respect to the Janus Henderson Merger and the Funds.
Based on its consideration and review of the foregoing information, the Board determined that each Fund was likely to benefit from the nature, quality and extent of these services, as well as the Janus Henderson’s ability to render such services based on their experience, personnel, operations and resources.
Cost of the services to be provided and profits to be realized by Janus Henderson from the relationship with the Funds; “fall-out” benefits.
The Board noted that the unitary fee currently in place for each Fund will remain in place and unchanged under the New Investment Management Agreement.
The Board also discussed the anticipated costs and projected profitability of Janus Henderson in connection with its serving as investment adviser to each Fund, including operational costs. In addition, the Board discussed that the Funds’ expenses were not expected to increase materially as a result of the Merger. The Board also noted that Henderson does not currently provide any investment management services to other exchange traded funds. In light of the nature, extent and quality of services proposed to be provided by Janus Henderson and the costs expected to be incurred by Janus Henderson in rendering those services, the Board concluded that the level of fees proposed to be paid to Janus Henderson with respect to the Funds were fair and reasonable.
The extent to which economies of scale would be realized as the Funds grow and whether fee levels would reflect such economies of scale.
The Board next discussed potential economies of scale. The Board discussed the promised continued commitment to expand the distribution of Fund shares, and the potential for increased distribution capabilities as a result of the Merger, which have the potential to result in long-term economies of scale.
The Board also noted that since the Trust is newly formed, the eventual aggregate amount of assets was uncertain, and therefore specific information concerning the extent to which economies of scale would be realized as each Fund grows and whether fee levels would reflect such economies of scale, if any, was difficult to determine. The Board recognized the uncertainty in launching new investment products and estimating future asset levels.
| | |
| | Janus Detroit Street Trust ½ 29 |
Janus Velocity Tail Risk Hedged Large Cap ETF
Board Considerations Regarding Approval of Investment Advisory Agreements (unaudited)
Other Benefits to Janus Henderson.
The Board considered other potential benefits that may accrue to Janus Henderson as a result of its relationship with the Funds, which include reputational benefits that may enhance Janus Henderson’s ability to gain business opportunities from other clients.
Conclusion.
No single factor was determinative to the decision of the Board. Based on, but not limited to, the foregoing, and such other matters as were deemed relevant, the Board concluded that the New Investment Management Agreement was fair and reasonable in light of the services to be performed, fees, expenses and such other matters as the Board considered relevant in the exercise of its business judgment.
After full consideration of the above factors, as well as other factors, the Trustees, with the Independent Trustees voting separately, determined to approve the New Investment Management Agreement with respect to the Funds.
Janus Velocity Tail Risk Hedged Large Cap ETF
Shareholder Meeting (unaudited)
A Special Meeting of Shareholders of the Fund was held on March 17, 2017. At the meeting, the following matter was voted on and approved by the Shareholders. Each whole or fractional vote reported represents one whole or fractional dollar of net asset value held on the record date for the meeting. The results of the Special Meeting of Shareholders are noted below.
Proposal 1
To approve a new investment advisory agreement.
| | | | | | | | | | |
| | | | Number of Votes ($) |
| Record Date Votes ($) | | | Affirmative | | Against/Withhold | | Abstain | | Broker Non-Votes |
| | 18,356,000.000 | | | 10,091,959.360 | | 62,353.920 | | 214,482.800 | | 0.000 |
| | |
| | Janus Detroit Street Trust ½ 31 |
Janus Velocity Tail Risk Hedged Large Cap ETF
Trustees and Officers (unaudited)
The Fund’s Statement of Additional Information includes additional information about the Trustees and officers and is available, without charge, by calling 1-877-335-2687.
The following are the Trustees and officers of the Trust, together with a brief description of their principal occupations during the last five years (principal occupations for certain Trustees may include periods over five years).
Each Trustee has served in that capacity since he or she was originally elected or appointed. The Trustees do not serve a specified term of office. Each Trustee will hold office until the termination of the Trust or his or her earlier death, resignation, retirement, incapacity, or removal. Under the Fund’s Governance Procedures and Guidelines, the policy is for Trustees to retire no later than the end of the calendar year in which the Trustee turns 75. The Trustees review the Fund’s Governance Procedures and Guidelines from time to time and may make changes they deem appropriate. The Fund’s Nominating and Governance Committee will consider nominees for the position of Trustee recommended by shareholders. Shareholders may submit the name of a candidate for consideration by the Committee by submitting their recommendations to the Trust’s Secretary. Each Trustee is currently a Trustee of one other registered investment company advised by Janus Capital: Clayton Street Trust. Collectively, these two registered investment companies consist of 12 series or funds.
The Trust’s officers are elected annually by the Trustees for a one-year term. Certain officers also serve as officers of Clayton Street Trust. Certain officers of the Fund may also be officers and/or directors of Janus Capital. Fund officers receive no compensation from the Fund, except for the Fund’s Chief Compliance Officer, as authorized by the Trustees.
| | | | | | | | | | | | | | | | | | |
| TRUSTEES | | | | | | | | | | | | | | |
| Name, Address, and Age | | Positions Held with the Trust | | | Length of Time Served | | | Principal Occupations
During the Past Five Years | | Number of
Portfolios/Funds
in Fund Complex
Overseen by
Trustee | | | Other Directorships
Held by Trustee
During the Past Five Years | |
Independent Trustees | | | | | | | | | | | | | | | | | | |
Clifford J. Weber 151 Detroit Street Denver, CO 80206 DOB: 1963 | |
| Chairman
Trustee |
| |
| 2/16-Present
2/16-Present |
| | Owner, Financial Products Consulting Group LLC (consulting services to financial institutions) (since 2015). Formerly, Executive Vice President of Global Index and Exchange- Traded Products, NYSE Market, Inc., a subsidiary of Intercontinental Exchange (ETF/ETP listing exchange) (2013-2015) and Executive Vice President and Head of Strategy and Product Development, NYSE Liffe U.S., a division of NYSE Euronext (U.S. futures exchange) (2008-2013). | | | 12 | | |
| Independent Trustee,
Clough Funds Trust
(investment company)
(since 2015);
Chairman, Clough
Funds Trust
(investment company)
(since 2017);
Independent Trustee,
Clough Dividend and
Income Fund (closed-
end fund) (since
2017); Independent
Trustee, Clough
Global Opportunities
Fund (closed-end
fund) (since 2017);
Independent Trustee,
Clough Global Equity
Fund (closed-end
fund) (since 2017);
Independent Trustee,
Elevation ETF Trust
(since 2016);
Chairman, Elevation
ETF Trust
(since 2017) |
|
Janus Velocity Tail Risk Hedged Large Cap ETF
Trustees and Officers (unaudited)
| | | | | | | | | | | | | | | | | | |
| TRUSTEES | | | | | | | | | | | | | | |
| Name, Address, and Age | | Positions Held with the Trust | | | Length of Time Served | | | Principal Occupations
During the Past Five Years | | Number of
Portfolios/Funds
in Fund Complex
Overseen by
Trustee | | | Other Directorships
Held by Trustee
During the Past Five Years | |
Maureen T. Upton 151 Detroit Street Denver, CO 80206 DOB: 1965 | | | Trustee | | | | 2/16-Present | | | Principal, Maureen Upton Ltd. (consulting services to developers of major infrastructure projects and investors) (since 2017). Formerly, Principal Consultant, SRK Consulting (U.S.), Inc. (consulting services to global mining, energy and water resource industries) (2015-2017) and Founder and Principal, Resource Initiatives LLC (sustainability consulting firm) (2006-2015). | | | 12 | | |
| Director, Denver
Metro Leadership
Foundation (non-
profit organization)
(2012-2014). |
|
| | | | | |
Jeffrey B. Weeden 151 Detroit Street Denver, CO 80206 DOB: 1956 | | | Trustee | | | | 2/16-Present | | | Senior Advisor, BayBoston Capital LP (investment fund in banks and bank holdings companies) (since 2015). Management Advisor, BoxCast, Inc. (technology start-up company) (2014-2017). Formerly Senior Executive Vice President and Chief Financial Officer, KeyCorp (financial services) (2002-2013). | | | 12 | | |
| Director, State
Farm
Bank (banking)
(since 2014). |
|
Interested Trustee | | | | | | | | | | | | | | | | | | |
Michael Drew Elder** 151 Detroit Street Denver, CO 80206 DOB: 1970 | | | Trustee | | | | 8/15-Present | | | Executive Vice President and Head of U.S. Intermediary Distribution, Janus Capital (since 2014) and President, Janus Distributors LLC (broker-dealer) (since 2014). Formerly, Senior Vice President, Janus Capital (2007-2014). | | | 12 | | |
| Director, Perkins
Investment
Management LLC
(since 2014). |
|
| ** | Michael Drew Elder is an Interested Trustee because of his employment with Janus Capital. |
| | |
| | Janus Detroit Street Trust ½ 33 |
Janus Velocity Tail Risk Hedged Large Cap ETF
Trustees and Officers (unaudited)
| | | | | | |
| OFFICERS | | | | | | |
| Name, Address, and Age | | Positions Held with the Trust | | Term of Office* and Length of Time Served | | Principal Occupations
During the Past Five Years |
Bruce L. Koepfgen 151 Detroit Street Denver, CO 80206 DOB: 1952 | | President and Chief Executive Officer | | 2/16-Present | | Head of North America for Janus Henderson Investors and Janus Capital Management (since 2017); Executive Vice President and Director of Janus International Holding LLC (since 2011); Executive Vice President of Janus Distributors LLC (since 2011); Vice President and Director of INTECH Investment Management LLC (since 2011); Executive Vice President and Director of Perkins Investment Management LLC (since 2011); and Executive Vice President and Director of Janus Management Holdings Corporation (since 2011). Formerly, President of Janus Capital Group Inc. and Janus Capital Management LLC (2013-2017); Executive Vice President of Janus Services LLC (2011-2015), Janus Capital Group Inc. and Janus Capital Management LLC (2011-2013); and Chief Financial Officer of Janus Capital Group Inc., Janus Capital Management LLC, Janus Distributors LLC, Janus Management Holdings Corporation, and Janus Services LLC (2011-2013). |
| | | |
Susan K. Wold 151 Detroit Street Denver, CO 80206 DOB: 1960 | | Vice President, Chief Compliance Officer, and Anti-Money Laundering Officer | | 10/17-Present; Vice President, Provisional Chief Compliance Officer, and Anti-Money Laundering Officer (9/17-10/17) | | Senior Vice President and Head of Compliance, North America for Janus Henderson (since September 2017); Formerly, Vice President, Head of Global Corporate Compliance, and Chief Compliance Officer for Janus Capital Management (May 2017-September 2017); Vice President, Compliance at Janus Capital Group and Janus Capital Management (2005-2017). |
| | | |
Jesper Nergaard 151 Detroit Street Denver, CO 80206 DOB: 1962 | | Vice President, Chief Financial Officer, Treasurer, and Principal Accounting Officer | | 2/16-Present | | Vice President of Janus Capital and Janus Services LLC. |
| | | |
Kathryn L. Santoro 151 Detroit Street Denver, CO 80206 DOB: 1973 | | Vice President, Secretary and Chief Legal Counsel | | 1/17-Present | | Vice President of Janus Capital and Janus Services LLC (since 2016). Formerly, Vice President and Associate Counsel of Curian Capital, LLC and Curian Clearing LLC (2013-2016); and General Counsel and Secretary (2011-2012) and Vice President (2009-2012) of Old Mutual Capital, Inc. |
| * | Officers are elected at least annually by the Trustees for a one-year term and may also be elected from time to time by the Trustees for an interim period. |
Janus Velocity Tail Risk Hedged Large Cap ETF
Notes
| | |
| | Janus Detroit Street Trust ½ 35 |
Janus Velocity Tail Risk Hedged Large Cap ETF
Notes
Janus Velocity Tail Risk Hedged Large Cap ETF
Notes
| | |
| | Janus Detroit Street Trust ½ 37 |
Knowledge. Shared
At Janus Henderson, we believe in the sharing of expert insight for better investment and business decisions. We call this ethos Knowledge. Shared.
Learn more by visiting janushenderson.com.
This report is submitted for the general information of shareholders of the Fund. It is not an offer or solicitation for the Fund and is not authorized for distribution to prospective investors unless preceded or accompanied by an effective prospectus.
Janus Henderson is a trademark of Janus Henderson Investors. © Janus Henderson Investors. The name Janus Henderson Investors includes HGI Group Limited, Henderson Global Investors (Brand Management) Sarl and Janus International Holding LLC.
Janus Capital Management LLC is the investment adviser and ALPS Distributors, Inc. is the distributor. ALPS is not affiliated with Janus Henderson or any of its subsidiaries.
ANNUAL REPORT
October 31, 2017
Janus Velocity Volatility Hedged Large Cap ETF
Janus Detroit Street Trust

Table of Contents
Janus Velocity Volatility Hedged Large Cap ETF (unaudited)
INVESTMENT OBJECTIVE
The Janus Velocity Volatility Hedged Large Cap ETF (“Exchange Traded Fund” or “ETF”) seeks to provide investment results that correspond generally, before fees and expenses, to the performance of the VelocityShares Volatility Hedged Large Cap Index (“the Underlying Index”). The Underlying Index is an index comprised of three large capitalization equity ETFs and two volatility related ETFs (“The Underlying Index ETFs”). The ETF will seek to achieve its investment objective by investing at least 80% of its total assets in Underlying Index ETFs. The ETF also intends to invest 15%, but may invest up to 20%, of its assets in swap agreements or other derivatives instead of investing directly in certain Underlying Index ETFs.
PERFORMANCE OVERVIEW
| • | | Stocks rallied after the November U.S. presidential election on the expectation the new administration would champion pro-growth initiatives that would benefit the U.S. economy. Signs of synchronized economic growth in major world economies and corporate earnings strength were also supportive of stocks. During the period, the market experienced some volatility as investors questioned whether Congress would be able to successfully implement the administration’s proposed policies. However, stocks delivered strong returns during the 12-month period. |
| • | | During the period, the Janus Velocity Volatility Hedged Large Cap ETF (SPXH) returned 21.13% (based on NAV); its primary benchmark, the VelocityShares Volatility Hedged Large Cap Index, returned 21.82%, and its secondary benchmark, the S&P 500 Index, returned 23.63%. |
| • | | SPXH seeks to provide investment results that correspond generally, before fees and expenses, to the performance of its primary benchmark. This core ETF addresses the challenge of efficiently hedging the downside risk of an equity portfolio, and is designed to provide a systematic solution to that problem via exposure to VIX® futures. It’s comprised of an 85% exposure to large-cap equities (S&P 500® Index) and a 15% exposure to a volatility component designed to efficiently hedge against large market declines. SPXH automatically rebalances back to these target allocations at each month end. |
| | |
| | Janus Detroit Street Trust ½ 1 |
Janus Velocity Volatility Hedged Large Cap ETF (unaudited)
Fund At A Glance
October 31, 2017
| | | | |
| Top Holdings – (% of Net Assets) | |
SPDR S&P 500 Trust | | | 28.3% | |
Vanguard S&P 500 | | | 28.3% | |
iShares Core S&P 500 | | | 28.3% | |
State Street Institutional U.S. Government Money Market Fund | | | 12.0% | |
| | | | |
| | | 96.9% | |
Holdings are subject to change without notice.
Janus Velocity Volatility Hedged Large Cap ETF (unaudited)
Performance
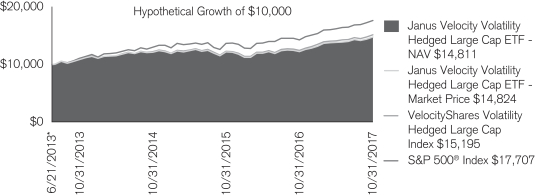
| | | | |
| Average Annual Total Return for the periods ended October 31, 2017 |
| | | One Year | | Since
Inception* |
Janus Velocity Volatility Hedged Large Cap ETF – NAV | | 21.13% | | 9.42% |
Janus Velocity Volatility Hedged Large Cap ETF – Market Price | | 21.15% | | 9.44% |
VelocityShares Volatility Hedged Large Cap Index | | 21.82% | | 10.07% |
S&P 500® Index | | 23.63% | | 14.00% |
Total annual expense ratio as stated in the February 28, 2017 prospectus: 0.70%.
Returns quoted are past performance and do not guarantee future results; current performance may be lower or higher. Investment returns and principal value will vary; there may be a gain or loss when shares are sold. For the most recent month-end performance call 800.668.0434 or visit janushenderson.com/performance.
Shares of ETFs are bought and sold at market price (not NAV) and are not individually redeemed from the Fund. Market returns are based upon the midpoint of the bid/ask spread at 4:00 p.m. Eastern time (when NAV is normally determined for most ETFs), and do not represent the returns you would receive if you traded shares at other times. Ordinary brokerage commissions apply and will reduce returns.
ETF shares are not individually redeemable and owners of the shares may acquire those shares from the Fund and tender those shares for redemption to the Fund in Creation Units only.
Investing involves risk, including the possible loss of principal and fluctuation of value.
Performance depends on that of the underlying index.
See the prospectus for a more complete discussion of objectives, risks and expenses.
Returns include reinvestment of dividends and capital gains. Returns greater than one year are annualized. Returns do not reflect the deduction of taxes that a shareholder would pay on Fund distributions or redemptions of Fund shares.
See Financial Highlights for actual expense ratios during the reporting period.
The Fund commenced operations on July 18, 2016, after the reorganization of Janus Velocity Volatility Hedged Large Cap ETF, the Fund’s predecessor fund (“Predecessor Fund”), into the Fund. The performance shown prior to July 18, 2016 reflects the historical performance of the Predecessor Fund prior to the reorganization, calculated using the fees and expenses of the Predecessor Fund. If the Fund had been available during periods prior to July 18, 2016, the performance shown may have been different. The Fund’s financial statements incorporate the financial statements of the Predecessor Fund for periods prior to July 18, 2016.
There is no assurance the stated objective(s) will be met.
See Notes to Schedule of Investments and Other Information for index definitions.
Index performance does not reflect the expenses of managing a portfolio as an index is unmanaged and not available for direct investment.
The index provider is Janus Index and Calculation Services LLC (“Janus Index”). Janus Index maintains the indices and calculates the index levels and performance shown or discussed, but does not manage actual assets. Janus Index receives compensation in connection with licensing its indices to third parties including the provision of any related data.
Effective February 28, 2017 Edward Tom, Benjamin Wang and Scott Weiner are Co-Portfolio Managers of the Fund.
| * | The Predecessor Fund’s inception date is June 21, 2013. |
| | |
| | Janus Detroit Street Trust ½ 3 |
Janus Velocity Volatility Hedged Large Cap ETF (unaudited)
Disclosure of Fund Expenses
As a shareholder of the Fund, you incur two types of costs: (1) transaction costs, which may include creation and redemption fees or brokerage charges and (2) ongoing costs, including management fees and other Fund expenses. This example is intended to help you understand your ongoing costs (in dollars) of investing in the Fund and to compare these costs with the ongoing costs of investing in other ETFs. To do so, compare this 5% hypothetical example with the 5% hypothetical examples that appear in the shareholder reports of the other funds. The example is based upon an investment of $1,000 invested at the beginning of the period and held for the six-months indicated, unless noted otherwise in the table and footnotes below.
Actual Expenses
The information in the table under the heading “Actual” provides information about actual account values and actual expenses. You may use the information in these columns, together with the amount you invested, to estimate the expenses that you paid over the period. Simply divide your account value by $1,000 (for example, an $8,600 account value divided by $1,000 = 8.6), then multiply the result by the number under the heading entitled “Expenses Paid During Period” to estimate the expenses you paid on your account during the period.
Hypothetical Example for Comparison Purposes
The information in the table under the heading “Hypothetical (5% return before expenses)” provides information about hypothetical account values and hypothetical expenses based upon the Fund’s actual expense ratio and an assumed rate of return of 5% per year before expenses, which is not the Fund’s actual return. The hypothetical account values and expenses may not be used to determine the actual ending account balance or expenses you paid for the period. You may use this information to compare the ongoing costs of investing in the Fund and other funds. To do so, compare this 5% hypothetical example with the 5% hypothetical examples that appear in the shareholder reports of the other funds. Additionally, for an analysis of the fees associated with an investment or other similar funds, please visit www.finra.org/fundanalyzer.
Please note that the expenses shown in the table are meant to highlight your ongoing costs only and do not reflect any transaction costs, such as creation and redemption fees, or brokerage charges. These fees are fully described in the Fund’s prospectus. Therefore, the hypothetical examples are useful in comparing ongoing costs only, and will not help you determine the relative total costs of owning different funds. In addition, if these transaction costs were included, your costs would have been higher.
| | | | | | | | | | | | | | | | | | | | | | | | |
Actual | | | Hypothetical
(5% return before expenses) | | | | |
Beginning
Account
Value
(5/1/17) | | Ending
Account
Value
(10/31/2017) | | | Expenses
Paid During
Period
(5/1/17 - 10/31/2017)† | | | Beginning
Account
Value
(5/1/17) | | | Ending
Account
Value
(10/31/2017) | | | Expenses
Paid During
Period
(5/1/17 - 10/31/2017)† | | | Net Annualized
Expense Ratio
(5/1/17 - 10/31/2017)†† | |
| $1,000.00 | | $ | 1,069.70 | | | $ | 3.39 | | | $ | 1,000.00 | | | $ | 1,021.93 | | | $ | 3.31 | | | | 0.65% | |
| † | Expenses Paid During Period is equal to the Net Annualized Expense Ratio multiplied by the average account value over the period, multiplied by 184/365 (to reflect the one-half year period). |
| †† | Ratios do not include indirect expenses of the underlying funds and/or investment companies in which the Fund invests. |
Janus Velocity Volatility Hedged Large Cap ETF
Report of Independent Registered Public Accounting Firm
To the Board of Trustees of Janus Detroit Street Trust and Shareholders of
Janus Velocity Volatility Hedged Large Cap ETF:
In our opinion, the accompanying statement of assets and liabilities, including the schedule of investments, and the related statements of operations and of changes in net assets and the financial highlights present fairly, in all material respects, the financial position of the Janus Velocity Volatility Hedged Large Cap ETF (one of the funds constituting Janus Detroit Street Trust, hereafter referred to as the “Fund”) as of October 31, 2017, the results of its operations for the year then ended, and the changes in its net assets and the financial highlights for the year then ended and for the period from December 1, 2015 through October 31, 2016, in conformity with accounting principles generally accepted in the United States of America. These financial statements and financial highlights (hereafter referred to as “financial statements”) are the responsibility of the Fund’s management. Our responsibility is to express an opinion on these financial statements based on our audits. We conducted our audits of these financial statements in accordance with the standards of the Public Company Accounting Oversight Board (United States). Those standards require that we plan and perform the audit to obtain reasonable assurance about whether the financial statements are free of material misstatement. An audit includes examining, on a test basis, evidence supporting the amounts and disclosures in the financial statements, assessing the accounting principles used and significant estimates made by management, and evaluating the overall financial statement presentation. We believe that our audits, which included confirmation of securities as of October 31, 2017 by correspondence with the custodian and brokers, provide a reasonable basis for our opinion. The financial statements of the Fund as of and for the year ended November 30, 2015, and the financial highlights for each of the periods ended on or prior to November 30, 2015 (not presented herein, other than the statement of changes in net assets and the financial highlights) were audited by other auditors whose report dated January 28, 2016 expressed an unqualified opinion on those financial statements and financial highlights.

Denver, Colorado
December 20, 2017
| | |
| | Janus Detroit Street Trust ½ 5 |
Janus Velocity Volatility Hedged Large Cap ETF
Schedule of Investments
October 31, 2017
| | | | | | | | |
| | | Shares | | | Value | |
| Investment Companies – 96.9% | | | | | | |
| Exchange-Traded Funds (ETFs) – 84.9% | | | | | | |
iShares Core S&P 500 | | | 59,529 | | | | $15,406,700 | |
SPDR S&P 500 Trust | | | 59,939 | | | | 15,413,314 | |
Vanguard S&P 500 | | | 65,252 | | | | 15,407,955 | |
| | | | | | | | |
| | | | | | | 46,227,969 | |
| Money Markets – 12.0% | | | |
State Street Institutional U.S. Government Money Market Fund, 0.9569%ºº | | | 6,493,648 | | | | 6,493,648 | |
Total Investments (total cost $43,376,808) – 96.9% | | | | | | | 52,721,617 | |
Cash, Receivables and Other Assets, net of Liabilities – 3.1% | | | | | | | 1,713,724 | |
Net Assets – 100% | | | | | | | $54,435,341 | |
The Fund may invest in certain securities that are considered affiliated companies. As defined by the Investment Company Act of 1940, as amended, an affiliated company is one in which the Fund owns 5% or more of the outstanding voting securities, or a company which is under common ownership or control.
Schedules of Affiliated Investments – (% of Net Assets)
| | | | | | | | | | | | | | | | |
| | | Dividend Income | | | Realized
Gain/(Loss) | | | Change in Unrealized
Appreciation/
(Depreciation) | | | Value at
10/31/17 | |
Investment Companies – 0% | | | | | | | | | | | | | | | | |
Investments Purchased with Cash Collateral from Securities Lending – 0% | | | | | | | | | | | | | | | | |
Janus Cash Collateral Fund LLC, 1.0003%ºº | | | $308 | D | | | $ — | | | | $ — | | | | $ — | |
| | | | |
| | | Share Balance
at 10/31/16 | | | Purchases | | | Sales | | | Share Balance
at 10/31/17 | |
Investment Companies – 0% | | | | | | | | | | | | | | | | |
Investments Purchased with Cash Collateral from Securities Lending – 0% | | | | | | | | | | | | | | | | |
Janus Cash Collateral Fund LLC, 1.0003%ºº | | | — | | | | 24,358,600 | | | | (24,358,600) | | | | — | |
Schedule of Total Return Swaps
| | | | | | | | | | | | | | | | | | |
Counterparty/
Return Paid by
the Fund | | Return Received
by the Fund | | Payment
Frequency | | | Termination
Date | | | Notional
Amount | | | Value and
Unrealized
Appreciation/
(Depreciation) | |
BNP Paribas S.A.: | | | | | | | | | | | | | | | | | | |
1.970% | | S&P 500 VIX Futures Variable Long/Short Index | | | Monthly | | | | 12/1/17 | | | | 38,000 USD | | | | $872 | |
1.970 | | S&P 500 VIX Futures Variable Long/Short Index | | | Monthly | | | | 1/2/18 | | | | 421,604 USD | | | | 13,462 | |
1.970 | | S&P 500 VIX Futures Variable Long/Short Index | | | Monthly | | | | 2/1/18 | | | | 1,060,000 USD | | | | 218,161 | |
1.970 | | S&P 500 VIX Futures Variable Long/Short Index | | | Monthly | | | | 3/1/18 | | | | 1,121,529 USD | | | | 120,022 | |
1.970 | | S&P 500 VIX Futures Variable Long/Short Index | | | Monthly | | | | 4/2/18 | | | | 215,000 USD | | | | 24,383 | |
1.970 | | S&P 500 VIX Futures Variable Long/Short Index | | | Monthly | | | | 5/1/18 | | | | 559,550 USD | | | | 66,966 | |
1.970 | | S&P 500 VIX Futures Variable Long/Short Index | | | Monthly | | | | 6/1/18 | | | | 167,000 USD | | | | 19,785 | |
1.970 | | S&P 500 VIX Futures Variable Long/Short Index | | | Monthly | | | | 9/3/18 | | | | 136,000 USD | | | | (2,121) | |
1.970 | | S&P 500 VIX Futures Variable Long/Short Index | | | Monthly | | | | 11/1/18 | | | | 107,370 USD | | | | (3,106) | |
1.970 | | S&P 500 VIX Futures Variable Long/Short Index | | | Monthly | | | | 12/3/18 | | | | 170,000 USD | | | | (2,168) | |
1.970 | | S&P 500 VIX Futures Variable Long/Short Index | | | Monthly | | | | 12/3/18 | | | | 330,267 USD | | | | (2,859) | |
1.970 | | S&P 500 VIX Futures Variable Long/Short Index | | | Monthly | | | | 1/2/19 | | | | 1,592,723 USD | | | | (23,544) | |
1.970 | | S&P 500 VIX Futures Variable Long/Short Index | | | Monthly | | | | 2/1/19 | | | | 227,736 USD | | | | (8,275) | |
1.970 | | S&P 500 VIX Futures Variable Long/Short Index | | | Monthly | | | | 2/1/19 | | | | 224,000 USD | | | | (2,691) | |
1.970 | | S&P 500 VIX Futures Variable Long/Short Index | | | Monthly | | | | 3/1/19 | | | | 231,640 USD | | | | 14,820 | |
1.970 | | S&P 500 VIX Futures Variable Long/Short Index | | | Monthly | | | | 3/1/19 | | | | 635,000 USD | | | | 39,829 | |
1.970 | | S&P 500 VIX Futures Variable Long/Short Index | | | Monthly | | | | 4/1/19 | | | | 216,151 USD | | | | 8,496 | |
1.970 | | S&P 500 VIX Futures Variable Long/Short Index | | | Monthly | | | | 5/1/19 | | | | 102,042 USD | | | | — | |
Total | | | | | | | | | | | | $482,032 | |
See Notes to Schedule of Investments and Other Information and Notes to Financial Statements.
Janus Velocity Volatility Hedged Large Cap ETF
Schedule of Investments
October 31, 2017
The following table, grouped by derivative type, provides information about the fair value and location of derivatives within the Statement of Assets and Liabilities as of October 31, 2017.
Fair Value of Derivative Instruments (not accounted for as hedging instruments) as of October 31, 2017
| | | | |
| | | Equity Contracts | |
| Asset Derivatives: | | | | |
| Outstanding swap contracts, at value | | $ | 526,796 | |
| Liability Derivatives: | | | | |
| Outstanding swap contracts, at value | | $ | 44,764 | |
The following tables provide information about the effect of derivatives and hedging activities on the Fund’s Statement of Operations for the year ended October 31, 2017.
The effect of Derivative Instruments (not accounted for as hedging instruments) on the Statement of Operations for the year ended October 31, 2017
| | | | |
| Amount of Realized Gain/(Loss) Recognized on Derivatives | |
| Derivative | | Equity Contracts | |
| Swap contracts | | $ | (256,945) | |
|
| Amount of Change in Unrealized Appreciation/Depreciation Recognized on Derivatives | |
| Derivative | | Equity Contracts | |
| Swap contracts | | $ | 1,070,852 | |
Please see the “Net Realized Gain/(Loss) on Investments” and “Change in Unrealized Net Appreciation/Depreciation” sections of the Fund’s Statement of Operations.
Average Ending Monthly Market Value of Derivative Instruments During the Year Ended October 31, 2017
| | | | |
| | | Market Value | |
Total return swaps, long | | | $348,048 | |
See Notes to Schedule of Investments and Other Information and Notes to Financial Statements.
| | |
| | Janus Detroit Street Trust ½ 7 |
Janus Velocity Volatility Hedged Large Cap ETF
Notes to Schedule of Investments and Other Information
| | |
| CBOE Volatility Index® or VIX® Index® | | Shows the market’s expectation of 30-day volatility. It is constructed using the implied volatilities of a wide range of S&P 500® Index options and is a widely used measure of market risk. The VIX methodology is the property of Chicago Board of Options Exchange, which is not affiliated with Janus Henderson. |
| |
| VelocityShares Volatility Hedged Large Cap Index | | VelocityShares Volatility Hedged Large Cap Index (SPXHID) combines 85% exposure to a large cap equity portfolio with a 15% exposure to a volatility strategy intended to hedge against large declines in the S&P 500 Index. |
| |
| S&P 500® Index | | S&P 500® Index reflects U.S. large-cap equity performance and represents broad U.S. equity market performance. |
| |
| SPDR | | Standard & Poor’s Depositary Receipt |
| |
| ºº | | Rate shown is the 7-day yield as of October 31, 2017. |
| |
| D | | Net of income paid to the securities lending agent and rebates paid to the borrowing counterparties. |
The following is a summary of the inputs that were used to value the Fund’s investments in securities and other financial instruments as of October 31, 2017. See Notes to Financial Statements for more information.
Valuation Inputs Summary
| | | | | | | | | | | | |
| | | Level 1 -
Quoted Prices | | | Level 2 -
Other Significant
Observable Inputs | | | Level 3 -
Significant
Unobservable Inputs | |
Assets | | | | | | | | | | | | |
Investment in Securities: | | | | | | | | | | | | |
Investment Companies | | $ | 52,721,617 | | | $ | — | | | $ | — | |
| | | | |
Total Investments in Securities | | $ | 52,721,617 | | | $ | — | | | $ | — | |
Other Financial Instruments(a): | | | | | | | | | | | | |
Outstanding Swap Contracts, at Value | | $ | — | | | $ | 526,796 | | | $ | — | |
| | | | |
Total Assets | | $ | 52,721,617 | | | $ | 526,796 | | | $ | — | |
| | | | |
Liabilities | | | | | | | | | | | | |
Other Financial Instruments(a): | | | — | | | | | | | $ | | |
Outstanding Swap Contracts, at Value | | $ | — | | | $ | 44,764 | | | $ | — | |
| (a) | Other financial instruments include forward foreign currency exchange, futures, written options, written swaptions, and swap contracts. Forward foreign currency exchange contracts are reported at their unrealized appreciation/(depreciation) at measurement date, which represents the change in the contract’s value from trade date. Futures, certain written options on futures, and centrally cleared swap contracts are reported at their variation margin at measurement date, which represents the amount due to/from the Fund at that date. Written options, written swaptions, and other swap contracts are reported at their market value at measurement date. |
Janus Velocity Volatility Hedged Large Cap ETF
Statement of Assets and Liabilities
October 31, 2017
| | | | |
Assets: | | | | |
Investments, at value(1) | | $ | 52,721,617 | |
Cash | | | 97,000 | |
Restricted cash (Note 1) | | | 720,000 | |
Deposits with brokers for OTC derivatives | | | 490,000 | |
Outstanding swap contracts, at value | | | 526,796 | |
Receivables: | | | | |
Investments sold | | | 227,053 | |
Dividends | | | 5,619 | |
Affiliated securities lending income, net | | | 157 | |
Total Assets | | | 54,788,242 | |
Liabilities: | | | | |
Outstanding swap contracts, at value | | | 44,764 | |
Payables: | | | | |
Investments purchased | | | 276,254 | |
Management fees | | | 28,796 | |
Interest on swap contracts | | | 3,087 | |
Total Liabilities | | | 352,901 | |
Net Assets | | $ | 54,435,341 | |
Net Assets Consists of: | | | | |
Capital (par value and paid-in surplus) | | $ | 49,462,010 | |
Undistributed net investment income/(loss) | | | — | |
Undistributed net realized gain/(loss) from investments and foreign currency transactions | | | (4,853,510) | |
Unrealized net appreciation/(depreciation) on investments and foreign currency translations | | | 9,826,841 | |
Total Net Assets | | $ | 54,435,341 | |
Net Assets | | $ | 54,435,341 | |
Shares outstanding, $0.001 Par Value (unlimited shares authorized) | | | 1,550,000 | |
Net Asset Value Per Share | | $ | 35.12 | |
| (1) | Includes cost of $43,376,808. |
See Notes to Financial Statements.
| | |
| | Janus Detroit Street Trust ½ 9 |
Janus Velocity Volatility Hedged Large Cap ETF
Statement of Operations
For the year ended October 31, 2017
| | | | |
Investment Income: | | | | |
Dividends | | $ | 837,009 | |
Affiliated securities lending income, net | | | 308 | |
Total Investment Income | | | 837,317 | |
Expenses: | | | | |
Management Fees | | | 304,533 | |
Total Expenses | | | 304,533 | |
Net Investment Income/(Loss) | | | 532,784 | |
Net Realized Gain/(Loss) on Investments: | | | | |
Investments and foreign currency transactions | | | 29,662 | |
Swap contracts | | | (256,945) | |
Total Net Realized Gain/(Loss) on Investments | | | (227,283) | |
Change in Unrealized Net Appreciation/Depreciation: | | | | |
Investments and foreign currency translations | | | 7,494,013 | |
Swap contracts | | | 1,070,852 | |
Total Change in Unrealized Net Appreciation/Depreciation | | | 8,564,865 | |
Net Increase/(Decrease) in Net Assets Resulting from Operations | | $ | 8,870,366 | |
See Notes to Financial Statements.
Janus Velocity Volatility Hedged Large Cap ETF
Statements of Changes in Net Assets
| | | | | | | | | | | | |
| | | Year ended
October 31, 2017 | | | Period ended
October 31, 2016(1) | | | Year ended
November 30, 2015(2) | |
Operations: | | | | | | | | | | | | |
Net investment income/(loss) | | $ | 532,784 | | | $ | 637,186 | | | $ | 823,336 | |
Net realized gain/(loss) on investments | | | (227,283) | | | | (1,312,411) | | | | 1,332,932 | |
Change in unrealized net appreciation/depreciation | | | 8,564,865 | | | | 516,162 | | | | (4,005,524) | |
Net Increase/(Decrease) in Net Assets Resulting from Operations | | | 8,870,366 | | | | (159,063) | | | | (1,849,256) | |
Dividends and Distributions to Shareholders: | | | | | | | | | | | | |
Dividends from Net Investment Income | | | (600,654) | | | | (817,870) | | | | (610,565) | |
Capital Share Transactions | | | 5,054,794 | | | | (24,623,793) | | | | (5,898,721) | |
Net Increase/(Decrease) in Net Assets | | | 13,324,506 | | | | (25,600,726) | | | | (8,358,542) | |
Net Assets: | | | | | | | | | | | | |
Beginning of period | | | 41,110,835 | | | | 66,711,561 | | | | 75,070,103 | |
End of period | | $ | 54,435,341 | | | $ | 41,110,835 | | | $ | 66,711,561 | |
| | | |
| | | | | | | | | | | | |
Undistributed Net Investment Income/(Loss) | | $ | — | | | $ | 41,435 | | | $ | 212,771 | |
| (1) | Period from December 1, 2015 through October 31, 2016. The Fund changed its fiscal year end from November 30 to October 31. |
| (2) | Period from December 1, 2014 through November 30, 2015. |
See Notes to Financial Statements.
| | |
| | Janus Detroit Street Trust ½ 11 |
Janus Velocity Volatility Hedged Large Cap ETF
Financial Highlights
| | | | | | | | | | | | | | | | | | | | | | |
For a share outstanding during year ended October 31, 2017 and period
ended October 31, 2016, and each year and period ended November 30 | | 2017 | | | 2016(1) | | | 2015 | | | 2014 | | | 2013(2) | |
| | Net Asset Value, Beginning of Period | | | $29.36 | | | | $29.65 | | | | $30.64 | | | | $27.85 | | | | $25.00 | |
| | Income/(Loss) from Investment Operations: | | | | | | | | | | | | | | | | | | | | |
| | Net investment income/(loss)(3) | | | 0.37 | | | | 0.42 | | | | 0.35 | | | | 0.21 | | | | 0.12 | |
| | Net realized and unrealized gain/(loss) | | | 5.81 | | | | (0.21) | | | | (1.10) | | | | 2.84 | | | | 2.88 | |
| | Total from Investment Operations | | | 6.18 | | | | 0.21 | | | | (0.75) | | | | 3.05 | | | | 3.00 | |
| | Less Dividends and Distributions: | | | | | | | | | | | | | | | | | | | | |
| | Dividends (from net investment income) | | | (0.42) | | | | (0.50) | | | | (0.24) | | | | (0.19) | | | | (0.10) | |
| | Distributions (from capital gains) | | | — | | | | — | | | | — | | | | (0.00)(4) | | | | — | |
| | Return of Capital | | | — | | | | — | | | | — | | | | (0.07) | | | | (0.05) | |
| | Total Dividends and Distributions | | | (0.42) | | | | (0.50) | | | | (0.24) | | | | (0.26) | | | | (0.15) | |
| | Net Asset Value, End of Period | | | $35.12 | | | | $29.36 | | | | $29.65 | | | | $30.64 | | | | $27.85 | |
| | Total Return* | | | 21.17% | | | | 0.75% | | | | (2.44)% | | | | 11.00% | | | | 12.04% | |
| | Net assets, End of Period (in thousands) | | | $54,435 | | | | $41,111 | | | | $66,712 | | | | $75,070 | | | | $8,357 | |
| | Average Net Assets for the Period (in thousands) | | | $46,851 | | | | $43,960 | | | | $71,258 | | | | $37,409 | | | | $5,892 | |
| | Ratios to Average Net Assets**: | | | | | | | | | | | | | | | | | | | | |
| | Ratio of Gross Expenses | | | 0.65% | | | | 0.65% | | | | 0.65% | | | | 0.65% | | | | 0.65% | |
| | Ratio of Net Investment Income/(Loss) | | | 1.14% | | | | 1.57% | | | | 1.15% | | | | 0.71% | | | | 1.05% | |
| | Portfolio Turnover Rate(5) | | | 2% | | | | 3% | | | | 4% | | | | 1% | | | | 2% | |
| * | Total return not annualized for periods of less than one full year. |
| ** | Annualized for periods of less than one full year. |
| (1) | Period from December 1, 2015 through October 31, 2016. The Fund changed its fiscal year end from November 30 to October 31. |
| (2) | Period from June 21, 2013 (inception date) through November 30, 2013. |
| (3) | Per share amounts are calculated based on average shares outstanding during the year or period. |
| (4) | Less than $0.005 per share. |
| (5) | Portfolio turnover rate excludes securities received or delivered from in-kind processing of creation or redemptions. |
See Notes to Financial Statements.
Janus Velocity Volatility Hedged Large Cap ETF
Notes to Financial Statements
1. Organization and Significant Accounting Policies
Janus Velocity Volatility Hedged Large Cap ETF (the “Fund”) is a series fund. The Fund is part of Janus Detroit Street Trust (the “Trust”), which is organized as a Delaware statutory trust and is registered under the Investment Company Act of 1940, as amended (the “1940 Act”), as an open-end management investment company, and therefore has applied the specialized accounting and reporting guidance in Financial Accounting Standards Board (“FASB”) Accounting Standards Codification (“ASC”) Topic 946. The Trust offers nine Funds each of which represent shares of beneficial interest in a separate portfolio of securities and other assets with its own objective and policies. The Fund is a fund of funds and seeks its investment objective by investing 85% of its net assets in unaffiliated underlying ETFs that provide exposure to large capitalization securities and 15% of its net assets to a volatility strategy. For additional information on the underlying ETFs, visit the Securities and Exchange Commission website at www.SEC.GOV. The Fund seeks investment results that correspond generally, before fees and expenses, to the performance of its underlying index, the VelocityShares Volatility Hedged Large Cap Index (the “Underlying Index”). The Fund is classified as nondiversified, as defined in the 1940 Act.
Pursuant to the Agreement and Plan of Reorganization and Termination (the “Reorganization”), the Fund acquired all of the assets and liabilities of Janus Velocity Volatility Hedged Large Cap ETF (the “Predecessor Fund”), a series of ALPS ETF Trust, on July 18, 2016. The shareholders of the Predecessor Fund received shares of the Fund with an aggregate net asset value “NAV” equal to the aggregate NAV of their shares in the Predecessor Fund immediately prior to the Reorganization at the following conversion ratios:
| | | | | | | | | | |
Predecessor Fund Shares
Prior to Reorganization | | | Conversion Ratio | | | New Shares Issued by the Fund | |
| | 950,000 | | | | 1.00 | | | | 950,000 | |
The Reorganization was treated as a tax-free exchange for federal income tax purposes, and accordingly, the basis of the assets of the Fund reflected the historical basis of the assets of the Predecessor Fund as of the date of the Reorganization.
The net assets and composition of net assets of the Fund and the Predecessor Fund on July 15, 2016, were as follows:
| | | | | | | | | | | | |
| | | Fund | | | Predecessor Fund | | | Combined Funds | |
| Paid-in-Capital | | $ | — | | | $ | 45,280,733 | | | $ | 45,280,733 | |
| Accumulated Net Investment Income | | | — | | | | (100,368) | | | | (100,368) | |
| Accumulated Net Realized Gain | | | — | | | | (1,473,509) | | | | (1,473,509) | |
| Net Unrealized Appreciation | | | — | | | | 537,352 | | | | 537,352 | |
| Net Assets | | | — | | | | 44,244,208 | | | | 44,244,208 | |
| Cost of Investments | | | — | | | | 35,003,989 | | | | 35,003,989 | |
The Predecessor Fund and the Fund had identical investment objectives and substantially similar investment policies and principal risks. For financial reporting purposes, the Predecessor Fund’s financial and performance history prior to the Reorganization is carried forward and reflected in the Fund’s financial statements and financial highlights. For the year ended November 30, 2015, and prior periods, the audit of those financial statements were performed by auditors different from the auditors of this report.
The fiscal year end of the Predecessor Fund was November 30. Subsequent to November 30, 2015, the Fund changed its fiscal year end to October 31, 2016, to reflect the fiscal year end of the Trust.
Unlike shares of traditional mutual funds, shares of the Fund are not individually redeemable and may only be purchased or redeemed directly from the Fund at NAV in large increments called “Creation Units” (50,000 or more shares per Creation Unit) through certain participants, known as “Authorized Participants.” The Fund will issue or redeem Creation Units in exchange for portfolio securities and/or cash. Except when aggregated in Creation Units, Fund shares are not redeemable securities of the Fund. Shares of the Fund are listed and trade on the NYSE Arc, Inc., and individual investors can purchase or sell shares in much smaller increments and for cash in the secondary market through a broker. These transactions, which do not involve the Fund, are made at market prices that may vary throughout the day and differ from the Fund’s NAV. As a result, you may pay more than NAV (at a premium) when you purchase shares, and receive less than NAV (at a discount) when you sell shares, in the secondary market.
| | |
| | Janus Detroit Street Trust ½ 13 |
Janus Velocity Volatility Hedged Large Cap ETF
Notes to Financial Statements
An Authorized Participant may hold of record more than 25% of the outstanding shares of the Fund. From time to time,
Authorized Participants may be a beneficial and/or legal owner of the Fund, may be affiliated with an index provider, may be deemed to have control of the Fund and/or may be able to affect the outcome of matters presented for a vote of the shareholders of the Fund. Authorized Participants may execute an irrevocable proxy granting the Distributor or an affiliate of Janus Capital Management LLC (“Janus Capital” or “Janus”) power to vote or abstain from voting such Authorized Participant’s beneficially or legally owned shares of the Fund. In such cases, the agent shall mirror vote (or abstain from voting) such shares in the same proportion as all other beneficial owners of the Fund.
The following accounting policies have been followed by the Fund and are in conformity with accounting principles generally accepted in the United States of America.
Investment Valuation
Securities held by the Fund are valued in accordance with policies and procedures established by and under the supervision of the Trustees (the “Valuation Procedures”). Equity securities, including shares of exchange-traded funds, traded on a domestic securities exchange are generally valued at the closing prices on the primary market or exchange on which they trade. If such price is lacking for the trading period immediately preceding the time of determination, such securities are valued at their current bid price. Equity securities that are traded on a foreign exchange are generally valued at the closing prices on such markets. In the event that there is no current trading volume on a particular security in such foreign exchange, the bid price from the primary exchange is generally used to value the security. Securities that are traded on the over-the-counter (“OTC”) markets are generally valued at their closing or latest bid prices as available. Foreign securities and currencies are converted to U.S. dollars using the applicable exchange rate in effect at the close of the New York Stock Exchange (“NYSE”). The Fund will determine the market value of individual securities held by it by using prices provided by one or more approved professional pricing services or, as needed, by obtaining market quotations from independent broker-dealers. Most debt securities are valued in accordance with the evaluated bid price supplied by the pricing service that is intended to reflect market value. The evaluated bid price supplied by the pricing service is an evaluation that may consider factors such as security prices, yields, maturities and ratings. Certain short-term securities maturing within 60 days or less may be evaluated and valued on an amortized cost basis provided that the amortized cost determined approximates market value. Securities for which market quotations or evaluated prices are not readily available or are deemed unreliable are valued at fair value determined in good faith under the Valuation Procedures. Circumstances in which fair value pricing may be utilized include, but are not limited to: (i) a significant event that may affect the securities of a single issuer, such as a merger, bankruptcy, or significant issuer-specific development; (ii) an event that may affect an entire market, such as a natural disaster or significant governmental action; (iii) a nonsignificant event such as a market closing early or not opening, or a security trading halt; and (iv) pricing of a nonvalued security and a restricted or nonpublic security. Special valuation considerations may apply with respect to “odd-lot” fixed-income transactions which, due to their small size, may receive evaluated prices by pricing services which reflect a large block trade and not what actually could be obtained for the odd-lot position.
Valuation Inputs Summary
FASB ASC 820, Fair Value Measurements and Disclosures (“ASC 820”), defines fair value, establishes a framework for measuring fair value, and expands disclosure requirements regarding fair value measurements. This standard emphasizes that fair value is a market-based measurement that should be determined based on the assumptions that market participants would use in pricing an asset or liability and establishes a hierarchy that prioritizes inputs to valuation techniques used to measure fair value. These inputs are summarized into three broad levels:
Level 1 – Unadjusted quoted prices in active markets the Fund has the ability to access for identical assets or liabilities.
Level 2 – Observable inputs other than unadjusted quoted prices included in Level 1 that are observable for the asset or liability either directly or indirectly. These inputs may include quoted prices for the identical instrument on an inactive market, prices for similar instruments, interest rates, prepayment speeds, credit risk, yield curves, default rates and similar data.
Assets or liabilities categorized as Level 2 in the hierarchy generally include: debt securities fair valued in accordance with the evaluated bid or ask prices supplied by a pricing service; securities traded on OTC markets and listed securities for which no sales are reported that are fair valued at the latest bid price (or yield equivalent thereof) obtained from one or more dealers transacting in a market for such securities or by a pricing service approved by the Fund’s Trustees; and certain short-term debt securities with maturities of 60 days or less that are fair valued at amortized cost. Other securities that may be categorized as Level 2 in the hierarchy include, but are not limited to, preferred stocks, bank loans, swaps, investments in unregistered investment companies, options, and forward contracts.
Janus Velocity Volatility Hedged Large Cap ETF
Notes to Financial Statements
Level 3 – Unobservable inputs for the asset or liability to the extent that relevant observable inputs are not available, representing the Fund’s own assumptions about the assumptions that a market participant would use in valuing the asset or liability, and that would be based on the best information available.
There have been no significant changes in valuation techniques used in valuing any such positions held by the Fund since the beginning of the fiscal year.
The inputs or methodology used for fair valuing securities are not necessarily an indication of the risk associated with investing in those securities. The summary of inputs used as of October 31, 2017 to fair value the Fund’s investments in securities and other financial instruments is included in the “Valuation Inputs Summary” in the Notes to Schedule of Investments and Other Information.
The Fund recognizes transfers between the levels as of the beginning of the fiscal year. The following describes the amounts of transfers between Level 1, Level 2 and Level 3 of the fair value hierarchy during the year/period.
Financial assets of $4,848,349 were transferred out of Level 2 to Level 1 to reflect the investments unadjusted quoted price as of October 31, 2017.
Investment Transactions and Investment Income
Investment transactions are accounted for as of the date purchased or sold (trade date). Dividend income is recorded on the ex-dividend date. Gains and losses are determined on the identified cost basis, which is the same basis used for federal income tax purposes.
Estimates
The preparation of financial statements in conformity with accounting principles generally accepted in the United States of America requires management to make estimates and assumptions that affect the reported amount of assets and liabilities and disclosure of contingent assets and liabilities at the date of the financial statements and the reported amounts of income and expenses during the reporting period. Actual results could differ from those estimates.
Indemnifications
In the normal course of business, the Fund may enter into contracts that contain provisions for indemnification of other parties against certain potential liabilities. The Fund’s maximum exposure under these arrangements is unknown, and would involve future claims that may be made against the Fund that have not yet occurred. Currently, the risk of material loss from such claims is considered remote.
Dividends and Distributions
The Fund generally declares and distributes dividends of net investment income quarterly. Net realized capital gains (if any) are distributed annually. The Fund may treat a portion of the amount paid to redeem shares as a distribution of investment company taxable income and realized capital gains that are reflected in the NAV. This practice, commonly referred to as “equalization,” has no effect on the redeeming shareholder or a Fund’s total return, but may reduce the amounts that would otherwise be required to be paid as taxable dividends to the remaining shareholders. It is possible that the Internal Revenue Service (IRS) could challenge the Fund’s equalization methodology or calculations, and any such challenge could result in additional tax, interest, or penalties to be paid by the Fund.
Federal Income Taxes
The Fund intends to continue to qualify as a regulated investment company and distribute all of its taxable income in accordance with the requirements of Subchapter M of the Internal Revenue Code. Management has analyzed the Fund’s tax positions taken for all open federal income tax years, generally a three-year period, and has concluded that no provision for federal income tax is required in the Fund’s financial statements. The Fund is not aware of any tax positions for which it is reasonably possible that the total amounts of unrecognized tax benefits will significantly change in the next twelve months.
Restricted Cash
As of October 31, 2017, the Fund had restricted cash in the amount of $720,000. The restricted cash represents collateral pledged in relation to derivatives. The carrying value of the restricted cash approximates fair value.
2. Derivative Instruments
The Fund may invest in various types of derivatives. A derivative is a financial instrument whose performance is derived from the performance of another asset. The Fund may invest in derivative instruments including, but not limited to: futures contracts, options, and swaps. Each derivative instrument that was held by the Fund during the year ended October 31, 2017 is discussed in further detail below.
| | |
| | Janus Detroit Street Trust ½ 15 |
Janus Velocity Volatility Hedged Large Cap ETF
Notes to Financial Statements
The Fund may use derivative instruments for risk management purposes or as part of its investment strategies. The Fund’s use of derivative instruments involves risks different from, or possibly greater than, the risks associated with investing directly in securities and other traditional investments. Derivatives are subject to a number of risks including liquidity risk, market risk, credit risk, default risk, counterparty risk and management risk. They also involve the risk of mispricing or improper valuation and the risk that changes in the value of the derivative may not correlate exactly with the change in the value of the underlying asset, rate or index. Also, suitable derivative transactions may not be available in all circumstances and there can be no assurance that the Fund will engage in these transactions to reduce exposure to other risks when that would be beneficial. The Fund’s ability to use derivatives may also be limited by certain regulatory and tax considerations.
In pursuit of its investment objective, the Fund may seek to use derivatives to increase or decrease exposure to the following market risk factors:
| | • | | Counterparty Risk – the risk that the counterparty (the party on the other side of the transaction) on a derivative transaction will be unable to honor its financial obligation to the Fund. |
| | • | | Credit Risk – the risk an issuer will be unable to make principal and interest payments when due, or will default on its obligations. |
| | • | | Equity Risk – the risk related to the change in value of equity securities as they relate to increases or decreases in the general market. |
| | • | | Index Risk – if the derivative is linked to the performance of an index, it will be subject to the risks associated with changes in that index. If the index changes, the Fund could receive lower interest payments or experience a reduction in the value of the derivative to below what the Fund paid. Certain indexed securities, including inverse securities (which move in an opposite direction to the index), may create leverage, to the extent that they increase or decrease in value at a rate that is a multiple of the changes in the applicable index. |
| | • | | Interest Rate Risk – the risk that the value of fixed-income securities will generally decline as prevailing interest rates rise, which may cause the Fund’s NAV to likewise decrease. |
| | • | | Liquidity Risk – the risk that certain securities may be difficult or impossible to sell at the time that the seller would like or at the price that the seller believes the security is currently worth. |
Derivatives may generally be traded OTC or on an exchange. Derivatives traded OTC are agreements that are individually negotiated between parties and can be tailored to meet a purchaser’s needs. OTC derivatives are not guaranteed by a clearing agency and may be subject to increased credit risk.
Swaps
Swap agreements are two-party contracts entered into primarily by institutional investors for periods ranging from a day to more than one year to exchange one set of cash flows for another. The most significant factor in the performance of swap agreements is the change in value of the specific index, security, or currency, or other factors that determine the amounts of payments due to and from the Fund. The use of swaps is a highly specialized activity which involves investment techniques and risks different from those associated with ordinary portfolio securities transactions. Swap agreements entail the risk that a party will default on its payment obligations to the Fund. If the other party to a swap defaults, the Fund would risk the loss of the net amount of the payments that it contractually is entitled to receive. If the Fund utilizes a swap at the wrong time or judges market conditions incorrectly, the swap may result in a loss to the Fund and reduce the Fund’s total return.
Swap agreements also bear the risk that the Fund will not be able to meet its obligation to the counterparty. Swap agreements are typically privately negotiated and entered into in the OTC market. However, certain swap agreements are required to be cleared through a clearinghouse and traded on an exchange or swap execution facility. Swaps that are required to be cleared are required to post initial and variation margins in accordance with the exchange requirements. Regulations enacted require the Fund to centrally clear certain interest rate and credit default index swaps through a clearinghouse or central counterparty (“CCP”). To clear a swap with a CCP, the Fund will submit the swap to, and post collateral with, a futures clearing merchant (“FCM”) that is a clearinghouse member.
Index swaps, interest rate swaps, and credit default swaps are valued using an approved vendor supplied price. Basket swaps are valued using a broker supplied price. Equity swaps that consist of a single underlying equity are valued either at the closing price, the latest bid price, or the last sale price on the primary market or exchange it trades. The market value of swap contracts are aggregated by positive and negative values and are disclosed separately as an asset or liability on the Fund’s Statement of Assets and Liabilities (if applicable). Realized gains and losses are reported on the Statement of Operations (if applicable). The change in unrealized net appreciation or depreciation during the period is included in the Statement of Operations (if applicable).
Janus Velocity Volatility Hedged Large Cap ETF
Notes to Financial Statements
The Fund’s maximum risk of loss from counterparty risk or credit risk is the discounted value of the payments to be received from/paid to the counterparty over the contract’s remaining life, to the extent that the amount is positive. The risk is mitigated by having a netting arrangement between the Fund and the counterparty and by the posting of collateral by the counterparty to cover the Fund’s exposure to the counterparty.
Total return swaps involve an exchange by two parties in which one party makes payments based on a set rate, either fixed or variable, while the other party makes payments based on the return of an underlying asset, which includes both the income it generates and any capital gains over the payment period. A fixed-income total return swap may be written on many different kinds of underlying reference assets, and may include different indices for various kinds of debt securities (e.g., U.S. investment grade bonds, high-yield bonds, or emerging market bonds).
During the year, the Fund entered into total return swaps on equity volatility indices in order to track the Fund’s underlying index. These total return swaps require the Fund to pay a floating reference interest rate, and an amount equal to the negative price movement of the index multiplied by the notional amount of the contract. The Fund will receive payments equal to the positive price movement of the same index multiplied by the notional amount of the contract and, in some cases, dividends paid on the securities.
3. Other Investments and Strategies
Additional Investment Risk
The financial crisis in both the U.S. and global economies over the past several years has resulted, and may continue to result, in a significant decline in the value and liquidity of many securities of issuers worldwide in the equity and fixed income/credit markets. In response to the crisis, the United States and certain foreign governments, along with the U.S. Federal Reserve and certain foreign central banks, took steps to support the financial markets. The withdrawal of this support, a failure of measures put in place to respond to the crisis, or investor perception that such efforts were not sufficient could each negatively affect financial markets generally, and the value and liquidity of specific securities. In addition, policy and legislative changes in the United States and in other countries continue to impact many aspects of financial regulation. The effect of these changes on the markets, and the practical implications for market participants, including the Fund, may not be fully known for some time. As a result, it may also be unusually difficult to identify both investment risks and opportunities, which could limit or preclude the Fund’s ability to achieve its investment objective. Therefore, it is important to understand that the value of your investment may fall, sometimes sharply, and you could lose money.
The enactment of the Dodd-Frank Wall Street Reform and Consumer Protection Act (the “Dodd-Frank Act”) provided for widespread regulation of financial institutions, consumer financial products and services, broker-dealers, OTC derivatives, investment advisers, credit rating agencies, and mortgage lending, which expanded federal oversight in the financial sector, including the investment management industry. Certain provisions of the Dodd-Frank Act remain pending and will be implemented through future rulemaking. Therefore, the ultimate impact of the Dodd-Frank Act and the regulations under the Dodd-Frank Act on the Fund and the investment management industry as a whole, is not yet certain.
A number of countries in the European Union (“EU”) have experienced, and may continue to experience, severe economic and financial difficulties. In particular, many EU nations are susceptible to economic risks associated with high levels of debt, notably due to investments in sovereign debt of countries such as Greece, Italy, Spain, Portugal, and Ireland. Many non-governmental issuers, and even certain governments, have defaulted on, or been forced to restructure, their debts. Many other issuers have faced difficulties obtaining credit or refinancing existing obligations. Financial institutions have in many cases required government or central bank support, have needed to raise capital, and/or have been impaired in their ability to extend credit. As a result, financial markets in the EU experienced extreme volatility and declines in asset values and liquidity. Responses to these financial problems by European governments, central banks, and others, including austerity measures and reforms, may not work, may result in social unrest, and may limit future growth and economic recovery or have other unintended consequences. Further defaults or restructurings by governments and others of their debt could have additional adverse effects on economies, financial markets, and asset valuations around the world. Greece, Ireland, and Portugal have already received one or more “bailouts” from other Eurozone member states, and it is unclear how much additional funding they will require or if additional Eurozone member states will require bailouts in the future. The risk of investing in securities in the European markets may also be heightened due to the referendum in which the United Kingdom voted to exit the EU (known as “Brexit”). One or more other countries may also abandon the euro and/ or withdraw from the EU, placing its currency and banking system in jeopardy.
Certain areas of the world have historically been prone to and economically sensitive to environmental events such as, but not limited to, hurricanes, earthquakes, typhoons, flooding, tidal waves, tsunamis, erupting volcanoes, wildfires or droughts,
| | |
| | Janus Detroit Street Trust ½ 17 |
Janus Velocity Volatility Hedged Large Cap ETF
Notes to Financial Statements
tornadoes, mudslides, or other weather-related phenomena. Such disasters, and the resulting physical or economic damage, could have a severe and negative impact on the Fund’s investment portfolio and, in the longer term, could impair the ability of issuers in which the Fund invests to conduct their businesses as they would under normal conditions. Adverse weather conditions may also have a particularly significant negative effect on issuers in the agricultural sector and on insurance companies that insure against the impact of natural disasters.
Counterparties
Fund transactions involving a counterparty are subject to the risk that the counterparty or a third party will not fulfill its obligation to the Fund (“counterparty risk”). Counterparty risk may arise because of the counterparty’s financial condition (i.e., financial difficulties, bankruptcy, or insolvency), market activities and developments, or other reasons, whether foreseen or not. A counterparty’s inability to fulfill its obligation may result in significant financial loss to the Fund. The Fund may be unable to recover its investment from the counterparty or may obtain a limited recovery, and/or recovery may be delayed. The extent of the Fund’s exposure to counterparty risk with respect to financial assets and liabilities approximates its carrying value. See the “Offsetting Assets and Liabilities” section of this Note for further details.
The Fund may be exposed to counterparty risk through participation in various programs, including, but not limited to, lending its securities to third parties, cash sweep arrangements whereby the Fund’s cash balance is invested in one or more types of cash management vehicles, as well as investments in, but not limited to, repurchase agreements, and derivatives, including various types of swaps, futures and options. The Fund intends to enter into financial transactions with counterparties that Janus Capital believes to be creditworthy at the time of the transaction. There is always the risk that Janus Capital’s analysis of a counterparty’s creditworthiness is incorrect or may change due to market conditions. To the extent that the Fund focuses its transactions with a limited number of counterparties, it will have greater exposure to the risks associated with one or more counterparties.
Exchange-Traded Funds
The Fund may invest in exchange-traded funds (“ETFs”) to gain exposure to a particular portion of the market. ETFs are typically open-end investment companies, which may be actively managed or passively managed, that generally seek to track the performance of a specific index. ETFs are traded on a national securities exchange at market prices that may vary from the NAV of their underlying investments. Accordingly, there may be times when an ETF trades at a premium or discount. When the Fund invests in an ETF, in addition to directly bearing the expenses associated with its own operations, it will bear a pro rata portion of the ETF’s expenses. As a result, the cost of investing in the Fund may be higher than the cost of investing directly in ETFs and may be higher than other mutual funds that invest directly in stocks and bonds. ETFs also involve the risk that an active trading market for an ETF’s shares may not develop or be maintained. Similarly, because the value of ETF shares depends on the demand in the market, the Fund may not be able to purchase or sell an ETF at the most optimal time, which could adversely affect the Fund’s performance. In addition, ETFs that track particular indices may be unable to match the performance of such underlying indices due to the temporary unavailability of certain index securities in the secondary market or other factors, such as discrepancies with respect to the weighting of securities. Because the Fund may invest in ETFs that provide exposure to a broad range of securities, such risks may include, but are not limited to, leverage risk, foreign exposure risk, interest rate risk, and commodity-linked investments risk. The Fund is also subject to substantially the same risks as those associated with direct exposure to the securities held by the ETF.
Offsetting Assets and Liabilities
The Fund presents gross and net information about transactions that are either offset in the financial statements or subject to an enforceable master netting arrangement or similar agreement with a designated counterparty, regardless of whether the transactions are actually offset in the Statement of Assets and Liabilities.
In order to better define its contractual rights and to secure rights that will help the Fund mitigate its counterparty risk, the Fund may enter into an International Swaps and Derivatives Association, Inc. Master Agreement (“ISDA Master Agreement”) or similar agreement with its derivative contract counterparties. An ISDA Master Agreement is a bilateral agreement between the Fund and a counterparty that governs OTC derivatives and forward foreign currency exchange contracts and typically contains, among other things, collateral posting terms and netting provisions in the event of a default and/or termination event. Under an ISDA Master Agreement, in the event of a default and/or termination event, the Fund may offset with each counterparty certain derivative financial instruments’ payables and/or receivables with collateral held and/or posted and create one single net payment. For financial reporting purposes, the Fund does not offset financial instruments’ payables and receivables and related collateral on the Statement of Assets and Liabilities.
The following tables present gross amounts of recognized assets and/or liabilities and the net amounts after deducting collateral that has been pledged by counterparties or has been pledged to counterparties (if applicable). For
Janus Velocity Volatility Hedged Large Cap ETF
Notes to Financial Statements
corresponding information grouped by type of instrument, see either the “Fair Value of Derivative Instruments as of October 31, 2017” table located in Note 2 of these Notes to Financial Statements and/or the Fund’s Schedule of Investments.
Offsetting of Financial Assets and Derivative Assets
| | | | | | | | | | | | | | | | |
| Counterparty | | Gross Amounts of
Recognized Assets | | | Offsetting Asset
or Liability(a) | | | Collateral
Pledged(b) | | | Net Amount | |
| BNP Paribas S.A. | | $ | 526,796 | | | $ | (44,764) | | | $ | (482,032) | | | $ | — | |
Offsetting of Financial Liabilities and Derivative Liabilities
| | | | | | | | | | | | | | | | |
| Counterparty | | Gross Amounts of
Recognized Liabilities | | | Offsetting Asset
or Liability(a) | | | Collateral
Pledged(b) | | | Net Amount | |
| BNP Paribas S.A. | | $ | 44,764 | | | $ | (44,764) | | | $ | — | | | $ | — | |
| (a) | Represents the amount of assets or liabilities that could be offset with the same counterparty under master netting or similar agreements that management elects not to offset on the Statement of Assets and Liabilities. |
| (b) | Collateral pledged is limited to the net outstanding amount due to/from an individual counterparty. The actual collateral amounts pledged may exceed these amounts and may fluctuate in value. |
The Fund may require the counterparty to pledge securities as collateral daily (based on the daily valuation of the financial asset) if the Fund has a net aggregate unrealized gain on OTC derivative contracts with a particular counterparty. The Fund may deposit cash as collateral with the counterparty and/or custodian daily (based on the daily valuation of the financial asset) if the Fund has a net aggregate unrealized loss on OTC derivative contracts with a particular counterparty. The collateral amounts are subject to minimum exposure requirements and initial margin requirements. Collateral amounts are monitored and subsequently adjusted up or down as valuations fluctuate by at least the minimum exposure requirement. Collateral may reduce the risk of loss.
Securities Lending
Under procedures adopted by the Trustees, the Fund may seek to earn additional income by lending securities to qualified parties. Deutsche Bank AG acts as securities lending agent and a limited purpose custodian or subcustodian to receive and disburse cash balances and cash collateral, hold short-term investments, hold collateral, and perform other custodian functions. The Fund may lend portfolio securities in an amount equal to up to 1/3 of its total assets as determined at the time of the loan origination. There is the risk of delay in recovering a loaned security or the risk of loss in collateral rights if the borrower fails financially. In addition, Janus Capital makes efforts to balance the benefits and risks from granting such loans. All loans will be continuously secured by collateral which may consist of cash, U.S. Government securities, domestic and foreign short-term debt instruments, letters of credit, time deposits, repurchase agreements, money market mutual funds or other money market accounts, or such other collateral as permitted by the SEC. If the Fund is unable to recover a security on loan, the Fund may use the collateral to purchase replacement securities in the market. There is a risk that the value of the collateral could decrease below the cost of the replacement security by the time the replacement investment is made, resulting in a loss to the Fund.
Upon receipt of cash collateral, Janus Capital may invest it in affiliated or non-affiliated cash management vehicles, whether registered or unregistered entities, as permitted by the 1940 Act and rules promulgated thereunder. Janus Capital currently intends to invest the cash collateral in a cash management vehicle for which Janus Capital serves as investment adviser, Janus Cash Collateral Fund LLC. An investment in Janus Cash Collateral Fund LLC is generally subject to the same risks that shareholders experience when investing in similarly structured vehicles, such as the potential for significant fluctuations in assets as a result of the purchase and redemption activity of the securities lending program, a decline in the value of the collateral, and possible liquidity issues. Such risks may delay the return of the cash collateral and cause the Fund to violate its agreement to return the cash collateral to a borrower in a timely manner. As adviser to the Fund and Janus Cash Collateral Fund LLC, Janus Capital has an inherent conflict of interest as a result of its fiduciary duties to both the Fund and Janus Cash Collateral Fund LLC. Additionally, Janus Capital receives an investment advisory fee of 0.05% for managing Janus Cash Collateral Fund LLC, but it may not receive a fee for managing certain other affiliated cash management vehicles in which the Fund may invest, and therefore may have an incentive to allocate preferred investment opportunities to investment vehicles for which it is receiving a fee.
The value of the collateral must be at least 102% of the market value of the loaned securities that are denominated in U.S. dollars and 105% of the market value of the loaned securities that are not denominated in U.S. dollars. Loaned securities and related collateral are marked-to-market each business day based upon the market value of the loaned
| | |
| | Janus Detroit Street Trust ½ 19 |
Janus Velocity Volatility Hedged Large Cap ETF
Notes to Financial Statements
securities at the close of business, employing the most recent available pricing information. Collateral levels are then adjusted based on this mark-to-market evaluation.
The cash collateral invested by Janus Capital is disclosed in the Schedule of Investments (if applicable). Income earned from the investment of the cash collateral, net of rebates paid to, or fees paid by, borrowers and less the fees paid to the lending agent are included as “Affiliated securities lending income, net” on the Statement of Operations. There were no securities on loan as of October 31, 2017.
4. Investment Advisory Agreements and Other Transactions with Affiliates
Effective February 22, 2016, the Fund entered into an investment advisory agreement with Janus Capital. Under its unitary fee structure, the Fund pays Janus Capital a management fee in return for providing certain investment advisory, supervisory, and administrative services to the Fund, including the costs of transfer agency, custody, fund administration, legal, audit, and other services. Janus Capital’s fee structure is designed to pay substantially all of the Fund’s expenses. However, the Fund bears other expenses which are not covered under the management fee which may vary and affect the total level of expenses paid by shareholders, such as distribution fees (if any), brokerage expenses or commissions, interest, dividends, taxes, litigation expenses, acquired fund fees and expenses (if any), and extraordinary expenses. The Fund’s management fee is calculated daily and paid monthly. The Fund’s contractual management fee rate (expressed as an annual rate) is 0.65% of the Fund’s average daily net assets.
Prior to the Reorganization on July 18, 2016, ALPS Advisors, Inc. (“ALPS”), the Predecessor Fund’s investment advisor, had entered into an investment advisory agreement with ALPS ETF Trust, whereby ALPS earned, on a monthly basis, an advisory fee equal to an annual rate of 0.65% of the Predecessor Fund’s average daily net assets.
Prior to the Reorganization on July 18, 2016, ALPS Fund Services, Inc. served as the Predecessor Fund’s administrator. ALPS Fund Services, Inc. did not receive any additional compensation for serving as administrator for the Predecessor Fund.
Effective February 22, 2016, Janus Capital serves as administrator to the Fund, providing oversight and coordination of the Fund’s service providers, recordkeeping and other administrative services.
State Street Bank and Trust Company (“State Street”) provides certain fund administration services to the Fund, including services related to the Fund’s accounting, including calculating the daily NAV, audit, tax, and reporting obligations, pursuant to an agreement with Janus Capital, on behalf of the Fund. As compensation for such services, Janus Capital pays State Street a fee based on a percentage of the Fund’s assets, with a minimum flat fee, for certain services. Janus Capital serves as administrator to the Fund, providing oversight and coordination of the Fund’s service providers, recordkeeping and other administrative services. Janus Capital does not receive any additional compensation, beyond the unitary fee, for serving as administrator. State Street also serves as transfer agent for the shares of the Fund.
The Trust has adopted a Distribution and Servicing Plan for shares of the Fund pursuant to Rule 12b-1 under the 1940 Act (the “Plan”). The Plan permits compensation in connection with the distribution and marketing of Fund shares and/or the provision of certain shareholder services. The Plan permits the Fund to pay ALPS Distributors, Inc. (the “Distributor”) or its designee, a fee for the sale and distribution and/or shareholder servicing of the shares at an annual rate of up to 0.25% of average daily net assets of the Fund. However, the Trustees have determined not to authorize payment under this Plan at this time. Under the terms of the Plan, the Trust is authorized to make payments to the Distributor or its designee for remittance to retirement plan service providers, broker-dealers, bank trust departments, financial advisors, and other financial intermediaries, as compensation for distribution and/or shareholder services performed by such entities for their customers who are investors in the Fund. The 12b-1 fee may only be imposed or increased when the Trustees determine that it is in the best interests of shareholders to do so. Because these fees are paid out of the Fund’s assets on an ongoing basis, to the extent that a fee is authorized, over time they will increase the cost of an investment in the Fund. The Plan fee may cost an investor more than other types of sales charges.
As of October 31, 2017, Janus Capital owned 1 share or 0.01% of the Fund.
The Fund is permitted to purchase or sell securities (“cross-trade”) between itself and other funds or accounts managed by Janus Capital in accordance with Rule 17a-7 under the Investment Company Act of 1940 (“Rule 17a-7”), when the transaction is consistent with the investment objectives and policies of the Fund and in accordance with the Internal Cross Trade Procedures adopted by the Trust’s Board of Trustees. These procedures have been designed to ensure that any cross-trade of securities by the Fund from or to another fund or account that is or could be considered an affiliate of the Fund under certain limited circumstances by virtue of having a common investment adviser, common Officer, or common Trustee complies with Rule 17a-7. Under these procedures, each cross-trade is effected at the current market
Janus Velocity Volatility Hedged Large Cap ETF
Notes to Financial Statements
price to save costs where allowed. During the year ended October 31, 2017, the Fund engaged in cross trades amounting to $ 81,293 in purchases.
5. Federal Income Tax
The tax components of capital shown in the table below represent: (1) distribution requirements the Fund must satisfy under the income tax regulations; (2) losses or deductions the Fund may be able to offset against income and gains realized in future years; and (3) unrealized appreciation or depreciation of investments for federal income tax purposes.
Other book to tax differences primarily consist of deferred compensation, derivatives, and foreign currency contract adjustments. The Fund has elected to treat gains and losses on forward foreign currency contracts as capital gains and losses, if applicable. Other foreign currency gains and losses on debt instruments are treated as ordinary income for federal income tax purposes pursuant to Section 988 of the Internal Revenue Code.
| | | | | | | | | | | | | | | | | | | | | | | | | | |
| | | | | | | | | | Loss Deferrals | | | | | | | |
Undistributed
Ordinary Income | | | Undistributed
Long-Term Gains | | | Accumulated
Capital Losses | | | Late-Year
Ordinary Loss | | | Post-October
Capital Loss | | | Other Book to Tax Differences | | | Net Tax Appreciation/ (Depreciation) | |
| $ | — | | | $ | — | | | $ | (4,774,610) | | | $ | — | | | $ | — | | | $ | 482,032 | | | $ | 9,265,909 | |
Accumulated capital losses noted below represent net capital loss carryovers, as of October 31, 2017, that may be available to offset future realized capital gains and thereby reduce future taxable gains distributions. The following table shows these capital loss carryovers.
| | | | | | | | | | |
Capital Loss Carryover Schedule
For the year ended October 31, 2017
No Expiration | | | Accumulated
Capital Losses | |
| Short-Term | | | Long-Term | | |
| $ | (3,075,842) | | | $ | (1,698,768) | | | $ | (4,774,610) | |
The aggregate cost of investments and the composition of unrealized appreciation and depreciation of investment securities for federal income tax purposes as of October 31, 2017 are noted below. The primary difference between book and tax appreciation or depreciation of investments is wash sale loss deferrals.
| | | | | | | | | | | | | | |
| Federal Tax Cost | | | Unrealized Appreciation | | | Unrealized (Depreciation) | | | Net Tax Appreciation/
(Depreciation) | |
| $ | 43,455,708 | | | $ | 9,265,909 | | | $ | — | | | $ | 9,265,909 | |
Information on the tax components of derivatives as of October 31, 2017 is as follows:
| | | | | | | | | | | | | | |
| Federal Tax Cost | | | Unrealized Appreciation | | | Unrealized (Depreciation) | | | Net Tax Appreciation/
(Depreciation) | |
| $ | — | | | $ | 526,796 | | | $ | (44,764) | | | $ | 482,032 | |
Income and capital gains distributions are determined in accordance with income tax regulations that may differ from accounting principles generally accepted in the United States of America. These differences are due to differing treatments for items such as net short-term gains, deferral of wash sale losses, foreign currency transactions, passive foreign investment companies, net investment losses, in-kind transactions, and capital loss carryovers. Certain permanent differences such as tax returns of capital and net investment losses noted below have been reclassified to capital.
| | | | | | | | | | | | | | |
| For the year ended October 31, 2017 | |
| Distributions | | | | |
| From Ordinary Income | | | From Long-Term Capital Gains | | | Tax Return of Capital | | | Net Investment Loss | |
| $ | 600,654 | | | $ | — | | | $ | — | | | $ | — | |
| | |
| | Janus Detroit Street Trust ½ 21 |
Janus Velocity Volatility Hedged Large Cap ETF
Notes to Financial Statements
| | | | | | | | | | | | | | |
| For the year ended October 31, 2016 | |
| Distributions | | | | |
| From Ordinary Income | | | From Long-Term Capital Gains | | | Tax Return of Capital | | | Net Investment Loss | |
| $ | 817,870 | | | $ | — | | | $ | — | | | $ | — | |
|
| For the year ended November 30, 2015 | |
| Distributions | | | | |
| From Ordinary Income | | | From Long-Term Capital Gains | | | Tax Return of Capital | | | Net Investment Loss | |
| $ | 610,565 | | | $ | — | | | $ | — | | | $ | — | |
Permanent book to tax basis differences may result in reclassifications between the components of net assets. These differences have no impact on the results of operations or net assets. The following reclassifications have been made to the Fund:
| | | | | | | | | | |
| Increase/(Decrease) to Capital | | | Increase/(Decrease) to Undistributed
Net Investment Income/Loss | | | Increase/(Decrease) to Undistributed
Net realized Gain/Loss | |
| $ | (26,435) | | | $ | 26,435 | | | $ | — | |
6. Capital Share Transactions
| | | | | | | | | | | | | | | | | | | | | | | | |
| | | Year ended October 31, 2017 | | | Period ended October 31, 2016(1) | | | Year ended November 30, 2015(2) | |
| | | Shares | | | Amount | | | Shares | | | Amount | | | Shares | | | Amount | |
| Shares sold | | | 150,000 | | | $ | 5,054,794 | | | | 100,000 | | | $ | 2,907,773 | | | | 350,000 | | | $ | 10,663,752 | |
| Shares repurchased | | | — | | | | — | | | | (950,000) | | | | (27,531,566) | | | | (550,002) | | | | (16,562,473) | |
| Net Increase/(Decrease) | | | 150,000 | | | $ | 5,054,794 | | | | (850,000) | | | $ | (24,623,793) | | | | (200,002) | | | $ | (5,898,721) | |
| (1) | Period from December 1, 2015 through October 31, 2016. The Fund changed its fiscal year end from November 30 to October 31. |
| (2) | Period from December 1, 2014 through November 30, 2015. |
7. Purchases and Sales of Investment Securities
For the year ended October 31, 2017, the aggregate cost of purchases and proceeds from sales of investment securities (excluding any short-term securities, short-term options contracts, and in-kind transactions) was as follows:
| | | | | | | | | | | | | | |
Purchases of Securities | | | Proceeds from Sales of Securities | | | Purchases of Long- Term U.S. Government Obligations | | | Proceeds from Sales of Long-Term U.S. Government Obligations | |
| $ | 972,625 | | | $ | 1,532,193 | | | $ | — | | | $ | — | |
For the year ended October 31, 2017, the cost of in-kind purchases and proceeds from in-kind sales, were as follows:
| | | | | | | | | | | | | | |
Purchases of Securities | | | Proceeds from Sales of Securities | | | Purchases of Long- Term U.S. Government Obligations | | | Proceeds from Sales of Long-Term U.S. Government Obligations | |
| $ | 4,316,162 | | | $ | — | | | $ | — | | | $ | — | |
8. Recent Accounting Pronouncements
The Securities and Exchange Commission (“SEC”) adopted new rules as well as amendments to its rules to modernize the reporting and disclosure of information by registered investment companies. In addition, the SEC adopted amendments to Regulation S-X, which require standardized, enhanced disclosure about derivatives in investment company financial statements, as well as other amendments. The compliance date of the amendments to Regulation SX was August 1, 2017. This report incorporates the amendments to Regulation S-X.
Janus Velocity Volatility Hedged Large Cap ETF
Notes to Financial Statements
The FASB issued Accounting Standards Update No. 2017-08, Receivables – Nonrefundable Fees and Other Costs (Subtopic 310-20), Premium Amortization on Purchased Callable Debt Securities (“ASU 2017-08”) to amend the amortization period for certain purchased callable debt securities held at a premium. The guidance requires certain premiums on callable debt securities to be amortized to the earliest call date. The amortization period for callable debt securities purchased at a discount will not be impacted. The amendments are effective for fiscal years, and interim periods within those fiscal years, beginning after December 15, 2018. Early adoption is permitted, including adoption in an interim period. Management is currently evaluating the impacts of ASU 2017-08 on the financial statements.
9. Merger Related Matters
On October 3, 2016, Janus Capital Group Inc. (“JCGI”), the direct parent of Janus Capital Management LLC, the investment adviser to the Fund (“Janus Capital”), and Henderson Group plc (“Henderson”) announced that they had entered into an Agreement and Plan of Merger (“Merger Agreement”) relating to the strategic combination of Henderson and JCGI (the “Merger”). Pursuant to the Merger Agreement, a newly formed, direct wholly-owned subsidiary of Henderson merged with and into JCGI, with JCGI as the surviving corporation and a direct wholly-owned subsidiary of Henderson.
The consummation of the Merger may have been deemed to cause an “assignment” (as defined in the Investment Company Act of 1940 Act, as amended) of the advisory agreement between the Fund and Janus Capital. As a result, the consummation of the Merger may have caused the pre-merger investment advisory agreement to terminate automatically in accordance with its terms.
On October 24, 2016, the Fund’s Board of Trustees approved, subject to shareholder approval, a new investment advisory agreement between the Fund and Janus Capital in order to permit Janus Capital to continue providing advisory services to the Fund following the closing of the Merger (“Post-Merger Advisory Agreement”). At the same meeting, the Trustees approved submitting the Post-Merger Advisory Agreement to Fund shareholders for approval.
On March 17, 2017, shareholders of the Fund approved the Post-Merger Advisory Agreement, which took effect upon the consummation of the Merger on May 30, 2017.
10. Subsequent Event
Management has evaluated whether any events or transactions occurred subsequent to October 31, 2017 and through the date of issuance of the Fund’s financial statements and determined that there were no material events or transactions that would require recognition or disclosure in the Fund’s financial statements.
| | |
| | Janus Detroit Street Trust ½ 23 |
Janus Velocity Volatility Hedged Large Cap ETF
Additional Information (unaudited)
Proxy Voting Policies and Voting Record
A description of the policies and procedures that the Fund uses to determine how to vote proxies relating to its portfolio securities is available without charge: (i) upon request, by calling 1-800-525-0020 (toll free); (ii) on the Fund’s website at janushenderson.com/proxyvoting; and (iii) on the SEC’s website at http://www.sec.gov.
Quarterly Portfolio Holdings
The Fund files its complete portfolio holdings (schedule of investments) with the SEC for the first and third quarters of each fiscal year on Form N-Q within 60 days of the end of such fiscal quarter. The Fund’s Form N-Q: (i) is available on the SEC’s website at http://www.sec.gov; (ii) may be reviewed and copied at the SEC’s Public Reference Room in Washington, D.C. (information on the Public Reference Room may be obtained by calling 1-800-SEC-0330); and (iii) is available without charge, upon request, by calling Janus Henderson at 1-800-525-0020 (toll free).
Designation Requirements (Unaudited)
For federal income tax purposes, the Fund designated the following for the year ended October 31, 2017:
| | | | |
| Dividends Received Deduction Percentage | | | 91% | |
| Qualified Dividend Income Percentage | | | 100% | |
Licensing Agreements
Janus Index & Calculation Services LLC (“Janus Index Services”) is the Index Provider for the Underlying Index. Janus Capital has entered into a license agreement with Janus Index Services to use the Underlying Index. Janus Index Services is affiliated with the Fund and Janus Capital. This affiliation may create potential conflicts for Janus Index Services as it may have an interest in the performance of the Fund, which could motivate it to alter the Underlying Index methodology for the Underlying Index. Janus Index Services has adopted procedures that it believes are reasonably designed to mitigate these and other potential conflicts.
Janus Index Services is the licensor of certain trademarks, service marks, and trade names. Neither Janus Index Services nor any of its affiliates make any representation or warranty, express or implied, to the owners of the Fund or any member of the public regarding the advisability of investing in securities generally or in the Fund particularly or the ability of the Underlying Index to track general market performance. The Underlying Index is determined, composed, and calculated by Janus Index Services without regard to Janus Capital or the Fund. Janus Index Services has no obligation to take the needs of Janus Capital or the owners of the Fund into consideration in determining, composing, or calculating the Underlying Index. Janus Index Services is not responsible for and has not participated in the determination of the timing of, prices at, or quantities of the Fund to be issued or in the determination or calculation of the equation by which the Fund is to be converted into cash.
ALTHOUGH JANUS INDEX SERVICES SHALL OBTAIN INFORMATION FOR INCLUSION IN OR FOR USE IN THE CALCULATION OF THE UNDERLYING INDEX FROM SOURCES WHICH IT CONSIDERS RELIABLE, IT DOES NOT GUARANTEE THE QUALITY, ACCURACY AND/OR THE COMPLETENESS OF THE UNDERLYING INDEX OR ANY DATA INCLUDED THEREIN AND SHALL HAVE NO LIABILITY FOR ERRORS OR OMISSIONS OF ANY KIND RELATED TO THE UNDERLYING INDEX OR DATA. JANUS INDEX SERVICES MAKES NO WARRANTY, EXPRESS OR IMPLIED, AS TO RESULTS TO BE OBTAINED BY JANUS CAPITAL, OWNERS OF THE FUND, OR ANY OTHER PERSON OR ENTITY FROM THE USE OF THE UNDERLYING INDEX OR ANY DATA INCLUDED THEREIN IN CONNECTION WITH THE RIGHTS LICENSED TO JANUS CAPITAL FOR ANY OTHER USE. JANUS INDEX SERVICES MAKES NO EXPRESS OR IMPLIED WARRANTIES, AND HEREBY EXPRESSLY DISCLAIMS ALL WARRANTIES OF MERCHANTABILITY OR FITNESS FOR A PARTICULAR PURPOSE OR USE WITH RESPECT TO THE UNDERLYING INDEX OR ANY DATA INCLUDED THEREIN. WITHOUT LIMITING ANY OF THE FOREGOING, IN NO EVENT SHALL IT HAVE ANY LIABILITY FOR ANY SPECIAL, PUNITIVE, INDIRECT, OR CONSEQUENTIAL DAMAGES (INCLUDING LOST PROFITS), EVEN IF NOTIFIED OF THE POSSIBILITY OF SUCH DAMAGES.
Janus Capital does not guarantee the accuracy and/or the completeness of the Underlying Index or any data included therein, and Janus Capital shall have no liability for any errors, omissions or interruptions therein. Janus Capital makes no warranty, express or implied, as to results to be obtained by the Fund, owners of the shares of the Fund or any other person or entity from the use of the Underlying Index or any data included therein. Janus Capital makes no express or implied warranties, and expressly disclaims all warranties of merchantability or fitness for a particular purpose or use with respect to the Underlying Index or any data included therein. Without limiting any of the foregoing, in no event shall Janus Capital have any liability for any special, punitive, direct, indirect or consequential damages (including lost profits) arising out of matters relating to the use of the Underlying Index even if notified of the possibility of such damages.
Janus Velocity Volatility Hedged Large Cap ETF
Board Considerations Regarding Approval of Investment Advisory Agreements (unaudited)
APPROVAL OF ADVISORY AGREEMENT DURING THE PERIOD FOR JANUS VELOCITY TAIL RISK HEDGED LARGE CAP ETF AND JANUS VELOCITY VOLATILITY HEDGED LARGE CAP ETF
The Trustees of Janus Detroit Street Trust (the “Trust”), the majority of whom serve as “independent” Trustees (the “Independent Trustees”) met on February 3, 2016 to consider the proposed investment management agreement (the “Investment Management Agreement”) for Janus Velocity Tail Risk Hedged Large Cap ETF and Janus Velocity Volatility Hedged Large Cap ETF (each a “New Hedged Equity Fund” and collectively, the “New Hedged Equity Funds”). In the course of their consideration of the Investment Management Agreement, the Trustees met in executive session and were advised by their independent counsel. In this regard, the Board, including the Independent Trustees, evaluated the terms of the Investment Management Agreement and reviewed the duties and responsibilities of the Trustees in evaluating and approving such agreements. In considering approval of the Investment Management Agreement, the Board, including the Independent Trustees, reviewed the Board Materials and other information from counsel and from Janus Capital Management LLC, the investment adviser (the “Adviser”), including: (i) a copy of the form of Investment Management Agreement, with respect to the Adviser’s management of the assets of each New Hedged Equity Fund; (ii) information describing the nature, quality and extent of the services that the Adviser will provide to the New Hedged Equity Fund, and the fees the Adviser will charge to the New Hedged Equity Funds; (iii) information concerning the Adviser’s financial condition, business, operations, portfolio management teams and compliance programs; (iv) information describing each New Hedged Equity Fund’s anticipated advisory fee and operating expenses; (v) a copy of the Adviser’s current Form ADV; and (vi) a memorandum from counsel on the responsibilities of trustees in considering investment advisory arrangements under the 1940 Act. The Board also considered presentations made by, and discussions held with, representatives of the Adviser. The Board also received information comparing the advisory fees and expenses of the New Hedged Equity Funds to those from fund complexes that were defined as competitors.
During its review of this information, the Board focused on and analyzed the factors that the Board deemed relevant, including: the nature, extent and quality of the services to be provided to each New Hedged Equity Fund by the Adviser; the Adviser’s personnel and operations; each New Hedged Equity Fund’s proposed expense level; the anticipated profitability to the Adviser under the Investment Management Agreement at certain asset levels; any “fall-out” benefits to the Adviser and its affiliates (i.e., the ancillary benefits realized by the Adviser and its affiliates from the Adviser’s relationship with the Trust); the effect of asset growth on each New Hedged Equity Fund’s expenses; and possible conflicts of interest.
The Trustees also considered benefits that accrue to the Adviser and its affiliates from their relationships with the New Hedged Equity Funds. They recognized that an affiliate of the Adviser would separately serve the New Hedged Equity Funds as index provider. The Trustees also concluded that, other than the services provided by the Adviser and its affiliates pursuant to the agreements and the fees to be paid by the New Hedged Equity Funds therefor, the New Hedged Equity Funds and the Adviser may potentially benefit from their relationship with each other in other ways. They concluded that the success of the New Hedged Equity Funds could attract other business to the Adviser or other Janus funds, and that the success of the Adviser could enhance the Adviser’s ability to serve the New Hedged Equity Funds. The Board considered and determined that the services provided by the Adviser to the New Hedged Equity Funds were in addition to, rather than duplicative of, services provided under the advisory contracts of the ETFs in which these funds intended on investing.
The Board, including the Independent Trustees, considered the following in respect of each New Hedged Equity Fund:
The nature, extent and quality of services to be provided by the Adviser; personnel and operations of the Adviser.
The Board reviewed the services that the Adviser would provide to each New Hedged Equity Fund. In connection with the investment advisory services to be provided by the Adviser, the Board noted the responsibilities that the Adviser would have as the Funds’ investment adviser, including: the overall supervisory responsibility for the general management and investment of each New Hedged Equity Fund’s securities portfolio; providing oversight of the investment performance and processes and compliance with each New Hedged Equity Fund’s investment objectives, policies and limitations; the implementation of the investment management program of each New Hedged Equity Fund; the management of the day-to-day investment and reinvestment of the assets of each New Hedged Equity Fund; determining daily baskets of deposit securities and cash components; executing portfolio security trades for purchases and redemptions of New Hedged Equity Fund shares conducted on a cash-in-lieu basis; the responsibility for daily monitoring of tracking error and quarterly reporting to the Board; the review of brokerage matters; the oversight of general portfolio compliance with relevant law; and the implementation of Board directives as they relate to the New Hedged Equity Funds.
| | |
| | Janus Detroit Street Trust ½ 25 |
Janus Velocity Volatility Hedged Large Cap ETF
Board Considerations Regarding Approval of Investment Advisory Agreements (unaudited)
The Board reviewed the Adviser’s experience, resources and strengths in managing other pooled investment vehicles, including the Adviser’s personnel. Based on its consideration and review of the foregoing information, the Board determined that each New Hedged Equity Fund was likely to benefit from the nature, quality and extent of these services, as well as the Adviser’s ability to render such services based on their experience, personnel, operations and resources.
Comparison of services to be rendered and fees to be paid to those under other investment advisory contracts, and the cost of the services to be provided and profits to be realized by the Advisers from the relationship with the New Hedged Equity Funds; “fall-out” benefits.
The Board then compared both the services to be rendered and the proposed fees to be paid under other contracts of the Adviser, and under contracts of other investment advisers with respect to similar ETFs. In particular, the Board compared each New Hedged Equity Fund’s proposed advisory fee and projected expense ratio to other investment companies considered to be in that New Hedged Equity Fund’s peer group. The Board also received and considered information about the fee rates charged to other accounts and clients that are managed by the Adviser, including information about the differences in services provided to the non-registered investment company clients. With regard to each New Hedged Equity Fund, the Board noted the following:
The Board noted that the Adviser was recommending a unitary fee that was lower than each New Hedged Equity Fund’s respective peer group median total expense ratio.
The Board also discussed the anticipated costs and projected profitability of the Adviser in connection with its serving as investment adviser to each New Hedged Equity Fund, including operational costs. In addition, the Board discussed the entrepreneurial risk undertaken by the Adviser in creating the Trust. After comparing each New Hedged Equity Fund’s proposed fees with those of other funds in the New Hedged Equity Fund’s peer group, and in light of the nature, extent and quality of services proposed to be provided by the Adviser and the costs expected to be incurred by the Adviser in rendering those services, the Board concluded that the level of fees proposed to be paid to the Adviser with respect to the New Hedged Equity Funds were fair and reasonable.
The Board also considered that the Adviser may experience reputational “fall-out” benefits based on the success of the New Hedged Equity Funds, but that such benefits are not easily quantifiable.
The extent to which economies of scale would be realized as the Funds grow and whether fee levels would reflect such economies of scale.
The Board next discussed potential economies of scale. Since the Trust is newly formed, the Trust and the New Hedged Equity Funds had not commenced operations, and the eventual aggregate amount of assets was uncertain, the Adviser was not able to provide the Board with specific information concerning the extent to which economies of scale would be realized as each New Hedged Equity Fund grows and whether fee levels would reflect such economies of scale, if any. The Board recognized the uncertainty in launching a new investment product and estimating future asset levels.
Investment performance of the Funds and the Adviser.
Because each New Hedged Equity Fund is newly formed and had not commenced operations, the Board did not consider the investment performance of the New Hedged Equity Funds or the Adviser. The Board noted that it had received performance information of comparable operational ETFs tracking similar underlying indices.
Conclusion.
No single factor was determinative to the decision of the Board. Based on the foregoing and such other matters as were deemed relevant, the Board concluded that the proposed advisory fee rate and projected total expense ratio are reasonable in relation to the services to be provided by the Adviser to each New Hedged Equity Fund, as well as the costs to be incurred and benefits to be gained by the Adviser in providing such services. The Board also found the proposed advisory fees to be reasonable in comparison to the fees charged by advisers to other comparable funds of similar actual or anticipated size. As a result, the Board concluded that the initial approval of the Investment Management Agreement was in the best interests of each New Hedged Equity Fund.
After full consideration of the above factors, as well as other factors, the Trustees, with the Independent Trustees voting separately, determined to approve the investment advisory agreement for each New Hedged Equity Fund.
Janus Velocity Volatility Hedged Large Cap ETF
Board Considerations Regarding Approval of Investment Advisory Agreements (unaudited)
APPROVAL OF ADVISORY AGREEMENT DURING THE PERIOD WITH THE ADVISER POST-MERGER
On October 3, 2016, Janus Capital Group Inc. (“JCGI”), the direct parent of Janus Capital Management LLC, the investment adviser to the Funds (the “Adviser”), and Henderson Group plc (“Henderson”) announced that they had entered into an Agreement and Plan of Merger (“Merger Agreement”) relating to the business combination of Henderson and JCGI (the “Merger”). Pursuant to the Merger Agreement, a newly formed, direct wholly-owned subsidiary of Henderson will merge with and into JCGI, with JCGI as the surviving corporation and a direct wholly-owned subsidiary of Henderson. The Merger is expected to close in the second quarter of 2017, subject to requisite shareholder and regulatory approvals. The consummation of the Merger will be deemed to be an “assignment” (as defined in the Investment Company Act of 1940, as amended) of the advisory agreement between the Fund and Janus Capital. As a result, the consummation of the Merger will cause such advisory agreement to terminate automatically in accordance with its terms.
The Trustees of the Trust, the majority of whom are Independent Trustees met on October 24, 2016, and at various times in advance of that date, which meeting was called for the purpose of considering the proposed investment management agreement (the “New Investment Management Agreement”) between the Adviser as a subsidiary of Henderson following the consummation of the Merger and the following series of the Trust: Janus Small Cap Growth Alpha ETF, Janus Small/Mid Cap Growth Alpha ETF, The Organics ETF, The Long-Term Care ETF, The Obesity ETF, The Health and Fitness ETF, Janus Velocity Tail Risk Hedged Large Cap ETF and Janus Velocity Volatility Hedged Large Cap ETF (each a “Fund” and collectively, the “Funds”). The Independent Trustees met with representatives of the Adviser to discuss the anticipated effects of the Merger. During these meetings, the Adviser indicated its belief that the Merger would not adversely affect the continued operation of the Funds or the capabilities of the investment advisory personnel who currently manage the Funds to continue to provide these and other services to the Funds at the current levels. The Adviser also indicated that it believed that the Merger could provide certain benefits to the Funds but that there could be no assurance as to any particular benefits that might result.
In the course of their consideration of the New Investment Management Agreement, the Trustees met in executive session and were advised by their independent counsel. In this regard, the Board, including the Independent Trustees, evaluated the terms of the New Investment Management Agreement and reviewed the duties and responsibilities of the Trustees in evaluating and approving such agreements. In considering approval of the Investment Management Agreement, the Board, including the Independent Trustees, reviewed the board materials (the “Materials”) and other information provided in advance of the meeting from counsel, the Adviser, as well as from Henderson, including: (i) a copy of the form of New Investment Management Agreement, with respect to the Adviser’s management of the assets of each Fund; (ii) information describing the nature, quality and extent of the services that will be provided to each Fund, and the fees that will be charged to the Funds; (iii) information concerning the Adviser’s and Henderson’s financial condition, business, operations, portfolio management teams and compliance programs; (iv) information describing each Fund’s anticipated advisory fee and operating expenses; (v) information concerning the anticipated structure of the post-Merger entity (“Janus Henderson”); and (v) a memorandum from counsel on the responsibilities of trustees in considering investment advisory arrangements under the 1940 Act. The Board also considered presentations made by, and discussions held with, representatives of the Adviser. The Board also noted the information previously provided to the Board during 2016 related to the initial approvals of each Fund.
During its review of this information, the Board focused on and analyzed the factors that the Board deemed relevant, including, among other matters:
| 1) | That the material terms regarding advisory services pursuant to the New Investment Management Agreement are substantially identical to the terms of the current investment management agreement with the Adviser; |
| 2) | That there is not expected to be any diminution in the nature, extent and quality of the services provided to the Funds and their shareholders by Janus Henderson, including compliance services; |
| 3) | The commitment of the Adviser to retain key personnel currently employed by the Adviser who provide services to the Funds; |
| 4) | That the manner in which each Fund’s assets are managed would not change as a result of the Merger, and that the same portfolio managers managing each Fund’s assets are expected to continue to do so after the Merger; |
| 5) | The terms and conditions of the New Investment Management Agreement, including the current advisory fee rates and operational expenses, are the same as the current fee rates under the current investment management agreement; |
| | |
| | Janus Detroit Street Trust ½ 27 |
Janus Velocity Volatility Hedged Large Cap ETF
Board Considerations Regarding Approval of Investment Advisory Agreements (unaudited)
| 6) | That each Fund’s expense ratios are not expected to increase as a result of the Merger or approval of the New Investment Management Agreement; |
| 7) | That the fees and expense ratios of the Funds relative to comparable investment companies continued to be reasonable given the quality of services provided; |
| 8) | The history, reputation, qualification and background of Henderson, as well as its financial condition; |
| 9) | The reputation, financial strength, corporate structure and capital resources of Henderson and its investment advisory subsidiaries and the anticipated financial strength of Janus Henderson; |
| 10) | The long-term business goals of the Adviser and Henderson with respect to the Funds; |
| 11) | That, pursuant to the terms of the Merger, Henderson has acknowledged the Advisor’s reliance upon the benefits and protections provided by Section 15(f) and has agreed not to take, and to cause its affiliates not to take, any action that would have the effect, directly or indirectly, of causing the requirements of any of the provisions of Section 15(f) not to be met in respect of the Merger; |
| 12) | That shareholders would not bear any costs in connection with the Merger, that the Adviser will bear the costs, fees and expenses incurred by the Funds in connection with the Proxy Statement, including all expenses in connection with the solicitation of proxies, the fees and expenses of attorneys relating to the Merger and Proxy Statement, and other fees and expenses incurred by the Funds, if any, in connection with the Merger; |
| 13) | The Adviser’s commitment to provide resources to the Funds and the potential for increased distribution capabilities as a result of the Merger, which have the potential to result in long-term economies of scale; and |
| 14) | That the Adviser and Henderson would derive benefits from the Merger and that, as a result, they have a different financial interest in the matters that were being considered than do Fund shareholders. |
In connection with their consideration of the New Investment Advisory Agreement on October 24 2016, the Board noted that, in February 2016, April 2016 and October 2016, the Board had initially approved the respective Funds’ current investment advisory agreements. The Trustees considered that, in connection with the foregoing approvals, the Board had determined that the Adviser had the capabilities, resources and personnel necessary to provide the services to each Fund required under the current investment advisory agreement, and the advisory fee rates paid by each Fund, taking into account the unitary fees charged to the Funds, represented reasonable compensation to the Adviser in light of the services provided. The Trustees noted that the Board also considered the cost to the Adviser of providing those services, potential economies of scale as each Fund’s assets grow, the fees and expenses paid by other comparable funds, and such other matters as the Board had considered relevant in the exercise of their reasonable business judgment.
To inform their consideration of the New Agreement, the Independent Trustees received and considered responses by the Adviser and Henderson to inquiries requesting information regarding: Henderson’s structure, operations, financial resources and key personnel; the material aspects of the Merger, the proposed operations of Janus Henderson and its compliance program, code of ethics, trading policies and key management and investment personnel, including each Fund’s portfolio managers; and anticipated changes to the management or operations of the Board and the Funds, including, if applicable, any changes to the Funds’ service providers, advisory fees and expense structure.
In considering the information and materials described above, the Independent Trustees received assistance from, and met separately with, independent legal counsel and were provided with a written description of their statutory responsibilities and the legal standards that are applicable to approvals of advisory agreements. The Board did not identify any particular information that was most relevant to its consideration to approve the New Investment Management Agreement for each Fund and each Trustee may have afforded different weight to the various factors. Legal counsel to the Independent Trustees provided the Board with a memorandum regarding its responsibilities pertaining to the approval of the New Agreement. In determining whether to approve the New Investment Management Agreement, the Board considered the best interests of each Fund separately.
In voting to approve the New Investment Management Agreement, the Board considered the overall fairness of the New Investment Management Agreement and factors it deemed relevant with respect to each Fund, including, but not limited to: (i) the nature, extent and quality of the services to be provided by Janus Henderson, (ii) that the investment personnel who currently manage the Funds would continue to manage the Funds as employees of Janus Henderson, (iii) that the fees and expenses of the Funds after the Transaction are expected to remain the same, (iv) the projected profitability of
Janus Velocity Volatility Hedged Large Cap ETF
Board Considerations Regarding Approval of Investment Advisory Agreements (unaudited)
the Funds to Janus Henderson and its affiliates; (v) whether the projected economies of scale would be realized as the Funds grow and whether any breakpoints are appropriate at certain asset levels and (vi) other benefits that may accrue Janus Henderson from its relationship with the Funds. The Board also considered that the Transaction might not be consummated if the New Investment Management Agreement was not approved by the Board and the shareholders of each Fund.
Although not meant to be all-inclusive, set forth below is a description of the information and certain factors that were considered by the Board, including the Independent Trustees in deciding to approve the New Investment Management Agreement in respect of each Fund:
The nature, extent and quality of services to be provided by Janus Henderson; personnel and operations of Janus Henderson.
In considering the nature, extent and quality of the services to be provided by Janus Henderson under the New Investment Management Agreement, the Board considered that the terms of the New Investment Management Agreement are substantially similar to the terms of the current investment management agreement. The Board considered that the level of service and manner in which each Fund’s assets are managed were expected to remain the same.
The Board considered that, for a period of time after closing, the Adviser expects that the operations of Janus Henderson, as they relate to the Funds, would be the same as those of the Adviser. The Board considered that the Adviser’s key personnel who provide services to the Funds are expected to provide those same services after the Merger. The Board also noted that the Merger is not expected to result in any change in the structure or operations of the Funds and that the Adviser does not currently anticipate any immediate changes to the Funds’ key service providers.
In evaluating Janus Henderson, the Board considered the history, background, reputation and qualification of the Adviser and Henderson, as well as their personnel and Henderson’s financial condition. The Board considered that Henderson is a global asset management firm that was established in 1934, and that it has a long history of asset management around the world. The Board also considered Henderson’s capabilities, experience, corporate structure and capital resources, as well as the Adviser’s long-term business goals with respect to the Janus Henderson Merger and the Funds.
Based on its consideration and review of the foregoing information, the Board determined that each Fund was likely to benefit from the nature, quality and extent of these services, as well as the Janus Henderson’s ability to render such services based on their experience, personnel, operations and resources.
Cost of the services to be provided and profits to be realized by Janus Henderson from the relationship with the Funds; fall-out benefits.
The Board noted that the unitary fee currently in place for each Fund will remain in place and unchanged under the New Investment Management Agreement.
The Board also discussed the anticipated costs and projected profitability of Janus Henderson in connection with its serving as investment adviser to each Fund, including operational costs. In addition, the Board discussed that the Funds’ expenses were not expected to increase materially as a result of the Merger. The Board also noted that Henderson does not currently provide any investment management services to other exchange traded funds. In light of the nature, extent and quality of services proposed to be provided by Janus Henderson and the costs expected to be incurred by Janus Henderson in rendering those services, the Board concluded that the level of fees proposed to be paid to Janus Henderson with respect to the Funds were fair and reasonable.
The extent to which economies of scale would be realized as the Funds grow and whether fee levels would reflect such economies of scale.
The Board next discussed potential economies of scale. The Board discussed the promised continued commitment to expand the distribution of Fund shares, and the potential for increased distribution capabilities as a result of the Merger, which have the potential to result in long-term economies of scale.
The Board also noted that since the Trust is newly formed, the eventual aggregate amount of assets was uncertain, and therefore specific information concerning the extent to which economies of scale would be realized as each Fund grows and whether fee levels would reflect such economies of scale, if any, was difficult to determine. The Board recognized the uncertainty in launching new investment products and estimating future asset levels.
| | |
| | Janus Detroit Street Trust ½ 29 |
Janus Velocity Volatility Hedged Large Cap ETF
Board Considerations Regarding Approval of Investment Advisory Agreements (unaudited)
Other Benefits to Janus Henderson.
The Board considered other potential benefits that may accrue to Janus Henderson as a result of its relationship with the Funds, which include reputational benefits that may enhance Janus Henderson’s ability to gain business opportunities from other clients.
Conclusion.
No single factor was determinative to the decision of the Board. Based on, but not limited to, the foregoing, and such other matters as were deemed relevant, the Board concluded that the New Investment Management Agreement was fair and reasonable in light of the services to be performed, fees, expenses and such other matters as the Board considered relevant in the exercise of its business judgment.
After full consideration of the above factors, as well as other factors, the Trustees, with the Independent Trustees voting separately, determined to approve the New Investment Management Agreement with respect to the Funds.
Janus Velocity Volatility Hedged Large Cap ETF
Shareholder Meeting (unaudited)
A Special Meeting of Shareholders of the Fund was held on March 17, 2017. At the meeting, the following matter was voted on and approved by the Shareholders. Each whole or fractional vote reported represents one whole or fractional dollar of net asset value held on the record date for the meeting. The results of the Special Meeting of Shareholders are noted below.
Proposal
To approve a new investment advisory agreement.
| | | | | | | | | | |
| | | | Number of Votes ($) |
| Record Date Votes ($) | | | Affirmative | | Against | | Abstain | | Broker Non-Votes |
| | 43,834,000.000 | | | 24,136,002.320 | | 162,686.760 | | 321,491.080 | | 0.000 |
| | |
| | Janus Detroit Street Trust ½ 31 |
Janus Velocity Volatility Hedged Large Cap ETF
Trustees and Officers (unaudited)
The Fund’s Statement of Additional Information includes additional information about the Trustees and officers and is available, without charge, by calling 1-877-335-2687.
The following are the Trustees and officers of the Trust, together with a brief description of their principal occupations during the last five years (principal occupations for certain Trustees may include periods over five years).
Each Trustee has served in that capacity since he or she was originally elected or appointed. The Trustees do not serve a specified term of office. Each Trustee will hold office until the termination of the Trust or his or her earlier death, resignation, retirement, incapacity, or removal. Under the Fund’s Governance Procedures and Guidelines, the policy is for Trustees to retire no later than the end of the calendar year in which the Trustee turns 75. The Trustees review the Fund’s Governance Procedures and Guidelines from time to time and may make changes they deem appropriate. The Fund’s Nominating and Governance Committee will consider nominees for the position of Trustee recommended by shareholders. Shareholders may submit the name of a candidate for consideration by the Committee by submitting their recommendations to the Trust’s Secretary. Each Trustee is currently a Trustee of one other registered investment company advised by Janus Capital: Clayton Street Trust. Collectively, these two registered investment companies consist of 12 series or funds.
The Trust’s officers are elected annually by the Trustees for a one-year term. Certain officers also serve as officers of Clayton Street Trust. Certain officers of the Fund may also be officers and/or directors of Janus Capital. Fund officers receive no compensation from the Fund, except for the Fund’s Chief Compliance Officer, as authorized by the Trustees.
| | | | | | | | | | | | | | | | | | |
| TRUSTEES | | | | | | | | | | | | | | |
| Name, Address, and Age | | Positions Held
with the Trust | | | Length of
Time Served | | | Principal Occupations
During the Past Five Years | | Number of
Portfolios/Funds
in Fund Complex
Overseen by
Trustee | | | Other Directorships
Held by Trustee
During the Past Five Years | |
Independent Trustees | | | | | | | | | | | | | | | | | | |
Clifford J. Weber 151 Detroit Street Denver, CO 80206 DOB: 1963 | |
| Chairman
Trustee |
| |
| 2/16-Present
2/16-Present |
| | Owner, Financial Products Consulting Group LLC (consulting services to financial institutions) (since 2015). Formerly, Executive Vice President of Global Index and Exchange- Traded Products, NYSE Market, Inc., a subsidiary of Intercontinental Exchange (ETF/ETP listing exchange) (2013-2015) and Executive Vice President and Head of Strategy and Product Development, NYSE Liffe U.S., a division of NYSE Euronext (U.S. futures exchange) (2008-2013). | | | 12 | | |
| .Independent Trustee,
Clough Funds Trust
(investment
company) (since
2015); Chairman,
Clough Funds Trust
(investment
company) (since
2017); Independent
Trustee, Clough
Dividend and Income
Fund (closed-end
fund) (since 2017);
Independent Trustee,
Clough Global
Opportunities Fund
(closed-end fund)
(since 2017);
Independent Trustee,
Clough Global Equity
Fund (closed-end
fund) (since 2017);
Independent Trustee,
Elevation ETF Trust
(since 2016);
Chairman, Elevation
ETF Trust (since
2017) |
|
Janus Velocity Volatility Hedged Large Cap ETF
Trustees and Officers (unaudited)
| | | | | | | | | | | | | | | | | | |
| TRUSTEES | | | | | | | | | | | | | | |
| Name, Address, and Age | | Positions Held
with the Trust | | | Length of
Time Served | | | Principal Occupations
During the Past Five Years | | Number of
Portfolios/Funds
in Fund Complex
Overseen by
Trustee | | | Other Directorships
Held by Trustee
During the Past Five Years | |
| | | | | |
Maureen T. Upton 151 Detroit Street Denver, CO 80206 DOB: 1965 | | | Trustee | | | | 2/16-Present | | | Principal, Maureen Upton Ltd. (consulting services to developers of major infrastructure projects and investors) (since 2017). Formerly, Principal Consultant, SRK Consulting (U.S.), Inc. (consulting services to global mining, energy and water resource industries) (2015-2017) and Founder and Principal, Resource Initiatives LLC (sustainability consulting firm) (2006-2015). | | | 12 | | |
| Director, Denver
Metro Leadership
Foundation
(non-profit
organization) (2012-2014). |
|
Jeffrey B. Weeden 151 Detroit Street Denver, CO 80206 DOB: 1956 | | | Trustee | | | | 2/16-Present | | | Senior Advisor, BayBoston Capital LP (investment fund in banks and bank holdings companies) (since 2015). Management Advisor, BoxCast, Inc. (technology start-up company) (2014-2017). Formerly Senior Executive Vice President and Chief Financial Officer, KeyCorp (financial services) (2002-2013). | | | 12 | | |
| Director, State
Farm
Bank (banking)
(since 2014). |
|
Interested Trustee | | | | | | | | | | | | | | | | | | |
Michael Drew Elder** 151 Detroit Street Denver, CO 80206 DOB: 1970 | | | Trustee | | | | 8/15-Present | | | Executive Vice President and Head of U.S. Intermediary Distribution, Janus Capital (since 2014) and President, Janus Distributors LLC (broker- dealer) (since 2014). Formerly, Senior Vice President, Janus Capital (2007-2014). | | | 12 | | |
| Director, Perkins
Investment
Management
LLC (since 2014). |
|
| ** | Michael Drew Elder is an Interested Trustee because of his employment with Janus Capital. |
| | |
| | Janus Detroit Street Trust ½ 33 |
Janus Velocity Volatility Hedged Large Cap ETF
Trustees and Officers (unaudited)
| | | | | | |
| OFFICERS | | | | | | |
| Name, Address, and Age | | Positions Held with the Trust | | Term of Office* and
Length of Time Served | | Principal Occupations
During the Past Five Years |
Bruce L. Koepfgen 151 Detroit Street Denver, CO 80206 DOB: 1952 | | President and Chief Executive Officer | | 2/16-Present | | Head of North America for Janus Henderson Investors and Janus Capital Management (since 2017); Executive Vice President and Director of Janus International Holding LLC (since 2011); Executive Vice President of Janus Distributors LLC (since 2011); Vice President and Director of INTECH Investment Management LLC (since 2011); Executive Vice President and Director of Perkins Investment Management LLC (since 2011); and Executive Vice President and Director of Janus Management Holdings Corporation (since 2011). Formerly, President of Janus Capital Group Inc. and Janus Capital Management LLC (2013-2017); Executive Vice President of Janus Services LLC (2011-2015), Janus Capital Group Inc. and Janus Capital Management LLC (2011-2013); and Chief Financial Officer of Janus Capital Group Inc., Janus Capital Management LLC, Janus Distributors LLC, Janus Management Holdings Corporation, and Janus Services LLC (2011-2013). |
| | | |
Susan K. Wold 151 Detroit Street Denver, CO 80206 DOB: 1960 | | Vice President, Chief Compliance Officer, and Anti-Money Laundering Officer | | 10/17-Present; Vice President, Provisional Chief Compliance Officer, and Anti-Money Laundering Officer (9/17-10/17) | | Senior Vice President and Head of Compliance, North America for Janus Henderson (since September 2017); Formerly, Vice President, Head of Global Corporate Compliance, and Chief Compliance Officer for Janus Capital Management (May 2017-September 2017); Vice President, Compliance at Janus Capital Group and Janus Capital Management (2005-2017). |
| | | |
Jesper Nergaard 151 Detroit Street Denver, CO 80206 DOB: 1962 | | Vice President, Chief Financial Officer, Treasurer, and Principal Accounting Officer | | 2/16-Present | | Vice President of Janus Capital and Janus Services LLC. |
| | | |
Kathryn L. Santoro 151 Detroit Street Denver, CO 80206 DOB: 1973 | | Vice President, Secretary and Chief Legal Counsel | | 1/17-Present | | Vice President of Janus Capital and Janus Services LLC (since 2016). Formerly, Vice President and Associate Counsel of Curian Capital, LLC and Curian Clearing LLC (2013- 2016); and General Counsel and Secretary (2011-2012) and Vice President (2009-2012) of Old Mutual Capital, Inc. |
| * | Officers are elected at least annually by the Trustees for a one-year term and may also be elected from time to time by the Trustees for an interim period. |
Janus Velocity Volatility Hedged Large Cap ETF
Notes
| | |
| | Janus Detroit Street Trust ½ 35 |
Janus Velocity Volatility Hedged Large Cap ETF
Notes
Janus Velocity Volatility Hedged Large Cap ETF
Notes
| | |
| | Janus Detroit Street Trust ½ 37 |
Knowledge. Shared
At Janus Henderson, we believe in the sharing of expert insight for better investment and business decisions. We call this ethos Knowledge. Shared.
Learn more by visiting janushenderson.com.
This report is submitted for the general information of shareholders of the Fund. It is not an offer or solicitation for the Fund and is not authorized for distribution to prospective investors unless preceded or accompanied by an effective prospectus.
Janus Henderson is a trademark of Janus Henderson Investors. © Janus Henderson Investors. The name Janus Henderson Investors includes HGI Group Limited, Henderson Global Investors (Brand Management) Sarl and Janus International Holding LLC.
Janus Capital Management LLC is the investment adviser and ALPS Distributors, Inc. is the distributor. ALPS is not affiliated with Janus Henderson or any of its subsidiaries.
ANNUAL REPORT
October 31, 2017
The Long-Term Care ETF
Janus Detroit Street Trust

Table of Contents
The Long-Term Care ETF (unaudited)
INVESTMENT OBJECTIVE
The Long-Term Care ETF seeks investment results that correspond generally to the performance, before fees and expenses, of an index which is designed to track the performance of companies globally that are positioned to profit from providing long-term care to the aging population, including companies owning or operating senior living facilities, nursing services, specialty hospitals, and senior housing, biotech companies for age-related illnesses, and companies that sell products and services to such facilities.
PERFORMANCE OVERVIEW
| • | | Stocks rallied after the November U.S. presidential election on the expectation the new administration would champion pro-growth initiatives that would benefit the U.S. economy. Signs of synchronized economic growth in major world economies and corporate earnings strength were also supportive of stocks. During the period, the market experienced some volatility as investors questioned whether Congress would be able to successfully implement the administration’s proposed policies. However, stocks delivered strong returns during the 12-month period. The underlying index underperformed the broader market, with the consumer services and financials sectors delivering the weakest returns. |
| • | | During the period, The Long-Term Care ETF (OLD) returned 2.66% (based on NAV); its primary benchmark, the Solactive Long-Term Care Index, returned 3.23%, and its secondary benchmark, the MSCI All Country World Index, returned 23.20%. |
| • | | OLD seeks investment results that correspond generally, before fees and expenses, to the performance of its primary benchmark. It seeks exposure to companies globally that are positioned to profit from providing long-term care to the aging population. These include companies owning or operating senior living facilities, nursing services, specialty hospitals or senior housing, as well as biotech companies for age-related illnesses and companies that sell products and services to such facilities. |
| | |
| | Janus Detroit Street Trust ½ 1 |
The Long-Term Care ETF (unaudited)
Fund At A Glance
October 31, 2017
| | | | |
| 5 Largest Equity Holdings – (% of Net Assets) | |
Ventas, Inc. | | | | |
Equity Real Estate Investment Trusts (REITs) | | | 20.3% | |
Welltower, Inc. | | | | |
Equity Real Estate Investment Trusts (REITs) | | | 20.1% | |
Orpea | | | | |
Health Care Providers & Services | | | 4.6% | |
HCP, Inc. | | | | |
Equity Real Estate Investment Trusts (REITs) | | | 4.5% | |
Senior Housing Properties Trust | | | | |
Equity Real Estate Investment Trusts (REITs) | | | 4.3% | |
| | | | |
| | | 53.8% | |
| | | | |
| Sector Allocation – (% of Net Assets) | | | |
Financial | | | 73.4% | |
Consumer, Non-cyclical | | | 24.9% | |
Investment Companies | | | 3.5% | |
Communications | | | 1.2% | |
Consumer, Cyclical | | | 0.3% | |
| | | | |
| | | 103.3% | |
Holdings are subject to change without notice.
The Long-Term Care ETF (unaudited)
Performance
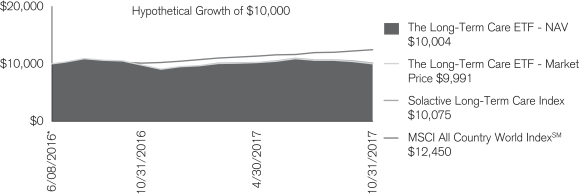
| | | | |
| Average Annual Total Return for the periods ended October 31, 2017 | | |
| | | One
Year | | Since
Inception* |
The Long-Term Care ETF – NAV | | 2.66% | | 0.03% |
The Long-Term Care ETF – Market Price | | 2.41% | | -0.06% |
Solactive Long-Term Care Index | | 3.23% | | 0.53% |
MSCI All Country World IndexSM | | 23.20% | | 16.98% |
Total annual expense ratio (estimated) as stated in the February 28, 2017 prospectus: 0.50%
Returns quoted are past performance and do not guarantee future results; current performance may be lower or higher. Investment returns and principal value will vary; there may be a gain or loss when shares are sold. For the most recent month-end performance call 800.668.0434 or visit janushenderson.com/performance.
Shares of ETFs are bought and sold at market price (not NAV) and are not individually redeemed from the Fund. Market returns are based upon the midpoint of the bid/ask spread at 4:00 p.m. Eastern time (when NAV is normally determined for most ETFs), and do not represent the returns you would receive if you traded shares at other times. Ordinary brokerage commissions apply and will reduce returns.
ETF shares are not individually redeemable and owners of the shares may acquire those shares from the Fund and tender those shares for redemption to the Fund in Creation Units only.
Investing involves risk, including the possible loss of principal and fluctuation of value.
Performance depends on that of the underlying index.
See the prospectus for a more complete discussion of objectives, risks and expenses.
Returns include reinvestment of dividends and capital gains. Returns greater than one year are annualized. Returns do not reflect the deduction of taxes that a shareholder would pay on Fund distributions or redemptions of Fund shares.
See Financial Highlights for actual expense ratios during the reporting period.
There is no assurance the stated objective(s) will be met.
See Notes to Schedule of Investments and Other Information for index definitions.
Index performance does not reflect the expenses of managing a portfolio as an index is unmanaged and not available for direct investment.
Solactive Indices were created by and are maintained by, Solactive AG. For detailed information on how stocks are selected for inclusion in the Underlying Index, see solactive.com. Solactive is not affiliated with Janus Henderson or ALPS.
Effective February 28, 2017 Edward Tom, Benjamin Wang and Scott Weiner are Co-Portfolio Managers of the Fund.
| * | The Fund commenced operations on June 8, 2016. |
| | |
| | Janus Detroit Street Trust ½ 3 |
The Long-Term Care ETF (unaudited)
Disclosure of Fund Expenses
As a shareholder of the Fund, you incur two types of costs: (1) transaction costs, which may include creation and redemption fees or brokerage charges and (2) ongoing costs, including management fees and other Fund expenses. This example is intended to help you understand your ongoing costs (in dollars) of investing in the Fund and to compare these costs with the ongoing costs of investing in other ETFs. To do so, compare this 5% hypothetical example with the 5% hypothetical examples that appear in the shareholder reports of the other funds. The example is based upon an investment of $1,000 invested at the beginning of the period and held for the six-months indicated, unless noted otherwise in the table and footnotes below.
Actual Expenses
The information in the table under the heading “Actual” provides information about actual account values and actual expenses. You may use the information in these columns, together with the amount you invested, to estimate the expenses that you paid over the period. Simply divide your account value by $1,000 (for example, an $8,600 account value divided by $1,000 = 8.6), then multiply the result by the number under the heading entitled “Expenses Paid During Period” to estimate the expenses you paid on your account during the period.
Hypothetical Example for Comparison Purposes
The information in the table under the heading “Hypothetical (5% return before expenses)” provides information about hypothetical account values and hypothetical expenses based upon the Fund’s actual expense ratio and an assumed rate of return of 5% per year before expenses, which is not the Fund’s actual return. The hypothetical account values and expenses may not be used to determine the actual ending account balance or expenses you paid for the period. You may use this information to compare the ongoing costs of investing in the Fund and other funds. To do so, compare this 5% hypothetical example with the 5% hypothetical examples that appear in the shareholder reports of the other funds. Additionally, for an analysis of the fees associated with an investment or other similar funds, please visit www.finra.org/fundanalyzer.
Please note that the expenses shown in the table are meant to highlight your ongoing costs only and do not reflect any transaction costs, such as creation and redemption fees, or brokerage charges. These fees are fully described in the Fund’s prospectus. Therefore, the hypothetical examples are useful in comparing ongoing costs only, and will not help you determine the relative total costs of owning different funds. In addition, if these transaction costs were included, your costs would have been higher.
| | | | | | | | | | | | | | | | | | | | | | | | |
Actual | | | Hypothetical
(5% return before expenses) | |
Beginning
Account
Value
(5/1/17) | | Ending
Account
Value
(10/31/2017) | | | Expenses
Paid During
Period
(5/1/17 - 10/31/2017)† | | | Beginning
Account
Value
(5/1/17) | | | Ending
Account
Value
(10/31/2017) | | | Expenses
Paid During
Period
(5/1/17 - 10/31/2017)† | | | Net Annualized
Expense Ratio
(5/1/17 - 10/31/2017) | |
| $1,000.00 | | $ | 983.40 | | | $ | 2.50 | | | $ | 1,000.00 | | | $ | 1,022.68 | | | $ | 2.55 | | | | 0.50% | |
| † | Expenses Paid During Period is equal to the Net Annualized Expense Ratio multiplied by the average account value over the period, multiplied by 184/365 (to reflect the one-half year period). |
The Long-Term Care ETF
Report of Independent Registered Public Accounting Firm
To the Board of Trustees of Janus Detroit Street Trust and Shareholders of The Long-Term Care ETF:
In our opinion, the accompanying statement of assets and liabilities, including the schedule of investments, and the related statements of operations and of changes in net assets and the financial highlights present fairly, in all material respects, the financial position of The Long-Term Care ETF (one of the funds constituting Janus Detroit Street Trust, hereafter referred to as the “Fund”) as of October 31, 2017, the results of its operations for the year then ended, and the changes in its net assets and financial highlights for the year then ended and for the period from June 8, 2016 (commencement of operations) through October 31, 2016, in conformity with accounting principles generally accepted in the United States of America. These financial statements and financial highlights (hereafter referred to as “financial statements”) are the responsibility of the Fund’s management. Our responsibility is to express an opinion on these financial statements based on our audits. We conducted our audits of these financial statements in accordance with the standards of the Public Company Accounting Oversight Board (United States). Those standards require that we plan and perform the audit to obtain reasonable assurance about whether the financial statements are free of material misstatement. An audit includes examining, on a test basis, evidence supporting the amounts and disclosures in the financial statements, assessing the accounting principles used and significant estimates made by management, and evaluating the overall financial statement presentation. We believe that our audits, which included confirmation of securities as of October 31, 2017 by correspondence with the custodian, brokers and transfer agent, provide a reasonable basis for our opinion.

Denver, Colorado
December 20, 2017
| | |
| | Janus Detroit Street Trust ½ 5 |
The Long-Term Care ETF
Schedule of Investments
October 31, 2017
| | | | | | | | |
| | | Shares | | | Value | |
| Common Stocks – 99.8% | | | | | | |
| Equity Real Estate Investment Trusts (REITs) – 70.6% | | | | | | |
Aedifica SA | | | 2,090 | | | | $199,162 | |
CareTrust, Inc. | | | 9,039 | | | | 170,837 | |
HCP, Inc. | | | 16,947 | | | | 437,911 | |
Ingenia Communities Group | | | 24,400 | | | | 49,578 | |
LTC Properties, Inc. | | | 4,700 | | | | 218,597 | |
National Health Investors, Inc. | | | 4,759 | | | | 362,588 | |
New Senior Investment Group, Inc. | | | 9,643 | | | | 86,209 | |
Omega Healthcare Investors, Inc.# | | | 14,035 | | | | 405,050 | |
Quality Care Properties, Inc.* | | | 11,306 | | | | 178,974 | |
Sabra Health Care, Inc. | | | 20,979 | | | | 417,902 | |
Senior Housing Properties Trust | | | 22,879 | | | | 420,974 | |
Ventas, Inc. | | | 31,551 | | | | 1,979,825 | |
Welltower, Inc. | | | 29,242 | | | | 1,958,044 | |
| | | | | | | | |
| | | | | | | 6,885,651 | |
| Health Care Providers & Services – 27.6% | | | | | | |
Almost Family, Inc.* | | | 1,545 | | | | 68,366 | |
Amedisys, Inc.* | | | 3,421 | | | | 164,584 | |
Arvida Group, Ltd. | | | 42,756 | | | | 34,855 | |
Brookdale Senior Living, Inc.* | | | 22,151 | | | | 222,175 | |
Capital Senior Living Corp.* | | | 2,812 | | | | 37,400 | |
Chartwell Retirement Residences | | | 22,849 | | | | 272,075 | |
Elan Corp. | | | 700 | | | | 10,078 | |
Ensign Group, Inc. | | | 5,777 | | | | 133,333 | |
Estia Health, Ltd. | | | 24,163 | | | | 64,474 | |
Extendicare, Inc. | | | 10,667 | | | | 77,535 | |
Genesis Healthcare, Inc.* | | | 4,357 | | | | 4,255 | |
Japara Healthcare, Ltd. | | | 29,467 | | | | 45,640 | |
Kindred Healthcare, Inc. | | | 10,093 | | | | 61,063 | |
Korian SA | | | 5,493 | | | | 178,534 | |
LHC Group, Inc.* | | | 1,953 | | | | 130,480 | |
Metlifecare, Ltd. | | | 20,197 | | | | 79,972 | |
N Field Co., Ltd. | | | 1,400 | | | | 25,849 | |
National HealthCare Corp. | | | 1,119 | | | | 71,616 | |
Orpea | | | 3,753 | | | | 449,666 | |
Pine Care Group, Ltd. | | | 32,000 | | | | 3,527 | |
Regis Healthcare, Ltd. | | | 16,030 | | | | 44,739 | |
Ryman Healthcare, Ltd. | | | 47,539 | | | | 302,869 | |
Sienna Senior Living, Inc. | | | 5,529 | | | | 76,216 | |
Summerset Group Holdings, Ltd. | | | 25,116 | | | | 83,792 | |
Tsukui Corp. | | | 6,000 | | | | 42,982 | |
| | | | | | | | |
| | | | | | | 2,686,075 | |
| Internet Software & Services – 1.2% | | | | | | |
SMS Co., Ltd. | | | 3,900 | | | | 116,866 | |
| Real Estate Management & Development – 0.4% | | | | | | |
DreamEast Group, Ltd.* | | | 8,500 | | | | 13,619 | |
Lifestyle Communities, Ltd. | | | 7,482 | | | | 25,930 | |
| | | | | | | | |
| | | | | | | | 39,549 | |
Total Common Stocks (cost $10,094,199) | | | | | | | 9,728,141 | |
| Investment Companies – 3.5% | | | | | | |
| Investments Purchased with Cash Collateral from Securities Lending – 3.5% | | | | | | |
Janus Cash Collateral Fund LLC, 1.0003%ºº,£ | | | 336,550 | | | | 336,550 | |
| Money Markets – 0.0% | | | | | | |
State Street Institutional U.S. Government Money Market Fund, 0.9569%ºº | | | 4 | | | | 4 | |
Total Investment Companies (cost $336,554) | | | | | | | 336,554 | |
Total Investments (total cost $10,430,753) – 103.3% | | | | | | | 10,064,695 | |
Liabilities, net of Cash, Receivables and Other Assets – (3.3%) | | | | | | | (320,497) | |
Net Assets – 100% | | | | | | | $9,744,198 | |
See Notes to Schedule of Investments and Other Information and Notes to Financial Statements.
The Long-Term Care ETF
Schedule of Investments
October 31, 2017
Summary of Investments by Country – (Long Positions) (unaudited)
| | | | | | | | |
| Country | | Value | | | % of
Investment
Securities | |
United States | | | $7,866,737 | | | | 78.2% | |
France | | | 628,200 | | | | 6.2 | |
New Zealand | | | 501,488 | | | | 5.0 | |
Canada | | | 425,826 | | | | 4.2 | |
Australia | | | 230,361 | | | | 2.3 | |
Belgium | | | 199,162 | | | | 2.0 | |
Japan | | | 195,775 | | | | 1.9 | |
Hong Kong | | | 17,146 | | | | 0.2 | |
Total | | | $10,064,695 | | | | 100.0% | |
Schedules of Affiliated Investments – (% of Net Assets)
| | | | | | | | | | | | | | | | |
| | | Dividend
Income | | | Realized
Gain/(Loss) | | | Change in Unrealized
Appreciation/
(Depreciation) | | | Value at
10/31/17 | |
Investment Companies – 3.5% | | | | | | | | | | | | | | | | |
Investments Purchased with Cash Collateral from Securities Lending – 3.5% | | | | | | | | | | | | | | | | |
Janus Cash Collateral Fund LLC, 1.0003%ºº | | $ | 371 | D | | $ | — | | | $ | — | | | $ | 336,550 | |
| | | | |
| | | Share Balance
at 10/31/16 | | | Purchases | | | Sales | | | Share Balance
at 10/31/17 | |
Investment Companies – 3.5% | | | | | | | | | | | | | | | | |
Investments Purchased with Cash Collateral from Securities Lending – 3.5% | | | | | | | | | | | | | | | | |
Janus Cash Collateral Fund LLC, 1.0003%ºº | | | — | | | | 2,498,758 | | | | (2,162,208) | | | | 336,550 | |
See Notes to Schedule of Investments and Other Information and Notes to Financial Statements.
| | |
| | Janus Detroit Street Trust ½ 7 |
The Long-Term Care ETF
Notes to Schedule of Investments and Other Information
| | |
| Solactive Long-Term Care Index | | Solactive Long-Term Care Index is designed to track the performance of companies globally that are positioned to profit from providing long-term care to the aging population, including: companies owning or operating senior living facilities, nursing services, specialty hospitals, and senior housing, biotech companies for age-related illnesses and companies that sell products and services to such facilities. |
| |
| MSCI All Country World IndexSM | | MSCI All Country World IndexSM reflects the equity market performance of global developed and emerging markets. |
| |
| LLC | | Limited Liability Company |
| # | Loaned security; a portion of the security is on loan at October 31, 2017. |
| * | Non-income producing security. |
| ºº | Rate shown is the 7-day yield as of October 31, 2017. |
| £ | The Fund may invest in certain securities that are considered affiliated companies. As defined by the Investment Company Act of 1940, as amended, an affiliated company is one in which the Fund owns 5% or more of the outstanding voting securities, or a company which is under common ownership or control. |
| D | Net of income paid to the securities lending agent and rebates paid to the borrowing companies. |
The following is a summary of the inputs that were used to value the Fund’s investments in securities and other financial instruments as of October 31, 2017. See Notes to Financial Statements for more information.
Valuation Inputs Summary
| | | | | | | | | | | | |
| | | Level 1 -
Quoted Prices | | | Level 2 -
Other Significant
Observable Inputs | | | Level 3 -
Significant
Unobservable Inputs | |
Assets | | | | | | | | | | | | |
Investments in Securities: | | | | | | | | | | | | |
Common Stocks | | $ | 9,728,141 | | | $ | — | | | $ | — | |
Investment Companies | | | 4 | | | | 336,550 | | | | — | |
| | | | |
Total Assets | | $ | 9,728,145 | | | $ | 336,550 | | | $ | — | |
See Notes to Schedule of Investments and Other Information and Notes to Financial Statements.
The Long-Term Care ETF
Statement of Assets and Liabilities
October 31, 2017
| | | | |
Assets: | | | | |
Unaffiliated investments, at value(1)(2) | | $ | 9,728,145 | |
Affiliated investments, at value(3) | | | 336,550 | |
Cash denominated in foreign currency(4) | | | 1,277 | |
Receivables: | | | | |
Investments sold | | | 399,684 | |
Dividends | | | 28,718 | |
Affiliated securities lending income, net | | | 106 | |
Total Assets | | | 10,494,480 | |
Liabilities: | | | | |
Collateral on securities loaned (Note 2) | | | 336,550 | |
Payables: | | | | |
Due to custodian | | | 3,710 | |
Investments purchased | | | 405,947 | |
Management fees | | | 4,075 | |
Total Liabilities | | | 750,282 | |
Net Assets | | $ | 9,744,198 | |
Net Assets Consists of: | | | | |
Capital (par value and paid-in surplus) | | | 10,191,538 | |
Undistributed net investment income/(loss) | | | — | |
Undistributed net realized gain/(loss) from investments and foreign currency transactions | | | (81,407) | |
Unrealized net appreciation/(depreciation) on investments and foreign currency translations | | | (365,933) | |
Total Net Assets | | $ | 9,744,198 | |
Net Assets | | $ | 9,744,198 | |
Shares outstanding, $0.001 Par Value (unlimited shares authorized) | | | 400,001 | |
Net Asset Value Per Share | | $ | 24.36 | |
| (1) | Includes cost of $10,094,203. |
| (2) | Includes $328,282 of securities on loan. See Note 2 in Notes to Financial Statements. |
| (3) | Includes cost of $336,550. |
| (4) | Includes cost of $1,297. |
See Notes to Financial Statements.
| | |
| | Janus Detroit Street Trust ½ 9 |
The Long-Term Care ETF
Statement of Operations
For the year ended October 31, 2017
| | | | |
Investment Income: | | | | |
Dividends | | $ | 226,219 | |
Affiliated securities lending income, net | | | 371 | |
Foreign tax withheld | | | (6,438) | |
Total Investment Income | | | 220,152 | |
Expenses: | | | | |
Management Fees | | | 35,221 | |
Total Expenses | | | 35,221 | |
Net Investment Income/(Loss) | | | 184,931 | |
Net Realized Gain/(Loss) on Investments: | | | | |
Investments and foreign currency transactions | | | (81,002) | |
Total Net Realized Gain/(Loss) on Investments | | | (81,002) | |
Change in Unrealized Net Appreciation/Depreciation: | | | | |
Investments and foreign currency translations | | | (303,267) | |
Total Change in Unrealized Net Appreciation/Depreciation | | | (303,267) | |
Net Increase/(Decrease) in Net Assets Resulting from Operations | | $ | (199,338) | |
See Notes to Financial Statements.
The Long-Term Care ETF
Statements of Changes in Net Assets
| | | | | | | | |
| | | Year ended
October 31, 2017 | | | Period ended
October 31, 2016(1) | |
Operations: | | | | | | | | |
Net investment income/(loss) | | $ | 184,931 | | | $ | 21,416 | |
Net realized gain/(loss) on investments | | | (81,002) | | | | (263) | |
Change in unrealized net appreciation/depreciation | | | (303,267) | | | | (62,666) | |
Net Increase/(Decrease) in Net Assets Resulting from Operations | | | (199,338) | | | | (41,513) | |
Dividends and Distributions to Shareholders: | | | | | | | | |
Dividends from Net Investment Income | | | (184,738) | | | | (21,391) | |
Return of Capital on Dividends from Net Investment Income | | | (22,237) | | | | (4,470) | |
Capital Share Transactions | | | 5,252,211 | | | | 4,965,674 | |
Net Increase/(Decrease) in Net Assets | | | 4,845,898 | | | | 4,898,300 | |
Net Assets: | | | | | | | | |
Beginning of period | | | 4,898,300 | | | | — | |
End of period | | $ | 9,744,198 | | | $ | 4,898,300 | |
| | |
| | | | | | | | |
Undistributed Net Investment Income/(Loss) | | $ | — | | | $ | — | |
| (1) | Period from June 8, 2016 (commencement of operations) through October 31, 2016. |
See Notes to Financial Statements.
| | |
| | Janus Detroit Street Trust ½ 11 |
The Long-Term Care ETF
Financial Highlights
| | | | | | | | | | |
| For a share outstanding during each year or period ended October 31 | | 2017 | | | 2016(1) | |
| | Net Asset Value, Beginning of Period | | | $24.49 | | | | $25.38 | |
| | Income/(Loss) from Investment Operations: | | | | | | | | |
| | Net investment income/(loss)(2) | | | 0.66 | | | | 0.21 | |
| | Net realized and unrealized gain/(loss) | | | (0.01) | | | | (0.84) | |
| | Total from Investment Operations | | | 0.65 | | | | (0.63) | |
| | Less Dividends and Distributions: | | | | | | | | |
| | Dividends (from net investment income) | | | (0.72) | | | | (0.21) | |
| | Return of Capital | | | (0.06) | | | | (0.05) | |
| | Total Dividends and Distributions | | | (0.78) | | | | (0.26) | |
| | Net Asset Value, End of Period | | | $24.36 | | | | $24.49 | |
| | Total Return* | | | 2.66% | | | | (2.56)% | |
| | Net assets, End of Period (in thousands) | | | $9,744 | | | | $4,898 | |
| | Average Net Assets for the Period (in thousands) | | | $7,044 | | | | $2,627 | |
| | Ratios to Average Net Assets**: | | | | | | | | |
| | Ratio of Gross Expenses | | | 0.50% | | | | 0.50% | |
| | Ratio of Net Investment Income/(Loss) | | | 2.63% | | | | 2.07% | |
| | Portfolio Turnover Rate(3) | | | 19% | | | | 5% | |
| * | Total return not annualized for periods of less than one full year. |
| ** | Annualized for periods of less than one full year. |
| (1) | Period from June 8, 2016 (commencement of operations) through October 31, 2016. |
| (2) | Per share amounts are calculated based on average shares outstanding during the year or period. |
| (3) | Portfolio turnover rate excludes securities received or delivered from in-kind processing of creation or redemptions. |
See Notes to Financial Statements.
The Long-Term Care ETF
Notes to Financial Statements
1. Organization and Significant Accounting Policies
The Long-Term Care ETF (the “Fund”) is a series fund. The Fund is part of Janus Detroit Street Trust (the “Trust”), which is organized as a Delaware statutory trust and is registered under the Investment Company Act of 1940, as amended (the “1940 Act”), as an open-end management investment company, and therefore has applied the specialized accounting and reporting guidance in Financial Accounting Standards Board (“FASB”) Accounting Standards Codification (“ASC”) Topic 946. The Trust offers nine Funds each of which represent shares of beneficial interest in a separate portfolio of securities and other assets with its own objective and policies. The Fund seeks investment results that correspond generally to the performance, before fees and expenses, of an index (“Underlying Index”) which is designed to track the performance of companies globally that are positioned to profit from providing long-term care to the aging population, including companies owning or operating senior living facilities, nursing services, specialty hospitals, and senior housing, biotech companies for age-related illnesses, and companies that sell products and services to such facilities. The Fund is classified as nondiversified, as defined in the 1940 Act.
Unlike shares of traditional mutual funds, shares of the Fund are not individually redeemable and may only be purchased or redeemed directly from the Fund at net asset value (“NAV”) in large increments called “Creation Units” (100,000 or more shares per Creation Unit) through certain participants, known as “Authorized Participants.” The Fund will issue or redeem Creation Units in exchange for portfolio securities and/or cash. Except when aggregated in Creation Units, Fund shares are not redeemable securities of the Fund. Shares of the Fund are listed and trade on The NASDAQ Stock Market LLC (“NASDAQ”) and individual investors can purchase or sell shares in much smaller increments and for cash in the secondary market through a broker. These transactions, which do not involve the Fund, are made at market prices that may vary throughout the day and differ from the Fund’s NAV. As a result, you may pay more than NAV (at a premium) when you purchase shares, and receive less than NAV (at a discount) when you sell shares, in the secondary market.
An Authorized Participant may hold of record more than 25% of the outstanding shares of the Fund. From time to time, Authorized Participants may be a beneficial and/or legal owner of the Fund, may be affiliated with an index provider, may be deemed to have control of the Fund and/or may be able to affect the outcome of matters presented for a vote of the shareholders of the Fund. Authorized Participants may execute an irrevocable proxy granting the Distributor or an affiliate of Janus Capital Management LLC (“Janus Capital” or “Janus”) power to vote or abstain from voting such Authorized Participant’s beneficially or legally owned shares of the Fund. In such cases, the agent shall mirror vote (or abstain from voting) such shares in the same proportion as all other beneficial owners of the Fund.
The following accounting policies have been followed by the Fund and are in conformity with accounting principles generally accepted in the United States of America.
Investment Valuation
Securities held by the Fund are valued in accordance with policies and procedures established by and under the supervision of the Trustees (the “Valuation Procedures”). Equity securities, including shares of exchange-traded funds, traded on a domestic securities exchange are generally valued at the closing prices on the primary market or exchange on which they trade. If such price is lacking for the trading period immediately preceding the time of determination, such securities are valued at their current bid price. Equity securities that are traded on a foreign exchange are generally valued at the closing prices on such markets. In the event that there is no current trading volume on a particular security in such foreign exchange, the bid price from the primary exchange is generally used to value the security. Securities that are traded on the over-the-counter (“OTC”) markets are generally valued at their closing or latest bid prices as available. Foreign securities and currencies are converted to U.S. dollars using the applicable exchange rate in effect at the close of the New York Stock Exchange (“NYSE”). The Fund will determine the market value of individual securities held by it by using prices provided by one or more approved professional pricing services or, as needed, by obtaining market quotations from independent broker-dealers. Most debt securities are valued in accordance with the evaluated bid price supplied by the pricing service that is intended to reflect market value. The evaluated bid price supplied by the pricing service is an evaluation that may consider factors such as security prices, yields, maturities and ratings. Certain short-term securities maturing within 60 days or less may be evaluated and valued on an amortized cost basis provided that the amortized cost determined approximates market value. Securities for which market quotations or evaluated prices are not readily available or are deemed unreliable are valued at fair value determined in good faith under the Valuation Procedures. Circumstances in which fair value pricing may be utilized include, but are not limited to: (i) a significant event that may affect the securities of a single issuer, such as a merger, bankruptcy, or significant issuer-specific development; (ii) an event that may affect an entire market, such as a natural disaster or significant governmental action; (iii) a nonsignificant event such as a market closing early or not opening, or a security trading halt; and (iv) pricing of a nonvalued security and a restricted or nonpublic security. Special valuation considerations may apply with respect to “odd-lot” fixed-income transactions which, due to their small size, may receive evaluated prices by pricing services which reflect a large block trade and not what actually could be obtained for the odd-lot position.
| | |
| | Janus Detroit Street Trust ½ 13 |
The Long-Term Care ETF
Notes to Financial Statements
Valuation Inputs Summary
FASB ASC 820, Fair Value Measurements and Disclosures (“ASC 820”), defines fair value, establishes a framework for measuring fair value, and expands disclosure requirements regarding fair value measurements. This standard emphasizes that fair value is a market-based measurement that should be determined based on the assumptions that market participants would use in pricing an asset or liability and establishes a hierarchy that prioritizes inputs to valuation techniques used to measure fair value. These inputs are summarized into three broad levels:
Level 1 – Unadjusted quoted prices in active markets the Fund has the ability to access for identical assets or liabilities.
Level 2 – Observable inputs other than unadjusted quoted prices included in Level 1 that are observable for the asset or liability either directly or indirectly. These inputs may include quoted prices for the identical instrument on an inactive market, prices for similar instruments, interest rates, prepayment speeds, credit risk, yield curves, default rates and similar data.
Assets or liabilities categorized as Level 2 in the hierarchy generally include: debt securities fair valued in accordance with the evaluated bid or ask prices supplied by a pricing service; securities traded on OTC markets and listed securities for which no sales are reported that are fair valued at the latest bid price (or yield equivalent thereof) obtained from one or more dealers transacting in a market for such securities or by a pricing service approved by the Fund’s Trustees; and certain short-term debt securities with maturities of 60 days or less that are fair valued at amortized cost. Other securities that may be categorized as Level 2 in the hierarchy include, but are not limited to, preferred stocks, bank loans, swaps, investments in unregistered investment companies, options, and forward contracts.
Level 3 – Unobservable inputs for the asset or liability to the extent that relevant observable inputs are not available, representing the Fund’s own assumptions about the assumptions that a market participant would use in valuing the asset or liability, and that would be based on the best information available.
There have been no significant changes in valuation techniques used in valuing any such positions held by the Fund since the beginning of the fiscal year.
The inputs or methodology used for fair valuing securities are not necessarily an indication of the risk associated with investing in those securities. The summary of inputs used as of October 31, 2017 to fair value the Fund’s investments in securities and other financial instruments is included in the “Valuation Inputs Summary” in the Notes to Schedule of Investments and Other Information.
The Fund recognizes transfers between the levels as of the beginning of the fiscal year. The following describes the amounts of transfers between Level 1, Level 2 and Level 3 of the fair value hierarchy during the year/period.
Financial assets of $1,751 were transferred out of Level 2 to Level 1 to reflect the investments unadjusted quoted price as of October 31, 2017.
Investment Transactions and Investment Income
Investment transactions are accounted for as of the date purchased or sold (trade date). Dividend income is recorded on the ex-dividend date. Certain dividends from foreign securities will be recorded as soon as the Fund is informed of the dividend, if such information is obtained subsequent to the ex-dividend date. Dividends from foreign securities may be subject to withholding taxes in foreign jurisdictions. Gains and losses are determined on the identified cost basis, which is the same basis used for federal income tax purposes.
Estimates
The preparation of financial statements in conformity with accounting principles generally accepted in the United States of America requires management to make estimates and assumptions that affect the reported amount of assets and liabilities and disclosure of contingent assets and liabilities at the date of the financial statements and the reported amounts of income and expenses during the reporting period. Actual results could differ from those estimates.
Indemnifications
In the normal course of business, the Fund may enter into contracts that contain provisions for indemnification of other parties against certain potential liabilities. The Fund’s maximum exposure under these arrangements is unknown, and would involve future claims that may be made against the Fund that have not yet occurred. Currently, the risk of material loss from such claims is considered remote.
Foreign Currency Translations
The Fund does not isolate that portion of the results of operations resulting from the effect of changes in foreign exchange rates on investments from the fluctuations arising from changes in market prices of securities held at the date
The Long-Term Care ETF
Notes to Financial Statements
of the financial statements. Net unrealized appreciation or depreciation of investments and foreign currency translations arise from changes in the value of assets and liabilities, including investments in securities held at the date of the financial statements, resulting from changes in the exchange rates and changes in market prices of securities held.
Currency gains and losses are also calculated on payables and receivables that are denominated in foreign currencies. The payables and receivables are generally related to foreign security transactions and income translations.
Foreign currency-denominated assets and forward currency contracts may involve more risks than domestic transactions, including currency risk, counterparty risk, political and economic risk, regulatory risk and equity risk. Risks may arise from unanticipated movements in the value of foreign currencies relative to the U.S. dollar.
Dividends and Distributions
The Fund generally declares and distributes dividends of net investment income quarterly. Net realized capital gains (if any) are distributed annually. The Fund may treat a portion of the amount paid to redeem shares as a distribution of investment company taxable income and realized capital gains that are reflected in the NAV. This practice, commonly referred to as “equalization,” has no effect on the redeeming shareholder or a Fund’s total return, but may reduce the amounts that would otherwise be required to be paid as taxable dividends to the remaining shareholders. It is possible that the Internal Revenue Service (IRS) could challenge the Fund’s equalization methodology or calculations, and any such challenge could result in additional tax, interest, or penalties to be paid by the Fund.
The Fund may make certain investments in real estate investment trusts (“REITs”) which pay dividends to their shareholders based upon funds available from operations. It is quite common for these dividends to exceed the REITs’ taxable earnings and profits, resulting in the excess portion of such dividends being designated as a return of capital. If the Fund distributes such amounts, such distributions could constitute a return of capital to shareholders for federal income tax purposes.
Federal Income Taxes
The Fund intends to continue to qualify as a regulated investment company and distribute all of its taxable income in accordance with the requirements of Subchapter M of the Internal Revenue Code. Management has analyzed the Fund’s tax positions taken for all open federal income tax years, generally a three-year period, and has concluded that no provision for federal income tax is required in the Fund’s financial statements. The Fund is not aware of any tax positions for which it is reasonably possible that the total amounts of unrecognized tax benefits will significantly change in the next twelve months.
2. Other Investments and Strategies
Additional Investment Risk
The financial crisis in both the U.S. and global economies over the past several years has resulted, and may continue to result, in a significant decline in the value and liquidity of many securities of issuers worldwide in the equity and fixed income/credit markets. In response to the crisis, the United States and certain foreign governments, along with the U.S. Federal Reserve and certain foreign central banks, took steps to support the financial markets. The withdrawal of this support, a failure of measures put in place to respond to the crisis, or investor perception that such efforts were not sufficient could each negatively affect financial markets generally, and the value and liquidity of specific securities. In addition, policy and legislative changes in the United States and in other countries continue to impact many aspects of financial regulation. The effect of these changes on the markets, and the practical implications for market participants, including the Fund, may not be fully known for some time. As a result, it may also be unusually difficult to identify both investment risks and opportunities, which could limit or preclude the Fund’s ability to achieve its investment objective. Therefore, it is important to understand that the value of your investment may fall, sometimes sharply, and you could lose money.
The enactment of the Dodd-Frank Wall Street Reform and Consumer Protection Act (the “Dodd-Frank Act”) provided for widespread regulation of financial institutions, consumer financial products and services, broker-dealers, OTC derivatives, investment advisers, credit rating agencies, and mortgage lending, which expanded federal oversight in the financial sector, including the investment management industry. Certain provisions of the Dodd-Frank Act remain pending and will be implemented through future rulemaking. Therefore, the ultimate impact of the Dodd-Frank Act and the regulations under the Dodd-Frank Act on the Fund and the investment management industry as a whole, is not yet certain.
A number of countries in the European Union (“EU”) have experienced, and may continue to experience, severe economic and financial difficulties. In particular, many EU nations are susceptible to economic risks associated with high levels of debt, notably due to investments in sovereign debt of countries such as Greece, Italy, Spain, Portugal, and Ireland. Many
| | |
| | Janus Detroit Street Trust ½ 15 |
The Long-Term Care ETF
Notes to Financial Statements
non-governmental issuers, and even certain governments, have defaulted on, or been forced to restructure, their debts. Many other issuers have faced difficulties obtaining credit or refinancing existing obligations. Financial institutions have in many cases required government or central bank support, have needed to raise capital, and/or have been impaired in their ability to extend credit. As a result, financial markets in the EU experienced extreme volatility and declines in asset values and liquidity. Responses to these financial problems by European governments, central banks, and others, including austerity measures and reforms, may not work, may result in social unrest, and may limit future growth and economic recovery or have other unintended consequences. Further defaults or restructurings by governments and others of their debt could have additional adverse effects on economies, financial markets, and asset valuations around the world. Greece, Ireland, and Portugal have already received one or more “bailouts” from other Eurozone member states, and it is unclear how much additional funding they will require or if additional Eurozone member states will require bailouts in the future. The risk of investing in securities in the European markets may also be heightened due to the referendum in which the United Kingdom voted to exit the EU (known as “Brexit”). One or more other countries may also abandon the euro and/ or withdraw from the EU, placing its currency and banking system in jeopardy.
Certain areas of the world have historically been prone to and economically sensitive to environmental events such as, but not limited to, hurricanes, earthquakes, typhoons, flooding, tidal waves, tsunamis, erupting volcanoes, wildfires or droughts, tornadoes, mudslides, or other weather-related phenomena. Such disasters, and the resulting physical or economic damage, could have a severe and negative impact on the Fund’s investment portfolio and, in the longer term, could impair the ability of issuers in which the Fund invests to conduct their businesses as they would under normal conditions. Adverse weather conditions may also have a particularly significant negative effect on issuers in the agricultural sector and on insurance companies that insure against the impact of natural disasters.
Real Estate Investing
Within the parameters of its specific investment policies, the Fund may invest in REITs. Such companies may include those in the real estate industry or real estate-related industries. These securities may include common stocks, preferred and convertible securities of issuers in real estate-related industries. A REIT is a trust that invests in real estate related projects, such as properties, mortgage loans, and construction loans. REITs are generally categorized as equity, mortgage, or hybrid REITs. A REIT may be listed on an exchange or traded OTC.
Counterparties
Fund transactions involving a counterparty are subject to the risk that the counterparty or a third party will not fulfill its obligation to the Fund (“counterparty risk”). Counterparty risk may arise because of the counterparty’s financial condition (i.e., financial difficulties, bankruptcy, or insolvency), market activities and developments, or other reasons, whether foreseen or not. A counterparty’s inability to fulfill its obligation may result in significant financial loss to the Fund. The Fund may be unable to recover its investment from the counterparty or may obtain a limited recovery, and/or recovery may be delayed. The extent of the Fund’s exposure to counterparty risk with respect to financial assets and liabilities approximates its carrying value. See the “Offsetting Assets and Liabilities” section of this Note for further details.
The Fund may be exposed to counterparty risk through participation in various programs, including, but not limited to, lending its securities to third parties, cash sweep arrangements whereby the Fund’s cash balance is invested in one or more types of cash management vehicles, as well as investments in, but not limited to, repurchase agreements, and derivatives, including various types of swaps, futures and options. The Fund intends to enter into financial transactions with counterparties that Janus Capital believes to be creditworthy at the time of the transaction. There is always the risk that Janus Capital’s analysis of a counterparty’s creditworthiness is incorrect or may change due to market conditions. To the extent that the Fund focuses its transactions with a limited number of counterparties, it will have greater exposure to the risks associated with one or more counterparties.
Offsetting Assets and Liabilities
The Fund presents gross and net information about transactions that are either offset in the financial statements or subject to an enforceable master netting arrangement or similar agreement with a designated counterparty, regardless of whether the transactions are actually offset in the Statement of Assets and Liabilities.
Deutsche Bank AG acts as securities lending agent and a limited purpose custodian or subcustodian to receive and disburse cash balances and cash collateral, hold short-term investments, hold collateral, and perform other custodian functions in accordance with the Agency Securities Lending and Repurchase Agreement. For financial reporting purposes, the Fund does not offset financial instruments’ payables and receivables and related collateral on the Statement of Assets and Liabilities. Securities on loan will be continuously secured by collateral which may consist of cash, U.S. Government securities, domestic and foreign short-term debt instruments, letters of credit, time deposits, repurchase agreements, money market mutual funds or other money market accounts, or such other collateral as
The Long-Term Care ETF
Notes to Financial Statements
permitted by the SEC. The value of the collateral must be at least 102% of the market value of the loaned securities that are denominated in U.S. dollars and 105% of the market value of the loaned securities that are not denominated in U.S. dollars. Upon receipt of cash collateral, Janus Capital serves as investment adviser, Janus Cash Collateral Fund LLC. Loaned securities and related collateral are marked-to-market each business day based upon the market value of the loaned securities at the close of business, employing the most recent available pricing information. Collateral levels are then adjusted based on this mark-to-market evaluation.
The following table presents gross amounts of recognized assets and/or liabilities and the net amounts after deducting collateral that has been pledged by counterparties or has been pledged to counterparties (if applicable). For corresponding information grouped by type of instrument, see the Fund’s Schedule of Investments.
Offsetting of Financial Assets and Derivative Assets
| | | | | | | | | | | | | | | | | | |
| Counterparty | | | Gross Amounts of
Recognized Assets | | | Offsetting
Asset or
Liability(a) | | | Collateral
Pledged(b) | | | Net Amount | |
| | Deutsche Bank AG | | | $ | 328,282 | | | $ | — | | | $ | (328,282) | | | $ | — | |
| (a) | Represents the amount of assets or liabilities that could be offset with the same counterparty under master netting or similar agreements that management elects not to offset on the Statement of Assets and Liabilities. |
| (b) | Collateral pledged is limited to the net outstanding amount due to/from an individual counterparty. The actual collateral amounts pledged may exceed these amounts and may fluctuate in value. |
Securities Lending
Under procedures adopted by the Trustees, the Fund may seek to earn additional income by lending securities to qualified parties. Deutsche Bank AG acts as securities lending agent and a limited purpose custodian or subcustodian to receive and disburse cash balances and cash collateral, hold short-term investments, hold collateral, and perform other custodian functions. The Fund may lend portfolio securities in an amount equal to up to 1/3 of its total assets as determined at the time of the loan origination. There is the risk of delay in recovering a loaned security or the risk of loss in collateral rights if the borrower fails financially. In addition, Janus Capital makes efforts to balance the benefits and risks from granting such loans. All loans will be continuously secured by collateral which may consist of cash, U.S. Government securities, domestic and foreign short-term debt instruments, letters of credit, time deposits, repurchase agreements, money market mutual funds or other money market accounts, or such other collateral as permitted by the SEC. If the Fund is unable to recover a security on loan, the Fund may use the collateral to purchase replacement securities in the market. There is a risk that the value of the collateral could decrease below the cost of the replacement security by the time the replacement investment is made, resulting in a loss to the Fund.
Upon receipt of cash collateral, Janus Capital may invest it in affiliated or non-affiliated cash management vehicles, whether registered or unregistered entities, as permitted by the 1940 Act and rules promulgated thereunder. Janus Capital currently intends to invest the cash collateral in a cash management vehicle for which Janus Capital serves as investment adviser, Janus Cash Collateral Fund LLC. An investment in Janus Cash Collateral Fund LLC is generally subject to the same risks that shareholders experience when investing in similarly structured vehicles, such as the potential for significant fluctuations in assets as a result of the purchase and redemption activity of the securities lending program, a decline in the value of the collateral, and possible liquidity issues. Such risks may delay the return of the cash collateral and cause the Fund to violate its agreement to return the cash collateral to a borrower in a timely manner. As adviser to the Fund and Janus Cash Collateral Fund LLC, Janus Capital has an inherent conflict of interest as a result of its fiduciary duties to both the Fund and Janus Cash Collateral Fund LLC. Additionally, Janus Capital receives an investment advisory fee of 0.05% for managing Janus Cash Collateral Fund LLC, but it may not receive a fee for managing certain other affiliated cash management vehicles in which the Fund may invest, and therefore may have an incentive to allocate preferred investment opportunities to investment vehicles for which it is receiving a fee.
The value of the collateral must be at least 102% of the market value of the loaned securities that are denominated in U.S. dollars and 105% of the market value of the loaned securities that are not denominated in U.S. dollars. Loaned securities and related collateral are marked-to-market each business day based upon the market value of the loaned securities at the close of business, employing the most recent available pricing information. Collateral levels are then adjusted based on this mark-to-market evaluation.
The cash collateral invested by Janus Capital is disclosed in the Schedule of Investments (if applicable). Income earned from the investment of the cash collateral, net of rebates paid to, or fees paid by, borrowers and less the fees paid to the
| | |
| | Janus Detroit Street Trust ½ 17 |
The Long-Term Care ETF
Notes to Financial Statements
lending agent are included as “Affiliated securities lending income, net” on the Statement of Operations. As of October 31, 2017, securities lending transactions accounted for as secured borrowings with an overnight and continuous contractual maturity are $328,282 for equity securities. Gross amounts of recognized liabilities for securities lending (collateral received) as of October 31, 2017 is $336,550, resulting in the net amount due to the counterparty of $8,268.
3. Investment Advisory Agreements and Other Transactions with Affiliates
Under its unitary fee structure, the Fund pays Janus Capital a management fee in return for providing certain investment advisory, supervisory, and administrative services to the Fund, including the costs of transfer agency, custody, fund administration, legal, audit, and other services. Janus Capital’s fee structure is designed to pay substantially all of the Fund’s expenses. However, the Fund bears other expenses which are not covered under the management fee which may vary and affect the total level of expenses paid by shareholders, such as distribution fees (if any), brokerage expenses or commissions, interest, dividends, taxes, litigation expenses, acquired fund fees and expenses (if any), and extraordinary expenses. The Fund’s management fee is calculated daily and paid monthly. The Fund’s contractual management fee rate (expressed as an annual rate) is 0.50% of the Fund’s average daily net assets.
State Street Bank and Trust Company (“State Street”) provides certain fund administration services to the Fund, including services related to the Fund’s accounting, including calculating the daily NAV, audit, tax, and reporting obligations, pursuant to an agreement with Janus Capital, on behalf of the Fund. As compensation for such services, Janus Capital pays State Street a fee based on a percentage of the Fund’s assets, with a minimum flat fee, for certain services. Janus Capital serves as administrator to the Fund, providing oversight and coordination of the Fund’s service providers, recordkeeping and other administrative services. Janus Capital does not receive any additional compensation, beyond the unitary fee, for serving as administrator. State Street also serves as transfer agent for the shares of the Fund. Pursuant to agreements with Janus Capital on behalf of the Fund, State Street Global Markets, an affiliate of State Street, may execute portfolio transactions for the Fund, including but not limited to, transactions in connection with cash in lieu transactions for non-US securities.
The Trust has adopted a Distribution and Servicing Plan for shares of the Fund pursuant to Rule 12b-1 under the 1940 Act (the “Plan”). The Plan permits compensation in connection with the distribution and marketing of Fund shares and/or the provision of certain shareholder services. The Plan permits the Fund to pay ALPS Distributors, Inc. (the “Distributor”) or its designee, a fee for the sale and distribution and/or shareholder servicing of the shares at an annual rate of up to 0.25% of average daily net assets of the Fund. However, the Trustees have determined not to authorize payment under this Plan at this time. Under the terms of the Plan, the Trust is authorized to make payments to the Distributor or its designee for remittance to retirement plan service providers, broker-dealers, bank trust departments, financial advisors, and other financial intermediaries, as compensation for distribution and/or shareholder services performed by such entities for their customers who are investors in the Fund. The 12b-1 fee may only be imposed or increased when the Trustees determine that it is in the best interests of shareholders to do so. Because these fees are paid out of the Fund’s assets on an ongoing basis, to the extent that a fee is authorized, over time they will increase the cost of an investment in the Fund. The Plan fee may cost an investor more than other types of sales charges.
As of October 31, 2017, Janus Capital owned 1 share or less than 0.01% of the Fund.
4. Federal Income Tax
The tax components of capital shown in the table below represent: (1) distribution requirements the Fund must satisfy under the income tax regulations; (2) losses or deductions the Fund may be able to offset against income and gains realized in future years; and (3) unrealized appreciation or depreciation of investments for federal income tax purposes.
Other book to tax differences primarily consist of deferred compensation, derivatives, and foreign currency contract adjustments. The Fund has elected to treat gains and losses on forward foreign currency contracts as capital gains and losses, if applicable. Other foreign currency gains and losses on debt instruments are treated as ordinary income for federal income tax purposes pursuant to Section 988 of the Internal Revenue Code.
| | | | | | | | | | | | | | | | | | | | | | | | | | |
| | | | | | | | | | Loss Deferrals | | | | | | | |
Undistributed
Ordinary Income | | | Undistributed
Long-Term Gains | | | Accumulated
Capital Losses | | | Late-Year
Ordinary Loss | | | Post-October
Capital Loss | | | Other Book
to Tax Differences | | | Net Tax Appreciation/
(Depreciation) | |
| $ | — | | | $ | — | | | $ | (69,619) | | | $ | — | | | $ | — | | | $ | 125 | | | $ | (377,846) | |
The Long-Term Care ETF
Notes to Financial Statements
Accumulated capital losses noted below represent net capital loss carryovers, as of October 31, 2017, that may be available to offset future realized capital gains and thereby reduce future taxable gains distributions. The following table shows these capital loss carryovers.
| | | | | | | | | | |
Capital Loss Carryover Schedule
For the year ended October 31, 2017
No Expiration | | | Accumulated
Capital Losses | |
| Short-Term | | | Long-Term | | |
| $ | (55,842) | | | $ | (13,777) | | | $ | (69,619) | |
The aggregate cost of investments and the composition of unrealized appreciation and depreciation of investment securities for federal income tax purposes as of October 31, 2017 are noted below. The primary difference between book and tax appreciation or depreciation of investments is wash sale deferrals.
| | | | | | | | | | | | | | |
| Federal Tax Cost | | | Unrealized Appreciation | | | Unrealized (Depreciation) | | | Net Tax Appreciation/
(Depreciation) | |
| $ | 10,442,541 | | | $ | 309,713 | | | $ | (687,559) | | | $ | (377,846) | |
Income and capital gains distributions are determined in accordance with income tax regulations that may differ from accounting principles generally accepted in the United States of America. These differences are due to differing treatments for items such as net short-term gains, deferral of wash sale losses, foreign currency transactions, passive foreign investment companies, net investment losses, in-kind transactions, and capital loss carryovers.
| | | | | | | | | | | | | | |
| For the year ended October 31, 2017 | |
| Distributions | | | | |
| From Ordinary Income | | | From Long-Term Capital Gains | | | Tax Return of Capital | | | Net Investment Loss | |
| $ | 184,738 | | | $ | — | | | $ | 22,237 | | | $ | — | |
|
| For the period ended October 31, 2016 | |
| Distributions | | | | |
| From Ordinary Income | | | From Long-Term Capital Gains | | | Tax Return of Capital | | | Net Investment Loss | |
| $ | 21,391 | | | $ | — | | | $ | 4,470 | | | $ | — | |
Permanent book to tax basis differences may result in reclassifications between the components of net assets. These differences have no impact on the results of operations or net assets. The following reclassifications have been made to the Fund:
| | | | | | | | | | |
| Increase/(Decrease) to Capital | | | Increase/(Decrease) to Undistributed
Net Investment Income/Loss | | | Increase/(Decrease) to Undistributed
Net realized Gain/Loss | |
| $ | (21,877) | | | $ | 22,044 | | | $ | (167) | |
5. Capital Share Transactions
| | | | | | | | | | | | | | | | |
| | | Year ended October 31, 2017 | | | Period ended October 31, 2016(1) | |
| | | Shares | | | Amount | | | Shares | | | Amount | |
| Shares sold | | | 200,000 | | | $ | 5,252,211 | | | | 200,001 | | | $ | 4,965,674 | |
Shares repurchased | | | — | | | | — | | | | — | | | | — | |
Net Increase/(Decrease) | | | 200,000 | | | $ | 5,252,211 | | | | 200,001 | | | $ | 4,965,674 | |
| (1) | Period from June 8, 2016 (commencement of operations) through October 31, 2016. |
| | |
| | Janus Detroit Street Trust ½ 19 |
The Long-Term Care ETF
Notes to Financial Statements
6. Purchases and Sales of Investment Securities
For the year ended October 31, 2017, the aggregate cost of purchases and proceeds from sales of investment securities (excluding any short-term securities, short-term options contracts, and in-kind transactions) was as follows:
| | | | | | | | | | | | | | |
Purchases of
Securities | | | Proceeds from Sales of Securities | | | Purchases of Long-
Term U.S. Government
Obligations | | | Proceeds from Sales of
Long-Term U.S.
Government Obligations | |
| $ | 1,421,384 | | | $ | 1,383,577 | | | $ | — | | | $ | — | |
For the year ended October 31, 2017, the cost of in-kind purchases and proceeds from in-kind sales, were as follows:
| | | | | | | | | | | | | | |
Purchases of
Securities | | | Proceeds from Sales
of Securities | | | Purchases of Long-
Term U.S. Government
Obligations | | | Proceeds from Sales of
Long-Term U.S.
Government Obligations | |
| $ | 5,251,263 | | | $ | — | | | $ | — | | | $ | — | |
7. Recent Accounting Pronouncements
The Securities and Exchange Commission (“SEC”) adopted new rules as well as amendments to its rules to modernize the reporting and disclosure of information by registered investment companies. In addition, the SEC adopted amendments to Regulation S-X, which require standardized, enhanced disclosure about derivatives in investment company financial statements, as well as other amendments. The compliance date of the amendments to Regulation SX was August 1, 2017. This report incorporates the amendments to Regulation S-X.
The FASB issued Accounting Standards Update No. 2017-08, Receivables – Nonrefundable Fees and Other Costs (Subtopic 310-20), Premium Amortization on Purchased Callable Debt Securities (“ASU 2017-08”) to amend the amortization period for certain purchased callable debt securities held at a premium. The guidance requires certain premiums on callable debt securities to be amortized to the earliest call date. The amortization period for callable debt securities purchased at a discount will not be impacted. The amendments are effective for fiscal years, and interim periods within those fiscal years, beginning after December 15, 2018. Early adoption is permitted, including adoption in an interim period. Management is currently evaluating the impacts of ASU 2017-08 on the financial statements.
8. Merger Related Matters
On October 3, 2016, Janus Capital Group Inc. (“JCGI”), the direct parent of Janus Capital Management LLC, the investment adviser to the Fund (“Janus Capital”), and Henderson Group plc (“Henderson”) announced that they had entered into an Agreement and Plan of Merger (“Merger Agreement”) relating to the strategic combination of Henderson and JCGI (the “Merger”). Pursuant to the Merger Agreement, a newly formed, direct wholly-owned subsidiary of Henderson merged with and into JCGI, with JCGI as the surviving corporation and a direct wholly-owned subsidiary of Henderson.
The consummation of the Merger may have been deemed to cause an “assignment” (as defined in the Investment Company Act of 1940 Act, as amended) of the advisory agreement between the Fund and Janus Capital. As a result, the consummation of the Merger may have caused the pre-merger investment advisory agreement to terminate automatically in accordance with its terms.
On October 24, 2016, the Fund’s Board of Trustees approved, subject to shareholder approval, a new investment advisory agreement between the Fund and Janus Capital in order to permit Janus Capital to continue providing advisory services to the Fund following the closing of the Merger (“Post-Merger Advisory Agreement”). At the same meeting, the Trustees approved submitting the Post-Merger Advisory Agreement to Fund shareholders for approval.
On April 18, 2017, shareholders of the Fund approved the Post-Merger Advisory Agreement, which took effect upon the consummation of the Merger on May 30, 2017.
9. Subsequent Event
Management has evaluated whether any events or transactions occurred subsequent to October 31, 2017 and through the date of issuance of the Fund’s financial statements and determined that there were no material events or transactions that would require recognition or disclosure in the Fund’s financial statements.
The Long-Term Care ETF
Additional Information (unaudited)
Proxy Voting Policies and Voting Record
A description of the policies and procedures that the Fund uses to determine how to vote proxies relating to its portfolio securities is available without charge: (i) upon request, by calling 1-800-525-0020 (toll free); (ii) on the Fund’s website at janushenderson.com/proxyvoting; and (iii) on the SEC’s website at http://www.sec.gov.
Quarterly Portfolio Holdings
The Fund files its complete portfolio holdings (schedule of investments) with the SEC for the first and third quarters of each fiscal year on Form N-Q within 60 days of the end of such fiscal quarter. The Fund’s Form N-Q: (i) is available on the SEC’s website at http://www.sec.gov; (ii) may be reviewed and copied at the SEC’s Public Reference Room in Washington, D.C. (information on the Public Reference Room may be obtained by calling 1-800-SEC-0330); and (iii) is available without charge, upon request, by calling Janus Henderson at 1-800-525-0020 (toll free).
Designation Requirements (Unaudited)
For federal income tax purposes, the Fund designated the following for the year ended October 31, 2017
| | | | |
| Return of Capital Distributions | | $ | 22,237 | |
| Dividends Received Deduction Percentage | | | 2% | |
| Qualified Dividend Income Percentage | | | 26% | |
Licensing Agreements
Solactive AG (“Solactive”) is the Index Provider for the Underlying Index. Janus Capital has entered into a license agreement with Solactive to use the Underlying Index.
Neither Solactive nor any of its affiliates make any representation or warranty, express or implied, to the owners of a Fund or any member of the public regarding the advisability of investing in securities generally or in a Fund particularly or the ability of the Underlying Index to track general market performance. The Underlying Index is determined, composed, and calculated by Solactive without regard to Janus Capital or the Fund. Solactive has no obligation to take the needs of Janus Capital or the owners of the Fund into consideration in determining, composing, or calculating the Underlying Index. Solactive is not responsible for and has not participated in the determination of the timing of, prices at, or quantities of the Fund to be issued or in the determination or calculation of the equation by which the Fund is to be converted into cash.
ALTHOUGH SOLACTIVE SHALL OBTAIN INFORMATION FOR INCLUSION IN OR FOR USE IN THE CALCULATION OF THE UNDERLYING INDEX FROM SOURCES WHICH IT CONSIDERS RELIABLE, IT DOES NOT GUARANTEE THE QUALITY, ACCURACY AND/OR THE COMPLETENESS OF THE UNDERLYING INDEX OR ANY DATA INCLUDED THEREIN AND SHALL HAVE NO LIABILITY FOR ERRORS OR OMISSIONS OF ANY KIND RELATED TO THE UNDERLYING INDEX OR DATA. SOLACTIVE MAKES NO WARRANTY, EXPRESS OR IMPLIED, AS TO RESULTS TO BE OBTAINED BY JANUS CAPITAL, OWNERS OF THE FUND, OR ANY OTHER PERSON OR ENTITY FROM THE USE OF THE UNDERLYING INDEX OR ANY DATA INCLUDED THEREIN IN CONNECTION WITH THE RIGHTS LICENSED TO JANUS CAPITAL FOR ANY OTHER USE. SOLACTIVE MAKES NO EXPRESS OR IMPLIED WARRANTIES, AND HEREBY EXPRESSLY DISCLAIMS ALL WARRANTIES OF MERCHANTABILITY OR FITNESS FOR A PARTICULAR PURPOSE OR USE WITH RESPECT TO THE UNDERLYING INDEX OR ANY DATA INCLUDED THEREIN. WITHOUT LIMITING ANY OF THE FOREGOING, IN NO EVENT SHALL IT HAVE ANY LIABILITY FOR ANY SPECIAL, PUNITIVE, INDIRECT, OR CONSEQUENTIAL DAMAGES (INCLUDING LOST PROFITS), EVEN IF NOTIFIED OF THE POSSIBILITY OF SUCH DAMAGES.
Janus Capital does not guarantee the accuracy and/or the completeness of the Underlying Index or any data included therein, and Janus Capital shall have no liability for any errors, omissions or interruptions therein. Janus Capital makes no warranty, express or implied, as to results to be obtained by the Fund, owners of the shares of the Fund or any other person or entity from the use of the Underlying Index or any data included therein. Janus Capital makes no express or implied warranties, and expressly disclaims all warranties of merchantability or fitness for a particular purpose or use with respect to the Underlying Index or any data included therein. Without limiting any of the foregoing, in no event shall Janus Capital have any liability for any special, punitive, direct, indirect or consequential damages (including lost profits) arising out of matters relating to the use of the Underlying Index even if notified of the possibility of such damages.
| | |
| | Janus Detroit Street Trust ½ 21 |
The Long-Term Care ETF
Board Considerations Regarding Approval of Investment Advisory Agreements (unaudited)
APPROVAL OF ADVISORY AGREEMENT DURING THE PERIOD FOR THE ORGANICS ETF, THE LONG-TERM CARE ETF, THE OBESITY ETF, AND THE HEALTH AND FITNESS ETF
The Trustees of the Trust, the majority of are Independent Trustees, met on April 18, 2016 to consider the proposed investment management agreement (the “Investment Management Agreement”) for The Organics ETF, The Long-Term Care ETF, The Obesity ETF, and The Health and Fitness ETF (each a “New Thematic Fund” and collectively, the “New Thematic Funds”). In the course of their consideration of the Investment Management Agreement, the Trustees met in executive session and were advised by their independent counsel. In this regard, the Board, including the Independent Trustees, evaluated the terms of the Investment Management Agreement and reviewed the duties and responsibilities of the Trustees in evaluating and approving such agreements. In considering approval of the Investment Management Agreement, the Board, including the Independent Trustees, reviewed the Board Materials and other information from counsel and from the Adviser, including: (i) a copy of the form of Investment Management Agreement with respect to the Adviser’s management of the assets of each New Thematic Fund; (ii) information describing the nature, quality and extent of the services that the Adviser will provide to the New Thematic Fund, and the fees the Adviser will charge to the New Thematic Funds; (iii) information concerning the Adviser’s financial condition, business, operations, portfolio management teams and compliance programs; (iv) information describing each New Thematic Fund’s anticipated advisory fee and operating expenses; (v) a copy of the Adviser’s current Form ADV; and (vi) a memorandum from counsel on the responsibilities of trustees in considering investment advisory arrangements under the 1940 Act. The Board also considered presentations made by, and discussions held with, representatives of the Adviser. The Board also received information comparing the advisory fees and expenses of the New Thematic Funds to those from fund complexes that were defined as competitors.
During its review of this information, the Board focused on and analyzed the factors that the Board deemed relevant, including: the nature, extent and quality of the services to be provided to each New Fund by the Adviser; the Adviser’s personnel and operations; each New Thematic Fund’s proposed expense level; the anticipated profitability to the Adviser under the Investment Management Agreement at certain asset levels; any “fall-out” benefits to the Adviser and its affiliates (i.e., any ancillary benefits anticipated to be realized by the Adviser and its affiliates from the Adviser’s relationship with the Trust); the effect of asset growth on each New Thematic Fund’s expenses; and possible conflicts of interest.
The Trustees also considered benefits that accrue to the Adviser and its affiliates from their relationships with the New Thematic Funds. The Trustees also concluded that, other than the services provided by the Adviser and its affiliates pursuant to the agreements and the fees to be paid by the New Thematic Funds therefor, the New Thematic Funds and the Adviser may potentially benefit from their relationship with each other in other ways. The Trustees concluded that the success of the New Thematic Funds could attract other business to the Adviser or other Janus funds, and that the success of the Adviser could enhance the Adviser’s ability to serve the New Thematic Funds.
The Board, including the Independent Trustees, considered the following in respect of each New Thematic Fund:
The nature, extent and quality of services to be provided by the Adviser; personnel and operations of the Adviser.
The Board reviewed the services that the Adviser would provide to each New Thematic Fund. In connection with the investment advisory services to be provided by the Adviser, the Board noted the responsibilities that the Adviser would have as the Funds’ investment adviser, including: the overall supervisory responsibility for the general management and investment of each New Fund’s securities portfolio; providing oversight of the investment performance and processes and compliance with the New Thematic Fund’s investment objectives, policies and limitations; the implementation of the investment management program of each New Thematic Fund; the management of the day-to-day investment and reinvestment of the assets of each New Thematic Fund; determining daily baskets of deposit securities and cash components; executing portfolio security trades for purchases and redemptions of New Thematic Fund shares conducted on a cash-in-lieu basis; the responsibility for daily monitoring of tracking error and quarterly reporting to the Board; the review of brokerage matters; the oversight of general portfolio compliance with relevant law; and the implementation of Board directives as they relate to the New Thematic Funds.
The Board reviewed the Adviser’s experience, resources and strengths in managing other pooled investment vehicles, including the Adviser’s personnel. Based on its consideration and review of the foregoing information, the Board determined that each New Thematic Fund was likely to benefit from the nature, quality and extent of these services, as well as the Adviser’s ability to render such services based on their experience, personnel, operations and resources.
The Long-Term Care ETF
Board Considerations Regarding Approval of Investment Advisory Agreements (unaudited)
Comparison of services to be rendered and fees to be paid to those under other investment advisory contracts, and the cost of the services to be provided and profits to be realized by the Adviser from the relationship with the New Thematic Funds; “fall-out” benefits.
The Board then compared both the services to be rendered and the proposed fees to be paid under other contracts of the Adviser, and under contracts of other investment advisers with respect to similar ETFs. In particular, the Board compared each New Thematic Fund’s proposed advisory fee and projected expense ratio to other investment companies considered to be in that New Thematic Fund’s peer group. The Board also received and considered information about the fee rates charged to other accounts and clients that are managed by the Adviser, including information about the differences in services provided to the non-registered investment company clients, noting that the New Thematic Funds had no other comparable equivalents at the Adviser. The Board also discussed the anticipated costs and projected profitability of the Adviser in connection with its serving as investment adviser to each New Thematic Fund, including operational costs. In addition, the Board discussed the entrepreneurial risk undertaken by the Adviser in creating the Trust. After comparing each New Thematic Fund’s proposed fees with those of other funds in each New Thematic Fund’s peer group, and in light of the nature, extent and quality of services proposed to be provided by the Adviser and the costs expected to be incurred by the Adviser in rendering those services, the Board concluded that the level of fees proposed to be paid to the Adviser with respect to the New Thematic Funds were fair and reasonable.
The Board also considered that the Adviser may experience reputational “fall-out” benefits based on the success of the New Thematic Funds, but that such benefits are not easily quantifiable.
The extent to which economies of scale would be realized as the New Thematic Funds grow and whether fee levels would reflect such economies of scale.
The Board next discussed potential economies of scale. Since the New Thematic Funds had not commenced operations, the eventual aggregate amount of assets was uncertain, and the Adviser was not able to provide the Board with specific information concerning the extent to which economies of scale could be realized as each New Thematic Fund grows, and whether fee levels would reflect such economies of scale, if any. The Board recognized the uncertainty in launching a new investment product and estimating future asset levels.
Investment performance of the New Thematic Funds and the Adviser.
Because each New Thematic Fund had not commenced operations and has an investment objective to track an index, the Board did not consider the investment performance of the New Thematic Fund or the Adviser.
Conclusion.
No single factor was determinative to the decision of the Board. Based on the foregoing and such other matters as were deemed relevant, the Board concluded that the proposed advisory fee rate and projected total expense ratio are reasonable in relation to the services to be provided by the Adviser to each New Thematic Fund, as well as the costs to be incurred and benefits to be gained by the Adviser in providing such services. The Board also found the proposed advisory fees to be reasonable in comparison to the fees charged by advisers to other comparable funds of similar actual or anticipated size. As a result, the Board concluded that the initial approval of the Investment Management Agreement was in the best interests of each New Thematic Fund.
After full consideration of the above factors, as well as other factors, the Trustees, with the Independent Trustees voting separately, determined to approve the Investment Management Agreement for each New Thematic Fund.
APPROVAL OF ADVISORY AGREEMENT DURING THE PERIOD WITH THE ADVISER POST-MERGER
On October 3, 2016, Janus Capital Group Inc. (“JCGI”), the direct parent of Janus Capital Management LLC, the investment adviser to the Funds (the “Adviser”), and Henderson Group plc (“Henderson”) announced that they had entered into an Agreement and Plan of Merger (“Merger Agreement”) relating to the business combination of Henderson and JCGI (the “Merger”). Pursuant to the Merger Agreement, a newly formed, direct wholly-owned subsidiary of Henderson will merge with and into JCGI, with JCGI as the surviving corporation and a direct wholly-owned subsidiary of Henderson. The Merger is expected to close in the second quarter of 2017, subject to requisite shareholder and regulatory approvals. The consummation of the Merger may be deemed to be an “assignment” (as defined in the Investment Company Act of 1940, as amended) of the advisory agreement between the Fund and Janus Capital. As a result, the consummation of the Merger will cause such advisory agreement to terminate automatically in accordance with its terms.
| | |
| | Janus Detroit Street Trust ½ 23 |
The Long-Term Care ETF
Board Considerations Regarding Approval of Investment Advisory Agreements (unaudited)
The Trustees of the Trust, the majority of whom are Independent Trustees met on October 24, 2016, and at various times in advance of that date, which meeting was called for the purpose of considering the proposed investment management agreement (the “New Investment Management Agreement”) between the Adviser as a subsidiary of Henderson following the consummation of the Merger and the following series of the Trust: Janus Small Cap Growth Alpha ETF, Janus Small/Mid Cap Growth Alpha ETF, The Organics ETF, The Long-Term Care ETF, The Obesity ETF, The Health and Fitness ETF, Janus Velocity Tail Risk Hedged Large Cap ETF and Janus Velocity Volatility Hedged Large Cap ETF (each a “Fund” and collectively, the “Funds”). The Independent Trustees met with representatives of the Adviser to discuss the anticipated effects of the Merger. During these meetings, the Adviser indicated its belief that the Merger would not adversely affect the continued operation of the Funds or the capabilities of the investment advisory personnel who currently manage the Funds to continue to provide these and other services to the Funds at the current levels. The Adviser also indicated that it believed that the Merger could provide certain benefits to the Funds but that there could be no assurance as to any particular benefits that might result.
In the course of their consideration of the New Investment Management Agreement, the Trustees met in executive session and were advised by their independent counsel. In this regard, the Board, including the Independent Trustees, evaluated the terms of the New Investment Management Agreement and reviewed the duties and responsibilities of the Trustees in evaluating and approving such agreements. In considering approval of the Investment Management Agreement, the Board, including the Independent Trustees, reviewed the board materials (the “Materials”) and other information provided in advance of the meeting from counsel, the Adviser, as well as from Henderson, including: (i) a copy of the form of New Investment Management Agreement, with respect to the Adviser’s management of the assets of each Fund; (ii) information describing the nature, quality and extent of the services that will be provided to each Fund, and the fees that will be charged to the Funds; (iii) information concerning the Adviser’s and Henderson’s financial condition, business, operations, portfolio management teams and compliance programs; (iv) information describing each Fund’s anticipated advisory fee and operating expenses; (v) information concerning the anticipated structure of the post-Merger entity (“Janus Henderson”); and (v) a memorandum from counsel on the responsibilities of trustees in considering investment advisory arrangements under the 1940 Act. The Board also considered presentations made by, and discussions held with, representatives of the Adviser. The Board also noted the information previously provided to the Board during 2016 related to the initial approvals of each Fund.
During its review of this information, the Board focused on and analyzed the factors that the Board deemed relevant, including, among other matters:
| 1) | That the material terms regarding advisory services pursuant to the New Investment Management Agreement are substantially identical to the terms of the current investment management agreement with the Adviser; |
| 2) | That there is not expected to be any diminution in the nature, extent and quality of the services provided to the Funds and their shareholders by Janus Henderson, including compliance services; |
| 3) | The commitment of the Adviser to retain key personnel currently employed by the Adviser who provide services to the Funds; |
| 4) | That the manner in which each Fund’s assets are managed would not change as a result of the Merger, and that the same portfolio managers managing each Fund’s assets are expected to continue to do so after the Merger; |
| 5) | The terms and conditions of the New Investment Management Agreement, including the current advisory fee rates and operational expenses, are the same as the current fee rates under the current investment management agreement; |
| 6) | That each Fund’s expense ratios are not expected to increase as a result of the Merger or approval of the New Investment Management Agreement; |
| 7) | That the fees and expense ratios of the Funds relative to comparable investment companies continued to be reasonable given the quality of services provided; |
| 8) | The history, reputation, qualification and background of Henderson, as well as its financial condition; |
| 9) | The reputation, financial strength, corporate structure and capital resources of Henderson and its investment advisory subsidiaries and the anticipated financial strength of Janus Henderson; |
| 10) | The long-term business goals of the Adviser and Henderson with respect to the Funds; |
The Long-Term Care ETF
Board Considerations Regarding Approval of Investment Advisory Agreements (unaudited)
| 11) | That, pursuant to the terms of the Merger, Henderson has acknowledged the Advisor’s reliance upon the benefits and protections provided by Section 15(f) and has agreed not to take, and to cause its affiliates not to take, any action that would have the effect, directly or indirectly, of causing the requirements of any of the provisions of Section 15(f) not to be met in respect of the Merger; |
| 12) | That shareholders would not bear any costs in connection with the Merger, that the Adviser will bear the costs, fees and expenses incurred by the Funds in connection with the Proxy Statement, including all expenses in connection with the solicitation of proxies, the fees and expenses of attorneys relating to the Merger and Proxy Statement, and other fees and expenses incurred by the Funds, if any, in connection with the Merger; |
| 13) | The Adviser’s commitment to provide resources to the Funds and the potential for increased distribution capabilities as a result of the Merger, which have the potential to result in long-term economies of scale; and |
| 14) | That the Adviser and Henderson would derive benefits from the Merger and that, as a result, they have a different financial interest in the matters that were being considered than do Fund shareholders. |
In connection with their consideration of the New Investment Advisory Agreement on October 24 2016, the Board noted that, in February 2016, April 2016 and October 2016, the Board had initially approved the respective Funds’ current investment advisory agreements. The Trustees considered that, in connection with the foregoing approvals, the Board had determined that the Adviser had the capabilities, resources and personnel necessary to provide the services to each Fund required under the current investment advisory agreement, and the advisory fee rates paid by each Fund, taking into account the unitary fees charged to the Funds, represented reasonable compensation to the Adviser in light of the services provided. The Trustees noted that the Board also considered the cost to the Adviser of providing those services, potential economies of scale as each Fund’s assets grow, the fees and expenses paid by other comparable funds, and such other matters as the Board had considered relevant in the exercise of their reasonable business judgment.
To inform their consideration of the New Agreement, the Independent Trustees received and considered responses by the Adviser and Henderson to inquiries requesting information regarding: Henderson’s structure, operations, financial resources and key personnel; the material aspects of the Merger, the proposed operations of Janus Henderson and its compliance program, code of ethics, trading policies and key management and investment personnel, including each Fund’s portfolio managers; and anticipated changes to the management or operations of the Board and the Funds, including, if applicable, any changes to the Funds’ service providers, advisory fees and expense structure.
In considering the information and materials described above, the Independent Trustees received assistance from, and met separately with, independent legal counsel and were provided with a written description of their statutory responsibilities and the legal standards that are applicable to approvals of advisory agreements. The Board did not identify any particular information that was most relevant to its consideration to approve the New Investment Management Agreement for each Fund and each Trustee may have afforded different weight to the various factors. Legal counsel to the Independent Trustees provided the Board with a memorandum regarding its responsibilities pertaining to the approval of the New Agreement. In determining whether to approve the New Investment Management Agreement, the Board considered the best interests of each Fund separately.
In voting to approve the New Investment Management Agreement, the Board considered the overall fairness of the New Investment Management Agreement and factors it deemed relevant with respect to each Fund, including, but not limited to: (i) the nature, extent and quality of the services to be provided by Janus Henderson, (ii) that the investment personnel who currently manage the Funds would continue to manage the Funds as employees of Janus Henderson, (iii) that the fees and expenses of the Funds after the Transaction are expected to remain the same, (iv) the projected profitability of the Funds to Janus Henderson and its affiliates; (v) whether the projected economies of scale would be realized as the Funds grow and whether any breakpoints are appropriate at certain asset levels and (vi) other benefits that may accrue Janus Henderson from its relationship with the Funds. The Board also considered that the Transaction might not be consummated if the New Investment Management Agreement was not approved by the Board and the shareholders of each Fund.
Although not meant to be all-inclusive, set forth below is a description of the information and certain factors that were considered by the Board, including the Independent Trustees in deciding to approve the New Investment Management Agreement in respect of each Fund:
The nature, extent and quality of services to be provided by Janus Henderson; personnel and operations of Janus Henderson.
| | |
| | Janus Detroit Street Trust ½ 25 |
The Long-Term Care ETF
Board Considerations Regarding Approval of Investment Advisory Agreements (unaudited)
In considering the nature, extent and quality of the services to be provided by Janus Henderson under the New Investment Management Agreement, the Board considered that the terms of the New Investment Management Agreement are substantially similar to the terms of the current investment management agreement. The Board considered that the level of service and manner in which each Fund’s assets are managed were expected to remain the same.
The Board considered that, for a period of time after closing, the Adviser expects that the operations of Janus Henderson, as they relate to the Funds, would be the same as those of the Adviser. The Board considered that the Adviser’s key personnel who provide services to the Funds are expected to provide those same services after the Merger. The Board also noted that the Merger is not expected to result in any change in the structure or operations of the Funds and that the Adviser does not currently anticipate any immediate changes to the Funds’ key service providers.
In evaluating Janus Henderson, the Board considered the history, background, reputation and qualification of the Adviser and Henderson, as well as their personnel and Henderson’s financial condition. The Board considered that Henderson is a global asset management firm that was established in 1934, and that it has a long history of asset management around the world. The Board also considered Henderson’s capabilities, experience, corporate structure and capital resources, as well as the Adviser’s long-term business goals with respect to the Janus Henderson Merger and the Funds.
Based on its consideration and review of the foregoing information, the Board determined that each Fund was likely to benefit from the nature, quality and extent of these services, as well as the Janus Henderson’s ability to render such services based on their experience, personnel, operations and resources.
Cost of the services to be provided and profits to be realized by Janus Henderson from the relationship with the Funds; “fall-out” benefits.
The Board noted that the unitary fee currently in place for each Fund will remain in place and unchanged under the New Investment Management Agreement.
The Board also discussed the anticipated costs and projected profitability of Janus Henderson in connection with its serving as investment adviser to each Fund, including operational costs. In addition, the Board discussed that the Funds’ expenses were not expected to increase materially as a result of the Merger. The Board also noted that Henderson does not currently provide any investment management services to other exchange traded funds. In light of the nature, extent and quality of services proposed to be provided by Janus Henderson and the costs expected to be incurred by Janus Henderson in rendering those services, the Board concluded that the level of fees proposed to be paid to Janus Henderson with respect to the Funds were fair and reasonable.
The extent to which economies of scale would be realized as the Funds grow and whether fee levels would reflect such economies of scale.
The Board next discussed potential economies of scale. The Board discussed the promised continued commitment to expand the distribution of Fund shares, and the potential for increased distribution capabilities as a result of the Merger, which have the potential to result in long-term economies of scale.
The Board also noted that since the Trust is newly formed, the eventual aggregate amount of assets was uncertain, and therefore specific information concerning the extent to which economies of scale would be realized as each Fund grows and whether fee levels would reflect such economies of scale, if any, was difficult to determine. The Board recognized the uncertainty in launching new investment products and estimating future asset levels.
Other Benefits to Janus Henderson.
The Board considered other potential benefits that may accrue to Janus Henderson as a result of its relationship with the Funds, which include reputational benefits that may enhance Janus Henderson’s ability to gain business opportunities from other clients.
Conclusion.
No single factor was determinative to the decision of the Board. Based on, but not limited to, the foregoing, and such other matters as were deemed relevant, the Board concluded that the New Investment Management Agreement was fair and reasonable in light of the services to be performed, fees, expenses and such other matters as the Board considered relevant in the exercise of its business judgment.
After full consideration of the above factors, as well as other factors, the Trustees, with the Independent Trustees voting separately, determined to approve the New Investment Management Agreement with respect to the Funds.
The Long-Term Care ETF
Shareholder Meeting (unaudited)
A Special Meeting of Shareholders of the Fund was held on March 17, 2017 and adjourned and reconvened on April 6, 2017 and April 18, 2017. At the meetings, the following matter was voted on and approved by the Shareholders. Each whole or fractional vote reported represents one whole or fractional dollar of net asset value held on the record date for the meetings. The results of the Special Meeting of Shareholders are noted below.
Proposal 1
To approve a new investment advisory agreement.
| | | | | | | | | | |
| | | | Number of Votes ($) |
| Record Date Votes ($) | | | Affirmative | | Against/Withhold | | Abstain | | Broker Non-Votes |
| | 4,726,000.000 | | | 2,402,887.440 | | 34,570.690 | | 339,279.540 | | 0.000 |
| | |
| | Janus Detroit Street Trust ½ 27 |
The Long-Term Care ETF
Trustees and Officers (unaudited)
The Fund’s Statement of Additional Information includes additional information about the Trustees and officers and is available, without charge, by calling 1-877-335-2687.
The following are the Trustees and officers of the Trust, together with a brief description of their principal occupations during the last five years (principal occupations for certain Trustees may include periods over five years).
Each Trustee has served in that capacity since he or she was originally elected or appointed. The Trustees do not serve a specified term of office. Each Trustee will hold office until the termination of the Trust or his or her earlier death, resignation, retirement, incapacity, or removal. Under the Fund’s Governance Procedures and Guidelines, the policy is for Trustees to retire no later than the end of the calendar year in which the Trustee turns 75. The Trustees review the Fund’s Governance Procedures and Guidelines from time to time and may make changes they deem appropriate. The Fund’s Nominating and Governance Committee will consider nominees for the position of Trustee recommended by shareholders. Shareholders may submit the name of a candidate for consideration by the Committee by submitting their recommendations to the Trust’s Secretary. Each Trustee is currently a Trustee of one other registered investment company advised by Janus Capital: Clayton Street Trust. Collectively, these two registered investment companies consist of 12 series or funds.
The Trust’s officers are elected annually by the Trustees for a one-year term. Certain officers also serve as officers of Clayton Street Trust. Certain officers of the Fund may also be officers and/or directors of Janus Capital. Fund officers receive no compensation from the Fund, except for the Fund’s Chief Compliance Officer, as authorized by the Trustees.
| | | | | | | | | | | | | | | | | | |
| TRUSTEES | | | | | | | | | | | | | | |
| Name, Address, and Age | | Positions Held
with the Trust | | | Length of
Time Served | | | Principal Occupations
During the Past Five Years | | Number of
Portfolios/Funds
in Fund Complex
Overseen by
Trustee | | | Other Directorships
Held by Trustee
During the Past Five Years | |
Independent Trustees | | | | | | | | | | | | | | | | | | |
Clifford J. Weber 151 Detroit Street Denver, CO 80206 DOB: 1963 | |
| Chairman
Trustee |
| |
| 2/16-Present
2/16-Present |
| | Owner, Financial Products Consulting Group LLC (consulting services to financial institutions) (since 2015). Formerly, Executive Vice President of Global Index and Exchange- Traded Products, NYSE Market, Inc., a subsidiary of Intercontinental Exchange (ETF/ETP listing exchange) (2013-2015) and Executive Vice President and Head of Strategy and Product Development, NYSE Liffe U.S., a division of NYSE Euronext (U.S. futures exchange) (2008-2013). | | | 12 | | |
| Independent Trustee,
Clough Funds Trust
(investment company)
(since 2015);
Chairman, Clough
Funds Trust
(investment company)
(since 2017);
Independent Trustee,
Clough Dividend and
Income Fund (closed-
end fund) (since
2017); Independent
Trustee, Clough
Global Opportunities
Fund (closed-end
fund) (since 2017);
Independent Trustee,
Clough Global Equity
Fund (closed-end
fund) (since 2017);
Independent Trustee,
Elevation ETF Trust
(since 2016);
Chairman, Elevation
ETF Trust (since
2017). |
|
The Long-Term Care ETF
Trustees and Officers (unaudited)
| | | | | | | | | | | | | | | | | | |
| TRUSTEES | | | | | | | | | | | | | | |
| Name, Address, and Age | | Positions Held
with the Trust | | | Length of
Time Served | | | Principal Occupations
During the Past Five Years | | Number of
Portfolios/Funds
in Fund Complex
Overseen by
Trustee | | | Other Directorships
Held by Trustee
During the Past Five Years | |
Maureen T. Upton 151 Detroit Street Denver, CO 80206 DOB: 1965 | | | Trustee | | | | 2/16-Present | | | Principal, Maureen Upton Ltd. (consulting services to developers of major infrastructure projects and investors) (since 2017). Formerly, Principal Consultant, SRK Consulting (U.S.), Inc. (consulting services to global mining, energy and water resource industries) (2015-2017) and Founder and Principal, Resource Initiatives LLC (sustainability consulting firm) (2006-2015). | | | 12 | | |
| Director, Denver
Metro Leadership
Foundation (non-
profit organization)
(2012-2014). |
|
| | | | | |
Jeffrey B. Weeden 151 Detroit Street Denver, CO 80206 DOB: 1956 | | | Trustee | | | | 2/16-Present | | | Senior Advisor, BayBoston Capital LP (investment fund in banks and bank holdings companies) (since 2015). Management Advisor, BoxCast, Inc. (technology start-up company) (2014-2017). Formerly Senior Executive Vice President and Chief Financial Officer, KeyCorp (financial services) (2002-2013). | | | 12 | | |
| Director, State Farm
Bank
(banking)
(since 2014). |
|
Interested Trustee | | | | | | | | | | | | | | | | | | |
Michael Drew Elder** 151 Detroit Street Denver, CO 80206 DOB: 1970 | | | Trustee | | | | 8/15-Present | | | Executive Vice President and Head of U.S. Intermediary Distribution, Janus Capital (since 2014) and President, Janus Distributors LLC (broker- dealer) (since 2014). Formerly, Senior Vice President, Janus Capital (2007-2014). | | | 12 | | |
| Director, Perkins
Investment
Management LLC
(since 2014). |
|
| ** | Michael Drew Elder is an Interested Trustee because of his employment with Janus Capital. |
| | |
| | Janus Detroit Street Trust ½ 29 |
The Long-Term Care ETF
Trustees and Officers (unaudited)
| | | | | | |
| OFFICERS | | | | | | |
| Name, Address, and Age | | Positions Held with the Trust | | Term of Office* and
Length of Time Served | | Principal Occupations
During the Past Five Years |
Bruce L. Koepfgen 151 Detroit Street Denver, CO 80206 DOB: 1952 | | President and Chief Executive Officer | | 2/16-Present | | Head of North America for Janus Henderson Investors and Janus Capital Management (since 2017); Executive Vice President and Director of Janus International Holding LLC (since 2011); Executive Vice President of Janus Distributors LLC (since 2011); Vice President and Director of INTECH Investment Management LLC (since 2011); Executive Vice President and Director of Perkins Investment Management LLC (since 2011); and Executive Vice President and Director of Janus Management Holdings Corporation (since 2011). Formerly, President of Janus Capital Group Inc. and Janus Capital Management LLC (2013-2017); Executive Vice President of Janus Services LLC (2011-2015), Janus Capital Group Inc. and Janus Capital Management LLC (2011-2013); and Chief Financial Officer of Janus Capital Group Inc., Janus Capital Management LLC, Janus Distributors LLC, Janus Management Holdings Corporation, and Janus Services LLC (2011-2013). |
Susan K. Wold 151 Detroit Street Denver, CO 80206 DOB: 1960 | | Vice President, Chief Compliance Officer, and Anti-Money Laundering Officer | | 10/17-Present; Vice President, Provisional Chief Compliance Officer, and Anti-Money Laundering Officer (9/17–10/17) | | Senior Vice President and Head of Compliance, North America for Janus Henderson (since September 2017); Formerly, Vice President, Head of Global Corporate Compliance, and Chief Compliance Officer for Janus Capital Management (May 2017-September 2017); Vice President, Compliance at Janus Capital Group and Janus Capital Management (2005-2017). |
Jesper Nergaard 151 Detroit Street Denver, CO 80206 DOB: 1962 | | Vice President, Chief Financial Officer, Treasurer, and Principal Accounting Officer | | 2/16-Present | | Vice President of Janus Capital and Janus Services LLC. |
Kathryn L. Santoro 151 Detroit Street Denver, CO 80206 DOB: 1973 | | Vice President, Secretary and Chief Legal Counsel | | 1/17-Present | | Vice President of Janus Capital and Janus Services LLC (since 2016). Formerly, Vice President and Associate Counsel of Curian Capital, LLC and Curian Clearing LLC (2013-2016); and General Counsel and Secretary (2011-2012) and Vice President (2009-2012) of Old Mutual Capital, Inc. |
| * | Officers are elected at least annually by the Trustees for a one-year term and may also be elected from time to time by the Trustees for an interim period. |
The Long-Term Care ETF
Notes
| | |
| | Janus Detroit Street Trust ½ 31 |
The Long-Term Care ETF
Notes
The Long-Term Care ETF
Notes
| | |
| | Janus Detroit Street Trust ½ 33 |
Knowledge. Shared
At Janus Henderson, we believe in the sharing of expert insight for better investment and business decisions. We call this ethos Knowledge. Shared.
Learn more by visiting janushenderson.com.
This report is submitted for the general information of shareholders of the Fund. It is not an offer or solicitation for the Fund and is not authorized for distribution to prospective investors unless preceded or accompanied by an effective prospectus.
Janus Henderson is a trademark of Janus Henderson Investors. © Janus Henderson Investors. The name Janus Henderson Investors includes HGI Group Limited, Henderson Global Investors (Brand Management) Sarl and Janus International Holding LLC.
Janus Capital Management LLC is the investment adviser and ALPS Distributors, Inc. is the distributor. ALPS is not affiliated with Janus Henderson or any of its subsidiaries.
ANNUAL REPORT
October 31, 2017
The Obesity ETF
Janus Detroit Street Trust

Table of Contents
The Obesity ETF (unaudited)
INVESTMENT OBJECTIVE
The Obesity ETF seeks investment results that correspond generally to the performance, before fees and expenses, of an index which is designed to track the performance of companies globally that are positioned to profit from servicing the obese, including biotechnology, pharmaceutical, health care and medical device companies whose business is focused on obesity and obesity related disease including diabetes, high blood pressure, cholesterol, heart disease, stroke, and sleep apnea, and companies focused on weight loss programs, weight loss supplements, or plus sized apparel.
PERFORMANCE OVERVIEW
| • | | Stocks rallied after the November U.S. presidential election on the expectation the new administration would champion pro-growth initiatives that would benefit the U.S. economy. Signs of synchronized economic growth in major world economies and corporate earnings strength were also supportive of stocks. During the period, the market experienced some volatility as investors questioned whether Congress would be able to successfully implement the administration’s proposed policies. However, stocks delivered strong returns during the 12-month period. The underlying index outperformed the broader market, with the consumer goods sector delivering the strongest returns. |
| • | | During the period, The Obesity ETF (SLIM) returned 27.99% (based on NAV); its primary benchmark, the Solactive Obesity Index, returned 28.51%, and its secondary benchmark, the MSCI All Country World Index, returned 23.20%. |
| • | | SLIM seeks investment results that correspond generally, before fees and expenses, to the performance of its primary benchmark. It seeks exposure to companies globally that could benefit as they fight the global obesity epidemic. Such companies could include biotechnology, pharmaceutical, health care and medical device companies focused on obesity and obesity-related disease such as diabetes, high blood pressure, cholesterol, heart disease, stroke and sleep apnea. The ETF also includes companies focused on weight-loss programs, supplements and plus-sized apparel. |
| | |
| | Janus Detroit Street Trust ½ 1 |
The Obesity ETF (unaudited)
Fund At A Glance
October 31, 2017
| | | | |
| 5 Largest Equity Holdings – (% of Net Assets) | | | |
Novo Nordisk A/S | | | | |
Pharmaceuticals | | | 20.3% | |
Fresenius Medical Care AG & Co. KGaA | | | | |
Health Care Providers & Services | | | 19.7% | |
Insulet Corp. | | | | |
Health Care Equipment & Supplies | | | 5.4% | |
Fisher & Paykel Healthcare Corp., Ltd. | | | | |
Health Care Equipment & Supplies | | | 5.0% | |
ResMed, Inc. | | | | |
Health Care Equipment & Supplies | | | 4.9% | |
| | | | |
| | | 55.3% | |
| | | | |
| Sector Allocation – (% of Net Assets) | | | |
Consumer, Non-cyclical | | | 101.6% | |
Consumer, Cyclical | | | 1.9% | |
Investment Companies | | �� | 0.6% | |
| | | | |
| | | 104.1% | |
Holdings are subject to change without notice.
The Obesity ETF (unaudited)
Performance
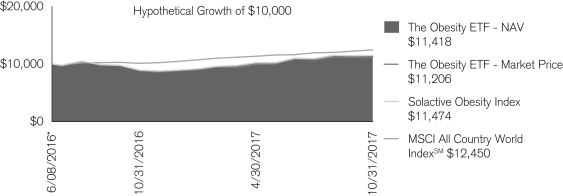
| | | | |
| Average Annual Total Return for the periods ended October 31, 2017 |
| | | One Year | | Since Inception* |
The Obesity ETF – NAV | | 27.99% | | 9.95% |
The Obesity ETF – Market Price | | 27.26% | | 8.49% |
Solactive Obesity Index | | 28.51% | | 10.34% |
MSCI All Country World IndexSM | | 23.20% | | 16.98% |
| Total | annual expense ratio (estimated) as stated in the February 28, 2017 prospectus: 0.50%. |
Returns quoted are past performance and do not guarantee future results; current performance may be lower or higher. Investment returns and principal value will vary; there may be a gain or loss when shares are sold. For the most recent month-end performance call 800.668.0434 or visit janushenderson.com/performance.
Shares of ETFs are bought and sold at market price (not NAV) and are not individually redeemed from the Fund. Market returns are based upon the midpoint of the bid/ask spread at 4:00 p.m. Eastern time (when NAV is normally determined for most ETFs), and do not represent the returns you would receive if you traded shares at other times. Ordinary brokerage commissions apply and will reduce returns.
ETF shares are not individually redeemable and owners of the shares may acquire those shares from the Fund and tender those shares for redemption to the Fund in Creation Units only.
Investing involves risk, including the possible loss of principal and fluctuation of value.
Performance depends on that of the underlying index.
High absolute short-term performance is not typical and may not be achieved in the future. Such results should not be the sole basis for evaluating material facts in making an investment decision.
See the prospectus for a more complete discussion of objectives, risks and expenses.
Returns include reinvestment of dividends and capital gains. Returns greater than one year are annualized. Returns do not reflect the deduction of taxes that a shareholder would pay on Fund distributions or redemptions of Fund shares.
See Financial Highlights for actual expense ratios during the reporting period.
There is no assurance the stated objective(s) will be met.
See Notes to Schedule of Investments and Other Information for index definitions.
Index performance does not reflect the expenses of managing a portfolio as an index is unmanaged and not available for direct investment.
Solactive Indices were created by and are maintained by, Solactive AG. For detailed information on how stocks are selected for inclusion in the Underlying Index, see solactive.com. Solactive is not affiliated with Janus Henderson or ALPS.
Effective February 28, 2017 Edward Tom, Benjamin Wang and Scott Weiner are Co-Portfolio Managers of the Fund.
| * | The Fund commenced operations on June 8, 2016. |
| | |
| | Janus Detroit Street Trust ½ 3 |
The Obesity ETF (unaudited)
Disclosure of Fund Expenses
As a shareholder of the Fund, you incur two types of costs: (1) transaction costs, which may include creation and redemption fees or brokerage charges and (2) ongoing costs, including management fees and other Fund expenses. This example is intended to help you understand your ongoing costs (in dollars) of investing in the Fund and to compare these costs with the ongoing costs of investing in other ETFs. To do so, compare this 5% hypothetical example with the 5% hypothetical examples that appear in the shareholder reports of the other funds. The example is based upon an investment of $1,000 invested at the beginning of the period and held for the six-months indicated, unless noted otherwise in the table and footnotes below.
Actual Expenses
The information in the table under the heading “Actual” provides information about actual account values and actual expenses. You may use the information in these columns, together with the amount you invested, to estimate the expenses that you paid over the period. Simply divide your account value by $1,000 (for example, an $8,600 account value divided by $1,000 = 8.6), then multiply the result by the number under the heading entitled “Expenses Paid During Period” to estimate the expenses you paid on your account during the period.
Hypothetical Example for Comparison Purposes
The information in the table under the heading “Hypothetical (5% return before expenses)” provides information about hypothetical account values and hypothetical expenses based upon the Fund’s actual expense ratio and an assumed rate of return of 5% per year before expenses, which is not the Fund’s actual return. The hypothetical account values and expenses may not be used to determine the actual ending account balance or expenses you paid for the period. You may use this information to compare the ongoing costs of investing in the Fund and other funds. To do so, compare this 5% hypothetical example with the 5% hypothetical examples that appear in the shareholder reports of the other funds. Additionally, for an analysis of the fees associated with an investment or other similar funds, please visit www.finra.org/fundanalyzer.
Please note that the expenses shown in the table are meant to highlight your ongoing costs only and do not reflect any transaction costs, such as creation and redemption fees, or brokerage charges. These fees are fully described in the Fund’s prospectus. Therefore, the hypothetical examples are useful in comparing ongoing costs only, and will not help you determine the relative total costs of owning different funds. In addition, if these transaction costs were included, your costs would have been higher.
| | | | | | | | | | | | | | | | | | | | | | | | |
Actual | | | Hypothetical
(5% return before expenses) | | | | |
Beginning
Account
Value
(5/1/17) | | Ending
Account
Value
(10/31/2017) | | | Expenses
Paid During
Period
(5/1/17 - 10/31/2017)† | | | Beginning
Account
Value
(5/1/17) | | | Ending
Account
Value
(10/31/2017) | | | Expenses
Paid During
Period
(5/1/17 - 10/31/2017)† | | | Net Annualized
Expense Ratio
(5/1/17 - 10/31/2017) | |
| $1,000.00 | | $ | 1,124.60 | | | $ | 2.68 | | | $ | 1,000.00 | | | $ | 1,022.68 | | | $ | 2.55 | | | | 0.50% | |
| † | Expenses Paid During Period is equal to the Net Annualized Expense Ratio multiplied by the average account value over the period, multiplied by 184/365 (to reflect the one-half year period). |
The Obesity ETF
Report of Independent Registered Public Accounting Firm
To the Board of Trustees of Janus Detroit Street Trust and Shareholders of The Obesity ETF:
In our opinion, the accompanying statement of assets and liabilities, including the schedule of investments, and the related statements of operations and of changes in net assets and the financial highlights present fairly, in all material respects, the financial position of The Obesity ETF (one of the funds constituting Janus Detroit Street Trust, hereafter referred to as the “Fund”) as of October 31, 2017, the results of its operations for the year then ended, and the changes in its net assets and financial highlights for the year then ended and for the period from June 8, 2016 (commencement of operations) through October 31, 2016, in conformity with accounting principles generally accepted in the United States of America. These financial statements and financial highlights (hereafter referred to as “financial statements”) are the responsibility of the Fund’s management. Our responsibility is to express an opinion on these financial statements based on our audits. We conducted our audits of these financial statements in accordance with the standards of the Public Company Accounting Oversight Board (United States). Those standards require that we plan and perform the audit to obtain reasonable assurance about whether the financial statements are free of material misstatement. An audit includes examining, on a test basis, evidence supporting the amounts and disclosures in the financial statements, assessing the accounting principles used and significant estimates made by management, and evaluating the overall financial statement presentation. We believe that our audits, which included confirmation of securities as of October 31, 2017 by correspondence with the custodian, brokers and transfer agent, provide a reasonable basis for our opinion.

Denver, Colorado
December 20, 2017
| | |
| | Janus Detroit Street Trust ½ 5 |
The Obesity ETF
Schedule of Investments
October 31, 2017
| | | | | | | | |
| | | Shares | | | Value | |
| Common Stocks – 103.5% | | | | | | |
| Biotechnology – 6.1% | | | | | | |
Adocia* | | | 201 | | | | $3,744 | |
Arena Pharmaceuticals, Inc.* | | | 1,881 | | | | 52,724 | |
Esperion Therapeutics, Inc.* | | | 948 | | | | 43,362 | |
Keryx Biopharmaceuticals, Inc.* | | | 5,143 | | | | 33,327 | |
Lexicon Pharmaceuticals, Inc.* | | | 2,092 | | | | 21,317 | |
MannKind Corp.*,# | | | 4,631 | | | | 15,236 | |
Zafgen, Inc.* | | | 1,085 | | | | 3,863 | |
| | | | | | | | |
| | | | | | | 173,573 | |
| Diversified Consumer Services – 4.3% | | | | | | |
Weight Watchers International, Inc.* | | | 2,729 | | | | 122,586 | |
| Health Care Equipment & Supplies – 36.4% | | | | | | |
AngioDynamics, Inc.* | | | 1,740 | | | | 29,528 | |
Apex Biotechnology Corp. | | | 4,000 | | | | 4,377 | |
Cardiovascular Systems, Inc.* | | | 1,536 | | | | 36,972 | |
CryoLife, Inc.* | | | 1,466 | | | | 28,514 | |
DexCom, Inc.* | | | 2,899 | | | | 130,368 | |
Endologix, Inc.* | | | 3,818 | | | | 20,235 | |
Fisher & Paykel Healthcare Corp., Ltd. | | | 15,682 | | | | 142,005 | |
Insulet Corp.* | | | 2,609 | | | | 153,435 | |
iRhythm Technologies, Inc.* | | | 774 | | | | 39,435 | |
Itamar Medical, Ltd.* | | | 5,639 | | | | 1,839 | |
LeMaitre Vascular, Inc. | | | 704 | | | | 22,535 | |
Lifetech Scientific Corp.* | | | 104,000 | | | | 25,727 | |
Microlife Corp. | | | 2,000 | | | | 4,894 | |
Microport Scientific Corp. | | | 28,000 | | | | 27,635 | |
Nipro Corp. | | | 6,800 | | | | 98,682 | |
NxStage Medical, Inc.* | | | 3,113 | | | | 83,895 | |
Obalon Therapeutics, Inc.* | | | 358 | | | | 3,018 | |
ResMed, Inc. | | | 16,769 | | | | 139,248 | |
Rockwell Medical, Inc.*,# | | | 2,243 | | | | 13,593 | |
TaiDoc Technology Corp. | | | 2,203 | | | | 6,370 | |
Ypsomed Holding AG* | | | 172 | | | | 29,972 | |
| | | | | | | | |
| | | | | | | 1,042,277 | |
| Health Care Providers & Services – 24.6% | | | | | | |
DaVita, Inc.* | | | 2,291 | | | | 139,155 | |
Fresenius Medical Care AG & Co. KGaA | | | 5,839 | | | | 564,714 | |
| | | | | | | | |
| | | | | | | 703,869 | |
| Internet & Catalog Retail – 3.8% | | | | | | |
N Brown Group PLC | | | 9,036 | | | | 36,142 | |
Nutrisystem, Inc. | | | 1,422 | | | | 71,029 | |
| | | | | | | | |
| | | | | | | 107,171 | |
| Life Sciences Tools & Services – 0.2% | | | | | | |
Crown Bioscience International | | | 4,000 | | | | 5,365 | |
| Personal Products – 6.9% | | | | | | |
Herbalife, Ltd.* | | | 1,762 | | | | 127,957 | |
Medifast, Inc. | | | 515 | | | | 32,136 | |
USANA Health Sciences, Inc.* | | | 572 | | | | 37,580 | |
| | | | | | | | |
| | | | | | | 197,673 | |
| Pharmaceuticals – 20.6% | | | | | | |
Novo Nordisk A/S - Class B | | | 11,696 | | | | 581,907 | |
Oramed Pharmaceuticals, Inc.* | | | 402 | | | | 3,988 | |
VIVUS, Inc.* | | | 4,788 | | | | 3,283 | |
| | | | | | | | |
| | | | | | | 589,178 | |
| Specialty Retail – 0.6% | | | | | | |
Cato Corp. - Class A | | | 1,105 | | | | 14,210 | |
Destination XL Group, Inc.* | | | 1,622 | | | | 3,244 | |
| | | | | | | | |
| | | | | | | | 17,454 | |
Total Common Stocks (cost $2,986,151) | | | | | | | 2,959,146 | |
See Notes to Schedule of Investments and Other Information and Notes to Financial Statements.
The Obesity ETF
Schedule of Investments
October 31, 2017
| | | | | | | | |
| | | Shares | | | Value | |
| Investment Companies – 0.6% | | | | | | |
Investments Purchased with Cash Collateral from Securities Lending – 0.6% | | | | | | | | |
Janus Cash Collateral Fund LLC, 1.0003%ºº,£ (cost $17,506) | | | 17,506 | | | | $17,506 | |
Total Investments (total cost $3,003,657) – 104.1% | | | | | | | 2,976,652 | |
Liabilities, net of Cash, Receivables and Other Assets – (4.1%) | | | | | | | (116,163) | |
Net Assets - 100% | | | | | | | $2,860,489 | |
Summary of Investments by Country – (Long Positions) (unaudited)
| | | | | | | | |
| Country | | Value | | | % of Investment Securities | |
United States | | | $1,439,291 | | | | 48.4% | |
Denmark | | | 581,907 | | | | 19.5 | |
Germany | | | 564,714 | | | | 19.0 | |
New Zealand | | | 142,005 | | | | 4.8 | |
Japan | | | 98,682 | | | | 3.3 | |
China | | | 53,362 | | | | 1.8 | |
United Kingdom | | | 36,142 | | | | 1.2 | |
Switzerland | | | 29,972 | | | | 1.0 | |
Taiwan, Province Of China | | | 21,006 | | | | 0.7 | |
Israel | | | 5,827 | | | | 0.2 | |
France | | | 3,744 | | | | 0.1 | |
Total | | | $2,976,652 | | | | 100.0% | |
Schedules of Affiliated Investments – (% of Net Assets)
| | | | | | | | | | | | | | | | |
| | | Dividend Income | | | Realized Gain/(Loss) | | | Change in Unrealized
Appreciation/
(Depreciation) | | | Value at 10/31/17 | |
Investment Companies – 0.6% | | | | | | | | | | | | | | | | |
Investments Purchased with Cash Collateral from Securities Lending – 0.6% | | | | | | | | | | | | | | | | |
Janus Cash Collateral Fund LLC, 1.0003%ºº | | $ | 4,628 | D | | $ | — | | | $ | — | | | $ | 17,506 | |
| | | | |
| | | Share Balance
at 10/31/16 | | | Purchases | | | Sales | | | Share Balance
at 10/31/17 | |
Investment Companies – 0.6% | | | | | | | | | | | | | | | | |
Investments Purchased with Cash Collateral from Securities Lending – 0.6% | | | | | | | | | | | | | | | | |
Janus Cash Collateral Fund LLC, 1.0003%ºº | | | — | | | | 1,129,960 | | | | (1,112,454) | | | | 17,506 | |
See Notes to Schedule of Investments and Other Information and Notes to Financial Statements.
| | |
| | Janus Detroit Street Trust ½ 7 |
The Obesity ETF
Notes to Schedule of Investments and Other Information
October 31, 2017
| | |
| Solactive Obesity Index | | Solactive Obesity Index is designed to track the performance of companies globally that are positioned to profit from servicing the obese, including: biotechnology, pharmaceutical, healthcare and medical device companies whose business is focused on obesity and obesity related disease, including diabetes, high blood pressure, cholesterol, heart disease, stroke and sleep apnea, and companies focused on weight loss programs and supplements, and plus sized apparel. |
| |
| MSCI All Country World IndexSM | | MSCI All Country World IndexSM reflects the equity market performance of global developed and emerging markets. |
| |
| LLC | | Limited Liability Company |
| |
| PLC | | Public Limited Company |
| * | Non-income producing security. |
| # | Loaned security; a portion of the security is on loan at October 31, 2017. |
| ºº | Rate shown is the 7-day yield as of October 31, 2017. |
| £ | The Fund may invest in certain securities that are considered affiliated companies. As defined by the Investment Company Act of 1940, as amended, an affiliated company is one in which the Fund owns 5% or more of the outstanding voting securities, or a company which is under common ownership or control. |
| D | Net of income paid to the securities lending agent and rebates paid to the borrowing companies |
The following is a summary of the inputs that were used to value the Fund’s investments in securities and other financial instruments as of October 31, 2017. See Notes to Financial Statements for more information.
Valuation Inputs Summary
| | | | | | | | | | | | |
| | | Level 1 -
Quoted Prices | | | Level 2 -
Other Significant
Observable Inputs | | | Level 3 - Significant
Unobservable Inputs | |
Assets | | | | | | | | | | | | |
Investments in Securities: | | | | | | | | | | | | |
Common Stocks | | $ | 2,959,146 | | | $ | — | | | $ | — | |
Investment Companies | | | — | | | | 17,506 | | | | — | |
| | | | |
Total Assets | | $ | 2,959,146 | | | $ | 17,506 | | | $ | — | |
The Obesity ETF
Statement of Assets and Liabilities
October 31, 2017
| | | | |
Assets: | | | | |
Unaffiliated investments, at value(1)(2) | | $ | 2,959,146 | |
Affiliated investments, at value(3) | | | 17,506 | |
Cash denominated in foreign currency(4) | | | 2 | |
Receivables: | | | | |
Investments sold | | | 109,515 | |
Dividends | | | 3,088 | |
Affiliated securities lending income, net | | | 779 | |
Total Assets | | | 3,090,036 | |
Liabilities: | | | | |
Collateral on securities loaned (Note 2) | | | 17,506 | |
Payables: | | | | |
Due to custodian | | | 871 | |
Investments purchased | | | 209,980 | |
Management fees | | | 1,190 | |
Total Liabilities | | | 229,547 | |
Net Assets | | $ | 2,860,489 | |
Net Assets Consists of: | | | | |
Capital (par value and paid-in surplus) | | $ | 2,921,528 | |
Undistributed net investment income/(loss) | | | — | |
Undistributed net realized gain/(loss) from investments and foreign currency transactions | | | (34,345) | |
Unrealized net appreciation/(depreciation) on investments and foreign currency translations | | | (26,694) | |
Total Net Assets | | $ | 2,860,489 | |
Net Assets | | $ | 2,860,489 | |
Shares outstanding, $0.001 Par Value (unlimited shares authorized) | | | 100,001 | |
Net Asset Value Per Share | | $ | 28.60 | |
| (1) | Includes cost of $2,986,151. |
| (2) | Includes $17,116 of securities on loan. See Note 2 in Notes to Financial Statements. |
| (3) | Includes cost of $17,506. |
See Notes to Financial Statements.
| | |
| | Janus Detroit Street Trust ½ 9 |
The Obesity ETF
Statement of Operations
For the year ended October 31, 2017
| | | | |
Investment Income: | | | | |
Dividends | | $ | 29,897 | |
Affiliated securities lending income, net | | | 4,628 | |
Foreign tax withheld | | | (3,787) | |
Total Investment Income | | | 30,738 | |
Expenses: | | | | |
Management Fees | | | 12,714 | |
Total Expenses | | | 12,714 | |
Net Investment Income/(Loss) | | | 18,024 | |
Net Realized Gain/(Loss) on Investments: | | | | |
Investments and foreign currency transactions | | | 384,390 | |
Total Net Realized Gain/(Loss) on Investments | | | 384,390 | |
Change in Unrealized Net Appreciation/Depreciation: | | | | |
Investments and foreign currency translations | | | 220,542 | |
Total Change in Unrealized Net Appreciation/Depreciation | | | 220,542 | |
Net Increase/(Decrease) in Net Assets Resulting from Operations | | $ | 622,956 | |
See Notes to Financial Statements.
The Obesity ETF
Statements of Changes in Net Assets
| | | | | | | | |
| | | Year ended
October 31, 2017 | | | Period ended
October 31, 2016(1) | |
Operations: | | | | | | | | |
Net investment income/(loss) | | $ | 18,024 | | | $ | 4,682 | |
Net realized gain/(loss) on investments | | | 384,390 | | | | (30,641) | |
Change in unrealized net appreciation/depreciation | | | 220,542 | | | | (247,236) | |
Net Increase/(Decrease) in Net Assets Resulting from Operations | | | 622,956 | | | | (273,195) | |
Dividends and Distributions to Shareholders: | | | | | | | | |
Dividends from Net Investment Income | | | (16,546) | | | | (4,675) | |
Return of Capital on Dividends from Net Investment Income | | | — | | | | (1,029) | |
Capital Share Transactions | | | 5,612 | | | | 2,527,366 | |
Net Increase/(Decrease) in Net Assets | | | 612,022 | | | | 2,248,467 | |
Net Assets: | | | | | | | | |
Beginning of period | | | 2,248,467 | | | | — | |
End of period | | $ | 2,860,489 | | | $ | 2,248,467 | |
| | |
| | | | | | | | |
Undistributed Net Investment Income/(Loss) | | $ | — | | | $ | 4 | |
| (1) | Period from June 8, 2016 (commencement of operations) through October 31, 2016. |
See Notes to Financial Statements.
| | |
| | Janus Detroit Street Trust ½ 11 |
The Obesity ETF
Financial Highlights
| | | | | | | | | | |
| For a share outstanding during each year or period ended October 31 | | 2017 | | | 2016(1) | |
| | Net Asset Value, Beginning of Period | | | $22.48 | | | | $25.27 | |
| | Income/(Loss) from Investment Operations: | | | | | | | | |
| | Net investment income/(loss)(2) | | | 0.18 | | | | 0.05 | |
| | Net realized and unrealized gain/(loss) | | | 6.11 | | | | (2.78) | |
| | Total from Investment Operations | | | 6.29 | | | | (2.73) | |
| | Less Dividends and Distributions: | | | | | | | | |
| | Dividends (from net investment income) | | | (0.17) | | | | (0.05) | |
| | Return of Capital | | | — | | | | (0.01) | |
| | Total Dividends and Distributions | | | (0.17) | | | | (0.06) | |
| | Net Asset Value, End of Period | | | $28.60 | | | | $22.48 | |
| | Total Return* | | | 28.05% | | | | (10.79)% | |
| | Net assets, End of Period (in thousands) | | | $2,860 | | | | $2,248 | |
| | Average Net Assets for the Period (in thousands) | | | $2,543 | | | | $2,478 | |
| | Ratios to Average Net Assets**: | | | | | | | | |
| | Ratio of Gross Expenses | | | 0.50% | | | | 0.50% | |
| | Ratio of Net Investment Income/(Loss) | | | 0.71% | | | | 0.48% | |
| | Portfolio Turnover Rate(3) | | | 44% | | | | 20% | |
| * | Total return not annualized for periods of less than one full year. |
| ** | Annualized for periods of less than one full year. |
| (1) | Period from June 8, 2016 (commencement of operations) through October 31, 2016. |
| (2) | Per share amounts are calculated based on average shares outstanding during the year or period. |
| (3) | Portfolio turnover rate excludes securities received or delivered from in-kind processing of creation or redemptions. |
See Notes to Financial Statements.
The Obesity ETF
Notes to Financial Statements
1. Organization and Significant Accounting Policies
The Obesity ETF (the “Fund”) is a series fund. The Fund is part of Janus Detroit Street Trust (the “Trust”), which is organized as a Delaware statutory trust and is registered under the Investment Company Act of 1940, as amended (the “1940 Act”), as an open-end management investment company, and therefore has applied the specialized accounting and reporting guidance in Financial Accounting Standards Board (“FASB”) Accounting Standards Codification (“ASC”) Topic 946. The Trust offers nine Funds each of which represent shares of beneficial interest in a separate portfolio of securities and other assets with its own objective and policies. The Fund seeks investment results that correspond generally to the performance, before fees and expenses, of an index (“Underlying Index”) which is designed to track the performance of companies globally that are positioned to profit from servicing the obese, including biotechnology, pharmaceutical, health care and medical device companies whose business is focused on obesity and obesity related disease including diabetes, high blood pressure, cholesterol, heart disease, stroke, and sleep apnea, and companies focused on weight loss programs, weight loss supplements, or plus sized apparel. The Fund is classified as nondiversified, as defined in the 1940 Act.
Unlike shares of traditional mutual funds, shares of the Fund are not individually redeemable and may only be purchased or redeemed directly from the Fund at net asset value (“NAV”) in large increments called “Creation Units” (100,000 or more shares per Creation Unit) through certain participants, known as “Authorized Participants.” The Fund will issue or redeem Creation Units in exchange for portfolio securities and/or cash. Except when aggregated in Creation Units, Fund shares are not redeemable securities of the Fund. Shares of the Fund are listed and trade on The NASDAQ Stock Market LLC (“NASDAQ”) and individual investors can purchase or sell shares in much smaller increments and for cash in the secondary market through a broker. These transactions, which do not involve the Fund, are made at market prices that may vary throughout the day and differ from the Fund’s NAV. As a result, you may pay more than NAV (at a premium) when you purchase shares, and receive less than NAV (at a discount) when you sell shares, in the secondary market.
An Authorized Participant may hold of record more than 25% of the outstanding shares of the Fund. From time to time, Authorized Participants may be a beneficial and/or legal owner of the Fund, may be affiliated with an index provider, may be deemed to have control of the Fund and/or may be able to affect the outcome of matters presented for a vote of the shareholders of the Fund. Authorized Participants may execute an irrevocable proxy granting the Distributor or an affiliate of Janus Capital Management LLC (“Janus Capital” or “Janus”) power to vote or abstain from voting such Authorized Participant’s beneficially or legally owned shares of the Fund. In such cases, the agent shall mirror vote (or abstain from voting) such shares in the same proportion as all other beneficial owners of the Fund.
The following accounting policies have been followed by the Fund and are in conformity with accounting principles generally accepted in the United States of America.
Investment Valuation
Securities held by the Fund are valued in accordance with policies and procedures established by and under the supervision of the Trustees (the “Valuation Procedures”). Equity securities traded on a domestic securities exchange are generally valued at the closing prices on the primary market or exchange on which they trade. If such price is lacking for the trading period immediately preceding the time of determination, such securities are valued at their current bid price. Equity securities that are traded on a foreign exchange are generally valued at the closing prices on such markets. In the event that there is no current trading volume on a particular security in such foreign exchange, the bid price from the primary exchange is generally used to value the security. Securities that are traded on the over-the-counter (“OTC”) markets are generally valued at their closing or latest bid prices as available. Foreign securities and currencies are converted to U.S. dollars using the applicable exchange rate in effect at the close of the New York Stock Exchange (“NYSE”). The Fund will determine the market value of individual securities held by it by using prices provided by one or more approved professional pricing services or, as needed, by obtaining market quotations from independent broker-dealers. Most debt securities are valued in accordance with the evaluated bid price supplied by the pricing service that is intended to reflect market value. The evaluated bid price supplied by the pricing service is an evaluation that may consider factors such as security prices, yields, maturities and ratings. Certain short-term securities maturing within 60 days or less may be evaluated and valued on an amortized cost basis provided that the amortized cost determined approximates market value. Securities for which market quotations or evaluated prices are not readily available or are deemed unreliable are valued at fair value determined in good faith under the Valuation Procedures. Circumstances in which fair value pricing may be utilized include, but are not limited to: (i) a significant event that may affect the securities of a single issuer, such as a merger, bankruptcy, or significant issuer-specific development; (ii) an event that may affect an entire market, such as a natural disaster or significant governmental action; (iii) a nonsignificant event such as a market closing early or not opening, or a security trading halt; and (iv) pricing of a nonvalued security and a restricted or nonpublic security. Special valuation considerations may apply with respect to “odd-lot” fixed-income transactions which, due to their
| | |
| | Janus Detroit Street Trust ½ 13 |
The Obesity ETF
Notes to Financial Statements
small size, may receive evaluated prices by pricing services which reflect a large block trade and not what actually could be obtained for the odd-lot position.
Valuation Inputs Summary
FASB ASC 820, Fair Value Measurements and Disclosures (“ASC 820”), defines fair value, establishes a framework for measuring fair value, and expands disclosure requirements regarding fair value measurements. This standard emphasizes that fair value is a market-based measurement that should be determined based on the assumptions that market participants would use in pricing an asset or liability and establishes a hierarchy that prioritizes inputs to valuation techniques used to measure fair value. These inputs are summarized into three broad levels:
Level 1 – Unadjusted quoted prices in active markets the Fund has the ability to access for identical assets or liabilities.
Level 2 – Observable inputs other than unadjusted quoted prices included in Level 1 that are observable for the asset or liability either directly or indirectly. These inputs may include quoted prices for the identical instrument on an inactive market, prices for similar instruments, interest rates, prepayment speeds, credit risk, yield curves, default rates and similar data.
Assets or liabilities categorized as Level 2 in the hierarchy generally include: debt securities fair valued in accordance with the evaluated bid or ask prices supplied by a pricing service; securities traded on OTC markets and listed securities for which no sales are reported that are fair valued at the latest bid price (or yield equivalent thereof) obtained from one or more dealers transacting in a market for such securities or by a pricing service approved by the Fund’s Trustees; and certain short-term debt securities with maturities of 60 days or less that are fair valued at amortized cost. Other securities that may be categorized as Level 2 in the hierarchy include, but are not limited to, preferred stocks, bank loans, swaps, investments in unregistered investment companies, options, and forward contracts.
Level 3 – Unobservable inputs for the asset or liability to the extent that relevant observable inputs are not available, representing the Fund’s own assumptions about the assumptions that a market participant would use in valuing the asset or liability, and that would be based on the best information available.
There have been no significant changes in valuation techniques used in valuing any such positions held by the Fund since the beginning of the fiscal year.
The inputs or methodology used for fair valuing securities are not necessarily an indication of the risk associated with investing in those securities. The summary of inputs used as of October 31, 2017 to fair value the Fund’s investments in securities and other financial instruments is included in the “Valuation Inputs Summary” in the Notes to Schedule of Investments and Other Information.
The Fund recognizes transfers between the levels as of the beginning of the fiscal year. The following describes the amounts of transfers between Level 1, Level 2 and Level 3 of the fair value hierarchy during the year/period.
Financial assets of $790 were transferred out of Level 2 to Level 1 to reflect the investments unadjusted quoted price as of October 31, 2017.
Investment Transactions and Investment Income
Investment transactions are accounted for as of the date purchased or sold (trade date). Dividend income is recorded on the ex-dividend date. Certain dividends from foreign securities will be recorded as soon as the Fund is informed of the dividend, if such information is obtained subsequent to the ex-dividend date. Dividends from foreign securities may be subject to withholding taxes in foreign jurisdictions. Gains and losses are determined on the identified cost basis, which is the same basis used for federal income tax purposes.
Estimates
The preparation of financial statements in conformity with accounting principles generally accepted in the United States of America requires management to make estimates and assumptions that affect the reported amount of assets and liabilities and disclosure of contingent assets and liabilities at the date of the financial statements and the reported amounts of income and expenses during the reporting period. Actual results could differ from those estimates.
Indemnifications
In the normal course of business, the Fund may enter into contracts that contain provisions for indemnification of other parties against certain potential liabilities. The Fund’s maximum exposure under these arrangements is unknown, and
The Obesity ETF
Notes to Financial Statements
would involve future claims that may be made against the Fund that have not yet occurred. Currently, the risk of material loss from such claims is considered remote.
Foreign Currency Translations
The Fund does not isolate that portion of the results of operations resulting from the effect of changes in foreign exchange rates on investments from the fluctuations arising from changes in market prices of securities held at the date of the financial statements. Net unrealized appreciation or depreciation of investments and foreign currency translations arise from changes in the value of assets and liabilities, including investments in securities held at the date of the financial statements, resulting from changes in the exchange rates and changes in market prices of securities held.
Currency gains and losses are also calculated on payables and receivables that are denominated in foreign currencies. The payables and receivables are generally related to foreign security transactions and income translations.
Foreign currency-denominated assets and forward currency contracts may involve more risks than domestic transactions, including currency risk, counterparty risk, political and economic risk, regulatory risk and equity risk. Risks may arise from unanticipated movements in the value of foreign currencies relative to the U.S. dollar.
Dividends and Distributions
The Fund generally declares and distributes dividends of net investment income quarterly. Net realized capital gains (if any) are distributed annually. The Fund may treat a portion of the amount paid to redeem shares as a distribution of investment company taxable income and realized capital gains that are reflected in the NAV. This practice, commonly referred to as “equalization,” has no effect on the redeeming shareholder or a Fund’s total return, but may reduce the amounts that would otherwise be required to be paid as taxable dividends to the remaining shareholders. It is possible that the Internal Revenue Service (IRS) could challenge the Fund’s equalization methodology or calculations, and any such challenge could result in additional tax, interest, or penalties to be paid by the Fund.
Federal Income Taxes
The Fund intends to continue to qualify as a regulated investment company and distribute all of its taxable income in accordance with the requirements of Subchapter M of the Internal Revenue Code. Management has analyzed the Fund’s tax positions taken for all open federal income tax years, generally a three-year period, and has concluded that no provision for federal income tax is required in the Fund’s financial statements. The Fund is not aware of any tax positions for which it is reasonably possible that the total amounts of unrecognized tax benefits will significantly change in the next twelve months.
2. Other Investments and Strategies
Additional Investment Risk
The financial crisis in both the U.S. and global economies over the past several years has resulted, and may continue to result, in a significant decline in the value and liquidity of many securities of issuers worldwide in the equity and fixed income/credit markets. In response to the crisis, the United States and certain foreign governments, along with the U.S. Federal Reserve and certain foreign central banks, took steps to support the financial markets. The withdrawal of this support, a failure of measures put in place to respond to the crisis, or investor perception that such efforts were not sufficient could each negatively affect financial markets generally, and the value and liquidity of specific securities. In addition, policy and legislative changes in the United States and in other countries continue to impact many aspects of financial regulation. The effect of these changes on the markets, and the practical implications for market participants, including the Fund, may not be fully known for some time. As a result, it may also be unusually difficult to identify both investment risks and opportunities, which could limit or preclude the Fund’s ability to achieve its investment objective. Therefore, it is important to understand that the value of your investment may fall, sometimes sharply, and you could lose money.
The enactment of the Dodd-Frank Wall Street Reform and Consumer Protection Act (the “Dodd-Frank Act”) provided for widespread regulation of financial institutions, consumer financial products and services, broker-dealers, OTC derivatives, investment advisers, credit rating agencies, and mortgage lending, which expanded federal oversight in the financial sector, including the investment management industry. Certain provisions of the Dodd-Frank Act remain pending and will be implemented through future rulemaking. Therefore, the ultimate impact of the Dodd-Frank Act and the regulations under the Dodd-Frank Act on the Fund and the investment management industry as a whole, is not yet certain.
A number of countries in the European Union (“EU”) have experienced, and may continue to experience, severe economic and financial difficulties. In particular, many EU nations are susceptible to economic risks associated with high levels of debt, notably due to investments in sovereign debt of countries such as Greece, Italy, Spain, Portugal, and Ireland. Many
| | |
| | Janus Detroit Street Trust ½ 15 |
The Obesity ETF
Notes to Financial Statements
non-governmental issuers, and even certain governments, have defaulted on, or been forced to restructure, their debts. Many other issuers have faced difficulties obtaining credit or refinancing existing obligations. Financial institutions have in many cases required government or central bank support, have needed to raise capital, and/or have been impaired in their ability to extend credit. As a result, financial markets in the EU experienced extreme volatility and declines in asset values and liquidity. Responses to these financial problems by European governments, central banks, and others, including austerity measures and reforms, may not work, may result in social unrest, and may limit future growth and economic recovery or have other unintended consequences. Further defaults or restructurings by governments and others of their debt could have additional adverse effects on economies, financial markets, and asset valuations around the world. Greece, Ireland, and Portugal have already received one or more “bailouts” from other Eurozone member states, and it is unclear how much additional funding they will require or if additional Eurozone member states will require bailouts in the future. The risk of investing in securities in the European markets may also be heightened due to the referendum in which the United Kingdom voted to exit the EU (known as “Brexit”). One or more other countries may also abandon the euro and/ or withdraw from the EU, placing its currency and banking system in jeopardy.
Certain areas of the world have historically been prone to and economically sensitive to environmental events such as, but not limited to, hurricanes, earthquakes, typhoons, flooding, tidal waves, tsunamis, erupting volcanoes, wildfires or droughts, tornadoes, mudslides, or other weather-related phenomena. Such disasters, and the resulting physical or economic damage, could have a severe and negative impact on the Fund’s investment portfolio and, in the longer term, could impair the ability of issuers in which the Fund invests to conduct their businesses as they would under normal conditions. Adverse weather conditions may also have a particularly significant negative effect on issuers in the agricultural sector and on insurance companies that insure against the impact of natural disasters.
Counterparties
Fund transactions involving a counterparty are subject to the risk that the counterparty or a third party will not fulfill its obligation to the Fund (“counterparty risk”). Counterparty risk may arise because of the counterparty’s financial condition (i.e., financial difficulties, bankruptcy, or insolvency), market activities and developments, or other reasons, whether foreseen or not. A counterparty’s inability to fulfill its obligation may result in significant financial loss to the Fund. The Fund may be unable to recover its investment from the counterparty or may obtain a limited recovery, and/or recovery may be delayed. The extent of the Fund’s exposure to counterparty risk with respect to financial assets and liabilities approximates its carrying value. See the “Offsetting Assets and Liabilities” section of this Note for further details.
The Fund may be exposed to counterparty risk through participation in various programs, including, but not limited to, lending its securities to third parties, cash sweep arrangements whereby the Fund’s cash balance is invested in one or more types of cash management vehicles, as well as investments in, but not limited to, repurchase agreements, and derivatives, including various types of swaps, futures and options. The Fund intends to enter into financial transactions with counterparties that Janus Capital believes to be creditworthy at the time of the transaction. There is always the risk that Janus Capital’s analysis of a counterparty’s creditworthiness is incorrect or may change due to market conditions. To the extent that the Fund focuses its transactions with a limited number of counterparties, it will have greater exposure to the risks associated with one or more counterparties.
Offsetting Assets and Liabilities
The Fund presents gross and net information about transactions that are either offset in the financial statements or subject to an enforceable master netting arrangement or similar agreement with a designated counterparty, regardless of whether the transactions are actually offset in the Statement of Assets and Liabilities.
Deutsche Bank AG acts as securities lending agent and a limited purpose custodian or subcustodian to receive and disburse cash balances and cash collateral, hold short-term investments, hold collateral, and perform other custodian functions in accordance with the Agency Securities Lending and Repurchase Agreement. For financial reporting purposes, the Fund does not offset financial instruments’ payables and receivables and related collateral on the Statement of Assets and Liabilities. Securities on loan will be continuously secured by collateral which may consist of cash, U.S. Government securities, domestic and foreign short-term debt instruments, letters of credit, time deposits, repurchase agreements, money market mutual funds or other money market accounts, or such other collateral as permitted by the SEC. The value of the collateral must be at least 102% of the market value of the loaned securities that are denominated in U.S. dollars and 105% of the market value of the loaned securities that are not denominated in U.S. dollars. Upon receipt of cash collateral, Janus Capital intends to invest the cash collateral in a cash management vehicle for which Janus Capital serves as investment adviser, Janus Cash Collateral Fund LLC. Loaned securities and related collateral are marked-to-market each business day based upon the market value of the loaned securities at the close of business, employing the most recent available pricing information. Collateral levels are then adjusted based on this mark-to-market evaluation.
The Obesity ETF
Notes to Financial Statements
The following table presents gross amounts of recognized assets and/or liabilities and the net amounts after deducting collateral that has been pledged by counterparties or has been pledged to counterparties (if applicable). For corresponding information grouped by type of instrument, see the Fund’s Schedule of Investments.
Offsetting of Financial Assets and Derivative Assets
| | | | | | | | | | | | | | | | | | |
| Counterparty | | | Gross Amounts of
Recognized Assets | | | Offsetting Asset
or Liability(a) | | | Collateral
Pledged(b) | | | Net Amount | |
| | Deutsche Bank AG | | | $ | 17,116 | | | $ | — | | | $ | (17,116) | | | $ | — | |
| (a) | Represents the amount of assets or liabilities that could be offset with the same counterparty under master netting or similar agreements that management elects not to offset on the Statement of Assets and Liabilities. |
| (b) | Collateral pledged is limited to the net outstanding amount due to/from an individual counterparty. The actual collateral amounts pledged may exceed these amounts and may fluctuate in value. |
Securities Lending
Under procedures adopted by the Trustees, the Fund may seek to earn additional income by lending securities to qualified parties. Deutsche Bank AG acts as securities lending agent and a limited purpose custodian or subcustodian to receive and disburse cash balances and cash collateral, hold short-term investments, hold collateral, and perform other custodian functions. The Fund may lend portfolio securities in an amount equal to up to 1/3 of its total assets as determined at the time of the loan origination. There is the risk of delay in recovering a loaned security or the risk of loss in collateral rights if the borrower fails financially. In addition, Janus Capital makes efforts to balance the benefits and risks from granting such loans. All loans will be continuously secured by collateral which may consist of cash, U.S. Government securities, domestic and foreign short-term debt instruments, letters of credit, time deposits, repurchase agreements, money market mutual funds or other money market accounts, or such other collateral as permitted by the SEC. If the Fund is unable to recover a security on loan, the Fund may use the collateral to purchase replacement securities in the market. There is a risk that the value of the collateral could decrease below the cost of the replacement security by the time the replacement investment is made, resulting in a loss to the Fund.
Upon receipt of cash collateral, Janus Capital may invest it in affiliated or non-affiliated cash management vehicles, whether registered or unregistered entities, as permitted by the 1940 Act and rules promulgated thereunder. Janus Capital currently intends to invest the cash collateral in a cash management vehicle for which Janus Capital serves as investment adviser, Janus Cash Collateral Fund LLC. An investment in Janus Cash Collateral Fund LLC is generally subject to the same risks that shareholders experience when investing in similarly structured vehicles, such as the potential for significant fluctuations in assets as a result of the purchase and redemption activity of the securities lending program, a decline in the value of the collateral, and possible liquidity issues. Such risks may delay the return of the cash collateral and cause the Fund to violate its agreement to return the cash collateral to a borrower in a timely manner. As adviser to the Fund and Janus Cash Collateral Fund LLC, Janus Capital has an inherent conflict of interest as a result of its fiduciary duties to both the Fund and Janus Cash Collateral Fund LLC. Additionally, Janus Capital receives an investment advisory fee of 0.05% for managing Janus Cash Collateral Fund LLC, but it may not receive a fee for managing certain other affiliated cash management vehicles in which the Fund may invest, and therefore may have an incentive to allocate preferred investment opportunities to investment vehicles for which it is receiving a fee.
The value of the collateral must be at least 102% of the market value of the loaned securities that are denominated in U.S. dollars and 105% of the market value of the loaned securities that are not denominated in U.S. dollars. Loaned securities and related collateral are marked-to-market each business day based upon the market value of the loaned securities at the close of business, employing the most recent available pricing information. Collateral levels are then adjusted based on this mark-to-market evaluation.
The cash collateral invested by Janus Capital is disclosed in the Schedule of Investments (if applicable). Income earned from the investment of the cash collateral, net of rebates paid to, or fees paid by, borrowers and less the fees paid to the lending agent are included as “Affiliated securities lending income, net” on the Statement of Operations. As of October 31, 2017, securities lending transactions accounted for as secured borrowings with an overnight and continuous contractual maturity are $17,116 for equity securities. Gross amounts of recognized liabilities for securities lending (collateral received) as of October 31, 2017 is $17,506, resulting in the net amount due to the counterparty of $390.
3. Investment Advisory Agreements and Other Transactions with Affiliates
Under its unitary fee structure, the Fund pays Janus Capital a management fee in return for providing certain investment advisory, supervisory, and administrative services to the Fund, including the costs of transfer agency, custody, fund
| | |
| | Janus Detroit Street Trust ½ 17 |
The Obesity ETF
Notes to Financial Statements
administration, legal, audit, and other services. Janus Capital’s fee structure is designed to pay substantially all of the Fund’s expenses. However, the Fund bears other expenses which are not covered under the management fee which may vary and affect the total level of expenses paid by shareholders, such as distribution fees (if any), brokerage expenses or commissions, interest, dividends, taxes, litigation expenses, acquired fund fees and expenses (if any), and extraordinary expenses. The Fund’s management fee is calculated daily and paid monthly. The Fund’s contractual management fee rate (expressed as an annual rate) is 0.50% of the Fund’s average daily net assets.
State Street Bank and Trust Company (“State Street”) provides certain fund administration services to the Fund, including services related to the Fund’s accounting, including calculating the daily NAV, audit, tax, and reporting obligations, pursuant to an agreement with Janus Capital, on behalf of the Fund. As compensation for such services, Janus Capital pays State Street a fee based on a percentage of the Fund’s assets, with a minimum flat fee, for certain services. Janus Capital serves as administrator to the Fund, providing oversight and coordination of the Fund’s service providers, recordkeeping and other administrative services. Janus Capital does not receive any additional compensation, beyond the unitary fee, for serving as administrator. State Street also serves as transfer agent for the shares of the Fund. Pursuant to agreements with Janus Capital on behalf of the Fund, State Street Global Markets, an affiliate of State Street, may execute portfolio transactions for the Fund, including but not limited to, transactions in connection with cash in lieu transactions for non-US securities.
The Trust has adopted a Distribution and Servicing Plan for shares of the Fund pursuant to Rule 12b-1 under the 1940 Act (the “Plan”). The Plan permits compensation in connection with the distribution and marketing of Fund shares and/or the provision of certain shareholder services. The Plan permits the Fund to pay ALPS Distributors, Inc. (the “Distributor”) or its designee, a fee for the sale and distribution and/or shareholder servicing of the shares at an annual rate of up to 0.25% of average daily net assets of the Fund. However, the Trustees have determined not to authorize payment under this Plan at this time. Under the terms of the Plan, the Trust is authorized to make payments to the Distributor or its designee for remittance to retirement plan service providers, broker-dealers, bank trust departments, financial advisors, and other financial intermediaries, as compensation for distribution and/or shareholder services performed by such entities for their customers who are investors in the Fund. The 12b-1 fee may only be imposed or increased when the Trustees determine that it is in the best interests of shareholders to do so. Because these fees are paid out of the Fund’s assets on an ongoing basis, to the extent that a fee is authorized, over time they will increase the cost of an investment in the Fund. The Plan fee may cost an investor more than other types of sales charges.
As of October 31, 2017, Janus Capital owned 1 share or less than 0.01% of the Fund.
4. Federal Income Tax
The tax components of capital shown in the table below represent: (1) distribution requirements the Fund must satisfy under the income tax regulations; (2) losses or deductions the Fund may be able to offset against income and gains realized in future years; and (3) unrealized appreciation or depreciation of investments for federal income tax purposes.
Other book to tax differences primarily consist of deferred compensation, derivatives, and foreign currency contract adjustments. The Fund has elected to treat gains and losses on forward foreign currency contracts as capital gains and losses, if applicable. Other foreign currency gains and losses on debt instruments are treated as ordinary income for federal income tax purposes pursuant to Section 988 of the Internal Revenue Code.
| | | | | | | | | | | | | | | | | | | | | | | | | | |
| | | | | | | | | | Loss Deferrals | | | Other Book
to Tax Differences | | | Net Tax
Appreciation/
(Depreciation) | |
Undistributed
Ordinary Income | | | Undistributed
Long-Term Gains | | | Accumulated
Capital Losses | | | Late-Year
Ordinary Loss | | | Post-October
Capital Loss | | | |
| $ | — | | | $ | — | | | $ | (18,541) | | | $ | — | | | $ | — | | | $ | 311 | | | $ | (42,809) | |
Accumulated capital losses noted below represent net capital loss carryovers, as of October 31, 2017, that may be available to offset future realized capital gains and thereby reduce future taxable gains distributions. The following table shows these capital loss carryovers.
| | | | | | | | | | |
Capital Loss Carryover Schedule
For the year ended October 31, 2017
No Expiration | | | Accumulated Capital Losses | |
| Short-Term | | | Long-Term | | |
| $ | (18,541) | | | $ | — | | | $ | (18,541) | |
The Obesity ETF
Notes to Financial Statements
The aggregate cost of investments and the composition of unrealized appreciation and depreciation of investment securities for federal income tax purposes as of October 31, 2017 are noted below. The primary difference between book and tax appreciation or depreciation of investments is wash sale deferrals.
| | | | | | | | | | | | | | |
| Federal Tax Cost | | | Unrealized Appreciation | | | Unrealized (Depreciation) | | | Net Tax Appreciation/
(Depreciation) | |
| $ | 3,019,461 | | | $ | 148,901 | | | $ | (191,710) | | | $ | (42,809) | |
Income and capital gains distributions are determined in accordance with income tax regulations that may differ from accounting principles generally accepted in the United States of America. These differences are due to differing treatments for items such as net short-term gains, deferral of wash sale losses, foreign currency transactions, passive foreign investment companies, net investment losses, in-kind transactions, and capital loss carryovers. Certain permanent differences such as tax returns of capital and net investment losses noted below have been reclassified to capital.
| | | | | | | | | | | | | | |
| For the year ended October 31, 2017 | |
| Distributions | | | | |
| From Ordinary Income | | | From Long-Term Capital Gains | | | Tax Return of Capital | | | Net Investment Loss | |
| $ | 16,546 | | | $ | — | | | $ | — | | | $ | — | |
|
| For the period ended October 31, 2016 | |
| Distributions | | | | |
| From Ordinary Income | | | From Long-Term Capital Gains | | | Tax Return of Capital | | | Net Investment Loss | |
| $ | 4,675 | | | $ | — | | | $ | 1,029 | | | $ | — | |
Permanent book to tax basis differences may result in reclassifications between the components of net assets. These differences have no impact on the results of operations or net assets. The following reclassifications have been made to the Fund:
| | | | | | | | | | |
| Increase/(Decrease) to Capital | | | Increase/(Decrease) to Undistributed
Net Investment Income/Loss | | | Increase/(Decrease) to Undistributed
Net realized Gain/Loss | |
| $ | 389,579 | | | $ | (1,482) | | | $ | (388,097) | |
5. Capital Share Transactions
| | | | | | | | | | | | | | | | |
| | | Year ended October 31, 2017 | | | Period ended October 31, 2016(1) | |
| | | Shares | | | Amount | | | Shares | | | Amount | |
| Shares sold | | | 100,000 | | | $ | 2,726,001 | | | | 100,001 | | | $ | 2,527,366 | |
| Shares repurchased | | | (100,000) | | | | (2,720,389) | | | | — | | | | — | |
Net Increase/(Decrease) | | | — | | | $ | 5,612 | | | | 100,001 | | | $ | 2,527,366 | |
| (1) | Period from June 8, 2016 (commencement of operations) through October 31, 2016. |
6. Purchases and Sales of Investment Securities
For the year ended October 31, 2017, the aggregate cost of purchases and proceeds from sales of investment securities (excluding any short-term securities, short-term options contracts, and in-kind transactions) was as follows:
| | | | | | | | | | | | | | |
Purchases of Securities | | | Proceeds from Sales of Securities | | | Purchases of Long- Term U.S. Government Obligations | | | Proceeds from Sales of Long-Term U.S. Government Obligations | |
| $ | 1,309,631 | | | $ | 1,217,623 | | | $ | — | | | $ | — | |
| | |
| | Janus Detroit Street Trust ½ 19 |
The Obesity ETF
Notes to Financial Statements
For the year ended October 31, 2017, the cost of in-kind purchases and proceeds from in-kind sales, were as follows:
| | | | | | | | | | | | | | |
Purchases of Securities | | | Proceeds from Sales of Securities | | | Purchases of Long- Term U.S. Government Obligations | | | Proceeds from Sales of Long-Term U.S. Government Obligations | |
| $ | 2,707,024 | | | $ | 2,698,253 | | | $ | — | | | $ | — | |
During the year ended October 31, 2017, the Fund had net realized gain/(loss) of $392,968 from in-kind redemptions. Gains on in-kind transactions are not considered taxable for federal income tax purposes.
7. Recent Accounting Pronouncements
The Securities and Exchange Commission (“SEC”) adopted new rules as well as amendments to its rules to modernize the reporting and disclosure of information by registered investment companies. In addition, the SEC adopted amendments to Regulation S-X, which require standardized, enhanced disclosure about derivatives in investment company financial statements, as well as other amendments. The compliance date of the amendments to Regulation SX was August 1, 2017. This report incorporates the amendments to Regulation S-X.
The FASB issued Accounting Standards Update No. 2017-08, Receivables – Nonrefundable Fees and Other Costs (Subtopic 310-20), Premium Amortization on Purchased Callable Debt Securities (“ASU 2017-08”) to amend the amortization period for certain purchased callable debt securities held at a premium. The guidance requires certain premiums on callable debt securities to be amortized to the earliest call date. The amortization period for callable debt securities purchased at a discount will not be impacted. The amendments are effective for fiscal years, and interim periods within those fiscal years, beginning after December 15, 2018. Early adoption is permitted, including adoption in an interim period. Management is currently evaluating the impacts of ASU 2017-08 on the financial statements.
8. Merger Related Matters
On October 3, 2016, Janus Capital Group Inc. (“JCGI”), the direct parent of Janus Capital Management LLC, the investment adviser to the Fund (“Janus Capital”), and Henderson Group plc (“Henderson”) announced that they had entered into an Agreement and Plan of Merger (“Merger Agreement”) relating to the strategic combination of Henderson and JCGI (the “Merger”). Pursuant to the Merger Agreement, a newly formed, direct wholly-owned subsidiary of Henderson merged with and into JCGI, with JCGI as the surviving corporation and a direct wholly-owned subsidiary of Henderson.
The consummation of the Merger may have been deemed to cause an “assignment” (as defined in the Investment Company Act of 1940 Act, as amended) of the advisory agreement between the Fund and Janus Capital. As a result, the consummation of the Merger may have caused the pre-merger investment advisory agreement to terminate automatically in accordance with its terms.
On October 24, 2016, the Fund’s Board of Trustees approved, subject to shareholder approval, a new investment advisory agreement between the Fund and Janus Capital in order to permit Janus Capital to continue providing advisory services to the Fund following the closing of the Merger (“Post-Merger Advisory Agreement”). At the same meeting, the Trustees approved submitting the Post-Merger Advisory Agreement to Fund shareholders for approval.
On March 17, 2017, shareholders of the Fund approved the Post-Merger Advisory Agreement, which took effect upon the consummation of the Merger on May 30, 2017.
9. Subsequent Event
Management has evaluated whether any events or transactions occurred subsequent to October 31, 2017 and through the date of issuance of the Fund’s financial statements and determined that there were no material events or transactions that would require recognition or disclosure in the Fund’s financial statements.
The Obesity ETF
Additional Information (unaudited)
Proxy Voting Policies and Voting Record
A description of the policies and procedures that the Fund uses to determine how to vote proxies relating to its portfolio securities is available without charge: (i) upon request, by calling 1-800-525-0020 (toll free); (ii) on the Fund’s website at janushenderson.com/proxyvoting; and (iii) on the SEC’s website at http://www.sec.gov.
Quarterly Portfolio Holdings
The Fund files its complete portfolio holdings (schedule of investments) with the SEC for the first and third quarters of each fiscal year on Form N-Q within 60 days of the end of such fiscal quarter. The Fund’s Form N-Q: (i) is available on the SEC’s website at http://www.sec.gov; (ii) may be reviewed and copied at the SEC’s Public Reference Room in Washington, D.C. (information on the Public Reference Room may be obtained by calling 1-800-SEC-0330); and (iii) is available without charge, upon request, by calling Janus Henderson at 1-800-525-0020 (toll free).
Designation Requirements (Unaudited)
For federal income tax purposes, the Fund designated the following for the year ended October 31, 2017:
| | | | |
| Dividends Received Deduction Percentage | | | 36% | |
| Qualified Dividend Income Percentage | | | 100% | |
Licensing Agreements
Solactive AG (“Solactive”) is the Index Provider for the Underlying Index. Janus Capital has entered into a license agreement with Solactive to use the Underlying Index.
Neither Solactive nor any of its affiliates make any representation or warranty, express or implied, to the owners of a Fund or any member of the public regarding the advisability of investing in securities generally or in a Fund particularly or the ability of the Underlying Index to track general market performance. The Underlying Index is determined, composed, and calculated by Solactive without regard to Janus Capital or the Fund. Solactive has no obligation to take the needs of Janus Capital or the owners of the Fund into consideration in determining, composing, or calculating the Underlying Index. Solactive is not responsible for and has not participated in the determination of the timing of, prices at, or quantities of the Fund to be issued or in the determination or calculation of the equation by which the Fund is to be converted into cash.
ALTHOUGH SOLACTIVE SHALL OBTAIN INFORMATION FOR INCLUSION IN OR FOR USE IN THE CALCULATION OF THE UNDERLYING INDEX FROM SOURCES WHICH IT CONSIDERS RELIABLE, IT DOES NOT GUARANTEE THE QUALITY, ACCURACY AND/OR THE COMPLETENESS OF THE UNDERLYING INDEX OR ANY DATA INCLUDED THEREIN AND SHALL HAVE NO LIABILITY FOR ERRORS OR OMISSIONS OF ANY KIND RELATED TO THE UNDERLYING INDEX OR DATA. SOLACTIVE MAKES NO WARRANTY, EXPRESS OR IMPLIED, AS TO RESULTS TO BE OBTAINED BY JANUS CAPITAL, OWNERS OF THE FUND, OR ANY OTHER PERSON OR ENTITY FROM THE USE OF THE UNDERLYING INDEX OR ANY DATA INCLUDED THEREIN IN CONNECTION WITH THE RIGHTS LICENSED TO JANUS CAPITAL FOR ANY OTHER USE. SOLACTIVE MAKES NO EXPRESS OR IMPLIED WARRANTIES, AND HEREBY EXPRESSLY DISCLAIMS ALL WARRANTIES OF MERCHANTABILITY OR FITNESS FOR A PARTICULAR PURPOSE OR USE WITH RESPECT TO THE UNDERLYING INDEX OR ANY DATA INCLUDED THEREIN. WITHOUT LIMITING ANY OF THE FOREGOING, IN NO EVENT SHALL IT HAVE ANY LIABILITY FOR ANY SPECIAL, PUNITIVE, INDIRECT, OR CONSEQUENTIAL DAMAGES (INCLUDING LOST PROFITS), EVEN IF NOTIFIED OF THE POSSIBILITY OF SUCH DAMAGES.
Janus Capital does not guarantee the accuracy and/or the completeness of the Underlying Index or any data included therein, and Janus Capital shall have no liability for any errors, omissions or interruptions therein. Janus Capital makes no warranty, express or implied, as to results to be obtained by the Fund, owners of the shares of the Fund or any other person or entity from the use of the Underlying Index or any data included therein. Janus Capital makes no express or implied warranties, and expressly disclaims all warranties of merchantability or fitness for a particular purpose or use with respect to the Underlying Index or any data included therein. Without limiting any of the foregoing, in no event shall Janus Capital have any liability for any special, punitive, direct, indirect or consequential damages (including lost profits) arising out of matters relating to the use of the Underlying Index even if notified of the possibility of such damages.
| | |
| | Janus Detroit Street Trust ½ 21 |
The Obesity ETF
Board Considerations Regarding Approval of Investment Advisory Agreements (unaudited)
APPROVAL OF ADVISORY AGREEMENT DURING THE PERIOD FOR THE ORGANICS ETF, THE LONG-TERM CARE ETF, THE OBESITY ETF, AND THE HEALTH AND FITNESS ETF
The Trustees of the Trust, the majority of are Independent Trustees, met on April 18, 2016 to consider the proposed investment management agreement (the “Investment Management Agreement”) for The Organics ETF, The Long-Term Care ETF, The Obesity ETF, and The Health and Fitness ETF (each a “New Thematic Fund” and collectively, the “New Thematic Funds”). In the course of their consideration of the Investment Management Agreement, the Trustees met in executive session and were advised by their independent counsel. In this regard, the Board, including the Independent Trustees, evaluated the terms of the Investment Management Agreement and reviewed the duties and responsibilities of the Trustees in evaluating and approving such agreements. In considering approval of the Investment Management Agreement, the Board, including the Independent Trustees, reviewed the Board Materials and other information from counsel and from the Adviser, including: (i) a copy of the form of Investment Management Agreement with respect to the Adviser’s management of the assets of each New Thematic Fund; (ii) information describing the nature, quality and extent of the services that the Adviser will provide to the New Thematic Fund, and the fees the Adviser will charge to the New Thematic Funds; (iii) information concerning the Adviser’s financial condition, business, operations, portfolio management teams and compliance programs; (iv) information describing each New Thematic Fund’s anticipated advisory fee and operating expenses; (v) a copy of the Adviser’s current Form ADV; and (vi) a memorandum from counsel on the responsibilities of trustees in considering investment advisory arrangements under the 1940 Act. The Board also considered presentations made by, and discussions held with, representatives of the Adviser. The Board also received information comparing the advisory fees and expenses of the New Thematic Funds to those from fund complexes that were defined as competitors.
During its review of this information, the Board focused on and analyzed the factors that the Board deemed relevant, including: the nature, extent and quality of the services to be provided to each New Fund by the Adviser; the Adviser’s personnel and operations; each New Thematic Fund’s proposed expense level; the anticipated profitability to the Adviser under the Investment Management Agreement at certain asset levels; any “fall-out” benefits to the Adviser and its affiliates (i.e., any ancillary benefits anticipated to be realized by the Adviser and its affiliates from the Adviser’s relationship with the Trust); the effect of asset growth on each New Thematic Fund’s expenses; and possible conflicts of interest.
The Trustees also considered benefits that accrue to the Adviser and its affiliates from their relationships with the New Thematic Funds. The Trustees also concluded that, other than the services provided by the Adviser and its affiliates pursuant to the agreements and the fees to be paid by the New Thematic Funds therefor, the New Thematic Funds and the Adviser may potentially benefit from their relationship with each other in other ways. The Trustees concluded that the success of the New Thematic Funds could attract other business to the Adviser or other Janus funds, and that the success of the Adviser could enhance the Adviser’s ability to serve the New Thematic Funds.
The Board, including the Independent Trustees, considered the following in respect of each New Thematic Fund:
The nature, extent and quality of services to be provided by the Adviser; personnel and operations of the Adviser.
The Board reviewed the services that the Adviser would provide to each New Thematic Fund. In connection with the investment advisory services to be provided by the Adviser, the Board noted the responsibilities that the Adviser would have as the Funds’ investment adviser, including: the overall supervisory responsibility for the general management and investment of each New Fund’s securities portfolio; providing oversight of the investment performance and processes and compliance with the New Thematic Fund’s investment objectives, policies and limitations; the implementation of the investment management program of each New Thematic Fund; the management of the day-to-day investment and reinvestment of the assets of each New Thematic Fund; determining daily baskets of deposit securities and cash components; executing portfolio security trades for purchases and redemptions of New Thematic Fund shares conducted on a cash-in-lieu basis; the responsibility for daily monitoring of tracking error and quarterly reporting to the Board; the review of brokerage matters; the oversight of general portfolio compliance with relevant law; and the implementation of Board directives as they relate to the New Thematic Funds.
The Board reviewed the Adviser’s experience, resources and strengths in managing other pooled investment vehicles, including the Adviser’s personnel. Based on its consideration and review of the foregoing information, the Board determined that each New Thematic Fund was likely to benefit from the nature, quality and extent of these services, as well as the Adviser’s ability to render such services based on their experience, personnel, operations and resources.
The Obesity ETF
Board Considerations Regarding Approval of Investment Advisory Agreements (unaudited)
Comparison of services to be rendered and fees to be paid to those under other investment advisory contracts, and the cost of the services to be provided and profits to be realized by the Adviser from the relationship with the New Thematic Funds; “fall-out” benefits.
The Board then compared both the services to be rendered and the proposed fees to be paid under other contracts of the Adviser, and under contracts of other investment advisers with respect to similar ETFs. In particular, the Board compared each New Thematic Fund’s proposed advisory fee and projected expense ratio to other investment companies considered to be in that New Thematic Fund’s peer group. The Board also received and considered information about the fee rates charged to other accounts and clients that are managed by the Adviser, including information about the differences in services provided to the non-registered investment company clients, noting that the New Thematic Funds had no other comparable equivalents at the Adviser. The Board also discussed the anticipated costs and projected profitability of the Adviser in connection with its serving as investment adviser to each New Thematic Fund, including operational costs. In addition, the Board discussed the entrepreneurial risk undertaken by the Adviser in creating the Trust. After comparing each New Thematic Fund’s proposed fees with those of other funds in each New Thematic Fund’s peer group, and in light of the nature, extent and quality of services proposed to be provided by the Adviser and the costs expected to be incurred by the Adviser in rendering those services, the Board concluded that the level of fees proposed to be paid to the Adviser with respect to the New Thematic Funds were fair and reasonable.
The Board also considered that the Adviser may experience reputational “fall-out” benefits based on the success of the New Thematic Funds, but that such benefits are not easily quantifiable.
The extent to which economies of scale would be realized as the New Thematic Funds grow and whether fee levels would reflect such economies of scale.
The Board next discussed potential economies of scale. Since the New Thematic Funds had not commenced operations, the eventual aggregate amount of assets was uncertain, and the Adviser was not able to provide the Board with specific information concerning the extent to which economies of scale could be realized as each New Thematic Fund grows, and whether fee levels would reflect such economies of scale, if any. The Board recognized the uncertainty in launching a new investment product and estimating future asset levels.
Investment performance of the New Thematic Funds and the Adviser.
Because each New Thematic Fund had not commenced operations and has an investment objective to track an index, the Board did not consider the investment performance of the New Thematic Fund or the Adviser.
Conclusion.
No single factor was determinative to the decision of the Board. Based on the foregoing and such other matters as were deemed relevant, the Board concluded that the proposed advisory fee rate and projected total expense ratio are reasonable in relation to the services to be provided by the Adviser to each New Thematic Fund, as well as the costs to be incurred and benefits to be gained by the Adviser in providing such services. The Board also found the proposed advisory fees to be reasonable in comparison to the fees charged by advisers to other comparable funds of similar actual or anticipated size. As a result, the Board concluded that the initial approval of the Investment Management Agreement was in the best interests of each New Thematic Fund.
After full consideration of the above factors, as well as other factors, the Trustees, with the Independent Trustees voting separately, determined to approve the Investment Management Agreement for each New Thematic Fund.
APPROVAL OF ADVISORY AGREEMENT DURING THE PERIOD WITH THE ADVISER POST-MERGER
On October 3, 2016, Janus Capital Group Inc. (“JCGI”), the direct parent of Janus Capital Management LLC, the investment adviser to the Funds (the “Adviser”), and Henderson Group plc (“Henderson”) announced that they had entered into an Agreement and Plan of Merger (“Merger Agreement”) relating to the business combination of Henderson and JCGI (the “Merger”). Pursuant to the Merger Agreement, a newly formed, direct wholly-owned subsidiary of Henderson will merge with and into JCGI, with JCGI as the surviving corporation and a direct wholly-owned subsidiary of Henderson. The Merger is expected to close in the second quarter of 2017, subject to requisite shareholder and regulatory approvals. The consummation of the Merger may be deemed to be an “assignment” (as defined in the Investment Company Act of 1940, as amended) of the advisory agreement between the Fund and Janus Capital. As a result, the consummation of the Merger will cause such advisory agreement to terminate automatically in accordance with its terms.
| | |
| | Janus Detroit Street Trust ½ 23 |
The Obesity ETF
Board Considerations Regarding Approval of Investment Advisory Agreements (unaudited)
The Trustees of the Trust, the majority of whom are Independent Trustees met on October 24, 2016, and at various times in advance of that date, which meeting was called for the purpose of considering the proposed investment management agreement (the “New Investment Management Agreement”) between the Adviser as a subsidiary of Henderson following the consummation of the Merger and the following series of the Trust: Janus Small Cap Growth Alpha ETF, Janus Small/Mid Cap Growth Alpha ETF, The Organics ETF, The Long-Term Care ETF, The Obesity ETF, The Health and Fitness ETF, Janus Velocity Tail Risk Hedged Large Cap ETF and Janus Velocity Volatility Hedged Large Cap ETF (each a “Fund” and collectively, the “Funds”). The Independent Trustees met with representatives of the Adviser to discuss the anticipated effects of the Merger. During these meetings, the Adviser indicated its belief that the Merger would not adversely affect the continued operation of the Funds or the capabilities of the investment advisory personnel who currently manage the Funds to continue to provide these and other services to the Funds at the current levels. The Adviser also indicated that it believed that the Merger could provide certain benefits to the Funds but that there could be no assurance as to any particular benefits that might result.
In the course of their consideration of the New Investment Management Agreement, the Trustees met in executive session and were advised by their independent counsel. In this regard, the Board, including the Independent Trustees, evaluated the terms of the New Investment Management Agreement and reviewed the duties and responsibilities of the Trustees in evaluating and approving such agreements. In considering approval of the Investment Management Agreement, the Board, including the Independent Trustees, reviewed the board materials (the “Materials”) and other information provided in advance of the meeting from counsel, the Adviser, as well as from Henderson, including: (i) a copy of the form of New Investment Management Agreement, with respect to the Adviser’s management of the assets of each Fund; (ii) information describing the nature, quality and extent of the services that will be provided to each Fund, and the fees that will be charged to the Funds; (iii) information concerning the Adviser’s and Henderson’s financial condition, business, operations, portfolio management teams and compliance programs; (iv) information describing each Fund’s anticipated advisory fee and operating expenses; (v) information concerning the anticipated structure of the post-Merger entity (“Janus Henderson”); and (v) a memorandum from counsel on the responsibilities of trustees in considering investment advisory arrangements under the 1940 Act. The Board also considered presentations made by, and discussions held with, representatives of the Adviser. The Board also noted the information previously provided to the Board during 2016 related to the initial approvals of each Fund.
During its review of this information, the Board focused on and analyzed the factors that the Board deemed relevant, including, among other matters:
| 1) | That the material terms regarding advisory services pursuant to the New Investment Management Agreement are substantially identical to the terms of the current investment management agreement with the Adviser; |
| 2) | That there is not expected to be any diminution in the nature, extent and quality of the services provided to the Funds and their shareholders by Janus Henderson, including compliance services; |
| 3) | The commitment of the Adviser to retain key personnel currently employed by the Adviser who provide services to the Funds; |
| 4) | That the manner in which each Fund’s assets are managed would not change as a result of the Merger, and that the same portfolio managers managing each Fund’s assets are expected to continue to do so after the Merger; |
| 5) | The terms and conditions of the New Investment Management Agreement, including the current advisory fee rates and operational expenses, are the same as the current fee rates under the current investment management agreement; |
| 6) | That each Fund’s expense ratios are not expected to increase as a result of the Merger or approval of the New Investment Management Agreement; |
| 7) | That the fees and expense ratios of the Funds relative to comparable investment companies continued to be reasonable given the quality of services provided; |
| 8) | The history, reputation, qualification and background of Henderson, as well as its financial condition; |
| 9) | The reputation, financial strength, corporate structure and capital resources of Henderson and its investment advisory subsidiaries and the anticipated financial strength of Janus Henderson; |
| 10) | The long-term business goals of the Adviser and Henderson with respect to the Funds; |
The Obesity ETF
Board Considerations Regarding Approval of Investment Advisory Agreements (unaudited)
| 11) | That, pursuant to the terms of the Merger, Henderson has acknowledged the Advisor’s reliance upon the benefits and protections provided by Section 15(f) and has agreed not to take, and to cause its affiliates not to take, any action that would have the effect, directly or indirectly, of causing the requirements of any of the provisions of Section 15(f) not to be met in respect of the Merger; |
| 12) | That shareholders would not bear any costs in connection with the Merger, that the Adviser will bear the costs, fees and expenses incurred by the Funds in connection with the Proxy Statement, including all expenses in connection with the solicitation of proxies, the fees and expenses of attorneys relating to the Merger and Proxy Statement, and other fees and expenses incurred by the Funds, if any, in connection with the Merger; |
| 13) | The Adviser’s commitment to provide resources to the Funds and the potential for increased distribution capabilities as a result of the Merger, which have the potential to result in long-term economies of scale; and |
| 14) | That the Adviser and Henderson would derive benefits from the Merger and that, as a result, they have a different financial interest in the matters that were being considered than do Fund shareholders. |
In connection with their consideration of the New Investment Advisory Agreement on October 24 2016, the Board noted that, in February 2016, April 2016 and October 2016, the Board had initially approved the respective Funds’ current investment advisory agreements. The Trustees considered that, in connection with the foregoing approvals, the Board had determined that the Adviser had the capabilities, resources and personnel necessary to provide the services to each Fund required under the current investment advisory agreement, and the advisory fee rates paid by each Fund, taking into account the unitary fees charged to the Funds, represented reasonable compensation to the Adviser in light of the services provided. The Trustees noted that the Board also considered the cost to the Adviser of providing those services, potential economies of scale as each Fund’s assets grow, the fees and expenses paid by other comparable funds, and such other matters as the Board had considered relevant in the exercise of their reasonable business judgment.
To inform their consideration of the New Agreement, the Independent Trustees received and considered responses by the Adviser and Henderson to inquiries requesting information regarding: Henderson’s structure, operations, financial resources and key personnel; the material aspects of the Merger, the proposed operations of Janus Henderson and its compliance program, code of ethics, trading policies and key management and investment personnel, including each Fund’s portfolio managers; and anticipated changes to the management or operations of the Board and the Funds, including, if applicable, any changes to the Funds’ service providers, advisory fees and expense structure.
In considering the information and materials described above, the Independent Trustees received assistance from, and met separately with, independent legal counsel and were provided with a written description of their statutory responsibilities and the legal standards that are applicable to approvals of advisory agreements. The Board did not identify any particular information that was most relevant to its consideration to approve the New Investment Management Agreement for each Fund and each Trustee may have afforded different weight to the various factors. Legal counsel to the Independent Trustees provided the Board with a memorandum regarding its responsibilities pertaining to the approval of the New Agreement. In determining whether to approve the New Investment Management Agreement, the Board considered the best interests of each Fund separately.
In voting to approve the New Investment Management Agreement, the Board considered the overall fairness of the New Investment Management Agreement and factors it deemed relevant with respect to each Fund, including, but not limited to: (i) the nature, extent and quality of the services to be provided by Janus Henderson, (ii) that the investment personnel who currently manage the Funds would continue to manage the Funds as employees of Janus Henderson, (iii) that the fees and expenses of the Funds after the Transaction are expected to remain the same, (iv) the projected profitability of the Funds to Janus Henderson and its affiliates; (v) whether the projected economies of scale would be realized as the Funds grow and whether any breakpoints are appropriate at certain asset levels and (vi) other benefits that may accrue Janus Henderson from its relationship with the Funds. The Board also considered that the Transaction might not be consummated if the New Investment Management Agreement was not approved by the Board and the shareholders of each Fund.
Although not meant to be all-inclusive, set forth below is a description of the information and certain factors that were considered by the Board, including the Independent Trustees in deciding to approve the New Investment Management Agreement in respect of each Fund:
The nature, extent and quality of services to be provided by Janus Henderson; personnel and operations of Janus Henderson.
In considering the nature, extent and quality of the services to be provided by Janus Henderson under the New Investment Management Agreement, the Board considered that the terms of the New Investment Management Agreement are
| | |
| | Janus Detroit Street Trust ½ 25 |
The Obesity ETF
Board Considerations Regarding Approval of Investment Advisory Agreements (unaudited)
substantially similar to the terms of the current investment management agreement. The Board considered that the level of service and manner in which each Fund’s assets are managed were expected to remain the same.
The Board considered that, for a period of time after closing, the Adviser expects that the operations of Janus Henderson, as they relate to the Funds, would be the same as those of the Adviser. The Board considered that the Adviser’s key personnel who provide services to the Funds are expected to provide those same services after the Merger. The Board also noted that the Merger is not expected to result in any change in the structure or operations of the Funds and that the Adviser does not currently anticipate any immediate changes to the Funds’ key service providers.
In evaluating Janus Henderson, the Board considered the history, background, reputation and qualification of the Adviser and Henderson, as well as their personnel and Henderson’s financial condition. The Board considered that Henderson is a global asset management firm that was established in 1934, and that it has a long history of asset management around the world. The Board also considered Henderson’s capabilities, experience, corporate structure and capital resources, as well as the Adviser’s long-term business goals with respect to the Janus Henderson Merger and the Funds.
Based on its consideration and review of the foregoing information, the Board determined that each Fund was likely to benefit from the nature, quality and extent of these services, as well as the Janus Henderson’s ability to render such services based on their experience, personnel, operations and resources.
Cost of the services to be provided and profits to be realized by Janus Henderson from the relationship with the Funds; “fall-out” benefits.
The Board noted that the unitary fee currently in place for each Fund will remain in place and unchanged under the New Investment Management Agreement.
The Board also discussed the anticipated costs and projected profitability of Janus Henderson in connection with its serving as investment adviser to each Fund, including operational costs. In addition, the Board discussed that the Funds’ expenses were not expected to increase materially as a result of the Merger. The Board also noted that Henderson does not currently provide any investment management services to other exchange traded funds. In light of the nature, extent and quality of services proposed to be provided by Janus Henderson and the costs expected to be incurred by Janus Henderson in rendering those services, the Board concluded that the level of fees proposed to be paid to Janus Henderson with respect to the Funds were fair and reasonable.
The extent to which economies of scale would be realized as the Funds grow and whether fee levels would reflect such economies of scale.
The Board next discussed potential economies of scale. The Board discussed the promised continued commitment to expand the distribution of Fund shares, and the potential for increased distribution capabilities as a result of the Merger, which have the potential to result in long-term economies of scale.
The Board also noted that since the Trust is newly formed, the eventual aggregate amount of assets was uncertain, and therefore specific information concerning the extent to which economies of scale would be realized as each Fund grows and whether fee levels would reflect such economies of scale, if any, was difficult to determine. The Board recognized the uncertainty in launching new investment products and estimating future asset levels.
Other Benefits to Janus Henderson.
The Board considered other potential benefits that may accrue to Janus Henderson as a result of its relationship with the Funds, which include reputational benefits that may enhance Janus Henderson’s ability to gain business opportunities from other clients.
Conclusion.
No single factor was determinative to the decision of the Board. Based on, but not limited to, the foregoing, and such other matters as were deemed relevant, the Board concluded that the New Investment Management Agreement was fair and reasonable in light of the services to be performed, fees, expenses and such other matters as the Board considered relevant in the exercise of its business judgment.
After full consideration of the above factors, as well as other factors, the Trustees, with the Independent Trustees voting separately, determined to approve the New Investment Management Agreement with respect to the Funds.
The Obesity ETF
Shareholder Meeting (unaudited)
A Special Meeting of Shareholders of the Fund was held on March 17, 2017. At the meeting, the following matter was voted on and approved by the Shareholders. Each whole or fractional vote reported represents one whole or fractional dollar of net asset value held on the record date for the meeting. The results of the Special Meeting of Shareholders are noted below.
Proposal 1
To approve a new investment advisory agreement.
| | | | | | | | | | |
| | | | Number of Votes ($) |
| Record Date Votes ($) | | | Affirmative | | Against/Withhold | | Abstain | | Broker Non-Votes |
| | 2,257,000.000 | | | 1,121,300.170 | | 0.000 | | 32,162.250 | | 0.000 |
| | |
| | Janus Detroit Street Trust ½ 27 |
The Obesity ETF
Trustees and Officers (unaudited)
The Fund’s Statement of Additional Information includes additional information about the Trustees and officers and is available, without charge, by calling 1-877-335-2687.
The following are the Trustees and officers of the Trust, together with a brief description of their principal occupations during the last five years (principal occupations for certain Trustees may include periods over five years).
Each Trustee has served in that capacity since he or she was originally elected or appointed. The Trustees do not serve a specified term of office. Each Trustee will hold office until the termination of the Trust or his or her earlier death, resignation, retirement, incapacity, or removal. Under the Fund’s Governance Procedures and Guidelines, the policy is for Trustees to retire no later than the end of the calendar year in which the Trustee turns 75. The Trustees review the Fund’s Governance Procedures and Guidelines from time to time and may make changes they deem appropriate. The Fund’s Nominating and Governance Committee will consider nominees for the position of Trustee recommended by shareholders. Shareholders may submit the name of a candidate for consideration by the Committee by submitting their recommendations to the Trust’s Secretary. Each Trustee is currently a Trustee of one other registered investment company advised by Janus Capital: Clayton Street Trust. Collectively, these two registered investment companies consist of 12 series or funds.
The Trust’s officers are elected annually by the Trustees for a one-year term. Certain officers also serve as officers of Clayton Street Trust. Certain officers of the Fund may also be officers and/or directors of Janus Capital. Fund officers receive no compensation from the Fund, except for the Fund’s Chief Compliance Officer, as authorized by the Trustees.
| | | | | | | | | | | | | | | | | | |
| TRUSTEES | | | | | | | | | | | | | | |
| Name, Address, and Age | | Positions Held
with the Trust | | | Length of
Time Served | | | Principal Occupations
During the Past Five Years | | Number of
Portfolios/Funds
in Fund Complex
Overseen by
Trustee | | | Other Directorships Held by Trustee During the Past Five Years | |
Independent Trustees | | | | | | | | | | | | | | | | | | |
Clifford J. Weber 151 Detroit Street Denver, CO 80206 DOB: 1963 | |
| Chairman
Trustee |
| |
| 2/16-Present
2/16-Present |
| | Owner, Financial Products Consulting Group LLC (consulting services to financial institutions) (since 2015). Formerly, Executive Vice President of Global Index and Exchange- Traded Products, NYSE Market, Inc., a subsidiary of Intercontinental Exchange (ETF/ETP listing exchange) (2013-2015) and Executive Vice President and Head of Strategy and Product Development, NYSE Liffe U.S., a division of NYSE Euronext (U.S. futures exchange) (2008-2013). | | | 12 | | |
| Independent Trustee,
Clough Funds Trust
(investment company)
(since 2015);
Chairman, Clough
Funds Trust
(investment company)
(since 2017);
Independent Trustee,
Clough Dividend and
Income Fund (closed-
end fund) (since
2017); Independent
Trustee, Clough
Global Opportunities
Fund (closed-end
fund) (since 2017);
Independent Trustee,
Clough Global Equity
Fund (closed-end
fund) (since 2017);
Independent Trustee,
Elevation ETF Trust
(since 2016);
Chairman, Elevation
ETF Trust (since
2017). |
|
The Obesity ETF
Trustees and Officers (unaudited)
| | | | | | | | | | | | | | | | | | |
| TRUSTEES | | | | | | | | | | | | | | |
| Name, Address, and Age | | Positions Held
with the Trust | | | Length of
Time Served | | | Principal Occupations
During the Past Five Years | | Number of
Portfolios/Funds
in Fund Complex
Overseen by
Trustee | | | Other Directorships Held by Trustee During the Past Five Years | |
Maureen T. Upton 151 Detroit Street Denver, CO 80206 DOB: 1965 | | | Trustee | | | | 2/16-Present | | | Principal, Maureen Upton Ltd. (consulting services to developers of major infrastructure projects and investors) (since 2017). Formerly, Principal Consultant, SRK Consulting (U.S.), Inc. (consulting services to global mining, energy and water resource industries) (2015-2017) and Founder and Principal, Resource Initiatives LLC (sustainability consulting firm) (2006-2015). | | | 12 | | |
| Director, Denver Metro
Leadership Foundation
(non-profit organization)
(2012-2014). |
|
| | | | | |
Jeffrey B. Weeden 151 Detroit Street Denver, CO 80206 DOB: 1956 | | | Trustee | | | | 2/16-Present | | | Senior Advisor, BayBoston Capital LP (investment fund in banks and bank holdings companies) (since 2015). Management Advisor, BoxCast, Inc. (technology start-up company) (2014-2017). Formerly Senior Executive Vice President and Chief Financial Officer, KeyCorp (financial services) (2002-2013). | | | 12 | | |
| Director, State
Farm Bank (banking)
(since 2014). |
|
Interested Trustee | | | | | | | | | | | | | | | | | | |
Michael Drew Elder** 151 Detroit Street Denver, CO 80206 DOB: 1970 | | | Trustee | | | | 8/15-Present | | | Executive Vice President and Head of U.S. Intermediary Distribution, Janus Capital (since 2014) and President, Janus Distributors LLC (broker- dealer) (since 2014). Formerly, Senior Vice President, Janus Capital (2007-2014). | | | 12 | | |
| Director, Perkins
Investment
Management LLC
(since 2014). |
|
| ** | Michael Drew Elder is an Interested Trustee because of his employment with Janus Capital. |
| | |
| | Janus Detroit Street Trust ½ 29 |
The Obesity ETF
Trustees and Officers (unaudited)
| | | | | | |
| OFFICERS | | | | | | |
| Name, Address, and Age | | Positions Held with the Trust | | Term of Office* and
Length of Time Served | | Principal Occupations
During the Past Five Years |
Bruce L. Koepfgen 151 Detroit Street Denver, CO 80206 DOB: 1952 | | President and Chief Executive Officer | | 2/16-Present | | Head of North America for Janus Henderson Investors and Janus Capital Management (since 2017); Executive Vice President and Director of Janus International Holding LLC (since 2011); Executive Vice President of Janus Distributors LLC (since 2011); Vice President and Director of INTECH Investment Management LLC (since 2011); Executive Vice President and Director of Perkins Investment Management LLC (since 2011); and Executive Vice President and Director of Janus Management Holdings Corporation (since 2011). Formerly, President of Janus Capital Group Inc. and Janus Capital Management LLC (2013-2017); Executive Vice President of Janus Services LLC (2011-2015), Janus Capital Group Inc. and Janus Capital Management LLC (2011-2013); and Chief Financial Officer of Janus Capital Group Inc., Janus Capital Management LLC, Janus Distributors LLC, Janus Management Holdings Corporation, and Janus Services LLC (2011-2013). |
| | | |
Susan K. Wold 151 Detroit Street Denver, CO 80206 DOB: 1960 | | Vice President, Chief Compliance Officer, and Anti-Money Laundering Officer | | 10/17-Present; Vice President, Provisional Chief Compliance Officer, and Anti-Money Laundering Officer (9/17-10/17) | | Senior Vice President and Head of Compliance, North America for Janus Henderson (since September 2017); Formerly, Vice President, Head of Global Corporate Compliance, and Chief Compliance Officer for Janus Capital Management (May 2017 – September 2017); Vice President, Compliance at Janus Capital Group and Janus Capital Management (2005 – 2017). |
| | | |
Jesper Nergaard 151 Detroit Street Denver, CO 80206 DOB: 1962 | | Vice President, Chief Financial Officer, Treasurer, and Principal Accounting Officer | | 2/16-Present | | Vice President of Janus Capital and Janus Services LLC. |
| | | |
Kathryn L. Santoro 151 Detroit Street Denver, CO 80206 DOB: 1973 | | Vice President, Secretary and Chief Legal Counsel | | 1/17-Present | | Vice President of Janus Capital and Janus Services LLC (since 2016). Formerly, Vice President and Associate Counsel of Curian Capital, LLC and Curian Clearing LLC (2013- 2016); and General Counsel and Secretary (2011-2012) and Vice President (2009-2012) of Old Mutual Capital, Inc. |
| * | Officers are elected at least annually by the Trustees for a one-year term and may also be elected from time to time by the Trustees for an interim period. |
The Obesity ETF
Notes
| | |
| | Janus Detroit Street Trust ½ 31 |
The Obesity ETF
Notes
The Obesity ETF
Notes
| | |
| | Janus Detroit Street Trust ½ 33 |
Knowledge. Shared
At Janus Henderson, we believe in the sharing of expert insight for better investment and business decisions. We call this ethos Knowledge. Shared.
Learn more by visiting janushenderson.com.
This report is submitted for the general information of shareholders of the Fund. It is not an offer or solicitation for the Fund and is not authorized for distribution to prospective investors unless preceded or accompanied by an effective prospectus.
Janus Henderson is a trademark of Janus Henderson Investors. © Janus Henderson Investors. The name Janus Henderson Investors includes HGI Group Limited, Henderson Global Investors (Brand Management) Sarl and Janus International Holding LLC.
Janus Capital Management LLC is the investment adviser and ALPS Distributors, Inc. is the distributor. ALPS is not affiliated with Janus Henderson or any of its subsidiaries.
ANNUAL REPORT
October 31, 2017
The Organics ETF
Janus Detroit Street Trust

Table of Contents
The Organics ETF (unaudited)
INVESTMENT OBJECTIVE
The Organics ETF seeks investment results that correspond generally to the performance, before fees and expenses, of an index which is designed to track the performance of companies globally that are positioned to profit from increasing demand for organic products, including companies which service, produce, distribute, market or sell organic food, beverages, cosmetics, supplements, or packaging.
PERFORMANCE OVERVIEW
| • | | Stocks rallied after the November U.S. presidential election on the expectation the new administration would champion pro-growth initiatives that would benefit the U.S. economy. Signs of synchronized economic growth in major world economies and corporate earnings strength were also supportive of stocks. During the period, the market experienced some volatility as investors questioned whether Congress would be able to successfully implement the administration’s proposed policies. However, stocks delivered strong returns during the 12-month period. The underlying index outperformed the broader market, with the basic materials sector delivering the strongest returns. |
| • | | During the period, The Organics ETF (ORG) returned 27.11% (based on NAV); its primary benchmark, the Solactive Organics Index, returned 27.87%, and its secondary benchmark, the MSCI All Country World Index, returned 23.20%. |
| • | | ORG seeks investment results that correspond generally, before fees and expenses, to the performance of its primary benchmark. It seeks exposure to companies globally that can capitalize on consumers’ increasing desire for naturally-derived food and personal care items, including: companies which service, produce, distribute, market or sell organic food, beverage, cosmetics, supplements, or packaging. |
| | |
| | Janus Detroit Street Trust ½ 1 |
The Organics ETF (unaudited)
Fund At A Glance
October 31, 2017
| | | | |
| 5 Largest Equity Holdings – (% of Net Assets) | |
Chr Hansen Holding A/S | | | | |
Chemicals | | | 20.9% | |
Hain Celestial Group, Inc. | | | | |
Food Products | | | 18.0% | |
Blackmores, Ltd. | | | | |
Personal Products | | | 9.1% | |
Bellamy’s Australia, Ltd. | | | | |
Food Products | | | 6.5% | |
Wessanen | | | | |
Food Products | | | 6.4% | |
| | | | |
| | | 60.9% | |
Holdings are subject to change without notice.
| | | | |
| Sector Allocation – (% of Net Assets) | | | |
Consumer, Non-cyclical | | | 103.7% | |
Basic Materials | | | 4.1% | |
Investment Companies | | | 3.0% | |
| | | | |
| | | 110.8% | |
The Organics ETF (unaudited)
Performance
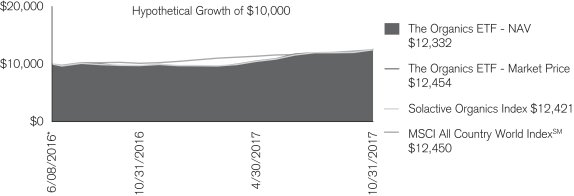
| | | | |
| Average Annual Total Return for the periods ended October 31, 2017 |
| | | One Year | | Since
Inception* |
The Organics ETF – NAV | | 27.11% | | 16.18% |
The Organics ETF – Market Price | | 28.68% | | 17.01% |
Solactive Organics Index | | 27.87% | | 16.79% |
MSCI All Country World IndexSM | | 23.20% | | 16.98% |
| Total | annual expense ratio (estimated) as stated in the February 28, 2017 prospectus: 0.50%. |
Returns quoted are past performance and do not guarantee future results; current performance may be lower or higher. Investment returns and principal value will vary; there may be a gain or loss when shares are sold. For the most recent month-end performance call 800.668.0434 or visit janushenderson.com/performance.
Shares of ETFs are bought and sold at market price (not NAV) and are not individually redeemed from the Fund. Market returns are based upon the midpoint of the bid/ask spread at 4:00 p.m. Eastern time (when NAV is normally determined for most ETFs), and do not represent the returns you would receive if you traded shares at other times. Ordinary brokerage commissions apply and will reduce returns.
ETF shares are not individually redeemable and owners of the shares may acquire those shares from the Fund and tender those shares for redemption to the Fund in Creation Units only.
Investing involves risk, including the possible loss of principal and fluctuation of value.
Performance depends on that of the underlying index.
High absolute short-term performance is not typical and may not be achieved in the future. Such results should not be the sole basis for evaluating material facts in making an investment decision.
See the prospectus for a more complete discussion of objectives, risks and expenses.
Returns include reinvestment of dividends and capital gains. Returns greater than one year are annualized. Returns do not reflect the deduction of taxes that a shareholder would pay on Fund distributions or redemptions of Fund shares.
See Financial Highlights for actual expense ratios during the reporting period.
There is no assurance the stated objective(s) will be met.
See Notes to Schedule of Investments and Other Information for index definitions.
Index performance does not reflect the expenses of managing a portfolio as an index is unmanaged and not available for direct investment.
Solactive Indices were created by and are maintained by, Solactive AG. For detailed information on how stocks are selected for inclusion in the Underlying Index, see solactive.com. Solactive is not affiliated with Janus Henderson or ALPS.
Effective February 28, 2017 Edward Tom, Benjamin Wang and Scott Weiner are Co-Portfolio Managers of the Fund.
| * | Fund commenced operations on June 8, 2016. |
| | |
| | Janus Detroit Street Trust ½ 3 |
The Organics ETF (unaudited)
Disclosure of Fund Expenses
As a shareholder of the Fund, you incur two types of costs: (1) transaction costs, which may include creation and redemption fees or brokerage charges and (2) ongoing costs, including management fees and other Fund expenses. This example is intended to help you understand your ongoing costs (in dollars) of investing in the Fund and to compare these costs with the ongoing costs of investing in other ETFs. To do so, compare this 5% hypothetical example with the 5% hypothetical examples that appear in the shareholder reports of the other funds. The example is based upon an investment of $1,000 invested at the beginning of the period and held for the six-months indicated, unless noted otherwise in the table and footnotes below.
Actual Expenses
The information in the table under the heading “Actual” provides information about actual account values and actual expenses. You may use the information in these columns, together with the amount you invested, to estimate the expenses that you paid over the period. Simply divide your account value by $1,000 (for example, an $8,600 account value divided by $1,000 = 8.6), then multiply the result by the number under the heading entitled “Expenses Paid During Period” to estimate the expenses you paid on your account during the period.
Hypothetical Example for Comparison Purposes
The information in the table under the heading “Hypothetical (5% return before expenses)” provides information about hypothetical account values and hypothetical expenses based upon the Fund’s actual expense ratio and an assumed rate of return of 5% per year before expenses, which is not the Fund’s actual return. The hypothetical account values and expenses may not be used to determine the actual ending account balance or expenses you paid for the period. You may use this information to compare the ongoing costs of investing in the Fund and other funds. To do so, compare this 5% hypothetical example with the 5% hypothetical examples that appear in the shareholder reports of the other funds. Additionally, for an analysis of the fees associated with an investment or other similar funds, please visit www.finra.org/fundanalyzer.
Please note that the expenses shown in the table are meant to highlight your ongoing costs only and do not reflect any transaction costs, such as creation and redemption fees, or brokerage charges. These fees are fully described in the Fund’s prospectus. Therefore, the hypothetical examples are useful in comparing ongoing costs only, and will not help you determine the relative total costs of owning different funds. In addition, if these transaction costs were included, your costs would have been higher.
| | | | | | | | | | | | | | | | | | | | | | | | |
Actual | | | Hypothetical
(5% return before expenses) | | | | |
Beginning
Account
Value
(5/1/17) | | Ending
Account
Value
(10/31/2017) | | | Expenses
Paid During
Period
(5/1/17 - 10/31/2017)† | | | Beginning
Account
Value
(5/1/17) | | | Ending
Account
Value
(10/31/2017) | | | Expenses
Paid During
Period
(5/1/17 - 10/31/2017)† | | | Net Annualized
Expense Ratio
(5/1/17 - 10/31/2017) | |
| $1,000.00 | | $ | 1,190.60 | | | $ | 2.76 | | | $ | 1,000.00 | | | $ | 1,022.68 | | | $ | 2.55 | | | | 0.50% | |
| † | Expenses Paid During Period is equal to the Net Annualized Expense Ratio multiplied by the average account value over the period, multiplied by 184/365 (to reflect the one-half year period). |
The Organics ETF
Report of Independent Registered Public Accounting Firm
To the Board of Trustees of Janus Detroit Street Trust and Shareholders of The Organics ETF:
In our opinion, the accompanying statement of assets and liabilities, including the schedule of investments, and the related statements of operations and of changes in net assets and the financial highlights present fairly, in all material respects, the financial position of The Organics ETF (one of the funds constituting Janus Detroit Street Trust, hereafter referred to as the “Fund”) as of October 31, 2017, the results of its operations for the year then ended, and the changes in its net assets and financial highlights for the year then ended and for the period from June 8, 2016 (commencement of operations) through October 31, 2016, in conformity with accounting principles generally accepted in the United States of America. These financial statements and financial highlights (hereafter referred to as “financial statements”) are the responsibility of the Fund’s management. Our responsibility is to express an opinion on these financial statements based on our audits. We conducted our audits of these financial statements in accordance with the standards of the Public Company Accounting Oversight Board (United States). Those standards require that we plan and perform the audit to obtain reasonable assurance about whether the financial statements are free of material misstatement. An audit includes examining, on a test basis, evidence supporting the amounts and disclosures in the financial statements, assessing the accounting principles used and significant estimates made by management, and evaluating the overall financial statement presentation. We believe that our audits, which included confirmation of securities as of October 31, 2017 by correspondence with the custodian, brokers and transfer agent, provide a reasonable basis for our opinion.

Denver, Colorado
December 20, 2017
| | |
| | Janus Detroit Street Trust ½ 5 |
The Organics ETF
Schedule of Investments
October 31, 2017
| | | | | | | | |
| | | Shares | | | Value | |
| Common Stocks – 107.8% | | | | | | |
| Chemicals – 25.0% | | | | | | |
Century Sunshine Group Holdings, Ltd.* | | | 2,660,000 | | | | $84,555 | |
Chr Hansen Holding A/S | | | 29,721 | | | | 2,600,983 | |
Treatt PLC | | | 74,150 | | | | 427,595 | |
| | | | | | | | |
| | | | | | | 3,113,133 | |
| Food & Staples Retailing – 11.7% | | | | | | |
Natural Grocers by Vitamin Cottage, Inc.* | | | 14,275 | | | | 70,090 | |
Sprouts Farmers Market, Inc.* | | | 30,749 | | | | 568,549 | |
United Natural Foods, Inc.* | | | 14,167 | | | | 549,255 | |
Village Super Market, Inc. - Class A | | | 11,031 | | | | 264,634 | |
| | | | | | | | |
| | | | | | | 1,452,528 | |
| Food Products – 54.4% | | | | | | |
Amira Nature Foods, Ltd.*,# | | | 23,089 | | | | 138,303 | |
Amplify Snack Brands, Inc.*,# | | | 26,831 | | | | 171,450 | |
Ariake Japan Co., Ltd. | | | 9,900 | | | | 755,373 | |
Bellamy’s Australia, Ltd.* | | | 86,999 | | | | 803,146 | |
China Shengmu Organic Milk, Ltd.* | | | 1,692,000 | | | | 290,610 | |
Freedom Foods Group, Ltd. | | | 104,088 | | | | 374,306 | |
Hain Celestial Group, Inc.* | | | 62,417 | | | | 2,248,260 | |
Ichitan Group PCL* | | | 424,300 | | | | 107,927 | |
Rock Field Co., Ltd. | | | 29,600 | | | | 519,166 | |
SunOpta, Inc.* | | | 61,047 | | | | 570,790 | |
Wessanen | | | 42,216 | | | | 801,872 | |
| | | | | | | | |
| | | | | | | 6,781,203 | |
| Personal Products – 11.1% | | | | | | |
Blackmores, Ltd. | | | 9,290 | | | | 1,137,703 | |
HS Vital Co., Ltd.* | | | 12,247 | | | | 67,119 | |
Nature’s Sunshine Products, Inc. | | | 11,661 | | | | 115,444 | |
Sagittarius Life Science Corp. | | | 27,206 | | | | 62,423 | |
| | | | | | | | |
| | | | | | | 1,382,689 | |
| Specialty Retail – 5.6% | | | | | | |
DavidsTea, Inc.*,# | | | 18,583 | | | | 78,978 | |
L’Occitane International SA | | | 271,500 | | | | 515,731 | |
Naturhouse Health SAU | | | 21,656 | | | | 105,453 | |
| | | | | | | | |
| | | | | | | | 700,162 | |
Total Common Stocks (cost $12,673,639) | | | | | | | 13,429,715 | |
| Investment Companies – 3.0% | | | | | | |
| Investments Purchased with Cash Collateral from Securities Lending – 1.9% | | | | | | |
Janus Cash Collateral Fund LLC, 1.0003%ºº,£ | | | 238,150 | | | | 238,150 | |
| Money Markets – 1.1% | | | | | | |
State Street Institutional U.S. Government Money Market Fund, 0.9659%ºº | | | 143,632 | | | | 143,632 | |
Total Investment Companies (total cost $381,782) | | | | | | | 381,782 | |
Total Investments (total cost $13,055,421) – 110.8% | | | | | | | 13,811,497 | |
Liabilities, net of Cash, Receivables and Other Assets – (10.8%) | | | | | | | (1,348,066) | |
Net Assets - 100% | | | | | | | $12,463,431 | |
See Notes to Schedule of Investments and Other Information and Notes to Financial Statements.
The Organics ETF
Schedule of Investments
October 31, 2017
Summary of Investments by Country – (Long Positions) (unaudited)
| | | | | | | | |
| Country | | Value | | | % of
Investment
Securities | |
United States | | | $4,369,464 | | | | 31.6% | |
Denmark | | | 2,600,983 | | | | 18.8 | |
Australia | | | 2,315,155 | | | | 16.8 | |
Japan | | | 1,274,539 | | | | 9.2 | |
Netherlands | | | 801,872 | | | | 5.8 | |
Canada | | | 649,768 | | | | 4.7 | |
Luxembourg | | | 515,731 | | | | 3.7 | |
United Kingdom | | | 427,595 | | | | 3.1 | |
China | | | 290,610 | | | | 2.1 | |
United Arab Emirates | | | 138,303 | | | | 1.0 | |
Thailand | | | 107,927 | | | | 0.8 | |
Spain | | | 105,453 | | | | 0.8 | |
Hong Kong | | | 84,555 | | | | 0.6 | |
South Korea | | | 67,119 | | | | 0.5 | |
Taiwan, Province Of China | | | 62,423 | | | | 0.5 | |
Total | | | $13,811,497 | | | | 100.0% | |
Schedules of Affiliated Investments – (% of Net Assets)
| | | | | | | | | | | | | | | | |
| | | Dividend Income | | | Realized
Gain/(Loss) | | | Change in
Unrealized
Appreciation/
(Depreciation) | | | Value at
10/31/17 | |
Investment Companies – 1.9% | | | | | | | | | | | | | | | | |
Investments Purchased with Cash Collateral from Securities Lending – 1.9% | | | | | | | | | | | | | | | | |
Janus Cash Collateral Fund LLC, 1.0003%ºº | | $ | 16,237 | D | | $ | — | | | $ | — | | | $ | 238,150 | |
| | | | |
| | | Share Balance
at 10/31/16 | | | Purchases | | | Sales | | | Share Balance
at 10/31/17 | |
Investment Companies – 1.9% | | | | | | | | | | | | | | | | |
Investments Purchased with Cash Collateral from Securities Lending – 1.9% | | | | | | | | | | | | | | | | |
Janus Cash Collateral Fund LLC, 1.0003%ºº | | | — | | | | 1,571,318 | | | | (1,333,168) | | | | 238,150 | |
See Notes to Schedule of Investments and Other Information and Notes to Financial Statements.
| | |
| | Janus Detroit Street Trust ½ 7 |
The Organics ETF
Notes to Schedule of Investments and Other Information
| | |
| Solactive Organics Index | | Solactive Organics Index is designed to track the performance of companies globally that are positioned to profit from increasing demand for organic products, including companies which service, produce, distribute, market or sell organic food, beverage, cosmetics, supplements, or packaging. |
| |
| MSCI All Country World IndexSM | | MSCI All Country World IndexSM reflects the equity market performance of global developed and emerging markets. |
| |
| LLC | | Limited Liability Company |
| |
| PCL | | Public Company Limited |
| |
| PLC | | Public Limited Company |
| * | Non-income producing security. |
| # | Loaned security; a portion of the security is on loan at October 31, 2017. |
| ºº | Rate shown is the 7-day yield as of October 31, 2017. |
| £ | The Fund may invest in certain securities that are considered affiliated companies. As defined by the Investment Company Act of 1940, as amended, an affiliated company is one in which the Fund owns 5% or more of the outstanding voting securities, or a company which is under common ownership or control. |
| D | Net of income paid to the securities lending agent and rebates paid to the borrowing counterparties. |
The following is a summary of the inputs that were used to value the Fund’s investments in securities and other financial instruments as of October 31, 2017. See Notes to Financial Statements for more information.
Valuation Inputs Summary
| | | | | | | | | | | | |
| | | Level 1 -
Quoted Prices | | | Level 2 -
Other Significant
Observable Inputs | | | Level 3 -
Significant
Unobservable Inputs | |
Assets | | | | | | | | | | | | |
Investments in Securities: | | | | | | | | | | | | |
Common Stocks | | $ | 13,429,715 | | | $ | — | | | $ | — | |
Investment Companies | | | 143,632 | | | | 238,150 | | | | — | |
| | | | |
Total Assets | | $ | 13,573,347 | | | $ | 238,150 | | | $ | — | |
The Organics ETF
Statement of Assets and Liabilities
October 31, 2017
| | | | |
Assets: | | | | |
Unaffiliated investments, at value(1)(2) | | $ | 13,573,347 | |
Affiliated investments, at value(3) | | | 238,150 | |
Cash denominated in foreign currency(4) | | | 3 | |
Receivables: | | | | |
Investments sold | | | 1,262,133 | |
Dividends | | | 5,987 | |
Affiliated securities lending income, net | | | 2,698 | |
Total Assets | | | 15,082,318 | |
Liabilities: | | | | |
Collateral on securities loaned (Note 2) | | | 238,150 | |
Payables: | | | | |
Investments purchased | | | 2,375,698 | |
Management fees | | | 5,039 | |
Total Liabilities | | | 2,618,887 | |
Net Assets | | $ | 12,463,431 | |
Net Assets Consists of: | | | | |
Capital (par value and paid-in surplus) | | $ | 11,771,190 | |
Undistributed net investment income/(loss) | | | 31,033 | |
Undistributed net realized gain/(loss) from investments and foreign currency transactions | | | (94,891) | |
Unrealized net appreciation/(depreciation) on investments and foreign currency translations | | | 756,099 | |
Total Net Assets | | $ | 12,463,431 | |
Net Assets | | $ | 12,463,431 | |
Shares outstanding, $0.001 Par Value (unlimited shares authorized) | | | 400,001 | |
Net Asset Value Per Share | | $ | 31.16 | |
| (1) | Includes cost of $12,817,271. |
| (2) | Includes $227,391 of securities on loan. See Note 2 in Notes to Financial Statements. |
| (3) | Includes cost of $238,150. |
See Notes to Financial Statements.
| | |
| | Janus Detroit Street Trust ½ 9 |
The Organics ETF
Statement of Operations
For the year ended October 31, 2017
| | | | |
Investment Income: | | | | |
Dividends | | $ | 72,661 | |
Affiliated securities lending income, net | | | 16,237 | |
Foreign tax withheld | | | (7,142) | |
Total Investment Income | | | 81,756 | |
Expenses: | | | | |
Management Fees | | | 26,569 | |
Total Expenses | | | 26,569 | |
Net Investment Income/(Loss) | | | 55,187 | |
Net Realized Gain/(Loss) on Investments: | | | | |
Investments and foreign currency transactions | | | 479,486 | |
Total Net Realized Gain/(Loss) on Investments | | | 479,486 | |
Change in Unrealized Net Appreciation/Depreciation: | | | | |
Investments and foreign currency translations | | | 836,970 | |
Total Change in Unrealized Net Appreciation/Depreciation | | | 836,970 | |
Net Increase/(Decrease) in Net Assets Resulting from Operations | | $ | 1,371,643 | |
See Notes to Financial Statements.
The Organics ETF
Statements of Changes in Net Assets
| | | | | | | | |
| | | Year ended
October 31, 2017 | | | Period ended
October 31, 2016(1) | |
Operations: | |
Net investment income/(loss) | | $ | 55,187 | | | $ | 6,273 | |
Net realized gain/(loss) on investments | | | 479,486 | | | | (936) | |
Change in unrealized net appreciation/depreciation | | | 836,970 | | | | (80,871) | |
Net Increase/(Decrease) in Net Assets Resulting from Operations | | | 1,371,643 | | | | (75,534) | |
Dividends and Distributions to Shareholders: | |
Dividends from Net Investment Income | | | (45,437) | | | | (3,120) | |
Capital Share Transactions | | | 8,671,208 | | | | 2,544,671 | |
Net Increase/(Decrease) in Net Assets | | | 9,997,414 | | | | 2,466,017 | |
Net Assets: | |
Beginning of period | | | 2,466,017 | | | | — | |
End of period | | $ | 12,463,431 | | | $ | 2,466,017 | |
| | |
| | | | | | | | |
Undistributed Net Investment Income/(Loss) | | $ | 31,033 | | | $ | 3,258 | |
| (1) | Period from June 8, 2016 (commencement of operations) through October 31, 2016. |
See Notes to Financial Statements.
| | |
| | Janus Detroit Street Trust ½ 11 |
The Organics ETF
Financial Highlights
| | | | | | | | | | |
| For a share outstanding during each year or period ended October 31 | | 2017 | | | 2016(1) | |
| | Net Asset Value, Beginning of Period | | | $24.66 | | | | $25.45 | |
| | Income/(Loss) from Investment Operations: | | | | | | | | |
| | Net investment income/(loss)(2) | | | 0.29 | | | | 0.06 | |
| | Net realized and unrealized gain/(loss) | | | 6.39 | | | | (0.82) | |
| | Total from Investment Operations | | | 6.68 | | | | (0.76) | |
| | Less Dividends and Distributions: | | | | | | | | |
| | Dividends (from net investment income) | | | (0.18) | | | | (0.03) | |
| | Total Dividends and Distributions | | | (0.18) | | | | (0.03) | |
| | Net Asset Value, End of Period | | | $31.16 | | | | $24.66 | |
| | Total Return* | | | 27.19% | | | | (2.98)% | |
| | Net assets, End of Period (in thousands) | | | $12,463 | | | | $2,466 | |
| | Average Net Assets for the Period (in thousands) | | | $5,314 | | | | $2,507 | |
| | Ratios to Average Net Assets**: | | | | | | | | |
| | Ratio of Gross Expenses | | | 0.50% | | | | 0.50% | |
| | Ratio of Net Investment Income/(Loss) | | | 1.04% | | | | 0.63% | |
| | Portfolio Turnover Rate(3) | | | 86% | | | | 20% | |
| * | Total return not annualized for periods of less than one full year. |
| ** | Annualized for periods of less than one full year. |
| (1) | Period from June 8, 2016 (commencement of operations) through October 31, 2016. |
| (2) | Per share amounts are calculated based on average shares outstanding during the year or period. |
| (3) | Portfolio turnover rate excludes securities received or delivered from in-kind processing of creation or redemptions. |
See Notes to Financial Statements.
The Organics ETF
Notes to Financial Statements
1. Organization and Significant Accounting Policies
The Organics ETF (the “Fund”) is a series fund. The Fund is part of Janus Detroit Street Trust (the “Trust”), which is organized as a Delaware statutory trust and is registered under the Investment Company Act of 1940, as amended (the “1940 Act”), as an open-end management investment company, and therefore has applied the specialized accounting and reporting guidance in Financial Accounting Standards Board (“FASB”) Accounting Standards Codification (“ASC”) Topic 946. The Trust offers nine Funds each of which represent shares of beneficial interest in a separate portfolio of securities and other assets with its own objective and policies. The Fund seeks investment results that correspond generally to the performance, before fees and expenses, of an index (“Underlying Index”) which is designed to track the performance of companies globally that are positioned to profit from increasing demand for organic products, including companies which service, produce, distribute, market or sell organic food, beverages, cosmetics, supplements, or packaging. The Fund is classified as nondiversified, as defined in the 1940 Act.
Unlike shares of traditional mutual funds, shares of the Fund are not individually redeemable and may only be purchased or redeemed directly from the Fund at net asset value (“NAV”) in large increments called “Creation Units” (100,000 or more shares per Creation Unit) through certain participants, known as “Authorized Participants.” The Fund will issue or redeem Creation Units in exchange for portfolio securities and/or cash. Except when aggregated in Creation Units, Fund shares are not redeemable securities of the Fund. Shares of the Fund are listed and trade on The NASDAQ Stock Market LLC (“NASDAQ”) and individual investors can purchase or sell shares in much smaller increments and for cash in the secondary market through a broker. These transactions, which do not involve the Fund, are made at market prices that may vary throughout the day and differ from the Fund’s NAV. As a result, you may pay more than NAV (at a premium) when you purchase shares, and receive less than NAV (at a discount) when you sell shares, in the secondary market.
An Authorized Participant may hold of record more than 25% of the outstanding shares of the Fund. From time to time, Authorized Participants may be a beneficial and/or legal owner of the Fund, may be affiliated with an index provider, may be deemed to have control of the Fund and/or may be able to affect the outcome of matters presented for a vote of the shareholders of the Fund. Authorized Participants may execute an irrevocable proxy granting the Distributor or an affiliate of Janus Capital Management LLC (“Janus Capital” or “Janus”) power to vote or abstain from voting such Authorized Participant’s beneficially or legally owned shares of the Fund. In such cases, the agent shall mirror vote (or abstain from voting) such shares in the same proportion as all other beneficial owners of the Fund.
The following accounting policies have been followed by the Fund and are in conformity with accounting principles generally accepted in the United States of America.
Investment Valuation
Securities held by the Fund are valued in accordance with policies and procedures established by and under the supervision of the Trustees (the “Valuation Procedures”). Equity securities, including shares of exchange-traded funds, traded on a domestic securities exchange are generally valued at the closing prices on the primary market or exchange on which they trade. If such price is lacking for the trading period immediately preceding the time of determination, such securities are valued at their current bid price. Equity securities that are traded on a foreign exchange are generally valued at the closing prices on such markets. In the event that there is no current trading volume on a particular security in such foreign exchange, the bid price from the primary exchange is generally used to value the security. Securities that are traded on the over-the-counter (“OTC”) markets are generally valued at their closing or latest bid prices as available. Foreign securities and currencies are converted to U.S. dollars using the applicable exchange rate in effect at the close of the New York Stock Exchange (“NYSE”). The Fund will determine the market value of individual securities held by it by using prices provided by one or more approved professional pricing services or, as needed, by obtaining market quotations from independent broker-dealers. Most debt securities are valued in accordance with the evaluated bid price supplied by the pricing service that is intended to reflect market value. The evaluated bid price supplied by the pricing service is an evaluation that may consider factors such as security prices, yields, maturities and ratings. Certain short-term securities maturing within 60 days or less may be evaluated and valued on an amortized cost basis provided that the amortized cost determined approximates market value. Securities for which market quotations or evaluated prices are not readily available or are deemed unreliable are valued at fair value determined in good faith under the Valuation Procedures. Circumstances in which fair value pricing may be utilized include, but are not limited to: (i) a significant event that may affect the securities of a single issuer, such as a merger, bankruptcy, or significant issuer-specific development; (ii) an event that may affect an entire market, such as a natural disaster or significant governmental action; (iii) a nonsignificant event such as a market closing early or not opening, or a security trading halt; and (iv) pricing of a nonvalued security and a restricted or nonpublic security. Special valuation considerations may apply with respect to “odd-lot” fixed-income transactions which, due to their small size, may receive evaluated prices by pricing services which reflect a large block trade and not what actually could be obtained for the odd-lot position.
| | |
| | Janus Detroit Street Trust ½ 13 |
The Organics ETF
Notes to Financial Statements
Valuation Inputs Summary
FASB ASC 820, Fair Value Measurements and Disclosures (“ASC 820”), defines fair value, establishes a framework for measuring fair value, and expands disclosure requirements regarding fair value measurements. This standard emphasizes that fair value is a market-based measurement that should be determined based on the assumptions that market participants would use in pricing an asset or liability and establishes a hierarchy that prioritizes inputs to valuation techniques used to measure fair value. These inputs are summarized into three broad levels:
Level 1 – Unadjusted quoted prices in active markets the Fund has the ability to access for identical assets or liabilities.
Level 2 – Observable inputs other than unadjusted quoted prices included in Level 1 that are observable for the asset or liability either directly or indirectly. These inputs may include quoted prices for the identical instrument on an inactive market, prices for similar instruments, interest rates, prepayment speeds, credit risk, yield curves, default rates and similar data.
Assets or liabilities categorized as Level 2 in the hierarchy generally include: debt securities fair valued in accordance with the evaluated bid or ask prices supplied by a pricing service; securities traded on OTC markets and listed securities for which no sales are reported that are fair valued at the latest bid price (or yield equivalent thereof) obtained from one or more dealers transacting in a market for such securities or by a pricing service approved by the Fund’s Trustees; and certain short-term debt securities with maturities of 60 days or less that are fair valued at amortized cost. Other securities that may be categorized as Level 2 in the hierarchy include, but are not limited to, preferred stocks, bank loans, swaps, investments in unregistered investment companies, options, and forward contracts.
Level 3 – Unobservable inputs for the asset or liability to the extent that relevant observable inputs are not available, representing the Fund’s own assumptions about the assumptions that a market participant would use in valuing the asset or liability, and that would be based on the best information available.
There have been no significant changes in valuation techniques used in valuing any such positions held by the Fund since the beginning of the fiscal year.
The inputs or methodology used for fair valuing securities are not necessarily an indication of the risk associated with investing in those securities. The summary of inputs used as of October 31, 2017 to fair value the Fund’s investments in securities and other financial instruments is included in the “Valuation Inputs Summary” in the Notes to Schedule of Investments and Other Information.
The Fund recognizes transfers between the levels as of the beginning of the fiscal year. The following describes the amounts of transfers between Level 1, Level 2 and Level 3 of the fair value hierarchy during the year/period.
Financial assets of $2,000 were transferred out of Level 2 to Level 1 to reflect the investments unadjusted quoted price as of October 31, 2017.
Investment Transactions and Investment Income
Investment transactions are accounted for as of the date purchased or sold (trade date). Dividend income is recorded on the ex-dividend date. Certain dividends from foreign securities will be recorded as soon as the Fund is informed of the dividend, if such information is obtained subsequent to the ex-dividend date. Dividends from foreign securities may be subject to withholding taxes in foreign jurisdictions. Gains and losses are determined on the identified cost basis, which is the same basis used for federal income tax purposes.
Estimates
The preparation of financial statements in conformity with accounting principles generally accepted in the United States of America requires management to make estimates and assumptions that affect the reported amount of assets and liabilities and disclosure of contingent assets and liabilities at the date of the financial statements and the reported amounts of income and expenses during the reporting period. Actual results could differ from those estimates.
Indemnifications
In the normal course of business, the Fund may enter into contracts that contain provisions for indemnification of other parties against certain potential liabilities. The Fund’s maximum exposure under these arrangements is unknown, and would involve future claims that may be made against the Fund that have not yet occurred. Currently, the risk of material loss from such claims is considered remote.
Foreign Currency Translations
The Fund does not isolate that portion of the results of operations resulting from the effect of changes in foreign exchange rates on investments from the fluctuations arising from changes in market prices of securities held at the date
The Organics ETF
Notes to Financial Statements
of the financial statements. Net unrealized appreciation or depreciation of investments and foreign currency translations arise from changes in the value of assets and liabilities, including investments in securities held at the date of the financial statements, resulting from changes in the exchange rates and changes in market prices of securities held.
Currency gains and losses are also calculated on payables and receivables that are denominated in foreign currencies. The payables and receivables are generally related to foreign security transactions and income translations.
Foreign currency-denominated assets and forward currency contracts may involve more risks than domestic transactions, including currency risk, counterparty risk, political and economic risk, regulatory risk and equity risk. Risks may arise from unanticipated movements in the value of foreign currencies relative to the U.S. dollar.
Dividends and Distributions
The Fund generally declares and distributes dividends of net investment income quarterly. Net realized capital gains (if any) are distributed annually. The Fund may treat a portion of the amount paid to redeem shares as a distribution of investment company taxable income and realized capital gains that are reflected in the NAV. This practice, commonly referred to as “equalization,” has no effect on the redeeming shareholder or a Fund’s total return, but may reduce the amounts that would otherwise be required to be paid as taxable dividends to the remaining shareholders. It is possible that the Internal Revenue Service (IRS) could challenge the Fund’s equalization methodology or calculations, and any such challenge could result in additional tax, interest, or penalties to be paid by the Fund.
Federal Income Taxes
The Fund intends to continue to qualify as a regulated investment company and distribute all of its taxable income in accordance with the requirements of Subchapter M of the Internal Revenue Code. Management has analyzed the Fund’s tax positions taken for all open federal income tax years, generally a three-year period, and has concluded that no provision for federal income tax is required in the Fund’s financial statements. The Fund is not aware of any tax positions for which it is reasonably possible that the total amounts of unrecognized tax benefits will significantly change in the next twelve months.
2. Other Investments and Strategies
Additional Investment Risk
The financial crisis in both the U.S. and global economies over the past several years has resulted, and may continue to result, in a significant decline in the value and liquidity of many securities of issuers worldwide in the equity and fixed income/credit markets. In response to the crisis, the United States and certain foreign governments, along with the U.S. Federal Reserve and certain foreign central banks, took steps to support the financial markets. The withdrawal of this support, a failure of measures put in place to respond to the crisis, or investor perception that such efforts were not sufficient could each negatively affect financial markets generally, and the value and liquidity of specific securities. In addition, policy and legislative changes in the United States and in other countries continue to impact many aspects of financial regulation. The effect of these changes on the markets, and the practical implications for market participants, including the Fund, may not be fully known for some time. As a result, it may also be unusually difficult to identify both investment risks and opportunities, which could limit or preclude the Fund’s ability to achieve its investment objective. Therefore, it is important to understand that the value of your investment may fall, sometimes sharply, and you could lose money.
The enactment of the Dodd-Frank Wall Street Reform and Consumer Protection Act (the “Dodd-Frank Act”) provided for widespread regulation of financial institutions, consumer financial products and services, broker-dealers, OTC derivatives, investment advisers, credit rating agencies, and mortgage lending, which expanded federal oversight in the financial sector, including the investment management industry. Certain provisions of the Dodd-Frank Act remain pending and will be implemented through future rulemaking. Therefore, the ultimate impact of the Dodd-Frank Act and the regulations under the Dodd-Frank Act on the Fund and the investment management industry as a whole, is not yet certain.
A number of countries in the European Union (“EU”) have experienced, and may continue to experience, severe economic and financial difficulties. In particular, many EU nations are susceptible to economic risks associated with high levels of debt, notably due to investments in sovereign debt of countries such as Greece, Italy, Spain, Portugal, and Ireland. Many non-governmental issuers, and even certain governments, have defaulted on, or been forced to restructure, their debts. Many other issuers have faced difficulties obtaining credit or refinancing existing obligations. Financial institutions have in many cases required government or central bank support, have needed to raise capital, and/or have been impaired in their ability to extend credit. As a result, financial markets in the EU experienced extreme volatility and declines in asset values and liquidity. Responses to these financial problems by European governments, central banks, and others, including austerity measures and reforms, may not work, may result in social unrest, and may limit future growth and
| | |
| | Janus Detroit Street Trust ½ 15 |
The Organics ETF
Notes to Financial Statements
economic recovery or have other unintended consequences. Further defaults or restructurings by governments and others of their debt could have additional adverse effects on economies, financial markets, and asset valuations around the world. Greece, Ireland, and Portugal have already received one or more “bailouts” from other Eurozone member states, and it is unclear how much additional funding they will require or if additional Eurozone member states will require bailouts in the future. The risk of investing in securities in the European markets may also be heightened due to the referendum in which the United Kingdom voted to exit the EU (known as “Brexit”). One or more other countries may also abandon the euro and/ or withdraw from the EU, placing its currency and banking system in jeopardy.
Certain areas of the world have historically been prone to and economically sensitive to environmental events such as, but not limited to, hurricanes, earthquakes, typhoons, flooding, tidal waves, tsunamis, erupting volcanoes, wildfires or droughts, tornadoes, mudslides, or other weather-related phenomena. Such disasters, and the resulting physical or economic damage, could have a severe and negative impact on the Fund’s investment portfolio and, in the longer term, could impair the ability of issuers in which the Fund invests to conduct their businesses as they would under normal conditions. Adverse weather conditions may also have a particularly significant negative effect on issuers in the agricultural sector and on insurance companies that insure against the impact of natural disasters.
Counterparties
Fund transactions involving a counterparty are subject to the risk that the counterparty or a third party will not fulfill its obligation to the Fund (“counterparty risk”). Counterparty risk may arise because of the counterparty’s financial condition (i.e., financial difficulties, bankruptcy, or insolvency), market activities and developments, or other reasons, whether foreseen or not. A counterparty’s inability to fulfill its obligation may result in significant financial loss to the Fund. The Fund may be unable to recover its investment from the counterparty or may obtain a limited recovery, and/or recovery may be delayed. The extent of the Fund’s exposure to counterparty risk with respect to financial assets and liabilities approximates its carrying value. See the “Offsetting Assets and Liabilities” section of this Note for further details.
The Fund may be exposed to counterparty risk through participation in various programs, including, but not limited to, lending its securities to third parties, cash sweep arrangements whereby the Fund’s cash balance is invested in one or more types of cash management vehicles, as well as investments in, but not limited to, repurchase agreements, and derivatives, including various types of swaps, futures and options. The Fund intends to enter into financial transactions with counterparties that Janus Capital believes to be creditworthy at the time of the transaction. There is always the risk that Janus Capital’s analysis of a counterparty’s creditworthiness is incorrect or may change due to market conditions. To the extent that the Fund focuses its transactions with a limited number of counterparties, it will have greater exposure to the risks associated with one or more counterparties.
Offsetting Assets and Liabilities
The Fund presents gross and net information about transactions that are either offset in the financial statements or subject to an enforceable master netting arrangement or similar agreement with a designated counterparty, regardless of whether the transactions are actually offset in the Statement of Assets and Liabilities.
Deutsche Bank AG acts as securities lending agent and a limited purpose custodian or subcustodian to receive and disburse cash balances and cash collateral, hold short-term investments, hold collateral, and perform other custodian functions in accordance with the Agency Securities Lending and Repurchase Agreement. For financial reporting purposes, the Fund does not offset financial instruments’ payables and receivables and related collateral on the Statement of Assets and Liabilities. Securities on loan will be continuously secured by collateral which may consist of cash, U.S. Government securities, domestic and foreign short-term debt instruments, letters of credit, time deposits, repurchase agreements, money market mutual funds or other money market accounts, or such other collateral as permitted by the SEC. The value of the collateral must be at least 102% of the market value of the loaned securities that are denominated in U.S. dollars and 105% of the market value of the loaned securities that are not denominated in U.S. dollars. Upon receipt of cash collateral, Janus Capital intends to invest the cash collateral in a cash management vehicle for which Janus Capital serves as investment adviser, Janus Cash Collateral Fund LLC. Loaned securities and related collateral are marked-to-market each business day based upon the market value of the loaned securities at the close of business, employing the most recent available pricing information. Collateral levels are then adjusted based on this mark-to-market evaluation.
The Organics ETF
Notes to Financial Statements
The following table presents gross amounts of recognized assets and/or liabilities and the net amounts after deducting collateral that has been pledged by counterparties or has been pledged to counterparties (if applicable). For corresponding information grouped by type of instrument, see the Fund’s Schedule of Investments.
Offsetting of Financial Assets and Derivative Assets
| | | | | | | | | | | | | | | | | | |
| Counterparty | | | Gross Amounts
of Recognized
Assets | | | Offsetting Asset
or Liability(a) | | | Collateral
Pledged(b) | | | Net Amount | |
| | Deutsche Bank AG | | | $ | 227,391 | | | $ | — | | | $ | (227,391) | | | $ | — | |
| (a) | Represents the amount of assets or liabilities that could be offset with the same counterparty under master netting or similar agreements that management elects not to offset on the Statement of Assets and Liabilities. |
| (b) | Collateral pledged is limited to the net outstanding amount due to/from an individual counterparty. The actual collateral amounts pledged may exceed these amounts and may fluctuate in value. |
Securities Lending
Under procedures adopted by the Trustees, the Fund may seek to earn additional income by lending securities to qualified parties. Deutsche Bank AG acts as securities lending agent and a limited purpose custodian or subcustodian to receive and disburse cash balances and cash collateral, hold short-term investments, hold collateral, and perform other custodian functions. The Fund may lend portfolio securities in an amount equal to up to 1/3 of its total assets as determined at the time of the loan origination. There is the risk of delay in recovering a loaned security or the risk of loss in collateral rights if the borrower fails financially. In addition, Janus Capital makes efforts to balance the benefits and risks from granting such loans. All loans will be continuously secured by collateral which may consist of cash, U.S. Government securities, domestic and foreign short-term debt instruments, letters of credit, time deposits, repurchase agreements, money market mutual funds or other money market accounts, or such other collateral as permitted by the SEC. If the Fund is unable to recover a security on loan, the Fund may use the collateral to purchase replacement securities in the market. There is a risk that the value of the collateral could decrease below the cost of the replacement security by the time the replacement investment is made, resulting in a loss to the Fund.
Upon receipt of cash collateral, Janus Capital may invest it in affiliated or non-affiliated cash management vehicles, whether registered or unregistered entities, as permitted by the 1940 Act and rules promulgated thereunder. Janus Capital currently intends to invest the cash collateral in a cash management vehicle for which Janus Capital serves as investment adviser, Janus Cash Collateral Fund LLC. An investment in Janus Cash Collateral Fund LLC is generally subject to the same risks that shareholders experience when investing in similarly structured vehicles, such as the potential for significant fluctuations in assets as a result of the purchase and redemption activity of the securities lending program, a decline in the value of the collateral, and possible liquidity issues. Such risks may delay the return of the cash collateral and cause the Fund to violate its agreement to return the cash collateral to a borrower in a timely manner. As adviser to the Fund and Janus Cash Collateral Fund LLC, Janus Capital has an inherent conflict of interest as a result of its fiduciary duties to both the Fund and Janus Cash Collateral Fund LLC. Additionally, Janus Capital receives an investment advisory fee of 0.05% for managing Janus Cash Collateral Fund LLC, but it may not receive a fee for managing certain other affiliated cash management vehicles in which the Fund may invest, and therefore may have an incentive to allocate preferred investment opportunities to investment vehicles for which it is receiving a fee.
The value of the collateral must be at least 102% of the market value of the loaned securities that are denominated in U.S. dollars and 105% of the market value of the loaned securities that are not denominated in U.S. dollars. Loaned securities and related collateral are marked-to-market each business day based upon the market value of the loaned securities at the close of business, employing the most recent available pricing information. Collateral levels are then adjusted based on this mark-to-market evaluation.
The cash collateral invested by Janus Capital is disclosed in the Schedule of Investments (if applicable). Income earned from the investment of the cash collateral, net of rebates paid to, or fees paid by, borrowers and less the fees paid to the lending agent are included as “Affiliated securities lending income, net” on the Statement of Operations. As of October 31, 2017, securities lending transactions accounted for as secured borrowings with an overnight and continuous contractual maturity are $227,391 for equity securities. Gross amounts of recognized liabilities for securities lending (collateral received) as of October 31, 2017 is $238,150, resulting in the net amount due to the counterparty of $10,759.
| | |
| | Janus Detroit Street Trust ½ 17 |
The Organics ETF
Notes to Financial Statements
3. Investment Advisory Agreements and Other Transactions with Affiliates
Under its unitary fee structure, the Fund pays Janus Capital a management fee in return for providing certain investment advisory, supervisory, and administrative services to the Fund, including the costs of transfer agency, custody, fund administration, legal, audit, and other services. Janus Capital’s fee structure is designed to pay substantially all of the Fund’s expenses. However, the Fund bears other expenses which are not covered under the management fee which may vary and affect the total level of expenses paid by shareholders, such as distribution fees (if any), brokerage expenses or commissions, interest, dividends, taxes, litigation expenses, acquired fund fees and expenses (if any), and extraordinary expenses. The Fund’s management fee is calculated daily and paid monthly. The Fund’s contractual management fee rate (expressed as an annual rate) is 0.50% of the Fund’s average daily net assets.
State Street Bank and Trust Company (“State Street”) provides certain fund administration services to the Fund, including services related to the Fund’s accounting, including calculating the daily NAV, audit, tax, and reporting obligations, pursuant to an agreement with Janus Capital, on behalf of the Fund. As compensation for such services, Janus Capital pays State Street a fee based on a percentage of the Fund’s assets, with a minimum flat fee, for certain services. Janus Capital serves as administrator to the Fund, providing oversight and coordination of the Fund’s service providers, recordkeeping and other administrative services. Janus Capital does not receive any additional compensation, beyond the unitary fee, for serving as administrator. State Street also serves as transfer agent for the shares of the Fund. Pursuant to agreements with Janus Capital on behalf of the Fund, State Street Global Markets, an affiliate of State Street, may execute portfolio transactions for the Fund, including but not limited to, transactions in connection with cash in lieu transactions for non-US securities.
The Trust has adopted a Distribution and Servicing Plan for shares of the Fund pursuant to Rule 12b-1 under the 1940 Act (the “Plan”). The Plan permits compensation in connection with the distribution and marketing of Fund shares and/or the provision of certain shareholder services. The Plan permits the Fund to pay ALPS Distributors, Inc. (the “Distributor”) or its designee, a fee for the sale and distribution and/or shareholder servicing of the shares at an annual rate of up to 0.25% of average daily net assets of the Fund. However, the Trustees have determined not to authorize payment under this Plan at this time. Under the terms of the Plan, the Trust is authorized to make payments to the Distributor or its designee for remittance to retirement plan service providers, broker-dealers, bank trust departments, financial advisors, and other financial intermediaries, as compensation for distribution and/or shareholder services performed by such entities for their customers who are investors in the Fund. The 12b-1 fee may only be imposed or increased when the Trustees determine that it is in the best interests of shareholders to do so. Because these fees are paid out of the Fund’s assets on an ongoing basis, to the extent that a fee is authorized, over time they will increase the cost of an investment in the Fund. The Plan fee may cost an investor more than other types of sales charges.
As of October 31, 2017, Janus Capital owned 1 share or less than 0.01% of the Fund.
4. Federal Income Tax
The tax components of capital shown in the table below represent: (1) distribution requirements the Fund must satisfy under the income tax regulations; (2) losses or deductions the Fund may be able to offset against income and gains realized in future years; and (3) unrealized appreciation or depreciation of investments for federal income tax purposes.
Other book to tax differences primarily consist of deferred compensation, derivatives, and foreign currency contract adjustments. The Fund has elected to treat gains and losses on forward foreign currency contracts as capital gains and losses, if applicable. Other foreign currency gains and losses on debt instruments are treated as ordinary income for federal income tax purposes pursuant to Section 988 of the Internal Revenue Code.
| | | | | | | | | | | | | | | | | | | | | | | | | | |
| | | | | | | | | | Loss Deferrals | | | | | | | |
Undistributed
Ordinary Income | | | Undistributed
Long-Term Gains | | | Accumulated
Capital Losses | | | Late-Year
Ordinary Loss | | | Post-October
Capital Loss | | | Other Book
to Tax Differences | | | Net Tax
Appreciation/
(Depreciation) | |
| $ | 31,033 | | | $ | — | | | $ | — | | | $ | — | | | $ | — | | | $ | 23 | | | $ | 661,185 | |
During the year ended ended October 31, 2017, capital loss carryovers of $629 were utilized by the Fund.
The Organics ETF
Notes to Financial Statements
The aggregate cost of investments and the composition of unrealized appreciation and depreciation of investment securities for federal income tax purposes as of October 31, 2017 are noted below. The primary difference between book and tax appreciation or depreciation of investments is wash sale loss deferrals.
| | | | | | | | | | | | | | |
| Federal Tax Cost | | | Unrealized Appreciation | | | Unrealized (Depreciation) | | | Net Tax Appreciation/
(Depreciation) | |
| $ | 13,150,312 | | | $ | 1,070,860 | | | $ | (409,675) | | | $ | 661,185 | |
Income and capital gains distributions are determined in accordance with income tax regulations that may differ from accounting principles generally accepted in the United States of America. These differences are due to differing treatments for items such as net short-term gains, deferral of wash sale losses, foreign currency transactions, passive foreign investment companies, net investment losses, in-kind transactions, and capital loss carryovers. Certain permanent differences such as tax returns of capital and net investment losses noted below have been reclassified to capital.
| | | | | | | | | | | | | | |
| For the year ended October 31, 2017 | |
| Distributions | | | | |
| From Ordinary Income | | | From Long-Term Capital Gains | | | Tax Return of Capital | | | Net Investment Loss | |
| $ | 45,437 | | | $ | — | | | $ | — | | | $ | — | |
|
| For the period ended October 31, 2016 | |
| Distributions | | | | |
| From Ordinary Income | | | From Long-Term Capital Gains | | | Tax Return of Capital | | | Net Investment Loss | |
| $ | 3,120 | | | $ | — | | | $ | — | | | $ | — | |
Permanent book to tax basis differences may result in reclassifications between the components of net assets. These differences have no impact on the results of operations or net assets. The following reclassifications have been made to the Fund:
| | | | | | | | | | |
| Increase/(Decrease) to Capital | | | Increase/(Decrease) to Undistributed
Net Investment Income/Loss | | | Increase/(Decrease) to Undistributed
Net realized Gain/Loss | |
| $ | 555,311 | | | $ | 18,025 | | | $ | (573,336) | |
5. Capital Share Transactions
| | | | | | | | | | | | | | | | |
| | | Year ended October 31, 2017 | | | Period ended October 31, 2016(1) | |
| | | Shares | | | Amount | | | Shares | | | Amount | |
| Shares sold | | | 400,000 | | | $ | 11,664,634 | | | | 100,001 | | | $ | 2,544,671 | |
| Shares repurchased | | | (100,000) | | | | (2,993,426) | | | | — | | | | — | |
Net Increase/(Decrease) | | | 300,000 | | | $ | 8,671,208 | | | | 100,001 | | | $ | 2,544,671 | |
| (1) | Period from June 8, 2016 (commencement of operations) through October 31, 2016. |
6. Purchases and Sales of Investment Securities
For the year ended October 31, 2017, the aggregate cost of purchases and proceeds from sales of investment securities (excluding any short-term securities, short-term options contracts, and in-kind transactions) was as follows:
| | | | | | | | | | | | | | |
Purchases of Securities | | | Proceeds from Sales of Securities | | | Purchases of Long- Term U.S. Government Obligations | | | Proceeds from Sales of Long-Term U.S. Government Obligations | |
| $ | 6,180,511 | | | $ | 5,144,514 | | | $ | — | | | $ | — | |
| | |
| | Janus Detroit Street Trust ½ 19 |
The Organics ETF
Notes to Financial Statements
For the year ended October 31, 2017, the cost of in-kind purchases and proceeds from in-kind sales, were as follows:
| | | | | | | | | | | | | | |
Purchases of Securities | | | Proceeds from Sales of Securities | | | Purchases of Long- Term U.S. Government Obligations | | | Proceeds from Sales of Long-Term U.S. Government Obligations | |
| $ | 11,577,236 | | | $ | 2,964,110 | | | $ | — | | | $ | — | |
During the year ended October 31, 2017, the Fund had net realized gain/(loss) of $557,351 from in-kind redemptions. Gains on in-kind transactions are not considered taxable for federal income tax purposes.
7. Recent Accounting Pronouncements
The Securities and Exchange Commission (“SEC”) adopted new rules as well as amendments to its rules to modernize the reporting and disclosure of information by registered investment companies. In addition, the SEC adopted amendments to Regulation S-X, which require standardized, enhanced disclosure about derivatives in investment company financial statements, as well as other amendments. The compliance date of the amendments to Regulation SX was August 1, 2017. This report incorporates the amendments to Regulation S-X.
The FASB issued Accounting Standards Update No. 2017-08, Receivables – Nonrefundable Fees and Other Costs
(Subtopic 310-20), Premium Amortization on Purchased Callable Debt Securities (“ASU 2017-08”) to amend the
amortization period for certain purchased callable debt securities held at a premium. The guidance requires certain
premiums on callable debt securities to be amortized to the earliest call date. The amortization period for callable debt securities purchased at a discount will not be impacted. The amendments are effective for fiscal years, and interim periods within those fiscal years, beginning after December 15, 2018. Early adoption is permitted, including adoption in an interim period. Management is currently evaluating the impacts of ASU 2017-08 on the financial statements.
8. Merger Related Matters
On October 3, 2016, Janus Capital Group Inc. (“JCGI”), the direct parent of Janus Capital Management LLC, the investment adviser to the Fund (“Janus Capital”), and Henderson Group plc (“Henderson”) announced that they had entered into an Agreement and Plan of Merger (“Merger Agreement”) relating to the strategic combination of Henderson and JCGI (the “Merger”). Pursuant to the Merger Agreement, a newly formed, direct wholly-owned subsidiary of Henderson merged with and into JCGI, with JCGI as the surviving corporation and a direct wholly-owned subsidiary of Henderson.
The consummation of the Merger may have been deemed to cause an “assignment” (as defined in the Investment Company Act of 1940 Act, as amended) of the advisory agreement between the Fund and Janus Capital. As a result, the consummation of the Merger may have caused the pre-merger investment advisory agreement to terminate automatically in accordance with its terms.
On October 24, 2016, the Fund’s Board of Trustees approved, subject to shareholder approval, a new investment advisory agreement between the Fund and Janus Capital in order to permit Janus Capital to continue providing advisory services to the Fund following the closing of the Merger (“Post-Merger Advisory Agreement”). At the same meeting, the Trustees approved submitting the Post-Merger Advisory Agreement to Fund shareholders for approval.
On April 18, 2017, shareholders of the Fund approved the Post-Merger Advisory Agreement, which took effect upon the consummation of the Merger on May 30, 2017.
9. Subsequent Event
Management has evaluated whether any events or transactions occurred subsequent to October 31, 2017 and through the date of issuance of the Fund’s financial statements and determined that there were no material events or transactions that would require recognition or disclosure in the Fund’s financial statements.
The Organics ETF
Additional Information (unaudited)
Proxy Voting Policies and Voting Record
A description of the policies and procedures that the Fund uses to determine how to vote proxies relating to its portfolio securities is available without charge: (i) upon request, by calling 1-800-525-0020 (toll free); (ii) on the Fund’s website at janushenderson.com/proxyvoting; and (iii) on the SEC’s website at http://www.sec.gov.
Quarterly Portfolio Holdings
The Fund files its complete portfolio holdings (schedule of investments) with the SEC for the first and third quarters of each fiscal year on Form N-Q within 60 days of the end of such fiscal quarter. The Fund’s Form N-Q: (i) is available on the SEC’s website at http://www.sec.gov; (ii) may be reviewed and copied at the SEC’s Public Reference Room in Washington, D.C. (information on the Public Reference Room may be obtained by calling 1-800-SEC-0330); and (iii) is available without charge, upon request, by calling Janus Henderson at 1-800-525-0020 (toll free).
Designation Requirements (Unaudited)
For federal income tax purposes, the Fund designated the following for the year ended October 31, 2017:
| | | | |
| Foreign Tax Credits | | $ | 7,142 | |
| Foreign Source Income | | $ | 57,018 | |
| Dividends Received Deduction Percentage | | | 23% | |
| Qualified Dividend Income Percentage | | | 87% | |
Licensing Agreements
Solactive AG (“Solactive”) is the Index Provider for the Underlying Index. Janus Capital has entered into a license agreement with Solactive to use the Underlying Index.
Neither Solactive nor any of its affiliates make any representation or warranty, express or implied, to the owners of a Fund or any member of the public regarding the advisability of investing in securities generally or in a Fund particularly or the ability of the Underlying Index to track general market performance. The Underlying Index is determined, composed, and calculated by Solactive without regard to Janus Capital or the Fund. Solactive has no obligation to take the needs of Janus Capital or the owners of the Fund into consideration in determining, composing, or calculating the Underlying Index. Solactive is not responsible for and has not participated in the determination of the timing of, prices at, or quantities of the Fund to be issued or in the determination or calculation of the equation by which the Fund is to be converted into cash.
ALTHOUGH SOLACTIVE SHALL OBTAIN INFORMATION FOR INCLUSION IN OR FOR USE IN THE CALCULATION OF THE UNDERLYING INDEX FROM SOURCES WHICH IT CONSIDERS RELIABLE, IT DOES NOT GUARANTEE THE QUALITY, ACCURACY AND/OR THE COMPLETENESS OF THE UNDERLYING INDEX OR ANY DATA INCLUDED THEREIN AND SHALL HAVE NO LIABILITY FOR ERRORS OR OMISSIONS OF ANY KIND RELATED TO THE UNDERLYING INDEX OR DATA. SOLACTIVE MAKES NO WARRANTY, EXPRESS OR IMPLIED, AS TO RESULTS TO BE OBTAINED BY JANUS CAPITAL, OWNERS OF THE FUND, OR ANY OTHER PERSON OR ENTITY FROM THE USE OF THE UNDERLYING INDEX OR ANY DATA INCLUDED THEREIN IN CONNECTION WITH THE RIGHTS LICENSED TO JANUS CAPITAL FOR ANY OTHER USE. SOLACTIVE MAKES NO EXPRESS OR IMPLIED WARRANTIES, AND HEREBY EXPRESSLY DISCLAIMS ALL WARRANTIES OF MERCHANTABILITY OR FITNESS FOR A PARTICULAR PURPOSE OR USE WITH RESPECT TO THE UNDERLYING INDEX OR ANY DATA INCLUDED THEREIN. WITHOUT LIMITING ANY OF THE FOREGOING, IN NO EVENT SHALL IT HAVE ANY LIABILITY FOR ANY SPECIAL, PUNITIVE, INDIRECT, OR CONSEQUENTIAL DAMAGES (INCLUDING LOST PROFITS), EVEN IF NOTIFIED OF THE POSSIBILITY OF SUCH DAMAGES.
Janus Capital does not guarantee the accuracy and/or the completeness of the Underlying Index or any data included therein, and Janus Capital shall have no liability for any errors, omissions or interruptions therein. Janus Capital makes no warranty, express or implied, as to results to be obtained by the Fund, owners of the shares of the Fund or any other person or entity from the use of the Underlying Index or any data included therein. Janus Capital makes no express or implied warranties, and expressly disclaims all warranties of merchantability or fitness for a particular purpose or use with respect to the Underlying Index or any data included therein. Without limiting any of the foregoing, in no event shall Janus Capital have any liability for any special, punitive, direct, indirect or consequential damages (including lost profits) arising out of matters relating to the use of the Underlying Index even if notified of the possibility of such damages.
| | |
| | Janus Detroit Street Trust ½ 21 |
The Organics ETF
Board Considerations Regarding Approval of Investment Advisory Agreements (unaudited)
APPROVAL OF ADVISORY AGREEMENT DURING THE PERIOD FOR THE ORGANICS ETF, THE LONG-TERM CARE ETF, THE OBESITY ETF, AND THE HEALTH AND FITNESS ETF
The Trustees of the Trust, the majority of are Independent Trustees, met on April 18, 2016 to consider the proposed investment management agreement (the “Investment Management Agreement”) for The Organics ETF, The Long-Term Care ETF, The Obesity ETF, and The Health and Fitness ETF (each a “New Thematic Fund” and collectively, the “New Thematic Funds”). In the course of their consideration of the Investment Management Agreement, the Trustees met in executive session and were advised by their independent counsel. In this regard, the Board, including the Independent Trustees, evaluated the terms of the Investment Management Agreement and reviewed the duties and responsibilities of the Trustees in evaluating and approving such agreements. In considering approval of the Investment Management Agreement, the Board, including the Independent Trustees, reviewed the Board Materials and other information from counsel and from the Adviser, including: (i) a copy of the form of Investment Management Agreement with respect to the Adviser’s management of the assets of each New Thematic Fund; (ii) information describing the nature, quality and extent of the services that the Adviser will provide to the New Thematic Fund, and the fees the Adviser will charge to the New Thematic Funds; (iii) information concerning the Adviser’s financial condition, business, operations, portfolio management teams and compliance programs; (iv) information describing each New Thematic Fund’s anticipated advisory fee and operating expenses; (v) a copy of the Adviser’s current Form ADV; and (vi) a memorandum from counsel on the responsibilities of trustees in considering investment advisory arrangements under the 1940 Act. The Board also considered presentations made by, and discussions held with, representatives of the Adviser. The Board also received information comparing the advisory fees and expenses of the New Thematic Funds to those from fund complexes that were defined as competitors.
During its review of this information, the Board focused on and analyzed the factors that the Board deemed relevant, including: the nature, extent and quality of the services to be provided to each New Fund by the Adviser; the Adviser’s personnel and operations; each New Thematic Fund’s proposed expense level; the anticipated profitability to the Adviser under the Investment Management Agreement at certain asset levels; any “fall-out” benefits to the Adviser and its affiliates (i.e., any ancillary benefits anticipated to be realized by the Adviser and its affiliates from the Adviser’s relationship with the Trust); the effect of asset growth on each New Thematic Fund’s expenses; and possible conflicts of interest.
The Trustees also considered benefits that accrue to the Adviser and its affiliates from their relationships with the New Thematic Funds. The Trustees also concluded that, other than the services provided by the Adviser and its affiliates pursuant to the agreements and the fees to be paid by the New Thematic Funds therefor, the New Thematic Funds and the Adviser may potentially benefit from their relationship with each other in other ways. The Trustees concluded that the success of the New Thematic Funds could attract other business to the Adviser or other Janus funds, and that the success of the Adviser could enhance the Adviser’s ability to serve the New Thematic Funds.
The Board, including the Independent Trustees, considered the following in respect of each New Thematic Fund:
The nature, extent and quality of services to be provided by the Adviser; personnel and operations of the Adviser.
The Board reviewed the services that the Adviser would provide to each New Thematic Fund. In connection with the investment advisory services to be provided by the Adviser, the Board noted the responsibilities that the Adviser would have as the Funds’ investment adviser, including: the overall supervisory responsibility for the general management and investment of each New Fund’s securities portfolio; providing oversight of the investment performance and processes and compliance with the New Thematic Fund’s investment objectives, policies and limitations; the implementation of the investment management program of each New Thematic Fund; the management of the day-to-day investment and reinvestment of the assets of each New Thematic Fund; determining daily baskets of deposit securities and cash components; executing portfolio security trades for purchases and redemptions of New Thematic Fund shares conducted on a cash-in-lieu basis; the responsibility for daily monitoring of tracking error and quarterly reporting to the Board; the review of brokerage matters; the oversight of general portfolio compliance with relevant law; and the implementation of Board directives as they relate to the New Thematic Funds.
The Board reviewed the Adviser’s experience, resources and strengths in managing other pooled investment vehicles, including the Adviser’s personnel. Based on its consideration and review of the foregoing information, the Board determined that each New Thematic Fund was likely to benefit from the nature, quality and extent of these services, as well as the Adviser’s ability to render such services based on their experience, personnel, operations and resources.
The Organics ETF
Board Considerations Regarding Approval of Investment Advisory Agreements (unaudited)
Comparison of services to be rendered and fees to be paid to those under other investment advisory contracts, and the cost of the services to be provided and profits to be realized by the Adviser from the relationship with the New Thematic Funds; “fall-out” benefits.
The Board then compared both the services to be rendered and the proposed fees to be paid under other contracts of the Adviser, and under contracts of other investment advisers with respect to similar ETFs. In particular, the Board compared each New Thematic Fund’s proposed advisory fee and projected expense ratio to other investment companies considered to be in that New Thematic Fund’s peer group. The Board also received and considered information about the fee rates charged to other accounts and clients that are managed by the Adviser, including information about the differences in services provided to the non-registered investment company clients, noting that the New Thematic Funds had no other comparable equivalents at the Adviser. The Board also discussed the anticipated costs and projected profitability of the Adviser in connection with its serving as investment adviser to each New Thematic Fund, including operational costs. In addition, the Board discussed the entrepreneurial risk undertaken by the Adviser in creating the Trust. After comparing each New Thematic Fund’s proposed fees with those of other funds in each New Thematic Fund’s peer group, and in light of the nature, extent and quality of services proposed to be provided by the Adviser and the costs expected to be incurred by the Adviser in rendering those services, the Board concluded that the level of fees proposed to be paid to the Adviser with respect to the New Thematic Funds were fair and reasonable.
The Board also considered that the Adviser may experience reputational “fall-out” benefits based on the success of the New Thematic Funds, but that such benefits are not easily quantifiable.
The extent to which economies of scale would be realized as the New Thematic Funds grow and whether fee levels would reflect such economies of scale.
The Board next discussed potential economies of scale. Since the New Thematic Funds had not commenced operations, the eventual aggregate amount of assets was uncertain, and the Adviser was not able to provide the Board with specific information concerning the extent to which economies of scale could be realized as each New Thematic Fund grows, and whether fee levels would reflect such economies of scale, if any. The Board recognized the uncertainty in launching a new investment product and estimating future asset levels.
Investment performance of the New Thematic Funds and the Adviser.
Because each New Thematic Fund had not commenced operations and has an investment objective to track an index, the Board did not consider the investment performance of the New Thematic Fund or the Adviser.
Conclusion.
No single factor was determinative to the decision of the Board. Based on the foregoing and such other matters as were deemed relevant, the Board concluded that the proposed advisory fee rate and projected total expense ratio are reasonable in relation to the services to be provided by the Adviser to each New Thematic Fund, as well as the costs to be incurred and benefits to be gained by the Adviser in providing such services. The Board also found the proposed advisory fees to be reasonable in comparison to the fees charged by advisers to other comparable funds of
similar actual or anticipated size. As a result, the Board concluded that the initial approval of the Investment Management Agreement was in the best interests of each New Thematic Fund.
After full consideration of the above factors, as well as other factors, the Trustees, with the Independent Trustees voting separately, determined to approve the Investment Management Agreement for each New Thematic Fund.
APPROVAL OF ADVISORY AGREEMENT DURING THE PERIOD WITH THE ADVISER POST-MERGER
On October 3, 2016, Janus Capital Group Inc. (“JCGI”), the direct parent of Janus Capital Management LLC, the investment adviser to the Funds (the “Adviser”), and Henderson Group plc (“Henderson”) announced that they had entered into an Agreement and Plan of Merger (“Merger Agreement”) relating to the business combination of Henderson and JCGI (the “Merger”). Pursuant to the Merger Agreement, a newly formed, direct wholly-owned subsidiary of Henderson will merge with and into JCGI, with JCGI as the surviving corporation and a direct wholly-owned subsidiary of Henderson. The Merger is expected to close in the second quarter of 2017, subject to requisite shareholder and regulatory approvals. The consummation of the Merger may be deemed to be an “assignment” (as defined in the Investment Company Act of 1940, as amended) of the advisory agreement between the Fund and Janus Capital. As a result, the consummation of the Merger will cause such advisory agreement to terminate automatically in accordance with its terms.
| | |
| | Janus Detroit Street Trust ½ 23 |
The Organics ETF
Board Considerations Regarding Approval of Investment Advisory Agreements (unaudited)
The Trustees of the Trust, the majority of whom are Independent Trustees met on October 24, 2016, and at various times in advance of that date, which meeting was called for the purpose of considering the proposed investment management agreement (the “New Investment Management Agreement”) between the Adviser as a subsidiary of Henderson following the consummation of the Merger and the following series of the Trust: Janus Small Cap Growth Alpha ETF, Janus Small/Mid Cap Growth Alpha ETF, The Organics ETF, The Long-Term Care ETF, The Obesity ETF, The Health and Fitness ETF, Janus Velocity Tail Risk Hedged Large Cap ETF and Janus Velocity Volatility Hedged Large Cap ETF (each a “Fund” and collectively, the “Funds”). The Independent Trustees met with representatives of the Adviser to discuss the anticipated effects of the Merger. During these meetings, the Adviser indicated its belief that the Merger would not adversely affect the continued operation of the Funds or the capabilities of the investment advisory personnel who currently manage the Funds to continue to provide these and other services to the Funds at the current levels. The Adviser also indicated that it believed that the Merger could provide certain benefits to the Funds but that there could be no assurance as to any particular benefits that might result.
In the course of their consideration of the New Investment Management Agreement, the Trustees met in executive session and were advised by their independent counsel. In this regard, the Board, including the Independent Trustees, evaluated the terms of the New Investment Management Agreement and reviewed the duties and responsibilities of the Trustees in evaluating and approving such agreements. In considering approval of the Investment Management Agreement, the Board, including the Independent Trustees, reviewed the board materials (the “Materials”) and other information provided in advance of the meeting from counsel, the Adviser, as well as from Henderson, including: (i) a copy of the form of New Investment Management Agreement, with respect to the Adviser’s management of the assets of each Fund; (ii) information describing the nature, quality and extent of the services that will be provided to each Fund, and the fees that will be charged to the Funds; (iii) information concerning the Adviser’s and Henderson’s financial condition, business, operations, portfolio management teams and compliance programs; (iv) information describing each Fund’s anticipated advisory fee and operating expenses; (v) information concerning the anticipated structure of the post-Merger entity (“Janus Henderson”); and (v) a memorandum from counsel on the responsibilities of trustees in considering investment advisory arrangements under the 1940 Act. The Board also considered presentations made by, and discussions held with, representatives of the Adviser. The Board also noted the information previously provided to the Board during 2016 related to the initial approvals of each Fund.
During its review of this information, the Board focused on and analyzed the factors that the Board deemed relevant, including, among other matters:
| 1) | That the material terms regarding advisory services pursuant to the New Investment Management Agreement are substantially identical to the terms of the current investment management agreement with the Adviser; |
| 2) | That there is not expected to be any diminution in the nature, extent and quality of the services provided to the Funds and their shareholders by Janus Henderson, including compliance services; |
| 3) | The commitment of the Adviser to retain key personnel currently employed by the Adviser who provide services to the Funds; |
| 4) | That the manner in which each Fund’s assets are managed would not change as a result of the Merger, and that the same portfolio managers managing each Fund’s assets are expected to continue to do so after the Merger; |
| 5) | The terms and conditions of the New Investment Management Agreement, including the current advisory fee rates and operational expenses, are the same as the current fee rates under the current investment management agreement; |
| 6) | That each Fund’s expense ratios are not expected to increase as a result of the Merger or approval of the New Investment Management Agreement; |
| 7) | That the fees and expense ratios of the Funds relative to comparable investment companies continued to be reasonable given the quality of services provided; |
| 8) | The history, reputation, qualification and background of Henderson, as well as its financial condition; |
| 9) | The reputation, financial strength, corporate structure and capital resources of Henderson and its investment advisory subsidiaries and the anticipated financial strength of Janus Henderson; |
| 10) | The long-term business goals of the Adviser and Henderson with respect to the Funds; |
The Organics ETF
Board Considerations Regarding Approval of Investment Advisory Agreements (unaudited)
| 11) | That, pursuant to the terms of the Merger, Henderson has acknowledged the Advisor’s reliance upon the benefits and protections provided by Section 15(f) and has agreed not to take, and to cause its affiliates not to take, any action that would have the effect, directly or indirectly, of causing the requirements of any of the provisions of Section 15(f) not to be met in respect of the Merger; |
| 12) | That shareholders would not bear any costs in connection with the Merger, that the Adviser will bear the costs, fees and expenses incurred by the Funds in connection with the Proxy Statement, including all expenses in connection with the solicitation of proxies, the fees and expenses of attorneys relating to the Merger and Proxy Statement, and other fees and expenses incurred by the Funds, if any, in connection with the Merger; |
| 13) | The Adviser’s commitment to provide resources to the Funds and the potential for increased distribution capabilities as a result of the Merger, which have the potential to result in long-term economies of scale; and |
| 14) | That the Adviser and Henderson would derive benefits from the Merger and that, as a result, they have a different financial interest in the matters that were being considered than do Fund shareholders. |
In connection with their consideration of the New Investment Advisory Agreement on October 24 2016, the Board noted that, in February 2016, April 2016 and October 2016, the Board had initially approved the respective Funds’ current investment advisory agreements. The Trustees considered that, in connection with the foregoing approvals, the Board had determined that the Adviser had the capabilities, resources and personnel necessary to provide the services to each Fund required under the current investment advisory agreement, and the advisory fee rates paid by each Fund, taking into account the unitary fees charged to the Funds, represented reasonable compensation to the Adviser in light of the services provided. The Trustees noted that the Board also considered the cost to the Adviser of providing those services, potential economies of scale as each Fund’s assets grow, the fees and expenses paid by other comparable funds, and such other matters as the Board had considered relevant in the exercise of their reasonable business judgment.
To inform their consideration of the New Agreement, the Independent Trustees received and considered responses by the Adviser and Henderson to inquiries requesting information regarding: Henderson’s structure, operations, financial resources and key personnel; the material aspects of the Merger, the proposed operations of Janus Henderson and its compliance program, code of ethics, trading policies and key management and investment personnel, including each Fund’s portfolio managers; and anticipated changes to the management or operations of the Board and the Funds, including, if applicable, any changes to the Funds’ service providers, advisory fees and expense structure.
In considering the information and materials described above, the Independent Trustees received assistance from, and met separately with, independent legal counsel and were provided with a written description of their statutory responsibilities and the legal standards that are applicable to approvals of advisory agreements. The Board did not identify any particular information that was most relevant to its consideration to approve the New Investment Management Agreement for each Fund and each Trustee may have afforded different weight to the various factors. Legal counsel to the Independent Trustees provided the Board with a memorandum regarding its responsibilities pertaining to the approval of the New Agreement. In determining whether to approve the New Investment Management Agreement, the Board considered the best interests of each Fund separately.
In voting to approve the New Investment Management Agreement, the Board considered the overall fairness of the New Investment Management Agreement and factors it deemed relevant with respect to each Fund, including, but not limited to: (i) the nature, extent and quality of the services to be provided by Janus Henderson, (ii) that the investment personnel who currently manage the Funds would continue to manage the Funds as employees of Janus Henderson, (iii) that the fees and expenses of the Funds after the Transaction are expected to remain the same, (iv) the projected profitability of the Funds to Janus Henderson and its affiliates; (v) whether the projected economies of scale would be realized as the Funds grow and whether any breakpoints are appropriate at certain asset levels and (vi) other benefits that may accrue Janus Henderson from its relationship with the Funds. The Board also considered that the Transaction might not be consummated if the New Investment Management Agreement was not approved by the Board and the shareholders of each Fund.
Although not meant to be all-inclusive, set forth below is a description of the information and certain factors that were considered by the Board, including the Independent Trustees in deciding to approve the New Investment Management Agreement in respect of each Fund:
The nature, extent and quality of services to be provided by Janus Henderson; personnel and operations of Janus Henderson.
In considering the nature, extent and quality of the services to be provided by Janus Henderson under the New Investment Management Agreement, the Board considered that the terms of the New Investment Management
| | |
| | Janus Detroit Street Trust ½ 25 |
The Organics ETF
Board Considerations Regarding Approval of Investment Advisory Agreements (unaudited)
Agreement are substantially similar to the terms of the current investment management agreement. The Board considered that the level of service and manner in which each Fund’s assets are managed were expected to remain the same.
The Board considered that, for a period of time after closing, the Adviser expects that the operations of Janus Henderson, as they relate to the Funds, would be the same as those of the Adviser. The Board considered that the
Adviser’s key personnel who provide services to the Funds are expected to provide those same services after the Merger. The Board also noted that the Merger is not expected to result in any change in the structure or operations of the Funds and that the Adviser does not currently anticipate any immediate changes to the Funds’ key service providers.
In evaluating Janus Henderson, the Board considered the history, background, reputation and qualification of the Adviser and Henderson, as well as their personnel and Henderson’s financial condition. The Board considered that Henderson is a global asset management firm that was established in 1934, and that it has a long history of asset management around the world. The Board also considered Henderson’s capabilities, experience, corporate structure and capital resources, as well as the Adviser’s long-term business goals with respect to the Janus Henderson Merger and the Funds.
Based on its consideration and review of the foregoing information, the Board determined that each Fund was likely to benefit from the nature, quality and extent of these services, as well as the Janus Henderson’s ability to render such services based on their experience, personnel, operations and resources.
Cost of the services to be provided and profits to be realized by Janus Henderson from the relationship with the Funds; “fall-out” benefits.
The Board noted that the unitary fee currently in place for each Fund will remain in place and unchanged under the New Investment Management Agreement.
The Board also discussed the anticipated costs and projected profitability of Janus Henderson in connection with its serving as investment adviser to each Fund, including operational costs. In addition, the Board discussed that the Funds’ expenses were not expected to increase materially as a result of the Merger. The Board also noted that Henderson does not currently provide any investment management services to other exchange traded funds. In light of the nature, extent and quality of services proposed to be provided by Janus Henderson and the costs expected to be incurred by Janus Henderson in rendering those services, the Board concluded that the level of fees proposed to be paid to Janus Henderson with respect to the Funds were fair and reasonable.
The extent to which economies of scale would be realized as the Funds grow and whether fee levels would reflect such economies of scale.
The Board next discussed potential economies of scale. The Board discussed the promised continued commitment to expand the distribution of Fund shares, and the potential for increased distribution capabilities as a result of the Merger, which have the potential to result in long-term economies of scale.
The Board also noted that since the Trust is newly formed, the eventual aggregate amount of assets was uncertain, and therefore specific information concerning the extent to which economies of scale would be realized as each Fund grows and whether fee levels would reflect such economies of scale, if any, was difficult to determine. The Board recognized the uncertainty in launching new investment products and estimating future asset levels.
Other Benefits to Janus Henderson.
The Board considered other potential benefits that may accrue to Janus Henderson as a result of its relationship with the Funds, which include reputational benefits that may enhance Janus Henderson’s ability to gain business opportunities from other clients.
Conclusion.
No single factor was determinative to the decision of the Board. Based on, but not limited to, the foregoing, and such other matters as were deemed relevant, the Board concluded that the New Investment Management Agreement was fair and reasonable in light of the services to be performed, fees, expenses and such other matters as the Board considered relevant in the exercise of its business judgment.
After full consideration of the above factors, as well as other factors, the Trustees, with the Independent Trustees voting separately, determined to approve the New Investment Management Agreement with respect to the Funds.
The Organics ETF
Shareholder Meeting (unaudited)
A Special Meeting of Shareholders of the Fund was held on March 17, 2017 and adjourned and reconvened on April 6, 2017 and April 18, 2017. At the meetings, the following matter was voted on and approved by the Shareholders. Each whole or fractional vote reported represents one whole or fractional dollar of net asset value held on the record date for the meetings. The results of the Special Meeting of Shareholders are noted below.
Proposal 1
To approve a new investment advisory agreement.
| | | | | | | | | | |
| | | | Number of Votes ($) |
| Record Date Votes ($) | | | Affirmative | | Against/Withhold | | Abstain | | Broker Non-Votes |
| | 2,486,000.000 | | | 1,022,442.080 | | 14,891.140 | | 208,127.920 | | 0.000 |
| | |
| | Janus Detroit Street Trust ½ 27 |
The Organics ETF
Trustees and Officers (unaudited)
The Fund’s Statement of Additional Information includes additional information about the Trustees and officers and is available, without charge, by calling 1-877-335-2687.
The following are the Trustees and officers of the Trust, together with a brief description of their principal occupations during the last five years (principal occupations for certain Trustees may include periods over five years).
Each Trustee has served in that capacity since he or she was originally elected or appointed. The Trustees do not serve a specified term of office. Each Trustee will hold office until the termination of the Trust or his or her earlier death, resignation, retirement, incapacity, or removal. Under the Fund’s Governance Procedures and Guidelines, the policy is for Trustees to retire no later than the end of the calendar year in which the Trustee turns 75. The Trustees review the Fund’s Governance Procedures and Guidelines from time to time and may make changes they deem appropriate. The Fund’s Nominating and Governance Committee will consider nominees for the position of Trustee recommended by shareholders. Shareholders may submit the name of a candidate for consideration by the Committee by submitting their recommendations to the Trust’s Secretary. Each Trustee is currently a Trustee of one other registered investment company advised by Janus Capital: Clayton Street Trust. Collectively, these two registered investment companies consist of 12 series or funds.
The Trust’s officers are elected annually by the Trustees for a one-year term. Certain officers also serve as officers of Clayton Street Trust. Certain officers of the Fund may also be officers and/or directors of Janus Capital. Fund officers receive no compensation from the Fund, except for the Fund’s Chief Compliance Officer, as authorized by the Trustees.
| | | | | | | | | | | | | | | | | | |
| TRUSTEES | | | | | | | | | | | | | | |
| Name, Address, and Age | | Positions Held
with the Trust | | | Length of Time Served | | | Principal Occupations
During the Past Five Years | | Number of
Portfolios/Funds
in Fund Complex
Overseen by
Trustee | | | Other Directorships
Held by Trustee
During the Past Five Years | |
Independent Trustees | | | | | | | | | | | | | | | | | | |
Clifford J. Weber 151 Detroit Street Denver, CO 80206 DOB: 1963 | |
| Chairman
Trustee |
| |
| 2/16-Present
2/16-Present |
| | Owner, Financial Products Consulting Group LLC (consulting services to financial institutions) (since 2015). Formerly, Executive Vice President of Global Index and Exchange- Traded Products, NYSE Market, Inc., a subsidiary of Intercontinental Exchange (ETF/ETP listing exchange) (2013-2015) and Executive Vice President and Head of Strategy and Product Development, NYSE Liffe U.S., a division of NYSE Euronext (U.S. futures exchange) (2008-2013). | | | 12 | | |
| Independent Trustee,
Clough Funds Trust
(investment
company) (since
2015); Chairman,
Clough Funds Trust
(investment
company) (since
2017); Independent
Trustee, Clough
Dividend and Income
Fund (closed-end
fund) (since 2017);
Independent Trustee,
Clough Global
Opportunities Fund
(closed-end fund)
(since 2017);
Independent Trustee,
Clough Global Equity
Fund (closed-end
fund) (since 2017);
Independent Trustee,
Elevation ETF Trust
(since 2016);
Chairman, Elevation
ETF Trust (since
2017) |
|
The Organics ETF
Trustees and Officers (unaudited)
| | | | | | | | | | | | | | | | | | |
| TRUSTEES | | | | | | | | | | | | | | |
| Name, Address, and Age | | Positions Held
with the Trust | | | Length of Time Served | | | Principal Occupations
During the Past Five Years | | Number of
Portfolios/Funds
in Fund Complex
Overseen by
Trustee | | | Other Directorships
Held by Trustee
During the Past Five Years | |
| | | | | |
Maureen T. Upton 151 Detroit Street Denver, CO 80206 DOB: 1965 | | | Trustee | | | | 2/16-Present | | | Principal, Maureen Upton Ltd. (consulting services to developers of major infrastructure projects and investors) (since 2017). Formerly, Principal Consultant, SRK Consulting (U.S.), Inc. (consulting services to global mining, energy and water resource industries) (2015-2017) and Founder and Principal, Resource Initiatives LLC (sustainability consulting firm) (2006-2015). | | | 12 | | |
| Director, Denver
Metro Leadership
Foundation (non-profit
organization)
(2012-2014). |
|
Jeffrey B. Weeden 151 Detroit Street Denver, CO 80206 DOB: 1956 | | | Trustee | | | | 2/16-Present | | | Senior Advisor, BayBoston Capital LP (investment fund in banks and bank holdings companies) (since 2015). Management Advisor, BoxCast, Inc. (technology start-up company) (2014-2017). Formerly Senior Executive Vice President and Chief Financial Officer, KeyCorp (financial services) (2002-2013). | | | 12 | | |
| Director, State Farm
Bank (banking)
(since 2014). |
|
Interested Trustee | | | | | | | | | | | | | | | | | | |
Michael Drew Elder** 151 Detroit Street Denver, CO 80206 DOB: 1970 | | | Trustee | | | | 8/15-Present | | | Executive Vice President and Head of U.S. Intermediary Distribution, Janus Capital (since 2014) and President, Janus Distributors LLC (broker- dealer) (since 2014). Formerly, Senior Vice President, Janus Capital (2007-2014). | | | 12 | | |
| Director, Perkins
Investment
Management LLC
(since 2014). |
|
| ** | Michael Drew Elder is an Interested Trustee because of his employment with Janus Capital. |
| | |
| | Janus Detroit Street Trust ½ 29 |
The Organics ETF
Trustees and Officers (unaudited)
| | | | | | |
| OFFICERS | | | | | | |
| Name, Address, and Age | | Positions Held with the Trust | | Term of Office* and
Length of Time Served | | Principal Occupations
During the Past Five Years |
Bruce L. Koepfgen 151 Detroit Street Denver, CO 80206 DOB: 1952 | | President and Chief Executive Officer | | 2/16-Present | | Head of North America for Janus Henderson Investors and Janus Capital Management (since 2017); Executive Vice President and Director of Janus International Holding LLC (since 2011); Executive Vice President of Janus Distributors LLC (since 2011); Vice President and Director of INTECH Investment Management LLC (since 2011); Executive Vice President and Director of Perkins Investment Management LLC (since 2011); and Executive Vice President and Director of Janus Management Holdings Corporation (since 2011). Formerly, President of Janus Capital Group Inc. and Janus Capital Management LLC (2013-2017); Executive Vice President of Janus Services LLC (2011-2015), Janus Capital Group Inc. and Janus Capital Management LLC (2011-2013); and Chief Financial Officer of Janus Capital Group Inc., Janus Capital Management LLC, Janus Distributors LLC, Janus Management Holdings Corporation, and Janus Services LLC (2011-2013). |
| | | |
Susan K. Wold 151 Detroit Street Denver, CO 80206 DOB: 1960 | | Vice President, Chief Compliance Officer, and Anti-Money Laundering Officer | | 10/17-Present; Vice President, Provisional Chief Compliance Officer, and Anti-Money Laundering Officer (9/17-10/17) | | Senior Vice President and Head of Compliance, North America for Janus Henderson (since September 2017); Formerly, Vice President, Head of Global Corporate Compliance, and Chief Compliance Officer for Janus Capital Management (May 2017-September 2017); Vice President, Compliance at Janus Capital Group and Janus Capital Management (2005-2017). |
| | | |
Jesper Nergaard 151 Detroit Street Denver, CO 80206 DOB: 1962 | | Vice President, Chief Financial Officer, Treasurer, and Principal Accounting Officer | | 2/16-Present | | Vice President of Janus Capital and Janus Services LLC. |
| | | |
Kathryn L. Santoro 151 Detroit Street Denver, CO 80206 DOB: 1973 | | Vice President, Secretary and Chief Legal Counsel | | 1/17-Present | | Vice President of Janus Capital and Janus Services LLC (since 2016). Formerly, Vice President and Associate Counsel of Curian Capital, LLC and Curian Clearing LLC (2013- 2016); and General Counsel and Secretary (2011-2012) and Vice President (2009-2012) of Old Mutual Capital, Inc. |
| * | Officers are elected at least annually by the Trustees for a one-year term and may also be elected from time to time by the Trustees for an interim period. |
The Organics ETF
Notes
| | |
| | Janus Detroit Street Trust ½ 31 |
The Organics ETF
Notes
The Organics ETF
Notes
| | |
| | Janus Detroit Street Trust ½ 33 |
Knowledge. Shared
At Janus Henderson, we believe in the sharing of expert insight for better investment and business decisions. We call this ethos Knowledge. Shared.
Learn more by visiting janushenderson.com.
This report is submitted for the general information of shareholders of the Fund. It is not an offer or solicitation for the Fund and is not authorized for distribution to prospective investors unless preceded or accompanied by an effective prospectus.
Janus Henderson is a trademark of Janus Henderson Investors. © Janus Henderson Investors. The name Janus Henderson Investors includes HGI Group Limited, Henderson Global Investors (Brand Management) Sarl and Janus International Holding LLC.
Janus Capital Management LLC is the investment adviser and ALPS Distributors, Inc. is the distributor. ALPS is not affiliated with Janus Henderson or any of its subsidiaries.
ANNUAL REPORT
October 31, 2017
Janus Henderson SG Global Quality Income ETF (formerly named Janus SG Global Quality Income ETF)
Janus Detroit Street Trust

Table of Contents
Janus Henderson SG Global Quality Income ETF (unaudited)
INVESTMENT OBJECTIVE
Janus Henderson SG Global Quality Income ETF seeks investment results that correspond generally to the performance, before fees and expenses, of an index which is designed to track the stocks of quality companies globally with attractive and sustainable dividends.
PERFORMANCE OVERVIEW
| • | | Global stocks enjoyed strong gains during the period. Stocks rallied through the beginning of the year after the November U.S. presidential election on the expectation that the new administration would champion pro-growth initiatives benefiting the global economy. Signs of synchronized economic growth in major world economies and corporate earnings strength were also supportive of stocks. |
| • | | During the period since inception, the Janus Henderson SG Global Quality Income ETF (SGQI) returned 14.65% (based on NAV); its primary benchmark, the SGI Global Quality Income Index, returned 14.51%, and its secondary benchmark, the MSCI World Index, returned 18.43%. |
| • | | SGQI seeks investment results that correspond generally, before fees and expenses, to the performance of its primary benchmark. The strategy seeks to provide investors with a consistent income stream by selecting quality, high-yielding companies across the globe. The strategy’s focus on dividend-generating companies negatively affected its performance given the growth-oriented environment during the period. |
| | |
| | Janus Detroit Street Trust ½ 1 |
Janus Henderson SG Global Quality Income ETF (unaudited)
Fund At A Glance
October 31, 2017
| | | | |
| 5 Largest Equity Holdings – (% of Net Assets) | |
Neste OYJ | | | | |
Oil, Gas & Consumable Fuels | | | 1.6% | |
Avangrid, Inc. | | | | |
Electric Utilities | | | 1.5% | |
Shaw Communications, Inc. | | | | |
Media | | | 1.4% | |
Abertis Infraestructuras SA | | | | |
Transportation Infrastructure | | | 1.4% | |
AGL Energy, Ltd. | | | | |
Multi-Utilities | | | 1.4% | |
| | | | |
| | | 7.3% | |
| | | | |
| Sector Allocation – (% of Net Assets) | |
Utilities | | | 27.0% | |
Consumer, Non-cyclical | | | 23.3% | |
Communications | | | 17.2% | |
Energy | | | 16.3% | |
Consumer, Cyclical | | | 10.7% | |
Industrial | | | 4.0% | |
Basic Materials | | | 1.4% | |
Investment Companies | | | 1.1% | |
| | | | |
| | | 101.0% | |
Holdings are subject to change without notice.
Janus Henderson SG Global Quality Income ETF (unaudited)
Performance
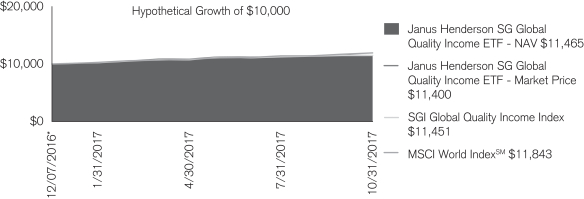
| | |
| Cumulative Total Return for the period ended October 31, 2017 |
| | | Since
Inception* |
Janus Henderson SG Global Quality Income ETF – NAV | | 14.65% |
Janus Henderson SG Global Quality Income ETF – Market Price | | 14.00% |
SGI Global Quality Income Index | | 14.51% |
MSCI World IndexSM | | 18.43% |
Total annual expense ratio (estimated) as stated in the December 5, 2016 prospectus: 0.45%
Returns quoted are past performance and do not guarantee future results; current performance may be lower or higher. Investment returns and principal value will vary; there may be a gain or loss when shares are sold. For the most recent month-end performance call 800.668.0434 or visit janushenderson.com/performance.
Shares of ETFs are bought and sold at market price (not NAV) and are not individually redeemed from the Fund. Market returns are based upon the midpoint of the bid/ask spread at 4:00 p.m. Eastern time (when NAV is normally determined for most ETFs), and do not represent the returns you would receive if you traded shares at other times. Ordinary brokerage commissions apply and will reduce returns.
ETF shares are not individually redeemable and owners of the shares may acquire those shares from the Fund and tender those shares for redemption to the Fund in Creation Units only.
Investing involves risk, including the possible loss of principal and fluctuation of value.
Performance depends on that of the underlying index.
The ETF is new and has less than one year of operating history.
See the prospectus for a more complete discussion of objectives, risks and expenses.
Returns include reinvestment of dividends and capital gains. Returns greater than one year are annualized. Returns do not reflect the deduction of taxes that a shareholder would pay on Fund distributions or redemptions of Fund shares.
See Financial Highlights for actual expense ratios during the reporting period.
There is no assurance the stated objective(s) will be met.
See Notes to Schedule of Investments and Other Information for index definitions.
Index performance does not reflect the expenses of managing a portfolio as an index is unmanaged and not available for direct investment.
The SGI Global Quality Income Index is the exclusive property of Societe Generale (“SG”) and is being used under license. SG has contracted with Solactive AG to maintain and calculate the Index. Neither SG nor Solactive have passed on the legality or suitability of SGQI, nor make any warranties or bear any liability for any errors or omissions in calculating the Index. SGQI is not sponsored, endorsed, or promoted by SG. “SGI Global Quality Income Index” is a service mark of Societe Generale. SG, Solactive, Janus Henderson and ALPS are unaffiliated.
| * | The Fund commenced operations on December 7, 2016. |
| | |
| | Janus Detroit Street Trust ½ 3 |
Janus Henderson SG Global Quality Income ETF (unaudited)
Disclosure of Fund Expenses
As a shareholder of the Fund, you incur two types of costs: (1) transaction costs, which may include creation and redemption fees or brokerage charges and (2) ongoing costs, including management fees and other Fund expenses. This example is intended to help you understand your ongoing costs (in dollars) of investing in the Fund and to compare these costs with the ongoing costs of investing in other ETFs. To do so, compare this 5% hypothetical example with the 5% hypothetical examples that appear in the shareholder reports of the other funds. The example is based upon an investment of $1,000 invested at the beginning of the period and held for the six-months indicated, unless noted otherwise in the table and footnotes below.
Actual Expenses
The information in the table under the heading “Actual” provides information about actual account values and actual expenses. You may use the information in these columns, together with the amount you invested, to estimate the expenses that you paid over the period. Simply divide your account value by $1,000 (for example, an $8,600 account value divided by $1,000 = 8.6), then multiply the result by the number under the heading entitled “Expenses Paid During Period” to estimate the expenses you paid on your account during the period.
Hypothetical Example for Comparison Purposes
The information in the table under the heading “Hypothetical (5% return before expenses)” provides information about hypothetical account values and hypothetical expenses based upon the Fund’s actual expense ratio and an assumed rate of return of 5% per year before expenses, which is not the Fund’s actual return. The hypothetical account values and expenses may not be used to determine the actual ending account balance or expenses you paid for the period. You may use this information to compare the ongoing costs of investing in the Fund and other funds. To do so, compare this 5% hypothetical example with the 5% hypothetical examples that appear in the shareholder reports of the other funds. Additionally, for an analysis of the fees associated with an investment or other similar funds, please visit www.finra.org/fundanalyzer.
Please note that the expenses shown in the table are meant to highlight your ongoing costs only and do not reflect any transaction costs, such as creation and redemption fees, or brokerage charges. These fees are fully described in the Fund’s prospectus. Therefore, the hypothetical examples are useful in comparing ongoing costs only, and will not help you determine the relative total costs of owning different funds. In addition, if these transaction costs were included, your costs would have been higher.
| | | | | | | | | | | | | | | | | | | | | | | | |
Actual | | | Hypothetical
(5% return before expenses) | | | | |
Beginning
Account
Value
(5/1/17) | | Ending
Account
Value
(10/31/2017) | | | Expenses
Paid During
Period
(5/1/17 - 10/31/2017)† | | | Beginning
Account
Value
(5/1/17) | | | Ending
Account
Value
(10/31/2017) | | | Expenses
Paid During
Period
(5/1/17 - 10/31/2017)† | | | Net Annualized
Expense Ratio
(5/1/17 - 10/31/2017) | |
| $1,000.00 | | $ | 1,068.90 | | | $ | 2.35 | | | $ | 1,000.00 | | | $ | 1,022.94 | | | $ | 2.29 | | | | 0.45% | |
| † | Expenses Paid During Period is equal to the Net Annualized Expense Ratio multiplied by the average account value over the period, multiplied by 184/365 (to reflect the one-half year period). |
Janus Henderson SG Global Quality Income ETF
Report of Independent Registered Public Accounting Firm
To the Board of Trustees of Janus Detroit Street Trust and Shareholders of
Janus Henderson SG Global Quality Income ETF:
In our opinion, the accompanying statement of assets and liabilities, including the schedule of investments, and the related statements of operations and of changes in net assets and the financial highlights present fairly, in all material respects, the financial position of the Janus Henderson SG Global Quality Income ETF Fund (one of the funds constituting Janus Detroit Street Trust, hereafter referred to as the “Fund”) as of October 31, 2017, and the results of its operations, the changes in its net assets and the financial highlights for the period from December 7, 2016 (commencement of operations) through October 31, 2017, in conformity with accounting principles generally accepted in the United States of America. These financial statements and financial highlights (hereafter referred to as “financial statements”) are the responsibility of the Fund’s management. Our responsibility is to express an opinion on these financial statements based on our audit. We conducted our audit of these financial statements in accordance with the standards of the Public Company Accounting Oversight Board (United States). Those standards require that we plan and perform the audit to obtain reasonable assurance about whether the financial statements are free of material misstatement. An audit includes examining, on a test basis, evidence supporting the amounts and disclosures in the financial statements, assessing the accounting principles used and significant estimates made by management, and evaluating the overall financial statement presentation. We believe that our audit, which included confirmation of securities as of October 31, 2017 by correspondence with the custodian, brokers and transfer agent, provides a reasonable basis for our opinion.

Denver, Colorado
December 20, 2017
| | |
| | Janus Detroit Street Trust ½ 5 |
Janus Henderson SG Global Quality Income ETF
Schedule of Investments
October 31, 2017
| | | | | | | | |
| | | Shares | | | Value | |
| Common Stocks – 99.9% | | | | | | |
| Auto Components – 1.4% | | | | | | |
Nokian Renkaat OYJ | | | 14,133 | | | | $648,197 | |
| Chemicals – 1.4% | | | | | | |
BASF SE | | | 6,113 | | | | 666,700 | |
| Diversified Telecommunication Services – 13.1% | | | | | | |
AT&T, Inc. | | | 18,018 | | | | 606,306 | |
BCE, Inc. | | | 13,623 | | | | 629,526 | |
Elisa OYJ | | | 14,913 | | | | 600,929 | |
Proximus SADP | | | 18,795 | | | | 624,233 | |
Singapore Telecommunications, Ltd. | | | 235,600 | | | | 648,488 | |
Spark New Zealand, Ltd. | | | 248,728 | | | | 627,039 | |
Swisscom AG | | | 1,246 | | | | 630,000 | |
Telia Co. AB | | | 134,198 | | | | 621,153 | |
TELUS Corp. | | | 17,856 | | | | 647,143 | |
Verizon Communications, Inc. | | | 13,440 | | | | 643,373 | |
| | | | | | | | |
| | | | | | | 6,278,190 | |
| Electric Utilities – 18.9% | | | | | | |
American Electric Power Co., Inc. | | | 8,759 | | | | 651,757 | |
Avangrid, Inc. | | | 13,405 | | | | 693,441 | |
CLP Holdings, Ltd. | | | 62,500 | | | | 635,671 | |
Duke Energy Corp. | | | 7,385 | | | | 652,169 | |
Endesa SA | | | 27,478 | | | | 629,006 | |
Fortis, Inc. | | | 17,499 | | | | 644,929 | |
Fortum OYJ | | | 30,464 | | | | 646,965 | |
Great Plains Energy, Inc. | | | 20,234 | | | | 664,282 | |
Hydro One, Ltd. | | | 35,198 | | | | 622,811 | |
OGE Energy Corp. | | | 17,433 | | | | 642,232 | |
Power Assets Holdings, Ltd. | | | 73,500 | | | | 636,853 | |
PPL Corp. | | | 17,127 | | | | 643,290 | |
Red Electrica Corp. SA | | | 29,746 | | | | 658,746 | |
SSE PLC | | | 34,757 | | | | 637,870 | |
| | | | | | | | |
| | | | | | | 9,060,022 | |
| Food & Staples Retailing – 1.3% | | | | | | |
Wesfarmers, Ltd. | | | 19,273 | | | | 617,703 | |
| Food Products – 6.6% | | | | | | |
Flowers Foods, Inc. | | | 33,945 | | | | 645,973 | |
Kellogg Co. | | | 10,382 | | | | 649,186 | |
Orkla ASA | | | 62,375 | | | | 609,502 | |
Tate & Lyle PLC | | | 73,007 | | | | 626,780 | |
WH Group, Ltd. | | | 634,056 | | | | 642,126 | |
| | | | | | | | |
| | | | | | | 3,173,567 | |
| Hotels, Restaurants & Leisure – 6.7% | | | | | | |
Cracker Barrel Old Country Store, Inc.# | | | 4,273 | | | | 667,143 | |
Crown Resorts, Ltd. | | | 69,816 | | | | 621,500 | |
Las Vegas Sands Corp. | | | 10,394 | | | | 658,772 | |
Sands China, Ltd. | | | 132,400 | | | | 623,664 | |
Tabcorp Holdings, Ltd. | | | 191,523 | | | | 659,357 | |
| | | | | | | | |
| | | | | | | 3,230,436 | |
| Household Durables – 2.7% | | | | | | |
Garmin, Ltd. | | | 11,719 | | | | 663,413 | |
Persimmon PLC | | | 17,226 | | | | 640,965 | |
| | | | | | | | |
| | | | | | | 1,304,378 | |
| Media – 1.4% | | | | | | |
Shaw Communications, Inc. - Class B | | | 29,441 | | | | 672,820 | |
| Multi-Utilities – 6.8% | | | | | | |
AGL Energy, Ltd. | | | 34,509 | | | | 668,639 | |
CenterPoint Energy, Inc. | | | 21,910 | | | | 648,098 | |
Dominion Energy, Inc. | | | 8,168 | | | | 662,751 | |
See Notes to Schedule of Investments and Other Information and Notes to Financial Statements.
Janus Henderson SG Global Quality Income ETF
Schedule of Investments
October 31, 2017
| | | | | | | | |
| | | Shares | | | Value | |
| Common Stocks – (continued) | | | | | | |
| Multi-Utilities – (continued) | | | | | | |
National Grid PLC | | | 51,886 | | | | $ 624,253 | |
NorthWestern Corp. | | | 10,934 | | | | 648,167 | |
| | | | | | | | |
| | | | | | | 3,251,908 | |
| Oil, Gas & Consumable Fuels – 17.7% | | | | | | |
Caltex Australia, Ltd. | | | 24,931 | | | | 654,909 | |
Chevron Corp. | | | 5,382 | | | | 623,720 | |
Enagas SA | | | 22,305 | | | | 642,589 | |
Eni SpA | | | 39,082 | | | | 639,221 | |
Exxon Mobil Corp. | | | 7,788 | | | | 649,130 | |
Inter Pipeline, Ltd. | | | 30,803 | | | | 627,004 | |
Neste OYJ | | | 13,882 | | | | 773,499 | |
Pembina Pipeline Corp. | | | 18,711 | | | | 619,055 | |
Repsol SA | | | 35,289 | | | | 661,253 | |
Royal Dutch Shell PLC - Class A | | | 21,009 | | | | 659,949 | |
Total SA | | | 11,872 | | | | 662,056 | |
TransCanada Corp. | | | 12,811 | | | | 608,699 | |
Woodside Petroleum, Ltd. | | | 27,671 | | | | 651,990 | |
| | | | | | | | |
| | | | | | | 8,473,074 | |
| Pharmaceuticals – 6.2% | | | | | | |
GlaxoSmithKline PLC | | | 31,891 | | | | 574,897 | |
Orion OYJ - Class B | | | 14,344 | | | | 588,193 | |
Pfizer, Inc. | | | 17,664 | | | | 619,300 | |
Roche Holding AG | | | 2,553 | | | | 590,356 | |
Sanofi | | | 6,504 | | | | 615,921 | |
| | | | | | | | |
| | | | | | | 2,988,667 | |
| Road & Rail – 1.3% | | | | | | |
ComfortDelGro Corp., Ltd. | | | 423,700 | | | | 628,211 | |
| Textiles, Apparel & Luxury Goods – 1.3% | | | | | | |
Hugo Boss AG | | | 6,968 | | | | 623,739 | |
Tobacco - 5.2% | | | | | | | | |
Altria Group, Inc. | | | 9,826 | | | | 631,026 | |
Japan Tobacco, Inc. | | | 19,500 | | | | 643,021 | |
KT&G Corp. | | | 6,883 | | | | 651,223 | |
Philip Morris International, Inc. | | | 5,605 | | | | 586,507 | |
| | | | | | | | |
| | | | | | | 2,511,777 | |
| Transportation Infrastructure – 5.2% | | | | | | |
Abertis Infraestructuras SA | | | 31,079 | | | | 672,336 | |
Macquarie Infrastructure Corp. | | | 8,858 | | | | 616,074 | |
Sydney Airport | | | 112,290 | | | | 612,159 | |
Transurban Group | | | 66,405 | | | | 617,612 | |
| | | | | | | | |
| | | | | | | 2,518,181 | |
| Wireless Telecommunication Services – 2.7% | | | | | | |
Freenet AG | | | 18,772 | | | | 627,296 | |
NTT DoCoMo, Inc. | | | 27,500 | | | | 663,359 | |
| | | | | | | | |
| | | | | | | | 1,290,655 | |
Total Common Stocks (cost $45,737,875) | | | | | | | 47,938,225 | |
| Investment Companies – 1.1% | | | | | | |
Investments Purchased with Cash Collateral from Securities Lending – 1.1% | | | | | | | | |
Janus Cash Collateral Fund LLC, 1.0003%ºº,£ | | | 514,073 | | | | 514,073 | |
| Money Markets – 0.0% | | | | | | |
State Street Institutional U.S. Government Money Market Fund, 0.9569%ºº | | | 29 | | | | 29 | |
Total Investment Companies (cost $514,102) | | | | | | | 514,102 | |
Total Investments (total cost $46,251,977) – 101.0% | | | | | | | 48,452,327 | |
Liabilities, net of Cash, Receivables and Other Assets – (1.0%) | | | | | | | (465,685) | |
Net Assets – 100% | | | | | | | $47,986,642 | |
See Notes to Schedule of Investments and Other Information and Notes to Financial Statements.
| | |
| | Janus Detroit Street Trust ½ 7 |
Janus Henderson SG Global Quality Income ETF
Schedule of Investments
October 31, 2017
Summary of Investments by Country – (Long Positions) (unaudited)
| | | | | | | | |
| Country | | Value | | | % of
Investment
Securities | |
United States | | | $14,016,799 | | | | 28.9% | |
Australia | | | 5,103,869 | | | | 10.5 | |
Canada | | | 5,071,987 | | | | 10.5 | |
Spain | | | 3,263,930 | | | | 6.7 | |
Finland | | | 3,257,783 | | | | 6.7 | |
United Kingdom | | | 3,104,765 | | | | 6.4 | |
Germany | | | 1,917,735 | | | | 4.0 | |
Hong Kong | | | 1,914,650 | | | | 4.0 | |
Switzerland | | | 1,883,769 | | | | 3.9 | |
Japan | | | 1,306,380 | | | | 2.7 | |
France | | | 1,277,977 | | | | 2.6 | |
Singapore | | | 1,276,699 | | | | 2.6 | |
Netherlands | | | 659,949 | | | | 1.4 | |
South Korea | | | 651,223 | | | | 1.3 | |
Italy | | | 639,221 | | | | 1.3 | |
New Zealand | | | 627,039 | | | | 1.3 | |
Belgium | | | 624,233 | | | | 1.3 | |
Macau | | | 623,664 | | | | 1.3 | |
Sweden | | | 621,153 | | | | 1.3 | |
Norway | | | 609,502 | | | | 1.3 | |
Total | | | $48,452,327 | | | | 100.0% | |
Schedules of Affiliated Investments – (% of Net Assets)
| | | | | | | | | | | | | | | | |
| | | Dividend Income | | | Realized
Gain/(Loss) | | | Change in Unrealized
Appreciation/
(Depreciation) | | | Value at
10/31/17 | |
Investment Companies – 1.1% | | | | | | | | | | | | | | | | |
Investments Purchased with Cash Collateral from Securities Lending – 1.1% | | | | | | | | | | | | | | | | |
Janus Cash Collateral Fund LLC, 1.0003%ºº | | | $13,202 | D | | | $ — | | | | $ — | | | | $514,073 | |
| | | | |
| | | Share Balance
at 10/31/16 | | | Purchases | | | Sales | | | Share Balance
at 10/31/17 | |
Investment Companies – 1.1% | | | | | | | | | | | | | | | | |
Investments Purchased with Cash Collateral from Securities Lending – 1.1% | | | | | | | | | | | | | | | | |
Janus Cash Collateral Fund LLC, 1.0003%ºº | | | — | | | | 10,402,984 | | | | (9,888,911) | | | | 514,073 | |
See Notes to Schedule of Investments and Other Information and Notes to Financial Statements.
Janus Henderson SG Global Quality Income ETF
Notes to Schedule of Investments and Other Information
| | |
| MSCI World IndexSM | | MSCI All Country World IndexSM reflects the equity market performance of global developed and emerging markets. |
| |
| SGI Global Quality Income Index | | SGI Global Quality Income Index (NTR-USD) (SGQINTRD) includes non-financial global developed country stocks, which meet certain criteria for market capitalization, average daily volume, business quality, balance sheet risk and dividend yield. |
| |
| LLC | | Limited Liability Company |
| |
| PLC | | Public Limited Company |
| # | Loaned security; a portion of the security is on loan at October 31, 2017. |
| ºº | Rate shown is the 7-day yield as of October 31, 2017. |
| £ | The Fund may invest in certain securities that are considered affiliated companies. As defined by the Investment Company Act of 1940, as amended, an affiliated company is one in which the Fund owns 5% or more of the outstanding voting securities, or a company which is under common ownership or control. |
| D | Net of income paid to the securities lending agent and rebates paid to the borrowing counterparties. |
The following is a summary of the inputs that were used to value the Fund’s investments in securities and other financial instruments as of October 31, 2017. See Notes to Financial Statements for more information.
Valuation Inputs Summary
| | | | | | | | | | | | |
| | | Level 1 -
Quoted Prices | | | Level 2 -
Other Significant
Observable Inputs | | | Level 3 -
Significant
Unobservable Inputs | |
Assets | | | | | | | | | | | | |
Investments in Securities: | | | | | | | | | | | | |
Common Stocks | | $ | 47,938,225 | | | $ | — | | | $ | — | |
Investment Companies | | | 29 | | | | 514,073 | | | | — | |
| | | | |
Total Assets | | $ | 47,938,254 | | | $ | 514,073 | | | $ | — | |
| | |
| | Janus Detroit Street Trust ½ 9 |
Janus Henderson SG Global Quality Income ETF
Statement of Assets and Liabilities
October 31, 2017
| | | | |
Assets: | | | | |
Unaffiliated investments, at value(1)(2) | | $ | 47,938,254 | |
Affiliated investments, at value(3) | | | 514,073 | |
Cash denominated in foreign currency(4) | | | 5,187 | |
Receivables: | | | | |
Investments sold | | | 15,308 | |
Dividends | | | 98,124 | |
Affiliated securities lending income, net | | | 4,500 | |
Total Assets | | | 48,575,446 | |
Liabilities: | | | | |
Collateral on securities loaned (Note 2) | | | 514,073 | |
Payables: | | | | |
Due to custodian | | | 56,915 | |
Investments purchased | | | 37 | |
Management fees | | | 17,779 | |
Total Liabilities | | | 588,804 | |
Net Assets | | $ | 47,986,642 | |
Net Assets Consists of: | | | | |
Capital (par value and paid-in surplus) | | $ | 45,675,837 | |
Undistributed net investment income/(loss) | | | 135,222 | |
Undistributed net realized gain/(loss) from investments and foreign currency transactions | | | (24,617) | |
Unrealized net appreciation/(depreciation) on investments and foreign currency translations | | | 2,200,200 | |
Total Net Assets | | $ | 47,986,642 | |
Net Assets | | $ | 47,986,642 | |
Shares outstanding, $0.001 Par Value (unlimited shares authorized) | | | 1,700,001 | |
Net Asset Value Per Share | | $ | 28.23 | |
| (1) | Includes cost of $45,737,904. |
| (2) | Includes $503,376 of securities on loan. See Note 2 in Notes to Financial Statements. |
| (3) | Includes cost of $514,073. |
| (4) | Includes cost of $5,210. |
See Notes to Financial Statements.
Janus Henderson SG Global Quality Income ETF
Statement of Operations
For the period ended October 31, 2017(1)
| | | | |
Investment Income: | | | | |
Dividends | | $ | 2,011,801 | |
Affiliated securities lending income, net | | | 13,202 | |
Foreign tax withheld | | | (147,303) | |
Total Investment Income | | | 1,877,700 | |
Expenses: | | | | |
Management Fees | | | 169,613 | |
Total Expenses | | | 169,613 | |
Net Investment Income/(Loss) | | | 1,708,087 | |
Net Realized Gain/(Loss) on Investments: | | | | |
Investments and foreign currency transactions | | | 2,007,954 | |
Total Net Realized Gain/(Loss) on Investments | | | 2,007,954 | |
Change in Unrealized Net Appreciation/Depreciation: | | | | |
Investments and foreign currency translations | | | 2,200,200 | |
Total Change in Unrealized Net Appreciation/Depreciation | | | 2,200,200 | |
Net Increase/(Decrease) in Net Assets Resulting from Operations | | $ | 5,916,241 | |
| (1) | Period from December 7, 2016 (commencement of operations) through October 31, 2017. |
See Notes to Financial Statements.
| | |
| | Janus Detroit Street Trust ½ 11 |
Janus Henderson SG Global Quality Income ETF
Statement of Changes in Net Assets
| | | | |
| | | Period ended
October 31, 2017(1) | |
Operations: | | | | |
Net investment income/(loss) | | $ | 1,708,087 | |
Net realized gain/(loss) on investments | | | 2,007,954 | |
Change in unrealized net appreciation/depreciation | | | 2,200,200 | |
Net Increase/(Decrease) in Net Assets Resulting from Operations | | | 5,916,241 | |
Dividends and Distributions to Shareholders: | | | | |
Dividends from Net Investment Income | | | (1,601,928) | |
Capital Share Transactions | | | 43,672,329 | |
Net Increase/(Decrease) in Net Assets | | | 47,986,642 | |
Net Assets: | | | | |
Beginning of period | | | — | |
End of period | | $ | 47,986,642 | |
| |
| | | | |
Undistributed Net Investment Income/(Loss) | | $ | 135,222 | |
| (1) | Period from December 7, 2016 (commencement of operations) through October 31, 2017. |
See Notes to Financial Statements.
Janus Henderson SG Global Quality Income ETF
Financial Highlights
| | | | | | |
| For a share outstanding during the period ended October 31 | | 2017(1) | |
| | Net Asset Value, Beginning of Period | | | $25.59 | |
| | Income/(Loss) from Investment Operations: | | | | |
| | Net investment income/(loss)(2) | | | 1.12 | |
| | Net realized and unrealized gain/(loss) | | | 2.58 | |
| | Total from Investment Operations | | | 3.70 | |
| | Less Dividends and Distributions: | | | | |
| | Dividends (from net investment income) | | | (1.06) | |
| | Total Dividends and Distributions | | | (1.06) | |
| | Net Asset Value, End of Period | | | $28.23 | |
| | Total Return* | | | 14.65% | |
| | Net assets, End of Period (in thousands) | | | $47,987 | |
| | Average Net Assets for the Period (in thousands) | | | $41,816 | |
| | Ratios to Average Net Assets**: | | | | |
| | Ratio of Gross Expenses | | | 0.45% | |
| | Ratio of Net Investment Income/(Loss) | | | 4.53% | |
| | Portfolio Turnover Rate(3) | | | 99% | |
| * | Total return not annualized for periods of less than one full year. |
| ** | Annualized for periods of less than one full year. |
| (1) | Period from December 7, 2016 (commencement of operations) through October 31, 2017. |
| (2) | Per share amounts are calculated based on average shares outstanding during the year or period |
| (3) | Portfolio turnover rate excludes securities received or delivered from in-kind processing of creation or redemptions. |
See Notes to Financial Statements.
| | |
| | Janus Detroit Street Trust ½ 13 |
Janus Henderson SG Global Quality Income ETF
Notes to Financial Statements
1. Organization and Significant Accounting Policies
Janus Henderson SG Global Quality Income ETF (the “Fund”) (formerly named Janus SG Global Quality Income ETF) is a series fund. The Fund is part of Janus Detroit Street Trust (the “Trust”), which is organized as a Delaware statutory trust and is registered under the Investment Company Act of 1940, as amended (the “1940 Act”), as an open-end management investment company, and therefore has applied the specialized accounting and reporting guidance in Financial Accounting Standards Board (“FASB”) Accounting Standards Codification (“ASC”) Topic 946. The financial statements include information for the period from December 7, 2016 (commencement of operations) through October 31, 2017. The Trust offers nine Funds each of which represent shares of beneficial interest in a separate portfolio of securities and other assets with its own objective and policies. The Fund seeks investment results that correspond generally to the performance, before fees and expenses, of an index (“Underlying Index”) which is designed to track the stocks of quality companies globally with attractive and sustainable dividends. The Fund is classified as diversified, as defined in the 1940 Act.
Unlike shares of traditional mutual funds, shares of the Fund are not individually redeemable and may only be purchased or redeemed directly from the Fund at net asset value (“NAV”) in large increments called “Creation Units” (50,000 shares per Creation Unit) through certain participants, known as “Authorized Participants.” The Fund will issue or redeem Creation Units in exchange for portfolio securities and/or cash. Except when aggregated in Creation Units, Fund shares are not redeemable securities of the Fund. Shares of the Fund are listed and trade on The NASDAQ Stock Market LLC (“NASDAQ”) and individual investors can purchase or sell shares in much smaller increments for cash in the secondary market through a broker. These transactions, which do not involve the Fund, are made at market prices that may vary throughout the day and differ from the Fund’s NAV. As a result, you may pay more than NAV (at a premium) when you purchase shares, and receive less than NAV (at a discount) when you sell shares, in the secondary market.
An Authorized Participant may hold of record more than 25% of the outstanding shares of the Fund. From time to time, Authorized Participants may be a beneficial and/or legal owner of the Fund, may be affiliated with an index provider, may be deemed to have control of the Fund and/or may be able to affect the outcome of matters presented for a vote of the shareholders of the Fund. Authorized Participants may execute an irrevocable proxy granting the Distributor or an affiliate of Janus Capital Management LLC (“Janus Capital” or “Janus”) power to vote or abstain from voting such Authorized Participant’s beneficially or legally owned shares of the Fund. In such cases, the agent shall mirror vote (or abstain from voting) such shares in the same proportion as all other beneficial owners of the Fund.
The following accounting policies have been followed by the Fund and are in conformity with accounting principles generally accepted in the United States of America.
Investment Valuation
Securities held by the Fund are valued in accordance with policies and procedures established by and under the supervision of the Trustees (the “Valuation Procedures”). Equity securities traded on a domestic securities exchange are generally valued at the closing prices on the primary market or exchange on which they trade. If such price is lacking for the trading period immediately preceding the time of determination, such securities are valued at their current bid price. Equity securities that are traded on a foreign exchange are generally valued at the closing prices on such markets. In the event that there is no current trading volume on a particular security in such foreign exchange, the bid price from the primary exchange is generally used to value the security. Securities that are traded on the over-the-counter (“OTC”) markets are generally valued at their closing or latest bid prices as available. Foreign securities and currencies are converted to U.S. dollars using the applicable exchange rate in effect at the close of the New York Stock Exchange (“NYSE”). The Fund will determine the market value of individual securities held by it by using prices provided by one or more approved professional pricing services or, as needed, by obtaining market quotations from independent broker-dealers. Most debt securities are valued in accordance with the evaluated bid price supplied by the pricing service that is intended to reflect market value. The evaluated bid price supplied by the pricing service is an evaluation that may consider factors such as security prices, yields, maturities and ratings. Certain short-term securities maturing within 60 days or less may be evaluated and valued on an amortized cost basis provided that the amortized cost determined approximates market value. Securities for which market quotations or evaluated prices are not readily available or are deemed unreliable are valued at fair value determined in good faith under the Valuation Procedures. Circumstances in which fair value pricing may be utilized include, but are not limited to: (i) a significant event that may affect the securities of a single issuer, such as a merger, bankruptcy, or significant issuer-specific development; (ii) an event that may affect an entire market, such as a natural disaster or significant governmental action; (iii) a nonsignificant event such as a market closing early or not opening, or a security trading halt; and (iv) pricing of a nonvalued security and a restricted or nonpublic security. Special valuation considerations may apply with respect to “odd-lot” fixed-income transactions which, due to their
Janus Henderson SG Global Quality Income ETF
Notes to Financial Statements
small size, may receive evaluated prices by pricing services which reflect a large block trade and not what actually could be obtained for the odd-lot position.
Valuation Inputs Summary
FASB ASC 820, Fair Value Measurements and Disclosures (“ASC 820”), defines fair value, establishes a framework for measuring fair value, and expands disclosure requirements regarding fair value measurements. This standard emphasizes that fair value is a market-based measurement that should be determined based on the assumptions that market participants would use in pricing an asset or liability and establishes a hierarchy that prioritizes inputs to valuation techniques used to measure fair value. These inputs are summarized into three broad levels:
Level 1 – Unadjusted quoted prices in active markets the Fund has the ability to access for identical assets or liabilities.
Level 2 – Observable inputs other than unadjusted quoted prices included in Level 1 that are observable for the asset or liability either directly or indirectly. These inputs may include quoted prices for the identical instrument on an inactive market, prices for similar instruments, interest rates, prepayment speeds, credit risk, yield curves, default rates and similar data.
Assets or liabilities categorized as Level 2 in the hierarchy generally include: debt securities fair valued in accordance with the evaluated bid or ask prices supplied by a pricing service; securities traded on OTC markets and listed securities for which no sales are reported that are fair valued at the latest bid price (or yield equivalent thereof) obtained from one or more dealers transacting in a market for such securities or by a pricing service approved by the Fund’s Trustees; and certain short-term debt securities with maturities of 60 days or less that are fair valued at amortized cost. Other securities that may be categorized as Level 2 in the hierarchy include, but are not limited to, preferred stocks, bank loans, swaps, investments in unregistered investment companies, options, and forward contracts.
Level 3 – Unobservable inputs for the asset or liability to the extent that relevant observable inputs are not available, representing the Fund’s own assumptions about the assumptions that a market participant would use in valuing the asset or liability, and that would be based on the best information available.
There have been no significant changes in valuation techniques used in valuing any such positions held by the Fund since the beginning of the fiscal year.
The inputs or methodology used for fair valuing securities are not necessarily an indication of the risk associated with investing in those securities. The summary of inputs used as of October 31, 2017 to fair value the Fund’s investments in securities and other financial instruments is included in the “Valuation Inputs Summary” in the Notes to Schedule of Investments and Other Information.
There were no transfers between Level 1, Level 2 and Level 3 of the fair value hierarchy during the period. The Fund recognizes transfers between the levels as of the beginning of the fiscal year.
Investment Transactions and Investment Income
Investment transactions are accounted for as of the date purchased or sold (trade date). Dividend income is recorded on the ex-dividend date. Certain dividends from foreign securities will be recorded as soon as the Fund is informed of the dividend, if such information is obtained subsequent to the ex-dividend date. Dividends from foreign securities may be subject to withholding taxes in foreign jurisdictions. Gains and losses are determined on the identified cost basis, which is the same basis used for federal income tax purposes.
Estimates
The preparation of financial statements in conformity with accounting principles generally accepted in the United States of America requires management to make estimates and assumptions that affect the reported amount of assets and liabilities and disclosure of contingent assets and liabilities at the date of the financial statements and the reported amounts of income and expenses during the reporting period. Actual results could differ from those estimates.
Indemnifications
In the normal course of business, the Fund may enter into contracts that contain provisions for indemnification of other parties against certain potential liabilities. The Fund’s maximum exposure under these arrangements is unknown, and would involve future claims that may be made against the Fund that have not yet occurred. Currently, the risk of material loss from such claims is considered remote.
| | |
| | Janus Detroit Street Trust ½ 15 |
Janus Henderson SG Global Quality Income ETF
Notes to Financial Statements
Foreign Currency Translations
The Fund does not isolate that portion of the results of operations resulting from the effect of changes in foreign exchange rates on investments from the fluctuations arising from changes in market prices of securities held at the date of the financial statements. Net unrealized appreciation or depreciation of investments and foreign currency translations arise from changes in the value of assets and liabilities, including investments in securities held at the date of the financial statements, resulting from changes in the exchange rates and changes in market prices of securities held.
Currency gains and losses are also calculated on payables and receivables that are denominated in foreign currencies. The payables and receivables are generally related to foreign security transactions and income translations.
Foreign currency-denominated assets and forward currency contracts may involve more risks than domestic transactions, including currency risk, counterparty risk, political and economic risk, regulatory risk and equity risk. Risks may arise from unanticipated movements in the value of foreign currencies relative to the U.S. dollar.
Dividends and Distributions
The Fund generally declares and distributes dividends of net investment income quarterly. Net realized capital gains (if any) are distributed annually. The Fund may treat a portion of the amount paid to redeem shares as a distribution of investment company taxable income and realized capital gains that are reflected in the NAV. This practice, commonly referred to as “equalization,” has no effect on the redeeming shareholder or a Fund’s total return, but may reduce the amounts that would otherwise be required to be paid as taxable dividends to the remaining shareholders. It is possible that the Internal Revenue Service (IRS) could challenge the Fund’s equalization methodology or calculations, and any such challenge could result in additional tax, interest, or penalties to be paid by the Fund.
Federal Income Taxes
The Fund intends to qualify as a regulated investment company and distribute all of its taxable income in accordance with the requirements of Subchapter M of the Internal Revenue Code. Management has analyzed the Fund’s tax positions taken for all open federal income tax years, generally a three-year period, and has concluded that no provision for federal income tax is required in the Fund’s financial statements. The Fund is not aware of any tax positions for which it is reasonably possible that the total amounts of unrecognized tax benefits will significantly change in the next twelve months.
2. Other Investments and Strategies
Additional Investment Risk
The financial crisis in both the U.S. and global economies over the past several years has resulted, and may continue to result, in a significant decline in the value and liquidity of many securities of issuers worldwide in the equity and fixed income/credit markets. In response to the crisis, the United States and certain foreign governments, along with the U.S. Federal Reserve and certain foreign central banks, took steps to support the financial markets. The withdrawal of this support, a failure of measures put in place to respond to the crisis, or investor perception that such efforts were not sufficient could each negatively affect financial markets generally, and the value and liquidity of specific securities. In addition, policy and legislative changes in the United States and in other countries continue to impact many aspects of financial regulation. The effect of these changes on the markets, and the practical implications for market participants, including the Fund, may not be fully known for some time. As a result, it may also be unusually difficult to identify both investment risks and opportunities, which could limit or preclude the Fund’s ability to achieve its investment objective. Therefore, it is important to understand that the value of your investment may fall, sometimes sharply, and you could lose money.
The enactment of the Dodd-Frank Wall Street Reform and Consumer Protection Act (the “Dodd-Frank Act”) provided for widespread regulation of financial institutions, consumer financial products and services, broker-dealers, OTC derivatives, investment advisers, credit rating agencies, and mortgage lending, which expanded federal oversight in the financial sector, including the investment management industry. Certain provisions of the Dodd-Frank Act remain pending and will be implemented through future rulemaking. Therefore, the ultimate impact of the Dodd-Frank Act and the regulations under the Dodd-Frank Act on the Fund and the investment management industry as a whole, is not yet certain.
A number of countries in the European Union (“EU”) have experienced, and may continue to experience, severe economic and financial difficulties. In particular, many EU nations are susceptible to economic risks associated with high levels of debt, notably due to investments in sovereign debt of countries such as Greece, Italy, Spain, Portugal, and Ireland. Many non-governmental issuers, and even certain governments, have defaulted on, or been forced to restructure, their debts. Many other issuers have faced difficulties obtaining credit or refinancing existing obligations. Financial institutions have in
Janus Henderson SG Global Quality Income ETF
Notes to Financial Statements
many cases required government or central bank support, have needed to raise capital, and/or have been impaired in their ability to extend credit. As a result, financial markets in the EU experienced extreme volatility and declines in asset values and liquidity. Responses to these financial problems by European governments, central banks, and others, including austerity measures and reforms, may not work, may result in social unrest, and may limit future growth and economic recovery or have other unintended consequences. Further defaults or restructurings by governments and others of their debt could have additional adverse effects on economies, financial markets, and asset valuations around the world. Greece, Ireland, and Portugal have already received one or more “bailouts” from other Eurozone member states, and it is unclear how much additional funding they will require or if additional Eurozone member states will require bailouts in the future. The risk of investing in securities in the European markets may also be heightened due to the referendum in which the United Kingdom voted to exit the EU (known as “Brexit”). One or more other countries may also abandon the euro and/ or withdraw from the EU, placing its currency and banking system in jeopardy.
Certain areas of the world have historically been prone to and economically sensitive to environmental events such as, but not limited to, hurricanes, earthquakes, typhoons, flooding, tidal waves, tsunamis, erupting volcanoes, wildfires or droughts, tornadoes, mudslides, or other weather-related phenomena. Such disasters, and the resulting physical or economic damage, could have a severe and negative impact on the Fund’s investment portfolio and, in the longer term, could impair the ability of issuers in which the Fund invests to conduct their businesses as they would under normal conditions. Adverse weather conditions may also have a particularly significant negative effect on issuers in the agricultural sector and on insurance companies that insure against the impact of natural disasters.
Counterparties
Fund transactions involving a counterparty are subject to the risk that the counterparty or a third party will not fulfill its obligation to the Fund (“counterparty risk”). Counterparty risk may arise because of the counterparty’s financial condition (i.e., financial difficulties, bankruptcy, or insolvency), market activities and developments, or other reasons, whether foreseen or not. A counterparty’s inability to fulfill its obligation may result in significant financial loss to the Fund. The Fund may be unable to recover its investment from the counterparty or may obtain a limited recovery, and/or recovery may be delayed. The extent of the Fund’s exposure to counterparty risk with respect to financial assets and liabilities approximates its carrying value. See the “Offsetting Assets and Liabilities” section of this Note for further details.
The Fund may be exposed to counterparty risk through participation in various programs, including, but not limited to, lending its securities to third parties, cash sweep arrangements whereby the Fund’s cash balance is invested in one or more types of cash management vehicles, as well as investments in, but not limited to, repurchase agreements, and derivatives, including various types of swaps, futures and options. The Fund intends to enter into financial transactions with counterparties that Janus Capital believes to be creditworthy at the time of the transaction. There is always the risk that Janus Capital’s analysis of a counterparty’s creditworthiness is incorrect or may change due to market conditions. To the extent that the Fund focuses its transactions with a limited number of counterparties, it will have greater exposure to the risks associated with one or more counterparties.
Offsetting Assets and Liabilities
The Fund presents gross and net information about transactions that are either offset in the financial statements or subject to an enforceable master netting arrangement or similar agreement with a designated counterparty, regardless of whether the transactions are actually offset in the Statement of Assets and Liabilities.
Deutsche Bank AG acts as securities lending agent and a limited purpose custodian or subcustodian to receive and disburse cash balances and cash collateral, hold short-term investments, hold collateral, and perform other custodian functions in accordance with the Agency Securities Lending and Repurchase Agreement. For financial reporting purposes, the Fund does not offset financial instruments’ payables and receivables and related collateral on the Statement of Assets and Liabilities. Securities on loan will be continuously secured by collateral which may consist of cash, U.S. Government securities, domestic and foreign short-term debt instruments, letters of credit, time deposits, repurchase agreements, money market mutual funds or other money market accounts, or such other collateral as permitted by the SEC. The value of the collateral must be at least 102% of the market value of the loaned securities that are denominated in U.S. dollars and 105% of the market value of the loaned securities that are not denominated in U.S. dollars. Upon receipt of cash collateral, Janus Capital intends to invest the cash collateral in a cash management vehicle for which Janus Capital serves as investment adviser, Janus Cash Collateral Fund LLC. Loaned securities and related collateral are marked-to-market each business day based upon the market value of the loaned securities at the close of business, employing the most recent available pricing information. Collateral levels are then adjusted based on this mark-to-market evaluation.
| | |
| | Janus Detroit Street Trust ½ 17 |
Janus Henderson SG Global Quality Income ETF
Notes to Financial Statements
The following table presents gross amounts of recognized assets and/or liabilities and the net amounts after deducting collateral that has been pledged by counterparties or has been pledged to counterparties (if applicable). For corresponding information grouped by type of instrument, see the Fund’s Schedule of Investments.
Offsetting of Financial Assets and Derivative Assets
| | | | | | | | | | | | | | | | | | |
| Counterparty | | | Gross Amounts
of Recognized
Assets | | | Offsetting Asset
or Liability(a) | | | Collateral
Pledged(b) | | | Net Amount | |
| | Deutsche Bank AG | | | $ | 503,376 | | | $ | — | | | $ | (503,376) | | | $ | — | |
| (a) | Represents the amount of assets or liabilities that could be offset with the same counterparty under master netting or similar agreements that management elects not to offset on the Statement of Assets and Liabilities. |
| (b) | Collateral pledged is limited to the net outstanding amount due to/from an individual counterparty. The actual collateral amounts pledged may exceed these amounts and may fluctuate in value. |
Securities Lending
Under procedures adopted by the Trustees, the Fund may seek to earn additional income by lending securities to qualified parties. Deutsche Bank AG acts as securities lending agent and a limited purpose custodian or subcustodian to receive and disburse cash balances and cash collateral, hold short-term investments, hold collateral, and perform other custodian functions. The Fund may lend portfolio securities in an amount equal to up to 1/3 of its total assets as determined at the time of the loan origination. There is the risk of delay in recovering a loaned security or the risk of loss in collateral rights if the borrower fails financially. In addition, Janus Capital makes efforts to balance the benefits and risks from granting such loans. All loans will be continuously secured by collateral which may consist of cash, U.S. Government securities, domestic and foreign short-term debt instruments, letters of credit, time deposits, repurchase agreements, money market mutual funds or other money market accounts, or such other collateral as permitted by the SEC. If the Fund is unable to recover a security on loan, the Fund may use the collateral to purchase replacement securities in the market. There is a risk that the value of the collateral could decrease below the cost of the replacement security by the time the replacement investment is made, resulting in a loss to the Fund.
Upon receipt of cash collateral, Janus Capital may invest it in affiliated or non-affiliated cash management vehicles, whether registered or unregistered entities, as permitted by the 1940 Act and rules promulgated thereunder. Janus Capital currently intends to invest the cash collateral in a cash management vehicle for which Janus Capital serves as investment adviser, Janus Cash Collateral Fund LLC. An investment in Janus Cash Collateral Fund LLC is generally subject to the same risks that shareholders experience when investing in similarly structured vehicles, such as the potential for significant fluctuations in assets as a result of the purchase and redemption activity of the securities lending program, a decline in the value of the collateral, and possible liquidity issues. Such risks may delay the return of the cash collateral and cause the Fund to violate its agreement to return the cash collateral to a borrower in a timely manner. As adviser to the Fund and Janus Cash Collateral Fund LLC, Janus Capital has an inherent conflict of interest as a result of its fiduciary duties to both the Fund and Janus Cash Collateral Fund LLC. Additionally, Janus Capital receives an investment advisory fee of 0.05% for managing Janus Cash Collateral Fund LLC, but it may not receive a fee for managing certain other affiliated cash management vehicles in which the Fund may invest, and therefore may have an incentive to allocate preferred investment opportunities to investment vehicles for which it is receiving a fee.
The value of the collateral must be at least 102% of the market value of the loaned securities that are denominated in U.S. dollars and 105% of the market value of the loaned securities that are not denominated in U.S. dollars. Loaned securities and related collateral are marked-to-market each business day based upon the market value of the loaned securities at the close of business, employing the most recent available pricing information. Collateral levels are then adjusted based on this mark-to-market evaluation.
The cash collateral invested by Janus Capital is disclosed in the Schedule of Investments (if applicable). Income earned from the investment of the cash collateral, net of rebates paid to, or fees paid by, borrowers and less the fees paid to the lending agent are included as “Affiliated securities lending income, net” on the Statement of Operations. As of October 31, 2017, securities lending transactions accounted for as secured borrowings with an overnight and continuous contractual maturity are $503,376 for equity securities. Gross amounts of recognized liabilities for securities lending (collateral received) as of October 31, 2017 is $514,073, resulting in the net amount due to the counterparty of $10,697.
Janus Henderson SG Global Quality Income ETF
Notes to Financial Statements
3. Investment Advisory Agreements and Other Transactions with Affiliates
Under its unitary fee structure, the Fund pays Janus Capital a management fee in return for providing certain investment advisory, supervisory, and administrative services to the Fund, including the costs of transfer agency, custody, fund administration, legal, audit, and other services. Janus Capital’s fee structure is designed to pay substantially all of the Fund’s expenses. However, the Fund bears other expenses which are not covered under the management fee which may vary and affect the total level of expenses paid by shareholders, such as distribution fees (if any), brokerage expenses or commissions, interest, dividends, taxes, litigation expenses, acquired fund fees and expenses (if any), and extraordinary expenses. The Fund’s management fee is calculated daily and paid monthly. The Fund’s contractual management fee rate (expressed as an annual rate) is 0.45% of the Fund’s average daily net assets.
State Street Bank and Trust Company (“State Street”) provides certain fund administration services to the Fund, including services related to the Fund’s accounting, including calculating the daily NAV, audit, tax, and reporting obligations, pursuant to an agreement with Janus Capital, on behalf of the Fund. As compensation for such services, Janus Capital pays State Street a fee based on a percentage of the Fund’s assets, with a minimum flat fee, for certain services. Janus Capital serves as administrator to the Fund, providing oversight and coordination of the Fund’s service providers, recordkeeping and other administrative services. Janus Capital does not receive any additional compensation, beyond the unitary fee, for serving as administrator. State Street also serves as transfer agent for the shares of the Fund.
The Trust has adopted a Distribution and Servicing Plan for shares of the Fund pursuant to Rule 12b-1 under the 1940 Act (the “Plan”). The Plan permits compensation in connection with the distribution and marketing of Fund shares and/or the provision of certain shareholder services. The Plan permits the Fund to pay ALPS Distributors, Inc. (the “Distributor”) or its designee, a fee for the sale and distribution and/or shareholder servicing of the shares at an annual rate of up to 0.25% of average daily net assets of the Fund. However, the Trustees have determined not to authorize payment under this Plan at this time. Under the terms of the Plan, the Trust is authorized to make payments to the Distributor or its designee for remittance to retirement plan service providers, broker-dealers, bank trust departments, financial advisors, and other financial intermediaries, as compensation for distribution and/or shareholder services performed by such entities for their customers who are investors in the Fund. The 12b-1 fee may only be imposed or increased when the Trustees determine that it is in the best interests of shareholders to do so. Because these fees are paid out of the Fund’s assets on an ongoing basis, to the extent that a fee is authorized, over time they will increase the cost of an investment in the Fund. The Plan fee may cost an investor more than other types of sales charges.
As of October 31, 2017, Janus Capital owned 1 share or less than 0.01% of the Fund.
4. Federal Income Tax
The tax components of capital shown in the table below represent: (1) distribution requirements the Fund must satisfy under the income tax regulations; (2) losses or deductions the Fund may be able to offset against income and gains realized in future years; and (3) unrealized appreciation or depreciation of investments for federal income tax purposes.
Other book to tax differences primarily consist of deferred compensation, derivatives, and foreign currency contract adjustments. The Fund has elected to treat gains and losses on forward foreign currency contracts as capital gains and losses, if applicable. Other foreign currency gains and losses on debt instruments are treated as ordinary income for federal income tax purposes pursuant to Section 988 of the Internal Revenue Code.
| | | | | | | | | | | | | | | | | | | | | | | | | | |
| | | | | | | | | | Loss Deferrals | | | | | | | |
Undistributed
Ordinary Income | | | Undistributed
Long-Term Gains | | | Accumulated
Capital Losses | | | Late-Period
Ordinary Loss | | | Post-October
Capital Loss | | | Other Book to Tax Differences | | | Net Tax Appreciation/ (Depreciation) | |
| $ | 135,222 | | | $ | — | | | $ | — | | | $ | — | | | $ | — | | | $ | (150) | | | $ | 2,175,733 | |
The aggregate cost of investments and the composition of unrealized appreciation and depreciation of investment securities for federal income tax purposes as of October 31, 2017 are noted below. The primary difference between book and tax appreciation or depreciation of investments is wash sale loss deferrals.
| | | | | | | | | | | | | | |
| Federal Tax Cost | | | Unrealized Appreciation | | | Unrealized (Depreciation) | | | Net Tax Appreciation/
(Depreciation) | |
| $ | 46,276,594 | | | $ | 2,908,512 | | | $ | (732,779) | | | $ | 2,175,733 | |
| | |
| | Janus Detroit Street Trust ½ 19 |
Janus Henderson SG Global Quality Income ETF
Notes to Financial Statements
Income and capital gains distributions are determined in accordance with income tax regulations that may differ from accounting principles generally accepted in the United States of America. These differences are due to differing treatments for items such as net short-term gains, deferral of wash sale losses, foreign currency transactions, passive foreign investment companies, net investment losses, in-kind transactions, and capital loss carryovers. Certain permanent differences such as tax returns of capital and net investment losses noted below have been reclassified to capital.
| | | | | | | | | | | | | | |
| For the period ended October 31, 2017 | |
| Distributions | | | | |
| From Ordinary Income | | | From Long-Term Capital Gains | | | Tax Return of Capital | | | Net Investment Loss | |
| $ | 1,601,928 | | | $ | — | | | $ | — | | | $ | — | |
Permanent book to tax basis differences may result in reclassifications between the components of net assets. These differences have no impact on the results of operations or net assets. The following reclassifications have been made to the Fund:
| | | | | | | | | | |
| Increase/(Decrease) to Capital | | | Increase/(Decrease) to Undistributed
Net Investment Income/Loss | | | Increase/(Decrease) to Undistributed
Net realized Gain/Loss | |
| | 2,003,508 | | | $ | 29,063 | | | $ | (2,032,571) | |
5. Capital Share Transactions
| | | | | | | | |
| | | Period ended October 31, 2017(1) | |
| | | Shares | | | Amount | |
| Shares sold | | | 2,300,001 | | | $ | 60,294,375 | |
| Shares repurchased | | | (600,000) | | | | (16,622,046) | |
Net Increase/(Decrease) | | | 1,700,001 | | | $ | 43,672,329 | |
| (1) | Period from December 7, 2016 (commencement of operations) through October 31, 2017. |
6. Purchases and Sales of Investment Securities
For the period ended October 31, 2017, the aggregate cost of purchases and proceeds from sales of investment securities (excluding any short-term securities, short-term options contracts, and in-kind transactions) was as follows:
| | | | | | | | | | | | | | |
Purchases of Securities | | | Proceeds from Sales of Securities | | | Purchases of Long- Term U.S. Government Obligations | | | Proceeds from Sales of Long-Term U.S. Government Obligations | |
| $ | 43,394,998 | | | $ | 42,767,228 | | | $ | — | | | $ | — | |
7. Recent Accounting Pronouncements
The Securities and Exchange Commission (“SEC”) adopted new rules as well as amendments to its rules to modernize the reporting and disclosure of information by registered investment companies. In addition, the SEC adopted amendments to Regulation S-X, which require standardized, enhanced disclosure about derivatives in investment company financial statements, as well as other amendments. The compliance date of the amendments to Regulation SX was August 1, 2017. This report incorporates the amendments to Regulation S-X.
The FASB issued Accounting Standards Update No. 2017-08, Receivables – Nonrefundable Fees and Other Costs (Subtopic 310-20), Premium Amortization on Purchased Callable Debt Securities (“ASU 2017-08”) to amend the amortization period for certain purchased callable debt securities held at a premium. The guidance requires certain premiums on callable debt securities to be amortized to the earliest call date. The amortization period for callable debt securities purchased at a discount will not be impacted. The amendments are effective for fiscal years, and interim periods within those fiscal years, beginning after December 15, 2018. Early adoption is permitted, including adoption in an interim period. Management is currently evaluating the impacts of ASU 2017-08 on the financial statements.
Janus Henderson SG Global Quality Income ETF
Notes to Financial Statements
8. Merger Related Matters
On October 3, 2016, Janus Capital Group Inc. (“JCGI”), the direct parent of Janus Capital Management LLC, the investment adviser to the Fund (“Janus Capital”), and Henderson Group plc (“Henderson”) announced that they had entered into an Agreement and Plan of Merger (“Merger Agreement”) relating to the strategic combination of Henderson and JCGI (the “Merger”). Pursuant to the Merger Agreement, a newly formed, direct wholly-owned subsidiary of Henderson merged with and into JCGI, with JCGI as the surviving corporation and a direct wholly-owned subsidiary of Henderson.
In approving the Fund’s initial investment advisory agreement on October 24, 2016, the Fund’s Board of Trustees also considered the potential post-Merger ownership structure of Janus Capital and have approved a contract (the “Post-Merger Advisory Agreement”) identical in all material respects to the initial investment advisory agreement that will take effect upon the completion of the Merger.
The Post-Merger Advisory Agreement took effect upon the consummation of the Merger on May 30, 2017. In connection with the Merger, the Fund’s name was changed to Janus Henderson SG Global Quality Income ETF effective June 5, 2017.
9. Subsequent Event
Management has evaluated whether any events or transactions occurred subsequent to October 31, 2017 and through the date of issuance of the Fund’s financial statements and determined that there were no material events or transactions that would require recognition or disclosure in the Fund’s financial statements.
| | |
| | Janus Detroit Street Trust ½ 21 |
Janus Henderson SG Global Quality Income ETF
Additional Information (unaudited)
Proxy Voting Policies and Voting Record
A description of the policies and procedures that the Fund uses to determine how to vote proxies relating to its portfolio securities is available without charge: (i) upon request, by calling 1-800-525-0020 (toll free); (ii) on the Fund’s website at janushenderson.com/proxyvoting; and (iii) on the SEC’s website at http://www.sec.gov.
Quarterly Portfolio Holdings
The Fund files its complete portfolio holdings (schedule of investments) with the SEC for the first and third quarters of each fiscal year on Form N-Q within 60 days of the end of such fiscal quarter. The Fund’s Form N-Q: (i) is available on the SEC’s website at http://www.sec.gov; (ii) may be reviewed and copied at the SEC’s Public Reference Room in Washington, D.C. (information on the Public Reference Room may be obtained by calling 1-800-SEC-0330); and (iii) is available without charge, upon request, by calling Janus Henderson at 1-800-525-0020 (toll free).
Designation Requirements (Unaudited)
For federal income tax purposes, the Fund designated the following for the period ended October 31, 2017
| | | | |
| Foreign Tax Credits | | $ | 118,113 | |
| Foreign Source Income | | $ | 1,487,011 | |
| Dividends Received Deduction Percentage | | | 20% | |
| Qualified Dividend Income Percentage | | | 85% | |
Licensing Agreements
“Societe Generale” and other related marks are service marks of Societe Generale and have been licensed for use by Janus Capital. The Underlying Index is the property of Societe Generale and is used under license. The Fund is not sponsored, endorsed, or promoted by Societe Generale. Neither Societe Generale nor any of its affiliates have passed on the Fund as to its legality or suitability, and such parties make no warranties nor bear any liability with respect to the Fund. Neither Societe Generale nor any of its affiliates acts as an investment adviser or fiduciary with respect to the Fund, Janus Capital or the Underlying Index.
The Underlying Index is the exclusive property of Societe Generale, which has contracted with Solactive AG (“Solactive”) to maintain and calculate the Underlying Index. Solactive shall have no liability for any errors or omissions in calculating the Underlying Index.
Janus Capital does not guarantee the accuracy and/or the completeness of the Underlying Index or any data included therein, and Janus Capital shall have no liability for any errors, omissions or interruptions therein. Janus Capital makes no warranty, express or implied, as to results to be obtained by the Fund, owners of the shares of the Fund or any other person or entity from the use of the Underlying Index or any data included therein. Janus Capital makes no express or implied warranties, and expressly disclaims all warranties of merchantability or fitness for a particular purpose or use with respect to the Underlying Index or any data included therein. Without limiting any of the foregoing, in no event shall Janus Capital have any liability for any special, punitive, direct, indirect or consequential damages (including lost profits) arising out of matters relating to the use of the Underlying Index even if notified of the possibility of such damages.
Janus Henderson SG Global Quality Income ETF
Board Considerations Regarding Approval of Investment Advisory Agreements (unaudited)
APPROVAL OF ADVISORY AGREEMENT DURING THE PERIOD FOR JANUS SHORT DURATION INCOME ETF AND JANUS HENDERSON SG GLOBAL QUALITY INCOME ETF
The Trustees of Janus Detroit Street Trust (the “Trust”), including the Independent Trustees, met on October 24, 2016 to consider the proposed investment management agreement (the “Investment Management Agreement”) for Janus Henderson Short Duration Income ETF and Janus Henderson SG Global Quality Income ETF (each a “New Fund” and collectively, the “New Funds”). In the course of their consideration of the Investment Management Agreement, the Trustees met in executive session and were advised by their independent counsel. In this regard, the Board, including the Independent Trustees, evaluated the terms of the Investment Management Agreement and reviewed the duties and responsibilities of the Trustees in evaluating and approving such agreements. In considering approval of the Investment Management Agreement, the Board, including the Independent Trustees, reviewed the Board Materials and other information from counsel and from Janus Capital Management LLC, the investment adviser (the “Adviser”), including: (i) a copy of the form of Investment Management Agreement, with respect to the Adviser’s management of the assets of each New Fund; (ii) information describing the nature, quality and extent of the services that the Adviser will provide to the New Fund, and the fees the Adviser will charge to the New Funds; (iii) information concerning the Adviser’s financial condition, business, operations, portfolio management teams and compliance programs; (iv) information describing each New Fund’s anticipated advisory fee and operating expenses; (v) a copy of the Adviser’s current Form ADV; and (vi) a memorandum from counsel on the responsibilities of trustees in considering investment advisory arrangements under the 1940 Act. The Board also considered presentations made by, and discussions held with, representatives of the Adviser. The Board also received information comparing the advisory fees and expenses of the New Funds to those from fund complexes that were defined as competitors.
During its review of this information, the Board focused on and analyzed the factors that the Board deemed relevant, including: the nature, extent and quality of the services to be provided to each New Fund by the Adviser; the Adviser’s personnel and operations; each New Fund’s proposed expense level; the anticipated profitability to the Adviser under the Investment Management Agreement at certain asset levels; any “fall-out” benefits to the Adviser and its affiliates (i.e., any ancillary benefits anticipated to be realized by the Adviser and its affiliates from the Adviser’s relationship with the Trust); the effect of asset growth on each New Fund’s expenses; and possible conflicts of interest.
The Trustees also considered benefits that accrue to the Adviser and its affiliates from their relationships with the New Funds. The Trustees also concluded that, other than the services provided by the Adviser and its affiliates pursuant to the agreements and the fees to be paid by the New Funds therefor, the New Fund and the Adviser may potentially benefit from their relationship with each other in other ways. The Trustees concluded that the success of the New Funds could attract other business to the Adviser or other Janus funds, and that the success of the Adviser could enhance the Adviser’s ability to serve the New Funds.
The Board, including the Independent Trustees, considered the following in respect of each New Fund:
(a) The nature, extent and quality of services to be provided by Adviser; personnel and operations of the Adviser. The Board reviewed the services that the Adviser would provide to each New Fund. In connection with the investment advisory services to be provided by the Adviser, the Board noted the responsibilities that the Adviser would have as the Funds’ investment adviser, including: the overall supervisory responsibility for the general management and investment of each New Fund’s securities portfolio; providing oversight of the investment performance and processes and compliance with the New Fund’s investment objectives, policies and limitations; the implementation of the investment management program of each New Fund; the management of the day-to-day investment and reinvestment of the assets of each New Fund; determining daily baskets of deposit securities and cash components; executing portfolio security trades for purchases and redemptions of New Fund shares conducted on a cash-in-lieu basis; the responsibility for daily monitoring of tracking error and quarterly reporting to the Board for the Janus SG Global Quality Income ETF, whose investment objective seeks to track the performance of an index; the review of brokerage matters; the oversight of general portfolio compliance with relevant law; and the implementation of Board directives as they relate to the New Funds.
The Board reviewed the Adviser’s experience, resources and strengths in managing other pooled investment vehicles, including the Adviser’s personnel. Based on its consideration and review of the foregoing information, the Board determined that each New Fund was likely to benefit from the nature, quality and extent of these services, as well as the Adviser’s ability to render such services based on their experience, personnel, operations and resources.
(b) Comparison of services to be rendered and fees to be paid to those under other investment advisory contracts, and the cost of the services to be provided and profits to be realized by the Adviser from the relationship with the New Funds;
| | |
| | Janus Detroit Street Trust ½ 23 |
Janus Henderson SG Global Quality Income ETF
Board Considerations Regarding Approval of Investment Advisory Agreements (unaudited)
“fall-out” benefits. The Board then compared both the services to be rendered and the proposed fees to be paid under other contracts of the Adviser, and under contracts of other investment advisers with respect to similar ETFs. In particular, the Board compared each New Fund’s proposed advisory fee and projected expense ratio to other investment companies considered to be in that New Fund’s peer group. The Board also noted that the New Funds had no other comparable equivalents managed by the Adviser. The Board also discussed the anticipated costs and projected profitability of the Adviser in connection with its serving as investment adviser to each New Fund, including operational costs. In addition, the Board discussed the entrepreneurial risk undertaken by the Adviser in creating the Trust. After comparing each New Fund’s proposed fees with those of other funds in the New Fund’s peer group, and in light of the nature, extent and quality of services proposed to be provided by the Adviser and the costs expected to be incurred by the Adviser in rendering those services, the Board concluded that the level of fees proposed to be paid to the Adviser with respect to the New Funds were fair and reasonable.
The Board also considered that the Adviser may experience reputational “fall-out” benefits based on the success of the New Funds, but that such benefits are not easily quantifiable.
(c) The extent to which economies of scale would be realized as the New Funds grow and whether fee levels would reflect such economies of scale. The Board next discussed potential economies of scale. Since the New Funds had not commenced operations, the eventual aggregate amount of assets was uncertain, and the Adviser was not able to provide the Board with specific information concerning the extent to which economies of scale could be realized as each New Fund grows, and whether fee levels would reflect such economies of scale, if any. The Board recognized the uncertainty in launching a new investment product and estimating future asset levels.
(d) Investment performance of the New Funds and the Adviser. Because each New Fund had not commenced operations, the Board did not consider the investment performance of the New Fund. However, for the Janus Short Duration Income ETF, the Board considered the experience of the Adviser with comparable investment strategies.
Conclusion.
No single factor was determinative to the decision of the Board. Based on the foregoing and such other matters as were deemed relevant, the Board concluded that the proposed advisory fee rate and projected total expense ratio are reasonable in relation to the services to be provided by the Adviser to each New Fund, as well as the costs to be incurred and benefits to be gained by the Adviser in providing such services. The Board also found the proposed advisory fees to be reasonable in comparison to the fees charged by advisers to other comparable funds of similar actual or anticipated size. As a result, the Board concluded that the initial approval of the Investment Management Agreement was in the best interests of each New Fund.
After full consideration of the above factors, as well as other factors, the Trustees, with the Independent Trustees voting separately, determined to approve the Investment Management Agreement for each New Fund.
Janus Henderson SG Global Quality Income ETF
Trustees and Officers (unaudited)
The Fund’s Statement of Additional Information includes additional information about the Trustees and officers and is available, without charge, by calling 1-877-335-2687.
The following are the Trustees and officers of the Trust, together with a brief description of their principal occupations during the last five years (principal occupations for certain Trustees may include periods over five years).
Each Trustee has served in that capacity since he or she was originally elected or appointed. The Trustees do not serve a specified term of office. Each Trustee will hold office until the termination of the Trust or his or her earlier death, resignation, retirement, incapacity, or removal. Under the Fund’s Governance Procedures and Guidelines, the policy is for Trustees to retire no later than the end of the calendar year in which the Trustee turns 75. The Trustees review the Fund’s Governance Procedures and Guidelines from time to time and may make changes they deem appropriate. The Fund’s Nominating and Governance Committee will consider nominees for the position of Trustee recommended by shareholders. Shareholders may submit the name of a candidate for consideration by the Committee by submitting their recommendations to the Trust’s Secretary. Each Trustee is currently a Trustee of one other registered investment company advised by Janus Capital: Clayton Street Trust. Collectively, these two registered investment companies consist of 8 series or funds.
The Trust’s officers are elected annually by the Trustees for a one-year term. Certain officers also serve as officers of Clayton Street Trust. Certain officers of the Fund may also be officers and/or directors of Janus Capital. Fund officers receive no compensation from the Fund, except for the Fund’s Chief Compliance Officer, as authorized by the Trustees.
| | | | | | | | | | | | | | | | | | |
| TRUSTEES | | | | | | | | | | | | | | |
| Name, Address, and Age | | Positions Held
with the Trust | | | Length of
Time Served | | | Principal Occupations
During the Past Five Years | | Number of
Portfolios/Funds
in Fund Complex
Overseen by
Trustee | | | Other Directorships
Held by Trustee
During the Past Five Years | |
Independent Trustees | | | | | | | | | | | | | | | | | | |
Clifford J. Weber 151 Detroit Street Denver, CO 80206 DOB: 1963 | |
| Chairman
Trustee |
| |
| 2/16-Present
2/16-Present |
| | Owner, Financial Products Consulting Group LLC (consulting services to financial institutions) (since 2015). Formerly, Executive Vice President of Global Index and Exchange- Traded Products, NYSE Market, Inc., a subsidiary of Intercontinental Exchange (ETF/ETP listing exchange) (2013-2015) and Executive Vice President and Head of Strategy and Product Development, NYSE Liffe U.S., a division of NYSE Euronext (U.S. futures exchange) (2008-2013). | | | 12 | | |
| Independent Trustee,
Clough Funds Trust
(investment company)
(since 2015);
Chairman, Clough
Funds Trust
(investment company)
(since 2017);
Independent Trustee,
Clough Dividend and
Income Fund (closed-
end fund) (since
2017); Independent
Trustee, Clough
Global Opportunities
Fund (closed-end
fund) (since 2017);
Independent Trustee,
Clough Global Equity
Fund (closed-end
fund) (since 2017);
Independent Trustee,
Elevation ETF Trust
(since 2016);
Chairman, Elevation
ETF Trust (since
2017). |
|
| | |
| | Janus Detroit Street Trust ½ 25 |
Janus Henderson SG Global Quality Income ETF
Trustees and Officers (unaudited)
| | | | | | | | | | | | | | | | | | |
| TRUSTEES | | | | | | | | | | | | | | |
| Name, Address, and Age | | Positions Held
with the Trust | | | Length of
Time Served | | | Principal Occupations
During the Past Five Years | | Number of
Portfolios/Funds
in Fund Complex
Overseen by
Trustee | | | Other Directorships
Held by Trustee
During the Past Five Years | |
Maureen T. Upton 151 Detroit Street Denver, CO 80206 DOB: 1965 | | | Trustee | | | | 2/16-Present | | | Principal, Maureen Upton Ltd. (consulting services to developers of major infrastructure projects and investors) (since 2017). Formerly, Principal Consultant, SRK Consulting (U.S.), Inc. (consulting services to global mining, energy and water resource industries) (2015-2017) and Founder and Principal, Resource Initiatives LLC (sustainability consulting firm) (2006-2015). | | | 12 | | |
| Director, Denver
Metro Leadership
Foundation (non-
profit organization)
(2012-2014). |
|
| | | | | |
Jeffrey B. Weeden 151 Detroit Street Denver, CO 80206 DOB: 1956 | | | Trustee | | | | 2/16-Present | | | Senior Advisor, BayBoston Capital LP (investment fund in banks and bank holdings companies) (since 2015). Management Advisor, BoxCast, Inc. (technology start-up company) (2014-2017). Formerly Senior Executive Vice President and Chief Financial Officer, KeyCorp (financial services) (2002-2013). | | | 12 | | |
| Director, State
Farm Bank (banking)
(since 2014). |
|
Interested Trustee | | | | | | | | | | | | | | | | | | |
Michael Drew Elder** 151 Detroit Street Denver, CO 80206 DOB: 1970 | | | Trustee | | | | 8/15-Present | | | Executive Vice President and Head of U.S. Intermediary Distribution, Janus Capital (since 2014) and President, Janus Distributors LLC (broker- dealer) (since 2014). Formerly, Senior Vice President, Janus Capital (2007-2014). | | | 12 | | |
| Director, Perkins
Investment
Management LLC
(since 2014). |
|
| ** | Michael Drew Elder is an Interested Trustee because of his employment with Janus Capital. |
Janus Henderson SG Global Quality Income ETF
Trustees and Officers (unaudited)
| | | | | | |
| OFFICERS | | | | | | |
| Name, Address, and Age | | Positions Held with the Trust | | Term of Office* and
Length of Time Served | | Principal Occupations
During the Past Five Years |
Bruce L. Koepfgen 151 Detroit Street Denver, CO 80206 DOB: 1952 | | President and Chief Executive Officer | | 2/16-Present | | Head of North America for Janus Henderson Investors and Janus Capital Management (since 2017); Executive Vice President and Director of Janus International Holding LLC (since 2011); Executive Vice President of Janus Distributors LLC (since 2011); Vice President and Director of INTECH Investment Management LLC (since 2011); Executive Vice President and Director of Perkins Investment Management LLC (since 2011); and Executive Vice President and Director of Janus Management Holdings Corporation (since 2011). Formerly, President of Janus Capital Group Inc. and Janus Capital Management LLC (2013-2017); Executive Vice President of Janus Services LLC (2011-2015), Janus Capital Group Inc. and Janus Capital Management LLC (2011-2013); and Chief Financial Officer of Janus Capital Group Inc., Janus Capital Management LLC, Janus Distributors LLC, Janus Management Holdings Corporation, and Janus Services LLC (2011-2013). |
| | | |
Susan K. Wold 151 Detroit Street Denver, CO 80206 DOB: 1960 | | Vice President, Chief Compliance Officer, and Anti-Money Laundering Officer | | 10/17-Present; Vice President, Provisional Chief Compliance Officer, and Anti-Money Laundering Officer (9/17-10/17) | | Senior Vice President and Head of Compliance, North America for Janus Henderson (since September 2017); Formerly, Vice President, Head of Global Corporate Compliance, and Chief Compliance Officer for Janus Capital Management (May 2017-September 2017); Vice President, Compliance at Janus Capital Group and Janus Capital Management (2005-2017). |
| | | |
Jesper Nergaard 151 Detroit Street Denver, CO 80206 DOB: 1962 | | Vice President, Chief Financial Officer, Treasurer, and Principal Accounting Officer | | 2/16-Present | | Vice President of Janus Capital and Janus Services LLC. |
| | | |
Kathryn L. Santoro 151 Detroit Street Denver, CO 80206 DOB: 1973 | | Vice President, Secretary and Chief Legal Counsel | | 1/17-Present | | Vice President of Janus Capital and Janus Services LLC (since 2016). Formerly, Vice President and Associate Counsel of Curian Capital, LLC and Curian Clearing LLC (2013-2016); and General Counsel and Secretary (2011-2012) and Vice President (2009-2012) of Old Mutual Capital, Inc. |
| * | Officers are elected at least annually by the Trustees for a one-year term and may also be elected from time to time by the Trustees for an interim period. |
| | |
| | Janus Detroit Street Trust ½ 27 |
Janus Henderson SG Global Quality Income ETF
Notes
Janus Henderson SG Global Quality Income ETF
Notes
| | |
| | Janus Detroit Street Trust ½ 29 |
Knowledge. Shared
At Janus Henderson, we believe in the sharing of expert insight for better investment and business decisions. We call this ethos Knowledge. Shared.
Learn more by visiting janushenderson.com.
This report is submitted for the general information of shareholders of the Fund. It is not an offer or solicitation for the Fund and is not authorized for distribution to prospective investors unless preceded or accompanied by an effective prospectus.
Janus Henderson is a trademark of Janus Henderson Investors. © Janus Henderson Investors. The name Janus Henderson Investors includes HGI Group Limited, Henderson Global Investors (Brand Management) Sarl and Janus International Holding LLC.
Janus Capital Management LLC is the investment adviser and ALPS Distributors, Inc. is the distributor. ALPS is not affiliated with Janus Henderson or any of its subsidiaries.
ANNUAL REPORT
October 31, 2017
Janus Henderson Short Duration Income ETF (formerly named Janus Short Duration Income ETF)
Janus Detroit Street Trust

Table of Contents
Janus Henderson Short Duration Income ETF (unaudited)
INVESTMENT OBJECTIVE
Janus Henderson Short Duration Income ETF seeks to provide a steady income stream with capital preservation across various market cycles. The Fund seeks to consistently outperform the 3-month USD LIBOR rate by a moderate amount through various market cycles while at the same time providing low volatility.
PERFORMANCE OVERVIEW
| • | | Global bond markets started the period wrong-footed as investors digested the results of the U.S. presidential election. Losses were soon pared and both U.S. and global fixed income markets ultimately delivered gains for the period. The yield on 10-year U.S. Treasurys rose from 1.77% in the wake of the election to as high as 2.60% ,but then remained largely range-bound as investors dialed back their expectations of pro-growth reforms and cadence of rate hikes by the Federal Reserve (Fed). Optimism was more evident in riskier assets. The spreads on investment-grade and high-yield corporate bonds narrowed by 37 basis points (bps) and 140 bps, respectively. A main U.S. stock index rose by over 21%. |
| • | | During the period, the Janus Henderson Short Duration Income ETF (VNLA) returned 1.87% (based on NAV); its benchmark, 3-Month USD LIBOR, returned 1.03%. Positive returns were driven by Fund’s cash-based core of corporate credits. Duration positioning – a component of the Fund’s Structural Alpha strategy, which is aimed at hedging the portfolio against downside risk – generated negative returns. |
| • | | Janus Henderson Short Duration Income ETF is an actively managed fixed income ETF with the potential to deliver returns above cash. The strategy seeks to provide a steady income stream with low volatility and capital preservation across economic cycles. Rather than tracking a benchmark, the Fund is designed to move beyond conventional constraints and provide positive absolute returns. |
| | |
| | Janus Detroit Street Trust ½ 1 |
Janus Henderson Short Duration Income ETF (unaudited)
Fund At A Glance
October 31, 2017
| | | | |
| Sector Allocation – (% of Net Assets) | |
Financial | | | 51.5% | |
Consumer, Cyclical | | | 10.3% | |
Consumer, Non-cyclical | | | 7.5% | |
Communications | | | 6.3% | |
Industrial | | | 6.2% | |
Technology | | | 3.8% | |
Utilities | | | 3.8% | |
Energy | | | 3.7% | |
Government | | | 2.0% | |
Basic Materials | | | 1.4% | |
Diversified | | | 1.0% | |
Asset-Backed Securities | | | 0.8% | |
Mortgage-Backed Securities | | | 0.1% | |
| | | | |
| | | 98.4% | |
Holdings are subject to change without notice.
Janus Henderson Short Duration Income ETF (unaudited)
Performance
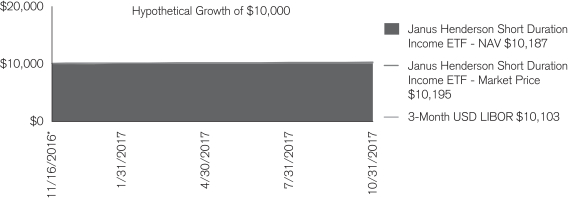
| | |
| Cumulative Total Return for the period ended October 31, 2017 |
| | | Since
Inception* |
Janus Henderson Short Duration Income ETF – NAV | | 1.87% |
Janus Henderson Short Duration Income ETF – Market Price | | 1.95% |
3-Month USD LIBOR | | 1.03% |
Total annual expense ratio (estimated) as stated in the November 16, 2016 prospectus: 0.35%.
Returns quoted are past performance and do not guarantee future results; current performance may be lower or higher. Investment returns and principal value will vary; there may be a gain or loss when shares are sold. For the most recent month-end performance call 800.668.0434 or visit janushenderson.com/performance.
Shares of ETFs are bought and sold at market price (not NAV) and are not individually redeemed from the Fund. Market returns are based upon the midpoint of the bid/ask spread at 4:00 p.m. Eastern time (when NAV is normally determined for most ETFs), and do not represent the returns you would receive if you traded shares at other times. Ordinary brokerage commissions apply and will reduce returns.
ETF shares are not individually redeemable and owners of the shares may acquire those shares from the Fund and tender those shares for redemption to the Fund in Creation Units only.
Investing involves risk, including the possible loss of principal and fluctuation of value.
The Fund is not a money market fund and does not attempt to maintain a stable net asset value.
The ETF is new and has less than one year of operating history.
See the prospectus for a more complete discussion of objectives, risks and expenses.
Returns include reinvestment of dividends and capital gains. Returns greater than one year are annualized. Returns do not reflect the deduction of taxes that a shareholder would pay on Fund distributions or redemptions of Fund shares.
See Financial Highlights for actual expense ratios during the reporting period.
There is no assurance the stated objective(s) will be met.
See Notes to Schedule of Investments and Other Information for index definitions.
Index performance does not reflect the expenses of managing a portfolio as an index is unmanaged and not available for direct investment.
| * | The Fund commenced operations on November 16, 2016. |
| | |
| | Janus Detroit Street Trust ½ 3 |
Janus Henderson Short Duration Income ETF (unaudited)
Disclosure of Fund Expenses
As a shareholder of the Fund, you incur two types of costs: (1) transaction costs, which may include creation and redemption fees or brokerage charges and (2) ongoing costs, including management fees and other Fund expenses. This example is intended to help you understand your ongoing costs (in dollars) of investing in the Fund and to compare these costs with the ongoing costs of investing in other ETFs. To do so, compare this 5% hypothetical example with the 5% hypothetical examples that appear in the shareholder reports of the other funds. The example is based upon an investment of $1,000 invested at the beginning of the period and held for the six-months indicated, unless noted otherwise in the table and footnotes below.
Actual Expenses
The information in the table under the heading “Actual” provides information about actual account values and actual expenses. You may use the information in these columns, together with the amount you invested, to estimate the expenses that you paid over the period. Simply divide your account value by $1,000 (for example, an $8,600 account value divided by $1,000 = 8.6), then multiply the result by the number under the heading entitled “Expenses Paid During Period” to estimate the expenses you paid on your account during the period.
Hypothetical Example for Comparison Purposes
The information in the table under the heading “Hypothetical (5% return before expenses)” provides information about hypothetical account values and hypothetical expenses based upon the Fund’s actual expense ratio and an assumed rate of return of 5% per year before expenses, which is not the Fund’s actual return. The hypothetical account values and expenses may not be used to determine the actual ending account balance or expenses you paid for the period. You may use this information to compare the ongoing costs of investing in the Fund and other funds. To do so, compare this 5% hypothetical example with the 5% hypothetical examples that appear in the shareholder reports of the other funds. Additionally, for an analysis of the fees associated with an investment or other similar funds, please visit www.finra.org/fundanalyzer.
Please note that the expenses shown in the table are meant to highlight your ongoing costs only and do not reflect any transaction costs, such as creation and redemption fees, or brokerage charges. These fees are fully described in the Fund’s prospectus. Therefore, the hypothetical examples are useful in comparing ongoing costs only, and will not help you determine the relative total costs of owning different funds. In addition, if these transaction costs were included, your costs would have been higher.
| | | | | | | | | | | | | | | | | | | | | | | | |
Actual | | | Hypothetical
(5% return before expenses) | | | | |
Beginning
Account
Value
(5/1/17) | | Ending
Account
Value
(10/31/2017) | | | Expenses
Paid During
Period
(5/1/17 - 10/31/2017)† | | | Beginning
Account
Value
(5/1/17) | | | Ending
Account
Value
(10/31/2017) | | | Expenses
Paid During
Period
(5/1/17 - 10/31/2017)† | | | Net Annualized
Expense Ratio
(5/1/17 - 10/31/2017) | |
| $1,000.00 | | $ | 1,011.30 | | | $ | 1.77 | | | $ | 1,000.00 | | | $ | 1,023.44 | | | $ | 1.79 | | | | 0.35% | |
| † | Expenses Paid During Period is equal to the Net Annualized Expense Ratio multiplied by the average account value over the period, multiplied by 184/365 (to reflect the one-half year period). |
Janus Henderson Short Duration Income ETF
Report of Independent Registered Public Accounting Firm
To the Board of Trustees of Janus Detroit Street Trust and Shareholders of
Janus Henderson Short Duration Income ETF:
In our opinion, the accompanying statement of assets and liabilities, including the schedule of investments, and the related statements of operations and of changes in net assets and the financial highlights present fairly, in all material respects, the financial position of the Janus Henderson Short Duration Income ETF Fund (one of the funds constituting Janus Detroit Street Trust, hereafter referred to as the “Fund”) as of October 31, 2017, and the results of its operations, and the changes in its net assets and the financial highlights for the period from November 16, 2016 (commencement of operations) through October 31, 2017, in conformity with accounting principles generally accepted in the United States of America. These financial statements and financial highlights (hereafter referred to as “financial statements”) are the responsibility of the Fund’s management. Our responsibility is to express an opinion on these financial statements based on our audit. We conducted our audit of these financial statements in accordance with the standards of the Public Company Accounting Oversight Board (United States). Those standards require that we plan and perform the audit to obtain reasonable assurance about whether the financial statements are free of material misstatement. An audit includes examining, on a test basis, evidence supporting the amounts and disclosures in the financial statements, assessing the accounting principles used and significant estimates made by management, and evaluating the overall financial statement presentation. We believe that our audit, which included confirmation of securities as of October 31, 2017 by correspondence with the custodian and brokers, provides a reasonable basis for our opinion.

Denver, Colorado
December 20, 2017
| | |
| | Janus Detroit Street Trust ½ 5 |
Janus Henderson Short Duration Income ETF
Schedule of Investments
October 31, 2017
| | | | | | | | |
| | | Principal Amounts | | | Value | |
| Corporate Bonds – 94.8% | | | | | | |
| Asset-Backed Securities – 0.8% | | | | | | |
American Tower Trust I, 1.5510%, 3/15/43 (144A) | | | $350,000 | | | | $349,453 | |
Applebee’s Funding LLC / IHOP Funding LLC, 4.2770%, 9/5/44 (144A) | | | 327,000 | | | | 322,111 | |
Conn Funding II LP, 2.7300%, 7/15/19 (144A) | | | 46,336 | | | | 46,350 | |
Golden Credit Card Trust, 1.9800%, 4/15/22 (144A) | | | 484,000 | | | | 483,226 | |
| | | | | | | | |
| | | | 1,201,140 | |
| Basic Materials – 1.4% | | | | | | |
Chevron Phillips Chemical Co. LLC / Chevron Phillips Chemical Co. LP, 1.7000%, 5/1/18 | | | 490,000 | | | | 490,005 | |
Chevron Phillips Chemical Co. LLC / Chevron Phillips Chemical Co. LP, 1.7000%, 5/1/18 (144A) | | | 253,000 | | | | 253,002 | |
Incitec Pivot Finance LLC, 6.0000%, 12/10/19 (144A) | | | 450,000 | | | | 481,637 | |
Sherwin-Williams Co., 2.2500%, 5/15/20 | | | 1,000,000 | | | | 1,002,168 | |
| | | | | | | | |
| | | | 2,226,812 | |
| Communications – 6.3% | | | | | | |
Alibaba Group Holding, Ltd., ICE LIBOR USD 3 Month + 0.5200%, 1.8372%, 11/28/17 | | | 975,000 | | | | 974,971 | |
Alibaba Group Holding, Ltd., 2.5000%, 11/28/19 | | | 400,000 | | | | 402,680 | |
Amazon.com, Inc., 3.3000%, 12/5/21 | | | 396,000 | | | | 412,208 | |
Amazon.com, Inc., 2.4000%, 2/22/23 (144A) | | | 1,000,000 | | | | 992,938 | |
Deutsche Telekom International Finance BV, ICE LIBOR USD 3 Month + 0.5800%, 1.9333%, 1/17/20 (144A) | | | 700,000 | | | | 702,289 | |
eBay, Inc., 2.2000%, 8/1/19 | | | 100,000 | | | | 100,355 | |
eBay, Inc., ICE LIBOR USD 3 Month + 0.8700%, 2.2480%, 1/30/23 | | | 1,700,000 | | | | 1,711,108 | |
Optus Finance Pty Ltd., 4.6250%, 10/15/19 | | | 700,000 | | | | 729,732 | |
Optus Finance Pty Ltd., 4.0000%, 6/17/22 | | | 500,000 | | | | 398,459 | |
Optus Finance Pty Ltd., 3.2500%, 8/23/22 | | | 750,000 | | | | 578,645 | |
SingTel Group Treasury Pte Ltd., 4.5000%, 9/8/21 | | | 841,000 | | | | 900,355 | |
Telstra Corp., Ltd., 7.7500%, 7/15/20 | | | 500,000 | | | | 434,089 | |
Walt Disney Co., ICE LIBOR USD 3 Month + 0.3900%, 1.7061%, 3/4/22 | | | 1,430,000 | | | | 1,441,647 | |
| | | | | | | | |
| | | | 9,779,476 | |
| Consumer, Cyclical – 9.3% | | | | | | |
American Honda Finance Corp., ICE LIBOR USD 3 Month + 0.2800%, 1.5964%, 11/19/18 | | | 600,000 | | | | 601,347 | |
American Honda Finance Corp., ICE LIBOR USD 3 Month + 0.3400%, 1.6491%, 2/14/20 | | | 850,000 | | | | 852,957 | |
CK Hutchison International 17 II, Ltd., 2.2500%, 9/29/20 (144A) | | | 700,000 | | | | 696,960 | |
Costco Wholesale Corp., 2.2500%, 2/15/22 | | | 1,000,000 | | | | 997,917 | |
CVS Health Corp., 2.1250%, 6/1/21 | | | 1,203,000 | | | | 1,185,112 | |
Daimler Finance North America LLC, ICE LIBOR USD 3 Month + 0.2500%, 1.5617%, 11/5/18 (144A) | | | 500,000 | | | | 500,319 | |
Daimler Finance North America LLC, 1.5000%, 7/5/19 (144A) | | | 175,000 | | | | 173,622 | |
Daimler Finance North America LLC, ICE LIBOR USD 3 Month + 0.6300%, 1.9767%, 1/6/20 (144A) | | | 1,900,000 | | | | 1,911,561 | |
General Motors Financial Co., Inc., ICE LIBOR USD 3 Month + 1.5500%, 2.9092%, 1/14/22 | | | 500,000 | | | | 511,132 | |
Hyundai Capital America, 2.7500%, 9/27/26 (144A) | | | 1,000,000 | | | | 922,003 | |
Hyundai Capital Services, Inc., 3.0000%, 3/6/22 (144A) | | | 400,000 | | | | 396,943 | |
Lowe’s Cos., Inc., ICE LIBOR USD 3 Month + 0.4200%, 1.7372%, 9/10/19 | | | 1,026,000 | | | | 1,033,203 | |
Nissan Motor Acceptance Corp., ICE LIBOR USD 3 Month + 1.0100%, 2.3272%, 3/8/19 (144A) | | | 450,000 | | | | 454,416 | |
Nissan Motor Acceptance Corp., ICE LIBOR USD 3 Month + 0.3900%, 1.7486%, 7/13/20 (144A) | | | 600,000 | | | | 600,486 | |
Nissan Motor Acceptance Corp., ICE LIBOR USD 3 Month + 0.6900%, 2.0208%, 9/28/22 (144A) | | | 700,000 | | | | 701,017 | |
Toyota Motor Credit Corp., ICE LIBOR USD 3 Month + 0.2600%, 1.6103%, 1/9/19 | | | 1,400,000 | | | | 1,402,360 | |
Wal-Mart Stores, Inc., ICE LIBOR USD 3 Month – 0.0300%, 1.3087%, 10/9/19 | | | 1,500,000 | | | | 1,500,210 | |
| | | | | | | | |
| | | | 14,441,565 | |
See Notes to Schedule of Investments and Other Information and Notes to Financial Statements.
Janus Henderson Short Duration Income ETF
Schedule of Investments
October 31, 2017
| | | | | | | | |
| | | Principal Amounts | | | Value | |
| Corporate Bonds – (continued) | | | | | | |
| Consumer, Non-cyclical – 7.0% | | | | | | |
Allergan Funding SCS, 2.3500%, 3/12/18 | | | $ 600,000 | | | | $ 601,364 | |
Allergan Funding SCS, 2.4500%, 6/15/19 | | | 900,000 | | | | 905,624 | |
Becton Dickinson and Co., ICE LIBOR USD 3 Month + 1.0300%, 2.3461%, 6/6/22 | | | 900,000 | | | | 905,616 | |
Cardinal Health, Inc., ICE LIBOR USD 3 Month + 0.7700%, 2.0900%, 6/15/22 | | | 1,200,000 | | | | 1,204,357 | |
Constellation Brands, Inc., 2.7000%, 5/9/22 | | | 1,236,000 | | | | 1,239,124 | |
Constellation Brands, Inc., 2.6500%, 11/7/22 | | | 300,000 | | | | 298,746 | |
Molson Coors Brewing Co., 2.2500%, 3/15/20 (144A) | | | 740,000 | | | | 739,916 | |
Molson Coors Brewing Co., 2.2500%, 3/15/20 | | | 387,000 | | | | 386,956 | |
Sysco Corp., 2.6000%, 10/1/20 | | | 500,000 | | | | 506,065 | |
Sysco Corp., 2.6000%, 6/12/22 | | | 763,000 | | | | 765,061 | |
Transurban Finance Co. Pty Ltd., 3.3750%, 3/22/27 (144A) | | | 150,000 | | | | 146,421 | |
Wesfarmers, Ltd., 1.8740%, 3/20/18 | | | 400,000 | | | | 400,281 | |
Wesfarmers, Ltd., 6.2500%, 3/28/19 | | | 800,000 | | | | 644,598 | |
Wesfarmers, Ltd., 4.7500%, 3/12/20 | | | 500,000 | | | | 401,209 | |
WSO Finance Pty Ltd., 3.5000%, 7/14/23 | | | 1,400,000 | | | | 1,069,063 | |
WSO Finance Pty Ltd., 4.5000%, 3/31/27 | | | 800,000 | | | | 635,202 | |
| | | | | | | | |
| | | | | | | 10,849,603 | |
| Diversified – 1.0% | | | | | | |
CK Hutchison International 16, Ltd., 1.8750%, 10/3/21 (144A) | | | 1,100,000 | | | | 1,067,000 | |
Hutchison Whampoa International 09, Ltd., 7.6250%, 4/9/19 | | | 100,000 | | | | 107,564 | |
Hutchison Whampoa International, Ltd., 5.7500%, 9/11/19 (144A) | | | 350,000 | | | | 372,338 | |
| | | | | | | | |
| | | | 1,546,902 | |
| Energy – 2.7% | | | | | | |
Canadian Natural Resources, Ltd., 1.7500%, 1/15/18 | | | 100,000 | | | | 100,015 | |
Harvest Operations Corp., 2.1250%, 5/14/18 | | | 200,000 | | | | 199,839 | |
Korea National Oil Corp., ICE LIBOR USD 3 Month + 0.6000%, 1.9297%, 3/27/20 | | | 800,000 | | | | 796,992 | |
Shell International Finance BV, ICE LIBOR USD 3 Month + 0.3500%, 1.6603%, 9/12/19 | | | 550,000 | | | | 553,062 | |
Sinopec Group Overseas Development 2013, Ltd., 2.5000%, 10/17/18 | | | 500,000 | | | | 501,316 | |
Sinopec Group Overseas Development 2014, Ltd., 2.7500%, 4/10/19 | | | 250,000 | | | | 251,109 | |
Sinopec Group Overseas Development 2016, Ltd., 1.7500%, 9/29/19 (144A) | | | 750,000 | | | | 740,989 | |
Sinopec Group Overseas Development 2017, Ltd., 2.3750%, 4/12/20 (144A) | | | 600,000 | | | | 599,492 | |
Sinopec Group Overseas Development 2017, Ltd., 2.2500%, 9/13/20 (144A) | | | 500,000 | | | | 497,367 | |
| | | | | | | | |
| | | | 4,240,181 | |
| Financial – 51.5% | | | | | | |
Ally Financial, Inc., 3.2500%, 2/13/18 | | | 897,000 | | | | 899,606 | |
Ally Financial, Inc., 8.0000%, 12/31/18 | | | 100,000 | | | | 106,125 | |
American Express Co., ICE LIBOR USD 3 Month + 0.6100%, 1.9868%, 8/1/22 | | | 1,150,000 | | | | 1,149,777 | |
ANZ New Zealand Int’l, Ltd., ICE LIBOR USD 3 Month + 1.0100%, 2.3880%, 7/28/21 (144A) | | | 1,500,000 | | | | 1,517,013 | |
Australia & New Zealand Banking Group, Ltd., ICE LIBOR USD 3 Month + 0.6600%, 1.9883%, 9/23/19 (144A) | | | 600,000 | | | | 604,859 | |
Australia & New Zealand Banking Group, Ltd., ICE LIBOR USD 3 Month + 0.5000%, 1.8164%, 8/19/20 (144A) | | | 1,250,000 | | | | 1,255,259 | |
Bank Nederlandse Gemeenten NV, 1.5000%, 2/15/19 (144A) | | | 350,000 | | | | 349,004 | |
Bank Nederlandse Gemeenten NV, 1.8750%, 6/11/19 | | | 700,000 | | | | 701,046 | |
Bank of America Corp., ICE LIBOR USD 3 Month + 1.0700%, 2.3931%, 3/22/18 | | | 400,000 | | | | 401,367 | |
Bank of America Corp., ICE LIBOR USD 3 Month + 1.4200%, 2.7773%, 4/19/21 | | | 1,000,000 | | | | 1,029,896 | |
Bank of America Corp., 90 Day Australian Bank Bill Rate + 1.550%, 3.2400%, 8/5/21 | | | 300,000 | | | | 234,648 | |
Bank of America Corp., ICE LIBOR USD 3 Month + 0.6500%, 1.9711%, 10/1/21 | | | 1,200,000 | | | | 1,202,930 | |
Bank of America Corp., ICE LIBOR USD 3 Month + 1.1600%, 2.5226%, 1/20/23 | | | 1,350,000 | | | | 1,374,580 | |
Bank of Montreal, ICE LIBOR USD 3 Month + 0.6000%, 1.9103%, 12/12/19 | | | 1,000,000 | | | | 1,007,174 | |
Bank of Montreal, ICE LIBOR USD 3 Month + 0.4400%, 1.7600%, 6/15/20 | | | 800,000 | | | | 803,352 | |
Bank of Montreal, ICE LIBOR USD 3 Month + 0.6300%, 1.9472%, 9/11/22 (144A) | | | 500,000 | | | | 501,326 | |
Bank of Montreal, CDOR USD 3 Month + 1.0800%, 3.1200%, 9/19/24 | | | 550,000 | | | | 433,259 | |
Bank of Nova Scotia, ICE LIBOR USD 3 Month + 0.6400%, 1.9572%, 3/7/22 | | | 500,000 | | | | 500,397 | |
Bank of Nova Scotia, 2.7000%, 3/7/22 | | | 500,000 | | | | 503,722 | |
See Notes to Schedule of Investments and Other Information and Notes to Financial Statements.
| | |
| | Janus Detroit Street Trust ½ 7 |
Janus Henderson Short Duration Income ETF
Schedule of Investments
October 31, 2017
| | | | | | | | |
| | | Principal Amounts | | | Value | |
| Corporate Bonds – (continued) | | | | | | |
| Financial – (continued) | | | | | | |
Bank of Queensland, Ltd., 90 Day Australian Bank Bill Rate + 1.070%, 2.7600%, 11/6/19 | | | $ 1,370,000 | | | | $ 1,055,974 | |
Bank of Queensland, Ltd., 90 Day Australian Bank Bill Rate + 1.170%, 2.8600%, 10/26/20 | | | 500,000 | | | | 385,892 | |
Bendigo & Adelaide Bank, Ltd., 90 Day Australian Bank Bill Rate + 1.460%, 3.1600%, 4/20/21 | | | 450,000 | | | | 350,594 | |
Bendigo & Adelaide Bank, Ltd., 90 Day Australian Bank Bill Rate + 2.800%, 4.4900%, 1/29/24 | | | 500,000 | | | | 389,728 | |
Bendigo & Adelaide Bank, Ltd., 90 Day Australian Bank Bill Rate + 2.800%, 4.5350%, 12/9/26 | | | 200,000 | | | | 159,541 | |
BNZ International Funding, Ltd., 2.3500%, 3/4/19 (144A) | | | 800,000 | | | | 803,564 | |
Cboe Global Markets, Inc., 3.6500%, 1/12/27 | | | 350,000 | | | | 357,758 | |
Citigroup, Inc., ICE LIBOR USD 3 Month + 0.9300%, 2.2472%, 6/7/19 | | | 100,000 | | | | 100,962 | |
Citigroup, Inc., ICE LIBOR USD 3 Month + 0.7900%, 2.1403%, 1/10/20 | | | 850,000 | | | | 856,865 | |
Citigroup, Inc., ICE LIBOR USD 3 Month + 1.0700%, 2.3872%, 12/8/21 | | | 2,250,000 | | | | 2,285,996 | |
Citigroup, Inc., ICE LIBOR USD 3 Month + 0.9600%, 2.3274%, 4/25/22 | | | 750,000 | | | | 758,240 | |
Citizens Bank NA, ICE LIBOR USD 3 Month + 0.5400%, 1.8561%, 3/2/20 | | | 400,000 | | | | 400,991 | |
Citizens Bank NA, ICE LIBOR USD 3 Month + 0.5700%, 1.8872%, 5/26/20 | | | 600,000 | | | | 601,728 | |
Citizens Bank NA, 2.2500%, 10/30/20 | | | 1,100,000 | | | | 1,098,449 | |
Citizens Bank NA, ICE LIBOR USD 3 Month + 0.8100%, 2.1272%, 5/26/22 | | | 300,000 | | | | 300,680 | |
Commonwealth Bank of Australia, ICE LIBOR USD 3 Month + 0.8300%, 2.1461%, 9/6/21 | | | 1,000,000 | | | | 1,009,809 | |
Commonwealth Bank of Australia, ICE LIBOR USD 3 Month + 0.6800%, 2.0011%, 9/18/22 (144A) | | | 1,200,000 | | | | 1,203,457 | |
Commonwealth Bank of Australia, 90 Day Australian Bank Bill Rate + 2.650%, 4.3850%, 6/3/26 | | | 1,300,000 | | | | 1,039,796 | |
Commonwealth Bank of Australia, ICE LIBOR USD 3 Month + 2.094%, 3.3750%, 10/20/26 | | | 500,000 | | | | 500,550 | |
Cooperatieve Rabobank UA, ICE LIBOR USD 3 Month + 0.8300%, 2.1803%, 1/10/22 | | | 1,200,000 | | | | 1,215,690 | |
DBS Bank, Ltd., 90 Day Australian Bank Bill Rate + 0.5100%, 2.2450%, 9/4/20 | | | 1,000,000 | | | | 766,582 | |
DBS Group Holdings, Ltd., ICE LIBOR USD 3 Month + 0.4900%, 1.8072%,
6/8/20 (144A) | | | 800,000 | | | | 801,280 | |
DEXUS Finance Pty Ltd., 5.7500%, 9/10/18 | | | 100,000 | | | | 78,798 | |
DEXUS Finance Pty Ltd., 4.2000%, 11/9/22 | | | 2,200,000 | | | | 1,739,591 | |
E*TRADE Financial Corp., 2.9500%, 8/24/22 | | | 1,300,000 | | | | 1,300,328 | |
First Republic Bank, 2.5000%, 6/6/22 | | | 1,300,000 | | | | 1,290,553 | |
GAIF Bond Issuer Pty Ltd., 5.5000%, 3/20/18 | | | 900,000 | | | | 698,094 | |
GAIF Bond Issuer Pty Ltd., 3.4000%, 9/30/26 | | | 701,000 | | | | 688,338 | |
GAIF Bond Issuer Pty Ltd., 3.4000%, 9/30/26 (144A) | | | 350,000 | | | | 343,678 | |
General Property Trust, 3.5910%, 11/7/23 | | | 600,000 | | | | 457,882 | |
Goldman Sachs Group, Inc., ICE LIBOR USD 3 Month + 0.8000%, 2.1167%, 12/13/19 | | | 500,000 | | | | 503,850 | |
Goldman Sachs Group, Inc., ICE LIBOR USD 3 Month + 1.7700%, 3.0872%, 2/25/21 | | | 380,000 | | | | 394,419 | |
Goldman Sachs Group, Inc., ICE LIBOR USD 3 Month + 1.0500%, 2.3661%, 6/5/23 | | | 1,350,000 | | | | 1,361,995 | |
Goldman Sachs Group, Inc., ICE LIBOR USD 3 Month + 1.2010%, 3.2720%, 9/29/25 | | | 1,000,000 | | | | 996,411 | |
GPT Wholesale Shopping Centre Fund No 1, 3.9930%, 9/11/24 | | | 1,000,000 | | | | 770,850 | |
International Lease Finance Corp., 3.8750%, 4/15/18 | | | 1,006,000 | | | | 1,015,253 | |
International Lease Finance Corp., 7.1250%, 9/1/18 (144A) | | | 1,500,000 | | | | 1,562,627 | |
JPMorgan Chase & Co., 2.3500%, 1/28/19 | | | 800,000 | | | | 804,866 | |
JPMorgan Chase & Co., ICE LIBOR USD 3 Month + 1.2050%, 2.5830%, 10/29/20 | | | 250,000 | | | | 256,205 | |
JPMorgan Chase & Co., ICE LIBOR USD 3 Month + 0.6800%, 1.9961%, 6/1/21 | | | 600,000 | | | | 603,406 | |
JPMorgan Chase & Co., ICE LIBOR USD 3 Month + 0.9000%, 2.2674%, 4/25/23 | | | 1,900,000 | | | | 1,924,732 | |
Liberty Financial Pty Ltd., 3.7500%, 4/9/18 | | | 900,000 | | | | 690,286 | |
Lloyds Banking Group PLC, 3.6500%, 3/20/23 | | | 1,500,000 | | | | 1,154,420 | |
Lloyds Banking Group PLC, 2.9070%, 11/7/23 | | | 400,000 | | | | 400,000 | |
Macquarie Bank, Ltd., ICE LIBOR USD 3 Month + 0.3500%, 1.6856%,
4/4/19 (144A) | | | 1,400,000 | | | | 1,401,223 | |
See Notes to Schedule of Investments and Other Information and Notes to Financial Statements.
Janus Henderson Short Duration Income ETF
Schedule of Investments
October 31, 2017
| | | | | | | | |
| | | Principal Amounts | | | Value | |
| Corporate Bonds – (continued) | | | | | | |
| Financial – (continued) | | | | | | |
Macquarie Bank, Ltd., ICE LIBOR USD 3 Month + 1.1200%, 2.4980%,
7/29/20 (144A) | | | $ 1,000,000 | | | | $ 1,016,583 | |
Mizuho Financial Group, Inc., ICE LIBOR USD 3 Month + 0.8800%, 2.1972%, 9/11/22 | | | 1,100,000 | | | | 1,103,686 | |
Morgan Stanley, 2.1250%, 4/25/18 | | | 600,000 | | | | 601,100 | |
Morgan Stanley, ICE LIBOR USD 3 Month + 0.8500%, 2.2148%, 1/24/19 | | | 800,000 | | | | 805,225 | |
Morgan Stanley, ICE LIBOR USD 3 Month + 0.8000%, 2.1091%, 2/14/20 | | | 353,000 | | | | 354,755 | |
Morgan Stanley, ICE LIBOR USD 3 Month + 1.1800%, 2.5426%, 1/20/22 | | | 1,350,000 | | | | 1,370,838 | |
Morgan Stanley, ICE LIBOR USD 3 Month + 1.4000%, 2.7648%, 10/24/23 | | | 400,000 | | | | 411,241 | |
National Australia Bank, Ltd., 90 Day Australian Bank Bill Rate + 1.080%, 2.7700%, 11/5/20 | | | 2,000,000 | | | | 1,554,517 | |
National Australia Bank, Ltd., 90 Day Australian Bank Bill Rate + 1.850%, 3.5600%, 3/26/25 | | | 650,000 | | | | 505,929 | |
National Australia Bank, Ltd., 90 Day Australian Bank Bill Rate + 2.400%, 4.1200%, 9/21/26 | | | 1,000,000 | | | | 795,410 | |
Nederlandse Waterschapsbank NV, 1.7500%, 9/5/19 | | | 700,000 | | | | 698,953 | |
Nissan Financial Services Australia Pty Ltd., 2.5000%, 9/6/19 | | | 250,000 | | | | 191,357 | |
Nordea Bank AB, 2.3750%, 4/4/19 | | | 400,000 | | | | 402,638 | |
Nordea Bank AB, ICE LIBOR USD 3 Month + 0.4700%, 1.7872%, 5/29/20 (144A) | | | 400,000 | | | | 402,045 | |
Nordea Bank AB, 2.5000%, 9/17/20 (144A) | | | 200,000 | | | | 201,726 | |
Oversea-Chinese Banking Corp., Ltd., ICE LIBOR USD 3 Month + 1.848%, 3.7500%, 11/15/22 | | | 850,000 | | | | 850,436 | |
Oversea-Chinese Banking Corp., Ltd., USD SWAP SEMI 30/360 5YR + 2.2030%, 4.0000%, 10/15/24 | | | 250,000 | | | | 255,998 | |
Royal Bank of Canada, ICE LIBOR USD 3 Month + 0.4800%, 1.8580%, 7/29/19 | | | 200,000 | | | | 200,952 | |
Royal Bank of Canada, ICE LIBOR USD 3 Month + 0.7300%, 2.1068%, 2/1/22 | | | 500,000 | | | | 505,200 | |
Royal Bank of Canada, CDOR USD 3 Month + 1.0800%, 3.0400%, 7/17/24 | | | 850,000 | | | | 668,224 | |
Scentre Group Trust 1 / Scentre Group Trust 2, 2.3750%, 11/5/19 (144A) | | | 500,000 | | | | 501,224 | |
Shopping Centres Australasia Property Retail Trust, 3.7500%, 4/20/21 | | | 600,000 | | | | 463,892 | |
Shopping Centres Australasia Property Retail Trust, 3.9000%, 6/7/24 | | | 600,000 | | | | 458,102 | |
Simon Property Group LP, 2.3500%, 1/30/22 | | | 500,000 | | | | 498,439 | |
Simon Property Group LP, 2.6250%, 6/15/22 | | | 780,000 | | | | 783,218 | |
Sumitomo Mitsui Financial Group, Inc., ICE LIBOR USD 3 Month + 1.1400%, 2.4973%, 10/19/21 | | | 700,000 | | | | 711,581 | |
Sumitomo Mitsui Financial Group, Inc., 2.7840%, 7/12/22 | | | 420,000 | | | | 421,131 | |
Sumitomo Mitsui Financial Group, Inc., ICE LIBOR USD 3 Month + 0.7400%, 2.0939%, 10/18/22 | | | 500,000 | | | | 500,000 | |
Sumitomo Mitsui Trust Bank, Ltd., 2.0500%, 3/6/19 (144A) | | | 400,000 | | | | 400,006 | |
Toronto-Dominion Bank, 2.1250%, 7/2/19 | | | 800,000 | | | | 803,660 | |
Toronto-Dominion Bank, 2.2500%, 9/25/19 (144A) | | | 1,000,000 | | | | 1,005,324 | |
Toronto-Dominion Bank, 1.8500%, 9/11/20 | | | 360,000 | | | | 357,872 | |
Toronto-Dominion Bank, ICE LIBOR USD 3 Month + 0.9300%, 2.2492%, 12/14/20 | | | 1,000,000 | | | | 1,018,491 | |
Toronto-Dominion Bank, 2.5000%, 12/14/20 | | | 800,000 | | | | 808,044 | |
United Overseas Bank, Ltd., USD SWAP SEMI 30/360 5YR + 1.654%, 2.8800%, 3/8/27 | | | 500,000 | | | | 495,747 | |
Wells Fargo & Co., ICE LIBOR USD 3 Month + 1.0100%, 2.3272%, 12/7/20 | | | 500,000 | | | | 510,219 | |
Wells Fargo & Co., 2.5000%, 3/4/21 | | | 800,000 | | | | 803,172 | |
Wells Fargo & Co., ICE LIBOR USD 3 Month + 0.9300%, 2.2392%, 2/11/22 | | | 83,000 | | | | 83,870 | |
Wells Fargo & Co., ICE LIBOR USD 3 Month + 1.1100%, 2.4748%, 1/24/23 | | | 850,000 | | | | 867,255 | |
Wells Fargo Bank NA, ICE LIBOR USD 3 Month + 0.6500%, 1.9661%, 12/6/19 | | | 250,000 | | | | 252,453 | |
Westpac Banking Corp., ICE LIBOR USD 3 Month + 0.4300%, 1.7461%, 3/6/20 | | | 380,000 | | | | 381,280 | |
Westpac Banking Corp., ICE LIBOR USD 3 Month + 1.0000%, 2.3091%, 5/13/21 | | | 200,000 | | | | 203,052 | |
Westpac Banking Corp., ICE LIBOR USD 3 Month + 0.8500%, 2.1664%, 8/19/21 | �� | | 500,000 | | | | 506,333 | |
Westpac Banking Corp., ICE LIBOR USD 3 Month + 0.8500%, 2.2064%, 1/11/22 | | | 450,000 | | | | 455,345 | |
Westpac Banking Corp., 90 Day Australian Bank Bill Rate + 1.110%, 2.8000%, 2/7/22 | | | 2,000,000 | | | | 1,557,038 | |
Westpac Banking Corp., ICE LIBOR USD 3 Month + 0.7100%, 2.0408%, 6/28/22 | | | 750,000 | | | | 754,412 | |
Westpac Banking Corp., US Treasury Yield Curve Rate + 2.900%, 3.6250%, 2/28/23 | | | 500,000 | | | | 501,057 | |
| | | | | | | | |
| | | | 80,456,301 | |
See Notes to Schedule of Investments and Other Information and Notes to Financial Statements.
| | |
| | Janus Detroit Street Trust ½ 9 |
Janus Henderson Short Duration Income ETF
Schedule of Investments
October 31, 2017
| | | | | | | | |
| | | Principal Amounts | | | Value | |
| Corporate Bonds – (continued) | | | | | | |
| Government – 2.0% | | | | | | |
Airservices Australia, 2.7500%, 5/15/23 | | | $ 500,000 | | | | $ 381,788 | |
Argentina Treasury Bill, 0%, 11/24/17¤ | | | 485,886 | | | | 484,997 | |
Argentina Treasury Bill, 0%, 12/15/17¤ | | | 600,000 | | | | 597,879 | |
Argentina Treasury Bill, 0%, 3/16/18¤ | | | 107,891 | | | | 106,613 | |
Export-Import Bank of Korea, ICE LIBOR USD 3 Month + 0.7000%, 2.0172%, 5/26/19 | | | 308,000 | | | | 308,893 | |
International Bank for Reconstruction & Development, 3.5000%, 1/22/21 | | | 1,850,000 | | | | 1,300,190 | |
| | | | | | | | |
| | | | 3,180,360 | |
| Industrial – 6.2% | | | | | | |
Asciano Finance, Ltd., 5.0000%, 4/7/18 (144A) | | | 1,450,000 | | | | 1,467,351 | |
Australia Pacific Airports Melbourne Pty Ltd., 5.0000%, 6/4/20 | | | 200,000 | | | | 161,703 | |
Australia Pacific Airports Melbourne Pty Ltd., 3.7500%, 11/4/26 | | | 100,000 | | | | 75,381 | |
Brisbane Airport Corp Pty Ltd., 6.0000%, 10/21/20 | | | 260,000 | | | | 215,149 | |
Caterpillar Financial Services Corp., ICE LIBOR USD 3 Month + 0.1800%, 1.4961%, 12/6/18 (144A) | | | 650,000 | | | | 650,392 | |
Caterpillar Financial Services Corp., ICE LIBOR USD 3 Month + 0.5900%, 1.9061%, 6/6/22 | | | 1,800,000 | | | | 1,814,148 | |
General Electric Co., 2.7000%, 10/9/22 | | | 1,300,000 | | | | 1,317,563 | |
New Terminal Financing Co. Pty Ltd., 90 Day Australian Bank Bill Rate + 1.450%, 3.1550%, 7/12/24 | | | 2,700,000 | | | | 2,083,669 | |
Perth Airport Pty Ltd., 6.0000%, 7/23/20 | | | 464,000 | | | | 382,127 | |
QPH Finance Co. Pty Ltd., 5.7500%, 7/29/20 | | | 750,000 | | | | 616,175 | |
QPH Finance Co. Pty Ltd., 5.0000%, 7/7/21 | | | 150,000 | | | | 121,856 | |
Sydney Airport Finance Co. Pty Ltd., 7.7500%, 7/6/18 | | | 206,000 | | | | 163,728 | |
Sydney Airport Finance Co. Pty Ltd., 5.1250%, 2/22/21 (144A) | | | 200,000 | | | | 214,766 | |
Sydney Airport Finance Co. Pty Ltd., 3.9000%, 3/22/23 (144A) | | | 400,000 | | | | 416,144 | |
| | | | | | | | |
| | | | 9,700,152 | |
| Technology – 3.8% | | | | | | |
Apple, Inc., 2.1000%, 9/12/22 (144A) | | | 1,400,000 | | | | 1,384,960 | |
Broadcom Corp. / Broadcom Cayman Finance, Ltd., 3.0000%, 1/15/22 (144A) | | | 1,165,000 | | | | 1,179,212 | |
IBM Credit LLC, ICE LIBOR USD 3 Month + 0.2600%, 1.6226%, 1/20/21 | | | 1,600,000 | | | | 1,601,543 | |
International Business Machines Corp., ICE LIBOR USD 3 Month + 0.2300%, 1.6045%, 1/27/20 | | | 350,000 | | | | 351,166 | |
Oracle Corp., 1.9000%, 9/15/21 | | | 1,500,000 | | | | 1,484,126 | |
| | | | | | | | |
| | | | 6,001,007 | |
| Utilities – 2.8% | | | | | | |
AGL Energy, Ltd., 5.0000%, 11/5/21 | | | 150,000 | | | | 121,369 | |
AusNet Services Holdings Pty Ltd., 5.2500%, 2/14/20 | | | 200,000 | | | | 161,539 | |
ETSA Utilities Finance Pty Ltd., 90 Day Australian Bank Bill Rate + 1.0200%, 2.7300%, 8/29/22 | | | 1,000,000 | | | | 766,428 | |
ETSA Utilities Finance Pty Ltd., 3.5000%, 8/29/24 | | | 800,000 | | | | 608,572 | |
Korea Gas Corp., 2.8750%, 7/29/18 | | | 450,000 | | | | 451,458 | |
Korea Gas Corp., 4.2500%, 11/2/20 | | | 370,000 | | | | 386,539 | |
Korea Gas Corp., 2.7500%, 7/20/22 (144A) | | | 800,000 | | | | 793,332 | |
Korea South-East Power Co., Ltd., 5.7500%, 9/25/20 | | | 670,000 | | | | 547,217 | |
State Grid Overseas Investment 2016, Ltd., 2.2500%, 5/4/20 (144A) | | | 500,000 | | | | 498,042 | |
| | | | | | | | |
| | | | | 4,334,496 | |
Total Corporate Bonds (cost $148,144,974) | | | | | | | 147,957,995 | |
| Mortgage-Backed Securities – 0.1% | | | | | | |
CGDB Commercial Mortgage Trust 2017-BIO, ICE LIBOR USD 1 Month + 0.9500%, 2.1770%, 5/15/30 (144A) | | | 268,200 | | | | 268,284 | |
| Commercial Paper – 3.5% | | | | | | |
Mondelez International, Inc., 1.4231%, 11/6/17 (144A) | | | 725,000 | | | | 724,854 | |
ONEOK, Inc., 1.2857%, 11/6/17 (144A) | | | 1,600,000 | | | | 1,599,600 | |
Mattel, Inc., 1.4222%, 11/2/17 | | | 1,500,000 | | | | 1,499,933 | |
CNPC Finance, Ltd., 1.1990%, 11/13/17 (144A) | | | 1,600,000 | | | | 1,599,211 | |
Total Commercial Paper (cost $5,423,598) | | | | | | | 5,423,598 | |
Total Investments (total cost $153,836,772) – 98.4% | | | | | | | 153,649,877 | |
Cash, Receivables and Other Assets, net of Liabilities – 1.6% | | | | | | | 2,434,312 | |
Net Assets – 100% | | | | | | | $156,084,189 | |
See Notes to Schedule of Investments and Other Information and Notes to Financial Statements.
Janus Henderson Short Duration Income ETF
Schedule of Investments
October 31, 2017
Summary of Investments by Country – (Long Positions) (unaudited)
| | | | | | | | |
| Country | | Value | | | % of
Investment
Securities | |
United States | | | $74,689,484 | | | | 48.6% | |
Australia | | | 38,065,174 | | | | 24.8 | |
Canada | | | 9,900,077 | | | | 6.4 | |
Netherlands | | | 4,220,044 | | | | 2.7 | |
Singapore | | | 4,070,398 | | | | 2.7 | |
South Korea | | | 3,681,374 | | | | 2.4 | |
Cayman Islands | | | 3,621,513 | | | | 2.4 | |
Japan | | | 3,136,404 | | | | 2.0 | |
China | | | 3,088,315 | | | | 2.0 | |
New Zealand | | | 2,320,577 | | | | 1.5 | |
Hong Kong | | | 1,599,211 | | | | 1.0 | |
United Kingdom | | | 1,554,420 | | | | 1.0 | |
Luxembourg | | | 1,506,988 | | | | 1.0 | |
Argentina | | | 1,189,489 | | | | 0.8 | |
Sweden | | | 1,006,409 | | | | 0.7 | |
Total | | | $153,649,877 | | | | 100.0% | |
Schedule of Forward Foreign Currency Exchange Contracts, Open
| | | | | | | | | | | | | | | | |
Counterparty/
Foreign Currency | | Settlement Date | | | Foreign Currency Amount (Sold)/ Purchased | | | USD Currency Amount (Sold)/ Purchased | | | Unrealized
Appreciation
(Depreciation) | |
Bank of America N.A.: | | | | | | | | | | | | | | | | |
New Zealand Dollar | | | 11/21/17 | | | | (1,900,000) | | | | $1,366,892 | | | | $65,788 | |
Barclays Bank PLC: | | | | | | | | | | | | | | | | |
Australian Dollar | | | 11/21/17 | | | | (21,700,000) | | | | 16,992,228 | | | | 357,025 | |
BNP Paribas S.A.: | | | | | | | | | | | | | | | | |
Australian Dollar | | | 11/21/17 | | | | (1,500,000) | | | | 1,166,370 | | | | 16,471 | |
Citibank N.A.: | | | | | | | | | | | | | | | | |
Canadian Dollar | | | 11/21/17 | | | | (1,420,000) | | | | 1,135,379 | | | | 33,651 | |
J.P. Morgan Chase Bank: | | | | | | | | | | | | | | | | |
Australian Dollar | | | 11/21/17 | | | | (2,600,000) | | | | 2,047,716 | | | | 54,558 | |
Australian Dollar | | | 11/21/17 | | | | (8,320,000) | | | | 6,514,693 | | | | 136,587 | |
Euro | | | 11/21/17 | | | | (105,000) | | | | 123,658 | | | | 1,218 | |
| | | | | | | | | | | | | | | | 192,363 | |
Morgan Stanley & Co.: | | | | | | | | | | | | | | | | |
Euro | | | 11/21/17 | | | | 105,000 | | | | (124,544) | | | | (2,104) | |
Total | | | | | | | | $663,194 | |
Schedule of Futures
| | | | | | | | | | | | | | | | | | | | |
| Description | | Number of
Contracts | | | Expiration
Date | | | Value and
Notional
Amount | | | Unrealized
Appreciation
(Depreciation) | | | Variation Margin
Asset/(Liability) | |
Futures Sold: | | | | | | | | | | | | | | | | | | | | |
10-Year U.S. Treasury Note | | | 20 | | | | 12/19/17 | | | | $2,498,750 | | | | $53,683 | | | | $1,563 | |
3-Year Australian Bond | | | 63 | | | | 12/15/17 | | | | 5,390,429 | | | | (26,985) | | | | (5,900) | |
5-Year U.S. Treasury Note | | | 194 | | | | 12/29/17 | | | | 22,734,375 | | | | 186,206 | | | | 13,641 | |
Total | | | | | | | | | | | | | | | $212,904 | | | | $9,304 | |
See Notes to Schedule of Investments and Other Information and Notes to Financial Statements.
| | |
| | Janus Detroit Street Trust ½ 11 |
Janus Henderson Short Duration Income ETF
Schedule of Investments
October 31, 2017
Schedule of OTC Credit Default Swaps – Sell Protection(1)
| | | | | | | | | | | | | | | | | | | | | | | | |
Counterparty/
Reference Asset Type/
Reference Asset | | S&P
Credit
Rating | | | Maturity
Date | | | Notional
Amount(2) | | | Premiums
Paid/(Received) | | | Unrealized
Appreciation/
(Depreciation) | | | Outstanding
Swap Contracts
at Value
Asset/(Liability) | |
Morgan Stanley & Co.: | | | | | | | | | | | | | | | | | | | | | | | | |
Foreign Government Bonds | | | | | | | | | | | | | | | | | | | | | | | | |
United Mexican States, Fixed Rate
1.00% Paid Quarterly | | | BBB+ | | | | 12/20/17 | | | | 500,000 USD | | | | $238 | | | | $891 | | | | $1,129 | |
| (1) | If a credit event occurs, the seller of protection will pay a net settlement amount equal to the notional amount of the swap less the recovery value of the reference asset from related offsetting purchase protection. |
| (2) | If a credit event occurs, the notional amount represents the maximum potential amount the Fund could be required to make as a seller of credit protection or receive as a buyer of protection. |
The following tables, grouped by derivative type, provide information about the fair value and location of derivatives within the Statement of Assets and Liabilities as of October 31, 2017.
Fair Value of Derivative Instruments (not accounted for as hedging instruments) as of October 31, 2017
| | | | | | | | | | | | | | | | |
| | | Credit
Contracts | | | Interest Rate
Contracts | | | Currency
Contracts | | | Total | |
| Asset Derivatives: | | | | | | | | | | | | | | | | |
| Forward foreign currency exchange contracts | | $ | — | | | $ | — | | | $ | 665,298 | | | $ | 665,298 | |
| Outstanding swap contracts, at value | | | 1,129 | | | | — | | | | — | | | | 1,129 | |
| Variation margin receivable | | | — | | | | 15,204 | | | | — | | | | 15,204 | |
| Total Asset Derivatives | | $ | 1,129 | | | $ | 15,204 | | | $ | 665,298 | | | $ | 681,631 | |
| | | | |
| | | Credit
Contracts | | | Interest Rate
Contracts | | | Currency
Contracts | | | Total | |
| Liability Derivatives: | | | | | | | | | | | | | | | | |
| Forward foreign currency exchange contracts | | $ | — | | | $ | — | | | $ | 2,104 | | | $ | 2,104 | |
| Variation margin payable | | | — | | | | 5,900 | | | | — | | | | 5,900 | |
| Total Liability Derivatives | | $ | — | | | $ | 5,900 | | | $ | 2,104 | | | $ | 8,004 | |
See Notes to Schedule of Investments and Other Information and Notes to Financial Statements.
Janus Henderson Short Duration Income ETF
Schedule of Investments
October 31, 2017
The following tables provide information about the effect of derivatives and hedging activities on the Fund’s Statement of Operations for the period ended October 31, 2017.
The effect of Derivative Instruments (not accounted for as hedging instruments) on the Statement of Operations for the period ended October 31, 2017
| | | | | | | | | | | | | | | | |
| Amount of Realized Gain/(Loss) Recognized on Derivatives | | | | |
| Derivative | | Credit
Contracts | | | Interest Rate
Contracts | | | Currency
Contracts | | | Total | |
| Forward foreign currency exchange contracts | | $ | — | | | $ | — | | | $ | (703,011) | | | $ | (703,011) | |
| Futures contracts | | | — | | | | (193,178) | | | | — | | | | (193,178) | |
| Swap contracts | | | 2,527 | | | | — | | | | — | | | | 2,527 | |
| Total | | $ | 2,527 | | | $ | (193,178) | | | $ | (703,011) | | | $ | (893,662) | |
| |
| Amount of Change in Unrealized Appreciation/Depreciation Recognized on Derivatives | | | | |
| Derivative | | Credit
Contracts | | | Interest Rate
Contracts | | | Currency
Contracts | | | Total | |
| Forward foreign currency exchange contracts | | $ | — | | | $ | — | | | $ | 663,194 | | | $ | 663,194 | |
| Futures contracts | | | — | | | | 212,904 | | | | — | | | | 212,904 | |
| Swap contracts | | | 891 | | | | — | | | | — | | | | 891 | |
| Total | | $ | 891 | | | $ | 212,904 | | | $ | 663,194 | | | $ | 876,989 | |
Please see the “Net Realized Gain/(Loss) on Investments” and “Change in Unrealized Net Appreciation/Depreciation” sections of the Fund’s Statement of Operations.
Average Ending Monthly Market Value of Derivative Instruments During the Year Ended October 31, 2017
| | | | |
| | | Market Value | |
| Forward foreign currency exchange contracts, purchased | | $ | 10,203 | |
| Forward foreign currency exchange contracts, sold | | | 10,121,898 | |
| Futures contracts, purchased | | | 84,656 | |
| Futures contracts, sold | | | 10,813,166 | |
| Credit default swaps, long | | | 1,933 | |
See Notes to Schedule of Investments and Other Information and Notes to Financial Statements.
| | |
| | Janus Detroit Street Trust ½ 13 |
Janus Henderson Short Duration Income ETF
Notes to Schedule of Investments and Other Information
| | |
| |
| LIBOR | | LIBOR (London Interbank Offered Rate) is a short-term interest rate that banks offer one another and generally represents current cash rates. |
| |
| LLC | | Limited Liability Company |
| |
| LP | | Limited Partnership |
| |
| OTC | | Over-the-Counter |
| |
| PLC | | Public Limited Company |
| 144A | Securities sold under Rule 144A of the Securities Act of 1933, as amended, are subject to legal and/or contractual restrictions on resale and may not be publicly sold without registration under the 1993 Act. Unless otherwise noted, these securities have been determined to be liquid under guidelines established by the Board of Trustees. The total value of 144A securities as of the year ended October 31, 2017 is $38,818,202, which represents 24.9% of net assets. |
The following is a summary of the inputs that were used to value the Fund’s investments in securities and other financial instruments as of October 31, 2017. See Notes to Financial Statements for more information.
Valuation Inputs Summary
| | | | | | | | | | | | |
| | | Level 1 -
Quoted Prices | | | Level 2 -
Other Significant
Observable Inputs | | | Level 3 -
Significant
Unobservable Inputs | |
Assets | | | | | | | | | | | | |
Investments in Securities: | | | | | | | | | | | | |
Corporate Bonds | | $ | — | | | $ | 147,957,995 | | | $ | — | |
Mortgage-Backed Securities | | | — | | | | 268,284 | | | | — | |
Commercial Paper | | | — | | | | 5,423,598 | | | | — | |
| | | | |
Total Investments in Securities | | $ | — | | | $ | 153,649,877 | | | $ | — | |
Other Financial Instruments(a): | | | | | | | | | | | | |
Forward Foreign Currency Exchange Contracts | | $ | — | | | $ | 665,298 | | | $ | — | |
Outstanding Swap Contracts, at Value | | | — | | | | 1,129 | | | | — | |
Variation Margin Receivable | | | 15,204 | | | | — | | | | — | |
| | | | |
Total Assets | | $ | 15,204 | | | $ | 154,316,304 | | | $ | — | |
| | | | |
Liabilities | | | | | | | | | | | | |
Other Financial Instruments(a): | | | | | | | | | | | | |
Forward Foreign Currency Exchange Contracts | | $ | — | | | $ | 2,104 | | | $ | — | |
Variation Margin Payable | | | 5,900 | | | | — | | | | — | |
| | | | |
Total Liabilities | | $ | 5,900 | | | $ | 2,104 | | | $ | — | |
| (a) | Other financial instruments include forward foreign currency exchange, futures, written options, written swaptions, and swap contracts. Forward foreign currency exchange contracts are reported at their unrealized appreciation/(depreciation) at measurement date, which represents the change in the contract’s value from trade date. Futures, certain written options on futures, and centrally cleared swap contracts are reported at their variation margin at measurement date, which represents the amount due to/from the Fund at that date. Written options, written swaptions, and other swap contracts are reported at their market value at measurement date. |
See Notes to Schedule of Investments and Other Information and Notes to Financial Statements.
Janus Henderson Short Duration Income ETF
Statement of Assets and Liabilities
October 31, 2017
| | | | |
Assets: | | | | |
Investments, at value(1) | | $ | 153,649,877 | |
Cash | | | 4,750,748 | |
Cash denominated in foreign currency(2) | | | 76,734 | |
Forward foreign currency exchange contracts | | | 665,298 | |
Variation margin receivable | | | 15,204 | |
Deposits with brokers for futures | | | 210,000 | |
Outstanding swap contracts, at value(3) | | | 1,129 | |
Receivables: | | | | |
Investments sold | | | 898,758 | |
Interest | | | 663,778 | |
Total Assets | | | 160,931,526 | |
Liabilities: | | | | |
Forward foreign currency exchange contracts | | | 2,104 | |
Variation margin payable | | | 5,900 | |
Payables: | | | | |
Investments purchased | | | 4,796,708 | |
Management fees | | | 42,625 | |
Total Liabilities | | | 4,847,337 | |
Net Assets | | $ | 156,084,189 | |
Net Assets Consists of: | | | | |
Capital (par value and paid-in surplus) | | $ | 155,558,371 | |
Undistributed net investment income/(loss) | | | 666,239 | |
Undistributed net realized gain/(loss) from investments and foreign currency transactions | | | (824,643) | |
Unrealized net appreciation/(depreciation) on investments and foreign currency translations | | | 684,222 | |
Total Net Assets | | $ | 156,084,189 | |
Net Assets | | $ | 156,084,189 | |
Shares outstanding, $0.001 Par Value (unlimited shares authorized) | | | 3,100,001 | |
Net Asset Value Per Share | | $ | 50.35 | |
| (1) | Includes cost of $153,836,772. |
| (2) | Includes cost of $76,858. |
| (3) | Net premiums paid of $238. |
See Notes to Financial Statements.
| | |
| | Janus Detroit Street Trust ½ 15 |
Janus Henderson Short Duration Income ETF
Statement of Operations
For the period ended October 31, 2017(1)
| | | | |
Investment Income: | | | | |
Interest | | $ | 1,314,412 | |
Foreign tax withheld | | | (2,065) | |
Total Investment Income | | | 1,312,347 | |
Expenses: | | | | |
Management Fees | | | 222,976 | |
Total Expenses | | | 222,976 | |
Net Investment Income/(Loss) | | | 1,089,371 | |
Net Realized Gain/(Loss) on Investments: | | | | |
Investments and foreign currency transactions | | | 479,179 | |
Forward foreign currency exchange contracts | | | (703,011) | |
Futures contracts | | | (193,178) | |
Swap contracts | | | 2,527 | |
Total Net Realized Gain/(Loss) on Investments | | | (414,483) | |
Change in Unrealized Net Appreciation/Depreciation: | | | | |
Investments and foreign currency translations | | | (192,767) | |
Forward foreign currency exchange contracts | | | 663,194 | |
Futures contracts | | | 212,904 | |
Swap contracts | | | 891 | |
Total Change in Unrealized Net Appreciation/Depreciation | | | 684,222 | |
Net Increase/(Decrease) in Net Assets Resulting from Operations | | $ | 1,359,110 | |
| (1) | Period from November 16, 2016 (commencement of operations) through October 31, 2017. |
See Notes to Financial Statements.
Janus Henderson Short Duration Income ETF
Statement of Changes in Net Assets
| | | | |
| | | Period ended October 31, 2017(1) | |
Operations: | | | | |
Net investment income/(loss) | | $ | 1,089,371 | |
Net realized gain/(loss) on investments | | | (414,483) | |
Change in unrealized net appreciation/depreciation | | | 684,222 | |
Net Increase/(Decrease) in Net Assets Resulting from Operations | | | 1,359,110 | |
Dividends and Distributions to Shareholders: | | | | |
Dividends from Net Investment Income | | | (833,292) | |
Capital Share Transactions | | | 155,558,371 | |
Net Increase/(Decrease) in Net Assets | | | 156,084,189 | |
Net Assets: | | | | |
Beginning of period | | | — | |
End of period | | $ | 156,084,189 | |
| |
| | | | |
Undistributed Net Investment Income/(Loss) | | $ | 666,239 | |
| (1) | Period from November 16, 2016 (commencement of operations) through October 31, 2017. |
See Notes to Financial Statements.
| | |
| | Janus Detroit Street Trust ½ 17 |
Janus Henderson Short Duration Income ETF
Financial Highlights
| | | | | | |
| For a share outstanding during the period ended October 31 | | 2017(1) | |
| | Net Asset Value, Beginning of Period | | | $50.00 | |
| | Income/(Loss) from Investment Operations: | | | | |
| | Net investment income/(loss)(2) | | | 0.82 | |
| | Net realized and unrealized gain/(loss) | | | 0.11 | |
| | Total from Investment Operations | | | 0.93 | |
| | Less Dividends and Distributions: | | | | |
| | Dividends (from net investment income) | | | (0.58) | |
| | Total Dividends and Distributions | | | (0.58) | |
| | Net Asset Value, End of Period | | | $50.35 | |
| | Total Return* | | | 1.87% | |
| | Net assets, End of Period (in thousands) | | | $156,084 | |
| | Average Net Assets for the Period (in thousands) | | | $66,131 | |
| | Ratios to Average Net Assets**: | | | | |
| | Ratio of Gross Expenses | | | 0.35% | |
| | Ratio of Net Investment Income/(Loss) | | | 1.71% | |
| | Portfolio Turnover Rate(3) | | | 44% | |
| * | Total return not annualized for periods of less than one full year. |
| ** | Annualized for periods of less than one full year. |
| (1) | Period from November 16, 2016 (commencement of operations) through October 31, 2017. |
| (2) | Per share amounts are calculated based on average shares outstanding during the year or period. |
| (3) | Portfolio turnover rate excludes securities received or delivered from in-kind processing of creation or redemptions. |
See Notes to Financial Statements.
Janus Henderson Short Duration Income ETF
Notes to Financial Statements
1. Organization and Significant Accounting Policies
Janus Henderson Short Duration Income ETF (the “Fund”) (formerly named Janus Short Duration Income ETF) is a series fund. The Fund is part of Janus Detroit Street Trust (the “Trust”), which is organized as a Delaware statutory trust and is registered under the Investment Company Act of 1940, as amended (the “1940 Act”), as an open-end management investment company, and therefore has applied the specialized accounting and reporting guidance in Financial Accounting Standards Board (“FASB”) Accounting Standards Codification (“ASC”) Topic 946. The financial statements include information for the period from November 16, 2016 (commencement of operations) through October 31, 2017. The Trust offers nine Funds each of which represent shares of beneficial interest in a separate portfolio of securities and other assets with its own objective and policies. The Fund seeks to provide a steady income stream with capital preservation across various market cycles. The Fund seeks to consistently outperform the LIBOR 3-month rate by a moderate amount through various market cycles while at the same time providing low volatility. The Fund is classified as diversified, as defined in the 1940 Act.
The Fund is an actively-managed exchange-traded fund. Unlike shares of traditional mutual funds, shares of the Fund are not individually redeemable and may only be purchased or redeemed directly from the Fund at net asset value (“NAV”) in large increments called “Creation Units” (100,000 shares per Creation Unit) through certain participants, known as “Authorized Participants.” The Fund will issue or redeem Creation Units in exchange for portfolio securities and/or cash. Except when aggregated in Creation Units, Fund shares are not redeemable securities of the Fund. Shares of the Fund are listed and trade on NYSE Arca, Inc. (“NYSE Arca”), and individual investors can purchase or sell shares in much smaller increments for cash in the secondary market through a broker. These transactions, which do not involve the Fund, are made at market prices that may vary throughout the day and differ from the Fund’s NAV. As a result, you may pay more than NAV (at a premium) when you purchase shares, and receive less than NAV (at a discount) when you sell shares, in the secondary market.
An Authorized Participant may hold of record more than 25% of the outstanding shares of the Fund. From time to time, Authorized Participants may be a beneficial and/or legal owner of the Fund, may be affiliated with an index provider, may be deemed to have control of the Fund and/or may be able to affect the outcome of matters presented for a vote of the shareholders of the Fund. Authorized Participants may execute an irrevocable proxy granting the Distributor or an affiliate of Janus Capital Management LLC (“Janus Capital” or “Janus”) power to vote or abstain from voting such Authorized Participant’s beneficially or legally owned shares of the Fund. In such cases, the agent shall mirror vote (or abstain from voting) such shares in the same proportion as all other beneficial owners of the Fund.
The following accounting policies have been followed by the Fund and are in conformity with accounting principles generally accepted in the United States of America.
Investment Valuation
Securities held by the Fund are valued in accordance with policies and procedures established by and under the supervision of the Trustees (the “Valuation Procedures”). Equity securities, including shares of exchange-traded funds, traded on a domestic securities exchange are generally valued at the closing prices on the primary market or exchange on which they trade. If such price is lacking for the trading period immediately preceding the time of determination, such securities are valued at their current bid price. Equity securities that are traded on a foreign exchange are generally valued at the closing prices on such markets. In the event that there is no current trading volume on a particular security in such foreign exchange, the bid price from the primary exchange is generally used to value the security. Securities that are traded on the over-the-counter (“OTC”) markets are generally valued at their closing or latest bid prices as available. Foreign securities and currencies are converted to U.S. dollars using the applicable exchange rate in effect at the close of the New York Stock Exchange (“NYSE”). The Fund will determine the market value of individual securities held by it by using prices provided by one or more approved professional pricing services or, as needed, by obtaining market quotations from independent broker-dealers. Most debt securities are valued in accordance with the evaluated bid price supplied by the pricing service that is intended to reflect market value. The evaluated bid price supplied by the pricing service is an evaluation that may consider factors such as security prices, yields, maturities and ratings. Certain short-term securities maturing within 60 days or less may be evaluated and valued on an amortized cost basis provided that the amortized cost determined approximates market value. Securities for which market quotations or evaluated prices are not readily available or are deemed unreliable are valued at fair value determined in good faith under the Valuation Procedures. Circumstances in which fair value pricing may be utilized include, but are not limited to: (i) a significant event that may affect the securities of a single issuer, such as a merger, bankruptcy, or significant issuer-specific development; (ii) an event that may affect an entire market, such as a natural disaster or significant governmental action; (iii) a nonsignificant event such as a market closing early or not opening, or a security trading halt; and (iv) pricing of a nonvalued security and a restricted or nonpublic security. Special valuation considerations may apply with respect to
| | |
| | Janus Detroit Street Trust ½ 19 |
Janus Henderson Short Duration Income ETF
Notes to Financial Statements
“odd-lot” fixed-income transactions which, due to their small size, may receive evaluated prices by pricing services which reflect a large block trade and not what actually could be obtained for the odd-lot position.
Valuation Inputs Summary
FASB ASC 820, Fair Value Measurements and Disclosures (“ASC 820”), defines fair value, establishes a framework for measuring fair value, and expands disclosure requirements regarding fair value measurements. This standard emphasizes that fair value is a market-based measurement that should be determined based on the assumptions that market participants would use in pricing an asset or liability and establishes a hierarchy that prioritizes inputs to valuation techniques used to measure fair value. These inputs are summarized into three broad levels:
Level 1 – Unadjusted quoted prices in active markets the Fund has the ability to access for identical assets or liabilities.
Level 2 – Observable inputs other than unadjusted quoted prices included in Level 1 that are observable for the asset or liability either directly or indirectly. These inputs may include quoted prices for the identical instrument on an inactive market, prices for similar instruments, interest rates, prepayment speeds, credit risk, yield curves, default rates and similar data.
Assets or liabilities categorized as Level 2 in the hierarchy generally include: debt securities fair valued in accordance with the evaluated bid or ask prices supplied by a pricing service; securities traded on OTC markets and listed securities for which no sales are reported that are fair valued at the latest bid price (or yield equivalent thereof) obtained from one or more dealers transacting in a market for such securities or by a pricing service approved by the Fund’s Trustees; and certain short-term debt securities with maturities of 60 days or less that are fair valued at amortized cost. Other securities that may be categorized as Level 2 in the hierarchy include, but are not limited to, preferred stocks, bank loans, swaps, investments in unregistered investment companies, options, and forward contracts.
Level 3 – Unobservable inputs for the asset or liability to the extent that relevant observable inputs are not available, representing the Fund’s own assumptions about the assumptions that a market participant would use in valuing the asset or liability, and that would be based on the best information available.
There have been no significant changes in valuation techniques used in valuing any such positions held by the Fund since the beginning of the fiscal year.
The inputs or methodology used for fair valuing securities are not necessarily an indication of the risk associated with investing in those securities. The summary of inputs used as of October 31, 2017 to fair value the Fund’s investments in securities and other financial instruments is included in the “Valuation Inputs Summary” in the Notes to Schedule of Investments and Other Information.
There were no transfers between Level 1, Level 2 and Level 3 of the fair value hierarchy during the period. The Fund recognizes transfers between the levels as of the beginning of the fiscal year.
Investment Transactions and Investment Income
Investment transactions are accounted for as of the date purchased or sold (trade date). Dividend income is recorded on the ex-dividend date. Certain dividends from foreign securities will be recorded as soon as the Fund is informed
of the dividend, if such information is obtained subsequent to the ex-dividend date. Dividends from foreign securities may be subject to withholding taxes in foreign jurisdictions. Interest income is recorded on the accrual basis and includes amortization of premiums and accretion of discounts. Gains and losses are determined on the identified cost basis, which is the same basis used for federal income tax purposes.
Estimates
The preparation of financial statements in conformity with accounting principles generally accepted in the United States of America requires management to make estimates and assumptions that affect the reported amount of assets and liabilities and disclosure of contingent assets and liabilities at the date of the financial statements and the reported amounts of income and expenses during the reporting period. Actual results could differ from those estimates.
Indemnifications
In the normal course of business, the Fund may enter into contracts that contain provisions for indemnification of other parties against certain potential liabilities. The Fund’s maximum exposure under these arrangements is unknown, and would involve future claims that may be made against the Fund that have not yet occurred. Currently, the risk of material loss from such claims is considered remote.
Janus Henderson Short Duration Income ETF
Notes to Financial Statements
Foreign Currency Translations
The Fund does not isolate that portion of the results of operations resulting from the effect of changes in foreign exchange rates on investments from the fluctuations arising from changes in market prices of securities held at the date of the financial statements. Net unrealized appreciation or depreciation of investments and foreign currency translations arise from changes in the value of assets and liabilities, including investments in securities held at the date of the financial statements, resulting from changes in the exchange rates and changes in market prices of securities held.
Currency gains and losses are also calculated on payables and receivables that are denominated in foreign currencies. The payables and receivables are generally related to foreign security transactions and income translations.
Foreign currency-denominated assets and forward currency contracts may involve more risks than domestic transactions, including currency risk, counterparty risk, political and economic risk, regulatory risk and equity risk. Risks may arise from unanticipated movements in the value of foreign currencies relative to the U.S. dollar.
Dividends and Distributions
Dividends from net investment income are declared daily and distributed monthly for the Fund. Net realized capital gains (if any) are distributed annually. The Fund may treat a portion of the amount paid to redeem shares as a distribution of investment company taxable income and realized capital gains that are reflected in the NAV. This practice, commonly referred to as “equalization,” has no effect on the redeeming shareholder or a Fund’s total return, but may reduce the amounts that would otherwise be required to be paid as taxable dividends to the remaining shareholders. It is possible that the Internal Revenue Service (IRS) could challenge the Fund’s equalization methodology or calculations, and any such challenge could result in additional tax, interest, or penalties to be paid by the Fund.
Federal Income Taxes
The Fund intends to qualify as a regulated investment company and distribute all of its taxable income in accordance with the requirements of Subchapter M of the Internal Revenue Code. Management has analyzed the Fund’s tax positions taken for all open federal income tax years, generally a three-year period, and has concluded that no provision for federal income tax is required in the Fund’s financial statements. The Fund is not aware of any tax positions for which it is reasonably possible that the total amounts of unrecognized tax benefits will significantly change in the next twelve months.
2. Derivative Instruments
The Fund may invest in various types of derivatives. A derivative is a financial instrument whose performance is derived from the performance of another asset. The Fund may invest in derivative instruments including, but not limited to: futures contracts, options, and swaps. Each derivative instrument that was held by the Fund during the period ended October 31, 2017 is discussed in further detail below.
The Fund may use derivative instruments for risk management purposes or as part of its investment strategies. The Fund’s use of derivative instruments involves risks different from, or possibly greater than, the risks associated with investing directly in securities and other traditional investments. Derivatives are subject to a number of risks including liquidity risk, market risk, credit risk, default risk, counterparty risk and management risk. They also involve the risk of mispricing or improper valuation and the risk that changes in the value of the derivative may not correlate exactly with the change in the value of the underlying asset, rate or index. Also, suitable derivative transactions may not be available in all circumstances and there can be no assurance that the Fund will engage in these transactions to reduce exposure to other risks when that would be beneficial. The Fund’s ability to use derivatives may also be limited by certain regulatory and tax considerations.
In pursuit of its investment objective, the Fund may seek to use derivatives to increase or decrease exposure to the following market risk factors:
| | • | | Counterparty Risk – the risk that the counterparty (the party on the other side of the transaction) on a derivative transaction will be unable to honor its financial obligation to the Fund. |
| | • | | Credit Risk – the risk an issuer will be unable to make principal and interest payments when due, or will default on its obligations. |
| | • | | Equity Risk – the risk related to the change in value of equity securities as they relate to increases or decreases in the general market. |
| | • | | Index Risk – if the derivative is linked to the performance of an index, it will be subject to the risks associated with changes in that index. If the index changes, the Fund could receive lower interest payments or experience a reduction in the value of the derivative to below what the Fund paid. Certain indexed securities, including |
| | |
| | Janus Detroit Street Trust ½ 21 |
Janus Henderson Short Duration Income ETF
Notes to Financial Statements
| | inverse securities (which move in an opposite direction to the index), may create leverage, to the extent that they increase or decrease in value at a rate that is a multiple of the changes in the applicable index. |
| | • | | Interest Rate Risk – the risk that the value of fixed-income securities will generally decline as prevailing interest rates rise, which may cause the Fund’s NAV to likewise decrease. |
| | • | | Liquidity Risk – the risk that certain securities may be difficult or impossible to sell at the time that the seller would like or at the price that the seller believes the security is currently worth. |
Derivatives may generally be traded OTC or on an exchange. Derivatives traded OTC are agreements that are individually negotiated between parties and can be tailored to meet a purchaser’s needs. OTC derivatives are not guaranteed by a clearing agency and may be subject to increased credit risk.
Forward Foreign Currency Exchange Contracts
A forward foreign currency exchange contract (“forward currency contract”) is an obligation to buy or sell a specified currency at a future date at a negotiated rate (which may be U.S. dollars or a foreign currency). The Fund may enter into forward currency contracts for hedging purposes, including, but not limited to, reducing exposure to changes in foreign currency exchange rates on foreign portfolio holdings and locking in the U.S. dollar cost of firm purchase and sale commitments for securities denominated in or exposed to foreign currencies. The Fund may also invest in forward currency contracts for nonhedging purposes such as seeking to enhance returns. The Fund is subject to currency risk and counterparty risk in the normal course of pursuing its investment objective through its investments in forward currency contracts.
Forward currency contracts are valued by converting the foreign value to U.S. dollars by using the current spot U.S. dollar exchange rate and/or forward rate for that currency. Exchange and forward rates as of the close of the NYSE shall be used to value the forward currency contracts. The unrealized appreciation/(depreciation) for forward currency contracts is reported in the Statement of Assets and Liabilities as a receivable or payable and in the Statement of Operations for the change in unrealized net appreciation/depreciation. The gain or loss arising from the difference between the U.S. dollar cost of the original contract and the value of the foreign currency in U.S. dollars upon closing a forward currency contract is reported on the Statement of Operations.
During the period, the Fund entered into forward currency contracts with the obligation to purchase foreign currencies in the future at an agreed upon rate in order to take a positive outlook on the related currency. These forward contracts seek to increase exposure to currency risk.
During the period, the Fund entered into forward currency contracts with the obligation to purchase foreign currencies in the future at an agreed upon rate in order to decrease exposure to currency risk associated with foreign currency denominated securities held by the Fund.
During the period, the Fund has entered into forward contracts with the obligation to sell foreign currencies in the future at an agreed upon rate in order to take a negative outlook on the related currency. These forward contracts seek to increase exposure to currency risk.
During the period, the Fund entered into forward currency contracts with the obligation to sell foreign currencies in the future at an agreed upon rate in order to decrease exposure to currency risk associated with foreign currency denominated securities held by the Fund.
Futures Contracts
A futures contract is an exchange-traded agreement to take or make delivery of an underlying asset at a specific time in the future for a specific predetermined negotiated price. The Fund may enter into futures contracts to gain exposure to the stock market or other markets pending investment of cash balances or to meet liquidity needs. The Fund is subject to interest rate risk, equity risk, and currency risk in the normal course of pursuing its investment objective through its investments in futures contracts. The Fund may also use such derivative instruments to hedge or protect from adverse movements in securities prices, currency rates or interest rates. The use of futures contracts may involve risks such as the possibility of illiquid markets or imperfect correlation between the values of the contracts and the underlying securities, or that the counterparty will fail to perform its obligations.
Futures contracts on commodities are valued at the settlement price on valuation date on the commodities exchange as reported by an approved vendor. Mini contracts, as defined in the description of the contract, shall be valued using the Actual Settlement Price or “ASET” price type as reported by an approved vendor. In the event that foreign futures trade when the foreign equity markets are closed, the last foreign futures trade price shall be used. Futures contracts are marked-to-market daily, and the daily variation margin is recorded as a receivable or payable on the Statement of Assets
Janus Henderson Short Duration Income ETF
Notes to Financial Statements
and Liabilities (if applicable). The change in unrealized net appreciation/depreciation is reported on the Statement of Operations. When a contract is closed, a realized gain or loss is reported on the Statement of Operations, equal to the difference between the opening and closing value of the contract. Securities held by the Fund that are designated as collateral for market value on futures contracts are noted on the Schedule of Investments (if applicable). Such collateral is in the possession of the Fund’s futures option merchant.
With futures, there is minimal counterparty credit risk to the Fund since futures are exchange-traded and the exchange’s clearinghouse, as counterparty to all exchange-traded futures, guarantees the futures against default.
During the period, the Fund purchased interest rate futures to increase exposure to interest rate risk.
During the period, the Fund sold interest rate futures to decrease exposure to interest rate risk.
Swaps
Swap agreements are two-party contracts entered into primarily by institutional investors for periods ranging from a day to more than one year to exchange one set of cash flows for another. The most significant factor in the performance of swap agreements is the change in value of the specific index, security, or currency, or other factors that determine the amounts of payments due to and from the Fund. The use of swaps is a highly specialized activity which involves investment techniques and risks different from those associated with ordinary portfolio securities transactions. Swap agreements entail the risk that a party will default on its payment obligations to the Fund. If the other party to a swap defaults, the Fund would risk the loss of the net amount of the payments that it contractually is entitled to receive. If the Fund utilizes a swap at the wrong time or judges market conditions incorrectly, the swap may result in a loss to the Fund and reduce the Fund’s total return.
Swap agreements also bear the risk that the Fund will not be able to meet its obligation to the counterparty. Swap agreements are typically privately negotiated and entered into in the OTC market. However, certain swap agreements are required to be cleared through a clearinghouse and traded on an exchange or swap execution facility. Swaps that are required to be cleared are required to post initial and variation margins in accordance with the exchange requirements. Regulations enacted require the Fund to centrally clear certain interest rate and credit default index swaps through a clearinghouse or central counterparty (“CCP”). To clear a swap with a CCP, the Fund will submit the swap to, and post collateral with, a futures clearing merchant (“FCM”) that is a clearinghouse member.
Index swaps, interest rate swaps, and credit default swaps are valued using an approved vendor supplied price. Basket swaps are valued using a broker supplied price. Equity swaps that consist of a single underlying equity are valued either at the closing price, the latest bid price, or the last sale price on the primary market or exchange it trades. The market value of swap contracts are aggregated by positive and negative values and are disclosed separately as an asset or liability on the Fund’s Statement of Assets and Liabilities (if applicable). Realized gains and losses are reported on the Statement of Operations (if applicable). The change in unrealized net appreciation or depreciation during the period is included in the Statement of Operations (if applicable).
The Fund’s maximum risk of loss from counterparty risk or credit risk is the discounted value of the payments to be received from/paid to the counterparty over the contract’s remaining life, to the extent that the amount is positive. The risk is mitigated by having a netting arrangement between the Fund and the counterparty and by the posting of collateral by the counterparty to cover the Fund’s exposure to the counterparty.
The Fund may enter into various types of credit default swap agreements, including OTC credit default swap agreements and index credit default swaps (“CDX”), for investment purposes and to add leverage to its portfolio. Credit default swaps are a specific kind of counterparty agreement that allow the transfer of third party credit risk from one party to the other. One party in the swap is a lender and faces credit risk from a third party, and the counterparty in the credit default swap agrees to insure this risk in exchange for regular periodic payments. Credit default swaps could result in losses if the Fund does not correctly evaluate the creditworthiness of the company or companies on which the credit default swap is based. Credit default swap agreements may involve greater risks than if the Fund had invested in the reference obligation directly since, in addition to risks relating to the reference obligation, credit default swaps are subject to illiquidity risk, counterparty risk, and credit risk. The Fund will generally incur a greater degree of risk when it sells a credit default swap than when it purchases a credit default swap.
As a buyer of a credit default swap, the Fund may lose its investment and recover nothing should no credit event occur and the swap is held to its termination date. As seller of a credit default swap, if a credit event were to occur, the value of any deliverable obligation received by the Fund, coupled with the upfront or periodic payments previously received, may be less than what it pays to the buyer, resulting in a loss of value to the Fund.
| | |
| | Janus Detroit Street Trust ½ 23 |
Janus Henderson Short Duration Income ETF
Notes to Financial Statements
If the Fund is the seller of credit protection against a particular security, the Fund would receive an up-front or periodic payment to compensate against potential credit events. As the seller in a credit default swap contract, the Fund would be required to pay the par value (the “notional value”) (or other agreed-upon value) of a referenced debt obligation to the counterparty in the event of a default by a third party, such as a U.S. or foreign corporate issuer, on the debt obligation. In return, the Fund would receive from the counterparty a periodic stream of payments over the term of the contract provided that no event of default has occurred. If no default occurs, the Fund would keep the stream of payments and would have no payment obligations. As the seller, the Fund would effectively add leverage to its portfolio because, in addition to its total net assets, the Fund would be subject to investment exposure on the notional value of the swap. The maximum potential amount of future payments (undiscounted) that the Fund as a seller could be required to make in a credit default transaction would be the notional amount of the agreement.
As a buyer of credit protection, the Fund is entitled to receive the par (or other agreed-upon) value of a referenced debt obligation from the counterparty to the contract in the event of a default or other credit event by a third party, such as a U.S. or foreign issuer, on the debt obligation. In return, the Fund as buyer would pay to the counterparty a periodic stream of payments over the term of the contract provided that no credit event has occurred. If no credit event occurs, the Fund would have spent the stream of payments and potentially received no benefit from the contract.
The Fund may invest in single-name credit default swaps (“CDS”) to buy or sell credit protection to hedge its credit exposure, gain issuer exposure without owning the underlying security, or increase the Fund’s total return. Single-name CDS enable the Fund to buy or sell protection against a credit event of a specific issuer. When the Fund buys a single-name CDS, the Fund will receive a return on its investment only in the event of a credit event, such as default by the issuer of the underlying obligation (as opposed to a credit downgrade or other indication of financial difficulty). If a single-name CDS transaction is particularly large, or if the relevant market is illiquid, it may not be possible for the Fund to initiate a single-name CDS transaction or to liquidate its position at an advantageous time or price, which may result in significant losses. Moreover, the Fund bears the risk of loss of the amount expected to be received under a single-name CDS in the event of the default or bankruptcy of the counterparty. The risks associated with cleared single-name CDS may be lower than that for uncleared single-name CDS because for cleared single-name CDS, the counterparty is a clearinghouse (to the extent such a trading market is available). However, there can be no assurance that a clearinghouse or its members will satisfy their obligations to the Fund.
During the period, the Fund sold protection via the credit default swap market in order to gain credit risk exposure to individual corporates, countries and/or credit indices where gaining this exposure via the cash bond market was less attractive.
3. Other Investments and Strategies
Additional Investment Risk
The Fund may be invested in lower-rated debt securities that have a higher risk of default or loss of value since these securities may be sensitive to economic changes, political changes, or adverse developments specific to the issuer.
The financial crisis in both the U.S. and global economies over the past several years has resulted, and may continue to result, in a significant decline in the value and liquidity of many securities of issuers worldwide in the equity and fixed income/credit markets. In response to the crisis, the United States and certain foreign governments, along with the U.S. Federal Reserve and certain foreign central banks, took steps to support the financial markets. The withdrawal of this support, a failure of measures put in place to respond to the crisis, or investor perception that such efforts were not sufficient could each negatively affect financial markets generally, and the value and liquidity of specific securities. In addition, policy and legislative changes in the United States and in other countries continue to impact many aspects of financial regulation. The effect of these changes on the markets, and the practical implications for market participants, including the Fund, may not be fully known for some time. As a result, it may also be unusually difficult to identify both investment risks and opportunities, which could limit or preclude the Fund’s ability to achieve its investment objective. Therefore, it is important to understand that the value of your investment may fall, sometimes sharply, and you could lose money.
The enactment of the Dodd-Frank Wall Street Reform and Consumer Protection Act (the “Dodd-Frank Act”) provided for widespread regulation of financial institutions, consumer financial products and services, broker-dealers, OTC derivatives, investment advisers, credit rating agencies, and mortgage lending, which expanded federal oversight in the financial sector, including the investment management industry. Certain provisions of the Dodd-Frank Act remain pending and will be implemented through future rulemaking. Therefore, the ultimate impact of the Dodd-Frank Act and the regulations under the Dodd-Frank Act on the Fund and the investment management industry as a whole, is not yet certain.
Janus Henderson Short Duration Income ETF
Notes to Financial Statements
A number of countries in the European Union (“EU”) have experienced, and may continue to experience, severe economic and financial difficulties. In particular, many EU nations are susceptible to economic risks associated with high levels of debt, notably due to investments in sovereign debt of countries such as Greece, Italy, Spain, Portugal, and Ireland. Many non-governmental issuers, and even certain governments, have defaulted on, or been forced to restructure, their debts. Many other issuers have faced difficulties obtaining credit or refinancing existing obligations. Financial institutions have in many cases required government or central bank support, have needed to raise capital, and/or have been impaired in their ability to extend credit. As a result, financial markets in the EU experienced extreme volatility and declines in asset values and liquidity. Responses to these financial problems by European governments, central banks, and others, including austerity measures and reforms, may not work, may result in social unrest, and may limit future growth and economic recovery or have other unintended consequences. Further defaults or restructurings by governments and others of their debt could have additional adverse effects on economies, financial markets, and asset valuations around the world. Greece, Ireland, and Portugal have already received one or more “bailouts” from other Eurozone member states, and it is unclear how much additional funding they will require or if additional Eurozone member states will require bailouts in the future. The risk of investing in securities in the European markets may also be heightened due to the referendum in which the United Kingdom voted to exit the EU (known as “Brexit”). One or more other countries may also abandon the euro and/ or withdraw from the EU, placing its currency and banking system in jeopardy.
Certain areas of the world have historically been prone to and economically sensitive to environmental events such as, but not limited to, hurricanes, earthquakes, typhoons, flooding, tidal waves, tsunamis, erupting volcanoes, wildfires or droughts, tornadoes, mudslides, or other weather-related phenomena. Such disasters, and the resulting physical or economic damage, could have a severe and negative impact on the Fund’s investment portfolio and, in the longer term, could impair the ability of issuers in which the Fund invests to conduct their businesses as they would under normal conditions. Adverse weather conditions may also have a particularly significant negative effect on issuers in the agricultural sector and on insurance companies that insure against the impact of natural disasters.
Counterparties
Fund transactions involving a counterparty are subject to the risk that the counterparty or a third party will not fulfill its obligation to the Fund (“counterparty risk”). Counterparty risk may arise because of the counterparty’s financial condition (i.e., financial difficulties, bankruptcy, or insolvency), market activities and developments, or other reasons, whether foreseen or not. A counterparty’s inability to fulfill its obligation may result in significant financial loss to the Fund. The Fund may be unable to recover its investment from the counterparty or may obtain a limited recovery, and/or recovery may be delayed. The extent of the Fund’s exposure to counterparty risk with respect to financial assets and liabilities approximates its carrying value. See the “Offsetting Assets and Liabilities” section of this Note for further details.
The Fund may be exposed to counterparty risk through participation in various programs, including, but not limited to, lending its securities to third parties, cash sweep arrangements whereby the Fund’s cash balance is invested in one or more types of cash management vehicles, as well as investments in, but not limited to, repurchase agreements, and derivatives, including various types of swaps, futures and options. The Fund intends to enter into financial transactions with counterparties that Janus Capital believes to be creditworthy at the time of the transaction. There is always the risk that Janus Capital’s analysis of a counterparty’s creditworthiness is incorrect or may change due to market conditions. To the extent that the Fund focuses its transactions with a limited number of counterparties, it will have greater exposure to the risks associated with one or more counterparties.
Mortgage and Asset-Backed Securities
The Fund may purchase fixed or variable rate commercial or residential mortgage-backed securities issued by the Government National Mortgage Association (“Ginnie Mae”), the Federal National Mortgage Association (“Fannie Mae”), the Federal Home Loan Mortgage Corporation (“Freddie Mac”), or other governmental or government-related entities. Ginnie Mae’s guarantees are backed by the full faith and credit of the U.S. Government. Historically, Fannie Mae and Freddie Mac securities were not backed by the full faith and credit of the U.S. Government. In September 2008, the Federal Housing Finance Agency (“FHFA”), an agency of the U.S. Government, placed Fannie Mae and Freddie Mac under conservatorship. Since that time, Fannie Mae and Freddie Mac have received capital support through U.S. Treasury preferred stock purchases, and Treasury and Federal Reserve purchases of their mortgage-backed securities. The FHFA and the U.S. Treasury have imposed strict limits on the size of these entities’ mortgage portfolios. The FHFA has the power to cancel any contract entered into by Fannie Mae and Freddie Mac prior to FHFA’s appointment as conservator or receiver, including the guarantee obligations of Fannie Mae and Freddie Mac.
Asset-backed securities may be backed by various consumer obligations, including automobile loans, equipment leases, credit card receivables, or other collateral. In the event the underlying loans are not paid, the securities’ issuer could be
| | |
| | Janus Detroit Street Trust ½ 25 |
Janus Henderson Short Duration Income ETF
Notes to Financial Statements
forced to sell the assets and recognize losses on such assets, which could impact your return. Unlike traditional debt instruments, payments on these securities include both interest and a partial payment of principal. Prepayment of the principal of underlying loans at a faster pace than expected is known as “prepayment risk,” and may shorten the effective maturities of these securities. This may result in the Fund having to reinvest proceeds at a lower interest rate. Mortgage and asset-backed securities tend to be more sensitive to changes in interest rates than other types of debt securities. In addition to prepayment risk, investments in mortgage-backed securities, particularly those comprised of subprime mortgages, and investments in other asset-backed securities comprised of under-performing assets may be subject to a higher degree of credit risk, valuation risk, and liquidity risk than other mortgage- and asset-backed securities. Mortgage and asset-backed securities are also subject to extension risk, which is the risk that rising interest rates could cause mortgages or other obligations underlying these securities to be paid more slowly than expected, increasing the Fund’s sensitivity to interest rate changes and causing its price to decline.
Offsetting Assets and Liabilities
The Fund presents gross and net information about transactions that are either offset in the financial statements or subject to an enforceable master netting arrangement or similar agreement with a designated counterparty, regardless of whether the transactions are actually offset in the Statement of Assets and Liabilities.
In order to better define its contractual rights and to secure rights that will help the Fund mitigate its counterparty risk, the Fund may enter into an International Swaps and Derivatives Association, Inc. Master Agreement (“ISDA Master Agreement”) or similar agreement with its derivative contract counterparties. An ISDA Master Agreement is a bilateral agreement between the Fund and a counterparty that governs OTC derivatives and forward foreign currency exchange contracts and typically contains, among other things, collateral posting terms and netting provisions in the event of a default and/or termination event. Under an ISDA Master Agreement, in the event of a default and/or termination event, the Fund may offset with each counterparty certain derivative financial instruments’ payables and/or receivables with collateral held and/or posted and create one single net payment. For financial reporting purposes, the Fund does not offset financial instruments’ payables and receivables and related collateral on the Statement of Assets and Liabilities.
The following tables present gross amounts of recognized assets and/or liabilities and the net amounts after deducting collateral that has been pledged by counterparties or has been pledged to counterparties (if applicable). For corresponding information grouped by type of instrument, see either the “Fair Value of Derivative Instruments as of October 31, 2017” table located in Note 2 of these Notes to Financial Statements and/or the Fund’s Schedule of Investments.
Offsetting of Financial Assets and Derivative Assets
| | | | | | | | | | | | | | | | |
| Counterparty | | Gross Amounts of
Recognized
Assets | | | Offsetting Asset or
Liability(a) | | | Collateral
Received(b) | | | Net Amount | |
| Bank of America N.A. | | $ | 65,788 | | | $ | — | | | $ | — | | | $ | 65,788 | |
| Barclays Bank PLC | | | 357,025 | | | | — | | | | — | | | | 357,025 | |
BNP Paribas S.A. | | | 16,471 | | | | — | | | | — | | | | 16,471 | |
| Citibank N.A. | | | 33,651 | | | | — | | | | — | | | | 33,651 | |
| J.P. Morgan Chase Bank | | | 192,363 | | | | — | | | | — | | | | 192,363 | |
| Morgan Stanley & Co. | | | 1,129 | | | | (1,129) | | | | — | | | | — | |
| Total | | $ | 666,427 | | | $ | (1,129) | | | $ | — | | | $ | 665,298 | |
Offsetting of Financial Liabilities and Derivative Liabilities
| | | | | | | | | | | | | | | | |
| Counterparty | | Gross Amounts of
Recognized
Liabilities | | | Offsetting Asset or
Liability(a) | | | Collateral
Pledged(b) | | | Net Amount | |
| Morgan Stanley & Co. | | $ | 2,104 | | | $ | (1,129) | | | $ | — | | | $ | 975 | |
| (a) | Represents the amount of assets or liabilities that could be offset with the same counterparty under master netting or similar agreements that management elects not to offset on the Statement of Assets and Liabilities. |
| (b) | Collateral pledged is limited to the net outstanding amount due to/from an individual counterparty. The actual collateral amounts pledged may exceed these amounts and may fluctuate in value. |
Janus Henderson Short Duration Income ETF
Notes to Financial Statements
The Fund does not exchange collateral on its forward currency contracts with its counterparties; however, the Fund may segregate cash or high-grade securities in an amount at all times equal to or greater than the Fund’s commitment with respect to these contracts. Such segregated assets, if with the Fund’s custodian, are denoted on the accompanying Schedule of Investments and are evaluated daily to ensure their market value equals or exceeds the current market value of the Fund’s corresponding forward currency contracts.
The Fund may require the counterparty to pledge securities as collateral daily (based on the daily valuation of the financial asset) if the Fund has a net aggregate unrealized gain on OTC derivative contracts with a particular counterparty. The Fund may deposit cash as collateral with the counterparty and/or custodian daily (based on the daily valuation of the financial asset) if the Fund has a net aggregate unrealized loss on OTC derivative contracts with a particular counterparty. The collateral amounts are subject to minimum exposure requirements and initial margin requirements. Collateral amounts are monitored and subsequently adjusted up or down as valuations fluctuate by at least the minimum exposure requirement. Collateral may reduce the risk of loss.
4. Investment Advisory Agreements and Other Transactions with Affiliates
Under its unitary fee structure, the Fund pays Janus Capital a management fee in return for providing certain investment advisory, supervisory, and administrative services to the Fund, including the costs of transfer agency, custody, fund administration, legal, audit, and other services. Janus Capital’s fee structure is designed to pay substantially all of the Fund’s expenses. However, the Fund bears other expenses which are not covered under the management fee which may vary and affect the total level of expenses paid by shareholders, such as distribution fees (if any), brokerage expenses or commissions, interest, dividends, taxes, litigation expenses, acquired fund fees and expenses (if any), and extraordinary expenses. The Fund’s management fee is calculated daily and paid monthly. The Fund’s contractual management fee rate (expressed as an annual rate) is 0.35% of the Fund’s average daily net assets.
State Street Bank and Trust Company (“State Street”) provides certain fund administration services to the Fund, including services related to the Fund’s accounting, including calculating the daily NAV, audit, tax, and reporting obligations, pursuant to an agreement with Janus Capital, on behalf of the Fund. As compensation for such services, Janus Capital pays State Street a fee based on a percentage of the Fund’s assets, with a minimum flat fee, for certain services. Janus Capital serves as administrator to the Fund, providing oversight and coordination of the Fund’s service providers, recordkeeping and other administrative services. Janus Capital does not receive any additional compensation, beyond the unitary fee, for serving as administrator. State Street also serves as transfer agent for the shares of the Fund.
The Trust has adopted a Distribution and Servicing Plan for shares of the Fund pursuant to Rule 12b-1 under the 1940 Act (the “Plan”). The Plan permits compensation in connection with the distribution and marketing of Fund shares and/or the provision of certain shareholder services. The Plan permits the Fund to pay ALPS Distributors, Inc. (the “Distributor”) or its designee, a fee for the sale and distribution and/or shareholder servicing of the shares at an annual rate of up to 0.25% of average daily net assets of the Fund. However, the Trustees have determined not to authorize payment under this Plan at this time. Under the terms of the Plan, the Trust is authorized to make payments to the Distributor or its designee for remittance to retirement plan service providers, broker-dealers, bank trust departments, financial advisors, and other financial intermediaries, as compensation for distribution and/or shareholder services performed by such entities for their customers who are investors in the Fund. The 12b-1 fee may only be imposed or increased when the Trustees determine that it is in the best interests of shareholders to do so. Because these fees are paid out of the Fund’s assets on an ongoing basis, to the extent that a fee is authorized, over time they will increase the cost of an investment in the Fund. The Plan fee may cost an investor more than other types of sales charges.
As of October 31, 2017, Janus Capital owned 1 share or less than 0.01% of the Fund.
The Fund is permitted to purchase or sell securities (“cross-trade”) between itself and other funds or accounts managed by Janus Capital in accordance with Rule 17a-7 under the Investment Company Act of 1940 (“Rule 17a-7”), when the transaction is consistent with the investment objectives and policies of the Fund and in accordance with the Internal Cross Trade Procedures adopted by the Trust’s Board of Trustees. These procedures have been designed to ensure that any cross-trade of securities by the Fund from or to another fund or account that is or could be considered an affiliate of the Fund under certain limited circumstances by virtue of having a common investment adviser, common Officer, or common Trustee complies with Rule 17a-7. Under these procedures, each cross-trade is effected at the current market price to save costs where allowed. During the period ended October 31, 2017, the Fund engaged in cross trades amounting to $14,896,036 in purchases and $1,118,746 in sales, resulting in a net realized gain of $96. The net realized gain is included within the “Net Realized Gain/(Loss) on Investments” section of the Fund’s Statement of Operations.
| | |
| | Janus Detroit Street Trust ½ 27 |
Janus Henderson Short Duration Income ETF
Notes to Financial Statements
5. Federal Income Tax
The tax components of capital shown in the table below represent: (1) distribution requirements the Fund must satisfy under the income tax regulations; (2) losses or deductions the Fund may be able to offset against income and gains realized in future years; and (3) unrealized appreciation or depreciation of investments for federal income tax purposes.
Other book to tax differences primarily consist of deferred compensation, derivatives, and foreign currency contract adjustments. The Fund has elected to treat gains and losses on forward foreign currency contracts as capital gains and losses, if applicable. Other foreign currency gains and losses on debt instruments are treated as ordinary income for federal income tax purposes pursuant to Section 988 of the Internal Revenue Code.
| | | | | | | | | | | | | | | | | | | | | | | | | | |
| | | | | | | | | | Loss Deferrals | | | | | | | |
Undistributed
Ordinary Income | | | Undistributed
Long-Term Gains | | | Accumulated
Capital Losses | | | Late-Year
Ordinary Loss | | | Post-October
Capital Loss | | | Other Book
to Tax Differences | | | Net Tax Appreciation/ (Depreciation) | |
| $ | 745,572 | | | $ | — | | | $ | — | | | $ | — | | | $ | — | | | $ | (32,857) | | | $ | (186,897) | |
The aggregate cost of investments and the composition of unrealized appreciation and depreciation of investment securities for federal income tax purposes as of October 31, 2017 are noted below. The primary difference between book and tax appreciation or depreciation of investments is wash sale loss deferrals.
| | | | | | | | | | | | | | |
| Federal Tax Cost | | | Unrealized
Appreciation | | | Unrealized
(Depreciation) | | | Net Tax Appreciation/ (Depreciation) | |
| $ | 153,836,774 | | | $ | 475,049 | | | $ | (661,946) | | | $ | (186,897) | |
Information on the tax components of derivatives as of October 31, 2017 is as follows:
| | | | | | | | | | | | | | |
| Federal Tax Cost | | | Unrealized
Appreciation | | | Unrealized
(Depreciation) | | | Net Tax Appreciation/
(Depreciation) | |
| $ | 903,629 | | | $ | 2,104 | | | $ | (29,089) | | | $ | (26,985) | |
Income and capital gains distributions are determined in accordance with income tax regulations that may differ from accounting principles generally accepted in the United States of America. These differences are due to differing treatments for items such as net short-term gains, deferral of wash sale losses, foreign currency transactions, passive foreign investment companies, net investment losses, in-kind transactions, and capital loss carryovers. Certain permanent differences such as tax returns of capital and net investment losses noted below have been reclassified to capital.
| | | | | | | | | | | | | | |
| For the period ended October 31, 2017 | |
| Distributions | | | | |
| From Ordinary Income | | | From Long-Term Capital Gains | | | Tax Return of Capital | | | Net Investment Loss | |
| $ | 833,292 | | | $ | — | | | $ | — | | | $ | — | |
Permanent book to tax basis differences may result in reclassifications between the components of net assets. These differences have no impact on the results of operations or net assets. The following reclassifications have been made to the Fund:
| | | | | | | | | | |
| Increase/(Decrease) to Capital | | | Increase/(Decrease) to Undistributed
Net Investment Income/Loss | | | Increase/(Decrease) to Undistributed
Net realized Gain/Loss | |
| $ | — | | | $ | 410,160 | | | $ | (410,160) | |
6. Capital Share Transactions
| | | | | | | | |
| | | Period ended October 31, 2017(1) | |
| | | Shares | | | Amount | |
| Shares sold | | | 3,100,001 | | | $ | 155,558,371 | |
| Shares repurchased | | | — | | | | — | |
Net Increase/(Decrease) | | | 3,100,001 | | | $ | 155,558,371 | |
| (1) | Period from November 16, 2016 (commencement of operations) through October 31, 2017. |
Janus Henderson Short Duration Income ETF
Notes to Financial Statements
7. Purchases and Sales of Investment Securities
For the period ended October 31, 2017, the aggregate cost of purchases and proceeds from sales of investment securities (excluding any short-term securities, short-term options contracts, and in-kind transactions) was as follows:
| | | | | | | | | | | | | | |
Purchases of Securities | | | Proceeds from Sales of Securities | | | Purchases of Long- Term U.S. Government Obligations | | | Proceeds from Sales of Long-Term U.S. Government Obligations | |
| $ | 164,058,635 | | | $ | 24,781,203 | | | $ | — | | | $ | — | |
8. Recent Accounting Pronouncements
The Securities and Exchange Commission (“SEC”) adopted new rules as well as amendments to its rules to modernize the reporting and disclosure of information by registered investment companies. In addition, the SEC adopted amendments to Regulation S-X, which require standardized, enhanced disclosure about derivatives in investment company financial statements, as well as other amendments. The compliance date of the amendments to Regulation SX was August 1, 2017. This report incorporates the amendments to Regulation S-X.
The FASB issued Accounting Standards Update No. 2017-08, Receivables – Nonrefundable Fees and Other Costs (Subtopic 310-20), Premium Amortization on Purchased Callable Debt Securities (“ASU 2017-08”) to amend the amortization period for certain purchased callable debt securities held at a premium. The guidance requires certain premiums on callable debt securities to be amortized to the earliest call date. The amortization period for callable debt securities purchased at a discount will not be impacted. The amendments are effective for fiscal years, and interim periods within those fiscal years, beginning after December 15, 2018. Early adoption is permitted, including adoption in an interim period. Management is currently evaluating the impacts of ASU 2017-08 on the financial statements.
9. Merger Related Matters
On October 3, 2016, Janus Capital Group Inc. (“JCGI”), the direct parent of Janus Capital Management LLC, the investment adviser to the Fund (“Janus Capital”), and Henderson Group plc (“Henderson”) announced that they had entered into an Agreement and Plan of Merger (“Merger Agreement”) relating to the strategic combination of Henderson and JCGI (the “Merger”). Pursuant to the Merger Agreement, a newly formed, direct wholly-owned subsidiary of Henderson merged with and into JCGI, with JCGI as the surviving corporation and a direct wholly-owned subsidiary of Henderson.
In approving the Fund’s initial investment advisory agreement on October 24, 2016, the Fund’s Board of Trustees also considered the potential post-Merger ownership structure of Janus Capital and have approved a contract (the “Post-Merger Advisory Agreement”) identical in all material respects to the initial investment advisory agreement that will take effect upon the completion of the Merger.
The Post-Merger Advisory Agreement took effect upon the consummation of the Merger on May 30, 2017. In connection with the Merger, the Fund’s name was changed to Janus Henderson Short Duration Income ETF effective June 5, 2017.
10. Subsequent Event
Management has evaluated whether any events or transactions occurred subsequent to October 31, 2017 and through the date of issuance of the Fund’s financial statements and determined that there were no material events or transactions that would require recognition or disclosure in the Fund’s financial statements.
| | |
| | Janus Detroit Street Trust ½ 29 |
Janus Henderson Short Duration Income ETF
Additional Information (unaudited)
Proxy Voting Policies and Voting Record
A description of the policies and procedures that the Fund uses to determine how to vote proxies relating to its portfolio securities is available without charge: (i) upon request, by calling 1-800-525-0020 (toll free); (ii) on the Fund’s website at janushenderson.com/proxyvoting; and (iii) on the SEC’s website at http://www.sec.gov.
Quarterly Portfolio Holdings
The Fund files its complete portfolio holdings (schedule of investments) with the SEC for the first and third quarters of each fiscal year on Form N-Q within 60 days of the end of such fiscal quarter. The Fund’s Form N-Q: (i) is available on the SEC’s website at http://www.sec.gov; (ii) may be reviewed and copied at the SEC’s Public Reference Room in Washington, D.C. (information on the Public Reference Room may be obtained by calling 1-800-SEC-0330); and (iii) is available without charge, upon request, by calling Janus Henderson at 1-800-525-0020 (toll free).
Janus Henderson Short Duration Income ETF
Board Considerations Regarding Approval of Investment Advisory Agreements (unaudited)
APPROVAL OF ADVISORY AGREEMENT DURING THE PERIOD FOR JANUS HENDERSON SHORT DURATION INCOME ETF AND JANUS HENDERSON SG GLOBAL QUALITY INCOME ETF
The Trustees of Janus Detroit Street Trust (the “Trust”), including the Independent Trustees, met on October 24, 2016 to consider the proposed investment management agreement (the “Investment Management Agreement”) for Janus Henderson Short Duration Income ETF and Janus Henderson SG Global Quality Income ETF (each a “New Fund” and collectively, the “New Funds”). In the course of their consideration of the Investment Management Agreement, the Trustees met in executive session and were advised by their independent counsel. In this regard, the Board, including the Independent Trustees, evaluated the terms of the Investment Management Agreement and reviewed the duties and responsibilities of the Trustees in evaluating and approving such agreements. In considering approval of the Investment Management Agreement, the Board, including the Independent Trustees, reviewed the Board Materials and other information from counsel and from Janus Capital Management LLC, the investment adviser (the “Adviser”), including: (i) a copy of the form of Investment Management Agreement, with respect to the Adviser’s management of the assets of each New Fund; (ii) information describing the nature, quality and extent of the services that the Adviser will provide to the New Fund, and the fees the Adviser will charge to the New Funds; (iii) information concerning the Adviser’s financial condition, business, operations, portfolio management teams and compliance programs; (iv) information describing each New Fund’s anticipated advisory fee and operating expenses; (v) a copy of the Adviser’s current Form ADV; and (vi) a memorandum from counsel on the responsibilities of trustees in considering investment advisory arrangements under the 1940 Act. The Board also considered presentations made by, and discussions held with, representatives of the Adviser. The Board also received information comparing the advisory fees and expenses of the New Funds to those from fund complexes that were defined as competitors.
During its review of this information, the Board focused on and analyzed the factors that the Board deemed relevant, including: the nature, extent and quality of the services to be provided to each New Fund by the Adviser; the Adviser’s personnel and operations; each New Fund’s proposed expense level; the anticipated profitability to the Adviser under the Investment Management Agreement at certain asset levels; any “fall-out” benefits to the Adviser and its affiliates (i.e., any ancillary benefits anticipated to be realized by the Adviser and its affiliates from the Adviser’s relationship with the Trust); the effect of asset growth on each New Fund’s expenses; and possible conflicts of interest.
The Trustees also considered benefits that accrue to the Adviser and its affiliates from their relationships with the New Funds. The Trustees also concluded that, other than the services provided by the Adviser and its affiliates pursuant to the agreements and the fees to be paid by the New Funds therefor, the New Fund and the Adviser may potentially benefit from their relationship with each other in other ways. The Trustees concluded that the success of the New Funds could attract other business to the Adviser or other Janus funds, and that the success of the Adviser could enhance the Adviser’s ability to serve the New Funds.
The Board, including the Independent Trustees, considered the following in respect of each New Fund:
(a) The nature, extent and quality of services to be provided by the Advisers; personnel and operations of the Adviser. The Board reviewed the services that the Adviser would provide to each New Fund. In connection with the investment advisory services to be provided by the Adviser, the Board noted the responsibilities that the Adviser would have as the Funds’ investment adviser, including: the overall supervisory responsibility for the general management and investment of each New Fund’s securities portfolio; providing oversight of the investment performance and processes and compliance with the New Fund’s investment objectives, policies and limitations; the implementation of the investment management program of each New Fund; the management of the day-to-day investment and reinvestment of the assets of each New Fund; determining daily baskets of deposit securities and cash components; executing portfolio security trades for purchases and redemptions of New Fund shares conducted on a cash-in-lieu basis; the responsibility for daily monitoring of tracking error and quarterly reporting to the Board for the Janus SG Global Quality Income ETF, whose investment objective seeks to track the performance of an index; the review of brokerage matters; the oversight of general portfolio compliance with relevant law; and the implementation of Board directives as they relate to the New Funds.
The Board reviewed the Adviser’s experience, resources and strengths in managing other pooled investment vehicles, including the Adviser’s personnel. Based on its consideration and review of the foregoing information, the Board determined that each New Fund was likely to benefit from the nature, quality and extent of these services, as well as the Adviser’s ability to render such services based on their experience, personnel, operations and resources.
(b) Comparison of services to be rendered and fees to be paid to those under other investment advisory contracts, and the cost of the services to be provided and profits to be realized by the Advisers from the relationship with the New Funds’; “fall-out” benefits. The Board then compared both the services to be rendered and the proposed fees to be paid under other contracts of the Adviser, and under contracts of other investment advisers with respect to similar ETFs. In particular, the
| | |
| | Janus Detroit Street Trust ½ 31 |
Janus Henderson Short Duration Income ETF
Board Considerations Regarding Approval of Investment Advisory Agreements (unaudited)
Board compared each New Fund’s proposed advisory fee and projected expense ratio to other investment companies considered to be in that New Fund’s peer group. The Board also noted that the New Funds had no other comparable equivalents managed by the Adviser. The Board also discussed the anticipated costs and projected profitability of the Adviser in connection with its serving as investment adviser to each New Fund, including operational costs. In addition, the Board discussed the entrepreneurial risk undertaken by the Adviser in creating the Trust. After comparing each New Fund’s proposed fees with those of other funds in the New Fund’s peer group, and in light of the nature, extent and quality of services proposed to be provided by the Adviser and the costs expected to be incurred by the Adviser in rendering those services, the Board concluded that the level of fees proposed to be paid to the Adviser with respect to the New Funds were fair and reasonable.
The Board also considered that the Adviser may experience reputational “fall-out” benefits based on the success of the New Funds, but that such benefits are not easily quantifiable.
(c) The extent to which economies of scale would be realized as the Funds grow and whether fee levels would reflect such economies of scale. The Board next discussed potential economies of scale. Since the New Funds had not commenced operations, the eventual aggregate amount of assets was uncertain, and the Adviser was not able to provide the Board with specific information concerning the extent to which economies of scale could be realized as each New Fund grows, and whether fee levels would reflect such economies of scale, if any. The Board recognized the uncertainty in launching a new investment product and estimating future asset levels.
(d) Investment performance of the Funds and the Adviser. Because each New Fund had not commenced operations, the Board did not consider the investment performance of the New Fund. However, for the Janus Short Duration Income ETF, the Board considered the experience of the Adviser with comparable investment strategies.
Conclusion. No single factor was determinative to the decision of the Board. Based on the foregoing and such other matters as were deemed relevant, the Board concluded that the proposed advisory fee rate and projected total expense ratio are reasonable in relation to the services to be provided by the Adviser to each New Fund, as well as the costs to be incurred and benefits to be gained by the Adviser in providing such services. The Board also found the proposed advisory fees to be reasonable in comparison to the fees charged by advisers to other comparable funds of similar actual or anticipated size. As a result, the Board concluded that the initial approval of the Investment Management Agreement was in the best interests of each New Fund.
After full consideration of the above factors, as well as other factors, the Trustees, including all of the independent Trustees voting separately, determined to approve the investment advisory agreement for each New Fund.
Janus Henderson Short Duration Income ETF
Trustees and Officers (unaudited)
The Fund’s Statement of Additional Information includes additional information about the Trustees and officers and is available, without charge, by calling 1-877-335-2687.
The following are the Trustees and officers of the Trust, together with a brief description of their principal occupations during the last five years (principal occupations for certain Trustees may include periods over five years).
Each Trustee has served in that capacity since he or she was originally elected or appointed. The Trustees do not serve a specified term of office. Each Trustee will hold office until the termination of the Trust or his or her earlier death, resignation, retirement, incapacity, or removal. Under the Fund’s Governance Procedures and Guidelines, the policy is for Trustees to retire no later than the end of the calendar year in which the Trustee turns 75. The Trustees review the Fund’s Governance Procedures and Guidelines from time to time and may make changes they deem appropriate. The Fund’s Nominating and Governance Committee will consider nominees for the position of Trustee recommended by shareholders. Shareholders may submit the name of a candidate for consideration by the Committee by submitting their recommendations to the Trust’s Secretary. Each Trustee is currently a Trustee of one other registered investment company advised by Janus Capital: Clayton Street Trust. Collectively, these two registered investment companies consist of 12 series or funds.
The Trust’s officers are elected annually by the Trustees for a one-year term. Certain officers also serve as officers of Clayton Street Trust. Certain officers of the Fund may also be officers and/or directors of Janus Capital. Fund officers receive no compensation from the Fund, except for the Fund’s Chief Compliance Officer, as authorized by the Trustees.
| | | | | | | | | | | | | | | | | | |
| TRUSTEES | | | | | | | | | | | | | | |
| Name, Address, and Age | | Positions Held
with the Trust | | | Length of
Time Served | | | Principal Occupations
During the Past Five Years | | Number of
Portfolios/Funds
in Fund Complex
Overseen by
Trustee | | | Other Directorships
Held by Trustee
During the Past Five Years | |
Independent Trustees | | | | | | | | | | | | | | | | | | |
Clifford J. Weber 151 Detroit Street Denver, CO 80206 DOB: 1963 | |
| Chairman
Trustee |
| |
| 2/16-Present
2/16-Present |
| | Owner, Financial Products Consulting Group LLC (consulting services to financial institutions) (since 2015). Formerly, Executive Vice President of Global Index and Exchange- Traded Products, NYSE Market, Inc., a subsidiary of Intercontinental Exchange (ETF/ETP listing exchange) (2013-2015) and Executive Vice President and Head of Strategy and Product Development, NYSE Liffe U.S., a division of NYSE Euronext (U.S. futures exchange) (2008-2013). | | | 12 | | |
| Independent Trustee,
Clough Funds Trust
(investment
company) (since
2015); Chairman,
Clough Funds Trust
(investment
company) (since
2017); Independent
Trustee, Clough
Dividend and Income
Fund (closed-end
fund) (since 2017);
Independent Trustee,
Clough Global
Opportunities Fund
(closed-end fund)
(since 2017);
Independent Trustee,
Clough Global Equity
Fund (closed-end
fund) (since 2017);
Independent Trustee,
Elevation ETF Trust
(since 2016);
Chairman, Elevation
ETF Trust (since
2017) |
|
| | |
| | Janus Detroit Street Trust ½ 33 |
Janus Henderson Short Duration Income ETF
Trustees and Officers (unaudited)
| | | | | | | | | | | | | | | | | | |
| TRUSTEES | | | | | | | | | | | | | | |
| Name, Address, and Age | | Positions Held
with the Trust | | | Length of
Time Served | | | Principal Occupations
During the Past Five Years | | Number of
Portfolios/Funds
in Fund Complex
Overseen by
Trustee | | | Other Directorships
Held by Trustee
During the Past Five Years | |
Maureen T. Upton 151 Detroit Street Denver, CO 80206 DOB: 1965 | | | Trustee | | | | 2/16-Present | | | Principal, Maureen Upton Ltd. (consulting services to developers of major infrastructure projects and investors) (since 2017). Formerly, Principal Consultant, SRK Consulting (U.S.), Inc. (consulting services to global mining, energy and water resource industries) (2015-2017) and Founder and Principal, Resource Initiatives LLC (sustainability consulting firm) (2006-2015). | | | 12 | | |
| Director, Denver
Metro
Leadership
Foundation (non-profit
organization) (2012-2014). |
|
| | | | | |
Jeffrey B. Weeden 151 Detroit Street Denver, CO 80206 DOB: 1956 | | | Trustee | | | | 2/16-Present | | | Senior Advisor, BayBoston Capital LP (investment fund in banks and bank holdings companies) (since 2015). Management Advisor, BoxCast, Inc. (technology start-up company) (2014-2017). Formerly Senior Executive Vice President and Chief Financial Officer, KeyCorp (financial services) (2002-2013). | | | 12 | | |
| Director, State
Farm
Bank (banking)
(since 2014). |
|
Interested Trustee | | | | | | | | | | | | | | | | | | |
Michael Drew Elder** 151 Detroit Street Denver, CO 80206 DOB: 1970 | | | Trustee | | | | 8/15-Present | | | Executive Vice President and Head of U.S. Intermediary Distribution, Janus Capital (since 2014) and President, Janus Distributors LLC (broker- dealer) (since 2014). Formerly, Senior Vice President, Janus Capital (2007-2014). | | | 12 | | |
| Director, Perkins
Investment
Management
LLC (since 2014). |
|
| ** | Michael Drew Elder is an Interested Trustee because of his employment with Janus Capital. |
Janus Henderson Short Duration Income ETF
Trustees and Officers (unaudited)
| | | | | | |
| OFFICERS | | | | | | |
| Name, Address, and Age | | Positions Held with the Trust | | Term of Office* and
Length of Time Served | | Principal Occupations During the Past Five Years |
Bruce L. Koepfgen 151 Detroit Street Denver, CO 80206 DOB: 1952 | | President and Chief Executive Officer | | 2/16-Present | | Head of North America for Janus Henderson Investors and Janus Capital Management (since 2017); Executive Vice President and Director of Janus International Holding LLC (since 2011); Executive Vice President of Janus Distributors LLC (since 2011); Vice President and Director of INTECH Investment Management LLC (since 2011); Executive Vice President and Director of Perkins Investment Management LLC (since 2011); and Executive Vice President and Director of Janus Management Holdings Corporation (since 2011). Formerly, President of Janus Capital Group Inc. and Janus Capital Management LLC (2013-2017); Executive Vice President of Janus Services LLC (2011-2015), Janus Capital Group Inc. and Janus Capital Management LLC (2011-2013); and Chief Financial Officer of Janus Capital Group Inc., Janus Capital Management LLC, Janus Distributors LLC, Janus Management Holdings Corporation, and Janus Services LLC (2011-2013). |
| | | |
Susan K. Wold 151 Detroit Street Denver, CO 80206 DOB: 1960 | | Vice President, Chief Compliance Officer, and Anti-Money Laundering Officer | | 10/17-Present; Vice President, Provisional Chief Compliance Officer, and Anti-Money Laundering Officer (9/17-10/17) | | Senior Vice President and Head of Compliance, North America for Janus Henderson (since September 2017); Formerly, Vice President, Head of Global Corporate Compliance, and Chief Compliance Officer for Janus Capital Management (May 2017-September 2017); Vice President, Compliance at Janus Capital Group and Janus Capital Management (2005-2017). |
| | | |
Jesper Nergaard 151 Detroit Street Denver, CO 80206 DOB: 1962 | | Vice President, Chief Financial Officer, Treasurer, and Principal Accounting Officer | | 2/16-Present | | Vice President of Janus Capital and Janus Services LLC. |
| | | |
Kathryn L. Santoro 151 Detroit Street Denver, CO 80206 DOB: 1973 | | Vice President, Secretary and Chief Legal Counsel | | 1/17-Present | | Vice President of Janus Capital and Janus Services LLC (since 2016). Formerly, Vice President and Associate Counsel of Curian Capital, LLC and Curian Clearing LLC (2013- 2016); and General Counsel and Secretary (2011-2012) and Vice President (2009-2012) of Old Mutual Capital, Inc. |
| * | Officers are elected at least annually by the Trustees for a one-year term and may also be elected from time to time by the Trustees for an interim period. |
| | |
| | Janus Detroit Street Trust ½ 35 |
Janus Henderson Short Duration Income ETF
Notes
Janus Henderson Short Duration Income ETF
Notes
Knowledge. Shared
At Janus Henderson, we believe in the sharing of expert insight for better investment and business decisions. We call this ethos Knowledge. Shared.
Learn more by visiting janushenderson.com.
This report is submitted for the general information of shareholders of the Fund. It is not an offer or solicitation for the Fund and is not authorized for distribution to prospective investors unless preceded or accompanied by an effective prospectus.
Janus Henderson is a trademark of Janus Henderson Investors. © Janus Henderson Investors. The name Janus Henderson Investors includes HGI Group Limited, Henderson Global Investors (Brand Management) Sarl and Janus International Holding LLC.
Janus Capital Management LLC is the investment adviser and ALPS Distributors, Inc. is the distributor. ALPS is not affiliated with Janus Henderson or any of its subsidiaries.
Item 2. Code of Ethics.
As of the end of the period covered by this Form N-CSR, the Registrant has adopted a Code of Ethics (as defined in Item 2(b) of Form N-CSR), which is posted on the Registrant’s website: janushenderson.com. Registrant intends to post any amendments to, or waivers from (as defined in Item 2 of Form N-CSR), such code on janushenderson.com within five business days following the date of such amendment or waiver.
Item 3. Audit Committee Financial Expert.
The Registrant’s Board of Trustees has determined that Jeffrey B. Weeden, the Chairman of the Board’s Audit Committee is an “audit committee financial expert,” as defined in Item 3 to Form N-CSR: Jeffrey B. Weeden is “independent” under the standards set forth in Item 3 to Form N-CSR.
Item 4. Principal Accountant Fees and Services.
The aggregate fees billed for each of the last two fiscal years for professional services rendered by the principal accountant for the audit of the Funds’ annual financial statements or services that are normally provided by the accountant in connection with statutory and regulatory filings or engagements for those fiscal years are $279,000 for 2017 and $258,400 for 2016.
The aggregate fees billed in each of the last two fiscal years for assurance and related services by the principal accountant that are reasonably related to the performance of the audit of the Funds’ financial statements and are not reported under paragraph (a) of this Item are $0 for 2017 and $5,000 for 2016.
The nature of the services comprising the fees disclosed under this category includes a seed balance sheet audit and additional testing surrounding fund mergers and system conversions.
The aggregate fees billed in each of the last two fiscal years for professional services rendered by the principal accountant for tax compliance, tax advice, and tax planning are $72,775 for 2017 and $56,000 for 2016.
The nature of the services comprising the fees disclosed under this category includes tax compliance, tax planning, and tax advice.
(d) All Other Fees
The aggregate fees billed in each of the last two fiscal years for products and services provided by the principal accountant, other than the services reported in paragraphs (a) through (c) of this Item are $0 for 2017 and $0 for 2016.
(e) Pre-Approval Policies and Procedures
(1) The registrant’s Audit Committee Charter requires the registrant’s Audit Committee to pre-approve any engagement of the principal accountant (i) to provide audit or non-audit services to the registrant or (ii) to provide non-audit services to the registrant’s investment adviser or any entity controlling, controlled by, or under common control with the investment adviser that provides ongoing services to the registrant, if the engagement relates directly to the operations and financial reporting of the registrant, except for those non-audit services that were subject to the pre-approval exception under Rule 2-01 of Regulation S-X. The Chairman of the Audit Committee or, if the Chairman is unavailable, another member of the Audit Committee who is an independent Trustee, may grant the pre-approval. All such delegated pre-approvals must be presented to the Audit Committee no later than the next Audit Committee meeting.
(2) 0%
(f) Not applicable as less than 50%.
(g) The aggregate non-audit fees billed by the registrant’s accountant for services rendered to the registrant, and rendered to the registrant’s investment adviser (not including any sub-adviser whose role is primarily portfolio management and is subcontracted with or overseen by another investment adviser), and any entity controlling, controlled by, or under common control with the adviser that provides ongoing services to the registrant for the last two fiscal years of the registrant are $181,415 for 2017 and $158,140 for 2016.
(h) The registrant’s audit committee of the board of trustees has considered whether the provision of non-audit services that were rendered to the registrant’s investment adviser (not including any subadviser whose role is primarily portfolio management and is subcontracted with or overseen by another investment adviser), and any entity controlling, controlled by, or under common control with the investment adviser that provides ongoing services to the registrant that were not pre-approved pursuant to paragraph (c)(7)(ii) of Rule 2-01 of Regulation S-X is compatible with maintaining the principal accountant’s independence.
Item 5. Audit Committee of Listed Registrants.
The registrant has a separately-designated standing audit committee established in accordance with Section 3(a)(58)(A) of the Securities Exchange Act of 1934. The members of the committee are Jeffrey B Weeden, Maureen T. Upton and Clifford J. Weber.
Item 6. Schedule of Investments.
(a) Schedule of Investments is contained in the Reports to Shareholders included under Item 1 of this Form N-CSR.
(b) Not applicable.
Item 7. Disclosure of Proxy Voting Policies and Procedures for Closed-End Management Investment Companies.
Not applicable.
Item 8. Portfolio Managers of Closed-End Management Investment Companies.
Not applicable.
Item 9. Purchases of Equity Securities by Closed-End Management Investment Company and Affiliated Purchasers.
Not applicable.
Item 10. Submission of Matters to a Vote of Security Holders.
There have been no material changes to the procedures by which shareholders may recommend nominees to the Registrant’s Board of Trustees.
Item 11. Controls and Procedures.
(a) The Registrant’s Principal Executive Officer and Principal Financial Officer have evaluated the Registrant’s disclosure controls and procedures (as defined in Rule 30a-3(c) under the Investment Company Act of 1940, as amended) within 90 days of this filing and have concluded that the Registrant’s disclosure controls and procedures were effective, as of that date.
(b) There have been no changes in the Registrant’s internal control over financial reporting (as defined in Rule 30a-3(d) under the Investment Company Act of 1940, as amended) that occurred during the Registrant’s second fiscal quarter of the period covered by this report that have materially affected, or are reasonably likely to materially affect, the Registrant’s internal control over financial reporting.
Item 12. Disclosure of Securities Lending Activities for Closed-End Management Investment Companies
Not applicable.
Item 13. Exhibits.
| | | | |
| (a) | | (1) | | Not applicable because the Registrant has posted its Code of Ethics (as defined in Item 2(b) of Form N-CSR) on its website pursuant to paragraph (f)(2) of Item 2 of Form N-CSR. |
| | |
| | (2) | | Separate certifications for the Registrant’s Principal Executive Officer and Principal Financial Officer, as required under Rule 30a-2(a) under the Investment Company Act of 1940, as amended, are attached as Ex99.CERT. |
| | |
| | (3) | | Not applicable. |
(b) A certification for the Registrant’s Principal Executive Officer and Principal Financial Officer, as required by Rule 30a-2(b) under the Investment Company Act of 1940, as amended, is attached as Ex99.906CERT
SIGNATURES
Pursuant to the requirements of the Securities Exchange Act of 1934 and the Investment Company Act of 1940, the registrant has duly caused this report to be signed on its behalf by the undersigned, thereunto duly authorized.
| | |
| JANUS DETROIT STREET TRUST |
| |
| By: | | /s/ Bruce L. Koepfgen |
| | Bruce L. Koepfgen |
| | President and Chief Executive Officer (Principal Executive Officer) |
| |
| Date: | | December 29, 2017 |
Pursuant to the requirements of the Securities Exchange Act of 1934 and the Investment Company Act of 1940, this report has been signed below by the following persons on behalf of the registrant and in the capacities and on the dates indicated.
| | |
| By: | | /s/ Bruce L. Koepfgen |
| | Bruce L. Koepfgen |
| | President and Chief Executive Officer (Principal Executive Officer) |
| |
| Date: | | December 29, 2017 |
| |
| By: | | /s/ Jesper Nergaard |
| | Jesper Nergaard |
| | Vice President, Chief Financial Officer, Treasurer and Principal Accounting Officer (Principal Financial Officer and Principal Accounting Officer) |
| |
| Date: | | December 29, 2017 |