UNITED STATES
SECURITIES AND EXCHANGE COMMISSION
Washington, D.C. 20549
FORM N-CSR
CERTIFIED SHAREHOLDER REPORT OF REGISTERED
MANAGEMENT INVESTMENT COMPANIES
Investment Company Act file number: 811-23112
JANUS DETROIT STREET TRUST
(Exact name of registrant as specified in charter)
151 Detroit Street, Denver, Colorado 80206-4805
(Address of principal executive offices)(Zip code)
| | |
(Name and Address of Agent for Service) | | Copy to: |
| |
Byron D. Hittle 151 Detroit Street
Denver, Colorado 80206-4805 | | Eric S. Purple
Stradley Ronon Stevens & Young, LLP 1250 Connecticut Avenue, N.W., Suite 500
Washington, D.C. 20036 |
Registrant’s telephone number, including area code: 303-333-3863
Date of fiscal year end: October 31
Date of reporting period: October 31, 2018
Item 1. Report to Shareholders.
ANNUAL REPORT
October 31, 2018
Janus Henderson Small Cap Growth Alpha ETF
Janus Detroit Street Trust

Table of Contents
Janus Henderson Small Cap Growth Alpha ETF (unaudited)
INVESTMENT OBJECTIVE
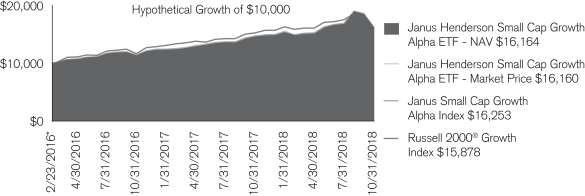
Janus Henderson Small Cap Growth Alpha ETF (JSML) seeks investment results that correspond generally, before fees and expenses, to the performance of its underlying index, the Janus Small Cap Growth Alpha Index. It pursues its investment objective by using a passive index-based approach, normally investing at least 80% of its net assets in securities that comprise its underlying index.
PERFORMANCE OVERVIEW
| • | | U.S. small-cap equities were up for the period, but were volatile. The anticipation that corporate tax reform would help boost future earnings for small-cap companies helped drive returns into January. However, concerns over inflation and faster-than-expected interest rate hikes created volatility, as did fears about protectionist trade policies. The market was led by a narrow subset of consumer Internet, medical technology and Software as a Service companies. Many of these stocks trade at extremely high valuations or are yet to produce earnings. Consumer staples, health care and information technology were the top-performing sectors within the Russell 2000® Growth Index, while energy and materials lagged. |
| • | | During the period, JSML returned 10.52% (based on NAV); its primary benchmark, the Janus Small Cap Growth Alpha Index, returned 10.44%, and its secondary benchmark, the Russell 2000 Growth Index, returned 4.13%. |
| • | | JSML seeks investment results that correspond generally, before fees and expenses, to the performance of its primary benchmark. The strategy seeks to provide risk-adjusted outperformance by identifying top-tier small-cap companies with some of the strongest fundamentals that the advisor believes can deliver sustainable growth in a variety of market environments. |
| | |
| | Janus Detroit Street Trust ½ 1 |
Janus Henderson Small Cap Growth Alpha ETF (unaudited)
Fund At A Glance
October 31, 2018
| | | | |
| 5 Largest Equity Holdings – (% of Net Assets) | |
Ubiquiti Networks, Inc. | | | | |
Communications Equipment | | | 3.7% | |
Etsy, Inc. | | | | |
Internet & Catalog Retail | | | 3.1% | |
NuVasive, Inc. | | | | |
Health Care Equipment & Supplies | | | 2.8% | |
Trade Desk, Inc. | | | | |
Software | | | 2.7% | |
Inogen, Inc. | | | | |
Health Care Equipment & Supplies | | | 2.5% | |
| | | | |
| | | 14.8% | |
| | | | |
| Sector Allocation – (% of Net Assets) | |
Consumer, Non-cyclical | | | 29.8% | |
Communications Services | | | 18.4% | |
Industrial | | | 14.8% | |
Consumer, Cyclical | | | 14.3% | |
Technology | | | 10.2% | |
Financial | | | 9.9% | |
Investment Company Securities | | | 6.2% | |
Basic Materials | | | 1.5% | |
Energy | | | 1.1% | |
| | | | |
| | | 106.2% | |
Holdings are subject to change without notice.
Janus Henderson Small Cap Growth Alpha ETF (unaudited)
Performance
| | | | |
| Average Annual Total Return for the periods ended October 31, 2018 |
| | | One Year | | Since
Inception* |
Janus Henderson Small Cap Growth Alpha ETF – NAV | | 10.52% | | 19.56% |
Janus Henderson Small Cap Growth Alpha ETF – Market Price | | 10.76% | | 19.55% |
Janus Small Cap Growth Alpha Index | | 10.44% | | 19.81% |
Russell 2000® Growth Index | | 4.13% | | 18.77% |
Total annual expense ratio as stated in the February 28, 2018 prospectus: 0.50%.
Returns quoted are past performance and do not guarantee future results; current performance may be lower or higher. Investment returns and principal value will vary; there may be a gain or loss when shares are sold. For the most recent month-end performance call 800.668.0434 or visit janushenderson.com/performance.
Shares of ETFs are bought and sold at market price (not NAV) and are not individually redeemed from the Fund. Market returns are based upon the midpoint of the bid/ask spread at 4:00 p.m. Eastern time (when NAV is normally determined for most ETFs), and do not represent the returns you would receive if you traded shares at other times. Ordinary brokerage commissions apply and will reduce returns.
ETF shares are not individually redeemable and owners of the shares may acquire those shares from the Fund and tender those shares for redemption to the Fund in Creation Units only.
Investing involves risk, including the possible loss of principal and fluctuation of value.
Performance depends on that of the underlying index.
See the prospectus for a more complete discussion of objectives, risks and expenses.
Returns include reinvestment of dividends and capital gains. Returns greater than one year are annualized. Returns do not reflect the deduction of taxes that a shareholder would pay on Fund distributions or redemptions of Fund shares.
See Financial Highlights for actual expense ratios during the reporting period.
There is no assurance the stated objective(s) will be met.
See Notes to Schedule of Investments and Other Information for index definitions.
Index performance does not reflect the expenses of managing a portfolio as an index is unmanaged and not available for direct investment.
The index provider is Janus Index and Calculation Services LLC (“Janus Index”). Janus Index maintains the indices and calculates the index levels and performance shown or discussed, but does not manage actual assets. Janus index receives compensation in connection with licensing its indices to third parties including the provision of any related data.
| * | The Fund commenced operations on February 23, 2016. |
| | |
| | Janus Detroit Street Trust ½ 3 |
Janus Henderson Small Cap Growth Alpha ETF (unaudited)
Disclosure of Fund Expenses
As a shareholder of the Fund, you incur two types of costs: (1) transaction costs, which may include creation and redemption fees or brokerage charges and (2) ongoing costs, including management fees and other Fund expenses. This example is intended to help you understand your ongoing costs (in dollars) of investing in the Fund and to compare these costs with the ongoing costs of investing in other ETFs. To do so, compare this 5% hypothetical example with the 5% hypothetical examples that appear in the shareholder reports of the other funds. The example is based upon an investment of $1,000 invested at the beginning of the period and held for the six-months indicated, unless noted otherwise in the table and footnotes below.
Actual Expenses
The information in the table under the heading “Actual” provides information about actual account values and actual expenses. You may use the information in these columns, together with the amount you invested, to estimate the expenses that you paid over the period. Simply divide your account value by $1,000 (for example, an $8,600 account value divided by $1,000 = 8.6), then multiply the result by the number under the heading entitled “Expenses Paid During Period” to estimate the expenses you paid on your account during the period.
Hypothetical Example for Comparison Purposes
The information in the table under the heading “Hypothetical (5% return before expenses)” provides information about hypothetical account values and hypothetical expenses based upon the Fund’s actual expense ratio and an assumed rate of return of 5% per year before expenses, which is not the Fund’s actual return. The hypothetical account values and expenses may not be used to determine the actual ending account balance or expenses you paid for the period. You may use this information to compare the ongoing costs of investing in the Fund and other funds. To do so, compare this 5% hypothetical example with the 5% hypothetical examples that appear in the shareholder reports of the other funds. Additionally, for an analysis of the fees associated with an investment or other similar funds, please visit www.finra.org/fundanalyzer.
Please note that the expenses shown in the table are meant to highlight your ongoing costs only and do not reflect any transaction costs, such as creation and redemption fees, or brokerage charges. These fees are fully described in the Fund’s prospectus. Therefore, the hypothetical examples are useful in comparing ongoing costs only, and will not help you determine the relative total costs of owning different funds. In addition, if these transaction costs were included, your costs would have been higher.
| | | | | | | | | | | | | | | | | | | | | | | | |
Actual | | | Hypothetical
(5% return before expenses) | | | | |
Beginning
Account
Value
(5/1/18) | | Ending
Account
Value
(10/31/2018) | | | Expenses
Paid During
Period
(5/1/18 - 10/31/2018)† | | | Beginning
Account
Value
(5/1/18) | | | Ending
Account
Value
(10/31/2018) | | | Expenses
Paid During
Period
(5/1/18 - 10/31/2018)† | | | Net Annualized
Expense Ratio
(5/1/18 - 10/31/2018) | |
| $1,000.00 | | $ | 1,066.20 | | | $ | 2.60 | | | $ | 1,000.00 | | | $ | 1,022.68 | | | $ | 2.55 | | | | 0.50% | |
| † | Expenses Paid During Period is equal to the Net Annualized Expense Ratio multiplied by the average account value over the period, multiplied by 184/365 (to reflect the one-half year period). |
Janus Henderson Small Cap Growth Alpha ETF
Report of Independent Registered Public Accounting Firm
To the Board of Trustees of Janus Detroit Street Trust and Shareholders of Janus Henderson Small Cap Growth Alpha ETF:
Opinion on the Financial Statements
We have audited the accompanying statement of assets and liabilities, including the schedule of investments, of Janus Henderson Small Cap Growth Alpha ETF (one of the funds constituting Janus Detroit Street Trust, referred to hereafter as the “Fund”) as of October 31, 2018, the related statement of operations for the year ended October 31, 2018, the statements of changes in net assets for each of the two years in the period ended October 31, 2018, including the related notes, and the financial highlights for each of the two years in the period ended October 31, 2018 and for the period February 23, 2016 (commencement date) through October 31, 2016 (collectively referred to as the “financial statements”). In our opinion, the financial statements present fairly, in all material respects, the financial position of the Fund as of October 31, 2018, the results of its operations for the year then ended, the changes in its net assets for each of the two years in the period ended October 31, 2018 and the financial highlights for each of the two years in the period ended October 31, 2018 and for the period February 23, 2016 (commencement date) through October 31, 2016 in conformity with accounting principles generally accepted in the United States of America.
Basis for Opinion
These financial statements are the responsibility of the Fund’s management. Our responsibility is to express an opinion on the Fund’s financial statements based on our audits. We are a public accounting firm registered with the Public Company Accounting Oversight Board (United States) (“PCAOB”) and are required to be independent with respect to the Fund in accordance with the U.S. federal securities laws and the applicable rules and regulations of the Securities and Exchange Commission and the PCAOB.
We conducted our audits of these financial statements in accordance with the standards of the PCAOB. Those standards require that we plan and perform the audit to obtain reasonable assurance about whether the financial statements are free of material misstatement, whether due to error or fraud.
Our audits included performing procedures to assess the risks of material misstatement of the financial statements, whether due to error or fraud, and performing procedures that respond to those risks. Such procedures included examining, on a test basis, evidence regarding the amounts and disclosures in the financial statements. Our audits also included evaluating the accounting principles used and significant estimates made by management, as well as evaluating the overall presentation of the financial statements. Our procedures included confirmation of securities owned as of October 31, 2018 by correspondence with the custodian and transfer agent. We believe that our audits provide a reasonable basis for our opinion.

Denver, Colorado
December 20, 2018
We have served as the auditor of one or more investment companies in Janus Henderson Funds since 1990.
| | |
| | Janus Detroit Street Trust ½ 5 |
Janus Henderson Small Cap Growth Alpha ETF
Schedule of Investments
October 31, 2018
| | | | | | | | |
| | | Shares | | | Value | |
| Common Stocks – 100.1% | | | | | | |
| Aerospace & Defense – 2.4% | | | | | | |
HEICO Corp. | | | 7,340 | | | | $615,312 | |
| Airlines – 1.7% | | | | | | |
Allegiant Travel Co. | | | 997 | | | | 113,797 | |
Hawaiian Holdings, Inc. | | | 3,142 | | | | 108,745 | |
Spirit Airlines, Inc.* | | | 4,224 | | | | 219,226 | |
| | | | | | | | |
| | | | | | | 441,768 | |
| Auto Components – 1.9% | | | | | | |
American Axle & Manufacturing Holdings, Inc.* | | | 5,470 | | | | 82,980 | |
Dorman Products, Inc.* | | | 1,629 | | | | 128,707 | |
Fox Factory Holding Corp.* | | | 1,852 | | | | 99,508 | |
Gentherm, Inc.* | | | 1,784 | | | | 77,854 | |
Horizon Global Corp.* | | | 1,223 | | | | 6,861 | |
LCI Industries | | | 1,232 | | | | 85,439 | |
| | | | | | | | |
| | | | 481,349 | |
| Automobiles – 0.2% | | | | | | |
Winnebago Industries, Inc. | | | 1,546 | | | | 42,608 | |
| Beverages – 0.3% | | | | | | |
National Beverage Corp.* | | | 761 | | | | 70,354 | |
| Biotechnology – 1.1% | | | | | | |
BioSpecifics Technologies Corp.* | | | 1,940 | | | | 118,864 | |
MiMedx Group, Inc.*,# | | | 29,556 | | | | 172,016 | |
| | | | | | | | |
| | | | 290,880 | |
| Building Products – 3.1% | | | | | | |
AAON, Inc. | | | 3,233 | | | | 111,506 | |
American Woodmark Corp.* | | | 1,087 | | | | 65,698 | |
Apogee Enterprises, Inc. | | | 1,746 | | | | 63,031 | |
Builders FirstSource, Inc.* | | | 7,098 | | | | 87,873 | |
Continental Building Products, Inc.* | | | 2,289 | | | | 63,657 | |
Patrick Industries, Inc.* | | | 1,521 | | | | 66,179 | |
PGT Innovations, Inc.* | | | 3,142 | | | | 63,657 | |
Simpson Manufacturing Co., Inc. | | | 2,864 | | | | 163,477 | |
Universal Forest Products, Inc. | | | 3,815 | | | | 107,850 | |
| | | | | | | | |
| | | | 792,928 | |
| Capital Markets – 1.8% | | | | | | |
Cohen & Steers, Inc. | | | 2,173 | | | | 83,422 | |
Diamond Hill Investment Group, Inc. | | | 161 | | | | 27,721 | |
Evercore, Inc. - Class A | | | 1,905 | | | | 155,619 | |
Hamilton Lane, Inc. - Class A | | | 1,079 | | | | 41,412 | |
Houlihan Lokey, Inc. | | | 1,595 | | | | 65,682 | |
Moelis & Co. - Class A | | | 2,124 | | | | 85,725 | |
Pzena Investment Management, Inc. - Class A | | | 815 | | | | 8,199 | |
| | | | | | | | |
| | | | 467,780 | |
| Chemicals – 2.0% | | | | | | |
Balchem Corp. | | | 4,050 | | | | 379,282 | |
Chase Corp. | | | 1,184 | | | | 127,683 | |
| | | | | | | | |
| | | | 506,965 | |
| Commercial Banks – 3.5% | | | | | | |
Ameris Bancorp | | | 2,207 | | | | 94,658 | |
Bankwell Financial Group, Inc. | | | 365 | | | | 11,067 | |
Byline Bancorp, Inc.* | | | 1,685 | | | | 37,070 | |
Eagle Bancorp, Inc.* | | | 1,598 | | | | 78,574 | |
Equity Bancshares, Inc. - Class A* | | | 736 | | | | 26,562 | |
FB Financial Corp. | | | 1,430 | | | | 52,166 | |
First Foundation, Inc.* | | | 2,066 | | | | 33,490 | |
Franklin Financial Network, Inc.* | | | 671 | | | | 22,747 | |
Hilltop Holdings, Inc. | | | 4,400 | | | | 87,560 | |
Independent Bank Group, Inc. | | | 1,415 | | | | 81,943 | |
See Notes to Schedule of Investments and Other Information and Notes to Financial Statements.
Janus Henderson Small Cap Growth Alpha ETF
Schedule of Investments
October 31, 2018
| | | | | | | | |
| | | Shares | | | Value | |
| Common Stocks – (continued) | | | | | | |
| Commercial Banks – (continued) | | | | | | |
Live Oak Bancshares, Inc. | | | 1,654 | | | | $ 30,434 | |
Metropolitan Bank Holding Corp.* | | | 383 | | | | 14,117 | |
National Commerce Corp.* | | | 963 | | | | 35,727 | |
Nicolet Bankshares, Inc.* | | | 451 | | | | 24,083 | |
People’s Utah Bancorp | | | 867 | | | | 29,053 | |
Preferred Bank | | | 710 | | | | 36,501 | |
RBB Bancorp | | | 769 | | | | 16,595 | |
Seacoast Banking Corp. of Florida* | | | 2,194 | | | | 57,724 | |
ServisFirst Bancshares, Inc. | | | 2,471 | | | | 88,907 | |
TriState Capital Holdings, Inc.* | | | 1,348 | | | | 33,997 | |
| | | | | | | | |
| | | | 892,975 | |
| Commercial Services & Supplies – 1.2% | | | | | | |
Healthcare Services Group, Inc. | | | 4,560 | | | | 185,091 | |
Multi-Color Corp. | | | 1,270 | | | | 67,513 | |
Viad Corp. | | | 1,261 | | | | 60,389 | |
| | | | | | | | |
| | | | 312,993 | |
| Communications Equipment – 5.5% | | | | | | |
Acacia Communications, Inc.* | | | 6,485 | | | | 223,538 | |
Applied Optoelectronics, Inc.* | | | 3,151 | | | | 61,854 | |
Casa Systems, Inc.* | | | 13,802 | | | | 198,749 | |
Ubiquiti Networks, Inc.# | | | 10,154 | | | | 945,236 | |
| | | | | | | | |
| | | | 1,429,377 | |
| Computers & Peripherals – 0.2% | | | | | | |
USA Technologies, Inc.* | | | 9,445 | | | | 54,781 | |
| Construction & Engineering – 0.9% | | | | | | |
Argan, Inc. | | | 962 | | | | 42,347 | |
Comfort Systems USA, Inc. | | | 2,302 | | | | 123,111 | |
Construction Partners, Inc. - Class A* | | | 737 | | | | 6,663 | |
NV5 Global, Inc.* | | | 777 | | | | 60,660 | |
| | | | | | | | |
| | | | 232,781 | |
| Diversified Financial Services – 0.3% | | | | | | |
FGL Holdings* | | | 9,973 | | | | 78,787 | |
| Electrical Equipment – 0.2% | | | | | | |
TPI Composites, Inc.* | | | 2,130 | | | | 53,804 | |
| Electronic Equipment & Instruments – 1.8% | | | | | | |
Control4 Corp.* | | | 4,171 | | | | 116,454 | |
Methode Electronics, Inc. | | | 5,902 | | | | 174,699 | |
Napco Security Technologies, Inc.* | | | 2,993 | | | | 42,111 | |
PC Connection, Inc. | | | 4,268 | | | | 141,442 | |
| | | | | | | | |
| | | | 474,706 | |
| Energy Equipment & Services – 0.3% | | | | | | |
Cactus, Inc. - Class A* | | | 858 | | | | 28,709 | |
Liberty Oilfield Services, Inc. - Class A | | | 1,599 | | | | 30,349 | |
Smart Sand, Inc.* | | | 947 | | | | 2,623 | |
Solaris Oilfield Infrastructure, Inc. - Class A* | | | 603 | | | | 7,959 | |
| | | | | | | | |
| | | | 69,640 | |
| Equity Real Estate Investment Trusts (REITs) – 1.6% | | | | | | |
CareTrust, Inc. | | | 2,181 | | | | 38,517 | |
Easterly Government Properties, Inc. | | | 1,640 | | | | 29,799 | |
Four Corners Property Trust, Inc. | | | 1,803 | | | | 47,022 | |
Independence Realty Trust, Inc. | | | 2,355 | | | | 23,338 | |
Jernigan Capital, Inc. | | | 520 | | | | 10,176 | |
National Storage Affiliates Trust | | | 1,535 | | | | 40,877 | |
Retail Opportunity Investments Corp. | | | 3,058 | | | | 53,790 | |
STAG Industrial, Inc. | | | 2,824 | | | | 74,723 | |
Summit Hotel Properties, Inc. | | | 2,842 | | | | 32,740 | |
See Notes to Schedule of Investments and Other Information and Notes to Financial Statements.
| | |
| | Janus Detroit Street Trust ½ 7 |
Janus Henderson Small Cap Growth Alpha ETF
Schedule of Investments
October 31, 2018
| | | | | | | | |
| | | Shares | | | Value | |
| Common Stocks – (continued) | | | | | | |
| Equity Real Estate Investment Trusts (REITs) – (continued) | | | | | | |
Terreno Realty Corp. | | | 1,578 | | | | $ 59,065 | |
| | | | | | | | |
| | | | 410,047 | |
Food & Staples Retailing – 0.8% | | | | | |
Sprouts Farmers Market, Inc.* | | | 2,084 | | | | 56,039 | |
Calavo Growers, Inc. | | | 288 | | | | 27,936 | |
Hostess Brands, Inc.* | | | 1,637 | | | | 17,025 | |
Pilgrim’s Pride Corp.* | | | 4,084 | | | | 72,123 | |
Sanderson Farms, Inc. | | | 373 | | | | 36,700 | |
| | | | | | | | |
| | | | 209,823 | |
| Health Care Equipment & Supplies – 10.8% | | | | | | |
Anika Therapeutics, Inc.* | | | 3,885 | | | | 138,928 | |
Cutera, Inc.* | | | 3,685 | | | | 74,806 | |
Glaukos Corp.* | | | 9,382 | | | | 543,593 | |
Heska Corp.* | | | 1,995 | | | | 199,939 | |
Inogen, Inc.* | | | 3,442 | | | | 652,500 | |
LeMaitre Vascular, Inc. | | | 5,180 | | | | 138,306 | |
NuVasive, Inc.* | | | 12,979 | | | | 729,030 | |
Tactile Systems Technology, Inc.* | | | 4,878 | | | | 319,411 | |
| | | | | | | | |
| | | | 2,796,513 | |
| Health Care Providers & Services – 3.6% | | | | | | |
AMN Healthcare Services, Inc.* | | | 12,645 | | | | 640,090 | |
National Research Corp. - Class A | | | 6,566 | | | | 249,836 | |
Psychemedics Corp. | | | 1,468 | | | | 25,690 | |
| | | | | | | | |
| | | | 915,616 | |
| Health Care Technology – 1.9% | | | | | | |
Simulations Plus, Inc. | | | 4,623 | | | | 93,431 | |
Tabula Rasa HealthCare, Inc.* | | | 5,387 | | | | 397,991 | |
| | | | | | | | |
| | | | 491,422 | |
| Hotels, Restaurants & Leisure – 2.1% | | | | | | |
Bojangles’, Inc.* | | | 1,809 | | | | 28,600 | |
Choice Hotels International, Inc. | | | 2,769 | | | | 203,245 | |
Chuy’s Holdings, Inc.* | | | 827 | | | | 20,154 | |
Dave & Buster’s Entertainment, Inc. | | | 1,926 | | | | 114,693 | |
Papa John’s International, Inc.# | | | 1,546 | | | | 84,319 | |
Wingstop, Inc. | | | 1,432 | | | | 89,672 | |
| | | | | | | | |
| | | | 540,683 | |
| Household Durables – 1.8% | | | | | | |
Cavco Industries, Inc.* | | | 445 | | | | 89,271 | |
Century Communities, Inc.* | | | 1,474 | | | | 31,278 | |
Hooker Furniture Corp. | | | 578 | | | | 16,918 | |
Installed Building Products, Inc.* | | | 1,545 | | | | 47,061 | |
iRobot Corp.* | | | 1,340 | | | | 118,148 | |
LGI Homes, Inc.* | | | 1,107 | | | | 47,369 | |
M/I Homes, Inc.* | | | 1,401 | | | | 33,862 | |
New Home Co., Inc.* | | | 1,024 | | | | 7,301 | |
TopBuild Corp.* | | | 1,744 | | | | 79,561 | |
| | | | | | | | |
| | | | 470,769 | |
| Insurance – 0.8% | | | | | | |
Goosehead Insurance, Inc. - Class A * | | | 631 | | | | 21,631 | |
Health Insurance Innovations, Inc. - Class A * | | | 662 | | | | 32,372 | |
Investors Title Co. | | | 86 | | | | 15,652 | |
Kingstone Companies, Inc. | | | 496 | | | | 8,432 | |
Kinsale Capital Group, Inc. | | | 988 | | | | 58,993 | |
Universal Insurance Holdings, Inc. | | | 1,625 | | | | 68,217 | |
| | | | | | | | |
| | | | 205,297 | |
See Notes to Schedule of Investments and Other Information and Notes to Financial Statements.
Janus Henderson Small Cap Growth Alpha ETF
Schedule of Investments
October 31, 2018
| | | | | | | | |
| | | Shares | | | Value | |
| Common Stocks – (continued) | | | | | | |
| Interactive Media & Services – 5.7% | | | | | | |
Cargurus, Inc.* | | | 14,188 | | | | $ 630,231 | |
Cars.com, Inc.* | | | 11,146 | | | | 291,022 | |
Match Group, Inc.*,# | | | 10,705 | | | | 553,663 | |
| | | | | | | | |
| | | | 1,474,916 | |
| Internet & Catalog Retail – 3.9% | | | | | | |
Duluth Holdings, Inc. - Class B* | | | 1,428 | | | | 43,883 | |
Etsy, Inc.* | | | 18,712 | | | | 795,634 | |
Liberty Expedia Holdings, Inc. - Class A* | | | 2,810 | | | | 122,010 | |
Nutrisystem, Inc. | | | 1,445 | | | | 51,384 | |
| | | | | | | | |
| | | | 1,012,911 | |
| IT Services – 0.9% | | | | | | |
Hackett Group, Inc. | | | 4,708 | | | | 96,373 | |
NIC, Inc. | | | 10,639 | | | | 141,605 | |
| | | | | | | | |
| | | | 237,978 | |
| Leisure Equipment & Products – 0.5% | | | | | | |
Johnson Outdoors, Inc. - Class A | | | 436 | | | | 32,835 | |
Malibu Boats, Inc. - Class A* | | | 1,005 | | | | 40,401 | |
Marine Products Corp. | | | 1,689 | | | | 34,405 | |
MCBC Holdings, Inc.* | | | 916 | | | | 27,187 | |
| | | | | | | | |
| | | | 134,828 | |
| Life Sciences Tools & Services – 1.8% | | | | | | |
Cambrex Corp.* | | | 8,854 | | | | 471,830 | |
| Machinery – 1.0% | | | | | | |
Lydall, Inc.* | | | 1,078 | | | | 32,200 | |
Omega Flex, Inc. | | | 624 | | | | 37,752 | |
Proto Labs, Inc.* | | | 1,673 | | | | 199,840 | |
| | | | | | | | |
| | | | 269,792 | |
| Media – 0.6% | | | | | | |
AMC Networks, Inc. - Class A* | | | 2,230 | | | | 130,634 | |
Entravision Communications Corp. - Class A | | | 3,164 | | | | 15,630 | |
| | | | | | | | |
| | | | 146,264 | |
| Metals & Mining – 1.9% | | | | | | |
Warrior Met Coal, Inc. | | | 6,637 | | | | 185,836 | |
Worthington Industries, Inc. | | | 7,466 | | | | 312,676 | |
| | | | | | | | |
| | | | 498,512 | |
| Mortgate Real Estate Investment Trusts (REITs) – 0.2% | | | | | | |
Cherry Hill Mortgage Investment Corp. | | | 724 | | | | 12,967 | |
Granite Point Mortgage Trust, Inc. | | | 2,000 | | | | 37,220 | |
| | | | | | | | |
| | | | 50,187 | |
| Multiline Retail – 1.1% | | | | | | |
Ollie’s Bargain Outlet Holdings, Inc.* | | | 3,053 | | | | 283,624 | |
| Oil, Gas & Consumable Fuels – 0.1% | | | | | | |
Alta Mesa Resources, Inc. – Class A* | | | 4,087 | | | | 12,874 | |
| Paper & Forest Products – 1.7% | | | | | | |
KapStone Paper and Packaging Corp. | | | 12,276 | | | | 429,660 | |
| Personal Products – 0.0% | | | | | | |
Natural Health Trends Corp. | | | 189 | | | | 4,298 | |
| Pharmaceuticals – 5.0% | | | | | | |
Mallinckrodt PLC* | | | 22,150 | | | | 555,079 | |
Phibro Animal Health Corp. - Class A | | | 5,358 | | | | 229,965 | |
Prestige Consumer Healthcare, Inc.* | | | 13,770 | | | | 497,923 | |
| | | | | | | | |
| | | | 1,282,967 | |
| Professional Services – 2.7% | | | | | | |
BG Staffing, Inc. | | | 623 | | | | 16,098 | |
See Notes to Schedule of Investments and Other Information and Notes to Financial Statements.
| | |
| | Janus Detroit Street Trust ½ 9 |
Janus Henderson Small Cap Growth Alpha ETF
Schedule of Investments
October 31, 2018
| | | | | | | | |
| | | Shares | | | Value | |
| Common Stocks – (continued) | | | | | | |
| Professional Services – (continued) | | | | | | |
Insperity, Inc. | | | 2,593 | | | | $ 284,841 | |
Korn/Ferry International | | | 3,549 | | | | 160,202 | |
TriNet Group, Inc.* | | | 4,369 | | | | 205,299 | |
Willdan Group, Inc.* | | | 554 | | | | 16,731 | |
| | | | | | | | |
| | | | 683,171 | |
| Real Estate Management & Development – 0.3% | | | | | | |
Consolidated-Tomoka Land Co. | | | 148 | | | | 8,572 | |
HFF, Inc. - Class A | | | 1,062 | | | | 39,029 | |
RMR Group, Inc. - Class A | | | 407 | | | | 30,883 | |
| | | | | | | | |
| | | | 78,484 | |
| Road & Rail – 0.9% | | | | | | |
Saia, Inc.* | | | 1,588 | | | | 99,822 | |
Schneider National, Inc. - Class B | | | 5,818 | | | | 127,239 | |
| | | | | | | | |
| | | | 227,061 | |
| Semiconductors & Semiconductor Equipment – 2.1% | | | | | | |
Advanced Energy Industries, Inc.* | | | 6,253 | | | | 269,067 | |
FormFactor, Inc.* | | | 11,810 | | | | 144,554 | |
Ichor Holdings, Ltd.*,# | | | 3,896 | | | | 69,154 | |
Ultra Clean Holdings, Inc.* | | | 6,221 | | | | 65,445 | |
| | | | | | | | |
| | | | 548,220 | |
| Software – 12.4% | | | | | | |
Alarm.com Holdings, Inc.* | | | 7,623 | | | | 339,071 | |
Avalara, Inc.*,# | | | 10,625 | | | | 356,150 | |
Ebix, Inc. | | | 5,031 | | | | 288,327 | |
Globant SA* | | | 5,741 | | | | 295,547 | |
Hortonworks, Inc.* | | | 13,004 | | | | 232,251 | |
Paylocity Holding Corp.* | | | 8,435 | | | | 554,939 | |
Qualys, Inc.* | | | 6,237 | | | | 444,324 | |
Trade Desk, Inc. - Class A* | | | 5,661 | | | | 699,416 | |
| | | | | | | | |
| | | | 3,210,025 | |
| Specialty Retail – 2.6% | | | | | | |
Asbury Automotive Group, Inc.* | | | 999 | | | | 65,035 | |
At Home Group, Inc.* | | | 3,110 | | | | 85,027 | |
Boot Barn Holdings, Inc.* | | | 1,372 | | | | 33,861 | |
Camping World Holdings, Inc. - Class A# | | | 1,811 | | | | 31,059 | |
Floor & Decor Holdings, Inc. - Class A* | | | 4,760 | | | | 121,761 | |
Lithia Motors, Inc. - Class A | | | 1,138 | | | | 101,373 | |
MarineMax, Inc.* | | | 1,106 | | | | 25,173 | |
Penske Automotive Group, Inc. | | | 4,159 | | | | 184,576 | |
Winmark Corp. | | | 186 | | | | 28,586 | |
| | | | | | | | |
| | | | 676,451 | |
| Textiles, Apparel & Luxury Goods – 0.1% | | | | | | |
Superior Group of Companies, Inc. | | | 753 | | | | 13,095 | |
| Thrifts & Mortgage Finance – 1.4% | | | | | | |
Axos Financial, Inc.* | | | 2,920 | | | | 88,651 | |
Bridgewater Bancshares, Inc.* | | | 1,268 | | | | 14,075 | |
FS Bancorp, Inc.# | | | 174 | | | | 7,854 | |
Greene County Bancorp, Inc. | | | 401 | | | | 12,860 | |
Merchants Bancorp | | | 1,337 | | | | 30,751 | |
Meridian Bancorp, Inc. | | | 2,510 | | | | 39,759 | |
NMI Holdings, Inc. - Class A* | | | 3,062 | | | | 64,731 | |
PennyMac Financial Services, Inc. | | | 1,171 | | | | 23,408 | |
Sterling Bancorp, Inc. | | | 2,466 | | | | 25,523 | |
Walker & Dunlop, Inc. | | | 1,458 | | | | 61,178 | |
| | | | | | | | |
| | | | 368,790 | |
See Notes to Schedule of Investments and Other Information and Notes to Financial Statements.
Janus Henderson Small Cap Growth Alpha ETF
Schedule of Investments
October 31, 2018
| | | | | | | | |
| | | Shares | | | Value | |
| Common Stocks – (continued) | | | | | | |
| Tobacco – 0.1% | | | | | | |
Vector Group, Ltd. | | | 2,501 | | | | $ 33,813 | |
| Trading Companies & Distributors – 1.3% | | | | | | |
BMC Stock Holdings, Inc.* | | | 4,167 | | | | 69,755 | |
EnviroStar, Inc. | | | 692 | | | | 28,753 | |
Foundation Building Materials, Inc.* | | | 2,656 | | | | 25,312 | |
GMS, Inc.* | | | 2,546 | | | | 41,856 | |
SiteOne Landscape Supply, Inc.* | | | 2,509 | | | | 170,712 | |
| | | | | | | | |
| | | | | | | | 336,388 | |
Total Common Stocks (cost $29,782,355) | | | | | | | 25,836,097 | |
Investment Companies – 6.1% | | | | | | | | |
| Investments Purchased with Cash Collateral from Securities Lending – 6.1% | | | | | | |
Janus Henderson Cash Collateral Fund LLC, 2.1443%¥,£ (cost $1,591,064) | | | 1,591,064 | | | | 1,591,064 | |
Total Investments (total cost $31,373,419) – 106.2% | | | | | | | 27,427,161 | |
Liabilities, net of Cash, Receivables and Other Assets – (6.2%) | | | | | | | (1,611,591) | |
Net Assets – 100% | | | | | | | $25,815,570 | |
Summary of Investments by Country – (Long Positions) (unaudited)
| | | | | | | | |
| Country | | Value | | | % of Investment
Securities | |
United States | | | $27,131,614 | | | | 98.9% | |
Argentina | | | 295,547 | | | | 1.1 | |
Total | | | $27,427,161 | | | | 100.0% | |
Schedules of Affiliated Investments – (% of Net Assets)
| | | | | | | | | | | | | | | | |
| | | Dividend Income | | | Realized
Gain/(Loss) | | | Change in
Unrealized
Appreciation/
(Depreciation) | | | Value at
10/31/18 | |
Investment Companies – 6.1% | | | | | | | | | | | | | | | | |
Investments Purchased with Cash Collateral from Securities Lending – 6.1% | | | | | | | | | | | | | |
Janus Henderson Cash Collateral Fund LLC, 2.1443%¥ | | | $73,430D | | | | $ — | | | | $ — | | | | $1,591,064 | |
| | | | |
| | | Share Balance
at 10/31/17 | | | Purchases | | | Sales | | | Share
Balance at
10/31/18 | |
Investment Companies – 6.1% | | | | | | | | | | | | | | | | |
Investments Purchased with Cash Collateral from Securities Lending – 6.1% | | | | | | | | | | | | | |
Janus Henderson Cash Collateral Fund LLC, 2.1443%¥ | | | 396,201 | | | | 11,566,709 | | | | (10,371,846) | | | | 1,591,064 | |
See Notes to Schedule of Investments and Other Information and Notes to Financial Statements.
| | |
| | Janus Detroit Street Trust ½ 11 |
Janus Henderson Small Cap Growth Alpha ETF
Notes to Schedule of Investments and Other Information
October 31, 2018
| | |
| |
Janus Small
Cap Growth
Alpha Index | | Janus Small Cap Growth Alpha Index is designed to systematically identify small-capitalization stocks that are poised for sustainable growth (Smart Growth®) by evaluating each company’s performance in three critical areas: growth, profitability, and capital efficiency. A proprietary methodology is used to score stocks based on a wide range of fundamental measures and selects the top 10% (“top-tier”) of such eligible stocks. Stocks are market cap-weighted within sectors with a 3% maximum position size; sectors are weighted to align with the Janus Henderson Venture Fund. |
| |
Russell 2000®
Growth Index | | Russell 2000® Growth Index reflects the performance of U.S. small-cap equities with higher price-to-book ratios and higher forecasted growth values. |
| |
| LLC | | Limited Liability Company |
| |
| PLC | | Public Limited Company |
| * | Non-income producing security. |
| # | Loaned security; a portion of the security is on loan at October 31, 2018. |
| ¥ | Rate shown is the 7-day yield as of October 31, 2018. |
| £ | The Fund may invest in certain securities that are considered affiliated companies. As defined by the Investment Company Act of 1940, as amended, an affiliated company is one in which the Fund owns 5% or more of the outstanding voting securities, or a company which is under common ownership or control. |
| D | Net of income paid to the securities lending agent and rebates paid to the borrowing counterparties. |
The following is a summary of the inputs that were used to value the Fund’s investments in securities and other financial instruments as of October 31, 2018. See Notes to Financial Statements for more information.
Valuation Inputs Summary
| | | | | | | | | | | | |
| | | Level 1 -
Quoted Prices | | | Level 2 -
Other Significant
Observable Inputs | | | Level 3 -
Significant
Unobservable Inputs | |
Assets | | | | | | | | | | | | |
Investments in Securities: | | | | | | | | | | | | |
Common Stocks | | $ | 25,836,097 | | | $ | — | | | $ | — | |
Investment Companies | | | — | | | | 1,591,064 | | | | — | |
| | | | |
Total Assets | | $ | 25,836,097 | | | $ | 1,591,064 | | | $ | — | |
Janus Henderson Small Cap Growth Alpha ETF
Statement of Assets and Liabilities
October 31, 2018
| | | | |
Assets: | | | | |
Unaffiliated investments, at value(1)(2) | | $ | 25,836,097 | |
Affiliated investments, at value(3) | | | 1,591,064 | |
Receivables: | | | | |
Dividends | | | 2,253 | |
Affiliated securities lending income, net | | | 4,607 | |
Total Assets | | | 27,434,021 | |
Liabilities: | | | | |
Collateral on securities loaned (Note 2) | | | 1,591,064 | |
Payables: | | | | |
Due to custodian | | | 11,148 | |
Management fees | | | 16,239 | |
Total Liabilities | | | 1,618,451 | |
Net Assets | | $ | 25,815,570 | |
Net Assets Consists of: | | | | |
Capital (par value and paid-in surplus) | | $ | 30,269,518 | |
Total distributable earnings (loss) | | | (4,453,948) | |
Total Net Assets | | $ | 25,815,570 | |
Net Assets | | $ | 25,815,570 | |
Shares outstanding, $0.001 Par Value (unlimited shares authorized) | | | 652,000 | |
Net Asset Value Per Share | | $ | 39.59 | |
| (1) | Includes cost of $29,782,355. |
| (2) | Includes $1,566,630 of securities on loan. See Note 2 in Notes to Financial Statements. |
| (3) | Includes cost of $1,591,064. |
See Notes to Financial Statements.
| | |
| | Janus Detroit Street Trust ½ 13 |
Janus Henderson Small Cap Growth Alpha ETF
Statement of Operations
For the year ended October 31, 2018
| | | | |
Investment Income: | | | | |
Dividends | | $ | 100,601 | |
Affiliated securities lending income, net | | | 73,430 | |
Total Investment Income | | | 174,031 | |
Expenses: | | | | |
Management Fees | | | 87,221 | |
Total Expenses | | | 87,221 | |
Net Investment Income/(Loss) | | | 86,810 | |
Net Realized Gain/(Loss) on Investments: | | | | |
Investments and foreign currency transactions | | $ | 2,491,406 | |
Total Net Realized Gain/(Loss) on Investments | | $ | 2,491,406 | |
Change in Unrealized Net Appreciation/Depreciation: | | | | |
Investments and foreign currency translations | | $ | (4,687,297) | |
Total Change in Unrealized Net Appreciation/Depreciation | | $ | (4,687,297) | |
Net Increase/(Decrease) in Net Assets Resulting from Operations | | $ | (2,109,081) | |
See Notes to Financial Statements.
Janus Henderson Small Cap Growth Alpha ETF
Statements of Changes in Net Assets
| | | | | | | | |
| | | Year Ended
October 31, 2018 | | | Year Ended
October 31, 2017 | |
Operations: | | | | | | | | |
Net investment income/(loss) | | $ | 86,810 | | | $ | 28,851 | |
Net realized gain/(loss) on investments | | | 2,491,406 | | | | 775,153 | |
Change in unrealized net appreciation/depreciation | | | (4,687,297) | | | | 886,912 | |
Net Increase/(Decrease) in Net Assets Resulting from Operations | | | (2,109,081) | | | | 1,690,916 | |
Dividends and Distributions to Shareholders: | | | | | | | | |
Dividends and Distributions | | | (87,999) | | | | N/A | |
Dividends from Net Investment Income(1) | | | N/A | | | | (46,606) | |
Net Decrease from Dividends and Distributions to Shareholders | | | (87,999) | | | | (46,606) | |
Capital Share Transactions | | | 18,929,291 | | | | 3,157,247 | |
Net Increase/(Decrease) in Net Assets | | | 16,732,211 | | | | 4,801,557 | |
Net Assets: | | | | | | | | |
Beginning of period | | | 9,083,359 | | | | 4,281,802 | |
End of period(2) | | $ | 25,815,570 | | | $ | 9,083,359 | |
| (1) | The requirement to disclose dividends and distributions paid to shareholders from net investment income and/or net realized gain from investment transactions was eliminated by the U.S. Securities and Exchange Commission (“SEC”) in 2018. |
| (2) | Net assets – End of period includes undistributed (overdistributed) net investment income of $5,687 as of October 31, 2017. The requirement to disclose undistributed (overdistributed) net investment income was eliminated by the SEC in 2018. |
See Notes to Financial Statements.
| | |
| | Janus Detroit Street Trust ½ 15 |
Janus Henderson Small Cap Growth Alpha ETF
Financial Highlights
| | | | | | | | | | | | | | |
| For a share outstanding during each year or period ended October 31 | | 2018 | | | 2017 | | | 2016(1) | |
| | Net Asset Value, Beginning of Period | | | $36.05 | | | | $28.17 | | | | $24.83 | |
| | Income/(Loss) from Investment Operations: | | | | | | | | | | | | |
| | Net investment income/(loss)(2) | | | 0.20 | | | | 0.13 | | | | 0.26 | |
| | Net realized and unrealized gain/(loss) | | | 3.57 | | | | 7.97 | | | | 3.10 | |
| | Total from Investment Operations | | | 3.77 | | | | 8.10 | | | | 3.36 | |
| | Less Dividends and Distributions: | | | | | | | | | | | | |
| | Dividends (from net investment income) | | | (0.23) | | | | (0.22) | | | | (0.02) | |
| | Total Dividends and Distributions | | | (0.23) | | | | (0.22) | | | | (0.02) | |
| | Net Asset Value, End of Period | | | $39.59 | | | | $36.05 | | | | $28.17 | |
| | Total Return* | | | 10.49%(3) | | | | 28.86% | | | | 13.54% | |
| | Net assets, End of Period (in thousands) | | | $25,816 | | | | $9,083 | | | | $4,282 | |
| | Average Net Assets for the Period (in thousands) | | | $17,444 | | | | $7,068 | | | | $3,247 | |
| | Ratios to Average Net Assets**: | | | | | | | | | | | | |
| | Ratio of Gross Expenses | | | 0.50% | | | | 0.50% | | | | 0.50% | |
| | Ratio of Net Investment Income/(Loss) | | | 0.50% | | | | 0.41% | | | | 1.37% | |
| | Portfolio Turnover Rate(4) | | | 84% | | | | 117% | | | | 86% | |
| * | Total return not annualized for periods of less than one full year. |
| ** | Annualized for periods of less than one full year. |
| (1) | Period from February 23, 2016 (commencement of operations) through October 31, 2016. |
| (2) | Per share amounts are calculated based on average shares outstanding during the year or period. |
| (3) | The return includes adjustments in accordance with generally accepted accounting principles required at period end date. |
| (4) | Portfolio turnover rate excludes securities received or delivered from in-kind processing of creation or redemptions. |
See Notes to Financial Statements.
Janus Henderson Small Cap Growth Alpha ETF
Notes to Financial Statements
1. Organization and Significant Accounting Policies
Janus Henderson Small Cap Growth Alpha ETF (the “Fund”) is a series fund. The Fund is part of Janus Detroit Street Trust (the “Trust”), which is organized as a Delaware statutory trust and is registered under the Investment Company Act of 1940, as amended (the “1940 Act”), as an open-end management investment company, and therefore has applied the specialized accounting and reporting guidance in Financial Accounting Standards Board (“FASB”) Accounting Standards Codification (“ASC”) Topic 946. The Trust offers seven Funds each of which represent shares of beneficial interest in a separate portfolio of securities and other assets with its own objective and policies. The Fund seeks investment results that correspond generally, before fees and expenses, to the performance of its underlying index, the Janus Small Cap Growth Alpha Index (the “Underlying Index”). The Fund is classified as diversified, as defined in the 1940 Act.
Unlike shares of traditional mutual funds, shares of the Fund are not individually redeemable and may only be purchased or redeemed directly from the Fund at net asset value (“NAV”) in large increments called “Creation Units” (25,000 or more shares per Creation Unit) through certain participants, known as “Authorized Participants.” The Fund will issue or redeem Creation Units in exchange for portfolio securities and/or cash. Except when aggregated in Creation Units, Fund shares are not redeemable securities of the Fund. Shares of the Fund are listed and trade on The NASDAQ Stock Market LLC (“NASDAQ”) and individual investors can purchase or sell shares in much smaller increments and for cash in the secondary market through a broker. These transactions, which do not involve the Fund, are made at market prices that may vary throughout the day and differ from the Fund’s NAV. As a result, you may pay more than NAV (a premium) when you purchase shares, and receive less than NAV (a discount) when you sell shares, in the secondary market.
An Authorized Participant may hold of record more than 25% of the outstanding shares of the Fund. From time to time, Authorized Participants may be a beneficial and/or legal owner of the Fund, may be affiliated with an index provider, may be deemed to have control of the Fund and/or may be able to affect the outcome of matters presented for a vote of the shareholders of the Fund. Authorized Participants may execute an irrevocable proxy granting the Distributor or an affiliate of Janus Capital Management LLC (“Janus Capital” or “Janus”) power to vote or abstain from voting such Authorized Participant’s beneficially or legally owned shares of the Fund. In such cases, the agent shall mirror vote (or abstain from voting) such shares in the same proportion as all other beneficial owners of the Fund.
The following accounting policies have been followed by the Fund and are in conformity with accounting principles generally accepted in the United States of America.
Investment Valuation
Securities held by the Fund are valued in accordance with policies and procedures established by and under the supervision of the Trustees (the “Valuation Procedures”). Equity securities, including shares of exchange-traded funds, traded on a domestic securities exchange are generally valued at the closing prices on the primary market or exchange on which they trade. If such price is lacking for the trading period immediately preceding the time of determination, such securities are valued at their current bid price. Equity securities that are traded on a foreign exchange are generally valued at the closing prices on such markets. In the event that there is no current trading volume on a particular security in such foreign exchange, the bid price from the primary exchange is generally used to value the security. Securities that are traded on the over-the-counter (“OTC”) markets are generally valued at their closing or latest bid prices as available. Foreign securities and currencies are converted to U.S. dollars using the applicable exchange rate in effect at the close of the New York Stock Exchange (“NYSE”). The Fund will determine the market value of individual securities held by it by using prices provided by one or more approved professional pricing services or, as needed, by obtaining market quotations from independent broker-dealers. Most debt securities are valued in accordance with the evaluated bid price supplied by the pricing service that is intended to reflect market value. The evaluated bid price supplied by the pricing service is an evaluation that may consider factors such as security prices, yields, maturities and ratings. Certain short-term securities maturing within 60 days or less may be evaluated and valued on an amortized cost basis provided that the amortized cost determined approximates market value. Securities for which market quotations or evaluated prices are not readily available or are deemed by Janus Capital to be unreliable are valued at fair value determined in good faith under the Valuation Procedures. Circumstances in which fair value pricing may be utilized include, but are not limited to: (i) a significant event that may affect the securities of a single issuer, such as a merger, bankruptcy, or significant issuer-specific development; (ii) an event that may affect an entire market, such as a natural disaster or significant governmental action; (iii) a nonsignificant event such as a market closing early or not opening, or a security trading halt; and (iv) pricing of a nonvalued security and a restricted or nonpublic security. Special valuation considerations may apply with respect to “odd-lot” fixed-income transactions which, due to their small size, may receive evaluated prices by pricing services which reflect a large block trade and not what actually could be obtained for the odd-lot position.
| | |
| | Janus Detroit Street Trust ½ 17 |
Janus Henderson Small Cap Growth Alpha ETF
Notes to Financial Statements
Valuation Inputs Summary
FASB ASC 820, Fair Value Measurements and Disclosures (“ASC 820”), defines fair value, establishes a framework for measuring fair value, and expands disclosure requirements regarding fair value measurements. This standard emphasizes that fair value is a market-based measurement that should be determined based on the assumptions that market participants would use in pricing an asset or liability and establishes a hierarchy that prioritizes inputs to valuation techniques used to measure fair value. These inputs are summarized into three broad levels:
Level 1 – Unadjusted quoted prices in active markets the Fund has the ability to access for identical assets or liabilities.
Level 2 – Observable inputs other than unadjusted quoted prices included in Level 1 that are observable for the asset or liability either directly or indirectly. These inputs may include quoted prices for the identical instrument on an inactive market, prices for similar instruments, interest rates, prepayment speeds, credit risk, yield curves, default rates and similar data.
Assets or liabilities categorized as Level 2 in the hierarchy generally include: debt securities fair valued in accordance with the evaluated bid or ask prices supplied by a pricing service; securities traded on OTC markets and listed securities for which no sales are reported that are fair valued at the latest bid price (or yield equivalent thereof) obtained from one or more dealers transacting in a market for such securities or by a pricing service approved by the Fund’s Trustees; and certain short-term debt securities with maturities of 60 days or less that are fair valued at amortized cost. Other securities that may be categorized as Level 2 in the hierarchy include, but are not limited to, preferred stocks, bank loans, swaps, investments in unregistered investment companies, options, and forward contracts.
Level 3 – Unobservable inputs for the asset or liability to the extent that relevant observable inputs are not available, representing the Fund’s own assumptions about the assumptions that a market participant would use in valuing the asset or liability, and that would be based on the best information available.
There have been no significant changes in valuation techniques used in valuing any such positions held by the Fund since the beginning of the fiscal year.
The inputs or methodology used for fair valuing securities are not necessarily an indication of the risk associated with investing in those securities. The summary of inputs used as of October 31, 2018 to fair value the Fund’s investments in securities and other financial instruments is included in the “Valuation Inputs Summary” in the Notes to Schedule of Investments and Other Information.
There were no transfers between Level 1, Level 2 and Level 3 of the fair value hierarchy during the period. The Fund recognizes transfers between the levels as of the beginning of the fiscal year.
Investment Transactions and Investment Income
Investment transactions are accounted for as of the date purchased or sold (trade date). Dividend income is recorded on the ex-dividend date. Certain dividends from foreign securities will be recorded as soon as the Fund is informed of the dividend, if such information is obtained subsequent to the ex-dividend date. Dividends from foreign securities may be subject to withholding taxes in foreign jurisdictions. Gains and losses are determined on the identified cost basis, which is the same basis used for federal income tax purposes.
Estimates
The preparation of financial statements in conformity with accounting principles generally accepted in the United States of America requires management to make estimates and assumptions that affect the reported amount of assets and liabilities and disclosure of contingent assets and liabilities at the date of the financial statements, and the reported amounts of income and expenses during the reporting period. Actual results could differ from those estimates.
Indemnifications
In the normal course of business, the Fund may enter into contracts that contain provisions for indemnification of other parties against certain potential liabilities. The Fund’s maximum exposure under these arrangements is unknown, and would involve future claims that may be made against the Fund that have not yet occurred. Currently, the risk of material loss from such claims is considered remote.
Foreign Currency Translations
The Fund does not isolate that portion of the results of operations resulting from the effect of changes in foreign exchange rates on investments from the fluctuations arising from changes in market prices of securities held at the date
Janus Henderson Small Cap Growth Alpha ETF
Notes to Financial Statements
of the financial statements. Net unrealized appreciation or depreciation of investments and foreign currency translations arise from changes in the value of assets and liabilities, including investments in securities held at the date of the financial statements, resulting from changes in the exchange rates and changes in market prices of securities held.
Currency gains and losses are also calculated on payables and receivables that are denominated in foreign currencies. The payables and receivables are generally related to foreign security transactions and income translations.
Foreign currency-denominated assets and forward currency contracts may involve more risks than domestic transactions, including currency risk, counterparty risk, political and economic risk, regulatory risk and equity risk. Risks may arise from unanticipated movements in the value of foreign currencies relative to the U.S. dollar.
Dividends and Distributions
The Fund generally declares and distributes dividends of net investment income quarterly. Net realized capital gains (if any) are distributed annually. The Fund may treat a portion of the amount paid to redeem shares as a distribution of investment company taxable income and realized capital gains that are reflected in the NAV. This practice, commonly referred to as “equalization,” has no effect on the redeeming shareholder or a Fund’s total return, but may reduce the amounts that would otherwise be required to be paid as taxable dividends to the remaining shareholders. It is possible that the Internal Revenue Service (IRS) could challenge the Fund’s equalization methodology or calculations, and any such challenge could result in additional tax, interest, or penalties to be paid by the Fund.
The Fund may make certain investments in real estate investment trusts (“REITs”) which pay dividends to their shareholders based upon funds available from operations. It is quite common for these dividends to exceed the REITs’ taxable earnings and profits, resulting in the excess portion of such dividends being designated as a return of capital. If the Fund distributes such amounts, such distributions could constitute a return of capital to shareholders for federal income tax purposes.
Federal Income Taxes
The Fund intends to continue to qualify as a regulated investment company and distribute all of its taxable income in accordance with the requirements of Subchapter M of the Internal Revenue Code. Management has analyzed the Fund’s tax positions taken for all open federal income tax years, generally a three-year period, and has concluded that no provision for federal income tax is required in the Fund’s financial statements. The Fund is not aware of any tax positions for which it is reasonably possible that the total amounts of unrecognized tax benefits will significantly change in the next twelve months.
On December 22, 2017, the Tax Cuts and Jobs Act was signed into law. Currently, Management does not believe the bill will have a material impact on the Fund’s intention to continue to qualify as a regulated investment company, which is generally not subject to U.S. federal income tax.
2. Other Investments and Strategies
Additional Investment Risk
The financial crisis in both the U.S. and global economies over the past several years has resulted, and may continue to result, in a significant decline in the value and liquidity of many securities of issuers worldwide in the equity and fixed income/credit markets. In response to the crisis, the United States and certain foreign governments, along with the U.S. Federal Reserve and certain foreign central banks, took steps to support the financial markets. The withdrawal of this support, a failure of measures put in place to respond to the crisis, or investor perception that such efforts were not sufficient could each negatively affect financial markets generally, and the value and liquidity of specific securities. In addition, policy and legislative changes in the United States and in other countries continue to impact many aspects of financial regulation. The effect of these changes on the markets, and the practical implications for market participants, including the Fund, may not be fully known for some time and could limit or preclude the Fund’s ability to achieve its investment objective. Therefore, it is important to understand that the value of your investment may fall, sometimes sharply, and you could lose money.
The enactment of the Dodd-Frank Wall Street Reform and Consumer Protection Act (the “Dodd-Frank Act”) provided for widespread regulation of financial institutions, consumer financial products and services, broker-dealers, OTC derivatives, investment advisers, credit rating agencies, and mortgage lending, which expanded federal oversight in the financial sector, including the investment management industry. Certain provisions of the Dodd-Frank Act remain pending and will be implemented through future rulemaking. Therefore, the ultimate impact of the Dodd-Frank Act and the regulations under the Dodd-Frank Act on the Fund and the investment management industry as a whole, is not yet certain.
| | |
| | Janus Detroit Street Trust ½ 19 |
Janus Henderson Small Cap Growth Alpha ETF
Notes to Financial Statements
Counterparties
Fund transactions involving a counterparty are subject to the risk that the counterparty or a third party will not fulfill its obligation to the Fund (“counterparty risk”). Counterparty risk may arise because of the counterparty’s financial condition (i.e., financial difficulties, bankruptcy, or insolvency), market activities and developments, or other reasons, whether foreseen or not. A counterparty’s inability to fulfill its obligation may result in significant financial loss to the Fund. The Fund may be unable to recover its investment from the counterparty or may obtain a limited recovery, and/or recovery may be delayed. The extent of the Fund’s exposure to counterparty risk with respect to financial assets and liabilities approximates its carrying value. See the “Offsetting Assets and Liabilities” section of this Note for further details.
The Fund may be exposed to counterparty risk through participation in various programs, including, but not limited to, lending its securities to third parties, cash sweep arrangements whereby the Fund’s cash balance is invested in one or more types of cash management vehicles, as well as investments in, but not limited to, repurchase agreements, and derivatives, including various types of swaps, futures and options. The Fund intends to enter into financial transactions with counterparties that Janus Capital believes to be creditworthy at the time of the transaction. There is always the risk that Janus Capital’s analysis of a counterparty’s creditworthiness is incorrect or may change due to market conditions. To the extent that the Fund focuses its transactions with a limited number of counterparties, it will have greater exposure to the risks associated with one or more counterparties.
Offsetting Assets and Liabilities
The Fund presents gross and net information about transactions that are either offset in the financial statements or subject to an enforceable master netting arrangement or similar agreement with a designated counterparty, regardless of whether the transactions are actually offset in the Statement of Assets and Liabilities.
Deutsche Bank AG acts as securities lending agent and a limited purpose custodian or subcustodian to receive and disburse cash balances and cash collateral, hold short-term investments, hold collateral, and perform other custodian functions in accordance with the Agency Securities Lending and Repurchase Agreement. For financial reporting purposes, the Fund does not offset financial instruments’ payables and receivables and related collateral on the Statement of Assets and Liabilities. Securities on loan will be continuously secured by collateral which may consist of cash, U.S. Government securities, domestic and foreign short-term debt instruments, letters of credit, time deposits, repurchase agreements, money market mutual funds or other money market accounts, or such other collateral as permitted by the SEC. The value of the collateral must be at least 102% of the market value of the loaned securities that are denominated in U.S. dollars and 105% of the market value of the loaned securities that are not denominated in U.S. dollars. Upon receipt of cash collateral, Janus Capital intends to invest the cash collateral in a cash management vehicle for which Janus Capital serves as investment adviser, Janus Henderson Cash Collateral Fund LLC. Loaned securities and related collateral are marked-to-market each business day based upon the market value of the loaned securities at the close of business, employing the most recent available pricing information. Collateral levels are then adjusted based on this mark-to-market evaluation.
The following table presents gross amounts of recognized assets and/or liabilities and the net amounts after deducting collateral that has been pledged by counterparties or has been pledged to counterparties (if applicable). For corresponding information grouped by type of instrument, see the Fund’s Schedule of Investments.
Offsetting of Financial Assets and Derivative Assets
| | | | | | | | | | | | | | | | | | |
| Counterparty | | | Gross Amounts of Recognized Assets | | | Offsetting Asset or Liability(a) | | | Collateral
Pledged(b) | | | Net Amount | |
| | Deutsche Bank AG | | | $ | 1,566,630 | | | $ | — | | | $ | (1,566,630) | | | $ | — | |
| (a) | Represents the amount of assets or liabilities that could be offset with the same counterparty under master netting or similar agreements that management elects not to offset on the Statement of Assets and Liabilities. |
| (b) | Collateral pledged is limited to the net outstanding amount due to/from an individual counterparty. The actual collateral amounts pledged may exceed these amounts and may fluctuate in value. |
Real Estate Investing
The Fund may invest in equity securities of real estate-related companies to the extent such securities are included in the Underlying Index. Such companies may include those in the real estate industry or real estate-related industries. These securities may include common stocks, preferred stocks, and other equity securities, including, but not limited to, mortgage-backed securities, real estate-backed securities, securities of REITs and similar REIT-like entities. A REIT is a
Janus Henderson Small Cap Growth Alpha ETF
Notes to Financial Statements
trust that invests in real estate-related projects, such as properties, mortgage loans, and construction loans. REITs are generally categorized as equity, mortgage, or hybrid REITs. A REIT may be listed on an exchange or traded OTC.
Securities Lending
Under procedures adopted by the Trustees, the Fund may seek to earn additional income by lending securities to qualified parties. Deutsche Bank AG acts as securities lending agent and a limited purpose custodian or subcustodian to receive and disburse cash balances and cash collateral, hold short-term investments, hold collateral, and perform other custodian functions. The Fund may lend portfolio securities in an amount equal to up to 1/3 of its total assets as determined at the time of the loan origination. There is the risk of delay in recovering a loaned security or the risk of loss in collateral rights if the borrower fails financially. In addition, Janus Capital makes efforts to balance the benefits and risks from granting such loans. All loans will be continuously secured by collateral which may consist of cash, U.S. Government securities, domestic and foreign short-term debt instruments, letters of credit, time deposits, repurchase agreements, money market mutual funds or other money market accounts, or such other collateral as permitted by the SEC. If the Fund is unable to recover a security on loan, the Fund may use the collateral to purchase replacement securities in the market. There is a risk that the value of the collateral could decrease below the cost of the replacement security by the time the replacement investment is made, resulting in a loss to the Fund.
Upon receipt of cash collateral, Janus Capital may invest it in affiliated or non-affiliated cash management vehicles, whether registered or unregistered entities, as permitted by the 1940 Act and rules promulgated thereunder. Janus Capital currently intends to invest the cash collateral in a cash management vehicle for which Janus Capital serves as investment adviser, Janus Henderson Cash Collateral Fund LLC. An investment in Janus Henderson Cash Collateral Fund LLC is generally subject to the same risks that shareholders experience when investing in similarly structured vehicles, such as the potential for significant fluctuations in assets as a result of the purchase and redemption activity of the securities lending program, a decline in the value of the collateral, and possible liquidity issues. Such risks may delay the return of the cash collateral and cause the Fund to violate its agreement to return the cash collateral to a borrower in a timely manner. As adviser to the Fund and Janus Henderson Cash Collateral Fund LLC, Janus Capital has an inherent conflict of interest as a result of its fiduciary duties to both the Fund and Janus Henderson Cash Collateral Fund LLC. Additionally, Janus Capital receives an investment advisory fee of 0.05% for managing Janus Henderson Cash Collateral Fund LLC, but it may not receive a fee for managing certain other affiliated cash management vehicles in which the Fund may invest, and therefore may have an incentive to allocate preferred investment opportunities to investment vehicles for which it is receiving a fee.
The value of the collateral must be at least 102% of the market value of the loaned securities that are denominated in U.S. dollars and 105% of the market value of the loaned securities that are not denominated in U.S. dollars. Loaned securities and related collateral are marked-to-market each business day based upon the market value of the loaned securities at the close of business, employing the most recent available pricing information. Collateral levels are then adjusted based on this mark-to-market evaluation.
The cash collateral invested by Janus Capital is disclosed in the Schedule of Investments (if applicable). Income earned from the investment of the cash collateral, net of rebates paid to, or fees paid by, borrowers and less the fees paid to the lending agent are included as “Affiliated securities lending income, net” on the Statement of Operations. As of October 31, 2018, securities lending transactions accounted for as secured borrowings with an overnight and continuous contractual maturity are $1,566,630 for equity securities. Gross amounts of recognized liabilities for securities lending (collateral received) as of October 31, 2018 is $1,591,064, resulting in the net amount due to the counterparty of $24,434.
3. Investment Advisory Agreements and Other Transactions with Affiliates
Under its unitary fee structure, the Fund pays Janus Capital a management fee in return for providing certain investment advisory, supervisory, and administrative services to the Fund, including the costs of transfer agency, custody, fund administration, legal, audit, and other services. Janus Capital’s fee structure is designed to pay substantially all of the Fund’s expenses. However, the Fund bears other expenses which are not covered under the management fee which may vary and affect the total level of expenses paid by shareholders, such as distribution fees (if any), brokerage expenses or commissions, interest, dividends, taxes, litigation expenses, acquired fund fees and expenses (if any), and extraordinary expenses. The Fund’s management fee is calculated daily and paid monthly. For the fiscal year ended October 31, 2018, the Fund’s contractual management fee rate (expressed as an annual rate) was 0.50% of the Fund’s average daily net assets.
State Street Bank and Trust Company (“State Street”) provides certain fund administration services to the Fund, including services related to the Fund’s accounting, including calculating the daily NAV, audit, tax, and reporting obligations,
| | |
| | Janus Detroit Street Trust ½ 21 |
Janus Henderson Small Cap Growth Alpha ETF
Notes to Financial Statements
pursuant to an agreement with Janus Capital, on behalf of the Fund. As compensation for such services, Janus Capital pays State Street a fee based on a percentage of the Fund’s assets, with a minimum flat fee, for certain services. Janus Capital serves as administrator to the Fund, providing oversight and coordination of the Fund’s service providers, recordkeeping and other administrative services. Janus Capital does not receive any additional compensation, beyond the unitary fee, for serving as administrator. State Street also serves as transfer agent for the shares of the Fund.
Due to an administrative oversight by its administrator, the Fund’s Distribution and Servicing Plan, pursuant to Rule 12b-1 under the 1940 Act that was originally approved at the time of the Fund’s formation (“Initial Rule 12b-1 Plan”), could be viewed to have expired on or about February 11, 2017. The Initial Rule 12b-1 Plan was never implemented, and 12b-1 fees were not charged, prior to its potential expiration. At an in-person meeting held on July 18, 2018, the Fund’s Board of Trustees (“Board”) approved a new Rule 12b-1 Plan (the “Plan”) with respect to the Fund, with terms that are substantively identical to the Initial Rule 12b-1 Plan. Because the Fund has commenced operations, the Plan must also be approved by the Fund’s shareholders prior to implementation. At this time, Janus Capital does not intend to seek shareholder approval for implementation of the Plan. The Plan would permit compensation in connection with the distribution and marketing of Fund shares and/or the provision of certain shareholder services. The Plan would permit the Fund to pay ALPS Distributors, Inc. (the “Distributor”) or its designee, a fee for the sale and distribution and/or shareholder servicing of the shares at an annual rate of up to 0.25% of average daily net assets of the Fund. Under the terms of the Plan, the Trust would be authorized to make payments to the Distributor or its designee for remittance to retirement plan service providers, broker-dealers, bank trust departments, financial advisors, and other financial intermediaries, as compensation for distribution and/or shareholder services performed by such entities for their customers who are investors in the Fund. However, implementation of the Plan and imposition of the 12b-1 fee would require prior approval by Fund shareholders via proxy vote. Janus Capital does not anticipate seeking such approval at this time. Because 12b-1 fees are paid out of the fund assets on an ongoing basis, to the extent that such a fee is authorized by shareholders in the future, over time they will increase the cost of an investment in the Fund. If implemented, the Plan fee may cost an investor more than other types of sales charges.
As of October 31, 2018, Janus Capital owned 2,000 shares or 0.31% of the Fund.
The Fund is permitted to purchase or sell securities (“cross-trade”) between itself and other funds or accounts managed by Janus Capital in accordance with Rule 17a-7 under the Investment Company Act of 1940 (“Rule 17a-7”), when the transaction is consistent with the investment objectives and policies of the Fund and in accordance with the Internal Cross Trade Procedures adopted by the Trust’s Board of Trustees. These procedures have been designed to ensure that any cross-trade of securities by the Fund from or to another fund or account that is or could be considered an affiliate of the Fund under certain limited circumstances by virtue of having a common investment adviser, common Officer, or common Trustee complies with Rule 17a-7. Under these procedures, each cross-trade is effected at the current market price to save costs where allowed. During the year ended October 31, 2018, the Fund engaged in cross trades amounting to $290,785 in purchases and $1,133,070 in sales, resulting in a net realized gain of $36,471. The net realized gain is included within the “Net Realized Gain/(Loss) on Investments” section of the Fund’s Statement of Operations.
Any purchases and sales, realized gains/losses and recorded dividends from affiliated investments during the year ended October 31, 2018 can be found in a table located in the Schedule of Investments.
4. Federal Income Tax
The tax components of capital shown in the table below represent: (1) distribution requirements the Fund must satisfy under the income tax regulations; (2) losses or deductions the Fund may be able to offset against income and gains realized in future years; and (3) unrealized appreciation or depreciation of investments for federal income tax purposes.
Other book to tax differences primarily consist of derivatives, and foreign currency contract adjustments. The Fund has elected to treat gains and losses on forward foreign currency contracts as capital gains and losses, if applicable. Other foreign currency gains and losses on debt instruments are treated as ordinary income for federal income tax purposes pursuant to Section 988 of the Internal Revenue Code.
| | | | | | | | | | | | | | | | | | | | | | | | | | |
Undistributed
Ordinary Income | | | Undistributed
Long-Term Gains | | | Accumulated
Capital Losses | | | Late-Year
Ordinary Loss | | | Post-October
Capital Loss | | | Other Book to Tax Differences | | | Net Tax Appreciation/ (Depreciation) | |
| $ | 3,169 | | | $ | — | | | $ | (493,274) | | | $ | — | | | $ | — | | | $ | — | | | $ | (3,963,843) | |
Janus Henderson Small Cap Growth Alpha ETF
Notes to Financial Statements
Accumulated capital losses noted below represent net capital loss carryovers, as of October 31, 2018, that may be available to offset future realized capital gains and thereby reduce future taxable gains distributions. The following table shows these capital loss carryovers.
| | | | | | | | | | |
Capital Loss Carryover Schedule
For the year ended October 31, 2018
No Expiration | | | Accumulated Capital Losses | |
| Short-Term | | | Long-Term | |
| $ | (342,113) | | | $ | (151,161) | | | $ | (493,274) | |
The aggregate cost of investments and the composition of unrealized appreciation and depreciation of investment securities for federal income tax purposes as of October 31, 2018 are noted below. The primary differences between book and tax appreciation or depreciation of investments are wash sale loss deferrals and investments in partnerships.
| | | | | | | | | | | | | | |
| Federal Tax Cost | | | Unrealized Appreciation | | | Unrealized (Depreciation) | | | Net Tax Appreciation/
(Depreciation) | |
| $ | 31,391,004 | | | $ | 307,910 | | | $ | (4,271,753) | | | $ | (3,963,843) | |
Income and capital gains distributions are determined in accordance with income tax regulations that may differ from accounting principles generally accepted in the United States of America. These differences are due to differing treatments for items such as net short-term gains, deferral of wash sale losses, foreign currency transactions, passive foreign investment companies, net investment losses, in-kind transactions and capital loss carryovers. Certain permanent differences such as tax returns of capital and net investment losses noted below have been reclassified to capital.
| | | | | | | | | | | | | | |
| For the year ended October 31, 2018: | |
| Distributions | | | | |
| From Ordinary Income | | | From Long-Term Capital Gain | | | Tax Return of Capital | | | Net Investment Loss | |
| $ | 87,999 | | | $ | — | | | $ | — | | | $ | — | |
|
| For the year ended October 31, 2017: | |
| Distributions | | | | |
| From Ordinary Income | | | From Long-Term Capital Gain | | | Tax Return of Capital | | | Net Investment Loss | |
| $ | 46,606 | | | $ | — | | | $ | — | | | $ | — | |
Permanent book to tax basis differences may result in reclassifications between the components of net assets. These differences have no impact on the results of operations or net assets. The following reclassifications have been made to the Fund:
| | | | | | | | | | |
| Increase/(Decrease) to Capital | | | Increase/(Decrease) to Undistributed
Net Investment Income/Loss | | | Increase/(Decrease) to Undistributed
Net realized Gain/Loss | |
| $ | 2,907,499 | | | $ | (1,329) | | | $ | (2,906,170) | |
5. Capital Share Transactions
Janus Henderson Small Cap Growth Alpha ETF
| | | | | | | | | | | | | | | | |
| | | Year ended October 31, 2018 | | | Year ended October 31, 2017 | |
| | | Shares | | | Amount | | | Shares | | | Amount | |
| Shares sold | | | 950,000 | | | $ | 41,517,848 | | | | 200,000 | | | $ | 6,541,633 | |
| Shares repurchased | | | (550,000) | | | | (22,588,557) | | | | (100,000) | | | | (3,384,386) | |
Net Increase/(Decrease) | | | 400,000 | | | $ | 18,929,291 | | | | 100,000 | | | $ | 3,157,247 | |
| | |
| | Janus Detroit Street Trust ½ 23 |
Janus Henderson Small Cap Growth Alpha ETF
Notes to Financial Statements
6. Purchases and Sales of Investment Securities
For the year ended October 31, 2018, the aggregate cost of purchases and proceeds from sales of investment securities (excluding any short-term securities, short-term options contracts, and in-kind transactions) was as follows:
| | | | | | | | | | | | | | |
Purchases of Securities | | | Proceeds from Sales of Securities | | | Purchases of Long- Term U.S. Government Obligations | | | Proceeds from Sales of Long-Term U.S. Government Obligations | |
| $ | 14,790,703 | | | $ | 14,806,962 | | | $ | — | | | $ | — | |
For the year ended October 31, 2018, the cost of in-kind purchases and proceeds from in-kind sales, were as follows:
| | | | | | | | | | | | | | |
Purchases of Securities | | | Proceeds from Sales of Securities | | | Purchases of Long- Term U.S. Government Obligations | | | Proceeds from Sales of Long-Term U.S. Government Obligations | |
| $ | 41,494,942 | | | $ | 22,523,302 | | | $ | — | | | $ | — | |
During the year ended October 31, 2018, the Fund had net realized gain/(loss) of $3,205,090 from in-kind redemptions. Gains on in-kind transactions are not considered taxable for federal income tax purposes.
7. Recent Accounting Pronouncements
The Securities and Exchange Commission adopted amendments to Regulation S-X, for the presentation of distributable earnings and distributions to align with US Generally Accepted Accounting Principles (GAAP). The compliance date of the amendments to Regulation S-X is November 5, 2018. This report incorporates the amendments to Regulation S-X.
The FASB issued Accounting Standards Update No. 2017-08, Receivables – Nonrefundable Fees and Other Costs (Subtopic 310-20), Premium Amortization on Purchased Callable Debt Securities (“ASU 2017-08”) to amend the amortization period for certain purchased callable debt securities held at a premium. The guidance requires certain premiums on callable debt securities to be amortized to the earliest call date. The amortization period for callable debt securities purchased at a discount will not be impacted. The amendments are effective for fiscal years, and interim periods within those fiscal years, beginning after December 15, 2018. Early adoption is permitted, including adoption in an interim period. Management is currently evaluating the impacts of ASU 2017-08 on the Fund’s financial statements.
The FASB issued Accounting Standards Update 2018-13, Fair Value Measurement (Topic 820) in August 2018. The new guidance removes, modifies and enhances the disclosures to Topic 820. For public entities, the amendments are effective for financial statements issued for fiscal years beginning after December 15, 2019, and interim periods within those fiscal years. Management is currently evaluating the impact of this new guidance on the financial statements.
8. Subsequent Events
Management has evaluated whether any events or transactions occurred subsequent to October 31, 2018 and through the date of issuance of the Fund’s financial statements and determined that there were no material events or transactions that would require recognition or disclosure in the Fund’s financial statements other than the following:
The Fund’s Board of Trustees (“Board”) approved an amendment (“Amendment”) to the Investment Advisory and Management Agreement that provides for a new management fee rate schedule that reduces the annual management fee rate payable by the Fund to Janus Capital and also provides for further management fee rate reductions as assets grow. The new annual management fee rate schedule is effective November 1, 2018. A chart comparing the Fund’s historical management fee to the new management fee schedule (each expressed as an annual rate) is provided below.
| | | | | | |
| Historical | | New | |
| Average Daily Net Assets | | Daily Net Assets | |
| | $0-$500 million | | | 0.35% | |
| 0.50% | | Next $500 million | | | 0.28% | |
| | | Over $1 billion | | | 0.20% | |
Janus Henderson Small Cap Growth Alpha ETF
Additional Information (unaudited)
Proxy Voting Policies and Voting Record
A description of the policies and procedures that the Fund uses to determine how to vote proxies relating to its portfolio securities is available without charge: (i) upon request, by calling 1-800-525-0020 (toll free); (ii) on the Fund’s website at janushenderson.com/proxyvoting; and (iii) on the SEC’s website at http://www.sec.gov.
Designation Requirements (unaudited)
For federal income tax purposes, the Fund designated the following for the year ended October 31, 2018.
| | | | |
| Dividends Received Deduction Percentage | | | 84% | |
| Qualified Dividend Income Percentage | | | 83% | |
Quarterly Portfolio Holdings
The Fund files its complete portfolio holdings (schedule of investments) with the SEC for the first and third quarters of each fiscal year on Form N-Q within 60 days of the end of such fiscal quarter. The Fund’s Form N-Q: (i) is available on the SEC’s website at http://www.sec.gov; (ii) may be reviewed and copied at the SEC’s Public Reference Room in Washington, D.C. (information on the Public Reference Room may be obtained by calling 1-800-SEC-0330); and (iii) is available without charge, upon request, by calling Janus Henderson at 1-800-525-0020 (toll free).
Licensing Agreements
Janus Index & Calculation Services LLC (“Janus Index Services”) is the Index Provider for the Underlying Index. Janus Capital has entered into a license agreement with Janus Index Services to use the Underlying Index. Janus Index Services is affiliated with the Fund and Janus Capital. This affiliation may create potential conflicts for Janus Index Services as it may have an interest in the performance of the Fund, which could motivate it to alter the Underlying Index methodology for the Underlying Index. Janus Index Services has adopted procedures that it believes are reasonably designed to mitigate these and other potential conflicts.
Janus Index Services is the licensor of certain trademarks, service marks, and trade names. Neither Janus Index Services nor any of its affiliates make any representation or warranty, express or implied, to the owners of the Fund or any member of the public regarding the advisability of investing in securities generally or in the Fund particularly or the ability of the Underlying Index to track general market performance. The Underlying Index is determined, composed, and calculated by Janus Index Services without regard to Janus Capital or the Fund. Janus Index Services has no obligation to take the needs of Janus Capital or the owners of the Fund into consideration in determining, composing, or calculating the Underlying Index. Janus Index Services is not responsible for and has not participated in the determination of the timing of, prices at, or quantities of the Fund to be issued or in the determination or calculation of the equation by which the Fund is to be converted into cash.
ALTHOUGH JANUS INDEX SERVICES SHALL OBTAIN INFORMATION FOR INCLUSION IN OR FOR USE IN THE CALCULATION OF THE UNDERLYING INDEX FROM SOURCES WHICH IT CONSIDERS RELIABLE, IT DOES NOT GUARANTEE THE QUALITY, ACCURACY AND/OR THE COMPLETENESS OF THE UNDERLYING INDEX OR ANY DATA INCLUDED THEREIN AND SHALL HAVE NO LIABILITY FOR ERRORS OR OMISSIONS OF ANY KIND RELATED TO THE UNDERLYING INDEX OR DATA. JANUS INDEX SERVICES MAKES NO WARRANTY, EXPRESS OR IMPLIED, AS TO RESULTS TO BE OBTAINED BY JANUS CAPITAL, OWNERS OF THE FUND, OR ANY OTHER PERSON OR ENTITY FROM THE USE OF THE UNDERLYING INDEX OR ANY DATA INCLUDED THEREIN IN CONNECTION WITH THE RIGHTS LICENSED TO JANUS CAPITAL FOR ANY OTHER USE. JANUS INDEX SERVICES MAKES NO EXPRESS OR IMPLIED WARRANTIES, AND HEREBY EXPRESSLY DISCLAIMS ALL WARRANTIES OF MERCHANTABILITY OR FITNESS FOR A PARTICULAR PURPOSE OR USE WITH RESPECT TO THE UNDERLYING INDEX OR ANY DATA INCLUDED THEREIN. WITHOUT LIMITING ANY OF THE FOREGOING, IN NO EVENT SHALL IT HAVE ANY LIABILITY FOR ANY SPECIAL, PUNITIVE, INDIRECT, OR CONSEQUENTIAL DAMAGES (INCLUDING LOST PROFITS), EVEN IF NOTIFIED OF THE POSSIBILITY OF SUCH DAMAGES.
Janus Capital does not guarantee the accuracy and/or the completeness of the Underlying Index or any data included therein, and Janus Capital shall have no liability for any errors, omissions or interruptions therein. Janus Capital makes no warranty, express or implied, as to results to be obtained by the Fund, owners of the shares of the Fund or any other person or entity from the use of the Underlying Index or any data included therein. Janus Capital makes no express or implied warranties, and expressly disclaims all warranties of merchantability or fitness for a particular purpose or use with respect to the Underlying Index or any data included therein. Without limiting any of the foregoing, in no event shall Janus Capital have any liability for any special, punitive, direct, indirect or consequential damages (including lost profits) arising out of matters relating to the use of the Underlying Index even if notified of the possibility of such damages.
| | |
| | Janus Detroit Street Trust ½ 25 |
Janus Henderson Small Cap Growth Alpha ETF
Board Considerations Regarding Approval of Investment Advisory Agreements (unaudited)
APPROVAL OF AMENDMENT TO INVESTMENT ADVISORY AGREEMENT
At an in-person meeting held on October 9-10, 2018, the Trustees approved an amendment (“Amendment”) to the Investment Advisory and Management Agreement between the Trust and Janus Capital on behalf of Janus Henderson Small Cap Growth Alpha ETF, Janus Henderson Small/Mid Cap Growth Alpha ETF, The Long-Term Care ETF, The Obesity ETF, and The Organics ETF (each a “Fund” and, together, the “Funds”). The Amendment provided for a new management fee rate schedule that reduces the annual management fee rate payable by the Funds to Janus Capital and also provided for further management fee rate reductions as assets grow. A comparison of the prior and new unitary fee rate schedules (each expressed as an annual rate) is shown below.
| | | | | | |
| Current | | New | |
| Average Daily Net Assets | | Daily Net Assets | |
| | $0-$500 million | | | 0.35% | |
| 0.50% | | Next $500 million | | | 0.28% | |
| | | Over $1 billion | | | 0.20% | |
In connection with the Amendment approval, Janus Capital represented to the Trustees that there would be no change to the nature, quality and extent of services rendered by Janus Capital to the Fund. The Amendment is effective as of November 1, 2018.
Janus Henderson Small Cap Growth Alpha ETF
Trustees and Officers (unaudited)
The Fund’s Statement of Additional Information includes additional information about the Trustees and officers and is available, without charge, by calling 1-877-335-2687.
The following are the Trustees and officers of the Trust, together with a brief description of their principal occupations during the last five years (principal occupations for certain Trustees may include periods over five years).
Each Trustee has served in that capacity since he or she was originally elected or appointed. The Trustees do not serve a specified term of office. Each Trustee will hold office until the termination of the Trust or his or her earlier death, resignation, retirement, incapacity, or removal. Under the Fund’s Governance Procedures and Guidelines, the policy is for Trustees to retire no later than the end of the calendar year in which the Trustee turns 75. The Trustees review the Fund’s Governance Procedures and Guidelines from time to time and may make changes they deem appropriate. The Fund’s Nominating and Governance Committee will consider nominees for the position of Trustee recommended by shareholders. Shareholders may submit the name of a candidate for consideration by the Committee by submitting their recommendations to the Trust’s Secretary. Each Trustee is currently a Trustee of one other registered investment company advised by Janus Capital: Clayton Series Trust. Collectively, these two registered investment companies consist of 10 series or funds.
The Trust’s officers are elected annually by the Trustees for a one-year term. Certain officers also serve as officers of Clayton Series Trust. Certain officers of the Fund may also be officers and/or directors of Janus Capital. Fund officers receive no compensation from the Fund, except for the Fund’s Chief Compliance Officer, as authorized by the Trustees.
| | | | | | | | | | | | | | | | | | |
| TRUSTEES | | | | | | | | | | | | | | |
| Name, Address, and Age | | Positions Held with the Trust | | | Length of Time Served | | | Principal Occupations During the Past Five Years | | Number of Portfolios/Funds in Fund Complex Overseen by Trustee* | | | Other Directorships Held by Trustee During the Past Five Years | |
Independent Trustees | | | | | | | | | | | | | | | | | | |
Clifford J. Weber 151 Detroit Street Denver, CO 80206 DOB: 1963 | |
| Chairman
Trustee |
| |
| 2/16-Present
2/16-Present |
| | Owner, Financial Products Consulting Group LLC (consulting services to financial institutions) (since 2015). Formerly, Executive Vice President of Global Index and Exchange- Traded Products, NYSE Market, Inc., a subsidiary of Intercontinental Exchange (ETF/ETP listing exchange) (2013-2015) and Executive Vice President and Head of Strategy and Product Development, NYSE Liffe U.S., a division of NYSE Euronext (U.S. futures exchange) (2008-2013). | | | 10 | | |
| Independent Trustee, Clough
Funds Trust (investment company) (since 2015). Chairman, Clough Funds Trust (since 2017), Independent Trustee, Clough Dividend and Income Fund (closed-end fund) (since 2017), Independent
Trustee, Clough Global
Opportunities Fund
(closed-end fund)
(since 2017), Independent Trustee, Clough Global Equity Fund (closed-end fund) (since 2017), Independent Trustee, Elevation ETF Trust (investment company) (2016-2018) Chairman,
Elevation ETF Trust
(2016-2018), and Independent Trustee, Global X Funds (investment company) (since 2018). |
|
| | |
| | Janus Detroit Street Trust ½ 27 |
Janus Henderson Small Cap Growth Alpha ETF
Trustees and Officers (unaudited)
| | | | | | | | | | | | | | | | | | |
| TRUSTEES | | | | | | | | | | | | | | |
| Name, Address, and Age | | Positions Held with the Trust | | | Length of Time Served | | | Principal Occupations During the Past Five Years | | Number of Portfolios/Funds in Fund Complex Overseen by Trustee* | | | Other Directorships Held by Trustee During the Past Five Years | |
Maureen T. Upton 151 Detroit Street Denver, CO 80206 DOB: 1965 | | | Trustee | | | | 2/16-Present | | | Principal, Maureen Upton Ltd. (consulting services to developers of major infrastructure projects and investors) (since 2017). Formerly, Principal Consultant, SRK Consulting (U.S.), Inc. (consulting services to global mining, energy and water resource industries) (2015-2017) and Founder and Principal, Resource Initiatives LLC (sustainability consulting firm) (2006-2015). | | | 10 | | |
| Director, Denver Metro
Leadership Foundation (non-profit organization) (2012-2014). |
|
| | | | | |
Jeffrey B. Weeden 151 Detroit Street Denver, CO 80206 DOB: 1956 | | | Trustee | | | | 2/16-Present | | | Senior Advisor, BayBoston Capital LP (investment fund in finance companies, banks and bank holdings companies) (since 2015). Formerly, Management Advisor, BoxCast, Inc. (technology start-up company) (2014-2017) and Senior Executive Vice President and Chief Financial Officer, KeyCorp (financial services) (2002-2013). | | | 10 | | |
| Director, State Farm Bank
(banking) (since 2014). |
|
Interested Trustee | | | | | | | | | | | | | | | | | | |
Michael Drew Elder** 151 Detroit Street Denver, CO 80206 DOB: 1970 | | | Trustee | | | | 8/15-Present | | | Executive Vice President and Head of U.S. Intermediary Distribution, Janus Capital (since 2014) and President, Janus Distributors LLC (broker- dealer) (since 2014). Formerly, Senior Vice President, Janus Capital (2007-2014). | | | 10 | | |
| Director, Perkins Investment
Management LLC (since 2014). |
|
| * | In addition to the Trust, which is comprised of seven series, each Trustee also serves as a trustee to the Clayton Street Trust, which is an affiliated registered investment company currently comprised of three portfolios. |
| ** | Michael Drew Elder is an Interested Trustee because of his employment with Janus Capital. |
Janus Henderson Small Cap Growth Alpha ETF
Trustees and Officers (unaudited)
| | | | | | |
| OFFICERS | | | | | | |
| Name, Address, and Age | | Positions Held with the Trust | | Term of Office*and Length of Time Served | | Principal Occupations During the Past Five Years |
Bruce L. Koepfgen 151 Detroit Street Denver, CO 80206 DOB: 1952 | | President and Chief Executive Officer | | 2/16-Present | | Head of North America for Janus Henderson Investors and Janus Capital Management LLC (since 2017); Executive Vice President and Director of Janus International Holding LLC (since 2011); Executive Vice President of Janus Distributors LLC (since 2011); Executive Vice President and Working Director of INTECH Investment Management LLC (since 2011); Executive Vice President and Director of Perkins Investment Management LLC (since 2011); and Executive Vice President and Director of Janus Management Holdings Corporation (since 2011). Formerly, President of Janus Capital Group Inc. and Janus Capital Management LLC (2013-2017); Executive Vice President of Janus Services LLC (2011-2015), Janus Capital Group Inc. and Janus Capital Management LLC (2011-2013); and Chief Financial Officer of Janus Capital Group Inc., Janus Capital Management LLC, Janus Distributors LLC, Janus Management Holdings Corporation, and Janus Services LLC (2011-2013). |
| | | |
Susan K. Wold 151 Detroit Street Denver, CO 80206 DOB: 1960 | | Vice President, Chief Compliance Officer, and Anti-Money Laundering Officer | | 9/17-Present | | Senior Vice President and Head of Compliance North America for Janus Henderson (since September 2017); Formerly Vice President, Head of Global Corporate Compliance, and Chief Compliance Officer for Janus Capital Management LLC (May 2017-September 2017); Vice President, Compliance at Janus Capital Group and Janus Capital Management LLC (2005-2017). |
| | | |
Jesper Nergaard 151 Detroit Street Denver, CO 80206 DOB: 1962 | | Vice President, Chief Financial Officer, Treasurer, and Principal Accounting Officer | | 2/16-Present | | Vice President of Janus Capital and Janus Services LLC. |
| | | |
Byron Hittle 151 Detroit Street Denver, CO 80206 DOB: 1974 | | Vice President, Secretary and Chief Legal Officer | | 7/18-Present | | Vice President and Assistant General Counsel of Janus Capital and Janus Services LLC
(2017-present); Assistant Vice President and Senior Legal Counsel (2012-2016). |
| * | Officers are elected at least annually by the Trustees for a one-year term and may also be elected from time to time by the Trustees for an interim period. |
| | |
| | Janus Detroit Street Trust ½ 29 |
Knowledge. Shared
At Janus Henderson, we believe in the sharing of expert insight for better investment and business decisions. We call this ethos Knowledge. Shared.
Learn more by visiting janushenderson.com.
This report is submitted for the general information of shareholders of the Fund. It is not an offer or solicitation for the Fund and is not authorized for distribution to prospective investors unless preceded or accompanied by an effective prospectus.
Janus Henderson and Knowledge. Shared are trademarks of Janus Henderson Group plc or one of its subsidiary entities. © Janus Henderson Group plc.
Janus Capital Management LLC is the investment adviser and ALPS Distributors, Inc. is the distributor. ALPS is not affiliated with Janus Henderson or any of its subsidiaries.
ANNUAL REPORT
October 31, 2018
Janus Henderson Small/Mid Cap Growth Alpha ETF
Janus Detroit Street Trust

Table of Contents
Janus Henderson Small/Mid Cap Growth Alpha ETF (unaudited)
INVESTMENT OBJECTIVE
Janus Henderson Small/Mid Cap Growth Alpha ETF (JSMD) seeks investment results that correspond generally, before fees and expenses, to the performance of its underlying index, the Janus Small/Mid Cap Growth Alpha Index. It pursues its investment objective by using a passive index-based approach, normally investing at least 80% of its net assets in securities that comprise its underlying index.
PERFORMANCE OVERVIEW
| • | | U.S. small- and mid-cap equities were up for the period, but were volatile. The anticipation that corporate tax reform would help boost future earnings for smaller-cap companies helped drive returns into January. However, concerns over inflation and faster-than-expected interest rate hikes created volatility, as did fears about protectionist trade policies. The market was led by a narrow subset of consumer Internet, medical technology and Software as a Service companies. Many of these stocks trade at extremely high valuations or are yet to produce earnings. Consumer staples, technology and health care were the top-performing sectors within the Russell 2500TM Growth Index, while materials and energy lagged. |
| • | | During the period, JSMD returned 11.37% (based on NAV); its primary benchmark, the Janus Small/Mid Cap Growth Alpha Index, returned 11.81%, and its secondary benchmark, the Russell 2500 Growth Index, returned 5.52%. |
| • | | JSMD seeks investment results that correspond generally, before fees and expenses, to the performance of its primary benchmark. The strategy seeks to provide risk-adjusted outperformance by identifying top-tier small- and mid-cap companies with some of the strongest fundamentals that the advisor believes can deliver sustainable growth in a variety of market environments. |
| | |
| | Janus Detroit Street Trust ½ 1 |
Janus Henderson Small/Mid Cap Growth Alpha ETF (unaudited)
Fund At A Glance
October 31, 2018
| | | | |
| 5 Largest Equity Holdings – (% of Net Assets) | |
Veeva Systems, Inc. – Class A | | | | |
Health Care Technology | | | 2.7% | |
Westlake Chemical Corp. | | | | |
Chemicals | | | 2.1% | |
West Pharmaceutical Services, Inc. | | | | |
Health Care Equipment & Supplies | | | 1.9% | |
ICON PLC | | | | |
Life Sciences Tools & Services | | | 1.8% | |
Rollins, Inc. | | | | |
Commercial Services & Supplies | | | 1.8% | |
| | | | |
| | | 10.3% | |
| | | | |
| Sector Allocation – (% of Net Assets) | |
Consumer, Non-cyclical | | | 26.8% | |
Consumer, Cyclical | | | 17.2% | |
Industrial | | | 15.7% | |
Technology | | | 15.4% | |
Financial | | | 10.5% | |
Communications Services | | | 10.4% | |
Basic Materials | | | 3.3% | |
Investment Company Securities | | | 1.8% | |
Energy | | | 0.6% | |
| | | | |
| | | 101.7% | |
Holdings are subject to change without notice.
Janus Henderson Small/Mid Cap Growth Alpha ETF (unaudited)
Performance
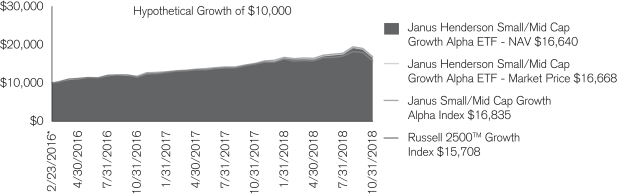
| | | | |
| Average Annual Total Return for the periods ended October 31, 2018 |
| | | One Year | | Since
Inception* |
Janus Henderson Small/Mid Cap Growth Alpha ETF – NAV | | 11.37% | | 20.86% |
Janus Henderson Small/Mid Cap Growth Alpha ETF – Market Price | | 11.44% | | 20.94% |
Janus Small/Mid Cap Growth Alpha Index | | 11.81% | | 21.39% |
Russell 2500TM Growth Index | | 5.52% | | 18.30% |
Total annual expense ratio as stated in the February 28, 2018 prospectus: 0.50%.
Returns quoted are past performance and do not guarantee future results; current performance may be lower or higher. Investment returns and principal value will vary; there may be a gain or loss when shares are sold. For the most recent month-end performance call 800.668.0434 or visit janushenderson.com/performance.
Shares of ETFs are bought and sold at market price (not NAV) and are not individually redeemed from the Fund. Market returns are based upon the midpoint of the bid/ask spread at 4:00 p.m. Eastern time (when NAV is normally determined for most ETFs), and do not represent the returns you would receive if you traded shares at other times. Ordinary brokerage commissions apply and will reduce returns.
ETF shares are not individually redeemable and owners of the shares may acquire those shares from the Fund and tender those shares for redemption to the Fund in Creation Units only.
Investing involves risk, including the possible loss of principal and fluctuation of value.
Performance depends on that of the underlying index.
See the prospectus for a more complete discussion of objectives, risks and expenses.
Returns include reinvestment of dividends and capital gains. Returns greater than one year are annualized. Returns do not reflect the deduction of taxes that a shareholder would pay on Fund distributions or redemptions of Fund shares.
See Financial Highlights for actual expense ratios during the reporting period.
There is no assurance the stated objective(s) will be met.
See Notes to Schedule of Investments and Other Information for index definitions
Index performance does not reflect the expenses of managing a portfolio as an index is unmanaged and not available for direct investment.
The index provider is Janus Index and Calculation Services LLC (“Janus Index”). Janus Index maintains the indices and calculates the index levels and performance shown or discussed, but does not manage actual assets. Janus index receives compensation in connection with licensing its indices to third parties including the provision of any related data.
| * | The Fund commenced operations on February 23, 2016. |
| | |
| | Janus Detroit Street Trust ½ 3 |
Janus Henderson Small/Mid Cap Growth Alpha ETF (unaudited)
Disclosure of Fund Expenses
As a shareholder of the Fund, you incur two types of costs: (1) transaction costs, which may include creation and redemption fees or brokerage charges and (2) ongoing costs, including management fees and other Fund expenses. This example is intended to help you understand your ongoing costs (in dollars) of investing in the Fund and to compare these costs with the ongoing costs of investing in other ETFs. To do so, compare this 5% hypothetical example with the 5% hypothetical examples that appear in the shareholder reports of the other funds. The example is based upon an investment of $1,000 invested at the beginning of the period and held for the six-months indicated, unless noted otherwise in the table and footnotes below.
Actual Expenses
The information in the table under the heading “Actual” provides information about actual account values and actual expenses. You may use the information in these columns, together with the amount you invested, to estimate the expenses that you paid over the period. Simply divide your account value by $1,000 (for example, an $8,600 account value divided by $1,000 = 8.6), then multiply the result by the number under the heading entitled “Expenses Paid During Period” to estimate the expenses you paid on your account during the period.
Hypothetical Example for Comparison Purposes
The information in the table under the heading “Hypothetical (5% return before expenses)” provides information about hypothetical account values and hypothetical expenses based upon the Fund’s actual expense ratio and an assumed rate of return of 5% per year before expenses, which is not the Fund’s actual return. The hypothetical account values and expenses may not be used to determine the actual ending account balance or expenses you paid for the period. You may use this information to compare the ongoing costs of investing in the Fund and other funds. To do so, compare this 5% hypothetical example with the 5% hypothetical examples that appear in the shareholder reports of the other funds. Additionally, for an analysis of the fees associated with an investment or other similar funds, please visit www.finra.org/fundanalyzer.
Please note that the expenses shown in the table are meant to highlight your ongoing costs only and do not reflect any transaction costs, such as creation and redemption fees, or brokerage charges. These fees are fully described in the Fund’s prospectus. Therefore, the hypothetical examples are useful in comparing ongoing costs only, and will not help you determine the relative total costs of owning different funds. In addition, if these transaction costs were included, your costs would have been higher.
| | | | | | | | | | | | | | | | | | | | | | | | |
Actual | | | Hypothetical
(5% return before expenses) | | | | |
Beginning
Account
Value
(5/1/18) | | Ending
Account
Value
(10/31/2018) | | | Expenses
Paid During
Period
(5/1/18 - 10/31/2018)† | | | Beginning
Account
Value
(5/1/18) | | | Ending
Account
Value
(10/31/2018) | | | Expenses
Paid During
Period
(5/1/18 - 10/31/2018)† | | | Net Annualized
Expense Ratio
(5/1/18 - 10/31/2018) | |
| $1,000.00 | | $ | 1,027.00 | | | $ | 2.55 | | | $ | 1,000.00 | | | $ | 1,022.68 | | | $ | 2.55 | | | | 0.50% | |
| † | Expenses Paid During Period is equal to the Net Annualized Expense Ratio multiplied by the average account value over the period, multiplied by 184/365 (to reflect the one-half year period). |
Janus Henderson Small/Mid Cap Growth Alpha ETF
Report of Independent Registered Public Accounting Firm
To the Board of Trustees of Janus Detroit Street Trust and Shareholders of Janus Henderson Small/Mid Cap Growth Alpha ETF:
Opinion on the Financial Statements
We have audited the accompanying statement of assets and liabilities, including the schedule of investments, of Janus Henderson Small/Mid Cap Growth Alpha ETF (one of the funds constituting Janus Detroit Street Trust, referred to hereafter as the “Fund”) as of October 31, 2018, the related statement of operations for the year ended October 31, 2018, the statements of changes in net assets for each of the two years in the period ended October 31, 2018, including the related notes, and the financial highlights for each of the two years in the period ended October 31, 2018 and for the period February 23, 2016 (commencement date) through October 31, 2016 (collectively referred to as the “financial statements”). In our opinion, the financial statements present fairly, in all material respects, the financial position of the Fund as of October 31, 2018, the results of its operations for the year then ended, the changes in its net assets for each of the two years in the period ended October 31, 2018 and the financial highlights for each of the two years in the period ended October 31, 2018 and for the period February 23, 2016 (commencement date) through October 31, 2016 in conformity with accounting principles generally accepted in the United States of America.
Basis for Opinion
These financial statements are the responsibility of the Fund’s management. Our responsibility is to express an opinion on the Fund’s financial statements based on our audits. We are a public accounting firm registered with the Public Company Accounting Oversight Board (United States) (“PCAOB”) and are required to be independent with respect to the Fund in accordance with the U.S. federal securities laws and the applicable rules and regulations of the Securities and Exchange Commission and the PCAOB.
We conducted our audits of these financial statements in accordance with the standards of the PCAOB. Those standards require that we plan and perform the audit to obtain reasonable assurance about whether the financial statements are free of material misstatement, whether due to error or fraud.
Our audits included performing procedures to assess the risks of material misstatement of the financial statements, whether due to error or fraud, and performing procedures that respond to those risks. Such procedures included examining, on a test basis, evidence regarding the amounts and disclosures in the financial statements. Our audits also included evaluating the accounting principles used and significant estimates made by management, as well as evaluating the overall presentation of the financial statements. Our procedures included confirmation of securities owned as of October 31, 2018 by correspondence with the custodian and transfer agent. We believe that our audits provide a reasonable basis for our opinion.

Denver, Colorado
December 20, 2018
We have served as the auditor of one or more investment companies in Janus Henderson Funds since 1990.
| | |
| | Janus Detroit Street Trust ½ 5 |
Janus Henderson Small/Mid Cap Growth Alpha ETF
Schedule of Investments
October 31, 2018
| | | | | | | | |
| | | Shares | | | Value | |
| Common Stocks – 99.9% | | | | | | |
| Aerospace & Defense – 1.4% | | | | | | |
HEICO Corp. | | | 8,482 | | | | $711,046 | |
| Airlines – 2.8% | | | | | | |
Alaska Air Group, Inc. | | | 8,807 | | | | 540,926 | |
Allegiant Travel Co. | | | 1,156 | | | | 131,946 | |
Hawaiian Holdings, Inc. | | | 3,629 | | | | 125,600 | |
JetBlue Airways Corp.* | | | 22,376 | | | | 374,350 | |
Spirit Airlines, Inc.* | | | 4,881 | | | | 253,324 | |
| | | | | | | | |
| | | | | | | 1,426,146 | |
| Auto Components – 1.5% | | | | | | |
American Axle & Manufacturing Holdings, Inc.* | | | 5,596 | | | | 84,891 | |
Dorman Products, Inc.* | | | 1,662 | | | | 131,315 | |
Fox Factory Holding Corp.* | | | 1,895 | | | | 101,819 | |
Gentex Corp. | | | 13,478 | | | | 283,712 | |
Gentherm, Inc.* | | | 1,827 | | | | 79,730 | |
LCI Industries | | | 1,263 | | | | 87,589 | |
| | | | | | | | |
| | | | | | | 769,056 | |
| Automobiles – 0.4% | | | | | | |
Thor Industries, Inc. | | | 2,640 | | | | 183,850 | |
Winnebago Industries, Inc. | | | 1,579 | | | | 43,517 | |
| | | | | | | | |
| | | | | | | 227,367 | |
| Beverages – 0.4% | | | | | | |
National Beverage Corp.* | | | 2,461 | | | | 227,519 | |
| Biotechnology – 2.1% | | | | | | |
BioSpecifics Technologies Corp.* | | | 899 | | | | 55,082 | |
Ligand Pharmaceuticals, Inc.* | | | 2,602 | | | | 428,836 | |
United Therapeutics Corp.* | | | 5,369 | | | | 595,207 | |
| | | | | | | | |
| | | | | | | 1,079,125 | |
| Building Products – 3.1% | | | | | | |
American Woodmark Corp.* | | | 1,255 | | | | 75,852 | |
Builders FirstSource, Inc.* | | | 8,205 | | | | 101,578 | |
Continental Building Products, Inc.* | | | 2,645 | | | | 73,558 | |
Lennox International, Inc. | | | 2,879 | | | | 607,152 | |
Patrick Industries, Inc.* | | | 1,755 | | | | 76,360 | |
PGT Innovations, Inc.* | | | 3,629 | | | | 73,524 | |
Simpson Manufacturing Co., Inc. | | | 3,314 | | | | 189,163 | |
Trex Co., Inc.* | | | 4,201 | | | | 257,521 | |
Universal Forest Products, Inc. | | | 4,408 | | | | 124,614 | |
| | | | | | | | |
| | | | | | | 1,579,322 | |
| Capital Markets – 1.8% | | | | | | |
Cohen & Steers, Inc. | | | 2,405 | | | | 92,328 | |
Diamond Hill Investment Group, Inc. | | | 181 | | | | 31,165 | |
Evercore, Inc. - Class A | | | 2,107 | | | | 172,121 | |
Hamilton Lane, Inc. - Class A | | | 1,188 | | | | 45,595 | |
Houlihan Lokey, Inc. | | | 1,762 | | | | 72,559 | |
MarketAxess Holdings, Inc. | | | 1,933 | | | | 405,292 | |
Moelis & Co. - Class A | | | 2,350 | | | | 94,846 | |
| | | | | | | | |
| | | | | | | 913,906 | |
| Chemicals – 3.0% | | | | | | |
Balchem Corp. | | | 3,684 | | | | 345,007 | |
Chase Corp. | | | 1,075 | | | | 115,928 | |
Westlake Chemical Corp. | | | 14,831 | | | | 1,057,450 | |
| | | | | | | | |
| | | | | | | 1,518,385 | |
| Commercial Banks – 2.8% | | | | | | |
Ameris Bancorp | | | 2,445 | | | | 104,866 | |
Bank of Princeton* | | | 342 | | | | 9,662 | |
Bank OZK | | | 6,616 | | | | 181,014 | |
See Notes to Schedule of Investments and Other Information and Notes to Financial Statements.
Janus Henderson Small/Mid Cap Growth Alpha ETF
Schedule of Investments
October 31, 2018
| | | | | | | | |
| | | Shares | | | Value | |
| Common Stocks – (continued) | | | | | | |
| Commercial Banks – (continued) | | | | | | |
Bankwell Financial Group, Inc. | | | 403 | | | | $ 12,219 | |
Byline Bancorp, Inc.* | | | 1,862 | | | | 40,964 | |
Eagle Bancorp, Inc.* | | | 1,764 | | | | 86,736 | |
Equity Bancshares, Inc. - Class A* | | | 811 | | | | 29,269 | |
FB Financial Corp. | | | 1,578 | | | | 57,565 | |
First Foundation, Inc.* | | | 2,284 | | | | 37,024 | |
Franklin Financial Network, Inc.* | | | 745 | | | | 25,255 | |
Hilltop Holdings, Inc. | | | 4,864 | | | | 96,794 | |
Independent Bank Group, Inc. | | | 1,568 | | | | 90,803 | |
Live Oak Bancshares, Inc. | | | 1,825 | | | | 33,580 | |
Metropolitan Bank Holding Corp.* | | | 422 | | | | 15,555 | |
National Commerce Corp.* | | | 1,060 | | | | 39,326 | |
Nicolet Bankshares, Inc.* | | | 497 | | | | 26,540 | |
People’s Utah Bancorp | | | 962 | | | | 32,237 | |
Preferred Bank | | | 789 | | | | 40,562 | |
RBB Bancorp | | | 851 | | | | 18,365 | |
Seacoast Banking Corp. of Florida* | | | 2,427 | | | | 63,854 | |
ServisFirst Bancshares, Inc. | | | 2,734 | | | | 98,369 | |
TriState Capital Holdings, Inc.* | | | 1,488 | | | | 37,527 | |
Western Alliance Bancorp* | | | 5,445 | | | | 262,667 | |
| | | | | | | | |
| | | | | | | 1,440,753 | |
| Commercial Services & Supplies – 3.4% | | | | | | |
Healthcare Services Group, Inc. | | | 5,274 | | | | 214,072 | |
KAR Auction Services, Inc. | | | 9,608 | | | | 547,079 | |
Rollins, Inc. | | | 15,604 | | | | 923,757 | |
Viad Corp. | | | 1,454 | | | | 69,632 | |
| | | | | | | | |
| | | | | | | 1,754,540 | |
| Communications Equipment – 3.0% | | | | | | |
Acacia Communications, Inc.* | | | 3,488 | | | | 120,231 | |
Applied Optoelectronics, Inc.* | | | 1,470 | | | | 28,856 | |
Casa Systems, Inc.* | | | 7,426 | | | | 106,935 | |
Ciena Corp.* | | | 12,286 | | | | 384,061 | |
Lumentum Holdings, Inc.* | | | 5,402 | | | | 295,219 | |
Ubiquiti Networks, Inc.# | | | 6,366 | | | | 592,611 | |
| | | | | | | | |
| | | | | | | 1,527,913 | |
| Construction & Engineering – 0.3% | | | | | | |
Argan, Inc. | | | 1,113 | | | | 48,994 | |
Construction Partners, Inc. - Class A* | | | 854 | | | | 7,720 | |
NV5 Global, Inc.* | | | 900 | | | | 70,263 | |
| | | | | | | | |
| | | | | | | 126,977 | |
| Construction Materials – 0.8% | | | | | | |
Eagle Materials, Inc. | | | 5,466 | | | | 403,609 | |
Consumer Finance – 0.8% | | | | | | | | |
Credit Acceptance Corp.* | | | 994 | | | | 421,874 | |
Distributors – 0.6% | | | | | | | | |
Pool Corp. | | | 2,023 | | | | 294,852 | |
Diversified Consumer Services – 1.3% | | | | | | | | |
Bright Horizons Family Solutions, Inc.* | | | 2,935 | | | | 337,261 | |
Grand Canyon Education, Inc.* | | | 2,415 | | | | 301,150 | |
| | | | | | | | |
| | | | | | | 638,411 | |
| Diversified Financial Services – 0.2% | | | | | | |
FGL Holdings* | | | 11,026 | | | | 87,105 | |
| Electrical Equipment – 0.8% | | | | | | |
Acuity Brands, Inc. | | | 2,874 | | | | 361,089 | |
TPI Composites, Inc.* | | | 2,461 | | | | 62,165 | |
| | | | | | | | |
| | | | | | | 423,254 | |
See Notes to Schedule of Investments and Other Information and Notes to Financial Statements.
| | |
| | Janus Detroit Street Trust ½ 7 |
Janus Henderson Small/Mid Cap Growth Alpha ETF
Schedule of Investments
October 31, 2018
| | | | | | | | |
| | | Shares | | | Value | |
| Common Stocks – (continued) | | | | | | |
| Electronic Equipment & Instruments – 3.3% | | | | | | |
Coherent, Inc.* | | | 2,090 | | | | $ 257,362 | |
Control4 Corp.* | | | 2,245 | | | | 62,680 | |
IPG Photonics Corp.* | | | 4,625 | | | | 617,669 | |
Littelfuse, Inc. | | | 2,157 | | | | 390,762 | |
Methode Electronics, Inc. | | | 3,181 | | | | 94,158 | |
SYNNEX Corp. | | | 3,408 | | | | 264,495 | |
| | | | | | | | |
| | | | | | | 1,687,126 | |
| Energy Equipment & Services – 0.3% | | | | | | |
Cactus, Inc. - Class A* | | | 1,887 | | | | 63,139 | |
Liberty Oilfield Services, Inc. - Class A | | | 3,508 | | | | 66,582 | |
Smart Sand, Inc.* | | | 2,085 | | | | 5,775 | |
| | | | | | | | |
| | | | | | | 135,496 | |
| Equity Real Estate Investment Trusts (REITs) – 1.9% | | | | | | |
CareTrust, Inc. | | | 1,093 | | | | 19,302 | |
CoreSite Realty Corp. | | | 465 | | | | 43,645 | |
CubeSmart | | | 2,509 | | | | 72,711 | |
Easterly Government Properties, Inc. | | | 816 | | | | 14,827 | |
Four Corners Property Trust, Inc. | | | 902 | | | | 23,524 | |
Gaming and Leisure Properties, Inc. | | | 2,884 | | | | 97,162 | |
Healthcare Trust of America, Inc. - Class A | | | 2,802 | | | | 73,580 | |
Hudson Pacific Properties, Inc. | | | 2,114 | | | | 64,054 | |
Independence Realty Trust, Inc. | | | 1,183 | | | | 11,724 | |
Jernigan Capital, Inc. | | | 261 | | | | 5,108 | |
Kilroy Realty Corp. | | | 1,426 | | | | 98,223 | |
Lamar Advertising Co. - Class A | | | 1,143 | | | | 83,805 | |
National Storage Affiliates Trust | | | 761 | | | | 20,265 | |
Park Hotels & Resorts, Inc. | | | 2,716 | | | | 78,954 | |
Retail Opportunity Investments Corp. | | | 1,522 | | | | 26,772 | |
STORE Capital Corp. | | | 2,776 | | | | 80,587 | |
Summit Hotel Properties, Inc. | | | 1,412 | | | | 16,266 | |
Sun Communities, Inc. | | | 1,095 | | | | 110,015 | |
Terreno Realty Corp. | | | 788 | | | | 29,495 | |
| | | | | | | | |
| | | | | | | 970,019 | |
| Food & Staples Retailing – 0.7% | | | | | | |
Performance Food Group Co.* | | | 5,530 | | | | 162,140 | |
Sprouts Farmers Market, Inc.* | | | 6,710 | | | | 180,432 | |
| | | | | | | | |
| | | | | | | 342,572 | |
| Food Products – 1.1% | | | | | | |
B&G Foods, Inc. | | | 3,483 | | | | 90,697 | |
Calavo Growers, Inc. | | | 927 | | | | 89,919 | |
Hostess Brands, Inc.* | | | 5,277 | | | | 54,881 | |
Pilgrim’s Pride Corp.* | | | 13,147 | | | | 232,176 | |
Sanderson Farms, Inc. | | | 1,205 | | | | 118,560 | |
| | | | | | | | |
| | | | | | | 586,233 | |
| Health Care Equipment & Supplies – 7.6% | | | | | | |
Anika Therapeutics, Inc.* | | | 1,798 | | | | 64,297 | |
Cantel Medical Corp. | | | 5,141 | | | | 406,910 | |
Glaukos Corp.* | | | 4,346 | | | | 251,807 | |
Inogen, Inc.* | | | 2,632 | | | | 498,948 | |
LeMaitre Vascular, Inc. | | | 2,399 | | | | 64,053 | |
Masimo Corp.* | | | 6,432 | | | | 743,539 | |
Neogen Corp.* | | | 6,389 | | | | 387,940 | |
NuVasive, Inc.* | | | 6,338 | | | | 356,006 | |
Tactile Systems Technology, Inc.* | | | 2,259 | | | | 147,919 | |
West Pharmaceutical Services, Inc. | | | 9,064 | | | | 960,059 | |
| | | | | | | | |
| | | | | | | 3,881,478 | |
See Notes to Schedule of Investments and Other Information and Notes to Financial Statements.
Janus Henderson Small/Mid Cap Growth Alpha ETF
Schedule of Investments
October 31, 2018
| | | | | | | | |
| | | Shares | | | Value | |
| Common Stocks – (continued) | | | | | | |
| Health Care Providers & Services – 2.2% | | | | | | |
AMN Healthcare Services, Inc.* | | | 5,854 | | | | $ 296,329 | |
HealthEquity, Inc.* | | | 7,647 | | | | 701,995 | |
National Research Corp. - Class A | | | 3,050 | | | | 116,053 | |
| | | | | | | | |
| | | | | | | 1,114,377 | |
| Health Care Technology – 4.4% | | | | | | |
athenahealth, Inc.* | | | 4,992 | | | | 636,680 | |
Simulations Plus, Inc. | | | 2,140 | | | | 43,249 | |
Tabula Rasa HealthCare, Inc.* | | | 2,496 | | | | 184,405 | |
Veeva Systems, Inc. - Class A* | | | 14,867 | | | | 1,358,100 | |
| | | | | | | | |
| | | | | | | 2,222,434 | |
| Hotels, Restaurants & Leisure – 1.9% | | | | | | |
Chuy’s Holdings, Inc.* | | | 849 | | | | 20,690 | |
Dave & Buster’s Entertainment, Inc. | | | 1,973 | | | | 117,492 | |
Dunkin’ Brands Group, Inc. | | | 4,198 | | | | 304,607 | |
Hilton Grand Vacations, Inc.* | | | 4,855 | | | | 130,454 | |
Papa John’s International, Inc.# | | | 1,583 | | | | 86,337 | |
Texas Roadhouse, Inc. | | | 3,581 | | | | 216,507 | |
Wingstop, Inc. | | | 1,468 | | | | 91,926 | |
| | | | | | | | |
| | | | | | | 968,013 | |
| Household Durables – 1.6% | | | | | | |
Cavco Industries, Inc.* | | | 453 | | | | 90,876 | |
Century Communities, Inc.* | | | 1,509 | | | | 32,021 | |
Hooker Furniture Corp. | | | 590 | | | | 17,269 | |
Installed Building Products, Inc.* | | | 1,583 | | | | 48,218 | |
iRobot Corp.* | | | 1,373 | | | | 121,057 | |
LGI Homes, Inc.* | | | 1,134 | | | | 48,524 | |
M/I Homes, Inc.* | | | 1,432 | | | | 34,612 | |
PulteGroup, Inc. | | | 14,231 | | | | 349,656 | |
TopBuild Corp.* | | | 1,785 | | | | 81,432 | |
| | | | | | | | |
| | | | | | | 823,665 | |
| Insurance – 2.0% | | | | | | |
Athene Holding, Ltd. - Class A* | | | 8,473 | | | | 387,385 | |
Brown & Brown, Inc. | | | 14,366 | | | | 404,834 | |
Goosehead Insurance, Inc. - Class A* | | | 696 | | | | 23,859 | |
Health Insurance Innovations, Inc. - Class A* | | | 732 | | | | 35,795 | |
Investors Title Co. | | | 97 | | | | 17,654 | |
Kingstone Companies, Inc. | | | 548 | | | | 9,316 | |
Kinsale Capital Group, Inc. | | | 1,089 | | | | 65,024 | |
NI Holdings, Inc.* | | | 1,150 | | | | 17,986 | |
Universal Insurance Holdings, Inc. | | | 1,795 | | | | 75,354 | |
| | | | | | | | |
| | | | | | | 1,037,207 | |
| Interactive Media & Services – 2.2% | | | | | | |
Cargurus, Inc.* | | | 7,636 | | | | 339,191 | |
Cars.com, Inc.* | | | 5,998 | | | | 156,608 | |
Match Group, Inc.* | | | 5,761 | | | | 297,959 | |
Yelp, Inc.* | | | 7,197 | | | | 308,175 | |
| | | | | | | | |
| | | | | | | 1,101,933 | |
| Internet & Catalog Retail – 3.3% | | | | | | |
Duluth Holdings, Inc. - Class B * | | | 1,463 | | | | 44,958 | |
Etsy, Inc.* | | | 10,301 | | | | 437,998 | |
GrubHub, Inc.* | | | 7,782 | | | | 721,703 | |
Liberty Expedia Holdings, Inc. - Class A* | | | 2,874 | | | | 124,789 | |
Nutrisystem, Inc. | | | 1,476 | | | | 52,487 | |
Stamps.com, Inc.* | | | 1,561 | | | | 315,587 | |
| | | | | | | | |
| | | | | | | 1,697,522 | |
See Notes to Schedule of Investments and Other Information and Notes to Financial Statements.
| | |
| | Janus Detroit Street Trust ½ 9 |
Janus Henderson Small/Mid Cap Growth Alpha ETF
Schedule of Investments
October 31, 2018
| | | | | | | | |
| | | Shares | | | Value | |
| Common Stocks – (continued) | | | | | | |
| IT Services – 3.0% | | | | | | |
EPAM Systems, Inc.* | | | 4,627 | | | | $ 552,788 | |
Euronet Worldwide, Inc.* | | | 4,388 | | | | 487,858 | |
Hackett Group, Inc. | | | 2,534 | | | | 51,871 | |
MAXIMUS, Inc. | | | 5,526 | | | | 359,024 | |
NIC, Inc. | | | 5,725 | | | | 76,200 | |
| | | | | | | | |
| | | | | | | 1,527,741 | |
| Leisure Equipment & Products – 0.6% | | | | | | |
Brunswick Corp. | | | 4,345 | | | | 225,896 | |
Malibu Boats, Inc. - Class A* | | | 1,028 | | | | 41,326 | |
Marine Products Corp. | | | 1,731 | | | | 35,260 | |
MCBC Holdings, Inc.* | | | 935 | | | | 27,751 | |
| | | | | | | | |
| | | | | | | 330,233 | |
| Life Sciences Tools & Services – 3.7% | | | | | | |
Cambrex Corp.* | | | 4,100 | | | | 218,489 | |
ICON PLC* | | | 6,696 | | | | 924,584 | |
PRA Health Sciences, Inc.* | | | 7,934 | | | | 768,566 | |
| | | | | | | | |
| | | | | | | 1,911,639 | |
| Machinery – 4.9% | | | | | | |
Graco, Inc. | | | 11,955 | | | | 485,732 | |
John Bean Technologies Corp. | | | 2,260 | | | | 234,972 | |
Lydall, Inc.* | | | 1,243 | | | | 37,128 | |
Middleby Corp.* | | | 3,985 | | | | 447,516 | |
Omega Flex, Inc. | | | 722 | | | | 43,681 | |
Proto Labs, Inc.* | | | 1,933 | | | | 230,897 | |
Snap-On, Inc. | | | 4,034 | | | | 620,994 | |
Toro Co. | | | 7,524 | | | | 423,827 | |
| | | | | | | | |
| | | | | | | 2,524,747 | |
| Media – 1.1% | | | | | | |
AMC Networks, Inc. - Class A* | | | 2,278 | | | | 133,445 | |
Cable One, Inc. | | | 285 | | | | 255,286 | |
Entravision Communications Corp. - Class A | | | 3,235 | | | | 15,981 | |
Nexstar Media Group, Inc. - Class A | | | 2,283 | | | | 170,974 | |
| | | | | | | | |
| | | | | | | 575,686 | |
| Metals & Mining – 0.3% | | | | | | |
Warrior Met Coal, Inc. | | | 6,038 | | | | 169,064 | |
| Mortgate Real Estate Investment Trusts (REITs) – 0.6% | | | | | | |
Cherry Hill Mortgage Investment Corp. | | | 813 | | | | 14,561 | |
New Residential Investment Corp. | | | 17,502 | | | | 312,936 | |
| | | | | | | | |
| | | | | | | 327,497 | |
| Multiline Retail – 0.6% | | | | | | |
Ollie’s Bargain Outlet Holdings, Inc.* | | | 3,125 | | | | 290,313 | |
| Oil, Gas & Consumable Fuels – 0.0% | | | | | | |
Alta Mesa Resources, Inc. - Class A* | | | 3,794 | | | | 11,951 | |
| Pharmaceuticals – 0.7% | | | | | | |
Phibro Animal Health Corp. - Class A | | | 2,480 | | | | 106,442 | |
Prestige Consumer Healthcare, Inc.* | | | 6,376 | | | | 230,556 | |
| | | | | | | | |
| | | | | | | 336,998 | |
| Professional Services – 2.0% | | | | | | |
ASGN, Inc.* | | | 3,744 | | | | 251,148 | |
BG Staffing, Inc. | | | 722 | | | | 18,656 | |
Insperity, Inc. | | | 2,999 | | | | 329,440 | |
Korn/Ferry International | | | 4,108 | | | | 185,435 | |
TriNet Group, Inc.* | | | 5,046 | | | | 237,112 | |
Willdan Group, Inc.* | | | 637 | | | | 19,237 | |
| | | | | | | | |
| | | | | | | 1,041,028 | |
See Notes to Schedule of Investments and Other Information and Notes to Financial Statements.
Janus Henderson Small/Mid Cap Growth Alpha ETF
Schedule of Investments
October 31, 2018
| | | | | | | | |
| | | Shares | | | Value | |
| Common Stocks – (continued) | | | | | | |
| Real Estate Management & Development – 0.1% | | | | | | |
Consolidated-Tomoka Land Co. | | | 75 | | | | $ 4,344 | |
HFF, Inc. - Class A | | | 528 | | | | 19,404 | |
RMR Group, Inc. - Class A | | | 204 | | | | 15,480 | |
| | | | | | | | |
| | | | | | | 39,228 | |
| Road & Rail – 1.3% | | | | | | |
Knight-Swift Transportation Holdings, Inc. | | | 12,738 | | | | 407,616 | |
Saia, Inc.* | | | 1,837 | | | | 115,474 | |
Schneider National, Inc. - Class B | | | 6,720 | | | | 146,966 | |
| | | | | | | | |
| | | | | | | 670,056 | |
| Semiconductors & Semiconductor Equipment – 3.7% | | | | | | |
Advanced Energy Industries, Inc.* | | | 3,364 | | | | 144,753 | |
FormFactor, Inc.* | | | 6,354 | | | | 77,773 | |
Ichor Holdings, Ltd.* | | | 2,096 | | | | 37,204 | |
MKS Instruments, Inc. | | | 4,712 | | | | 347,227 | |
Monolithic Power Systems, Inc. | | | 3,639 | | | | 429,839 | |
Ultra Clean Holdings, Inc.* | | | 3,350 | | | | 35,242 | |
Universal Display Corp.# | | | 4,051 | | | | 498,313 | |
Versum Materials, Inc. | | | 9,371 | | | | 295,749 | |
| | | | | | | | |
| | | | | | | 1,866,100 | |
| Software – 7.5% | | | | | | |
Avalara, Inc.* | | | 5,717 | | | | 191,634 | |
Blackbaud, Inc. | | | 4,179 | | | | 299,718 | |
Ebix, Inc. | | | 2,708 | | | | 155,196 | |
Globant SA* | | | 3,087 | | | | 158,919 | |
Hortonworks, Inc.* | | | 6,997 | | | | 124,966 | |
LogMeIn, Inc. | | | 4,462 | | | | 384,267 | |
Manhattan Associates, Inc.* | | | 5,657 | | | | 270,065 | |
Paycom Software, Inc.* | | | 5,042 | | | | 631,258 | |
Paylocity Holding Corp.* | | | 4,538 | | | | 298,555 | |
Qualys, Inc.* | | | 3,355 | | | | 239,010 | |
Trade Desk, Inc. - Class A* | | | 3,045 | | | | 376,210 | |
Tyler Technologies, Inc.* | | | 3,325 | | | | 703,770 | |
| | | | | | | | |
| | | | | | | 3,833,568 | |
| Specialty Retail – 3.8% | | | | | | |
Boot Barn Holdings, Inc.* | | | 1,402 | | | | 34,602 | |
Burlington Stores, Inc.* | | | 3,384 | | | | 580,322 | |
Camping World Holdings, Inc. - Class A# | | | 1,854 | | | | 31,796 | |
Five Below, Inc.* | | | 2,787 | | | | 317,216 | |
Floor & Decor Holdings, Inc. - Class A* | | | 3,371 | | | | 86,230 | |
Lithia Motors, Inc. - Class A | | | 1,162 | | | | 103,511 | |
MarineMax, Inc.* | | | 1,128 | | | | 25,673 | |
Penske Automotive Group, Inc. | | | 4,252 | | | | 188,704 | |
Tractor Supply Co. | | | 6,104 | | | | 560,897 | |
| | | | | | | | |
| | | | | | | 1,928,951 | |
| Textiles, Apparel & Luxury Goods – 0.4% | | | | | | |
Skechers U.S.A., Inc. - Class A* | | | 6,769 | | | | 193,390 | |
Superior Group of Companies, Inc. | | | 767 | | | | 13,338 | |
| | | | | | | | |
| | | | | | | 206,728 | |
| Thrifts & Mortgage Finance – 1.1% | | | | | | |
Axos Financial, Inc.* | | | 3,229 | | | | 98,032 | |
Bridgewater Bancshares, Inc.* | | | 1,401 | | | | 15,551 | |
Essent Group, Ltd.* | | | 5,047 | | | | 198,953 | |
FS Bancorp, Inc. | | | 191 | | | | 8,622 | |
Greene County Bancorp, Inc. | | | 439 | | | | 14,079 | |
Merchants Bancorp | | | 1,476 | | | | 33,948 | |
NMI Holdings, Inc. - Class A* | | | 3,382 | | | | 71,495 | |
Sterling Bancorp, Inc. | | | 2,727 | | | | 28,224 | |
See Notes to Schedule of Investments and Other Information and Notes to Financial Statements.
| | |
| | Janus Detroit Street Trust ½ 11 |
Janus Henderson Small/Mid Cap Growth Alpha ETF
Schedule of Investments
October 31, 2018
| | | | | | | | |
| | | Shares | | | Value | |
| Common Stocks – (continued) | | | | | | |
| Thrifts & Mortgage Finance – (continued) | | | | | | |
Walker & Dunlop, Inc. | | | 1,608 | | | | $ 67,472 | |
| | | | | | | | |
| | | | | | | 536,376 | |
| Trading Companies & Distributors – 1.5% | | | | | | |
BMC Stock Holdings, Inc.* | | | 4,814 | | | | 80,586 | |
EnviroStar, Inc. | | | 799 | | | | 33,198 | |
Foundation Building Materials, Inc.* | | | 3,068 | | | | 29,238 | |
GMS, Inc.* | | | 2,942 | | | | 48,367 | |
SiteOne Landscape Supply, Inc.* | | | 2,899 | | | | 197,248 | |
Watsco, Inc. | | | 2,671 | | | | 395,789 | |
| | | | | | | | |
| | | | | | | | 784,426 | |
Total Common Stocks (cost $53,191,322) | | | | | | | 51,051,565 | |
| Investment Companies – 1.8% | | | | | | |
| Investments Purchased with Cash Collateral from Securities Lending – 1.7% | | | | | | |
Janus Cash Collateral Fund LLC, 2.1443%¥,£ | | | 847,850 | | | | 847,850 | |
| Money Markets – 0.1% | | | | | | |
State Street Institutional U.S. Government Money Market Fund, 2.0900%¥ | | | 60,506 | | | | 60,506 | |
Total Investment Companies (total cost $908,356) – 1.8% | | | | | | | 908,356 | |
Total Investments (total cost $54,099,678) – 101.7% | | | | | | | 51,959,921 | |
Liabilities, net of Cash, Receivables and Other Assets – (1.7%) | | | | | | | (860,981) | |
Net Assets – 100% | | | | | | | $51,098,940 | |
Summary of Investments by Country – (Long Positions) (unaudited)
| | | | | | | | |
| Country | | Value | | | % of
Investment
Securities | |
United States | | | $50,876,418 | | | | 97.9% | |
Ireland | | | 924,584 | | | | 1.8 | |
Argentina | | | 158,919 | | | | 0.3 | |
Total | | | $51,959,921 | | | | 100.0% | |
Schedules of Affiliated Investments – (% of Net Assets)
| | | | | | | | | | | | | | | | |
| | | Dividend Income | | | Realized
Gain/(Loss) | | | Change in
Unrealized
Appreciation/
(Depreciation) | | | Value at
10/31/18 | |
| Investment Companies – 1.7% | | | | | | | | | | | | |
| Investments Purchased with Cash Collateral from Securities Lending – 1.7% | | | | | | | |
Janus Henderson Cash Collateral Fund LLC, 2.1443%¥ | | | $60,298 | D | | | $ — | | | | $ — | | | | $847,850 | |
| | | | |
| | | Share Balance
at 10/31/17 | | | Purchases | | | Sales | | | Share Balance
at 10/31/18 | |
| Investment Companies – 1.7% | | | | | | | | | | | | |
| Investments Purchased with Cash Collateral from Securities Lending – 1.7% | | | | | | | |
Janus Henderson Cash Collateral Fund LLC, 2.1443%¥ | | | 1,290,848 | | | | 15,262,919 | | | | (15,705,917) | | | | 847,850 | |
See Notes to Schedule of Investments and Other Information and Notes to Financial Statements.
Janus Henderson Small/Mid Cap Growth Alpha ETF
Notes to Schedule of Investments and Other Information
| | |
Janus Small/Mid Cap
Growth Alpha Index | | Janus Small/Mid Cap Growth Alpha Index is designed to systematically identify small- and mid-capitalization stocks that are poised for sustainable growth (Smart Growth®) by evaluating each company’s performance in three critical areas: growth, profitability, and capital efficiency. A proprietary methodology is used to score stocks based on a wide range fundamental measures and selects the top 10% (“top-tier”) of such eligible stocks. Stocks are market cap-weighted within sectors with a 3% maximum position size; sectors are weighted to align with the Janus Henderson Triton Fund. |
| |
Russell 2500™
Growth Index | | Russell 2500™ Growth Index reflects the performance of U.S. small to mid-cap equities with higher price-to-book ratios and higher forecasted growth values. |
| |
| LLC | | Limited Liability Company |
| |
| PLC | | Public Limited Company |
| * | Non-income producing security. |
| # | Loaned security; a portion of the security is on loan at October 31, 2018. |
| ¥ | Rate reflects 7 day yield as of October 31, 2018. |
| £ | The Fund may invest in certain securities that are considered affiliated companies. As defined by the Investment Company Act of 1940, as amended, an affiliated company is one in which the Fund owns 5% or more of the outstanding voting securities, or a company which is under common ownership or control. |
| D | Net of income paid to the securities lending agent and rebates paid to the borrowing counterparties. |
The following is a summary of the inputs that were used to value the Fund’s investments in securities and other financial instruments as of October 31, 2018. See Notes to Financial Statements for more information.
Valuation Inputs Summary
| | | | | | | | | | | | |
| | | Level 1 -
Quoted Prices | | | Level 2 -
Other Significant
Observable Inputs | | | Level 3 -
Significant
Unobservable Inputs | |
Assets | | | | | | | | | | | | |
Investments in Securities: | | | | | | | | | | | | |
Common Stocks | | $ | 51,051,565 | | | $ | — | | | $ | — | |
Investment Companies | | | 60,506 | | | | 847,850 | | | | — | |
| | | | |
Total Assets | | $ | 51,112,071 | | | $ | 847,850 | | | $ | — | |
| | |
| | Janus Detroit Street Trust ½ 13 |
Janus Henderson Small/Mid Cap Growth Alpha ETF
Statement of Assets and Liabilities
October 31, 2018
| | | | |
Assets: | | | | |
Unaffiliated investments, at value(1)(2) | | $ | 51,112,071 | |
Affiliated investments, at value(3) | | | 847,850 | |
Receivables: | | | | |
Dividends | | | 7,461 | |
Affiliated securities lending income, net | | | 1,642 | |
Total Assets | | | 51,969,024 | |
Liabilities: | | | | |
Collateral on securities loaned (Note 2) | | | 847,850 | |
Payables: | | | | |
Management fees | | | 22,234 | |
Total Liabilities | | | 870,084 | |
Net Assets | | $ | 51,098,940 | |
Net Assets Consists of: | | | | |
Capital (par value and paid-in surplus) | | $ | 53,286,255 | |
Total distributable earnings (loss) | | | (2,187,315) | |
Total Net Assets | | $ | 51,098,940 | |
Net Assets | | $ | 51,098,940 | |
Shares outstanding, $0.001 Par Value (unlimited shares authorized) | | | 1,252,000 | |
Net Asset Value Per Share | | $ | 40.81 | |
| (1) | Includes cost of $53,251,828. |
| (2) | Includes $829,826 of securities on loan. See Note 2 in Notes to Financial Statements. |
| (3) | Includes cost of $847,850. |
See Notes to Financial Statements.
Janus Henderson Small/Mid Cap Growth Alpha ETF
Statement of Operations
For the year ended October 31, 2018
| | | | |
Investment Income: | | | | |
Dividends | | $ | 252,905 | |
Affiliated securities lending income, net | | | 60,298 | |
Total Investment Income | | | 313,203 | |
Expenses: | | | | |
Management Fees | | | 180,864 | |
Total Expenses | | | 180,864 | |
Net Investment Income/(Loss) | | | 132,339 | |
Net Realized Gain/(Loss) on Investments: | | | | |
Investments and foreign currency transactions | | | 5,775,355 | |
Total Net Realized Gain/(Loss) on Investments | | | 5,775,355 | |
Change in Unrealized Net Appreciation/Depreciation: | | | | |
Investments and foreign currency translations | | | (4,563,367) | |
Total Change in Unrealized Net Appreciation/Depreciation | | | (4,563,367) | |
Net Increase/(Decrease) in Net Assets Resulting from Operations | | $ | 1,344,327 | |
See Notes to Financial Statements.
| | |
| | Janus Detroit Street Trust ½ 15 |
Janus Henderson Small/Mid Cap Growth Alpha ETF
Statements of Changes in Net Assets
| | | | | | | | |
| | | Year Ended
October 31, 2018 | | | Year Ended
October 31, 2017 | |
Operations: | | | | | | | | |
Net investment income/(loss) | | $ | 132,339 | | | $ | 51,070 | |
Net realized gain/(loss) on investments | | | 5,775,355 | | | | 1,182,193 | |
Change in unrealized net appreciation/depreciation | | | (4,563,367) | | | | 2,633,801 | |
Net Increase/(Decrease) in Net Assets Resulting from Operations | | | 1,344,327 | | | | 3,867,064 | |
Dividends and Distributions to Shareholders: | | | | | | | | |
Dividends and Distributions | | | (119,256) | | | | N/A | |
Dividends from Net Investment Income(1) | | | N/A | | | | (65,865) | |
Net Decrease from Dividends and Distributions to Shareholders | | | (119,256) | | | | (65,865) | |
Capital Share Transactions | | | 27,735,957 | | | | 8,190,682 | |
Net Increase/(Decrease) in Net Assets | | | 28,961,028 | | | | 11,991,881 | |
Net Assets: | | | | | | | | |
Beginning of period | | | 22,137,912 | | | | 10,146,031 | |
End of period(2) | | $ | 51,098,940 | | | $ | 22,137,912 | |
| 1) | The requirement to disclose dividends and distributions paid to shareholders from net investment income and/or net realized gain from investment transactions was eliminated by the U.S. Securities and Exchange Commission (“SEC”) in 2018. |
| (2) | Net assets – End of period includes undistributed (overdistributed) net investment income of $8,663 as of October 31, 2017. The requirement to disclose undistributed (overdistributed) net investment income was eliminated by the SEC in 2018. |
See Notes to Financial Statements.
Janus Henderson Small/Mid Cap Growth Alpha ETF
Financial Highlights
| | | | | | | | | | | | | | |
| For a share outstanding during each year or period ended October 31 | | 2018 | | | 2017 | | | 2016(1) | |
| | Net Asset Value, Beginning of Period | | | $36.77 | | | | $28.82 | | | | $24.75 | |
| | Income/(Loss) from Investment Operations: | | | | | | | | | | | | |
| | Net investment income/(loss)(2) | | | 0.15 | | | | 0.10 | | | | 0.18 | |
| | Net realized and unrealized gain/(loss) | | | 4.03 | | | | 7.99 | | | | 3.93 | |
| | Total from Investment Operations | | | 4.18 | | | | 8.09 | | | | 4.11 | |
| | Less Dividends and Distributions: | | | | | | | | | | | | |
| | Dividends (from net investment income) | | | (0.14) | | | | (0.14) | | | | (0.04) | |
| | Total Dividends and Distributions | | | (0.14) | | | | (0.14) | | | | (0.04) | |
| | Net Asset Value, End of Period | | | $40.81 | | | | $36.77 | | | | $28.82 | |
| | Total Return* | | | 11.37% | | | | 28.14% | | | | 16.60% | |
| | Net assets, End of Period (in thousands) | | | $51,099 | | | | $22,138 | | | | $10,146 | |
| | Average Net Assets for the Period (in thousands) | | | $36,173 | | | | $16,594 | | | | $5,482 | |
| | Ratios to Average Net Assets**: | | | | | | | | | | | | |
| | Ratio of Gross Expenses | | | 0.50% | | | | 0.50% | | | | 0.50% | |
| | Ratio of Net Investment Income/(Loss) | | | 0.37% | | | | 0.31% | | | | 0.93% | |
| | Portfolio Turnover Rate(3) | | | 79% | | | | 76% | | | | 65% | |
| * | Total return not annualized for periods of less than one full year. |
| ** | Annualized for periods of less than one full year. |
| (1) | Period from February 23, 2016 (commencement of operations) through October 31, 2016. |
| (2) | Per share amounts are calculated based on average shares outstanding during the year or period. |
| (3) | Portfolio turnover rate excludes securities received or delivered from in-kind processing of creation or redemptions. |
See Notes to Financial Statements.
| | |
| | Janus Detroit Street Trust ½ 17 |
Janus Henderson Small/Mid Cap Growth Alpha ETF
Notes to Financial Statements
1. Organization and Significant Accounting Policies
Janus Henderson Small/Mid Cap Growth Alpha ETF (the “Fund”) is a series fund. The Fund is part of Janus Detroit Street Trust (the “Trust”), which is organized as a Delaware statutory trust and is registered under the Investment Company Act of 1940, as amended (the “1940 Act”), as an open-end management investment company, and therefore has applied the specialized accounting and reporting guidance in Financial Accounting Standards Board (“FASB”) Accounting Standards Codification (“ASC”) Topic 946. The Trust offers seven Funds each of which represent shares of beneficial interest in a separate portfolio of securities and other assets with its own objective and policies. The Fund seeks investment results that correspond generally, before fees and expenses, to the performance of its underlying index, the Janus Small/Mid Cap Growth Alpha Index (the “Underlying Index”). The Fund is classified as diversified, as defined in the 1940 Act.
Unlike shares of traditional mutual funds, shares of the Fund are not individually redeemable and may only be purchased or redeemed directly from the Fund at net asset value (“NAV”) in large increments called “Creation Units” (25,000 or more shares per Creation Unit) through certain participants, known as “Authorized Participants.” The Fund will issue or redeem Creation Units in exchange for portfolio securities and/or cash. Except when aggregated in Creation Units, Fund shares are not redeemable securities of the Fund. Shares of the Fund are listed and trade on The NASDAQ Stock Market LLC (“NASDAQ”) and individual investors can purchase or sell shares in much smaller increments and for cash in the secondary market through a broker. These transactions, which do not involve the Fund, are made at market prices that may vary throughout the day and differ from the Fund’s NAV. As a result, you may pay more than NAV (a premium) when you purchase shares, and receive less than NAV (a discount) when you sell shares, in the secondary market.
An Authorized Participant may hold of record more than 25% of the outstanding shares of the Fund. From time to time, Authorized Participants may be a beneficial and/or legal owner of the Fund, may be affiliated with an index provider, may be deemed to have control of the Fund and/or may be able to affect the outcome of matters presented for a vote of the shareholders of the Fund. Authorized Participants may execute an irrevocable proxy granting the Distributor or an affiliate of Janus Capital Management LLC (“Janus Capital” or “Janus”) power to vote or abstain from voting such Authorized Participant’s beneficially or legally owned shares of the Fund. In such cases, the agent shall mirror vote (or abstain from voting) such shares in the same proportion as all other beneficial owners of the Fund.
The following accounting policies have been followed by the Fund and are in conformity with accounting principles generally accepted in the United States of America.
Investment Valuation
Securities held by the Fund are valued in accordance with policies and procedures established by and under the supervision of the Trustees (the “Valuation Procedures”). Equity securities, including shares of exchange-traded funds, traded on a domestic securities exchange are generally valued at the closing prices on the primary market or exchange on which they trade. If such price is lacking for the trading period immediately preceding the time of determination, such securities are valued at their current bid price. Equity securities that are traded on a foreign exchange are generally valued at the closing prices on such markets. In the event that there is no current trading volume on a particular security in such foreign exchange, the bid price from the primary exchange is generally used to value the security. Securities that are traded on the over-the-counter (“OTC”) markets are generally valued at their closing or latest bid prices as available. Foreign securities and currencies are converted to U.S. dollars using the applicable exchange rate in effect at the close of the New York Stock Exchange (“NYSE”). The Fund will determine the market value of individual securities held by it by using prices provided by one or more approved professional pricing services or, as needed, by obtaining market quotations from independent broker-dealers. Most debt securities are valued in accordance with the evaluated bid price supplied by the pricing service that is intended to reflect market value. The evaluated bid price supplied by the pricing service is an evaluation that may consider factors such as security prices, yields, maturities and ratings. Certain short-term securities maturing within 60 days or less may be evaluated and valued on an amortized cost basis provided that the amortized cost determined approximates market value. Securities for which market quotations or evaluated prices are not readily available or are deemed by Janus Capital to be unreliable are valued at fair value determined in good faith under the Valuation Procedures. Circumstances in which fair value pricing may be utilized include, but are not limited to: (i) a significant event that may affect the securities of a single issuer, such as a merger, bankruptcy, or significant issuer-specific development; (ii) an event that may affect an entire market, such as a natural disaster or significant governmental action; (iii) a nonsignificant event such as a market closing early or not opening, or a security trading halt; and (iv) pricing of a nonvalued security and a restricted or nonpublic security. Special valuation considerations may apply with respect to “odd-lot” fixed-income transactions which, due to their small size, may receive evaluated prices by pricing services which reflect a large block trade and not what actually could be obtained for the odd-lot position.
Janus Henderson Small/Mid Cap Growth Alpha ETF
Notes to Financial Statements
Valuation Inputs Summary
FASB ASC 820, Fair Value Measurements and Disclosures (“ASC 820”), defines fair value, establishes a framework for measuring fair value, and expands disclosure requirements regarding fair value measurements. This standard emphasizes that fair value is a market-based measurement that should be determined based on the assumptions that market participants would use in pricing an asset or liability and establishes a hierarchy that prioritizes inputs to valuation techniques used to measure fair value. These inputs are summarized into three broad levels:
Level 1 – Unadjusted quoted prices in active markets the Fund has the ability to access for identical assets or liabilities.
Level 2 – Observable inputs other than unadjusted quoted prices included in Level 1 that are observable for the asset or liability either directly or indirectly. These inputs may include quoted prices for the identical instrument on an inactive market, prices for similar instruments, interest rates, prepayment speeds, credit risk, yield curves, default rates and similar data.
Assets or liabilities categorized as Level 2 in the hierarchy generally include: debt securities fair valued in accordance with the evaluated bid or ask prices supplied by a pricing service; securities traded on OTC markets and listed securities for which no sales are reported that are fair valued at the latest bid price (or yield equivalent thereof) obtained from one or more dealers transacting in a market for such securities or by a pricing service approved by the Fund’s Trustees; and certain short-term debt securities with maturities of 60 days or less that are fair valued at amortized cost. Other securities that may be categorized as Level 2 in the hierarchy include, but are not limited to, preferred stocks, bank loans, swaps, investments in unregistered investment companies, options, and forward contracts.
Level 3 – Unobservable inputs for the asset or liability to the extent that relevant observable inputs are not available, representing the Fund’s own assumptions about the assumptions that a market participant would use in valuing the asset or liability, and that would be based on the best information available.
There have been no significant changes in valuation techniques used in valuing any such positions held by the Fund since the beginning of the fiscal year.
The inputs or methodology used for fair valuing securities are not necessarily an indication of the risk associated with investing in those securities. The summary of inputs used as of October 31, 2018 to fair value the Fund’s investments in securities and other financial instruments is included in the “Valuation Inputs Summary” in the Notes to Schedule of Investments and Other Information.
There were no transfers between Level 1, Level 2 and Level 3 of the fair value hierarchy during the period. The Fund recognizes transfers between the levels as of the beginning of the fiscal year.
Investment Transactions and Investment Income
Investment transactions are accounted for as of the date purchased or sold (trade date). Dividend income is recorded on the ex-dividend date. Certain dividends from foreign securities will be recorded as soon as the Fund is informed of the dividend, if such information is obtained subsequent to the ex-dividend date. Dividends from foreign securities may be subject to withholding taxes in foreign jurisdictions. Gains and losses are determined on the identified cost basis, which is the same basis used for federal income tax purposes.
Estimates
The preparation of financial statements in conformity with accounting principles generally accepted in the United States of America requires management to make estimates and assumptions that affect the reported amount of assets and liabilities and disclosure of contingent assets and liabilities at the date of the financial statements and the reported amounts of income and expenses during the reporting period. Actual results could differ from those estimates.
Indemnifications
In the normal course of business, the Fund may enter into contracts that contain provisions for indemnification of other parties against certain potential liabilities. The Fund’s maximum exposure under these arrangements is unknown, and would involve future claims that may be made against the Fund that have not yet occurred. Currently, the risk of material loss from such claims is considered remote.
Foreign Currency Translations
The Fund does not isolate that portion of the results of operations resulting from the effect of changes in foreign exchange rates on investments from the fluctuations arising from changes in market prices of securities held at the date
| | |
| | Janus Detroit Street Trust ½ 19 |
Janus Henderson Small/Mid Cap Growth Alpha ETF
Notes to Financial Statements
of the financial statements. Net unrealized appreciation or depreciation of investments and foreign currency translations arise from changes in the value of assets and liabilities, including investments in securities held at the date of the financial statements, resulting from changes in the exchange rates and changes in market prices of securities held.
Currency gains and losses are also calculated on payables and receivables that are denominated in foreign currencies. The payables and receivables are generally related to foreign security transactions and income translations.
Foreign currency-denominated assets and forward currency contracts may involve more risks than domestic transactions, including currency risk, counterparty risk, political and economic risk, regulatory risk and equity risk. Risks may arise from unanticipated movements in the value of foreign currencies relative to the U.S. dollar.
Dividends and Distributions
The Fund generally declares and distributes dividends of net investment income quarterly. Net realized capital gains (if any) are distributed annually. The Fund may treat a portion of the amount paid to redeem shares as a distribution of investment company taxable income and realized capital gains that are reflected in the NAV. This practice, commonly referred to as “equalization,” has no effect on the redeeming shareholder or a Fund’s total return, but may reduce the amounts that would otherwise be required to be paid as taxable dividends to the remaining shareholders. It is possible that the Internal Revenue Service (IRS) could challenge the Fund’s equalization methodology or calculations, and any such challenge could result in additional tax, interest, or penalties to be paid by the Fund.
The Fund may make certain investments in real estate investment trusts (“REITs”) which pay dividends to their shareholders based upon funds available from operations. It is quite common for these dividends to exceed the REITs’ taxable earnings and profits, resulting in the excess portion of such dividends being designated as a return of capital. If the Fund distributes such amounts, such distributions could constitute a return of capital to shareholders for federal income tax purposes.
Federal Income Taxes
The Fund intends to continue to qualify as a regulated investment company and distribute all of its taxable income in accordance with the requirements of Subchapter M of the Internal Revenue Code. Management has analyzed the Fund’s tax positions taken for all open federal income tax years, generally a three-year period, and has concluded that no provision for federal income tax is required in the Fund’s financial statements. The Fund is not aware of any tax positions for which it is reasonably possible that the total amounts of unrecognized tax benefits will significantly change in the next twelve months.
On December 22, 2017, the Tax Cuts and Jobs Act was signed into law. Currently, Management does not believe the bill will have a material impact on the Fund’s intention to continue to qualify as a regulated investment company, which is generally not subject to U.S. federal income tax.
2. Other Investments and Strategies
Additional Investment Risk
The financial crisis in both the U.S. and global economies over the past several years has resulted, and may continue to result, in a significant decline in the value and liquidity of many securities of issuers worldwide in the equity and fixed income/credit markets. In response to the crisis, the United States and certain foreign governments, along with the U.S. Federal Reserve and certain foreign central banks, took steps to support the financial markets. The withdrawal of this support, a failure of measures put in place to respond to the crisis, or investor perception that such efforts were not sufficient could each negatively affect financial markets generally, and the value and liquidity of specific securities. In addition, policy and legislative changes in the United States and in other countries continue to impact many aspects of financial regulation. The effect of these changes on the markets, and the practical implications for market participants, including the Fund, may not be fully known for some time and could limit or preclude the Fund’s ability to achieve its investment objective. Therefore, it is important to understand that the value of your investment may fall, sometimes sharply, and you could lose money.
The enactment of the Dodd-Frank Wall Street Reform and Consumer Protection Act (the “Dodd-Frank Act”) provided for widespread regulation of financial institutions, consumer financial products and services, broker-dealers, OTC derivatives, investment advisers, credit rating agencies, and mortgage lending, which expanded federal oversight in the financial sector, including the investment management industry. Certain provisions of the Dodd-Frank Act remain pending and will be implemented through future rulemaking. Therefore, the ultimate impact of the Dodd-Frank Act and the regulations under the Dodd-Frank Act on the Fund and the investment management industry as a whole, is not yet certain.
Janus Henderson Small/Mid Cap Growth Alpha ETF
Notes to Financial Statements
Counterparties
Fund transactions involving a counterparty are subject to the risk that the counterparty or a third party will not fulfill its obligation to the Fund (“counterparty risk”). Counterparty risk may arise because of the counterparty’s financial condition (i.e., financial difficulties, bankruptcy, or insolvency), market activities and developments, or other reasons, whether foreseen or not. A counterparty’s inability to fulfill its obligation may result in significant financial loss to the Fund. The Fund may be unable to recover its investment from the counterparty or may obtain a limited recovery, and/or recovery may be delayed. The extent of the Fund’s exposure to counterparty risk with respect to financial assets and liabilities approximates its carrying value. See the “Offsetting Assets and Liabilities” section of this Note for further details.
The Fund may be exposed to counterparty risk through participation in various programs, including, but not limited to, lending its securities to third parties, cash sweep arrangements whereby the Fund’s cash balance is invested in one or more types of cash management vehicles, as well as investments in, but not limited to, repurchase agreements, and derivatives, including various types of swaps, futures and options. The Fund intends to enter into financial transactions with counterparties that Janus Capital believes to be creditworthy at the time of the transaction. There is always the risk that Janus Capital’s analysis of a counterparty’s creditworthiness is incorrect or may change due to market conditions. To the extent that the Fund focuses its transactions with a limited number of counterparties, it will have greater exposure to the risks associated with one or more counterparties.
Offsetting Assets and Liabilities
The Fund presents gross and net information about transactions that are either offset in the financial statements or subject to an enforceable master netting arrangement or similar agreement with a designated counterparty, regardless of whether the transactions are actually offset in the Statement of Assets and Liabilities.
Deutsche Bank AG acts as securities lending agent and a limited purpose custodian or subcustodian to receive and disburse cash balances and cash collateral, hold short-term investments, hold collateral, and perform other custodian functions in accordance with the Agency Securities Lending and Repurchase Agreement. For financial reporting purposes, the Fund does not offset financial instruments’ payables and receivables and related collateral on the Statement of Assets and Liabilities. Securities on loan will be continuously secured by collateral which may consist of cash, U.S. Government securities, domestic and foreign short-term debt instruments, letters of credit, time deposits, repurchase agreements, money market mutual funds or other money market accounts, or such other collateral as permitted by the SEC. The value of the collateral must be at least 102% of the market value of the loaned securities that are denominated in U.S. dollars and 105% of the market value of the loaned securities that are not denominated in U.S. dollars. Upon receipt of cash collateral, Janus Capital intends to invest the cash collateral in a cash management vehicle for which Janus Capital serves as investment adviser, Janus Henderson Cash Collateral Fund LLC. Loaned securities and related collateral are marked-to-market each business day based upon the market value of the loaned securities at the close of business, employing the most recent available pricing information. Collateral levels are then adjusted based on this mark-to-market evaluation.
The following table presents gross amounts of recognized assets and/or liabilities and the net amounts after deducting collateral that has been pledged by counterparties or has been pledged to counterparties (if applicable). For corresponding information grouped by type of instrument, see the Fund’s Schedule of Investments.
Offsetting of Financial Assets and Derivative Assets
| | | | | | | | | | | | | | | | | | |
| Counterparty | | | Gross Amounts of
Recognized Assets | | | Offsetting Asset
or Liability(a) | | | Collateral
Pledged(b) | | | Net Amount | |
| | Deutsche Bank AG | | | $ | 829,826 | | | $ | — | | | $ | (829,826) | | | $ | — | |
| (a) | Represents the amount of assets or liabilities that could be offset with the same counterparty under master netting or similar agreements that management elects not to offset on the Statement of Assets and Liabilities. |
| (b) | Collateral pledged is limited to the net outstanding amount due to/from an individual counterparty. The actual collateral amounts pledged may exceed these amounts and may fluctuate in value. |
Real Estate Investing
The Fund may invest in equity securities of real estate-related companies to the extent such securities are included in the Underlying Index. Such companies may include those in the real estate industry or real estate-related industries. These securities may include common stocks, preferred stocks, and other equity securities, including, but not limited to, mortgage-backed securities, real estate-backed securities, securities of REITs and similar REIT-like entities. A REIT is a trust that invests in real estate-related projects, such as properties, mortgage loans, and construction loans. REITs are generally categorized as equity, mortgage, or hybrid REITs. A REIT may be listed on an exchange or traded OTC.
| | |
| | Janus Detroit Street Trust ½ 21 |
Janus Henderson Small/Mid Cap Growth Alpha ETF
Notes to Financial Statements
Securities Lending
Under procedures adopted by the Trustees, the Fund may seek to earn additional income by lending securities to qualified parties. Deutsche Bank AG acts as securities lending agent and a limited purpose custodian or subcustodian to receive and disburse cash balances and cash collateral, hold short-term investments, hold collateral, and perform other custodian functions. The Fund may lend portfolio securities in an amount equal to up to 1/3 of its total assets as determined at the time of the loan origination. There is the risk of delay in recovering a loaned security or the risk of loss in collateral rights if the borrower fails financially. In addition, Janus Capital makes efforts to balance the benefits and risks from granting such loans. All loans will be continuously secured by collateral which may consist of cash, U.S. Government securities, domestic and foreign short-term debt instruments, letters of credit, time deposits, repurchase agreements, money market mutual funds or other money market accounts, or such other collateral as permitted by the SEC. If the Fund is unable to recover a security on loan, the Fund may use the collateral to purchase replacement securities in the market. There is a risk that the value of the collateral could decrease below the cost of the replacement security by the time the replacement investment is made, resulting in a loss to the Fund.
Upon receipt of cash collateral, Janus Capital may invest it in affiliated or non-affiliated cash management vehicles, whether registered or unregistered entities, as permitted by the 1940 Act and rules promulgated thereunder. Janus Capital currently intends to invest the cash collateral in a cash management vehicle for which Janus Capital serves as investment adviser, Janus Henderson Cash Collateral Fund LLC. An investment in Janus Henderson Cash Collateral Fund LLC is generally subject to the same risks that shareholders experience when investing in similarly structured vehicles, such as the potential for significant fluctuations in assets as a result of the purchase and redemption activity of the securities lending program, a decline in the value of the collateral, and possible liquidity issues. Such risks may delay the return of the cash collateral and cause the Fund to violate its agreement to return the cash collateral to a borrower in a timely manner. As adviser to the Fund and Janus Henderson Cash Collateral Fund LLC, Janus Capital has an inherent conflict of interest as a result of its fiduciary duties to both the Fund and Janus Henderson Cash Collateral Fund LLC. Additionally, Janus Capital receives an investment advisory fee of 0.05% for managing Janus Henderson Cash Collateral Fund LLC, but it may not receive a fee for managing certain other affiliated cash management vehicles in which the Fund may invest, and therefore may have an incentive to allocate preferred investment opportunities to investment vehicles for which it is receiving a fee.
The value of the collateral must be at least 102% of the market value of the loaned securities that are denominated in U.S. dollars and 105% of the market value of the loaned securities that are not denominated in U.S. dollars. Loaned securities and related collateral are marked-to-market each business day based upon the market value of the loaned securities at the close of business, employing the most recent available pricing information. Collateral levels are then adjusted based on this mark-to-market evaluation.
The cash collateral invested by Janus Capital is disclosed in the Schedule of Investments (if applicable). Income earned from the investment of the cash collateral, net of rebates paid to, or fees paid by, borrowers and less the fees paid to the lending agent are included as “Affiliated securities lending income, net” on the Statement of Operations. As of October 31, 2018, securities lending transactions accounted for as secured borrowings with an overnight and continuous contractual maturity are $829,826 for equity securities. Gross amounts of recognized liabilities for securities lending (collateral received) as of October 31, 2018 is $847,850, resulting in the net amount due to the counterparty of $18,024.
3. Investment Advisory Agreements and Other Transactions with Affiliates
Under its unitary fee structure, the Fund pays Janus Capital a management fee in return for providing certain investment advisory, supervisory, and administrative services to the Fund, including the costs of transfer agency, custody, fund administration, legal, audit, and other services. Janus Capital’s fee structure is designed to pay substantially all of the Fund’s expenses. However, the Fund bears other expenses which are not covered under the management fee which may vary and affect the total level of expenses paid by shareholders, such as distribution fees (if any), brokerage expenses or commissions, interest, dividends, taxes, litigation expenses, acquired fund fees and expenses (if any), and extraordinary expenses. The Fund’s management fee is calculated daily and paid monthly. For the fiscal year ended October 31, 2018, the Fund’s contractual management fee rate (expressed as an annual rate) was 0.50% of the Fund’s average daily net assets.
State Street Bank and Trust Company (“State Street”) provides certain fund administration services to the Fund, including services related to the Fund’s accounting, including calculating the daily NAV, audit, tax, and reporting obligations, pursuant to an agreement with Janus Capital, on behalf of the Fund. As compensation for such services, Janus Capital pays State Street a fee based on a percentage of the Fund’s assets, with a minimum flat fee, for certain services. Janus
Janus Henderson Small/Mid Cap Growth Alpha ETF
Notes to Financial Statements
Capital serves as administrator to the Fund, providing oversight and coordination of the Fund’s service providers, recordkeeping and other administrative services. Janus Capital does not receive any additional compensation, beyond the unitary fee, for serving as administrator. State Street also serves as transfer agent for the shares of the Fund.
Due to an administrative oversight by its administrator, the Fund’s Distribution and Servicing Plan, pursuant to Rule 12b-1 under the 1940 Act that was originally approved at the time of the Fund’s formation (“Initial Rule 12b-1 Plan”), could be viewed to have expired on or about February 11, 2017. The Initial Rule 12b-1 Plan was never implemented, and 12b-1 fees were not charged, prior to its potential expiration. At an in-person meeting held on July 18, 2018, the Fund’s Board of Trustees (“Board��) approved a new Rule 12b-1 Plan (the “Plan”) with respect to the Fund, with terms that are substantively identical to the Initial Rule 12b-1 Plan. Because the Fund has commenced operations, the Plan must also be approved by the Fund’s shareholders prior to implementation. At this time, Janus Capital does not intend to seek shareholder approval for implementation of the Plan. The Plan would permit compensation in connection with the distribution and marketing of Fund shares and/or the provision of certain shareholder services. The Plan would permit the Fund to pay ALPS Distributors, Inc. (the “Distributor”) or its designee, a fee for the sale and distribution and/or shareholder servicing of the shares at an annual rate of up to 0.25% of average daily net assets of the Fund. Under the terms of the Plan, the Trust would be authorized to make payments to the Distributor or its designee for remittance to retirement plan service providers, broker-dealers, bank trust departments, financial advisors, and other financial intermediaries, as compensation for distribution and/or shareholder services performed by such entities for their customers who are investors in the Fund. However, implementation of the Plan and imposition of the 12b-1 fee would require prior approval by Fund shareholders via proxy vote. Janus Capital does not anticipate seeking such approval at this time. Because 12b-1 fees are paid out of the fund assets on an ongoing basis, to the extent that such a fee is authorized by shareholders in the future, over time they will increase the cost of an investment in the Fund. If implemented, the Plan fee may cost an investor more than other types of sales charges.
As of October 31, 2018, Janus Capital owned 2,000 shares or 0.16% of the Fund.
The Fund is permitted to purchase or sell securities (“cross-trade”) between itself and other funds or accounts managed by Janus Capital in accordance with Rule 17a-7 under the Investment Company Act of 1940 (“Rule 17a-7”), when the transaction is consistent with the investment objectives and policies of the Fund and in accordance with the Internal Cross Trade Procedures adopted by the Trust’s Board of Trustees. These procedures have been designed to ensure that any cross-trade of securities by the Fund from or to another fund or account that is or could be considered an affiliate of the Fund under certain limited circumstances by virtue of having a common investment adviser, common Officer, or common Trustee complies with Rule 17a-7. Under these procedures, each cross-trade is effected at the current market price to save costs where allowed. During the year ended October 31, 2018, the Fund engaged in cross trades amounting to $1,133,070 in purchases and $290,785 in sales, resulting in a net realized loss of $38,318. The net realized loss is included within the “Net Realized Gain/(Loss) on Investments” section of the Fund’s Statement of Operations.
Any purchases and sales, realized gains/losses and recorded dividends from affiliated investments during the year ended October 31, 2018 can be found in a table located in the Schedule of Investments.
4. Federal Income Tax
The tax components of capital shown in the table below represent: (1) distribution requirements the Fund must satisfy under the income tax regulations; (2) losses or deductions the Fund may be able to offset against income and gains realized in future years; and (3) unrealized appreciation or depreciation of investments for federal income tax purposes.
Other book to tax differences primarily consist of derivatives, and foreign currency contract adjustments. The Fund has elected to treat gains and losses on forward foreign currency contracts as capital gains and losses, if applicable. Other foreign currency gains and losses on debt instruments are treated as ordinary income for federal income tax purposes pursuant to Section 988 of the Internal Revenue Code.
| | | | | | | | | | | | | | | | | | | | | | | | | | |
| | | | | | | | | | Loss Deferrals | | | | | | | |
Undistributed
Ordinary Income | | | Undistributed
Long-Term Gains | | | Accumulated
Capital Losses | | | Late-Year
Ordinary Loss | | | Post-October
Capital Loss | | | Other Book
to Tax Differences | | | Net Tax
Appreciation/
(Depreciation) | |
| $ | 23,277 | | | $ | — | | | $ | — | | | $ | — | | | $ | — | | | $ | — | | | $ | (2,210,592) | |
During the year ended October 31, 2018, capital loss carryovers of $34,497 were utilized by the Fund.
| | |
| | Janus Detroit Street Trust ½ 23 |
Janus Henderson Small/Mid Cap Growth Alpha ETF
Notes to Financial Statements
The aggregate cost of investments and the composition of unrealized appreciation and depreciation of investment securities for federal income tax purposes as of October 31, 2018 are noted below. The primary differences between book and tax appreciation or depreciation of investments are wash sale loss deferrals and investments in partnerships.
| | | | | | | | | | | | | | |
| Federal Tax Cost | | | Unrealized Appreciation | | | Unrealized (Depreciation) | | | Net Tax Appreciation/
(Depreciation) | |
| $ | 54,170,513 | | | $ | 2,768,076 | | | $ | (4,978,668) | | | $ | (2,210,592) | |
Income and capital gains distributions are determined in accordance with income tax regulations that may differ from accounting principles generally accepted in the United States of America. These differences are due to differing treatments for items such as net short-term gains, deferral of wash sale losses, foreign currency transactions, passive foreign investment companies, net investment losses, in-kind transactions and capital loss carryovers. Certain permanent differences such as tax returns of capital and net investment losses noted below have been reclassified to capital.
| | | | | | | | | | | | | | |
| For the year ended October 31, 2018: | |
| Distributions | | | | |
| From Ordinary Income | | | From Long-Term Capital Gain | | | Tax Return of Capital | | | Net Investment Loss | |
| $ | 119,256 | | | $ | — | | | $ | — | | | $ | — | |
|
| For the year ended October 31, 2017: | |
| Distributions | | | | |
| From Ordinary Income | | | From Long-Term Capital Gain | | | Tax Return of Capital | | | Net Investment Loss | |
| $ | 65,865 | | | $ | — | | | $ | — | | | $ | — | |
Permanent book to tax basis differences may result in reclassifications between the components of net assets. These differences have no impact on the results of operations or net assets. The following reclassifications have been made to the Fund:
| | | | | | | | | | |
| Increase/(Decrease) to Capital | | | Increase/(Decrease) to Undistributed
Net Investment Income/Loss | | | Increase/(Decrease) to Undistributed
Net realized Gain/Loss | |
| $ | 5,795,570 | | | $ | 1,531 | | | $ | (5,797,101) | |
5. Capital Share Transactions
| | | | | | | | | | | | | | | | |
| | | Year ended October 31, 2018 | | | Year ended October 31, 2017 | |
| | | Shares | | | Amount | | | Shares | | | Amount | |
| Shares sold | | | 1,100,000 | | | $ | 47,454,865 | | | | 350,000 | | | $ | 11,660,083 | |
| Shares repurchased | | | (450,000) | | | | (19,718,908) | | | | (100,000) | | | | (3,469,401) | |
Net Increase/(Decrease) | | | 650,000 | | | $ | 27,735,957 | | | | 250,000 | | | $ | 8,190,682 | |
6. Purchases and Sales of Investment Securities
For the year ended October 31, 2018, the aggregate cost of purchases and proceeds from sales of investment securities (excluding any short-term securities, short-term options contracts, and in-kind transactions) was as follows:
| | | | | | | | | | | | | | |
Purchases of Securities | | | Proceeds from Sales of Securities | | | Purchases of Long- Term U.S. Government Obligations | | | Proceeds from Sales of Long-Term U.S. Government Obligations | |
| $ | 28,840,388 | | | $ | 28,794,216 | | | $ | — | | | $ | — | |
Janus Henderson Small/Mid Cap Growth Alpha ETF
Notes to Financial Statements
For the year ended October 31, 2018, the cost of in-kind purchases and proceeds from in-kind sales, were as follows:
| | | | | | | | | | | | | | |
Purchases of
Securities | | | Proceeds from Sales of Securities | | | Purchases of Long- Term U.S. Government Obligations | | | Proceeds from Sales of Long-Term U.S. Government Obligations | |
| $ | 47,451,377 | | | $ | 19,770,279 | | | $ | — | | | $ | — | |
During the year ended October 31, 2018, the Fund had net realized gain/(loss) of $5,807,962 from in-kind redemptions. Gains on in-kind transactions are not considered taxable for federal income tax purposes.
7. Recent Accounting Pronouncements
The Securities and Exchange Commission adopted amendments to Regulation S-X, for the presentation of distributable earnings and distributions to align with US Generally Accepted Accounting Principles (GAAP). The compliance date of the amendments to Regulation S-X is November 5, 2018. This report incorporates the amendments to Regulation S-X.
The FASB issued Accounting Standards Update 2018-13, Fair Value Measurement (Topic 820) in August 2018. The new guidance removes, modifies and enhances the disclosures to Topic 820. For public entities, the amendments are effective for financial statements issued for fiscal years beginning after December 15, 2019, and interim periods within those fiscal years. Management is currently evaluating the impact of this new guidance on the financial statements.
The FASB issued Accounting Standards Update No. 2017-08, Receivables – Nonrefundable Fees and Other Costs (Subtopic 310-20), Premium Amortization on Purchased Callable Debt Securities (“ASU 2017-08”) to amend the amortization period for certain purchased callable debt securities held at a premium. The guidance requires certain premiums on callable debt securities to be amortized to the earliest call date. The amortization period for callable debt securities purchased at a discount will not be impacted. The amendments are effective for fiscal years, and interim periods within those fiscal years, beginning after December 15, 2018. Early adoption is permitted, including adoption in an interim period. Management is currently evaluating the impacts of ASU 2017-08 on the Fund’s financial statements.
8. Subsequent Events
Management has evaluated whether any events or transactions occurred subsequent to October 31, 2018 and through the date of issuance of the Fund’s financial statements and determined that there were no material events or transactions that would require recognition or disclosure in the Fund’s financial statements other than the following:
The Fund’s Board of Trustees (“Board”) approved an amendment (“Amendment”) to the Investment Advisory and Management Agreement that provides for a new management fee rate schedule that reduces the annual management fee rate payable by the Fund to Janus Capital and also provides for further management fee rate reductions as assets grow. The new annual management fee rate schedule is effective November 1, 2018. A chart comparing the Fund’s historical management fee to the new management fee schedule (each expressed as an annual rate) is provided below.
| | | | | | | | |
Historical Average Daily Net Assets | | | New Daily Net Assets | |
| | 0.50% | | | $0-$500 million | | | 0.35% | |
| | | | Next $500 million | | | 0.28% | |
| | | | | Over $1 billion | | | 0.20% | |
| | |
| | Janus Detroit Street Trust ½ 25 |
Janus Henderson Small/Mid Cap Growth Alpha ETF
Additional Information (unaudited)
Proxy Voting Policies and Voting Record
A description of the policies and procedures that the Fund uses to determine how to vote proxies relating to its portfolio securities is available without charge: (i) upon request, by calling 1-800-525-0020 (toll free); (ii) on the Fund’s website at janushenderson.com/proxyvoting; and (iii) on the SEC’s website at http://www.sec.gov.
Quarterly Portfolio Holdings
The Fund files its complete portfolio holdings (schedule of investments) with the SEC for the first and third quarters of each fiscal year on Form N-Q within 60 days of the end of such fiscal quarter. The Fund’s Form N-Q: (i) is available on the SEC’s website at http://www.sec.gov; (ii) may be reviewed and copied at the SEC’s Public Reference Room in Washington, D.C. (information on the Public Reference Room may be obtained by calling 1-800-SEC-0330); and (iii) is available without charge, upon request, by calling Janus Henderson at 1-800-525-0020 (toll free).
Designation Requirements (unaudited)
For federal income tax purposes, the Fund designated the following for the year ended October 31, 2018
| | | | |
| Dividends Received Deduction Percentage | | | 100% | |
| Qualified Dividend Income Percentage | | | 100% | |
Licensing Agreements
Solactive AG (“Solactive”) is the Index Provider for the Underlying Index. Janus Capital has entered into a license agreement with Solactive to use the Underlying Index.
Neither Solactive nor any of its affiliates make any representation or warranty, express or implied, to the owners of a Fund or any member of the public regarding the advisability of investing in securities generally or in a Fund particularly or the ability of the Underlying Index to track general market performance. The Underlying Index is determined, composed, and calculated by Solactive without regard to Janus Capital or the Fund. Solactive has no obligation to take the needs of Janus Capital or the owners of the Fund into consideration in determining, composing, or calculating the Underlying Index. Solactive is not responsible for and has not participated in the determination of the timing of, prices at, or quantities of the Fund to be issued or in the determination or calculation of the equation by which the Fund is to be converted into cash.
ALTHOUGH SOLACTIVE SHALL OBTAIN INFORMATION FOR INCLUSION IN OR FOR USE IN THE CALCULATION OF THE UNDERLYING INDEX FROM SOURCES WHICH IT CONSIDERS RELIABLE, IT DOES NOT GUARANTEE THE QUALITY, ACCURACY AND/OR THE COMPLETENESS OF THE UNDERLYING INDEX OR ANY DATA INCLUDED THEREIN AND SHALL HAVE NO LIABILITY FOR ERRORS OR OMISSIONS OF ANY KIND RELATED TO THE UNDERLYING INDEX OR DATA. SOLACTIVE MAKES NO WARRANTY, EXPRESS OR IMPLIED, AS TO RESULTS TO BE OBTAINED BY JANUS CAPITAL, OWNERS OF THE FUND, OR ANY OTHER PERSON OR ENTITY FROM THE USE OF THE UNDERLYING INDEX OR ANY DATA INCLUDED THEREIN IN CONNECTION WITH THE RIGHTS LICENSED TO JANUS CAPITAL FOR ANY OTHER USE. SOLACTIVE MAKES NO EXPRESS OR IMPLIED WARRANTIES, AND HEREBY EXPRESSLY DISCLAIMS ALL WARRANTIES OF MERCHANTABILITY OR FITNESS FOR A PARTICULAR PURPOSE OR USE WITH RESPECT TO THE UNDERLYING INDEX OR ANY DATA INCLUDED THEREIN. WITHOUT LIMITING ANY OF THE FOREGOING, IN NO EVENT SHALL IT HAVE ANY LIABILITY FOR ANY SPECIAL, PUNITIVE, INDIRECT, OR CONSEQUENTIAL DAMAGES (INCLUDING LOST PROFITS), EVEN IF NOTIFIED OF THE POSSIBILITY OF SUCH DAMAGES.
Janus Capital does not guarantee the accuracy and/or the completeness of the Underlying Index or any data included therein, and Janus Capital shall have no liability for any errors, omissions or interruptions therein. Janus Capital makes no warranty, express or implied, as to results to be obtained by the Fund, owners of the shares of the Fund or any other person or entity from the use of the Underlying Index or any data included therein. Janus Capital makes no express or implied warranties, and expressly disclaims all warranties of merchantability or fitness for a particular purpose or use with respect to the Underlying Index or any data included therein. Without limiting any of the foregoing, in no event shall Janus Capital have any liability for any special, punitive, direct, indirect or consequential damages (including lost profits) arising out of matters relating to the use of the Underlying Index even if notified of the possibility of such damages.
Janus Henderson Small/Mid Cap Growth Alpha ETF
Board Considerations Regarding Approval of Investment Advisory Agreements (unaudited)
APPROVAL OF AMENDMENT TO INVESTMENT ADVISORY AGREEMENT
At an in-person meeting held on October 9-10, 2018, the Trustees approved an amendment (“Amendment”) to the Investment Advisory and Management Agreement between the Trust and Janus Capital on behalf of Janus Henderson Small Cap Growth Alpha ETF, Janus Henderson Small/Mid Cap Growth Alpha ETF, The Long-Term Care ETF, The Obesity ETF, and The Organics ETF (each a “Fund” and, together, the “Funds”). The Amendment provided for a new management fee rate schedule that reduces the annual management fee rate payable by the Funds to Janus Capital and also provided for further management fee rate reductions as assets grow. A comparison of the prior and new unitary fee rate schedules (each expressed as an annual rate) is shown below.
| | | | | | | | |
Current Average Daily Net Assets | | | New Daily Net Assets | |
| | 0.50% | | | $0-$500 million | | | 0.35% | |
| | | | Next $500 million | | | 0.28% | |
| | | | | Over $1 billion | | | 0.20% | |
In connection with the Amendment approval, Janus Capital represented to the Trustees that there would be no change to the nature, quality and extent of services rendered by Janus Capital to the Fund. The Amendment is effective as of November 1, 2018.
| | |
| | Janus Detroit Street Trust ½ 27 |
Janus Henderson Small/Mid Cap Growth Alpha ETF
Trustees and Officers (unaudited)
The Fund’s Statement of Additional Information includes additional information about the Trustees and officers and is available, without charge, by calling 1-877-335-2687.
The following are the Trustees and officers of the Trust, together with a brief description of their principal occupations during the last five years (principal occupations for certain Trustees may include periods over five years).
Each Trustee has served in that capacity since he or she was originally elected or appointed. The Trustees do not serve a specified term of office. Each Trustee will hold office until the termination of the Trust or his or her earlier death, resignation, retirement, incapacity, or removal. Under the Fund’s Governance Procedures and Guidelines, the policy is for Trustees to retire no later than the end of the calendar year in which the Trustee turns 75. The Trustees review the Fund’s Governance Procedures and Guidelines from time to time and may make changes they deem appropriate. The Fund’s Nominating and Governance Committee will consider nominees for the position of Trustee recommended by shareholders. Shareholders may submit the name of a candidate for consideration by the Committee by submitting their recommendations to the Trust’s Secretary. Each Trustee is currently a Trustee of one other registered investment company advised by Janus Capital: Clayton Series Trust. Collectively, these two registered investment companies consist of 10 series or funds.
The Trust’s officers are elected annually by the Trustees for a one-year term. Certain officers also serve as officers of Clayton Series Trust. Certain officers of the Fund may also be officers and/or directors of Janus Capital. Fund officers receive no compensation from the Fund, except for the Fund’s Chief Compliance Officer, as authorized by the Trustees.
| | | | | | | | | | | | | | | | | | |
| TRUSTEES | | | | | | | | | | | | | | |
| Name, Address, and Age | | Positions Held
with the Trust | | | Length of Time Served | | | Principal Occupations During the Past Five Years | | Number of Portfolios/Funds in Fund Complex Overseen by Trustee* | | | Other Directorships Held by Trustee During the Past Five Years | |
Independent Trustees | | | | | | | | | | | | | | | | | | |
Clifford J. Weber 151 Detroit Street Denver, CO 80206 DOB: 1963 | |
| Chairman
Trustee |
| |
| 2/16-Present
2/16-Present |
| | Owner, Financial Products Consulting Group LLC (consulting services to financial institutions) (since 2015). Formerly, Executive Vice President of Global Index and Exchange- Traded Products, NYSE Market, Inc., a subsidiary of Intercontinental Exchange (ETF/ETP listing exchange) (2013-2015) and Executive Vice President and Head of Strategy and Product Development, NYSE Liffe U.S., a division of NYSE Euronext (U.S. futures exchange) (2008-2013). | | | 10 | | |
| Independent Trustee, Clough
Funds Trust (investment
company) (since 2015).
Chairman, Clough Funds
Trust (since 2017),
Independent Trustee, Clough
Dividend and Income Fund
(closed-end fund)
(since 2017), Independent
Trustee, Clough Global
Opportunities Fund
(closed-end fund) (since
2017), Independent Trustee,
Clough Global Equity Fund
(closed-end fund) (since
2017), Independent Trustee,
Elevation ETF Trust
(investment company)
(2016-2018) Chairman,
Elevation ETF Trust (2016-
2018), and Independent
Trustee, Global X Funds
(investment company)
(since 2018). |
|
Janus Henderson Small/Mid Cap Growth Alpha ETF
Trustees and Officers (unaudited)
| | | | | | | | | | | | | | | | | | |
| TRUSTEES | | | | | | | | | | | | | | |
| Name, Address, and Age | | Positions Held
with the Trust | | | Length of Time Served | | | Principal Occupations During the Past Five Years | | Number of Portfolios/Funds in Fund Complex Overseen by Trustee* | | | Other Directorships Held by Trustee During the Past Five Years | |
Maureen T. Upton 151 Detroit Street Denver, CO 80206 DOB: 1965 | | | Trustee | | | | 2/16-Present | | | Principal, Maureen Upton Ltd. (consulting services to developers of major infrastructure projects and investors) (since 2017). Formerly, Principal Consultant, SRK Consulting (U.S.), Inc. (consulting services to global mining, energy and water resource industries) (2015-2017) and Founder and Principal, Resource Initiatives LLC (sustainability consulting firm) (2006-2015). | | | 10 | | |
| Director, Denver Metro
Leadership Foundation
(non-profit organization)
(2012-2014). |
|
| | | | | |
Jeffrey B. Weeden 151 Detroit Street Denver, CO 80206 DOB: 1956 | | | Trustee | | | | 2/16-Present | | | Senior Advisor, BayBoston Capital LP (investment fund in finance companies, banks and bank holdings companies) (since 2015). Formerly, Management Advisor, BoxCast, Inc. (technology start-up company) (2014-2017) and Senior Executive Vice President and Chief Financial Officer, KeyCorp (financial services) (2002-2013). | | | 10 | | |
| Director, State Farm Bank
(banking) (since 2014). |
|
Interested Trustee | | | | | | | | | | | | | | | | | | |
Michael Drew Elder** 151 Detroit Street Denver, CO 80206 DOB: 1970 | | | Trustee | | | | 8/15-Present | | | Executive Vice President and Head of U.S. Intermediary Distribution, Janus Capital (since 2014) and President, Janus Distributors LLC (broker- dealer) (since 2014). Formerly, Senior Vice President, Janus Capital (2007-2014). | | | 10 | | |
| Director, Perkins Investment
Management LLC
(since 2014). |
|
| * | In addition to the Trust, which is comprised of seven series, each Trustee also serves as a trustee to the Clayton Street Trust, which is an affiliated registered investment company currently comprised of three portfolios. |
| ** | Michael Drew Elder is an Interested Trustee because of his employment with Janus Capital. |
| | |
| | Janus Detroit Street Trust ½ 29 |
Janus Henderson Small/Mid Cap Growth Alpha ETF
Trustees and Officers (unaudited)
| | | | | | |
| OFFICERS | | | | | | |
| Name, Address, and Age | | Positions Held with the Trust | | Term of Office* and
Length of Time Served | | Principal Occupations During the Past Five Years |
Bruce L. Koepfgen 151 Detroit Street Denver, CO 80206 DOB: 1952 | | President and Chief Executive Officer | | 2/16-Present | | Head of North America for Janus Henderson Investors and Janus Capital Management LLC (since 2017); Executive Vice President and Director of Janus International Holding LLC (since 2011); Executive Vice President of Janus Distributors LLC (since 2011); Executive Vice President and Working Director of INTECH Investment Management LLC (since 2011); Executive Vice President and Director of Perkins Investment Management LLC (since 2011); and Executive Vice President and Director of Janus Management Holdings Corporation (since 2011). Formerly, President of Janus Capital Group Inc. and Janus Capital Management LLC (2013-2017); Executive Vice President of Janus Services LLC (2011-2015), Janus Capital Group Inc. and Janus Capital Management LLC (2011- 2013); and Chief Financial Officer of Janus Capital Group Inc., Janus Capital Management LLC, Janus Distributors LLC, Janus Management Holdings Corporation, and Janus Services LLC (2011-2013). |
| | | |
Susan K. Wold 151 Detroit Street Denver, CO 80206 DOB: 1960 | | Vice President, Chief Compliance Officer, and Anti- Money Laundering Officer | | 9/17-Present | | Senior Vice President and Head of Compliance North America for Janus Henderson (since September 2017); Formerly Vice President, Head of Global Corporate Compliance, and Chief Compliance Officer for Janus Capital Management LLC (May 2017-September 2017); Vice President, Compliance at Janus Capital Group and Janus Capital Management LLC (2005-2017). |
| | | |
Jesper Nergaard 151 Detroit Street Denver, CO 80206 DOB: 1962 | | Vice President, Chief Financial Officer, Treasurer, and Principal Accounting Officer | | 2/16-Present | | Vice President of Janus Capital and Janus Services LLC. |
| | | |
Byron Hittle 151 Detroit Street Denver, CO 80206 DOB: 1974 | | Vice President, Secretary and Chief Legal Officer | | 7/18-Present | | Vice President and Assistant General Counsel of Janus Capital and Janus Services LLC (2017- present); Assistant Vice President and Senior Legal Counsel (2012-2016). |
| * | Officers are elected at least annually by the Trustees for a one-year term and may also be elected from time to time by the Trustees for an interim period. |
Janus Henderson Small/Mid Cap Growth Alpha ETF
Notes
| | |
| | Janus Detroit Street Trust ½ 31 |
Janus Henderson Small/Mid Cap Growth Alpha ETF
Notes
Janus Henderson Small/Mid Cap Growth Alpha ETF
Notes
| | |
| | Janus Detroit Street Trust ½ 33 |
Knowledge. Shared
At Janus Henderson, we believe in the sharing of expert insight for better investment and business decisions. We call this ethos Knowledge. Shared.
Learn more by visiting janushenderson.com.
This report is submitted for the general information of shareholders of the Fund. It is not an offer or solicitation for the Fund and is not authorized for distribution to prospective investors unless preceded or accompanied by an effective prospectus.
Janus Henderson and Knowledge. Shared are trademarks of Janus Henderson Group plc or one of its subsidiary entities. © Janus Henderson Group plc.
Janus Capital Management LLC is the investment adviser and ALPS Distributors, Inc. is the distributor. ALPS is not affiliated with Janus Henderson or any of its subsidiaries.
ANNUAL REPORT
October 31, 2018
The Long-Term Care ETF
Janus Detroit Street Trust

Table of Contents
The Long-Term Care ETF (unaudited)
INVESTMENT OBJECTIVE
The Long-Term Care ETF (OLD) seeks investment results that correspond generally to the performance, before fees and expenses, of an index which is designed to track the performance of companies globally that are positioned to profit from providing long-term care to the aging population, including companies owning or operating senior living facilities, nursing services, specialty hospitals, and senior housing, biotech companies for age-related illnesses, and companies that sell products and services to such facilities.
PERFORMANCE OVERVIEW
| • | | Concerns over inflation and faster-than-expected interest rate hikes were a source of volatility, as were fears about protectionist trade policies. Gains were concentrated in the U.S., where economic data have been positive, driven by corporate earnings, synchronized economic growth and optimism about U.S. tax reform. The nomination of Jerome Powell as the next chair of the Federal Reserve (Fed) signaled the likely continuation of monetary policy normalization. Throughout the period, political and economic tensions in both developed economies outside the U.S. and emerging economies became increasingly prevalent. Highly uncertain Brexit negotiations and tensions between the EU and Italy weighed on European markets. Emerging markets continue to struggle as U.S. Treasury yields rise, and Asian markets are anticipating greater conflict with the U.S. |
| • | | The underlying Solactive Long-Term Care Index outperformed the broader market as represented by the MSCI All Country World IndexSM. Within the Solactive Long-Term Care Index, health care services delivered the strongest returns on a sub-industry basis, while health care real estate investment trusts delivered the weakest returns. |
| • | | During the period, OLD returned 8.44% (based on NAV); its primary benchmark, the Solactive Long-Term Care Index, returned 9.00%, and its secondary benchmark, the MSCI All Country World Index, returned -0.52%. |
| • | | OLD seeks investment results that correspond generally, before fees and expenses, to the performance of its primary benchmark. It seeks exposure to companies globally that are positioned to profit from providing long-term care to the aging population. These include companies owning or operating senior living facilities, nursing services, specialty hospitals or senior housing, as well as biotech companies for age-related illnesses and companies that sell products and services to such facilities. |
| | |
| | Janus Detroit Street Trust ½ 1 |
The Long-Term Care ETF (unaudited)
Fund At A Glance
October 31, 2018
| | | | |
| 5 Largest Equity Holdings – (% of Net Assets) | |
Welltower, Inc. | | | | |
Equity Real Estate Investment Trusts (REITs) | | | 17.6% | |
Ventas, Inc. | | | | |
Equity Real Estate Investment Trusts (REITs) | | | 14.8% | |
HCP, Inc. | | | | |
Equity Real Estate Investment Trusts (REITs) | | | 9.2% | |
Orpea | | | | |
Health Care Providers & Services | | | 4.8% | |
Omega Healthcare Investors, Inc. | | | | |
Equity Real Estate Investment Trusts (REITs) | | | 4.7% | |
| | | | |
| | | 51.1% | |
| | | | |
| Sector Allocation – (% of Net Assets) | |
Financial | | | 67.3% | |
Consumer, Non-cyclical | | | 31.1% | |
Communications Services | | | 1.3% | |
Consumer, Cyclical | | | 0.3% | |
| | | | |
| | | 100.0% | |
Holdings are subject to change without notice.
The Long-Term Care ETF (unaudited)
Performance
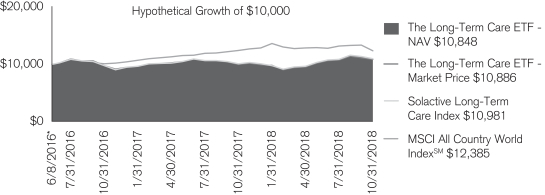
| | | | |
| Average Annual Total Return for the periods ended October 31, 2018 |
| | | One Year | | Since
Inception* |
The Long-Term Care ETF – NAV | | 8.44% | | 3.45% |
The Long-Term Care ETF – Market Price | | 8.95% | | 3.60% |
Solactive Long-Term Care Index | | 9.00% | | 3.98% |
MSCI All Country World IndexSM | | -0.52% | | 9.33% |
Total annual expense ratio as stated in the February 28, 2018 prospectus: 0.50%
Returns quoted are past performance and do not guarantee future results; current performance may be lower or higher. Investment returns and principal value will vary; there may be a gain or loss when shares are sold. For the most recent month-end performance call 800.668.0434 or visit janushenderson.com/performance.
Shares of ETFs are bought and sold at market price (not NAV) and are not individually redeemed from the Fund. Market returns are based upon the midpoint of the bid/ask spread at 4:00 p.m. Eastern time (when NAV is normally determined for most ETFs), and do not represent the returns you would receive if you traded shares at other times. Ordinary brokerage commissions apply and will reduce returns.
ETF shares are not individually redeemable and owners of the shares may acquire those shares from the Fund and tender those shares for redemption to the Fund in Creation Units only.
Investing involves risk, including the possible loss of principal and fluctuation of value.
Performance depends on that of the underlying index.
See the prospectus for a more complete discussion of objectives, risks and expenses.
Returns include reinvestment of dividends and capital gains. Returns greater than one year are annualized. Returns do not reflect the deduction of taxes that a shareholder would pay on Fund distributions or redemptions of Fund shares.
See Financial Highlights for actual expense ratios during the reporting period.
There is no assurance the stated objective(s) will be met.
See Notes to Schedule of Investments and Other Information for index definitions.
Index performance does not reflect the expenses of managing a portfolio as an index is unmanaged and not available for direct investment.
Solactive Indices were created by and are maintained by, Solactive AG. For detailed information on how stocks are selected for inclusion in the Underlying Index, see solactive.com. Solactive is not affiliated with Janus Henderson or ALPS.
| * | The Fund commenced operations on June 8, 2016. |
| | |
| | Janus Detroit Street Trust ½ 3 |
The Long-Term Care ETF (unaudited)
Disclosure of Fund Expenses
As a shareholder of the Fund, you incur two types of costs: (1) transaction costs, which may include creation and redemption fees or brokerage charges and (2) ongoing costs, including management fees and other Fund expenses. This example is intended to help you understand your ongoing costs (in dollars) of investing in the Fund and to compare these costs with the ongoing costs of investing in other ETFs. To do so, compare this 5% hypothetical example with the 5% hypothetical examples that appear in the shareholder reports of the other funds. The example is based upon an investment of $1,000 invested at the beginning of the period and held for the six-months indicated, unless noted otherwise in the table and footnotes below.
Actual Expenses
The information in the table under the heading “Actual” provides information about actual account values and actual expenses. You may use the information in these columns, together with the amount you invested, to estimate the expenses that you paid over the period. Simply divide your account value by $1,000 (for example, an $8,600 account value divided by $1,000 = 8.6), then multiply the result by the number under the heading entitled “Expenses Paid During Period” to estimate the expenses you paid on your account during the period.
Hypothetical Example for Comparison Purposes
The information in the table under the heading “Hypothetical (5% return before expenses)” provides information about hypothetical account values and hypothetical expenses based upon the Fund’s actual expense ratio and an assumed rate of return of 5% per year before expenses, which is not the Fund’s actual return. The hypothetical account values and expenses may not be used to determine the actual ending account balance or expenses you paid for the period. You may use this information to compare the ongoing costs of investing in the Fund and other funds. To do so, compare this 5% hypothetical example with the 5% hypothetical examples that appear in the shareholder reports of the other funds. Additionally, for an analysis of the fees associated with an investment or other similar funds, please visit www.finra.org/fundanalyzer.
Please note that the expenses shown in the table are meant to highlight your ongoing costs only and do not reflect any transaction costs, such as creation and redemption fees, or brokerage charges. These fees are fully described in the Fund’s prospectus. Therefore, the hypothetical examples are useful in comparing ongoing costs only, and will not help you determine the relative total costs of owning different funds. In addition, if these transaction costs were included, your costs would have been higher.
| | | | | | | | | | | | | | | | | | | | | | | | |
Actual | | | Hypothetical
(5% return before expenses) | | | | |
Beginning
Account
Value
(5/1/18) | | Ending
Account
Value
(10/31/2018) | | | Expenses
Paid During
Period
(5/1/18 - 10/31/2018)† | | | Beginning
Account
Value
(5/1/18) | | | Ending
Account
Value
(10/31/2018) | | | Expenses
Paid During
Period
(5/1/18 - 10/31/2018)† | | | Net Annualized
Expense Ratio
(5/1/18 - 10/31/2018) | |
| $1,000.00 | | $ | 1,138.40 | | | $ | 2.69 | | | $ | 1,000.00 | | | $ | 1,022.68 | | | $ | 2.55 | | | | 0.50% | |
| † | Expenses Paid During Period is equal to the Net Annualized Expense Ratio multiplied by the average account value over the period, multiplied by 184/365 (to reflect the one-half year period). |
The Long-Term Care ETF
Report of Independent Registered Public Accounting Firm
To the Board of Trustees of Janus Detroit Street Trust and Shareholders of The Long-Term Care ETF:
Opinion on the Financial Statements
We have audited the accompanying statement of assets and liabilities, including the schedule of investments, of The Long-Term Care ETF (one of the funds constituting Janus Detroit Street Trust, referred to hereafter as the “Fund”) as of October 31, 2018, the related statement of operations for the year ended October 31, 2018, the statements of changes in net assets for each of the two years in the period ended October 31, 2018, including the related notes, and the financial highlights for each of the two years in the period ended October 31, 2018 and for the period June 8, 2016 (commencement date) through October 31, 2016 (collectively referred to as the “financial statements”). In our opinion, the financial statements present fairly, in all material respects, the financial position of the Fund as of October 31, 2018, the results of its operations for the year then ended, the changes in its net assets for each of the two years in the period ended October 31, 2018 and the financial highlights for each of the two years in the period ended October 31, 2018 and for the period June 8, 2016 (commencement date) through October 31, 2016 in conformity with accounting principles generally accepted in the United States of America.
Basis for Opinion
These financial statements are the responsibility of the Fund’s management. Our responsibility is to express an opinion on the Fund’s financial statements based on our audits. We are a public accounting firm registered with the Public Company Accounting Oversight Board (United States) (“PCAOB”) and are required to be independent with respect to the Fund in accordance with the U.S. federal securities laws and the applicable rules and regulations of the Securities and Exchange Commission and the PCAOB.
We conducted our audits of these financial statements in accordance with the standards of the PCAOB. Those standards require that we plan and perform the audit to obtain reasonable assurance about whether the financial statements are free of material misstatement, whether due to error or fraud.
Our audits included performing procedures to assess the risks of material misstatement of the financial statements, whether due to error or fraud, and performing procedures that respond to those risks. Such procedures included examining, on a test basis, evidence regarding the amounts and disclosures in the financial statements. Our audits also included evaluating the accounting principles used and significant estimates made by management, as well as evaluating the overall presentation of the financial statements. Our procedures included confirmation of securities owned as of October 31, 2018 by correspondence with the custodian and brokers; when replies were not received from brokers, we performed other auditing procedures. We believe that our audits provide a reasonable basis for our opinion.

Denver, Colorado
December 20, 2018
We have served as the auditor of one or more investment companies in Janus Henderson Funds since 1990.
| | |
| | Janus Detroit Street Trust ½ 5 |
The Long-Term Care ETF
Schedule of Investments
October 31, 2018
| | | | | | | | |
| | | Shares | | | Value | |
| Common Stocks – 100.0% | | | | | | |
| Equity Real Estate Investment Trusts (REITs) – 64.7% | | | | | | |
Aedifica SA | | | 1,586 | | | | $132,799 | |
CareTrust, Inc. | | | 7,219 | | | | 127,488 | |
HCP, Inc. | | | 26,003 | | | | 716,383 | |
Ingenia Communities Group | | | 18,716 | | | | 38,203 | |
LTC Properties, Inc. | | | 3,536 | | | | 151,235 | |
National Health Investors, Inc. | | | 3,675 | | | | 269,965 | |
New Senior Investment Group, Inc. | | | 7,260 | | | | 41,527 | |
Omega Healthcare Investors, Inc. | | | 10,937 | | | | 364,749 | |
Sabra Health Care, Inc. | | | 15,660 | | | | 339,039 | |
Senior Housing Properties Trust | | | 20,560 | | | | 330,399 | |
Ventas, Inc. | | | 19,697 | | | | 1,143,214 | |
Welltower, Inc. | | | 20,598 | | | | 1,360,910 | |
| | | | | | | | |
| | | | | | | 5,015,911 | |
| Health Care Providers & Services – 33.7% | | | | | | |
Addus HomeCare Corp.* | | | 890 | | | | 58,295 | |
Ambea AB (144A) | | | 2,553 | | | | 23,743 | |
Amedisys, Inc.* | | | 2,623 | | | | 288,530 | |
Arvida Group, Ltd. | | | 31,387 | | | | 26,644 | |
Attendo AB (144A) | | | 8,329 | | | | 75,410 | |
Brookdale Senior Living, Inc.* | | | 16,683 | | | | 148,979 | |
Capital Senior Living Corp.* | | | 2,217 | | | | 19,953 | |
Charm Care Corp. KK | | | 400 | | | | 5,593 | |
Chartwell Retirement Residences | | | 18,932 | | | | 203,700 | |
Elan Corp. | | | 500 | | | | 12,268 | |
Ensign Group, Inc. | | | 4,445 | | | | 164,643 | |
Estia Health, Ltd. | | | 18,460 | | | | 26,690 | |
Extendicare, Inc. | | | 7,976 | | | | 44,701 | |
Genesis Healthcare, Inc.* | | | 4,584 | | | | 7,059 | |
Japara Healthcare, Ltd. | | | 22,119 | | | | 17,637 | |
Korian SA | | | 4,267 | | | | 168,442 | |
LHC Group, Inc.* | | | 2,625 | | | | 240,004 | |
Metlifecare, Ltd. | | | 15,170 | | | | 57,653 | |
N Field Co., Ltd. | | | 1,000 | | | | 15,285 | |
National HealthCare Corp. | | | 890 | | | | 70,782 | |
NichiiGakkan Co., Ltd. | | | 3,200 | | | | 29,886 | |
Oceania Healthcare, Ltd. | | | 30,248 | | | | 22,715 | |
Orpea | | | 3,042 | | | | 375,177 | |
Regis Healthcare, Ltd. | | | 12,088 | | | | 20,562 | |
Ryman Healthcare, Ltd. | | | 35,932 | | | | 283,910 | |
Sienna Senior Living, Inc. | | | 5,909 | | | | 74,692 | |
St-Care Holding Corp. | | | 1,000 | | | | 5,325 | |
Summerset Group Holdings, Ltd. | | | 18,633 | | | | 81,035 | |
Tsukui Corp. | | | 4,400 | | | | 37,857 | |
UNIMAT Retirement Community Co., Ltd. | | | 300 | | | | 4,750 | |
| | | | | | | | |
| | | | | | | 2,611,920 | |
| Professional Services – 1.3% | | | | | | |
SMS Co., Ltd. | | | 5,900 | | | | 98,860 | |
| Real Estate Management & Development – 0.3% | | | | | | |
Lifestyle Communities, Ltd. | | | 5,167 | | | | 21,277 | |
Total Common Stocks (cost $7,653,862) | | | | | | | 7,747,968 | |
Total Investments (total cost $7,653,862) – 100.0% | | | | | | | 7,747,968 | |
Cash, Receivables and Other Assets, net of Liabilities – 0.0% | | | | | | | 169 | |
Net Assets – 100% | | | | | | | $7,748,137 | |
See Notes to Schedule of Investments and Other Information and Notes to Financial Statements.
The Long-Term Care ETF
Schedule of Investments
October 31, 2018
Summary of Investments by Country – (Long Positions) (unaudited)
| | | | | | | | |
| Country | | Value | | | % of
Investment
Securities | |
United States | | | $5,843,154 | | | | 75.4% | |
France | | | 543,619 | | | | 7.0 | |
New Zealand | | | 471,957 | | | | 6.1 | |
Canada | | | 323,093 | | | | 4.2 | |
Japan | | | 209,824 | | | | 2.7 | |
Belgium | | | 132,799 | | | | 1.7 | |
Australia | | | 124,369 | | | | 1.6 | |
Sweden | | | 99,153 | | | | 1.3 | |
Total | | | $7,747,968 | | | | 100.0% | |
The Fund may invest in certain securities that are considered affiliated companies. As defined by the Investment Company Act of 1940, as amended, an affiliated company is one in which the Fund owns 5% or more of the outstanding voting securities, or a company which is under common ownership or control.
Schedules of Affiliated Investments – (% of Net Assets)
| | | | | | | | | | | | | | | | |
| | | Dividend Income | | | Realized
Gain/(Loss) | | | Change in
Unrealized
Appreciation/
(Depreciation) | | | Value at
10/31/18 | |
| Investment Companies – N/A | | | | | | | | | | | | |
| Investments Purchased with Cash Collateral from Securities Lending – N/A | | | | | | | | | | |
Janus Henderson Cash Collateral Fund LLC, 2.1443%¥ | | | $1,450 | D | | | $ — | | | | $ — | | | | $ — | |
| | | | |
| | | Share Balance
at 10/31/17 | | | Purchases | | | Sales | | | Share Balance
at 10/31/18 | |
| Investment Companies – N/A | | | | | | | | | | | | |
| Investments Purchased with Cash Collateral from Securities Lending – N/A | | | | | | | | | | |
Janus Henderson Cash Collateral Fund LLC, 2.1443%¥ | | | 336,550 | | | | 2,750,491 | | | | (3,087,041) | | | | — | |
See Notes to Schedule of Investments and Other Information and Notes to Financial Statements.
| | |
| | Janus Detroit Street Trust ½ 7 |
The Long-Term Care ETF
Notes to Schedule of Investments and Other Information
October 31, 2018
| | |
| Solactive Long-Term Care Index | | Solactive Long-Term Care Index is designed to track the performance of companies globally that are positioned to profit from providing long-term care to the aging population, including: companies owning or operating senior living facilities, nursing services, specialty hospitals, and senior housing, biotech companies for age-related illnesses and companies that sell products and services to such facilities. |
| |
| MSCI All Country World IndexSM | | MSCI All Country World IndexSM reflects the equity market performance of global developed and emerging markets. |
| |
| LLC | | Limited Liability Company |
| 144A | Securities sold under Rule 144A of the Securities Act of 1933, as amended, are subject to legal and/or contractual restrictions on resale and may not be publicly sold without registration under the 1993 Act. Unless otherwise noted, these securities have been determined to be liquid under guidelines established by the Board of Trustees. The total value of 144A securities as of the year ended October 31, 2018 is. $99,153, which represents 1.3% of net assets. |
| * | Non-income producing security. |
| ºº | Rate shown is the 7-day yield as of October 31, 2018. |
| D | Net of income paid to the securities lending agent and rebates paid to the borrowing counterparties. |
The following is a summary of the inputs that were used to value the Fund’s investments in securities and other financial instruments as of October 31, 2018. See Notes to Financial Statements for more information.
Valuation Inputs Summary
| | | | | | | | | | | | |
| | | Level 1 -
Quoted Prices | | | Level 2 -
Other Significant
Observable Inputs | | | Level 3 -
Significant
Unobservable Inputs | |
Assets | | | | | | | | | | | | |
Investments in Securities: | | | | | | | | | | | | |
Common Stocks | | $ | 7,747,968 | | | $ | — | | | $ | — | |
| | | | |
Total Assets | | $ | 7,747,968 | | | $ | — | | | $ | — | |
The Long-Term Care ETF
Statement of Assets and Liabilities
October 31, 2018
| | | | |
Assets: | | | | |
Unaffiliated investments, at value(1) | | $ | 7,747,968 | |
Receivables: | | | | |
Investments sold | | | 1,185,219 | |
Dividends | | | 31,167 | |
Total Assets | | | 8,964,354 | |
Liabilities: | | | | |
Payables: | | | | |
Due to custodian | | | 12,226 | |
Investments purchased | | | 1,200,158 | |
Management fees | | | 3,833 | |
Total Liabilities | | | 1,216,217 | |
Net Assets | | $ | 7,748,137 | |
Net Assets Consists of: | | | | |
Capital (par value and paid-in surplus) | | $ | 7,956,333 | |
Total distributable earnings (loss) | | | (208,196) | |
Total Net Assets | | $ | 7,748,137 | |
Net Assets | | $ | 7,748,137 | |
Shares outstanding, $0.001 Par Value (unlimited shares authorized) | | | 300,001 | |
Net Asset Value Per Share | | $ | 25.83 | |
| (1) | Includes cost of $7,653,862. |
See Notes to Financial Statements.
| | |
| | Janus Detroit Street Trust ½ 9 |
The Long-Term Care ETF
Statement of Operations
For the year ended October 31, 2018
| | | | |
Investment Income: | | | | |
Dividends | | $ | 275,995 | |
Affiliated securities lending income, net | | | 1,450 | |
Foreign tax withheld | | | (8,824) | |
Total Investment Income | | | 268,621 | |
Expenses: | | | | |
Management Fees | | | 48,510 | |
Total Expenses | | | 48,510 | |
Net Investment Income/(Loss) | | | 220,111 | |
Net Realized Gain/(Loss) on Investments: | | | | |
Investments and foreign currency transactions | | $ | 56,886 | |
Total Net Realized Gain/(Loss) on Investments | | $ | 56,886 | |
Change in Unrealized Net Appreciation/Depreciation: | | | | |
Investments and foreign currency translations | | $ | 459,538 | |
Total Change in Unrealized Net Appreciation/Depreciation | | $ | 459,538 | |
Net Increase/(Decrease) in Net Assets Resulting from Operations | | $ | 736,535 | |
See Notes to Financial Statements.
The Long-Term Care ETF
Statements of Changes in Net Assets
| | | | | | | | |
| | | Year Ended
October 31, 2018 | | | Year Ended
October 31, 2017 | |
Operations: | | | | | | | | |
Net investment income/(loss) | | $ | 220,111 | | | $ | 184,931 | |
Net realized gain/(loss) on investments | | | 56,886 | | | | (81,002) | |
Change in unrealized net appreciation/depreciation | | | 459,538 | | | | (303,267) | |
Net Increase/(Decrease) in Net Assets Resulting from Operations | | | 736,535 | | | | (199,338) | |
Dividends and Distributions to Shareholders: | | | | | | | | |
Dividends and Distributions | | | (220,395) | | | | N/A | |
Dividends from Net Investment Income(1) | | | N/A | | | | (184,738) | |
Return of Capital on Dividends from Net Investment Income(1) | | | N/A | | | | (22,237) | |
Net Decrease from Dividends and Distributions to Shareholders | | | (220,395) | | | | (206,975) | |
Capital Share Transactions | | | (2,512,201) | | | | 5,252,211 | |
Net Increase/(Decrease) in Net Assets | | | (1,996,061) | | | | 4,845,898 | |
Net Assets: | | | | | | | | |
Beginning of year | | | 9,744,198 | | | | 4,898,300 | |
End of year(2) | | $ | 7,748,137 | | | $ | 9,744,198 | |
| (1) | The requirement to disclose dividends and distributions paid to shareholders from net investment income and/or net realized gain from investment transactions was eliminated by the U.S. Securities and Exchange Commission (“SEC”) in 2018. |
| (2) | The requirement to disclose undistributed (overdistributed) net investment income was eliminated by the SEC in 2018. |
See Notes to Financial Statements.
| | |
| | Janus Detroit Street Trust ½ 11 |
The Long-Term Care ETF
Financial Highlights
| | | | | | | | | | | | | | |
| For a share outstanding during each year or period ended October 31 | | 2018 | | | 2017 | | | 2016(1) | |
| | Net Asset Value, Beginning of Period | | | $24.36 | | | | $24.49 | | | | $25.38 | |
| | Income/(Loss) from Investment Operations: | | | | | | | | | | | | |
| | Net investment income/(loss)(2) | | | 0.56 | | | | 0.66 | | | | 0.21 | |
| | Net realized and unrealized gain/(loss) | | | 1.46 | | | | (0.01) | | | | (0.84) | |
| | Total from Investment Operations | | | 2.02 | | | | 0.65 | | | | (0.63) | |
| | Less Dividends and Distributions: | | | | | | | | | | | | |
| | Dividends (from net investment income) | | | (0.55) | | | | (0.72) | | | | (0.21) | |
| | Return of Capital | | | — | | | | (0.06) | | | | (0.05) | |
| | Total Dividends and Distributions | | | (0.55) | | | | (0.78) | | | | (0.26) | |
| | Net Asset Value, End of Period | | | $25.83 | | | | $24.36 | | | | $24.49 | |
| | Total Return* | | | 8.44% | | | | 2.66% | | | | (2.56)% | |
| | Net assets, End of Period (in thousands) | | | $7,748 | | | | $9,744 | | | | $4,898 | |
| | Average Net Assets for the Period (in thousands) | | | $9,702 | | | | $7,044 | | | | $2,627 | |
| | Ratios to Average Net Assets**: | | | | | | | | | | | | |
| | Ratio of Gross Expenses | | | 0.50% | | | | 0.50% | | | | 0.50% | |
| | Ratio of Net Investment Income/(Loss) | | | 2.27% | | | | 2.63% | | | | 2.07% | |
| | Portfolio Turnover Rate(3) | | | 38% | | | | 19% | | | | 5% | |
| * | Total return not annualized for periods of less than one full year. |
| ** | Annualized for periods of less than one full year. |
| (1) | Period from June 8, 2016 (commencement of operations) through October 31, 2016. |
| (2) | Per share amounts are calculated based on average shares outstanding during the year or period. |
| (3) | Portfolio turnover rate excludes securities received or delivered from in-kind processing of creation or redemptions. |
See Notes to Financial Statements.
The Long-Term Care ETF
Notes to Financial Statements
1. Organization and Significant Accounting Policies
The Long-Term Care ETF (the “Fund”) is a series fund. The Fund is part of Janus Detroit Street Trust (the “Trust”), which is organized as a Delaware statutory trust and is registered under the Investment Company Act of 1940, as amended (the “1940 Act”), as an open-end management investment company, and therefore has applied the specialized accounting and reporting guidance in Financial Accounting Standards Board (“FASB”) Accounting Standards Codification (“ASC”) Topic 946. The Trust offers seven Funds each of which represent shares of beneficial interest in a separate portfolio of securities and other assets with its own objective and policies. The Fund seeks investment results that correspond generally to the performance, before fees and expenses, of an index (Underlying Index) which is designed to track the performance of companies globally that are positioned to profit from providing long-term care to the aging population, including companies owning or operating senior living facilities, nursing services, specialty hospitals, and senior housing, biotech companies for age-related illnesses, and companies that sell products and services to such facilities. The Fund is classified as nondiversified, as defined in the 1940 Act.
Unlike shares of traditional mutual funds, shares of the Fund are not individually redeemable and may only be purchased or redeemed directly from the Fund at net asset value (“NAV”) in large increments called “Creation Units” (25,000 or more shares per Creation Unit) through certain participants, known as “Authorized Participants.” The Fund will issue or redeem Creation Units in exchange for portfolio securities and/or cash. Except when aggregated in Creation Units, Fund shares are not redeemable securities of the Fund. Shares of the Fund are listed and trade on The NASDAQ Stock Market LLC (“NASDAQ”) and individual investors can purchase or sell shares in much smaller increments and for cash in the secondary market through a broker. These transactions, which do not involve the Fund, are made at market prices that may vary throughout the day and differ from the Fund’s NAV. As a result, you may pay more than NAV (a premium) when you purchase shares, and receive less than NAV (a discount) when you sell shares, in the secondary market.
An Authorized Participant may hold of record more than 25% of the outstanding shares of the Fund. From time to time, Authorized Participants may be a beneficial and/or legal owner of the Fund, may be affiliated with an index provider, may be deemed to have control of the Fund and/or may be able to affect the outcome of matters presented for a vote of the shareholders of the Fund. Authorized Participants may execute an irrevocable proxy granting the Distributor or an affiliate of Janus Capital Management LLC (“Janus Capital” or “Janus”) power to vote or abstain from voting such Authorized Participant’s beneficially or legally owned shares of the Fund. In such cases, the agent shall mirror vote (or abstain from voting) such shares in the same proportion as all other beneficial owners of the Fund.
The following accounting policies have been followed by the Fund and are in conformity with accounting principles generally accepted in the United States of America.
Investment Valuation
Securities held by the Fund are valued in accordance with policies and procedures established by and under the supervision of the Trustees (the “Valuation Procedures”). Equity securities, including shares of exchange-traded funds, traded on a domestic securities exchange are generally valued at the closing prices on the primary market or exchange on which they trade. If such price is lacking for the trading period immediately preceding the time of determination, such securities are valued at their current bid price. Equity securities that are traded on a foreign exchange are generally valued at the closing prices on such markets. In the event that there is no current trading volume on a particular security in such foreign exchange, the bid price from the primary exchange is generally used to value the security. Securities that are traded on the over-the-counter (“OTC”) markets are generally valued at their closing or latest bid prices as available. Foreign securities and currencies are converted to U.S. dollars using the applicable exchange rate in effect at the close of the New York Stock Exchange (“NYSE”). The Fund will determine the market value of individual securities held by it by using prices provided by one or more approved professional pricing services or, as needed, by obtaining market quotations from independent broker-dealers. Most debt securities are valued in accordance with the evaluated bid price supplied by the pricing service that is intended to reflect market value. The evaluated bid price supplied by the pricing service is an evaluation that may consider factors such as security prices, yields, maturities and ratings. Certain short-term securities maturing within 60 days or less may be evaluated and valued on an amortized cost basis provided that the amortized cost determined approximates market value. Securities for which market quotations or evaluated prices are not readily available or are deemed by Janus Capital to be unreliable are valued at fair value determined in good faith under the Valuation Procedures. Circumstances in which fair value pricing may be utilized include, but are not limited to: (i) a significant event that may affect the securities of a single issuer, such as a merger, bankruptcy, or significant issuer-specific development; (ii) an event that may affect an entire market, such as a natural disaster or significant governmental action; (iii) a nonsignificant event such as a market closing early or not opening, or a security trading halt; and (iv) pricing of a nonvalued security and a restricted or nonpublic security. Special valuation considerations may apply with respect to
| | |
| | Janus Detroit Street Trust ½ 13 |
The Long-Term Care ETF
Notes to Financial Statements
“odd-lot” fixed-income transactions which, due to their small size, may receive evaluated prices by pricing services which reflect a large block trade and not what actually could be obtained for the odd-lot position.
Valuation Inputs Summary
FASB ASC 820, Fair Value Measurements and Disclosures (“ASC 820”), defines fair value, establishes a framework for measuring fair value, and expands disclosure requirements regarding fair value measurements. This standard emphasizes that fair value is a market-based measurement that should be determined based on the assumptions that market participants would use in pricing an asset or liability and establishes a hierarchy that prioritizes inputs to valuation techniques used to measure fair value. These inputs are summarized into three broad levels:
Level 1 – Unadjusted quoted prices in active markets the Fund has the ability to access for identical assets or liabilities.
Level 2 – Observable inputs other than unadjusted quoted prices included in Level 1 that are observable for the asset or liability either directly or indirectly. These inputs may include quoted prices for the identical instrument on an inactive market, prices for similar instruments, interest rates, prepayment speeds, credit risk, yield curves, default rates and similar data.
Assets or liabilities categorized as Level 2 in the hierarchy generally include: debt securities fair valued in accordance with the evaluated bid or ask prices supplied by a pricing service; securities traded on OTC markets and listed securities for which no sales are reported that are fair valued at the latest bid price (or yield equivalent thereof) obtained from one or more dealers transacting in a market for such securities or by a pricing service approved by the Fund’s Trustees; and certain short-term debt securities with maturities of 60 days or less that are fair valued at amortized cost. Other securities that may be categorized as Level 2 in the hierarchy include, but are not limited to, preferred stocks, bank loans, swaps, investments in unregistered investment companies, options, and forward contracts.
Level 3 – Unobservable inputs for the asset or liability to the extent that relevant observable inputs are not available, representing the Fund’s own assumptions about the assumptions that a market participant would use in valuing the asset or liability, and that would be based on the best information available.
There have been no significant changes in valuation techniques used in valuing any such positions held by the Fund since the beginning of the fiscal year.
The inputs or methodology used for fair valuing securities are not necessarily an indication of the risk associated with investing in those securities. The summary of inputs used as of October 31, 2018 to fair value the Fund’s investments in securities and other financial instruments is included in the “Valuation Inputs Summary” in the Notes to Schedule of Investments and Other Information.
The Fund recognizes transfers between the levels as of the beginning of the fiscal year. The following describes the amounts of transfers between Level 1, Level 2, and Level 3 of the fair value hierarchy during the year.
There were no transfers between Level 1, Level 2 and Level 3 of the fair value hierarchy during the period. The Fund recognizes transfers between the levels as of the beginning of the fiscal year.
Investment Transactions and Investment Income
Investment transactions are accounted for as of the date purchased or sold (trade date). Dividend income is recorded on the ex-dividend date. Certain dividends from foreign securities will be recorded as soon as the Fund is informed of the dividend, if such information is obtained subsequent to the ex-dividend date. Dividends from foreign securities may be subject to withholding taxes in foreign jurisdictions. Gains and losses are determined on the identified cost basis, which is the same basis used for federal income tax purposes.
Estimates
The preparation of financial statements in conformity with accounting principles generally accepted in the United States of America requires management to make estimates and assumptions that affect the reported amount of assets and liabilities and disclosure of contingent assets and liabilities at the date of the financial statements and the reported amounts of income and expenses during the reporting period. Actual results could differ from those estimates.
Indemnifications
In the normal course of business, the Fund may enter into contracts that contain provisions for indemnification of other parties against certain potential liabilities. The Fund’s maximum exposure under these arrangements is unknown, and
The Long-Term Care ETF
Notes to Financial Statements
would involve future claims that may be made against the Fund that have not yet occurred. Currently, the risk of material loss from such claims is considered remote.
Foreign Currency Translations
The Fund does not isolate that portion of the results of operations resulting from the effect of changes in foreign exchange rates on investments from the fluctuations arising from changes in market prices of securities held at the date of the financial statements. Net unrealized appreciation or depreciation of investments and foreign currency translations arise from changes in the value of assets and liabilities, including investments in securities held at the date of the financial statements, resulting from changes in the exchange rates and changes in market prices of securities held.
Currency gains and losses are also calculated on payables and receivables that are denominated in foreign currencies. The payables and receivables are generally related to foreign security transactions and income translations.
Foreign currency-denominated assets and forward currency contracts may involve more risks than domestic transactions, including currency risk, counterparty risk, political and economic risk, regulatory risk and equity risk. Risks may arise from unanticipated movements in the value of foreign currencies relative to the U.S. dollar.
Dividends and Distributions
The Fund generally declares and distributes dividends of net investment income quarterly. Net realized capital gains (if any) are distributed annually. The Fund may treat a portion of the amount paid to redeem shares as a distribution of investment company taxable income and realized capital gains that are reflected in the NAV. This practice, commonly referred to as “equalization,” has no effect on the redeeming shareholder or a Fund’s total return, but may reduce the amounts that would otherwise be required to be paid as taxable dividends to the remaining shareholders. It is possible that the Internal Revenue Service (IRS) could challenge the Fund’s equalization methodology or calculations, and any such challenge could result in additional tax, interest, or penalties to be paid by the Fund.
The Fund may make certain investments in real estate investment trusts (“REITs”) which pay dividends to their shareholders based upon funds available from operations. It is quite common for these dividends to exceed the REITs’ taxable earnings and profits, resulting in the excess portion of such dividends being designated as a return of capital. If the Fund distributes such amounts, such distributions could constitute a return of capital to shareholders for federal income tax purposes.
Federal Income Taxes
The Fund intends to continue to qualify as a regulated investment company and distribute all of its taxable income in accordance with the requirements of Subchapter M of the Internal Revenue Code. Management has analyzed the Fund’s tax positions taken for all open federal income tax years, generally a three-year period, and has concluded that no provision for federal income tax is required in the Fund’s financial statements. The Fund is not aware of any tax positions for which it is reasonably possible that the total amounts of unrecognized tax benefits will significantly change in the next twelve months.
On December 22, 2017, the Tax Cuts and Jobs Act was signed into law. Currently, Management does not believe the bill will have a material impact on the Fund’s intention to continue to qualify as a regulated investment company, which is generally not subject to U.S. federal income tax.
2. Other Investments and Strategies
Additional Investment Risk
The financial crisis in both the U.S. and global economies over the past several years has resulted, and may continue to result, in a significant decline in the value and liquidity of many securities of issuers worldwide in the equity and fixed income/credit markets. In response to the crisis, the United States and certain foreign governments, along with the U.S. Federal Reserve and certain foreign central banks, took steps to support the financial markets. The withdrawal of this support, a failure of measures put in place to respond to the crisis, or investor perception that such efforts were not sufficient could each negatively affect financial markets generally, and the value and liquidity of specific securities. In addition, policy and legislative changes in the United States and in other countries continue to impact many aspects of financial regulation. The effect of these changes on the markets, and the practical implications for market participants, including the Fund, may not be fully known for some time and could limit or preclude the Fund’s ability to achieve its investment objective. Therefore, it is important to understand that the value of your investment may fall, sometimes sharply, and you could lose money.
| | |
| | Janus Detroit Street Trust ½ 15 |
The Long-Term Care ETF
Notes to Financial Statements
The enactment of the Dodd-Frank Wall Street Reform and Consumer Protection Act (the “Dodd-Frank Act”) provided for widespread regulation of financial institutions, consumer financial products and services, broker-dealers, OTC derivatives, investment advisers, credit rating agencies, and mortgage lending, which expanded federal oversight in the financial sector, including the investment management industry. Certain provisions of the Dodd-Frank Act remain pending and will be implemented through future rulemaking. Therefore, the ultimate impact of the Dodd-Frank Act and the regulations under the Dodd-Frank Act on the Fund and the investment management industry as a whole, is not yet certain.
A number of countries in the European Union (“EU”) have experienced, and may continue to experience, severe economic and financial difficulties. In particular, many EU nations are susceptible to economic risks associated with high levels of debt, notably due to investments in sovereign debt of countries such as Greece, Italy, Spain, Portugal, and Ireland. Many non-governmental issuers, and even certain governments, have defaulted on, or been forced to restructure, their debts. Many other issuers have faced difficulties obtaining credit or refinancing existing obligations. Financial institutions have in many cases required government or central bank support, have needed to raise capital, and/or have been impaired in their ability to extend credit. As a result, financial markets in the EU experienced extreme volatility and declines in asset values and liquidity. Responses to these financial problems by European governments, central banks, and others, including austerity measures and reforms, may not work, may result in social unrest, and may limit future growth and economic recovery or have other unintended consequences. Further defaults or restructurings by governments and others of their debt could have additional adverse effects on economies, financial markets, and asset valuations around the world. Greece, Ireland, and Portugal have already received one or more “bailouts” from other Eurozone member states, and it is unclear how much additional funding they will require or if additional Eurozone member states will require bailouts in the future. The risk of investing in securities in the European markets may also be heightened due to the referendum in which the United Kingdom voted to exit the EU (known as “Brexit”). One or more other countries may also abandon the euro and/or withdraw from the EU, placing its currency and banking system in jeopardy.
Certain areas of the world have historically been prone to and economically sensitive to environmental events such as, but not limited to, hurricanes, earthquakes, typhoons, flooding, tidal waves, tsunamis, erupting volcanoes, wildfires or droughts, tornadoes, mudslides, or other weather-related phenomena. Such disasters, and the resulting physical or economic damage, could have a severe and negative impact on the Fund’s investment portfolio and, in the longer term, could impair the ability of issuers in which the Fund invests to conduct their businesses as they would under normal conditions. Adverse weather conditions may also have a particularly significant negative effect on issuers in the agricultural sector and on insurance companies that insure against the impact of natural disasters.
Real Estate Investing
The Fund may invest in equity securities of real estate-related companies to the extent such securities are included in the Underlying Index. Such companies may include those in the real estate industry or real estate-related industries. These securities may include common stocks, preferred and convertible securities of issuers in real estate-related industries. A REIT is a trust that invests in real estate-related projects, such as properties, mortgage loans, and construction loans. REITs are generally categorized as equity, mortgage, or hybrid REITs. A REIT may be listed on an exchange or traded OTC.
Counterparties
Fund transactions involving a counterparty are subject to the risk that the counterparty or a third party will not fulfill its obligation to the Fund (“counterparty risk”). Counterparty risk may arise because of the counterparty’s financial condition (i.e., financial difficulties, bankruptcy, or insolvency), market activities and developments, or other reasons, whether foreseen or not. A counterparty’s inability to fulfill its obligation may result in significant financial loss to the Fund. The Fund may be unable to recover its investment from the counterparty or may obtain a limited recovery, and/or recovery may be delayed. The extent of the Fund’s exposure to counterparty risk with respect to financial assets and liabilities approximates its carrying value.
The Fund may be exposed to counterparty risk through participation in various programs, including, but not limited to, lending its securities to third parties, cash sweep arrangements whereby the Fund’s cash balance is invested in one or more types of cash management vehicles, as well as investments in, but not limited to, repurchase agreements, and derivatives, including various types of swaps, futures and options. The Fund intends to enter into financial transactions with counterparties that Janus Capital believes to be creditworthy at the time of the transaction. There is always the risk that Janus Capital’s analysis of a counterparty’s creditworthiness is incorrect or may change due to market conditions. To the extent that the Fund focuses its transactions with a limited number of counterparties, it will have greater exposure to the risks associated with one or more counterparties.
The Long-Term Care ETF
Notes to Financial Statements
Securities Lending
Under procedures adopted by the Trustees, the Fund may seek to earn additional income by lending securities to qualified parties. Deutsche Bank AG acts as securities lending agent and a limited purpose custodian or subcustodian to receive and disburse cash balances and cash collateral, hold short-term investments, hold collateral, and perform other custodian functions. The Fund may lend portfolio securities in an amount equal to up to 1/3 of its total assets as determined at the time of the loan origination. There is the risk of delay in recovering a loaned security or the risk of loss in collateral rights if the borrower fails financially. In addition, Janus Capital makes efforts to balance the benefits and risks from granting such loans. All loans will be continuously secured by collateral which may consist of cash, U.S. Government securities, domestic and foreign short-term debt instruments, letters of credit, time deposits, repurchase agreements, money market mutual funds or other money market accounts, or such other collateral as permitted by the SEC. If the Fund is unable to recover a security on loan, the Fund may use the collateral to purchase replacement securities in the market. There is a risk that the value of the collateral could decrease below the cost of the replacement security by the time the replacement investment is made, resulting in a loss to the Fund.
Upon receipt of cash collateral, Janus Capital may invest it in affiliated or non-affiliated cash management vehicles, whether registered or unregistered entities, as permitted by the 1940 Act and rules promulgated thereunder. Janus Capital currently intends to invest the cash collateral in a cash management vehicle for which Janus Capital serves as investment adviser, Janus Henderson Cash Collateral Fund LLC. An investment in Janus Henderson Cash Collateral Fund LLC is generally subject to the same risks that shareholders experience when investing in similarly structured vehicles, such as the potential for significant fluctuations in assets as a result of the purchase and redemption activity of the securities lending program, a decline in the value of the collateral, and possible liquidity issues. Such risks may delay the return of the cash collateral and cause the Fund to violate its agreement to return the cash collateral to a borrower in a timely manner. As adviser to the Fund and Janus Henderson Cash Collateral Fund LLC, Janus Capital has an inherent conflict of interest as a result of its fiduciary duties to both the Fund and Janus Henderson Cash Collateral Fund LLC. Additionally, Janus Capital receives an investment advisory fee of 0.05% for managing Janus Henderson Cash Collateral Fund LLC, but it may not receive a fee for managing certain other affiliated cash management vehicles in which the Fund may invest, and therefore may have an incentive to allocate preferred investment opportunities to investment vehicles for which it is receiving a fee.
The value of the collateral must be at least 102% of the market value of the loaned securities that are denominated in U.S. dollars and 105% of the market value of the loaned securities that are not denominated in U.S. dollars. Loaned securities and related collateral are marked-to-market each business day based upon the market value of the loaned securities at the close of business, employing the most recent available pricing information. Collateral levels are then adjusted based on this mark-to-market evaluation.
The cash collateral invested by Janus Capital is disclosed in the Schedule of Investments (if applicable). Income earned from the investment of the cash collateral, net of rebates paid to, or fees paid by, borrowers and less the fees paid to the lending agent are included as “Affiliated securities lending income, net” on the Statement of Operations. There were no securities on loan as of October 31, 2018.
3. Investment Advisory Agreements and Other Transactions with Affiliates
Under its unitary fee structure, the Fund pays Janus Capital a management fee in return for providing certain investment advisory, supervisory, and administrative services to the Fund, including the costs of transfer agency, custody, fund administration, legal, audit, and other services. Janus Capital’s fee structure is designed to pay substantially all of the Fund’s expenses. However, the Fund bears other expenses which are not covered under the management fee which may vary and affect the total level of expenses paid by shareholders, such as distribution fees (if any), brokerage expenses or commissions, interest, dividends, taxes, litigation expenses, acquired fund fees and expenses (if any), and extraordinary expenses. The Fund’s management fee is calculated daily and paid monthly. For the fiscal year ended October 31, 2018, the Fund’s contractual management fee rate (expressed as an annual rate) was 0.50% of the Fund’s average daily net assets.
State Street Bank and Trust Company (“State Street”) provides certain fund administration services to the Fund, including services related to the Fund’s accounting, including calculating the daily NAV, audit, tax, and reporting obligations, pursuant to an agreement with Janus Capital, on behalf of the Fund. As compensation for such services, Janus Capital pays State Street a fee based on a percentage of the Fund’s assets, with a minimum flat fee, for certain services. Janus Capital serves as administrator to the Fund, providing oversight and coordination of the Fund’s service providers, recordkeeping and other administrative services. Janus Capital does not receive any additional compensation, beyond the unitary fee, for serving as administrator. State Street also serves as transfer agent for the shares of the Fund. Pursuant to
| | |
| | Janus Detroit Street Trust ½ 17 |
The Long-Term Care ETF
Notes to Financial Statements
agreements with Janus Capital on behalf of the Fund, State Street Global Markets, an affiliate of State Street, may execute portfolio transactions for the Fund, including but not limited to, transactions in connection with cash in lieu transactions for non-US securities.
Due to an administrative oversight by its administrator, the Fund’s Distribution and Servicing Plan, pursuant to Rule 12b-1 under the 1940 Act that was originally approved at the time of the Fund’s formation (“Initial Rule 12b-1 Plan”), could be viewed to have expired on or about February 11, 2017. The Initial Rule 12b-1 Plan was never implemented, and 12b-1 fees were not charged, prior to its potential expiration. At an in-person meeting held on July 18, 2018, the Fund’s Board of Trustees (“Board”) approved a new Rule 12b-1 Plan (the “Plan”) with respect to the Fund, with terms that are substantively identical to the Initial Rule 12b-1 Plan. Because the Fund has commenced operations, the Plan must also be approved by the Fund’s shareholders prior to implementation. At this time, Janus Capital does not intend to seek shareholder approval for implementation of the Plan. The Plan would permit compensation in connection with the distribution and marketing of Fund shares and/or the provision of certain shareholder services. The Plan would permit the Fund to pay ALPS Distributors, Inc. (the “Distributor”) or its designee, a fee for the sale and distribution and/or shareholder servicing of the shares at an annual rate of up to 0.25% of average daily net assets of the Fund. Under the terms of the Plan, the Trust would be authorized to make payments to the Distributor or its designee for remittance to retirement plan service providers, broker-dealers, bank trust departments, financial advisors, and other financial intermediaries, as compensation for distribution and/or shareholder services performed by such entities for their customers who are investors in the Fund. However, implementation of the Plan and imposition of the 12b-1 fee would require prior approval by Fund shareholders via proxy vote. Janus Capital does not anticipate seeking such approval at this time. Because 12b-1 fees are paid out of the fund assets on an ongoing basis, to the extent that such a fee is authorized by shareholders in the future, over time they will increase the cost of an investment in the Fund. If implemented, the Plan fee may cost an investor more than other types of sales charges.
As of October 31, 2018, Janus Capital owned 1 share or less than 0.0% of the Fund.
Any purchases and sales, realized gains/losses and recorded dividends from affiliated investments during the year ended October 31, 2018 can be found in a table located in the Schedule of Investments.
4. Federal Income Tax
The tax components of capital shown in the table below represent: (1) distribution requirements the Fund must satisfy under the income tax regulations; (2) losses or deductions the Fund may be able to offset against income and gains realized in future years; and (3) unrealized appreciation or depreciation of investments for federal income tax purposes.
Other book to tax differences primarily consist of derivatives, and foreign currency contract adjustments. The Fund has elected to treat gains and losses on forward foreign currency contracts as capital gains and losses, if applicable. Other foreign currency gains and losses on debt instruments are treated as ordinary income for federal income tax purposes pursuant to Section 988 of the Internal Revenue Code.
| | | | | | | | | | | | | | | | | | | | | | | | | | |
| | | | | | | | | | Loss Deferrals | | | | | | | |
Undistributed
Ordinary Income | | | Undistributed
Long-Term Gains | | | Accumulated
Capital Losses | | | Late-Year
Ordinary Loss | | | Post-October
Capital Loss | | | Other Book to Tax Differences | | | Net Tax Appreciation/ (Depreciation) | |
| $ | 23,560 | | | $ | — | | | $ | (317,447) | | | $ | — | | | $ | — | | | $ | (19) | | | $ | 85,710 | |
Accumulated capital losses noted below represent net capital loss carryovers, as of October 31, 2018, that may be available to offset future realized capital gains and thereby reduce future taxable gains distributions. The following table shows these capital loss carryovers.
| | | | | | | | | | |
Capital Loss Carryover Schedule
For the year ended October 31, 2018
No Expiration | | | Accumulated Capital Losses | |
| Short-Term | | | Long-Term | |
| $ | (78,838) | | | $ | (238,609) | | | $ | (317,447) | |
The Long-Term Care ETF
Notes to Financial Statements
The aggregate cost of investments and the composition of unrealized appreciation and depreciation of investment securities for federal income tax purposes as of October 31, 2018 are noted below. The primary difference between book and tax appreciation or depreciation of investments is wash sale loss deferrals.
| | | | | | | | | | | | | | |
| Federal Tax Cost | | | Unrealized
Appreciation | | | Unrealized
(Depreciation) | | | Net Tax Appreciation/
(Depreciation) | |
| $ | 7,662,258 | | | $ | 643,266 | | | $ | (557,556) | | | $ | 85,710 | |
Income and capital gains distributions are determined in accordance with income tax regulations that may differ from accounting principles generally accepted in the United States of America. These differences are due to differing treatments for items such as net short-term gains, deferral of wash sale losses, foreign currency transactions, passive foreign investment companies, net investment losses, in-kind transactions and capital loss carryovers. Certain permanent differences such as tax returns of capital and net investment losses noted below have been reclassified to capital.
| | | | | | | | | | | | | | |
| For the year ended October 31, 2018: | |
| Distributions | | | | |
| From Ordinary Income | | | From Long-Term Capital Gain | | | Tax Return of Capital | | | Net Investment Loss | |
| $ | 220,395 | | | $ | — | | | $ | — | | | $ | — | |
|
| For the year ended October 31, 2017: | |
| Distributions | | | | |
| From Ordinary Income | | | From Long-Term Capital Gain | | | Tax Return of Capital | | | Net Investment Loss | |
| $ | 162,210 | | | $ | — | | | $ | 44,765 | | | $ | — | |
Permanent book to tax basis differences may result in reclassifications between the components of net assets. These differences have no impact on the results of operations or net assets. The following reclassifications have been made to the Fund:
| | | | | | | | | | |
| Increase/(Decrease) to Capital | | | Increase/(Decrease) to Undistributed
Net Investment Income/Loss | | | Increase/(Decrease) to Undistributed
Net realized Gain/Loss | |
| $ | 276,996 | | | $ | 23,844 | | | $ | (300,840) | |
5. Capital Share Transactions
| | | | | | | | | | | | | | | | |
| | | Year ended October 31, 2018 | | | Year ended October 31, 2017 | |
| | | Shares | | | Amount | | | Shares | | | Amount | |
| Shares sold | | | — | | | | — | | | | 200,000 | | | $ | 5,252,211 | |
| Shares repurchased | | | (100,000) | | | $ | (2,512,201) | | | | — | | | | — | |
Net Increase/(Decrease) | | | (100,000) | | | $ | (2,512,201) | | | | 200,000 | | | $ | 5,252,211 | |
6. Purchases and Sales of Investment Securities
For the year ended October 31, 2018, the aggregate cost of purchases and proceeds from sales of investment securities (excluding any short-term securities, short-term options contracts, and in-kind transactions) was as follows:
| | | | | | | | | | | | | | |
Purchases of
Securities | | | Proceeds from Sales of Securities | | | Purchases of Long- Term U.S. Government Obligations | | | Proceeds from Sales of Long-Term U.S. Government Obligations | |
| $ | 3,803,846 | | | $ | 3,641,006 | | | $ | — | | | $ | — | |
| | |
| | Janus Detroit Street Trust ½ 19 |
The Long-Term Care ETF
Notes to Financial Statements
For the year ended October 31, 2018, the cost of in-kind purchases and proceeds from in-kind sales, were as follows:
| | | | | | | | | | | | | | |
Purchases of Securities | | | Proceeds from Sales of Securities | | | Purchases of Long- Term U.S. Government Obligations | | | Proceeds from Sales of Long-Term U.S. Government Obligations | |
| $ | — | | | $ | 2,510,495 | | | $ | — | | | $ | — | |
During the year ended October 31, 2018, the Fund had net realized gain/(loss) of $308,306 from in-kind redemptions. Gains on in-kind transactions are not considered taxable for federal income tax purposes.
7. Recent Accounting Pronouncements
The Securities and Exchange Commission adopted amendments to Regulation S-X, for the presentation of distributable earnings and distributions to align with US Generally Accepted Accounting Principles (GAAP). The compliance date of the amendments to Regulation S-X is November 5, 2018. This report incorporates the amendments to Regulation S-X.
The FASB issued Accounting Standards Update 2018-13, Fair Value Measurement (Topic 820) in August 2018. The new guidance removes, modifies and enhances the disclosures to Topic 820. For public entities, the amendments are effective for financial statements issued for fiscal years beginning after December 15, 2019, and interim periods within those fiscal years. Management is currently evaluating the impact of this new guidance on the financial statements.
The FASB issued Accounting Standards Update No. 2017-08, Receivables – Nonrefundable Fees and Other Costs (Subtopic 310-20), Premium Amortization on Purchased Callable Debt Securities (“ASU 2017-08”) to amend the amortization period for certain purchased callable debt securities held at a premium. The guidance requires certain premiums on callable debt securities to be amortized to the earliest call date. The amortization period for callable debt securities purchased at a discount will not be impacted. The amendments are effective for fiscal years, and interim periods within those fiscal years, beginning after December 15, 2018. Early adoption is permitted, including adoption in an interim period. Management is currently evaluating the impacts of ASU 2017-08 on the Fund’s financial statements.
8. Subsequent Events
Management has evaluated whether any events or transactions occurred subsequent to October 31, 2018 and through the date of issuance of the Fund’s financial statements and determined that there were no material events or transactions that would require recognition or disclosure in the Fund’s financial statements other than the following:
The Fund’s Board of Trustees (“Board”) approved an amendment (“Amendment”) to the Investment Advisory and Management Agreement that provides for a new management fee rate schedule that reduces the annual management fee rate payable by the Fund to Janus Capital and also provides for further management fee rate reductions as assets grow. The new annual management fee rate schedule is effective November 1, 2018. A chart comparing the Fund’s historical management fee to the new management fee schedule (each expressed as an annual rate) is provided below.
| | | | | | | | |
Historical Average Daily Net Assets | | | New Daily Net Assets | |
| | | | $0-$500 million | | | 0.35% | |
| | 0.50% | | | Next $500 million | | | 0.28% | |
| | | | | Over $1 billion | | | 0.20% | |
The Long-Term Care ETF
Additional Information (unaudited)
Proxy Voting Policies and Voting Record
A description of the policies and procedures that the Fund uses to determine how to vote proxies relating to its portfolio securities is available without charge: (i) upon request, by calling 1-800-525-0020 (toll free); (ii) on the Fund’s website at janushenderson.com/proxyvoting; and (iii) on the SEC’s website at http://www.sec.gov.
Quarterly Portfolio Holdings
The Fund files its complete portfolio holdings (schedule of investments) with the SEC for the first and third quarters of each fiscal year on Form N-Q within 60 days of the end of such fiscal quarter. The Fund’s Form N-Q: (i) is available on the SEC’s website at http://www.sec.gov; (ii) may be reviewed and copied at the SEC’s Public Reference Room in Washington, D.C. (information on the Public Reference Room may be obtained by calling 1-800-SEC-0330); and (iii) is available without charge, upon request, by calling Janus Henderson at 1-800-525-0020 (toll free).
Designation Requirements (unaudited)
For federal income tax purposes, the Fund designated the following for the year ended October 31, 2018
| | | | |
| Dividends Received Deduction Percentage | | | 2% | |
| Qualified Dividend Income Percentage | | | 29% | |
Licensing Agreements
Solactive AG (“Solactive”) is the Index Provider for the Underlying Index. Janus Capital has entered into a license agreement with Solactive to use the Underlying Index.
Neither Solactive nor any of its affiliates make any representation or warranty, express or implied, to the owners of a Fund or any member of the public regarding the advisability of investing in securities generally or in a Fund particularly or the ability of the Underlying Index to track general market performance. The Underlying Index is determined, composed, and calculated by Solactive without regard to Janus Capital or the Fund. Solactive has no obligation to take the needs of Janus Capital or the owners of the Fund into consideration in determining, composing, or calculating the Underlying Index. Solactive is not responsible for and has not participated in the determination of the timing of, prices at, or quantities of the Fund to be issued or in the determination or calculation of the equation by which the Fund is to be converted into cash.
ALTHOUGH SOLACTIVE SHALL OBTAIN INFORMATION FOR INCLUSION IN OR FOR USE IN THE CALCULATION OF THE UNDERLYING INDEX FROM SOURCES WHICH IT CONSIDERS RELIABLE, IT DOES NOT GUARANTEE THE QUALITY, ACCURACY AND/OR THE COMPLETENESS OF THE UNDERLYING INDEX OR ANY DATA INCLUDED THEREIN AND SHALL HAVE NO LIABILITY FOR ERRORS OR OMISSIONS OF ANY KIND RELATED TO THE UNDERLYING INDEX OR DATA. SOLACTIVE MAKES NO WARRANTY, EXPRESS OR IMPLIED, AS TO RESULTS TO BE OBTAINED BY JANUS CAPITAL, OWNERS OF THE FUND, OR ANY OTHER PERSON OR ENTITY FROM THE USE OF THE UNDERLYING INDEX OR ANY DATA INCLUDED THEREIN IN CONNECTION WITH THE RIGHTS LICENSED TO JANUS CAPITAL FOR ANY OTHER USE. SOLACTIVE MAKES NO EXPRESS OR IMPLIED WARRANTIES, AND HEREBY EXPRESSLY DISCLAIMS ALL WARRANTIES OF MERCHANTABILITY OR FITNESS FOR A PARTICULAR PURPOSE OR USE WITH RESPECT TO THE UNDERLYING INDEX OR ANY DATA INCLUDED THEREIN. WITHOUT LIMITING ANY OF THE FOREGOING, IN NO EVENT SHALL IT HAVE ANY LIABILITY FOR ANY SPECIAL, PUNITIVE, INDIRECT, OR CONSEQUENTIAL DAMAGES (INCLUDING LOST PROFITS), EVEN IF NOTIFIED OF THE POSSIBILITY OF SUCH DAMAGES.
Janus Capital does not guarantee the accuracy and/or the completeness of the Underlying Index or any data included therein, and Janus Capital shall have no liability for any errors, omissions or interruptions therein. Janus Capital makes no warranty, express or implied, as to results to be obtained by the Fund, owners of the shares of the Fund or any other person or entity from the use of the Underlying Index or any data included therein. Janus Capital makes no express or implied warranties, and expressly disclaims all warranties of merchantability or fitness for a particular purpose or use with respect to the Underlying Index or any data included therein. Without limiting any of the foregoing, in no event shall Janus Capital have any liability for any special, punitive, direct, indirect or consequential damages (including lost profits) arising out of matters relating to the use of the Underlying Index even if notified of the possibility of such damages.
| | |
| | Janus Detroit Street Trust ½ 21 |
The Long-Term Care ETF
Board Considerations Regarding Approval of Investment Advisory Agreements (unaudited)
APPROVAL OF AMENDMENT TO INVESTMENT ADVISORY AGREEMENT
At an in-person meeting held on October 9-10, 2018, the Trustees approved an amendment (“Amendment”) to the Investment Advisory and Management Agreement between the Trust and Janus Capital on behalf of Janus Henderson Small Cap Growth Alpha ETF, Janus Henderson Small/Mid Cap Growth Alpha ETF, The Long-Term Care ETF, The Obesity ETF, and The Organics ETF (each a “Fund” and, together, the “Funds”). The Amendment provided for a new management fee rate schedule that reduces the annual management fee rate payable by the Funds to Janus Capital and also provided for further management fee rate reductions as assets grow. A comparison of the prior and new unitary fee rate schedules (each expressed as an annual rate) is shown below.
| | | | | | | | |
Current Average Daily Net Assets | | | New Daily Net Assets | |
| | | | $0-$500 million | | | 0.35% | |
| | 0.50% | | | Next $500 million | | | 0.28% | |
| | | | | Over $1 billion | | | 0.20% | |
In connection with the Amendment approval, Janus Capital represented to the Trustees that there would be no change to the nature, quality and extent of services rendered by Janus Capital to the Fund. The Amendment is effective as of November 1, 2018.
The Long-Term Care ETF
Trustees and Officers (unaudited)
The Fund’s Statement of Additional Information includes additional information about the Trustees and officers and is available, without charge, by calling 1-877-335-2687.
The following are the Trustees and officers of the Trust, together with a brief description of their principal occupations during the last five years (principal occupations for certain Trustees may include periods over five years).
Each Trustee has served in that capacity since he or she was originally elected or appointed. The Trustees do not serve a specified term of office. Each Trustee will hold office until the termination of the Trust or his or her earlier death, resignation, retirement, incapacity, or removal. Under the Fund’s Governance Procedures and Guidelines, the policy is for Trustees to retire no later than the end of the calendar year in which the Trustee turns 75. The Trustees review the Fund’s Governance Procedures and Guidelines from time to time and may make changes they deem appropriate. The Fund’s Nominating and Governance Committee will consider nominees for the position of Trustee recommended by shareholders. Shareholders may submit the name of a candidate for consideration by the Committee by submitting their recommendations to the Trust’s Secretary. Each Trustee is currently a Trustee of one other registered investment company advised by Janus Capital: Clayton Series Trust. Collectively, these two registered investment companies consist of 10 series or funds.
The Trust’s officers are elected annually by the Trustees for a one-year term. Certain officers also serve as officers of Clayton Series Trust. Certain officers of the Fund may also be officers and/or directors of Janus Capital. Fund officers receive no compensation from the Fund, except for the Fund’s Chief Compliance Officer, as authorized by the Trustees.
| | | | | | | | | | | | | | | | | | |
| TRUSTEES | | | | | | | | | | | | | | |
| Name, Address, and Age | | Positions Held
with the Trust | | | Length of
Time Served | | | Principal Occupations During the Past Five Years | | Number of Portfolios/Funds
in Fund Complex Overseen by Trustee* | | | Other Directorships
Held by Trustee
During the Past Five Years | |
Independent Trustees | | | | | | | | | | | | | | | | | | |
Clifford J. Weber 151 Detroit Street Denver, CO 80206 DOB: 1963 | |
| Chairman
Trustee |
| |
| 2/16-Present
2/16-Present |
| | Owner, Financial Products Consulting Group LLC (consulting services to financial institutions) (since 2015). Formerly, Executive Vice President of Global Index and Exchange- Traded Products, NYSE Market, Inc., a subsidiary of Intercontinental Exchange (ETF/ETP listing exchange) (2013-2015) and Executive Vice President and Head of Strategy and Product Development, NYSE Liffe U.S., a division of NYSE Euronext (U.S. futures exchange) (2008-2013). | | | 10 | | |
| Independent Trustee, Clough
Funds Trust (investment
company) (since 2015).
Chairman, Clough Funds
Trust (since 2017),
Independent Trustee, Clough
Dividend and Income Fund
(closed-end fund)
(since 2017), Independent
Trustee, Clough Global
Opportunities Fund (closed-
end fund) (since 2017),
Independent Trustee, Clough
Global Equity Fund (closed-
end fund) (since 2017),
Independent Trustee,
Elevation ETF Trust
(investment company)
(2016-2018) Chairman,
Elevation ETF Trust
(2016-2018), and
Independent Trustee,
Global X Funds (investment
company) (since 2018). |
|
| | |
| | Janus Detroit Street Trust ½ 23 |
The Long-Term Care ETF
Trustees and Officers (unaudited)
| | | | | | | | | | | | | | | | | | |
| TRUSTEES | | | | | | | | | | | | | | |
| Name, Address, and Age | | Positions Held
with the Trust | | | Length of
Time Served | | | Principal Occupations During the Past Five Years | | Number of Portfolios/Funds
in Fund Complex Overseen by Trustee* | | | Other Directorships
Held by Trustee
During the Past Five Years | |
Maureen T. Upton 151 Detroit Street Denver, CO 80206 DOB: 1965 | | | Trustee | | | | 2/16-Present | | | Principal, Maureen Upton Ltd. (consulting services to developers of major infrastructure projects and investors) (since 2017). Formerly, Principal Consultant, SRK Consulting (U.S.), Inc. (consulting services to global mining, energy and water resource industries) (2015-2017) and Founder and Principal, Resource Initiatives LLC (sustainability consulting firm) (2006-2015). | | | 10 | | |
| Director, Denver Metro
Leadership Foundation
(non-profit organization)
(2012-2014). |
|
| | | | | |
Jeffrey B. Weeden 151 Detroit Street Denver, CO 80206 DOB: 1956 | | | Trustee | | | | 2/16-Present | | | Senior Advisor, BayBoston Capital LP (investment fund in finance companies, banks and bank holdings companies) (since 2015). Formerly, Management Advisor, BoxCast, Inc. (technology start-up company) (2014-2017) and Senior Executive Vice President and Chief Financial Officer, KeyCorp (financial services) (2002-2013). | | | 10 | | |
| Director, State Farm Bank
(banking) (since 2014). |
|
Interested Trustee | | | | | | | | | | | | | | | | | | |
Michael Drew Elder** 151 Detroit Street Denver, CO 80206 DOB: 1970 | | | Trustee | | | | 8/15-Present | | | Executive Vice President and Head of U.S. Intermediary Distribution, Janus Capital (since 2014) and President, Janus Distributors LLC (broker- dealer) (since 2014). Formerly, Senior Vice President, Janus Capital (2007-2014). | | | 10 | | |
| Director, Perkins Investment
Management LLC (since
2014). |
|
| * | In addition to the Trust, which is comprised of seven series, each Trustee also serves as a trustee to the Clayton Street Trust, which is an affiliated registered investment company currently comprised of three portfolios. |
| ** | Michael Drew Elder is an Interested Trustee because of his employment with Janus Capital. |
The Long-Term Care ETF
Trustees and Officers (unaudited)
| | | | | | |
| OFFICERS | | | | | | |
| Name, Address, and Age | | Positions Held with the Trust | | Term of Office* and Length of Time Served | | Principal Occupations During the Past Five Years |
Bruce L. Koepfgen 151 Detroit Street Denver, CO 80206 DOB: 1952 | | President and Chief Executive Officer | | 2/16-Present | | Head of North America for Janus Henderson Investors and Janus Capital Management LLC (since 2017); Executive Vice President and Director of Janus International Holding LLC (since 2011); Executive Vice President of Janus Distributors LLC (since 2011); Executive Vice President and Working Director of INTECH Investment Management LLC (since 2011); Executive Vice President and Director of Perkins Investment Management LLC (since 2011); and Executive Vice President and Director of Janus Management Holdings Corporation (since 2011). Formerly, President of Janus Capital Group Inc. and Janus Capital Management LLC (2013-2017); Executive Vice President of Janus Services LLC (2011-2015), Janus Capital Group Inc. and Janus Capital Management LLC (2011-2013); and Chief Financial Officer of Janus Capital Group Inc., Janus Capital Management LLC, Janus Distributors LLC, Janus Management Holdings Corporation, and Janus Services LLC (2011-2013). |
| | | |
Susan K. Wold 151 Detroit Street Denver, CO 80206 DOB: 1960 | | Vice President, Chief Compliance Officer, and Anti- Money Laundering Officer | | 9/17-Present | | Senior Vice President and Head of Compliance North America for Janus Henderson (since September 2017); Formerly Vice President, Head of Global Corporate Compliance, and Chief Compliance Officer for Janus Capital Management LLC (May 2017-September 2017); Vice President, Compliance at Janus Capital Group and Janus Capital Management LLC (2005-2017). |
| | | |
Jesper Nergaard 151 Detroit Street Denver, CO 80206 DOB: 1962 | | Vice President, Chief Financial Officer, Treasurer, and Principal Accounting Officer | | 2/16-Present | | Vice President of Janus Capital and Janus Services LLC. |
| | | |
Byron Hittle 151 Detroit Street Denver, CO 80206 DOB: 1974 | | Vice President, Secretary and Chief Legal Officer | | 7/18-Present | | Vice President and Assistant General Counsel of Janus Capital and Janus Services LLC (2017-present); Assistant Vice President and Senior Legal Counsel (2012-2016). |
| * | Officers are elected at least annually by the Trustees for a one-year term and may also be elected from time to time by the Trustees for an interim period. |
| | |
| | Janus Detroit Street Trust ½ 25 |
Knowledge. Shared
At Janus Henderson, we believe in the sharing of expert insight for better investment and business decisions. We call this ethos Knowledge. Shared.
Learn more by visiting janushenderson.com.
This report is submitted for the general information of shareholders of the Fund. It is not an offer or solicitation for the Fund and is not authorized for distribution to prospective investors unless preceded or accompanied by an effective prospectus.
Janus Henderson and Knowledge. Shared are trademarks of Janus Henderson Group plc or one of its subsidiary entities. © Janus Henderson Group plc.
Janus Capital Management LLC is the investment adviser and ALPS Distributors, Inc. is the distributor. ALPS is not affiliated with Janus Henderson or any of its subsidiaries.
ANNUAL REPORT
October 31, 2018
The Obesity ETF
Janus Detroit Street Trust

Table of Contents
The Obesity ETF (unaudited)
INVESTMENT OBJECTIVE
The Obesity ETF (SLIM) seeks investment results that correspond generally to the performance, before fees and expenses, of an index which is designed to track the performance of companies globally that are positioned to profit from servicing the obese, including biotechnology, pharmaceutical, health care and medical device companies whose business is focused on obesity and obesity related disease including diabetes, high blood pressure, cholesterol, heart disease, stroke, and sleep apnea, and companies focused on weight loss programs, weight loss supplements, or plus sized apparel.
PERFORMANCE OVERVIEW
| • | | Concerns over inflation and faster-than-expected interest rate hikes were a source of volatility, as were fears about protectionist trade policies. Gains were concentrated in the U.S., where economic data have been positive, driven by corporate earnings, synchronized economic growth and optimism about U.S. tax reform. The nomination of Jerome Powell as the next chair of the Federal Reserve (Fed) signaled the likely continuation of monetary policy normalization. Throughout the period, political and economic tensions in both developed economies outside the U.S. and emerging economies became increasingly prevalent. Highly uncertain Brexit negotiations and tensions between the EU and Italy weighed on European markets. Emerging markets continue to struggle as U.S. Treasury yields rise, and Asian markets are anticipating greater conflict with the U.S. |
| • | | The underlying Solactive Obesity Index outperformed the broader market as represented by the MSCI All Country World IndexSM. Within the Solactive Obesity Index, personal products and apparel retail delivered the strongest returns on a sub-industry basis. The weakest-performing sub-industries were led by Internet and direct marketing, and pharmaceuticals. |
| • | | During the period, SLIM returned 19.79% (based on NAV); its primary benchmark, the Solactive Obesity Index, returned 20.26%, and its secondary benchmark, the MSCI All Country World Index, returned -0.52%. |
| • | | SLIM seeks investment results that correspond generally, before fees and expenses, to the performance of its primary benchmark. It seeks exposure to companies globally that could benefit as they fight the global obesity epidemic. Such companies could include biotechnology, pharmaceutical, health care and medical device companies focused on obesity and obesity-related disease such as diabetes, high blood pressure, cholesterol, heart disease, stroke and sleep apnea. The ETF also includes companies focused on weight-loss programs, supplements and plus-size apparel. |
| | |
| | Janus Detroit Street Trust ½ 1 |
The Obesity ETF (unaudited)
Fund At A Glance
October 31, 2018
| | | | |
| 5 Largest Equity Holdings – (% of Net Assets) | |
Novo Nordisk A/S - Class B | | | | |
Pharmaceuticals | | | 20.8% | |
Fresenius Medical Care AG & Co. KGaA | | | | |
Health Care Providers & Services | | | 8.5% | |
ResMed, Inc. | | | | |
Health Care Equipment & Supplies | | | 7.5% | |
ABIOMED, Inc. | | | | |
Health Care Equipment & Supplies | | | 7.3% | |
DexCom, Inc. | | | | |
Health Care Equipment & Supplies | | | 5.8% | |
| | | | |
| | | 49.9% | |
| | | | |
| Sector Allocation – (% of Net Assets) | |
Consumer, Non-cyclical | | | 99.1% | |
Consumer, Cyclical | | | 0.9% | |
Investment Company Securities | | | 0.6% | |
| | | | |
| | | 100.6% | |
Holdings are subject to change without notice.
The Obesity ETF (unaudited)
Performance
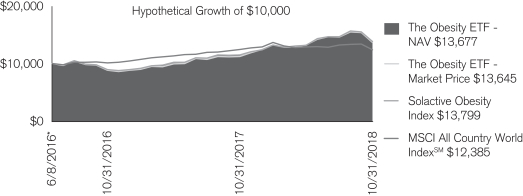
| | | | |
| Average Annual Total Return for the periods ended October 31, 2018 |
| | | One
Year | | Since
Inception* |
The Obesity ETF – NAV | | 19.79% | | 13.95% |
The Obesity ETF – Market Price | | 21.77% | | 13.84% |
Solactive Obesity Index | | 20.26% | | 14.38% |
MSCI All Country World IndexSM | | -0.52% | | 9.33% |
Total annual expense ratio as stated in the February 28, 2018 prospectus: 0.50%.
Returns quoted are past performance and do not guarantee future results; current performance may be lower or higher. Investment returns and principal value will vary; there may be a gain or loss when shares are sold. For the most recent month-end performance call 800.668.0434 or visit janushenderson.com/performance.
Shares of ETFs are bought and sold at market price (not NAV) and are not individually redeemed from the Fund. Market returns are based upon the midpoint of the bid/ask spread at 4:00 p.m. Eastern time (when NAV is normally determined for most ETFs), and do not represent the returns you would receive if you traded shares at other times. Ordinary brokerage commissions apply and will reduce returns.
ETF shares are not individually redeemable and owners of the shares may acquire those shares from the Fund and tender those shares for redemption to the Fund in Creation Units only.
Investing involves risk, including the possible loss of principal and fluctuation of value.
Performance depends on that of the underlying index.
See the prospectus for a more complete discussion of objectives, risks and expenses.
Returns include reinvestment of dividends and capital gains. Returns greater than one year are annualized. Returns do not reflect the deduction of taxes that a shareholder would pay on Fund distributions or redemptions of Fund shares.
See Financial Highlights for actual expense ratios during the reporting period.
There is no assurance the stated objective(s) will be met.
See Notes to Schedule of Investments and Other Information for index definitions.
Index performance does not reflect the expenses of managing a portfolio as an index is unmanaged and not available for direct investment.
Solactive Indices were created by and are maintained by, Solactive AG. For detailed information on how stocks are selected for inclusion in the Underlying Index, see solactive.com. Solactive is not affiliated with Janus Henderson or ALPS.
| * | The Fund commenced operations on June 8, 2016. |
| | |
| | Janus Detroit Street Trust ½ 3 |
The Obesity ETF (unaudited)
Disclosure of Fund Expenses
As a shareholder of the Fund, you incur two types of costs: (1) transaction costs, which may include creation and redemption fees or brokerage charges and (2) ongoing costs, including management fees and other Fund expenses. This example is intended to help you understand your ongoing costs (in dollars) of investing in the Fund and to compare these costs with the ongoing costs of investing in other ETFs. To do so, compare this 5% hypothetical example with the 5% hypothetical examples that appear in the shareholder reports of the other funds. The example is based upon an investment of $1,000 invested at the beginning of the period and held for the six-months indicated, unless noted otherwise in the table and footnotes below.
Actual Expenses
The information in the table under the heading “Actual” provides information about actual account values and actual expenses. You may use the information in these columns, together with the amount you invested, to estimate the expenses that you paid over the period. Simply divide your account value by $1,000 (for example, an $8,600 account value divided by $1,000 = 8.6), then multiply the result by the number under the heading entitled “Expenses Paid During Period” to estimate the expenses you paid on your account during the period.
Hypothetical Example for Comparison Purposes
The information in the table under the heading “Hypothetical (5% return before expenses)” provides information about hypothetical account values and hypothetical expenses based upon the Fund’s actual expense ratio and an assumed rate of return of 5% per year before expenses, which is not the Fund’s actual return. The hypothetical account values and expenses may not be used to determine the actual ending account balance or expenses you paid for the period. You may use this information to compare the ongoing costs of investing in the Fund and other funds. To do so, compare this 5% hypothetical example with the 5% hypothetical examples that appear in the shareholder reports of the other funds. Additionally, for an analysis of the fees associated with an investment or other similar funds, please visit www.finra.org/fundanalyzer.
Please note that the expenses shown in the table are meant to highlight your ongoing costs only and do not reflect any transaction costs, such as creation and redemption fees, or brokerage charges. These fees are fully described in the Fund’s prospectus. Therefore, the hypothetical examples are useful in comparing ongoing costs only, and will not help you determine the relative total costs of owning different funds. In addition, if these transaction costs were included, your costs would have been higher.
| | | | | | | | | | | | | | | | | | | | | | | | |
Actual | | | Hypothetical
(5% return before expenses) | | | | |
Beginning
Account
Value
(5/1/18) | | Ending
Account
Value
(10/31/2018) | | | Expenses
Paid During
Period
(5/1/18 - 10/31/2018)† | | | Beginning
Account
Value
(5/1/18) | | | Ending
Account
Value
(10/31/2018) | | | Expenses
Paid During
Period
(5/1/18 - 10/31/2018)† | | | Net Annualized
Expense Ratio
(5/1/18 - 10/31/2018) | |
| $1,000.00 | | $ | 1,045.80 | | | $ | 2.58 | | | $ | 1,000.00 | | | $ | 1,022.68 | | | $ | 2.55 | | | | 0.50% | |
| † | Expenses Paid During Period is equal to the Net Annualized Expense Ratio multiplied by the average account value over the period, multiplied by 184/365 (to reflect the one-half year period). |
The Obesity ETF
Report of Independent Registered Public Accounting Firm
To the Board of Trustees of Janus Detroit Street Trust and Shareholders of The Obesity ETF:
Opinion on the Financial Statements
We have audited the accompanying statement of assets and liabilities, including the schedule of investments, of The Obesity ETF (one of the funds constituting Janus Detroit Street Trust, referred to hereafter as the “Fund”) as of October 31, 2018, the related statement of operations for the year ended October 31, 2018, the statements of changes in net assets for each of the two years in the period ended October 31, 2018, including the related notes, and the financial highlights for each of the two years in the period ended October 31, 2018 and for the period June 8, 2016 (commencement date) through October 31, 2016 (collectively referred to as the “financial statements”). In our opinion, the financial statements present fairly, in all material respects, the financial position of the Fund as of October 31, 2018, the results of its operations for the year then ended, the changes in its net assets for each of the two years in the period ended October 31, 2018 and the financial highlights for each of the two years in the period ended October 31, 2018 and for the period June 8, 2016 (commencement date) through October 31, 2016 in conformity with accounting principles generally accepted in the United States of America.
Basis for Opinion
These financial statements are the responsibility of the Fund’s management. Our responsibility is to express an opinion on the Fund’s financial statements based on our audits. We are a public accounting firm registered with the Public Company Accounting Oversight Board (United States) (“PCAOB”) and are required to be independent with respect to the Fund in accordance with the U.S. federal securities laws and the applicable rules and regulations of the Securities and Exchange Commission and the PCAOB.
We conducted our audits of these financial statements in accordance with the standards of the PCAOB. Those standards require that we plan and perform the audit to obtain reasonable assurance about whether the financial statements are free of material misstatement, whether due to error or fraud.
Our audits included performing procedures to assess the risks of material misstatement of the financial statements, whether due to error or fraud, and performing procedures that respond to those risks. Such procedures included examining, on a test basis, evidence regarding the amounts and disclosures in the financial statements. Our audits also included evaluating the accounting principles used and significant estimates made by management, as well as evaluating the overall presentation of the financial statements. Our procedures included confirmation of securities owned as of October 31, 2018 by correspondence with the custodian, transfer agent, and brokers; when replies were not received from brokers, we performed other auditing procedures. We believe that our audits provide a reasonable basis for our opinion.

Denver, Colorado
December 20, 2018
We have served as the auditor of one or more investment companies in Janus Henderson Funds since 1990.
| | |
| | Janus Detroit Street Trust ½ 5 |
The Obesity ETF
Schedule of Investments
October 31, 2018
| | | | | | | | |
| | | Shares | | | Value | |
| Common Stocks – 100.0% | | | | | | |
| Biotechnology – 7.3% | | | | | | |
Arena Pharmaceuticals, Inc.* | | | 5,587 | | | | $199,232 | |
Cohbar, Inc.* | | | 3,223 | | | | 12,344 | |
Esperion Therapeutics, Inc.* | | | 2,766 | | | | 125,659 | |
Keryx Biopharmaceuticals, Inc.* | | | 13,481 | | | | 37,477 | |
Lexicon Pharmaceuticals, Inc.* | | | 4,645 | | | | 36,370 | |
Madrigal Pharmaceuticals, Inc.* | | | 944 | | | | 180,172 | |
MannKind Corp.*,# | | | 17,121 | | | | 31,332 | |
Poxel S.A.* | | | 1,744 | | | | 11,916 | |
Rhythm Pharmaceuticals, Inc.* | | | 2,793 | | | | 78,232 | |
Zafgen, Inc.* | | | 3,744 | | | | 36,354 | |
| | | | | | | | |
| | | | | | | 749,088 | |
| Diversified Consumer Services – 3.4% | | | | | | |
Weight Watchers International, Inc.* | | | 5,188 | | | | 342,927 | |
| Health Care Equipment & Supplies – 44.3% | |
ABIOMED, Inc.* | | | 2,178 | | | | 743,134 | |
AngioDynamics, Inc.* | | | 4,133 | | | | 84,437 | |
Apex Biotechnology Corp. | | | 9,000 | | | | 7,839 | |
Apollo Endosurgery, Inc.* | | | 1,446 | | | | 8,213 | |
Cardiovascular Systems, Inc.* | | | 3,796 | | | | 106,478 | |
CryoLife, Inc.* | | | 3,834 | | | | 118,777 | |
DexCom, Inc.* | | | 4,480 | | | | 594,810 | |
Endologix, Inc.* | | | 9,189 | | | | 11,211 | |
Fisher & Paykel Healthcare Corp., Ltd. | | | 51,338 | | | | 455,914 | |
Insulet Corp.* | | | 5,174 | | | | 456,398 | |
iRhythm Technologies, Inc.* | | | 2,398 | | | | 185,269 | |
Itamar Medical, Ltd.* | | | 22,897 | | | | 7,812 | |
LeMaitre Vascular, Inc. | | | 1,746 | | | | 46,618 | |
Lifetech Scientific Corp.* | | | 370,000 | | | | 80,236 | |
Microlife Corp. | | | 5,000 | | | | 13,622 | |
Microport Scientific Corp. | | | 67,000 | | | | 79,996 | |
Nipro Corp. | | | 15,600 | | | | 198,775 | |
NxStage Medical, Inc.* | | | 7,279 | | | | 206,578 | |
ResMed, Inc. | | | 72,923 | | | | 764,926 | |
Rockwell Medical, Inc.*,# | | | 5,178 | | | | 21,126 | |
Senseonics Holdings, Inc.*,# | | | 13,436 | | | | 49,848 | |
SomnoMed, Ltd.* | | | 2,104 | | | | 2,356 | |
TaiDoc Technology Corp. | | | 4,203 | | | | 17,658 | |
Tandem Diabetes Care, Inc.* | | | 5,677 | | | | 213,512 | |
Ypsomed Holding AG* | | | 390 | | | | 52,419 | |
| | | | | | | | |
| | | | | | | 4,527,962 | |
| Health Care Providers & Services – 13.1% | | | | | | |
DaVita, Inc.* | | | 6,995 | | | | 471,043 | |
Fresenius Medical Care AG & Co. KGaA | | | 11,111 | | | | 872,691 | |
| | | | | | | | |
| | | | | | | 1,343,734 | |
| Internet & Catalog Retail – 1.5% | | | | | | |
N Brown Group PLC | | | 21,311 | | | | 36,897 | |
Nutrisystem, Inc. | | | 3,270 | | | | 116,281 | |
| | | | | | | | |
| | | | | | | 153,178 | |
| Personal Products – 9.0% | | | | | | |
Herbalife Nutrition, Ltd.* | | | 8,722 | | | | 464,534 | |
Medifast, Inc. | | | 1,295 | | | | 274,126 | |
USANA Health Sciences, Inc.* | | | 1,570 | | | | 183,721 | |
| | | | | | | | |
| | | | | | | 922,381 | |
| Pharmaceuticals – 20.8% | | | | | | |
Novo Nordisk A/S - Class B | | | 49,168 | | | | 2,127,350 | |
Oramed Pharmaceuticals, Inc.* | | | 931 | | | | 3,929 | |
| | | | | | | | |
| | | | | | | 2,131,279 | |
See Notes to Schedule of Investments and Other Information and Notes to Financial Statements.
The Obesity ETF
Schedule of Investments
October 31, 2018
| | | | | | | | |
| | | Shares | | | Value | |
| Common Stocks – (continued) | | | | | | |
| Specialty Retail – 0.6% | | | | | | |
Cato Corp. - Class A | | | 2,472 | | | | $ 47,660 | |
Destination XL Group, Inc.* | | | 3,789 | | | | 11,595 | |
| | | | | | | | |
| | | | | | | | 59,255 | |
Total Common Stocks (cost $10,859,033) | | | | | | | 10,229,804 | |
| Investment Companies – 0.6% | |
| Investments Purchased with Cash Collateral from Securities Lending – 0.6% | |
Janus Cash Collateral Fund LLC, 2.1443%ºº,£ (cost $63,969) | | | 63,969 | | | | 63,969 | |
Total Investments (total cost $10,923,002) – 100.6% | | | | | | | 10,293,773 | |
Liabilities, net of Cash, Receivables and Other Assets – (0.6%) | | | | | | | (62,205) | |
Net Assets – 100% | | | | | | | $10,231,568 | |
Summary of Investments by Country – (Long Positions) (unaudited)
| | | | | | | | |
| Country | | Value | | | % of
Investment
Securities | |
United States | | | $6,324,363 | | | | 61.4% | |
Denmark | | | 2,127,350 | | | | 20.7 | |
Germany | | | 872,691 | | | | 8.5 | |
New Zealand | | | 455,914 | | | | 4.4 | |
Japan | | | 198,775 | | | | 1.9 | |
China | | | 160,232 | | | | 1.6 | |
Switzerland | | | 52,419 | | | | 0.5 | |
Taiwan, Province Of China | | | 39,119 | | | | 0.4 | |
United Kingdom | | | 36,897 | | | | 0.4 | |
France | | | 11,916 | | | | 0.1 | |
Israel | | | 11,741 | | | | 0.1 | |
Australia | | | 2,356 | | | | — | |
Total | | | $10,293,773 | | | | 100.0% | |
Schedules of Affiliated Investments – (% of Net Assets)
| | | | | | | | | | | | | | | | |
| | | Dividend Income | | | Realized
Gain/(Loss) | | | Change in Unrealized
Appreciation/
(Depreciation) | | | Value at
10/31/18 | |
Investment Companies – 0.6% | | | | | | | | | | | | | | | | |
Investments Purchased with Cash Collateral from Securities Lending – 0.6% | | | | | | | | | | | | | | | | |
Janus Henderson Cash Collateral Fund LLC, 2.1443%ºº | | | $4,481 | D | | | $ — | | | | $ — | | | | $63,969 | |
| | | | |
| | | Share Balance
at 10/31/17 | | | Purchases | | | Sales | | | Share Balance
at 10/31/18 | |
Investment Companies – 0.6% | | | | | | | | | | | | | | | | |
Investments Purchased with Cash Collateral from Securities Lending – 0.6% | | | | | | | | | | | | | | | | |
Janus Henderson Cash Collateral Fund LLC, 2.1443%ºº | | | 17,506 | | | | 1,312,638 | | | | (1,266,175) | | | | 63,969 | |
See Notes to Schedule of Investments and Other Information and Notes to Financial Statements.
| | |
| | Janus Detroit Street Trust ½ 7 |
The Obesity ETF
Notes to Schedule of Investments and Other Information
October 31, 2018
| | |
| Solactive Obesity Index | | Solactive Obesity Index is designed to track the performance of companies globally that are positioned to profit from servicing the obese, including: biotechnology, pharmaceutical, healthcare and medical device companies whose business is focused on obesity and obesity related disease, including diabetes, high blood pressure, cholesterol, heart disease, stroke and sleep apnea, and companies focused on weight loss programs and supplements, and plus sized apparel. |
| |
| MSCI All Country World IndexSM | | MSCI All Country World IndexSM reflects the equity market performance of global developed and emerging markets. |
| |
| LLC | | Limited Liability Company |
| |
| PLC | | Public Limited Company |
| * | Non-income producing security. |
| # | Loaned security; a portion of the security is on loan at October 31, 2018. |
| ºº | Rate shown is the 7-day yield as of October 31, 2018. |
| £ | The Fund may invest in certain securities that are considered affiliated companies. As defined by the Investment Company Act of 1940, as amended, an affiliated company is one in which the Fund owns 5% or more of the outstanding voting securities, or a company which is under common ownership or control. |
| D | Net of income paid to the securities lending agent and rebates paid to the borrowing counterparties. |
The following is a summary of the inputs that were used to value the Fund’s investments in securities and other financial instruments as of October 31, 2018. See Notes to Financial Statements for more information.
Valuation Inputs Summary
| | | | | | | | | | | | |
| | | Level 1 -
Quoted Prices | | | Level 2 -
Other Significant
Observable Inputs | | | Level 3 -
Significant
Unobservable Inputs | |
Assets | | | | | | | | | | | | |
Investments in Securities: | | | | | | | | | | | | |
Common Stocks | | $ | 10,229,804 | | | $ | — | | | $ | — | |
Investment Companies | | | — | | | | 63,969 | | | | — | |
| | | | |
Total Assets | | $ | 10,229,804 | | | $ | 63,969 | | | $ | — | |
The Obesity ETF
Statement of Assets and Liabilities
October 31, 2018
| | | | |
Assets: | | | | |
Unaffiliated investments, at value(1)(2) | | $ | 10,229,804 | |
Affiliated investments, at value(3) | | | 63,969 | |
Cash denominated in foreign currency(4) | | | 2 | |
Receivables: | | | | |
Investments sold | | | 1,302,998 | |
Dividends | | | 8,700 | |
Affiliated securities lending income, net | | | 408 | |
Total Assets | | | 11,605,881 | |
Liabilities: | | | | |
Collateral on securities loaned (Note 2) | | | 63,969 | |
Payables: | | | | |
Due to custodian | | | 6,385 | |
Investments purchased | | | 1,299,502 | |
Management fees | | | 4,457 | |
Total Liabilities | | | 1,374,313 | |
Net Assets | | $ | 10,231,568 | |
Net Assets Consists of: | | | | |
Capital (par value and paid-in surplus) | | $ | 11,166,423 | |
Total distributable earnings (loss) | | | (934,855) | |
Total Net Assets | | $ | 10,231,568 | |
Net Assets | | $ | 10,231,568 | |
Shares outstanding, $0.001 Par Value (unlimited shares authorized) | | | 300,001 | |
Net Asset Value Per Share | | $ | 34.11 | |
| (1) | Includes cost of $10,859,033. |
| (2) | Includes $58,482 of securities on loan. See Note 2 in Notes to Financial Statements. |
| (3) | Includes cost of $63,969. |
See Notes to Financial Statements.
| | |
| | Janus Detroit Street Trust ½ 9 |
The Obesity ETF
Statement of Operations
For the year ended October 31, 2018
| | | | |
Investment Income: | | | | |
Dividends | | $ | 56,728 | |
Affiliated securities lending income, net | | | 4,481 | |
Foreign tax withheld | | | (6,070) | |
Total Investment Income | | | 55,139 | |
Expenses: | | | | |
Management Fees | | | 28,972 | |
Total Expenses | | | 28,972 | |
Net Investment Income/(Loss) | | | 26,167 | |
Net Realized Gain/(Loss) on Investments: | | | | |
Investments and foreign currency transactions | | | 689,964 | |
Forward foreign currency exchange contracts | | | 21 | |
Total Net Realized Gain/(Loss) on Investments | | | 689,985 | |
Change in Unrealized Net Appreciation/Depreciation: | | | | |
Investments and foreign currency translations | | | (601,808) | |
Total Change in Unrealized Net Appreciation/Depreciation | | | (601,808) | |
Net Increase/(Decrease) in Net Assets Resulting from Operations | | $ | 114,344 | |
See Notes to Financial Statements.
The Obesity ETF
Statements of Changes in Net Assets
| | | | | | | | |
| | | Year Ended
October 31, 2018 | | | Year Ended
October 31, 2017 | |
Operations: | | | | | | | | |
Net investment income/(loss) | | $ | 26,167 | | | $ | 18,024 | |
Net realized gain/(loss) on investments | | | 689,985 | | | | 384,390 | |
Change in unrealized net appreciation/depreciation | | | (601,808) | | | | 220,542 | |
Net Increase/(Decrease) in Net Assets Resulting from Operations | | | 114,344 | | | | 622,956 | |
Dividends and Distributions to Shareholders: | | | | | | | | |
Dividends and Distributions | | | (27,273) | | | | N/A | |
Dividends from Net Investment Income(1) | | | N/A | | | | (16,546) | |
Net Decrease from Dividends and Distributions to Shareholders | | | (27,273) | | | | (16,546) | |
Capital Share Transactions | | | 7,284,008 | | | | 5,612 | |
Net Increase/(Decrease) in Net Assets | | | 7,371,079 | | | | 612,022 | |
Net Assets: | | | | | | | | |
Beginning of period | | | 2,860,489 | | | | 2,248,467 | |
End of period(2) | | $ | 10,231,568 | | | $ | 2,860,489 | |
| (1) | The requirement to disclose dividends and distributions paid to shareholders from net investment income and/or net realized gain from investment transactions was eliminated by the U.S. Securities and Exchange Commission (“SEC”) in 2018. |
| (2) | The requirement to disclose undistributed (overdistributed) net investment income was eliminated by the SEC in 2018. |
See Notes to Financial Statements.
| | |
| | Janus Detroit Street Trust ½ 11 |
The Obesity ETF
Financial Highlights
| | | | | | | | | | | | | | |
| For a share outstanding during each year or period ended October 31 | | 2018 | | | 2017 | | | 2016(1) | |
| | Net Asset Value, Beginning of Period | | | $28.60 | | | | $22.48 | | | | $25.27 | |
| | Income/(Loss) from Investment Operations: | | | | | | | | | | | | |
| | Net investment income/(loss)(2) | | | 0.16 | | | | 0.18 | | | | 0.05 | |
| | Net realized and unrealized gain/(loss) | | | 5.50 | | | | 6.11 | | | | (2.78) | |
| | Total from Investment Operations | | | 5.66 | | | | 6.29 | | | | (2.73) | |
| | Less Dividends and Distributions: | | | | | | | | | | | | |
| | Dividends (from net investment income) | | | (0.15) | | | | (0.17) | | | | (0.05) | |
| | Return of Capital | | | — | | | | — | | | | (0.01) | |
| | Total Dividends and Distributions | | | (0.15) | | | | (0.17) | | | | (0.06) | |
| | Net Asset Value, End of Period | | | $34.11 | | | | $28.60 | | | | $22.48 | |
| | Total Return* | | | 19.79% | | | | 28.05% | | | | (10.79)% | |
| | Net assets, End of Period (in thousands) | | | $10,232 | | | | $2,860 | | | | $2,248 | |
| | Average Net Assets for the Period (in thousands) | | | $5,794 | | | | $2,543 | | | | $2,478 | |
| | Ratios to Average Net Assets**: | | | | | | | | | | | | |
| | Ratio of Gross Expenses | | | 0.50% | | | | 0.50% | | | | 0.50% | |
| | Ratio of Net Investment Income/(Loss) | | | 0.45% | | | | 0.71% | | | | 0.48% | |
| | Portfolio Turnover Rate(3) | | | 67% | | | | 44% | | | | 20% | |
| * | Total return not annualized for periods of less than one full year. |
| ** | Annualized for periods of less than one full year. |
| (1) | Period from June 8, 2016 (commencement of operations) through October 31, 2016. |
| (2) | Per share amounts are calculated based on average shares outstanding during the year or period. |
| (3) | Portfolio turnover rate excludes securities received or delivered from in-kind processing of creation or redemptions. |
See Notes to Financial Statements.
The Obesity ETF
Notes to Financial Statements
1. Organization and Significant Accounting Policies
The Obesity ETF (the “Fund”) is a series fund. The Fund is part of Janus Detroit Street Trust (the “Trust”), which is organized as a Delaware statutory trust and is registered under the Investment Company Act of 1940, as amended (the “1940 Act”), as an open-end management investment company, and therefore has applied the specialized accounting and reporting guidance in Financial Accounting Standards Board (“FASB”) Accounting Standards Codification (“ASC”) Topic 946. The Trust offers seven Funds each of which represent shares of beneficial interest in a separate portfolio of securities and other assets with its own objective and policies. The Fund seeks investment results that correspond generally to the performance, before fees and expenses, of an index (“Underlying Index”) which is designed to track the performance of companies globally that are positioned to profit from servicing the obese, including biotechnology, pharmaceutical, health care and medical device companies whose business is focused on obesity and obesity related disease including diabetes, high blood pressure, cholesterol, heart disease, stroke, and sleep apnea, and companies focused on weight loss programs, weight loss supplements, or plus sized apparel. The Fund is classified as nondiversified, as defined in the 1940 Act.
Unlike shares of traditional mutual funds, shares of the Fund are not individually redeemable and may only be purchased or redeemed directly from the Fund at net asset value (“NAV”) in large increments called “Creation Units” (25,000 or more shares per Creation Unit) through certain participants, known as “Authorized Participants.” The Fund will issue or redeem Creation Units in exchange for portfolio securities and/or cash. Except when aggregated in Creation Units, Fund shares are not redeemable securities of the Fund. Shares of the Fund are listed and trade on The NASDAQ Stock Market LLC (“NASDAQ”) and individual investors can purchase or sell shares in much smaller increments and for cash in the secondary market through a broker. These transactions, which do not involve the Fund, are made at market prices that may vary throughout the day and differ from the Fund’s NAV. As a result, you may pay more than NAV (a premium) when you purchase shares, and receive less than NAV (a discount) when you sell shares, in the secondary market.
An Authorized Participant may hold of record more than 25% of the outstanding shares of the Fund. From time to time, Authorized Participants may be a beneficial and/or legal owner of the Fund, may be affiliated with an index provider, may be deemed to have control of the Fund and/or may be able to affect the outcome of matters presented for a vote of the shareholders of the Fund. Authorized Participants may execute an irrevocable proxy granting the Distributor or an affiliate of Janus Capital Management LLC (“Janus Capital” or “Janus”) power to vote or abstain from voting such Authorized Participant’s beneficially or legally owned shares of the Fund. In such cases, the agent shall mirror vote (or abstain from voting) such shares in the same proportion as all other beneficial owners of the Fund.
The following accounting policies have been followed by the Fund and are in conformity with accounting principles generally accepted in the United States of America.
Investment Valuation
Securities held by the Fund are valued in accordance with policies and procedures established by and under the supervision of the Trustees (the “Valuation Procedures”). Equity securities traded on a domestic securities exchange are generally valued at the closing prices on the primary market or exchange on which they trade. If such price is lacking for the trading period immediately preceding the time of determination, such securities are valued at their current bid price. Equity securities that are traded on a foreign exchange are generally valued at the closing prices on such markets. In the event that there is no current trading volume on a particular security in such foreign exchange, the bid price from the primary exchange is generally used to value the security. Securities that are traded on the over-the-counter (“OTC”) markets are generally valued at their closing or latest bid prices as available. Foreign securities and currencies are converted to U.S. dollars using the applicable exchange rate in effect at the close of the New York Stock Exchange (“NYSE”). The Fund will determine the market value of individual securities held by it by using prices provided by one or more approved professional pricing services or, as needed, by obtaining market quotations from independent broker-dealers. Most debt securities are valued in accordance with the evaluated bid price supplied by the pricing service that is intended to reflect market value. The evaluated bid price supplied by the pricing service is an evaluation that may consider factors such as security prices, yields, maturities and ratings. Certain short-term securities maturing within 60 days or less may be evaluated and valued on an amortized cost basis provided that the amortized cost determined approximates market value. Securities for which market quotations or evaluated prices are not readily available or are deemed by Janus Capital to be unreliable are valued at fair value determined in good faith under the Valuation Procedures. Circumstances in which fair value pricing may be utilized include, but are not limited to: (i) a significant event that may affect the securities of a single issuer, such as a merger, bankruptcy, or significant issuer-specific development; (ii) an event that may affect an entire market, such as a natural disaster or significant governmental action; (iii) a nonsignificant event such as a market closing early or not opening, or a security trading halt; and (iv) pricing of a nonvalued security and a restricted or nonpublic security. Special valuation considerations may apply with respect to “odd-lot” fixed-income transactions
| | |
| | Janus Detroit Street Trust ½ 13 |
The Obesity ETF
Notes to Financial Statements
which, due to their small size, may receive evaluated prices by pricing services which reflect a large block trade and not what actually could be obtained for the odd-lot position.
Valuation Inputs Summary
FASB ASC 820, Fair Value Measurements and Disclosures (“ASC 820”), defines fair value, establishes a framework for measuring fair value, and expands disclosure requirements regarding fair value measurements. This standard emphasizes that fair value is a market-based measurement that should be determined based on the assumptions that market participants would use in pricing an asset or liability and establishes a hierarchy that prioritizes inputs to valuation techniques used to measure fair value. These inputs are summarized into three broad levels:
Level 1 – Unadjusted quoted prices in active markets the Fund has the ability to access for identical assets or liabilities.
Level 2 – Observable inputs other than unadjusted quoted prices included in Level 1 that are observable for the asset or liability either directly or indirectly. These inputs may include quoted prices for the identical instrument on an inactive market, prices for similar instruments, interest rates, prepayment speeds, credit risk, yield curves, default rates and similar data.
Assets or liabilities categorized as Level 2 in the hierarchy generally include: debt securities fair valued in accordance with the evaluated bid or ask prices supplied by a pricing service; securities traded on OTC markets and listed securities for which no sales are reported that are fair valued at the latest bid price (or yield equivalent thereof) obtained from one or more dealers transacting in a market for such securities or by a pricing service approved by the Fund’s Trustees; and certain short-term debt securities with maturities of 60 days or less that are fair valued at amortized cost. Other securities that may be categorized as Level 2 in the hierarchy include, but are not limited to, preferred stocks, bank loans, swaps, investments in unregistered investment companies, options, and forward contracts.
Level 3 – Unobservable inputs for the asset or liability to the extent that relevant observable inputs are not available, representing the Fund’s own assumptions about the assumptions that a market participant would use in valuing the asset or liability, and that would be based on the best information available.
There have been no significant changes in valuation techniques used in valuing any such positions held by the Fund since the beginning of the fiscal year.
The inputs or methodology used for fair valuing securities are not necessarily an indication of the risk associated with investing in those securities. The summary of inputs used as of October 31, 2018 to fair value the Fund’s investments in securities and other financial instruments is included in the “Valuation Inputs Summary” in the Notes to Schedule of Investments and Other Information.
The Fund recognizes transfers between the levels as of the beginning of the fiscal year. The following describes the amounts of transfers between Level 1, Level 2, and Level 3 of the fair value hierarchy during the year.
There were no transfers between Level 1, Level 2 and Level 3 of the fair value hierarchy during the period. The Fund recognizes transfers between the levels as of the beginning of the fiscal year.
Investment Transactions and Investment Income
Investment transactions are accounted for as of the date purchased or sold (trade date). Dividend income is recorded on the ex-dividend date. Certain dividends from foreign securities will be recorded as soon as the Fund is informed of the dividend, if such information is obtained subsequent to the ex-dividend date. Dividends from foreign securities may be subject to withholding taxes in foreign jurisdictions. Gains and losses are determined on the identified cost basis, which is the same basis used for federal income tax purposes.
Estimates
The preparation of financial statements in conformity with accounting principles generally accepted in the United States of America requires management to make estimates and assumptions that affect the reported amount of assets and liabilities and disclosure of contingent assets and liabilities at the date of the financial statements and the reported amounts of income and expenses during the reporting period. Actual results could differ from those estimates.
Indemnifications
In the normal course of business, the Fund may enter into contracts that contain provisions for indemnification of other parties against certain potential liabilities. The Fund’s maximum exposure under these arrangements is unknown, and
The Obesity ETF
Notes to Financial Statements
would involve future claims that may be made against the Fund that have not yet occurred. Currently, the risk of material loss from such claims is considered remote.
Foreign Currency Translations
The Fund does not isolate that portion of the results of operations resulting from the effect of changes in foreign exchange rates on investments from the fluctuations arising from changes in market prices of securities held at the date of the financial statements. Net unrealized appreciation or depreciation of investments and foreign currency translations arise from changes in the value of assets and liabilities, including investments in securities held at the date of the financial statements, resulting from changes in the exchange rates and changes in market prices of securities held.
Currency gains and losses are also calculated on payables and receivables that are denominated in foreign currencies. The payables and receivables are generally related to foreign security transactions and income translations.
Foreign currency-denominated assets and forward currency contracts may involve more risks than domestic transactions, including currency risk, counterparty risk, political and economic risk, regulatory risk and equity risk. Risks may arise from unanticipated movements in the value of foreign currencies relative to the U.S. dollar.
Dividends and Distributions
The Fund generally declares and distributes dividends of net investment income quarterly. Net realized capital gains (if any) are distributed annually. The Fund may treat a portion of the amount paid to redeem shares as a distribution of investment company taxable income and realized capital gains that are reflected in the NAV. This practice, commonly referred to as “equalization,” has no effect on the redeeming shareholder or a Fund’s total return, but may reduce the amounts that would otherwise be required to be paid as taxable dividends to the remaining shareholders. It is possible that the Internal Revenue Service (IRS) could challenge the Fund’s equalization methodology or calculations, and any such challenge could result in additional tax, interest, or penalties to be paid by the Fund.
Federal Income Taxes
The Fund intends to continue to qualify as a regulated investment company and distribute all of its taxable income in accordance with the requirements of Subchapter M of the Internal Revenue Code. Management has analyzed the Fund’s tax positions taken for all open federal income tax years, generally a three-year period, and has concluded that no provision for federal income tax is required in the Fund’s financial statements. The Fund is not aware of any tax positions for which it is reasonably possible that the total amounts of unrecognized tax benefits will significantly change in the next twelve months.
On December 22, 2017, the Tax Cuts and Jobs Act was signed into law. Currently, Management does not believe the bill will have a material impact on the Fund’s intention to continue to qualify as a regulated investment company, which is generally not subject to U.S. federal income tax.
2. Other Investments and Strategies
Additional Investment Risk
The financial crisis in both the U.S. and global economies over the past several years has resulted, and may continue to result, in a significant decline in the value and liquidity of many securities of issuers worldwide in the equity and fixed income/credit markets. In response to the crisis, the United States and certain foreign governments, along with the U.S. Federal Reserve and certain foreign central banks, took steps to support the financial markets. The withdrawal of this support, a failure of measures put in place to respond to the crisis, or investor perception that such efforts were not sufficient could each negatively affect financial markets generally, and the value and liquidity of specific securities. In addition, policy and legislative changes in the United States and in other countries continue to impact many aspects of financial regulation. The effect of these changes on the markets, and the practical implications for market participants, including the Fund, may not be fully known for some time and could limit or preclude the Fund’s ability to achieve its investment objective. Therefore, it is important to understand that the value of your investment may fall, sometimes sharply, and you could lose money.
The enactment of the Dodd-Frank Wall Street Reform and Consumer Protection Act (the “Dodd-Frank Act”) provided for widespread regulation of financial institutions, consumer financial products and services, broker-dealers, OTC derivatives, investment advisers, credit rating agencies, and mortgage lending, which expanded federal oversight in the financial sector, including the investment management industry. Certain provisions of the Dodd-Frank Act remain pending and will be implemented through future rulemaking. Therefore, the ultimate impact of the Dodd-Frank Act and the regulations under the Dodd-Frank Act on the Fund and the investment management industry as a whole, is not yet certain.
A number of countries in the European Union (“EU”) have experienced, and may continue to experience, severe economic and financial difficulties. In particular, many EU nations are susceptible to economic risks associated with high levels of
| | |
| | Janus Detroit Street Trust ½ 15 |
The Obesity ETF
Notes to Financial Statements
debt, notably due to investments in sovereign debt of countries such as Greece, Italy, Spain, Portugal, and Ireland. Many non-governmental issuers, and even certain governments, have defaulted on, or been forced to restructure, their debts. Many other issuers have faced difficulties obtaining credit or refinancing existing obligations. Financial institutions have in many cases required government or central bank support, have needed to raise capital, and/or have been impaired in their ability to extend credit. As a result, financial markets in the EU experienced extreme volatility and declines in asset values and liquidity. Responses to these financial problems by European governments, central banks, and others, including austerity measures and reforms, may not work, may result in social unrest, and may limit future growth and economic recovery or have other unintended consequences. Further defaults or restructurings by governments and others of their debt could have additional adverse effects on economies, financial markets, and asset valuations around the world. Greece, Ireland, and Portugal have already received one or more “bailouts” from other Eurozone member states, and it is unclear how much additional funding they will require or if additional Eurozone member states will require bailouts in the future. The risk of investing in securities in the European markets may also be heightened due to the referendum in which the United Kingdom voted to exit the EU (known as “Brexit”). One or more other countries may also abandon the euro and/or withdraw from the EU, placing its currency and banking system in jeopardy.
Certain areas of the world have historically been prone to and economically sensitive to environmental events such as, but not limited to, hurricanes, earthquakes, typhoons, flooding, tidal waves, tsunamis, erupting volcanoes, wildfires or droughts, tornadoes, mudslides, or other weather-related phenomena. Such disasters, and the resulting physical or economic damage, could have a severe and negative impact on the Fund’s investment portfolio and, in the longer term, could impair the ability of issuers in which the Fund invests to conduct their businesses as they would under normal conditions. Adverse weather conditions may also have a particularly significant negative effect on issuers in the agricultural sector and on insurance companies that insure against the impact of natural disasters.
Counterparties
Fund transactions involving a counterparty are subject to the risk that the counterparty or a third party will not fulfill its obligation to the Fund (“counterparty risk”). Counterparty risk may arise because of the counterparty’s financial condition (i.e., financial difficulties, bankruptcy, or insolvency), market activities and developments, or other reasons, whether foreseen or not. A counterparty’s inability to fulfill its obligation may result in significant financial loss to the Fund. The Fund may be unable to recover its investment from the counterparty or may obtain a limited recovery, and/or recovery may be delayed. The extent of the Fund’s exposure to counterparty risk with respect to financial assets and liabilities approximates its carrying value. See the “Offsetting Assets and Liabilities” section of this Note for further details.
The Fund may be exposed to counterparty risk through participation in various programs, including, but not limited to, lending its securities to third parties, cash sweep arrangements whereby the Fund’s cash balance is invested in one or more types of cash management vehicles, as well as investments in, but not limited to, repurchase agreements, and derivatives, including various types of swaps, futures and options. The Fund intends to enter into financial transactions with counterparties that Janus Capital believes to be creditworthy at the time of the transaction. There is always the risk that Janus Capital’s analysis of a counterparty’s creditworthiness is incorrect or may change due to market conditions. To the extent that the Fund focuses its transactions with a limited number of counterparties, it will have greater exposure to the risks associated with one or more counterparties.
Offsetting Assets and Liabilities
The Fund presents gross and net information about transactions that are either offset in the financial statements or subject to an enforceable master netting arrangement or similar agreement with a designated counterparty, regardless of whether the transactions are actually offset in the Statement of Assets and Liabilities.
Deutsche Bank AG acts as securities lending agent and a limited purpose custodian or subcustodian to receive and disburse cash balances and cash collateral, hold short-term investments, hold collateral, and perform other custodian functions in accordance with the Agency Securities Lending and Repurchase Agreement. For financial reporting purposes, the Fund does not offset financial instruments’ payables and receivables and related collateral on the Statement of Assets and Liabilities. Securities on loan will be continuously secured by collateral which may consist of cash, U.S. Government securities, domestic and foreign short-term debt instruments, letters of credit, time deposits, repurchase agreements, money market mutual funds or other money market accounts, or such other collateral as permitted by the SEC. The value of the collateral must be at least 102% of the market value of the loaned securities that are denominated in U.S. dollars and 105% of the market value of the loaned securities that are not denominated in U.S. dollars. Upon receipt of cash collateral, Janus Capital intends to invest the cash collateral in a cash management vehicle for which Janus Capital serves as investment adviser, Janus Henderson Cash Collateral Fund LLC. Loaned securities and related collateral are marked-to-market each business day based upon the market value of the loaned securities at the
The Obesity ETF
Notes to Financial Statements
close of business, employing the most recent available pricing information. Collateral levels are then adjusted based on this mark-to-market evaluation.
The following table presents gross amounts of recognized assets and/or liabilities and the net amounts after deducting collateral that has been pledged by counterparties or has been pledged to counterparties (if applicable). For corresponding information grouped by type of instrument, see the Fund’s Schedule of Investments.
Offsetting of Financial Assets and Derivative Assets
| | | | | | | | | | | | | | | | | | |
| Counterparty | | | Gross Amounts of
Recognized Assets | | | Offsetting Asset
or Liability(a) | | | Collateral
Pledged(b) | | | Net Amount | |
| | Deutsche Bank AG | | | $ | 58,482 | | | $ | — | | | $ | (58,482) | | | $ | — | |
| (a) | Represents the amount of assets or liabilities that could be offset with the same counterparty under master netting or similar agreements that management elects not to offset on the Statement of Assets and Liabilities. |
| (b) | Collateral pledged is limited to the net outstanding amount due to/from an individual counterparty. The actual collateral amounts pledged may exceed these amounts and may fluctuate in value. |
Securities Lending
Under procedures adopted by the Trustees, the Fund may seek to earn additional income by lending securities to qualified parties. Deutsche Bank AG acts as securities lending agent and a limited purpose custodian or subcustodian to receive and disburse cash balances and cash collateral, hold short-term investments, hold collateral, and perform other custodian functions. The Fund may lend portfolio securities in an amount equal to up to 1/3 of its total assets as determined at the time of the loan origination. There is the risk of delay in recovering a loaned security or the risk of loss in collateral rights if the borrower fails financially. In addition, Janus Capital makes efforts to balance the benefits and risks from granting such loans. All loans will be continuously secured by collateral which may consist of cash, U.S. Government securities, domestic and foreign short-term debt instruments, letters of credit, time deposits, repurchase agreements, money market mutual funds or other money market accounts, or such other collateral as permitted by the SEC. If the Fund is unable to recover a security on loan, the Fund may use the collateral to purchase replacement securities in the market. There is a risk that the value of the collateral could decrease below the cost of the replacement security by the time the replacement investment is made, resulting in a loss to the Fund.
Upon receipt of cash collateral, Janus Capital may invest it in affiliated or non-affiliated cash management vehicles, whether registered or unregistered entities, as permitted by the 1940 Act and rules promulgated thereunder. Janus Capital currently intends to invest the cash collateral in a cash management vehicle for which Janus Capital serves as investment adviser, Janus Henderson Cash Collateral Fund LLC. An investment in Janus Henderson Cash Collateral Fund LLC is generally subject to the same risks that shareholders experience when investing in similarly structured vehicles, such as the potential for significant fluctuations in assets as a result of the purchase and redemption activity of the securities lending program, a decline in the value of the collateral, and possible liquidity issues. Such risks may delay the return of the cash collateral and cause the Fund to violate its agreement to return the cash collateral to a borrower in a timely manner. As adviser to the Fund and Janus Henderson Cash Collateral Fund LLC, Janus Capital has an inherent conflict of interest as a result of its fiduciary duties to both the Fund and Janus Henderson Cash Collateral Fund LLC. Additionally, Janus Capital receives an investment advisory fee of 0.05% for managing Janus Henderson Cash Collateral Fund LLC, but it may not receive a fee for managing certain other affiliated cash management vehicles in which the Fund may invest, and therefore may have an incentive to allocate preferred investment opportunities to investment vehicles for which it is receiving a fee.
The value of the collateral must be at least 102% of the market value of the loaned securities that are denominated in U.S. dollars and 105% of the market value of the loaned securities that are not denominated in U.S. dollars. Loaned securities and related collateral are marked-to-market each business day based upon the market value of the loaned securities at the close of business, employing the most recent available pricing information. Collateral levels are then adjusted based on this mark-to-market evaluation.
The cash collateral invested by Janus Capital is disclosed in the Schedule of Investments (if applicable). Income earned from the investment of the cash collateral, net of rebates paid to, or fees paid by, borrowers and less the fees paid to the lending agent are included as “Affiliated securities lending income, net” on the Statement of Operations. As of October 31, 2018, securities lending transactions accounted for as secured borrowings with an overnight and continuous contractual maturity are $58,482 for equity securities. Gross amounts of recognized liabilities for securities lending (collateral received) as of October 31, 2018 is $63,969, resulting in the net amount due to the counterparty of $5,487.
| | |
| | Janus Detroit Street Trust ½ 17 |
The Obesity ETF
Notes to Financial Statements
3. Investment Advisory Agreements and Other Transactions with Affiliates
Under its unitary fee structure, the Fund pays Janus Capital a management fee in return for providing certain investment advisory, supervisory, and administrative services to the Fund, including the costs of transfer agency, custody, fund administration, legal, audit, and other services. Janus Capital’s fee structure is designed to pay substantially all of the Fund’s expenses. However, the Fund bears other expenses which are not covered under the management fee which may vary and affect the total level of expenses paid by shareholders, such as distribution fees (if any), brokerage expenses or commissions, interest, dividends, taxes, litigation expenses, acquired fund fees and expenses (if any), and extraordinary expenses. The Fund’s management fee is calculated daily and paid monthly. For the fiscal year ended October 31, 2018, the Fund’s contractual management fee rate (expressed as an annual rate) was 0.50% of the Fund’s average daily net assets.
State Street Bank and Trust Company (“State Street”) provides certain fund administration services to the Fund, including services related to the Fund’s accounting, including calculating the daily NAV, audit, tax, and reporting obligations, pursuant to an agreement with Janus Capital, on behalf of the Fund. As compensation for such services, Janus Capital pays State Street a fee based on a percentage of the Fund’s assets, with a minimum flat fee, for certain services. Janus Capital serves as administrator to the Fund, providing oversight and coordination of the Fund’s service providers, recordkeeping and other administrative services. Janus Capital does not receive any additional compensation, beyond the unitary fee, for serving as administrator. State Street also serves as transfer agent for the shares of the Fund. Pursuant to agreements with Janus Capital on behalf of the Fund, State Street Global Markets, an affiliate of State Street, may execute portfolio transactions for the Fund, including but not limited to, transactions in connection with cash in lieu transactions for non-US securities.
Due to an administrative oversight by its administrator, the Fund’s Distribution and Servicing Plan, pursuant to Rule 12b-1 under the 1940 Act that was originally approved at the time of the Fund’s formation (“Initial Rule 12b-1 Plan”), could be viewed to have expired on or about February 11, 2017. The Initial Rule 12b-1 Plan was never implemented, and 12b-1 fees were not charged, prior to its potential expiration. At an in-person meeting held on July 18, 2018, the Fund’s Board of Trustees (“Board”) approved a new Rule 12b-1 Plan (the “Plan”) with respect to the Fund, with terms that are substantively identical to the Initial Rule 12b-1 Plan. Because the Fund has commenced operations, the Plan must also be approved by the Fund’s shareholders prior to implementation. At this time, Janus Capital does not intend to seek shareholder approval for implementation of the Plan. The Plan would permit compensation in connection with the distribution and marketing of Fund shares and/or the provision of certain shareholder services. The Plan would permit the Fund to pay ALPS Distributors, Inc. (the “Distributor”) or its designee, a fee for the sale and distribution and/or shareholder servicing of the shares at an annual rate of up to 0.25% of average daily net assets of the Fund. Under the terms of the Plan, the Trust would be authorized to make payments to the Distributor or its designee for remittance to retirement plan service providers, broker-dealers, bank trust departments, financial advisors, and other financial intermediaries, as compensation for distribution and/or shareholder services performed by such entities for their customers who are investors in the Fund. However, implementation of the Plan and imposition of the 12b-1 fee would require prior approval by Fund shareholders via proxy vote. Janus Capital does not anticipate seeking such approval at this time. Because 12b-1 fees are paid out of the fund assets on an ongoing basis, to the extent that such a fee is authorized by shareholders in the future, over time they will increase the cost of an investment in the Fund. If implemented, the Plan fee may cost an investor more than other types of sales charges.
As of October 31, 2018, Janus Capital owned 1 share or less than 0.0% of the Fund.
Any purchases and sales, realized gains/losses and recorded dividends from affiliated investments during the year ended October 31, 2018 can be found in a table located in the Schedule of Investments.
4. Federal Income Tax
The tax components of capital shown in the table below represent: (1) distribution requirements the Fund must satisfy under the income tax regulations; (2) losses or deductions the Fund may be able to offset against income and gains realized in future years; and (3) unrealized appreciation or depreciation of investments for federal income tax purposes.
Other book to tax differences primarily consist of derivatives, and foreign currency contract adjustments. The Fund has elected to treat gains and losses on forward foreign currency contracts as capital gains and losses, if applicable. Other foreign currency gains and losses on debt instruments are treated as ordinary income for federal income tax purposes pursuant to Section 988 of the Internal Revenue Code.
The Obesity ETF
Notes to Financial Statements
| | | | | | | | | | | | | | | | | | | | | | | | | | |
| | | | | | | | | | Loss Deferrals | | | Other Book
to Tax Differences | | | Net Tax
Appreciation/
(Depreciation) | |
Undistributed
Ordinary Income | | | Undistributed
Long-Term Gains | | | Accumulated
Capital Losses | | | Late-Year
Ordinary Loss | | | Post-October
Capital Loss | |
| $ | — | | | $ | — | | | $ | (294,923) | | | $ | — | | | $ | — | | | $ | 727 | | | $ | (640,659) | |
Accumulated capital losses noted below represent net capital loss carryovers, as of October 31, 2018, that may be available to offset future realized capital gains and thereby reduce future taxable gains distributions. The following table shows these capital loss carryovers.
| | | | | | | | | | |
Capital Loss Carryover Schedule
For the year ended October 31, 2018
No Expiration | | | Accumulated Capital Losses | |
| Short-Term | | | Long-Term | |
| $ | (215,532) | | | $ | (79,391) | | | $ | (294,923) | |
The aggregate cost of investments and the composition of unrealized appreciation and depreciation of investment securities for federal income tax purposes as of October 31, 2018 are noted below. The primary difference between book and tax appreciation or depreciation of investments is wash sale loss deferrals.
| | | | | | | | | | | | | | |
| Federal Tax Cost | | | Unrealized Appreciation | | | Unrealized (Depreciation) | | | Net Tax Appreciation/
(Depreciation) | |
| $ | 10,934,432 | | | $ | 353,808 | | | $ | (994,467) | | | $ | (640,659) | |
Income and capital gains distributions are determined in accordance with income tax regulations that may differ from accounting principles generally accepted in the United States of America. These differences are due to differing treatments for items such as net short-term gains, deferral of wash sale losses, foreign currency transactions, passive foreign investment companies, net investment losses, in-kind transactions and capital loss carryovers. Certain permanent differences such as tax returns of capital and net investment losses noted below have been reclassified to capital.
| | | | | | | | | | | | | | |
| For the year ended October 31, 2018: | |
| Distributions | | | | |
| From Ordinary Income | | | From Long-Term Capital Gain | | | Tax Return of Capital | | | Net Investment Loss | |
| $ | 27,273 | | | $ | — | | | $ | — | | | $ | — | |
|
| For the year ended October 31, 2017: | |
| Distributions | | | | |
| From Ordinary Income | | | From Long-Term Capital Gain | | | Tax Return of Capital | | | Net Investment Loss | |
| $ | 16,546 | | | $ | — | | | $ | — | | | $ | — | |
Permanent book to tax basis differences may result in reclassifications between the components of net assets. These differences have no impact on the results of operations or net assets. The following reclassifications have been made to the Fund:
| | | | | | | | | | |
| Increase/(Decrease) to Capital | | | Increase/(Decrease) to Undistributed
Net Investment Income/Loss | | | Increase/(Decrease) to Undistributed
Net realized Gain/Loss | |
| $ | 960,887 | | | $ | 1,106 | | | $ | (961,993) | |
| | |
| | Janus Detroit Street Trust ½ 19 |
The Obesity ETF
Notes to Financial Statements
5. Capital Share Transactions
| | | | | | | | | | | | | | | | |
| | | Year ended October 31, 2018 | | | Year ended October 31, 2017 | |
| | | Shares | | | Amount | | | Shares | | | Amount | |
| Shares sold | | | 400,000 | | | $ | 14,195,008 | | | | 100,000 | | | $ | 2,726,001 | |
| Shares repurchased | | | (200,000) | | | | (6,911,000) | | | | (100,000) | | | | (2,720,389) | |
Net Increase/(Decrease) | | | 200,000 | | | $ | 7,284,008 | | | | — | | | $ | 5,612 | |
6. Purchases and Sales of Investment Securities
For the year ended October 31, 2018, the aggregate cost of purchases and proceeds from sales of investment securities (excluding any short-term securities, short-term options contracts, and in-kind transactions) was as follows:
| | | | | | | | | | | | | | |
Purchases of Securities | | | Proceeds from Sales of Securities | | | Purchases of Long- Term U.S. Government Obligations | | | Proceeds from Sales of Long-Term U.S. Government Obligations | |
| $ | 3,985,810 | | | $ | 4,049,075 | | | $ | — | | | $ | — | |
For the year ended October 31, 2018, the cost of in-kind purchases and proceeds from in-kind sales, were as follows:
| | | | | | | | | | | | | | |
Purchases of Securities | | | Proceeds from Sales of Securities | | | Purchases of Long- Term U.S. Government Obligations | | | Proceeds from Sales of Long-Term U.S. Government Obligations | |
| $ | 13,928,683 | | | $ | 6,669,041 | | | $ | — | | | $ | — | |
During the year ended October 31, 2018, the Fund had net realized gain/(loss) of $940,206 from in-kind redemptions. Gains on in-kind transactions are not considered taxable for federal income tax purposes.
7. Recent Accounting Pronouncements
The Securities and Exchange Commission adopted amendments to Regulation S-X, for the presentation of distributable earnings and distributions to align with US Generally Accepted Accounting Principles (GAAP). The compliance date of the amendments to Regulation S-X is November 5, 2018. This report incorporates the amendments to Regulation S-X.
The FASB issued Accounting Standards Update 2018-13, Fair Value Measurement (Topic 820) in August 2018. The new guidance removes, modifies and enhances the disclosures to Topic 820. For public entities, the amendments are effective for financial statements issued for fiscal years beginning after December 15, 2019, and interim periods within those fiscal years. Management is currently evaluating the impact of this new guidance on the financial statements.
The FASB issued Accounting Standards Update No. 2017-08, Receivables – Nonrefundable Fees and Other Costs (Subtopic 310-20), Premium Amortization on Purchased Callable Debt Securities (“ASU 2017-08”) to amend the amortization period for certain purchased callable debt securities held at a premium. The guidance requires certain premiums on callable debt securities to be amortized to the earliest call date. The amortization period for callable debt securities purchased at a discount will not be impacted. The amendments are effective for fiscal years, and interim periods within those fiscal years, beginning after December 15, 2018. Early adoption is permitted, including adoption in an interim period. Management is currently evaluating the impacts of ASU 2017-08 on the Fund’s financial statements.
8. Subsequent Events
Management has evaluated whether any events or transactions occurred subsequent to October 31, 2018 and through the date of issuance of the Fund’s financial statements and determined that there were no material events or transactions that would require recognition or disclosure in the Fund’s financial statements other than the following:
The Fund’s Board of Trustees (“Board”) approved an amendment (“Amendment”) to the Investment Advisory and Management Agreement that provides for a new management fee rate schedule that reduces the annual management
The Obesity ETF
Notes to Financial Statements
fee rate payable by the Fund to Janus Capital and also provides for further management fee rate reductions as assets grow. The new annual management fee rate schedule is effective November 1, 2018. A chart comparing the Fund’s historical management fee to the new management fee schedule (each expressed as an annual rate) is provided below.
| | | | | | |
| Historical | | New | |
| Average Daily Net Assets | | Daily Net Assets | |
| 0.50% | | $0-$500 million | | | 0.35% | |
| | Next $500 million | | | 0.28% | |
| | | Over $1 billion | | | 0.20% | |
| | |
| | Janus Detroit Street Trust ½ 21 |
The Obesity ETF
Additional Information (unaudited)
Proxy Voting Policies and Voting Record
A description of the policies and procedures that the Fund uses to determine how to vote proxies relating to its portfolio securities is available without charge: (i) upon request, by calling 1-800-525-0020 (toll free); (ii) on the Fund’s website at janushenderson.com/proxyvoting; and (iii) on the SEC’s website at http://www.sec.gov.
Quarterly Portfolio Holdings
The Fund files its complete portfolio holdings (schedule of investments) with the SEC for the first and third quarters of each fiscal year on Form N-Q within 60 days of the end of such fiscal quarter. The Fund’s Form N-Q: (i) is available on the SEC’s website at http://www.sec.gov; (ii) may be reviewed and copied at the SEC’s Public Reference Room in Washington, D.C. (information on the Public Reference Room may be obtained by calling 1-800-SEC-0330); and (iii) is available without charge, upon request, by calling Janus Henderson at 1-800-525-0020 (toll free).
Designation Requirements (unaudited)
For federal income tax purposes, the Fund designated the following for the year ended October 31, 2018
| | | | |
| Dividends Received Deduction Percentage | | | 43% | |
| Qualified Dividend Income Percentage | | | 100% | |
Licensing Agreements
Solactive AG (“Solactive”) is the Index Provider for the Underlying Index. Janus Capital has entered into a license agreement with Solactive to use the Underlying Index.
Neither Solactive nor any of its affiliates make any representation or warranty, express or implied, to the owners of a Fund or any member of the public regarding the advisability of investing in securities generally or in a Fund particularly or the ability of the Underlying Index to track general market performance. The Underlying Index is determined, composed, and calculated by Solactive without regard to Janus Capital or the Fund. Solactive has no obligation to take the needs of Janus Capital or the owners of the Fund into consideration in determining, composing, or calculating the Underlying Index. Solactive is not responsible for and has not participated in the determination of the timing of, prices at, or quantities of the Fund to be issued or in the determination or calculation of the equation by which the Fund is to be converted into cash.
ALTHOUGH SOLACTIVE SHALL OBTAIN INFORMATION FOR INCLUSION IN OR FOR USE IN THE CALCULATION OF THE UNDERLYING INDEX FROM SOURCES WHICH IT CONSIDERS RELIABLE, IT DOES NOT GUARANTEE THE QUALITY, ACCURACY AND/OR THE COMPLETENESS OF THE UNDERLYING INDEX OR ANY DATA INCLUDED THEREIN AND SHALL HAVE NO LIABILITY FOR ERRORS OR OMISSIONS OF ANY KIND RELATED TO THE UNDERLYING INDEX OR DATA. SOLACTIVE MAKES NO WARRANTY, EXPRESS OR IMPLIED, AS TO RESULTS TO BE OBTAINED BY JANUS CAPITAL, OWNERS OF THE FUND, OR ANY OTHER PERSON OR ENTITY FROM THE USE OF THE UNDERLYING INDEX OR ANY DATA INCLUDED THEREIN IN CONNECTION WITH THE RIGHTS LICENSED TO JANUS CAPITAL FOR ANY OTHER USE. SOLACTIVE MAKES NO EXPRESS OR IMPLIED WARRANTIES, AND HEREBY EXPRESSLY DISCLAIMS ALL WARRANTIES OF MERCHANTABILITY OR FITNESS FOR A PARTICULAR PURPOSE OR USE WITH RESPECT TO THE UNDERLYING INDEX OR ANY DATA INCLUDED THEREIN. WITHOUT LIMITING ANY OF THE FOREGOING, IN NO EVENT SHALL IT HAVE ANY LIABILITY FOR ANY SPECIAL, PUNITIVE, INDIRECT, OR CONSEQUENTIAL DAMAGES (INCLUDING LOST PROFITS), EVEN IF NOTIFIED OF THE POSSIBILITY OF SUCH DAMAGES.
Janus Capital does not guarantee the accuracy and/or the completeness of the Underlying Index or any data included therein, and Janus Capital shall have no liability for any errors, omissions or interruptions therein. Janus Capital makes no warranty, express or implied, as to results to be obtained by the Fund, owners of the shares of the Fund or any other person or entity from the use of the Underlying Index or any data included therein. Janus Capital makes no express or implied warranties, and expressly disclaims all warranties of merchantability or fitness for a particular purpose or use with respect to the Underlying Index or any data included therein. Without limiting any of the foregoing, in no event shall Janus Capital have any liability for any special, punitive, direct, indirect or consequential damages (including lost profits) arising out of matters relating to the use of the Underlying Index even if notified of the possibility of such damages.
The Obesity ETF
Board Considerations Regarding Approval of Investment Advisory Agreements (unaudited)
APPROVAL OF AMENDMENT TO INVESTMENT ADVISORY AGREEMENT
At an in-person meeting held on October 9-10, 2018, the Trustees approved an amendment (“Amendment”) to the Investment Advisory and Management Agreement between the Trust and Janus Capital on behalf of Janus Henderson Small Cap Growth Alpha ETF, Janus Henderson Small/Mid Cap Growth Alpha ETF, The Long-Term Care ETF, The Obesity ETF, and The Organics ETF (each a “Fund” and, together, the “Funds”). The Amendment provided for a new management fee rate schedule that reduces the annual management fee rate payable by the Funds to Janus Capital and also provided for further management fee rate reductions as assets grow. A comparison of the prior and new unitary fee rate schedules (each expressed as an annual rate) is shown below.
| | | | | | |
| Current | | New | |
| Average Daily Net Assets | | Daily Net Assets | |
| 0.50% | | $0-$500 million | | | 0.35% | |
| | Next $500 million | | | 0.28% | |
| | | Over $1 billion | | | 0.20% | |
In connection with the Amendment approval, Janus Capital represented to the Trustees that there would be no change to the nature, quality and extent of services rendered by Janus Capital to the Fund. The Amendment is effective as of November 1, 2018.
| | |
| | Janus Detroit Street Trust ½ 23 |
The Obesity ETF
Trustees and Officers (unaudited)
The Fund’s Statement of Additional Information includes additional information about the Trustees and officers and is available, without charge, by calling 1-877-335-2687.
The following are the Trustees and officers of the Trust, together with a brief description of their principal occupations during the last five years (principal occupations for certain Trustees may include periods over five years).
Each Trustee has served in that capacity since he or she was originally elected or appointed. The Trustees do not serve a specified term of office. Each Trustee will hold office until the termination of the Trust or his or her earlier death, resignation, retirement, incapacity, or removal. Under the Fund’s Governance Procedures and Guidelines, the policy is for Trustees to retire no later than the end of the calendar year in which the Trustee turns 75. The Trustees review the Fund’s Governance Procedures and Guidelines from time to time and may make changes they deem appropriate. The Fund’s Nominating and Governance Committee will consider nominees for the position of Trustee recommended by shareholders. Shareholders may submit the name of a candidate for consideration by the Committee by submitting their recommendations to the Trust’s Secretary. Each Trustee is currently a Trustee of one other registered investment company advised by Janus Capital: Clayton Series Trust. Collectively, these two registered investment companies consist of 10 series or funds.
The Trust’s officers are elected annually by the Trustees for a one-year term. Certain officers also serve as officers of Clayton Series Trust. Certain officers of the Fund may also be officers and/or directors of Janus Capital. Fund officers receive no compensation from the Fund, except for the Fund’s Chief Compliance Officer, as authorized by the Trustees.
| | | | | | | | | | | | | | | | | | |
| TRUSTEES | | | | | | | | | | | | | | |
| Name, Address, and Age | | Positions Held
with the Trust | | | Length of Time Served | | | Principal Occupations
During the Past Five Years | | Number of
Portfolios/Funds in Fund Complex Overseen by
Trustee* | | | Other Directorships Held by Trustee During the Past Five Years | |
Independent Trustees | | | | | | | | | | | | | | | | | | |
Clifford J. Weber 151 Detroit Street Denver, CO 80206 DOB: 1963 | |
| Chairman
Trustee |
| |
| 2/16-Present
2/16-Present |
| | Owner, Financial Products Consulting Group LLC (consulting services to financial institutions) (since 2015). Formerly, Executive Vice President of Global Index and Exchange- Traded Products, NYSE Market, Inc., a subsidiary of Intercontinental Exchange (ETF/ETP listing exchange) (2013-2015) and Executive Vice President and Head of Strategy and Product Development, NYSE Liffe U.S., a division of NYSE Euronext (U.S. futures exchange) (2008-2013). | | | 10 | | |
| Independent Trustee, Clough
Funds Trust (investment
company) (since 2015).
Chairman, Clough Funds
Trust (since 2017),
Independent Trustee, Clough
Dividend and Income Fund
(closed-end fund) (since
2017), Independent Trustee,
Clough Global Opportunities
Fund (closed-end fund)
(since 2017), Independent
Trustee, Clough Global
Equity Fund (closed-end
fund) (since 2017),
Independent Trustee,
Elevation ETF Trust
(investment company)
(2016-2018) Chairman,
Elevation ETF Trust (2016-
2018), and Independent
Trustee, Global X Funds
(investment company) (since
2018). |
|
The Obesity ETF
Trustees and Officers (unaudited)
| | | | | | | | | | | | | | | | | | |
| TRUSTEES | | | | | | | | | | | | | | |
| Name, Address, and Age | | Positions Held
with the Trust | | | Length of Time Served | | | Principal Occupations
During the Past Five Years | | Number of
Portfolios/Funds in Fund Complex Overseen by
Trustee* | | | Other Directorships Held by Trustee During the Past Five Years | |
Maureen T. Upton 151 Detroit Street Denver, CO 80206 DOB: 1965 | | | Trustee | | | | 2/16-Present | | | Principal, Maureen Upton Ltd. (consulting services to developers of major infrastructure projects and investors) (since 2017). Formerly, Principal Consultant, SRK Consulting (U.S.), Inc. (consulting services to global mining, energy and water resource industries) (2015-2017) and Founder and Principal, Resource Initiatives LLC (sustainability consulting firm) (2006-2015). | | | 10 | | |
| Director, Denver Metro
Leadership Foundation (non-profit organization) (2012-2014). |
|
| | | | | |
Jeffrey B. Weeden 151 Detroit Street Denver, CO 80206 DOB: 1956 | | | Trustee | | | | 2/16-Present | | | Senior Advisor, BayBoston Capital LP (investment fund in finance companies, banks and bank holdings companies) (since 2015). Formerly, Management Advisor, BoxCast, Inc. (technology start-up company) (2014-2017) and Senior Executive Vice President and Chief Financial Officer, KeyCorp (financial services) (2002-2013). | | | 10 | | |
| Director, State Farm
Bank (banking)
(since 2014). |
|
Interested Trustee | | | | | | | | | | | | | | | | | | |
Michael Drew Elder** 151 Detroit Street Denver, CO 80206 DOB: 1970 | | | Trustee | | | | 8/15-Present | | | Executive Vice President and Head of U.S. Intermediary Distribution, Janus Capital (since 2014) and President, Janus Distributors LLC (broker- dealer) (since 2014). Formerly, Senior Vice President, Janus Capital (2007-2014). | | | 10 | | |
| Director, Perkins Investment
Management LLC
(since 2014). |
|
| * | In addition to the Trust, which is comprised of seven series, each Trustee also serves as a trustee to the Clayton Street Trust, which is an affiliated registered investment company currently comprised of three portfolios. |
| ** | Michael Drew Elder is an Interested Trustee because of his employment with Janus Capital. |
| | |
| | Janus Detroit Street Trust ½ 25 |
The Obesity ETF
Trustees and Officers (unaudited)
| | | | | | |
| OFFICERS | | | | | | |
| Name, Address, and Age | | Positions Held with the Trust | | Term of Office* and
Length of Time Served | | Principal Occupations
During the Past Five Years |
Bruce L. Koepfgen 151 Detroit Street Denver, CO 80206 DOB: 1952 | | President and Chief Executive Officer | | 2/16-Present | | Head of North America for Janus Henderson Investors and Janus Capital Management LLC (since 2017); Executive Vice President and Director of Janus International Holding LLC (since 2011); Executive Vice President of Janus Distributors LLC (since 2011); Executive Vice President and Working Director of INTECH Investment Management LLC (since 2011); Executive Vice President and Director of Perkins Investment Management LLC (since 2011); and Executive Vice President and Director of Janus Management Holdings Corporation (since 2011). Formerly, President of Janus Capital Group Inc. and Janus Capital Management LLC (2013-2017); Executive Vice President of Janus Services LLC (2011-2015), Janus Capital Group Inc. and Janus Capital Management LLC (2011-2013); and Chief Financial Officer of Janus Capital Group Inc., Janus Capital Management LLC, Janus Distributors LLC, Janus Management Holdings Corporation, and Janus Services LLC (2011-2013). |
| | | |
Susan K. Wold 151 Detroit Street Denver, CO 80206 DOB: 1960 | | Vice President, Chief Compliance Officer, and Anti- Money Laundering Officer | | 9/17-Present | | Senior Vice President and Head of Compliance North America for Janus Henderson (since September 2017); Formerly Vice President, Head of Global Corporate Compliance, and Chief Compliance Officer for Janus Capital Management LLC (May 2017-September 2017); Vice President, Compliance at Janus Capital Group and Janus Capital Management LLC (2005-2017). |
| | | |
Jesper Nergaard 151 Detroit Street Denver, CO 80206 DOB: 1962 | | Vice President, Chief Financial Officer, Treasurer, and Principal Accounting Officer | | 2/16-Present | | Vice President of Janus Capital and Janus Services LLC. |
| | | |
Byron Hittle 151 Detroit Street Denver, CO 80206 DOB: 1974 | | Vice President, Secretary and Chief Legal Officer | | 7/18-Present | | Vice President and Assistant General Counsel of Janus Capital and Janus Services LLC (2017-present); Assistant Vice President and Senior Legal Counsel (2012-2016). |
| * | Officers are elected at least annually by the Trustees for a one-year term and may also be elected from time to time by the Trustees for an interim period. |
The Obesity ETF
Notes
| | |
| | Janus Detroit Street Trust ½ 27 |
The Obesity ETF
Notes
The Obesity ETF
Notes
| | |
| | Janus Detroit Street Trust ½ 29 |
Knowledge. Shared
At Janus Henderson, we believe in the sharing of expert insight for better investment and business decisions. We call this ethos Knowledge. Shared.
Learn more by visiting janushenderson.com.
This report is submitted for the general information of shareholders of the Fund. It is not an offer or solicitation for the Fund and is not authorized for distribution to prospective investors unless preceded or accompanied by an effective prospectus.
Janus Henderson and Knowledge. Shared are trademarks of Janus Henderson Group plc or one of its subsidiary entities. © Janus Henderson Group plc.
Janus Capital Management LLC is the investment adviser and ALPS Distributors, Inc. is the distributor. ALPS is not affiliated with Janus Henderson or any of its subsidiaries.
ANNUAL REPORT
October 31, 2018
The Organics ETF
Janus Detroit Street Trust

Table of Contents
The Organics ETF (unaudited)
INVESTMENT OBJECTIVE
The Organics ETF (ORG) seeks investment results that correspond generally to the performance, before fees and expenses, of an index which is designed to track the performance of companies globally that are positioned to profit from increasing demand for organic products, including companies which service, produce, distribute, market or sell organic food, beverages, cosmetics, supplements, or packaging.
PERFORMANCE OVERVIEW
| • | | Concerns over inflation and faster-than-expected interest rate hikes were a source of volatility, as were fears about protectionist trade policies. Gains were concentrated in the U.S., where economic data have been positive, driven by corporate earnings, synchronized economic growth and optimism about U.S. tax reform. The nomination of Jerome Powell as the next chair of the Federal Reserve (Fed) signaled the likely continuation of monetary policy normalization. Throughout the period, political and economic tensions in both developed economies outside the U.S. and emerging economies became increasingly prevalent. Highly uncertain Brexit negotiations and tensions between the EU and Italy weighed on European markets. Emerging markets continue to struggle as U.S. Treasury yields rise, and Asian markets are anticipating greater conflict with the U.S. |
| • | | The underlying Solactive Organics Index underperformed the broader market as represented by the MSCI All Country World IndexSM. Within the Solactive Organics Index, agricultural products and food distributors delivered the weakest returns on a sub-industry basis, while Internet and direct marketing, and food retail delivered the strongest returns. |
| • | | During the period, ORG returned -5.86% (based on NAV); its primary benchmark, the Solactive Organics Index, returned -5.77%, and its secondary benchmark, the MSCI All Country World IndexSM, returned -0.52%. |
| • | | ORG seeks investment results that correspond generally, before fees and expenses, to the performance of its primary benchmark. It seeks exposure to companies globally that can capitalize on consumers’ increasing desire for naturally derived food and personal care items, including companies that service, produce, distribute, market or sell organic food, beverage, cosmetics, supplements or packaging. |
| | |
| | Janus Detroit Street Trust ½ 1 |
The Organics ETF (unaudited)
Fund At A Glance
October 31, 2018
| | | | |
| 5 Largest Equity Holdings – (% of Net Assets) | |
Chr Hansen Holding AS | | | | |
Chemicals | | | 20.5% | |
Sprouts Farmers Market, Inc. | | | | |
Food & Staples Retailing | | | 11.8% | |
Hain Celestial Group, Inc. | | | | |
Food Products | | | 8.0% | |
Ariake Japan Co., Ltd. | | | | |
Food Products | | | 5.5% | |
L’Occitane International SA | | | | |
Specialty Retail | | | 4.8% | |
| | | | |
| | | 50.6% | |
| | | | |
| Sector Allocation – (% of Net Assets) | |
Consumer, Non-cyclical | | | 93.1% | |
Investment Company Securities | | | 6.5% | |
Basic Materials | | | 4.3% | |
Communications Services | | | 3.4% | |
| | | | |
| | | 107.3% | |
Holdings are subject to change without notice.
The Organics ETF (unaudited)
Performance
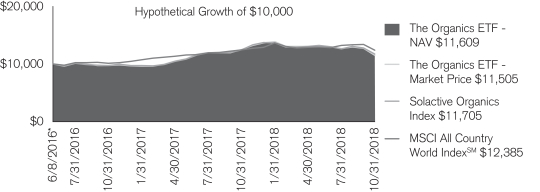
| | | | |
| Average Annual Total Return for the periods ended October 31, 2018 |
| | | One Year | | Since
Inception* |
The Organics ETF – NAV | | -5.86% | | 6.42% |
The Organics ETF – Market Price | | -7.62% | | 6.02% |
Solactive Organics Index | | -5.77% | | 6.79% |
MSCI All Country World IndexSM | | -0.52% | | 9.33% |
Total annual expense ratio as stated in the February 28, 2018 prospectus: 0.50%.
Returns quoted are past performance and do not guarantee future results; current performance may be lower or higher. Investment returns and principal value will vary; there may be a gain or loss when shares are sold. For the most recent month-end performance call 800.668.0434 or visit janushenderson.com/performance.
Shares of ETFs are bought and sold at market price (not NAV) and are not individually redeemed from the Fund. Market returns are based upon the midpoint of the bid/ask spread at 4:00 p.m. Eastern time (when NAV is normally determined for most ETFs), and do not represent the returns you would receive if you traded shares at other times. Ordinary brokerage commissions apply and will reduce returns.
ETF shares are not individually redeemable and owners of the shares may acquire those shares from the Fund and tender those shares for redemption to the Fund in Creation Units only.
Investing involves risk, including the possible loss of principal and fluctuation of value.
Performance depends on that of the underlying index.
See the prospectus for a more complete discussion of objectives, risks and expenses.
Returns include reinvestment of dividends and capital gains. Returns greater than one year are annualized. Returns do not reflect the deduction of taxes that a shareholder would pay on Fund distributions or redemptions of Fund shares.
See Financial Highlights for actual expense ratios during the reporting period.
There is no assurance the stated objective(s) will be met.
See Notes to Schedule of Investments and Other Information for index definitions.
Index performance does not reflect the expenses of managing a portfolio as an index is unmanaged and not available for direct investment.
Solactive Indices were created by and are maintained by, Solactive AG. For detailed information on how stocks are selected for inclusion in the Underlying Index, see solactive.com. Solactive is not affiliated with Janus Henderson or ALPS.
| * | Fund commenced operations on June 8, 2016. |
| | |
| | Janus Detroit Street Trust ½ 3 |
The Organics ETF (unaudited)
Disclosure of Fund Expenses
As a shareholder of the Fund, you incur two types of costs: (1) transaction costs, which may include creation and redemption fees or brokerage charges and (2) ongoing costs, including management fees and other Fund expenses. This example is intended to help you understand your ongoing costs (in dollars) of investing in the Fund and to compare these costs with the ongoing costs of investing in other ETFs. To do so, compare this 5% hypothetical example with the 5% hypothetical examples that appear in the shareholder reports of the other funds. The example is based upon an investment of $1,000 invested at the beginning of the period and held for the six-months indicated, unless noted otherwise in the table and footnotes below.
Actual Expenses
The information in the table under the heading “Actual” provides information about actual account values and actual expenses. You may use the information in these columns, together with the amount you invested, to estimate the expenses that you paid over the period. Simply divide your account value by $1,000 (for example, an $8,600 account value divided by $1,000 = 8.6), then multiply the result by the number under the heading entitled “Expenses Paid During Period” to estimate the expenses you paid on your account during the period.
Hypothetical Example for Comparison Purposes
The information in the table under the heading “Hypothetical (5% return before expenses)” provides information about hypothetical account values and hypothetical expenses based upon the Fund’s actual expense ratio and an assumed rate of return of 5% per year before expenses, which is not the Fund’s actual return. The hypothetical account values and expenses may not be used to determine the actual ending account balance or expenses you paid for the period. You may use this information to compare the ongoing costs of investing in the Fund and other funds. To do so, compare this 5% hypothetical example with the 5% hypothetical examples that appear in the shareholder reports of the other funds. Additionally, for an analysis of the fees associated with an investment or other similar funds, please visit www.finra.org/fundanalyzer.
Please note that the expenses shown in the table are meant to highlight your ongoing costs only and do not reflect any transaction costs, such as creation and redemption fees, or brokerage charges. These fees are fully described in the Fund’s prospectus. Therefore, the hypothetical examples are useful in comparing ongoing costs only, and will not help you determine the relative total costs of owning different funds. In addition, if these transaction costs were included, your costs would have been higher.
| | | | | | | | | | | | | | | | | | | | | | | | |
Actual | | | Hypothetical
(5% return before expenses) | | | | |
Beginning
Account
Value
(5/1/18) | | Ending
Account
Value
(10/31/2018) | | | Expenses
Paid During
Period
(5/1/18 - 10/31/2018)† | | | Beginning
Account
Value
(5/1/18) | | | Ending
Account
Value
(10/31/2018) | | | Expenses
Paid During
Period
(5/1/18 - 10/31/2018)† | | | Net Annualized
Expense Ratio
(5/1/18 - 10/31/2018) | |
| $1,000.00 | | $ | 898.20 | | | $ | 2.39 | | | $ | 1,000.00 | | | $ | 1,022.68 | | | $ | 2.55 | | | | 0.50% | |
| † | Expenses Paid During Period is equal to the Net Annualized Expense Ratio multiplied by the average account value over the period, multiplied by 184/365 (to reflect the one-half year period). |
The Organics ETF
Report of Independent Registered Public Accounting Firm
To the Board of Trustees of Janus Detroit Street Trust and Shareholders of The Organics ETF:
Opinion on the Financial Statements
We have audited the accompanying statement of assets and liabilities, including the schedule of investments, of The Organics ETF (one of the funds constituting Janus Detroit Street Trust, referred to hereafter as the “Fund”) as of October 31, 2018, the related statement of operations for the year ended October 31, 2018, the statements of changes in net assets for each of the two years in the period ended October 31, 2018, including the related notes, and the financial highlights for each of the two years in the period ended October 31, 2018 and for the period June 8, 2016 (commencement date) through October 31, 2016 (collectively referred to as the “financial statements”). In our opinion, the financial statements present fairly, in all material respects, the financial position of the Fund as of October 31, 2018, the results of its operations for the year then ended, the changes in its net assets for each of the two years in the period ended October 31, 2018 and the financial highlights for each of the two years in the period ended October 31, 2018 and for the period June 8, 2016 (commencement date) through October 31, 2016 in conformity with accounting principles generally accepted in the United States of America.
Basis for Opinion
These financial statements are the responsibility of the Fund’s management. Our responsibility is to express an opinion on the Fund’s financial statements based on our audits. We are a public accounting firm registered with the Public Company Accounting Oversight Board (United States) (“PCAOB”) and are required to be independent with respect to the Fund in accordance with the U.S. federal securities laws and the applicable rules and regulations of the Securities and Exchange Commission and the PCAOB.
We conducted our audits of these financial statements in accordance with the standards of the PCAOB. Those standards require that we plan and perform the audit to obtain reasonable assurance about whether the financial statements are free of material misstatement, whether due to error or fraud.
Our audits included performing procedures to assess the risks of material misstatement of the financial statements, whether due to error or fraud, and performing procedures that respond to those risks. Such procedures included examining, on a test basis, evidence regarding the amounts and disclosures in the financial statements. Our audits also included evaluating the accounting principles used and significant estimates made by management, as well as evaluating the overall presentation of the financial statements. Our procedures included confirmation of securities owned as of October 31, 2018 by correspondence with the custodian, transfer agent, and brokers; when replies were not received from brokers, we performed other auditing procedures. We believe that our audits provide a reasonable basis for our opinion.

Denver, Colorado
December 20, 2018
We have served as the auditor of one or more investment companies in Janus Henderson Funds since 1990.
| | |
| | Janus Detroit Street Trust ½ 5 |
The Organics ETF
Schedule of Investments
October 31, 2018
| | | | | | | | |
| | | Shares | | | Value | |
| Common Stocks – 100.8% | | | | | | |
| Chemicals – 24.8% | | | | | | |
Century Sunshine Group Holdings, Ltd.* | | | 4,915,000 | | | | $121,004 | |
Chr Hansen Holding AS | | | 23,545 | | | | 2,380,710 | |
Treatt PLC | | | 70,322 | | | | 377,386 | |
| | | | | | | | |
| | | | | | | 2,879,100 | |
| Food & Staples Retailing – 19.6% | | | | | | |
Natural Grocers by Vitamin Cottage, Inc.* | | | 12,191 | | | | 220,901 | |
Sprouts Farmers Market, Inc.* | | | 50,956 | | | | 1,370,207 | |
United Natural Foods, Inc.* | | | 20,818 | | | | 452,375 | |
Village Super Market, Inc. - Class A | | | 9,623 | | | | 237,111 | |
| | | | | | | | |
| | | | | | | 2,280,594 | |
| Food Products – 40.6% | | | | | | |
Ariake Japan Co., Ltd. | | | 7,200 | | | | 637,987 | |
Bellamy’s Australia, Ltd.* | | | 79,260 | | | | 406,149 | |
Bubs Australia, Ltd.*,# | | | 411,752 | | | | 137,159 | |
China Shengmu Organic Milk, Ltd. (144A)* | | | 2,891,000 | | | | 116,165 | |
Freedom Foods Group, Ltd. | | | 122,743 | | | | 440,190 | |
Hain Celestial Group, Inc.* | | | 37,250 | | | | 926,780 | |
Ichitan Group PCL | | | 909,800 | | | | 109,231 | |
John B Sanfilippo & Son, Inc. | | | 7,679 | | | | 484,238 | |
Rock Field Co., Ltd. | | | 25,300 | | | | 366,761 | |
SunOpta, Inc.* | | | 73,340 | | | | 544,183 | |
Wessanen | | | 51,714 | | | | 542,292 | |
| | | | | | | | |
| | | | | | | 4,711,135 | |
| Internet & Catalog Retail – 3.4% | | | | | | |
Oisix ra daichi, Inc.*,# | | | 23,000 | | | | 395,782 | |
| | | | | | | | |
| Personal Products – 7.1% | | | | | | |
Blackmores, Ltd. | | | 5,963 | | | | 512,943 | |
HS Vital Co., Ltd.* | | | 15,779 | | | | 30,809 | |
Midsona AB - Class B | | | 39,511 | | | | 275,376 | |
| | | | | | | 819,128 | |
| Specialty Retail – 5.3% | | | | | | |
L’Occitane International SA | | | 300,000 | | | | 562,543 | |
Naturhouse Health SAU | | | 18,403 | | | | 47,333 | |
| | | | | | | | |
| | | | | | | 609,876 | |
Total Common Stocks (cost $12,920,963) | | | | | | | 11,695,615 | |
| Investment Companies – 6.5% | | | | | | |
| Investments Purchased with Cash Collateral from Securities Lending – 6.5% | | | | | | |
Janus Henderson Cash Collateral Fund LLC, 2.1443% ºº,£ (cost $760,430) | | | 760,430 | | | | 760,430 | |
Total Investments (total cost $13,681,393) – 107.3% | | | | | | | 12,456,045 | |
Liabilities, net of Cash, Receivables and Other Assets – (7.3%) | | | | | | | (847,658) | |
Net Assets – 100% | | | | | | | $11,608,387 | |
See Notes to Schedule of Investments and Other Information and Notes to Financial Statements.
The Organics ETF
Schedule of Investments
October 31, 2018
Summary of Investments by Country – (Long Positions) (unaudited)
| | | | | | | | |
| Country | | Value | | | % of
Investment
Securities | |
United States | | | $4,452,042 | | | | 35.7% | |
Denmark | | | 2,380,710 | | | | 19.1 | |
Australia | | | 1,496,441 | | | | 12.0 | |
Japan | | | 1,400,530 | | | | 11.2 | |
Luxembourg | | | 562,543 | | | | 4.5 | |
Canada | | | 544,183 | | | | 4.4 | |
Netherlands | | | 542,292 | | | | 4.4 | |
United Kingdom | | | 377,386 | | | | 3.0 | |
Sweden | | | 275,376 | | | | 2.2 | |
Hong Kong | | | 121,004 | | | | 1.0 | |
China | | | 116,165 | | | | 0.9 | |
Thailand | | | 109,231 | | | | 0.9 | |
Spain | | | 47,333 | | | | 0.4 | |
South Korea | | | 30,809 | | | | 0.3 | |
Total | | | $12,456,045 | | | | 100.0% | |
Schedules of Affiliated Investments – (% of Net Assets)
| | | | | | | | | | | | | | | | |
| | | Dividend
Income | | | Realized
Gain/(Loss) | | | Change in
Unrealized
Appreciation/
(Depreciation) | | | Value at
10/31/18 | |
Investment Companies — 6.5% | | | | | | | | | | | | | | | | |
Investments Purchased with Cash Collateral from Securities Lending — 6.5% | | | | | | | | | | | | | | | | |
Janus Henderson Cash Collateral Fund LLC, 2.1443%ºº | | | $29,834 | D | | | $— | | | | $— | | | | $760,430 | |
| | | | |
| | | Share Balance
at 10/31/17 | | | Purchases | | | Sales | | | Share
Balance
at
10/31/18 | |
Investment Companies — 6.5% | | | | | | | | | | | | | | | | |
Investments Purchased with Cash Collateral from Securities Lending — 6.5% | | | | | | | | | | | | | | | | |
Janus Henderson Cash Collateral Fund LLC, 2.1443%ºº | | | 238,150 | | | | 5,688,405 | | | | (5,166,125) | | | | 760,430 | |
See Notes to Schedule of Investments and Other Information and Notes to Financial Statements.
| | |
| | Janus Detroit Street Trust ½ 7 |
The Organics ETF
Notes to Schedule of Investments and Other Information
October 31, 2018
| | |
| Solactive Organics Index | | Solactive Organics Index is designed to track the performance of companies globally that are positioned to profit from increasing demand for organic products, including companies which service, produce, distribute, market or sell organic food, beverage, cosmetics, supplements, or packaging. |
| |
| MSCI All Country World IndexSM | | MSCI All Country World IndexSM reflects the equity market performance of global developed and emerging markets. |
| |
| LLC | | Limited Liability Company |
| |
| PCL | | Public Company Limited |
| |
| PLC | | Public Limited Company |
| 144A | Securities sold under Rule 144A of the Securities Act of 1933, as amended, are subject to legal and/or contractual restrictions on resaleand may not be publicly sold without registration under the 1993 Act. Unless otherwise noted, these securities have been determined tobe liquid under guidelines established by the Board of Trustees. The total value of 144A securities as of the year ended October 31, 2018 is $116,165, which represents 1.0% of net assets. |
| * | Non-income producing security. |
| # | Loaned security; a portion of the security is on loan at October 31, 2018. |
| ºº | Rate reflects 7 day yield as of October 31, 2018. |
| £ | The Fund may invest in certain securities that are considered affiliated companies. As defined by the Investment Company Act of 1940, as amended, an affiliated company is one in which the Fund owns 5% or more of the outstanding voting securities, or a company which is under common ownership or control. |
| D | Net of income paid to the securities lending agent and rebates paid to the borrowing counterparties. |
The following is a summary of the inputs that were used to value the Fund’s investments in securities and other financial instruments as of October 31, 2018. See Notes to Financial Statements for more information.
Valuation Inputs Summary
| | | | | | | | | | | | |
| | | Level 1 -
Quoted Prices | | | Level 2 -
Other Significant
Observable Inputs | | | Level 3 -
Significant
Unobservable Inputs | |
Assets | |
Investments in Securities: | |
Common Stocks | | $ | 11,695,615 | | | $ | — | | | $ | — | |
Investment Companies | | | — | | | | 760,430 | | | | — | |
| | | | |
Total Assets | | $ | 11,695,615 | | | $ | 760,430 | | | $ | — | |
The Organics ETF
Statement of Assets and Liabilities
October 31, 2018
| | | | |
Assets: | |
Unaffiliated investments, at value(1)(2) | | $ | 11,695,615 | |
Affiliated investments, at value(3) | | | 760,430 | |
Receivables: | | | | |
Investments sold | | | 1,593,280 | |
Dividends | | | 14,833 | |
Affiliated securities lending income, net | | | 2,972 | |
Total Assets | | | 14,067,130 | |
Liabilities: | |
Collateral on securities loaned (Note 2) | | | 760,430 | |
Payables: | | | | |
Investments purchased | | | 1,693,236 | |
Management fees | | | 5,077 | |
Total Liabilities | | | 2,458,743 | |
Net Assets | | $ | 11,608,387 | |
Net Assets Consists of: | |
Capital (par value and paid-in surplus) | | $ | 13,461,364 | |
Total distributable earnings (loss) | | | (1,852,977) | |
Total Net Assets | | $ | 11,608,387 | |
Net Assets | | $ | 11,608,387 | |
Shares outstanding, $0.001 Par Value (unlimited shares authorized) | | | 400,001 | |
Net Asset Value Per Share | | $ | 29.02 | |
| (1) | Includes cost of $12,920,963. |
| (2) | Includes $703,689 of securities on loan. See Note 2 in Notes to Financial Statements. |
| (3) | Includes cost of $760,430 |
See Notes to Financial Statements.
| | |
| | Janus Detroit Street Trust ½ 9 |
The Organics ETF
Statement of Operations
For the year ended October 31, 2018
| | | | |
Investment Income: | | | | |
Dividends | | $ | 173,845 | |
Affiliated securities lending income, net | | | 29,834 | |
Foreign tax withheld | | | (15,620) | |
Total Investment Income | | | 188,059 | |
Expenses: | | | | |
Management Fees | | | 64,961 | |
Total Expenses | | | 64,961 | |
Net Investment Income/(Loss) | | | 123,098 | |
Net Realized Gain/(Loss) on Investments: | | | | |
Investments and foreign currency transactions | | | 1,070,360 | |
Total Net Realized Gain/(Loss) on Investments | | | 1,070,360 | |
Change in Unrealized Net Appreciation/Depreciation: | | | | |
Investments and foreign currency translations | | | (1,982,614) | |
Total Change in Unrealized Net Appreciation/Depreciation | | | (1,982,614) | |
Net Increase/(Decrease) in Net Assets Resulting from Operations | | $ | (789,156) | |
See Notes to Financial Statements.
The Organics ETF
Statements of Changes in Net Assets
| | | | | | | | |
| | | Year Ended
October 31, 2018 | | | Year Ended
October 31, 2017 | |
Operations: | | | | | | | | |
Net investment income/(loss) | | $ | 123,098 | | | $ | 55,187 | |
Net realized gain/(loss) on investments | | | 1,070,360 | | | | 479,486 | |
Change in unrealized net appreciation/depreciation | | | (1,982,614) | | | | 836,970 | |
Net Increase/(Decrease) in Net Assets Resulting from Operations | | | (789,156) | | | | 1,371,643 | |
Dividends and Distributions to Shareholders: | |
Dividends and Distributions | | | (132,732) | | | | N/A | |
Dividends from Net Investment Income(1) | | | N/A | | | | (45,437) | |
Net Decrease from Dividends and Distributions to Shareholders | | | (132,732) | | | | (45,437) | |
Capital Share Transactions | | | 66,844 | | | | 8,671,208 | |
Net Increase/(Decrease) in Net Assets | | | (855,044) | | | | 9,997,414 | |
Net Assets: | |
Beginning of year | | | 12,463,431 | | | | 2,466,017 | |
End of year(2) | | $ | 11,608,387 | | | $ | 12,463,431 | |
| (1) | The requirement to disclose dividends and distributions paid to shareholders from net investment income and/or net realized gain from investment transactions was eliminated by the U.S. Securities and Exchange Commission (“SEC”) in 2018. |
| (2) | Net assets - End of period includes undistributed (over distributed) net investment income of $31,033 as of October 31, 2017. The requirement to disclose undistributed (over distributed) net investment income was eliminated by the SEC in 2018. |
See Notes to Financial Statements.
| | |
| | Janus Detroit Street Trust ½ 11 |
The Organics ETF
Financial Highlights
| | | | | | | | | | | | | | |
| For a share outstanding during each year or period ended October 31 | | 2018 | | | 2017 | | | 2016(1) | |
| | Net Asset Value, Beginning of Period | | | $31.16 | | | | $24.66 | | | | $25.45 | |
| | Income/(Loss) from Investment Operations: | | | | | | | | | | | | |
| | Net investment income/(loss)(2) | | | 0.31 | | | | 0.29 | | | | 0.06 | |
| | Net realized and unrealized gain/(loss) | | | (2.12) | | | | 6.39 | | | | (0.82) | |
| | Total from Investment Operations | | | (1.81) | | | | 6.68 | | | | (0.76) | |
| | Less Dividends and Distributions: | | | | | | | | | | | | |
| | Dividends (from net investment income) | | | (0.33) | | | | (0.18) | | | | (0.03) | |
| | Total Dividends and Distributions | | | (0.33) | | | | (0.18) | | | | (0.03) | |
| | Net Asset Value, End of Period | | | $29.02 | | | | $31.16 | | | | $24.66 | |
| | Total Return* | | | (5.92)%(3) | | | | 27.19% | | | | (2.98)% | |
| | Net assets, End of Period (in thousands) | | | $11,608 | | | | $12,463 | | | | $2,466 | |
| | Average Net Assets for the Period (in thousands) | | | $12,992 | | | | $5,314 | | | | $2,507 | |
| | Ratios to Average Net Assets**: | | | | | | | | | | | | |
| | Ratio of Gross Expenses | | | 0.50% | | | | 0.50% | | | | 0.50% | |
| | Ratio of Net Investment Income/(Loss) | | | 0.95% | | | | 1.04% | | | | 0.63% | |
| | Portfolio Turnover Rate(4) | | | 52% | | | | 86% | | | | 20% | |
| * | Total return not annualized for periods of less than one full year. |
| ** | Annualized for periods of less than one full year. |
| (1) | Period from June 8, 2016 (commencement of operations) through October 31, 2016. |
| (2) | Per share amounts are calculated based on average shares outstanding during the year or period. |
| (3) | The return includes adjustments in accordance with generally accepted accounting principles required at period end date. |
| (4) | Portfolio turnover rate excludes securities received or delivered from in-kind processing of creation or redemptions. |
See Notes to Financial Statements.
The Organics ETF
Notes to Financial Statements
1. Organization and Significant Accounting Policies
The Organics ETF (the “Fund”) is a series fund. The Fund is part of Janus Detroit Street Trust (the “Trust”), which is organized as a Delaware statutory trust and is registered under the Investment Company Act of 1940, as amended (the “1940 Act”), as an open-end management investment company, and therefore has applied the specialized accounting and reporting guidance in Financial Accounting Standards Board (“FASB”) Accounting Standards Codification (“ASC”) Topic 946. The Trust offers seven Funds each of which represent shares of beneficial interest in a separate portfolio of securities and other assets with its own objective and policies. The Fund seeks investment results that correspond generally to the performance, before fees and expenses, of an index (“Underlying Index”) which is designed to track the performance of companies globally that are positioned to profit from increasing demand for organic products, including companies which service, produce, distribute, market or sell organic food, beverages, cosmetics, supplements, or packaging. The Fund is classified as nondiversified, as defined in the 1940 Act.
Unlike shares of traditional mutual funds, shares of the Fund are not individually redeemable and may only be purchased or redeemed directly from the Fund at net asset value (“NAV”) in large increments called “Creation Units” (25,000 or more shares per Creation Unit) through certain participants, known as “Authorized Participants.” The Fund will issue or redeem Creation Units in exchange for portfolio securities and/or cash. Except when aggregated in Creation Units, Fund shares are not redeemable securities of the Fund. Shares of the Fund are listed and trade on The NASDAQ Stock Market LLC (“NASDAQ”) and individual investors can purchase or sell shares in much smaller increments and for cash in the secondary market through a broker. These transactions, which do not involve the Fund, are made at market prices that may vary throughout the day and differ from the Fund’s NAV. As a result, you may pay more than NAV (a premium) when you purchase shares, and receive less than NAV (a discount) when you sell shares, in the secondary market.
An Authorized Participant may hold of record more than 25% of the outstanding shares of the Fund. From time to time, Authorized Participants may be a beneficial and/or legal owner of the Fund, may be affiliated with an index provider, may be deemed to have control of the Fund and/or may be able to affect the outcome of matters presented for a vote of the shareholders of the Fund. Authorized Participants may execute an irrevocable proxy granting the Distributor or an affiliate of Janus Capital Management LLC (“Janus Capital” or “Janus”) power to vote or abstain from voting such Authorized Participant’s beneficially or legally owned shares of the Fund. In such cases, the agent shall mirror vote (or abstain from voting) such shares in the same proportion as all other beneficial owners of the Fund.
The following accounting policies have been followed by the Fund and are in conformity with accounting principles generally accepted in the United States of America.
Investment Valuation
Securities held by the Fund are valued in accordance with policies and procedures established by and under the supervision of the Trustees (the “Valuation Procedures”). Equity securities, including shares of exchange-traded funds, traded on a domestic securities exchange are generally valued at the closing prices on the primary market or exchange on which they trade. If such price is lacking for the trading period immediately preceding the time of determination, such securities are valued at their current bid price. Equity securities that are traded on a foreign exchange are generally valued at the closing prices on such markets. In the event that there is no current trading volume on a particular security in such foreign exchange, the bid price from the primary exchange is generally used to value the security. Securities that are traded on the over-the-counter (“OTC”) markets are generally valued at their closing or latest bid prices as available. Foreign securities and currencies are converted to U.S. dollars using the applicable exchange rate in effect at the close of the New York Stock Exchange (“NYSE”). The Fund will determine the market value of individual securities held by it by using prices provided by one or more approved professional pricing services or, as needed, by obtaining market quotations from independent broker-dealers. Most debt securities are valued in accordance with the evaluated bid price supplied by the pricing service that is intended to reflect market value. The evaluated bid price supplied by the pricing service is an evaluation that may consider factors such as security prices, yields, maturities and ratings. Certain short-term securities maturing within 60 days or less may be evaluated and valued on an amortized cost basis provided that the amortized cost determined approximates market value. Securities for which market quotations or evaluated prices are not readily available or are deemed by Janus Capital to be unreliable are valued at fair value determined in good faith under the Valuation Procedures. Circumstances in which fair value pricing may be utilized include, but are not limited to: (i) a significant event that may affect the securities of a single issuer, such as a merger, bankruptcy, or significant issuer-specific development; (ii) an event that may affect an entire market, such as a natural disaster or significant governmental action; (iii) a nonsignificant event such as a market closing early or not opening, or a security trading halt; and (iv) pricing of a nonvalued security and a restricted or nonpublic security. Special valuation considerations may apply with respect to “odd-lot” fixed-income transactions which, due to their small size, may receive evaluated prices by pricing services which reflect a large block trade and not what actually could be obtained for the odd-lot position.
| | |
| | Janus Detroit Street Trust ½ 13 |
The Organics ETF
Notes to Financial Statements
Valuation Inputs Summary
FASB ASC 820, Fair Value Measurements and Disclosures (“ASC 820”), defines fair value, establishes a framework for measuring fair value, and expands disclosure requirements regarding fair value measurements. This standard emphasizes that fair value is a market-based measurement that should be determined based on the assumptions that market participants would use in pricing an asset or liability and establishes a hierarchy that prioritizes inputs to valuation techniques used to measure fair value. These inputs are summarized into three broad levels:
Level 1 – Unadjusted quoted prices in active markets the Fund has the ability to access for identical assets or liabilities.
Level 2 – Observable inputs other than unadjusted quoted prices included in Level 1 that are observable for the asset or liability either directly or indirectly. These inputs may include quoted prices for the identical instrument on an inactive market, prices for similar instruments, interest rates, prepayment speeds, credit risk, yield curves, default rates and similar data.
Assets or liabilities categorized as Level 2 in the hierarchy generally include: debt securities fair valued in accordance with the evaluated bid or ask prices supplied by a pricing service; securities traded on OTC markets and listed securities for which no sales are reported that are fair valued at the latest bid price (or yield equivalent thereof) obtained from one or more dealers transacting in a market for such securities or by a pricing service approved by the Fund’s Trustees; and certain short-term debt securities with maturities of 60 days or less that are fair valued at amortized cost. Other securities that may be categorized as Level 2 in the hierarchy include, but are not limited to, preferred stocks, bank loans, swaps, investments in unregistered investment companies, options, and forward contracts.
Level 3 – Unobservable inputs for the asset or liability to the extent that relevant observable inputs are not available, representing the Fund’s own assumptions about the assumptions that a market participant would use in valuing the asset or liability, and that would be based on the best information available.
There have been no significant changes in valuation techniques used in valuing any such positions held by the Fund since the beginning of the fiscal year.
The inputs or methodology used for fair valuing securities are not necessarily an indication of the risk associated with investing in those securities. The summary of inputs used as of October 31, 2018 to fair value the Fund’s investments in securities and other financial instruments is included in the “Valuation Inputs Summary” in the Notes to Schedule of Investments and Other Information.
There were no transfers between Level 1, Level 2 and Level 3 of the fair value hierarchy during the period. The Fund recognizes transfers between the levels as of the beginning of the fiscal year.
Investment Transactions and Investment Income
Investment transactions are accounted for as of the date purchased or sold (trade date). Dividend income is recorded on the ex-dividend date. Certain dividends from foreign securities will be recorded as soon as the Fund is informed of the dividend, if such information is obtained subsequent to the ex-dividend date. Dividends from foreign securities may be subject to withholding taxes in foreign jurisdictions. Gains and losses are determined on the identified cost basis, which is the same basis used for federal income tax purposes.
Estimates
The preparation of financial statements in conformity with accounting principles generally accepted in the United States of America requires management to make estimates and assumptions that affect the reported amount of assets and liabilities and disclosure of contingent assets and liabilities at the date of the financial statements and the reported amounts of income and expenses during the reporting period. Actual results could differ from those estimates.
Indemnifications
In the normal course of business, the Fund may enter into contracts that contain provisions for indemnification of other parties against certain potential liabilities. The Fund’s maximum exposure under these arrangements is unknown, and would involve future claims that may be made against the Fund that have not yet occurred. Currently, the risk of material loss from such claims is considered remote.
The Organics ETF
Notes to Financial Statements
Foreign Currency Translations
The Fund does not isolate that portion of the results of operations resulting from the effect of changes in foreign exchange rates on investments from the fluctuations arising from changes in market prices of securities held at the date of the financial statements. Net unrealized appreciation or depreciation of investments and foreign currency translations arise from changes in the value of assets and liabilities, including investments in securities held at the date of the financial statements, resulting from changes in the exchange rates and changes in market prices of securities held.
Currency gains and losses are also calculated on payables and receivables that are denominated in foreign currencies. The payables and receivables are generally related to foreign security transactions and income translations.
Foreign currency-denominated assets and forward currency contracts may involve more risks than domestic transactions, including currency risk, counterparty risk, political and economic risk, regulatory risk and equity risk. Risks may arise from unanticipated movements in the value of foreign currencies relative to the U.S. dollar.
Dividends and Distributions
The Fund generally declares and distributes dividends of net investment income quarterly. Net realized capital gains (if any) are distributed annually. The Fund may treat a portion of the amount paid to redeem shares as a distribution of investment company taxable income and realized capital gains that are reflected in the NAV. This practice, commonly referred to as “equalization,” has no effect on the redeeming shareholder or a Fund’s total return, but may reduce the amounts that would otherwise be required to be paid as taxable dividends to the remaining shareholders. It is possible that the Internal Revenue Service (IRS) could challenge the Fund’s equalization methodology or calculations, and any such challenge could result in additional tax, interest, or penalties to be paid by the Fund.
Federal Income Taxes
The Fund intends to continue to qualify as a regulated investment company and distribute all of its taxable income in accordance with the requirements of Subchapter M of the Internal Revenue Code. Management has analyzed the Fund’s tax positions taken for all open federal income tax years, generally a three-year period, and has concluded that no provision for federal income tax is required in the Fund’s financial statements. The Fund is not aware of any tax positions for which it is reasonably possible that the total amounts of unrecognized tax benefits will significantly change in the next twelve months.
On December 22, 2017, the Tax Cuts and Jobs Act was signed into law. Currently, Management does not believe the bill will have a material impact on the Fund’s intention to continue to qualify as a regulated investment company, which is generally not subject to U.S. federal income tax.
2. Other Investments and Strategies
Additional Investment Risk
The financial crisis in both the U.S. and global economies over the past several years has resulted, and may continue to result, in a significant decline in the value and liquidity of many securities of issuers worldwide in the equity and fixed income/credit markets. In response to the crisis, the United States and certain foreign governments, along with the U.S. Federal Reserve and certain foreign central banks, took steps to support the financial markets. The withdrawal of this support, a failure of measures put in place to respond to the crisis, or investor perception that such efforts were not sufficient could each negatively affect financial markets generally, and the value and liquidity of specific securities. In addition, policy and legislative changes in the United States and in other countries continue to impact many aspects of financial regulation. The effect of these changes on the markets, and the practical implications for market participants, including the Fund, may not be fully known for some time and could limit or preclude the Fund’s ability to achieve its investment objective. Therefore, it is important to understand that the value of your investment may fall, sometimes sharply, and you could lose money.
The enactment of the Dodd-Frank Wall Street Reform and Consumer Protection Act (the “Dodd-Frank Act”) provided for widespread regulation of financial institutions, consumer financial products and services, broker-dealers, OTC derivatives, investment advisers, credit rating agencies, and mortgage lending, which expanded federal oversight in the financial sector, including the investment management industry. Certain provisions of the Dodd-Frank Act remain pending and will be implemented through future rulemaking. Therefore, the ultimate impact of the Dodd-Frank Act and the regulations under the Dodd-Frank Act on the Fund and the investment management industry as a whole, is not yet certain.
A number of countries in the European Union (“EU”) have experienced, and may continue to experience, severe economic and financial difficulties. In particular, many EU nations are susceptible to economic risks associated with high levels of debt, notably due to investments in sovereign debt of countries such as Greece, Italy, Spain, Portugal, and Ireland. Many
| | |
| | Janus Detroit Street Trust ½ 15 |
The Organics ETF
Notes to Financial Statements
non-governmental issuers, and even certain governments, have defaulted on, or been forced to restructure, their debts. Many other issuers have faced difficulties obtaining credit or refinancing existing obligations. Financial institutions have in many cases required government or central bank support, have needed to raise capital, and/or have been impaired in their ability to extend credit. As a result, financial markets in the EU experienced extreme volatility and declines in asset values and liquidity. Responses to these financial problems by European governments, central banks, and others, including austerity measures and reforms, may not work, may result in social unrest, and may limit future growth and economic recovery or have other unintended consequences. Further defaults or restructurings by governments and others of their debt could have additional adverse effects on economies, financial markets, and asset valuations around the world. Greece, Ireland, and Portugal have already received one or more “bailouts” from other Eurozone member states, and it is unclear how much additional funding they will require or if additional Eurozone member states will require bailouts in the future. The risk of investing in securities in the European markets may also be heightened due to the referendum in which the United Kingdom voted to exit the EU (known as “Brexit”). One or more other countries may also abandon the euro and/or withdraw from the EU, placing its currency and banking system in jeopardy.
Certain areas of the world have historically been prone to and economically sensitive to environmental events such as, but not limited to, hurricanes, earthquakes, typhoons, flooding, tidal waves, tsunamis, erupting volcanoes, wildfires or droughts, tornadoes, mudslides, or other weather-related phenomena. Such disasters, and the resulting physical or economic damage, could have a severe and negative impact on the Fund’s investment portfolio and, in the longer term, could impair the ability of issuers in which the Fund invests to conduct their businesses as they would under normal conditions. Adverse weather conditions may also have a particularly significant negative effect on issuers in the agricultural sector and on insurance companies that insure against the impact of natural disasters.
Counterparties
Fund transactions involving a counterparty are subject to the risk that the counterparty or a third party will not fulfill its obligation to the Fund (“counterparty risk”). Counterparty risk may arise because of the counterparty’s financial condition (i.e., financial difficulties, bankruptcy, or insolvency), market activities and developments, or other reasons, whether foreseen or not. A counterparty’s inability to fulfill its obligation may result in significant financial loss to the Fund. The Fund may be unable to recover its investment from the counterparty or may obtain a limited recovery, and/or recovery may be delayed. The extent of the Fund’s exposure to counterparty risk with respect to financial assets and liabilities approximates its carrying value. See the “Offsetting Assets and Liabilities” section of this Note for further details.
The Fund may be exposed to counterparty risk through participation in various programs, including, but not limited to, lending its securities to third parties, cash sweep arrangements whereby the Fund’s cash balance is invested in one or more types of cash management vehicles, as well as investments in, but not limited to, repurchase agreements, and derivatives, including various types of swaps, futures and options. The Fund intends to enter into financial transactions with counterparties that Janus Capital believes to be creditworthy at the time of the transaction. There is always the risk that Janus Capital’s analysis of a counterparty’s creditworthiness is incorrect or may change due to market conditions. To the extent that the Fund focuses its transactions with a limited number of counterparties, it will have greater exposure to the risks associated with one or more counterparties.
Offsetting Assets and Liabilities
The Fund presents gross and net information about transactions that are either offset in the financial statements or subject to an enforceable master netting arrangement or similar agreement with a designated counterparty, regardless of whether the transactions are actually offset in the Statement of Assets and Liabilities.
Deutsche Bank AG acts as securities lending agent and a limited purpose custodian or subcustodian to receive and disburse cash balances and cash collateral, hold short-term investments, hold collateral, and perform other custodian functions in accordance with the Agency Securities Lending and Repurchase Agreement. For financial reporting purposes, the Fund does not offset financial instruments’ payables and receivables and related collateral on the Statement of Assets and Liabilities. Securities on loan will be continuously secured by collateral which may consist of cash, U.S. Government securities, domestic and foreign short-term debt instruments, letters of credit, time deposits, repurchase agreements, money market mutual funds or other money market accounts, or such other collateral as permitted by the SEC. The value of the collateral must be at least 102% of the market value of the loaned securities that are denominated in U.S. dollars and 105% of the market value of the loaned securities that are not denominated in U.S. dollars. Upon receipt of cash collateral, Janus Capital intends to invest the cash collateral in a cash management vehicle for which Janus Capital serves as investment adviser, Janus Henderson Cash Collateral Fund LLC. Loaned securities and related collateral are marked-to-market each business day based upon the market value of the loaned securities at the close of business, employing the most recent available pricing information. Collateral levels are then adjusted based on this mark-to-market evaluation.
The Organics ETF
Notes to Financial Statements
The following table presents gross amounts of recognized assets and/or liabilities and the net amounts after deducting collateral that has been pledged by counterparties or has been pledged to counterparties (if applicable). For corresponding information grouped by type of instrument, see the Fund’s Schedule of Investments.
Offsetting of Financial Assets and Derivative Assets
| | | | | | | | | | | | | | | | | | |
| Counterparty | | | Gross Amounts
of Recognized
Assets | | | Offsetting Asset
or Liability(a) | | | Collateral
Pledged(b) | | | Net Amount | |
| | Deutsche Bank AG | | | $ | 703,689 | | | $ | — | | | $ | (703,689) | | | $ | — | |
| (a) | Represents the amount of assets or liabilities that could be offset with the same counterparty under master netting or similar agreements that management elects not to offset on the Statement of Assets and Liabilities. |
| (b) | Collateral pledged is limited to the net outstanding amount due to/from an individual counterparty. The actual collateral amounts pledged may exceed these amounts and may fluctuate in value. |
Securities Lending
Under procedures adopted by the Trustees, the Fund may seek to earn additional income by lending securities to qualified parties. Deutsche Bank AG acts as securities lending agent and a limited purpose custodian or subcustodian to receive and disburse cash balances and cash collateral, hold short-term investments, hold collateral, and perform other custodian functions. The Fund may lend portfolio securities in an amount equal to up to 1/3 of its total assets as determined at the time of the loan origination. There is the risk of delay in recovering a loaned security or the risk of loss in collateral rights if the borrower fails financially. In addition, Janus Capital makes efforts to balance the benefits and risks from granting such loans. All loans will be continuously secured by collateral which may consist of cash, U.S. Government securities, domestic and foreign short-term debt instruments, letters of credit, time deposits, repurchase agreements, money market mutual funds or other money market accounts, or such other collateral as permitted by the SEC. If the Fund is unable to recover a security on loan, the Fund may use the collateral to purchase replacement securities in the market. There is a risk that the value of the collateral could decrease below the cost of the replacement security by the time the replacement investment is made, resulting in a loss to the Fund.
The value of the collateral must be at least 102% of the market value of the loaned securities that are denominated in U.S. dollars and 105% of the market value of the loaned securities that are not denominated in U.S. dollars. Loaned securities and related collateral are marked-to-market each business day based upon the market value of the loaned securities at the close of business, employing the most recent available pricing information. Collateral levels are then adjusted based on this mark-to-market evaluation.
Upon receipt of cash collateral, Janus Capital may invest it in affiliated or non-affiliated cash management vehicles, whether registered or unregistered entities, as permitted by the 1940 Act and rules promulgated thereunder. Janus Capital currently intends to invest the cash collateral in a cash management vehicle for which Janus Capital serves as investment adviser, Janus Henderson Cash Collateral Fund LLC. An investment in Janus Henderson Cash Collateral Fund LLC is generally subject to the same risks that shareholders experience when investing in similarly structured vehicles, such as the potential for significant fluctuations in assets as a result of the purchase and redemption activity of the securities lending program, a decline in the value of the collateral, and possible liquidity issues. Such risks may delay the return of the cash collateral and cause the Fund to violate its agreement to return the cash collateral to a borrower in a timely manner. As adviser to the Fund and Janus Henderson Cash Collateral Fund LLC, Janus Capital has an inherent conflict of interest as a result of its fiduciary duties to both the Fund and Janus Henderson Cash Collateral Fund LLC. Additionally, Janus Capital receives an investment advisory fee of 0.05% for managing Janus Henderson Cash Collateral Fund LLC, but it may not receive a fee for managing certain other affiliated cash management vehicles in which the Fund may invest, and therefore may have an incentive to allocate preferred investment opportunities to investment vehicles for which it is receiving a fee.
The cash collateral invested by Janus Capital is disclosed in the Schedule of Investments (if applicable). Income earned from the investment of the cash collateral, net of rebates paid to, or fees paid by, borrowers and less the fees paid to the lending agent are included as “Affiliated securities lending income, net” on the Statement of Operations. As of October 31, 2018, securities lending transactions accounted for as secured borrowings with an overnight and continuous contractual maturity are $703,689 for equity securities. Gross amounts of recognized liabilities for securities lending (collateral received) as of October 31, 2018 is $760,430, resulting in the net amount due to the counterparty of $56,741.
| | |
| | Janus Detroit Street Trust ½ 17 |
The Organics ETF
Notes to Financial Statements
3. Investment Advisory Agreements and Other Transactions with Affiliates
Under its unitary fee structure, the Fund pays Janus Capital a management fee in return for providing certain investment advisory, supervisory, and administrative services to the Fund, including the costs of transfer agency, custody, fund administration, legal, audit, and other services. Janus Capital’s fee structure is designed to pay substantially all of the Fund’s expenses. However, the Fund bears other expenses which are not covered under the management fee which may vary and affect the total level of expenses paid by shareholders, such as distribution fees (if any), brokerage expenses or commissions, interest, dividends, taxes, litigation expenses, acquired fund fees and expenses (if any), and extraordinary expenses. The Fund’s management fee is calculated daily and paid monthly. For the fiscal year ended October 31, 2018, the Fund’s contractual management fee rate (expressed as an annual rate) was 0.50% of the Fund’s average daily net assets.
State Street Bank and Trust Company (“State Street”) provides certain fund administration services to the Fund, including services related to the Fund’s accounting, including calculating the daily NAV, audit, tax, and reporting obligations, pursuant to an agreement with Janus Capital, on behalf of the Fund. As compensation for such services, Janus Capital pays State Street a fee based on a percentage of the Fund’s assets, with a minimum flat fee, for certain services. Janus Capital serves as administrator to the Fund, providing oversight and coordination of the Fund’s service providers, recordkeeping and other administrative services. Janus Capital does not receive any additional compensation, beyond the unitary fee, for serving as administrator. State Street also serves as transfer agent for the shares of the Fund. Pursuant to agreements with Janus Capital on behalf of the Fund, State Street Global Markets, an affiliate of State Street, may execute portfolio transactions for the Fund, including but not limited to, transactions in connection with cash in lieu transactions for non-US securities.
Due to an administrative oversight by its administrator, the Fund’s Distribution and Servicing Plan, pursuant to Rule 12b-1 under the 1940 Act that was originally approved at the time of the Fund’s formation (“Initial Rule 12b-1 Plan”), could be viewed to have expired on or about February 11, 2017. The Initial Rule 12b-1 Plan was never implemented, and 12b-1 fees were not charged, prior to its potential expiration. At an in-person meeting held on July 18, 2018, the Fund’s Board of Trustees (“Board”) approved a new Rule 12b-1 Plan (the “Plan”) with respect to the Fund, with terms that are substantively identical to the Initial Rule 12b-1 Plan. Because the Fund has commenced operations, the Plan must also be approved by the Fund’s shareholders prior to implementation. At this time, Janus Capital does not intend to seek shareholder approval for implementation of the Plan. The Plan would permit compensation in connection with the distribution and marketing of Fund shares and/or the provision of certain shareholder services. The Plan would permit the Fund to pay ALPS Distributors, Inc. (the “Distributor”) or its designee, a fee for the sale and distribution and/or shareholder servicing of the shares at an annual rate of up to 0.25% of average daily net assets of the Fund. Under the terms of the Plan, the Trust would be authorized to make payments to the Distributor or its designee for remittance to retirement plan service providers, broker-dealers, bank trust departments, financial advisors, and other financial intermediaries, as compensation for distribution and/or shareholder services performed by such entities for their customers who are investors in the Fund. However, implementation of the Plan and imposition of the 12b-1 fee would require prior approval by Fund shareholders via proxy vote. Janus Capital does not anticipate seeking such approval at this time. Because 12b-1 fees are paid out of the fund assets on an ongoing basis, to the extent that such a fee is authorized by shareholders in the future, over time they will increase the cost of an investment in the Fund. If implemented, the Plan fee may cost an investor more than other types of sales charges.
As of October 31, 2018, Janus Capital owned 1 share or less than 0.0% of the Fund.
Any purchases and sales, realized gains/losses and recorded dividends from affiliated investments during the year ended October 31, 2018 can be found in a table located in the Schedule of Investments.
4. Federal Income Tax
The tax components of capital shown in the table below represent: (1) distribution requirements the Fund must satisfy under the income tax regulations; (2) losses or deductions the Fund may be able to offset against income and gains realized in future years; and (3) unrealized appreciation or depreciation of investments for federal income tax purposes.
Other book to tax differences primarily consist of derivatives, and foreign currency contract adjustments. The Fund has elected to treat gains and losses on forward foreign currency contracts as capital gains and losses, if applicable. Other foreign currency gains and losses on debt instruments are treated as ordinary income for federal income tax purposes pursuant to Section 988 of the Internal Revenue Code.
The Organics ETF
Notes to Financial Statements
| | | | | | | | | | | | | | | | | | | | | | | | | | |
| | | | | | | | | | Loss Deferrals | | | | | | | |
Undistributed
Ordinary Income | | | Undistributed
Long-Term Gains | | | Accumulated
Capital Losses | | | Late-Year
Ordinary Loss | | | Post-October
Capital Loss | | | Other Book
to Tax Differences | | | Net Tax
Appreciation/
(Depreciation) | |
| $ | 17,650 | | | $ | — | | | $ | (609,308) | | | $ | — | | | $ | — | | | $ | (393) | | | $ | (1,260,926) | |
Accumulated capital losses noted below represent net capital loss carryovers, as of October 31, 2018, that may be available to offset future realized capital gains and thereby reduce future taxable gains distributions. The following table shows these capital loss carryovers.
| | | | | | | | | | |
Capital Loss Carryover Schedule
For the year ended October 31, 2018
No Expiration | | | Accumulated
Capital Losses | |
| Short-Term | | | Long-Term | |
| $ | (489,425) | | | $ | (119,883) | | | $ | (609,308) | |
The aggregate cost of investments and the composition of unrealized appreciation and depreciation of investment securities for federal income tax purposes as of October 31, 2018 are noted below. The primary differences between book and tax appreciation or depreciation of investments are wash sale loss deferrals and investments in partnerships.
| | | | | | | | | | | | | | |
| Federal Tax Cost | | | Unrealized Appreciation | | | Unrealized (Depreciation) | | | Net Tax Appreciation/
(Depreciation) | |
| $ | 13,716,971 | | | $ | 819,334 | | | $ | (2,080,260) | | | $ | (1,260,926) | |
Income and capital gains distributions are determined in accordance with income tax regulations that may differ from accounting principles generally accepted in the United States of America. These differences are due to differing treatments for items such as net short-term gains, deferral of wash sale losses, foreign currency transactions, passive foreign investment companies, net investment losses, in-kind transactions and capital loss carryovers. Certain permanent differences such as tax returns of capital and net investment losses noted below have been reclassified to capital.
| | | | | | | | | | | | | | |
| For the year ended October 31, 2018: | |
| Distributions | | | | |
| From Ordinary Income | | | From Long-Term Capital Gain | | | Tax Return of Capital | | | Net Investment Loss | |
| $ | 132,732 | | | $ | — | | | $ | — | | | $ | — | |
|
| For the year ended October 31, 2017: | |
| Distributions | | | | |
| From Ordinary Income | | | From Long-Term Capital Gain | | | Tax Return of Capital | | | Net Investment Loss | |
| $ | 45,437 | | | $ | — | | | $ | — | | | $ | — | |
Permanent book to tax basis differences may result in reclassifications between the components of net assets. These differences have no impact on the results of operations or net assets. The following reclassifications have been made to the Fund:
| | | | | | | | | | |
| Increase/(Decrease) to Capital | | | Increase/(Decrease) to Undistributed
Net Investment Income/Loss | | | Increase/(Decrease) to Undistributed
Net realized Gain/Loss | |
| $ | 1,623,330 | | | $ | (3,749) | | | $ | (1,619,581) | |
5. Capital Share Transactions
| | | | | | | | | | | | | | | | |
| | | Year ended October 31, 2018 | | | Year ended October 31, 2017 | |
| | | Shares | | | Amount | | | Shares | | | Amount | |
| Shares sold | | | 200,000 | | | $ | 6,725,311 | | | | 400,000 | | | $ | 11,664,634 | |
| Shares repurchased | | | (200,000) | | | | (6,658,467) | | | | (100,000) | | | | (2,993,426) | |
Net Increase/(Decrease) | | | — | | | $ | 66,844 | | | | 300,000 | | | $ | 8,671,208 | |
| | |
| | Janus Detroit Street Trust ½ 19 |
The Organics ETF
Notes to Financial Statements
6. Purchases and Sales of Investment Securities
For the year ended October 31, 2018, the aggregate cost of purchases and proceeds from sales of investment securities (excluding any short-term securities, short-term options contracts, and in-kind transactions) was as follows:
| | | | | | | | | | | | | | |
Purchases of Securities | | | Proceeds from Sales of Securities | | | Purchases of Long- Term U.S. Government Obligations | | | Proceeds from Sales of Long-Term U.S. Government Obligations | |
| $ | 6,725,576 | | | $ | 7,430,028 | | | $ | — | | | $ | — | |
For the year ended October 31, 2018, the cost of in-kind purchases and proceeds from in-kind sales, were as follows:
| | | | | | | | | | | | | | |
Purchases of Securities | | | Proceeds from Sales of Securities | | | Purchases of Long- Term U.S. Government Obligations | | | Proceeds from Sales of Long-Term U.S. Government Obligations | |
| $ | 6,563,672 | | | $ | 6,683,312 | | | $ | — | | | $ | — | |
During the year ended October 31, 2018, the Fund had net realized gain/(loss) of $1,659,656 from in-kind redemptions. Gains on in-kind transactions are not considered taxable for federal income tax purposes.
7. Recent Accounting Pronouncements
The Securities and Exchange Commission adopted amendments to Regulation S-X, for the presentation of distributable earnings and distributions to align with US Generally Accepted Accounting Principles (GAAP). The compliance date of the amendments to Regulation S-X is November 5, 2018. This report incorporates the amendments to Regulation S-X.
The FASB issued Accounting Standards Update 2018-13, Fair Value Measurement (Topic 820) in August 2018. The new guidance removes, modifies and enhances the disclosures to Topic 820. For public entities, the amendments are effective for financial statements issued for fiscal years beginning after December 15, 2019, and interim periods within those fiscal years. Management is currently evaluating the impact of this new guidance on the financial statements.
The FASB issued Accounting Standards Update No. 2017-08, Receivables – Nonrefundable Fees and Other Costs (Subtopic 310-20), Premium Amortization on Purchased Callable Debt Securities (“ASU 2017-08”) to amend the amortization period for certain purchased callable debt securities held at a premium. The guidance requires certain premiums on callable debt securities to be amortized to the earliest call date. The amortization period for callable debt securities purchased at a discount will not be impacted. The amendments are effective for fiscal years, and interim periods within those fiscal years, beginning after December 15, 2018. Early adoption is permitted, including adoption in an interim period. Management is currently evaluating the impacts of ASU 2017-08 on the Fund’s financial statements.
8. Subsequent Events
Management has evaluated whether any events or transactions occurred subsequent to October 31, 2018 and through the date of issuance of the Fund’s financial statements and determined that there were no material events or transactions that would require recognition or disclosure in the Fund’s financial statements other than the following:
The Fund’s Board of Trustees (“Board”) approved an amendment (“Amendment”) to the Investment Advisory and Management Agreement that provides for a new management fee rate schedule that reduces the annual management fee rate payable by the Fund to Janus Capital and also provides for further management fee rate reductions as assets grow. The new annual management fee rate schedule is effective November 1, 2018. A chart comparing the Fund’s historical management fee to the new management fee schedule (each expressed as an annual rate) is provided below.
| | | | |
| Historical | | | | New |
| Average Daily Net Assets | | | | Daily Net Assets |
| 0.50% | | | | $0-$500 million 0.35%
Next $500 million 0.28% Over $1 billion 0.20% |
The Organics ETF
Additional Information (unaudited)
Proxy Voting Policies and Voting Record
A description of the policies and procedures that the Fund uses to determine how to vote proxies relating to its portfolio securities is available without charge: (i) upon request, by calling 1-800-525-0020 (toll free); (ii) on the Fund’s website at janushenderson.com/proxyvoting; and (iii) on the SEC’s website at http://www.sec.gov.
Quarterly Portfolio Holdings
The Fund files its complete portfolio holdings (schedule of investments) with the SEC for the first and third quarters of each fiscal year on Form N-Q within 60 days of the end of such fiscal quarter. The Fund’s Form N-Q: (i) is available on the SEC’s website at http://www.sec.gov; (ii) may be reviewed and copied at the SEC’s Public Reference Room in Washington, D.C. (information on the Public Reference Room may be obtained by calling 1-800-SEC-0330); and (iii) is available without charge, upon request, by calling Janus Henderson at 1-800-525-0020 (toll free).
Designation Requirements (unaudited)
For federal income tax purposes, the Fund designated the following for the year ended October 31, 2018
| | | | |
| Foreign Tax Credits | | $ | 15,620 | |
| Foreign Source Income | | $ | 140,677 | |
| Dividends Received Deduction Percentage | | | 23% | |
| Qualified Dividend Income Percentage | | | 97% | |
Licensing Agreements
Solactive AG (“Solactive”) is the Index Provider for the Underlying Index. Janus Capital has entered into a license agreement with Solactive to use the Underlying Index.
Neither Solactive nor any of its affiliates make any representation or warranty, express or implied, to the owners of a Fund or any member of the public regarding the advisability of investing in securities generally or in a Fund particularly or the ability of the Underlying Index to track general market performance. The Underlying Index is determined, composed, and calculated by Solactive without regard to Janus Capital or the Fund. Solactive has no obligation to take the needs of Janus Capital or the owners of the Fund into consideration in determining, composing, or calculating the Underlying Index. Solactive is not responsible for and has not participated in the determination of the timing of, prices at, or quantities of the Fund to be issued or in the determination or calculation of the equation by which the Fund is to be converted into cash.
ALTHOUGH SOLACTIVE SHALL OBTAIN INFORMATION FOR INCLUSION IN OR FOR USE IN THE CALCULATION OF THE UNDERLYING INDEX FROM SOURCES WHICH IT CONSIDERS RELIABLE, IT DOES NOT GUARANTEE THE QUALITY, ACCURACY AND/OR THE COMPLETENESS OF THE UNDERLYING INDEX OR ANY DATA INCLUDED THEREIN AND SHALL HAVE NO LIABILITY FOR ERRORS OR OMISSIONS OF ANY KIND RELATED TO THE UNDERLYING INDEX OR DATA. SOLACTIVE MAKES NO WARRANTY, EXPRESS OR IMPLIED, AS TO RESULTS TO BE OBTAINED BY JANUS CAPITAL, OWNERS OF THE FUND, OR ANY OTHER PERSON OR ENTITY FROM THE USE OF THE UNDERLYING INDEX OR ANY DATA INCLUDED THEREIN IN CONNECTION WITH THE RIGHTS LICENSED TO JANUS CAPITAL FOR ANY OTHER USE. SOLACTIVE MAKES NO EXPRESS OR IMPLIED WARRANTIES, AND HEREBY EXPRESSLY DISCLAIMS ALL WARRANTIES OF MERCHANTABILITY OR FITNESS FOR A PARTICULAR PURPOSE OR USE WITH RESPECT TO THE UNDERLYING INDEX OR ANY DATA INCLUDED THEREIN. WITHOUT LIMITING ANY OF THE FOREGOING, IN NO EVENT SHALL IT HAVE ANY LIABILITY FOR ANY SPECIAL, PUNITIVE, INDIRECT, OR CONSEQUENTIAL DAMAGES (INCLUDING LOST PROFITS), EVEN IF NOTIFIED
OF THE POSSIBILITY OF SUCH DAMAGES.
Janus Capital does not guarantee the accuracy and/or the completeness of the Underlying Index or any data included therein, and Janus Capital shall have no liability for any errors, omissions or interruptions therein. Janus Capital makes no warranty, express or implied, as to results to be obtained by the Fund, owners of the shares of the Fund or any other person or entity from the use of the Underlying Index or any data included therein. Janus Capital makes no express or implied warranties, and expressly disclaims all warranties of merchantability or fitness for a particular purpose or use with respect to the Underlying Index or any data included therein. Without limiting any of the foregoing, in no event shall Janus Capital have any liability for any special, punitive, direct, indirect or consequential damages (including lost profits) arising out of matters relating to the use of the Underlying Index even if notified of the possibility of such damages.
| | |
| | Janus Detroit Street Trust ½ 21 |
The Organics ETF
Board Considerations Regarding Approval of Investment Advisory Agreements (unaudited)
APPROVAL OF AMENDMENT TO INVESTMENT ADVISORY AGREEMENT
At an in-person meeting held on October 9-10, 2018, the Trustees approved an amendment (“Amendment”) to the Investment Advisory and Management Agreement between the Trust and Janus Capital on behalf of Janus Henderson Small Cap Growth Alpha ETF, Janus Henderson Small/Mid Cap Growth Alpha ETF, The Long-Term Care ETF, The Obesity ETF, and The Organics ETF (each a “Fund” and, together, the “Funds”). The Amendment provided for a new management fee rate schedule that reduces the annual management fee rate payable by the Funds to Janus Capital and also provided for further management fee rate reductions as assets grow. A comparison of the prior and new unitary fee rate schedules (each expressed as an annual rate) is shown below.
| | | | |
| Current | | | | New |
| Average Daily Net Assets | | | | Daily Net Assets |
| 0.50% | | | | $0-$500 million 0.35%
Next $500 million 0.28% Over $1 billion 0.20% |
In connection with the Amendment approval, Janus Capital represented to the Trustees that there would be no change to the nature, quality and extent of services rendered by Janus Capital to the Fund. The Amendment is effective as of November 1, 2018.
The Organics ETF
Trustees and Officers (unaudited)
The Fund’s Statement of Additional Information includes additional information about the Trustees and officers and is available, without charge, by calling 1-877-335-2687.
The following are the Trustees and officers of the Trust, together with a brief description of their principal occupations during the last five years (principal occupations for certain Trustees may include periods over five years).
Each Trustee has served in that capacity since he or she was originally elected or appointed. The Trustees do not serve a specified term of office. Each Trustee will hold office until the termination of the Trust or his or her earlier death, resignation, retirement, incapacity, or removal. Under the Fund’s Governance Procedures and Guidelines, the policy is for Trustees to retire no later than the end of the calendar year in which the Trustee turns 75. The Trustees review the Fund’s Governance Procedures and Guidelines from time to time and may make changes they deem appropriate. The Fund’s Nominating and Governance Committee will consider nominees for the position of Trustee recommended by shareholders. Shareholders may submit the name of a candidate for consideration by the Committee by submitting their recommendations to the Trust’s Secretary. Each Trustee is currently a Trustee of one other registered investment company advised by Janus Capital: Clayton Series Trust. Collectively, these two registered investment companies consist of 10 series or funds.
The Trust’s officers are elected annually by the Trustees for a one-year term. Certain officers also serve as officers of Clayton Series Trust. Certain officers of the Fund may also be officers and/or directors of Janus Capital. Fund officers receive no compensation from the Fund, except for the Fund’s Chief Compliance Officer, as authorized by the Trustees.
| | | | | | | | | | | | | | | | | | |
| TRUSTEES | | | | | | | | | | | | | | |
| Name, Address, and Age | | Positions Held
with the Trust | | | Length of Time Served | | | Principal Occupations During the Past Five Years | | Number of Portfolios/Funds in Fund Complex Overseen by Trustee* | | | Other Directorships Held by Trustee During the Past Five Years | |
Independent Trustees | | | | | | | | | | | | | | | | | | |
Clifford J. Weber 151 Detroit Street Denver, CO 80206 DOB: 1963 | |
| Chairman
Trustee |
| |
| 2/16-Present
2/16-Present |
| | Owner, Financial Products Consulting Group LLC (consulting services to financial institutions) (since 2015). Formerly, Executive Vice President of Global Index and Exchange- Traded Products, NYSE Market, Inc., a subsidiary of Intercontinental Exchange (ETF/ETP listing exchange) (2013-2015) and Executive Vice President and Head of Strategy and Product Development, NYSE Liffe U.S., a division of NYSE Euronext (U.S. futures exchange) (2008-2013). | | | 10 | | |
| Independent Trustee,
Clough Funds Trust
(investment company)
(since 2015).
Chairman, Clough
Funds Trust (since
2017), Independent
Trustee, Clough
Dividend and Income
Fund (closed-end
fund) (since 2017),
Independent Trustee,
Clough Global
Opportunities Fund
(closed-end fund)
(since 2017),
Independent Trustee,
Clough Global Equity
Fund (closed-end
fund) (since 2017),
Independent Trustee,
Elevation ETF Trust
(investment company)
(2016-2018)
Chairman, Elevation
ETF Trust (2016-
2018), and
Independent Trustee
Global X Funds,
(investment company)
(since 2018). |
|
| | |
| | Janus Detroit Street Trust ½ 23 |
The Organics ETF
Trustees and Officers (unaudited)
| | | | | | | | | | |
| TRUSTEES | | | | | | | | | | |
| Name, Address, and Age | | Positions Held
with the Trust | | Length of Time Served | | Principal Occupations During the Past Five Years | | Number of Portfolios/Funds in Fund Complex Overseen by Trustee* | | Other Directorships Held by Trustee During the Past Five Years |
Maureen T. Upton 151 Detroit Street Denver, CO 80206 DOB: 1965 | | Trustee | | 2/16-Present | | Principal, Maureen Upton Ltd. (consulting services to developers of major infrastructure projects and investors) (since 2017). Formerly, Principal Consultant, SRK Consulting (U.S.), Inc. (consulting services to global mining, energy and water resource industries) (2015-2017) and Founder and Principal, Resource Initiatives LLC (sustainability consulting firm) (2006-2015). | | 10 | | Director, Denver
Metro Leadership
Foundation (non-profit
organization)
(2012-2014). |
| | | | | |
Jeffrey B. Weeden 151 Detroit Street Denver, CO 80206 DOB: 1956 | | Trustee | | 2/16-Present | | Senior Advisor, BayBoston Capital LP (investment fund in finance companies, banks and bank holdings companies) (since 2015). Formerly, Management Advisor, BoxCast, Inc. (technology start-up company) (2014-2017) and Senior Executive Vice President and Chief Financial Officer, KeyCorp (financial services) (2002-2013). | | 10 | | Director, State
Farm Bank
(banking) (since 2014). |
Interested Trustee |
Michael Drew Elder** 151 Detroit Street Denver, CO 80206 DOB: 1970 | | Trustee | | 8/15-Present | | Executive Vice President and Head of U.S. Intermediary Distribution, Janus Capital (since 2014) and President, Janus Distributors LLC (broker- dealer) (since 2014). Formerly, Senior Vice President, Janus Capital (2007-2014). | | 10 | | Director, Perkins
Investment
Management
LLC (since 2014). |
| * | In addition to the Trust, which is comprised of seven series, each Trustee also serves as a trustee to the Clayton Street Trust, which is an affiliated registered investment company currently comprised of three portfolios. |
| ** | Michael Drew Elder is an Interested Trustee because of his employment with Janus Capital. |
The Organics ETF
Trustees and Officers (unaudited)
| | | | | | |
| OFFICERS | | | | | | |
| Name, Address, and Age | | Positions Held with the Trust | | Term of Office* and Length of Time Served | | Principal Occupations During the Past Five Years |
Bruce L. Koepfgen 151 Detroit Street Denver, CO 80206 DOB: 1952 | | President and Chief Executive Officer | | 2/16-Present | | Head of North America for Janus Henderson Investors and Janus Capital Management LLC (since 2017); Executive Vice President and Director of Janus International Holding LLC (since 2011); Executive Vice President of Janus Distributors LLC (since 2011); Executive Vice President and Working Director of INTECH Investment Management LLC (since 2011); Executive Vice President and Director of Perkins Investment Management LLC (since 2011); and Executive Vice President and Director of Janus Management Holdings Corporation (since 2011). Formerly, President of Janus Capital Group Inc. and Janus Capital Management LLC (2013-2017); Executive Vice President of Janus Services LLC (2011-2015), Janus Capital Group Inc. and Janus Capital Management LLC (2011-2013); and Chief Financial Officer of Janus Capital Group Inc., Janus Capital Management LLC, Janus Distributors LLC, Janus Management Holdings Corporation, and Janus Services LLC (2011-2013). |
| | | |
Susan K. Wold 151 Detroit Street Denver, CO 80206 DOB: 1960 | | Vice President, Chief Compliance Officer, and Anti- Money Laundering Officer | | 9/17-Present | | Senior Vice President and Head of Compliance North America for Janus Henderson (since September 2017); Formerly Vice President, Head of Global Corporate Compliance, and Chief Compliance Officer for Janus Capital Management LLC (May 2017-September 2017); Vice President, Compliance at Janus Capital Group and Janus Capital Management LLC (2005-2017). |
| | | |
Jesper Nergaard 151 Detroit Street Denver, CO 80206 DOB: 1962 | | Vice President, Chief Financial Officer, Treasurer, and Principal Accounting Officer | | 2/16-Present | | Vice President of Janus Capital and Janus Services LLC. |
| | | |
Byron Hittle 151 Detroit Street Denver, CO 80206 DOB: 1974 | | Vice President, Secretary and Chief Legal Officer | | 7/18-Present | �� | Vice President and Assistant General Counsel of Janus Capital and Janus Services LLC (2017- present); Assistant Vice President and Senior Legal Counsel (2012-2016). |
| * | Officers are elected at least annually by the Trustees for a one-year term and may also be elected from time to time by the Trustees for an interim period. |
| | |
| | Janus Detroit Street Trust ½ 25 |
Knowledge. Shared
At Janus Henderson, we believe in the sharing of expert insight for better investment and business decisions. We call this ethos Knowledge. Shared.
Learn more by visiting janushenderson.com.
This report is submitted for the general information of shareholders of the Fund. It is not an offer or solicitation for the Fund and is not authorized for distribution to prospective investors unless preceded or accompanied by an effective prospectus.
Janus Henderson and Knowledge. Shared are trademarks of Janus Henderson Group plc or one of its subsidiary entities. © Janus Henderson Group plc.
Janus Capital Management LLC is the investment adviser and ALPS Distributors, Inc. is the distributor. ALPS is not affiliated with Janus Henderson or any of its subsidiaries.
ANNUAL REPORT
October 31, 2018
Janus Henderson Short Duration Income ETF
Janus Detroit Street Trust

Table of Contents
Janus Henderson Short Duration Income ETF (unaudited)
INVESTMENT OBJECTIVE
Janus Henderson Short Duration Income ETF (VNLA) seeks to provide a steady income stream with capital preservation across various market cycles. During the period, the Fund sought to consistently outperform the LIBOR 3-month rate by a moderate amount through various market cycles while at the same time providing low volatility.
PERFORMANCE OVERVIEW
| • | | Global bond markets lost ground during the period with higher interest rates in the U.S. being a contributing factor. Treasury yields rose across all tenors with shorter-dated maturities coming under greater pressure, driven by the Federal Reserve’s normalization program. Corporate credits delivered negative returns as the autumn sell-off in credits, along with higher interest rates, overwhelmed earlier spread tightening. |
| • | | During the period, the VNLA returned 1.86% (based on NAV); its benchmark, 3-Month USD LIBOR, returned 1.85%. The largest source of positive returns was the Fund’s cash-based core of shorter-duration corporate credits. The Fund’s concentration on investment-grade corporate credits served the strategy well during the year as spreads narrowed for much of the period before widening over the final month. Also contributing was the Fund’s duration positioning. With the aim of managing interest-rate risk, the Fund kept duration toward the lower end of its mandated range for much of the period. Furthermore, the duration exposure we held has tended to be in regions that are expected to keep interest rates steady for the foreseeable future. Weighing on the Fund’s performance was the cost of hedges on corporate credits the Fund tactically deployed during the period with the aim of mitigating any potential losses associated with spread widening. |
| • | | VNLA is an actively managed fixed income ETF with the potential to deliver returns above cash. The strategy seeks to provide a steady income stream with low volatility and capital preservation across economic cycles. Rather than tracking a benchmark, the Fund is designed to move beyond conventional constraints and provide positive absolute returns. |
| | |
| | Janus Detroit Street Trust ½ 1 |
Janus Henderson Short Duration Income ETF (unaudited)
Fund At A Glance
October 31, 2018
| | | | |
| Sector Allocation – (% of Net Assets) | |
Financial | | | 50.0% | |
Consumer, Cyclical | | | 14.3% | |
Utilities | | | 7.3% | |
Communications | | | 6.8% | |
Energy | | | 5.9% | |
Consumer, Non-cyclical | | | 5.6% | |
Industrial | | | 3.8% | |
Technology | | | 3.4% | |
Asset-Backed Securities | | | 1.6% | |
Government | | | 1.3% | |
Diversified | | | 1.2% | |
Mortgage-Backed Securities | | | 1.0% | |
Basic Materials | | | 0.5% | |
Investment Company Securities | | | 0.1% | |
| | | | |
| | | 102.8% | |
Holdings are subject to change without notice.
Janus Henderson Short Duration Income ETF (unaudited)
Performance
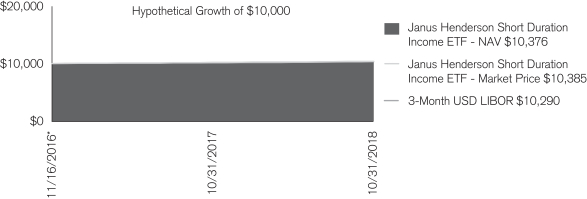
| | | | |
| Average Annual Total Return for the period ended October 31, 2018 |
| | | One Year | | Since
Inception* |
Janus Henderson Short Duration Income ETF – NAV | | 1.86% | | 1.91% |
Janus Henderson Short Duration Income ETF – Market Price | | 1.86% | | 1.95% |
3-Month USD LIBOR | | 1.85% | | 1.47% |
Total annual expense ratio as stated in the February 28, 2018 prospectus: 0.35%.
Returns quoted are past performance and do not guarantee future results; current performance may be lower or higher. Investment returns and principal value will vary; there may be a gain or loss when shares are sold. For the most recent month-end performance call 800.668.0434 or visit janushenderson.com/performance.
Shares of ETFs are bought and sold at market price (not NAV) and are not individually redeemed from the Fund. Market returns are based upon the midpoint of the bid/ask spread at 4:00 p.m. Eastern time (when NAV is normally determined for most ETFs), and do not represent the returns you would receive if you traded shares at other times. Ordinary brokerage commissions apply and will reduce returns.
ETF shares are not individually redeemable and owners of the shares may acquire those shares from the Fund and tender those shares for redemption to the Fund in Creation Units only.
Investing involves risk, including the possible loss of principal and fluctuation of value.
The Fund is not a money market fund and does not attempt to maintain a stable net asset value.
See the prospectus for a more complete discussion of objectives, risks and expenses.
Returns include reinvestment of dividends and capital gains. Returns greater than one year are annualized. Returns do not reflect the deduction of taxes that a shareholder would pay on Fund distributions or redemptions of Fund shares.
See Financial Highlights for actual expense ratios during the reporting period.
There is no assurance the stated objective(s) will be met.
See Notes to Schedule of Investments and Other Information for index definitions.
Index performance does not reflect the expenses of managing a portfolio as an index is unmanaged and not available for direct investment.
Effective November 1, 2018 Nick Maroutsos, Daniel Siluk and Jason England are Co-Portfolio Managers of the Fund.
Effective November 1, 2018 the Fund’s primary benchmark changed from the 3- Month USD LIBOR to the FTSE 3-Month U.S. Treasury Bill Index. This change in benchmarks resulted in corresponding changes to the Fund’s investment objective and principal investment strategies to reflect the new benchmark index, and is not expected to impact how the Fund is managed. Janus Henderson believes the FTSE 3-Month U.S Treasury Bill Index is a more appropriate benchmark against which to measure the Fund’s performance and regulators had signaled intent to phase out LIBOR as a key market interest rate by the end of 2021.
| * | The Fund commenced operations on November 16, 2016. |
| | |
| | Janus Detroit Street Trust ½ 3 |
Janus Henderson Short Duration Income ETF (unaudited)
Disclosure of Fund Expenses
As a shareholder of the Fund, you incur two types of costs: (1) transaction costs, which may include creation and redemption fees or brokerage charges and (2) ongoing costs, including management fees and other Fund expenses. This example is intended to help you understand your ongoing costs (in dollars) of investing in the Fund and to compare these costs with the ongoing costs of investing in other ETFs. To do so, compare this 5% hypothetical example with the 5% hypothetical examples that appear in the shareholder reports of the other funds. The example is based upon an investment of $1,000 invested at the beginning of the period and held for the six-months indicated, unless noted otherwise in the table and footnotes below.
Actual Expenses
The information in the table under the heading “Actual” provides information about actual account values and actual expenses. You may use the information in these columns, together with the amount you invested, to estimate the expenses that you paid over the period. Simply divide your account value by $1,000 (for example, an $8,600 account value divided by $1,000 = 8.6), then multiply the result by the number under the heading entitled “Expenses Paid During Period” to estimate the expenses you paid on your account during the period.
Hypothetical Example for Comparison Purposes
The information in the table under the heading “Hypothetical (5% return before expenses)” provides information about hypothetical account values and hypothetical expenses based upon the Fund’s actual expense ratio and an assumed rate of return of 5% per year before expenses, which is not the Fund’s actual return. The hypothetical account values and expenses may not be used to determine the actual ending account balance or expenses you paid for the period. You may use this information to compare the ongoing costs of investing in the Fund and other funds. To do so, compare this 5% hypothetical example with the 5% hypothetical examples that appear in the shareholder reports of the other funds. Additionally, for an analysis of the fees associated with an investment or other similar funds, please visit www.finra.org/fundanalyzer.
Please note that the expenses shown in the table are meant to highlight your ongoing costs only and do not reflect any transaction costs, such as creation and redemption fees, or brokerage charges. These fees are fully described in the Fund’s prospectus. Therefore, the hypothetical examples are useful in comparing ongoing costs only, and will not help you determine the relative total costs of owning different funds. In addition, if these transaction costs were included, your costs would have been higher.
| | | | | | | | | | | | | | | | | | | | | | | | |
Actual | | | Hypothetical
(5% return before expenses) | | | | |
Beginning
Account
Value
(5/1/18) | | Ending
Account
Value
(10/31/2018) | | | Expenses
Paid During
Period
(5/1/18 - 10/31/2018)† | | | Beginning
Account
Value
(5/1/18) | | | Ending
Account
Value
(10/31/2018) | | | Expenses
Paid During
Period
(5/1/18 - 10/31/2018)† | | | Net Annualized
Expense Ratio
(5/1/18 - 10/31/2018) | |
| $1,000.00 | | $ | 1,012.60 | | | $ | 1.78 | | | $ | 1,000.00 | | | $ | 1,023.44 | | | $ | 1.79 | | | | 0.35% | |
| † | Expenses Paid During Period is equal to the Net Annualized Expense Ratio multiplied by the average account value over the period, multiplied by 184/365 (to reflect the one-half year period). |
Janus Henderson Short Duration Income ETF
Report of Independent Registered Public Accounting Firm
To the Board of Trustees of Janus Detroit Street Trust and Shareholders of Janus Henderson Short Duration Income ETF:
Opinion on the Financial Statements
We have audited the accompanying statement of assets and liabilities, including the schedule of investments, of Janus Henderson Short Duration Income ETF (one of the funds constituting Janus Detroit Street Trust, referred to hereafter as the “Fund”) as of October 31, 2018, the related statement of operations for the year ended October 31, 2018, the statements of changes in net assets and the financial highlights for the year ended October 31, 2018 and for the period November 16, 2016 (commencement date) through October 31, 2017, including the related notes (collectively referred to as the “financial statements”). In our opinion, the financial statements present fairly, in all material respects, the financial position of the Fund as of October 31, 2018, the results of its operations for the year then ended, the changes in its net assets and the financial highlights for the year ended October 31, 2018 and for the period November 16, 2016 (commencement date) through October 31, 2017 in conformity with accounting principles generally accepted in the United States of America.
Basis for Opinion
These financial statements are the responsibility of the Fund’s management. Our responsibility is to express an opinion on the Fund’s financial statements based on our audits. We are a public accounting firm registered with the Public Company Accounting Oversight Board (United States) (“PCAOB”) and are required to be independent with respect to the Fund in accordance with the U.S. federal securities laws and the applicable rules and regulations of the Securities and Exchange Commission and the PCAOB.
We conducted our audits of these financial statements in accordance with the standards of the PCAOB. Those standards require that we plan and perform the audit to obtain reasonable assurance about whether the financial statements are free of material misstatement, whether due to error or fraud.
Our audits included performing procedures to assess the risks of material misstatement of the financial statements, whether due to error or fraud, and performing procedures that respond to those risks. Such procedures included examining, on a test basis, evidence regarding the amounts and disclosures in the financial statements. Our audits also included evaluating the accounting principles used and significant estimates made by management, as well as evaluating the overall presentation of the financial statements. Our procedures included confirmation of securities owned as of October 31, 2018 by correspondence with the custodian and brokers; when replies were not received from brokers, we performed other auditing procedures. We believe that our audits provide a reasonable basis for our opinion.

Denver, Colorado
December 20, 2018
We have served as the auditor of one or more investment companies in Janus Henderson Funds since 1990.
| | |
| | Janus Detroit Street Trust ½ 5 |
Janus Henderson Short Duration Income ETF
Schedule of Investments
October 31, 2018
| | | | | | | | |
| | | Principal Amounts | | | Value | |
| Corporate Bonds – 88.7% | |
| Asset-Backed Securities – 1.6% | |
Applebee’s Funding LLC / IHOP Funding LLC, 4.2770%, 9/5/44 (144A) | | | $2,224,530 | | | | $2,188,536 | |
Golden Credit Card Trust, 1.9800%, 4/15/22 (144A) | | | 484,000 | | | | 474,827 | |
Upgrade Receivables Trust, 3.7600%, 11/15/24 (144A) | | | 9,254,000 | | | | 9,253,505 | |
| | | | | | | | |
| | | | | | | 11,916,868 | |
| Basic Materials – 0.5% | |
Incitec Pivot Finance LLC, 6.0000%, 12/10/19 (144A) | | | 2,450,000 | | | | 2,509,386 | |
Sherwin-Williams Co., 2.2500%, 5/15/20 | | | 1,000,000 | | | | 982,941 | |
| | | | | | | | |
| | | | | | | 3,492,327 | |
| Communications – 5.8% | |
Alibaba Group Holding, Ltd., 2.5000%, 11/28/19 | | | 2,800,000 | | | | 2,783,116 | |
Amazon.com, Inc., 3.3000%, 12/5/21 | | | 1,496,000 | | | | 1,498,028 | |
Amazon.com, Inc., 2.5000%, 11/29/22 | | | 4,000,000 | | | | 3,852,236 | |
Amazon.com, Inc., 2.4000%, 2/22/23 | | | 2,000,000 | | | | 1,910,673 | |
Booking Holdings, Inc., 3.6000%, 6/1/26 | | | 3,250,000 | | | | 3,104,455 | |
CBS Corp., 2.9000%, 6/1/23 (144A) | | | 2,333,000 | | | | 2,202,864 | |
Deutsche Telekom International Finance B.V., 1.5000%, 9/19/19 | | | 875,000 | | | | 861,934 | |
Deutsche Telekom International Finance B.V., 1.5000%, 9/19/19 (144A) | | | 150,000 | | | | 147,760 | |
Deutsche Telekom International Finance B.V., ICE LIBOR USD 3 Month + 0.5800%, 3.0288%, 1/17/20 (144A)(a) | | | 700,000 | | | | 702,215 | |
eBay, Inc., 2.2000%, 8/1/19 | | | 100,000 | | | | 99,362 | |
eBay, Inc., 2.1500%, 6/5/20 | | | 1,446,000 | | | | 1,420,347 | |
eBay, Inc., ICE LIBOR USD 3 Month + 0.8700%, 3.3904%, 1/30/23(a) | | | 2,400,000 | | | | 2,412,084 | |
Optus Finance Pty, Ltd., 4.6250%, 10/15/19 | | | 8,967,000 | | | | 9,059,521 | |
SingTel Group Treasury Pte, Ltd., 4.5000%, 9/8/21 | | | 2,341,000 | | | | 2,388,887 | |
Telstra Corp., Ltd., 7.7500%, 7/15/20 | | | 2,200,000 | | | | 1,688,466 | |
Verizon Communications, Inc., 90 Day Australian Bank Bill Rate + 1.2200%, 3.1700%, 2/17/23(a) | | | 4,230,000 | | | | 3,007,609 | |
Verizon Communications, Inc., 3.5000%, 2/17/23 | | | 2,170,000 | | | | 1,545,448 | |
Walt Disney Co., 1.6500%, 1/8/19 | | | 600,000 | | | | 598,732 | |
Walt Disney Co., 2.1500%, 9/17/20 | | | 1,100,000 | | | | 1,082,268 | |
Walt Disney Co., ICE LIBOR USD 3 Month + 0.3900%, 2.7108%, 3/4/22(a) | | | 2,030,000 | | | | 2,045,060 | |
| | | | | | | | |
| | | | | | | 42,411,065 | |
| Consumer, Cyclical – 9.4% | |
American Honda Finance Corp., 1.2000%, 7/12/19 | | | 1,925,000 | | | | 1,902,922 | |
American Honda Finance Corp., 2.2500%, 8/15/19 | | | 1,500,000 | | | | 1,491,707 | |
American Honda Finance Corp., ICE LIBOR USD 3 Month + 0.3400%,
2.6593%, 2/14/20(a) | | | 850,000 | | | | 850,993 | |
American Honda Finance Corp., ICE LIBOR USD 3 Month + 0.2600%,
2.5941%, 6/16/20(a) | | | 4,100,000 | | | | 4,101,718 | |
Cintas Corp. No. 2, 3.7000%, 4/1/27 | | | 1,625,000 | | | | 1,567,281 | |
Costco Wholesale Corp., 2.2500%, 2/15/22 | | | 1,500,000 | | | | 1,450,361 | |
Costco Wholesale Corp., 2.7500%, 5/18/24 | | | 1,600,000 | | | | 1,541,512 | |
CVS Health Corp., 2.1250%, 6/1/21 | | | 3,803,000 | | | | 3,665,599 | |
Daimler Finance North America LLC, ICE LIBOR USD 3 Month + 0.2500%, 2.5905%, 11/5/18 (144A)(a) | | | 500,000 | | | | 500,003 | |
Daimler Finance North America LLC, 1.5000%, 7/5/19 (144A) | | | 1,650,000 | | | | 1,632,481 | |
Daimler Finance North America LLC, ICE LIBOR USD 3 Month + 0.6300%, 3.0381%, 1/6/20 (144A)(a) | | | 1,900,000 | | | | 1,908,360 | |
Daimler Finance North America LLC, ICE LIBOR USD 3 Month + 0.4500%, 2.7596%, 2/22/21 (144A)(a) | | | 4,018,000 | | | | 4,014,464 | |
Daimler Finance North America LLC, ICE LIBOR USD 3 Month + 0.5500%, 2.8905%, 5/4/21 (144A)(a) | | | 2,000,000 | | | | 2,000,960 | |
Daimler Finance North America LLC, 2.8500%, 1/6/22 (144A) | | | 600,000 | | | | 581,227 | |
Ford Motor Credit Co. LLC, ICE LIBOR USD 3 Month + 0.8100%, 3.2183%, 4/5/21(a) | | | 1,988,000 | | | | 1,971,513 | |
Ford Motor Credit Co. LLC, ICE LIBOR USD 3 Month + 1.0800%, 3.4283%, 8/3/22(a) | | | 5,264,000 | | | | 5,140,708 | |
General Motors Co., ICE LIBOR USD 3 Month + 0.8000%, 3.1430%, 8/7/20(a) | | | 314,000 | | | | 314,592 | |
See Notes to Schedule of Investments and Other Information and Notes to Financial Statements.
Janus Henderson Short Duration Income ETF
Schedule of Investments
October 31, 2018
| | | | | | | | |
| | | Principal Amounts | | | Value | |
| Corporate Bonds – (continued) | |
| Consumer, Cyclical – (continued) | |
General Motors Co., ICE LIBOR USD 3 Month + 0.9000%, 3.2271%, 9/10/21(a) | | | $ 3,000,000 | | | | $ 2,995,662 | |
General Motors Financial Co., Inc., 2.4500%, 11/6/20 | | | 650,000 | | | | 632,416 | |
General Motors Financial Co., Inc., ICE LIBOR USD 3 Month + 1.5500%, 3.9863%, 1/14/22(a) | | | 500,000 | | | | 506,781 | |
General Motors Financial Co., Inc., ICE LIBOR USD 3 Month + 0.9900%,
3.3983%, 1/5/23(a) | | | 2,150,000 | | | | 2,130,660 | |
Hyundai Capital America, ICE LIBOR USD 3 Month + 0.9400%, 3.3481%, 7/8/21 (144A)(a) | | | 3,500,000 | | | | 3,512,600 | |
Hyundai Capital America, 2.7500%, 9/27/26 (144A) | | | 1,000,000 | | | | 866,789 | |
Hyundai Capital Services, Inc., 1.6250%, 8/30/19 | | | 500,000 | | | | 492,974 | |
Hyundai Capital Services, Inc., 3.0000%, 3/6/22 (144A) | | | 400,000 | | | | 385,035 | |
Lowe’s Cos., Inc., ICE LIBOR USD 3 Month + 0.4200%, 2.7471%, 9/10/19(a) | | | 2,551,000 | | | | 2,557,818 | |
Nissan Financial Services Australia Pty, Ltd., 2.5000%, 9/6/19 | | | 250,000 | | | | 177,118 | |
Nissan Motor Acceptance Corp., 2.2500%, 1/13/20 (144A) | | | 1,000,000 | | | | 986,561 | |
Nissan Motor Acceptance Corp., ICE LIBOR USD 3 Month + 0.3900%, 2.8263%, 7/13/20 (144A)(a) | | | 600,000 | | | | 599,300 | |
Nissan Motor Acceptance Corp., 1.9000%, 9/14/21 (144A) | | | 2,000,000 | | | | 1,905,590 | |
Nissan Motor Acceptance Corp., ICE LIBOR USD 3 Month + 0.6300%, 2.9834%, 9/21/21 (144A)(a) | | | 3,000,000 | | | | 3,005,806 | |
Nissan Motor Acceptance Corp., ICE LIBOR USD 3 Month + 0.6900%, 3.0761%, 9/28/22 (144A)(a) | | | 700,000 | | | | 699,450 | |
Toyota Motor Credit Corp., 2.1250%, 7/18/19 | | | 552,000 | | | | 549,336 | |
Toyota Motor Credit Corp., ICE LIBOR USD 3 Month + 0.1000%, 2.5143%, 1/10/20(a) | | | 3,000,000 | | | | 3,001,543 | |
Toyota Motor Credit Corp., ICE LIBOR USD 3 Month + 0.2800%, 2.7163%, 4/13/21(a) | | | 2,000,000 | | | | 2,000,340 | |
Toyota Motor Finance Netherlands B.V., ICE LIBOR USD 3 Month + 0.2500%, 2.5843%, 12/12/19(a) | | | 1,000,000 | | | | 1,000,770 | |
Walmart, Inc., 1.9000%, 12/15/20 | | | 2,500,000 | | | | 2,438,267 | |
Walmart, Inc., ICE LIBOR USD 3 Month + 0.2300%, 2.5964%, 6/23/21(a) | | | 3,500,000 | | | | 3,515,113 | |
| | | | | | | | |
| | | | | | | 68,596,330 | |
| Consumer, Non-cyclical – 4.6% | |
Allergan Funding SCS, 2.4500%, 6/15/19 | | | 1,400,000 | | | | 1,397,296 | |
Allergan Funding SCS, 3.0000%, 3/12/20 | | | 1,000,000 | | | | 995,661 | |
Becton Dickinson and Co., ICE LIBOR USD 3 Month + 0.8750%, 3.2611%, 12/29/20(a) | | | 1,400,000 | | | | 1,401,119 | |
Becton Dickinson and Co., ICE LIBOR USD 3 Month + 1.0300%, 3.3528%, 6/6/22(a) | | | 900,000 | | | | 905,225 | |
Cardinal Health, Inc., 2.4000%, 11/15/19 | | | 500,000 | | | | 496,306 | |
Cardinal Health, Inc., ICE LIBOR USD 3 Month + 0.7700%, 3.1041%, 6/15/22(a) | | | 1,600,000 | | | | 1,598,200 | |
Constellation Brands, Inc., ICE LIBOR USD 3 Month + 0.7000%, 3.2652%, 11/15/21(a) | | | 3,000,000 | | | | 2,998,074 | |
Constellation Brands, Inc., 2.7000%, 5/9/22 | | | 1,236,000 | | | | 1,187,554 | |
Constellation Brands, Inc., 2.6500%, 11/7/22 | | | 4,100,000 | | | | 3,926,103 | |
Constellation Brands, Inc., 3.2000%, 2/15/23 | | | 2,800,000 | | | | 2,713,810 | |
Fonterra Co-operative Group, Ltd., 4.5000%, 6/30/21 | | | 2,200,000 | | | | 1,626,598 | |
Molson Coors Brewing Co., 2.2500%, 3/15/20 | | | 1,127,000 | | | | 1,110,538 | |
Molson Coors Brewing Co., 2.1000%, 7/15/21 | | | 4,300,000 | | | | 4,116,583 | |
Sysco Corp., 1.9000%, 4/1/19 | | | 2,400,000 | | | | 2,391,022 | |
Sysco Corp., 2.6000%, 10/1/20 | | | 500,000 | | | | 492,841 | |
Sysco Corp., 2.6000%, 6/12/22 | | | 763,000 | | | | 734,126 | |
Transurban Finance Co. Pty, Ltd., 3.3750%, 3/22/27 (144A) | | | 150,000 | | | | 137,837 | |
Wesfarmers, Ltd., 6.2500%, 3/28/19 | | | 800,000 | | | | 575,658 | |
Wesfarmers, Ltd., 4.7500%, 3/12/20 | | | 500,000 | | | | 364,669 | |
WSO Finance Pty, Ltd., 3.5000%, 7/14/23 | | | 1,400,000 | | | | 998,500 | |
WSO Finance Pty, Ltd., 4.5000%, 3/31/27 | | | 800,000 | | | | 586,817 | |
WSO Finance Pty, Ltd., 4.5000%, 9/30/27 | | | 4,000,000 | | | | 2,910,325 | |
| | | | | | | | |
| | | | | | | 33,664,862 | |
See Notes to Schedule of Investments and Other Information and Notes to Financial Statements.
| | |
| | Janus Detroit Street Trust ½ 7 |
Janus Henderson Short Duration Income ETF
Schedule of Investments
October 31, 2018
| | | | | | | | |
| | | Principal Amounts | | | Value | |
| Corporate Bonds – (continued) | |
| Diversified – 1.2% | |
CK Hutchison International 16, Ltd., 1.8750%, 10/3/21 (144A) | | | $ 1,100,000 | | | | $ 1,045,066 | |
CK Hutchison International 17 II, Ltd., 2.2500%, 9/29/20 (144A) | | | 1,100,000 | | | | 1,072,693 | |
CK Hutchison International 17, Ltd., 2.8750%, 4/5/22 | | | 4,000,000 | | | | 3,878,014 | |
Hutchison Whampoa International 09, Ltd., 7.6250%, 4/9/19 | | | 2,450,000 | | | | 2,495,472 | |
Hutchison Whampoa International, Ltd., 5.7500%, 9/11/19 (144A) | | | 350,000 | | | | 357,534 | |
| | | | | | | | |
| | | | | | | 8,848,779 | |
| Energy – 2.8% | |
CNOOC Finance 2015 USA LLC, 3.7500%, 5/2/23 | | | 4,500,000 | | | | 4,445,937 | |
Harvest Operations Corp., 4.2000%, 6/1/23 (144A) | | | 2,410,526 | | | | 2,434,716 | |
Korea National Oil Corp., 4.2500%, 10/8/19 | | | 200,000 | | | | 143,351 | |
Korea National Oil Corp., 2.0000%, 10/24/21 | | | 4,746,000 | | | | 4,513,979 | |
Shell International Finance BV, ICE LIBOR USD 3 Month + 0.3500%, 2.6843%, 9/12/19(a) | | | 550,000 | | | | 551,391 | |
Sinopec Group Overseas Development 2014, Ltd., 2.7500%, 4/10/19 | | | 250,000 | | | | 249,458 | |
Sinopec Group Overseas Development 2016, Ltd., 1.7500%, 9/29/19 (144A) | | | 1,700,000 | | | | 1,674,639 | |
Sinopec Group Overseas Development 2017, Ltd., 2.3750%, 4/12/20 (144A) | | | 600,000 | | | | 590,259 | |
Sinopec Group Overseas Development 2017, Ltd., 2.2500%, 9/13/20 (144A) | | | 500,000 | | | | 488,305 | |
Sinopec Group Overseas Development 2018, Ltd., 3.7500%, 9/12/23 (144A) | | | 5,000,000 | | | | 4,934,715 | |
| | | | | | | | |
| | | | | | | 20,026,750 | |
| Financial – 50.0% | |
Ally Financial, Inc., 3.2500%, 11/5/18 | | | 1,600,000 | | | | 1,599,792 | |
Ally Financial, Inc., 8.0000%, 12/31/18 | | | 1,000,000 | | | | 1,006,250 | |
Ally Financial, Inc., 3.5000%, 1/27/19 | | | 4,400,000 | | | | 4,394,500 | |
American Express Co., ICE LIBOR USD 3 Month + 0.5250%, 2.8368%, 5/17/21(a) | | | 2,400,000 | | | | 2,403,129 | |
American Express Co., ICE LIBOR USD 3 Month + 0.6100%, 3.1510%, 8/1/22(a) | | | 1,550,000 | | | | 1,547,814 | |
American Express Credit Corp., 1.7000%, 10/30/19 | | | 3,500,000 | | | | 3,453,591 | |
American Express Credit Corp., 2.3750%, 5/26/20 | | | 500,000 | | | | 493,055 | |
ANZ New Zealand Int’l, Ltd., 2.7500%, 1/22/21 (144A) | | | 2,500,000 | | | | 2,453,698 | |
ANZ New Zealand Int’l, Ltd., ICE LIBOR USD 3 Month + 1.0100%, 3.5193%, 7/28/21 (144A)(a) | | | 1,500,000 | | | | 1,519,357 | |
Aroundtown S.A., 2.1250%, 3/13/23 | | | 3,000,000 | | | | 3,493,930 | |
ASB Bank, Ltd., ICE LIBOR USD 3 Month + 0.9700%, 3.3015%, 6/14/23 (144A)(a) | | | 4,310,000 | | | | 4,334,082 | |
Australia & New Zealand Banking Group, Ltd., 5.1250%, 9/10/19 | | | 4,920,000 | | | | 5,813,776 | |
Australia & New Zealand Banking Group, Ltd., ICE LIBOR USD 3 Month + 0.4600%, 2.7718%, 5/17/21 (144A)(a) | | | 6,250,000 | | | | 6,253,271 | |
Australia & New Zealand Banking Group, Ltd., 90 Day Australian Bank Bill Rate + 1.0000%, 2.9307%, 3/7/22(a) | | | 2,000,000 | | | | 1,427,466 | |
Australia & New Zealand Banking Group, Ltd., ICE LIBOR USD 3 Month + 0.5800%, 2.9214%, 11/9/22 (144A)(a) | | | 3,935,000 | | | | 3,929,238 | |
Bank Nederlandse Gemeenten NV, 1.5000%, 2/15/19 (144A) | | | 750,000 | | | | 747,637 | |
Bank Nederlandse Gemeenten NV, 1.8750%, 6/11/19 | | | 700,000 | | | | 696,242 | |
Bank of America Corp., 90 Day Australian Bank Bill Rate + 1.1500%, 3.0967%, 3/5/20(a) | | | 5,000,000 | | | | 3,561,986 | |
Bank of America Corp., 90 Day Australian Bank Bill Rate + 1.5500%, 3.5164%, 8/5/21(a) | | | 1,600,000 | | | | 1,151,648 | |
Bank of America Corp., ICE LIBOR USD 3 Month + 0.6500%, 3.0226%, 6/25/22(a) | | | 5,000,000 | | | | 5,000,895 | |
Bank of America Corp., ICE LIBOR USD 3 Month + 1.1600%, 3.6290%, 1/20/23(a) | | | 1,350,000 | | | | 1,371,108 | |
Bank of America Corp., ICE LIBOR USD 3 Month + 0.9600%, 3.4372%, 7/23/24(a) | | | 5,300,000 | | | | 5,299,523 | |
Bank of China, Ltd., 90 Day Australian Bank Bill Rate + 1.0000%, 2.9484%, 3/2/20(a) | | | 2,300,000 | | | | 1,632,109 | |
Bank of China, Ltd., 90 Day Australian Bank Bill Rate + 1.2300%, 3.1600%, 4/20/22(a) | | | 800,000 | | | | 568,322 | |
Bank of Communications Co., Ltd., ICE LIBOR USD 3 Month + 0.7500%, 3.0618%, 5/17/21(a) | | | 3,500,000 | | | | 3,500,070 | |
Bank of Montreal, ICE LIBOR USD 3 Month + 0.4400%, 2.7741%, 6/15/20(a) | | | 800,000 | | | | 803,278 | |
Bank of Montreal, ICE LIBOR USD 3 Month + 0.3400%, 2.7763%, 7/13/20(a) | | | 3,000,000 | | | | 3,006,676 | |
Bank of Montreal, ICE LIBOR USD 3 Month + 0.4600%, 2.8963%, 4/13/21(a) | | | 2,000,000 | | | | 2,004,544 | |
Bank of Montreal, ICE LIBOR USD 3 Month + 0.6300%, 2.9613%, 9/11/22(a) | | | 500,000 | | | | 502,559 | |
Bank of Montreal, CDOR USD 3 Month + 1.0800%, 3.1200%, 9/19/24(a) | | | 1,350,000 | | | | 1,029,670 | |
See Notes to Schedule of Investments and Other Information and Notes to Financial Statements.
Janus Henderson Short Duration Income ETF
Schedule of Investments
October 31, 2018
| | | | | | | | |
| | | Principal Amounts | | | Value | |
| Corporate Bonds – (continued) | |
| Financial – (continued) | |
Bank of Nova Scotia, 2.3500%, 10/21/20 | | | $ 700,000 | | | | $ 688,435 | |
Bank of Nova Scotia, ICE LIBOR USD 3 Month + 0.2900%, 2.6996%, 1/8/21(a) | | | 1,200,000 | | | | 1,199,715 | |
Bank of Nova Scotia, ICE LIBOR USD 3 Month + 0.4400%, 2.9090%, 4/20/21(a) | | | 2,000,000 | | | | 2,004,841 | |
Bank of Nova Scotia, 2.7000%, 3/7/22 | | | 500,000 | | | | 486,654 | |
Bank of Nova Scotia, ICE LIBOR USD 3 Month + 0.6400%, 2.9568%, 3/7/22(a) | | | 500,000 | | | | 504,339 | |
Bank of Queensland, Ltd., 90 Day Australian Bank Bill Rate + 1.1700%,
3.0911%, 10/26/20(a) | | | 5,900,000 | | | | 4,204,322 | |
Bank of Queensland, Ltd., ICE LIBOR USD 3 Month + 1.0200%, 2.9750%, 11/16/21(a) | | | 6,000,000 | | | | 4,253,813 | |
Bendigo & Adelaide Bank, Ltd., 90 Day Australian Bank Bill Rate + 1.1000%, 3.0550%, 8/18/20(a) | | | 2,000,000 | | | | 1,423,961 | |
Bendigo & Adelaide Bank, Ltd., 90 Day Australian Bank Bill Rate + 1.4600%, 3.3900%, 4/20/21(a) | | | 450,000 | | | | 322,958 | |
Bendigo & Adelaide Bank, Ltd., 90 Day Australian Bank Bill Rate + 2.8000%, 4.7150%, 1/29/24(a) | | | 500,000 | | | | 355,668 | |
Bendigo & Adelaide Bank, Ltd., 90 Day Australian Bank Bill Rate + 2.8000%, 4.7318%, 12/9/26(a) | | | 200,000 | | | | 146,552 | |
Canadian Imperial Bank of Commerce, ICE LIBOR USD 3 Month + 0.3150%, 2.8735%, 2/2/21(a) | | | 1,500,000 | | | | 1,501,058 | |
Capital One Financial Corp., ICE LIBOR USD 3 Month + 0.7200%, 3.2404%, 1/30/23(a) | | | 6,300,000 | | | | 6,244,821 | |
Capital One NA, ICE LIBOR USD 3 Month + 1.1500%, 3.6704%, 1/30/23(a) | | | 1,500,000 | | | | 1,507,200 | |
Cboe Global Markets, Inc., 3.6500%, 1/12/27 | | | 350,000 | | | | 331,379 | |
Citibank NA, ICE LIBOR USD 3 Month + 0.5700%, 3.0472%, 7/23/21(a) | | | 6,500,000 | | | | 6,521,083 | |
Citigroup, Inc., 90 Day Australian Bank Bill Rate + 1.2500%, 3.2164%, 8/7/19(a) | | | 1,500,000 | | | | 1,067,815 | |
Citigroup, Inc., 90 Day Australian Bank Bill Rate + 1.5500%, 3.5164%, 5/4/21(a) | | | 2,000,000 | | | | 1,437,642 | |
Citigroup, Inc., ICE LIBOR USD 3 Month + 1.0700%, 3.3971%, 12/8/21(a) | | | 5,750,000 | | | | 5,840,390 | |
Citigroup, Inc., ICE LIBOR USD 3 Month + 0.9600%, 3.4499%, 4/25/22(a) | | | 750,000 | | | | 757,723 | |
Citigroup, Inc., ICE LIBOR USD 3 Month + 0.7220%, 3.1420%, 1/24/23(a) | | | 1,000,000 | | | | 976,290 | |
Citizens Bank NA, ICE LIBOR USD 3 Month + 0.5400%, 2.8608%, 3/2/20(a) | | | 800,000 | | | | 801,924 | |
Citizens Bank NA, ICE LIBOR USD 3 Month + 0.5700%, 2.8814%, 5/26/20(a) | | | 600,000 | | | | 601,659 | |
Citizens Bank NA, 2.2500%, 10/30/20 | | | 1,100,000 | | | | 1,071,638 | |
Citizens Bank NA, ICE LIBOR USD 3 Month + 0.8100%, 3.1214%, 5/26/22(a) | | | 300,000 | | | | 300,615 | |
Commonwealth Bank of Australia, 5.5000%, 8/6/19 | | | 3,360,000 | | | | 3,962,358 | |
Commonwealth Bank of Australia, 2.2500%, 3/10/20 (144A) | | | 500,000 | | | | 493,105 | |
Commonwealth Bank of Australia, 90 Day Australian Bank Bill Rate + 1.1500%, 3.0827%, 1/18/21(a) | | | 2,000,000 | | | | 1,432,751 | |
Commonwealth Bank of Australia, ICE LIBOR USD 3 Month + 0.8300%, 3.1528%, 9/6/21(a) | | | 1,000,000 | | | | 1,010,709 | |
Commonwealth Bank of Australia, ICE LIBOR USD 3 Month + 0.8300%, 3.1528%, 9/6/21 (144A)(a) | | | 1,204,000 | | | | 1,216,894 | |
Commonwealth Bank of Australia, ICE LIBOR USD 3 Month + 0.6800%, 3.0171%, 9/18/22 (144A)(a) | | | 1,200,000 | | | | 1,203,374 | |
Commonwealth Bank of Australia, ICE LIBOR USD 3 Month + 0.7000%, 3.0341%, 3/16/23 (144A)(a) | | | 3,000,000 | | | | 3,009,564 | |
Commonwealth Bank of Australia, 90 Day Australian Bank Bill Rate + 1.9500%, 3.9164%, 11/5/24(a) | | | 6,000,000 | | | | 4,292,286 | |
Commonwealth Bank of Australia, 90 Day Australian Bank Bill Rate + 2.6500%, 4.5984%, 6/3/26(a) | | | 1,300,000 | | | | 950,631 | |
Commonwealth Bank of Australia, ICE LIBOR USD 3 Month + 2.0940%,
3.3750%, 10/20/26(a) | | | 500,000 | | | | 483,970 | |
Cooperatieve Rabobank UA, ICE LIBOR USD 3 Month + 0.4300%, 2.9380%, 4/26/21(a) | | | 2,000,000 | | | | 2,004,739 | |
Cooperatieve Rabobank UA, ICE LIBOR USD 3 Month + 0.8300%, 3.2443%, 1/10/22(a) | | | 1,700,000 | | | | 1,721,328 | |
Cooperatieve Rabobank UA, ICE LIBOR USD 3 Month + 0.4800%, 2.8943%, 1/10/23(a) | | | 1,200,000 | | | | 1,196,604 | |
Cooperatieve Rabobank UA, ICE LIBOR USD 3 Month + 0.8600%,
3.2336%, 9/26/23 (144A)(a) | | | 3,000,000 | | | | 2,994,013 | |
DBS Bank, Ltd., ICE LIBOR USD 3 Month + 0.5100%, 2.4590%, 9/4/20(a) | | | 1,000,000 | | | | 708,783 | |
See Notes to Schedule of Investments and Other Information and Notes to Financial Statements.
| | |
| | Janus Detroit Street Trust ½ 9 |
Janus Henderson Short Duration Income ETF
Schedule of Investments
October 31, 2018
| | | | | | | | |
| | | Principal Amounts | | | Value | |
| Corporate Bonds – (continued) | |
| Financial – (continued) | |
DBS Group Holdings, Ltd., ICE LIBOR USD 3 Month + 0.4900%, 2.8171%, 6/8/20 (144A)(a) | | | $ 1,600,000 | | | | $ 1,602,784 | |
DBS Group Holdings, Ltd., ICE LIBOR USD 3 Month + 0.4900%, 2.8171%, 6/8/20(a) | | | 800,000 | | | | 801,392 | |
DBS Group Holdings, Ltd., USD SWAP SEMI 30/360 5YR + 2.3900%, 3.6000%, 9/7/21(a) | | | 1,200,000 | | | | 1,150,800 | |
DBS Group Holdings, Ltd., ICE LIBOR USD 3 Month + 1.5800%, 3.5034%, 3/16/28(a) | | | 1,130,000 | | | | 800,290 | |
DBS Group Holdings, Ltd., ICE LIBOR USD 3 Month + 1.5900%,
4.5200%, 12/11/28 (144A)(a) | | | 3,000,000 | | | | 3,032,730 | |
DEXUS Finance Pty, Ltd., 4.2000%, 11/9/22 | | | 2,200,000 | | | | 1,601,763 | |
Dexus Wholesale Property Fund, 4.7500%, 6/16/25 | | | 1,800,000 | | | | 1,329,640 | |
E*TRADE Financial Corp., 2.9500%, 8/24/22 | | | 2,700,000 | | | | 2,602,212 | |
First Republic Bank, 2.5000%, 6/6/22 | | | 1,645,000 | | | | 1,579,042 | |
GAIF Bond Issuer Pty, Ltd., 3.4000%, 9/30/26 (144A) | | | 3,352,000 | | | | 3,084,169 | |
GAIF Bond Issuer Pty, Ltd., 3.4000%, 9/30/26 | | | 2,519,000 | | | | 2,317,727 | |
General Property Trust, 3.5910%, 11/7/23 | | | 600,000 | | | | 426,155 | |
Goldman Sachs Bank USA, 3.2000%, 6/5/20 | | | 3,000,000 | | | | 2,997,323 | |
Goldman Sachs Group, Inc., 90 Day Australian Bank Bill Rate + 1.3000%,
3.2575%, 8/21/19(a) | | | 180,000 | | | | 128,208 | |
Goldman Sachs Group, Inc., 90 Day Australian Bank Bill Rate + 1.2000%,
3.1550%, 8/26/20(a) | | | 2,500,000 | | | | 1,780,982 | |
Goldman Sachs Group, Inc., ICE LIBOR USD 3 Month + 1.7700%, 4.0814%, 2/25/21(a) | | | 3,380,000 | | | | 3,472,883 | |
Goldman Sachs Group, Inc., ICE LIBOR USD 3 Month + 1.3600%, 3.8499%, 4/23/21(a) | | | 2,000,000 | | | | 2,039,600 | |
Goldman Sachs Group, Inc., ICE LIBOR USD 3 Month + 0.7800%, 3.3066%, 10/31/22(a) | | | 3,400,000 | | | | 3,411,811 | |
Goldman Sachs Group, Inc., ICE LIBOR USD 3 Month + 1.0500%, 3.3656%, 6/5/23(a) | | | 1,350,000 | | | | 1,358,978 | |
Goldman Sachs Group, Inc., ICE LIBOR USD 3 Month + 1.2010%, 3.2720%, 9/29/25(a) | | | 1,000,000 | | | | 948,108 | |
GPT RE, Ltd., 3.6725%, 9/19/24 | | | 2,200,000 | | | | 1,553,794 | |
GPT Wholesale Office Fund No 1, 4.0000%, 5/18/22 | | | 1,900,000 | | | | 1,375,553 | |
GPT Wholesale Shopping Centre Fund No. 1, 3.9930%, 9/11/24 | | | 4,150,000 | | | | 2,959,228 | |
JPMorgan Chase & Co., 90 Day Australian Bank Bill Rate + 1.1000%, 3.0318%, 12/9/19(a) | | | 1,500,000 | | | | 1,069,011 | |
JPMorgan Chase & Co., ICE LIBOR USD 3 Month + 0.6800%, 3.0008%, 6/1/21(a) | | | 1,200,000 | | | | 1,201,800 | |
JPMorgan Chase & Co., ICE LIBOR USD 3 Month + 0.6100%, 2.9471%, 6/18/22(a) | | | 5,000,000 | | | | 4,999,950 | |
JPMorgan Chase & Co., ICE LIBOR USD 3 Month + 0.9000%, 3.3899%, 4/25/23(a) | | | 1,900,000 | | | | 1,913,283 | |
JPMorgan Chase & Co., ICE LIBOR USD 3 Month + 0.7300%, 3.2072%, 4/23/24(a) | | | 2,749,000 | | | | 2,723,638 | |
JPMorgan Chase Bank NA, ICE LIBOR USD 3 Month + 0.3400%, 2.8480%, 4/26/21(a) | | | 4,000,000 | | | | 4,000,777 | |
Kreditanstalt fuer Wiederaufbau, 2.3750%, 12/29/22 | | | 7,000,000 | | | | 6,785,090 | |
Liberty Financial Pty, Ltd., 5.1000%, 6/1/20 | | | 4,700,000 | | | | 3,347,524 | |
Liberty Financial Pty, Ltd., 5.1000%, 4/9/21 | | | 3,650,000 | | | | 2,593,234 | |
Lloyds Banking Group PLC, ICE LIBOR USD 3 Month + 1.3000%, 3.2200%, 3/20/23(a) | | | 3,000,000 | | | | 2,119,443 | |
Lloyds Banking Group PLC, 3.6500%, 3/20/23 | | | 1,500,000 | | | | 1,063,409 | |
Lloyds Banking Group PLC, ICE LIBOR USD 3 Month + 0.8100%, 2.9070%, 11/7/23(a) | | | 1,400,000 | | | | 1,330,037 | |
Macquarie Bank, Ltd., ICE LIBOR USD 3 Month + 0.3500%, 2.7575%, 4/4/19 (144A)(a) | | | 1,400,000 | | | | 1,400,687 | |
Macquarie Bank, Ltd., ICE LIBOR USD 3 Month + 1.1200%, 3.6293%, 7/29/20 (144A)(a) | | | 1,000,000 | | | | 1,012,267 | |
Macquarie Group, Ltd., 6.2500%, 1/14/21 (144A) | | | 1,750,000 | | | | 1,839,641 | |
Macquarie Group, Ltd., 6.2500%, 1/14/21 | | | 2,091,000 | | | | 2,198,109 | |
Macquarie Group, Ltd., ICE LIBOR USD 3 Month + 1.0230%, 3.1890%, 11/28/23 (144A)(a) | | | 3,257,000 | | | | 3,103,915 | |
Macquarie Group, Ltd., ICE LIBOR USD 3 Month + 1.3500%, 3.7310%, 3/27/24(a) | | | 6,602,000 | | | | 6,679,857 | |
Mizuho Financial Group, Inc., ICE LIBOR USD 3 Month + 0.8800%, 3.2113%, 9/11/22(a) | | | 1,100,000 | | | | 1,102,200 | |
See Notes to Schedule of Investments and Other Information and Notes to Financial Statements.
Janus Henderson Short Duration Income ETF
Schedule of Investments
October 31, 2018
| | | | | | | | |
| | | Principal Amounts | | | Value | |
| Corporate Bonds – (continued) | |
| Financial – (continued) | |
Morgan Stanley, ICE LIBOR USD 3 Month + 0.8000%, 3.1193%, 2/14/20(a) | | | $ 2,853,000 | | | | $ 2,856,709 | |
Morgan Stanley, ICE LIBOR USD 3 Month + 1.4000%, 3.8690%, 4/21/21(a) | | | 4,000,000 | | | | 4,083,492 | |
Morgan Stanley, ICE LIBOR USD 3 Month + 1.1800%, 3.6490%, 1/20/22(a) | | | 2,850,000 | | | | 2,882,083 | |
Morgan Stanley, ICE LIBOR USD 3 Month + 1.4000%, 3.8874%, 10/24/23(a) | | | 4,400,000 | | | | 4,480,362 | |
Morgan Stanley, ICE LIBOR USD 3 Month + 0.8470%, 3.7370%, 4/24/24(a) | | | 2,000,000 | | | | 1,975,012 | |
National Australia Bank, Ltd., 90 Day Australian Bank Bill Rate + 1.0800%, 3.0464%, 11/5/20(a) | | | 2,000,000 | | | | 1,429,390 | |
National Australia Bank, Ltd., 2.5000%, 1/12/21 | | | 1,500,000 | | | | 1,467,797 | |
National Australia Bank, Ltd., ICE LIBOR USD 3 Month + 0.5800%, 2.9175%, 9/20/21 (144A)(a) | | | 5,500,000 | | | | 5,516,720 | |
National Australia Bank, Ltd., ICE LIBOR USD 3 Month + 0.8000%, 2.7600%, 2/10/23(a) | | | 2,000,000 | | | | 1,413,572 | |
National Australia Bank, Ltd., 90 Day Australian Bank Bill Rate + 1.8500%, 3.7915%, 3/26/25(a) | | | 4,017,000 | | | | 2,871,877 | |
National Australia Bank, Ltd., 90 Day Australian Bank Bill Rate + 2.4000%, 4.3250%, 9/21/26(a) | | | 1,925,000 | | | | 1,401,108 | |
Nederlandse Waterschapsbank NV, 1.7500%, 9/5/19 | | | 1,100,000 | | | | 1,089,847 | |
Nordea Bank AB, 2.1250%, 5/29/20 (144A) | | | 910,000 | | | | 892,003 | |
Nordea Bank AB, 2.5000%, 9/17/20 (144A) | | | 200,000 | | | | 196,435 | |
Nordea Bank Abp, ICE LIBOR USD 3 Month + 0.9400%, 3.2548%, 8/30/23 (144A)(a) | | | 4,500,000 | | | | 4,495,959 | |
Oversea-Chinese Banking Corp., Ltd., 4.2500%, 6/19/24 (144A) | | | 399,000 | | | | 395,473 | |
Oversea-Chinese Banking Corp., Ltd., 4.2500%, 6/19/24 | | | 1,897,000 | | | | 1,880,231 | |
Oversea-Chinese Banking Corp., Ltd., USD SWAP SEMI 30/360 5YR + 2.2030%, 4.0000%, 10/15/24(a) | | | 250,000 | | | | 250,725 | |
Royal Bank of Canada, ICE LIBOR USD 3 Month + 0.7300%, 3.2710%, 2/1/22(a) | | | 500,000 | | | | 505,179 | |
Royal Bank of Canada, ICE LIBOR USD 3 Month + 0.6600%, 3.0683%, 10/5/23(a) | | | 2,700,000 | | | | 2,686,414 | |
Royal Bank of Canada, CDOR USD 3 Month + 1.0800%, 3.0400%, 7/17/24(a) | | | 6,250,000 | | | | 4,767,133 | |
Scentre Group Trust 1, 4.5000%, 9/8/21 | | | 1,400,000 | | | | 1,026,809 | |
Scentre Group Trust 1 / Scentre Group Trust 2, 2.3750%, 11/5/19 (144A) | | | 500,000 | | | | 495,179 | |
Shopping Centres Australasia Property Retail Trust, 3.7500%, 4/20/21 | | | 600,000 | | | | 428,697 | |
Shopping Centres Australasia Property Retail Trust, 3.9000%, 6/7/24 | | | 3,100,000 | | | | 2,173,725 | |
Simon Property Group LP, 2.7500%, 2/1/23 | | | 3,500,000 | | | | 3,372,310 | |
Simon Property Group LP, 2.7500%, 6/1/23 | | | 3,600,000 | | | | 3,460,661 | |
Stockland Trust, 8.2500%, 11/25/20 | | | 1,000,000 | | | | 782,994 | |
Sumitomo Mitsui Financial Group, Inc., ICE LIBOR USD 3 Month + 1.1400%, 3.5896%, 10/19/21(a) | | | 700,000 | | | | 711,957 | |
Sumitomo Mitsui Financial Group, Inc., 2.7840%, 7/12/22 | | | 420,000 | | | | 405,979 | |
Sumitomo Mitsui Financial Group, Inc., ICE LIBOR USD 3 Month + 0.7400%, 3.1846%, 10/18/22(a) | | | 500,000 | | | | 500,335 | |
Sumitomo Mitsui Financial Group, Inc., ICE LIBOR USD 3 Month + 0.8600%, 3.3096%, 7/19/23(a) | | | 4,700,000 | | | | 4,722,290 | |
Suncorp-Metway, Ltd., 2.3750%, 11/9/20 (144A) | | | 3,988,000 | | | | 3,883,207 | |
TD Ameritrade Holding Corp., ICE LIBOR USD 3 Month + 0.4300%, 2.9710%, 11/1/21(a) | | | 6,000,000 | | | | 6,001,020 | |
Toronto-Dominion Bank, 3.0000%, 6/11/20 | | | 2,000,000 | | | | 1,994,001 | |
Toronto-Dominion Bank, 1.8500%, 9/11/20 | | | 360,000 | | | | 351,300 | |
Toronto-Dominion Bank, 2.5000%, 12/14/20 | | | 2,400,000 | | | | 2,363,044 | |
Toronto-Dominion Bank, ICE LIBOR USD 3 Month + 0.6400%, 3.0896%, 7/19/23(a) | | | 4,000,000 | | | | 4,010,380 | |
United Overseas Bank, Ltd., ICE LIBOR USD 3 Month + 0.4800%,
2.9572%, 4/23/21 (144A)(a) | | | 2,500,000 | | | | 2,502,203 | |
United Overseas Bank, Ltd., USD SWAP SEMI 30/360 5YR + 1.9950%, 3.7500%, 9/19/24(a) | | | 3,580,000 | | | | 3,580,537 | |
United Overseas Bank, Ltd., USD SWAP SEMI 30/360 5YR + 1.6540%, 2.8800%, 3/8/27(a) | | | 800,000 | | | | 768,328 | |
United Overseas Bank, Ltd., USD SWAP SEMI 30/360 5YR + 1.6540%, 2.8800%, 3/8/27(a) | | | 500,000 | | | | 480,205 | |
Vicinity Centres Trust, 3.5000%, 4/26/24 | | | 2,320,000 | | | | 1,626,092 | |
Wells Fargo & Co., ICE LIBOR USD 3 Month + 1.0100%, 3.3268%, 12/7/20(a) | | | 1,246,000 | | | | 1,261,589 | |
Wells Fargo & Co., 2.5000%, 3/4/21 | | | 800,000 | | | | 779,661 | |
Wells Fargo & Co., ICE LIBOR USD 3 Month + 0.9300%, 3.2680%, 2/11/22(a) | | | 1,083,000 | | | | 1,091,803 | |
Wells Fargo & Co., 90 Day Australian Bank Bill Rate + 1.1000%, 3.0150%, 4/27/22(a) | | | 3,500,000 | | | | 2,484,742 | |
See Notes to Schedule of Investments and Other Information and Notes to Financial Statements.
| | |
| | Janus Detroit Street Trust ½ 11 |
Janus Henderson Short Duration Income ETF
Schedule of Investments
October 31, 2018
| | | | | | | | |
| | | Principal Amounts | | | Value | |
| Corporate Bonds – (continued) | |
| Financial – (continued) | |
Wells Fargo & Co., ICE LIBOR USD 3 Month + 1.1100%, 3.5974%, 1/24/23(a) | | | $ 850,000 | | | | $ 859,671 | |
Wells Fargo Bank NA, ICE LIBOR USD 3 Month + 0.5000%, 2.9772%, 7/23/21(a) | | | 7,500,000 | | | | 7,505,145 | |
Wells Fargo Bank NA, ICE LIBOR USD 3 Month + 0.5100%, 2.9872%, 10/22/21(a) | | | 3,500,000 | | | | 3,501,561 | |
Westpac Banking Corp., 1.6000%, 8/19/19 | | | 1,050,000 | | | | 1,038,453 | |
Westpac Banking Corp., ICE LIBOR USD 3 Month + 1.0000%, 3.3380%, 5/13/21(a) | | | 200,000 | | | | 203,105 | |
Westpac Banking Corp., ICE LIBOR USD 3 Month + 0.8500%, 3.1723%, 8/19/21(a) | | | 500,000 | | | | 506,663 | |
Westpac Banking Corp., ICE LIBOR USD 3 Month + 0.8500%, 3.2704%, 1/11/22(a) | | | 450,000 | | | | 454,826 | |
Westpac Banking Corp., 90 Day Australian Bank Bill Rate + 1.1100%, 3.0764%, 2/7/22(a) | | | 2,000,000 | | | | 1,432,522 | |
Westpac Banking Corp., ICE LIBOR USD 3 Month + 0.7100%, 3.0961%, 6/28/22(a) | | | 750,000 | | | | 753,871 | |
Westpac Banking Corp., ICE LIBOR USD 3 Month + 0.5700%, 2.9904%, 1/11/23(a) | | | 3,600,000 | | | | 3,586,653 | |
Westpac Banking Corp., 90 Day Australian Bank Bill Rate + 2.0500%, 3.9659%, 3/14/24(a) | | | 300,000 | | | | 213,471 | |
Westpac Banking Corp., 90 Day Australian Bank Bill Rate + 3.1000%, 5.0318%, 3/10/26(a) | | | 1,000,000 | | | | 735,829 | |
Westpac Banking Corp., ICE LIBOR USD 3 Month + 1.8300%, 4.3340%, 8/16/29(a) | | | 9,100,000 | | | | 6,436,692 | |
| | | | | | | | |
| | | | | | | 365,096,895 | |
| Government – 1.3% | |
Airservices Australia, 2.7500%, 5/15/23 | | | 500,000 | | | | 353,155 | |
European Investment Bank, 2.7500%, 8/25/26 | | | 22,800,000 | | | | 5,769,417 | |
Export-Import Bank of Korea, ICE LIBOR USD 3 Month + 0.7000%, 3.0114%, 5/26/19(a) | | | 308,000 | | | | 308,283 | |
International Bank for Reconstruction & Development, 3.5000%, 1/22/21 | | | 3,465,000 | | | | 2,320,880 | |
International Bank for Reconstruction & Development, 3.0000%, 2/2/23 | | | 1,300,000 | | | | 861,534 | |
| | | | | | | | |
| | | | | | | 9,613,269 | |
| Industrial – 2.7% | |
Amcor, Ltd., 4.6250%, 4/16/19 | | | 2,730,000 | | | | 3,157,935 | |
Australia Pacific Airports Melbourne Pty, Ltd., 5.0000%, 6/4/20 | | | 200,000 | | | | 147,006 | |
Australia Pacific Airports Melbourne Pty, Ltd., 3.7500%, 11/4/26 | | | 100,000 | | | | 70,968 | |
Brisbane Airport Corp Pty, Ltd., 6.0000%, 10/21/20 | | | 260,000 | | | | 195,123 | |
Caterpillar Financial Services Corp., ICE LIBOR USD 3 Month + 0.1800%,
2.5028%, 12/6/18(a) | | | 650,000 | | | | 650,064 | |
Caterpillar Financial Services Corp., ICE LIBOR USD 3 Month + 0.2800%,
2.6464%, 3/22/19(a) | | | 600,000 | | | | 600,474 | |
Caterpillar Financial Services Corp., ICE LIBOR USD 3 Month + 0.5100%,
2.9243%, 1/10/20(a) | | | 500,000 | | | | 502,274 | |
Caterpillar Financial Services Corp., 1.8500%, 9/4/20 | | | 1,000,000 | | | | 977,827 | |
Caterpillar Financial Services Corp., ICE LIBOR USD 3 Month + 0.5900%,
2.9128%, 6/6/22(a) | | | 1,800,000 | | | | 1,811,184 | |
Caterpillar Financial Services Corp., ICE LIBOR USD 3 Month + 0.5100%,
2.8238%, 5/15/23(a) | | | 1,200,000 | | | | 1,198,329 | |
New Terminal Financing Co. Pty, Ltd., 90 Day Australian Bank Bill Rate + 1.4500%, 3.3880%, 7/12/24(a) | | | 2,700,000 | | | | 1,926,446 | |
Perth Airport Pty, Ltd., 6.0000%, 7/23/20 | | | 598,000 | | | | 445,919 | |
QPH Finance Co. Pty, Ltd., 5.7500%, 7/29/20 | | | 750,000 | | | | 557,533 | |
QPH Finance Co. Pty, Ltd., 5.0000%, 7/7/21 | | | 150,000 | | | | 111,388 | |
Rockwell Collins, Inc., 3.1000%, 11/15/21 | | | 1,000,000 | | | | 981,453 | |
Sydney Airport Finance Co. Pty, Ltd., 5.1250%, 2/22/21 (144A) | | | 350,000 | | | | 359,108 | |
Sydney Airport Finance Co. Pty, Ltd., 3.9000%, 3/22/23 (144A) | | | 600,000 | | | | 596,472 | |
Trimble, Inc., 4.1500%, 6/15/23 | | | 2,500,000 | | | | 2,491,776 | |
Vulcan Materials Co., ICE LIBOR USD 3 Month + 0.6500%, 2.9708%, 3/1/21(a) | | | 1,700,000 | | | | 1,702,522 | |
WestRock Co., 3.3750%, 9/15/27 (144A) | | | 1,625,000 | | | | 1,490,096 | |
| | | | | | | | |
| | | | | | | 19,973,897 | |
| Technology – 2.4% | |
Apple, Inc., 1.8000%, 5/11/20 | | | 1,000,000 | | | | 981,520 | |
Apple, Inc., 1.5500%, 8/4/21 | | | 1,100,000 | | | | 1,052,414 | |
Apple, Inc., 2.1000%, 9/12/22 | | | 1,400,000 | | | | 1,335,853 | |
Apple, Inc., 2.4000%, 1/13/23 | | | 200,000 | | | | 191,472 | |
Broadcom Corp. / Broadcom Cayman Finance, Ltd., 3.0000%, 1/15/22 | | | 1,165,000 | | | | 1,127,731 | |
Broadcom Corp. / Broadcom Cayman Finance, Ltd., 2.6500%, 1/15/23 | | | 2,100,000 | | | | 1,969,838 | |
IBM Credit LLC, 1.6250%, 9/6/19 | | | 1,285,000 | | | | 1,271,787 | |
See Notes to Schedule of Investments and Other Information and Notes to Financial Statements.
Janus Henderson Short Duration Income ETF
Schedule of Investments
October 31, 2018
| | | | | | | | |
| | | Principal Amounts | | | Value | |
| Corporate Bonds – (continued) | |
| Technology – (continued) | |
IBM Credit LLC, ICE LIBOR USD 3 Month + 0.2600%, 2.7290%, 1/20/21(a) | | | $ 3,300,000 | | | | $ 3,307,671 | |
International Business Machines Corp., 1.9000%, 1/27/20 | | | 500,000 | | | | 492,628 | |
International Business Machines Corp., ICE LIBOR USD 3 Month + 0.2300%, 2.7393%, 1/27/20(a) | | | 350,000 | | | | 350,742 | |
Microchip Technology, Inc., 3.9220%, 6/1/21 (144A) | | | 2,600,000 | | | | 2,581,247 | |
Oracle Corp., 1.9000%, 9/15/21 | | | 3,100,000 | | | | 2,977,230 | |
| | | | | | | | |
| | | | | | | 17,640,133 | |
| Utilities – 6.4% | |
AGL Energy, Ltd., 5.0000%, 11/5/21 | | | 150,000 | | | | 110,987 | |
Ausgrid Finance Pty, Ltd., 3.8500%, 5/1/23 (144A) | | | 4,000,000 | | | | 3,962,254 | |
Ausgrid Finance Pty, Ltd., ICE LIBOR USD 3 Month + 1.2200%, 3.1350%, 10/30/24(a) | | | 11,700,000 | | | | 8,226,159 | |
Ausgrid Finance Pty, Ltd., 3.7500%, 10/30/24 | | | 6,170,000 | | | | 4,377,683 | |
AusNet Services Holdings Pty, Ltd., 5.2500%, 2/14/20 | | | 700,000 | | | | 512,369 | |
Australian Gas Networks Vic 3 Pty, Ltd., 4.5000%, 12/17/21 | | | 350,000 | | | | 256,953 | |
Australian Gas Networks, Ltd., 90 Day Australian Bank Bill Rate + 0.4200%, 2.3561%, 7/1/26(a) | | | 2,500,000 | | | | 1,631,992 | |
Energy Partnership Gas Pty, Ltd., 3.6420%, 12/11/24 | | | 1,000,000 | | | | 704,537 | |
ETSA Utilities Finance Pty, Ltd., ICE LIBOR USD 3 Month + 1.0200%, 2.9750%, 8/29/22(a) | | | 2,000,000 | | | | 1,418,064 | |
ETSA Utilities Finance Pty, Ltd., ICE LIBOR USD 3 Month + 1.0400%, 2.9667%, 12/13/23(a) | | | 500,000 | | | | 354,547 | |
ETSA Utilities Finance Pty, Ltd., 3.5000%, 8/29/24 | | | 4,280,000 | | | | 3,032,709 | |
Korea East-West Power Co., Ltd., 3.8750%, 7/19/23 (144A) | | | 3,000,000 | | | | 2,989,935 | |
Korea Gas Corp., 4.2500%, 11/2/20 | | | 370,000 | | | | 375,613 | |
Korea Gas Corp., 2.7500%, 7/20/22 (144A) | | | 800,000 | | | | 770,549 | |
Korea Hydro & Nuclear Power Co., Ltd., 3.7500%, 7/25/23 (144A) | | | 3,082,000 | | | | 3,056,919 | |
Korea South-East Power Co., Ltd., 5.7500%, 9/25/20 | | | 670,000 | | | | 496,376 | |
Network Finance Co. Pty, Ltd., ICE LIBOR USD 3 Month + 1.2300%, 3.1650%, 12/6/24(a) | | | 10,600,000 | | | | 7,455,156 | |
State Grid Overseas Investment 2016, Ltd., 2.2500%, 5/4/20 (144A) | | | 500,000 | | | | 489,940 | |
State Grid Overseas Investment 2016, Ltd., 2.2500%, 5/4/20 | | | 600,000 | | | | 587,929 | |
United Energy Distribution Pty, Ltd., ICE LIBOR USD 3 Month + 0.9700%,
2.9364%, 2/7/23(a) | | | 3,000,000 | | | | 2,128,816 | |
United Energy Distribution Pty, Ltd., 3.8500%, 10/23/24 | | | 2,370,000 | | | | 1,701,622 | |
Victoria Power Networks Finance Pty, Ltd., 4.0000%, 8/18/27 | | | 2,500,000 | | | | 1,763,345 | |
| | | | | | | | |
| | | | | | | | 46,404,454 | |
Total Corporate Bonds (cost $661,292,333) | | | | | | | 647,685,629 | |
| Mortgage-Backed Securities – 1.0% | |
Caesars Palace Las Vegas Trust 2017-VICI, 4.3540%, 10/15/34 (144A)(a) | | | 941,000 | | | | 921,183 | |
Resimac MBS Trust, ICE LIBOR USD 3 Month + 0.8000%, 3.0841%, 11/10/49 (144A)(a) | | | 2,475,171 | | | | 2,464,699 | |
RESIMAC Premier Series 2017-1, ICE LIBOR USD 1 Month + 0.9500%, 3.2371%, 9/11/48 (144A)(a) | | | 4,117,784 | | | | 4,116,116 | |
Total Mortgage-Backed Securities (cost $7,498,810) | | | | | | | 7,501,998 | |
| Investment Companies – 0.1% | |
| Money Markets – 0.1% | |
State Street Institutional U.S. Government Money Market Fund, 2.0900%¥ | | | 881,651 | | | | 881,651 | |
| Commercial Paper – 13.0% | |
AutoNation, Inc., 2.7000%, 11/2/18 (Section 4(2)) | | | 7,000,000 | | | | 6,998,948 | |
CNPC Finance, Ltd., 2.4659%, 11/8/18 (Section 4(2)) | | | 7,000,000 | | | | 6,996,279 | |
Cox Enterprises, Inc., 2.2733%, 11/6/18 (Section 4(2)) | | | 7,000,000 | | | | 6,997,195 | |
Dominion Resources, Inc., 2.1511%, 11/1/18 (Section 4(2)) | | | 7,000,000 | | | | 6,999,539 | |
Enable Midstream Partners LP, 2.8001%, 11/1/18 (Section 4(2)) | | | 9,000,000 | | | | 8,999,325 | |
Enbridge Energy Partners LP, 2.5500%, 11/6/18 (Section 4(2)) | | | 7,000,000 | | | | 6,997,195 | |
General Motors Financial Co., Inc., 2.4267%, 11/1/18 (Section 4(2)) | | | 7,000,000 | | | | 6,999,480 | |
HP, Inc., 2.2733%, 11/5/18 (Section 4(2)) | | | 7,000,000 | | | | 6,997,837 | |
Hyundai Capital America, 1.8857%, 11/9/18 (Section 4(2)) | | | 7,500,000 | | | | 7,495,457 | |
See Notes to Schedule of Investments and Other Information and Notes to Financial Statements.
| | |
| | Janus Detroit Street Trust ½ 13 |
Janus Henderson Short Duration Income ETF
Schedule of Investments
October 31, 2018
| | | | | | | | |
| | | Principal Amounts | | | Value | |
| Investment Companies – (continued) | |
| Commercial Paper – (continued) | |
Mohawk Industries, Inc., 2.2471%, 11/7/18 (Section 4(2)) | | | $ 7,000,000 | | | | $ 6,996,720 | |
Mondelez International, Inc., 2.3000%, 11/5/18 (Section 4(2)) | | | 7,000,000 | | | | 6,997,669 | |
Pentair Finance Sarl, 2.9000%, 11/1/18 (Section 4(2)) | | | 8,000,000 | | | | 7,999,400 | |
VM Credit, Inc., 2.3700%, 11/13/18 (Section 4(2)) | | | 7,500,000 | | | | 7,493,370 | |
Total Commercial Paper (cost $94,974,452) | | | | | | | 94,968,414 | |
Total Investments (total cost $764,647,246) – 102.8% | | | | | | | 751,037,692 | |
Liabilities, net of Cash, Receivables and Other Assets – (2.8%) | | | | | | | (20,492,344) | |
Net Assets — 100% | | | | | | | $730,545,348 | |
Summary of Investments by Country – (Long Positions) (unaudited)
| | | | | | | | |
| Country | | Value | | | % of
Investment
Securities | |
United States | | | $405,111,234 | | | | 54.0 | % |
Australia | | | 191,527,154 | | | | 25.5 | |
Canada | | | 33,318,763 | | | | 4.4 | |
Singapore | | | 20,343,368 | | | | 2.7 | |
China | | | 14,127,817 | | | | 1.9 | |
Netherlands | | | 13,714,480 | | | | 1.8 | |
South Korea | | | 13,533,014 | | | | 1.8 | |
Cayman Islands | | | 11,631,895 | | | | 1.6 | |
New Zealand | | | 9,933,735 | | | | 1.3 | |
Japan | | | 7,442,761 | | | | 1.0 | |
Hong Kong | | | 6,996,279 | | | | 0.9 | |
Germany | | | 6,785,090 | | | | 0.9 | |
Luxembourg | | | 5,886,887 | | | | 0.8 | |
Finland | | | 5,584,397 | | | | 0.7 | |
United Kingdom | | | 4,512,889 | | | | 0.6 | |
British Virgin Islands | | | 587,929 | | | | 0.1 | |
Total | | | $751,037,692 | | | | 100.0 | % |
Schedule of Foreign Currency Contracts, Open
| | | | | | | | | | | | | | | | |
Counterparty/
Foreign Currency | | Settlement Date | | | Foreign Currency
Amount Sold
(Purchased) | | | USD Currency
Amount Sold/
(Purchased) | | | Market Value
and Unrealized
Appreciation
(Depreciation) | |
Bank of America N.A.: | |
Euro | | | 12/11/18 | | | | 3,140,000 | | | | $(3,614,646) | | | | $45,078 | |
Euro | | | 1/02/19 | | | | 11,575,000 | | | | (13,179,469) | | | | (12,437) | |
| | | | | | | | | | | | | | | | 32,641 | |
Barclays Bank PLC: | |
Polish Zloty | | | 12/11/18 | | | | 22,250,000 | | | | (5,935,866) | | | | 122,390 | |
State Street Bank and Trust: | |
Australian Dollar | | | 12/11/18 | | | | 2,000,000 | | | | (1,420,240) | | | | 2,132 | |
Australian Dollar | | | 12/11/18 | | | | 178,300,000 | | | | (126,315,030) | | | | (109,272) | |
Canadian Dollar | | | 12/11/18 | | | | 7,670,000 | | | | (5,855,985) | | | | 11,072 | |
| | | | | | | | | | | | | | | | (96,068) | |
Westpac Banking Corp.: | |
New Zealand Dollar | | | 12/11/18 | | | | 4,900,000 | | | | (3,212,205) | | | | 11,211 | |
Total | | | | $(159,533,441) | | | | $70,174 | |
See Notes to Schedule of Investments and Other Information and Notes to Financial Statements.
Janus Henderson Short Duration Income ETF
Schedule of Investments
October 31, 2018
Schedule of Futures
| | | | | | | | | | | | | | | | | | | | |
| Description | | Number of Contracts | | | Expiration
Date | | | Value and Notional
Amount | | | Unrealized
Appreciation/
(Depreciation) | | | Variation Margin
Asset/(Liability) | |
Futures Bought: | |
3-Year Australian Bond | | | 603 | | | | 12/17/18 | | | | $47,625,189 | | | | $69,100 | | | | $20,487 | |
Futures Sold: | |
10-Year U.S. Treasury Note | | | 150 | | | | 12/19/18 | | | | 17,765,625 | | | | 231,791 | | | | 68,720 | |
5-Year U.S. Treasury Note | | | 1,136 | | | | 12/31/18 | | | | 127,666,876 | | | | 620,694 | | | | 184,015 | |
| | | | | | | | | | | | | | | | 852,485 | | | | 252,735 | |
Total | | | | | | | | | | | | | | | $921,585 | | | | $273,222 | |
Schedule of Centrally Cleared Interest Rate Swaps
| | | | | | | | | | | | | | | | | | | | | | | | | | | | |
| Payments made by Fund | | Payments received
by Fund | | | Payment
Frequency | | | Maturity
Date | | | Notional
Amount | | | Premiums
Paid/ (Received) | | | Unrealized
Appreciation/
(Depreciation) | | | Asset
(Liability)
Variation
Margin | |
3 Month LIBOR | | | 2.8295% Fixed | | | | Quarterly | | | | 7/12/20 | | | | 68,439,000 USD | | | | $ — | | | | $257,146 | | | | $(1,942) | |
3 Month LIBOR | | | 2.5800% Fixed | | | | Quarterly | | | | 8/28/22 | | | | 130,000,000 NZD | | | | — | | | | 68,573 | | | | (1,935) | |
2.9764% Fixed | | | 3 Month LIBOR | | | | Quarterly | | | | 7/12/28 | | | | 15,168,000 USD | | | | — | | | | 209,834 | | | | (430) | |
Total | | | | | | | | | | | | | | | $ — | | | | $535,553 | | | | $(4,307) | |
The following table, grouped by derivative type, provides information about the fair value and location of derivatives within the Statement of Assets and Liabilities as of October 31, 2018.
Fair Value of Derivative Instruments (not accounted for as hedging instruments) as of October 31, 2018
| | | | | | | | | | | | |
| | | Interest Rate
Contracts | | | Currency Contracts | | | Total | |
Asset Derivatives: | | | | | | | | | | | | |
Forward foreign currency exchange contracts | | | $— | | | | $191,883 | | | | $191,883 | |
Variation margin receivable | | | 273,222 | | | | — | | | | 273,222 | |
Total Asset Derivatives | | | $273,222 | | | | $191,883 | | | | $465,105 | |
Liability Derivatives: | | | | | | | | | | | | |
Forward foreign currency exchange contracts | | | $— | | | | $121,709 | | | | $121,709 | |
Variation margin payable | | | 4,307 | | | | — | | | | 4,307 | |
Total Liability Derivatives | | | $4,307 | | | | $121,709 | | | | $126,016 | |
The following tables provide information about the effect of derivatives and hedging activities on the Fund’s Statement of Operations for the period ended October 31, 2018.
The effect of Derivative Instruments (not accounted for as hedging instruments) on the Statement of Operations for the period ended October 31, 2018
| | | | | | | | | | | | | | | | |
Amount of Realized Gain/(Loss) Recognized on Derivatives | |
| Derivative | | Credit
Contracts | | | Interest Rate
Contracts | | | Currency
Contracts | | | Total | |
Forward foreign currency exchange contracts | | | $— | | | | $— | | | | $9,329,428 | | | | $9,329,428 | |
Futures contracts | | | — | | | | 1,128,295 | | | | — | | | | 1,128,295 | |
Swap contracts | | | (413,897) | | | | (208,544) | | | | — | | | | (622,441) | |
| Written Swaption contracts | | | — | | | | 128,367 | | | | — | | | | 128,367 | |
Total | | | $(413,897) | | | | $1,048,118 | | | | $9,329,428 | | | | $9,963,649 | |
See Notes to Schedule of Investments and Other Information and Notes to Financial Statements.
| | |
| | Janus Detroit Street Trust ½ 15 |
Janus Henderson Short Duration Income ETF
Schedule of Investments
October 31, 2018
| | | | | | | | | | | | | | | | |
Amount of Change in Unrealized Appreciation/(Depreciation) Recognized on Derivatives | |
| Derivative | | Credit
Contracts | | | Interest Rate
Contracts | | | Currency
Contracts | | | Total | |
Forward foreign currency exchange contracts | | | $— | | | | $— | | | | $(593,020) | | | | $(593,020) | |
Futures contracts | | | — | | | | 708,681 | | | | — | | | | 708,681 | |
Swap contracts | | | (891) | | | | 535,553 | | | | — | | | | 534,662 | |
Total | | | $(891) | | | | $1,244,234 | | | | $(593,020) | | | | $650,323 | |
Please see the “Net realized and change in unrealized gain/ (loss) on investments” sections of the Fund’s Statement of Operations.
Average ending Monthly Market Value of Derivative Instruments During the Period Ended October 31, 2018
| | | | |
| Derivative | | Market Value | |
Forward foreign currency exchange contracts, purchased(a) | | | $2,075,052 | |
Forward foreign currency exchange contracts, sold(a) | | | 100,892,826 | |
Futures contracts, purchased | | | 4,694,719 | |
Futures contracts, sold | | | 74,147,531 | |
Credit default swaps, long | | | (291,458) | |
Interest rate swaps, long | | | 52,031 | |
| (a) | Forward foreign currency exchange contracts are reported as the average ending monthly currency amount purchased or sold. |
See Notes to Schedule of Investments and Other Information and Notes to Financial Statements.
Janus Henderson Short Duration Income ETF
Notes to Schedule of Investments and Other Information
October 31, 2018
| | |
FTSE 3-Month
U.S. Treasury
Bill Index | | FTSE 3-Month U.S. Treasury Bill Index tracks the performance of short-term U.S. government debt securities. |
| |
| CDOR | | Canadian Dollar Offered Rate |
| |
| ICE | | Intercontinental Exchange |
| |
| LIBOR | | LIBOR (London Interbank Offered Rate) is a short-term interest rate that banks offer one another and generally represents current cash rates. |
| |
| LLC | | Limited Liability Company |
| |
| LP | | Limited Partnership |
| |
| PLC | | Public Limited Company |
| |
| ¥ | | Rate reflects 7 day yield as of October 31, 2018. |
| |
| Section 4(2) | | Securities subject to legal and/or contractual restrictions on resale and may not be publicly sold without registration under the Securities Act of 1933, as amended. The total value of Section 4(2) securities as of the period ended October 31, 2018 is $94,968,414, which represents 13.0% of net assets. |
| |
| 144A | | Securities sold under Rule 144A of the Securities Act of 1933, as amended, are subject to legal and/or contractual restrictions on resale and may not be publicly sold without registration under the 1993 Act. Unless otherwise noted, these securities have been determined to be liquid under guidelines established by the Board of Trustees. The total value of 144A securities as of the year ended October 31, 2018 is 138,219,606 which represents 18.9% of net assets. |
| |
| (a) | | Variable or floating rate security. Rate shown is the current rate as of October 31, 2018. Certain variable rate securities are not based on a published reference rate and spread; they are determined by the issuer or agent and current market conditions. Reference rate is as of reset date and may vary by security, which may not indicate a reference rate and/or spread in their description. |
The following is a summary of the inputs that were used to value the Fund’s investments in securities and other financial instruments as of October 31, 2018. See Notes to Financial Statements for more information.
Valuation Inputs Summary
| | | | | | | | | | | | |
| | | Level 1 -
Quoted Prices | | | Level 2 -
Other Significant
Observable Inputs | | | Level 3 -
Significant
Unobservable Inputs | |
Assets | | | | | | | | | | | | |
Investments in Securities: | | | | | | | | | | | | |
Corporate Bonds | | $ | — | | | $ | 647,685,629 | | | $ | — | |
Mortgage-Backed Securities | | | — | | | | 7,501,998 | | | | — | |
Investment Companies | | | 881,651 | | | | — | | | | — | |
Commercial Paper | | | — | | | | 94,968,414 | | | | — | |
| | | | |
Total Investments in Securities | | $ | 881,651 | | | $ | 750,156,041 | | | $ | — | |
| | | | |
Other Financial Instruments(a): | | | | | | | | | | | | |
Forward Currency Contracts | | $ | — | | | $ | 191,883 | | | | — | |
Variation Margin Receivable | | | 273,222 | | | | — | | | | — | |
| | | | |
Total Other Financial Instruments | | $ | 273,222 | | | $ | 191,883 | | | $ | — | |
| | | | |
Total Assets | | $ | 1,154,873 | | | $ | 750,347,924 | | | $ | — | |
| | | | |
Liabilities | | | | | | | | | | | | |
Other Financial Instruments(a): | | | | | | | | | | | | |
Forward Currency Contracts | | $ | — | | | $ | 121,709 | | | $ | — | |
Variation Margin Payable | | | — | | | | 4,307 | | | | — | |
| | | | |
Total Liabilities | | $ | — | | | $ | 126,016 | | | $ | — | |
| (a) | Other financial instruments include forward currency, futures, and swap contracts. Forward currency contracts are reported at their unrealized appreciation/(depreciation) at measurement date, which represents the change in the contract’s value from trade date. Futures and centrally cleared swap contracts are reported at their variation margin at measurement date, which represents the amount due to/from the Fund at that date. |
| | |
| | Janus Detroit Street Trust ½ 17 |
Janus Henderson Short Duration Income ETF
Statement of Assets and Liabilities
October 31, 2018
| | | | |
Assets: | | | | |
Investments, at value(1) | | $ | 751,037,692 | |
Cash | | | 9,013,654 | |
Cash denominated in foreign currency(2) | | | 303,995 | |
Forward foreign currency exchange contracts | | | 191,883 | |
Due from broker for futures | | | 1,370,022 | |
Due from broker for centrally cleared swaps | | | 1,038,200 | |
Receivable for variation margin on future contracts | | | 273,222 | |
Receivables: | | | | |
Investments sold | | | 9,947 | |
Dividends | | | 1,805 | |
Interest | | | 3,780,343 | |
Total Assets | | | 767,020,763 | |
Liabilities: | | | | |
Payable for variation margin on swaps contracts | | | 4,307 | |
Forward foreign currency exchange contracts | | | 121,709 | |
Payables: | | | | |
Investments purchased | | | 36,151,193 | |
Management fees | | | 198,206 | |
Total Liabilities | | | 36,475,415 | |
Net Assets | | $ | 730,545,348 | |
Net Assets Consists of: | | | | |
Capital (par value and paid-in surplus) | | $ | 731,321,525 | |
Total distributable earnings (loss) | | | (776,177) | |
Total Net Assets | | $ | 730,545,348 | |
Net Assets | | $ | 730,545,348 | |
Shares outstanding, $0.001 Par Value (unlimited shares authorized) | | | 14,600,001 | |
Net Asset Value Per Share | | $ | 50.04 | |
| (1) | Includes cost of $764,647,246 |
| (2) | Includes cost of $301,864 |
See Notes to Financial Statements.
Janus Henderson Short Duration Income ETF
Statement of Operations
For the year ended October 31, 2018
| | | | |
Investment Income: | | | | |
Dividends | | $ | 5,113 | |
Interest | | | 11,622,975 | |
Foreign tax withheld | | | (1,754) | |
Total Investment Income | | | 11,626,334 | |
Expenses: | | | | |
Management Fees | | | 1,423,490 | |
Total Expenses | | | 1,423,490 | |
Net Investment Income/(Loss) | | | 10,202,844 | |
Net Realized Gain/(Loss) on Investments: | | | | |
Investments and foreign currency transactions | | | 770,266 | |
Forward foreign currency exchange contracts | | | 9,329,428 | |
Futures contracts | | | 1,128,295 | |
Written swaption contracts | | | 128,367 | |
Swap contracts | | | (622,441) | |
Total Net Realized Gain/(Loss) on Investments | | | 10,733,915 | |
Change in Unrealized Net Appreciation/Depreciation: | | | | |
Investments and foreign currency translations | | | (13,417,834) | |
Forward foreign currency exchange contracts | | | (593,020) | |
Futures contracts | | | 708,681 | |
Swap contracts | | | 534,662 | |
Total Change in Unrealized Net Appreciation/Depreciation | | | (12,767,511) | |
Net Increase/(Decrease) in Net Assets Resulting from Operations | | $ | 8,169,248 | |
See Notes to Financial Statements.
| | |
| | Janus Detroit Street Trust ½ 19 |
Janus Henderson Short Duration Income ETF
Statements of Changes in Net Assets
| | | | | | | | |
| | | Year ended
October 31, 2018 | | | Period ended
October 31, 2017(1) | |
Operations: | | | | | | | | |
Net investment income/(loss) | | $ | 10,202,844 | | | $ | 1,089,371 | |
Net realized gain/(loss) on investments | | | 10,733,915 | | | | (414,483) | |
Change in unrealized net appreciation/depreciation | | | (12,767,511) | | | | 684,222 | |
Net Increase/(Decrease) in Net Assets Resulting from Operations | | | 8,169,248 | | | | 1,359,110 | |
Dividends and Distributions to Shareholders: | | | | | | | | |
Dividends and Distributions | | | (9,471,243) | | | | N/A | |
Dividends from Net Investment Income(2) | | | N/A | | | | (833,292) | |
Net Decrease from Dividends and Distributions to Shareholders | | | (9,471,243) | | | | (833,292) | |
Capital Share Transactions | | | 575,763,154 | | | | 155,558,371 | |
Net Increase/(Decrease) in Net Assets | | | 574,461,159 | | | | 156,084,189 | |
Net Assets: | | | | | | | | |
Beginning of period | | | 156,084,189 | | | | — | |
End of period(3) | | $ | 730,545,348 | | | $ | 156,084,189 | |
| (1) | Period from November 16, 2016 (commencement of operations) through October 31, 2017. |
| (2) | The requirement to disclose dividends and distributions paid to shareholders from net investment income and/or net realized gain from investment transactions was eliminated by the U.S. Securities and Exchange Commission (“SEC”) in 2018. |
| (3) | Net assets – End of period includes undistributed (over distributed) net investment income of $666,239 as of October 31, 2017. The requirement to disclose undistributed (over distributed) net investment income was eliminated by the SEC in 2018. |
See Notes to Financial Statements.
Janus Henderson Short Duration Income ETF
Financial Highlights
| | | | | | | | | | |
| For a share outstanding during each year or period ended October 31 | | 2018 | | | 2017(1) | |
| | Net Asset Value, Beginning of Period | | | $50.35 | | | | $50.00 | |
| | Income/(Loss) from Investment Operations: | | | | | | | | |
| | Net investment income/(loss)(2) | | | 1.25 | | | | 0.82 | |
| | Net realized and unrealized gain/(loss) | | | (0.33) | | | | 0.11 | |
| | Total from Investment Operations | | | 0.92 | | | | 0.93 | |
| | Less Dividends and Distributions: | | | | | | | | |
| | Dividends (from net investment income) | | | (1.23) | | | | (0.58) | |
| | Total Dividends and Distributions | | | (1.23) | | | | (0.58) | |
| | Net Asset Value, End of Period | | | $50.04 | | | | $50.35 | |
| | Total Return* | | | 1.86% | | | | 1.87% | |
| | Net assets, End of Year (in thousands) | | | $730,545 | | | | $156,084 | |
| | Average Net Assets for the Period (in thousands) | | | $406,711 | | | | $66,131 | |
| | Ratios to Average Net Assets**: | | | | | | | | |
| | Ratio of Gross Expenses | | | 0.35% | | | | 0.35% | |
| | Ratio of Net Investment Income/(Loss) | | | 2.51% | | | | 1.71% | |
| | Portfolio Turnover Rate(3) | | | 22% | | | | 44% | |
| * | Total return not annualized for periods of less than one full year. |
| ** | Annualized for periods of less than one full year. |
| (1) | Period from November 16, 2016 (commencement of operations) through October 31, 2017. |
| (2) | Per share amounts are calculated based on average shares outstanding during the year or period. |
| (3) | Portfolio turnover rate excludes securities received or delivered from in-kind processing of creation or redemptions. |
See Notes to Financial Statements.
| | |
| | Janus Detroit Street Trust ½ 21 |
Janus Henderson Short Duration Income ETF
Notes to Financial Statements
1. Organization and Significant Accounting Policies
Janus Henderson Short Duration Income ETF (the “Fund”) is a series fund. The Fund is part of Janus Detroit Street Trust (the “Trust”), which is organized as a Delaware statutory trust and is registered under the Investment Company Act of 1940, as amended (the “1940 Act”), as an open-end management investment company, and therefore has applied the specialized accounting and reporting guidance in Financial Accounting Standards Board (“FASB”) Accounting Standards Codification (“ASC”) Topic 946. The Trust offers seven Funds each of which represent shares of beneficial interest in a separate portfolio of securities and other assets with its own objective and policies. The Fund seeks to provide a steady income stream with capital preservation across various market cycles. The Fund is classified as diversified, as defined in the 1940 Act.
The Fund is an actively-managed exchange-traded fund. Unlike shares of traditional mutual funds, shares of the Fund are not individually redeemable and may only be purchased or redeemed directly from the Fund at net asset value (“NAV”) in large increments called “Creation Units” (25,000 shares per Creation Unit) through certain participants, known as “Authorized Participants.” The Fund will issue or redeem Creation Units in exchange for portfolio securities and/or cash. Except when aggregated in Creation Units, Fund shares are not redeemable securities of the Fund. Shares of the Fund are listed and trade on NYSE Arca, Inc. (“NYSE Arca”), and individual investors can purchase or sell shares in much smaller increments for cash in the secondary market through a broker. These transactions, which do not involve the Fund, are made at market prices that may vary throughout the day and differ from the Fund’s NAV. As a result, you may pay more than NAV (a premium) when you purchase shares, and receive less than NAV (a discount) when you sell shares, in the secondary market.
An Authorized Participant may hold of record more than 25% of the outstanding shares of the Fund. From time to time, Authorized Participants may be a beneficial and/or legal owner of the Fund, may be affiliated with an index provider, may be deemed to have control of the Fund and/or may be able to affect the outcome of matters presented for a vote of the shareholders of the Fund. Authorized Participants may execute an irrevocable proxy granting the Distributor or an affiliate of Janus Capital Management LLC (“Janus Capital” or “Janus”) power to vote or abstain from voting such Authorized Participant’s beneficially or legally owned shares of the Fund. In such cases, the agent shall mirror vote (or abstain from voting) such shares in the same proportion as all other beneficial owners of the Fund.
The following accounting policies have been followed by the Fund and are in conformity with accounting principles generally accepted in the United States of America.
Investment Valuation
Securities held by the Fund are valued in accordance with policies and procedures established by and under the supervision of the Trustees (the “Valuation Procedures”). Equity securities, including shares of exchange-traded funds, traded on a domestic securities exchange are generally valued at the closing prices on the primary market or exchange on which they trade. If such price is lacking for the trading period immediately preceding the time of determination, such securities are valued at their current bid price. Equity securities that are traded on a foreign exchange are generally valued at the closing prices on such markets. In the event that there is no current trading volume on a particular security in such foreign exchange, the bid price from the primary exchange is generally used to value the security. Securities that are traded on the over-the-counter (“OTC”) markets are generally valued at their closing or latest bid prices as available. Foreign securities and currencies are converted to U.S. dollars using the applicable exchange rate in effect at the close of the New York Stock Exchange (“NYSE”). The Fund will determine the market value of individual securities held by it by using prices provided by one or more approved professional pricing services or, as needed, by obtaining market quotations from independent broker-dealers. Most debt securities are valued in accordance with the evaluated bid price supplied by the pricing service that is intended to reflect market value. The evaluated bid price supplied by the pricing service is an evaluation that may consider factors such as security prices, yields, maturities and ratings. Certain short-term securities maturing within 60 days or less may be evaluated and valued on an amortized cost basis provided that the amortized cost determined approximates market value. Securities for which market quotations or evaluated prices are not readily available or are deemed by Janus Capital to be unreliable are valued at fair value determined in good faith under the Valuation Procedures. Circumstances in which fair value pricing may be utilized include, but are not limited to: (i) a significant event that may affect the securities of a single issuer, such as a merger, bankruptcy, or significant issuer-specific development; (ii) an event that may affect an entire market, such as a natural disaster or significant governmental action; (iii) a nonsignificant event such as a market closing early or not opening, or a security trading halt; and (iv) pricing of a nonvalued security and a restricted or nonpublic security. Special valuation considerations may apply with respect to “odd-lot” fixed-income transactions which, due to their small size, may receive evaluated prices by pricing services which reflect a large block trade and not what actually could be obtained for the odd-lot position.
Janus Henderson Short Duration Income ETF
Notes to Financial Statements
Valuation Inputs Summary
FASB ASC 820, Fair Value Measurements and Disclosures (“ASC 820”), defines fair value, establishes a framework for measuring fair value, and expands disclosure requirements regarding fair value measurements. This standard emphasizes that fair value is a market-based measurement that should be determined based on the assumptions that market participants would use in pricing an asset or liability and establishes a hierarchy that prioritizes inputs to valuation techniques used to measure fair value. These inputs are summarized into three broad levels:
Level 1 – Unadjusted quoted prices in active markets the Fund has the ability to access for identical assets or liabilities.
Level 2 – Observable inputs other than unadjusted quoted prices included in Level 1 that are observable for the asset or liability either directly or indirectly. These inputs may include quoted prices for the identical instrument on an inactive market, prices for similar instruments, interest rates, prepayment speeds, credit risk, yield curves, default rates and similar data.
Assets or liabilities categorized as Level 2 in the hierarchy generally include: debt securities fair valued in accordance with the evaluated bid or ask prices supplied by a pricing service; securities traded on OTC markets and listed securities for which no sales are reported that are fair valued at the latest bid price (or yield equivalent thereof) obtained from one or more dealers transacting in a market for such securities or by a pricing service approved by the Fund’s Trustees; and certain short-term debt securities with maturities of 60 days or less that are fair valued at amortized cost. Other securities that may be categorized as Level 2 in the hierarchy include, but are not limited to, preferred stocks, bank loans, swaps, investments in unregistered investment companies, options, and forward contracts.
Level 3 – Unobservable inputs for the asset or liability to the extent that relevant observable inputs are not available, representing the Fund’s own assumptions about the assumptions that a market participant would use in valuing the asset or liability, and that would be based on the best information available.
There have been no significant changes in valuation techniques used in valuing any such positions held by the Fund since the beginning of the fiscal year.
The inputs or methodology used for fair valuing securities are not necessarily an indication of the risk associated with investing in those securities. The summary of inputs used as of October 31, 2018 to fair value the Fund’s investments in securities and other financial instruments is included in the “Valuation Inputs Summary” in the Notes to Schedule of Investments and Other Information.
There were no transfers between Level 1, Level 2 and Level 3 of the fair value hierarchy during the period. The Fund recognizes transfers between the levels as of the beginning of the fiscal year.
Investment Transactions and Investment Income
Investment transactions are accounted for as of the date purchased or sold (trade date). Dividend income is recorded on the ex-dividend date. Certain dividends from foreign securities will be recorded as soon as the Fund is informed of the dividend, if such information is obtained subsequent to the ex-dividend date. Dividends from foreign securities may be subject to withholding taxes in foreign jurisdictions. Interest income is recorded on the accrual basis and includes amortization of premiums and accretion of discounts. Gains and losses are determined on the identified cost basis, which is the same basis used for federal income tax purposes.
Estimates
The preparation of financial statements in conformity with accounting principles generally accepted in the United States of America requires management to make estimates and assumptions that affect the reported amount of assets and liabilities and disclosure of contingent assets and liabilities at the date of the financial statements and the reported amounts of income and expenses during the reporting period. Actual results could differ from those estimates.
Indemnifications
In the normal course of business, the Fund may enter into contracts that contain provisions for indemnification of other parties against certain potential liabilities. The Fund’s maximum exposure under these arrangements is unknown, and would involve future claims that may be made against the Fund that have not yet occurred. Currently, the risk of material loss from such claims is considered remote.
Foreign Currency Translations
The Fund does not isolate that portion of the results of operations resulting from the effect of changes in foreign exchange rates on investments from the fluctuations arising from changes in market prices of securities held at the date
| | |
| | Janus Detroit Street Trust ½ 23 |
Janus Henderson Short Duration Income ETF
Notes to Financial Statements
of the financial statements. Net unrealized appreciation or depreciation of investments and foreign currency translations arise from changes in the value of assets and liabilities, including investments in securities held at the date of the financial statements, resulting from changes in the exchange rates and changes in market prices of securities held.
Currency gains and losses are also calculated on payables and receivables that are denominated in foreign currencies. The payables and receivables are generally related to foreign security transactions and income translations.
Foreign currency-denominated assets and forward currency contracts may involve more risks than domestic transactions, including currency risk, counterparty risk, political and economic risk, regulatory risk and equity risk. Risks may arise from unanticipated movements in the value of foreign currencies relative to the U.S. dollar.
Dividends and Distributions
Dividends from net investment income are generally declared and distributed monthly. Net realized capital gains (if any) are distributed annually. The Fund may treat a portion of the amount paid to redeem shares as a distribution of investment company taxable income and realized capital gains that are reflected in the NAV. This practice, commonly referred to as “equalization,” has no effect on the redeeming shareholder or a Fund’s total return, but may reduce the amounts that would otherwise be required to be paid as taxable dividends to the remaining shareholders. It is possible that the Internal Revenue Service (IRS) could challenge the Fund’s equalization methodology or calculations, and any such challenge could result in additional tax, interest, or penalties to be paid by the Fund.
Federal Income Taxes
The Fund intends to continue to qualify as a regulated investment company and distribute all of its taxable income in accordance with the requirements of Subchapter M of the Internal Revenue Code. Management has analyzed the Fund’s tax positions taken for all open federal income tax years, generally a three-year period, and has concluded that no provision for federal income tax is required in the Fund’s financial statements. The Fund is not aware of any tax positions for which it is reasonably possible that the total amounts of unrecognized tax benefits will significantly change in the next twelve months.
On December 22, 2017, the Tax Cuts and Jobs Act was signed into law. Currently, Management does not believe the bill will have a material impact on the Fund’s intention to continue to qualify as a regulated investment company, which is generally not subject to U.S. federal income tax.
2. Derivative Instruments
The Fund may invest in various types of derivatives. A derivative is a financial instrument whose performance is derived from the performance of another asset. The Fund may invest in derivative instruments including, but not limited to: futures contracts, options, and swaps. Each derivative instrument that was held by the Fund during the year ended October 31, 2018 is discussed in further detail below.
The Fund may use derivative instruments for risk various investment purposes, such as to manage or hedge portfolio risk, including interest rate risk, or to manage duration. The Fund’s use of derivative instruments involves risks different from, or possibly greater than, the risks associated with investing directly in securities and other traditional investments. Derivatives are subject to a number of risks including liquidity risk, market risk, credit risk, default risk, counterparty risk and management risk. They also involve the risk of mispricing or improper valuation and the risk that changes in the value of the derivative may not correlate exactly with the change in the value of the underlying asset, rate or index. Also, suitable derivative transactions may not be available in all circumstances and there can be no assurance that the Fund will engage in these transactions to reduce exposure to other risks when that would be beneficial. The Fund’s ability to use derivatives may also be limited by certain regulatory and tax considerations.
In pursuit of its investment objective, the Fund may seek to use derivatives to increase or decrease exposure to the following market risk factors:
| • | | Counterparty Risk – the risk that the counterparty (the party on the other side of the transaction) on a derivative transaction will be unable to honor its financial obligation to the Fund. |
| • | | Credit Risk – the risk an issuer will be unable to make principal and interest payments when due, or will default on its obligations. |
| • | | Equity Risk – the risk related to the change in value of equity securities as they relate to increases or decreases in the general market. |
Janus Henderson Short Duration Income ETF
Notes to Financial Statements
| • | | Index Risk – if the derivative is linked to the performance of an index, it will be subject to the risks associated with changes in that index. If the index changes, the Fund could receive lower interest payments or experience a reduction in the value of the derivative to below what the Fund paid. Certain indexed securities, including inverse securities (which move in an opposite direction to the index), may create leverage, to the extent that they increase or decrease in value at a rate that is a multiple of the changes in the applicable index. |
| • | | Interest Rate Risk – the risk that the value of fixed-income securities will generally decline as prevailing interest rates rise, which may cause the Fund’s NAV to likewise decrease. |
| • | | Liquidity Risk – the risk that certain securities may be difficult or impossible to sell at the time that the seller would like or at the price that the seller believes the security is currently worth. |
Derivatives may generally be traded OTC or on an exchange. Derivatives traded OTC are agreements that are individually negotiated between parties and can be tailored to meet a purchaser’s needs. OTC derivatives are not guaranteed by a clearing agency and may be subject to increased credit risk.
In an effort to mitigate credit risk associated with derivatives traded OTC, the Fund may enter into collateral agreements with certain counterparties whereby, subject to certain minimum exposure requirements, the Fund may require the counterparty to post collateral if the Fund has a net aggregate unrealized gain on all OTC derivative contracts with a particular counterparty. Additionally, the Fund may deposit cash and/or treasuries as collateral with the counterparty and/ or custodian daily (based on the daily valuation of the financial asset) if the Fund has a net aggregate unrealized loss on OTC derivative contracts with a particular counterparty. All liquid securities and restricted cash are considered to cover in an amount at all times equal to or greater than the Fund’s commitment with respect to certain exchange-traded derivatives, centrally cleared derivatives, forward foreign currency exchange contracts, short sales, and/or securities with extended settlement dates. There is no guarantee that counterparty exposure is reduced and these arrangements are dependent on Janus Capital’s ability to establish and maintain appropriate systems and trading.
Forward Foreign Currency Exchange Contracts
A forward foreign currency exchange contract (“forward currency contract”) is an obligation to buy or sell a specified currency at a future date at a negotiated rate (which may be U.S. dollars or a foreign currency). The Fund may enter into forward currency contracts for hedging purposes, including, but not limited to, reducing exposure to changes in foreign currency exchange rates on foreign portfolio holdings and locking in the U.S. dollar cost of firm purchase and sale commitments for securities denominated in or exposed to foreign currencies. The Fund may also invest in forward currency contracts for nonhedging purposes such as seeking to enhance returns. The Fund is subject to currency risk and counterparty risk in the normal course of pursuing its investment objective through its investments in forward currency contracts.
Forward currency contracts are valued by converting the foreign value to U.S. dollars by using the current spot U.S. dollar exchange rate and/or forward rate for that currency. Exchange and forward rates as of the close of the NYSE shall be used to value the forward currency contracts. The unrealized appreciation/(depreciation) for forward currency contracts is reported in the Statement of Assets and Liabilities as a receivable or payable (if applicable) and in the Statement of Operations for the change in unrealized net appreciation/depreciation (if applicable). The gain or loss arising from the difference between the U.S. dollar cost of the original contract and the value of the foreign currency in U.S. dollars upon closing a forward currency contract is reported on the Statement of Operations (if applicable).
During the year, the Fund entered into forward currency contracts with the obligation to purchase foreign currencies in the future at an agreed upon rate in order to take a positive outlook on the related currency. These forward contracts seek to increase exposure to currency risk.
During the year, the Fund entered into forward currency contracts with the obligation to purchase foreign currencies in the future at an agreed upon rate in order to decrease exposure to currency risk associated with foreign currency denominated securities held by the Fund.
During the year, the Fund entered into forward contracts with the obligation to sell foreign currencies in the future at an agreed upon rate in order to take a negative outlook on the related currency. These forward contracts seek to increase exposure to currency risk.
During the year, the Fund entered into forward currency contracts with the obligation to sell foreign currencies in the future at an agreed upon rate in order to decrease exposure to currency risk associated with foreign currency denominated securities held by the Fund.
| | |
| | Janus Detroit Street Trust ½ 25 |
Janus Henderson Short Duration Income ETF
Notes to Financial Statements
Futures Contracts
A futures contract is an exchange-traded agreement to take or make delivery of an underlying asset at a specific time in the future for a specific predetermined negotiated price. The Fund may enter into futures contracts to gain exposure to the stock market or other markets pending investment of cash balances or to meet liquidity needs. The Fund is subject to interest rate risk, equity risk, and currency risk in the normal course of pursuing its investment objective through its investments in futures contracts. The Fund may also use such derivative instruments to hedge or protect from adverse movements in securities prices, currency rates or interest rates. The use of futures contracts may involve risks such as the possibility of illiquid markets or imperfect correlation between the values of the contracts and the underlying securities, or that the counterparty will fail to perform its obligations.
Futures contracts on commodities are valued at the settlement price on valuation date on the commodities exchange as reported by an approved vendor. Mini contracts, as defined in the description of the contract, shall be valued using the Actual Settlement Price or “ASET” price type as reported by an approved vendor. Futures contracts are marked-to-market daily, and the daily variation margin is recorded as a receivable or payable on the Statement of Assets and Liabilities (if applicable). The change in unrealized net appreciation/depreciation is reported on the Statement of Operations (if applicable). When a contract is closed, a realized gain or loss is reported on the Statement of Operations (if applicable), equal to the difference between the opening and closing value of the contract.
Securities held by the Fund that are designated as collateral for market value on futures contracts are noted on the Schedule of Investments (if applicable). Such collateral is in the possession of the Fund’s futures option merchant.
With futures, there is minimal counterparty credit risk to the Fund since futures are exchange-traded and the exchange’s clearinghouse, as counterparty to all exchange-traded futures, guarantees the futures against default.
During the year, the Fund purchased interest rate futures to increase exposure to interest rate risk.
During the year, the Fund sold interest rate futures to decrease exposure to interest rate risk.
Swaps
Swap agreements are two-party contracts entered into primarily by institutional investors for periods ranging from a day to more than one year to exchange one set of cash flows for another. The most significant factor in the performance of swap agreements is the change in value of the specific index, security, or currency, or other factors that determine the amounts of payments due to and from the Fund. The use of swaps is a highly specialized activity which involves investment techniques and risks different from those associated with ordinary portfolio securities transactions. Swap agreements entail the risk that a party will default on its payment obligations to the Fund. If the other party to a swap defaults, the Fund would risk the loss of the net amount of the payments that it contractually is entitled to receive. If the Fund utilizes a swap at the wrong time or judges market conditions incorrectly, the swap may result in a loss to the Fund and reduce the Fund’s total return.
Swap agreements also bear the risk that the Fund will not be able to meet its obligation to the counterparty. Swap agreements are typically privately negotiated and entered into in the OTC market. However, certain swap agreements are required to be cleared through a clearinghouse and traded on an exchange or swap execution facility. Swaps that are required to be cleared are required to post initial and variation margins in accordance with the exchange requirements. Regulations enacted require the Fund to centrally clear certain interest rate and credit default index swaps through a clearinghouse or central counterparty (“CCP”). To clear a swap with a CCP, the Fund will submit the swap to, and post collateral with, a futures clearing merchant (“FCM”) that is a clearinghouse member.
Index swaps, interest rate swaps, and credit default swaps are valued using an approved vendor supplied price. Basket swaps are valued using a broker supplied price. Equity swaps that consist of a single underlying equity are valued either at the closing price, the latest bid price, or the last sale price on the primary market or exchange it trades. The market value of swap contracts are aggregated by positive and negative values and are disclosed separately as an asset or liability on the Fund’s Statement of Assets and Liabilities (if applicable). Realized gains and losses are reported on the Statement of Operations (if applicable). The change in unrealized net appreciation or depreciation during the period is included in the Statement of Operations (if applicable).
The Fund’s maximum risk of loss from counterparty risk or credit risk is the discounted value of the payments to be received from/paid to the counterparty over the contract’s remaining life, to the extent that the amount is positive. The risk is mitigated by having a netting arrangement between the Fund and the counterparty and by the posting of collateral by the counterparty to cover the Fund’s exposure to the counterparty.
Janus Henderson Short Duration Income ETF
Notes to Financial Statements
The Fund may enter into various types of credit default swap agreements, including OTC credit default swap agreements and index credit default swaps (“CDX”), for investment purposes and to add leverage to its portfolio. Credit default swaps are a specific kind of counterparty agreement that allow the transfer of third party credit risk from one party to the other. One party in the swap is a lender and faces credit risk from a third party, and the counterparty in the credit default swap agrees to insure this risk in exchange for regular periodic payments. Credit default swaps could result in losses if the Fund does not correctly evaluate the creditworthiness of the company or companies on which the credit default swap is based. Credit default swap agreements may involve greater risks than if the Fund had invested in the reference obligation directly since, in addition to risks relating to the reference obligation, credit default swaps are subject to illiquidity risk, counterparty risk, and credit risk. The Fund will generally incur a greater degree of risk when it sells a credit default swap than when it purchases a credit default swap.
As a buyer of a credit default swap, the Fund may lose its investment and recover nothing should no credit event occur and the swap is held to its termination date. As seller of a credit default swap, if a credit event were to occur, the value of any deliverable obligation received by the Fund, coupled with the upfront or periodic payments previously received, may be less than what it pays to the buyer, resulting in a loss of value to the Fund.
If the Fund is the seller of credit protection against a particular security, the Fund would receive an up-front or periodic payment to compensate against potential credit events. As the seller in a credit default swap contract, the Fund would be required to pay the par value (the “notional value”) (or other agreed-upon value) of a referenced debt obligation to the counterparty in the event of a default by a third party, such as a U.S. or foreign corporate issuer, on the debt obligation. In return, the Fund would receive from the counterparty a periodic stream of payments over the term of the contract provided that no event of default has occurred. If no default occurs, the Fund would keep the stream of payments and would have no payment obligations. As the seller, the Fund would effectively add leverage to its portfolio because, in addition to its total net assets, the Fund would be subject to investment exposure on the notional value of the swap. The maximum potential amount of future payments (undiscounted) that the Fund as a seller could be required to make in a credit default transaction would be the notional amount of the agreement.
As a buyer of credit protection, the Fund is entitled to receive the par (or other agreed-upon) value of a referenced debt obligation from the counterparty to the contract in the event of a default or other credit event by a third party, such as a U.S. or foreign issuer, on the debt obligation. In return, the Fund as buyer would pay to the counterparty a periodic stream of payments over the term of the contract provided that no credit event has occurred. If no credit event occurs, the Fund would have spent the stream of payments and potentially received no benefit from the contract.
The Fund may invest in single-name credit default swaps (“CDS”) to buy or sell credit protection to hedge its credit exposure, gain issuer exposure without owning the underlying security, or increase the Fund’s total return. Single-name CDS enable the Fund to buy or sell protection against a credit event of a specific issuer. When the Fund buys a single-name CDS, the Fund will receive a return on its investment only in the event of a credit event, such as default by the issuer of the underlying obligation (as opposed to a credit downgrade or other indication of financial difficulty). If a single-name CDS transaction is particularly large, or if the relevant market is illiquid, it may not be possible for the Fund to initiate a single-name CDS transaction or to liquidate its position at an advantageous time or price, which may result in significant losses. Moreover, the Fund bears the risk of loss of the amount expected to be received under a single-name CDS in the event of the default or bankruptcy of the counterparty. The risks associated with cleared single-name CDS may be lower than that for uncleared single-name CDS because for cleared single-name CDS, the counterparty is a clearinghouse (to the extent such a trading market is available). However, there can be no assurance that a clearinghouse or its members will satisfy their obligations to the Fund.
During the year, the Fund sold protection via the credit default swap market in order to gain credit risk exposure to individual corporates, countries and/or credit indices where gaining this exposure via the cash bond market was less attractive.
The Fund’s use of interest rate swaps involves investment techniques and risks different from those associated with ordinary portfolio security transactions. Interest rate swaps do not involve the delivery of securities, other underlying assets, or principal. Interest rate swaps involve the exchange by two parties of their respective commitments to pay or receive interest (e.g., an exchange of floating rate payments for fixed rate payments). Interest rate swaps may result in potential losses if interest rates do not move as expected or if the counterparties are unable to satisfy their obligations. Interest rate swaps are generally entered into on a net basis. Accordingly, the risk of loss with respect to interest rate swaps is limited to the net amount of interest payments that the Fund is contractually obligated to make.
| | |
| | Janus Detroit Street Trust ½ 27 |
Janus Henderson Short Duration Income ETF
Notes to Financial Statements
During the year, the Fund entered into interest rate swaps paying a fixed interest rate and receiving a floating interest rate in order to increase interest rate risk (duration) exposure. As interest rates rise, the Fund benefits by receiving a higher future floating rate, while paying a fixed rate that has not decreased.
3. Other Investments and Strategies
Additional Investment Risk
The Fund may be invested in lower-rated debt securities that have a higher risk of default or loss of value since these securities may be sensitive to economic changes, political changes, or adverse developments specific to the issuer.
The financial crisis in both the U.S. and global economies over the past several years has resulted, and may continue to result, in a significant decline in the value and liquidity of many securities of issuers worldwide in the equity and fixed income/credit markets. In response to the crisis, the United States and certain foreign governments, along with the U.S. Federal Reserve and certain foreign central banks, took steps to support the financial markets. The withdrawal of this support, a failure of measures put in place to respond to the crisis, or investor perception that such efforts were not sufficient could each negatively affect financial markets generally, and the value and liquidity of specific securities. In addition, policy and legislative changes in the United States and in other countries continue to impact many aspects of financial regulation. The effect of these changes on the markets, and the practical implications for market participants, including the Fund, may not be fully known for some time. As a result, it may also be unusually difficult to identify both investment risks and opportunities, which could limit or preclude the Fund’s ability to achieve its investment objective. Therefore, it is important to understand that the value of your investment may fall, sometimes sharply, and you could lose money.
The enactment of the Dodd-Frank Wall Street Reform and Consumer Protection Act (the “Dodd-Frank Act”) provided for widespread regulation of financial institutions, consumer financial products and services, broker-dealers, OTC derivatives, investment advisers, credit rating agencies, and mortgage lending, which expanded federal oversight in the financial sector, including the investment management industry. Certain provisions of the Dodd-Frank Act remain pending and will be implemented through future rulemaking. Therefore, the ultimate impact of the Dodd-Frank Act and the regulations under the Dodd-Frank Act on the Fund and the investment management industry as a whole, is not yet certain.
A number of countries in the European Union (“EU”) have experienced, and may continue to experience, severe economic and financial difficulties. In particular, many EU nations are susceptible to economic risks associated with high levels of debt, notably due to investments in sovereign debt of countries such as Greece, Italy, Spain, Portugal, and Ireland. Many non-governmental issuers, and even certain governments, have defaulted on, or been forced to restructure, their debts. Many other issuers have faced difficulties obtaining credit or refinancing existing obligations. Financial institutions have in many cases required government or central bank support, have needed to raise capital, and/or have been impaired in their ability to extend credit. As a result, financial markets in the EU experienced extreme volatility and declines in asset values and liquidity. Responses to these financial problems by European governments, central banks, and others, including austerity measures and reforms, may not work, may result in social unrest, and may limit future growth and economic recovery or have other unintended consequences. Further defaults or restructurings by governments and others of their debt could have additional adverse effects on economies, financial markets, and asset valuations around the world. Greece, Ireland, and Portugal have already received one or more “bailouts” from other Eurozone member states, and it is unclear how much additional funding they will require or if additional Eurozone member states will require bailouts in the future. The risk of investing in securities in the European markets may also be heightened due to the referendum in which the United Kingdom voted to exit the EU (known as “Brexit”). One or more other countries may also abandon the euro and/or withdraw from the EU, placing its currency and banking system in jeopardy.
Certain areas of the world have historically been prone to and economically sensitive to environmental events such as, but not limited to, hurricanes, earthquakes, typhoons, flooding, tidal waves, tsunamis, erupting volcanoes, wildfires or droughts, tornadoes, mudslides, or other weather-related phenomena. Such disasters, and the resulting physical or economic damage, could have a severe and negative impact on the Fund’s investment portfolio and, in the longer term, could impair the ability of issuers in which the Fund invests to conduct their businesses as they would under normal conditions. Adverse weather conditions may also have a particularly significant negative effect on issuers in the agricultural sector and on insurance companies that insure against the impact of natural disasters.
Counterparties
Fund transactions involving a counterparty are subject to the risk that the counterparty or a third party will not fulfill its obligation to the Fund (“counterparty risk”). Counterparty risk may arise because of the counterparty’s financial condition (i.e., financial difficulties, bankruptcy, or insolvency), market activities and developments, or other reasons, whether foreseen or not. A counterparty’s inability to fulfill its obligation may result in significant financial loss to the Fund. The Fund may be unable to recover its investment from the counterparty or may obtain a limited recovery, and/or recovery
Janus Henderson Short Duration Income ETF
Notes to Financial Statements
may be delayed. The extent of the Fund’s exposure to counterparty risk with respect to financial assets and liabilities approximates its carrying value. See the “Offsetting Assets and Liabilities” section of this Note for further details.
The Fund may be exposed to counterparty risk through participation in various programs, including, but not limited to, lending its securities to third parties, cash sweep arrangements whereby the Fund’s cash balance is invested in one or more types of cash management vehicles, as well as investments in, but not limited to, repurchase agreements, and derivatives, including various types of swaps, futures and options. The Fund intends to enter into financial transactions with counterparties that Janus Capital believes to be creditworthy at the time of the transaction. There is always the risk that Janus Capital’s analysis of a counterparty’s creditworthiness is incorrect or may change due to market conditions. To the extent that the Fund focuses its transactions with a limited number of counterparties, it will have greater exposure to the risks associated with one or more counterparties.
Mortgage and Asset-Backed Securities
The Fund purchases fixed or variable rate commercial or residential mortgage-backed securities issued by the Government National Mortgage Association (“Ginnie Mae”), the Federal National Mortgage Association (“Fannie Mae”), the Federal Home Loan Mortgage Corporation (“Freddie Mac”), or other governmental or government-related entities. Ginnie Mae’s guarantees are backed by the full faith and credit of the U.S. Government. Historically, Fannie Mae and Freddie Mac securities were not backed by the full faith and credit of the U.S. Government. In September 2008, the Federal Housing Finance Agency (“FHFA”), an agency of the U.S. Government, placed Fannie Mae and Freddie Mac under conservatorship. Since that time, Fannie Mae and Freddie Mac have received capital support through U.S. Treasury preferred stock purchases, and Treasury and Federal Reserve purchases of their mortgage-backed securities. The FHFA and the U.S. Treasury have imposed strict limits on the size of these entities’ mortgage portfolios. The FHFA has the power to cancel any contract entered into by Fannie Mae and Freddie Mac prior to FHFA’s appointment as conservator or receiver, including the guarantee obligations of Fannie Mae and Freddie Mac.
Asset-backed securities may be backed by various consumer obligations, including automobile loans, equipment leases, credit card receivables, or other collateral. In the event the underlying loans are not paid, the securities’ issuer could be forced to sell the assets and recognize losses on such assets, which could impact your return.
Unlike traditional debt instruments, payments on mortgage-backed and other asset-backed securities include both interest and a partial payment of principal. Prepayment of the principal of underlying loans at a faster pace than expected is known as “prepayment risk,” and may shorten the effective maturities of these securities. This may result in the Fund having to reinvest proceeds at a lower interest rate. Mortgage and asset-backed securities tend to be more sensitive to changes in interest rates than other types of debt securities. In addition to prepayment risk, investments in mortgage-backed securities, particularly those comprised of subprime mortgages, and investments in other asset-backed securities comprised of under-performing assets may be subject to a higher degree of credit risk, valuation risk, and liquidity risk than other mortgage- and asset-backed securities. Mortgage and asset-backed securities are also subject to extension risk, which is the risk that rising interest rates could cause mortgages or other obligations underlying these securities to be paid more slowly than expected, increasing the Fund’s sensitivity to interest rate changes and causing its price to decline.
When-Issued and Delayed Delivery Securities
The Fund may purchase or sell securities on a when-issued or delayed delivery basis. When-issued and delayed delivery securities in which the Fund may invest include U.S. Treasury Securities, municipal bonds, bank loans, and other similar instruments. The price of the underlying securities and date when the securities will be delivered and paid for are fixed at the time the transaction is negotiated. Losses may arise due to changes in the market value of the securities or from the inability of counterparties to meet the terms of the contract. In connection with such purchases, the Fund may hold liquid assets as collateral with the Fund’s custodian sufficient to cover the purchase price.
Offsetting Assets and Liabilities
The Fund presents gross and net information about transactions that are either offset in the financial statements or subject to an enforceable master netting arrangement or similar agreement with a designated counterparty, regardless of whether the transactions are actually offset in the Statement of Assets and Liabilities.
In order to better define its contractual rights and to secure rights that will help the Fund mitigate its counterparty risk, the Fund may enter into an International Swaps and Derivatives Association, Inc. Master Agreement (“ISDA Master Agreement”) or similar agreement with its derivative contract counterparties. An ISDA Master Agreement is a bilateral agreement between the Fund and a counterparty that governs OTC derivatives and forward foreign currency exchange contracts and typically contains, among other things, collateral posting terms and netting provisions in the event of a default and/or termination event. Under an ISDA Master Agreement, in the event of a default and/or termination event,
| | |
| | Janus Detroit Street Trust ½ 29 |
Janus Henderson Short Duration Income ETF
Notes to Financial Statements
the Fund may offset with each counterparty certain derivative financial instruments’ payables and/or receivables with collateral held and/or posted and create one single net payment. For financial reporting purposes, the Fund does not offset financial instruments’ payables and receivables and related collateral on the Statement of Assets and Liabilities.
The following tables present gross amounts of recognized assets and/or liabilities and the net amounts after deducting collateral that has been pledged by counterparties or has been pledged to counterparties (if applicable). For corresponding information grouped by type of instrument, see either the “Fair Value of Derivative Instruments as of October 31, 2018” table located in the Fund’s Schedule of Investments.
Offsetting of Financial Assets and Derivative Assets
| | | | | | | | | | | | | | | | |
| Counterparty | | Gross Amounts
of Recognized
Assets | | | Offsetting Asset or
Liability(a) | | | Collateral
Pledged(b) | | | Net Amount | |
| Bank of America N.A. | | $ | 45,078 | | | $ | (12,437) | | | $ | — | | | $ | 32,641 | |
| Barclays Bank PLC | | | 122,390 | | | | — | | | | — | | | | 122,390 | |
| State Street Bank and Trust | | | 13,204 | | | | (13,204) | | | | — | | | | — | |
| Westpac Banking Corp | | | 11,211 | | | | — | | | | — | | | | 11,211 | |
| | | $ | 191,883 | | | | (25,641) | | | $ | — | | | $ | 166,242 | |
Offsetting of Financial Liabilities and Derivative Liabilities
| | | | | | | | | | | | | | | | |
| Counterparty | | Gross Amounts
of Recognized
Liabilities | | | Offsetting Asset or
Liability(a) | | | Collateral
Pledged(b) | | | Net Amount | |
| Bank of America N.A. | | $ | 12,437 | | | $ | (12,437) | | | $ | — | | | $ | — | |
| State Street Bank and Trust | | | 109,272 | | | | (13,204) | | | | — | | | | 96,068 | |
| | | $ | 121,709 | | | $ | (25,641) | | | $ | — | | | $ | 96,068 | |
| (a) | Represents the amount of assets or liabilities that could be offset with the same counterparty under master netting or similar agreements that management elects not to offset on the Statement of Assets and Liabilities. |
| (b) | Collateral pledged is limited to the net outstanding amount due to/from an individual counterparty. The actual collateral amounts pledged may exceed these amounts and may fluctuate in value. |
The Fund generally does not exchange collateral on its forward currency contracts with its counterparties; however, all liquid securities and restricted cash are considered to cover in an amount at all times equal to or greater than the Fund’s commitment with respect to these contracts. Certain securities may be segregated at the Fund’s custodian. These segregated securities are denoted on the accompanying Schedule of Investments and are evaluated daily to ensure their cover and/or market value equals or exceeds the Fund’s corresponding forward foreign currency exchange contract’s obligation value.
The Fund may require the counterparty to pledge securities as collateral daily (based on the daily valuation of the financial asset) if the Fund has a net aggregate unrealized gain on OTC derivative contracts with a particular counterparty. The Fund may deposit cash as collateral with the counterparty and/or custodian daily (based on the daily valuation of the financial asset) if the Fund has a net aggregate unrealized loss on OTC derivative contracts with a particular counterparty. The collateral amounts are subject to minimum exposure requirements and initial margin requirements. Collateral amounts are monitored and subsequently adjusted up or down as valuations fluctuate by at least the minimum exposure requirement. Collateral may reduce the risk of loss.
4. Investment Advisory Agreements and Other Transactions with Affiliates
Under its unitary fee structure, the Fund pays Janus Capital a management fee in return for providing certain investment advisory, supervisory, and administrative services to the Fund, including the costs of transfer agency, custody, fund administration, legal, audit, and other services. Janus Capital’s fee structure is designed to pay substantially all of the Fund’s expenses. However, the Fund bears other expenses which are not covered under the management fee which may vary and affect the total level of expenses paid by shareholders, such as distribution fees (if any), brokerage expenses or commissions, interest, dividends, taxes, litigation expenses, acquired fund fees and expenses (if any), and extraordinary expenses. The Fund’s management fee is calculated daily and paid monthly. For the fiscal year ended October 31, 2018, the Fund’s contractual management fee rate (expressed as an annual rate) was 0.35% of the Fund’s average daily net assets.
Janus Henderson Short Duration Income ETF
Notes to Financial Statements
State Street Bank and Trust Company (“State Street”) provides certain fund administration services to the Fund, including services related to the Fund’s accounting, including calculating the daily NAV, audit, tax, and reporting obligations, pursuant to an agreement with Janus Capital, on behalf of the Fund. As compensation for such services, Janus Capital pays State Street a fee based on a percentage of the Fund’s assets, with a minimum flat fee, for certain services. Janus Capital serves as administrator to the Fund, providing oversight and coordination of the Fund’s service providers, recordkeeping and other administrative services. Janus Capital does not receive any additional compensation, beyond the unitary fee, for serving as administrator. State Street also serves as transfer agent for the shares of the Fund.
Due to an administrative oversight by its administrator, the Fund’s Distribution and Servicing Plan, pursuant to Rule 12b-1 under the 1940 Act that was originally approved at the time of the Fund’s formation (“Initial Rule 12b-1 Plan”), could be viewed to have expired on or about February 11, 2017. The Initial Rule 12b-1 Plan was never implemented, and 12b-1 fees were not charged, prior to its potential expiration. At an in-person meeting held on July 18, 2018, the Fund’s Board of Trustees (“Board”) approved a new Rule 12b-1 Plan (the “Plan”) with respect to the Fund, with terms that are substantively identical to the Initial Rule 12b-1 Plan. Because the Fund has commenced operations, the Plan must also be approved by the Fund’s shareholders prior to implementation. At this time, Janus Capital does not intend to seek shareholder approval for implementation of the Plan. The Plan would permit compensation in connection with the distribution and marketing of Fund shares and/or the provision of certain shareholder services. The Plan would permit the Fund to pay ALPS Distributors, Inc. (the “Distributor”) or its designee, a fee for the sale and distribution and/or shareholder servicing of the shares at an annual rate of up to 0.25% of average daily net assets of the Fund. Under the terms of the Plan, the Trust would be authorized to make payments to the Distributor or its designee for remittance to retirement plan service providers, broker-dealers, bank trust departments, financial advisors, and other financial intermediaries, as compensation for distribution and/or shareholder services performed by such entities for their customers who are investors in the Fund. However, implementation of the Plan and imposition of the 12b-1 fee would require prior approval by Fund shareholders via proxy vote. Janus Capital does not anticipate seeking such approval at this time. Because 12b-1 fees are paid out of the fund assets on an ongoing basis, to the extent that such a fee is authorized by shareholders in the future, over time they will increase the cost of an investment in the Fund. If implemented, the Plan fee may cost an investor more than other types of sales charges.
As of October 31, 2018, Janus Capital owned 1 share or less than 0.0% of the Fund.
The Fund is permitted to purchase or sell securities (“cross-trade”) between itself and other funds or accounts managed by Janus Capital in accordance with Rule 17a-7 under the Investment Company Act of 1940 (“Rule 17a-7”), when the transaction is consistent with the investment objectives and policies of the Fund and in accordance with the Internal Cross Trade Procedures adopted by the Trust’s Board of Trustees. These procedures have been designed to ensure that any cross-trade of securities by the Fund from or to another fund or account that is or could be considered an affiliate of the Fund under certain limited circumstances by virtue of having a common investment adviser, common Officer, or common Trustee complies with Rule 17a-7. Under these procedures, each cross-trade is effected at the current market price to save costs where allowed. During the year ended October 31, 2018, the Fund engaged in cross trades amounting to $66,768,756 in purchases and $3,649,018 in sales, resulting in a net realized loss of $14,437. The net realized loss is included within the “Net Realized Gain/(Loss) on Investments” section of the Fund’s Statement of Operations.
5. Federal Income Tax
The tax components of capital shown in the table below represent: (1) distribution requirements the Fund must satisfy under the income tax regulations; (2) losses or deductions the Fund may be able to offset against income and gains realized in future years; and (3) unrealized appreciation or depreciation of investments for federal income tax purposes.
Other book to tax differences primarily consist of derivatives, and foreign currency contract adjustments. The Fund has elected to treat gains and losses on forward foreign currency contracts as capital gains and losses, if applicable. Other foreign currency gains and losses on debt instruments are treated as ordinary income for federal income tax purposes pursuant to Section 988 of the Internal Revenue Code.
| | | | | | | | | | | | | | | | | | | | | | | | | | |
| | | | | | | | | | Loss Deferrals | | | | | | | |
Undistributed
Ordinary Income | | | Undistributed
Long-Term Gains | | | Accumulated
Capital Losses | | | Late-Year
Ordinary Loss | | | Post-October
Capital Loss | | | Other Book
to Tax Differences | | | Net Tax
Appreciation/ (Depreciation) | |
| $ | 5,863,088 | | | $ | 6,744,542 | | | $ | — | | | $ | — | | | $ | — | | | $ | (1,048) | | | $ | (13,382,759) | |
| | |
| | Janus Detroit Street Trust ½ 31 |
Janus Henderson Short Duration Income ETF
Notes to Financial Statements
The aggregate cost of investments and the composition of unrealized appreciation and depreciation of investment securities for federal income tax purposes as of October 31, 2018 are noted below. The primary difference between book and tax appreciation or depreciation of investments is wash sale loss deferrals.
| | | | | | | | | | | | | | |
| Federal Tax Cost | | | Unrealized Appreciation | | | Unrealized (Depreciation) | | | Net Tax
Appreciation/
(Depreciation) | |
| $ | 764,647,246 | | | $ | 422,774 | | | $ | (14,032,328) | | | $ | (13,609,554) | |
Information on the tax components of derivatives as of October 31, 2018 is as follows:
| | | | | | | | | | | | | | |
| Federal Tax Cost | | | Unrealized Appreciation | | | Unrealized (Depreciation) | | | Net Tax
Appreciation/
(Depreciation) | |
| $ | 1,458,212 | | | $ | 69,100 | | | $ | — | | | $ | 69,100 | |
Income and capital gains distributions are determined in accordance with income tax regulations that may differ from accounting principles generally accepted in the United States of America. These differences are due to differing treatments for items such as net short-term gains, deferral of wash sale losses, foreign currency transactions, passive foreign investment companies, net investment losses, in-kind transactions and capital loss carryovers. Certain permanent differences such as tax returns of capital and net investment losses noted below have been reclassified to capital.
| | | | | | | | | | | | | | |
| For the year ended October 31, 2018: | |
| Distributions | | | | |
| From Ordinary Income | | | From Long-Term Capital Gain | | | Tax Return of Capital | | | Net Investment Loss | |
| $ | 9,471,243 | | | $ | — | | | $ | — | | | $ | — | |
|
| For the year ended October 31, 2017: | |
| Distributions | | | | |
| From Ordinary Income | | | From Long-Term Capital Gain | | | Tax Return of Capital | | | Net Investment Loss | |
| $ | 816,802 | | | $ | 16,490 | | | $ | — | | | $ | — | |
Permanent book to tax basis differences may result in reclassifications between the components of net assets. These differences have no impact on the results of operations or net assets. The following reclassifications have been made to the Fund:
| | | | | | | | | | |
| Increase/(Decrease) to Capital | | | Increase/(Decrease) to Undistributed
Net Investment Income/Loss | | | Increase/(Decrease) to Undistributed
Net realized Gain/Loss | |
| $ | — | | | $ | 46,878 | | | $ | (46,878) | |
6. Capital Share Transactions
| | | | | | | | | | | | | | | | |
| | | Year ended October 31, 2018 | | | Year ended October 31, 2017(1) | |
| | | Shares | | | Amount | | | Shares | | | Amount | |
| Shares sold | | | 11,500,000 | | | $ | 575,763,154 | | | | 3,100,001 | | | $ | 155,558,371 | |
| Shares repurchased | | | — | | | | ��� | | | | — | | | | — | |
Net Increase/(Decrease) | | | 11,500,000 | | | $ | 575,763,154 | | | | 3,100,001 | | | $ | 155,558,371 | |
| (1) | Period from November 16, 2016 (commencement of operations) through October 31, 2017. |
Janus Henderson Short Duration Income ETF
Notes to Financial Statements
7. Purchases and Sales of Investment Securities
For the year ended October 31, 2018, the aggregate cost of purchases and proceeds from sales of investment securities (excluding any short-term securities, short-term options contracts, and in-kind transactions) was as follows:
| | | | | | | | | | | | | | |
Purchases of Securities | | | Proceeds from Sales of Securities | | | Purchases of Long- Term U.S. Government Obligations | | | Proceeds from Sales of Long-Term U.S. Government Obligations | |
| $ | 585,137,337 | | | $ | 77,782,205 | | | $ | — | | | $ | — | |
8. Recent Accounting Pronouncements
The Securities and Exchange Commission adopted amendments to Regulation S-X, for the presentation of distributable earnings and distributions to align with US Generally Accepted Accounting Principles (GAAP). The compliance date of the amendments to Regulation S-X is November 5, 2018. This report incorporates the amendments to Regulation S-X.
The FASB issued Accounting Standards Update 2018-13, Fair Value Measurement (Topic 820) in August 2018. The new guidance removes, modifies and enhances the disclosures to Topic 820. For public entities, the amendments are effective for financial statements issued for fiscal years beginning after December 15, 2019, and interim periods within those fiscal years. Management is currently evaluating the impact of this new guidance on the financial statements.
The FASB issued Accounting Standards Update No. 2017-08, Receivables – Nonrefundable Fees and Other Costs (Subtopic 310-20), Premium Amortization on Purchased Callable Debt Securities (“ASU 2017-08”) to amend the amortization period for certain purchased callable debt securities held at a premium. The guidance requires certain premiums on callable debt securities to be amortized to the earliest call date. The amortization period for callable debt securities purchased at a discount will not be impacted. The amendments are effective for fiscal years, and interim periods within those fiscal years, beginning after December 15, 2018. Early adoption is permitted, including adoption in an interim period. Management is currently evaluating the impacts of ASU 2017-08 on the Fund’s financial statements.
9. Subsequent Events
Management has evaluated whether any events or transactions occurred subsequent to October 31, 2018 and through the date of issuance of the Fund’s financial statements and determined that there were no material events or transactions that would require recognition or disclosure in the Fund’s financial statements other than the following:
At an in-person meeting held on October 10, 2018, the Board approved an amendment to the Fund’s Investment Advisory and Management Agreement, which provides for a new management fee rate schedule that reduces the annual management fee rate payable by the Fund to Janus Capital as the Fund’s assets grow. The new annual management fee rate is effective November 1, 2018 and is provided below.
| | | | |
New Management Fee Rate (As a Percentage of Daily Net Assets) | |
| $0-$500 million | | | 0.35% | |
| Next $500 million | | | 0.28% | |
| Over $1 billion | | | 0.20% | |
| | |
| | Janus Detroit Street Trust ½ 33 |
Janus Henderson Short Duration Income ETF
Additional Information (unaudited)
Proxy Voting Policies and Voting Record
A description of the policies and procedures that the Fund uses to determine how to vote proxies relating to its portfolio securities is available without charge: (i) upon request, by calling 1-800-525-0020 (toll free); (ii) on the Fund’s website at janushenderson.com/proxyvoting; and (iii) on the SEC’s website at http://www.sec.gov.
Quarterly Portfolio Holdings
The Fund files its complete portfolio holdings (schedule of investments) with the SEC for the first and third quarters of each fiscal year on Form N-Q within 60 days of the end of such fiscal quarter. The Fund’s Form N-Q: (i) is available on the SEC’s website at http://www.sec.gov; (ii) may be reviewed and copied at the SEC’s Public Reference Room in Washington, D.C. (information on the Public Reference Room may be obtained by calling 1-800-SEC-0330); and (iii) is available without charge, upon request, by calling Janus Henderson at 1-800-525-0020 (toll free).
Janus Henderson Short Duration Income ETF
Board Considerations Regarding Approval of Investment Advisory Agreements (unaudited)
APPROVAL OF AMENDMENT TO INVESTMENT ADVISORY AGREEMENT
At an in-person meeting held on October 9-10, 2018, the Trustees, including the Independent Trustees, unanimously approved an amendment to the Fund’s Investment Advisory and Management Agreement (“Amendment”). The Amendment provided for a new management fee rate schedule that reduces the annual management fee rate payable by the Fund to Janus Capital as the Fund’s assets grow. The new unitary fee rate schedule (expressed as an annual rate) is as follows:
| | | | |
| Daily Net Assets | | | |
| $0-$500 million | | | 0.35% | |
| Next $500 million | | | 0.28% | |
| Over $1 billion | | | 0.20% | |
In connection with the Amendment approval, Janus Capital represented to the Trustees that there would be no change to the nature, quality and extent of services rendered by [Janus Capital] to the Fund. The Amendment is effective as of November 1, 2018.
| | |
| | Janus Detroit Street Trust ½ 35 |
Janus Henderson Short Duration Income ETF
Trustees and Officers (unaudited)
The Fund’s Statement of Additional Information includes additional information about the Trustees and officers and is available, without charge, by calling 1-877-335-2687.
The following are the Trustees and officers of the Trust, together with a brief description of their principal occupations during the last five years (principal occupations for certain Trustees may include periods over five years).
Each Trustee has served in that capacity since he or she was originally elected or appointed. The Trustees do not serve a specified term of office. Each Trustee will hold office until the termination of the Trust or his or her earlier death, resignation, retirement, incapacity, or removal. Under the Fund’s Governance Procedures and Guidelines, the policy is for Trustees to retire no later than the end of the calendar year in which the Trustee turns 75. The Trustees review the Fund’s Governance Procedures and Guidelines from time to time and may make changes they deem appropriate. The Fund’s Nominating and Governance Committee will consider nominees for the position of Trustee recommended by shareholders. Shareholders may submit the name of a candidate for consideration by the Committee by submitting their recommendations to the Trust’s Secretary. Each Trustee is currently a Trustee of one other registered investment company advised by Janus Capital: Clayton Series Trust. Collectively, these two registered investment companies consist of 10 series or funds.
The Trust’s officers are elected annually by the Trustees for a one-year term. Certain officers also serve as officers of Clayton Series Trust. Certain officers of the Fund may also be officers and/or directors of Janus Capital. Fund officers receive no compensation from the Fund, except for the Fund’s Chief Compliance Officer, as authorized by the Trustees.
| | | | | | | | | | | | |
| TRUSTEES |
| Name, Address, and Age | | Positions Held
with the Trust | | Length of Time Served | | Principal Occupations During the Past Five Years | | Number of Portfolios/Funds in Fund Complex Overseen by Trustee* | | | Other Directorships Held by Trustee During the Past Five Years |
Independent Trustees | | | | | | | | |
Clifford J. Weber 151 Detroit Street Denver, CO 80206 DOB: 1963 | | Chairman
Trustee | | 2/16-Present
2/16-Present | | Owner, Financial Products Consulting Group LLC (consulting services to financial institutions) (since 2015). Formerly, Executive Vice President of Global Index and Exchange- Traded Products, NYSE Market, Inc., a subsidiary of Intercontinental Exchange (ETF/ETP listing exchange) (2013-2015) and Executive Vice President and Head of Strategy and Product Development, NYSE Liffe U.S., a division of NYSE Euronext (U.S. futures exchange) (2008-2013). | | | 10 | | | Independent Trustee, Clough Funds Trust (investment company) (since 2015). Chairman, Clough Funds Trust (since 2017), Independent Trustee, Clough Dividend and Income Fund (closed-end fund) (since 2017), Independent Trustee, Clough Global Opportunities Fund (closed-end fund) (since 2017), Independent Trustee, Clough Global Equity Fund (closed-end fund) (since 2017), Independent Trustee, Elevation ETF Trust (investment company) (2016-2018) Chairman, Elevation ETF Trust (2016-2018), and Independent Trustee, Global X Funds (investment company) (since 2018). |
Janus Henderson Short Duration Income ETF
Trustees and Officers (unaudited)
| | | | | | | | | | | | | | | | |
| TRUSTEES |
| Name, Address, and Age | | Positions Held
with the Trust | | | Length of Time Served | | | Principal Occupations During the Past Five Years | | Number of Portfolios/Funds
in Fund Complex Overseen by Trustee* | | | Other Directorships Held by Trustee During the
Past Five Years |
Maureen T. Upton 151 Detroit Street Denver, CO 80206 DOB: 1965 | | | Trustee | | | | 2/16-Present | | | Principal, Maureen Upton Ltd. (consulting services to developers of major infrastructure projects and investors) (since 2017). Formerly, Principal Consultant, SRK Consulting (U.S.), Inc. (consulting services to global mining, energy and water resource industries) (2015-2017) and Founder and Principal, Resource Initiatives LLC (sustainability consulting firm) (2006-2015). | | | 10 | | | Director, Denver Metro Leadership Foundation (non-profit organization) (2012-2014). |
| | | | | |
Jeffrey B. Weeden 151 Detroit Street Denver, CO 80206 DOB: 1956 | | | Trustee | | | | 2/16-Present | | | Senior Advisor, BayBoston Capital LP (investment fund in finance companies, banks and bank holdings companies) (since 2015). Formerly, Management Advisor, BoxCast, Inc. (technology start-up company) (2014-2017) and Senior Executive Vice President and Chief Financial Officer, KeyCorp (financial services) (2002-2013). | | | 10 | | | Director, State Farm Bank (banking) (since 2014). |
Interested Trustee | | | | | | | | | | | | | | | | |
Michael Drew Elder** 151 Detroit Street Denver, CO 80206 DOB: 1970 | | | Trustee | | | | 8/15-Present | | | Executive Vice President and Head of U.S. Intermediary Distribution, Janus Capital (since 2014) and President, Janus Distributors LLC (broker- dealer) (since 2014). Formerly, Senior Vice President, Janus Capital (2007-2014). | | | 10 | | | Director, Perkins Investment Management LLC (since 2014). |
| * | In addition to the Trust, which is comprised of seven series, each Trustee also serves as a trustee to the Clayton Street Trust, which is an affiliated registered investment company currently comprised of three portfolios. |
| ** | Michael Drew Elder is an Interested Trustee because of his employment with Janus Capital. |
| | |
| | Janus Detroit Street Trust ½ 37 |
Janus Henderson Short Duration Income ETF
Trustees and Officers (unaudited)
| | | | | | |
| OFFICERS |
| Name, Address, and Age | | Positions Held with the Trust | | Term of Office* and Length of Time Served | | Principal Occupations During the Past Five Years |
Bruce L. Koepfgen 151 Detroit Street Denver, CO 80206 DOB: 1952 | | President and Chief Executive Officer | | 2/16-Present | | Head of North America for Janus Henderson Investors and Janus Capital Management LLC (since 2017); Executive Vice President and Director of Janus International Holding LLC (since 2011); Executive Vice President of Janus Distributors LLC (since 2011); Executive Vice President and Working Director of INTECH Investment Management LLC (since 2011); Executive Vice President and Director of Perkins Investment Management LLC (since 2011); and Executive Vice President and Director of Janus Management Holdings Corporation (since 2011). Formerly, President of Janus Capital Group Inc. and Janus Capital Management LLC (2013-2017); Executive Vice President of Janus Services LLC (2011-2015), Janus Capital Group Inc. and Janus Capital Management LLC (2011-2013); and Chief Financial Officer of Janus Capital Group Inc., Janus Capital Management LLC, Janus Distributors LLC, Janus Management Holdings Corporation, and Janus Services LLC (2011-2013). |
| | | |
Susan K. Wold 151 Detroit Street Denver, CO 80206 DOB: 1960 | | Vice President, Chief Compliance Officer, and Anti- Money Laundering Officer | | 9/17-Present | | Senior Vice President and Head of Compliance North America for Janus Henderson (since September 2017); Formerly Vice President, Head of Global Corporate Compliance, and Chief Compliance Officer for Janus Capital Management LLC (May 2017-September 2017); Vice President, Compliance at Janus Capital Group and Janus Capital Management LLC (2005-2017). |
| | | |
Jesper Nergaard 151 Detroit Street Denver, CO 80206 DOB: 1962 | | Vice President, Chief Financial Officer, Treasurer, and Principal Accounting Officer | | 2/16-Present | | Vice President of Janus Capital and Janus Services LLC. |
| | | |
Byron Hittle 151 Detroit Street Denver, CO 80206 DOB: 1974 | | Vice President, Secretary and Chief Legal Officer | | 7/18-Present | | Vice President and Assistant General Counsel of Janus Capital and Janus Services LLC (2017- present); Assistant Vice President and Senior Legal Counsel (2012-2016). |
| * | Officers are elected at least annually by the Trustees for a one-year term and may also be elected from time to time by the Trustees for an interim period. |
Janus Henderson Short Duration Income ETF
Notes
| | |
| | Janus Detroit Street Trust ½ 39 |
Janus Henderson Short Duration Income ETF
Notes
Janus Henderson Short Duration Income ETF
Notes
| | |
| | Janus Detroit Street Trust ½ 41 |
Knowledge. Shared
At Janus Henderson, we believe in the sharing of expert insight for better investment and business decisions. We call this ethos Knowledge. Shared.
Learn more by visiting janushenderson.com.
This report is submitted for the general information of shareholders of the Fund. It is not an offer or solicitation for the Fund and is not authorized for distribution to prospective investors unless preceded or accompanied by an effective prospectus.
Janus Henderson and Knowledge. Shared are trademarks of Janus Henderson Group plc or one of its subsidiary entities. © Janus Henderson Group plc.
Janus Capital Management LLC is the investment adviser and ALPS Distributors, Inc. is the distributor. ALPS is not affiliated with Janus Henderson or any of its subsidiaries.
ANNUAL REPORT
October 31, 2018
Janus Henderson Mortgage-Backed Securities ETF
Janus Detroit Street Trust

Table of Contents
Janus Henderson Mortgage-Backed Securities ETF (unaudited)
INVESTMENT OBJECTIVE
Janus Henderson Mortgage-Backed Securities ETF (JMBS) seeks a high level of total return consisting of income and capital appreciation. It pursues its objective by investing primarily in high-quality, typically low-volatility agency mortgage-backed securities that have the explicit or implied guarantee of the U.S. government. The Fund seeks to outperform the total return of the Bloomberg Barclays U.S. MBS Index while maintaining a substantial correlation to the index.
| • | | Janus Henderson Mortgage-Backed Securities ETF began investment operations on September 12, 2018. |
| | |
| | Janus Detroit Street Trust ½ 1 |
Janus Henderson Mortgage-Backed Securities ETF (unaudited)
Fund At A Glance
October 31, 2018
| | | | |
| Sector Allocation – (% of Net Assets) | |
Mortgage-Backed Securities | | | 154.2% | |
Investment Companies | | | 21.0% | |
Asset-Backed Securities | | | 0.9% | |
| | | | |
| | | 176.1% | |
Janus Henderson Mortgage-Backed Securities ETF (unaudited)
Performance
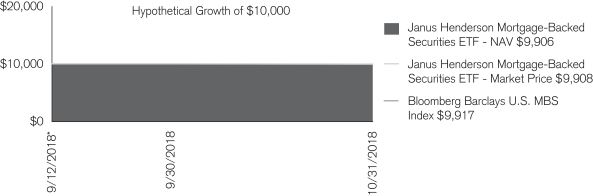
| | |
| Cumulative Total Return for the period ended October 31, 2018 |
| | | Since
Inception* |
Janus Henderson Mortgage-Backed Securities ETF – NAV | | -0.94% |
Janus Henderson Mortgage-Backed Securities ETF – Market Price | | -0.92% |
Bloomberg Barclays U.S. MBS Index | | -0.83% |
Total annual expense ratio (estimated) as stated in the September 12, 2018 prospectus: 0.35%.
Returns quoted are past performance and do not guarantee future results; current performance may be lower or higher. Investment returns and principal value will vary; there may be a gain or loss when shares are sold. For the most recent month-end performance call 800.668.0434 or visit janushenderson.com/performance.
Shares of ETFs are bought and sold at market price (not NAV) and are not individually redeemed from the Fund. Market returns are based upon the midpoint of the bid/ask spread at 4:00 p.m. Eastern time (when NAV is normally determined for most ETFs), and do not represent the returns you would receive if you traded shares at other times. Ordinary brokerage commissions apply and will reduce returns.
ETF shares are not individually redeemable and owners of the shares may acquire those shares from the Fund and tender those shares for redemption to the Fund in Creation Units only.
Investing involves risk, including the possible loss of principal and fluctuation of value.
The ETF is new and has less than one year of operating history.
See the prospectus for a more complete discussion of objectives, risks and expenses.
Returns include reinvestment of dividends and capital gains. Returns greater than one year are annualized. Returns do not reflect the deduction of taxes that a shareholder would pay on Fund distributions or redemptions of Fund shares.
See Financial Highlights for actual expense ratios during the reporting period.
There is no assurance the stated objective(s) will be met.
See Notes to Schedule of Investments and Other Information for index definitions.
Index performance does not reflect the expenses of managing a portfolio as an index is unmanaged and not available for direct investment.
| * | The Fund commenced operations on September 12, 2018. |
| | |
| | Janus Detroit Street Trust ½ 3 |
Janus Henderson Mortgage-Backed Securities ETF (unaudited)
Disclosure of Fund Expenses
As a shareholder of the Fund, you incur two types of costs: (1) transaction costs, which may include creation and redemption fees or brokerage charges and (2) ongoing costs, including management fees and other Fund expenses. This example is intended to help you understand your ongoing costs (in dollars) of investing in the Fund and to compare these costs with the ongoing costs of investing in other ETFs. To do so, compare this 5% hypothetical example with the 5% hypothetical examples that appear in the shareholder reports of the other funds. The example is based upon an investment of $1,000 invested at the beginning of the period and held for the six-months indicated, unless noted otherwise in the table and footnotes below.
Actual Expenses
The information in the table under the heading “Actual” provides information about actual account values and actual expenses. You may use the information in these columns, together with the amount you invested, to estimate the expenses that you paid over the period. Simply divide your account value by $1,000 (for example, an $8,600 account value divided by $1,000 = 8.6), then multiply the result by the number under the heading entitled “Expenses Paid During Period” to estimate the expenses you paid on your account during the period.
Hypothetical Example for Comparison Purposes
The information in the table under the heading “Hypothetical (5% return before expenses)” provides information about hypothetical account values and hypothetical expenses based upon the Fund’s actual expense ratio and an assumed rate of return of 5% per year before expenses, which is not the Fund’s actual return. The hypothetical account values and expenses may not be used to determine the actual ending account balance or expenses you paid for the period. You may use this information to compare the ongoing costs of investing in the Fund and other funds. To do so, compare this 5% hypothetical example with the 5% hypothetical examples that appear in the shareholder reports of the other funds. Additionally, for an analysis of the fees associated with an investment or other similar funds, please visit www.finra.org/fundanalyzer.
Please note that the expenses shown in the table are meant to highlight your ongoing costs only and do not reflect any transaction costs, such as creation and redemption fees, or brokerage charges. These fees are fully described in the Fund’s prospectus. Therefore, the hypothetical examples are useful in comparing ongoing costs only, and will not help you determine the relative total costs of owning different funds. In addition, if these transaction costs were included, your costs would have been higher.
| | | | | | | | | | | | | | | | | | | | | | | | |
Actual | | | Hypothetical
(5% return before expenses) | | | | |
Beginning
Account
Value
(9/12/18) | | Ending
Account
Value
(10/31/2018) | | | Expenses
Paid During
Period
(9/12/18 - 10/31/2018)* | | | Beginning
Account
Value
(5/1/18) | | | Ending
Account
Value
(10/31/2018) | | | Expenses
Paid During
Period
(5/1/18 - 10/31/2018)† | | | Net Annualized
Expense Ratio
(5/1/18 - 10/31/2018) | |
| $1,000.00 | | $ | 990.60 | | | $ | 0.47 | | | $ | 1,000.00 | | | $ | 1,023.44 | | | $ | 1.79 | | | | 0.35% | |
| * | Actual Expenses Paid During Period reflects only the inception period for the Fund (September 12, 2018 to October 31, 2018) and is equal to the Net Annualized Expense Ratio multiplied by the average account value over the period, multiplied by 49/365 (to reflect the period). Therefore, actual expenses shown are lower than would be expected for a six-month period. |
| † | Expenses Paid During Period is equal to the Net Annualized Expense Ratio multiplied by the average account value over the period, multiplied by 184/365 (to reflect the one-half year period). |
Janus Henderson Mortgage-Backed Securities ETF
Report of Independent Registered Public Accounting Firm
To the Board of Trustees of Janus Detroit Street Trust and Shareholders of Janus Henderson Mortgage-Backed Securities ETF:
Opinion on the Financial Statements
We have audited the accompanying statement of assets and liabilities, including the schedule of investments, of Janus Henderson Mortgage-Backed Securities ETF (one of the funds constituting Janus Detroit Street Trust, referred to hereafter as the “Fund”) as of October 31, 2018, the related statements of operations and changes in net assets, including the related notes, and the financial highlights for the period September 12, 2018 (commencement of operations) through October 31, 2018 (collectively referred to as the “financial statements”). In our opinion, the financial statements present fairly, in all material respects, the financial position of the Fund as of October 31, 2018, the results of its operations, changes in its net assets, and the financial highlights for the period September 12, 2018 (commencement of operations) through October 31, 2018 in conformity with accounting principles generally accepted in the United States of America.
Basis for Opinion
These financial statements are the responsibility of the Fund’s management. Our responsibility is to express an opinion on the Fund’s financial statements based on our audit. We are a public accounting firm registered with the Public Company Accounting Oversight Board (United States) (“PCAOB”) and are required to be independent with respect to the Fund in accordance with the U.S. federal securities laws and the applicable rules and regulations of the Securities and Exchange Commission and the PCAOB.
We conducted our audit of these financial statements in accordance with the standards of the PCAOB. Those standards require that we plan and perform the audit to obtain reasonable assurance about whether the financial statements are free of material misstatement, whether due to error or fraud.
Our audit included performing procedures to assess the risks of material misstatement of the financial statements, whether due to error or fraud, and performing procedures that respond to those risks. Such procedures included examining, on a test basis, evidence regarding the amounts and disclosures in the financial statements. Our audit also included evaluating the accounting principles used and significant estimates made by management, as well as evaluating the overall presentation of the financial statements. Our procedures included confirmation of securities owned as of October 31, 2018 by correspondence with the custodian and brokers; when replies were not received from brokers, we performed other auditing procedures. We believe that our audit provides a reasonable basis for our opinion.

Denver, Colorado
December 20, 2018
We have served as the auditor of one or more investment companies in Janus Henderson Funds since 1990.
| | |
| | Janus Detroit Street Trust ½ 5 |
Janus Henderson Mortgage-Backed Securities ETF
Schedule of Investments
October 31, 2018
| | | | | | | | |
| | | Shares or Principal Amounts | | | Value | |
| Asset-Backed Securities – 0.9% | | | | | | |
PRPM LLC, 3.4700%, 9/25/22 (144A) | | | $204,530 | | | | $202,218 | |
PRPM LLC, 3.4700%, 11/25/22 (144A)‡ | | | 82,208 | | | | 81,549 | |
Total Asset-Backed Securities (cost $283,628) | | | | 283,767 | |
| Mortgage-Backed Securities – 154.2% | | | | | | |
Angel Oak Mortgage Trust I LLC, 3.6490%, 9/25/48 (144A)‡ | | | 96,765 | | | | 96,866 | |
Angel Oak Mortgage Trust LLC 2.8100%, 1/25/47 (144A) | | | 74,563 | | | | 73,898 | |
Angel Oak Mortgage Trust LLC 2.7080%, 11/25/47 (144A) | | | 85,498 | | | | 84,470 | |
BBCMS Tall Mortgage Trust, ICE LIBOR USD 1 Month + 0.7220%, 3.0015%, 3/15/37 (144A)‡ | | | 193,000 | | | | 192,636 | |
BHMS ATLS, ICE LIBOR USD 1 Month + 1.2500%, 3.5295%, 7/15/35 (144A)‡ | | | 100,000 | | | | 99,968 | |
Caesars Palace Las Vegas Trust, 4.1384%, 10/15/34 (144A) | | | 30,000 | | | | 29,961 | |
Caesars Palace Las Vegas Trust, 4.4991%, 10/15/34 (144A)‡ | | | 35,000 | | | | 34,928 | |
COLT Mortgage Loan Trust, 2.5680%, 10/25/47 (144A) ‡ | | | 50,922 | | | | 50,601 | |
CSMLT Trust, 3.5000%, 8/25/45 (144A)‡ | | | 38,354 | | | | 37,667 | |
Deephaven Residential Mortgage Trust 2.7110%, 10/25/47 (144A) | | | 542,233 | | | | 535,473 | |
Deephaven Residential Mortgage Trust 2.9760%, 12/25/57 (144A) | | | 303,635 | | | | 301,517 | |
Deephaven Residential Mortgage Trust 3.7890%, 8/25/58 (144A) | | | 341,862 | | | | 341,858 | |
Deephaven Residential Mortgage Trust 3.9630%, 8/25/58 (144A) | | | 97,675 | | | | 97,674 | |
Federal Home Loan Mortgage Corp., ICE LIBOR USD 1 Month + 3.6000%, 5.8814%, 4/25/24‡ | | | 250,000 | | | | 275,535 | |
Federal Home Loan Mortgage Corp., 0.0431%, 7/25/28‡(b) | | | 65,956,000 | | | | 532,628 | |
Federal Home Loan Mortgage Corp., 4.5000%, 5/1/38 | | | 1,005,653 | | | | 1,034,354 | |
Federal Home Loan Mortgage Corp., 4.5000%, 11/1/38 | | | 390,000 | | | | 401,713 | |
Federal Home Loan Mortgage Corp., 3.5000%, 3/1/43 | | | 604 | | | | 593 | |
Federal Home Loan Mortgage Corp., 3.5000%, 6/1/43 | | | 82,373 | | | | 80,910 | |
Federal Home Loan Mortgage Corp., 3.5000%, 2/1/44 | | | 796,144 | | | | 779,618 | |
Federal Home Loan Mortgage Corp., 3.5000%, 12/1/44 | | | 1,622,225 | | | | 1,593,419 | |
Federal Home Loan Mortgage Corp., 3.5000%, 10/1/46 | | | 120,199 | | | | 117,428 | |
Federal Home Loan Mortgage Corp., 3.0000%, 12/1/46 | | | 1,229,066 | | | | 1,164,421 | |
Federal Home Loan Mortgage Corp., 3.5000%, 2/1/47 | | | 76,722 | | | | 74,954 | |
Federal Home Loan Mortgage Corp., 4.0000%, 3/1/47 | | | 160,087 | | | | 160,550 | |
Federal Home Loan Mortgage Corp., 4.0000%, 8/1/48 | | | 99,688 | | | | 100,176 | |
Federal National Mortgage Association, ICE LIBOR USD 1 Month + 2.6000%, 4.8814%, 5/25/24‡ | | | 38,000 | | | | 40,384 | |
Federal National Mortgage Association, ICE LIBOR USD 1 Month + 3.0000%, 5.2814%, 7/25/24‡ | | | 94,721 | | | | 100,887 | |
Federal National Mortgage Association, ICE LIBOR USD 1 Month + 4.0000%, 6.2814%, 5/25/25‡ | | | 10,813 | | | | 11,851 | |
Federal National Mortgage Association, 4.5000%, 9/1/37 | | | 45,443 | | | | 46,822 | |
Federal National Mortgage Association, 4.5000%, 10/1/37 | | | 45,561 | | | | 46,945 | |
Federal National Mortgage Association, 4.5000%, 5/1/38 | | | 77,700 | | | | 80,061 | |
Federal National Mortgage Association, 4.5000%, 7/1/38 | | | 469,003 | | | | 482,674 | |
Federal National Mortgage Association, 4.5000%, 11/1/38 | | | 390,000 | | | | 401,368 | |
Federal National Mortgage Association, 3.5000%, 4/1/43 | | | 966,510 | | | | 946,769 | |
Federal National Mortgage Association, 3.5000%, 11/1/43 | | | 483,639 | | | | 473,761 | |
Federal National Mortgage Association, 3.5000%, 2/1/45 | | | 485,253 | | | | 475,309 | |
Federal National Mortgage Association, 4.5000%, 6/1/45 | | | 15,667 | | | | 16,152 | |
Federal National Mortgage Association, 3.0000%, 10/1/45 | | | 6,410 | | | | 6,070 | |
Federal National Mortgage Association, 3.0000%, 10/1/45 | | | 9,794 | | | | 9,274 | |
Federal National Mortgage Association, 4.0000%, 10/1/45 | | | 158,819 | | | | 159,273 | |
Federal National Mortgage Association, 3.0000%, 1/1/46 | | | 60,212 | | | | 57,074 | |
Federal National Mortgage Association, 3.5000%, 1/1/46 | | | 190,978 | | | | 186,705 | |
Federal National Mortgage Association, 3.5000%, 2/1/46 | | | 478,694 | | | | 468,054 | |
Federal National Mortgage Association, 4.0000%, 2/1/46 | | | 1,146,932 | | | | 1,154,729 | |
Federal National Mortgage Association, 3.0000%, 3/1/46 | | | 263,935 | | | | 250,069 | |
Federal National Mortgage Association, 3.0000%, 3/1/46 | | | 493,564 | | | | 467,636 | |
Federal National Mortgage Association, 3.5000%, 5/1/46 | | | 157,464 | | | | 153,883 | |
Federal National Mortgage Association, 3.5000%, 7/1/46 | | | 476,717 | | | | 465,876 | |
Federal National Mortgage Association, 3.0000%, 11/1/46 | | | 860,449 | | | | 814,892 | |
Federal National Mortgage Association, 3.0000%, 11/1/46 | | | 10,074 | | | | 9,553 | |
Federal National Mortgage Association, 3.0000%, 11/1/46 | | | 9,585 | | | | 9,089 | |
Federal National Mortgage Association, 3.5000%, 12/1/46 | | | 995,520 | | | | 972,157 | |
Federal National Mortgage Association, 4.0000%, 5/1/47 | | | 14,463 | | | | 14,479 | |
See Notes to Schedule of Investments and Other Information and Notes to Financial Statements.
Janus Henderson Mortgage-Backed Securities ETF
Schedule of Investments
October 31, 2018
| | | | | | | | |
| | | Shares or Principal Amounts | | | Value | |
| Mortgage-Backed Securities – (continued) | | | | | | |
Federal National Mortgage Association, 4.0000%, 6/1/47 | | | $ 1,724 | | | | $ 1,726 | |
Federal National Mortgage Association, 4.0000%, 6/1/47 | | | 3,793 | | | | 3,795 | |
Federal National Mortgage Association, 4.5000%, 7/1/47 | | | 140,198 | | | | 144,640 | |
Federal National Mortgage Association, 4.0000%, 8/1/47 | | | 33,749 | | | | 33,768 | |
Federal National Mortgage Association, 4.0000%, 9/1/47 | | | 791,564 | | | | 796,658 | |
Federal National Mortgage Association, 4.0000%, 11/1/47 | | | 34,036 | | | | 34,067 | |
Federal National Mortgage Association, 4.0000%, 11/1/47 | | | 21,599 | | | | 21,624 | |
Federal National Mortgage Association, 4.5000%, 11/1/47 | | | 71,594 | | | | 73,863 | |
Federal National Mortgage Association, 4.0000%, 12/1/47 | | | 42,311 | | | | 42,359 | |
Federal National Mortgage Association, 4.0000%, 1/1/48 | | | 81,096 | | | | 81,188 | |
Federal National Mortgage Association, 4.5000%, 2/1/48 | | | 119,242 | | | | 122,134 | |
Federal National Mortgage Association, 4.5000%, 2/1/48 | | | 95,320 | | | | 97,631 | |
Federal National Mortgage Association, 4.5000%, 4/1/48 | | | 166,315 | | | | 170,349 | |
Federal National Mortgage Association, 4.5000%, 4/1/48 | | | 99,057 | | | | 102,194 | |
Federal National Mortgage Association, 4.5000%, 4/1/48 | | | 214,991 | | | | 220,205 | |
Federal National Mortgage Association, 4.5000%, 4/1/48 | | | 161,255 | | | | 165,167 | |
Federal National Mortgage Association, 4.5000%, 4/1/48 | | | 78,967 | | | | 80,882 | |
Federal National Mortgage Association, 4.0000%, 6/1/48 | | | 126,709 | | | | 126,774 | |
Federal National Mortgage Association, 4.0000%, 8/1/48 | | | 314,145 | | | | 314,307 | |
Federal National Mortgage Association, 4.0000%, 9/1/48 | | | 314,520 | | | | 314,682 | |
Federal National Mortgage Association, 3.5000%, 11/1/48(a) | | | 2,112,803 | | | | 2,056,764 | |
Federal National Mortgage Association, 4.0000%, 11/1/48(a) | | | 14,742,501 | | | | 14,742,439 | |
Federal National Mortgage Association, 5.0000%, 11/1/48(a) | | | 3,798,000 | | | | 3,963,272 | |
Federal National Mortgage Association, 3.5000%, 8/1/56 | | | 87,430 | | | | 84,909 | |
Federal National Mortgage Association, 3.0000%, 2/1/57 | | | 929,467 | | | | 871,058 | |
Federal National Mortgage Association, 3.5000%, 2/1/57 | | | 1,030,195 | | | | 1,000,481 | |
Government National Mortgage Association, 4.5000%, 8/20/48 | | | 1,343,980 | | | | 1,380,083 | |
Government National Mortgage Association, 5.0000%, 8/20/48 | | | 1,619,235 | | | | 1,687,425 | |
Government National Mortgage Association, 4.5000%, 11/1/48(a) | | | 1,625,000 | | | | 1,666,799 | |
JP Morgan Chase Commercial Mortgage Securities Corp., 3.5537%, 10/5/31 (144A) | | | 10,000 | | | | 9,825 | |
JP Morgan Chase Commercial Mortgage Securities Corp., 4.1426%, 10/5/31 (144A)‡ | | | 10,000 | | | | 9,826 | |
JP Morgan Chase Commercial Mortgage Securities Corp., 0.9598%, 12/15/49‡(b) | | | 5,878,511 | | | | 306,622 | |
JP Morgan Chase Commercial Mortgage Securities Trust, 3.7417%, 9/5/32 (144A)‡ | | | 25,000 | | | | 24,600 | |
JP Morgan Mortgage Trust, 4.0000%, 1/25/49 (144A)‡ | | | 24,657 | | | | 24,113 | |
loanDepot Station Place Agency Securitization Trust, ICE LIBOR USD 1 Month + 0.8000, 3.0814%, 11/25/50 (144A) | | | 78,000 | | | | 77,727 | |
loanDepot Station Place Agency Securitization Trust, ICE LIBOR USD 1 Month + 1.0000%, 3.2814%, 11/25/50 (144A) | | | 97,000 | | | | 96,713 | |
Mello Warehouse Securitization Trust, ICE LIBOR USD 1 Month + 1.0500%, 1.0500, 11/25/51 (144A) | | | 241,000 | | | | 241,000 | |
Mello Warehouse Securitization Trust, ICE LIBOR USD 1 Month + 1.2500%, 1.2500%, 11/25/51 (144A) | | | 80,000 | | | | 80,000 | |
Mello Warehouse Securitization Trust, ICE LIBOR USD 1 Month + 0.8500%, 3.1318%, 11/25/51 (144A)‡ | | | 321,000 | | | | 321,000 | |
New Residential Mortgage Loan Trust, ICE LIBOR USD 1 Month + 0.9000%, 3.1873%, 1/25/48 (144A)‡ | | | 487,220 | | | | 487,220 | |
Sequoia Mortgage Trust, 0.3471%, 11/25/48 (144A)‡(b) | | | 13,175,000 | | | | 199,997 | |
Station Place Securitization Trust, ICE LIBOR USD 1 Month + 0.8500%, 3.0324%, 9/24/19 (144A)‡ | | | 99,000 | | | | 99,000 | |
Verus Securitization Trust, 3.8490%, 3/25/58 (144A)‡ | | | 88,314 | | | | 88,194 | |
Wells Fargo Mortgage Backed Securities, 3.5000%, 7/25/47 (144A)‡ | | | 500,000 | | | | 476,992 | |
WinWater Mortgage Loan Trust, 3.5000%, 8/20/45 (144A)‡ | | | 80,224 | | | | 79,531 | |
Total Mortgage-Backed Securities (cost $49,808,575) | | | | 49,639,215 | |
| Investment Companies – 21.0% | | | | | | |
| Money Market Funds – 21.0% | | | | | | |
Federated Institutional Prime Obligations Fund, 2.35% | | | 6,782,754 | | | | 6,784,111 | |
Total Money Market Funds (cost $6,784,683) | | | | 6,784,111 | |
Total Investments (total cost $56,876,886) – 176.1% | | | | 56,707,093 | |
Liabilities, net of Cash, Receivables and Other Assets – (76.1%) | | | | (24,513,961) | |
Net Assets – 100% | | | | $32,193,132 | |
See Notes to Schedule of Investments and Other Information and Notes to Financial Statements.
| | |
| | Janus Detroit Street Trust ½ 7 |
Janus Henderson Mortgage-Backed Securities ETF
Schedule of Investments
October 31, 2018
Summary of Investments by Country – (Long Positions) (unaudited)
| | | | | | | | |
| Country | | Value | | | % of
Investment
Securities | |
United States | | | $56,707,093 | | | | 100.0% | |
Schedule of TBA sales commitments – (% of Net Assets)
| | | | | | | | |
| | | Principal Amounts | | | Value | |
| Securities Sold Short – (12.0)% | | | |
| Mortgage-Backed Securities – (12.0)% | | | |
Federal National Mortgage Association, 30 year, 4.5000%, 11/13/48(a) | | | $(681,077) | | | | $(697,319) | |
Government National Mortgage Association, 30 year, 5.0000%, 11/19/48(a) | | | (3,050,000) | | | | (3,170,809) | |
Total Securities Sold Short (proceeds $3,864,683) | | | | $(3,868,128) | |
Summary of Investments by Country – (Short Positions) (unaudited)
| | | | | | | | |
| Country | | Value | | | % of
Investment
Securities | |
United States | | | $(3,868,128) | | | | 100.0% | |
See Notes to Schedule of Investments and Other Information and Notes to Financial Statements.
Janus Henderson Mortgage-Backed Securities ETF
Notes to Schedule of Investments and Other Information
October 31, 2018
Schedule of Futures
| | | | | | | | | | | | | | | | | | | | |
| Description | | Number of Contracts | | | Expiration
Date | | | Value and
Notional Amount | | | Unrealized
Appreciation/
(Depreciation) | | | Variation Margin
Asset/(Liability) | |
Futures Bought: | | | | | | | | | | | | | | | | | | | | |
90-Day Euro Future | | | 21 | | | | 12/16/19 | | | | $5,081,738 | | | | $1,500 | | | | $1,896 | |
90-Day Euro Future | | | 21 | | | | 03/16/20 | | | | 5,081,213 | | | | 2,212 | | | | 2,797 | |
90-Day Euro Future | | | 21 | | | | 06/15/20 | | | | 5,081,475 | | | | 2,963 | | | | 3,745 | |
90-Day Euro Future | | | 21 | | | | 09/14/20 | | | | 5,082,000 | | | | 3,450 | | | | 4,361 | |
| | | | | | | | | | | | | | | | 10,125 | | | | 12,799 | |
Futures Sold: | | | | | | | | | | | | | | | | | | | | |
10-Year U.S. Treasury Note | | | 57 | | | | 12/19/18 | | | | 6,750,938 | | | | $(14,250) | | | | $(17,744) | |
10-Year U.S. Ultra Long Treasury Note | | | 9 | | | | 12/19/18 | | | | 1,125,984 | | | | 6,733 | | | | 8,512 | |
5-Year U.S. Treasury Note | | | 7 | | | | 12/31/18 | | | | 786,680 | | | | 969 | | | | 1,225 | |
2-Year U.S. Treasury Note | | | 6 | | | | 12/31/18 | | | | 1,263,938 | | | | 438 | | | | 553 | |
U.S. Long Treasury Bond | | | 2 | | | | 12/19/18 | | | | 276,250 | | | | 5,250 | | | | 6,637 | |
U.S. Ultra Bond | | | 1 | | | | 12/19/18 | | | | 149,219 | | | | 5,281 | | | | 6,675 | |
| | | | | | | | | | | | | | | | 4,421 | | | | 5,858 | |
Total | | | | | | | | | | | | | | | $14,546 | | | | $18,657 | |
The following table, grouped by derivative type, provides information about the fair value and location of derivatives within the Statement of Assets and Liabilities as of October 31, 2018.
Fair Value of Derivative Instruments (not accounted for as hedging instruments) as of October 31, 2018
| | | | |
| | | Interest Rate
Contracts | |
Asset Derivatives: | | | | |
Variation margin receivable | | | $36,401 | |
Liability Derivatives: | | | | |
Variation margin payable | | | $17,744 | |
The following tables provide information about the effect of derivatives and hedging activities on the Fund’s Statement of Operations for the period ended October 31, 2018.
The effect of Derivative Instruments (not accounted for as hedging instruments) on the Statement of Operations for the period ended October 31, 2018
| | | | |
| Amount of Realized Gain/(Loss) Recognized on Derivatives | |
| Derivative | | Interest Rate
Contracts | |
Futures contracts | | | $2,776 | |
| | | | |
| Amount of Change in Unrealized Appreciation/(Depreciation) Recognized on Derivatives | |
| Derivative | | Interest Rate
Contracts | |
Futures contracts | | | $14,546 | |
Please see the “Net realized and change in unrealized gain/ (loss) on investments” sections of the Fund’s Statement of Operations.
| | |
| | Janus Detroit Street Trust ½ 9 |
Janus Henderson Mortgage-Backed Securities ETF
Notes to Schedule of Investments and Other Information
October 31, 2018
Average ending Monthly Market Value of Derivative Instruments During the Period Ended October 31, 2018
| | | | |
| Derivative | | Market Value | |
Futures contracts, purchased | | | $10,163,213 | |
Futures contracts, sold | | | $6,560,516 | |
| | |
| |
Bloomberg Barclays
U.S. MBS Index | | Bloomberg Barclays U.S. MBS Index tracks the performance of U.S. fixed-rate agency mortgage backed pass-through securities. |
| |
| ICE | | Intercontinental Exchange |
| |
| LIBOR | | LIBOR (London Interbank Offered Rate) is a short-term interest rate that banks offer one another and generally represents current cash rates. |
| |
| LLC | | Limited Liability Company |
| |
| ‡ | | The interest rate on floating rate notes is based on an index or market interest rates and is subject to change. Rate in the security description is as of October 31, 2018. |
| |
| 144A | | Securities sold under Rule 144A of the Securities Act of 1933, as amended, are subject to legal and/or contractual restrictions on resale and may not be publicly sold without registration under the 1993 Act. Unless otherwise noted, these securities have been determined to be liquid under guidelines established by the Board of Trustees. The total value of 144A securities as of the period ended October 31, 2018 is 4,577,022 which represents 14.2% of net assets. |
| |
| (a) | | Settlement is on a delayed delivery or when-issued basis with final maturity to be announced (TBA) in the future. |
| |
| (b) | | IO – Interest only. |
The following is a summary of the inputs that were used to value the Fund’s investments in securities and other financial instruments as of October 31, 2018. See Notes to Financial Statements for more information.
Valuation Inputs Summary
| | | | | | | | | | | | |
| | | Level 1 -
Quoted Prices | | | Level 2 -
Other Significant
Observable Inputs | | | Level 3 -
Significant
Unobservable Inputs | |
Assets | | | | | | | | | | | | |
Investments in Securities: | | | | | | | | | | | | |
Asset-Backed Securities | | $ | — | | | $ | 283,767 | | | $ | — | |
Mortgage-Backed Securities | | | — | | | | 49,639,215 | | | | — | |
Investment Companies | | | 6,784,111 | | | | — | | | | — | |
| | | | |
Total Investments in Securities | | $ | 6,784,111 | | | $ | 49,922,982 | | | $ | — | |
| | | | |
Other Financial Instruments(a): | | | | | | | | | | | | |
Variation Margin Receivable | | $ | 36,401 | | | $ | — | | | $ | — | |
| | | | |
Total Asset | | $ | 6,820,512 | | | $ | 49,922,982 | | | $ | — | |
| | | | |
Liabilities | | | | | | | | | | | | |
TBA sales commitments(a): | | | | | | | | | | | | |
Mortgage-Backed Securities | | $ | — | | | $ | 3,868,128 | | | $ | — | |
| | | | |
Other Financial Instruments(a): | | | | | | | | | | | | |
Variation Margin Payable | | $ | 17,744 | | | $ | — | | | $ | — | |
| | | | |
Total Liabilities | | $ | 17,744 | | | $ | 3,868,128 | | | $ | — | |
| (a) | Other financial instruments include futures. Futures are reported at their variation margin at measurement date, which represents the amount due to/from the Fund at that date. |
Janus Henderson Mortgage-Backed Securities ETF
Statement of Assets and Liabilities
October 31, 2018
| | | | |
Assets: | | | | |
Investments, at value(1) | | $ | 56,707,093 | |
Due from broker for futures | | | 80,000 | |
Receivables: | | | | |
Investments sold | | | 14,918,312 | |
Dividends | | | 26,205 | |
Interest | | | 116,126 | |
Receivable for variation margin on futures contracts | | | 36,401 | |
Total Assets | | | 71,884,137 | |
Liabilities: | | | | |
TBA sales commitments, at value(2) | | | 3,868,128 | |
Payable for variation margin on futures contracts | | | 17,744 | |
Payables: | | | | |
Due to custodian | | | 11,573 | |
Investments purchased | | | 35,775,187 | |
Management fees | | | 9,579 | |
Interest payable for short sales | | | 8,794 | |
Total Liabilities | | | 39,691,005 | |
Net Assets | | $ | 32,193,132 | |
Net Assets Consists of: | | | | |
Capital (par value and paid-in surplus) | | $ | 32,510,942 | |
Total distributable earnings (loss) | | | (317,810) | |
Total Net Assets | | $ | 32,193,132 | |
Net Assets | | $ | 32,193,132 | |
Shares outstanding, $0.001 Par Value (unlimited shares authorized) | | | 650,001 | |
Net Asset Value Per Share | | $ | 49.53 | |
| (1) | Includes cost of $56,876,886 |
See Notes to Financial Statements.
| | |
| | Janus Detroit Street Trust ½ 11 |
Janus Henderson Mortgage-Backed Securities ETF
Statement of Operations
For the period ended October 31, 2018(1)
| | | | |
Investment Income: | | | | |
Dividends | | $ | 49,004 | |
Interest | | | 74,435 | |
Total Investment Income | | | 123,439 | |
Expenses: | | | | |
Management Fees | | | 14,308 | |
Total Expenses | | | 14,308 | |
Net Investment Income/(Loss) | | | 109,131 | |
Net Realized Gain/(Loss) on Investments: | | | | |
Investments | | | (288,117) | |
Futures contracts | | | 2,776 | |
TBA sales commitments | | | 17,091 | |
Total Net Realized Gain/(Loss) on Investments | | | (268,250) | |
Change in Unrealized Net Appreciation/Depreciation: | | | | |
Investments | | | (169,793) | |
Futures contracts | | | 14,546 | |
TBA sales commitments | | | (3,445) | |
Total Change in Unrealized Net Appreciation/Depreciation | | | (158,692) | |
Net Increase/(Decrease) in Net Assets Resulting from Operations | | $ | (317,811) | |
| (1) | Period from September 12, 2018 (commencement of operations) through October 31, 2018. |
See Notes to Financial Statements.
Janus Henderson Mortgage-Backed Securities ETF
Statement of Changes in Net Assets
| | | | |
| | | Period ended
October 31, 2018(1) | |
Operations: | | | | |
Net investment income/(loss) | | $ | 109,131 | |
Net realized gain/(loss) on investments | | | (268,250) | |
Change in unrealized net appreciation/depreciation | | | (158,692) | |
Net Increase/(Decrease) in Net Assets Resulting from Operations | | | (317,811) | |
Capital Share Transactions | | | 32,510,943 | |
Net Increase/(Decrease) in Net Assets | | | 32,193,132 | |
Net Assets: | | | | |
Beginning of period | | | — | |
End of period | | $ | 32,193,132 | |
| (1) | Period from September 12, 2018 (commencement of operations) through October 31, 2018. |
See Notes to Financial Statements.
| | |
| | Janus Detroit Street Trust ½ 13 |
Janus Henderson Mortgage-Backed Securities ETF
Financial Highlights
| | | | | | |
| For a share outstanding during each period ended October 31 | | 2018(1) | |
| | Net Asset Value, Beginning of Period | | | $50.00 | |
| | Income/(Loss) from Investment Operations: | | | | |
| | Net investment income/(loss)(2) | | | 0.17 | |
| | Net realized and unrealized gain/(loss) | | | (0.64) | |
| | Total from Investment Operations | | | (0.47) | |
| | Net Asset Value, End of Period | | | $49.53 | |
| | Total Return* | | | (0.94)% | |
| | Net assets, End of Year (in thousands) | | | $32,193 | |
| | Average Net Assets for the Period (in thousands) | | | $30,452 | |
| | Ratios to Average Net Assets**: | | | | |
| | Ratio of Gross Expenses | | | 0.35% | |
| | Ratio of Net Investment Income/(Loss) | | | 2.67% | |
| | Portfolio Turnover Rate(3)(4) | | | 91% | |
| * | Total return not annualized for periods of less than one full year. |
| ** | Annualized for periods of less than one full year. |
| (1) | Period from September 12, 2018 (commencement of operations) through October 31, 2018. |
| (2) | Per share amounts are calculated based on average shares outstanding during the year or period. |
| (3) | Portfolio turnover rate excludes securities received or delivered from in-kind processing of creation or redemptions. |
| (4) | Portfolio Turnover Rate excludes TBA (to be announced) purchase and sales commitments. |
See Notes to Financial Statements.
Janus Henderson Mortgage-Backed Securities ETF
Notes to Financial Statements
1. Organization and Significant Accounting Policies
Janus Henderson Mortgage-Backed Securities ETF (the “Fund”) is a series fund. The Fund is part of Janus Detroit Street Trust (the “Trust”), which is organized as a Delaware statutory trust and is registered under the Investment Company Act of 1940, as amended (the “1940 Act”), as an open-end management investment company, and therefore has applied the specialized accounting and reporting guidance in Financial Accounting Standards Board (“FASB”) Accounting Standards Codification (“ASC”) Topic 946. The financial statements include information for the period from September 12, 2018 (commencement of operations) through October 31, 2018. The Trust offers seven Funds each of which represent shares of beneficial interest in a separate portfolio of securities and other assets with its own objective and policies. The Fund seeks a high level of total return consisting of income and capital appreciation. The Fund is classified as diversified, as defined in the 1940 Act.
The Fund is an actively-managed exchange-traded fund. Unlike shares of traditional mutual funds, shares of the Fund are not individually redeemable and may only be purchased or redeemed directly from the Fund at net asset value (“NAV”) in large increments called “Creation Units” (25,000 shares per Creation Unit) through certain participants, known as “Authorized Participants.” The Fund will issue or redeem Creation Units in exchange for portfolio securities and/or cash. Except when aggregated in Creation Units, Fund shares are not redeemable securities of the Fund. Shares of the Fund are listed and trade on NYSE Arca, Inc. (“NYSE Arca”), and individual investors can purchase or sell shares in much smaller increments for cash in the secondary market through a broker. These transactions, which do not involve the Fund, are made at market prices that may vary throughout the day and differ from the Fund’s NAV. As a result, you may pay more than NAV (a premium) when you purchase shares, and receive less than NAV (a discount) when you sell shares, in the secondary market.
An Authorized Participant may hold of record more than 25% of the outstanding shares of the Fund. From time to time, Authorized Participants may be a beneficial and/or legal owner of the Fund, may be affiliated with an index provider, may be deemed to have control of the Fund and/or may be able to affect the outcome of matters presented for a vote of the shareholders of the Fund. Authorized Participants may execute an irrevocable proxy granting the Distributor or an affiliate of Janus Capital Management LLC (“Janus Capital” or “Janus”) power to vote or abstain from voting such Authorized Participant’s beneficially or legally owned shares of the Fund. In such cases, the agent shall mirror vote (or abstain from voting) such shares in the same proportion as all other beneficial owners of the Fund.
The following accounting policies have been followed by the Fund and are in conformity with accounting principles generally accepted in the United States of America.
Investment Valuation
Securities held by the Fund are valued in accordance with policies and procedures established by and under the supervision of the Trustees (the “Valuation Procedures”). Equity securities, including shares of exchange-traded funds, traded on a domestic securities exchange are generally valued at the closing prices on the primary market or exchange on which they trade. If such price is lacking for the trading period immediately preceding the time of determination, such securities are valued at their current bid price. Equity securities that are traded on a foreign exchange are generally valued at the closing prices on such markets. In the event that there is no current trading volume on a particular security in such foreign exchange, the bid price from the primary exchange is generally used to value the security. Securities that are traded on the over-the-counter (“OTC”) markets are generally valued at their closing or latest bid prices as available. Foreign securities and currencies are converted to U.S. dollars using the applicable exchange rate in effect at the close of the New York Stock Exchange (“NYSE”). The Fund will determine the market value of individual securities held by it by using prices provided by one or more approved professional pricing services or, as needed, by obtaining market quotations from independent broker-dealers. Most debt securities are valued in accordance with the evaluated bid price supplied by the pricing service that is intended to reflect market value. The evaluated bid price supplied by the pricing service is an evaluation that may consider factors such as security prices, yields, maturities and ratings. Certain short-term securities maturing within 60 days or less may be evaluated and valued on an amortized cost basis provided that the amortized cost determined approximates market value. Securities for which market quotations or evaluated prices are not readily available or are deemed by Janus Capital to be unreliable are valued at fair value determined in good faith under the Valuation Procedures. Circumstances in which fair value pricing may be utilized include, but are not limited to: (i) a significant event that may affect the securities of a single issuer, such as a merger, bankruptcy, or significant issuer-specific development; (ii) an event that may affect an entire market, such as a natural disaster or significant governmental action; (iii) a nonsignificant event such as a market closing early or not opening, or a security trading halt; and (iv) pricing of a nonvalued security and a restricted or nonpublic security. Special valuation considerations may apply with respect to “odd-lot” fixed-income transactions which, due to their small size, may receive evaluated prices by pricing services which reflect a large block trade and not what actually could be obtained for the odd-lot position.
| | |
| | Janus Detroit Street Trust ½ 15 |
Janus Henderson Mortgage-Backed Securities ETF
Notes to Financial Statements
Valuation Inputs Summary
FASB ASC 820, Fair Value Measurements and Disclosures (“ASC 820”), defines fair value, establishes a framework for measuring fair value, and expands disclosure requirements regarding fair value measurements. This standard emphasizes that fair value is a market-based measurement that should be determined based on the assumptions that market participants would use in pricing an asset or liability and establishes a hierarchy that prioritizes inputs to valuation techniques used to measure fair value. These inputs are summarized into three broad levels:
Level 1 – Unadjusted quoted prices in active markets the Fund has the ability to access for identical assets or liabilities.
Level 2 – Observable inputs other than unadjusted quoted prices included in Level 1 that are observable for the asset or liability either directly or indirectly. These inputs may include quoted prices for the identical instrument on an inactive market, prices for similar instruments, interest rates, prepayment speeds, credit risk, yield curves, default rates and similar data.
Assets or liabilities categorized as Level 2 in the hierarchy generally include: debt securities fair valued in accordance with the evaluated bid or ask prices supplied by a pricing service; securities traded on OTC markets and listed securities for which no sales are reported that are fair valued at the latest bid price (or yield equivalent thereof) obtained from one or more dealers transacting in a market for such securities or by a pricing service approved by the Fund’s Trustees; and certain short-term debt securities with maturities of 60 days or less that are fair valued at amortized cost. Other securities that may be categorized as Level 2 in the hierarchy include, but are not limited to, preferred stocks, bank loans, swaps, investments in unregistered investment companies, options, and forward contracts.
Level 3 – Unobservable inputs for the asset or liability to the extent that relevant observable inputs are not available, representing the Fund’s own assumptions about the assumptions that a market participant would use in valuing the asset or liability, and that would be based on the best information available.
There have been no significant changes in valuation techniques used in valuing any such positions held by the Fund since the beginning of the fiscal year.
The inputs or methodology used for fair valuing securities are not necessarily an indication of the risk associated with investing in those securities. The summary of inputs used as of October 31, 2018 to fair value the Fund’s investments in securities and other financial instruments is included in the “Valuation Inputs Summary” in the Notes to Schedule of Investments and Other Information.
There were no transfers between Level 1, Level 2 and Level 3 of the fair value hierarchy during the period. The Fund recognizes transfers between the levels as of the beginning of the fiscal year.
Investment Transactions and Investment Income
Investment transactions are accounted for as of the date purchased or sold (trade date). Dividend income is recorded on the ex-dividend date. Certain dividends from foreign securities will be recorded as soon as the Fund is informed of the dividend, if such information is obtained subsequent to the ex-dividend date. Dividends from foreign securities may be subject to withholding taxes in foreign jurisdictions. Interest income is recorded on the accrual basis and includes amortization of premiums and accretion of discounts. Gains and losses are determined on the identified cost basis, which is the same basis used for federal income tax purposes.
Estimates
The preparation of financial statements in conformity with accounting principles generally accepted in the United States of America requires management to make estimates and assumptions that affect the reported amount of assets and liabilities and disclosure of contingent assets and liabilities at the date of the financial statements and the reported amounts of income and expenses during the reporting period. Actual results could differ from those estimates.
Indemnifications
In the normal course of business, the Fund may enter into contracts that contain provisions for indemnification of other parties against certain potential liabilities. The Fund’s maximum exposure under these arrangements is unknown, and would involve future claims that may be made against the Fund that have not yet occurred. Currently, the risk of material loss from such claims is considered remote.
Janus Henderson Mortgage-Backed Securities ETF
Notes to Financial Statements
Dividends and Distributions
Dividends from net investment income are generally declared and distributed monthly. Net realized capital gains (if any) are distributed annually. The Fund may treat a portion of the amount paid to redeem shares as a distribution of investment company taxable income and realized capital gains that are reflected in the NAV. This practice, commonly referred to as “equalization,” has no effect on the redeeming shareholder or a Fund’s total return, but may reduce the amounts that would otherwise be required to be paid as taxable dividends to the remaining shareholders. It is possible that the Internal Revenue Service (IRS) could challenge the Fund’s equalization methodology or calculations, and any such challenge could result in additional tax, interest, or penalties to be paid by the Fund.
Federal Income Taxes
The Fund intends to continue to qualify as a regulated investment company and distribute all of its taxable income in accordance with the requirements of Subchapter M of the Internal Revenue Code. Management has analyzed the Fund’s tax positions taken for all open federal income tax years, generally a three-year period, and has concluded that no provision for federal income tax is required in the Fund’s financial statements. The Fund is not aware of any tax positions for which it is reasonably possible that the total amounts of unrecognized tax benefits will significantly change in the next twelve months.
On December 22, 2017, the Tax Cuts and Jobs Act was signed into law. Currently, Management does not believe the bill will have a material impact on the Fund’s intention to continue to qualify as a regulated investment company, which is generally not subject to U.S. federal income tax.
2. Derivative Instruments
The Fund may invest in various types of derivatives. A derivative is a financial instrument whose performance is derived from the performance of another asset. The Fund may invest in derivative instruments including, but not limited to: futures contracts, options, and swaps. Each derivative instrument that was held by the Fund during the period ended October 31, 2018 is discussed in further detail below.
The Fund may use derivative instruments for risk various investment purposes, such as to manage or hedge portfolio risk, including interest rate risk, or to manage duration. The Fund’s use of derivative instruments involves risks different from, or possibly greater than, the risks associated with investing directly in securities and other traditional investments. Derivatives are subject to a number of risks including liquidity risk, market risk, credit risk, default risk, counterparty risk and management risk. They also involve the risk of mispricing or improper valuation and the risk that changes in the value of the derivative may not correlate exactly with the change in the value of the underlying asset, rate or index. Also, suitable derivative transactions may not be available in all circumstances and there can be no assurance that the Fund will engage in these transactions to reduce exposure to other risks when that would be beneficial. The Fund’s ability to use derivatives may also be limited by certain regulatory and tax considerations.
In pursuit of its investment objective, the Fund may seek to use derivatives to increase or decrease exposure to the following market risk factors:
| • | | Counterparty Risk – the risk that the counterparty (the party on the other side of the transaction) on a derivative transaction will be unable to honor its financial obligation to the Fund. |
| • | | Credit Risk – the risk an issuer will be unable to make principal and interest payments when due, or will default on its obligations. |
| • | | Equity Risk – the risk related to the change in value of equity securities as they relate to increases or decreases in the general market. |
| • | | Index Risk – if the derivative is linked to the performance of an index, it will be subject to the risks associated with changes in that index. If the index changes, the Fund could receive lower interest payments or experience a reduction in the value of the derivative to below what the Fund paid. Certain indexed securities, including inverse securities (which move in an opposite direction to the index), may create leverage, to the extent that they increase or decrease in value at a rate that is a multiple of the changes in the applicable index. |
| • | | Interest Rate Risk – the risk that the value of fixed-income securities will generally decline as prevailing interest rates rise, which may cause the Fund’s NAV to likewise decrease. |
| • | | Liquidity Risk – the risk that certain securities may be difficult or impossible to sell at the time that the seller would like or at the price that the seller believes the security is currently worth. |
| | |
| | Janus Detroit Street Trust ½ 17 |
Janus Henderson Mortgage-Backed Securities ETF
Notes to Financial Statements
Derivatives may generally be traded OTC or on an exchange. Derivatives traded OTC are agreements that are individually negotiated between parties and can be tailored to meet a purchaser’s needs. OTC derivatives are not guaranteed by a clearing agency and may be subject to increased credit risk.
In an effort to mitigate credit risk associated with derivatives traded OTC, the Fund may enter into collateral agreements with certain counterparties whereby, subject to certain minimum exposure requirements, the Fund may require the counterparty to post collateral if the Fund has a net aggregate unrealized gain on all OTC derivative contracts with a particular counterparty. Additionally, the Fund may deposit cash and/or treasuries as collateral with the counterparty and/ or custodian daily (based on the daily valuation of the financial asset) if the Fund has a net aggregate unrealized loss on OTC derivative contracts with a particular counterparty. All liquid securities and restricted cash are considered to cover in an amount at all times equal to or greater than the Fund’s commitment with respect to certain exchange-traded derivatives, centrally cleared derivatives, forward foreign currency exchange contracts, short sales, and/or securities with extended settlement dates. There is no guarantee that counterparty exposure is reduced and these arrangements are dependent on Janus Capital’s ability to establish and maintain appropriate systems and trading.
Futures Contracts
A futures contract is an exchange-traded agreement to take or make delivery of an underlying asset at a specific time in the future for a specific predetermined negotiated price. The Fund may enter into futures contracts to gain exposure to the stock market or other markets pending investment of cash balances or to meet liquidity needs. The Fund is subject to interest rate risk, equity risk, and currency risk in the normal course of pursuing its investment objective through its investments in futures contracts. The Fund may also use such derivative instruments to hedge or protect from adverse movements in securities prices, currency rates or interest rates. The use of futures contracts may involve risks such as the possibility of illiquid markets or imperfect correlation between the values of the contracts and the underlying securities, or that the counterparty will fail to perform its obligations.
Futures contracts on commodities are valued at the settlement price on valuation date on the commodities exchange as reported by an approved vendor. Mini contracts, as defined in the description of the contract, shall be valued using the Actual Settlement Price or “ASET” price type as reported by an approved vendor. Futures contracts are marked-to-market daily, and the daily variation margin is recorded as a receivable or payable on the Statement of Assets and Liabilities (if applicable). The change in unrealized net appreciation/depreciation is reported on the Statement of Operations (if applicable). When a contract is closed, a realized gain or loss is reported on the Statement of Operations (if applicable), equal to the difference between the opening and closing value of the contract.
Securities held by the Fund that are designated as collateral for market value on futures contracts are noted on the Schedule of Investments (if applicable). Such collateral is in the possession of the Fund’s futures option merchant.
With futures, there is minimal counterparty credit risk to the Fund since futures are exchange-traded and the exchange’s clearinghouse, as counterparty to all exchange-traded futures, guarantees the futures against default.
During the year, the Fund purchased interest rate futures to increase exposure to interest rate risk.
During the year, the Fund sold interest rate futures to decrease exposure to interest rate risk.
3. Other Investments and Strategies
Additional Investment Risk
The Fund may be invested in lower-rated debt securities that have a higher risk of default or loss of value since these securities may be sensitive to economic changes, political changes, or adverse developments specific to the issuer.
The financial crisis in both the U.S. and global economies over the past several years has resulted, and may continue to result, in a significant decline in the value and liquidity of many securities of issuers worldwide in the equity and fixed income/credit markets. In response to the crisis, the United States and certain foreign governments, along with the U.S. Federal Reserve and certain foreign central banks, took steps to support the financial markets. The withdrawal of this support, a failure of measures put in place to respond to the crisis, or investor perception that such efforts were not sufficient could each negatively affect financial markets generally, and the value and liquidity of specific securities. In addition, policy and legislative changes in the United States and in other countries continue to impact many aspects of financial regulation. The effect of these changes on the markets, and the practical implications for market participants, including the Fund, may not be fully known for some time. As a result, it may also be unusually difficult to identify both investment risks and opportunities, which could limit or preclude the Fund’s ability to achieve its investment objective. Therefore, it is important to understand that the value of your investment may fall, sometimes sharply, and you could lose money.
Janus Henderson Mortgage-Backed Securities ETF
Notes to Financial Statements
The enactment of the Dodd-Frank Wall Street Reform and Consumer Protection Act (the “Dodd-Frank Act”) provided for widespread regulation of financial institutions, consumer financial products and services, broker-dealers, OTC derivatives, investment advisers, credit rating agencies, and mortgage lending, which expanded federal oversight in the financial sector, including the investment management industry. Certain provisions of the Dodd-Frank Act remain pending and will be implemented through future rulemaking. Therefore, the ultimate impact of the Dodd-Frank Act and the regulations under the Dodd-Frank Act on the Fund and the investment management industry as a whole, is not yet certain.
Counterparties
Fund transactions involving a counterparty are subject to the risk that the counterparty or a third party will not fulfill its obligation to the Fund (“counterparty risk”). Counterparty risk may arise because of the counterparty’s financial condition (i.e., financial difficulties, bankruptcy, or insolvency), market activities and developments, or other reasons, whether foreseen or not. A counterparty’s inability to fulfill its obligation may result in significant financial loss to the Fund. The Fund may be unable to recover its investment from the counterparty or may obtain a limited recovery, and/or recovery may be delayed. The extent of the Fund’s exposure to counterparty risk with respect to financial assets and liabilities approximates its carrying value.
The Fund may be exposed to counterparty risk through participation in various programs, including, but not limited to, lending its securities to third parties, cash sweep arrangements whereby the Fund’s cash balance is invested in one or more types of cash management vehicles, as well as investments in, but not limited to, repurchase agreements, and derivatives, including various types of swaps, futures and options. The Fund intends to enter into financial transactions with counterparties that Janus Capital believes to be creditworthy at the time of the transaction. There is always the risk that Janus Capital’s analysis of a counterparty’s creditworthiness is incorrect or may change due to market conditions. To the extent that the Fund focuses its transactions with a limited number of counterparties, it will have greater exposure to the risks associated with one or more counterparties.
Mortgage and Asset-Backed Securities
The Fund purchases fixed or variable rate commercial or residential mortgage-backed securities issued by the Government National Mortgage Association (“Ginnie Mae”), the Federal National Mortgage Association (“Fannie Mae”), the Federal Home Loan Mortgage Corporation (“Freddie Mac”), or other governmental or government-related entities. Ginnie Mae’s guarantees are backed by the full faith and credit of the U.S. Government. Historically, Fannie Mae and Freddie Mac securities were not backed by the full faith and credit of the U.S. Government. In September 2008, the Federal Housing Finance Agency (“FHFA”), an agency of the U.S. Government, placed Fannie Mae and Freddie Mac under conservatorship. Since that time, Fannie Mae and Freddie Mac have received capital support through U.S. Treasury preferred stock purchases, and Treasury and Federal Reserve purchases of their mortgage-backed securities. The FHFA and the U.S. Treasury have imposed strict limits on the size of these entities’ mortgage portfolios. The FHFA has the power to cancel any contract entered into by Fannie Mae and Freddie Mac prior to FHFA’s appointment as conservator or receiver, including the guarantee obligations of Fannie Mae and Freddie Mac.
Asset-backed securities may be backed by various consumer obligations, including automobile loans, equipment leases, credit card receivables, or other collateral. In the event the underlying loans are not paid, the securities’ issuer could be forced to sell the assets and recognize losses on such assets, which could impact your return. Unlike traditional debt instruments, payments on mortgage-backed and other asset-backed securities include both interest and a partial payment of principal. Prepayment of the principal of underlying loans at a faster pace than expected is known as “prepayment risk,” and may shorten the effective maturities of these securities. This may result in the Fund having to reinvest proceeds at a lower interest rate. Mortgage and asset-backed securities tend to be more sensitive to changes in interest rates than other types of debt securities. In addition to prepayment risk, investments in mortgage-backed securities, particularly those comprised of subprime mortgages, and investments in other asset-backed securities comprised of under-performing assets may be subject to a higher degree of credit risk, valuation risk, and liquidity risk than other mortgage- and asset-backed securities. Mortgage and asset-backed securities are also subject to extension risk, which is the risk that rising interest rates could cause mortgages or other obligations underlying these securities to be paid more slowly than expected, increasing the Fund’s sensitivity to interest rate changes and causing its price to decline.
When-Issued, Delayed Delivery and Forward Commitment Transactions
The Fund typically will enter into “to be announced” commitments to purchase mortgage-backed securities and may purchase or sell other securities on a when-issued, delayed delivery, or forward commitment basis.
When purchasing a security on a when-issued, delayed delivery, or forward commitment basis, the Fund assumes the rights and risks of ownership of the security, including the risk of price and yield fluctuations, and takes such fluctuations
| | |
| | Janus Detroit Street Trust ½ 19 |
Janus Henderson Mortgage-Backed Securities ETF
Notes to Financial Statements
into account when determining its net asset value. Because the Fund is not required to pay for the security until the delivery date, these risks are in addition to the risks associated with the Fund’s other investments. If the other party to a transaction fails to deliver the securities, the Fund could miss a favorable price or yield opportunity. If the Fund remains substantially fully invested at a time when when-issued, delayed delivery, or forward commitment purchases are outstanding, the purchases may result in a form of leverage.
When the Fund has sold a security on a when-issued, delayed delivery, or forward commitment basis, the Fund does not participate in future gains or losses with respect to the security. If the other party to a transaction fails to pay for the securities, the Fund could suffer a loss. Additionally, when selling a security on a when-issued, delayed delivery, or forward commitment basis without owning the security, the Fund will incur a loss if the security’s price appreciates in value such that the security’s price is above the agreed upon price on the settlement date.
The Fund may dispose of or renegotiate a transaction after it is entered into, and may purchase or sell when-issued, delayed delivery or forward commitment securities before the settlement date, which may result in a gain or loss.
To facilitate TBA commitments, the Fund is required to segregate or otherwise earmark liquid assets marked to market daily in an amount at least equal to such TBA commitments. Rules of the Financial Industry Regulatory Authority (“FINRA”) which are expected to be effective in March 2019, include mandatory margin requirements for TBA commitments which, in some circumstances, will require the Fund to also post collateral. These collateral requirements may increase costs associated with the Fund’s participation in the TBA market.
4. Investment Advisory Agreements and Other Transactions with Affiliates
Under its unitary fee structure, the Fund pays Janus Capital a management fee in return for providing certain investment advisory, supervisory, and administrative services to the Fund, including the costs of transfer agency, custody, fund administration, legal, audit, and other services. Janus Capital’s fee structure is designed to pay substantially all of the Fund’s expenses. However, the Fund bears other expenses which are not covered under the management fee which may vary and affect the total level of expenses paid by shareholders, such as distribution fees (if any), brokerage expenses or commissions, interest, dividends, taxes, litigation expenses, acquired fund fees and expenses (if any), and extraordinary expenses. The Fund’s management fee is calculated daily and paid monthly. For the period ended October 31, 2018, the Fund’s contractual management fee rate (expressed as an annual rate) was 0.35% of the Fund’s average daily net assets.
State Street Bank and Trust Company (“State Street”) provides certain fund administration services to the Fund, including services related to the Fund’s accounting, including calculating the daily NAV, audit, tax, and reporting obligations, pursuant to an agreement with Janus Capital, on behalf of the Fund. As compensation for such services, Janus Capital pays State Street a fee based on a percentage of the Fund’s assets, with a minimum flat fee, for certain services. Janus Capital serves as administrator to the Fund, providing oversight and coordination of the Fund’s service providers, recordkeeping and other administrative services. Janus Capital does not receive any additional compensation, beyond the unitary fee, for serving as administrator. State Street also serves as transfer agent for the shares of the Fund.
The Trust has adopted a Distribution and Servicing Plan for shares of the Fund pursuant to Rule 12b-1 under the 1940 Act (the “Plan”). The Plan permits compensation in connection with the distribution and marketing of Fund shares and/or the provision of certain shareholder services. The Plan permits the Fund to pay ALPS Distributors, Inc. (the “Distributor”) or its designee, a fee for the sale and distribution and/or shareholder servicing of the shares at an annual rate of up to 0.25% of average daily net assets of the Fund. However, the Trustees have determined not to authorize payment under this Plan at this time. Under the terms of the Plan, the Trust is authorized to make payments to the Distributor or its designee for remittance to retirement plan service providers, broker dealers, bank trust departments, financial advisors, and other financial intermediaries, as compensation for distribution and/or shareholder services performed by such entities for their customers who are investors in the Fund. The 12b-1 fee may only be imposed or increased when the Trustees determine that it is in the best interests of shareholders to do so. Because these fees are paid out of the Fund’s assets on an ongoing basis, to the extent that a fee is authorized, over time they will increase the cost of an investment in the Fund. The Plan fee may cost an investor more than other types of sales charges.
As of October 31, 2018, Janus Capital owned 200,001 shares or approximately 30.78% of the Fund.
The Fund is permitted to purchase or sell securities (“cross-trade”) between itself and other funds or accounts managed by Janus Capital in accordance with Rule 17a-7 under the Investment Company Act of 1940 (“Rule 17a-7”), when the transaction is consistent with the investment objectives and policies of the Fund and in accordance with the Internal Cross Trade Procedures adopted by the Trust’s Board of Trustees. These procedures have been designed to ensure that
Janus Henderson Mortgage-Backed Securities ETF
Notes to Financial Statements
any cross-trade of securities by the Fund from or to another fund or account that is or could be considered an affiliate of the Fund under certain limited circumstances by virtue of having a common investment adviser, common Officer, or common Trustee complies with Rule 17a-7. Under these procedures, each cross-trade is effected at the current market price to save costs where allowed. During the period ended October 31, 2018, the Fund engaged in cross trades amounting to $3,345,884 in purchases and $138,068 in sales, resulting in a net realized loss of $133. The net realized loss is included within the “Net Realized Gain/(Loss) on Investments” section of the Fund’s Statement of Operations.
5. Federal Income Tax
The tax components of capital shown in the table below represent: (1) distribution requirements the Fund must satisfy under the income tax regulations; (2) losses or deductions the Fund may be able to offset against income and gains realized in future years; and (3) unrealized appreciation or depreciation of investments for federal income tax purposes.
Other book to tax differences primarily consist of derivatives, and foreign currency contract adjustments. The Fund has elected to treat gains and losses on forward foreign currency contracts as capital gains and losses, if applicable. Other foreign currency gains and losses on debt instruments are treated as ordinary income for federal income tax purposes pursuant to Section 988 of the Internal Revenue Code.
| | | | | | | | | | | | | | | | | | | | | | | | | | |
| | | | | | | | | | Loss Deferrals | | | | | | | |
Undistributed
Ordinary Income | | | Undistributed
Long-Term Gains | | | Accumulated
Capital Losses | | | Late-Year
Ordinary Loss | | | Post-October
Capital Loss | | | Other Book to Tax Differences | | | Net Tax Appreciation/
(Depreciation) | |
| $ | 111,299 | | | $ | — | | | $ | (254,158) | | | $ | — | | | $ | — | | | $ | — | | | $ | (174,951) | |
Accumulated capital losses noted below represent net capital loss carryovers, as of October 31, 2018, that may be available to offset future realized capital gains and thereby reduce future taxable gains distributions. The following table shows these capital loss carryovers.
| | | | | | | | | | |
Capital Loss Carryover Schedule
For the year ended October 31, 2018
No Expiration | | | Accumulated
Capital Losses | |
| Short-Term | | | Long-Term | |
| $ | (254,158) | | | $ | — | | | $ | (254,158) | |
The aggregate cost of investments and the composition of unrealized appreciation and depreciation of investment securities for federal income tax purposes as of October 31, 2018 are noted below. The primary difference between book and tax appreciation or depreciation of investments is wash sale loss deferrals.
| | | | | | | | | | | | | | |
| Federal Tax Cost | | | Unrealized
Appreciation | | | Unrealized
(Depreciation) | | | Net Tax Appreciation/
(Depreciation) | |
| $ | 56,878,599 | | | $ | 8,951 | | | $ | (180,457) | | | $ | (171,506) | |
Information on the tax components of derivatives as of October 31, 2018 is as follows:
| | | | | | | | | | | | | | |
| Federal Tax Cost | | | Unrealized
Appreciation | | | Unrealized
(Depreciation) | | | Net Tax Appreciation/
(Depreciation) | |
| $ | (3,850,137) | | | $ | — | | | $ | (3,445) | | | $ | (3,445) | |
Permanent book to tax basis differences may result in reclassifications between the components of net assets. These differences have no impact on the results of operations or net assets. The following reclassifications have been made to the Fund:
| | | | | | | | | | |
| Increase/(Decrease) to Capital | | | Increase/(Decrease) to Undistributed
Net Investment Income/Loss | | | Increase/(Decrease) to Undistributed
Net realized Gain/Loss | |
| $ | (1) | | | $ | — | | | $ | 1 | |
| | |
| | Janus Detroit Street Trust ½ 21 |
Janus Henderson Mortgage-Backed Securities ETF
Notes to Financial Statements
6. Capital Share Transactions
| | | | | | | | |
| | | Period ended October 31, 2018(1) | |
| | | Shares | | | Amount | |
| Shares sold | | | 650,001 | | | $ | 32,510,943 | |
| Shares repurchased | | | — | | | | — | |
| Net Increase/(Decrease) | | | 650,001 | | | $ | 32,510,943 | |
| (1) | Period from September 12, 2018 (commencement of operations) through October 31, 2018. |
7. Purchases and Sales of Investment Securities
For the period ended October 31, 2018, the aggregate cost of purchases and proceeds from sales of investment securities (excluding any short-term securities, short-term options contracts, TBAs, and in-kind transactions) was as follows:
| | | | | | | | | | | | | | |
Purchases of Securities | | | Proceeds from Sales of Securities | | | Purchases of Long- Term U.S. Government Obligations | | | Proceeds from Sales of Long-Term U.S. Government Obligations | |
| $ | 70,685,536 | | | $ | 36,229,824 | | | $ | — | | | $ | — | |
8. Recent Accounting Pronouncements
The Securities and Exchange Commission adopted amendments to Regulation S-X, for the presentation of distributable earnings and distributions to align with US Generally Accepted Accounting Principles (GAAP). The compliance date of the amendments to Regulation S-X is November 5, 2018. This report incorporates the amendments to Regulation S-X.
The FASB issued Accounting Standards Update No. 2017-08, Receivables – Nonrefundable Fees and Other Costs (Subtopic 310-20), Premium Amortization on Purchased Callable Debt Securities (“ASU 2017-08”) to amend the amortization period for certain purchased callable debt securities held at a premium. The guidance requires certain premiums on callable debt securities to be amortized to the earliest call date. The amortization period for callable debt securities purchased at a discount will not be impacted. The amendments are effective for fiscal years, and interim periods within those fiscal years, beginning after December 15, 2018. Early adoption is permitted, including adoption in an interim period. Management is currently evaluating the impacts of ASU 2017-08 on the Fund’s financial statements.
The FASB issued Accounting Standards Update 2018-13, Fair Value Measurement (Topic 820) in August 2018. The new guidance removes, modifies and enhances the disclosures to Topic 820. For public entities, the amendments are effective for financial statements issued for fiscal years beginning after December 15, 2019, and interim periods within those fiscal years. Management is currently evaluating the impact of this new guidance on the financial statements.
9. Subsequent Events
Management has evaluated whether any events or transactions occurred subsequent to October 31, 2018 and through the date of issuance of the Fund’s financial statements and determined that there were no material events or transactions that would require recognition or disclosure in the Fund’s financial statements other than the following:
Fund’s Board of Trustees (“Board”) approved an amendment to the Fund’s Investment Advisory and Management Agreement, which provides for a new management fee rate schedule that reduces the annual management fee rate payable by the Fund to Janus Capital as the Fund’s assets grow. The new annual management fee rate is effective November 1, 2018 and is provided below.
| | | | |
New Management Fee Rate (As a Percentage of Daily Net Assets) | |
| $0-$500 million | | | 0.35% | |
| Next $500 million | | | 0.28% | |
| Over $1 billion | | | 0.20% | |
Janus Henderson Mortgage-Backed Securities ETF
Additional Information (unaudited)
Proxy Voting Policies and Voting Record
A description of the policies and procedures that the Fund uses to determine how to vote proxies relating to its portfolio securities is available without charge: (i) upon request, by calling 1-800-525-0020 (toll free); (ii) on the Fund’s website at janushenderson.com/proxyvoting; and (iii) on the SEC’s website at http://www.sec.gov.
Quarterly Portfolio Holdings
The Fund files its complete portfolio holdings (schedule of investments) with the SEC for the first and third quarters of each fiscal year on Form N-Q within 60 days of the end of such fiscal quarter. The Fund’s Form N-Q: (i) is available on the SEC’s website at http://www.sec.gov; (ii) may be reviewed and copied at the SEC’s Public Reference Room in Washington, D.C. (information on the Public Reference Room may be obtained by calling 1-800-SEC-0330); and (iii) is available without charge, upon request, by calling Janus Henderson at 1-800-525-0020 (toll free).
| | |
| | Janus Detroit Street Trust ½ 23 |
Janus Henderson Mortgage-Backed Securities ETF
Board Considerations Regarding Approval of Investment Advisory Agreements (unaudited)
The Trustees of Janus Detroit Street Trust (the “Trust”), including the Trustees who are not “interested persons” as that term is defined in the Investment Company Act of 1940, as amended (the “Independent Trustees”), met on July 18, 2018 to consider the proposed investment management agreement (the “Investment Management Agreement”) for Janus Henderson Mortgage-Backed Securities ETF (the “New Fund”). In the course of their consideration of the Investment Management Agreement, the Trustees met in executive session and were advised by their independent counsel. In this regard, the Board, including the Independent Trustees, evaluated the terms of the Investment Management Agreement and reviewed the duties and responsibilities of the Trustees in evaluating and approving such agreements. In considering approval of the Investment Management Agreement, the Board, including the Independent Trustees, reviewed the materials provided to it relating to their consideration of the Investment Management Agreement for the New Fund and other information provided by counsel and Janus Capital Management LLC, the proposed investment adviser to the New Fund (the “Adviser”), including: (i) a copy of the form of Investment Management Agreement with respect to the Adviser’s management of the assets of the New Fund; (ii) information regarding the nature, quality and extent of the services to be provided to the New Fund by the Adviser, and the fees to be charged to the New Fund therefor; (iii) information concerning the Adviser’s financial condition, business, operations, portfolio management personnel and compliance programs; (iv) information describing the New Fund’s anticipated advisory fee structure and operating expenses; (v) a copy of the Adviser’s current Form ADV; and (vi) a memorandum from counsel on the responsibilities of trustees in considering investment advisory arrangements under the 1940 Act. The Board also considered presentations made by, and discussions held with, representatives of the Adviser. The Board also received information comparing the proposed advisory fee and expenses of the New Fund to those of mutual funds and exchange-traded funds (“ETFs”) considered to be competitors.
During its review of this information, the Board focused on and analyzed the factors that it deemed relevant, including: the nature, extent and quality of the services to be provided to the New Fund by the Adviser; the Adviser’s personnel and operations; the New Fund’s proposed expense level; the anticipated profitability to the Adviser under the Investment Management Agreement at certain asset levels; any “fall-out” benefits to the Adviser and its affiliates (i.e., the ancillary benefits realized by the Adviser and its affiliates from the Adviser’s relationship with the Trust); the effect of asset growth on the New Fund’s expenses; and potential conflicts of interest.
The Trustees also considered benefits that accrue to the Adviser and its affiliates from their relationships with the New Fund. The Trustees also concluded that, other than the services provided by the Adviser and its affiliates pursuant to agreements with the New Fund and the fees to be paid by the New Fund therefor, the New Fund and the Adviser may potentially benefit from their relationship with each other in other ways. The Trustees concluded that the success of the New Fund could attract other business to the Adviser or other Janus Henderson funds, and that the success of the Adviser could enhance the Adviser’s ability to serve the New Fund.
The Board, including the Independent Trustees, considered the following in respect of the New Fund:
(a) The nature, extent and quality of services to be provided by the Adviser; personnel and operations of the Adviser.
The Board reviewed the services that the Adviser would provide to the New Fund. In connection with the investment advisory services to be provided by the Adviser, the Board noted the responsibilities that the Adviser would have as the New Fund’s investment adviser, including: the overall supervisory responsibility for the general management and investment of the New Fund’s securities portfolio; providing oversight of the investment performance and processes and compliance with the New Fund’s investment objectives, policies and limitations; the implementation of the investment management program of the New Fund; the management of the day-to-day investment and reinvestment of the assets of the New Fund; determining daily baskets of securities and cash components in connection with creation and redemption transactions in the New Fund’s shares; executing portfolio security trades for purchases and redemptions of New Fund shares conducted on a cash-in-lieu basis; the review of brokerage matters; the oversight of general portfolio compliance with relevant law; and the implementation of Board directives as they relate to the New Fund.
The Board reviewed the Adviser’s experience, resources and strengths in managing other pooled investment vehicles, such as the other funds in the Trust, including the Adviser’s personnel. Based on its consideration and review of the foregoing information, the Board determined that the New Fund was likely to benefit from the nature, quality and extent of these services, as well as the Adviser’s ability to render such services based on the Adviser’s experience, personnel, operations and resources.
(b) Comparison of services to be rendered and fees to be paid under other investment advisory contracts, and the cost of the services to be provided and profits to be realized by the Adviser from the relationship with the New Fund; “fall-out” benefits.
The Board then compared both the services to be rendered and the proposed fees to be paid under other contracts of the Adviser, and under contracts of other investment advisers with respect to similar mutual funds and ETFs. In particular,
Janus Henderson Mortgage-Backed Securities ETF
Board Considerations Regarding Approval of Investment Advisory Agreements (unaudited)
the Board compared the New Fund’s proposed management fee and projected expense ratio to other investment companies anticipated to be in the New Fund’s peer group. The Board noted that the Adviser was recommending a unitary fee that was lower than the New Fund’s respective peer group median total expense ratio for the actively managed mutual funds and ETFs in the peer group.
The Board also discussed the anticipated costs and projected profitability of the Adviser in connection with its serving as investment adviser to the New Fund, including operational costs. After comparing the New Fund’s proposed fees with those of other mutual funds and ETFs in the New Fund’s anticipated peer group, and in light of the nature, extent and quality of services proposed to be provided by the Adviser and the costs expected to be incurred by the Adviser in rendering those services, the Board concluded that the level of fee proposed to be paid to the Adviser with respect to the New Fund was fair and reasonable.
The Board also considered that the Adviser may experience reputational “fall-out” benefits based on the success of the New Fund, but that such benefits are not easily quantifiable.
(c) The extent to which economies of scale would be realized as the Fund grows and whether fee levels would reflect such economies of scale.
The Board next discussed potential economies of scale. Since the New Fund had not commenced operations, and the eventual aggregate amount of assets was uncertain, the Adviser was not able to provide the Board specific information concerning the extent to which economies of scale would be realized as the New Fund grows and whether the management fee level would reflect such economies of scale, if any. The Board recognized the uncertainty in launching a new investment product and estimating future asset levels.
(d) Investment performance of the Fund and the Adviser.
Because the New Fund is newly formed and had not commenced operations, the Board did not consider the investment performance of the New Fund. However, the Board considered the experience of the Adviser in managing similar investment strategies.
Conclusion.
No single factor was determinative to the decision of the Board. Based on the foregoing and such other matters as were deemed relevant, the Board concluded that the proposed management fee rate and projected total expense ratio are reasonable in relation to the services to be provided by the Adviser to the New Fund, as well as the costs to be incurred and benefits to be gained by the Adviser in providing such services. The Board also found the proposed management fee to be reasonable in comparison to the fees charged by advisers to other comparable mutual funds and ETFs of similar anticipated size. As a result, the Board concluded that the initial approval of the Investment Management Agreement was in the best interests of the New Fund.
After full consideration of the above factors, as well as other factors, the Trustees, including all of the Independent Trustees voting separately, determined to approve the Investment Management Agreement for the New Fund.
APPROVAL OF AMENDMENT TO INVESTMENT ADVISORY AGREEMENT
At an in-person meeting held on October 9-10, 2018, the Trustees of the Trust, including the Independent Trustees, unanimously approved an amendment to the New Fund’s Investment Management Agreement (“Amendment”). The Amendment provided for a new management fee rate schedule that reduces the annual management fee rate payable by the New Fund to the Adviser as the New Fund’s assets grow. The new fee rate schedule (expressed as an annual rate) is as follows:
| | | | |
| New Fee Rate | |
| $0-$500 million | | | 0.35% | |
| Next $500 million | | | 0.28% | |
| Over $1 billion | | | 0.20% | |
In connection with the Amendment approval, the Adviser represented to the Trustees that there would be no change to the nature, quality and extent of services rendered by the Adviser to the New Fund. The Amendment is effective as of November 1, 2018.
| | |
| | Janus Detroit Street Trust ½ 25 |
Janus Henderson Mortgage-Backed Securities ETF
Trustees and Officers (unaudited)
The Fund’s Statement of Additional Information includes additional information about the Trustees and officers and is available, without charge, by calling 1-877-335-2687.
The following are the Trustees and officers of the Trust, together with a brief description of their principal occupations during the last five years (principal occupations for certain Trustees may include periods over five years).
Each Trustee has served in that capacity since he or she was originally elected or appointed. The Trustees do not serve a specified term of office. Each Trustee will hold office until the termination of the Trust or his or her earlier death, resignation, retirement, incapacity, or removal. Under the Fund’s Governance Procedures and Guidelines, the policy is for Trustees to retire no later than the end of the calendar year in which the Trustee turns 75. The Trustees review the Fund’s Governance Procedures and Guidelines from time to time and may make changes they deem appropriate. The Fund’s Nominating and Governance Committee will consider nominees for the position of Trustee recommended by shareholders. Shareholders may submit the name of a candidate for consideration by the Committee by submitting their recommendations to the Trust’s Secretary. Each Trustee is currently a Trustee of one other registered investment company advised by Janus Capital: Clayton Series Trust. Collectively, these two registered investment companies consist of 10 series or funds.
The Trust’s officers are elected annually by the Trustees for a one-year term. Certain officers also serve as officers of Clayton Series Trust. Certain officers of the Fund may also be officers and/or directors of Janus Capital. Fund officers receive no compensation from the Fund, except for the Fund’s Chief Compliance Officer, as authorized by the Trustees.
| | | | | | | | | | | | | | | | | | |
| TRUSTEES | | | | | | | | | | | | | | |
| Name, Address, and Age | | Positions Held
with the Trust | | | Length of Time Served | | | Principal Occupations
During the Past Five Years | | Number of Portfolios/Funds in Fund Complex Overseen by
Trustee* | | | Other Directorships
Held by Trustee
During the Past Five Years | |
Independent Trustees | | | | | | | | | | | | | | | | | | |
Clifford J. Weber 151 Detroit Street Denver, CO 80206 DOB: 1963 | |
| Chairman
Trustee |
| |
| 2/16-Present
2/16-Present |
| | Owner, Financial Products Consulting Group LLC (consulting services to financial institutions) (since 2015). Formerly, Executive Vice President of Global Index and Exchange- Traded Products, NYSE Market, Inc., a subsidiary of Intercontinental Exchange (ETF/ETP listing exchange) (2013-2015) and Executive Vice President and Head of Strategy and Product Development, NYSE Liffe U.S., a division of NYSE Euronext (U.S. futures exchange) (2008-2013). | | | 10 | | |
| Independent Trustee, Clough
Funds Trust (investment
company) (since 2015).
Chairman, Clough Funds
Trust (since 2017),
Independent Trustee, Clough
Dividend and Income Fund
(closed-end fund) (since
2017), Independent Trustee,
Clough Global Opportunities
Fund (closed-end fund)
(since 2017), Independent
Trustee, Clough Global
Equity Fund (closed-end
fund) (since 2017),
Independent Trustee,
Elevation ETF Trust
(investment company)
(2016-2018) Chairman,
Elevation ETF Trust
(2016-2018), and
Independent Trustee,
Global X Funds (investment
company) (since 2018). |
|
Janus Henderson Mortgage-Backed Securities ETF
Trustees and Officers (unaudited)
| | | | | | | | | | | | | | | | | | |
| TRUSTEES | | | | | | | | | | | | | | |
| Name, Address, and Age | | Positions Held
with the Trust | | | Length of Time Served | | | Principal Occupations
During the Past Five Years | | Number of Portfolios/Funds in Fund Complex Overseen by
Trustee* | | | Other Directorships
Held by Trustee
During the Past Five Years | |
Maureen T. Upton 151 Detroit Street Denver, CO 80206 DOB: 1965 | | | Trustee | | | | 2/16-Present | | | Principal, Maureen Upton Ltd. (consulting services to developers of major infrastructure projects and investors) (since 2017). Formerly, Principal Consultant, SRK Consulting (U.S.), Inc. (consulting services to global mining, energy and water resource industries) (2015-2017) and Founder and Principal, Resource Initiatives LLC (sustainability consulting firm) (2006-2015). | | | 10 | | |
| Director, Denver Metro
Leadership Foundation (non-
profit organization)
(2012-2014). |
|
| | | | | |
Jeffrey B. Weeden 151 Detroit Street Denver, CO 80206 DOB: 1956 | | | Trustee | | | | 2/16-Present | | | Senior Advisor, BayBoston Capital LP (investment fund in finance companies, banks and bank holdings companies) (since 2015). Formerly, Management Advisor, BoxCast, Inc. (technology start-up company) (2014-2017) and Senior Executive Vice President and Chief Financial Officer, KeyCorp (financial services) (2002-2013). | | | 10 | | |
| Director, State
Farm
Bank (banking)
(since 2014). |
|
Interested Trustee | | | | | | | | | | | | | | | | | | |
Michael Drew Elder** 151 Detroit Street Denver, CO 80206 DOB: 1970 | | | Trustee | | | | 8/15-Present | | | Executive Vice President and Head of U.S. Intermediary Distribution, Janus Capital (since 2014) and President, Janus Distributors LLC (broker- dealer) (since 2014). Formerly, Senior Vice President, Janus Capital (2007-2014). | | | 10 | | |
| Director, Perkins
Investment
Management
LLC
(since 2014). |
|
| * | In addition to the Trust, which is comprised of seven series, each Trustee also serves as a trustee to the Clayton Street Trust, which is an affiliated registered investment company currently comprised of three portfolios. |
| ** | Michael Drew Elder is an Interested Trustee because of his employment with Janus Capital. |
| | |
| | Janus Detroit Street Trust ½ 27 |
Janus Henderson Mortgage-Backed Securities ETF
Trustees and Officers (unaudited)
| | | | | | |
| OFFICERS | | | | | | |
| Name, Address, and Age | | Positions Held with the Trust | | Term of Office* and
Length of Time Served | | Principal Occupations
During the Past Five Years |
Bruce L. Koepfgen 151 Detroit Street Denver, CO 80206 DOB: 1952 | | President and Chief Executive Officer | | 2/16-Present | | Head of North America for Janus Henderson Investors and Janus Capital Management LLC (since 2017); Executive Vice President and Director of Janus International Holding LLC (since 2011); Executive Vice President of Janus Distributors LLC (since 2011); Executive Vice President and Working Director of INTECH Investment Management LLC (since 2011); Executive Vice President and Director of Perkins Investment Management LLC (since 2011); and Executive Vice President and Director of Janus Management Holdings Corporation (since 2011). Formerly, President of Janus Capital Group Inc. and Janus Capital Management LLC (2013-2017); Executive Vice President of Janus Services LLC (2011-2015), Janus Capital Group Inc. and Janus Capital Management LLC (2011- 2013); and Chief Financial Officer of Janus Capital Group Inc., Janus Capital Management LLC, Janus Distributors LLC, Janus Management Holdings Corporation, and Janus Services LLC (2011-2013). |
| | | |
Susan K. Wold 151 Detroit Street Denver, CO 80206 DOB: 1960 | | Vice President, Chief Compliance Officer, and Anti- Money Laundering Officer | | 9/17-Present | | Senior Vice President and Head of Compliance North America for Janus Henderson (since September 2017); Formerly Vice President, Head of Global Corporate Compliance, and Chief Compliance Officer for Janus Capital Management LLC (May 2017-September 2017); Vice President, Compliance at Janus Capital Group and Janus Capital Management LLC (2005-2017). |
| | | |
Jesper Nergaard 151 Detroit Street Denver, CO 80206 DOB: 1962 | | Vice President, Chief Financial Officer, Treasurer, and Principal Accounting Officer | | 2/16-Present | | Vice President of Janus Capital and Janus Services LLC. |
| | | |
Byron Hittle 151 Detroit Street Denver, CO 80206 DOB: 1974 | | Vice President, Secretary and Chief Legal Officer | | 7/18-Present | | Vice President and Assistant General Counsel of Janus Capital and Janus Services LLC (2017-present); Assistant Vice President and Senior Legal Counsel (2012-2016). |
| * | Officers are elected at least annually by the Trustees for a one-year term and may also be elected from time to time by the Trustees for an interim period. |
Janus Henderson Mortgage-Backed Securities ETF
Notes
| | |
| | Janus Detroit Street Trust ½ 29 |
Knowledge. Shared
At Janus Henderson, we believe in the sharing of expert insight for better investment and business decisions. We call this ethos Knowledge. Shared.
Learn more by visiting janushenderson.com.
This report is submitted for the general information of shareholders of the Fund. It is not an offer or solicitation for the Fund and is not authorized for distribution to prospective investors unless preceded or accompanied by an effective prospectus.
Janus Henderson and Knowledge. Shared are trademarks of Janus Henderson Group plc or one of its subsidiary entities. © Janus Henderson Group plc.
Janus Capital Management LLC is the investment adviser and ALPS Distributors, Inc. is the distributor. ALPS is not affiliated with Janus Henderson or any of its subsidiaries.
Item 2. Code of Ethics.
As of the end of the period covered by this Form N-CSR, the Registrant has adopted a Code of Ethics (as defined in Item 2(b) of Form N-CSR), which is posted on the Registrant’s website: janushenderson.com. Registrant intends to post any amendments to, or waivers from (as defined in Item 2 of Form N-CSR), such code on janushenderson.com within five business days following the date of such amendment or waiver.
Item 3. Audit Committee Financial Expert.
The Registrant’s Board of Trustees has determined that Jeffrey B. Weeden, the Chairman of the Board’s Audit and Pricing Committee is an “audit committee financial expert,” as defined in Item 3 to Form N-CSR: Jeffrey B. Weeden is “independent” under the standards set forth in Item 3 to Form N-CSR.
Item 4. Principal Accountant Fees and Services.
(a) Audit Fees
The aggregate fees billed for each of the last two fiscal years for professional services rendered by the principal accountant for the audit of the Funds’ annual financial statements or services that are normally provided by the accountant in connection with statutory and regulatory filings or engagements for those fiscal years are $214,339 for 2018 and $292,815 for 2017.
(b) Audit Related Fees
The aggregate fees billed in each of the last two fiscal years for assurance and related services by the principal accountant that are reasonably related to the performance of the audit of the Funds’ financial statements and are not reported under paragraph (a) of this Item are $0 for 2018 and $0 for 2017.
(c) Tax Fees
The aggregate fees billed in each of the last two fiscal years for professional services rendered by the principal accountant for tax compliance, tax advice, and tax planning are $76,014 for 2018 and $80,263 for 2017.
The nature of the services comprising the fees disclosed under this category includes tax compliance, tax planning, and tax advice.
(d) All Other Fees
The aggregate fees billed in each of the last two fiscal years for products and services provided by the principal accountant, other than the services reported in paragraphs (a) through (c) of this Item are $0 for 2018 and $0 for 2017.
(e) Pre-Approval Policies and Procedures
(1) The registrant’s Audit Committee Charter requires the registrant’s Audit Committee to pre-approve any engagement of the principal accountant (i) to provide audit or non-audit services to the registrant or (ii) to provide non-audit services to the registrant’s investment adviser or any entity controlling, controlled by, or under common control with the investment adviser that provides ongoing services to the registrant, if the engagement relates directly to the operations and financial reporting of the registrant, except for those non-audit services that were subject to the pre-approval exception under Rule 2-01 of Regulation S-X. The Chairman of the Audit Committee or, if the Chairman is unavailable, another member of the Audit Committee who is an independent Trustee, may grant the pre-approval. All such delegated pre-approvals must be presented to the Audit Committee no later than the next Audit Committee meeting.
(2) 0%
(f) Not applicable as less than 50%.
(g) The aggregate non-audit fees billed by the registrant’s accountant for services rendered to the registrant, and rendered to the registrant’s investment adviser (not including any sub-adviser whose role is primarily portfolio management and is subcontracted with or overseen by another investment adviser), and any entity controlling, controlled by, or under common control with the adviser that provides ongoing services to the registrant for the last two fiscal years of the registrant are $76,014 for 2018 and $80,263 for 2017.
(h) The registrant’s audit committee of the board of trustees has considered whether the provision of non-audit services that were rendered to the registrant’s investment adviser (not including any subadviser whose role is primarily portfolio management and is subcontracted with or overseen by another investment adviser), and any entity controlling, controlled by, or under common control with the investment adviser that provides ongoing services to the registrant that were not pre-approved pursuant to paragraph (c)(7)(ii) of Rule 2-01 of Regulation S-X is compatible with maintaining the principal accountant’s independence.
Item 5. Audit Committee of Listed Registrants.
The registrant has a separately-designated standing audit committee established in accordance with Section 3(a)(58)(A) of the Securities Exchange Act of 1934. The members of the committee are Jeffrey B Weeden, Maureen T. Upton and Clifford J. Weber.
Item 6. Investments.
(a) Schedule of Investments is contained in the Reports to Shareholders included under Item 1 of this Form N-CSR.
(b) Not applicable.
Item 7. Disclosure of Proxy Voting Policies and Procedures for Closed-End Management Investment Companies.
Not applicable.
Item 8. Portfolio Managers of Closed-End Management Investment Companies.
Not applicable.
Item 9. Purchases of Equity Securities by Closed-End Management Investment Company and Affiliated Purchasers.
Not applicable.
Item 10. Submission of Matters to a Vote of Security Holders.
There have been no material changes to the procedures by which shareholders may recommend nominees to the Registrant’s Board of Trustees.
Item 11. Controls and Procedures.
(a) The Registrant’s Principal Executive Officer and Principal Financial Officer have evaluated the Registrant’s disclosure controls and procedures (as defined in Rule 30a-3(c) under the Investment Company Act of 1940, as amended) within 90 days of this filing and have concluded that the Registrant’s disclosure controls and procedures were effective, as of that date.
(b) There have been no changes in the Registrant’s internal control over financial reporting (as defined in Rule 30a-3(d) under the Investment Company Act of 1940, as amended) that occurred during the Registrant���s second fiscal quarter of the period covered by this report that have materially affected, or are reasonably likely to materially affect, the Registrant’s internal control over financial reporting.
Item 12. Disclosure of Securities Lending Activities for Closed-End Management Investment Companies
Not applicable.
Item 13. Exhibits.
| | | | |
(a) | | (1) | | Not applicable because the Registrant has posted its Code of Ethics (as defined in Item 2(b) of Form N-CSR) on its website pursuant to paragraph (f)(2) of Item 2 of Form N-CSR. |
| | |
| | (2) | | Separate certifications for the Registrant’s Principal Executive Officer and Principal Financial Officer, as required under Rule 30a-2(a) under the Investment Company Act of 1940, as amended, are attached as Ex99.CERT. |
| | |
| | (3) | | Not applicable. |
| | |
| | (4) | | Not applicable. |
|
(b) A certification for the Registrant’s Principal Executive Officer and Principal Financial Officer, as required by Rule 30a-2(b) under the Investment Company Act of 1940, as amended, is attached as Ex99.906CERT. |
SIGNATURES
Pursuant to the requirements of the Securities Exchange Act of 1934 and the Investment Company Act of 1940, the registrant has duly caused this report to be signed on its behalf by the undersigned, thereunto duly authorized.
| | |
| JANUS DETROIT STREET TRUST |
| |
| By: | | /s/ Bruce L. Koepfgen |
| | Bruce L. Koepfgen |
| | President and Chief Executive Officer (Principal Executive Officer) |
| |
| Date: | | December 28, 2018 |
Pursuant to the requirements of the Securities Exchange Act of 1934 and the Investment Company Act of 1940, this report has been signed below by the following persons on behalf of the registrant and in the capacities and on the dates indicated.
| | |
| By: | | /s/ Bruce L. Koepfgen |
| | Bruce L. Koepfgen |
| | President and Chief Executive Officer (Principal Executive Officer) |
| |
| Date: | | December 28, 2018 |
| | |
| By: | | /s/ Jesper Nergaard |
| | Jesper Nergaard |
| | Vice President, Chief Financial Officer, Treasurer and Principal Accounting Officer (Principal Financial Officer and Principal Accounting Officer) |
| |
| Date: | | December 28, 2018 |