united states
securities and exchange commission
washington, d.c. 20549
form n-csr
certified shareholder report of registered management
investment companies
Investment Company Act file number 811-22483
Copeland Trust
(Exact name of Registrant as specified in charter)
Eight Tower Bridge, 161 Washington St., Suite #1325 Conshohocken, PA 19428
(Address of principal executive offices) (Zip code)
Gemini Fund Services, LLC, 80 Arkay Drive Suite 10, Hauppauge, NY 11788
(Name and address of agent for service)
Registrant's telephone number, including area code: (631) 470-2619
Date of fiscal year end: 11/30
Date of reporting period: 5/31/16
Item 1. Reports to Stockholders.
| | | |
| | Copeland | |
| | Risk Managed | |
| | Dividend Growth Fund | |
| | | |
| | Copeland | |
| | International Risk Managed | |
| | Dividend Growth Fund | |
| | | |
| | Copeland | |
| | INTERNATIONAL SMALL CAP | |
| | DIVIDEND GROWTH FUND | |
| | | |
| | | |
| | Semi-Annual Report | |
| | May 31, 2016 | |
| | | |
| | | |
| | | |
| | | |
| | | |
| | | |
| | Investor Information: 1-888-9-COPELAND | |
| | | |
| | This report and the financial statements contained herein are submitted for the general information of shareholders and are not authorized for distribution to prospective investors unless preceded or accompanied by an effective prospectus. Nothing herein contained is to be considered an offer of sale or solicitation of an offer to buy shares of the Funds. Such offering is made only by prospectus, which includes details as to offering price and other material information. | |
| | | |
| | Distributed by Northern Lights Distributors, LLC
Member FINRA | |
| | | |
| | | |
Copeland Risk Managed Dividend Growth Fund
Semi-Annual Report
May 31, 2016
Dear Fellow Shareholders:
Copeland Capital Management is pleased to review the performance of the Risk Managed Dividend Growth Fund from December 1, 2015 through May 31, 2016.
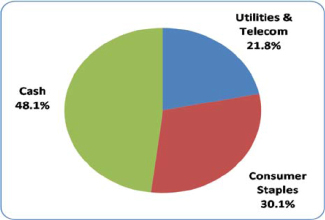
During the six-month period, the Fund delivered a positive 0.7% return, versus the 1.9% advance posted by the S&P 500 Index. The Fund maintained an average cash position of 36% during the period and targeted 50% cash by period end, as dictated by our tactical sector signals. This positioning is a reminder that the Fund will own dividend growth stocks only within sectors rated positively by these sector signals, reflecting one of our important goals, which is to preserve capital during times of market stress. The Fund will invest more broadly across more market sectors in an effort to capture income and capital appreciation in equities when the signals suggest the risk of downside losses has subsided. The cash allocation, the concentration in defensive sectors and ownership of what we believe are more resilient dividend growth stocks resulted in considerably less volatility as manifested by the Fund’s beta, a measure of portfolio volatility in comparison to the market, of 0.25, meaning that the portfolio’s value changed at just 25% of the volatility of the market.
As of May 31, the Fund’s equity exposure was limited to the Utilities and Consumer Staples segments of the market, while all other sector signals were negative. The Fund has maintained this limited exposure profile dating back to the end of January. Our weighting in the Utilities/Telecommunications sector (which we consider collectively) averaged 21% during the period, well above the roughly 6% stake held in the benchmark. The outsized exposure significantly aided Fund performance as our holdings in this typically staid market segment returned nearly 19% on average during the semi-annual period. The Fund’s performance in this sector bested both the 16% return turned in by the average Utility stock during the period as well as the 1.9% return registered by the broader benchmark. Our overweight positioning in the Consumer Staples sector, where our exposure level averaged 25% during the period, was also a tailwind as the defensive sector outperformed the broad market even if our average holding lagged the group. Meanwhile, these benefits were offset by the previously mentioned heavy exposure to cash, reflecting our defensive positioning and focus on capital preservation for much of the period.
In our view, it is unusual for an inherently defensive sector like Utilities to outpace a broader advance in the equity markets, but such was the case over the prior six months. As inflation remains quiescent and expectations surrounding Fed rate hikes are repeatedly pushed out, yield starved investors continue to be drawn to the relatively high payouts offered by securities within the Utilities sector. Competition from fixed-income securities has yet to materialize with the yield on the ten-year Treasury slipping from 2.21% at the outset of the period to 1.85% at the end of the semi-annual period. Not surprisingly, our top performing holding during the period hailed from the Utilities sector. Southwest Gas (SWX, 1.7%) rose nearly 25% over the six month timeframe. This Las Vegas, Nevada based utility boasts both a natural gas distribution segment, as well as a construction services segment. Southwest Gas is the largest distributor of natural gas in both Arizona and Nevada, areas which are enjoying population growth rates well in excess of the national average. The company recently raised its dividend for the tenth straight year, this time by a robust 11%, a rate considerably higher than that observed by the typical utility stock.
On the downside, Fund holding Polaris (PII, 0.0%, sold during the period) registered the most significant drop in price during the period, falling just over 17% before it was sold from the Fund near the turn of the calendar year as we eliminated exposure to the Consumer Discretionary sector when the sector signal turned negative. In mid-December, this maker of off- road vehicles, motorcycles and snowmobiles pre-announced that 2015 sales and earnings would fall well short of expectations. Full-year sales guidance was halved from 10 to 11 percent growth, versus 2014, to four to five percent growth. Earnings guidance was slashed in more draconian fashion from 11 to 12 percent growth to one to two percent growth for full year 2015. Softer off-road vehicle sales and a snow mobile industry sagging under the weight of atypically warm
weather conspired to drag expected results lower. The Fund has continued to avoid the Consumer Discretionary over the course of 2016 and will continue to do so until the sector signal turns positive.
The preceding six months has been a tale of two halves for equities as the broad market shed roughly 12% before bottoming in the second week of February. A global growth scare, particularly in China, weighed upon investor sentiment during the initial months of the period. As perceived downside risks failed to materialize and the global economy continued along its path of muted yet steady recovery, the equity market recouped prior losses and managed to eke out a slight gain for the six-month period. Looking forward, we believe that the inability or unwillingness of the Federal Reserve to raise interest rates above the hyper-stimulative range of 25 to 50 basis points should give investors pause and may serve to mute equity market returns. We believe that the latter half of the year will bring with it a political election that is likely to be atypically caustic as voters select between two polarizing candidates with unprecedentedly low approval ratings, while the UK holds a polarizing vote on leaving the European Union. In our view, market volatility is likely to rise as investors return from summer vacation and refocus on a tepid domestic economy, declining corporate earnings, uneven global growth and the uncertain political future.
Irrespective of future term market trends, we at Copeland remain intently focused on the long-term prospects of companies held in the Fund, with a particular emphasis on the capacity of each to continue to grow the dividend over time. We continue to favor companies that we believe retain noteworthy competitive advantages in their respective industries, are cash generative, and are overseen by managements with capital allocation discipline and an eye on the shareholder. In addition, we continue to scour the domestic universe of consistent dividend growers in order to identify new potential investments for the Fund, and will invest more broadly in these dividend growers in other sectors of the market only when our tactical signals suggest that the heightened risk of capital loss has lessened in each specific sector of the market. It is our belief that our dividend growth philosophy, with its balance of growth orientation and defensive characteristics, combined with our focus on preserving capital in times of market stress, will serve shareholders well in the future.
Thank you for the confidence you have placed in Copeland and for your investment in the Risk Managed Dividend Growth Fund.
May 31, 2016
The performance data quoted here represents past performance. Current performance may be lower or higher than the performance data quoted above. Investment return and principal value will fluctuate, so that shares, when redeemed, may be worth more or less than their original cost. Past performance is no guarantee of future results. The Fund’s investment adviser has contractually agreed to reduce its fees and/or absorb expenses of the fund, at least until March 31, 2017, to ensure that the net annual fund operating expenses will not exceed 1.45% for CDGRX, 2.20% for CDCRX and 1.30% for CDIVX, subject to possible recoupment from the Fund in future years. Without the agreement, the expense ratio would be 1.60% for CDGRX, 2.35% for CDCRX and 1.35% for CDIVX. The maximum sales charge (load) for Class A is 5.75%. Please review the Fund’s prospectus for more detail on the expense waiver. Results shown reflect the waiver, without which the results could have been lower. A Fund’s performance, especially for very short periods of time, should not be the sole factor in making your investment decisions. For performance information current to the most recent month-end, please call toll-free 1-888-9-COPELAND (1-888-926-7352). Additional information can be found by visiting our website, www.copelandfunds.com.
The S&P 500 Index is an unmanaged composite of 500 large capitalization companies. This index is widely used by professional investors as a performance benchmark for large-cap stocks. You cannot invest directly in an index.
Holdings are for informational purposes only and should not be deemed a recommendation to buy. Holdings are subject to change, may not be representative of current holdings, and are subject to risk.
NLD Review Code: 1245-NLD-7/18/2016
* Footnote: Cash percentage may differ from the Generally Accepted Accounting
Principles (“GAAP”) reflected in the Portfolio of Investments.
| Top Five Performers | % of Portfolio |
| thru 5/31/16 | at 5/31/16 |
| Southwest Gas Corporation (SWX) | 1.7% |
| UGI Corporation (UGI) | 1.7% |
| WEC Energy Group (WEC) | 3.4% |
| Nextera Energy (NEE) | 3.3% |
| ITC Holdings Corporation (ITC) | 3.9% |
| Bottom Five Performers | % of Portfolio |
| thru 5/31/16 | at 5/31/16 |
| Polaris Industries (PII) | 0.0% |
| Qualcomm (QCOM) | 0.0% |
| FactSet Research Systems (FDS) | 0.0% |
| Flowers Foods (FLO) | 0.0% |
| Texas Instruments (TXN) | 0.0% |
| Top Ten Holdings - 5/31/16 | % of Portfolio |
| Casey’s General Stores (CASY) | 4.5% |
| Kroger (KR) | 4.1% |
| CVS Health Corporation (CVS) | 4.0% |
| ITC Holdings Corporation (ITC) | 3.9% |
| WEC Energy (WEC) | 3.4% |
| Nextera Energy (NEE) | 3.3% |
| Intl Flavors and Fragrances (IFF) | 3.2% |
| Altria Group (MO) | 3.1% |
| Costco Wholesale (COST) | 3.1% |
| Verizon Communications (VZ) | 3.1% |
Holdings are for informational purposes only and should not be deemed a recommendation to buy. Holdings are subject to change, may not be representative of current holdings, and are subject to risk.
Copeland Risk Managed Dividend Growth Fund
Portfolio Review (Unaudited)
December 28, 2010* through May 31, 2016
| Average Annualized | | | | Since | Since | Since |
| Total Returns as of | Six | | Three | Inception | Inception | Inception |
| May 31, 2016 | Months** | One Year | Year | Class A* | Class C* | Class I* |
| Copeland Risk Managed | | | | | | |
| Dividend Growth Fund: | | | | | | |
| Class A | | | | | | |
| Without sales charge | 0.73% | (8.51)% | 5.33% | 7.83% | — | — |
| With sales charge+ | (5.08)% | (13.78)% | 3.28% | 6.66% | — | — |
| Class C | 0.36% | (9.17)% | 4.54% | — | 8.28% | — |
| Class I | 0.83% | (8.36)% | 5.55% | — | — | 7.25% |
| S&P 500 Index | 1.93% | 1.72% | 11.06% | 12.25% | 14.27% | 12.80% |
| Russell 3000 | 1.29% | 0.22% | 10.57% | 11.86% | 14.07% | 12.31% |
| * | Class A shares commenced operations on December 28, 2010. Class C commenced operations on January 5, 2012. Class I commenced operations March 1, 2013. |
| + | Adjusted for initial maximum sales charge of 5.75%. |
The S&P 500 Index is an unmanaged market capitalization-weighted index which is comprised of 500 of the largest U.S. domiciled companies and includes the reinvestment of all dividends. Investors cannot invest directly in an index or benchmark.
The Russell 3000 Index measures the performance of the largest 3000 U.S. companies representing approximately 98% of the investable U.S. equity market and includes the reinvestment of all dividends. Investors cannot invest directly in an index or benchmark.
Past performance is not predictive of future results. The investment return and principal value of an investment will fluctuate. An investor’s shares, when redeemed, may be worth more or less than the original cost. Total return is calculated assuming reinvestment of all dividends and distributions. Total returns would have been lower had the adviser not waived its fees and reimbursed a portion of the Fund’s expenses. The Domestic Fund’s gross annual operating expense ratio, as stated in the current prospectus, is 1.49%, 2.25%, and 1.25%,for Class A, Class C, and Class I shares, respectively, and its net annual operating expense ratio is 1.46%, 2.21%, and 1.25%, for Class A, Class C, and Class I shares, respectively. These ratios can fluctuate and may differ from the expense ratios disclosed in the Financial Highlights section of this report. The Fund’s investment adviser has contractually agreed to reduce its fees and/or absorb expenses of the Fund, at least until March 31, 2017, to ensure that the net annual fund operating expenses will not exceed 1.45%, 2.20% and 1.30% of Class A, Class C and Class I shares, respectively, subject to possible recoupment from the Fund in future years. The chart does not reflect the deduction of taxes that a shareholder would have to pay on fund distributions or the redemption of the fund shares. For performance information current to the most recent month-end, please call 1-888-9-COPELAND.
Copeland International Risk Managed Dividend Growth Fund
Semi-Annual Report
May 31, 2016
Dear Fellow Shareholders:
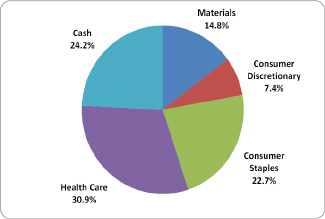
The Copeland International Risk Managed Dividend Growth Fund delivered a -0.64% return during the six months ended May 31, 2016, the first half of the Fund’s fiscal year. This compared to a -1.37% return achieved by the Fund’s benchmark, the MSCI All-Country World Ex-US Index. During this time period, the Fund’s risk managed approach had contributed to significantly lower volatility of Fund returns than those experienced by the benchmark. The Fund was especially resilient during the broad market sell-off in January and February, when investors were particularly concerned about the risks associated with US Federal Reserve policy and the macroeconomic climate in China.
The three leading segments which contributed to Fund performance during the first half of the fiscal year were Consumer Discretionary, the UK/Ireland, and Financials. Within the Consumer Discretionary sector, the biggest gainer was Paddy Power Betfair plc (2.5%), which benefited from a merger of the two leading on-line gambling companies in Europe, Paddy Power in Ireland and Betfair in the UK. Driven by above-average secular growth potential, the combined entities also experienced increased scale benefits, as well as a growing “network effect.” Offsetting this position within the sector was a holding in Next plc (0.0%), which lagged other Consumer Discretionary stocks, due to declining like-for-like sales in its retail stores during the final quarter of 2015, and lowered guidance for overall growth in 2016. From a geographic perspective, in spite of the concerns surrounding the “Brexit” campaign, the Fund profited from its exposure to the UK/Ireland. In addition to the aforementioned Consumer Discretionary holding, the Fund also benefited from its position in Kerry Group plc (4.3%), a flavors and ingredients company. The company experienced solid organic growth driven by the evolution of consumer preferences in the food industry, and also saw improving underlying profitability in its Ireland-based prepared foods division. The Fund’s lack of exposure to Financials throughout the first half of its fiscal year, as a function of the Fund’s quantitative sector signals, was the other key positive contributor to performance during the period, as the Financial sector was the worst performing sector during the past six months.
Results within the Health Care and Energy sectors of the market detracted from relative performance during the most recent six-month period. As Health Care was one of the worst performing sectors in the market, primarily due to fears of broad-based cost containment pressures, the Fund’s overweight exposure versus the benchmark negatively impacted results. Teva Pharmaceutical (4.3%), the world’s largest generic pharmaceutical manufacturer, was a notable laggard. Delays in the firm’s announced acquisition of the generics division of competitor Allergan, along with concerns of stagnating industry growth, led to its share price weakness. In contrast, the Fund’s holding in Fresenius SE (2.2%), the diversified German Health Care service provider, was an outperformer in the period. The company retains an oligopolistic position in the global kidney dialysis market, while also playing a dominant role in the for-profit hospital industry in Germany. Energy was the other key headwind for the Fund from a sector perspective. The second best performing sector in the time period, a function of the healthy rebound in oil and commodity prices, the lack of any Fund exposure to the sector over the past six months proved to be a detriment to results.
Cash was a positive contributor to results in the first half of the Fund’s fiscal year. Under normal market conditions, the Fund targets a fully invested position across all 9 market sectors, with individual sector weightings proportionate to the weightings in our non-US dividend growth universe. Within this context, the Fund utilizes Copeland’s risk management overlay to determine specific sector allocations. Copeland’s quantitative model generates “buy” and “sell” sector signals based on volatility-adjusted trend lines. Only sectors with a “buy” signal are owned, while no investment exposure is maintained in sectors with a “sell” signal. If there are an insufficient number of “buy” sectors to be fully invested, the Fund retains a cash allocation. As a result of “sell” signals in all but two sectors at the start of the semi-annual period, the Fund targeted a 50% cash position as of December 31, 2015. This bolstered relative performance during a significant correction in non-US equity markets during the first six weeks of the calendar year. By the end of the first half of the Fund’s fiscal year, “buy” signals had re-emerged in more sectors of the market, which resulted in a less defensive position, and a cash allocation of 25%. In addition to providing downside
protection for the Fund early in 2016, the Fund’s cash position materially reduced the Fund’s volatility during the time period.
We remain optimistic about the prospects for international dividend growth investing over the long term. Although “Brexit,” the potential decision of UK voters to withdraw from the European Union, could create political and macroeconomic uncertainties for investors, we believe there is likely to be continued and ongoing monetary policy stimulus from the world’s Central Banks, particularly in Europe. Historically, this has proven to be supportive of share prices. Nonetheless, with a perhaps less certain near-term investment climate overseas, we believe our Fund is well suited for investors seeking to maintain long-term exposure to the international equity asset class. Should overall market volatility remain elevated during the remainder of 2016 or beyond, we believe that the Fund’s risk management techniques provide some potential for limiting downside exposure during inevitable periods of declining share prices overseas. Alternatively, if more favorable trends develop within the international equity markets, the Fund will seek to reduce cash holdings in an effort to capture what we believe to be the superior long term risk-adjusted performance opportunity offered by dividend growth equities.
Thank you for your continued support of the Copeland International Risk Managed Dividend Growth Fund.
May 31, 2016
The performance data quoted here represents past performance. Current performance may be lower or higher than the performance data quoted above. Investment return and principal value will fluctuate, so that shares, when redeemed, may be worth more or less than their original cost. Past performance is no guarantee of future results. The Fund’s investment adviser has contractually agreed to reduce its fees and/or absorb expenses of the fund, at least until March 31, 2017, to ensure that the net annual fund operating expenses will not exceed 1.60% for IDVGX, 2.35% for IDVCX and 1.45% for IDVIX, subject to possible recoupment from the Fund in future years. Without the agreement, the expense ratio would be 2.14% for IDVGX, 2.90% for IDVCX and 1.99% for IDVIX. The maximum sales charge (load) for Class A is 5.75%. Please review the Fund’s prospectus for more detail on the expense waiver. Results shown reflect the waiver, without which the results could have been lower. A Fund’s performance, especially for very short periods of time, should not be the sole factor in making your investment decisions. For performance information current to the most recent month-end, please call toll-free 1-888-9-COPELAND (1-888-926-7352). Additional information can be found by visiting our website, www.copelandfunds.com.
MSCI All Country World Ex-US Index (“ACWI Ex-US”) – This Index is a market capitalization-weighted index designed to provide a broad measure of stock performance throughout the world, with the exception of U.S. based companies. It includes both developed and emerging markets. Morgan Stanley Capital International is the owner of the trademark service marks and copyrights of the ACWI Ex-US.
Holdings are for informational purposes only and should not be deemed a recommendation to buy. Holdings are subject to change, may not be representative of current holdings, and are subject to risk.
NLD Review Code: 1246-NLD-7/18/2016
* Footnote: Cash percentage may differ from the Generally Accepted Accounting
Principles reflected in the Portfolio of Investments.
| Top Five Performers | % of Portfolio |
| thru 5/31/16 | at 5/31/16 |
| Merck KGAA | 2.3% |
| Betfair Group PLC (now Paddy Power Betfair PLC) | 2.5% |
| Huhtamaki Oyj | 2.3% |
| Fresenius SE & Co KGAA | 2.2% |
| Kerry Group PLC Class A | 4.3% |
| Bottom Five Performers | % of Portfolio |
| thru 5/31/16 | at 5/31/16 |
| Kose Corp | 0.0% |
| Clicks Group LTD | 0.0% |
| Teva Pharmaceutical-SP ADR | 4.3% |
| Next PLC | 0.0% |
| Bayer AG-REG | 2.5% |
| Top Ten Holdings - 5/31/16 | % of Portfolio |
| Medtronic PLC | 5.1% |
| Imperial Brands PLC | 4.9% |
| Alimentation Couche-Tard | 4.7% |
| Intl Flavors and Fragrances | 4.6% |
| Kerry Group PLC Class A | 4.3% |
| Teva Pharmaceutical | 4.3% |
| Novo-Nordisk A/S-Spons ADR | 4.0% |
| SAB Miller PLC | 3.9% |
| Steris Corp | 3.5% |
| Metro Intl | 3.4% |
Holdings are for informational purposes only and should not be deemed a recommendation to buy. Holdings are subject to change, may not be representative of current holdings, and are subject to risk.
Copeland International Risk Managed Dividend Growth Fund
Portfolio Review (Unaudited)
December 17, 2012* through May 31, 2016
| Average Annualized | | | | |
| Total Returns as of | Six | | | Since |
| May 31, 2016 | Months** | One Year | Three Year | Inception* |
| Copeland International Risk Managed Dividend Growth Fund: | | | | |
| Class A | | | | |
| Without sales charge | (0.64)% | (7.26)% | 1.25% | 2.41% |
| With sales charge+ | (6.38)% | (12.57)% | (0.74)% | 0.67% |
| Class C | (1.03)% | (8.00)% | 0.47% | 1.66% |
| Class I | (0.47)% | (7.09)% | 1.40% | 2.54% |
| MSCI ACW ex US Index (net) | (1.37)% | (11.39)% | 0.19% | 1.74% |
| * | The Fund commenced operations December 17, 2012. |
| + | Adjusted for initial maximum sales charge of 5.75%. |
The MSCI All Country World ex US (net) Index is a free float-adjusted market capitalization index designed to measure equity market performance in the global developed and emerging markets excluding holdings in the United States and is net of any withholding taxes. Investors cannot invest directly in an index or benchmark.
Past performance is not predictive of future results. The investment return and principal value of an investment will fluctuate. An investor’s shares, when redeemed, may be worth more or less than the original cost. Total return is calculated assuming reinvestment of all dividends and distributions. Total returns would have been lower had the adviser not waived its fees and reimbursed a portion of the Fund’s expenses. The International Fund’s gross annual operating expense ratio, as stated in the current prospectus is 2.06%, 2.82%, and 1.91%, for Class A, Class C, and Class I shares, respectively, and its net annual operating expense ratio is 1.62%, 2.37%, and 1.47% for its Class A, Class C, and Class I shares, respectively. These ratios can fluctuate and may differ from the expense ratios disclosed in the Financial Highlights section of this report. The Fund’s investment adviser has contractually agreed to reduce its fees and/or absorb expenses of the Fund, at least until March 31, 2017, to ensure that the net annual fund operating expenses will not exceed 1.60%, 2.35%, and 1.45% of Class A, Class C and Class I shares, respectively, subject to possible recoupment from the Fund in future years. The chart does not reflect the deduction of taxes that a shareholder would have to pay on fund distributions or the redemption of the fund shares. For performance information current to the most recent month-end, please call 1-888-9-COPELAND.
Copeland International Small Cap Dividend Growth Fund
Portfolio Review (Unaudited)
December 17, 2015* through May 31, 2016
| Total Returns as of | Since |
| May 31, 2016 | Inception* |
| Copeland International Small Cap Dividend Growth Fund: | |
| Class A | |
| Without sales charge | 0.40% |
| With sales charge+ | (5.37)% |
| Class I | 0.30% |
| MSCI ACW ex US Small Cap (net) | 5.82% |
| | |
| * | The Fund commenced operations December 17, 2015. |
| + | Adjusted for initial maximum sales charge of 5.75%. |
The MSCI World ex USA Small Cap Index captures small cap representation across 22 of 23 Developed Markets (DM) countries* (excluding the United States). With 2,381 constituents, the index covers approximately 14% of the free float-adjusted market capitalization in each country.
Past performance is not predictive of future results. The investment return and principal value of an investment will fluctuate. An investor’s shares, when redeemed, may be worth more or less than the original cost. Total return is calculated assuming reinvestment of all dividends and distributions. Total returns would have been lower had the adviser not waived its fees and reimbursed a portion of the Fund’s expenses. The International Fund’s gross annual operating expense ratio, as stated in the current prospectus is 1.40%, and 1.25%, for Class A and Class I shares, respectively. The Fund’s adviser has contractually agreed to reduce its fees and/or absorb expenses of the Fund, until at least March 31, 2017, to ensure that total annual fund operating expenses after fee deferral and/or reimbursement (exclusive of any taxes, leverage interest, borrowing interest, brokerage commissions, expenses incurred in connection with any merger or reorganization, dividend expense on securities sold short, acquired fund fees and expenses or extraordinary expenses such as litigation) will not exceed 1.40% and 1.25% of the daily average net asset value of Class A and Class I shares, respectively, subject to possible recoupment from the Fund in future years on a rolling three year basis (within the three years after the fees have been deferred or reimbursed) if such recoupment can be achieved without exceeding the lesser of the expense limitation in effect at the time of the deferral and at the time of the repayment.
| Copeland Risk Managed Dividend Growth Fund |
| PORTFOLIO OF INVESTMENTS (Unaudited) |
| May 31, 2016 |
| Shares | | | | | Market Value | |
| | | | | | | | | |
| | | | | COMMON STOCK - 52.05% | | | | |
| | | | | AGRICULTURE - 3.11% | | | | |
| | 182,561 | | | Altria Group, Inc. | | $ | 11,618,182 | |
| | | | | | | | | |
| | | | | BEVERAGES - 2.91% | | | | |
| | 119,041 | | | Dr. Pepper Snapple Group, Inc. | | | 10,880,347 | |
| | | | | | | | | |
| | | | | CHEMICALS - 3.16% | | | | |
| | 91,585 | | | International Flavors & Fragrance, Inc. | | | 11,814,465 | |
| | | | | | | | | |
| | | | | ELECTRIC - 13.69% | | | | |
| | 205,226 | | | Eversource Energy | | | 11,336,684 | |
| | 330,133 | | | ITC Holdings Corp. | | | 14,697,521 | |
| | 103,863 | | | NextEra Energy, Inc. | | | 12,476,023 | |
| | 209,775 | | | WEC Energy Group, Inc. | | | 12,615,869 | |
| | | | | | | | 51,126,097 | |
| | | | | FOOD - 7.14% | | | | |
| | 152,625 | | | Hormel Foods Corp. | | | 5,251,826 | |
| | 427,153 | | | Kroger Co. | | | 15,274,991 | |
| | 63,013 | | | McCormick & Co., Inc. | | | 6,116,672 | |
| | | | | | | | 26,643,489 | |
| | | | | GAS - 5.07% | | | | |
| | 170,105 | | | New Jersey Resources Corp. | | | 5,979,191 | |
| | 92,716 | | | Southwest Gas Corp. | | | 6,437,272 | |
| | 152,141 | | | UGI Corp. | | | 6,529,892 | |
| | | | | | | | 18,946,355 | |
| | | | | HOUSEHOLD PRODUCTS/WARES - 2.24% | | | | |
| | 84,811 | | | Church & Dwight Co., Inc. | | | 8,352,187 | |
| | | | | | | | | |
| | | | | RETAIL - 11.64% | | | | |
| | 141,423 | | | Casey’s General Stores, Inc. | | | 17,000,459 | |
| | 77,774 | | | Costco Wholesale Corp. | | | 11,570,438 | |
| | 154,627 | | | CVS Caremark Corp. | | | 14,913,774 | |
| | | | | | | | 43,484,671 | |
| | | | | TELECOMMUNICATIONS - 3.09% | | | | |
| | 226,515 | | | Verizon Communications, Inc. | | | 11,529,614 | |
| | | | | | | | | |
| | | | | TOTAL COMMON STOCK | | | 194,395,407 | |
| | | | | (Cost - $168,792,896) | | | | |
| | | | | | | | | |
| | | | | SHORT-TERM INVESTMENTS - 48.11% | | | | |
| | 179,690,530 | | | Federated Treasury Obligations Fund - Institutional Class, 0.18% + | | | 179,690,530 | |
| | | | | TOTAL SHORT-TERM INVESTMENTS | | | | |
| | | | | (Cost - $179,690,530) | | | | |
| | | | | | | | | |
| | | | | TOTAL INVESTMENTS - 100.16% | | | | |
| | | | | (Cost - $348,483,426) (a) | | $ | 374,085,937 | |
| | | | | LIABILITIES IN EXCESS OF OTHER ASSETS - (0.16)% | | | (596,165 | |
| | | | | NET ASSETS - 100.00% | | $ | 373,489,772 | |
The accompanying notes are an integral part of these financial statements.
Copeland Risk Managed Dividend Growth Fund
PORTFOLIO OF INVESTMENTS (Unaudited) (Continued)
May 31, 2016
| + | Money market fund; Interest rate reflects seven-day effective yield on May 31, 2016. |
| (a) | Represents cost for financial reporting purposes. Aggregate cost for federal tax purposes is $ 348,483,426 and differs from value by net unrealized appreciation (depreciation) of securities as follows: |
| Unrealized Appreciation: | | $ | 25,602,511 | |
| Unrealized Depreciation: | | | — | |
| Net Unrealized Appreciation: | | $ | 25,602,511 | |
Portfolio Composition as of May 31, 2016 (Unaudited)
| | | Percent of Net Assets | |
| Utilities | | | 18.76 | % |
| Consumer, Non-Cyclical | | | 15.40 | % |
| Consumer, Cyclical | | | 11.64 | % |
| Basic Materials | | | 3.16 | % |
| Communications | | | 3.09 | % |
| Short-Term Investments | | | 48.11 | % |
| Liabilities in Excess of Other Assets | | | (0.16 | )% |
| Net Assets | | | 100.00 | % |
The accompanying notes are an integral part of these financial statements.
Copeland International Risk Managed Dividend Growth Fund
PORTFOLIO OF INVESTMENTS (Unaudited)
May 31, 2016
| Shares | | | | | Market Value | |
| | | | | | | | | |
| | | | | COMMON STOCK - 75.68% | | | | |
| | | | | AGRICULTURE - 8.03% | | | | |
| | 24,073 | | | Imperial Brands PLC | | $ | 1,315,308 | |
| | 8,515 | | | Philip Morris International, Inc. | | | 840,260 | |
| | | | | | | | 2,155,568 | |
| | | | | BEVERAGES - 6.90% | | | | |
| | 20,491 | | | Coca-Cola Enterprises, Inc. | | | 795,256 | |
| | 16,870 | | | SABMiller PLC | | | 1,054,540 | |
| | | | | | | | 1,849,796 | |
| | | | | CHEMICALS - 7.81% | | | | |
| | 9,504 | | | International Flavors & Fragrance, Inc. | | | 1,226,016 | |
| | 5,808 | | | Linde AG | | | 870,895 | |
| | | | | | | | 2,096,911 | |
| | | | | ENTERTAINEMENT - 2.46% | | | | |
| | 4,964 | | | Paddy Power Betfair PLC | | | 660,820 | |
| | | | | | | | | |
| | | | | FOOD - 7.68% | | | | |
| | 12,812 | | | Kerry Group PLC | | | 1,157,777 | |
| | 26,655 | | | Metro, Inc. | | | 904,584 | |
| | | | | | | | 2,062,361 | |
| | | | | FOREST PRODUCTS & PAPER - 2.16% | | | | |
| | 29,782 | | | Mondi PLC | | | 581,379 | |
| | | | | | | | | |
| | | | | HEALTHCARE-PRODUCTS - 10.56% | | | | |
| | 16,863 | | | Medtronic PLC | | | 1,357,134 | |
| | 31,238 | | | Smith & Nephew PLC | | | 532,128 | |
| | 13,608 | | | STERIS PLC | | | 944,804 | |
| | | | | | | | 2,834,066 | |
| | | | | HEALTHCARE-SERVICES - 2.25% | | | | |
| | 7,987 | | | Fresenius SE & Co KGaA | | | 603,879 | |
| | | | | | | | | |
| | | | | PACKAGING & CONTAINERS - 8.10% | | | | |
| | 4,270 | | | CCL Industries, Inc. | | | 761,307 | |
| | 10,141 | | | Gerresheimer AG | | | 808,708 | |
| | 14,448 | | | Huhtamaki OYJ | | | 604,721 | |
| | | | | | | | 2,174,736 | |
| | | | | PHARMACEUTICALS - 15.05% | | | | |
| | 3,319 | | | Actelion Ltd. | | | 545,263 | |
| | 7,000 | | | Bayer AG | | | 667,346 | |
| | 6,163 | | | Merck KGaA | | | 617,909 | |
| | 18,937 | | | Novo Nordisk ADR | | | 1,061,230 | |
| | 22,197 | | | Teva Pharmaceutical Industries Ltd. ADR | | | 1,151,358 | |
| | | | | | | | 4,043,106 | |
| | | | | RETAIL - 4.68% | | | | |
| | 28,513 | | | Alimentation Couche-Tard, Inc. | | | 1,256,645 | |
| | | | | | | | | |
| | | | | TOTAL COMMON STOCK | | | 20,319,267 | |
| | | | | (Cost - $19,990,020) | | | | |
| | | | | | | | | |
| | | | | SHORT-TERM INVESTMENTS - 24.91% | | | | |
| | 6,687,985 | | | Federated Treasury Obligations Fund - Institutional Class, 0.18% + | | $ | 6,687,985 | |
| | | | | TOTAL SHORT-TERM INVESTMENTS | | | | |
| | | | | (Cost - $6,687,985) | | | | |
| | | | | | | | | |
| | | | | TOTAL INVESTMENTS - 100.59% | | | | |
| | | | | (Cost - $26,678,005) (a) | | $ | 27,007,252 | |
| | | | | LIABILITIES IN EXCESS OF OTHER ASSETS - (0.59)% | | | (159,820 | ) |
| | | | | NET ASSETS - 100.00% | | $ | 26,847,432 | |
The accompanying notes are an integral part of these financial statements.
Copeland International Risk Managed Dividend Growth Fund
PORTFOLIO OF INVESTMENTS (Unaudited) (Continued)
May 31, 2016
| + | Money market fund; Interest rate reflects seven-day effective yield on May 31, 2016. |
ADR - American Depositary Receipt.
| (a) | Represents cost for financial reporting purposes. Aggregate cost for federal tax purposes is $26,678,005 and differs from value by net unrealized appreciation (depreciation) of securities as follows: |
| Unrealized Appreciation: | | $ | 938,021 | |
| Unrealized Depreciation: | | | (608,774 | ) |
| Net Unrealized Appreciation: | | $ | 329,247 | |
Portfolio Composition as of May 31, 2016 (Unaudited)
| | | Percent of Net Assets | |
| Consumer, Non-Cyclical | | | 50.47 | % |
| Basic Materials | | | 9.98 | % |
| Industrial | | | 8.10 | % |
| Consumer, Cyclical | | | 7.14 | % |
| Short-Term Investments | | | 24.91 | % |
| Liabilities in Excess of Other Assets | | | (0.60 | )% |
| Net Assets | | | 100.00 | % |
The accompanying notes are an integral part of these financial statements.
Copeland International Small Cap Dividend Growth Fund
PORTFOLIO OF INVESTMENTS (Unaudited)
May 31, 2016
| Shares | | | | | Market Value | |
| | | | | | | | | |
| | | | | COMMON STOCK - 93.03% | | | | |
| | | | | BUILDING MATERIALS - 4.78% | | | | |
| | 578 | | | Kingspan Group PLC | | $ | 16,252 | |
| | 1,600 | | | Sanwa Holdings Corp. | | | 13,866 | |
| | | | | | | | 30,118 | |
| | | | | COMMERCIAL SERVICES - 5.53% | | | | |
| | 568 | | | Intrum Justitia AB | | | 19,885 | |
| | 851 | | | Berendsen PLC | | | 14,961 | |
| | | | | | | | 34,846 | |
| | | | | COMPUTERS - 6.86% | | | | |
| | 1,643 | | | Altran Technologies SA | | | 24,425 | |
| | 500 | | | SCSK Corp. | | | 18,750 | |
| | | | | | | | 43,175 | |
| | | | | DIVERSIFIED FINANCIAL SERVICES - 1.93% | | | | |
| | 626 | | | Close Brothers Group PLC | | | 12,160 | |
| | | | | | | | | |
| | | | | ENTERTAINEMENT - 4.42% | | | | |
| | 209 | | | Paddy Power Betfair PLC | | | 27,823 | |
| | | | | | | | | |
| | | | | FOOD - 1.99% | | | | |
| | 4,731 | | | Booker Group PLC | | | 12,529 | |
| | | | | | | | | |
| | | | | HAND/MACHINE TOOLS - 2.45% | | | | |
| | 3,834 | | | Techtronic Industries Co. Ltd. | | | 15,401 | |
| | | | | | | | | |
| | | | | HEALTHCARE-PROCUCTS - 3.93% | | | | |
| | 356 | | | STERIS PLC | | | 24,717 | |
| | | | | | | | | |
| | | | | HOME BUILDERS - 2.44% | | | | |
| | 386 | | | Bellway PLC | | | 15,331 | |
| | | | | | | | | |
| | | | | INTERNET - 9.31% | | | | |
| | 2,146 | | | Auto Trader Group PLC - 144A | | | 12,268 | |
| | 895 | | | COOKPAD, Inc. | | | 11,913 | |
| | 3,131 | | | Moneysupermarket.com Group PLC | | | 15,065 | |
| | 316 | | | Rightmove PLC | | | 19,410 | |
| | | | | | | | 58,656 | |
| | | | | LEISURE TIME - 4.71% | | | | |
| | 408 | | | Amer Sports Oyj | | | 12,170 | |
| | 507 | | | CTS Eventim AG & Co | | | 17,507 | |
| | | | | | | | 29,677 | |
| | | | | PACKAGING&CONTAINERS - 7.93% | | | | |
| | 158 | | | CCL Industries, Inc. | | | 28,170 | |
| | 273 | | | Gerresheimer AG | | | 21,771 | |
| | | | | | | | 49,941 | |
| | | | | REAL ESTATE - 9.78% | | | | |
| | 1,616 | | | Hufvudstaden AB | | | 24,997 | |
| | 257 | | | LEG Immobilien AG | | | 22,965 | |
| | 100 | | | Relo Holdings Inc | | | 13,599 | |
| | | | | | | | 61,561 | |
| | | | | RETAIL - 14.24% | | | | |
| | 300 | | | ABC-Mart, Inc. | | | 19,306 | |
| | 194 | | | Dollarama, Inc. | | | 13,381 | |
| | 1,229 | | | JD Sports Fashion PLC | | | 23,483 | |
| | 300 | | | Kusuri No Aoki Co. Ltd. | | | 18,240 | |
| | 600 | | | WH Smith PLC | | | 15,268 | |
| | | | | | | | 89,678 | |
The accompanying notes are an integral part of these financial statements.
Copeland International Small Cap Dividend Growth Fund
PORTFOLIO OF INVESTMENTS (Unaudited) (Continued)
May 31, 2016
| Shares | | | | | Market Value | |
| | | | | | | | | |
| | | | | SOFTWARE - 5.25% | | | | |
| | 1,446 | | | EMIS Group PLC | | $ | 22,379 | |
| | 900 | | | Nihon Unisys Ltd. | | | 10,700 | |
| | | | | | | | 33,079 | |
| | | | | TELECOMMUNICATIONS - 4.24% | | | | |
| | 3,924 | | | Vocus Communications Ltd. | | | 26,700 | |
| | | | | | | | | |
| | | | | TRANSPORTATION - 3.24% | | | | |
| | 2,597 | | | Royal Mail PLC | | | 20,409 | |
| | | | | | | | | |
| | | | | TOTAL COMMON STOCK | | | 585,801 | |
| | | | | (Cost - $544,851) | | | | |
| | | | | | | | | |
| | | | | PREFERRED STOCK - 1.97% | | | | |
| | | | | MACHINERY-DIVERSIFIED - 1.97% | | | | |
| | 130 | | | Jungheinrich AG | | | 12,405 | |
| | | | | | | | | |
| | | | | TOTAL PREFERRED STOCK | | | 12,405 | |
| | | | | (Cost - $12,365) | | | | |
| | | | | | | | | |
| | | | | TOTAL INVESTMENTS - 95.00% | | | | |
| | | | | (Cost - $557,216) (a) | | $ | 598,206 | |
| | | | | OTHER ASSETS LESS LIABILITIES - 5.00% | | | 31,496 | |
| | | | | NET ASSETS - 100.00% | | $ | 629,702 | |
144A- Security exempt from registration under Rule 144A of the Securities Act of 1933. These securities may be sold in transactions exempt from registration, normally to qualified institutional buyers.
| (a) | Represents cost for financial reporting purposes. Aggregate cost for federal tax purposes is $557,216 and differs from value by net unrealized appreciation (depreciation) of securities as follows: |
| Unrealized Appreciation: | | | 48,249 | |
| Unrealized Depreciation: | | | (7,259 | ) |
| Net Unrealized Appreciation: | | $ | 40,990 | |
| | | | | |
Portfolio Composition as of May 31, 2016 (Unaudited)
| | | Percent of Net Assets | |
| Consumer, Cyclical | | | 25.81 | % |
| Industrial | | | 20.37 | % |
| Communications | | | 13.55 | % |
| Technology | | | 12.11 | % |
| Financial | | | 11.71 | % |
| Consumer, Non-Cyclical | | | 11.45 | % |
| Other Assets Less Liabilties | | | 5.00 | % |
| Net Assets | | | 100.00 | % |
The accompanying notes are an integral part of these financial statements.
Copeland Trust
STATEMENTS OF ASSETS AND LIABILITIES (Unaudited)
May 31, 2016
| | | | | | Copeland | | | Copeland | |
| | | Copeland Risk | | | International Risk | | | International Small | |
| | | Managed Dividend | | | Managed Dividend | | | Cap Dividend | |
| | | Growth Fund | | | Growth Fund | | | Growth Fund ** | |
| Assets: | | | | | | | | | | | | |
| Investments, at Cost | | $ | 348,483,426 | | | $ | 26,678,005 | | | $ | 557,216 | |
| Investments in Securities, at Market Value | | $ | 374,085,937 | | | $ | 27,007,252 | | | $ | 598,206 | |
| Cash | | | — | | | | — | | | | 56,426 | |
| Foreign Cash (Cost $0, $0, $25) | | | — | | | | — | | | | 25 | |
| Dividends and Interest Receivable | | | 464,106 | | | | 193,485 | | | | 944 | |
| Receivable for Fund Shares Sold | | | 167,478 | | | | 135,499 | | | | — | |
| Due from Investment Adviser | | | — | | | | — | | | | 14,811 | |
| Prepaid Expenses and Other Assets | | | 48,712 | | | | 22,905 | | | | 10 | |
| Total Assets | | | 374,766,233 | | | | 27,359,141 | | | | 670,422 | |
| | | | | | | | | | | | | |
| Liabilities: | | | | | | | | | | | | |
| Payable for Securities Purchased | | | — | | | | 376,262 | | | | — | |
| Payable for Fund Shares Redeemed | | | 680,561 | | | | 76,405 | | | | — | |
| Payable to Investment Adviser | | | 259,582 | | | | 4,561 | | | | — | |
| Accrued Distribution Fees | | | 79,713 | | | | 8,126 | | | | 1 | |
| Payable to Related Parties | | | 70,263 | | | | 11,094 | | | | 19,134 | |
| Accrued Expenses and Other Liabilities | | | 186,342 | | | | 35,261 | | | | 21,585 | |
| Total Liabilities | | | 1,276,461 | | | | 511,709 | | | | 40,720 | |
| | | | | | | | | | | | | |
| Net Assets | | $ | 373,489,772 | | | $ | 26,847,432 | | | $ | 629,702 | |
| | | | | | | | | | | | | |
| Composition of Net Assets: | | | | | | | | | | | | |
| At May 31, 2016, Net Assets consisted of: | | | | | | | | | | | | |
| Paid-in-Capital | | $ | 358,599,574 | | | $ | 28,866,646 | | | | 627,490 | |
| Undistributed Net Investment Income | | | 136,550 | | | | 56,401 | | | | 2,186 | |
| Accumulated Net Realized Loss From Security and Foreign Currency Transactions | | | (10,848,904 | ) | | | (2,404,738 | ) | | | (40,974 | ) |
| Net Unrealized Appreciation on Investments and Foreign Currency Translations | | | 25,602,552 | | | | 329,123 | | | | 41,000 | |
| Net Assets | | $ | 373,489,772 | | | $ | 26,847,432 | | | $ | 629,702 | |
| ** | Fund commenced operations on December 17, 2015. |
The accompanying notes are an integral part of these financial statements.
Copeland Funds
STATEMENTS OF ASSETS AND LIABILITIES (Unaudited) (Continued)
May 31, 2016
| | | | | | Copeland | | | Copeland | |
| | | Copeland Risk | | | International Risk | | | International Small | |
| | | Managed Dividend | | | Managed Dividend | | | Cap Dividend | |
| | | Growth Fund | | | Growth Fund | | | Growth Fund ** | |
| Class A Shares: | | | | | | | | | | | | |
| Net Assets | | $ | 125,086,472 | | | $ | 9,118,622 | | | $ | 2,585 | |
| Shares Outstanding (no par value; unlimited number of shares authorized) | | | 10,168,999 | | | | 840,463 | | | | 257 | (a) |
| | | | | | | | | | | | | |
| Net Asset Value and Redemption Price Per Share* | | $ | 12.30 | | | $ | 10.85 | | | $ | 10.04 | |
| Offering Price Per Share (NAV/0.9425) Includes a Maximum Sales Charge of 5.75% | | | | | | | | | | | | |
| | | $ | 13.05 | | | $ | 11.51 | | | $ | 10.65 | |
| Class C Shares: | | | | | | | | | | | | |
| | | | | | | | | | | | | |
| Net Assets | | $ | 59,453,277 | | | $ | 7,082,391 | | | $ | — | |
| Shares Outstanding (no par value; unlimited number of shares authorized) | | | 4,919,160 | | | | 669,244 | | | | — | |
| | | | | | | | | | | | | |
| Net Asset Value, Offering Price and Redemption Price Per Share* | | $ | 12.09 | | | $ | 10.58 | | | | — | |
| | | | | | | | | | | | | |
| Class I Shares: | | | | | | | | | | | | |
| Net Assets | | $ | 188,950,023 | | | $ | 10,646,419 | | | $ | 627,117 | |
| Shares Outstanding (no par value; unlimited number of shares authorized) | | | 15,414,675 | | | | 977,896 | | | | 62,496 | |
| | | | | | | | | | | | | |
| Net Asset Value, Offering Price and Redemption Price Per Share* | | $ | 12.26 | | | $ | 10.89 | | | $ | 10.03 | |
| * | The Funds charge a 1.00% fee on shares redeemed less than 30 days after purchase or if shares held less than 30 days are redeemed for failure to maintain the Funds’ minimum balance requirement. |
| ** | Fund commenced operations on December 17, 2015. |
The accompanying notes are an integral part of these financial statements.
| Copeland Trust |
| STATEMENTS OF OPERATIONS (Unaudited) |
| For the Period Ended May 31, 2016 |
| | | | | | Copeland | | | Copeland | |
| | | Copeland Risk | | | International Risk | | | International Small | |
| | | Managed Dividend | | | Managed Dividend | | | Cap Dividend | |
| | | Growth Fund | | | Growth Fund | | | Growth Fund ** | |
| Investment Income: | | | | | | | | | | | | |
| Dividend Income (Less $0, $27,950 and $621 Foreign Taxes Withholding, respectively) | | $ | 3,165,954 | | | $ | 399,967 | | | $ | 5,539 | |
| Interest Income | | | 100,250 | | | | 7,443 | | | | — | |
| Total Investment Income | | | 3,266,204 | | | | 407,410 | | | | 5,539 | |
| | | | | | | | | | | | | |
| Expenses: | | | | | | | | | | | | |
| Investment Advisory Fees | | | 2,097,487 | | | | 162,303 | | | | 2,429 | |
| Distribution Fees - Class C | | | 331,966 | | | | 34,815 | | | | — | |
| Distribution Fees - Class A | | | 186,769 | | | | 12,908 | | | | — | |
| Administration Fees | | | 178,181 | | | | 15,031 | | | | 10,715 | |
| Shareholder Servicing Fees- Class I | | | 105,808 | | | | 5,718 | | | | — | |
| Trustees’ Fees | | | 97,682 | | | | 6,863 | | | | 6,271 | |
| Non 12B1 Shareholder | | | 52,894 | | | | 13,637 | | | | 7,480 | |
| Printing Expenses | | | 47,500 | | | | 6,000 | | | | 3,381 | |
| Fund Accounting Fees | | | 47,342 | | | | 17,593 | | | | 14,877 | |
| Legal Fees | | | 45,860 | | | | 3,223 | | | | 373 | |
| Transfer Agent Fees | | | 39,495 | | | | 9,099 | | | | 6,334 | |
| Registration & Filing Fees | | | 32,501 | | | | 25,000 | | | | 13,525 | |
| Custody Fees | | | 32,263 | | | | 9,000 | | | | 8,115 | |
| Chief Compliance Officer Fees | | | 19,261 | | | | 1,354 | | | | 348 | |
| Insurance Expense | | | 16,051 | | | | 1,127 | | | | 224 | |
| Audit Fees | | | 8,000 | | | | 8,000 | | | | 6,988 | |
| Miscellaneous Expenses | | | 5,548 | | | | 1,501 | | | | 901 | |
| Total Expenses | | | 3,344,608 | | | | 333,172 | | | | 81,961 | |
| Less: Fees Waived by Adviser | | | (212,764 | ) | | | (80,385 | ) | | | (78,608 | ) |
| Net Expenses | | | 3,131,844 | | | | 252,787 | | | | 3,353 | |
| Net Investment Income | | | 134,360 | | | | 154,623 | | | | 2,186 | |
| | | | | | | | | | | | | |
| Net Realized and Unrealized Gain (Loss) on Investments and Foreign Currencies: | | | | | | | | | | | | |
| Net Realized Gain (Loss) on: | | | | | | | | | | | | |
| Security Transactions and FX Loss on Securities | | | (10,846,578 | ) | | | (1,662,993 | ) | | | (40,972 | ) |
| Foreign Currency Transactions | | | — | | | | 922,431 | | | | (297 | ) |
| Foreign Currency Exchange Contracts | | | — | | | | 31,782 | | | | 295 | |
| | | | (10,846,578 | ) | | | (708,780 | ) | | | (40,974 | ) |
| Net Change in Unrealized Appreciation on: | | | | | | | | | | | | |
| Securities | | | 12,574,997 | | | | 29,030 | | | | 40,990 | |
| Foreign Currency Exchange Contracts | | | — | | | | 414 | | | | 10 | |
| | | | 12,574,997 | | | | 29,444 | | | | 41,000 | |
| Net Realized and Unrealized Gain(Loss) on Investments and Foreign Currency Transactions | | | 1,728,419 | | | | (679,336 | ) | | | 26 | |
| | | | | | | | | | | | | |
| Net Increase(Decrease) in Net Assets Resulting From Operations | | $ | 1,862,779 | | | $ | (524,713 | ) | | $ | 2,212 | |
| ** | Fund commenced operations on December 17, 2015. |
The accompanying notes are an integral part of these financial statements.
| Copeland Risk Managed Dividend Growth Fund |
| STATEMENTS OF CHANGES IN NET ASSETS |
| | | Six Months | | | Year | |
| | | Ended | | | Ended | |
| | | May 31, 2016 | | | November 30, 2015 | |
| Operations: | | (Unaudited) | | | | | |
| Net Investment Income | | $ | 134,360 | | | $ | 3,818,914 | |
| Net Realized Gain(Loss) on Investments and Foreign Currency Transactions | | | (10,846,578 | ) | | | 57,246,340 | |
| Net Change in Unrealized Appreciation (Depreciation) on Investments | | | 12,574,997 | | | | (108,627,507 | ) |
| Net Decrease in Net Assets Resulting From Operations | | | 1,862,779 | | | | (47,562,253 | ) |
| | | | | | | | | |
| Distributions to Shareholders From: | | | | | | | | |
| Net Investment Income | | | | | | | | |
| Class A ($0.05 and $0.03 per share, respectively) | | | (632,302 | ) | | | (582,684 | ) |
| Class I ($0.10 and $0.09 per share, respectively) | | | (1,684,154 | ) | | | (1,825,816 | ) |
| | | | (2,316,456 | ) | | | (2,408,500 | ) |
| Net Realized Gains | | | | | | | | |
| Class A ($1.13 and $0.84 per share, respectively) | | | (15,176,594 | ) | | | (15,589,469 | ) |
| Class C ($1.13 and $0.84 per share, respectively) | | | (6,668,143 | ) | | | (5,002,845 | ) |
| Class I ($1.13 and $0.84 per share, respectively) | | | (19,212,728 | ) | | | (16,828,788 | ) |
| | | | (41,057,465 | ) | | | (37,421,102 | ) |
| Total Distributions to Shareholders | | | (43,373,921 | ) | | | (39,829,602 | ) |
| | | | | | | | | |
| Beneficial Interest Transactions: | | | | | | | | |
| Class A | | | | | | | | |
| Proceeds from Shares Issued (403,961 and 3,491,109 shares, respectively) | | | 4,915,299 | | | | 51,542,521 | |
| Distributions Reinvested (1,209,984 and 1,095,356 shares, respectively) | | | 14,907,005 | | | | 15,286,930 | |
| Cost of Shares Redeemed (5,676,130 and 11,563,481 shares, respectively) | | | (69,908,296 | ) | | | (167,295,152 | ) |
| Redemption Fees | | | 468 | | | | 6,531 | |
| Total Class A Shares | | | (50,085,524 | ) | | | (100,459,170 | ) |
| | | | | | | | | |
| Class C | | | | | | | | |
| Proceeds from Shares Issued (207,587 and 1,533,966 shares, respectively) | | | 2,496,406 | | | | 22,507,464 | |
| Distributions Reinvested (543,922 and 360,867 shares, respectively) | | | 6,608,649 | | | | 4,948,328 | |
| Cost of Shares Redeemed (2,048,221 and 1,551,507 shares, respectively) | | | (24,874,024 | ) | | | (21,957,854 | ) |
| Redemption Fees | | | 204 | | | | 2,346 | |
| Total Class C Shares | | | (15,768,765 | ) | | | 5,500,284 | |
| | | | | | | | | |
| Class I | | | | | | | | |
| Proceeds from Shares Issued (1,909,974 and 6,618,260 shares, respectively) | | | 23,124,152 | | | | 98,111,650 | |
| Distributions Reinvested (1,540,336 and 1,238,904 shares, respectively) | | | 18,899,923 | | | | 17,235,625 | |
| Cost of Shares Redeemed (6,703,502 and 10,112,757 shares, respectively) | | | (83,295,535 | ) | | | (145,539,557 | ) |
| Redemption Fees | | | 606 | | | | 7,857 | |
| Total Class I Shares | | | (41,270,854 | ) | | | (30,184,425 | ) |
| | | | | | | | | |
| Total Beneficial Interest Transactions | | | (107,125,143 | ) | | | (125,143,311 | ) |
| | | | | | | | | |
| Decrease in Net Assets | | | (148,636,285 | ) | | | (212,535,166 | ) |
| | | | | | | | | |
| Net Assets: | | | | | | | | |
| Beginning of Period | | | 522,126,057 | | | | 734,661,223 | |
| End of Period** | | $ | 373,489,772 | | | $ | 522,126,057 | |
| | | | | | | | | |
| ** Includes undistributed net investment income of: | | $ | 136,550 | | | $ | 2,318,646 | |
The accompanying notes are an integral part of these financial statements.
| Copeland International Risk Managed Dividend Growth Fund |
| STATEMENTS OF CHANGES IN NET ASSETS |
| | | Six Months | | | Year | |
| | | Ended | | | Ended | |
| | | May 31, 2016 | | | November 30, 2015 | |
| Operations: | | (Unaudited) | | | | | |
| Net Investment Income(Loss) | | $ | 154,623 | | | $ | (82,925 | ) |
| Net Realized Loss on Investments and Foreign Currency Transactions | | | (708,780 | ) | | | (1,513,495 | ) |
| Net Change in Unrealized Appreciation on Investments and Foreign Currency Transactions | | | 29,444 | | | | 27,779 | |
| Net Increase(Decrease) in Net Assets Resulting From Operations | | | (524,713 | ) | | | (1,568,641 | ) |
| | | | | | | | | |
| Distributions to Shareholders From: | | | | | | | | |
| Net Investment Income | | | | | | | | |
| Class I ($0.01 and $0.00 per share, respectively) | | | (11,199 | ) | | | — | |
| | | | | | | | | |
| Total Distributions to Shareholders | | | (11,199 | ) | | | — | |
| | | | | | | | | |
| Beneficial Interest Transactions: | | | | | | | | |
| Class A | | | | | | | | |
| Proceeds from Shares Issued (106,523 and 658,186 shares, respectively) | | | 1,143,252 | | | | 7,592,808 | |
| Cost of Shares Redeemed (472,125 and 1,034,240 shares, respectively) | | | (4,960,279 | ) | | | (11,562,906 | ) |
| Redemption Fees | | | — | | | | 851 | |
| Total Class A Shares | | | (3,817,027 | ) | | | (3,969,247 | ) |
| | | | | | | | | |
| Class C | | | | | | | | |
| Proceeds from Shares Issued (78,582 and 315,454 shares, respectively) | | | 822,101 | | | | 3,507,234 | |
| Cost of Shares Redeemed (87,945 and 149,751 shares, respectively) | | | (919,449 | ) | | | (1,663,041 | ) |
| Redemption Fees | | | — | | | | 395 | |
| Total Class C Shares | | | (97,348 | ) | | | 1,844,588 | |
| | | | | | | | | |
| Class I | | | | | | | | |
| Proceeds from Shares Issued (117,796 and 911,310 shares, respectively) | | | 1,266,284 | | | | 10,397,435 | |
| Distributions Reinvested (996 and 0 shares, respectively) | | | 10,862 | | | | — | |
| Cost of Shares Redeemed (501,201 and 664,108 shares, respectively) | | | (5,304,394 | ) | | | (7,500,842 | ) |
| Redemption Fees | | | — | | | | 749 | |
| Total Class I Shares | | | (4,027,248 | ) | | | 2,897,342 | |
| | | | | | | | | |
| Total Beneficial Interest Transactions | | | (7,941,623 | ) | | | 772,683 | |
| | | | | | | | | |
| Decrease in Net Assets | | | (8,477,535 | ) | | | (795,958 | ) |
| | | | | | | | | |
| Net Assets: | | | | | | | | |
| Beginning of Period | | | 35,324,967 | | | | 36,120,925 | |
| End of Period** | | $ | 26,847,432 | | | $ | 35,324,967 | |
| | | | | | | | | |
| ** Includes accumulated net investment income (loss) of: | | $ | 56,401 | | | $ | (87,023 | ) |
The accompanying notes are an integral part of these financial statements.
| Copeland International Small Cap Dividend Growth Fund |
| STATEMENTS OF CHANGES IN NET ASSETS |
| | | For the Period | |
| | | Ended | |
| | | May 31, 2016 ** | |
| Operations: | | (Unaudited) | |
| Net Investment Income | | $ | 2,186 | |
| Net Realized Loss on Investments and Foreign Currency Transactions | | | (40,974 | ) |
| Net Change in Unrealized Appreciation on Investments and Foreign Currency Transactions | | | 41,000 | |
| Net Increase(Decrease) in Net Assets Resulting From Operations | | | 2,212 | |
| | | | | |
| Beneficial Interest Transactions: | | | | |
| Class A | | | | |
| Proceeds from Shares Issued (257 shares) | | | 2,530 | |
| Total Class A Shares | | | 2,530 | |
| | | | | |
| Class I | | | | |
| Proceeds from Shares Issued (62,496 shares) | | | 624,990 | |
| Cost of Shares Redeemed (3 shares) | | | (30 | ) |
| Total Class I Shares | | | 624,960 | |
| | | | | |
| Total Beneficial Interest Transactions | | | 627,490 | |
| | | | | |
| Increase in Net Assets | | | 629,702 | |
| | | | | |
| Net Assets: | | | | |
| Beginning of Period | | | — | |
| End of Period* | | $ | 629,702 | |
| | | | | |
| * Includes accumulated net investment income of: | | $ | 2,186 | |
| ** Fund commenced operations on December 17, 2015. | | | | |
The accompanying notes are an integral part of these financial statements.
| Copeland Risk Managed Dividend Growth Fund |
| FINANCIAL HIGHLIGHTS |
| |
| The table below sets forth financial data for one share of beneficial interest outstanding throughout each period presented. |
| | | Class A | |
| | | Six Months | | | Year | | | Year | | | Year | | | Year | | | Period | |
| | | Ended | | | Ended | | | Ended | | | Ended | | | Ended | | | Ended | |
| | | May 31, 2016 | | | November 30, 2015 | | | November 30, 2014 | | | November 30, 2013 | | | November 30, 2012 | | | November 30, 2011* | |
| | | (unaudited) | | | | | | | | | | | | | | | | |
| Net Asset Value, Beginning of Period | | $ | 13.38 | | | $ | 15.31 | | | $ | 14.20 | | | $ | 10.99 | | | $ | 10.18 | | | $ | 10.00 | |
| | | | | | | | | | | | | | | | | | | | | | | | | |
| Increase From Operations: | | | | | | | | | | | | | | | | | | | | | | | | |
| Net investment income (a) | | | 0.01 | | | | 0.08 | | | | 0.07 | | | | 0.10 | | | | 0.14 | | | | 0.07 | |
| Net gain(loss) from securities (both realized and unrealized) | | | 0.09 | | | | (1.14 | ) | | | 1.47 | | | | 3.17 | | | | 0.77 | | | | 0.15 | |
| Total from operations | | | 0.10 | | | | (1.06 | ) | | | 1.54 | | | | 3.27 | | | | 0.91 | | | | 0.22 | |
| | | | | | | | | | | | | | | | | | | | | | | | | |
| Distributions to shareholders from: | | | | | | | | | | | | | | | | | | | | | | | | |
| Net investment income | | | (0.05 | ) | | | (0.03 | ) | | | (0.07 | ) | | | (0.04 | ) | | | (0.10 | ) | | | (0.04 | ) |
| Net realized gains | | | (1.13 | ) | | | (0.84 | ) | | | (0.36 | ) | | | (0.02 | ) | | | — | | | | — | |
| Total distributions | | | (1.18 | ) | | | (0.87 | ) | | | (0.43 | ) | | | (0.06 | ) | | | (0.10 | ) | | | (0.04 | ) |
| | | | | | | | | | | | | | | | | | | | | | | | | |
| Redemption fees (e) | | | 0.00 | | | | 0.00 | | | | 0.00 | | | | 0.00 | | | | 0.00 | | | | 0.00 | |
| | | | | | | | | | | | | | | | | | | | | | | | | |
| Net Asset Value, End of Period | | $ | 12.30 | | | $ | 13.38 | | | $ | 15.31 | | | $ | 14.20 | | | $ | 10.99 | | | $ | 10.18 | |
| | | | | | | | | | | | | | | | | | | | | | | | | |
| Total Return (b) | | | 0.73 | % (d) | | | (7.08 | )% | | | 11.14 | % | | | 29.87 | % | | | 9.01 | % | | | 2.19 | % (d) |
| | | | | | | | | | | | | | | | | | | | | | | | | |
| Ratios/Supplemental Data | | | | | | | | | | | | | | | | | | | | | | | | |
| Net assets, end of period (in 000’s) | | $ | 125,086 | | | $ | 190,458 | | | $ | 324,664 | | | $ | 443,822 | | | $ | 293,049 | | | $ | 107,431 | |
| Ratio of expenses to average net assets: | | | | | | | | | | | | | | | | | | | | | | | | |
| before reimbursement | | | 1.60 | % (c) | | | 1.48 | % | | | 1.46 | % | | | 1.55 | % | | | 1.57 | % | | | 2.88 | % (c) |
| net of reimbursement | | | 1.45 | % (c) | | | 1.45 | % | | | 1.45 | % | | | 1.45 | % | | | 1.45 | % | | | 1.45 | % (c) |
| Ratio of net investment income to average net assets | | | 0.11 | % (c) | | | 0.57 | % | | | 0.48 | % | | | 0.81 | % | | | 1.31 | % | | | 0.73 | % (c) |
| Portfolio turnover rate | | | 62 | % (d) | | | 142 | % | | | 44 | % | | | 39 | % | | | 139 | % | | | 382 | % (d) |
| * | Class A commenced operations on December 28, 2010. |
| (a) | Per share amounts are calculated using the average shares method, which more appropriately presents the per share data for the period. |
| (b) | Total returns are historical in nature and assume changes in share price, reinvestment of dividends and capital gains distributions, if any. Had the Adviser not absorbed a portion of fund expenses, the total return would have been lower. |
| (e) | Less than $0.01 per share. |
The accompanying notes are an integral part of these financial statements.
| Copeland Risk Managed Dividend Growth Fund |
| FINANCIAL HIGHLIGHTS |
| |
| The table below sets forth financial data for one share of beneficial interest outstanding throughout each period presented. |
| | | Class C | |
| | | Six Months | | | Year | | | Year | | | Year | | | Period | |
| | | Ended | | | Ended | | | Ended | | | Ended | | | Ended | |
| | | May 31, 2016 | | | November 30, 2015 | | | November 30, 2014 | | | November 30, 2013 | | | November 30, 2012 * | |
| | | (unaudited) | | | | | | | | | | | | | |
| Net Asset Value, Beginning of Period | | $ | 13.17 | | | $ | 15.16 | | | $ | 14.10 | | | $ | 10.96 | | | $ | 10.23 | |
| | | | | | | | | | | | | | | | | | | | | |
| Increase From Operations: | | | | | | | | | | | | | | | | | | | | |
| Net investment income (loss) (a) | | | (0.04 | ) | | | (0.03 | ) | | | (0.04 | ) | | | 0.01 | | | | 0.07 | |
| Net gain(loss) from securities (both realized and unrealized) | | | 0.09 | | | | (1.12 | ) | | | 1.47 | | | | 3.15 | | | | 0.72 | |
| Total from operations | | | 0.05 | | | | (1.15 | ) | | | 1.43 | | | | 3.16 | | | | 0.79 | |
| | | | | | | | | | | | | | | | | | | | | |
| Distributions to shareholders from: | | | | | | | | | | | | | | | | | | | | |
| Net investment income | | | — | | | | — | | | | (0.01 | ) | | | 0.00 | (e) | | | (0.06 | ) |
| Net realized gains | | | (1.13 | ) | | | (0.84 | ) | | | (0.36 | ) | | | (0.02 | ) | | | — | |
| Total distributions | | | (1.13 | ) | | | (0.84 | ) | | | (0.37 | ) | | | (0.02 | ) | | | (0.06 | ) |
| | | | | | | | | | | | | | | | | | | | | |
| Redemption fees (e) | | | 0.00 | | | | 0.00 | | | | 0.00 | (e) | | | 0.00 | | | | 0.00 | |
| | | | | | | | | | | | | | | | | | | | | |
| Net Asset Value, End of Period | | $ | 12.09 | | | $ | 13.17 | | | $ | 15.16 | | | $ | 14.10 | | | $ | 10.96 | |
| | | | | | | | | | | | | | | | | | | | | |
| Total Return (b) | | | 0.36 | % (d) | | | (7.74 | )% | | | 10.36 | % | | | 28.89 | % | | | 7.77 | % (d) |
| | | | | | | | | | | | | | | | | | | | | |
| Ratios/Supplemental Data | | | | | | | | | | | | | | | | | | | | |
| Net assets, end of period (in 000’s) | | $ | 59,453 | | | $ | 81,851 | | | $ | 89,017 | | | $ | 52,399 | | | $ | 24,459 | |
| Ratio of expenses to average net assets: | | | | | | | | | | | | | | | | | | | | |
| before reimbursement | | | 2.35 | % (c) | | | 2.24 | % | | | 2.21 | % | | | 2.30 | % | | | 2.34 | % (c) |
| net of reimbursement | | | 2.20 | % (c) | | | 2.20 | % | | | 2.20 | % | | | 2.20 | % | | | 2.20 | % (c) |
| Ratio of net investment income(loss) to average net assets | | | (0.64 | )% (c) | | | (0.21 | )% | | | (0.27 | )% | | | 0.06 | % | | | 0.70 | % (c) |
| Portfolio turnover rate | | | 62 | % (d) | | | 142 | % | | | 44 | % | | | 39 | % | | | 139 | % (d) |
| * | Class C commenced operations on January 5, 2012. |
| (a) | Per share amounts are calculated using the average shares method, which more appropriately presents the per share data for the period. |
| (b) | Total returns are historical in nature and assume changes in share price, reinvestment of dividends and capital gains distributions, if any. Had the Adviser not absorbed a portion of fund expenses, the total return would have been lower. |
| (e) | Less than $0.01 per share. |
The accompanying notes are an integral part of these financial statements.
| Copeland Risk Managed Dividend Growth Fund |
| FINANCIAL HIGHLIGHTS |
| |
| The table below sets forth financial data for one share of beneficial interest outstanding throughout each period presented. |
| | | Class I | |
| | | Six Months | | | Year | | | Year | | | Period | |
| | | Ended | | | Ended | | | Ended | | | Ended | |
| | | May 31, 2016 | | | November 30, 2015 | | | November 30, 2014 | | | November 30, 2013 * | |
| | | (unaudited) | | | | | | | | | | |
| Net Asset Value, Beginning of Period | | $ | 13.38 | | | $ | 15.34 | | | $ | 14.22 | | | $ | 11.89 | |
| | | | | | | | | | | | | | | | | |
| Increase From Operations: | | | | | | | | | | | | | | | | |
| Net investment income (a) | | | 0.02 | | | | 0.11 | | | | 0.13 | | | | 0.09 | |
| Net gain(loss) from securities (both realized and unrealized) | | | 0.09 | | | | (1.14 | ) | | | 1.44 | | | | 2.29 | |
| Total from operations | | | 0.11 | | | | (1.03 | ) | | | 1.57 | | | | 2.38 | |
| | | | | | | | | | | | | | | | | |
| Distributions to shareholders from: | | | | | | | | | | | | | | | | |
| Net investment income | | | (0.10 | ) | | | (0.09 | ) | | | (0.09 | ) | | | (0.03 | ) |
| Net realized gains | | | (1.13 | ) | | | (0.84 | ) | | | (0.36 | ) | | | (0.02 | ) |
| Total distributions | | | (1.23 | ) | | | (0.93 | ) | | | (0.45 | ) | | | (0.05 | ) |
| | | | | | | | | | | | | | | | | |
| Redemption fees | | | 0.00 | (e) | | | 0.00 | (e) | | | 0.00 | (e) | | | — | |
| | | | | | | | | | | | | | | | | |
| Net Asset Value, End of Period | | $ | 12.26 | | | $ | 13.38 | | | $ | 15.34 | | | $ | 14.22 | |
| | | | | | | | | | | | | | | | | |
| Total Return (b) | | | 0.83 | % (d) | | | (6.87 | )% | | | 11.38 | % | | | 20.04 | % (d) |
| | | | | | | | | | | | | | | | | |
| Ratios/Supplemental Data | | | | | | | | | | | | | | | | |
| Net assets, end of period (in 000’s) | | $ | 188,950 | | | $ | 249,817 | | | $ | 320,981 | | | $ | 6,704 | |
| Ratio of expenses to average net assets: | | | | | | | | | | | | | | | | |
| before reimbursement | | | 1.35 | % (c) | | | 1.24 | % | | | 1.24 | % | | | 1.30 | % (c) |
| net of reimbursement | | | 1.30 | % (c) | | | 1.24 | % | | | 1.24 | % | | | 1.30 | % (c) |
| Ratio of net investment income to average net assets | | | 0.26 | % (c) | | | 0.76 | % | | | 0.63 | % | | | 1.06 | % (c) |
| Portfolio turnover rate | | | 62 | % (d) | | | 142 | % | | | 44 | % | | | 39 | % (d) |
| * | Class I commenced operations on March 1, 2013. |
| (a) | Per share amounts are calculated using the average shares method, which more appropriately presents the per share data for the period. |
| (b) | Total returns are historical in nature and assume changes in share price, reinvestment of dividends and capital gains distributions, if any. Had the Adviser not absorbed a portion of fund expenses, the total return would have been lower. |
| (e) | Less than $0.01 per share. |
The accompanying notes are an integral part of these financial statements.
| Copeland International Risk Managed Dividend Growth Fund |
| FINANCIAL HIGHLIGHTS |
| |
| The table below sets forth financial data for one share of beneficial interest outstanding throughout each period presented. |
| | | Class A | |
| | | Six Months | | | Year | | | Year | | | Period | |
| | | Ended | | | Ended | | | Ended | | | Ended | |
| | | May 31, 2016 | | | November 30, 2015 | | | November 30, 2014 | | | November 30, 2013 * | |
| | | (unaudited) | | | | | | | | | | |
| Net Asset Value, Beginning of Period | | $ | 10.92 | | | $ | 11.28 | | | $ | 11.01 | | | $ | 10.00 | |
| | | | | | | | | | | | | | | | | |
| Increase From Operations: | | | | | | | | | | | | | | | | |
| Net investment income (loss) (a) | | | 0.06 | | | | (0.02 | ) | | | 0.06 | | | | 0.04 | |
| Net gain(loss) from securities (both realized and unrealized) | | | (0.13 | ) | | | (0.34 | ) | | | 0.22 | | | | 0.97 | |
| Total from operations | | | (0.07 | ) | | | (0.36 | ) | | | 0.28 | | | | 1.01 | |
| | | | | | | | | | | | | | | | | |
| Distributions to shareholders from: | | | | | | | | | | | | | | | | |
| Net realized gains | | | — | | | | — | | | | (0.01 | ) | | | — | |
| Total distributions | | | — | | | | — | | | | (0.01 | ) | | | — | |
| | | | | | | | | | | | | | | | | |
| Redemption fees | | | — | | | | 0.00 | (e) | | | 0.00 | (e) | | | 0.00 | (e) |
| | | | | | | | | | | | | | | | | |
| Net Asset Value, End of Period | | $ | 10.85 | | | $ | 10.92 | | | $ | 11.28 | | | $ | 11.01 | |
| | | | | | | | | | | | | | | | | |
| Total Return (b) | | | (0.64 | )% (d) | | | (2.17 | )% | | | 2.51 | % | | | 10.10 | % (d) |
| | | | | | | | | | | | | | | | | |
| Ratios/Supplemental Data | | | | | | | | | | | | | | | | |
| Net assets, end of period (in 000’s) | | $ | 9,119 | | | $ | 13,169 | | | $ | 17,840 | | | $ | 8,116 | |
| Ratio of expenses to average net assets: | | | | | | | | | | | | | | | | |
| before reimbursement | | | 2.14 | % (c) | | | 2.04 | % | | | 2.33 | % | | | 7.74 | % (c) |
| net of reimbursement | | | 1.60 | % (c) | | | 1.60 | % | | | 1.60 | % | | | 1.60 | % (c) |
| Ratio of net investment income(loss) to average net assets | | | 1.12 | % (c) | | | (0.21 | )% | | | 0.48 | % | | | 0.36 | % (c) |
| Portfolio turnover rate | | | 81 | % (d) | | | 323 | % | | | 211 | % | | | 68 | % (d) |
| * | Class A commenced operations on December 17, 2012. |
| (a) | Per share amounts are calculated using the average shares method, which more appropriately presents the per share data for the period. |
| (b) | Total returns are historical in nature and assume changes in share price, reinvestment of dividends and capital gains distributions, if any. Had the Adviser not absorbed a portion of fund expenses, the total return would have been lower. |
| (e) | Less than $0.01 per share. |
The accompanying notes are an integral part of these financial statements.
| Copeland International Risk Managed Dividend Growth Fund |
| FINANCIAL HIGHLIGHTS |
| |
| The table below sets forth financial data for one share of beneficial interest outstanding throughout each period presented. |
| | | Class C | |
| | | Six Months | | | Year | | | Year | | | Period | |
| | | Ended | | | Ended | | | Ended | | | Ended | |
| | | May 31, 2016 | | | November 30, 2015 | | | November 30, 2014 | | | November 30, 2013 * | |
| | | (unaudited) | | | | | | | | | | |
| Net Asset Value, Beginning of Period | | $ | 10.69 | | | $ | 11.12 | | | $ | 10.95 | | | $ | 10.00 | |
| | | | | | | | | | | | | | | | | |
| Increase From Operations: | | | | | | | | | | | | | | | | |
| Net investment income (loss) (a) | | | 0.03 | | | | (0.10 | ) | | | (0.04 | ) | | | (0.03 | ) |
| Net gain(loss) from securities (both realized and unrealized) | | | (0.14 | ) | | | (0.33 | ) | | | 0.22 | | | | 0.98 | |
| Total from operations | | | (0.11 | ) | | | (0.43 | ) | | | 0.18 | | | | 0.95 | |
| | | | | | | | | | | | | | | | | |
| Distributions to shareholders from: | | | | | | | | | | | | | | | | |
| Net realized gains | | | — | | | | | | | | (0.01 | ) | | | — | |
| Total distributions | | | — | | | | | | | | (0.01 | ) | | | — | |
| | | | | | | | | | | | | | | | | |
| Redemption fees | | | — | | | | 0.00 | (e) | | | 0.00 | (e) | | | 0.00 | |
| | | | | | | | | | | | | | | | | |
| Net Asset Value, End of Period | | $ | 10.58 | | | $ | 10.69 | | | $ | 11.12 | | | $ | 10.95 | |
| | | | | | | | | | | | | | | | | |
| Total Return (b) | | | (1.03 | )% (d) | | | (2.87 | )% | | | 1.61 | % | | | 9.50 | % (d) |
| | | | | | | | | | | | | | | | | |
| Ratios/Supplemental Data | | | | | | | | | | | | | | | | |
| Net assets, end of period (in 000’s) | | $ | 7,082 | | | $ | 7,254 | | | $ | 5,706 | | | $ | 1,708 | |
| Ratio of expenses to average net assets: | | | | | | | | | | | | | | | | |
| before reimbursement | | | 2.90 | % (c) | | | 2.80 | % | | | 3.08 | % | | | 8.49 | % (c) |
| net of reimbursement | | | 2.35 | % (c) | | | 2.35 | % | | | 2.35 | % | | | 2.35 | % (c) |
| Ratio of net investment income(loss) to average net assets | | | 0.63 | % (c) | | | (0.88 | )% | | | (0.27 | )% | | | (0.39 | )% (c) |
| Portfolio turnover rate | | | 81 | % (d) | | | 323 | % | | | 211 | % | | | 68 | % (d) |
| * | Class C commenced operations on December 17, 2012. |
| (a) | Per share amounts are calculated using the average shares method, which more appropriately presents the per share data for the period. |
| (b) | Total returns are historical in nature and assume changes in share price, reinvestment of dividends and capital gains distributions, if any. Had the Adviser not absorbed a portion of fund expenses, the total return would have been lower. |
| (e) | Less than $0.01 per share. |
The accompanying notes are an integral part of these financial statements.
| Copeland International Risk Managed Dividend Growth Fund |
| FINANCIAL HIGHLIGHTS |
| |
| The table below sets forth financial data for one share of beneficial interest outstanding throughout each period presented. |
| | | Class I | |
| | | Six Months | | | Year | | | Year | | | Period | |
| | | Ended | | | Ended | | | Ended | | | Ended | |
| | | May 31, 2016 | | | November 30, 2015 | | | November 30, 2014 | | | November 30, 2013 * | |
| | | (unaudited) | | | | | | | | | | |
| Net Asset Value, Beginning of Period | | $ | 10.95 | | | $ | 11.30 | | | $ | 11.02 | | | $ | 10.00 | |
| | | | | | | | | | | | | | | | | |
| Increase From Operations: | | | | | | | | | | | | | | | | |
| Net investment income (a) | | | 0.07 | | | | 0.01 | | | | 0.06 | | | | 0.06 | |
| Net gain(loss) from securities (both realized and unrealized) | | | (0.12 | ) | | | (0.36 | ) | | | 0.23 | | | | 0.96 | |
| Total from operations | | | (0.05 | ) | | | (0.35 | ) | | | 0.29 | | | | 1.02 | |
| | | | | | | | | | | | | | | | | |
| Distributions to shareholders from: | | | | | | | | | | | | | | | | |
| Net Investment Income | | | (0.01 | ) | | | — | | | | — | | | | — | |
| Net realized gains | | | — | | | | — | | | | (0.01 | ) | | | — | |
| Total distributions | | | (0.01 | ) | | | — | | | | (0.01 | ) | | | — | |
| | | | | | | | | | | | | | | | | |
| Redemption fees | | | — | | | | 0.00 | (e) | | | 0.00 | (e) | | | 0.00 | (e) |
| | | | | | | | | | | | | | | | | |
| Net Asset Value, End of Period | | $ | 10.89 | | | $ | 10.95 | | | $ | 11.30 | | | $ | 11.02 | |
| | | | | | | | | | | | | | | | | |
| Total Return (b) | | | (0.47 | )% (d) | | | (2.00 | ) | | | 2.60 | % | | | 10.20 | % (d) |
| | | | | | | | | | | | | | | | | |
| Ratios/Supplemental Data | | | | | | | | | | | | | | | | |
| Net assets, end of period (in 000’s) | | $ | 10,646 | | | $ | 14,902 | | | $ | 12,575 | | | $ | 847 | |
| Ratio of expenses to average net assets: | | | | | | | | | | | | | | | | |
| before reimbursement | | | 1.99 | % (c) | | | 1.89 | % | | | 2.18 | % | | | 17.85 | % (c) |
| net of reimbursement | | | 1.45 | % (c) | | | 1.45 | % | | | 1.45 | % | | | 1.45 | % (c) |
| Ratio of net investment income to average net assets | | | 1.23 | % (c) | | | 0.05 | % | | | 0.63 | % | | | 0.59 | % (c) |
| Portfolio turnover rate | | | 81 | % (d) | | | 323 | % | | | 211 | % | | | 68 | % (d) |
| * | Class I commenced operations on December 17, 2012. |
| (a) | Per share amounts are calculated using the average shares method, which more appropriately presents the per share data for the period. |
| (b) | Total returns are historical in nature and assume changes in share price, reinvestment of dividends and capital gains distributions, if any. Had the Adviser not absorbed a portion of fund expenses, the total return would have been lower. |
| (e) | Less than $0.01 per share. |
The accompanying notes are an integral part of these financial statements.
| Copeland International Small Cap Dividend Growth Fund |
| FINANCIAL HIGHLIGHTS |
| |
| The table below sets forth financial data for one share of beneficial interest outstanding throughout each period presented. |
| | | Class A | | | Class I | |
| | | Period | | | Period | |
| | | Ended | | | Ended | |
| | | May 31, 2016 * | | | May 31, 2016 * | |
| | | (unaudited) | | | (unaudited) | |
| Net Asset Value, Beginning of Period | | $ | 10.00 | | | $ | 10.00 | |
| | | | | | | | | |
| Increase From Operations: | | | | | | | | |
| Net investment income (a) | | | 0.07 | | | | 0.04 | |
| Net gain(loss) from securities (both realized and unrealized) | | | (0.03 | ) | | | (0.01 | ) |
| Total from operations | | | 0.04 | | | | 0.03 | |
| | | | | | | | | |
| Distributions to shareholders from: | | | | | | | | |
| Net realized gains | | | — | | | | — | |
| Total distributions | | | — | | | | — | |
| | | | | | | | | |
| Redemption fees (e) | | | 0.00 | | | | 0.00 | |
| | | | | | | | | |
| Net Asset Value, End of Period | | $ | 10.04 | | | $ | 10.03 | |
| | | | | | | | | |
| Total Return (b)(d) | | | 0.40 | % | | | 0.30 | % |
| | | | | | | | | |
| Ratios/Supplemental Data | | | | | | | | |
| Net assets, end of period (in 000’s) | | $ | 3 | | | $ | 627 | |
| Ratio of expenses to average net assets: | | | | | | | | |
| before reimbursement (c) | | | 27.41 | % | | | 27.55 | % |
| net of reimbursement (c) | | | 1.40 | % | | | 1.25 | % |
| Ratio of net investment income to average net assets (c) | | | 1.36 | % | | | 0.73 | % |
| Portfolio turnover rate (d) | | | 46 | % | | | 46 | % |
| * | Class A and I commenced operations on December 17, 2015. |
| (a) | Per share amounts are calculated using the average shares method, which more appropriately presents the per share data for the period. |
| (b) | Total returns are historical in nature and assume changes in share price, reinvestment of dividends and capital gains distributions, if any. Had the Adviser not absorbed a portion of fund expenses, the total return would have been lower. |
| (e) | Less than $0.01 per share. |
The accompanying notes are an integral part of these financial statements.
| Copeland Trust |
| NOTES TO FINANCIAL STATEMENTS (Unaudited) |
| May 31, 2016 |
| |
Copeland Risk Managed Dividend Growth Fund (the “Domestic Fund”), Copeland International Risk Managed Dividend Growth Fund (the “International Fund”) and Copeland International Small Cap Dividend Growth Fund (the “International Small Cap Fund”) are all diversified series of Copeland Trust (the “Trust”). The Trust is registered under the Investment Company Act of 1940, as amended (the “1940 Act”) as an open-end management investment company. The Trust was organized as a statutory trust on September 10, 2010, under the laws of the State of Delaware. The investment objective of each fund is to seek long-term capital appreciation and income while preserving capital in declining markets. Each Fund is an investment company and accordingly follows the investment company accounting and reporting guidance of the Financial Accounting Standards Board (“FASB”) Accounting Standard Codification Topic 946 “Financial Services—Investment Companies”.
The Domestic and International Funds currently offer Class A, Class C and Class I shares. The Domestic Fund’s Class A shares commenced operations on December 28, 2010, Class C shares commenced operations on January 5, 2012 and Class I shares commenced operations on March 1, 2013. The International Fund’s Class A, Class C and Class I shares commenced operations on December 17, 2012. The International Small Cap Fund offers Class A and Class I shares which commenced operations on December 17, 2015. Class A shares are offered at net asset value plus a maximum sales charge of 5.75%. Purchases of $1,000,000 or more may be subject to a maximum contingent deferred sales charge of 1.00% on shares redeemed within 18 months. Class C and Class I shares are offered at net asset value. Each class represents an interest in the same assets of the Funds and classes are identical except for differences in their sales charge structures and ongoing service and distribution charges. All classes of shares have equal voting privileges except that each class has exclusive voting rights with respect to its service and/or distribution plans. The Funds’ income, expenses (other than class specific distribution fees) and realized and unrealized gains and losses are allocated proportionately each day based upon the relative net assets of each class.
| 2. | SUMMARY OF SIGNIFICANT ACCOUNTING POLICIES |
The following is a summary of significant accounting policies followed by the Funds in preparation of their financial statements. These policies are in conformity with accounting principles generally accepted in the United States of America (“GAAP”). The preparation of financial statements requires management to make estimates and assumptions that affect the reported amounts of assets and liabilities and disclosure of contingent assets and liabilities at the date of the financial statements and the reported amounts of income and expenses for the period. Actual results could differ from those estimates. The Funds follow the specialized accounting and reporting requirements under GAAP that are applicable to investment companies.
SECURITY VALUATION
The Funds’ securities are valued at the last sale price on the exchange in which such securities are primarily traded, as of the close of business on the day the securities are being valued. In the absence of a sale on the primary exchange, such securities shall be valued at the last bid on the primary exchange. NASDAQ traded securities are valued using the NASDAQ Official Closing Price (“NOCP”). Investments valued in currencies other than the U.S. dollar are converted to U.S. dollars using exchange rates obtained from pricing services. Short-term investments that mature in 60 days or less may be valued at amortized cost. Investments in open-end investment companies are valued at net asset value.
If market quotations are not readily available, securities will be valued at their fair market value as determined in good faith by the adviser in accordance with procedures approved by the Trust’s Board of Trustees (the “Board”) and evaluated by the Board as to the reliability of the fair value method used. (The procedures consider, among others, the following factors to determine a security’s fair value: the nature and pricing history (if any) of the security; whether any dealer quotations for the security are available; and possible valuation methodologies that could be used to determine the fair value of the security.)
| Copeland Trust |
| NOTES TO FINANCIAL STATEMENTS (Unaudited) (Continued) |
| May 31, 2016 |
| |
The Funds utilize various methods to measure the fair value of its investments on a recurring basis. GAAP establishes a hierarchy that prioritizes inputs to valuation methods. The three levels of input are:
Level 1 – Unadjusted quoted prices in active markets for identical assets and liabilities that the Funds have the ability to access.
Level 2 – Observable inputs other than quoted prices included in Level 1 that are observable for the asset or liability, either directly or indirectly. These inputs may include quoted prices for the identical instrument on an inactive market, prices for similar instruments, interest rates, prepayment speeds, credit risk, yield curves, default rates and similar data.
Level 3 – Unobservable inputs for the asset or liability, to the extent relevant observable inputs are not available, representing the Funds’ own assumptions about the assumptions a market participant would use in valuing the asset or liability, and would be based on the best information available.
The availability of observable inputs can vary from security to security and is affected by a wide variety of factors, including, for example, the type of security, whether the security is new and not yet established in the marketplace, the liquidity of markets, and other characteristics particular to the security. To the extent that valuation is based on models or inputs that are less observable or unobservable in the market, the determination of fair value requires more judgment. Accordingly, the degree of judgment exercised in determining fair value is greatest for instruments categorized in Level 3.
The inputs used to measure fair value may fall into different levels of the fair value hierarchy. In such cases, for disclosure purposes, the level in the fair value hierarchy within which the fair value measurement falls in its entirety, is determined based on the lowest level input that is significant to the fair value measurement in its entirety.
The inputs or methodology used for valuing securities are not necessarily an indication of the risk associated with investing in those securities. The following tables summarize the inputs used as of May 31, 2016 for the Funds’ assets measured at fair value:
Copeland Risk Managed Dividend Growth Fund
| Assets | | Level 1 | | | Level 2 | | | Level 3 | | | Total | |
| Common Stock * | | $ | 194,395,407 | | | $ | — | | | $ | — | | | $ | 194,395,407 | |
| Short-term Investment | | | 179,690,530 | | | | — | | | | — | | | | 179,690,530 | |
| Total: | | $ | 374,085,937 | | | $ | — | | | $ | — | | | $ | 374,085,937 | |
Copeland International Risk Managed Dividend Growth Fund
| Assets | | Level 1 | | | Level 2 | | | Level 3 | | | Total | |
| Common Stock * | | $ | 4,988,813 | | | $ | 15,330,454 | | | $ | — | | | $ | 20,319,267 | |
| Short-term Investment | | | 6,687,985 | | | | — | | | | — | | | | 6,687,985 | |
| Total: | | $ | 11,676,798 | | | $ | 15,330,454 | | | $ | — | | | $ | 27,007,252 | |
Copeland International Small Cap Dividend Growth Fund
| Assets | | Level 1 | | | Level 2 | | | Level 3 | | | Total | |
| Common Stock * | | $ | 45,550 | | | $ | 540,251 | | | $ | — | | | $ | 585,801 | |
| Preferred Stock | | | — | | | | 12,405 | | | | — | | | | 12,405 | |
| Total: | | $ | 45,550 | | | $ | 552,656 | | | $ | — | | | $ | 598,206 | |
The Funds did not hold any Level 3 securities during the period.
There were no transfers into or out of Level 1 and Level 2 during the current period presented. It is the Funds’ policy to record transfers into or out of Level 1 and 2 at the end of the reporting period.
| * | Please refer to the Portfolio of Investments for Industry Classification. |
| Copeland Trust |
| NOTES TO FINANCIAL STATEMENTS (Unaudited) (Continued) |
| May 31, 2016 |
| |
Securities in which the International Fund and the International Small Cap Fund invest in may be traded in markets that close before 4:00 p.m. Eastern Time (“ET”). In order to capture the developments that occur between the close of the foreign markets and 4:00 p.m. ET, the International Fund and the International Small Cap Fund utilize fair value prices as provided by an independent pricing vendor on a daily basis for those securities traded on a foreign exchange. The assets valued at fair value are reflected as level 2 assets in the table above.
SECURITY TRANSACTIONS AND INVESTMENT INCOME
Investment security transactions are accounted for on a trade date basis. Cost is determined and gains and losses are based upon the specific identification method for both financial statement and federal income tax purposes. Dividend income is recorded on the ex-dividend date and interest income is recorded on the accrual basis. Purchase discounts and premiums on securities are accreted and amortized over the life of the respective securities.
FEDERAL INCOME TAXES
The Funds intend to continue to comply with the requirements of Subchapter M of the Internal Revenue Code applicable to regulated investment companies and will distribute all of their taxable income, if any, to shareholders. Accordingly, no provision for Federal income taxes is required in the financial statements.
The Funds recognize the tax benefits of uncertain tax positions only where the position is “more likely than not” to be sustained assuming examination by tax authorities. Management has analyzed the Funds’ tax positions, and has concluded that no liability for unrecognized tax benefits should be recorded related to uncertain tax positions related to the open tax years (2013-2015) or expected to be taken in the Funds’ 2016 tax return. The Funds identify their major tax jurisdictions as U.S. Federal and foreign jurisdictions where the Funds may make significant investments; however, the Funds are not aware of any tax positions for which it is reasonably possible that the total amounts of unrecognized tax benefits will change materially in the next twelve months.
FOREIGN CURRENCY
The accounting records of the Funds are maintained in U.S. dollars. Investment securities and other assets and liabilities denominated in a foreign currency, and income receipts and expense payments are translated into U.S. dollars using the prevailing exchange rate at the London market close. Purchases and sales of securities are translated into U.S. dollars at the contractual currency rates established at the approximate time of the trade. Net realized gains and losses on foreign currency transactions represent net gains and losses from currency realized between the trade and settlement dates on securities transactions and the difference between income accrued versus income received. The effects of changes in foreign currency exchange rates on investments in securities are included with the net realized and unrealized gain or loss on investment securities.
FORWARD CURRENCY CONTRACTS
As foreign securities are purchased, the Funds generally enter into forward currency exchange contracts in order to eliminate ongoing foreign currency exchange rate risks. As foreign securities are sold, the foreign currency proceeds are typically repatriated into US dollars. Any realized gains and losses between trade date and settlement date from contract transactions are included as a component of net realized gains (losses) from foreign currency transactions in the Statements of Operations. For the period ended May 31, 2016, the International Fund and the International Small Cap Fund had a net realized gain of $31,782 and $295 on forward currency contracts, respectively.
CONCENTRATION OF RISK
Investing in securities of foreign issuers and currency transactions may involve certain considerations and risks not typically associated with investments in the United States. These risks include revaluation of currencies, adverse fluctuations in foreign currency values and possible adverse political, social and economic developments, including those particular to a specific industry, country or region. These conditions could cause the securities and their
| Copeland Trust |
| NOTES TO FINANCIAL STATEMENTS (Unaudited) (Continued) |
| May 31, 2016 |
| |
markets to be less liquid and prices more volatile than those of comparable U.S. companies and U.S. government securities.
DISTRIBUTIONS TO SHAREHOLDERS
Distributions from investment income, if any, are declared and paid annually and are recorded on the ex-dividend date. The Funds will declare and pay net realized capital gains, if any, annually. The character of income and gains to be distributed is determined in accordance with income tax regulations, which may differ from GAAP. These “book/tax” differences are considered either temporary (i.e., deferred losses, capital loss carry forwards) or permanent in nature. To the extent these differences are permanent in nature, such amounts are reclassified within the composition of net assets based on their federal tax-basis treatment; temporary differences do not require classification.
EXPENSES
Expenses of the Trust that are directly identifiable to a specific Fund are charged to that Fund. Expenses, which are not readily identifiable to a specific Fund, are allocated in such a manner as deemed equitable, taking into consideration the nature and type of expense and the relative sizes of the funds in the Trust.
INDEMNIFICATION
The Funds indemnify their officers and trustees for certain liabilities that may arise from the performance of their duties to the Trust. Additionally, in the normal course of business, the Funds enter into contracts that contain a variety of representations and warranties and which provide general indemnities. The Funds’ maximum exposure under these arrangements is unknown, as this would involve future claims that may be made against the Funds that have not yet occurred. However, based on experience, the Funds expect the risk of loss due to these warranties and indemnities to be remote.
| 3. | ADVISORY FEE AND OTHER RELATED PARTY TRANSACTIONS |
ADVISORY FEE
Subject to the authority of the Board, the adviser is responsible for management of the Funds’ investment portfolios. Pursuant to the Management Agreement (the “Management Agreement”), investment advisory services are provided to the Funds by Copeland Capital Management, LLC (the “Adviser”). Under the terms of the Management Agreement, the Adviser receives monthly fees calculated at an annual rate of 1.00%, 1.10% and 0.90% for the Domestic Fund, the International Fund and the International Small Cap Fund, respectively, of the average daily net assets of each Fund. For the period ended May 31, 2016, the Adviser earned advisory fees of $2,097,487, $162,303 and $2,429 for the Domestic Fund, International Fund and International Small Cap Fund, respectively, before the effect of the Expense Limitation Agreement.
The Adviser, pursuant to an Expense Limitation Agreement (the “Agreement”) has contractually agreed to reduce its fees and/or absorb expenses of each Fund, at least until March 31, 2017, to ensure that Net Annual Operating Expenses (excluding any front-end or contingent deferred loads, brokerage fees and commissions, acquired fund fees and expenses, borrowing costs such as interest and dividend expense on securities sold short, taxes and extraordinary expenses such as litigation) will not exceed 1.45%, 2.20% and 1.30% of the Domestic Fund’s average daily net assets for Class A, Class C and Class I shares, respectively, 1.60%, 2.35% and 1.45% of the International Fund’s average daily net assets for Class A, Class C and Class I shares, respectively, and 1.40% and 1.25% of the International Small Cap Fund’s average daily net assets for Class A and Class I shares, respectively. The Agreement will allow the Adviser, subject to certain conditions, to recover amounts previously reimbursed for operating expenses to a Fund to the extent that the Funds expense ratio falls below the above indicated expense limitations. The amounts that can be recovered will be limited to the difference between the actual expense ratio and the amount of the expense limitation in effect at the time of the deferral and at the time of repayment. Under such agreement, the Adviser can only recover such amounts for a period of up to three years. For the period ended
| Copeland Trust |
| NOTES TO FINANCIAL STATEMENTS (Unaudited) (Continued) |
| May 31, 2016 |
| |
May 31, 2016, the Adviser waived fees/reimbursed expenses of $212,764, $80,385 and $78,608 for the Domestic Fund, the International Fund and the International Small Cap Fund, respectively.
As of May 31, 2016, the cumulative expenses subject to recapture amounted to $575,039, $522,240 and $78,608 for the Domestic Fund, the International Fund and the International Small Cap Fund respectively, and will expire on November 30 of the years indicated below:
| Copeland Risk Managed Dividend Growth Fund |
| |
| 2016 | | 2017 | | 2018 |
| $368,688 | | $71,834 | | $212,764 |
| | | | | |
| Copeland International Risk Managed Dividend Growth Fund |
| |
| 2016 | | 2017 | | 2018 |
| $198,253 | | $169,931 | | $80,385 |
| | | | | |
| Copeland International Small Cap Dividend Growth Fund |
| |
| 2016 | | 2017 | | 2018 |
| N/A | | N/A | | N/A |
DISTRIBUTOR
The Board has adopted Distribution Plans and Agreements for each Fund (collectively the “Plan”) pursuant to Rule 12b-1 under the 1940 Act. The Plan provides that a monthly service and/or distribution fee is calculated by each Fund at an annual rate of 0.25% and 1.00%(of which up to 0.75% is a distribution fee and up to 0.25% is a service fee) of the average daily net assets attributable to Class A shares and Class C shares, respectively and is paid to Northern Lights Distributors, LLC (the “Distributor”), to provide compensation for ongoing distribution-related activities or services and/or maintenance of the Funds’ shareholder accounts, not otherwise required to be provided by the Adviser. The Plan is a compensation plan, which means that compensation is provided regardless of 12b-1 expenses incurred. For the six months ended May 31, 2016, the 12b-1 fees accrued amounted to $186,769 and $331,966 for the Domestic Fund, $12,908 and $34,815 for the International Fund for Class A and Class C shares, respectively.
The Board has adopted non-Rule 12b-1 shareholder service plans (collectively, the “Shareholder Service Plan”) for the Class I shares of each Fund. The Shareholder Service Plan permits the Funds to pay brokers, financial intermediaries and others an annual fee of 0.10% of each Fund’s average daily net assets attributable to the Class I shares for shareholder support and/or administrative services, not otherwise provided by the Trust’s transfer agent. For the six months ended May 31, 2016, the Domestic Fund paid $105,808 in fees and the International Fund paid $5,718 in fees associated with the Shareholder Service Plan. The Funds’ Class A and Class C shares may also pay broker-dealers or other financial intermediaries for shareholder support services and/or administrative services based on the aggregate net asset value of the Class A and Class C shares, as applicable, owned of record or beneficially by the broker-dealers’ or financial intermediaries’ customers.
The Adviser may enter into selling agreements or shareholder service agreements with broker-dealers and other financial intermediaries. Under those agreements, the Adviser pays such entities based on the aggregate net asset value of the Class A shares, Class C shares and Class I shares, as applicable, owned of record or beneficially by the broker-dealers’ or financial intermediaries’ customers. The Adviser may then recover from the Distributor all or a portion of the amounts paid by the Adviser to such broker-dealers or financial intermediaries under the Plan with respect to the Class A and Class C shares and under the Shareholder Service Plan for the Class I shares.
The Distributor acts as the Funds principal underwriter in a continuous public offering of the Funds shares. For the six months ended May 31, 2016, the Distributor received $36,716 in underwriting commissions for sales of Class A shares of the Domestic Fund, of which $5,160 was retained by the principal underwriter or other affiliated broker-dealers and $3,434 in underwriting commissions for sales of Class A shares of the International Fund of which $497 was retained by the principal underwriter or other affiliated broker-dealers.
| Copeland Trust |
| NOTES TO FINANCIAL STATEMENTS (Unaudited) (Continued) |
| May 31, 2016 |
| |
In addition, certain affiliates of the Distributor provide services to the Funds as follows:
GEMINI FUND SERVICES, LLC (“GFS”)
GFS, an affiliate of the Distributor, provides administration, fund accounting, and transfer agent services to the Trust. Pursuant to separate servicing agreements with GFS, the Fund pays GFS fees for providing administration, fund accounting, and transfer agency services to the Fund. Certain officers of the Fund are also officers of GFS, and are not paid any fees directly by the Fund for servicing in such capacities.
NORTHERN LIGHTS COMPLIANCE SERVICES, LLC (“NLCS”)
NLCS, an affiliate of GFS and the Distributor, provided a Chief Compliance Officer to the Trust, as well as related compliance services, pursuant to a consulting agreement between NLCS and the Trust through March 31, 2016. Under the terms of such agreement, NLCS receives fees from the Funds. Effective March 28, 2016, the Adviser is providing a Chief Compliance Officer to the Trust as well as related compliance services. The Adviser charges an annual fee of $100,000 to the Trust for these services.
BLU GIANT, LLC (“Blu Giant”)
Blu Giant, an affiliate of GFS and the Distributor, provides EDGAR conversion and filing services as well as print management services for the Fund on an ad-hoc basis. For the provision of these services, Blu Giant receives customary fees from the Fund.
TRUSTEE
Each Trustee who is not affiliated with the Trust or Adviser receives (i) a base annual retainer of $27,000, (ii) $17,000 for attendance at four regularly scheduled Board meetings, (iii) $4,000 for attendance at two regularly scheduled Audit Committee meetings, (iv) $750 and $2,500 per each additional telephonic or in person meeting, respectively, and (v) reimbursement for any reasonable expenses incurred attending the meetings. For carrying out his additional responsibilities, the independent Chairman of the Board receives an additional $11,000 per year. The foregoing compensation is paid in quarterly payments.
The “interested persons” who serve as Trustees of the Trust receive no compensation for their services as Trustees. None of the executive officers receive compensation from the Trust except for the CCO, a portion of whose salary is paid from the fees the Advisor receives from the Trust for compliance services.
| 4. | INVESTMENT TRANSACTIONS |
The cost of purchases and proceeds from the sale of securities, other than U.S. Government securities and short-term investments, for the period ended May 31, 2016 amounted to $178,054,519 and $411,194,219 respectively for the Domestic Fund, $16,733,093 and $13,941,376 respectively for the International Fund and $853,519 and $256,101 respectively for the International Small Cap Fund.
| Copeland Trust |
| NOTES TO FINANCIAL STATEMENTS (Unaudited) (Continued) |
| May 31, 2016 |
| 5. | DISTRIBUTIONS TO SHAREHOLDERS AND TAX COMPONENTS OF CAPITAL |
The tax character of fund distributions paid for the year ended November 30, 2015 and November 30, 2014 was as follows:
| | | For the period ended November 30, 2015: | |
| | | Ordinary | | | Long-Term | | | | |
| Portfolio | | Income | | | Capital Gains | | | Total | |
| Domesitc Fund | | $ | 2,940,828 | | | $ | 36,888,774 | | | $ | 39,829,602 | |
| International Fund | | | | | | | | | | | | |
| | | For the period ended November 30, 2014: | |
| | | Ordinary | | | Long-Term | | | | |
| Portfolio | | Income | | | Capital Gains | | | Total | |
| Domesitc Fund | | $ | 4,684,506 | | | $ | 11,051,353 | | | $ | 15,735,859 | |
| International Fund | | | 6,450 | | | | 112 | | | | 6,562 | |
As of November 30, 2015, the components of accumulated earnings/(deficit) on a tax basis were as follows:
| | | Undistributed | | | Undistributed | | | Post October Loss | | | Capital Loss | | | Other | | | Unrealized | | | Total | |
| | | Ordinary | | | Long-Term | | | and | | | Carry | | | Book/Tax | | | Appreciation/ | | | Accumulated | |
| Portfolio | | Income | | | Gains | | | Late Year Loss | | | Forwards | | | Differences | | | (Depreciation) | | | Earnings/(Deficits) | |
| Risk Managed Dividend Growth | | $ | 2,318,646 | | | $ | 41,055,139 | | | $ | — | | | $ | — | | | $ | — | | | $ | 13,027,555 | | | $ | 56,401,340 | |
| International Risk Managed | | | — | | | | — | | | | (87,023 | ) | | | (1,695,958 | ) | | | — | | | | 299,679 | | | | (1,483,302 | ) |
| | | | | | | | | | | | | | | | | | | | | | | | | | | | | |
Late year losses incurred after December 31 within the fiscal year are deemed to arise on the first business day of the following fiscal year for tax purposes. The International Fund incurred and elected to defer such late year losses of $87,023.
At November 30, 2015, the Funds had capital loss carry forwards for federal income tax purposes available to offset future capital gains as follows:
| | | Non-Expiring | | | Non-Expiring | | | | |
| Portfolio | | Short-Term | | | Long-Term | | | Total | |
| Domestic Fund | | $ | — | | | $ | — | | | $ | — | |
| International Fund | | | 1,695,958 | | | | — | | | | 1,695,958 | |
| | | | | | | | | | | | | |
Permanent book and tax differences, primarily attributable to the book/tax basis treatment of non-deductible expenses, foreign currency gains/(losses), return of capital from corporations, reclass of net operating losses and ordinary income distributions, and adjustments related to equalization, publicly traded partnerships, and passive foreign investment companies, resulted in reclassification for the period ended November 30, 2015 as follows:
| | | Paid- | | | Undistributed | | | Undistributed | |
| | | In- | | | Ordinary | | | Long-Term | |
| Portfolio | | Capital | | | Income (Loss) | | | Gains (Loss) | |
| Risk Managed Dividend Growth | | $ | 18,407,297 | | | $ | (3,155,319 | ) | | $ | (15,251,978 | ) |
| International Risk Managed | | | (248,307 | ) | | | 5,661 | | | | 242,646 | |
The Funds calculated per share income using the average share method. After giving effect to the net income distributed to shareholders, the balance of the Fund’s performance for the year was attributed to net realized and unrealized gains from securities. For the period ended May 31, 2016, net realized and unrealized gains were $0.09,
| Copeland Trust |
| NOTES TO FINANCIAL STATEMENTS (Unaudited) (Continued) |
| May 31, 2016 |
| |
on a per share basis for each of the Class A, Class C and Class I for the Domestic Fund, net realized and unrealized losses were $0.13, $0.14 and $0.13 on a per share basis for Class A, Class C and Class I, respectively for the International Fund and net realized and unrealized losses were $0.03 and $0.01 on a per share basis for Class A Class I, respectively for the International Small Cap Fund. Net realized and unrealized gains were $615,492, $273,454 and $839,473 for Class A, Class C and Class I, respectively for the Domestic Fund. Net realized and unrealized losses were $237,591, $160,468 and $281,276 for Class A, Class C and Class I, respectively for the International Fund. Net realized and unrealized gains were $0 and $26 for Class A and Class I, respectively for the International Small Cap Fund.
The Funds may assess a short-term redemption fee of 1.00% of the total redemption amount if shareholders sell their shares after holding them for less than 30 days or if shares are redeemed for failure to maintain the Funds’ minimum account balance requirement. The redemption fee is paid directly to the Funds. For the six months ended May 31, 2016, the Domestic Fund assessed $468, $204, and $606 in redemption fees for Class A, Class C and Class I shares, respectively.
| 8. | NEW ACCOUNTING PRONOUNCEMENT |
In May 2015, FASB issued Accounting Standards Update (“ASU”) 2015-07, “Disclosures for Investments in Certain Entities That Calculate Net Asset Value per Share (or Its Equivalent), modifying ASC 946 “Financial Services – Investment Companies. Under the modifications, investments in affiliated and private investment funds valued at Net Asset Value are no longer included in the fair value hierarchy disclosed in Footnote 2. ASU 2015-07 is effective for fiscal years beginning on or after December 15, 2015, and interim periods within those annual periods. Management has elected to early adopt ASU 2015-07 and the disclosures in Note 2 are presented accordingly.
| 9. | UNDERLYING INVESTMENT IN OTHER INVESTMENT COMPANIES |
The Domestic Fund currently invests a portion of their assets in Federated Treasury Obligations Fund, (“Federated”). The Domestic Fund may redeem its investment from Federated at any time if the Advisor determines that it is in the best interest of the Fund and its shareholders to do so. The performance of the Domestic Fund may be directly affected by the performance of Federated. The financial statements of Federated, including its portfolio of investments, can be found at the Securities and Exchange Commission’s website www.sec.gov and should be read in conjunction with Fund’s financial statements. As of May 31, 2016, the percentage of the Domestic Fund’s net assets invested in Federated was 48.11%.
Subsequent events after the date of the Statement of Assets and Liabilities have been evaluated through the date the financial statements were issued. Management has concluded that there is no impact requiring adjustment or disclosure in the financial statements.
| Copeland Trust |
| DISCLOSURE OF FUND EXPENSES (Unaudited) |
| May 31, 2016 |
| |
As a shareholder of the Copeland Risk Managed Dividend Growth Fund, the Copeland International Risk Managed Dividend Growth Fund and the Copeland International Small Cap Dividend Growth Fund, you incur two types of costs (1) transaction costs, including sales charges (loads) on purchase payments and sales (for Class A shares only) and redemption fees; and (2) ongoing costs, including management fees, distribution and/or service (12b-1 fees for Class A and C shares only) fees, shareholder servicing fees and other Fund expenses. This example is intended to help you understand your ongoing costs (in dollars) of investing in the Funds and to compare these costs with the ongoing costs of investing in other mutual funds. Please note, the expenses shown in the tables are meant to highlight ongoing costs only and do not reflect any transactional costs. This example is based on an investment of $1,000 invested for the period of time as indicated in the table below.
Actual Expenses: The first line of the table provides information about actual account values and actual expenses. You may use the information in this line, together with the amount you invested, to estimate the expenses that you paid over the period. Simply divide your account value by $1,000 (for example, an $8,600 account value divided by $1,000 = 8.6), then multiply the result by the number in the first line under the heading entitled “Expenses Paid During the Period” to estimate the expenses you paid on your account during the period.
Hypothetical Examples for Comparison Purposes: The second line of the table below provides information about hypothetical account values and hypothetical expenses based on the Funds’ actual expense ratio and an assumed rate of return of 5% per year before expenses, which is not the Funds’ actual return. The hypothetical account values and expenses may not be used to estimate the actual ending account balance or expenses you paid for the period. You may use this information to compare the ongoing costs of investing in the Funds and other funds. To do so, compare this 5% hypothetical example with the 5% hypothetical examples that appear in the shareholder reports of the other funds.
Please note that the expenses shown in the table are meant to highlight your ongoing costs only and do not reflect any transactional costs, such as sales charges (loads) or redemption fees which may be applicable to your account. Therefore, the second line of the table is useful in comparing ongoing costs only, and will not help you determine the relative total costs of owning different funds. In addition, if these transactional costs were included, your costs would have been higher.
| | | | | | | | | Expenses Paid |
| | | Beginning | | Ending | | | | During the |
| | | Account | | Account | | Annualized | | Period |
| | | Value | | Value | | Expense Ratio | | (12/1/15 to |
| | | (12/1/15) | | (5/31/16) | | | | 5/31/16) |
| Actual (a) | | | | | | | | |
| Copeland Risk Managed Dividend Growth Fund | | | | | | | | |
| Class A | | $1,000.00 | | $1,007.30 | | 1.45% | | $ 7.28 |
| Class C | | $1,000.00 | | $1,003.60 | | 2.20% | | $11.02 |
| Class I | | $1,000.00 | | $1,008.30 | | 1.30% | | $ 6.53 |
| Copeland International Risk Managed Dividend Growth Fund | | | | | | | | |
| Class A | | $1,000.00 | | $ 993.60 | | 1.60% | | $ 7.97 |
| Class C | | $1,000.00 | | $ 989.70 | | 2.35% | | $11.69 |
| Class I | | $1,000.00 | | $ 995.30 | | 1.45% | | $ 7.23 |
| Copeland International Small Cap Dividend Growth Fund | | | | | | | | |
| Class A | | $1,000.00(b) | | $1,004.00 | | 1.40% | | $6.36 (c) |
| Class I | | $1,000.00(b) | | $1,003.00 | | 1.25% | | $5.68 (c) |
| Hypothetical (a) | | | | | | | | |
| (5% return before expenses) | | | | | | | | |
| Copeland Risk Managed Dividend Growth Fund | | | | | | | | |
| Class A | | $1,000.00 | | $1,017.75 | | 1.45% | | $ 7.31 |
| Class C | | $1,000.00 | | $1,014.00 | | 2.20% | | $11.08 |
| Class I | | $1,000.00 | | $1,018.50 | | 1.30% | | $ 6.56 |
| Copeland International Risk Managed Dividend Growth Fund | | | | | | | | |
| Class A | | $1,000.00 | | $1,017.00 | | 1.60% | | $ 8.07 |
| Class C | | $1,000.00 | | $1,013.25 | | 2.35% | | $11.83 |
| Class I | | $1,000.00 | | $1,017.75 | | 1.45% | | $ 7.31 |
| Copeland International Small Cap Dividend Growth Fund | | | | | | | | |
| Class A | | $1,000.00 | | $1,016.33 | | 1.40% | | $6.40(d) |
| Class I | | $1,000.00 | | $1,017.01 | | 1.25% | | $5.72(d) |
| (a) | Expenses are equal to the average account value over the period, multiplied by the Fund’s annualized expense ratio, multiplied by the number of days in the six month period ended May 31, 2016 (183) divided by the number of days in the fiscal year (366). |
| (b) | Beginning Account Value starting date for the International Small Cap Dividend Growth Fund is 12/17/2015. |
| (c) | Actual expenses are equal to the average account value over the period, multiplied by the Fund’s annualized expense ratio, multiplied by the number of days in the period ended May 31, 2016 (166) divided by the number of days in the fiscal year (366). |
| (d) | Hypothetical expenses paid during the period assumes a starting date of 12/1/2015. |
| PRIVACY notice |
| |
| FACTS | WHAT DOES COPELAND TRUST DO WITH YOUR PERSONAL INFORMATION? |
| | |
| Why? | Financial companies choose how they share your personal information. Federal law gives consumers the right to limit some but not all sharing. Federal law also requires us to tell you how we collect, share, and protect your personal information. Please read this notice carefully to understand what we do. |
| | |
| What? | The types of personal information we collect and share depend on the product or service you have with us. This information can include: ■ Social Security number ■ Purchase History ■ Assets ■ Account Balances ■ Retirement Assets ■ Account Transactions ■ Transaction History ■ Wire Transfer Instructions ■ Checking Account Information When you are no longer our customer, we continue to share your information as described in this notice. |
| | |
| How? | All financial companies need to share customers’ personal information to run their everyday business. In the section below, we list the reasons financial companies can share their customers’ personal information; the reasons Copeland Trust chooses to share; and whether you can limit this sharing. |
| | | |
| Reasons we can share your personal information: | Does Copeland
Trust share? | Can you limit this sharing? |
For our everyday business purposes – such as to process your transactions, maintain your account(s), respond to court orders and legal investigations, or report to credit bureaus | Yes | No |
For our marketing purposes – to offer our products and services to you | No | We don’t share |
| For joint marketing with other financial companies | No | We don’t share |
For our affiliates’ everyday business purposes – information about your transactions and experiences | No | We don’t share |
For our affiliates’ everyday business purposes – information about your creditworthiness | No | We don’t share |
| For nonaffiliates to market to you | No | We don’t share |
| Questions? | Call 1-888-9-COPELAND (1-888-926-7352) |
| Who we are: |
| Who is providing this notice? | Copeland Trust |
| What we do: |
| How does Copeland Trust protect my personal information? | To protect your personal information from unauthorized access and use, we use security measures that comply with federal law. These measures include computer safeguards and secured files and buildings. Our service providers are held accountable for adhering to strict policies and procedures to prevent any misuse of your nonpublic personal information. |
| How does Copeland Trust collect my personal information? | We collect your personal information, for example, when you ■ Open an account ■ Provide account information ■ Give us your contact information ■ Make deposits or withdrawals from your account ■ Make a wire transfer ■ Tell us where to send the money ■ Tells us who receives the money ■ Show your government-issued ID ■ Show your driver’s license We also collect your personal information from other companies. |
| Why can’t I limit all sharing? | Federal law gives you the right to limit only ■ Sharing for affiliates’ everyday business purposes – information about your creditworthiness ■ Affiliates from using your information to market to you ■ Sharing for nonaffiliates to market to you State laws and individual companies may give you additional rights to limit sharing. |
| Definitions: |
| Affiliates | Companies related by common ownership or control. They can be financial and nonfinancial companies. ■ Copeland Trust does not share with our affiliates. |
| Nonaffiliates | Companies not related by common ownership or control. They can be financial and nonfinancial companies
■ Copeland Trust does not share with nonaffiliates so they can market to you. |
| Joint marketing | A formal agreement between nonaffiliated financial companies that together market financial products or services to you.
■ Copeland Trust does not jointly market. |
| Investment Adviser |
| Copeland Capital Management, LLC |
| 161 Washington Street, Suite 1325 |
| Conshohocken, PA 19428 |
| |
| Distributor |
| Northern Lights Distributors, LLC |
| 17605 Wright Street |
| Omaha, NE 68130 |
| |
| Legal Counsel |
| Drinker Biddle & Reath, LLP |
| Once Logan Square, Suite 2000 |
| Philadelphia, PA 19103 |
| |
| Independent Registered Public Accounting Firm |
| Tait, Weller & Baker LLP |
| 1818 Market Street, Suite 2400 |
| Philadelphia, PA 19103 |
| |
| Transfer Agent |
| Gemini Fund Services, LLC |
| 17605 Wright Street, Suite 2 |
| Omaha, NE 68130 |
| |
| Administrator |
| Gemini Fund Services, LLC |
| 80 Arkay Drive Suite 110 |
| Hauppauge, NY 11788 |
| |
| Custodian |
| The Northern Trust Company |
| 50 South LaSalle Street |
| Chicago, Il 60603 |
How to Obtain Proxy Voting Information
Information regarding how the Funds vote proxies relating to portfolio securities for the 12 month period ended June 30, 2016 as well as a description of the policies and procedures that the Funds used to determine how to vote proxies is available without charge, upon request, by calling 1-888-9-COPELAND or by referring to the Securities and Exchange Commission’s (“SEC”) website at http://www.sec.gov.
How to Obtain 1st and 3rd Fiscal Quarter Portfolio Holdings
The Funds file their complete schedule of portfolio holdings with the SEC for the first and third quarters of each fiscal year on Form N-Q. Form N-Q is available on the SEC’s website at http://www.sec.gov and may be reviewed and copied at the SEC’s Public Reference Room in Washington, DC (1 800 SEC 0330). The information on Form N-Q is available without charge, upon request, by calling 1-888-9-COPELAND.
Item 2. Code of Ethics. Not required for semi-annual reports.
Item 3. Audit Committee Financial Expert. Not required for semi-annual reports.
Item 4. Principal Accountant Fees and Services. Not required for semi-annual reports.
Item 5. Audit Committee of Listed Companies. Not applicable to open-end investment companies.
Item 6. Schedule of Investments.
| (a) | Schedule of investments in securities of unaffiliated issuers is included under Item 1. |
Item 7. Disclosure of Proxy Voting Policies and Procedures for Closed-End Funds. Not applicable.
Item 8. Portfolio Managers of Closed-End Funds. Not applicable.
Item 9. Purchases of Equity Securities by Closed-End Funds. Not applicable.
Item 10. Submission of Matters to a Vote of Security Holders. None
Item 11. Controls and Procedures.
(a) Based on an evaluation of the Registrant’s disclosure controls and procedures (as defined in rule 30a-3(c) under the Investment Company Act of 1940) as of the filing date of this report, Registrant’s principal executive officer and principal financial officer found such disclosure controls and procedures to be effective.
(b) There were no significant changes in the Registrant’s internal control over financial reporting that occurred during the Registrant’s last fiscal half-year that have materially affected, or are reasonably likely to materially affect, the Registrant’s internal control over financial reporting.
Item 12. Exhibits.
(a)(1) Any code of ethics.
(a)(2) Certification required by Section 302 of the Sarbanes-Oxley Act of 2002 is filed herewith.
(a)(3) Not applicable for open-end investment companies.
(b) Certification required by Section 906 of the Sarbanes-Oxley Act of 2002 is filed herewith.
SIGNATURE
Pursuant to the requirements of the Securities Exchange Act of 1934 and the Investment Company Act of 1940, the Registrant has duly caused this report to be signed on its behalf by the undersigned, thereunto duly authorized.
Copeland Trust
By: /s/ Mark W. Giovanniello
Mark W. Giovanniello, Principal Executive Officer
Date 8/10/16
Pursuant to the requirements of the Securities Exchange Act of 1934 and the Investment Company Act of 1940, this report has been signed below by the following persons on behalf of the Registrant and in the capacities and on the dates indicated.
By: /s/ Mark W. Giovanniello
Mark W. Giovanniello, Principal Executive Officer
Date 8/10/16
By: /s/ Steven J. Adams
Steven J. Adams, Principal Financial Officer
Date 8/10/16