united states
securities and exchange commission
washington, d.c. 20549
form n-csr
certified shareholder report of registered management
investment companies
Investment Company Act file number 811-22483
Copeland Trust
(Exact name of Registrant as specified in charter)
Eight Tower Bridge, 161 Washington St., Suite #1650 Conshohocken, PA 19428
(Address of principal executive offices) (Zip code)
Corporate Filing Solutions LLC, 1400 Peoples Plaza Suite 104, Newark, DE 19702
(Name and address of agent for service)
Registrant's telephone number, including area code: (484)351-3700
Date of fiscal year end: 11/30
Date of reporting period:5/31/19
Item 1. Reports to Stockholders.
| | | |
| | | |
| | Copeland
Risk Managed
Dividend Growth Fund Copeland
International Risk Managed
Dividend Growth Fund Copeland
SMID Cap
Dividend Growth Fund | |
| | | |
| | Semi-Annual Report May 31, 2019 | |
| | | |
| | Beginning on January 1, 2021, as permitted by regulations adopted by the Securities and Exchange Commission, paper copies of the Fund’s shareholder reports like this one will no longer be sent by mail, unless you specifically request paper copies of the reports. Instead, the reports will be made available on the Fund’s website www.copelandfunds.com, and you will be notified by mail each time a report is posted and provided with a website link to access the report. If you already elected to receive shareholder reports electronically, you will not be affected by this change and you need not take any action. You may elect to receive shareholder reports and other communications from the Fund electronically by contacting your financial intermediary (such as a broker-dealer or bank) or, if you are a direct investor, by following the instructions included with paper Fund documents that have been mailed to you. You may elect to receive all future reports in paper free of charge. You can inform the Fund or your financial intermediary that you wish to continue receiving paper copies of your shareholder reports by calling the Fund at 1-888-9-COPELAND (1-888-926-7352) or by contacting your financial intermediary. Your election to receive reports in paper will apply to all Copeland Funds you hold directly or through your financial intermediary. Investor Information: 1-888-9-COPELAND This report and the financial statements contained herein are submitted for the general information of shareholders and are not authorized for distribution to prospective investors unless preceded or accompanied by an effective prospectus. Nothing herein contained is to be considered an offer of sale or solicitation of an offer to buy shares of the Funds. Such offering is made only by prospectus, which includes details as to offering price and other material information. Distributed by Northern Lights Distributors, LLC
Member FINRA | |
Copeland Risk Managed Dividend Growth Fund
Semi-Annual Report
May 31, 2019
Dear Fellow Shareholders,
Copeland Capital Management is pleased to review the performance of the Risk Managed Dividend Growth Fund from December 1, 2018 through May 31, 2019. Unless otherwise stated herein, all data and statistics that follow are as of May 31, 2019.
During the six-month period, Class A shares of the Fund fell 4.6%, lagging the 0.7% advance posted by the S&P 500 Index. Favorable stock picking, which boosted performance relative to the benchmark by roughly 150 basis points1, was more than offset by our muted exposure to equities which averaged 40% during the period. Our equity allocation relative to the benchmark introduced a relative performance headwind of roughly 560 basis points.
The Fund began the six-month stretch invested in all but the Materials sector of the market. In November, the price of WTI Crude Oil dropped over 20% to $50.93 per barrel. The downdraft weighed upon commodity related equities, triggering a negative signal from our proprietary model and causing us to eliminate exposure to the Energy sector shortly after the outset of December. Market fortunes turned decidedly more sour in December as concerns surrounded slowing global growth, rising interest rates and trade tensions triggered a steep market decline of just over 9%. The magnitude of the downturn sparked a negative signal for all but the Utilities sector in our model, leading us to eliminate exposure to the remaining segments of the market and to restrict our Fund equity exposure level to 25% at the outset of January.
Our stock selection in the Energy and Communication Services sectors of the market bolstered Fund returns while those in the Information Technology and Real Estate sectors were a drag on performance. Communication Services constituent Cable One (CABO, 2.7% of Fund holdings) was the top performing holding, advancing over 39% during the period. On the heels of the market swoon in December, investors seemed to be drawn to the cable company’s resilient business model as Cable One has demonstrated an ability to grow profits and cash flows irrespective of broader economic conditions. The company also has a history of making accretive acquisitions. In April, Cable One announced that it would acquire Fidelity Communications, a small rural cable operator located in Missouri. If history is any guide, we believe the deal will prove to be a boon to Cable One’s future results. A second standout performer, Cogent Communications (CCOI, 2.1%), which rose just over 32% during the period, also hails from the Communications Services sector. The internet services provider benefitted from dramatic internet traffic growth of 43% in the most recently completed quarter. The sharp acceleration helped fuel revenue and earnings before interest, taxes, depreciation and amortization (“EBITDA”) advances of 6% and 8%, respectively, during the quarter. Reflective of strong underlying fundamentals, CCOI hiked the dividend by 15% in early May.
On the downside, Perrigo (PRGO, 0.0%) was the worst performer in the Fund, falling just under 35% during the period. In December, this maker of over-the-counter store branded drugs, received notification of a $1.64 billion tax assessment from the Irish government. Shares plummeted over 29% on the day that the potential tax liability was disclosed. While Perrigo has appealed the tax issuance, an adverse ruling has the potential to inhibit the pharmaceutical company’s ability to invest in the business, pay down debt, repurchase shares and make acquisitions. We exited the shares in early January, along with the balance of
| 1 | One basis point equals 0.01%. |
our Health Care holdings as dictated by a negative signal from our proprietary ranking system. SunTrust Banks (STI, 0.0%) was also a laggard, falling 17% while we held a position in the shares. Financials, including SunTrust, came under heavy selling pressure toward the end of 2018 as investor concerns surrounding an economic slowdown spiked. The downdraft triggered a negative sector signal and a liquidation of all of our Financials holdings at the outset of January. The downtick in SunTrust shares is, however, less pronounced when viewed in the context of a broader 9% market retreat during the period in which we held the banking shares.
The six-month stretch was marked by a steep market decline at the outset, a bottoming towards the end of December, a subsequent rebound over the ensuing four months, and yet another retrenchment during the month of May. The Federal Reserve played a central role in precipitating the market gyrations. In December the monetary authority raised its Federal Funds rate by 25 basis points to an upward bound of 2.5% while opining that “…further gradual increases in the target range…will be consistent with sustained expansion of economic activity.”2 The markets reacted poorly, fearing that the Federal Reserve was being overly aggressive in tightening policy and was ignoring signs of a slowing economy. In January the monetary authority backpedaled sharply, leaving the Federal Funds rate unchanged and stating that it would be “...patient as it determines what future adjustments to the target range…may be appropriate.”3 The dovish reversal proved to be just the elixir the markets needed in triggering a steady and ongoing equity rally.
As the period drew to a close, however, an increasingly caustic trade war with China weighed upon market sentiment, eroding virtually all of the gains recorded over the prior six months and leaving the broad indices essentially flat for the period. The markets must now navigate the countervailing forces of a more benign Federal Reserve on the one hand and the impact of a full-fledged trade war, on an already slowing economy on the other. For the moment, our proprietary sector signals have the Fund positioned in a decidedly defensive posture with a 25% allocation to Utilities/Telecom and a 75% allocation to short term Treasury securities, as a proxy for cash. Underlying price movements in the constituent market sectors will dictate the pace at which the Fund expands its market exposure.
Irrespective of near-term market trends, we at Copeland remain intently focused on the long-term prospects of the companies held in the Fund, with a particular emphasis on the capacity of each to continue to grow its dividend over time. We continue to favor companies that we believe retain noteworthy competitive advantages in their respective industries, are cash generative, and are overseen by managements with capital allocation discipline and an eye on the shareholder. At present, we are conservatively positioned, as dictated by a dearth of positively ranked market sectors. Should a more robust market environment unfold, however, we look forward to expanding our investment profile in an effort to seek to capitalize upon the potential gains afforded by a carefully selected portfolio of dividend growth equities.
Thank you for the confidence you have placed in Copeland and for your investment in the Risk Managed Dividend Growth Fund.
The views and opinions expressed in this letter are subject to change and may not be relied upon for investment advice. No forecasts can be guaranteed. The Fund holdings discussed herein are for informational purposes only and should not be perceived as investment recommendations by Copeland Capital Management. Holdings are subject to change, may not represent current holdings and are subject to risk. Performance data quoted here represents past performance. Past performance is no guarantee of
| 2 | “Federal Reserve Issues FOMC Statement.”Board of Governors of the Federal Reserve System, 19 Dec. 2018, www.federalreserve.gov/newsevents/pressreleases/monetary20181219a.htm. |
| 3 | “Federal Reserve Issues FOMC Statement.”Board of Governors of the Federal Reserve System, 30 Jan. 2019, www.federalreserve.gov/newsevents/pressreleases/monetary20190130a.htm. |
future results. The return quoted reflects fee waivers and expense reimbursements in effect and would have been lower in their absence. Current performance may be lower or higher than the performance quoted above. The risks of investing in the Copeland Funds vary from fund to fund; to see the risks of investing in an individual fund, please refer to that fund’s latest prospectus.
You cannot invest directly in any index. Index returns do not include a deduction for fees or expenses. The S&P 500® Index is a market-capitalization-weighted index of the stocks of 500 leading companies in major industries of the U.S. economy.
1133- NLD-7/11/2019
Copeland International Risk Managed Dividend Growth Fund
Semi-Annual Report
May 31, 2019
Dear Fellow Shareholders,
Copeland Capital Management is pleased to review the performance of the International Risk Managed Dividend Growth Fund from December 1, 2018 through May 31, 2019. Unless otherwise stated herein, all data and statistics that follow are as of May 31, 2019.
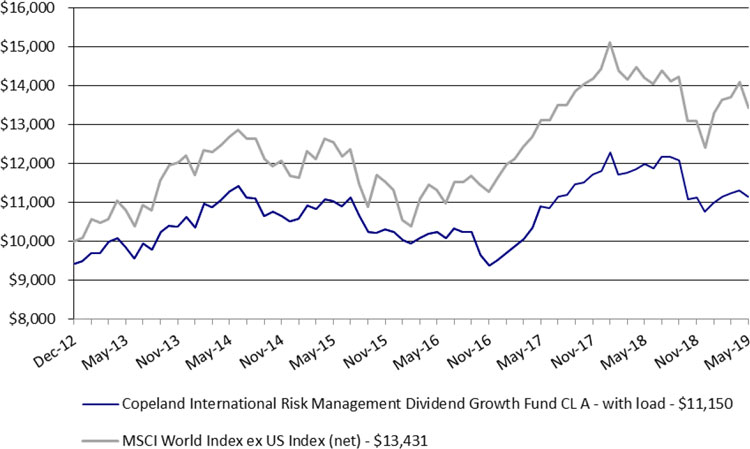
The Class I shares of the Copeland International Risk Managed Dividend Growth Fund delivered a return of +0.2% during the semi-annual period ended May 31, 2019, which compared to a +2.6% gain recorded by the Fund’s benchmark, the MSCI World ex-US Index. Although global equity markets have rebounded thus far in 2019, the Fund remains in a defensive position due to the higher-risk market climate indicated by our quantitative sector signals. Our primary Fund objective remains the preservation of principal during challenging market conditions, while also providing upside exposure to the international equity asset class during stable to rising markets.
The shortfall in relative performance during the first-half of the Fund’s fiscal year has been attributable to its allocation to cash and fixed-income investments. Fund exposure was limited to three sectors of the non-US equity markets at the outset of the time-period, namely Health Care, Consumer Staples, and Utilities/Communications. Following the sharp market sell-off in late 2018, the Fund shifted to a 50% allocation to cash/fixed income, where it has remained since, with equity exposure limited to Consumer Staples and Utilities/Communications. Retaining only half of the overall market exposure to equities during most of the semi-annual period accounted for more than 100%of the underperformance versus the Fund’s benchmark.
Within the equity portion of the Fund, results benefited during the semi-annual period from Copeland’s quantitative sector signals, which resulted in a significant overweight exposure to Consumer Staples, one of the best performing market sectors, and zero exposure to Financials, one of the worst performing groups over the past six months. Relative performance was boosted by positions in Diageo (DGEAF, 2.7% of holdings), the UK-based global spirits maker, and Nestle (NSRGY, 2.3%), the world’s largest food group based out of Switzerland. While both companies have increased their dividends for more than 20 years in succession, Diageo has also enjoyed accelerating organic growth in revenues and profits, particularly stemming from results within its AsiaPac operations. Nestle, meanwhile, continues to deliver steadily improving underlying operational results which re-affirm their longer-term targets of mid-single digit underlying growth and high-teens operating profit margins. Offsetting this favorable stock selection within Consumer Staples were Japanese holdings in drug-store operator Cosmos Pharmaceutical (COPN, 1.8%), and Unicharm (UNCHF, 2.6%), a leading household and personal care company. While Cosmos retains favorable future growth potential, at present the company has been challenged by upward pressure from labor costs, especially wages for part-time employees. Unicharm, which is very competitively positioned within the feminine hygiene and diaper segments, has struggled somewhat with a material slowdown in their Chinese operations. Carrying zero exposure to Information Technology, which was the strongest performing segment of the market during the period, offset the favorable sector exposures within the equity portion of the Fund.
Looking to the balance of 2019, we believe that investor sentiment is likely to be driven by the unfolding trade talks between the United States and China, which have more than once precipitated sharp market declines in recent months. The recent shift in global central bank activity is the other likely determinant of market direction, as near-term potential rate cuts by the US Federal Reserve are now embedded in forward market interest rates, and others, including the European Central Bank, appear to be following suit to a more accommodative posture. In related fashion, the presently inverted state of the short-end of the US yield curve, historically a good leading indicator of recession, provides market observers another cause for concern. As it relates to the Fund’s defensive positioning, underlying price movements in the constituent market sectors will dictate the pace at which the Fund expands its market exposure going forward.
Irrespective of near-term market trends, we at Copeland remain intently focused on the long-term prospects of the companies held in the Fund, with a particular emphasis on the capacity of each to continue to grow its dividend over time. We continue to favor firms that we believe retain noteworthy competitive advantages in their respective industries, are cash generative, and are overseen by managements with capital allocation discipline and an eye on the shareholder. In the event that a healthier overall market climate unfolds, we look forward to increasing the equity exposure in the Fund across a diversified group of dividend growth equities in sectors that garner positive buy indications from our quantitatively derived sector signals. Thank you for your confidence in Copeland Capital Management, and for your investment in the International Risk Managed Dividend Growth Fund.
The views and opinions expressed in this letter are subject to change and may not be relied upon for investment advice. No forecasts can be guaranteed. The Fund holdings discussed herein are for informational purposes only and should not be perceived as investment recommendations by Copeland Capital Management. Holdings are subject to change, may not represent current holdings and are subject to risk. Performance data quoted here represents past performance. Past performance is no guarantee of future results. The return quoted reflects fee waivers and expense reimbursements in effect and would have been lower in their absence. Current performance may be lower or higher than the performance quoted above. The risks of investing in the Copeland Funds vary from fund to fund; to see the risks of investing in an individual fund, please refer to that fund’s latest prospectus.
You cannot invest directly in any index. Index returns do not include a deduction for fees or expenses. The MSCI World ex-US® Index measures the performance of global equity markets, excluding the United States.
1132-NLD-7/11/2019
Copeland SMID Cap Dividend Growth Fund
Semi-Annual Report
May 31, 2019
Dear Fellow Shareholders,
Copeland Capital Management is pleased to review the performance of the SMID Cap Dividend Growth Fund from December 1, 2018 through May 31, 2019. Unless otherwise stated herein, all data and statistics that follow are as of May 31, 2019.
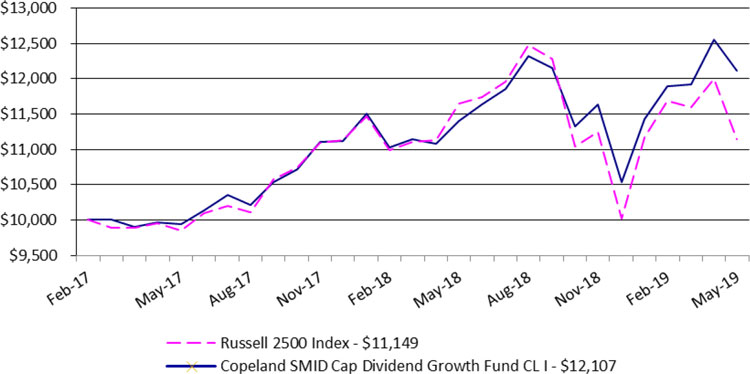
During the six-month period, Class I shares of the Fund delivered a positive +4.1% return, versus the -0.9% decline posted by the Russell 2500 Index. This period included two starkly different market environments, which we believe served as a strong test case for our dividend growth investment philosophy. The months of December and May were characterized by high volatility and significantly negative equity market returns. We believe that our dividend growth philosophy, which steers us towards more resilient growth companies, is most likely to shine during such volatile periods. This came to pass during both months, when most of the relative outperformance of the Fund was earned by the Fund versus the Russell 2500 Index.
After a precipitous decline in December, equity markets bounced back significantly in early 2019 driven by increasingly dovish commentary from the Federal Reserve. While we would typically expect to lag during aggressive market rallies, we were very much pleased with the Fund’s ability to largely keep up with the benchmark during these rallies. We believe our fundamental stock picking and our quantitative ranking model added significant value during this period. In particular, our evergreen focus on consistent secular growth companies seemed to resonate in the market during 2019.
Our stock selection in the Financial sector most significantly aided Fund returns. MarketAxess Holdings (MKTX, 2.0% of Fund holdings), the leading electronic bond trading platform, outperformed after reporting strong first quarter results, followed by continued strong monthly volume growth in April and May. Additionally, the company announced an impressive 21% dividend hike, which we believe indicates confidence from management in the sustainability of recent strong results. MSCI Inc. (MSCI, 1.8%), a leading equity index provider, recovered strongly during the year after the late 2018 dip, driven by strength in equity markets. MSCI’s strength was compounded by the company’s own strong fourth quarter 2018 results, with both revenues and earnings exceeding consensus expectations.
Stock selection was a headwind in the Technology sector. Littelfuse Inc. (LFUS, 1.5%), a specialty switch and sensor manufacturer, retreated due to concerns about global auto demand and channel inventory levels. However, we remain confident in the company’s long-term prospects and believe its recent acquisition of IXYS Corp. is likely to be highly accretive, so we took advantage of the stock weakness by adding to our position. LogMeIn Inc. (LOGM, 0.7%), a leading provider of collaboration software, was pressured after the company announced that it would make elevated investments in order to accelerate growth, temporarily depressing earnings. At the same time, LOGM announced an 8% year-over-year dividend increase, a move that we believe provides evidence of LOGM management’s confidence in favorable returns from these efforts.
The Federal Reserve played a central role in precipitating the market gyrations during this six-month period. In December the monetary authority raised its FederalFunds Rate by 25 basis points1 to an upward bound of 2.5% while opining that “…further gradual increases in the target range…will be consistent with
| 1 | One basis point equals 0.01%. |
sustained expansion of economic activity.”2 The markets reacted poorly, fearing that the Federal Reserve was being overly aggressive in tightening policy and was ignoring signs of a slowing economy. In January the monetary authority backpedaled sharply, leaving the Federal Funds Rate unchanged and stating that it would be “...patient as it determines what future adjustments to the target range…may be appropriate.”3 The dovish reversal proved to be just the elixir the markets needed in triggering a steady and ongoing equity rally.
As the period drew to a close, however, an increasingly caustic trade war with China weighed upon market sentiment, eroding virtually all of the gains recorded over the prior six months and leaving the broad indices essentially flat for the period. The markets must now navigate the countervailing forces of a more benign Federal Reserve on the one hand and the impact of a full-fledged trade war, on an already slowing economy on the other.
Irrespective of near-term market trends, we at Copeland remain intently focused on the long-term prospects of the companies held in the Fund, with an emphasis on the capacity of each to continue to grow its dividend over time. We continue to favor companies that we believe retain noteworthy competitive advantages in their respective industries, are cash generative, and are overseen by managements with capital allocation discipline and an eye on the shareholder. We believe this approach puts the Fund in the best position in seeking to outperform the market while taking on less risk.
Thank you for the confidence you have placed in Copeland and for your investment in the SMID Cap Dividend Growth Fund.
The views and opinions expressed in this letter are subject to change and may not be relied upon for investment advice. No forecasts can be guaranteed. The Fund holdings discussed herein are for informational purposes only and should not be perceived as investment recommendations by Copeland Capital Management. Holdings are subject to change, may not represent current holdings and are subject to risk. Performance data quoted here represents past performance. Past performance is no guarantee of future results. The return quoted reflects fee waivers and expense reimbursements in effect and would have been lower in their absence. Current performance may be lower or higher than the performance quoted above. The risks of investing in the Copeland Funds vary from fund to fund; to see the risks of investing in an individual fund, please refer to that fund’s latest prospectus.
You cannot invest directly in any index. Index returns do not include a deduction for fees or expenses. The Russell 2500 Index is comprised of the bottom 2500 companies in the Russell 3000 Index. The Russell 3000 Index measures the performance of the 3000 largest U.S. companies based on total market capitalization, which represents approximately 98% of the investable U.S. equity market.
1134-NLD-7/11/2019
| 2 | “Federal Reserve Issues FOMC Statement.”Board of Governors of the Federal Reserve System, 19 Dec. 2018, www.federalreserve.gov/newsevents/pressreleases/monetary20181219a.htm. |
| 3 | “Federal Reserve Issues FOMC Statement.”Board of Governors of the Federal Reserve System, 30 Jan. 2019, www.federalreserve.gov/newsevents/pressreleases/monetary20190130a.htm. |
| Copeland Risk Managed Dividend Growth Fund |
| Portfolio Review (Unaudited) |
| December 28, 2010* through May 31, 2019 |
| |
Performance of a $10,000 Investment (as of May 31, 2019)

| | Average Annualized | | | | | | | | | | | | Since | | | Since | | | Since | |
| | Total Returns as of | | | | | | | | | | | | Inception | | | Inception | | | Inception | |
| | May 31, 2019 | | | Six Months | | | One Year | | | Five Year | | | Class A* | | | Class C* | | | Class I* | |
| | Copeland Risk Managed Dividend Growth Fund: | | | | | | | | | | | | | | | | | | | |
| | Class A | | | | | | | | | | | | | | | | | | | |
| | Without sales charge | | | (4.57)% | | | 0.03% | | | 4.42% | | | 8.08% | | | — | | | — | |
| | With sales charge+ | | | (10.08)% | | | (5.69)% | | | 3.20% | | | 7.32% | | | — | | | — | |
| | Class C | | | (4.88)% | | | (0.64)% | | | 3.65% | | | — | | | 8.06% | | | — | |
| | Class I | | | (4.39)% | | | 0.27% | | | 4.62% | | | — | | | — | | | 7.95% | |
| | S&P 500 Index | | | 0.74% | | | 3.78% | | | 9.66% | | | 12.06% | | | 13.24% | | | 12.28% | |
| | Russell 3000 Index | | | 0.60% | | | 2.50% | | | 9.25% | | | 11.75% | | | 13.05% | | | 11.95% | |
| * | Class A shares commenced operations on December 28, 2010. Class C commenced operations on January 5, 2012. Class I commenced operations March 1, 2013. |
| + | Adjusted for initial maximum sales charge of 5.75%. |
The S&P 500 Index is an unmanaged market capitalization-weighted index which is comprised of 500 of the largest U.S. domiciled companies and includes the reinvestment of all dividends. Investors cannot invest directly in an index or benchmark.
The Russell 3000 Index measures the performance of the largest 3000 U.S. companies representing approximately 98% of the investable U.S. equity market and includes the reinvestment of all dividends. Investors cannot invest directly in an index or benchmark.
Past performance is not predictive of future results. The investment return and principal value of an investment will fluctuate. An investor’s shares, when redeemed, may be worth more or less than the original cost. The performance and returns do not reflect the deduction of taxes that a shareholder may pay on Fund distributions or redemption of Fund shares. Total return is calculated assuming reinvestment of all dividends and distributions. Total returns would have been lower had the adviser not waived its fees and reimbursed a portion of the Fund’s expenses. For performance information current to the most recent month-end please call toll-free 1-888-9-COPELAND (1-888-926-7352). Additional information can be found by visiting our website, www.copelandfunds.com. The Fund’s gross annual operating expense ratio, as stated in the current prospectus, is 1.71%, 2.45%, and 1.53%, for Class A, Class C, and Class I shares, respectively, and its net annual operating expense ratio is 1.45%, 2.20%, and 1.30%, for Class A, Class C, and Class I shares, respectively. These ratios can fluctuate and may differ from the expense ratios disclosed in the Financial Highlights section of this report. The Fund’s investment adviser has contractually agreed to reduce its fees and/or absorb expenses of the Fund, at least until March 31, 2020, to ensure that total annual fund operating expenses after fee deferral and/or reimbursement (exclusive of any taxes, leverage interest, borrowing interest, brokerage commissions, expenses incurred in connection with any merger or reorganization, dividend expense on securities sold short, acquired fund fees and expenses or extraordinary expenses such as litigation) will not exceed 1.45%, 2.20% and 1.30% of Class A, Class C and Class I shares, respectively, subject to possible recoupment from the Fund in future years on a rolling three year basis (within the three years after the fees have been deferred or reimbursed) if such recoupment can be achieved without exceeding the lesser of the expense limitation in effect at the time of the deferral and at the time of the repayment.
| Copeland International Risk Managed Dividend Growth Fund |
| Portfolio Review (Unaudited) |
| December 17, 2012* through May 31, 2019 |
| |
Performance of a $10,000 Investment (as of May 31, 2019)
| | Average Annualized | | | | | | | | | | | | | |
| | Total Returns as of | | | | | | | | | | | | Since | |
| | May 31, 2019 | | | Six Months | | | One Year | | | Five Year | | | Inception* | |
| | Copeland International Risk Managed Dividend Growth Fund: | | | | | | | | | | | | | |
| | Class A | | | | | | | | | | | | | |
| | Without sales charge | | | 0.17% | | | (7.03)% | | | (0.23)% | | | 2.64% | |
| | With sales charge+ | | | (5.60)% | | | (12.35)% | | | (1.41)% | | | 1.70% | |
| | Class C | | | (0.27)% | | | (7.80)% | | | (0.99)% | | | 1.88% | |
| | Class I | | | 0.17% | | | (6.97)% | | | (0.11)% | | | 2.75% | |
| | MSCI World ex US Index (net) | | | 2.61% | | | (5.44)% | | | 1.15% | | | 4.68% | |
| * | The Fund commenced operations December 17, 2012. |
| + | Adjusted for initial maximum sales charge of 5.75%. |
The MSCI World ex US Index is a free float-adjusted market capitalization weighted index that is designed to measure the equity market performance of developed markets excluding holdings in the United States and is net any withholding taxes. Investors cannot invest directly in an index or benchmark.
Past performance is not predictive of future results. The investment return and principal value of an investment will fluctuate. An investor’s shares, when redeemed, may be worth more or less than the original cost. The performance and returns do not reflect the deduction of taxes that a shareholder may pay on Fund distributions or redemption of Fund shares. Total return is calculated assuming reinvestment of all dividends and distributions. Total returns would have been lower had the adviser not waived its fees and reimbursed a portion of the Fund’s expenses. For performance information current to the most recent month- end please call toll-free 1-888-9-COPELAND (1-888-926-7352). Additional information can be found by visiting our website, www.copelandfunds.com. The Fund’s gross annual operating expense ratio, as stated in the current prospectus is 2.34%, 3.09%, and 2.19%, for Class A, Class C, and Class I shares, respectively, and its net annual operating expense ratio is 1.60%, 2.35%, and 1.45% for its Class A, Class C, and Class I shares, respectively. These ratios can fluctuate and may differ from the expense ratios disclosed in the Financial Highlights section of this report. The Fund’s investment adviser has contractually agreed to reduce its fees and/or absorb expenses of the Fund, at least until March 31, 2020, to ensure that total annual fund operating expenses after fee deferral and/or reimbursement (exclusive of any taxes, leverage interest, borrowing interest, brokerage commissions, expenses incurred in connection with any merger or reorganization, dividend expense on securities sold short, acquired fund fees and expenses or extraordinary expenses such as litigation) will not exceed 1.60%, 2.35%, and 1.45% of Class A, Class C and Class I shares, respectively, subject to possible recoupment from the Fund in future years on a rolling three year basis (within the three years after the fees have been deferred or reimbursed) if such recoupment can be achieved without exceeding the lesser of the expense limitation in effect at the time of the deferral and at the time of the repayment.
| Copeland SMID Cap Dividend Growth Fund |
| Portfolio Review (Unaudited) |
| February 27, 2017* through May 31, 2019 |
Performance of a $10,000 Investment (as of May 31, 2019)
| | | | | | | | | | | | | | | |
| | | | | | | | | | | Since | | | Since | |
| | Total Returns as of | | | | | | | | | Inception | | | Inception | |
| | May 31, 2019 | | | Six Months | | | One Year | | | Class I* | | | Class A* | |
| | | | | | | | | | | | | | | |
| | Copeland SMID Cap Dividend Growth Fund: | | | | | | | | | | | | | |
| | Class A | | | | | | | | | | | | | |
| | Without sales charge | | | N/A | | | N/A | | | N/A% | | | 3.96% | |
| | With sales charge+ | | | N/A | | | N/A | | | N/A% | | | (2.04)% | |
| | Copeland SMID Cap Dividend Growth Fund: | | | | | | | | | | | | | |
| | Class I | | | 4.11% | | | 6.23% | | | 8.85% | | | N/A% | |
| | Russell 2500 Index ** | | | (0.85)% | | | (4.29)% | | | 4.94% | | | (1.59)% | |
| | | | | | | | | | | | | | | |
| * | Class I shares commenced operations February 27, 2017. Class A shares commenced operations February 11, 2019. |
| + | Adjusted for initial maximum sales charge of 5.75%. |
| ** | The Russell 2500 Index is comprised of the smallest 2500 companies in the Russell 3000 Index. The Russell 3000 Index measures the performance of the 3,000 largest U.S. companies based on total market capitalization, which represents approximately 98% of the investable U.S. equity market. Investors cannot invest directly in an index or benchmark. |
Past performance is not predictive of future results. The investment return and principal value of an investment will fluctuate. An investor’s shares, when redeemed, may be worth more or less than the original cost. The performance and returns do not reflect the deduction of taxes that a shareholder may pay on Fund distributions or redemption of Fund shares. Total return is calculated assuming reinvestment of all dividends and distributions. Total returns would have been lower had the adviser not waived its fees and reimbursed a portion of the Fund’s expenses. For performance information current to the most recent month-end please call toll-free 1-888-9-COPELAND (1-888-926-7352). Additional information can be found by visiting our website, www.copelandfunds.com. The Fund’s gross annual operating expense ratio, as stated in the current prospectus is 10.39% and 10.14% for Class A and Class I shares, respectively and its net annual operating expense ratio is 1.20% and 0.95% for Class A and Class I shares, respectively. This ratio can fluctuate and may differ from the expense ratio disclosed in the Financial Highlights section of this report. The Fund’s adviser has contractually agreed to reduce its fees and/or absorb expenses of the Fund, until at least March 31, 2020, to ensure that total annual fund operating expenses after fee deferral and/or reimbursement (exclusive of any taxes, leverage interest, borrowing interest, brokerage commissions, expenses incurred in connection with any merger or reorganization, dividend expense on securities sold short, acquired fund fees and expenses or extraordinary expenses such as litigation) will not exceed 1.20% and 0.95% of the daily average net asset value of Class A shares and Class I shares, respectively, subject to possible recoupment from the Fund in future years on a rolling three year basis (within the three years after the fees have been deferred or reimbursed) if such recoupment can be achieved without exceeding the lesser of the expense limitation in effect at the time of the deferral and at the time of the repayment.
| Copeland Risk Managed Dividend Growth Fund |
| PORTFOLIO OF INVESTMENTS (Unaudited) |
| May 31, 2019 |
| Shares | | | Security | | Market Value | |
| | | | | | | | | |
| | | | | COMMON STOCK - 29.8% | | | | |
| | | | | ELECTRIC - 9.3% | | | | |
| | 24,601 | | | NextEra Energy, Inc. | | $ | 4,876,164 | |
| | 44,879 | | | WEC Energy Group, Inc. | | | 3,615,003 | |
| | 78,677 | | | Xcel Energy Corp. | | | 4,511,339 | |
| | | | | | | | 13,002,506 | |
| | | | | GAS - 5.4% | | | | |
| | 33,810 | | | Atmos Energy Corp. | | | 3,441,858 | |
| | 16,955 | | | Chesapeake Utilities Corp. | | | 1,539,175 | |
| | 51,236 | | | UGI Corp. | | | 2,644,290 | |
| | | | | | | | 7,625,323 | |
| | | | | INTERNET - 2.1% | | | | |
| | 50,933 | | | Cogent Communications Holdings, Inc. | | | 2,979,580 | |
| | | | | | | | | |
| | | | | MEDIA - 5.9% | | | | |
| | 3,355 | | | Cable One, Inc. | | | 3,747,703 | |
| | 110,671 | | | Comcast Corp. | | | 4,537,511 | |
| | | | | | | | 8,285,214 | |
| | | | | UTILITIES - 7.1% | | | | |
| | 303,722 | | | Algonquin Power & Utilities Corp. | | | 3,538,361 | |
| | 35,167 | | | American States Water Co. | | | 2,565,081 | |
| | 34,248 | | | American Water Works Co., Inc. | | | 3,870,709 | |
| | | | | | | | 9,974,151 | |
| | | | | | | | | |
| | | | | TOTAL COMMON STOCK (Cost - $33,834,607) | | | 41,866,774 | |
| Principal | | | | | Interest | | Maturity | | | |
| Amount | | | | | Rate % | | Date | | | |
| | | | | U.S GOVERNMENT OBLIGATIONS - 69.4% | | | | | | | | |
| $ | 97,900,000 | | | U.S Treasury Note | | 1.750 | | 12/31/2020 | | | 97,464,040 | |
| | | | | TOTAL U.S GOVERNMENT OBLIGATIONS (Cost - $97,237,998) | | | | |
| | | | | | | | | | | | | |
| | | | | | | | | | | | | |
| | | | | TOTAL INVESTMENTS - 99.2% (Cost - $131,072,605) | | $ | 139,330,814 | |
| | | | | OTHER ASSETS IN EXCESS OF LIABILITIES - 0.8% | | | 1,101,882 | |
| | | | | NET ASSETS - 100.0% | | | | | | $ | 140,432,696 | |
| Portfolio Composition as of May 31, 2019 | |
| | |
| Sector | | Percent of Net Assets | |
| US Treasury Note | | | 69.4 | % |
| Utilities/Communications | | | 29.8 | % |
| Other Assets in Excess of Liabilities | | | 0.8 | % |
| Net Assets | | | 100.0 | % |
The accompanying notes are an integral part of these financial statements.
| Copeland International Risk Managed Dividend Growth Fund |
| PORTFOLIO OF INVESTMENTS (Unaudited) |
| May 31, 2019 |
| Shares | | | Security | | Market Value | |
| | | | | | | | | |
| | | | | COMMON STOCK - 56.2% | | | | |
| | | | | AGRICULTURE - 3.5% | | | | |
| | 7,266 | | | British American Tobacco PLC | | $ | 251,622 | |
| | 4,556 | | | Philip Morris International, Inc. | | | 351,404 | |
| | | | | | | | 603,026 | |
| | | | | BEVERAGES - 7.0% | | | | |
| | 11,055 | | | Diageo PLC | | | 463,575 | |
| | 4,663 | | | Heineken Holding NV | | | 460,213 | |
| | 1,569 | | | Pernod Ricard SA | | | 275,934 | |
| | | | | | | | 1,199,722 | |
| | | | | COSMETICS/PERSONAL CARE - 9.8% | | | | |
| | 1,762 | | | L’Oreal SA | | | 471,525 | |
| | 3,900 | | | Shiseido Co. Ltd. | | | 279,263 | |
| | 15,200 | | | Unicharm Corp. | | | 452,546 | |
| | 7,820 | | | Unilever NV - ADR | | | 469,534 | |
| | | | | | | | 1,672,868 | |
| | | | | ELECTRIC - 5.9% | | | | |
| | 30,110 | | | CLP Holdings Ltd. | | | 340,981 | |
| | 12,362 | | | Fortis, Inc. | | | 466,810 | |
| | 9,833 | | | Red Electrica Corp SA | | | 207,891 | |
| | | | | | | | 1,015,682 | |
| | | | | ENERGY- ALTERNATE SOURCES - 1.1% | | | | |
| | 16,428 | | | Algonquin Power & Utilities Corp. | | | 191,634 | |
| | | | | | | | | |
| | | | | ENGINEERING & CONSTRUCTION - 1.9% | | | | |
| | 43,045 | | | CK Infrastructure Holdings Ltd. | | | 332,375 | |
| | | | | | | | | |
| | | | | FOOD - 9.7% | | | | |
| | 6,171 | | | Danone SA | | | 491,700 | |
| | 25,981 | | | Hilton Food Group PLC | | | 311,321 | |
| | 4,091 | | | Kerry Group PLC | | | 471,297 | |
| | 3,855 | | | Nestle SA | | | 380,662 | |
| | | | | | | | 1,654,980 | |
| | | | | GAS - 2.0% | | | | |
| | 6,887 | | | Rubis SCA | | | 343,359 | |
| | | | | | | | | |
| | | | | MEDIA - 2.6% | | | | |
| | 19,009 | | | Quebecor, Inc. | | | 448,544 | |
| | | | | | | | | |
| | | | | RETAIL - 4.3% | | | | |
| | 7,165 | | | Alimentation Couche-Tard, Inc. | | | 439,631 | |
| | 1,869 | | | Cosmos Pharmaceutical Corp. | | | 294,356 | |
| | | | | | | | 733,987 | |
| | | | | TELECOMMUNICATIONS - 6.8% | | | | |
| | 8,401 | | | BCE, Inc. | | | 378,197 | |
| | 22,000 | | | China Mobile Ltd. | | | 192,144 | |
| | 14,885 | | | Deutsche Telekom AG | | | 249,976 | |
| | 13,252 | | | KDDI Corp. | | | 338,766 | |
| | | | | | | | 1,159,083 | |
The accompanying notes are an integral part of these financial statements.
| Copeland International Risk Managed Dividend Growth Fund |
| PORTFOLIO OF INVESTMENTS (Unaudited) (Continued) |
| May 31, 2019 |
| Shares | | | Security | | Market Value | |
| | | | | | | | | | | | | |
| | | | | COMMON STOCK - 56.2% (Continued) | | | | | | | | |
| | | | | WATER - 1.6% | | | | | | | | |
| | 30,480 | | | Pennon Group PLC | | | | | | $ | 282,150 | |
| | | | | | | | | | | | | |
| | | | | TOTAL COMMON STOCK (Cost - $9,443,937) | | | 9,637,410 | |
| | | | | | | | | | | | | |
| Principal | | | | | Interest | | Maturity | | | | |
| Amount | | | | | Rate% | | Date | | | | |
| | | | | U.S GOVERNMENT OBLIGATIONS - 34.0% | | | | | | | | |
| $ | 5,838,000 | | | U.S Treasury Notes | | 1.875 | | 6/30/2020 | | | 5,817,020 | |
| | | | | TOTAL U.S GOVERNMENT OBLIGATIONS (Cost - $5,788,552) | | | | |
| | | | | | | | | | | | | |
| | | | | NON U.S GOVERNMENT OBLIGATIONS - 8.4% | | | | | | | | |
| | 1,128,000 | | | U.K. Treasury Gilt | | 2.000 | | 7/20/2020 | | | 1,443,140 | |
| | | | | TOTAL NON U.S GOVERNMENT OBLIGATIONS (Cost - $1,466,219) | | | | |
| | | | | | | | | | | | | |
| | | | | TOTAL INVESTMENTS - 98.6% (Cost - $16,698,708) | | $ | 16,897,570 | |
| | | | | OTHER ASSETS IN EXCESS OF LIABILITIES - 1.4% | | | 239,768 | |
| | | | | NET ASSETS - 100.00% | | | | | | $ | 17,137,338 | |
ADR - American Depositary Receipt.
PLC - Public Limited Company
| Portfolio Composition as of May 31, 2019 | |
| | |
| Country | | Percent of Net Assets | |
| U.S Treasury Notes | | | 33.9 | % |
| Canada | | | 11.2 | % |
| Great Britain | | | 10.4 | % |
| France | | | 9.2 | % |
| U.K. Treasury Gilt | | | 8.4 | % |
| Japan | | | 8.0 | % |
| Hong Kong | | | 5.0 | % |
| Ireland | | | 2.8 | % |
| Netherlands | | | 2.7 | % |
| Switzerland | | | 2.2 | % |
| United States | | | 2.1 | % |
| Germany | | | 1.5 | % |
| Spain | | | 1.2 | % |
| Other Assets in Excess of Liabilities | | | 1.4 | % |
| Net Assets | | | 100.0 | % |
| | | | | |
| | | | | |
| Sector | | Percent of Net Assets | |
| Consumer Staples | | | 34.2 | % |
| US Treasury Note | | | 34.0 | % |
| Utilities / Communications | | | 22.0 | % |
| UK Treasury Gilt | | | 8.4 | % |
| Other Assets in Excess of Liabilities | | | 1.4 | % |
| Net Assets | | | 100.0 | % |
The accompanying notes are an integral part of these financial statements.
| Copeland SMID Cap Dividend Growth Fund |
| PORTFOLIO OF INVESTMENTS (Unaudited) |
| May 31, 2019 |
| Shares | | | Security | | Market Value | |
| | | | | | | | | |
| | | | | COMMON STOCK - 95.6% | | | | |
| | | | | AEROSPACE & DEFENSE - 3.8% | | | | |
| | 355 | | | Harris Corp. | | $ | 66,452 | |
| | 597 | | | HEICO Corp. | | | 72,589 | |
| | | | | | | | 139,041 | |
| | | | | BANKS - 3.8% | | | | |
| | 1,763 | | | Bank OZK | | | 50,951 | |
| | 2,066 | | | Home BancShares, Inc. | | | 36,196 | |
| | 807 | | | Prosperity Bancshares, Inc. | | | 52,302 | |
| | | | | | | | 139,449 | |
| | | | | CHEMICALS - 2.3% | | | | |
| | 282 | | | International Flavors & Fragrances, Inc. | | | 38,188 | |
| | 258 | | | Quaker Chemical Corp. | | | 46,662 | |
| | | | | | | | 84,850 | |
| | | | | COMMERCIAL SERVICES - 4.9% | | | | |
| | 924 | | | Healthcare Services Group, Inc. | | | 29,208 | |
| | 293 | | | MarketAxess Holdings, Inc. | | | 87,261 | |
| | 1,389 | | | Service Corp. International | | | 60,935 | |
| | | | | | | | 177,404 | |
| | | | | DISTRIBUTION/WHOLESALE - 3.9% | | | | |
| | 1,271 | | | Core-Mark Holding Co., Inc. | | | 46,874 | |
| | 615 | | | KAR Auction Services, Inc. | | | 34,575 | |
| | 329 | | | Pool Corp. | | | 59,148 | |
| | | | | | | | 140,597 | |
| | | | | DIVERSIFIED FINANCIAL SERVICES - 3.6% | | | | |
| | 1,159 | | | Cohen & Steers, Inc. | | | 59,364 | |
| | 497 | | | Evercore, Inc. | | | 38,383 | |
| | 1,016 | | | Lazard Ltd. | | | 31,659 | |
| | | | | | | | 129,406 | |
| | | | | ELECTRICAL COMPONENTS & EQUIPMENT - 1.3% | | | | |
| | 288 | | | Littelfuse, Inc. | | | 47,004 | |
| | | | | | | | | |
| | | | | ELECTRONICS - 4.2% | | | | |
| | 6,873 | | | ADT, Inc. | | | 40,207 | |
| | 1,115 | | | Badger Meter, Inc. | | | 58,872 | |
| | 622 | | | Synnex Corp. | | | 53,934 | |
| | | | | | | | 153,013 | |
| | | | | ENVIRONMENTAL CONTROL - 1.6% | | | | |
| | 873 | | | Tetra Tech, Inc. | | | 58,945 | |
| | | | | | | | | |
| | | | | FOOD - 3.3% | | | | |
| | 709 | | | Calavo Growers, Inc. | | | 62,002 | |
| | 370 | | | J&J Snack Foods Corp. | | | 59,515 | |
| | | | | | | | 121,517 | |
| | | | | GAS - 1.4% | | | | |
| | 967 | | | UGI Corp. | | | 49,907 | |
| | | | | | | | | |
| | | | | HAND/MACHINE TOOLS - 1.2% | | | | |
| | 283 | | | Snap-on, Inc. | | | 44,125 | |
| | | | | | | | | |
| | | | | HEALTHCARE PRODUCTS - 5.2% | | | | |
| | 763 | | | Cantel Medical Corp. | | | 52,449 | |
| | 550 | | | ResMed, Inc. | | | 62,766 | |
| | 567 | | | STERIS PLC | | | 75,797 | |
| | | | | | | | 191,012 | |
The accompanying notes are an integral part of these financial statements.
| Copeland SMID Cap Dividend Growth Fund |
| PORTFOLIO OF INVESTMENTS (Unaudited) (Continued) |
| May 31, 2019 |
| Shares | | | Security | | Market Value | |
| | | | | | | | | |
| | | | | COMMON STOCK - 95.6% (Continued) | | | | |
| | | | | HEALTHCARE SERVICES - 6.7% | | | | |
| | 183 | | | Chemed Corp. | | $ | 60,013 | |
| | 850 | | | Encompass Health Corp. | | | 50,082 | |
| | 1,585 | | | Ensign Group, Inc. | | | 84,417 | |
| | 523 | | | Quest Diagnostics, Inc. | | | 50,161 | |
| | | | | | | | 244,673 | |
| | | | | HOUSEHOLD PRODUCTS - 2.0% | | | | |
| | 970 | | | Church & Dwight Co., Inc. | | | 72,178 | |
| | | | | | | | | |
| | | | | HOUSEWARES - 1.3% | | | | |
| | 712 | | | Toro Co. | | | 46,394 | |
| | | | | | | | | |
| | | | | INSURANCE - 1.4% | | | | |
| | 953 | | | First American Financial Corp. | | | 49,223 | |
| | | | | | | | | |
| | | | | INTERNET - 1.7% | | | | |
| | 1,039 | | | Cogent Communications Holdings, Inc. | | | 60,782 | |
| | | | | | | | | |
| | | | | LODGING - 1.5% | | | | |
| | 1,021 | | | Wyndham Destinations, Inc. | | | 54,460 | |
| | | | | | | | | |
| | | | | MACHINERY - CONSTRUCTION & MINING- 1.4% | | | | |
| | 1,096 | | | BWX Technologies, Inc. | | | 51,008 | |
| | | | | | | | | |
| | | | | MACHINERY - DIVERSIFIED - 2.6% | | | | |
| | 1,072 | | | Cognex Corp. | | | 43,523 | |
| | 411 | | | Nordson Corp. | | | 51,630 | |
| | | | | | | | 95,153 | |
| | | | | MEDIA - 3.7% | | | | |
| | 74 | | | Cable One, Inc. | | | 82,662 | |
| | 192 | | | FactSet Research Systems, Inc. | | | 53,414 | |
| | | | | | | | 136,076 | |
| | | | | OIL & GAS - 1.4% | | | | |
| | 2,098 | | | Cabot Oil & Gas Corp. | | | 52,492 | |
| | | | | | | | | |
| | | | | PIPELINES - 2.5% | | | | |
| | 3,980 | | | Antero Midstream GP LP | | | 48,636 | |
| | 883 | | | Phillips 66 Partners LP | | | 42,366 | |
| | | | | | | | 91,002 | |
| | | | | PRIVATE EQUITY - 1.2% | | | | |
| | 2,145 | | | Kennedy-Wilson Holdings, Inc. | | | 44,080 | |
| | | | | | | | | |
| | | | | REAL ESTATE INVESTMENT TRUSTS - 6.2% | | | | |
| | 420 | | | Alexandria Real Estate Equities, Inc. | | | 61,492 | |
| | 1,666 | | | Americold Realty Trust | | | 52,146 | |
| | 491 | | | CoreSite Realty Corp. | | | 57,310 | |
| | 697 | | | Ryman Hospitality Properties, Inc. | | | 55,725 | |
| | | | | | | | 226,673 | |
The accompanying notes are an integral part of these financial statements.
| Copeland SMID Cap Dividend Growth Fund |
| PORTFOLIO OF INVESTMENTS (Unaudited) (Continued) |
| May 31, 2019 |
| Shares | | | Security | | Market Value | |
| | | | | | | | | |
| | | | | COMMON STOCK - 95.6% (Continued) | | | | |
| | | | | RETAIL - 6.3% | | | | |
| | 2,630 | | | Bloomin’ Brands, Inc. | | $ | 50,785 | |
| | 354 | | | Casey’s General Stores, Inc. | | | 45,694 | |
| | 228 | | | Domino’s Pizza, Inc. | | | 63,726 | |
| | 680 | | | Tractor Supply Co. | | | 68,530 | |
| | | | | | | | 228,735 | |
| | | | | SEMICONDUCTORS - 2.6% | | | | |
| | 456 | | | Cabot Microelectronics Corp. | | | 44,446 | |
| | 789 | | | Power Integrations, Inc. | | | 51,411 | |
| | | | | | | | 95,857 | |
| | | | | SOFTWARE - 4.5% | | | | |
| | 510 | | | Broadridge Financial Solutions, Inc. | | | 63,684 | |
| | 346 | | | Jack Henry & Associates, Inc. | | | 45,402 | |
| | 246 | | | MSCI, Inc. | | | 54,122 | |
| | | | | | | | 163,208 | |
| | | | | TELECOMMUNICATIONS - 1.4% | | | | |
| | 694 | | | LogMeIn, Inc. | | | 49,850 | |
| | | | | | | | | |
| | | | | TRANSPORTATION - 1.4% | | | | |
| | 1,009 | | | Ryder System, Inc. | | | 50,955 | |
| | | | | | | | | |
| | | | | UTILITIES - 5.3% | | | | |
| | 5,045 | | | Algonquin Power & Utilities Corp. | | | 58,774 | |
| | 1,029 | | | American States Water Co. | | | 75,055 | |
| | 539 | | | American Water Works Co., Inc. | | | 60,918 | |
| | | | | | | | 194,747 | |
| | | | | | | | | |
| | | | | TOTAL COMMON STOCK (Cost - $3,202,504) | | | 3,483,816 | |
| | | | | | | | | |
| | | | | TOTAL INVESTMENTS - 95.6% (Cost - $3,202,504) | | $ | 3,483,816 | |
| | | | | OTHER ASSETS IN EXCESS OF LIABILITIES - 4.4% | | | 159,800 | |
| | | | | NET ASSETS - 100.00% | | $ | 3,643,616 | |
PLC - Public Limited Company
LP - Limited Partnership
| Portfolio Composition as of May 31, 2019 | |
| | |
| Sector | | Percent of Net Assets | |
| Consumer, Non-Cyclical | | | 22.2 | % |
| Industrials | | | 17.5 | % |
| Financials | | | 16.2 | % |
| Consumer, Cyclical | | | 12.9 | % |
| Technology | | | 7.1 | % |
| Communications | | | 6.8 | % |
| Utilities | | | 6.7 | % |
| Energy | | | 3.9 | % |
| Basic Materials | | | 2.3 | % |
| Other Assets in Excess of Liabilities | | | 4.4 | % |
| Net Assets | | | 100.0 | % |
The accompanying notes are an integral part of these financial statements.
| Copeland Trust |
| STATEMENTS OF ASSETS AND LIABILITIES (Unaudited) |
| May 31, 2019 |
| | | | | | Copeland | | | | |
| | | Copeland Risk | | | International Risk | | | Copeland SMID | |
| | | Managed Dividend | | | Managed Dividend | | | Cap Dividend | |
| | | Growth Fund | | | Growth Fund | | | Growth Fund | |
| Assets: | | | | | | | | | | | | |
| Investments, at Cost | | $ | 131,072,605 | | | $ | 16,698,708 | | | $ | 3,202,504 | |
| Investments in Securities, at Market Value | | $ | 139,330,814 | | | $ | 16,897,570 | | | $ | 3,483,816 | |
| Cash | | | 463,478 | | | | 85,864 | | | | 149,194 | |
| Foreign Cash (Cost $0, $9,603, $0) | | | — | | | | 9,608 | | | | — | |
| Dividends and Interest Receivable | | | 868,973 | | | | 164,198 | | | | 4,598 | |
| Due from Investment Adviser | | | — | | | | — | | | | 4,137 | |
| Receivable for Fund Shares Sold | | | 37,829 | | | | 3,940 | | | | — | |
| Prepaid Expenses and Other Assets | | | 67,463 | | | | 44,068 | | | | 16,880 | |
| Total Assets | | | 140,768,557 | | | | 17,205,248 | | | | 3,658,625 | |
| | | | | | | | | | | | | |
| Liabilities: | | | | | | | | | | | | |
| Payable for Securities Purchased | | | — | | | | — | | | | 4,929 | |
| Payable for Fund Shares Redeemed | | | 130,835 | | | | 11,290 | | | | — | |
| Payable to Investment Adviser | | | 88,605 | | | | 2,750 | | | | — | |
| Accrued Audit Fees | | | 8,914 | | | | 8,750 | | | | 5,099 | |
| Accrued Distribution Fees | | | 62,754 | | | | 9,960 | | | | — | |
| Payable to Related Parties | | | 3,454 | | | | 13,940 | | | | 1,657 | |
| Accrued Expenses and Other Liabilities | | | 41,299 | | | | 21,220 | | | | 3,324 | |
| Total Liabilities | | | 335,861 | | | | 67,910 | | | | 15,009 | |
| | | | | | | | | | | | | |
| Net Assets | | $ | 140,432,696 | | | $ | 17,137,338 | | | $ | 3,643,616 | |
| | | | | | | | | | | | | |
| | | | | | | | | | | | | |
| Composition of Net Assets: | | | | | | | | | | | | |
| At May 31, 2019, Net Assets consisted of: | | | | | | | | | | | | |
| Paid-in-Capital | | $ | 110,729,535 | | | $ | 18,705,537 | | | $ | 3,335,437 | |
| Accumulated Earnings (Loss) | | | 29,703,161 | | | | (1,568,199 | ) | | | 308,179 | |
| Net Assets | | $ | 140,432,696 | | | $ | 17,137,338 | | | $ | 3,643,616 | |
The accompanying notes are an integral part of these financial statements.
| Copeland Trust |
| STATEMENTS OF ASSETS AND LIABILITIES (Unaudited) (Continued) |
| May 31, 2019 |
| | | | | | Copeland | | | | |
| | | Copeland Risk | | | International Risk | | | Copeland SMID | |
| | | Managed Dividend | | | Managed Dividend | | | Cap Dividend | |
| | | Growth Fund | | | Growth Fund | | | Growth Fund | |
| Class A Shares: | | | | | | | | | | | | |
| Net Assets | | $ | 43,238,374 | | | $ | 1,855,514 | | | $ | 183 | |
| Shares Outstanding (no par value; unlimited number of shares authorized) | | | 3,218,506 | | | | 159,460 | | | | 16 | |
| | | | | | | | | | | | | |
| Net Asset Value and Redemption Price Per Share* | | $ | 13.43 | | | $ | 11.64 | | | $ | 11.54 | ** |
| Offering Price Per Share(NAV/0.9425) Includes a Maximum Sales Charge of 5.75% | | $ | 14.25 | | | $ | 12.35 | | | $ | 12.24 | |
| | | | | | | | | | | | | |
| Class C Shares: | | | | | | | | | | | | |
| Net Assets | | $ | 27,823,107 | | | $ | 1,607,227 | | | | | |
| Shares Outstanding (no par value; unlimited number of shares authorized) | | | 2,140,637 | | | | 143,074 | | | | | |
| | | | | | | | | | | | | |
| Net Asset Value, Offering Price and Redemption Price Per Share* | | $ | 13.00 | | | $ | 11.23 | | | | | |
| | | | | | | | | | | | | |
| Class I Shares: | | | | | | | | | | | | |
| Net Assets | | $ | 69,371,215 | | | $ | 13,674,597 | | | $ | 3,643,433 | |
| Shares Outstanding (no par value; unlimited number of shares authorized) | | | 5,212,900 | | | | 1,176,467 | | | | 315,618 | |
| | | | | | | | | | | | | |
| Net Asset Value, Offering Price and Redemption Price Per Share* | | $ | 13.31 | | | $ | 11.62 | | | $ | 11.54 | |
| * | The Funds charge a 1.00% fee on shares redeemed less than 30 days after purchase or if shares held less than 30 days are redeemed for failure to maintain the Funds’ minimum balance requirement. |
| ** | NAV may not recalculate due to rounding. |
The accompanying notes are an integral part of these financial statements.
| Copeland Trust |
| STATEMENTS OF OPERATIONS (Unaudited) |
| For the Period Ended May 31, 2019 |
| | | | | | Copeland | | | | |
| | | Copeland Risk | | | International Risk | �� | | Copeland SMID | |
| | | Managed Dividend | | | Managed Dividend | | | Cap Dividend | |
| | | Growth Fund | | | Growth Fund | | | Growth Fund | |
| Investment Income: | | | | | | | | | | | | |
| Dividend Income (Less $11,336, $13,245, and $218 Foreign Taxes Withholding, respectively) | | $ | 870,962 | | | $ | 162,764 | | | $ | 26,182 | |
| Interest Income | | | 840,030 | | | | 94,767 | | | | 1,349 | |
| Total Investment Income | | | 1,710,992 | | | | 257,531 | | | | 27,531 | |
| | | | | | | | | | | | | |
| Expenses: | | | | | | | | | | | | |
| Investment Advisory Fees | | | 745,377 | | | | 109,761 | | | | 10,236 | |
| Distribution Fees - Class C | | | 143,305 | | | | 8,735 | | | | — | |
| Distribution Fees - Class A | | | 57,731 | | | | 2,543 | | | | — | |
| Trustees’ Fees | | | 76,793 | | | | 10,458 | | | | 4,487 | |
| Administration Fees | | | 69,949 | | | | 16,094 | | | | 1,889 | |
| Chief Compliance Officer Fees | | | 39,190 | | | | 10,590 | | | | 220 | |
| Shareholder Service Fees- Class I | | | 35,077 | | | | 8,088 | | | | — | |
| Fund Accounting Fees | | | 28,673 | | | | 18,027 | | | | 11,130 | |
| Legal Fees | | | 28,581 | | | | 5,587 | | | | 2,100 | |
| Transfer Agent Fees | | | 27,801 | | | | 6,903 | | | | 1,850 | |
| Printing Expenses | | | 17,447 | | | | 4,629 | | | | 1,015 | |
| Non-Rule 12B-1 Shareholder Service Fees | | | 15,722 | | | | 6,341 | | | | 484 | |
| Registration & Filing Fees | | | 13,294 | | | | 13,183 | | | | 3,184 | |
| Insurance Expense | | | 13,130 | | | | 435 | | | | 87 | |
| Custody Fees | | | 8,895 | | | | 6,305 | | | | 9,947 | |
| Audit Fees | | | 8,695 | | | | 9,378 | | | | 5,099 | |
| Miscellaneous Expenses | | | 1,079 | | | | 2,687 | | | | 250 | |
| Total Expenses | | | 1,330,739 | | | | 239,744 | | | | 51,978 | |
| Less: Management Fees Waived by Adviser | | | (199,243 | ) | | | (85,862 | ) | | | (10,236 | ) |
| Less: Other Expenses Reimbursed by Adviser | | | — | | | | — | | | | (28,708 | ) |
| Net Expenses | | | 1,131,496 | | | | 153,882 | | | | 13,034 | |
| Net Investment Income | | | 579,496 | | | | 103,649 | | | | 14,497 | |
| | | | | | | | | | | | | |
| Net Realized and Unrealized Gain (Loss) on Investments and Foreign Currencies: | | | | | | | | | | | | |
| Net Realized Gain (Loss) on: | | | | | | | | | | | | |
| Security Transactions and FX Loss on Securities | | | 20,046,838 | | | | (387,746 | ) | | | 13,378 | |
| Foreign Currency Transactions | | | — | | | | (9,175 | ) | | | — | |
| | | | 20,046,838 | | | | (396,921 | ) | | | 13,378 | |
| Net Change in Unrealized Appreciation (Depreciation) on: | | | | | | | | | | | | |
| Securities | | | (28,335,830 | ) | | | 316,300 | | | | 237,755 | |
| Foreign Currency Exchange Contracts | | | — | | | | (437 | ) | | | — | |
| | | | (28,335,830 | ) | | | 315,863 | | | | 237,755 | |
| | | | | | | | | | | | | |
| Net Realized and Unrealized Gain (Loss) on Investments and Foreign Currency Transactions | | | (8,288,992 | ) | | | (81,058 | ) | | | 251,133 | |
| | | | | | | | | | | | | |
| Net Increase (Decrease) in Net Assets Resulting From Operations | | $ | (7,709,496 | ) | | $ | 22,591 | | | $ | 265,630 | |
The accompanying notes are an integral part of these financial statements.
| Copeland Risk Managed Dividend Growth Fund |
| STATEMENTS OF CHANGES IN NET ASSETS |
| | | Six Months | | | Year | |
| | | Ended | | | Ended | |
| | | May 31, 2019 | | | November 30, 2018 | |
| | | (Unaudited) | | | | |
| Operations: | | | | | | | | |
| Net Investment Income | | $ | 579,496 | | | $ | 356,633 | |
| Net Realized Gain on Investments and Foreign Currency Transactions | | | 20,046,838 | | | | 12,983,809 | |
| Net Change in Unrealized Appreciation (Depreciation) on Investments and Foreign Currency Transactions | | | (28,335,830 | ) | | | 3,390,403 | |
| Net Increase (Decrease) in Net Assets Resulting From Operations | | | (7,709,496 | ) | | | 16,730,845 | |
| | | | | | | | | |
| Distributions to Shareholders From: | | | | | | | | |
| Total Distributions Paid | | | | | | | | |
| Class A | | | (3,753,431 | ) | | | (2,787,853 | ) |
| Class C | | | (2,354,930 | ) | | | (1,470,734 | ) |
| Class I | | | (6,061,801 | ) | | | (3,463,111 | ) |
| Total Distributions to Shareholders | | | (12,170,162 | ) | | | (7,721,698 | ) |
| | | | | | | | | |
| Beneficial Interest Transactions: | | | | | | | | |
| Class A | | | | | | | | |
| Proceeds from Shares Issued | | | 1,160,426 | | | | 3,540,874 | |
| Distributions Reinvested | | | 3,503,569 | | | | 2,620,675 | |
| Cost of Shares Redeemed | | | (7,973,619 | ) | | | (21,301,591 | ) |
| Redemption Fees | | | 477 | | | | 459 | |
| Total Class A Shares | | | (3,309,147 | ) | | | (15,139,583 | ) |
| Class C | | | | | | | | |
| Proceeds from Shares Issued | | | 505,912 | | | | 1,694,122 | |
| Distributions Reinvested | | | 2,329,578 | | | | 1,457,862 | |
| Cost of Shares Redeemed | | | (3,609,006 | ) | | | (7,715,771 | ) |
| Redemption Fees | | | 73 | | | | 119 | |
| Total Class C Shares | | | (773,443 | ) | | | (4,563,668 | ) |
| Class I | | | | | | | | |
| Proceeds from Shares Issued | | | 9,586,001 | | | | 17,441,233 | |
| Distributions Reinvested | | | 5,921,432 | | | | 3,430,860 | |
| Cost of Shares Redeemed | | | (18,004,191 | ) | | | (18,536,619 | ) |
| Redemption Fees | | | 89 | | | | 196 | |
| Total Class I Shares | | | (2,496,669 | ) | | | 2,335,670 | |
| Total Beneficial Interest Transactions | | | (6,579,259 | ) | | | (17,367,581 | ) |
| | | | | | | | | |
| Decrease in Net Assets | | | (26,458,917 | ) | | | (8,358,434 | ) |
| | | | | | | | | |
| Net Assets: | | | | | | | | |
| Beginning of Year | | | 166,891,613 | | | | 175,250,047 | |
| End of Year | | $ | 140,432,696 | | | $ | 166,891,613 | |
| | | | | | | | | |
| Share Activity: | | | | | | | | |
| Class A | | | | | | | | |
| Shares Issued | | | 88,768 | | | | 242,487 | |
| Distributions Reinvested | | | 256,296 | | | | 190,456 | |
| Shares Redeemed | | | (602,531 | ) | | | (1,454,627 | ) |
| Total Class A Shares | | | (257,467 | ) | | | (1,021,684 | ) |
| Class C | | | | | | | | |
| Shares Issued | | | 39,583 | | | | 118,243 | |
| Distributions Reinvested | | | 175,552 | | | | 108,150 | |
| Shares Redeemed | | | (282,457 | ) | | | (541,849 | ) |
| Total Class C Shares | | | (67,322 | ) | | | (315,456 | ) |
| Class I | | | | | | | | |
| Shares Issued | | | 747,374 | | | | 1,127,549 | |
| Distributions Reinvested | | | 437,976 | | | | 265,266 | |
| Shares Redeemed | | | (1,377,230 | ) | | | (2,823,559 | ) |
| Total Class I Shares | | | (191,880 | ) | | | (1,430,744 | ) |
The accompanying notes are an integral part of these financial statements.
| Copeland International Risk Managed Dividend Growth Fund |
| STATEMENTS OF CHANGES IN NET ASSETS |
| | | Six Months | | | Year | |
| | | Ended | | | Ended | |
| | | May 31, 2019 | | | November 30, 2018 | |
| | | (Unaudited) | | | | |
| Operations: | | | | | | | | |
| Net Investment Income | | $ | 103,649 | | | $ | 158,235 | |
| Net Realized Gain (Loss) on Investments and Foreign Currency Transactions | | | (396,921 | ) | | | 1,212,409 | |
| Net Change in Unrealized Appreciation (Depreciation) on Investments and Foreign Currency Transactions | | | 315,863 | | | | (2,536,174 | ) |
| Net Increase (Decrease) in Net Assets Resulting From Operations | | | 22,591 | | | | (1,165,530 | ) |
| | | | | | | | | |
| Distributions to Shareholders From: | | | | | | | | |
| Total Distributions Paid | | | | | | | | |
| Class A | | | — | | | | (24,439 | ) |
| Class C | | | — | | | | (6,259 | ) |
| Class I | | | — | | | | (211,040 | ) |
| Total Distributions to Shareholders | | | — | | | | (241,738 | ) |
| | | | | | | | | |
| Beneficial Interest Transactions: | | | | | | | | |
| Class A | | | | | | | | |
| Proceeds from Shares Issued | | | 165,334 | | | | 204,659 | |
| Distributions Reinvested | | | — | | | | 22,886 | |
| Cost of Shares Redeemed | | | (529,649 | ) | | | (492,304 | ) |
| Redemption Fees | | | 2 | | | | — | |
| Total Class A Shares | | | (364,313 | ) | | | (264,759 | ) |
| Class C | | | | | | | | |
| Proceeds from Shares Issued | | | 29,749 | | | | 406,442 | |
| Distributions Reinvested | | | — | | | | 6,196 | |
| Cost of Shares Redeemed | | | (232,650 | ) | | | (417,555 | ) |
| Redemption Fees | | | — | | | | 30 | |
| Total Class C Shares | | | (202,901 | ) | | | (4,887 | ) |
| Class I | | | | | | | | |
| Proceeds from Shares Issued | | | 1,129,801 | | | | 4,623,175 | |
| Distributions Reinvested | | | — | | | | 206,851 | |
| Cost of Shares Redeemed | | | (5,298,156 | ) | | | (2,656,944 | ) |
| Total Class I Shares | | | (4,168,355 | ) | | | 2,173,082 | |
| Total Beneficial Interest Transactions | | | (4,735,569 | ) | | | 1,903,436 | |
| | | | | | | | | |
| Increase (Decrease) in Net Assets | | | (4,712,978 | ) | | | 496,168 | |
| | | | | | | | | |
| Net Assets: | | | | | | | | |
| Beginning of Year | | | 21,850,316 | | | | 21,354,148 | |
| End of Year | | $ | 17,137,338 | | | $ | 21,850,316 | |
| | | | | | | | | |
| Share Activity: | | | | | | | | |
| Class A | | | | | | | | |
| Shares Issued | | | 14,448 | | | | 16,513 | |
| Distributions Reinvested | | | — | | | | 1,879 | |
| Shares Redeemed | | | (45,832 | ) | | | (39,584 | ) |
| Total Class A Shares | | | (31,384 | ) | | | (21,192 | ) |
| Class C | | | | | | | | |
| Shares Issued | | | 2,701 | | | | 33,875 | |
| Distributions Reinvested | | | — | | | | 521 | |
| Shares Redeemed | | | (20,593 | ) | | | (35,085 | ) |
| Total Class C Shares | | | (17,892 | ) | | | (689 | ) |
| Class I | | | | | | | | |
| Shares Issued | | | 98,308 | | | | 374,295 | |
| Distributions Reinvested | | | — | | | | 17,039 | |
| Shares Redeemed | | | (458,080 | ) | | | (217,031 | ) |
| Total Class I Shares | | | (359,772 | ) | | | 174,303 | |
The accompanying notes are an integral part of these financial statements.
| Copeland SMID Cap Dividend Growth Fund |
| STATEMENTS OF CHANGES IN NET ASSETS |
| | | Six Months | | | For the Period | |
| | | Ended | | | Ended | |
| | | May 31, 2019 | | | November 30, 2018 | |
| | | (Unaudited) | | | | |
| Operations: | | | | | | | | |
| Net Investment Income | | $ | 14,497 | | | $ | 7,575 | |
| Net Realized Gain on Investments and Foreign Currency Transactions | | | 13,378 | | | | 31,806 | |
| Net Change in Unrealized Appreciation (Depreciation) on Investments and Foreign Currency Transactions | | | 237,755 | | | | (12,020 | ) |
| Net Increase in Net Assets Resulting From Operations | | | 265,630 | | | | 27,361 | |
| | | | | | | | | |
| Distributions to Shareholders From: | | | | | | | | |
| Total Distributions Paid | | | | | | | | |
| Class I | | | (39,613 | ) | | | (4,647 | ) |
| Total Distributions to Shareholders | | | (39,613 | ) | | | (4,647 | ) |
| | | | | | | | | |
| Beneficial Interest Transactions: | | | | | | | | |
| Class A * | | | | | | | | |
| Proceeds from Shares Issued | | | 176 | | | | — | |
| Total Class A Shares | | | 176 | | | | — | |
| Class I | | | | | | | | |
| Proceeds from Shares Issued | | | 2,367,373 | | | | 392,022 | |
| Distributions Reinvested | | | 35,745 | | | | 4,444 | |
| Cost of Shares Redeemed | | | (21,147 | ) | | | — | |
| Total Class I Shares | | | 2,381,971 | | | | 396,466 | |
| | | | | | | | | |
| Total Beneficial Interest Transactions | | | 2,382,147 | | | | 396,466 | |
| | | | | | | | | |
| Increase in Net Assets | | | 2,608,164 | | | | 419,180 | |
| | | | | | | | | |
| Net Assets: | | | | | | | | |
| Beginning of Period | | | 1,035,452 | | | | 616,272 | |
| End of Period | | $ | 3,643,616 | | | $ | 1,035,452 | |
| | | | | | | | | |
| Share Activity: | | | | | | | | |
| Class A * | | | | | | | | |
| Shares Issued | | | 16 | | | | | |
| Total Class A Shares | | | 16 | | | | — | |
| Class I | | | | | | | | |
| Shares Issued | | | 224,375 | | | | 33,817 | |
| Distributions Reinvested | | | 3,328 | | | | 409 | |
| Shares Redeemed | | | (1,829 | ) | | | — | |
| Total Class I Shares | | | 225,874 | | | | 34,226 | |
| * | Class A commenced operations on February 11, 2019. |
The accompanying notes are an integral part of these financial statements.
| Copeland Risk Managed Dividend Growth Fund |
| FINANCIAL HIGHLIGHTS |
| |
Certain information in the table below reflects financial results for one share of beneficial interest outstanding throughout each year presented.
| | | Class A | |
| | | Six Months | | | Year | | | Year | | | Year | | | Year | | | Year | |
| | | Ended | | | Ended | | | Ended | | | Ended | | | Ended | | | Ended | |
| | | May 31, 2019 | | | November 30, 2018 | | | November 30, 2017 | | | November 30, 2016 | | | November 30, 2015 | | | November 30, 2014 | |
| | | (Unaudited) | | | | | | | | | | | | | | | | |
| Net Asset Value, Beginning of Period | | $ | 15.18 | | | $ | 14.38 | | | $ | 12.27 | | | $ | 13.38 | | | $ | 15.31 | | | $ | 14.20 | |
| | | | | | | | | | | | | | | | | | | | | | | | | |
| Increase From Operations: | | | | | | | | | | | | | | | | | | | | | | | | |
| Net investment income (a) | | | 0.06 | | | | 0.04 | | | | 0.06 | | | | — | | | | 0.08 | | | | 0.07 | |
| Net gain (loss) from securities (both realized and unrealized) | | | (0.73 | ) | | | 1.38 | | | | 2.51 | | | | 0.07 | | | | (1.14 | ) | | | 1.47 | |
| Total from operations | | | (0.67 | ) | | | 1.42 | | | | 2.57 | | | | 0.07 | | | | (1.06 | ) | | | 1.54 | |
| | | | | | | | | | | | | | | | | | | | | | | | | |
| Distributions to shareholders from: | | | | | | | | | | | | | | | | | | | | | | | | |
| Net investment income | | | (0.01 | ) | | | (0.03 | ) | | | (0.09 | ) | | | (0.05 | ) | | | (0.03 | ) | | | (0.07 | ) |
| Net realized gains | | | (1.07 | ) | | | (0.59 | ) | | | (0.37 | ) | | | (1.13 | ) | | | (0.84 | ) | | | (0.36 | ) |
| Total distributions | | | (1.08 | ) | | | (0.62 | ) | | | (0.46 | ) | | | (1.18 | ) | | | (0.87 | ) | | | (0.43 | ) |
| | | | | | | | | | | | | | | | | | | | | | | | | |
| Redemption fees (b) | | | 0.00 | | | | 0.00 | | | | 0.00 | | | | 0.00 | | | | 0.00 | | | | 0.00 | |
| | | | | | | | | | | | | | | | | | | | | | | | | |
| Net Asset Value, End of Period | | $ | 13.43 | | | $ | 15.18 | | | $ | 14.38 | | | $ | 12.27 | | | $ | 13.38 | | | $ | 15.31 | |
| | | | | | | | | | | | | | | | | | | | | | | | | |
| Total Return (c) | | | (4.57 | )% (d) | | | 10.33 | % | | | 21.63 | % | | | 0.49 | % | | | (7.08 | )% | | | 11.14 | % |
| | | | | | | | | | | | | | | | | | | | | | | | | |
| Ratios/Supplemental Data | | | | | | | | | | | | | | | | | | | | | | | | |
| Net assets, end of year (in 000’s) | | $ | 43,238 | | | $ | 52,779 | | | $ | 64,666 | | | $ | 82,165 | | | $ | 190,458 | | | $ | 324,664 | |
| Ratio of expenses to average net assets: | | | | | | | | | | | | | | | | | | | | | | | | |
| before reimbursement | | | 1.72 | % (e) | | | 1.71 | % | | | 1.82 | % | | | 1.62 | % | | | 1.48 | % | | | 1.46 | % |
| net of reimbursement | | | 1.45 | % (e) | | | 1.45 | % | | | 1.45 | % | | | 1.45 | % | | | 1.45 | % | | | 1.45 | % |
| Ratio of net investment income to average net assets | | | 0.85 | % (e) | | | 0.28 | % | | | 0.47 | % | | | 0.01 | % | | | 0.57 | % | | | 0.48 | % |
| Portfolio turnover rate | | | 161 | % (d) | | | 30 | % | | | 27 | % | | | 201 | % | | | 142 | % | | | 44 | % |
| | | | | | | | | | | | | | | | | | | | | | | | | |
| (a) | Per share amounts are calculated using the average shares method, which more appropriately presents the per share data for the year. |
| (b) | Less than $0.01 per share. |
| (c) | Total returns are historical in nature and assume changes in share price, reinvestment of dividends and capital gains distributions, if any. Had the Adviser not absorbed a portion of fund expenses, the total return would have been lower. Sales loads are not reflected in total return. |
The accompanying notes are an integral part of these financial statements.
| Copeland Risk Managed Dividend Growth Fund |
| FINANCIAL HIGHLIGHTS |
| |
Certain information in the table below reflects financial results for one share of beneficial interest outstanding throughout each year presented.
| | | Class C | |
| | | Six Months | | | Year | | | Year | | | Year | | | Year | | | Year | |
| | | Ended | | | Ended | | | Ended | | | Ended | | | Ended | | | Ended | |
| | | May 31, 2019 | | | November 30, 2018 | | | November 30, 2017 | | | November 30, 2016 | | | November 30, 2015 | | | November 30, 2014 | |
| | | (Unaudited) | | | | | | | | | | | | | | | | |
| Net Asset Value, Beginning of Period | | $ | 14.76 | | | $ | 14.06 | | | $ | 12.01 | | | $ | 13.17 | | | $ | 15.16 | | | $ | 14.10 | |
| | | | | | | | | | | | | | | | | | | | | | | | | |
| Increase From Operations: | | | | | | | | | | | | | | | | | | | | | | | | |
| Net investment income (loss) (a) | | | 0.01 | | | | (0.07 | ) | | | (0.04 | ) | | | (0.09 | ) | | | (0.03 | ) | | | (0.04 | ) |
| Net gain (loss) from securities (both realized and unrealized) | | | (0.70 | ) | | | 1.36 | | | | 2.46 | | | | 0.06 | | | | (1.12 | ) | | | 1.47 | |
| Total from operations | | | (0.69 | ) | | | 1.29 | | | | 2.42 | | | | (0.03 | ) | | | (1.15 | ) | | | 1.43 | |
| | | | | | | | | | | | | | | | | | | | | | | | | |
| Distributions to shareholders from: | | | | | | | | | | | | | | | | | | | | | | | | |
| Net investment income | | | — | | | | — | | | | — | | | | — | | | | — | | | | (0.01 | ) |
| Net realized gains | | | (1.07 | ) | | | (0.59 | ) | | | (0.37 | ) | | | (1.13 | ) | | | (0.84 | ) | | | (0.36 | ) |
| Total distributions | | | (1.07 | ) | | | (0.59 | ) | | | (0.37 | ) | | | (1.13 | ) | | | (0.84 | ) | | | (0.37 | ) |
| | | | | | | | | | | | | | | | | | | | | | | | | |
| Redemption fees (b) | | | 0.00 | | | | 0.00 | | | | 0.00 | | | | 0.00 | | | | 0.00 | | | | 0.00 | |
| | | | | | | | | | | | | | | | | | | | | | | | | |
| Net Asset Value, End of Period | | $ | 13.00 | | | $ | 14.76 | | | $ | 14.06 | | | $ | 12.01 | | | $ | 13.17 | | | $ | 15.16 | |
| | | | | | | | | | | | | | | | | | | | | | | | | |
| Total Return (c) | | | (4.88 | )% (d) | | | 9.55 | % | | | 20.68 | % | | | (0.30 | )% | | | (7.74 | )% | | | 10.36 | % |
| | | | | | | | | | | | | | | | | | | | | | | | | |
| Ratios/Supplemental Data | | | | | | | | | | | | | | | | | | | | | | | | |
| Net assets, end of year (in 000’s) | | $ | 27,823 | | | $ | 32,597 | | | $ | 35,487 | | | $ | 43,859 | | | $ | 81,851 | | | $ | 89,017 | |
| Ratio of expenses to average net assets: | | | | | | | | | | | | | | | | | | | | | | | | |
| before reimbursement | | | 2.47 | % (e) | | | 2.45 | % | | | 2.57 | % | | | 2.38 | % | | | 2.24 | % | | | 2.21 | % |
| net of reimbursement | | | 2.20 | % (e) | | | 2.20 | % | | | 2.20 | % | | | 2.20 | % | | | 2.20 | % | | | 2.20 | % |
| Ratio of net investment income(loss) to average net assets | | | 0.10 | % (e) | | | (0.46 | )% | | | (0.28 | )% | | | (0.74 | )% | | | (0.21 | )% | | | (0.27 | )% |
| Portfolio turnover rate | | | 161 | % (d) | | | 30 | % | | | 27 | % | | | 201 | % | | | 142 | % | | | 44 | % |
| | | | | | | | | | | | | | | | | | | | | | | | | |
| (a) | Per share amounts are calculated using the average shares method, which more appropriately presents the per share data for the year. |
| (b) | Less than $0.01 per share. |
| (c) | Total returns are historical in nature and assume changes in share price, reinvestment of dividends and capital gains distributions, if any. Had the Adviser not absorbed a portion of fund expenses, the total return would have been lower. |
The accompanying notes are an integral part of these financial statements.
| Copeland Risk Managed Dividend Growth Fund |
| FINANCIAL HIGHLIGHTS |
| |
Certain information in the table below reflects financial results for one share of beneficial interest outstanding throughout each year presented.
| | | Class I | |
| | | Six Months | | | Year | | | Year | | | Year | | | Year | | | Year | |
| | | Ended | | | Ended | | | Ended | | | Ended | | | Ended | | | Ended | |
| | | May 31, 2019 | | | November 30, 2018 | | | November 30, 2017 | | | November 30, 2016 | | | November 30, 2015 | | | November 30, 2014 | |
| | | (Unaudited) | | | | | | | | | | | | | | | | |
| Net Asset Value, Beginning of Period | | $ | 15.08 | | | $ | 14.30 | | | $ | 12.24 | | | $ | 13.38 | | | $ | 15.34 | | | $ | 14.22 | |
| | | | | | | | | | | | | | | | | | | | | | | | | |
| Increase From Operations: | | | | | | | | | | | | | | | | | | | | | | | | |
| Net investment income (a) | | | 0.07 | | | | 0.07 | | | | 0.08 | | | | 0.01 | | | | 0.11 | | | | 0.13 | |
| Net gain (loss) from securities (both realized and unrealized) | | | (0.71 | ) | | | 1.37 | | | | 2.49 | | | | 0.08 | | | | (1.14 | ) | | | 1.44 | |
| Total from operations | | | (0.65 | ) | | | 1.44 | | | | 2.57 | | | | 0.09 | | | | (1.03 | ) | | | 1.57 | |
| | | | | | | | | | | | | | | | | | | | | | | | | |
| Distributions to shareholders from: | | | | | | | | | | | | | | | | | | | | | | | | |
| Net investment income | | | (0.06 | ) | | | (0.07 | ) | | | (0.14 | ) | | | (0.10 | ) | | | (0.09 | ) | | | (0.09 | ) |
| Net realized gains | | | (1.07 | ) | | | (0.59 | ) | | | (0.37 | ) | | | (1.13 | ) | | | (0.84 | ) | | | (0.36 | ) |
| Total distributions | | | (1.13 | ) | | | (0.66 | ) | | | (0.51 | ) | | | (1.23 | ) | | | (0.93 | ) | | | (0.45 | ) |
| | | | | | | | | | | | | | | | | | | | | | | | | |
| Redemption fees (b) | | | 0.00 | | | | 0.00 | | | | 0.00 | | | | 0.00 | | | | 0.00 | | | | 0.00 | |
| | | | | | | | | | | | | | | | | | | | | | | | | |
| Net Asset Value, End of Period | | $ | 13.31 | | | $ | 15.08 | | | $ | 14.30 | | | $ | 12.24 | | | $ | 13.38 | | | $ | 15.34 | |
| | | | | | | | | | | | | | | | | | | | | | | | | |
| Total Return (c) | | | (4.39 | )% (d) | | | 10.56 | % | | | 21.72 | % | | | 0.67 | % | | | (6.87 | )% | | | 11.38 | % (d) |
| | | | | | | | | | | | | | | | | | | | | | | | | |
| Ratios/Supplemental Data | | | | | | | | | | | | | | | | | | | | | | | | |
| Net assets, end of year (in 000’s) | | $ | 69,371 | | | $ | 81,516 | | | $ | 75,097 | | | $ | 81,750 | | | $ | 249,817 | | | $ | 320,981 | |
| Ratio of expenses to average net assets: | | | | | | | | | | | | | | | | | | | | | | | | |
| before reimbursement | | | 1.57 | % (e) | | | 1.53 | % | | | 1.57 | % | | | 1.37 | % | | | 1.24 | % | | | 1.24 | % |
| net of reimbursement | | | 1.30 | % (e) | | | 1.30 | % | | | 1.30 | % | | | 1.30 | % | | | 1.24 | % | | | 1.24 | % |
| Ratio of net investment income to average net assets | | | 1.00 | % (e) | | | 0.45 | % | | | 0.62 | % | | | 0.11 | % | | | 0.76 | % | | | 0.63 | % |
| Portfolio turnover rate | | | 161 | % (d) | | | 30 | % | | | 27 | % | | | 201 | % | | | 142 | % | | | 44 | % |
| | | | | | | | | | | | | | | | | | | | | | | | | |
| (a) | Per share amounts are calculated using the average shares method, which more appropriately presents the per share data for the year. |
| (b) | Less than $0.01 per share. |
| (c) | Total returns are historical in nature and assume changes in share price, reinvestment of dividends and capital gains distributions, if any. Had the Adviser not absorbed a portion of fund expenses, the total return would have been lower. |
The accompanying notes are an integral part of these financial statements.
| Copeland International Risk Managed Dividend Growth Fund |
| FINANCIAL HIGHLIGHTS |
| |
Certain information in the table below reflects financial results for one share of beneficial interest outstanding throughout each year presented.
| | | Class A | |
| | | Six Months | | | Year | | | Year | | | Year | | | Year | | | Year | |
| | | Ended | | | Ended | | | Ended | | | Ended | | | Ended | | | Ended | |
| | | May 31, 2019 | | | November 30, 2018 | | | November 30, 2017 | | | November 30, 2016 | | | November 30, 2015 | | | November 30, 2014 | |
| | | (Unaudited) | | | | | | | | | | | | | | | | |
| Net Asset Value, Beginning of Period | | $ | 11.62 | | | $ | 12.34 | | | $ | 9.93 | | | $ | 10.92 | | | $ | 11.28 | | | $ | 11.01 | |
| | | | | | | | | | | | | | | | | | | | | | | | | |
| Increase From Operations: | | | | | | | | | | | | | | | | | | | | | | | | |
| Net investment income (loss) (a) | | | 0.06 | | | | 0.08 | | | | 0.03 | | | | 0.08 | | | | (0.02 | ) | | | 0.06 | |
| Net gain (loss) from securities (both realized and unrealized) | | | (0.04 | ) | | | (0.68 | ) | | | 2.44 | | | | (1.07 | ) | | | (0.34 | ) | | | 0.22 | |
| Total from operations | | | 0.02 | | | | (0.60 | ) | | | 2.47 | | | | (0.99 | ) | | | (0.36 | ) | | | 0.28 | |
| | | | | | | | | | | | | | | | | | | | | | | | | |
| Distributions to shareholders from: | | | | | | | | | | | | | | | | | | | | | | | | |
| Net investment income | | | — | | | | (0.12 | ) | | | (0.06 | ) | | | — | | | | — | | | | — | |
| Net realized gains | | | — | | | | — | | | | — | | | | — | | | | — | | | | (0.01 | ) |
| Total distributions | | | — | | | | (0.12 | ) | | | (0.06 | ) | | | — | | | | — | | | | (0.01 | ) |
| | | | | | | | | | | | | | | | | | | | | | | | | |
| Redemption fees (b) | | | 0.00 | | | | 0.00 | | | | 0.00 | | | | 0.00 | | | | 0.00 | | | | 0.00 | |
| | | | | | | | | | | | | | | | | | | | | | | | | |
| Net Asset Value, End of Period | | $ | 11.64 | | | $ | 11.62 | | | $ | 12.34 | | | $ | 9.93 | | | $ | 10.92 | | | $ | 11.28 | |
| | | | | | | | | | | | | | | | | | | | | | | | | |
| Total Return (c) | | | 0.17 | % (d) | | | (4.94 | )% | | | 25.04 | % | | | (9.07 | )% | | | (3.19 | )% | | | 2.51 | % |
| | | | | | | | | | | | | | | | | | | | | | | | | |
| Ratios/Supplemental Data | | | | | | | | | | | | | | | | | | | | | | | | |
| Net assets, end of year (in 000’s) | | $ | 1,856 | | | $ | 2,218 | | | $ | 2,617 | | | $ | 5,322 | | | $ | 13,169 | | | $ | 17,840 | |
| Ratio of expenses to average net assets: | | | | | | | | | | | | | | | | | | | | | | | | |
| before reimbursement | | | 2.47 | % (e) | | | 2.34 | % | | | 2.58 | % | | | 2.14 | % | | | 2.04 | % | | | 2.33 | % |
| net of reimbursement | | | 1.60 | % (e) | | | 1.60 | % | | | 1.60 | % | | | 1.60 | % | | | 1.60 | % | | | 1.60 | % |
| Ratio of net investment income(loss) to average net assets | | | 0.99 | % (e) | | | 0.62 | % | | | 0.28 | % | | | 0.72 | % | | | (0.21 | )% | | | 0.48 | % |
| Portfolio turnover rate | | | 91 | % (d) | | | 96 | % | | | 88 | % | | | 180 | % | | | 323 | % | | | 211 | % |
| | | | | | | | | | | | | | | | | | | | | | | | | |
| (a) | Per share amounts are calculated using the average shares method, which more appropriately presents the per share data for the year. |
| (b) | Less than $0.01 per share. |
| (c) | Total returns are historical in nature and assume changes in share price, reinvestment of dividends and capital gains distributions, if any. Had the Adviser not absorbed a portion of fund expenses, the total return would have been lower. Sales loads are not reflected in total return. |
The accompanying notes are an integral part of these financial statements.
| Copeland International Risk Managed Dividend Growth Fund |
| FINANCIAL HIGHLIGHTS |
| |
Certain information in the table below reflects financial results for one share of beneficial interest outstanding throughout each year presented.
| | | Class C | |
| | | Six Months | | | Year | | | Year | | | Year | | | Year | | | Year | |
| | | Ended | | | Ended | | | Ended | | | Ended | | | Ended | | | Ended | |
| | | May 31, 2019 | | | November 30, 2018 | | | November 30, 2017 | | | November 30, 2016 | | | November 30, 2015 | | | November 30, 2014 | |
| | | (Unaudited) | | | | | | | | | | | | | | | | |
| Net Asset Value, Beginning of Period | | $ | 11.26 | | | $ | 11.97 | | | $ | 9.65 | | | $ | 10.69 | | | $ | 11.12 | | | $ | 10.95 | |
| | | | | | | | | | | | | | | | | | | | | | | | | |
| Increase From Operations: | | | | | | | | | | | | | | | | | | | | | | | | |
| Net investment income (loss) (a) | | | 0.01 | | | | (0.01 | ) | | | (0.06 | ) | | | (0.03 | ) | | | (0.10 | ) | | | (0.04 | ) |
| Net gain (loss) from securities (both realized and unrealized) | | | (0.04 | ) | | | (0.66 | ) | | | 2.38 | | | | (1.01 | ) | | | (0.33 | ) | | | 0.22 | |
| Total from operations | | | (0.03 | ) | | | (0.67 | ) | | | 2.32 | | | | (1.04 | ) | | | (0.43 | ) | | | 0.18 | |
| | | | | | | | | | | | | | | | | | | | | | | | | |
| Distributions to shareholders from: | | | | | | | | | | | | | | | | | | | | | | | | |
| Net investment income | | | — | | | | (0.04 | ) | | | — | | | | — | | | | — | | | | — | |
| Net realized gains | | | — | | | | — | | | | — | | | | — | | | | — | | | | (0.01 | ) |
| Total distributions | | | — | | | | (0.04 | ) | | | — | | | | — | | | | — | | | | (0.01 | ) |
| | | | | | | | | | | | | | | | | | | | | | | | | |
| Redemption fees (b) | | | 0.00 | | | | 0.00 | | | | 0.00 | | | | 0.00 | | | | 0.00 | | | | 0.00 | |
| | | | | | | | | | | | | | | | | | | | | | | | | |
| Net Asset Value, End of Period | | $ | 11.23 | | | $ | 11.26 | | | $ | 11.97 | | | $ | 9.65 | | | $ | 10.69 | | | $ | 11.12 | |
| | | | | | | | | | | | | | | | | | | | | | | | | |
| Total Return (c) | | | (0.27 | )% (d) | | | (5.62 | )% | | | 24.04 | % | | | (9.73 | )% | | | (3.87 | )% | | | 1.61 | % |
| | | | | | | | | | | | | | | | | | | | | | | | | |
| Ratios/Supplemental Data | | | | | | | | | | | | | | | | | | | | | | | | |
| Net assets, end of year (in 000’s) | | $ | 1,607 | | | $ | 1,813 | | | $ | 1,936 | | | $ | 3,603 | | | $ | 7,254 | | | $ | 5,706 | |
| Ratio of expenses to average net assets: | | | | | | | | | | | | | | | | | | | | | | | | |
| before reimbursement | | | 3.22 | % (e) | | | 3.09 | % | | | 3.32 | % | | | 2.89 | % | | | 2.80 | % | | | 3.08 | % |
| net of reimbursement | | | 2.35 | % (e) | | | 2.35 | % | | | 2.35 | % | | | 2.35 | % | | | 2.35 | % | | | 2.35 | % |
| Ratio of net investment loss to average net assets | | | 0.25 | % (e) | | | (0.11 | )% | | | (0.59 | )% | | | (0.28 | )% | | | (0.88 | )% | | | (0.27 | )% |
| Portfolio turnover rate | | | 91 | % (d) | | | 96 | % | | | 88 | % | | | 180 | % | | | 323 | % | | | 211 | % |
| | | | | | | | | | | | | | | | | | | | | | | | | |
| (a) | Per share amounts are calculated using the average shares method, which more appropriately presents the per share data for the year. |
| (b) | Less than $0.01 per share. |
| (c) | Total returns are historical in nature and assume changes in share price, reinvestment of dividends and capital gains distributions, if any. Had the Adviser not absorbed a portion of fund expenses, the total return would have been lower. |
The accompanying notes are an integral part of these financial statements.
| Copeland International Risk Managed Dividend Growth Fund |
| FINANCIAL HIGHLIGHTS |
| |
Certain information in the table below reflects financial results for one share of beneficial interest outstanding throughout each year presented.
| | | Class I | |
| | | Six Months | | | Year | | | Year | | | Year | | | Year | | | Year | |
| | | Ended | | | Ended | | | Ended | | | Ended | | | Ended | | | Ended | |
| | | May 31, 2019 | | | November 30, 2018 | | | November 30, 2017 | | | November 30, 2016 | | | November 30, 2015 | | | November 30, 2014 | |
| | | (Unaudited) | | | | | | | | | | | | | | | | |
| Net Asset Value, Beginning of Period | | $ | 11.60 | | | $ | 12.34 | | | $ | 9.96 | | | $ | 10.95 | | | $ | 11.30 | | | $ | 11.02 | |
| | | | | | | | | | | | | | | | | | | | | | | | | |
| Increase From Operations: | | | | | | | | | | | | | | | | | | | | | | | | |
| Net investment income (a) | | | 0.07 | | | | 0.09 | | | | 0.04 | | | | 0.08 | | | | 0.01 | | | | 0.06 | |
| Net gain (loss) from securities (both realized and unrealized) | | | (0.05 | ) | | | (0.68 | ) | | | 2.45 | | | | (1.06 | ) | | | (0.36 | ) | | | 0.23 | |
| Total from operations | | | 0.02 | | | | (0.59 | ) | | | 2.49 | | | | (0.98 | ) | | | (0.35 | ) | | | 0.29 | |
| | | | | | | | | | | | | | | | | | | | | | | | | |
| Distributions to shareholders from: | | | | | | | | | | | | | | | | | | | | | | | | |
| Net investment income | | | — | | | | (0.15 | ) | | | (0.11 | ) | | | (0.01 | ) | | | — | | | | — | |
| Net realized gains | | | — | | | | — | | | | — | | | | — | | | | — | | | | (0.01 | ) |
| Total distributions | | | — | | | | (0.15 | ) | | | (0.11 | ) | | | (0.01 | ) | | | — | | | | (0.01 | ) |
| | | | | | | | | | | | | | | | | | | | | | | | | |
| Redemption fees (b) | | | 0.00 | | | | 0.00 | | | | 0.00 | | | | 0.00 | | | | 0.00 | | | | 0.00 | |
| | | | | | | | | | | | | | | | | | | | | | | | | |
| Net Asset Value, End of Period | | $ | 11.62 | | | $ | 11.60 | | | $ | 12.34 | | | $ | 9.96 | | | $ | 10.95 | | | $ | 11.30 | |
| | | | | | | | | | | | | | | | | | | | | | | | | |
| Total Return (c) | | | 0.17 | % (d) | | | (4.82 | )% | | | 25.27 | % | | | (8.97 | )% | | | (3.10 | )% | | | 2.60 | % |
| | | | | | | | | | | | | | | | | | | | | | | | | |
| Ratios/Supplemental Data | | | | | | | | | | | | | | | | | | | | | | | | |
| Net assets, end of year (in 000’s) | | $ | 13,675 | | | $ | 17,820 | | | $ | 16,802 | | | $ | 10,563 | | | $ | 14,902 | | | $ | 12,575 | |
| Ratio of expenses to average net assets: | | | | | | | | | | | | | | | | | | | | | | | | |
| before reimbursement | | | 2.31 | % (e) | | | 2.19 | % | | | 2.42 | % | | | 2.04 | % | | | 1.89 | % | | | 2.18 | % |
| net of reimbursement | | | 1.45 | % (e) | | | 1.45 | % | | | 1.45 | % | | | 1.45 | % | | | 1.45 | % | | | 1.45 | % |
| Ratio of net investment income to average net assets | | | 0.48 | % (e) | | | 0.77 | % | | | 0.39 | % | | | 0.79 | % | | | 0.05 | % | | | 0.63 | % |
| Portfolio turnover rate | | | 91 | % (d) | | | 96 | % | | | 88 | % | | | 180 | % | | | 323 | % | | | 211 | % |
| | | | | | | | | | | | | | | | | | | | | | | | | |
| (a) | Per share amounts are calculated using the average shares method, which more appropriately presents the per share data for the year. |
| (b) | Less than $0.01 per share. |
| (c) | Total returns are historical in nature and assume changes in share price, reinvestment of dividends and capital gains distributions, if any. Had the Adviser not absorbed a portion of fund expenses, the total return would have been lower. |
The accompanying notes are an integral part of these financial statements.
| Copeland SMID Cap Dividend Growth Fund |
| FINANCIAL HIGHLIGHTS |
| |
Certain information in the table below reflects financial results for one share of beneficial interest outstanding throughout the period presented.
| | | Class A | |
| | | Period | |
| | | Ended | |
| | | May 31, 2019 * | |
| | | (Unaudited) | |
| Net Asset Value, Beginning of Period | | $ | 11.10 | |
| | | | | |
| Increase From Operations: | | | | |
| Net investment income (a) | | | — | |
| Net gain from securities (both realized and unrealized) | | | 0.44 | |
| Total from operations | | | 0.44 | |
| | | | | |
| Net Asset Value, End of Period | | $ | 11.54 | |
| | | | | |
| Total Return (b) | | | 3.96 | % (d) |
| | | | | |
| Ratios/Supplemental Data | | | | |
| Net assets, end of period | | $ | 183 | |
| Ratio of expenses to average net assets: | | | | |
| before reimbursement | | | 4.04 | % (c) |
| net of reimbursement | | | 1.20 | % (c) |
| Ratio of net investment income(loss) to average net assets | | | 0.00 | % (c) |
| Portfolio turnover rate | | | 13 | % (d) |
| | | | | |
| * | Class A commenced operations on February 11, 2019. |
| (a) | Per share amounts are calculated using the average shares method, which more appropriately presents the per share data for the year. |
| (b) | Total returns are historical in nature and assume changes in share price, reinvestment of dividends and capital gains distributions, if any. Had the Adviser not absorbed a portion of fund expenses, the total return would have been lower. Sales loads are not reflected in total return. |
The accompanying notes are an integral part of these financial statements.
| Copeland SMID Cap Dividend Growth Fund |
| FINANCIAL HIGHLIGHTS |
| |
Certain information in the table below reflects financial results for one share of beneficial interest outstanding throughout the period presented.
| | | Class I | |
| | | Six Months | | | Year | | | Period | |
| | | Ended | | | Ended | | | Ended | |
| | | May 31, 2019 | | | November 30, 2018 | | | November 30, 2017 * | |
| | | | (Unaudited) | | | | | | | | | |
| Net Asset Value, Beginning of Period | | $ | 11.54 | | | $ | 11.10 | | | $ | 10.00 | |
| | | | | | | | | | | | | |
| Increase From Operations: | | | | | | | | | | | | |
| Net investment income (a) | | | 0.08 | | | | 0.10 | | | | 0.06 | |
| Net gain from securities (both realized and unrealized) | | | 0.36 | | | | 0.42 | | | | 1.04 | |
| Total from operations | | | 0.44 | | | | 0.52 | | | | 1.10 | |
| | | | | | | | | | | | | |
| Distributions to shareholders from: | | | | | | | | | | | | |
| Net investment income | | | (0.08 | ) | | | (0.07 | ) | | | — | |
| Net realized gains | | | (0.36 | ) | | | (0.01 | ) | | | — | |
| Total distributions | | | (0.44 | ) | | | (0.08 | ) | | | — | |
| | | | | | | | | | | | | |
| Net Asset Value, End of Period | | $ | 11.54 | | | $ | 11.54 | | | $ | 11.10 | |
| | | | | | | | | | | | | |
| Total Return (b) | | | 4.11 | % (d) | | | 4.76 | % | | | 11.00 | % (d) |
| | | | | | | | | | | | | |
| Ratios/Supplemental Data | | | | | | | | | | | | |
| Net assets, end of period (in 000’s) | | $ | 3,643 | | | $ | 1,035 | | | $ | 616 | |
| Ratio of expenses to average net assets: | | | | | | | | | | | | |
| before reimbursement | | | 3.79 | % (c) | | | 10.14 | % | | | 12.96 | % (c) |
| net of reimbursement | | | 0.95 | % (c) | | | 0.95 | % | | | 0.95 | % (c) |
| Ratio of net investment income(loss) to average net assets | | | 1.06 | % (c) | | | 0.90 | % | | | 0.83 | % (c) |
| Portfolio turnover rate | | | 13 | % (d) | | | 26 | % | | | 21 | % (d) |
| * | Class I commenced operations on February 27, 2017. |
| (a) | Per share amounts are calculated using the average shares method, which more appropriately presents the per share data for the year. |
| (b) | Total returns are historical in nature and assume changes in share price, reinvestment of dividends and capital gains distributions, if any. Had the Adviser not absorbed a portion of fund expenses, the total return would have been lower. |
The accompanying notes are an integral part of these financial statements.
| Copeland Trust |
| NOTES TO FINANCIAL STATEMENTS (Unaudited) |
| May 31, 2019 |
Copeland Risk Managed Dividend Growth Fund (the “Domestic Fund”), Copeland International Risk Managed Dividend Growth Fund (the “International Fund”), and Copeland SMID Cap Dividend Growth Fund (the “SMID Fund”) are diversified series of Copeland Trust (the “Trust”). The Trust is registered under the Investment Company Act of 1940, as amended (the “1940 Act”) as an open-end management investment company. The Trust was organized as a statutory trust on September 10, 2010, under the laws of the State of Delaware.
The Domestic and International Funds currently offer Class A, Class C and Class I shares. The SMID Fund currently offers Class A and Class I shares. The Domestic Fund’s Class A shares commenced operations on December 28, 2010, Class C shares commenced operations on January 5, 2012 and Class I shares commenced operations on March 1, 2013. The International Fund’s Class A, Class C and Class I shares commenced operations on December 17, 2012. The SMID Fund’s Class I shares commenced operations on February 27, 2017 and Class A shares commenced operations on February 11, 2019. Class A shares are offered at net asset value plus a maximum sales charge of 5.75%. Purchases of $1,000,000 or more may be subject to a maximum contingent deferred sales charge of 1.00% on shares redeemed within 18 months. Class C and Class I shares are offered at net asset value. Each class represents an interest in the same assets of the Funds and classes are identical except for differences in their sales charge structures and ongoing service and distribution charges. All classes of shares have equal voting privileges except that each class has exclusive voting rights with respect to its service and/or distribution plans. The Funds’ income, expenses (other than class specific distribution fees) and realized and unrealized gains and losses are allocated proportionately each day based upon the relative net assets of each class.
| 2. | SUMMARY OF SIGNIFICANT ACCOUNTING POLICIES |
The following is a summary of significant accounting policies followed by the Funds in preparation of their financial statements. These policies are in conformity with accounting principles generally accepted in the United States of America (“GAAP”). The preparation of financial statements requires management to make estimates and assumptions that affect the reported amounts of assets and liabilities and disclosure of contingent assets and liabilities at the date of the financial statements and the reported amounts of income and expenses for the period. Actual results could differ from those estimates. The Funds are investment companies and accordingly follow the investment company accounting and reporting guidance of the Financial Accounting Standards Board (FASB) Accounting Standard Codification Topic 946 “Financial Services Investment Companies” including FASB Accounting Standard Update ASU 2013-08.
SECURITY VALUATION
The Funds’ securities are valued at the last sale price on the exchange in which such securities are primarily traded, as of the close of business on the day the securities are being valued. In the absence of a sale on the primary exchange, such securities shall be valued at the last mean on the primary exchange. NASDAQ traded securities are valued using the NASDAQ Official Closing Price (“NOCP”). Investments valued in currencies other than the U.S. dollar are converted to U.S. dollars using exchange rates obtained from pricing services. Short-term investments that mature in 60 days or less may be valued at amortized cost. Investments in open-end investment companies are valued at net asset value.
If market quotations are not readily available, securities will be valued at their fair market value as determined in good faith by the adviser in accordance with procedures approved by the Trust’s Board of Trustees (the “Board��) and evaluated by the Board as to the reliability of the fair value method used. The procedures consider, among others, the following factors to determine a security’s fair value: the nature and pricing history, if any, of the security; whether any dealer quotations for the security are available; and possible valuation methodologies that could be used to determine the fair value of the security.
The Funds utilize various methods to measure the fair value of their investments on a recurring basis. GAAP establishes a hierarchy that prioritizes inputs to valuation methods.
| Copeland Trust |
| NOTES TO FINANCIAL STATEMENTS (Unaudited) (Continued) |
| May 31, 2019 |
| |
The three levels of input are:
Level 1 – Unadjusted quoted prices in active markets for identical assets and liabilities that the Funds have the ability to access.
Level 2 – Observable inputs other than quoted prices included in Level 1 that are observable for the asset or liability, either directly or indirectly. These inputs may include quoted prices for the identical instrument on an inactive market, prices for similar instruments, interest rates, prepayment speeds, credit risk, yield curves, default rates and similar data.
Level 3– Unobservable inputs for the asset or liability, to the extent relevant observable inputs are not available, representing the Funds’ own assumptions about the assumptions a market participant would use in valuing the asset or liability, and would be based on the best information available.
The availability of observable inputs can vary from security to security and is affected by a wide variety of factors, including, for example, the type of security, whether the security is new and not yet established in the marketplace, the liquidity of markets, and other characteristics particular to the security. To the extent that valuation is based on models or inputs that are less observable or unobservable in the market, the determination of fair value requires more judgment. Accordingly, the degree of judgment exercised in determining fair value is greatest for instruments categorized in Level 3.
The inputs used to measure fair value may fall into different levels of the fair value hierarchy. In such cases, for disclosure purposes, the level in the fair value hierarchy within which the fair value measurement falls in its entirety, is determined based on the lowest level input that is significant to the fair value measurement in its entirety.
The inputs or methodology used for valuing securities are not necessarily an indication of the risk associated with investing in those securities. The following tables summarize the inputs used as of May 31, 2019 for the Funds’ assets measured at fair value:
| Copeland Risk Managed Dividend Growth Fund | |
| | | | | | | | | | | | | |
| Assets | | Level 1 | | | Level 2 | | | Level 3 | | | Total | |
| Common Stock* | | $ | 41,866,774 | | | $ | — | | | $ | — | | | $ | 41,866,774 | |
| U.S Government Obligations | | | — | | | | 97,464,040 | | | | — | | | $ | 97,464,040 | |
| Total | | $ | 41,866,774 | | | $ | 97,464,040 | | | $ | — | | | $ | 139,330,814 | |
| | | | | | | | | | | | | | | | | |
| Copeland International Risk Managed Dividend Growth Fund | |
| | | | | | | | | | | | | |
| Assets | | Level 1 | | | Level 2 | | | Level 3 | | | Total | |
| Common Stock* | | $ | 2,276,220 | | | $ | 7,361,190 | | | $ | — | | | $ | 9,637,410 | |
| U.S Government Obligations | | | — | | | | 5,817,020 | | | | — | | | $ | 5,817,020 | |
| Non U.S Government Obligations | | | — | | | | 1,443,140 | | | | — | | | $ | 1,443,140 | |
| Total | | $ | 2,276,220 | | | $ | 14,621,350 | | | $ | — | | | $ | 16,897,570 | |
| | | | | | | | | | | | | | | | | |
| Copeland SMID Cap Dividend Growth Fund | |
| | | | | | | | | | | | | |
| Assets | | Level 1 | | | Level 2 | | | Level 3 | | | Total | |
| Common Stock* | | $ | 3,483,816 | | | $ | — | | | $ | — | | | $ | 3,483,816 | |
| Total | | $ | 3,483,816 | | | $ | — | | | $ | — | | | $ | 3,483,816 | |
The Funds did not hold any Level 3 securities during the period.
| * | Please refer to the Portfolio of Investments for Industry Classification. |
Securities in which the International Fund invests may be traded in markets that close before 4:00 p.m. Eastern Time (“ET”). In order to capture the developments that occur between the close of the foreign markets and 4:00 p.m. ET, the International Fund utilizes fair value prices as provided by an independent pricing vendor on a daily basis for those securities traded on a foreign exchange. The assets valued at fair value are reflected as Level 2 assets in the table above.
| Copeland Trust |
| NOTES TO FINANCIAL STATEMENTS (Unaudited) (Continued) |
| May 31, 2019 |
SECURITY TRANSACTIONS AND INVESTMENT INCOME
Investment security transactions are accounted for on a trade date basis. Cost is determined and gains and losses are based upon the specific identification method for both financial statement and federal income tax purposes. Dividend income is recorded on the ex-dividend date and interest income is recorded on the accrual basis. Purchase discounts and premiums on securities are accreted and amortized over the life of the respective securities.
FEDERAL INCOME TAXES
The Funds intend to continue to comply with the requirements of Subchapter M of the Internal Revenue Code applicable to regulated investment companies and will distribute all of their taxable income, if any, to shareholders. Accordingly, no provision for Federal income taxes is required in the financial statements.
The Funds recognize the tax benefits of uncertain tax positions only where the position is “more likely than not” to be sustained assuming examination by tax authorities. Management has analyzed the Funds’ tax positions, and has concluded that no liability for unrecognized tax benefits should be recorded related to uncertain tax positions related to the open tax years (2016-2018) or expected to be taken in the Funds’ 2019 tax returns. The Funds identify their major tax jurisdictions as U.S. Federal and foreign jurisdictions where the Funds may make significant investments; however, the Funds are not aware of any tax positions for which it is reasonably possible that the total amounts of unrecognized tax benefits will change materially in the next twelve months.
FOREIGN CURRENCY
The accounting records of the Funds are maintained in U.S. dollars. Investment securities and other assets and liabilities denominated in a foreign currency, and income receipts and expense payments are translated into U.S. dollars using the prevailing exchange rate at the London market close. Purchases and sales of securities are translated into U.S. dollars at the contractual currency rates established at the approximate time of the trade. Net realized gains and losses on foreign currency transactions represent net gains and losses from currency realized between the trade and settlement dates on securities transactions and the difference between income accrued versus income received. The effects of changes in foreign currency exchange rates on investments in securities are included with the net realized and unrealized gain or loss on investment securities.
FORWARD CURRENCY CONTRACTS
As foreign securities are purchased, the Funds generally enter into forward currency exchange contracts in order to eliminate ongoing foreign currency exchange rate risks. As foreign securities are sold, the foreign currency proceeds are typically repatriated into US dollars. Any realized gains and losses between trade date and settlement date from contract transactions are included as a component of net realized gains (losses) from foreign currency transactions in the Statements of Operations. For the six months ended May 31, 2019, the International Fund had a net realized loss of $9,175 on forward currency contracts.
CONCENTRATION OF RISK
Investing in securities of foreign issuers and currency transactions may involve certain considerations and risks not typically associated with investments in the United States. These risks include revaluation of currencies, adverse fluctuations in foreign currency values and possible adverse political, social and economic developments, including those particular to a specific industry, country or region. These conditions could cause the securities and their markets to be less liquid and prices more volatile than those of comparable U.S. companies and U.S. government securities.
DISTRIBUTIONS TO SHAREHOLDERS
Distributions from investment income, if any, are declared and paid annually and are recorded on the ex-dividend date. The Funds will declare and pay net realized capital gains, if any, annually. The character of income and gains to be distributed is determined in accordance with income tax regulations, which may differ from GAAP. These “book/tax” differences are considered either temporary (i.e., deferred losses, capital loss carry forwards) or permanent in nature. To the extent these differences are permanent in nature, such amounts are reclassified within the composition of net assets based on their federal tax-basis treatment; temporary differences do not require classification.
| Copeland Trust |
| NOTES TO FINANCIAL STATEMENTS (Unaudited) (Continued) |
| May 31, 2019 |
EXPENSES
Expenses of the Trust that are directly identifiable to a specific Fund are charged to that Fund. Expenses, which are not readily identifiable to a specific Fund, are allocated in such a manner as deemed equitable, taking into consideration the nature and type of expense and the relative sizes of the Funds in the Trust.
INDEMNIFICATION
The Trust indemnifies their officers and trustees for certain liabilities that may arise from the performance of their duties to the Trust. Additionally, in the normal course of business, the Funds enter into contracts that contain a variety of representations and warranties and which provide general indemnities. The Funds’ maximum exposure under these arrangements is unknown, as this would involve future claims that may be made against the Funds that have not yet occurred. However, based on experience, the Funds expect the risk of loss due to these warranties and indemnities to be remote.
| 3. | INVESTMENT ADVISORY AGREEMENT AND TRANSACTIONS WITH RELATED PARTIES |
ADVISORY FEE
Subject to the authority of the Board, the adviser is responsible for management of the Funds’ investment portfolios. Pursuant to the Management Agreement (the “Management Agreement”), investment advisory services are provided to the Funds by Copeland Capital Management, LLC (the “Adviser”). Under the terms of the Management Agreement, the Adviser receives monthly fees calculated at an annual rate of 1.00%, 1.10% and 0.75% for the Domestic Fund, the International Fund and SMID Fund respectively, of the average daily net assets of each Fund. For the six months ended May 31, 2019, the Adviser earned advisory fees of $745,377, $109,761 and $10,236 for the Domestic Fund, International Fund, and SMID Fund, respectively, before the effect of the Expense Limitation Agreement.
The Adviser, pursuant to an Expense Limitation Agreement (the “Agreement”) has contractually agreed to reduce its fees and/or absorb expenses of each Fund, at least until March 31, 2020, to ensure that Net Annual Operating Expenses (excluding any front-end or contingent deferred loads, brokerage fees and commissions, acquired fund fees and expenses, borrowing costs such as interest and dividend expense on securities sold short, taxes and extraordinary expenses such as litigation) will not exceed 1.45%, 2.20% and 1.30% of the Domestic Fund’s average daily net assets for Class A, Class C and Class I shares, respectively, 1.60%, 2.35% and 1.45% of the International Fund’s average daily net assets for Class A, Class C and Class I shares, respectively, and 1.20% and 0.95% of the SMID Fund’s average daily net assets for Class A and Class I, respectively, subject to possible recoupment from the Fund in future years on a rolling three year basis (within the three years after the fees have been deferred or reimbursed) if such recoupment can be achieved without exceeding the lesser of the expense limitation in effect at the time of the deferral and at the time of the repayment. For the six months ended May 31, 2019, the Adviser waived fees/reimbursed expenses of $199,243, $85,862 and $38,944 for the Domestic Fund, International Fund and SMID Fund, respectively.
The expenses subject to recapture for the Domestic Fund, the International Fund and the SMID Fund will expire on November 30 of the years indicated below:
| Copeland Risk Managed Dividend Growth Fund |
| 2019 | | 2020 | | 2021 | | Total |
| $430,508 | | $600,610 | | $420,780 | | $1,451,898 |
| | | | | | | |
| Copeland International Risk Managed Dividend Growth Fund |
| 2019 | | 2020 | | 2021 | | Total |
| $153,111 | | $173,367 | | $173,709 | | $500,187 |
| | | | | | | |
| Copeland SMID Cap Dividend Growth Fund |
| | | 2020 | | 2021 | | Total |
| | | $48,465 | | $77,534 | | $125,999 |
| Copeland Trust |
| NOTES TO FINANCIAL STATEMENTS (Unaudited) (Continued) |
| May 31, 2019 |
DISTRIBUTOR
The Board has adopted Distribution Plans and Agreements for each Fund (collectively the “Plan”) pursuant to Rule 12b-1 under the 1940 Act. The Plan provides that a monthly service and/or distribution fee is calculated by each Fund at an annual rate of 0.25% and 1.00% (of which up to 0.75% is a distribution fee and up to 0.25% is a service fee) of the average daily net assets attributable to Class A shares and Class C shares, respectively and is paid to Northern Lights Distributors, LLC (the “Distributor” or “NLD”), to provide compensation for ongoing distribution-related activities or services and/or maintenance of the Funds’ shareholder accounts, not otherwise required to be provided by the Adviser. The Plan is a compensation plan, which means that compensation is provided regardless of 12b-1 expenses incurred. For the six months ended May 31, 2019, the 12b-1 fees accrued amounted to $57,731 and $143,305 for the Domestic Fund, $2,543 and $8,735 for the International Fund for Class A and Class C shares, respectively. The 12b-1 fees accrued for the SMID Cap Dividend Growth Fund Class A shares were $0.
The Board has adopted non-Rule 12b-1 shareholder service plans (collectively, the “Shareholder Service Plan”) for the Class I shares of each Fund. The Shareholder Service Plan permits the Funds to pay brokers, financial intermediaries and others an annual fee of 0.10% of each Fund’s average daily net assets attributable to the Class I shares for shareholder support and/or administrative services, not otherwise provided by the Trust’s transfer agent. For the six months ended May 31, 2019, the Domestic Fund accrued $35,077, the International Fund accrued $8,088 and the SMID Cap Dividend Growth Fund accrued $0 in fees associated with the Shareholder Service Plan. The Funds’ Class A and Class C shares may also pay broker-dealers or other financial intermediaries for shareholder support services and/or administrative services based on the aggregate net asset value of the Class A and Class C shares, as applicable, owned of record or beneficially by the broker-dealers’ or financial intermediaries’ customers.
The Distributor acts as the Funds’ principal underwriter in a continuous public offering of the Funds’ shares. For the six months ended May 31, 2019, the Distributor received $24,280 in underwriting commissions for sales of Class A shares of the Domestic Fund, of which $3,942 was retained by the principal underwriter or other affiliated broker-dealers, $10 in underwriting commissions for sales of Class A shares of the International Fund of which $2 was retained by the principal underwriter or other affiliated broker-dealers and $0 in underwriting commissions for sales of Class A shares of the SMID Cap Dividend Growth Fund of which $0 was retained by the principal underwriter or other affiliated broker-dealers.
In addition, certain affiliates of the Distributor provide services to the Funds as follows:
GEMINI FUND SERVICES, LLC (“GFS”)
GFS, an affiliate of the Distributor, provides administration, fund accounting, and transfer agent services to the Trust. Pursuant to separate servicing agreements with GFS, the Fund pays GFS fees for providing administration, fund accounting, and transfer agency services to the Fund. These fees are disclosed in the Statement of Operations. An officer of the Fund is also an officer of GFS, and is not paid any fees directly by the Fund for servicing in such capacity.
BLU GIANT, LLC (“Blu Giant”)
Blu Giant, an affiliate of GFS and the Distributor, provides EDGAR conversion and filing services as well as print management services for the Funds on an ad-hoc basis. For the provision of these services, Blu Giant receives customary fees from the Funds.
Effective February 1, 2019, NorthStar Financial Services Group, LLC, the parent company of Gemini Fund Services, LLC (“GFS”) and its affiliated companies including Northern Lights Distributors, LLC (“NLD”), and Blu Giant, LLC (“Blu Giant”) (collectively, the “Gemini Companies”), sold its interest in the Gemini Companies to a third party private equity firm that contemporaneously acquired Ultimus Fund Solutions, LLC (an independent mutual fund administration firm) and its affiliates (collectively, the “Ultimus Companies”). As a result of these separate transactions, the Gemini Companies and the Ultimus Companies are now indirectly owned through a common parent entity, The Ultimus Group, LLC.
CHIEF COMPLIANCE OFFICER
The Adviser is providing a Chief Compliance Officer to the Trust as well as related compliance services. The Adviser charges an annual fee of $100,000 to the Trust for these services.
| Copeland Trust |
| NOTES TO FINANCIAL STATEMENTS (Unaudited) (Continued) |
| May 31, 2019 |
| |
TRUSTEE
Each Trustee who is not affiliated with the Trust or Adviser receives (i) a base annual retainer of $30,000, (ii) $17,000 for attendance at four regularly scheduled Board meetings, (iii) $2,000 for attendance at each regularly scheduled Audit Committee meeting, (iv) $750 and $2,500 per each additional special telephonic or in person meeting, respectively, and (v) reimbursement for any reasonable expenses incurred attending the meetings. For carrying out his additional responsibilities, the independent Chairman of the Board receives an additional $11,000 per year. The foregoing compensation is paid in quarterly payments.
The “interested persons” who serve as Trustees of the Trust receive no compensation for their services as Trustees. None of the executive officers receive compensation from the Trust except for the CCO, a portion of whose salary is paid by the Trust for compliance services.
| 4. | INVESTMENT TRANSACTIONS |
The cost of purchases and the proceeds from sales of investments, other than short-term investments, for the six months ended May 31, 2019 were as follows:
| Fund | | Purchases | | | Sale Proceeds | |
| Risk Managed Dividend Growth Fund | | $ | 239,886,635 | | | $ | 257,297,606 | |
| International Risk Managed Dividend Growth Fund | | | 10,699,478 | | | | 15,281,288 | |
| SMID Cap Dividend Growth Fund | | | 2,591,049 | | | | 339,067 | |
| 5. | AGGREGATE UNREALIZED APPRECIATION AND DEPRECIATION – TAX BASIS |
The identified cost of investments in securities owned by the Funds for federal income tax purposes, and their respective gross unrealized appreciation and depreciation at May 31, 2019, were as follows:
| | | | | | Gross | | | Gross | | | Net Unrealized | |
| | | | | | Unrealized | | | Unrealized | | | Appreciaion | |
| Fund | | Tax Cost | | | Appreciation | | | Depreciation | | | (Depreciation) | |
| Risk Managed Dividend Growth Fund | | $ | 131,168,181 | | | $ | 8,278,287 | | | $ | (115,654 | ) | | $ | 8,162,633 | |
| International Risk Managed Dividend Growth Fund | | | 16,848,921 | | | | 758,063 | | | | (709,414 | ) | | | 48,649 | |
| SMID Cap Dividend Growth Fund | | | 3,201,420 | | | | 375,037 | | | | (92,641 | ) | | | 282,396 | |
| | | | | | | | | | | | | | | | | |
| 6. | DISTRIBUTIONS TO SHAREHOLDERS AND TAX COMPONENTS OF CAPITAL |
The tax character of fund distributions paid for the years ended November 30, 2018 and November 30, 2017 was as follows:
| For the year ended November 30, 2018: | | | | | | | | | | | | |
| | | Ordinary | | | Long-Term | | | Return of | | | | |
| | | Income | | | Capital Gains | | | Capital | | | Total | |
| Risk Managed Dividend Growth Fund | | $ | 7,380,149 | | | $ | 1,667,052 | | | $ | — | | | $ | 9,047,201 | |
| International Risk Managed Dividend Growth Fund | | | 111,528 | | | | — | | | | 130,210 | | | | 241,738 | |
| SMID Cap Dividend Growth Fund | | | 4,608 | | | | 39 | | | | — | | | | 4,647 | |
| | | | | | | | | | | | | | | | | |
| For the year ended November 30, 2017: | | | | | | | | | | | | |
| | | Ordinary | | | Long-Term | | | Return of | | | | |
| | | Income | | | Capital Gains | | | Capital | | | Total | |
| Risk Managed Dividend Growth Fund | | $ | 1,455,178 | | | $ | 6,059,214 | | | $ | — | | | $ | 7,514,392 | |
| International Risk Managed Dividend Growth Fund | | | 149,985 | | | | — | | | | — | | | | 149,985 | |
| SMID Cap Dividend Growth Fund | | | — | | | | — | | | | — | | | | — | |
| Copeland Trust |
| NOTES TO FINANCIAL STATEMENTS (Unaudited) (Continued) |
| May 31, 2019 |
| |
Tax equalization allows a Fund to treat as distribution that portion of redemption proceeds representing a redeeming shareholder’s portion of undistributed taxable and net capital gains. The Copeland Risk Managed Dividend Growth Fund utilized equalization in the amount of $1,325,503 which resulted in a difference between tax distributions and book distributions as disclosed on the Statement of Changes in Net Assets for the period ended November 30, 2018. Net investment income and net realized gains (losses), as disclosed on the Statements of Operations and net assets were not affected by these reclassifications.
As of November 30, 2018, the components of accumulated earnings/(deficit) on a tax basis were as follows:
| | | Undistributed | | | Undistributed | | | Post October Loss | | | Capital Loss | | | Other | | | Unrealized | | | Total | |
| | | Ordinary | | | Long-Term | | | and | | | Carry | | | Book/Tax | | | Appreciation/ | | | Accumulated | |
| | | Income | | | Capital Gains | | | Late Year Loss | | | Forwards | | | Differences | | | (Depreciation) | | | Earnings/(Deficits) | |
| Risk Managed Dividend Growth Fund | | $ | 285,597 | | | $ | 11,473,623 | | | $ | — | | | $ | — | | | $ | — | | | $ | 36,498,097 | | | $ | 48,257,317 | |
| International Risk Managed Dividend Growth Fund | | | — | | | | — | | | | — | | | | (1,211,667 | ) | | | — | | | | (248,913 | ) | | | (1,460,580 | ) |
| SMID Cap Dividend Growth Fund | | | 9,608 | | | | 27,912 | | | | — | | | | — | | | | — | | | | 44,641 | | | | 82,161 | |
The difference between book basis and tax basis undistributed net investment income/(loss), accumulated net realized gain/(loss), and unrealized appreciation/(depreciation) from investments is primarily attributable to the tax deferral of losses on wash sales, and adjustments for partnerships, and C-Corporation return of capital distributions.
At November 30, 2018, the Funds had capital loss carry forwards for federal income tax purposes available to offset future capital gains as follows:
| | | Non-Expiring | |
| | | Short-Term | | | Long-Term | | | Total | |
| Risk Managed Dividend Growth Fund | | $ | — | | | $ | — | | | $ | — | |
| International Risk Managed Dividend Growth Fund | | | 1,211,667 | | | | — | | | | 1,211,667 | |
| SMID Cap Dividend Growth Fund | | | — | | | | — | | | | — | |
Permanent book and tax differences, primarily attributable to the book/tax basis treatment of Fund distributions, resulted in reclassification for the year ended November 30, 2018 as follows:
| | | Paid | | | | |
| | | In | | | Accumulated | |
| | | Capital | | | Earnings (Losses) | |
| Risk Managed Dividend Growth Fund | | $ | 1,325,503 | | | $ | (1,325,503 | ) |
| International Risk Managed Dividend Growth Fund | | | (130,210 | ) | | | 130,210 | |
| SMID Cap Dividend Growth Fund | | | — | | | | — | |
The Funds may assess a short-term redemption fee of 1.00% of the total redemption amount if shareholders sell their shares after holding them for less than 30 days or if shares are redeemed for failure to maintain the Funds’ minimum account balance requirement. The redemption fee is paid directly to the Funds. For six months ended May 31, 2019, the Domestic Fund assessed $477, $73, and $89 in redemption fees for Class A, Class C and Class I shares, respectively and the International Fund assessed $2 in redemption fees for Class A. The SMID Fund did not assess a redemption fee for the period.
| 8. | RECENT ACCOUNTING PRONOUNCEMENTS |
In August 2018, the FASB issued Accounting Standards Update (“ASU”) No. 2018-13, which changes certain fair value measurement disclosure requirements. The new ASU, in addition to other modifications and additions, removes the requirement to disclose the amount and reasons for transfers between Level 1 and Level 2 of the fair value hierarchy, and the policy for the timing of transfers between levels. For investment companies, the amendments are effective for financial statements issued for fiscal years beginning after December 15, 2019, and interim periods within those fiscal years The amendments have been adapted with these financial statements.
| Copeland Trust |
| NOTES TO FINANCIAL STATEMENTS (Unaudited) (Continued) |
| May 31, 2019 |
| |
In August 2018, the Securities and Exchange Commission adopted amendments to certain disclosure requirements under Regulation S-X to conform to US GAAP, including: (i) an amendment to require presentation of the total, rather than the components, of distributable earnings on the Statement of Assets and Liabilities; and (ii) an amendment to require presentation of the total, rather than the components, of distributions to shareholders, except for tax return of capital distributions, if any, on the Statement of Changes in Net Assets. The amendments also removed the requirement for parenthetical disclosure of undistributed net investment income on the Statement of Changes in Net Assets. The amendments have been adapted with these financial statements.
Subsequent events after the date of the Statement of Assets and Liabilities have been evaluated through the date the financial statements were issued. Management has determined that no events or transactions occurred requiring adjustment or disclosure in the financial statements.
| Copeland Trust |
| DISCLOSURE OF FUND EXPENSES (Unaudited) |
| May 31, 2019 |
| |
As a shareholder of the Copeland Risk Managed Dividend Growth Fund, Copeland International Risk Managed Dividend Growth Fund, and the Copeland SMID Cap Dividend Growth Fund, you incur two types of costs (1) transaction costs, including sales charges (loads) on purchase payments and sales (for Class A shares only) and redemption fees; and (2) ongoing costs, including management fees, distribution and/or service (12b-1 fees for Class A and C shares only) fees, shareholder servicing fees and other Fund expenses. This example is intended to help you understand your ongoing costs (in dollars) of investing in the Funds and to compare these costs with the ongoing costs of investing in other mutual funds. Please note, the expenses shown in the tables are meant to highlight ongoing costs only and do not reflect any transactional costs. This example is based on an investment of $1,000 invested for the period of time as indicated in the table below.
Actual Expenses: The first line of the table provides information about actual account values and actual expenses. You may use the information in this line, together with the amount you invested, to estimate the expenses that you paid over the period. Simply divide your account value by $1,000 (for example, an $8,600 account value divided by $1,000 = 8.6), then multiply the result by the number in the first line under the heading entitled “Expenses Paid During the Period” to estimate the expenses you paid on your account during the period.
Hypothetical Examples for Comparison Purposes: The second line of the table below provides information about hypothetical account values and hypothetical expenses based on the Funds’ actual expense ratio and an assumed rate of return of 5% per year before expenses, which is not the Funds’ actual return. The hypothetical account values and expenses may not be used to estimate the actual ending account balance or expenses you paid for the period. You may use this information to compare the ongoing costs of investing in the Funds and other funds. To do so, compare this 5% hypothetical example with the 5% hypothetical examples that appear in the shareholder reports of the other funds.
Please note that the expenses shown in the table are meant to highlight your ongoing costs only and do not reflect any transactional costs, such as sales charges (loads) or redemption fees which may be applicable to your account. Therefore, the second line of the table is useful in comparing ongoing costs only, and will not help you determine the relative total costs of owning different funds. In addition, if these transactional costs were included, your costs would have been higher.
| | | | | | | | | |
| | | | | | | | | Expenses Paid |
| | | Beginning | | Ending | | | | During the |
| | | Account | | Account | | | | Period |
| | | Value | | Value | | Annualized | | (12/1/18 to |
| | | (12/1/18) | | (5/31/19) | | Expense Ratio | | 5/31/19) |
| Actual (a) | | | | | | | | |
| Copeland Risk Managed Dividend Growth Fund | | | | | | | | |
| Class A | | $1,000.00 | | $954.30 | | 1.45% | | $7.06 |
| Class C | | $1,000.00 | | $951.20 | | 2.20% | | $10.70 |
| Class I | | $1,000.00 | | $956.10 | | 1.30% | | $6.34 |
| Copeland International Risk Managed Dividend Growth Fund | | | | | | | | |
| Class A | | $1,000.00 | | $1,001.70 | | 1.60% | | $7.99 |
| Class C | | $1,000.00 | | $997.30 | | 2.35% | | $11.70 |
| Class I | | $1,000.00 | | $1,001.70 | | 1.24% | | $6.19 |
| Copeland SMID Cap Dividend Growth Fund | | | | | | | | |
| Class A (b) | | $1,000.00 | | $1,039.60 | | 1.82% | | $5.55 |
| Class I | | $1,000.00 | | $1,041.10 | | 0.95% | | $4.83 |
| Hypothetical (a) | | | | | | | | |
| (5% return before expenses) | | | | | | | | |
| Copeland Risk Managed Dividend Growth Fund | | | | | | | | |
| Class A | | $1,000.00 | | $1,017.70 | | 1.45% | | $7.29 |
| Class C | | $1,000.00 | | $1,013.96 | | 2.20% | | $11.05 |
| Class I | | $1,000.00 | | $1,018.45 | | 1.30% | | $6.54 |
| Copeland International Risk Managed Dividend Growth Fund | | | | | | | | |
| Class A | | $1,000.00 | | $1,016.95 | | 1.60% | | $8.05 |
| Class C | | $1,000.00 | | $1,013.21 | | 2.35% | | $11.80 |
| Class I | | $1,000.00 | | $1,018.75 | | 1.24% | | $6.24 |
| Copeland SMID Cap Dividend Growth Fund | | | | | | | | |
| Class A | | $1,000.00 | | $1,015.85 | | 1.82% | | $9.15(c) |
| Class I | | $1,000.00 | | $1,020.19 | | 0.95% | | $4.78 |
| (a) | Expenses are equal to the average account value over the period, multiplied by the Fund’s annualized expense ratio, multiplied by the number of days in the six month period ended May 31 , 2019 (182) divided by the number of days in the fiscal year (365). |
| (b) | Expenses Paid During Period are equal to Fund’s annualized expense ratios of 1.82% for Copeland SMID Cap Dividend Growth Fund Class A multiplied by the number of days in the period from February 11, 2019 through May 31, 2019 (109) divided by the number of days in the fiscal year (365). |
| (c) | Hypothetical expenses paid during the period assumes a starting date of December 1, 2018. |
Considerations Regarding the Management Agreement
On May 15, 2019 the Board of Trustees of Copeland Trust the (“Trust”), including all of Trustees who are not interested persons under the Investment Company Act of 1940, as amended (the “Independent Trustees”), considered the continuance of the Management Agreement between the Trust, on behalf of the Copeland Risk Managed Dividend Growth Fund (the “Domestic Fund”), Copeland International Risk Managed Dividend Growth Fund (the “International Fund”), Copeland SMID Cap Dividend Growth Fund (the “SMID Cap Fund”) and Copeland Capital Management, LLC (“Copeland”). The Board reviewed and considered, among other items: (1) a memorandum from independent counsel setting forth the Trustees’ fiduciary duties, responsibilities and the factors the Trustees should consider in their evaluation of the Management Agreement; and (2) a report and presentation by Copeland that described, among other things: (a) the nature, extent and quality of the services provided by Copeland to each Fund and the experience and qualifications of the personnel providing those services; (b) its organizational structure, financial information, level of insurance coverage and Form ADV; (c) its investment process and the strategy of each Fund; (d) its types of clients and assets under management;(e) its brokerage, soft dollar commission and trade allocation policies, including the types of research and services obtained in connection with soft dollar commissions; (f) the investment performance of each Fund as compared to its applicable benchmark index, Copeland’s other similarly managed accounts, if any, and relevant peer group; (g) its advisory fee arrangement with the Domestic Fund as compared to its relevant peer group and Copeland’s other similarly managed account; (h) its advisory fee arrangement with the International Fund as compared to its relevant peer group; (i) its advisory fee arrangement with the SMID Cap Fund as compared to its relevant peer group and Copeland’s other similarly managed account; (j) the contractual fee and expense waiver arrangement with each Fund; (k) its compliance program to monitor and review investment decisions and to prevent and detect violations of each Fund’s investment policies and limitations, as well as federal securities laws and conflicts of interest assessments, its business continuity and disaster recovery plan and information security system; (1) the costs of the services provided and the profits realized by Copeland from its relationships with each Fund; and (m) the extent to which economies of scale are relevant as each Fund grows, and whether the fee levels reflect these economies of scale to the benefit of shareholders. The Trustees discussed the written materials and Copeland’s oral presentation, together with information provided to the Trustees over the course of the year. In their deliberations, the Trustees did not identify any single piece of information that was all-important or controlling.
The Trustees, including all of the Independent Trustees, reached the following conclusions, among others, regarding Copeland and the Management Agreement. As to the nature, extent and quality of the services provided by Copeland to each Fund, its financial condition and the experience and qualifications of the portfolio managers, the Trustees determined that Copeland has the capabilities, resources and personnel necessary to manage each Fund and that they were satisfied with the quality of the services provided by Copeland in advising each Fund.
As to the costs of the services provided and the profits realized by Copeland, as discussed at the meeting, the Trustees concluded that they were satisfied that Copeland’s level of profitability from its relationships with the Domestic Fund seemed reasonable. The Trustees concluded that the negative profitability with respect to each of the International Fund and SMID Cap Fund was not a concern given each Fund’s relatively small asset base and Copeland’s overall financial strength. The Trustees also concluded that the benefits derived by Copeland from managing each Fund, including how it uses soft dollars, and the way in which it conducts portfolio transactions and selects brokers, seemed reasonable.
The Board also considered the management fees and expenses of each Domestic and International Funds’ Class A shares and the management fees and expenses of the SMID Cap Fund’s Class I shares. The Board concluded that, based on the information discussed at the meeting, each Fund’s management fee and expenses, taking into account Copeland’s agreement to waive fees and reimburse expenses to limit the expenses of each Fund, were reasonable as compared to the fees and expenses of comparable funds and, with respect to the Domestic Fund and the SMID Cap Fund, Copeland’s similarly managed accounts.
The Board also considered the investment performance of each Fund against its applicable benchmark index, peer group and with respect to the Domestic Fund and SMID Cap Fund, similarly managed accounts. Based on this information, the Trustees concluded that the performance of each Fund and comparable strategy, as applicable, for the periods shown is generally mixed (performance for certain periods was higher than the comparative performance information, and in other cases it was lower).
As to economies of scale, the Trustees noted that the Management Agreement does not contain breakpoints that reduce the fee rate as assets grow. The Trustees considered the current asset levels of each Fund and Copeland’s agreement to waive fees and reimburse expenses as a means to limit each Fund’s expenses and concluded that, at this time, the absence of breakpoints was reasonable.
Based upon the Trustees’ deliberations and evaluation of the information described above, the Trustees, and separately by all of the Independent Trustees, determined that the terms of the Management Agreement were reasonable and fair to each Fund and its shareholders, and voted to renew the Management Agreement with respect to the each Fund.
| PRIVACY notice |
| |
| FACTS | WHAT DOES COPELAND TRUST DO WITH YOUR PERSONAL INFORMATION? |
| | |
| Why? | Financial companies choose how they share your personal information. Federal law gives consumers the right to limit some but not all sharing. Federal law also requires us to tell you how we collect, share, and protect your personal information. Please read this notice carefully to understand what we do. |
| | |
| What? | The types of personal information we collect and share depend on the product or service you have with us. This information can include: ■ Social Security number ■ Purchase History ■ Assets ■ Account Balances ■ Retirement Assets ■ Account Transactions ■ Transaction History ■ Wire Transfer Instructions ■ Checking Account Information When you areno longer our customer, we continue to share your information as described in this notice. |
| | |
| How? | All financial companies need to share customers’ personal information to run their everyday business. In the section below, we list the reasons financial companies can share their customers’ personal information; the reasons Copeland Trust chooses to share; and whether you can limit this sharing. |
| | | |
| Reasons we can share your personal information: | Does Copeland
Trust share? | Can you limit this sharing? |
For our everyday business purposes – such as to process your transactions, maintain your account(s), respond to court orders and legal investigations, or report to credit bureaus | Yes | No |
For our marketing purposes – to offer our products and services to you | No | We don’t share |
| For joint marketing with other financial companies | No | We don’t share |
For our affiliates’ everyday business purposes – information about your transactions and experiences | No | We don’t share |
For our affiliates’ everyday business purposes – information about your creditworthiness | No | We don’t share |
| For nonaffiliates to market to you | No | We don’t share |
| Questions? | Call 1-888-9-COPELAND (1-888-926-7352) |
| Who we are: |
| Who is providing this notice? | Copeland Trust |
| What we do: |
| How does Copeland Trust protect my personal information? | To protect your personal information from unauthorized access and use, we use security measures that comply with federal law. These measures include computer safeguards and secured files and buildings. Our service providers are held accountable for adhering to strict policies and procedures to prevent any misuse of your nonpublic personal information. |
| How does Copeland Trust collect my personal information? | We collect your personal information, for example, when you ■ Open an account ■ Provide account information ■ Give us your contact information ■ Make deposits or withdrawals from your account ■ Make a wire transfer ■ Tell us where to send the money ■ Tells us who receives the money ■ Show your government-issued ID ■ �� Show your driver’s license We also collect your personal information from other companies. |
| Why can’t I limit all sharing? | Federal law gives you the right to limit only ■ Sharing for affiliates’ everyday business purposes – information about your creditworthiness ■ Affiliates from using your information to market to you ■ Sharing for nonaffiliates to market to you State laws and individual companies may give you additional rights to limit sharing. |
| Definitions: |
| Affiliates | Companies related by common ownership or control. They can be financial and nonfinancial companies. ■ Copeland Trust does not share with our affiliates. |
| Nonaffiliates | Companies not related by common ownership or control. They can be financial and nonfinancial companies
■ Copeland Trust does not share with nonaffiliates so they can market to you. |
| Joint marketing | A formal agreement between nonaffiliated financial companies that together market financial products or services to you.
■ Copeland Trust does not jointly market. |
| Investment Adviser |
| Copeland Capital Management, LLC |
| 161 Washington Street, Suite 1325 |
| Conshohocken, PA 19428 |
| |
| Distributor |
| Northern Lights Distributors, LLC |
| 17605 Wright Street |
| Omaha, NE 68130 |
| |
| Legal Counsel |
| Drinker Biddle & Reath, LLP |
| Once Logan Square, Suite 2000 |
| Philadelphia, PA 19103 |
| |
| Independent Registered Public Accounting Firm |
| Tait, Weller & Baker LLP |
| Two Liberty Place |
| 50 South 16th Street, Suite 2900 |
| Philadelphia, PA 19102 |
| |
| Transfer Agent |
| Gemini Fund Services, LLC |
| 17605 Wright Street, Suite 2 |
| Omaha, NE 68130 |
| |
| Administrator |
| Gemini Fund Services, LLC |
| 80 Arkay Drive Suite 110 |
| Hauppauge, NY 11788 |
| |
| Custodian |
| The Northern Trust Company |
| 50 South LaSalle Street |
| Chicago, Il 60603 |
| |
How to Obtain Proxy Voting Information
Information regarding how the Funds vote proxies relating to portfolio securities for the 12 month period ended June 30 as well as a description of the policies and procedures that the Funds used to determine how to vote proxies is available without charge, upon request, by calling 1-888-9-COPELAND or by referring to the Securities and Exchange Commission’s (“SEC”) website athttp://www.sec.gov.
How to Obtain 1st and 3rd Fiscal Quarter Portfolio Holdings
The Funds file their complete schedule of portfolio holdings with the SEC for the first and third quarters of each fiscal year on Form N-Q. Form N-Q is available on the SEC’s website athttp://www.sec.gov and may be reviewed and copied at the SEC’s Public Reference Room in Washington, DC (1-800-SEC-0330). The information on Form N-Q is available without charge, upon request, by calling 1-888-9-COPELAND. Form N-Q is being rescinded. Once form N-Q is rescinded, disclosure of the Funds’ complete holdings will be required to be made monthly on Form N-PORT, with every third month made available to the public by the SEC 60 days after the end of the Funds’ fiscal quarter.
Item 2. Code of Ethics.Not required for semi-annual reports.
Item 3. Audit Committee Financial Expert.Not required for semi-annual reports.
Item 4. Principal Accountant Fees and Services.Not required for semi-annual reports.
Item 5. Audit Committee of Listed Companies.Not applicable to open-end investment companies.
Item 6. Schedule of Investments.
| (a) | Schedule of investments in securities of unaffiliated issuers is included under Item 1. |
Item 7. Disclosure of Proxy Voting Policies and Procedures for Closed-End Funds. Not applicable to open-end investment companies.
Item 8. Portfolio Managers of Closed-End Funds. Not applicable to open-end investment companies.
Item 9. Purchases of Equity Securities by Closed-End Funds. Not applicable to open-end investment companies.
Item 10. Submission of Matters to a Vote of Security Holders. None
Item 11. Controls and Procedures.
(a) Based on an evaluation of the Registrant’s disclosure controls and procedures (as defined in rule 30a-3(c) under the Investment Company Act of 1940) as of the filing date of this report, Registrant’s principal executive officer and principal financial officer found such disclosure controls and procedures to be effective.
(b) There were no significant changes in the Registrant’s internal control over financial reporting that occurred during the Registrant’s last fiscal half-year that have materially affected, or are reasonably likely to materially affect, the Registrant’s internal control over financial reporting.
Item 12. Disclosure of Securities Lending Activities for Closed-End Management Investment Companies.Not applicable to open-end investment companies
Item 13. Exhibits.
(a)(1) Any code of ethics.
(a)(2) Certification required by Section 302 of the Sarbanes-Oxley Act of 2002 is filed herewith.
(a)(3) Not applicable for open-end investment companies.
(b) Certification required by Section 906 of the Sarbanes-Oxley Act of 2002 is filed herewith.
SIGNATURE
Pursuant to the requirements of the Securities Exchange Act of 1934 and the Investment Company Act of 1940, the Registrant has duly caused this report to be signed on its behalf by the undersigned, thereunto duly authorized.
Copeland Trust
By: /s/ Mark W. Giovanniello
Mark W. Giovanniello, Principal Executive Officer
Date 8/1/2019
Pursuant to the requirements of the Securities Exchange Act of 1934 and the Investment Company Act of 1940, this report has been signed below by the following persons on behalf of the Registrant and in the capacities and on the dates indicated.
By: /s/ Mark W. Giovanniello
Mark W. Giovanniello, Principal Executive Officer
Date 8/1/2019
By: /s/ Steven J. Adams
Steven J. Adams, Treasurer and Principal Financial Officer
Date 8/1/2019