united states
securities and exchange commission
washington, d.c. 20549
form n-csr
certified shareholder report of registered management
investment companies
Investment Company Act file number 811-22483
Copeland Trust
(Exact name of Registrant as specified in charter)
Eight Tower Bridge, 161 Washington St., Suite #1325 Conshohocken, PA 19428
(Address of principal executive offices) (Zip code)
Gemini Fund Services, LLC, 80 Arkay Drive Suite 10, Hauppauge, NY 11788
(Name and address of agent for service)
Registrant's telephone number, including area code: (631) 470-2619
Date of fiscal year end: 11/30
Date of reporting period: 5/31/20
Item 1. Reports to Stockholders.
| | | |
| | | |
| | Copeland
Risk Managed
Dividend Growth Fund Copeland
International Risk Managed
Dividend Growth Fund Copeland
SMID Cap
Dividend Growth Fund | |
| | | |
| | Semi-Annual Report May 31, 2020 | |
| | | |
| | Beginning on January 1, 2021, as permitted by regulations adopted by the Securities and Exchange Commission, paper copies of the Fund’s shareholder reports like this one will no longer be sent by mail, unless you specifically request paper copies of the reports. Instead, the reports will be made available on the Fund’s website www.copelandfunds.com, and you will be notified by mail each time a report is posted and provided with a website link to access the report. If you already elected to receive shareholder reports electronically, you will not be affected by this change and you need not take any action. You may elect to receive shareholder reports and other communications from the Fund electronically by contacting your financial intermediary (such as a broker-dealer or bank) or, if you are a direct investor, by following the instructions included with paper Fund documents that have been mailed to you. You may elect to receive all future reports in paper free of charge. You can inform the Fund or your financial intermediary that you wish to continue receiving paper copies of your shareholder reports by calling the Fund at 1-888-9-COPELAND (1-888-926-7352) or by contacting your financial intermediary. Your election to receive reports in paper will apply to all Copeland Funds you hold directly or through your financial intermediary. Investor Information: 1-888-9-COPELAND This report and the financial statements contained herein are submitted for the general information of shareholders and are not authorized for distribution to prospective investors unless preceded or accompanied by an effective prospectus. Nothing herein contained is to be considered an offer of sale or solicitation of an offer to buy shares of the Funds. Such offering is made only by prospectus, which includes details as to offering price and other material information. Distributed by Northern Lights Distributors, LLC
Member FINRA | |
Copeland Risk Managed Dividend Growth Fund
Semi-Annual Report
May 31, 2020
Dear Fellow Shareholders,
Copeland Capital Management is pleased to review the performance of the Copeland Risk Managed Dividend Growth Fund from December 1, 2019 through May 31, 2020. Unless otherwise stated herein, all data and statistics that follow are as of May 31, 2020.
During the six-month period, the Fund fell -10.38%, lagging the -2.1% retreat posted by the S&P 500 Index. While the Fund performed in line with the benchmark over the first four months of the period, the U.S. outbreak of the Coronavirus precipitated a sharp downturn in the equity market during the month of March. All nine of our proprietary sector signals registered a negative reading as we moved into April, leading the Fund to rein in its overall equity exposure level to 50%. Defying all expectations, the market staged a sharp V-shaped rally of over +18% during the months of April and May. As such the entire performance shortfall for the Fund relative to the broader S&P 500 Index was attributable to our cash position over the closing two months of the period.
Our stock selection in the Financials sector of the market bolstered Fund returns while those in the Energy sector were a drag. Financials constituent MarketAxess Holdings (MKTX, 1.5% of holdings) was the top performing holding, advancing strongly during the period. This electronic fixed-income trading platform provider posted strong first quarter earnings results bolstered by high volatility across most segments of the bond market, share gains on its open trading platform and demand for a simplified liquidity provider platform from the large number of people working from home. More recently, aggregate bond trading volumes during the month of May surged 48% versus the prior year as all four major product lines registered market share gains. A second standout performer, Consumer Discretionary constituent Tractor Supply (TSCO, 1.1% of holdings), also rose sharply during the period. The largest rural lifestyle retailer in the U.S. followed up a strong first quarter earnings report with robust interim second quarter guidance. The company forecast record sales growth of 24% to 29% fueled by same-store sales growth of 20% to 25% including substantial growth in the e-commerce business. As an essential, needs-based retailer Tractor Supply has remained open throughout the pandemic and has filled the void left by other retailers which have been forced to shutter.
On the downside, Fund holding Diamondback Energy (FANG, 0.0% of holdings) was the worst performer in the Fund, falling steeply while we held a position in the shares. The oil and gas exploration company was sharply impacted by an unfolding oil price war between Russia and Saudi Arabia which triggered a halving of the price of West Texas Intermediate (“WTI”) crude oil from $61 per barrel to start the year to under $30 per barrel during the month of March. Amidst fears surrounding a potential dividend cut we elected to exit our position in the shares. Aarons (AAN, 0.0% of holdings) was also a laggard, falling sharply while we held a position in the shares. The lease-to-own retailer of furniture, electronics, computers and appliances reported solid earnings in February, however weaker than expected guidance weighed upon the shares. The company unveiled expectations for a same-store sales decline of between 2% and 4% in the upcoming quarter. Brick and mortar EBITDA* in the coming year was expected to fall by $36 million or roughly 20%. In light of the unfolding challenges in the retail space, highlighted by many stores being forced to close, we opted to exit our position during the period.
Coming off a robust gain of over 31% during 2019, the equity market began 2020 in fine fashion. Unemployment remained at record lows, the economy continued to expand at a healthy pace and corporate earnings plumbed record levels. Things began to take a turn for the worse in late February and over the course of March as the Coronavirus spread to Europe and ultimately the United States. Widespread stay at home orders were implemented, stores and restaurants were closed, airline travel ground to a halt and for the first time ever a self-inflicted recession was necessary in an attempt to keep the populace safe. When all was said and done, the market had suffered its fastest 30% decline in history, falling 34% from an all-time high in late February to a low for the year on March 23, 2020.
From the aforementioned market low to the period close at the end of May, the market ricocheted higher by a sharp 36%. Spurring the market was unprecedented fiscal and monetary stimulus which instilled confidence that government and monetary authorities will do whatever is necessary to engineer an economic recovery. Said optimism surrounding a V-shaped economic recovery, initial success in reopening parts of the country, and hopefulness surrounding an eventual Coronavirus vaccine and development of effective treatments coalesced to push the market higher. Despite a 15% decline in first quarter 2020 S&P 500 Index earnings and expectations for a steeper decline in the current quarter, the market appears to be increasingly pricing towards what we believe may be a quick rebound over the latter half of the year and into 2021. According to the Bureau of Labor Statistics, the unemployment rate, which leapt from 4.4% in February to 14.7% in March, improved to 13.3% in the month of May as the economy regained 2.5 million jobs. Retail sales jumped 17.7% in May, the largest sequential increase since 1992.
As the period drew to a close, the Fund maintained a 50% invested position as each of our proprietary signals continues to flash a negative reading given the magnitude of the recent downdraft. The market appears to be pricing in a seamless recovery in the months ahead. That said, the risk of a second wave of the Coronavirus pandemic remains. Unemployment and stimulus benefits, which have helped fuel the unfolding recovery, are set to expire in July. In our opinion, economic activity, while starting to rebound, is unlikely to attain pre-virus levels for years to come as certain market segments remain hampered over the long term.
Irrespective of near-term market trends, we at Copeland remain intently focused on the long-term prospects of companies held in the Fund, with a particular emphasis on the capacity of each to continue to grow the dividend over time. We continue to favor companies that we believe retain noteworthy competitive advantages in their respective industries, are cash generative, and are overseen by managements with capital allocation discipline and an eye on the shareholder. Given the magnitude of the recent market snapback and the unprecedented uncertainty present today, we take solace in our defensive positioning at present. As the economy ultimately regains its footing, we look forward to expanding our investment profile in an attempt to capitalize upon the potential gains afforded by a carefully selected portfolio of dividend growth equities.
Thank you for the confidence you have placed in Copeland and for your investment in the Copeland Risk Managed Dividend Growth Fund.
The views and opinions expressed in this letter are subject to change and may not be relied upon for investment advice. No forecasts can be guaranteed. The Fund holdings discussed herein are for informational purposes only and should not be perceived as investment recommendations by Copeland Capital Management. Holdings are subject to change, may not represent current holdings and are subject to risk. Performance data quoted here represents past performance. Past performance is no guarantee of future results. The return quoted reflects fee waivers and expense reimbursements in effect and would have been lower in their absence. Current performance may be lower or higher than the performance quoted above. The risks of investing in the Copeland Funds vary from fund to fund; to see the risks of investing in an individual fund, please refer to that fund’s latest prospectus.
You cannot invest directly in any index. Index returns do not include a deduction for fees or expenses. The S&P 500® Index is a market-capitalization-weighted index of the stocks of 500 leading companies in major industries of the U.S. economy.
| * | EBITDA is an acronym for “Earnings Before Interest, Taxes, Depreciation and Amortization.” |
1131-NLD-7/21/2020
Copeland International Risk Managed Dividend Growth Fund
Semi-Annual Report
May 31, 2020
Dear Fellow Shareholders,
Copeland Capital Management is pleased to review the performance of the Copeland International Risk Managed Dividend Growth Fund from December 1, 2019 through May 31, 2020. Unless otherwise stated herein, all data and statistics that follow are as of May 31, 2020.
The Class I shares of the Copeland International Risk Managed Dividend Growth Fund delivered a return of -13.1% during the semi-annual period ended May 31, 2020, which compared to a -11.7% return recorded by the Fund’s benchmark, the MSCI World ex-US Index. Although non-US equity markets have rebounded sharply from the March 2020 lows related to the Coronavirus, the Fund remains in a defensive position. Our quantitative sector signals continue to indicate an above-average risk for market declines. The primary Fund objective remains the preservation of principal during challenging market conditions, while also providing upside exposure to the international equity asset class during stable to rising markets.
The minor shortfall in relative performance during the first half of the Fund’s fiscal year is a result of its allocation to cash and fixed-income investments. The Fund was fully invested in equities at the outset of the period, and then shifted to a 50% allocation to cash/fixed income following the sharp sell-off in equity markets in the first three months of 2020. Accordingly, while the Fund’s dividend growth methodology contributed to more resilient performance during the three-month sell-off ending in March (the Fund returned -19.7% vs. the -23.3% decline for the MSCI ex-US World Index), retaining only half of the overall exposure to equities during the market rebound in April and May proved to be a headwind for relative performance.
The Fund benefited from favorable stock selection during the semi-annual period, with noteworthy contributions in the Industrials, Basic Materials, and Consumer Staples sectors of the market. Offsetting the boost from these segments was lagging performance within the Health Care sector, the strongest performing area of the market during the six-month period. Among Industrial holdings, relative performance was boosted by holdings RELX (1.06% of holdings), a UK-based commercial services company, and Secom (0.99% of holdings), the Japanese security services company. Both proved economically resilient during the Coronavirus related weakness in demand. In contrast, holdings in the civil aerospace industry, Safran (0.0% of holdings) in France, and MTU Aero Engines (0.69% of holdings) in Germany, detracted from performance due to the collapse in air travel. Within the Basic Materials sector, all holdings outperformed the market during the period, with relative performance most favorable in Croda International (0.88% of holdings) in the U.K., and Denmark’s Novozymes (0.96% of holdings), ingredients companies both enjoying stable end-market demand from their customers. Consumer Staples holding Cosmos Pharmaceutical (0.82% of holdings), a Japanese drug store retailer, was the primary driver of contribution within the sector, as traffic and same-store sales comparisons fared well during the slowdown. Balancing this out was the lagging performance of global brewer Heineken (0.0% of holdings) in the Netherlands, which suffered a material decline in on-trade demand from the broad economic lockdowns around the world. On a final note, while in general it was challenging to keep up with the overall performance of the Health Care sector, Fund holdings in Ireland domiciled devices giant Medtronic (1.0%) and German hospital operator Fresenius (0.9%) detracted from relative performance due to declines in elective medical procedures during the global lockdown.
As we look to the remainder of 2020, we expect market trends to be driven by the conflicting forces of unprecedented global Central Bank stimulus, substantially greater even than what occurred during the 2008 financial crisis, and the unquantifiable macroeconomic consequences of the global Coronavirus pandemic. While we are encouraged by many of the initial signs of recovery around the world, with the majority of global gross domestic product (“GDP”) driven by personal consumption, we do not believe a sustainable economic expansion is possible until consumers feel safe to return to life as normal. This could be dependent upon the development of a vaccine and effective treatments, or more simply a function of successful testing and efforts to control the spread of the virus. Regardless, given the rise in global equity share prices since the March lows, by far the sharpest and most sizable market rebound in the modern era, we believe that current investor expectations may be vulnerable to disappointment.
In the face of the current market backdrop, we at Copeland remain as focused as ever on the long-term fundamental potential of the companies held in the Fund, as guided by what we view as the prospects for each to deliver continued dividend growth over time. Our investment approach favors cash-generative businesses with what we believe are decided competitive advantages versus industry peers, and management commitment to capital allocation discipline. When overall market conditions improve, as guided by our quantitative risk management techniques, the Fund will seek increased equity exposure in a diversified mix of dividend-growth stocks in favorable sectors of the market.
Thank you for your confidence in Copeland Capital Management, and for your investment in the Copeland International Risk Managed Dividend Growth Fund.
The views and opinions expressed in this letter are subject to change and may not be relied upon for investment advice. No forecasts can be guaranteed. The Fund holdings discussed herein are for informational purposes only and should not be perceived as investment recommendations by Copeland Capital Management. Holdings are subject to change, may not represent current holdings and are subject to risk. Performance data quoted here represents past performance. Past performance is no guarantee of future results. The return quoted reflects fee waivers and expense reimbursements in effect and would have been lower in their absence. Current performance may be lower or higher than the performance quoted above. The risks of investing in the Copeland Funds vary from fund to fund; to see the risks of investing in an individual fund, please refer to that fund’s latest prospectus.
You cannot invest directly in any index. Index returns do not include a deduction for fees or expenses. The MSCI World ex-US® Index measures the performance of global equity markets, excluding the United States.
1131-NLD-7/21/2020
Copeland SMID Cap Dividend Growth Fund
Semi-Annual Report
May 31, 2020
Dear Fellow Shareholders,
Copeland Capital Management is pleased to review the performance of the Copeland SMIDCap Dividend Growth Fund from December 1, 2019 through May 31, 2020. Unless otherwise stated herein, all data and statistics that follow are as of May 31, 2020.
During the six-month period, Class I shares of the Fund delivered a -9.19% return, versus the -11.72% decline posted by the Russell 2500 Index. The long bull market ended during the period as the Coronavirus spread across the globe, with severe negative consequences from both a health and market perspective. The market decline was incredibly swift and deep as the benchmark declined more than 40% in a little over a month from mid-February through mid-March. Governments and the health care industry were called to action, with their powerful response enabling a remarkable stock market recovery that continued through the period’s end. SMID Cap equities were more significantly impaired than their larger cap counterparts during the decline, and while they fully participated in the rebound, the result was still a deficit for the period as described above. Domestically, unprecedented fiscal and monetary stimulus was quickly enacted that supported many terminated employees and impaired businesses, while the Federal Reserve stepped in to ensure that bond markets and banks kept the lending markets functioning. Meanwhile the selfless actions of health care industry front-line workers in combination with progress on the scientific front have led to improved outcomes for patients, and optimism that a vaccine may be available quickly enough to avoid moredire economic consequences.
Our stock selection in the Financial sector most significantly aided Fund returns. MarketAxess Holdings (MKTX, 1.7% of Fund holdings), the leading electronic bond trading platform, outperformed after reporting strong first quarter earnings results, backed by elevated interest rate spread volatility, the best access to liquidity for traders working from home and continuing share gains on their open trading platform that allows both buy and sell-side bond investors to interface directly. Strong monthly volume growth continued in April and May. The company also announced an impressive 18% dividend hike, which we believe demonstrates confidence from management. MSCI Inc. (MSCI, 0.0%), a leading equity index provider, also performed well, recovering strongly after an initial pandemic-driven drop. The stability of MSCI’s business model, even during volatile periods, with more than 80% of revenues driven by index subscriptions, was on display during the latter part of the period as they reported solid first quarter results. MSCI was sold from the Fund during the period as its market capitalization exceeded our parameters, which are guided by the characteristics of the Russell 2500 SMID Cap benchmark. Finally, Discover Financial Services (DFS, 1.4%) was a leading performer during the period, shortly after our purchase near the depths of the pandemic driven market correction. Given Discover’s emphasis on the highest credit quality customers, in combination with the fiscal stimulus, we believe that the company is well-positioned to manage through the current employment downturn with manageable losses and adequate dividend coverage.
The Coronavirus pandemic has had significant implications for the Health Care sector, leading to widely diverging fortunes among industries. While governments flooded the biotechnology and pharmaceutical industry with investment in an effort to accelerate the development of therapeutics and vaccines to battle the virus, many facilities, devices and services companies were impeded as non-essential, non-Coronavirus related medical procedures were cancelled. The Fund’s dividend growth focus leads us largely into the latter group, while dividends are virtually non-existent among development stage, smaller capitalization, biotechnology stocks. As a result, stock selection was a headwind in the sector during the period. Cantel
Medical (CMD, 1.2%), a leading provider of sterilization equipment and supplies used in dental offices, colonoscopy procedures and dialysis centers, was severely impacted as procedures were cancelled and facilities closed to slow the virus’ spread or to allow facilities to handle Coronavirus patients. Similarly, U.S. Physical Therapy Inc. (USPH, 1.0%), a leading provider of physical therapy services, was forced to close most of its facilities leading to significant layoffs among its employees. Not all dividend growing health care companies were impaired, however. Holdings such as Resmed Inc. (RMD, 1.9%), which sells respiratory assist devices, Quest Diagnostics (DGX, 1.7%), which performs laboratory testing services, and Luminex Corp (LMNX, 1.1%), which produces the diagnostic tests that are used in these labs to diagnose respiratory illnesses, were all significant beneficiaries of virus related spending.
As we look to the remainder of 2020, we expect market trends to be driven by the conflicting forces of unprecedented global Central Bank stimulus, substantially greater even than what occurred during the 2008 financial crisis, and the unquantifiable macroeconomic consequences of the global pandemic. While we are encouraged by many of the initial signs of recovery around the world, with the majority of global gross domestic product (“GDP”) driven by personal consumption, we do not believe a sustainable economic expansion is possible until consumers feel safe to return to life as normal. This could be dependent upon the development of a vaccine and development of effective treatments, or more simply a function of successful testing and efforts to control the spread of the virus.
In the face of the current uncertain market backdrop,we at Copeland remain intently focused on the long -term prospects of the companies held in the Fund, with an emphasis on the capacity of each to continue to grow its dividend over time. We continue to favor companies that we believe retain noteworthy competitive advantages in their respective industries, are cash generative, and are overseen by managements with capital allocation discipline and an eye on the shareholder. We believe this approach puts the Fund in the best position in seeking to outperform the market while taking on less risk.
Thank you for the confidence you have placed in Copeland and for your investment in the Copeland SMID Cap Dividend Growth Fund.
The views and opinions expressed in this letter are subject to change and may not be relied upon for investment advice. No forecasts can be guaranteed. The Fund holdings discussed herein are for informational purposes only and should not be perceived as investment recommendations by Copeland Capital Management. Holdings are subject to change, may not represent current holdings and are subject to risk. Performance data quoted here represents past performance. Past performance is no guarantee of future results. The return quoted reflects fee waivers and expense reimbursements in effect and would have been lower in their absence. Current performance may be lower or higher than the performance quoted above. The risks of investing in the Copeland Funds vary from fund to fund; to see the risks of investing in an individual fund, please refer to that fund’s latest prospectus.
You cannot invest directly in any index. Index returns do not include a deduction for fees or expenses. The Russell 2500 Index is comprised of the bottom 2500 companies in the Russell 3000 Index. The Russell 3000 Index measures the performance of the 3000 largest U.S. companies based on total market capitalization, which represents approximately 98% of the investable U.S. equity market.
1131-NLD-7/21/2020
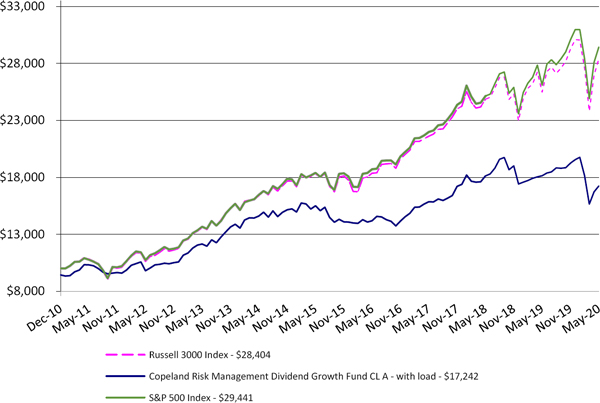
| Copeland Risk Managed Dividend Growth Fund |
| Portfolio Review (Unaudited) |
| December 28, 2010* through May 31, 2020 |
Performance of a $10,000 Investment (as of May 31, 2020)
| Average Annualized | | | | Since | Since | Since |
| Total Returns as of | Six | | | Inception | Inception | Inception |
| May 31, 2020 | Months | One Year | Five Year | Class A* | Class C* | Class I* |
| Copeland Risk Managed | | | | | | |
| Dividend Growth Fund: | | | | | | |
| Class A | | | | | | |
| Without sales charge | (10.38)% | (4.91)% | 2.15% | 6.62% | — | — |
| With sales charge+ | (15.54)% | (10.38)% | 0.94% | 5.95% | — | — |
| Class C | (10.62)% | (5.60)% | 1.40% | — | 6.33% | — |
| Class I | (10.21)% | (4.75)% | 2.32% | — | — | 6.10% |
| S&P 500 Index | (2.10)% | 12.84% | 9.86% | 12.14% | 13.18% | 12.36% |
| Russell 3000 Index | (2.91)% | 11.46% | 9.17% | 11.72% | 12.85% | 11.88% |
| * | Class A shares commenced operations on December 28, 2010. Class C commenced operations on January 5, 2012. Class I commenced operations March 1, 2013. |
| + | Adjusted for initial maximum sales charge of 5.75%. |
The S&P 500 Index is an unmanaged market capitalization-weighted index which is comprised of 500 of the largest U.S. domiciled companies and includes the reinvestment of all dividends. Investors cannot invest directly in an index or benchmark.
The Russell 3000 Index measures the performance of the largest 3000 U.S. companies representing approximately 98% of the investable U.S. equity market and includes the reinvestment of all dividends. Investors cannot invest directly in an index or benchmark.
Past performance is not predictive of future results. The investment return and principal value of an investment will fluctuate. An investor’s shares, when redeemed, may be worth more or less than the original cost. The performance and returns do not reflect the deduction of taxes that a shareholder may pay on Fund distributions or redemption of Fund shares. Total return is calculated assuming reinvestment of all dividends and distributions. Total returns would have been lower had the adviser not waived its fees and reimbursed a portion of the Fund’s expenses. For performance information current to the most recent month-end please call toll-free 1-888-9-COPELAND (1-888-926-7352). Additional information can be found by visiting our website, www.copelandfunds.com. The Fund’s gross annual operating expense ratio, as stated in the current prospectus, is 1.74%, 2.49%, and 1.58%,for Class A, Class C, and Class I shares, respectively, and its net annual operating expense ratio is 1.45%, 2.20%, and 1.30%, for Class A, Class C, and Class I shares, respectively. These ratios can fluctuate and may differ from the expense ratios disclosed in the Financial Highlights section of this report. The Fund’s investment adviser has contractually agreed to reduce its fees and/or absorb expenses of the Fund, at least until March 31, 2021, to ensure that total annual fund operating expenses after fee deferral and/or reimbursement (exclusive of any taxes, leverage interest, borrowing interest, brokerage commissions, expenses incurred in connection with any merger or reorganization, dividend expense on securities sold short, acquired fund fees and expenses or extraordinary expenses such as litigation) will not exceed 1.45%, 2.20% and 1.30% of Class A, Class C and Class I shares, respectively, subject to possible recoupment from the Fund in future years on a rolling three year basis (within the three years after the fees have been deferred or reimbursed) if such recoupment can be achieved without exceeding the lesser of the expense limitation in effect at the time of the deferral and at the time of the repayment.
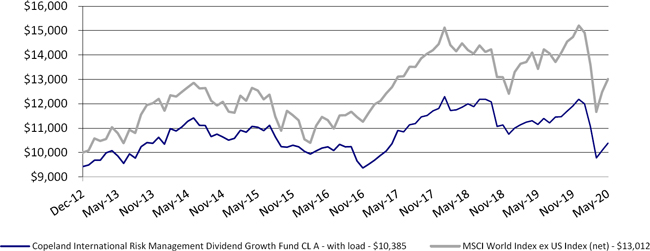
| Copeland International Risk Managed Dividend Growth Fund |
| Portfolio Review (Unaudited) |
| December 17, 2012* through May 31, 2020 |
Performance of a $10,000 Investment (as of May 31, 2020)
| Average Annualized | | | | |
| Total Returns as of | | | | Since |
| May 31, 2020 | Six Months | One Year | Five Year | Inception* |
| Copeland International Risk Managed | | | | |
| Dividend Growth Fund: | | | | |
| Class A | | | | |
| Without sales charge | (12.78)% | (6.86)% | (1.21)% | 1.31% |
| With sales charge+ | (17.81)% | (12.22)% | (2.36)% | 0.51% |
| Class C | (13.05)% | (7.48)% | (1.95)% | 0.57% |
| Class I | (12.70)% | (6.69)% | (1.08)% | 1.43% |
| MSCI World ex US Index (net) | (11.69)% | (3.12)% | 0.74% | 3.60% |
| * | The Fund commenced operations December 17, 2012. |
| + | Adjusted for initial maximum sales charge of 5.75%. |
The MSCI World ex US Index is a free float-adjusted market capitalization weighted index that is designed to measure the equity market performance of developed markets excluding holdings in the United States and is net any withholding taxes. Investors cannot invest directly in an index or benchmark.
Past performance is not predictive of future results. The investment return and principal value of an investment will fluctuate. An investor’s shares, when redeemed, may be worth more or less than the original cost. The performance and returns do not reflect the deduction of taxes that a shareholder may pay on Fund distributions or redemption of Fund shares. Total return is calculated assuming reinvestment of all dividends and distributions. Total returns would have been lower had the adviser not waived its fees and reimbursed a portion of the Fund’s expenses. For performance information current to the most recent month-end please call toll-free 1-888-9-COPELAND (1-888-926-7352). Additional information can be found by visiting our website, www.copelandfunds.com. The Fund’s gross annual operating expense ratio, as stated in the current prospectus is 2.43%, 3.18%, and 2.16%, for Class A, Class C, and Class I shares, respectively, and its net annual operating expense ratio is 1.60%, 2.35%, and 1.45% for its Class A, Class C, and Class I shares, respectively. These ratios can fluctuate and may differ from the expense ratios disclosed in the Financial Highlights section of this report. The Fund’s investment adviser has contractually agreed to reduce its fees and/or absorb expenses of the Fund, at least until March 31, 2021, to ensure that total annual fund operating expenses after fee deferral and/or reimbursement (exclusive of any taxes, leverage interest, borrowing interest, brokerage commissions, expenses incurred in connection with any merger or reorganization, dividend expense on securities sold short, acquired fund fees and expenses or extraordinary expenses such as litigation) will not exceed 1.60%, 2.35%, and 1.45% of Class A, Class C and Class I shares, respectively, subject to possible recoupment from the Fund in future years on a rolling three year basis (within the three years after the fees have been deferred or reimbursed) if such recoupment can be achieved without exceeding the lesser of the expense limitation in effect at the time of the deferral and at the time of the repayment.
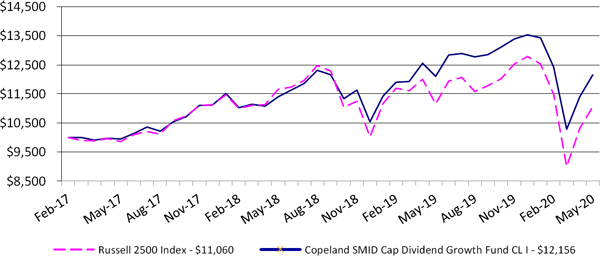
| Copeland SMID Cap Dividend Growth Fund |
| Portfolio Review (Unaudited) |
| February 27, 2017* through May 31, 2020 |
Performance of a $10,000 Investment (as of May 31, 2020)
| | | | Since | Since |
| Total Returns as of | | | Inception | Inception |
| May 31, 2020 | Six Months | One Year | Class I* | Class A* |
| Copeland SMID Cap Dividend Growth Fund: | | | | |
| Class I | (9.19)% | 0.41% | 6.18% | — |
| Class A | | | | |
| Without sales charge | (9.30)% | 0.06% | — | 3.08% |
| With sales charge+ | (14.53)% | (5.66)% | — | (1.53)% |
| Russell 2500 Index | (11.72)% | (0.80)% | 3.14% | (1.84)% |
| * | Class I shares commenced operations February 27, 2017. Class A commenced operations February 11, 2019 |
| + | Adjusted for initial maximum sales charge of 5.75%. |
The Russell 2500 Index is comprised of the smallest 2500 companies in the Russell 3000 Index. The Russell 3000 Index measures the performance of the 3,000 largest U.S. companies based on total market capitalization, which represents approximately 98% of the investable U.S. equity market. Investors cannot invest directly in an index or benchmark.
Past performance is not predictive of future results. The investment return and principal value of an investment will fluctuate. An investor’s shares, when redeemed, may be worth more or less than the original cost. The performance and returns do not reflect the deduction of taxes that a shareholder may pay on Fund distributions or redemption of Fund shares. Total return is calculated assuming reinvestment of all dividends and distributions. Total returns would have been lower had the adviser not waived its fees and reimbursed a portion of the Fund’s expenses. For performance information current to the most recent month-end please call toll-free 1-888-9-COPELAND (1-888-926-7352). Additional information can be found by visiting our website, www.copelandfunds.com. The Fund’s gross annual operating expense ratio, as stated in the current prospectus is 3.04% and 1.18% for Class A and Class C shares, respectively, and its net annual operating expense ratio is 1.20% and 0.95% for Class A and Class I shares, respectively. This ratio can fluctuate and may differ from the expense ratio disclosed in the Financial Highlights section of this report. The Fund’s adviser has contractually agreed to reduce its fees and/or absorb expenses of the Fund, until at least March 31, 2021, to ensure that total annual fund operating expenses after fee deferral and/or reimbursement (exclusive of any taxes, leverage interest, borrowing interest, brokerage commissions, expenses incurred in connection with any merger or reorganization, dividend expense on securities sold short, acquired fund fees and expenses or extraordinary expenses such as litigation) will not exceed 1.20% and 0.95% of Class A and Class I shares, respectively, subject to possible recoupment from the Fund in future years on a rolling three year basis (within the three years after the fees have been deferred or reimbursed) if such recoupment can be achieved without exceeding the lesser of the expense limitation in effect at the time of the deferral and at the time of the repayment.
| Copeland Risk Managed Dividend Growth Fund |
| PORTFOLIO OF INVESTMENTS (Unaudited) |
| May 31, 2020 |
| Shares | | | Security | | Market Value | |
| | | | | | | |
| | | | | COMMON STOCK - 55.3% | | | | |
| | | | | AEROSPACE/DEFENSE - 0.9% | | | | |
| | 1,905 | | | Lockheed Martin Corp. | | $ | 739,978 | |
| | | | | | | | | |
| | | | | BANKS - 1.9% | | | | |
| | 7,100 | | | JPMorgan Chase & Co. | | | 690,901 | |
| | 20,801 | | | Trust Financial Corp. | | | 765,061 | |
| | | | | | | | 1,455,962 | |
| | | | | CHEMICALS - 1.4% | | | | |
| | 1,676 | | | Air Products and Chemicals, Inc. | | | 405,005 | |
| | 1,762 | | | Ecolab, Inc. | | | 374,566 | |
| | 602 | | | Sherwin-Williams Co. | | | 357,498 | |
| | | | | | | | 1,137,069 | |
| | | | | COMMERCIAL SERVICES - 2.4% | | | | |
| | 9,191 | | | Booz Allen Hamilton Holding Corp. | | | 733,074 | |
| | 2,303 | | | MarketAxess Holdings, Inc. | | | 1,171,283 | |
| | | | | | | | 1,904,357 | |
| | | | | COMPUTERS - 2.0% | | | | |
| | 3,875 | | | Accenture PLC | | | 781,277 | |
| | 2,540 | | | Apple, Inc. | | | 807,568 | |
| | | | | | | | 1,588,845 | |
| | | | | DISTRIBUTION/WHOLESALE - 1.1% | | | | |
| | 20,870 | | | Fastenal Co. | | | 861,096 | |
| | | | | | | | | |
| | | | | DIVERSIFIED FINANCIAL SERVICES - 3.3% | | | | |
| | 1,544 | | | BlackRock, Inc. | | | 816,220 | |
| | 21,290 | | | Discover Financial Services | | | 1,011,488 | |
| | 3,931 | | | Visa, Inc. | | | 767,488 | |
| | | | | | | | 2,595,196 | |
| | | | | ELECTRIC - 2.4% | | | | |
| | 64,080 | | | Algonquin Power & Utilities Corp. | | | 897,120 | |
| | 3,751 | | | NextEra Energy, Inc. | | | 958,606 | |
| | | | | | | | 1,855,726 | |
| | | | | ENVIRONMENTAL CONTROL - 1.9% | | | | |
| | 9,079 | | | Tetra Tech, Inc. | | | 716,333 | |
| | 8,557 | | | Waste Connections, Inc. | | | 804,700 | |
| | | | | | | | 1,521,033 | |
| | | | | FOOD - 2.1% | | | | |
| | 12,002 | | | Calavo Growers, Inc. | | | 702,237 | |
| | 5,293 | | | McCormick & Co., Inc. | | | 927,122 | |
| | | | | | | | 1,629,359 | |
| | | | | HEALTHCARE PRODUCTS - 2.4% | | | | |
| | 6,357 | | | Medtronic PLC | | | 626,673 | |
| | 3,605 | | | ResMed Inc | | | 579,756 | |
| | 4,137 | | | Steris PLC | | | 686,287 | |
| | | | | | | | 1,892,716 | |
| | | | | HEALTHCARE SERVICES - 3.7% | | | | |
| | 1,307 | | | Chemed Corp. | | | 625,413 | |
| | 9,186 | | | Encompass Health Corp. | | | 672,875 | |
| | 7,312 | | | Quest Diagnostics, Inc. | | | 864,863 | |
| | 2,322 | | | UnitedHealth Group, Inc. | | | 707,862 | |
| | | | | | | | 2,871,013 | |
| | | | | HOUSEWARES - 1.0% | | | | |
| | 10,060 | | | Church & Dwight Co., Inc. | | | 755,204 | |
| | | | | | | | | |
| | | | | INSURANCE - 0.9% | | | | |
| | 7,061 | | | Allstate Corp. | | | 690,636 | |
| | | | | | | | | |
| | | | | INTERNET - 1.0% | | | | |
| | 6,825 | | | CDW Corp. | | | 756,961 | |
| | | | | | | | | |
| | | | | MEDIA - 3.0% | | | | |
| | 437 | | | Cable One, Inc. | | | 824,571 | |
| | 18,730 | | | Comcast Corp. | | | 741,708 | |
| | 2,499 | | | FactSet Research Systems, Inc. | | | 768,467 | |
| | | | | | | | 2,334,746 | |
The accompanying notes are an integral part of these financial statements.
| Copeland Risk Managed Dividend Growth Fund |
| PORTFOLIO OF INVESTMENTS (Unaudited) (Continued) |
| May 31, 2020 |
| Shares | | | Security | | | | | | Market Value | |
| | | | | | | | | | | |
| | | | | COMMON STOCK - 55.3% (Continued) | | | | | | | | |
| | | | | OIL & GAS - 1.2% | | | | | | | | |
| | 12,565 | | | Phillips 66 | | | | | | $ | 983,337 | |
| | | | | | | | | | | | | |
| | | | | PHARMACEUTICALS - 0.9% | | | | | | | | |
| | 4,966 | | | Zoetis, Inc. | | | | | | | 692,211 | |
| | | | | | | | | | | | | |
| | | | | REAL ESTATE INVESTMENT TRUSTS - 2.8% | | | | | | | | |
| | 4,777 | | | Alexandria Real Estate Equities, Inc. | | | | | | | 734,320 | |
| | 2,978 | | | American Tower Corp. | | | | | | | 768,830 | |
| | 1,012 | | | Equinix, Inc. | | | | | | | 706,002 | |
| | | | | | | | | | | | 2,209,152 | |
| | | | | RETAIL - 7.3% | | | | | | | | |
| | 4,965 | | | Casey’s General Stores, Inc. | | | | | | | 793,059 | |
| | 2,239 | | | Costco Wholesale Corp. | | | | | | | 690,664 | |
| | 3,952 | | | Dollar General Corp. | | | | | | | 756,848 | |
| | 1,885 | | | Domino’s Pizza, Inc. | | | | | | | 727,308 | |
| | 3,039 | | | Home Depot, Inc. | | | | | | | 755,131 | |
| | 5,823 | | | Ross Stores, Inc. | | | | | | | 564,598 | |
| | 7,522 | | | Starbucks Corp. | | | | | | | 586,641 | |
| | 7,163 | | | Tractor Supply Co. | | | | | | | 874,029 | |
| | | | | | | | | | | | 5,748,278 | |
| | | | | SEMICONDUCTORS - 2.9% | | | | | | | | |
| | 2,698 | | | Broadcom, Inc. | | | | | | | 785,846 | |
| | 6,443 | | | Texas Instruments, Inc. | | | | | | | 765,042 | |
| | 8,244 | | | Xilinx, Inc. | | | | | | | 758,036 | |
| | | | | | | | | | | | 2,308,924 | |
| | | | | SHIPBUILDING - 0.9% | | | | | | | | |
| | 3,583 | | | Huntington Ingalls Industries, Inc. | | | | | | | 716,206 | |
| | | | | | | | | | | | | |
| | | | | SOFTWARE - 4.9% | | | | | | | | |
| | 6,770 | | | Broadridge Financial Solutions, Inc. | | | | | | | 819,847 | |
| | 2,786 | | | Intuit, Inc. | | | | | | | 808,832 | |
| | 4,068 | | | Microsoft Corp. | | | | | | | 745,461 | |
| | 2,167 | | | MSCI, Inc. | | | | | | | 712,618 | |
| | 10,426 | | | Paychex, Inc. | | | | | | | 753,591 | |
| | | | | | | | | | | | 3,840,349 | |
| | | | | TELECOMMUNICATIONS - 0.8% | | | | | | | | |
| | 4,957 | | | Motorola Solutions, Inc. | | | | | | | 670,831 | |
| | | | | | | | | | | | | |
| | | | | TRANSPORTATION - 1.0% | | | | | | | | |
| | 4,580 | | | Union Pacific Corp. | | | | | | | 777,959 | |
| | | | | | | | | | | | | |
| | | | | WATER - 1.2% | | | | | | | | |
| | 7,335 | | | American Water Works Co., Inc. | | | | | | | 931,545 | |
| | | | | | | | | | | | | |
| | | | | TOTAL COMMON STOCK (Cost - $42,140,475) | | | | | | | 43,468,689 | |
| | | | | | | | | | | | | |
| Principal | | | | | Interest | | Maturity | | | | |
| Amount | | | | | Rate % | | Date | | | | |
| | | | | U.S GOVERNMENT OBLIGATIONS - 43.8% | | | | | | | | |
| $ | 33,750,000 | | | U.S Treasury Note | | 1.500 | | 10/31/2021 | | $ | 34,378,858 | |
| | | | | TOTAL U.S GOVERNMENT OBLIGATIONS (Cost - $34,358,989) | | | | | | | | |
| | | | | | | | | | | | | |
| | | | | TOTAL INVESTMENTS - 99.1% (Cost - $76,499,464) | | | | | | $ | 77,847,547 | |
| | | | | OTHER ASSETS IN EXCESS OF LIABILITIES - 0.9% | | | | | | | 682,398 | |
| | | | | NET ASSETS - 100.0% | | | | | | $ | 78,529,945 | |
PLC - Public Limited Company
| Portfolio Composition as of May 31, 2020 | |
| | |
| Sector | | Percent of Net Assets | |
| Information Technology | | | 12.7 | % |
| Financials | | | 8.4 | % |
| Health Care | | | 6.9 | % |
| Industrials | | | 5.9 | % |
| Consumer Discretionary | | | 5.5 | % |
| Consumer Staples | | | 4.9 | % |
| Utilities | | | 3.5 | % |
| Real Estate | | | 2.8 | % |
| Communication Services | | | 2.0 | % |
| Materials | | | 1.4 | % |
| Energy | | | 1.3 | % |
| US Treasury Note | | | 43.8 | % |
| Other Assets in Excess of Liabilities | | | 0.9 | % |
| Net Assets | | | 100.0 | % |
The accompanying notes are an integral part of these financial statements.
| Copeland International Risk Managed Dividend Growth Fund |
| PORTFOLIO OF INVESTMENTS (Unaudited) |
| May 31, 2020 |
| Shares | | | Security | | Market Value | |
| | | | | | | |
| | | | | COMMON STOCK - 55.2% | | | | |
| | | | | AEROSPACE / DEFENSE - 0.7% | | | | |
| | 301 | | | MTU Aero Engines AG * | | $ | 48,750 | |
| | | | | | | | | |
| | | | | APPAREL - 0.6% | | | | |
| | 3,900 | | | Shenzhou International Group Holdings Ltd. | | | 46,933 | |
| | | | | | | | | |
| | | | | BANKS - 4.0% | | | | |
| | 4,572 | | | DNB ASA | | | 62,402 | |
| | 3,000 | | | Hang Seng Bank Ltd. | | | 46,079 | |
| | 983 | | | Ringkjoebing Landbobank A/S * | | | 68,627 | |
| | 1,353 | | | Toronto-Dominion Bank | | | 57,734 | |
| | 3,600 | | | United Overseas Bank Ltd. | | | 49,841 | |
| | | | | | | | 284,683 | |
| | | | | BEVERAGES - 0.9% | | | | |
| | 1,821 | | | Diageo PLC | | | 63,601 | |
| | | | | | | | | |
| | | | | CHEMICALS - 3.7% | | | | |
| | 969 | | | Croda International PLC | | | 62,408 | |
| | 1,873 | | | Itaconix PLC | | | 52,278 | |
| | 1,239 | | | Novozymes AS | | | 67,820 | |
| | 700 | | | Shin-Etsu Chemical Co. Ltd. | | | 82,062 | |
| | | | | | | | 264,568 | |
| | | | | COMMERCIAL SERVICES - 3.8% | | | | |
| | 2,316 | | | Experian PLC | | | 81,313 | |
| | 12,592 | | | QinetiQ Group PLC | | | 46,268 | |
| | 3,210 | | | RELX PLC | | | 74,793 | |
| | 800 | | | Secom Co. Ltd. | | | 69,510 | |
| | | | | | | | 271,884 | |
| | | | | COMPUTERS - 2.9% | | | | |
| | 325 | | | Accenture PLC | | | 65,527 | |
| | 840 | | | Logitech International SA | | | 49,966 | |
| | 520 | | | Obic Co. Ltd. | | | 90,437 | |
| | | | | | | | 205,930 | |
| | | | | COSMETICS/PERSONAL CARE - 1.7% | | | | |
| | 800 | | | Kao Corp. | | | 64,466 | |
| | 1,167 | | | Unilever NV | | | 60,433 | |
| | | | | | | | 124,899 | |
| | | | | DIVERSIFIED FINANCIAL SERVICES - 0.8% | | | | |
| | 4,479 | | | Close Brothers Group PLC | | | 60,049 | |
| | | | | | | | | |
| | | | | ELECTRIC - 1.0% | | | | |
| | 1,872 | | | Fortis, Inc. | | | 71,795 | |
| | | | | | | | | |
| | | | | ELECTRONICS - 0.9% | | | | |
| | 1,000 | | | Nidec Corp. | | | 61,620 | |
| | | | | | | | | |
| | | | | FOOD - 2.1% | | | | |
| | 545 | | | Kerry Group PLC | | | 67,666 | |
| | 736 | | | Nestle SA | | | 80,004 | |
| | | | | | | | 147,670 | |
| | | | | GAS - 0.7% | | | | |
| | 1,094 | | | Rubis SCA | | | 52,538 | |
The accompanying notes are an integral part of these financial statements.
| Copeland International Risk Managed Dividend Growth Fund |
| PORTFOLIO OF INVESTMENTS (Unaudited) (Continued) |
| May 31, 2020 |
| Shares | | | Security | | Market Value | |
| | | | | | | |
| | | | | COMMON STOCK - 55.2% (Continued) | | | | |
| | | | | HAND/MACHINE TOOLS - 0.8% | | | | |
| | 6,500 | | | Techtronic Industries Co. Ltd. | | $ | 56,709 | |
| | | | | | | | | |
| | | | | HEALTHCARE PRODUCTS - 2.0% | | | | |
| | 703 | | | Medtronic PLC | | | 69,302 | |
| | 462 | | | Steris PLC | | | 76,641 | |
| | | | | | | | 145,943 | |
| | | | | HEALTHCARE SERVICES - 0.9% | | | | |
| | 1,286 | | | Fresenius SE & Co. KGaA | | | 62,299 | |
| | | | | | | | | |
| | | | | INSURANCE - 3.0% | | | | |
| | 8,600 | | | AIA Group Ltd. | | | 70,574 | |
| | 687 | | | Helvetia Holding AG | | | 61,308 | |
| | 1,963 | | | Tokio Marine Holdings, Inc. | | | 85,261 | |
| | | | | | | | 217,143 | |
| | | | | INTERNET - 1.1% | | | | |
| | 1,500 | | | Tencent Holdings Ltd. | | | 81,239 | |
| | | | | | | | | |
| | | | | MACHINERY-DIVERSIFIED - 1.7% | | | | |
| | 1,277 | | | Atlas Copco AB - A Shares | | | 50,534 | |
| | 580 | | | Spirax-Sarco Engineering PLC | | | 71,259 | |
| | | | | | | | 121,793 | |
| | | | | MEDIA - 1.8% | | | | |
| | 3,566 | | | Quebecor, Inc. | | | 78,095 | |
| | 680 | | | Wolters Kluwer NV | | | 54,383 | |
| | | | | | | | 132,478 | |
| | | | | OIL & GAS - 1.2% | | | | |
| | 998 | | | DCC PLC | | | 83,804 | |
| | | | | | | | | |
| | | | | PACKAGING & CONTAINERS - 0.7% | | | | |
| | 522 | | | Vidrala SA | | | 50,024 | |
| | | | | | | | | |
| | | | | PHARMACEUTICALS - 4.2% | | | | |
| | 1,597 | | | Dechra Pharmaceuticals PLC | | | 55,146 | |
| | 1,182 | | | Novo Nordisk AS | | | 77,941 | |
| | 248 | | | Roche Holding AG | | | 86,185 | |
| | 1,350 | | | Shionogi & Co. Ltd. | | | 80,138 | |
| | | | | | | | 299,410 | |
| | | | | PIPELINES - 0.7% | | | | |
| | 1,585 | | | Enbridge, Inc. | | | 51,350 | |
| | | | | | | | | |
| | | | | REAL ESTATE - 2.8% | | | | |
| | 4,911 | | | Hufvudstaden AB | | | 63,369 | |
| | 596 | | | LEG Immobilien AG | | | 74,732 | |
| | 2,800 | | | Relo Group, Inc. | | | 64,122 | |
| | | | | | | | 202,223 | |
| | | | | RETAIL - 2.6% | | | | |
| | 1,721 | | | Alimentation Couche-Tard, Inc. | | | 53,665 | |
| | 400 | | | Cosmos Pharmaceutical Corp. | | | 57,595 | |
| | 2,322 | | | Dollarama, Inc. | | | 78,419 | |
| | | | | | | | 189,679 | |
| | | | | SEMICONDUCTORS - 0.7% | | | | |
| | 162 | | | Broadcom, Inc. | | | 47,186 | |
The accompanying notes are an integral part of these financial statements.
| Copeland International Risk Managed Dividend Growth Fund |
| PORTFOLIO OF INVESTMENTS (Unaudited) (Continued) |
| May 31, 2020 |
| Shares | | | Security | | | | | | Market Value | |
| | | | | | | | | | | |
| | | | | COMMON STOCK - 55.2% (Continued) | | | | | | | | |
| | | | | SOFTWARE - 3.1% | | | | | | | | |
| | 418 | | | Dassault Systemes SE | | | | | | $ | 71,514 | |
| | 672 | | | SimCorp AS | | | | | | | 74,358 | |
| | 479 | | | Temenos Group AG | | | | | | | 73,709 | |
| | | | | | | | | | | | 219,581 | |
| | | | | STORAGE WAREHOUSING - 0.8% | | | | | | | | |
| | 6,857 | | | Safestore Holdings PLC | | | | | | | 56,879 | |
| | | | | | | | | | | | | |
| | | | | TELECOMMUNICATIONS - 0.9% | | | | | | | | |
| | 2,300 | | | KDDI Corp. | | | | | | | 67,204 | |
| | | | | | | | | | | | | |
| | | | | TRANSPORTATION - 1.5% | | | | | | | | |
| | 893 | | | Canadian National Railway Co. | | | | | | | 76,624 | |
| | 1,600 | | | Keisei Electric Railway Co. Ltd. | | | | | | | 31,390 | |
| | | | | | | | | | | | 108,014 | |
| | | | | WATER - 0.9% | | | | | | | | |
| | 4,443 | | | Pennon Group PLC | | | | | | | 63,043 | |
| | | | | | | | | | | | | |
| | | | | TOTAL COMMON STOCK (Cost - $4,043,280) | | | | | | | 3,960,921 | |
| | | | | | | | | | | | | |
| Principal | | | | | Interest | | Maturity | | | | |
| Amount | | | | | Rate % | | Date | | | | |
| | | | | U.S GOVERNMENT OBLIGATIONS - 39.8% | | | | | | | | |
| $ | 2,807,000 | | | U.S Treasury Note | | 1.500 | | 10/31/2021 | | $ | 2,859,302 | |
| | | | | TOTAL U.S GOVERNMENT OBLIGATIONS (Cost - $2,857,513) | | | | | | | | |
| | | | | | | | | | | | | |
| | | | | TOTAL INVESTMENTS - 95.0% (Cost - $6,900,793) | | | | | | $ | 6,820,223 | |
| | | | | OTHER ASSETS IN EXCESS OF LIABILITIES - 5.0% | | | | | | | 355,367 | |
| | | | | NET ASSETS - 100.00% | | | | | | $ | 7,175,590 | |
PLC - Public Limited Company
| Portfolio Composition as of May 31, 2020 | |
| | |
| Country | | Percent of Net Assets | |
| US Treasury Note | | | 39.8 | % |
| Japan | | | 10.5 | % |
| Unitrd Kingdom | | | 9.3 | % |
| Canada | | | 6.5 | % |
| Ireland | | | 5.1 | % |
| Switzerland | | | 4.9 | % |
| Denmark | | | 4.0 | % |
| Germany | | | 2.6 | % |
| Hong Kong | | | 2.4 | % |
| China | | | 1.8 | % |
| France | | | 1.7 | % |
| United States | | | 1.7 | % |
| Sweden | | | 1.6 | % |
| Noway | | | 0.9 | % |
| Netherlands | | | 0.8 | % |
| Spain | | | 0.7 | % |
| Singapore | | | 0.7 | % |
| Other Assets in Excess of Liabilities | | | 5.0 | % |
| Net Assets | | | 100.0 | % |
| | | | | |
| Sector | | Percent of Net Assets | |
| US Treasury Note | | | 39.8 | % |
| Industrials | | | 11.2 | % |
| Financials | | | 7.8 | % |
| Health Care | | | 7.1 | % |
| Information Technology | | | 6.6 | % |
| Consumer Staples | | | 6.2 | % |
| Materials | | | 4.5 | % |
| Real Estate | | | 3.6 | % |
| Communication Services | | | 3.2 | % |
| Utilities | | | 2.6 | % |
| Consumer Discretionary | | | 1.7 | % |
| Energy | | | 0.7 | % |
| Other Assets in Excess of Liabilities | | | 5.0 | % |
| Net Assets | | | 100.0 | % |
The accompanying notes are an integral part of these financial statements.
| Copeland SMID Cap Dividend Growth Fund |
| PORTFOLIO OF INVESTMENTS (Unaudited) |
| May 31, 2020 |
| Shares | | | Security | | Market Value | |
| | | | | | | |
| | | | | COMMON STOCK - 96.5% | | | | |
| | | | | AEROSPACE & DEFENSE - 1.2% | | | | |
| | 1,753 | | | HEICO Corp. | | $ | 176,632 | |
| | | | | | | | | |
| | | | | BANKS - 3.8% | | | | |
| | 7,809 | | | Bank OZK | | | 175,624 | |
| | 11,489 | | | Home BancShares, Inc. | | | 166,246 | |
| | 3,037 | | | Prosperity Bancshares, Inc. | | | 198,589 | |
| | | | | | | | 540,459 | |
| | | | | CHEMICALS - 1.5% | | | | |
| | 1,276 | | | Quaker Chemical Corp. | | | 218,005 | |
| | | | | | | | | |
| | | | | COMMERCIAL SERVICES - 4.9% | | | | |
| | 5,328 | | | Aaron’s, Inc. | | | 196,656 | |
| | 484 | | | MarketAxess Holdings, Inc. | | | 246,158 | |
| | 3,274 | | | Monro, Inc. | | | 180,397 | |
| | 457 | | | Morningstar, Inc. | | | 70,067 | |
| | | | | | | | 693,278 | |
| | | | | COMPUTERS - 1.5% | | | | |
| | 2,915 | | | Maximus, Inc. | | | 209,938 | |
| | | | | | | | | |
| | | | | DISTRIBUTION/WHOLESALE - 3.4% | | | | |
| | 8,186 | | | Core-Mark Holding Co., Inc. | | | 229,044 | |
| | 942 | | | Pool Corp. | | | 253,417 | |
| | | | | | | | 482,461 | |
| | | | | DIVERSIFIED FINANCIAL SERVICES - 4.3% | | | | |
| | 4,339 | | | Cohen & Steers, Inc. | | | 275,743 | |
| | 4,108 | | | Evercore, Inc. | | | 195,171 | |
| | 5,324 | | | Lazard Ltd. | | | 143,003 | |
| | | | | | | | 613,917 | |
| | | | | ELECTRIC - 1.9% | | | | |
| | 19,025 | | | Algonquin Power & Utilities Corp. | | | 266,350 | |
| | | | | | | | | |
| | | | | ELECTRICAL COMPONENTS & EQUIPMENT - 2.7% | | | | |
| | 1,100 | | | Littelfuse, Inc. | | | 178,739 | |
| | 1,354 | | | Universal Display Corp. | | | 198,496 | |
| | | | | | | | 377,235 | |
| | | | | ELECTRONICS - 1.5% | | | | |
| | 3,494 | | | Badger Meter, Inc. | | | 213,798 | |
| | | | | | | | | |
| | | | | ENGINEERING & CONSTRUCTION -1.1% | | | | |
| | 2,033 | | | Exponent, Inc. | | | 150,930 | |
| | | | | | | | | |
| | | | | ENVIRONMENTAL CONTROL - 1.9% | | | | |
| | 3,343 | | | Tetra Tech, Inc. | | | 263,763 | |
| | | | | | | | | |
| | | | | FOOD - 3.5% | | | | |
| | 3,290 | | | Calavo Growers, Inc. | | | 192,498 | |
| | 1,587 | | | J&J Snack Foods Corp. | | | 204,136 | |
| | 1,768 | | | Lamb Weston Holdings, Inc. | | | 106,186 | |
| | | | | | | | 502,820 | |
| | | | | GAS - 1.4% | | | | |
| | 6,101 | | | UGI Corp. | | | 194,256 | |
| | | | | | | | | |
| | | | | HAND/MACHINE TOOLS - 1.2% | | | | |
| | 1,311 | | | Snap-on, Inc. | | | 170,024 | |
| | | | | | | | | |
| | | | | HEALTHCARE PRODUCTS - 6.0% | | | | |
| | 3,872 | | | Cantel Medical Corp. | | | 162,934 | |
| | 4,798 | | | Luminex Corp. | | | 149,506 | |
| | 1,644 | | | ResMed, Inc. | | | 264,388 | |
| | 1,648 | | | STERIS PLC | | | 273,387 | |
| | | | | | | | 850,215 | |
The accompanying notes are an integral part of these financial statements.
| Copeland SMID Cap Dividend Growth Fund |
| PORTFOLIO OF INVESTMENTS (Unaudited) (Continued) |
| May 31, 2020 |
| Shares | | | Security | | Market Value | |
| | | | | | | |
| | | | | COMMON STOCK - 96.5% (Continued) | | | | |
| | | | | HEALTHCARE SERVICES - 8.0% | | | | |
| | 550 | | | Chemed Corp. | | $ | 263,180 | |
| | 3,217 | | | Encompass Health Corp. | | | 235,645 | |
| | 5,985 | | | Ensign Group, Inc. | | | 261,664 | |
| | 2,010 | | | Quest Diagnostics, Inc. | | | 237,743 | |
| | 1,904 | | | US Physical Therapy, Inc. | | | 141,163 | |
| | | | | | | | 1,139,395 | |
| | | | | HOUSEHOLD PRODUCTS - 1.6% | | | | |
| | 3,072 | | | Church & Dwight Co., Inc. | | | 230,615 | |
| | | | | | | | | |
| | | | | HOUSEWARES - 1.4% | | | | |
| | 2,710 | | | Toro Co. | | | 192,600 | |
| | | | | | | | | |
| | | | | INSURANCE - 1.2% | | | | |
| | 2,241 | | | Globe Life, Inc. | | | 172,602 | |
| | | | | | | | | |
| | | | | INTERNET - 1.3% | | | | |
| | 2,440 | | | Cogent Communications Holdings, Inc. | | | 186,709 | |
| | | | | | | | | |
| | | | | LEISURE TIME - 0.7% | | | | |
| | 1,850 | | | Brunswick Corp. | | | 101,768 | |
| | | | | | | | | |
| | | | | MACHINERY - CONSTRUCTION & MINING- 1.8% | | | | |
| | 4,113 | | | BWX Technologies, Inc. | | | 257,350 | |
| | | | | | | | | |
| | | | | MACHINERY - DIVERSIFIED - 3.7% | | | | |
| | 4,122 | | | Cognex Corp. | | | 233,882 | |
| | 1,560 | | | Nordson Corp. | | | 293,826 | |
| | | | | | | | 527,708 | |
| | | | | MEDIA - 4.7% | | | | |
| | 122 | | | Cable One, Inc. | | | 230,201 | |
| | 720 | | | FactSet Research Systems, Inc. | | | 221,407 | |
| | 2,470 | | | Nexstar Media Group, Inc. | | | 205,776 | |
| | | | | | | | 657,384 | |
| | | | | OIL & GAS - 1.4% | | | | |
| | 10,353 | | | Cabot Oil & Gas Corp. | | | 205,404 | |
| | | | | | | | | |
| | | | | PIPELINES - 1.1% | | | | |
| | 3,380 | | | Phillips 66 Partners LP | | | 151,018 | |
| | | | | | | | | |
| | | | | PRIVATE EQUITY - 1.2% | | | | |
| | 12,458 | | | Kennedy-Wilson Holdings, Inc. | | | 174,661 | |
| | | | | | | | | |
| | | | | REAL ESTATE INVESTMENT TRUSTS - 4.9% | | | | |
| | 1,594 | | | Alexandria Real Estate Equities, Inc. | | | 245,030 | |
| | 6,318 | | | Americold Realty Trust | | | 225,616 | |
| | 5,141 | | | NexPoint Residential Trust, Inc. | | | 164,409 | |
| | 839 | | | QTS Realty Trust, Inc. | | | 57,555 | |
| | | | | | | | 692,610 | |
| | | | | RETAIL - 6.4% | | | | |
| | 1,342 | | | Casey’s General Stores, Inc. | | | 214,358 | |
| | 617 | | | Domino’s Pizza, Inc. | | | 238,063 | |
| | 3,081 | | | MSC Industrial Direct Co., Inc. | | | 213,637 | |
| | 1,912 | | | Tractor Supply Co. | | | 233,302 | |
| | | | | | | | 899,360 | |
The accompanying notes are an integral part of these financial statements.
| Copeland SMID Cap Dividend Growth Fund |
| PORTFOLIO OF INVESTMENTS (Unaudited) (Continued) |
| May 31, 2020 |
| Shares | | | Security | | Market Value | |
| | | | | | | |
| | | | | COMMON STOCK - 96.5% (Continued) | | | | |
| | | | | SEMICONDUCTORS - 3.6% | | | | |
| | 1,723 | | | Cabot Microelectronics Corp. | | $ | 249,594 | |
| | 2,406 | | | Power Integrations, Inc. | | | 260,690 | |
| | | | | | | | 510,284 | |
| | | | | SHIPBUILDING - 1.3% | | | | |
| | 887 | | | Huntington Ingalls Industries, Inc. | | | 177,302 | |
| | | | | | | | | |
| | | | | SOFTWARE - 4.8% | | | | |
| | 1,957 | | | Broadridge Financial Solutions, Inc. | | | 236,993 | |
| | 1,323 | | | Jack Henry & Associates, Inc. | | | 239,278 | |
| | 2,548 | | | ManTech International Corp. | | | 198,082 | |
| | | | | | | | 674,353 | |
| | | | | TRANSPORTATION - 2.4% | | | | |
| | 1,421 | | | Landstar System, Inc. | | | 165,205 | |
| | 4,951 | | | Ryder System, Inc. | | | 169,621 | |
| | | | | | | | 334,826 | |
| | | | | WATER - 3.2% | | | | |
| | 2,408 | | | American States Water Co. | | | 197,480 | |
| | 2,033 | | | American Water Works Co., Inc. | | | 258,191 | |
| | | | | | | | 455,671 | |
| | | | | | | | | |
| | | | | TOTAL COMMON STOCK (Cost - $13,333,067) | | | 13,665,701 | |
| | | | | | | | | |
| | | | | TOTAL INVESTMENTS - 96.5% (Cost - $13,333,067) | | $ | 13,665,701 | |
| | | | | OTHER ASSETS IN EXCESS OF LIABILITIES - 3.5% | | | 494,264 | |
| | | | | NET ASSETS - 100.00% | | $ | 14,159,965 | |
PLC - Public Limited Company
LP - Limited Partnership
| Portfolio Composition as of May 31, 2020 | |
| | |
| Sector | | Percent of Net Assets | |
| Industrials | | | 15.8 | % |
| Information Technology | | | 15.7 | % |
| Health Care | | | 14.0 | % |
| Financials | | | 13.2 | % |
| Consumer Discretionary | | | 10.1 | % |
| Consumer Staples | | | 6.7 | % |
| Utilities | | | 6.5 | % |
| Real Estate | | | 6.1 | % |
| Communication Services | | | 4.4 | % |
| Energy | | | 2.5 | % |
| Materials | | | 1.5 | % |
| Other Assets in Excess of Liabilities | | | 3.5 | % |
| Net Assets | | | 100.0 | % |
The accompanying notes are an integral part of these financial statements.
| Copeland Trust |
| STATEMENTS OF ASSETS AND LIABILITIES (Unaudited) |
| May 31, 2020 |
| | | Copeland Risk | | | Copeland
International Risk | | | Copeland SMID | |
| | | Managed Dividend | | | Managed Dividend | | | Cap Dividend | |
| | | Growth Fund | | | Growth Fund | | | Growth Fund | |
| Assets: | | | | | | | | | | | | |
| Investments, at Cost | | $ | 76,499,464 | | | $ | 6,900,793 | | | $ | 13,333,067 | |
| Investments in Securities, at Market Value | | $ | 77,847,547 | | | $ | 6,820,223 | | | $ | 13,665,701 | |
| Cash | | | 817,590 | | | | 265,379 | | | | 584,970 | |
| Foreign Cash (Cost $0, $49,491, $0) | | | — | | | | 49,500 | | | | — | |
| Dividends and Interest Receivable | | | 119,294 | | | | 81,873 | | | | 31,438 | |
| Receivable for Securities Sold | | | — | | | | — | | | | 74,871 | |
| Due from Investment Adviser | | | — | | | | 1,059 | | | | — | |
| Receivable for Fund Shares Sold | | | 37,829 | | | | 1,207 | | | | — | |
| Prepaid Expenses and Other Assets | | | 78,332 | | | | 65,210 | | | | 52,734 | |
| Total Assets | | | 78,900,592 | | | | 7,284,451 | | | | 14,409,714 | |
| | | | | | | | | | | | | |
| Liabilities: | | | | | | | | | | | | |
| Payable for Securities Purchased | | | — | | | | 81,453 | | | | 237,028 | |
| Payable for Fund Shares Redeemed | | | 155,387 | | | | 7,290 | | | | — | |
| Payable to Investment Adviser | | | 50,661 | | | | — | | | | 2,887 | |
| Accrued Distribution Fees | | | 49,483 | | | | 7,990 | | | | 16 | |
| Payable to Related Parties | | | 79,697 | | | | 1,664 | | | | 7,508 | |
| Accrued Expenses and Other Liabilities | | | 35,419 | | | | 10,464 | | | | 2,310 | |
| Total Liabilities | | | 370,647 | | | | 108,861 | | | | 249,749 | |
| | | | | | | | | | | | | |
| Net Assets | | $ | 78,529,945 | | | $ | 7,175,590 | | | $ | 14,159,965 | |
| | | | | | | | | | | | | |
| | | | | | | | | | | | | |
| Composition of Net Assets: | | | | | | | | | | | | |
| At May 31, 2020, Net Assets consisted of: | | | | | | | | | | | | |
| Paid-in-Capital | | $ | 77,232,464 | | | $ | 9,664,277 | | | $ | 14,522,456 | |
| Accumulated Earnings (Loss) | | | 1,297,481 | | | | (2,488,687 | ) | | | (362,491 | ) |
| Net Assets | | $ | 78,529,945 | | | $ | 7,175,590 | | | $ | 14,159,965 | |
| | | | | | | | | | | | | |
The accompanying notes are an integral part of these financial statements.
| Copeland Trust |
| STATEMENTS OF ASSETS AND LIABILITIES (Unaudited) (Continued) |
| May 31, 2020 |
| | | | | | Copeland | | | | |
| | | Copeland Risk | | | International Risk | | | Copeland SMID | |
| | | Managed Dividend | | | Managed Dividend | | | Cap Dividend | |
| | | Growth Fund | | | Growth Fund | | | Growth Fund | |
| Class A Shares: | | | | | | | | | | | | |
| Net Assets | | $ | 20,756,741 | | | $ | 1,177,407 | | | $ | 40,760 | |
| Shares Outstanding (no par value; unlimited number of shares authorized) | | | 1,975,095 | | | | 108,653 | | | | 3,581 | |
| | | | | | | | | | | | | |
| Net Asset Value and Redemption Price Per Share* | | $ | 10.51 | | | $ | 10.84 | | | $ | 11.38 | |
| Offering Price Per Share (NAV/0.9425) Includes a Maximum Sales Charge of 5.75% | | $ | 11.15 | | | $ | 11.50 | | | $ | 12.08 | |
| | | | | | | | | | | | | |
| Class C Shares: | | | | | | | | | | | | |
| Net Assets | | $ | 16,774,266 | | | $ | 740,354 | | | | | |
| Shares Outstanding (no par value; unlimited number of shares authorized) | | | 1,662,998 | | | | 71,282 | | | | | |
| | | | | | | | | | | | | |
| Net Asset Value, Offering Price and Redemption Price Per Share* | | $ | 10.09 | | | $ | 10.39 | | | | | |
| | | | | | | | | | | | | |
| Class I Shares: | | | | | | | | | | | | |
| Net Assets | | $ | 40,998,938 | | | $ | 5,257,829 | | | $ | 14,119,205 | |
| Shares Outstanding (no par value; unlimited number of shares authorized) | | | 3,946,949 | | | | 486,410 | | | | 1,237,525 | |
| | | | | | | | | | | | | |
| Net Asset Value, Offering Price and Redemption Price Per Share* | | $ | 10.39 | | | $ | 10.81 | | | $ | 11.41 | |
| | | | | | | | | | | | | |
| * | The Funds charge a 1.00% fee on shares redeemed less than 30 days after purchase or if shares held less than 30 days are redeemed for failure to the Funds’ minimum balance requirement. |
The accompanying notes are an integral part of these financial statements.
| Copeland Trust |
| STATEMENTS OF OPERATIONS (Unaudited) |
| For the Six Months Ended May 31, 2020 |
| | | | | | Copeland | | | | |
| | | Copeland Risk | | | International Risk | | | Copeland SMID | |
| | | Managed Dividend | | | Managed Dividend | | | Cap Dividend | |
| | | Growth Fund | | | Growth Fund | | | Growth Fund | |
| Investment Income: | | | | | | | | | | | | |
| Dividend Income (Less $25,470, $26,860, and $1,270 Foreign Taxes Withholding, respectively) | | $ | 779,076 | | | $ | 75,331 | | | $ | 132,955 | |
| Interest Income | | | 108,065 | | | | (72 | ) | | | 4,279 | |
| Total Investment Income | | | 887,141 | | | | 75,259 | | | | 137,234 | |
| | | | | | | | | | | | | |
| Expenses: | | | | | | | | | | | | |
| Investment Advisory Fees | | | 511,500 | | | | 68,160 | | | | 48,161 | |
| Distribution Fees - Class C | | | 105,805 | | | | 5,621 | | | | — | |
| Distribution Fees - Class A | | | 35,757 | | | | 1,810 | | | | 51 | |
| Trustees’ Fees | | | 75,308 | | | | 7,269 | | | | 5,061 | |
| Administration Fees | | | 54,951 | | | | 4,449 | | | | 8,524 | |
| Chief Compliance Officer Fees | | | 38,240 | | | | 4,866 | | | | 4,876 | |
| Legal Fees | | | 37,283 | | | | 4,268 | | | | 1,915 | |
| Fund Accounting Fees | | | 28,316 | | | | 17,058 | | | | 17,945 | |
| Transfer Agent Fees | | | 23,695 | | | | 4,134 | | | | 5,616 | |
| Shareholder Service Fees- Class I | | | 21,013 | | | | 3,670 | | | | 1,812 | |
| Printing Expenses | | | 20,485 | | | | 1,549 | | | | 1,683 | |
| Insurance Expense | | | 15,024 | | | | 2,126 | | | | 168 | |
| Registration & Filing Fees | | | 19,842 | | | | 8,284 | | | | 2,941 | |
| Audit Fees | | | 9,558 | | | | 7,058 | | | | 4,374 | |
| Non-Rule 12B-1 Shareholder Service Fees | | | 9,150 | | | | 1,240 | | | | 487 | |
| Custody Fees | | | 7,225 | | | | 5,825 | | | | 6,857 | |
| Miscellaneous Expenses | | | 1,085 | | | | 183 | | | | 1,281 | |
| Total Expenses | | | 1,014,237 | | | | 147,570 | | | | 111,752 | |
| Less: Management Fees Waived by Adviser | | | (234,666 | ) | | | (51,928 | ) | | | (50,640 | ) |
| Net Expenses | | | 779,571 | | | | 95,642 | | | | 61,112 | |
| Net Investment Income (Loss) | | | 107,570 | | | | (20,383 | ) | | | 76,122 | |
| | | | | | | | | | | | | |
| Net Realized and Unrealized Loss on Investments and Foreign Currencies: | | | | | | | | | | | | |
| Net Realized Gain (Loss) on: | | | | | | | | | | | | |
| Security Transactions and FX Loss on Securities | | | (3,227,902 | ) | | | (608,475 | ) | | | (760,430 | ) |
| Foreign Currency Transactions | | | — | | | | 2,315 | | | | — | |
| | | | (3,227,902 | ) | | | (606,160 | ) | | | (760,430 | ) |
| Net Change in Unrealized Appreciation (Depreciation) on: | | | | | | | | | | | | |
| Securities | | | (9,361,483 | ) | | | (1,448,865 | ) | | | (374,280 | ) |
| Foreign Currency Exchange Contracts | | | — | | | | 1,389 | | | | — | |
| | | | (9,361,483 | ) | | | (1,447,476 | ) | | | (374,280 | ) |
| Net Realized and Unrealized Loss on Investments and Foreign Currency Transactions | | | (12,589,385 | ) | | | (2,053,636 | ) | | | (1,134,710 | ) |
| | | | | | | | | | | | | |
| Net Decrease in Net Assets Resulting From Operations | | $ | (12,481,815 | ) | | $ | (2,074,019 | ) | | $ | (1,058,588 | ) |
| | | | | | | | | | | | | |
The accompanying notes are an integral part of these financial statements.
| Copeland Risk Managed Dividend Growth Fund |
| STATEMENTS OF CHANGES IN NET ASSETS |
| | | Six Months | | | Year | |
| | | Ended | | | Ended | |
| | | May 31, 2020 | | | November 30, 2019 | |
| | | (Unaudited) | | | | |
| Operations: | | | | | | | | |
| Net Investment Income | | $ | 107,570 | | | $ | 888,564 | |
| Net Realized Gain (Loss) on Investments and Foreign Currency Transactions | | | (3,227,902 | ) | | | 25,079,273 | |
| Net Change in Unrealized Appreciation (Depreciation) on Investments and Foreign Currency Transactions | | | (9,361,483 | ) | | | (25,884,106 | ) |
| Net Increase (Decrease) in Net Assets Resulting From Operations | | | (12,481,815 | ) | | | 83,731 | |
| | | | | | | | | |
| Distributions to Shareholders From: | | | | | | | | |
| Total Distributions Paid | | | | | | | | |
| Class A | | | (6,494,529 | ) | | | (3,753,431 | ) |
| Class C | | | (4,425,567 | ) | | | (2,354,930 | ) |
| Class I | | | (11,471,495 | ) | | | (6,061,800 | ) |
| Total Distributions to Shareholders | | | (22,391,591 | ) | | | (12,170,161 | ) |
| | | | | | | | | |
| Beneficial Interest Transactions: | | | | | | | | |
| Class A | | | | | | | | |
| Proceeds from Shares Issued | | | 282,462 | | | | 1,578,190 | |
| Distributions Reinvested | | | 6,043,037 | | | | 3,503,569 | |
| Cost of Shares Redeemed | | | (12,449,158 | ) | | | (17,085,621 | ) |
| Redemption Fees | | | 3 | | | | 481 | |
| Total Class A Shares | | | (6,123,656 | ) | | | (12,003,381 | ) |
| Class C | | | | | | | | |
| Proceeds from Shares Issued | | | 153,672 | | | | 612,453 | |
| Distributions Reinvested | | | 4,347,840 | | | | 2,329,578 | |
| Cost of Shares Redeemed | | | (5,953,935 | ) | | | (7,724,642 | ) |
| Redemption Fees | | | 4 | | | | 79 | |
| Total Class C Shares | | | (1,452,419 | ) | | | (4,782,532 | ) |
| Class I | | | | | | | | |
| Proceeds from Shares Issued | | | 6,651,346 | | | | 15,245,576 | |
| Distributions Reinvested | | | 11,247,291 | | | | 5,921,432 | |
| Cost of Shares Redeemed | | | (25,711,282 | ) | | | (30,395,830 | ) |
| Redemption Fees | | | 1,529 | | | | 94 | |
| Total Class I Shares | | | (7,811,116 | ) | | | (9,228,728 | ) |
| Total Beneficial Interest Transactions | | | (15,387,191 | ) | | | (26,014,641 | ) |
| | | | | | | | | |
| Decrease in Net Assets | | | (50,260,597 | ) | | | (38,101,071 | ) |
| | | | | | | | | |
| Net Assets: | | | | | | | | |
| Beginning of Period | | | 128,790,542 | | | | 166,891,613 | |
| End of Period | | $ | 78,529,945 | | | $ | 128,790,542 | |
| | | | | | | | | |
| Share Activity: | | | | | | | | |
| Class A | | | | | | | | |
| Shares Issued | | | 24,483 | | | | 119,196 | |
| Distributions Reinvested | | | 515,617 | | | | 256,296 | |
| Shares Redeemed | | | (1,153,029 | ) | | | (1,263,441 | ) |
| Total Class A Shares | | | (612,929 | ) | | | (887,949 | ) |
| Class C | | | | | | | | |
| Shares Issued | | | 13,572 | | | | 47,575 | |
| Distributions Reinvested | | | 384,765 | | | | 175,552 | |
| Shares Redeemed | | | (575,755 | ) | | | (590,670 | ) |
| Total Class C Shares | | | (177,418 | ) | | | (367,543 | ) |
| Class I | | | | | | | | |
| Shares Issued | | | 606,107 | | | | 1,158,415 | |
| Distributions Reinvested | | | 972,108 | | | | 437,975 | |
| Shares Redeemed | | | (2,350,630 | ) | | | (2,281,806 | ) |
| Total Class I Shares | | | (772,415 | ) | | | (685,416 | ) |
| | | | | | | | | |
The accompanying notes are an integral part of these financial statements.
| Copeland International Risk Managed Dividend Growth Fund |
| STATEMENTS OF CHANGES IN NET ASSETS |
| | | Six Months | | | Year | |
| | | Ended | | | Ended | |
| | | May 31, 2020 | | | November 30, 2019 | |
| | | (Unaudited) | | | | |
| Operations: | | | | | | | | |
| Net Investment Income (Loss) | | $ | (20,383 | ) | | $ | 117,119 | |
| Net Realized Gain (Loss) on Investments and Foreign Currency Transactions | | | (606,160 | ) | | | (516,721 | ) |
| Net Change in Unrealized Appreciation (Depreciation) on Investments and Foreign Currency Transactions | | | (1,447,476 | ) | | | 1,484,592 | |
| Net Increase (Decrease) in Net Assets Resulting From Operations | | | (2,074,019 | ) | | | 1,084,990 | |
| | | | | | | | | |
| Distributions to Shareholders From: | | | | | | | | |
| Total Distributions Paid | | | | | | | | |
| Class A | | | (205 | ) | | | — | |
| Class C | | | — | | | | — | |
| Class I | | | (38,873 | ) | | | — | |
| Total Distributions to Shareholders | | | (39,078 | ) | | | — | |
| | | | | | | | | |
| Beneficial Interest Transactions: | | | | | | | | |
| Class A | | | | | | | | |
| Proceeds from Shares Issued | | | 184,929 | | | | 233,434 | |
| Distributions Reinvested | | | 189 | | | | — | |
| Cost of Shares Redeemed | | | (379,318 | ) | | | (968,927 | ) |
| Redemption Fees | | | 16 | | | | 2 | |
| Total Class A Shares | | | (194,184 | ) | | | (735,491 | ) |
| Class C | | | | | | | | |
| Proceeds from Shares Issued | | | 13,900 | | | | 32,800 | |
| Distributions Reinvested | | | — | | | | — | |
| Cost of Shares Redeemed | | | (438,853 | ) | | | (569,051 | ) |
| Redemption Fees | | | — | | | | — | |
| Total Class C Shares | | | (424,953 | ) | | | (536,251 | ) |
| Class I | | | | | | | | |
| Proceeds from Shares Issued | | | 271,590 | | | | 1,576,191 | |
| Distributions Reinvested | | | 38,829 | | | | — | |
| Cost of Shares Redeemed | | | (5,980,933 | ) | | | (7,661,419 | ) |
| Redemption Fees | | | 2 | | | | — | |
| Total Class I Shares | | | (5,670,512 | ) | | | (6,085,228 | ) |
| Total Beneficial Interest Transactions | | | (6,289,649 | ) | | | (7,356,970 | ) |
| | | | | | | | | |
| Increase (Decrease) in Net Assets | | | (8,402,746 | ) | | | (6,271,980 | ) |
| | | | | | | | | |
| Net Assets: | | | | | | | | |
| Beginning of Period | | | 15,578,336 | | | | 21,850,316 | |
| End of Period | | $ | 7,175,590 | | | $ | 15,578,336 | |
| | | | | | | | | |
| Share Activity: | | | | | | | | |
| Class A | | | | | | | | |
| Shares Issued | | | 14,914 | | | | 20,154 | |
| Distributions Reinvested | | | 15 | | | | — | |
| Shares Redeemed | | | (34,682 | ) | | | (82,592 | ) |
| Total Class A Shares | | | (19,753 | ) | | | (62,438 | ) |
| Class C | | | | | | | | |
| Shares Issued | | | 1,228 | | | | 2,962 | |
| Distributions Reinvested | | | — | | | | — | |
| Shares Redeemed | | | (44,147 | ) | | | (49,727 | ) |
| Total Class C Shares | | | (42,919 | ) | | | (46,765 | ) |
| Class I | | | | | | | | |
| Shares Issued | | | 22,840 | | | | 135,751 | |
| Distributions Reinvested | | | 3,111 | | | | — | |
| Shares Redeemed | | | (555,272 | ) | | | (656,259 | ) |
| Total Class I Shares | | | (529,321 | ) | | | (520,508 | ) |
| | | | | | | | | |
The accompanying notes are an integral part of these financial statements.
| Copeland SMID Cap Dividend Growth Fund |
| STATEMENTS OF CHANGES IN NET ASSETS |
| | | Six Months | | | For the Period | |
| | | Ended | | | Ended | |
| | | May 31, 2020 | | | November 30, 2019 | |
| | | (Unaudited) | | | | |
| Operations: | | | | | | | | |
| Net Investment Income | | $ | 76,122 | | | $ | 47,797 | |
| Net Realized Gain (Loss) on Investments and Foreign Currency Transactions | | | (760,430 | ) | | | 130,998 | |
| Net Change in Unrealized Appreciation (Depreciation) on Investments and Foreign Currency Transactions | | | (374,280 | ) | | | 663,357 | |
| Net Increase (Decrease) in Net Assets Resulting From Operations | | | (1,058,588 | ) | | | 842,152 | |
| | | | | | | | | |
| Distributions to Shareholders From: | | | | | | | | |
| Total Distributions Paid | | | | | | | | |
| Class A | | | (646 | ) | | | — | |
| Class I | | | (187,956 | ) | | | (39,614 | ) |
| Total Distributions to Shareholders | | | (188,602 | ) | | | (39,614 | ) |
| | | | | | | | | |
| Beneficial Interest Transactions: | | | | | | | | |
| Class A * | | | | | | | | |
| Proceeds from Shares Issued | | | 11,499 | | | | 31,929 | |
| Distributions Reinvested | | | 646 | | | | — | |
| Cost of Shares Redeemed | | | (636 | ) | | | — | |
| Redemption Fees | | | 2 | | | | — | |
| Total Class A Shares | | | 11,511 | | | | 31,929.00 | |
| Class I | | | | | | | | |
| Proceeds from Shares Issued | | | 4,932,711 | | | | 10,235,537 | |
| Distributions Reinvested | | | 181,961 | | | | 35,745 | |
| Cost of Shares Redeemed | | | (1,657,012 | ) | | | (203,729 | ) |
| Redemption Fees | | | 452 | | | | 60 | |
| Total Class I Shares | | | 3,458,112 | | | | 10,067,613 | |
| Total Beneficial Interest Transactions | | | 3,469,623 | | | | 10,099,542 | |
| | | | | | | | | |
| Increase in Net Assets | | | 2,222,433 | | | | 10,902,080 | |
| | | | | | | | | |
| Net Assets: | | | | | | | | |
| Beginning of Period | | | 11,937,532 | | | | 1,035,452 | |
| End of Period | | $ | 14,159,965 | | | $ | 11,937,532 | |
| | | | | | | | | |
| Share Activity: | | | | | | | | |
| Class A | | | | | | | | |
| Shares Issued | | | 908 | | | | 2,684 | |
| Distributions Reinvested | | | 52 | | | | — | |
| Shares Redeemed | | | (63 | ) | | | — | |
| Total Class A Shares | | | 897 | | | | 2,684 | |
| Class I | | | | | | | | |
| Shares Issued | | | 439,713 | | | | 856,574 | |
| Distributions Reinvested | | | 14,557 | | | | 3,328 | |
| Shares Redeemed | | | (149,850 | ) | | | (16,542 | ) |
| Total Class I Shares | | | 304,420 | | | | 843,360 | |
| | | | | | | | | |
The accompanying notes are an integral part of these financial statements.
| Copeland Risk Managed Dividend Growth Fund |
| FINANCIAL HIGHLIGHTS |
| |
| Certain information in the table below reflects financial results for one share of beneficial interest outstanding throughout each period presented. |
| | | Class A | |
| | | Six Months | | | Year | | | Year | | | Year | | | Year | | | Year | |
| | | Ended | | | Ended | | | Ended | | | Ended | | | Ended | | | Ended | |
| | | May 31, 2020 | | | November 30, 2019 | | | November 30, 2018 | | | November 30, 2017 | | | November 30, 2016 | | | November 30, 2015 | |
| | | (Unaudited) | | | | | | | | | | | | | | | | |
| Net Asset Value, Beginning of Period | | $ | 14.25 | | | $ | 15.18 | | | $ | 14.38 | | | $ | 12.27 | | | $ | 13.38 | | | $ | 15.31 | |
| | | | | | | | | | | | | | | | | | | | | | | | | |
| Increase From Operations: | | | | | | | | | | | | | | | | | | | | | | | | |
| Net investment income (a) | | | 0.02 | | | | 0.10 | | | | 0.04 | | | | 0.06 | | | | — | | | | 0.08 | |
| Net gain (loss) from securities (both realized and unrealized) | | | (1.24 | ) | | | 0.05 | | | | 1.38 | | | | 2.51 | | | | 0.07 | | | | (1.14 | ) |
| Total from operations | | | (1.22 | ) | | | 0.15 | | | | 1.42 | | | | 2.57 | | | | 0.07 | | | | (1.06 | ) |
| | | | | | | | | | | | | | | | | | | | | | | | | |
| Distributions to shareholders from: | | | | | | | | | | | | | | | | | | | | | | | | |
| Net investment income | | | (0.09 | ) | | | (0.01 | ) | | | (0.03 | ) | | | (0.09 | ) | | | (0.05 | ) | | | (0.03 | ) |
| Net realized gains | | | (2.43 | ) | | | (1.07 | ) | | | (0.59 | ) | | | (0.37 | ) | | | (1.13 | ) | | | (0.84 | ) |
| Total distributions | | | (2.52 | ) | | | (1.08 | ) | | | (0.62 | ) | | | (0.46 | ) | | | (1.18 | ) | | | (0.87 | ) |
| | | | | | | | | | | | | | | | | | | | | | | | | |
| Redemption fees (b) | | | 0.00 | | | | 0.00 | | | | 0.00 | | | | 0.00 | | | | 0.00 | | | | 0.00 | |
| | | | | | | | | | | | | | | | | | | | | | | | | |
| Net Asset Value, End of Period | | $ | 10.51 | | | $ | 14.25 | | | $ | 15.18 | | | $ | 14.38 | | | $ | 12.27 | | | $ | 13.38 | |
| | | | | | | | | | | | | | | | | | | | | | | | | |
| Total Return (c) | | | (10.38 | )% (d) | | | 1.32 | % | | | 10.33 | % | | | 21.63 | % | | | 0.49 | % | | | (7.08 | )% |
| | | | | | | | | | | | | | | | | | | | | | | | | |
| Ratios/Supplemental Data | | | | | | | | | | | | | | | | | | | | | | | | |
| Net assets, end of period (in 000’s) | | $ | 20,757 | | | $ | 36,870 | | | $ | 52,779 | | | $ | 64,666 | | | $ | 82,165 | | | $ | 190,458 | |
| Ratio of expenses to average net assets: | | | | | | | | | | | | | | | | | | | | | | | | |
| before reimbursement | | | 1.91 | % (e) | | | 1.74 | % | | | 1.71 | % | | | 1.82 | % | | | 1.62 | % | | | 1.48 | % |
| net of reimbursement | | | 1.45 | % (e) | | | 1.45 | % | | | 1.45 | % | | | 1.45 | % | | | 1.45 | % | | | 1.45 | % |
| Ratio of net investment income to average net assets | | | 0.30 | % (e) | | | 0.70 | % | | | 0.28 | % | | | 0.47 | % | | | 0.01 | % | | | 0.57 | % |
| Portfolio turnover rate | | | 112 | % (d) | | | 244 | % | | | 30 | % | | | 27 | % | | | 201 | % | | | 142 | % |
| | | | | | | | | | | | | | | | | | | | | | | | | |
| (a) | Per share amounts are calculated using the average shares method, which more appropriately presents the per share data for the year. |
| (b) | Less than $0.01 per share. |
| (c) | Total returns are historical in nature and assume changes in share price, reinvestment of dividends and capital gains distributions, if any. Had the Adviser not absorbed a portion of fund expenses, the total return would have been lower. Sales loads are not reflected in total return. |
The accompanying notes are an integral part of these financial statements.
| Copeland Risk Managed Dividend Growth Fund |
| FINANCIAL HIGHLIGHTS |
| |
| Certain information in the table below reflects financial results for one share of beneficial interest outstanding throughout each period presented. |
| | | Class C | |
| | | Six Months | | | Year | | | Year | | | Year | | | Year | | | Year | |
| | | Ended | | | Ended | | | Ended | | | Ended | | | Ended | | | Ended | |
| | | May 31, 2020 | | | November 30, 2019 | | | November 30, 2018 | | | November 30, 2017 | | | November 30, 2016 | | | November 30, 2015 | |
| | | (Unaudited) | | | | | | | | | | | | | | | | |
| Net Asset Value, Beginning of Period | | $ | 13.73 | | | $ | 14.76 | | | $ | 14.06 | | | $ | 12.01 | | | $ | 13.17 | | | $ | 15.16 | |
| | | | | | | | | | | | | | | | | | | | | | | | | |
| Increase From Operations: | | | | | | | | | | | | | | | | | | | | | | | | |
| Net investment income (loss) (a) | | | (0.03 | ) | | | (0.01 | ) | | | (0.07 | ) | | | (0.04 | ) | | | (0.09 | ) | | | (0.03 | ) |
| Net gain (loss) from securities (both realized and unrealized) | | | (1.18 | ) | | | 0.05 | | | | 1.36 | | | | 2.46 | | | | 0.06 | | | | (1.12 | ) |
| Total from operations | | | (1.21 | ) | | | 0.04 | | | | 1.29 | | | | 2.42 | | | | (0.03 | ) | | | (1.15 | ) |
| | | | | | | | | | | | | | | | | | | | | | | | | |
| Distributions to shareholders from: | | | | | | | | | | | | | | | | | | | | | | | | |
| Net investment income | | | — | | | | — | | | | — | | | | — | | | | — | | | | — | |
| Net realized gains | | | (2.43 | ) | | | (1.07 | ) | | | (0.59 | ) | | | (0.37 | ) | | | (1.13 | ) | | | (0.84 | ) |
| Total distributions | | | (2.43 | ) | | | (1.07 | ) | | | (0.59 | ) | | | (0.37 | ) | | | (1.13 | ) | | | (0.84 | ) |
| | | | | | | | | | | | | | | | | | | | | | | | | |
| Redemption fees (b) | | | 0.00 | | | | 0.00 | | | | 0.00 | | | | 0.00 | | | | 0.00 | | | | 0.00 | |
| | | | | | | | | | | | | | | | | | | | | | | | | |
| Net Asset Value, End of Period | | $ | 10.09 | | | $ | 13.73 | | | $ | 14.76 | | | $ | 14.06 | | | $ | 12.01 | | | $ | 13.17 | |
| | | | | | | | | | | | | | | | | | | | | | | | | |
| Total Return (c) | | | (10.62 | )% (d) | | | 0.54 | % | | | 9.55 | % | | | 20.68 | % | | | (0.30 | )% | | | (7.74 | )% |
| | | | | | | | | | | | | | | | | | | | | | | | | |
| Ratios/Supplemental Data | | | | | | | | | | | | | | | | | | | | | | | | |
| Net assets, end of period (in 000’s) | | $ | 16,774 | | | $ | 25,271 | | | $ | 32,597 | | | $ | 35,487 | | | $ | 43,859 | | | $ | 81,851 | |
| Ratio of expenses to average net assets: | | | | | | | | | | | | | | | | | | | | | | | | |
| before reimbursement | | | 2.67 | % (e) | | | 2.49 | % | | | 2.45 | % | | | 2.57 | % | | | 2.38 | % | | | 2.24 | % |
| net of reimbursement | | | 2.20 | % (e) | | | 2.20 | % | | | 2.20 | % | | | 2.20 | % | | | 2.20 | % | | | 2.20 | % |
| Ratio of net investment income(loss) to average net assets | | | (0.46 | )% (e) | | | (0.05 | )% | | | (0.46 | )% | | | (0.28 | )% | | | (0.74 | )% | | | (0.21 | )% |
| Portfolio turnover rate | | | 112 | % (d) | | | 244 | % | | | 30 | % | | | 27 | % | | | 201 | % | | | 142 | % |
| | | | | | | | | | | | | | | | | | | | | | | | | |
| (a) | Per share amounts are calculated using the average shares method, which more appropriately presents the per share data for the year. |
| (b) | Less than $0.01 per share. |
| (c) | Total returns are historical in nature and assume changes in share price, reinvestment of dividends and capital gains distributions, if any. Had the Adviser not absorbed a portion of fund expenses, the total return would have been lower. |
The accompanying notes are an integral part of these financial statements.
| Copeland Risk Managed Dividend Growth Fund |
| FINANCIAL HIGHLIGHTS |
| |
| Certain information in the table below reflects financial results for one share of beneficial interest outstanding throughout each period presented. |
| | | Class I | |
| | | Six Months | | | Year | | | Year | | | Year | | | Year | | | Year | |
| | | Ended | | | Ended | | | Ended | | | Ended | | | Ended | | | Ended | |
| | | May 31, 2020 | | | November 30, 2019 | | | November 30, 2018 | | | November 30, 2017 | | | November 30, 2016 | | | November 30, 2015 | |
| | | (Unaudited) | | | | | | | | | | | | | | | | |
| Net Asset Value, Beginning of Period | | $ | 14.12 | | | $ | 15.08 | | | $ | 14.30 | | | $ | 12.24 | | | $ | 13.38 | | | $ | 15.34 | |
| | | | | | | | | | | | | | | | | | | | | | | | | |
| Increase From Operations: | | | | | | | | | | | | | | | | | | | | | | | | |
| Net investment income (a) | | | 0.02 | | | | 0.11 | | | | 0.07 | | | | 0.08 | | | | 0.01 | | | | 0.11 | |
| Net gain (loss) from securities (both realized and unrealized) | | | (1.20 | ) | | | 0.06 | | | | 1.37 | | | | 2.49 | | | | 0.08 | | | | (1.14 | ) |
| Total from operations | | | (1.18 | ) | | | 0.17 | | | | 1.44 | | | | 2.57 | | | | 0.09 | | | | (1.03 | ) |
| | | | | | | | | | | | | | | | | | | | | | | | | |
| Distributions to shareholders from: | | | | | | | | | | | | | | | | | | | | | | | | |
| Net investment income | | | (0.12 | ) | | | (0.06 | ) | | | (0.07 | ) | | | (0.14 | ) | | | (0.10 | ) | | | (0.09 | ) |
| Net realized gains | | | (2.43 | ) | | | (1.07 | ) | | | (0.59 | ) | | | (0.37 | ) | | | (1.13 | ) | | | (0.84 | ) |
| Total distributions | | | (2.55 | ) | | | (1.13 | ) | | | (0.66 | ) | | | (0.51 | ) | | | (1.23 | ) | | | (0.93 | ) |
| | | | | | | | | | | | | | | | | | | | | | | | | |
| Redemption fees (b) | | | 0.00 | | | | 0.00 | | | | 0.00 | | | | 0.00 | | | | 0.00 | | | | 0.00 | |
| | | | | | | | | | | | | | | | | | | | | | | | | |
| Net Asset Value, End of Period | | $ | 10.39 | | | $ | 14.12 | | | $ | 15.08 | | | $ | 14.30 | | | $ | 12.24 | | | $ | 13.38 | |
| | | | | | | | | | | | | | | | | | | | | | | | | |
| Total Return (c) | | | (10.21 | )% (d) | | | 1.43 | % | | | 10.56 | % | | | 21.72 | % | | | 0.67 | % | | | (6.87 | )% |
| | | | | | | | | | | | | | | | | | | | | | | | | |
| Ratios/Supplemental Data | | | | | | | | | | | | | | | | | | | | | | | | |
| Net assets, end of period (in 000’s) | | $ | 40,999 | | | $ | 66,649 | | | $ | 81,516 | | | $ | 75,097 | | | $ | 81,750 | | | $ | 249,817 | |
| Ratio of expenses to average net assets: | | | | | | | | | | | | | | | | | | | | | | | | |
| before reimbursement | | | 1.75 | % (e) | | | 1.58 | % | | | 1.53 | % | | | 1.57 | % | | | 1.37 | % | | | 1.24 | % |
| net of reimbursement | | | 1.30 | % (e) | | | 1.30 | % | | | 1.30 | % | | | 1.30 | % | | | 1.30 | % | | | 1.24 | % |
| Ratio of net investment income to average net assets | | | 0.43 | % (e) | | | 0.85 | % | | | 0.45 | % | | | 0.62 | % | | | 0.11 | % | | | 0.76 | % |
| Portfolio turnover rate | | | 112 | % (d) | | | 244 | % | | | 30 | % | | | 27 | % | | | 201 | % | | | 142 | % |
| | | | | | | | | | | | | | | | | | | | | | | | | |
| (a) | Per share amounts are calculated using the average shares method, which more appropriately presents the per share data for the year. |
| (b) | Less than $0.01 per share. |
| (c) | Total returns are historical in nature and assume changes in share price, reinvestment of dividends and capital gains distributions, if any. Had the Adviser not absorbed a portion of fund expenses, the total return would have been lower. |
The accompanying notes are an integral part of these financial statements.
| Copeland International Risk Managed Dividend Growth Fund |
| FINANCIAL HIGHLIGHTS |
| |
| Certain information in the table below reflects financial results for one share of beneficial interest outstanding throughout each period presented. |
| | | Class A | |
| | | Six Months | | | Year | | | Year | | | Year | | | Year | | | Year | |
| | | Ended | | | Ended | | | Ended | | | Ended | | | Ended | | | Ended | |
| | | May 31, 2020 | | | November 30, 2019 | | | November 30, 2018 | | | November 30, 2017 | | | November 30, 2016 | | | November 30, 2015 | |
| | | (Unaudited) | | | | | | | | | | | | | | | | |
| Net Asset Value, Beginning of Period | | $ | 12.43 | | | $ | 11.62 | | | $ | 12.34 | | | $ | 9.93 | | | $ | 10.92 | | | $ | 11.28 | |
| | | | | | | | | | | | | | | | | | | | | | | | | |
| Increase From Operations: | | | | | | | | | | | | | | | | | | | | | | | | |
| Net investment income (loss) (a) | | | (0.02 | ) | | | 0.07 | | | | 0.08 | | | | 0.03 | | | | 0.08 | | | | (0.02 | ) |
| Net gain (loss) from securities (both realized and unrealized) | | | (1.57 | ) | | | 0.74 | | | | (0.68 | ) | | | 2.44 | | | | (1.07 | ) | | | (0.34 | ) |
| Total from operations | | | (1.59 | ) | | | 0.81 | | | | (0.60 | ) | | | 2.47 | | | | (0.99 | ) | | | (0.36 | ) |
| | | | | | | | | | | | | | | | | | | | | | | | | |
| Distributions to shareholders from: | | | | | | | | | | | | | | | | | | | | | | | | |
| Net investment income | | | — | (b) | | | — | | | | (0.12 | ) | | | (0.06 | ) | | | — | | | | — | |
| Net realized gains | | | — | | | | — | | | | — | | | | — | | | | — | | | | — | |
| Total distributions | | | — | | | | — | | | | (0.12 | ) | | | (0.06 | ) | | | — | | | | — | |
| | | | | | | | | | | | | | | | | | | | | | | | | |
| Redemption fees (b) | | | 0.00 | | | | 0.00 | | | | 0.00 | | | | 0.00 | | | | 0.00 | | | | 0.00 | |
| | | | | | | | | | | | | | | | | | | | | | | | | |
| Net Asset Value, End of Period | | $ | 10.84 | | | $ | 12.43 | | | $ | 11.62 | | | $ | 12.34 | | | $ | 9.93 | | | $ | 10.92 | |
| | | | | | | | | | | | | | | | | | | | | | | | | |
| Total Return (c) | | | (12.78 | )% (d) | | | 6.97 | % | | | (4.94 | )% | | | 25.04 | % | | | (9.07 | )% | | | (3.19 | )% |
| | | | | | | | | | | | | | | | | | | | | | | | | |
| Ratios/Supplemental Data | | | | | | | | | | | | | | | | | | | | | | | | |
| Net assets, end of period (in 000’s) | | $ | 1,177 | | | $ | 1,596 | | | $ | 2,218 | | | $ | 2,617 | | | $ | 5,322 | | | $ | 13,169 | |
| Ratio of expenses to average net assets: | | | | | | | | | | | | | | | | | | | | | | | | |
| before reimbursement | | | 2.46 | % (e) | | | 2.43 | % | | | 2.34 | % | | | 2.58 | % | | | 2.14 | % | | | 2.04 | % |
| net of reimbursement | | | 1.60 | % (e) | | | 1.60 | % | | | 1.60 | % | | | 1.60 | % | | | 1.60 | % | | | 1.60 | % |
| Ratio of net investment income(loss) to average net assets | | | (0.40 | )% (e) | | | 0.59 | % | | | 0.62 | % | | | 0.28 | % | | | 0.72 | % | | | (0.21 | )% |
| Portfolio turnover rate | | | 97 | % (d) | | | 147 | % | | | 96 | % | | | 88 | % | | | 180 | % | | | 323 | % |
| | | | | | | | | | | | | | | | | | | | | | | | | |
| (a) | Per share amounts are calculated using the average shares method, which more appropriately presents the per share data for the year. |
| (b) | Less than $0.01 per share. |
| (c) | Total returns are historical in nature and assume changes in share price, reinvestment of dividends and capital gains distributions, if any. Had the Adviser not absorbed a portion of fund expenses, the total return would have been lower. Sales loads are not reflected in total return. |
The accompanying notes are an integral part of these financial statements.
| Copeland International Risk Managed Dividend Growth Fund |
| FINANCIAL HIGHLIGHTS |
| |
| Certain information in the table below reflects financial results for one share of beneficial interest outstanding throughout each period presented. |
| | | Class C | |
| | | Six Months | | | Year | | | Year | | | Year | | | Year | | | Year | |
| | | Ended | | | Ended | | | Ended | | | Ended | | | Ended | | | Ended | |
| | | May 31, 2020 | | | November 30, 2019 | | | November 30, 2018 | | | November 30, 2017 | | | November 30, 2016 | | | November 30, 2015 | |
| | | (Unaudited) | | | | | | | | | | | | | | | | |
| Net Asset Value, Beginning of Period | | $ | 11.95 | | | $ | 11.26 | | | $ | 11.97 | | | $ | 9.65 | | | $ | 10.69 | | | $ | 11.12 | |
| | | | | | | | | | | | | | | | | | | | | | | | | |
| Increase From Operations: | | | | | | | | | | | | | | | | | | | | | | | | |
| Net investment income (loss) (a) | | | (0.06 | ) | | | (0.02 | ) | | | (0.01 | ) | | | (0.06 | ) | | | (0.03 | ) | | | (0.10 | ) |
| Net gain (loss) from securities (both realized and unrealized) | | | (1.50 | ) | | | 0.71 | | | | (0.66 | ) | | | 2.38 | | | | (1.01 | ) | | | (0.33 | ) |
| Total from operations | | | (1.56 | ) | | | 0.69 | | | | (0.67 | ) | | | 2.32 | | | | (1.04 | ) | | | (0.43 | ) |
| | | | | | | | | | | | | | | | | | | | | | | | | |
| Distributions to shareholders from: | | | | | | | | | | | | | | | | | | | | | | | | |
| Net investment income | | | — | | | | — | | | | (0.04 | ) | | | — | | | | — | | | | — | |
| Net realized gains | | | — | | | | — | | | | — | | | | — | | | | — | | | | — | |
| Total distributions | | | — | | | | — | | | | (0.04 | ) | | | — | | | | — | | | | — | |
| | | | | | | | | | | | | | | | | | | | | | | | | |
| Redemption fees (b) | | | 0.00 | | | | 0.00 | | | | 0.00 | | | | 0.00 | | | | 0.00 | | | | 0.00 | |
| | | | | | | | | | | | | | | | | | | | | | | | | |
| Net Asset Value, End of Period | | $ | 10.39 | | | $ | 11.95 | | | $ | 11.26 | | | $ | 11.97 | | | $ | 9.65 | | | $ | 10.69 | |
| | | | | | | | | | | | | | | | | | | | | | | | | |
| Total Return (c) | | | (13.05 | )% (d) | | | 6.13 | % | | | (5.62 | )% | | | 24.04 | % | | | (9.73 | )% | | | (3.87 | )% |
| | | | | | | | | | | | | | | | | | | | | | | | | |
| Ratios/Supplemental Data | | | | | | | | | | | | | | | | | | | | | | | | |
| Net assets, end of period (in 000’s) | | $ | 740 | | | $ | 1,365 | | | $ | 1,813 | | | $ | 1,936 | | | $ | 3,603 | | | $ | 7,254 | |
| Ratio of expenses to average net assets: | | | | | | | | | | | | | | | | | | | | | | | | |
| before reimbursement | | | 3.19 | % (e) | | | 3.18 | % | | | 3.09 | % | | | 3.32 | % | | | 2.89 | % | | | 2.80 | % |
| net of reimbursement | | | 2.35 | % (e) | | | 2.35 | % | | | 2.35 | % | | | 2.35 | % | | | 2.35 | % | | | 2.35 | % |
| Ratio of net investment loss to average net assets | | | (1.14 | )% (e) | | | (0.16 | )% | | | (0.11 | )% | | | (0.59 | )% | | | (0.28 | )% | | | (0.88 | )% |
| Portfolio turnover rate | | | 97 | % (d) | | | 147 | % | | | 96 | % | | | 88 | % | | | 180 | % | | | 323 | % |
| | | | | | | | | | | | | | | | | | | | | | | | | |
| (a) | Per share amounts are calculated using the average shares method, which more appropriately presents the per share data for the year. |
| (b) | Less than $0.01 per share. |
| (c) | Total returns are historical in nature and assume changes in share price, reinvestment of dividends and capital gains distributions, if any. Had the Adviser not absorbed a portion of fund expenses, the total return would have been lower. |
The accompanying notes are an integral part of these financial statements.
| Copeland International Risk Managed Dividend Growth Fund |
| FINANCIAL HIGHLIGHTS |
| |
| Certain information in the table below reflects financial results for one share of beneficial interest outstanding throughout each period presented. |
| | | Class I | |
| | | Six Months | | | Year | | | Year | | | Year | | | Year | | | Year | |
| | | Ended | | | Ended | | | Ended | | | Ended | | | Ended | | | Ended | |
| | | May 31, 2020 | | | November 30, 2019 | | | November 30, 2018 | | | November 30, 2017 | | | November 30, 2016 | | | November 30, 2015 | |
| | | (Unaudited) | | | | | | | | | | | | | | | | |
| Net Asset Value, Beginning of Period | | $ | 12.42 | | | $ | 11.60 | | | $ | 12.34 | | | $ | 9.96 | | | $ | 10.95 | | | $ | 11.30 | |
| | | | | | | | | | | | | | | | | | | | | | | | | |
| Increase From Operations: | | | | | | | | | | | | | | | | | | | | | | | | |
| Net investment income (loss) (a) | | | (0.01 | ) | | | 0.09 | | | | 0.09 | | | | 0.04 | | | | 0.08 | | | | 0.01 | |
| Net gain (loss) from securities (both realized and unrealized) | | | (1.56 | ) | | | 0.73 | | | | (0.68 | ) | | | 2.45 | | | | (1.06 | ) | | | (0.36 | ) |
| Total from operations | | | (1.57 | ) | | | 0.82 | | | | (0.59 | ) | | | 2.49 | | | | (0.98 | ) | | | (0.35 | ) |
| | | | | | | | | | | | | | | | | | | | | | | | | |
| Distributions to shareholders from: | | | | | | | | | | | | | | | | | | | | | | | | |
| Net investment income | | | (0.04 | ) | | | — | | | | (0.15 | ) | | | (0.11 | ) | | | (0.01 | ) | | | — | |
| Net realized gains | | | — | | | | — | | | | — | | | | — | | | | — | | | | — | |
| Total distributions | | | (0.04 | ) | | | — | | | | (0.15 | ) | | | (0.11 | ) | | | (0.01 | ) | | | — | |
| | | | | | | | | | | | | | | | | | | | | | | | | |
| Redemption fees (b) | | | 0.00 | | | | 0.00 | | | | 0.00 | | | | 0.00 | | | | 0.00 | | | | 0.00 | |
| | | | | | | | | | | | | | | | | | | | | | | | | |
| Net Asset Value, End of Period | | $ | 10.81 | | | $ | 12.42 | | | $ | 11.60 | | | $ | 12.34 | | | $ | 9.96 | | | $ | 10.95 | |
| | | | | | | | | | | | | | | | | | | | | | | | | |
| Total Return (c) | | | (12.70 | )% (d) | | | 7.07 | % | | | (4.82 | )% | | | 25.27 | % | | | (8.97 | )% | | | (3.10 | )% |
| | | | | | | | | | | | | | | | | | | | | | | | | |
| Ratios/Supplemental Data | | | | | | | | | | | | | | | | | | | | | | | | |
| Net assets, end of period (in 000’s) | | $ | 5,258 | | | $ | 12,618 | | | $ | 17,820 | | | $ | 16,802 | | | $ | 10,563 | | | $ | 14,902 | |
| Ratio of expenses to average net assets: | | | | | | | | | | | | | | | | | | | | | | | | |
| before reimbursement | | | 2.28 | % (e) | | | 2.16 | % | | | 2.19 | % | | | 2.42 | % | | | 2.04 | % | | | 1.89 | % |
| net of reimbursement | | | 1.45 | % (e) | | | 1.45 | % | | | 1.45 | % | | | 1.45 | % | | | 1.45 | % | | | 1.45 | % |
| Ratio of net investment income to average net assets | | | (0.22 | )% (e) | | | 0.74 | % | | | 0.77 | % | | | 0.39 | % | | | 0.79 | % | | | 0.05 | % |
| Portfolio turnover rate | | | 97 | % (d) | | | 147 | % | | | 96 | % | | | 88 | % | | | 180 | % | | | 323 | % |
| | | | | | | | | | | | | | | | | | | | | | | | | |
| (a) | Per share amounts are calculated using the average shares method, which more appropriately presents the per share data for the year. |
| (b) | Less than $0.01 per share. |
| (c) | Total returns are historical in nature and assume changes in share price, reinvestment of dividends and capital gains distributions, if any. Had the Adviser not absorbed a portion of fund expenses, the total return would have been lower. |
The accompanying notes are an integral part of these financial statements.
| Copeland SMID Cap Dividend Growth Fund |
| FINANCIAL HIGHLIGHTS |
| |
| Certain information in the table below reflects financial results for one share of beneficial interest outstanding throughout the period presented. |
| | | Class A | | | Class A | |
| | | Six Months | | | Period | |
| | | Ended | | | Ended | |
| | | May 31,2020 | | | November 30,2019 * | |
| | | (Unaudited) | | | | |
| Net Asset Value, Beginning of Period | | $ | 12.73 | | | $ | 11.10 | |
| | | | | | | | | |
| Increase From Operations: | | | | | | | | |
| Net investment income (a) | | | 0.05 | | | | 0.10 | |
| Net gain (loss) from securities (both realized and unrealized) | | | (1.21 | ) | | | 1.53 | |
| Total from operations | | | (1.16 | ) | | | 1.63 | |
| | | | | | | | | |
| Distributions to shareholders from: | | | | | | | | |
| Net investment income | | | (0.05 | ) | | | — | |
| Net realized gains | | | (0.14 | ) | | | — | |
| Total distributions | | | (0.19 | ) | | | — | |
| | | | | | | | | |
| Net Asset Value, End of Period | | $ | 11.38 | | | $ | 12.73 | |
| | | | | | | | | |
| Total Return (b) | | | (9.30 | )% (d) | | | 14.68 | % (d) |
| | | | | | | | | |
| Ratios/Supplemental Data | | | | | | | | |
| Net assets, end of period | | $ | 41 | | | $ | 34 | |
| Ratio of expenses to average net assets: | | | | | | | | |
| before reimbursement | | | 1.95 | % (c) | | | 3.04 | % (c) |
| net of reimbursement | | | 1.20 | % (c) | | | 1.20 | % (c) |
| Ratio of net investment income (loss) to average net assets | | | 0.94 | % (c) | | | 0.82 | % (c) |
| Portfolio turnover rate | | | 24 | % (d) | | | 22 | % (d) |
| | | | | | | | | |
| * | Class A commenced operations on February 11, 2019. |
| (a) | Per share amounts are calculated using the average shares method, which more appropriately presents the per share data for the year. |
| (b) | Total returns are historical in nature and assume changes in share price, reinvestment of dividends and capital gains distributions, if any. Had the Adviser not absorbed a portion of fund expenses, the total return would have been lower. |
The accompanying notes are an integral part of these financial statements.
| Copeland SMID Cap Dividend Growth Fund |
| FINANCIAL HIGHLIGHTS |
| |
| Certain information in the table below reflects financial results for one share of beneficial interest outstanding throughout the period presented. |
| | | Class I | |
| | | Six Months | | | Year | | | Year | | | Period | |
| | | Ended | | | Ended | | | Ended | | | Ended | |
| | | May 31, 2020 | | | November 30,2019 | | | November 30,2018 | | | November 30,2017 * | |
| | | (Unaudited) | | | | | | | | | | |
| Net Asset Value, Beginning of Period | | $ | 12.76 | | | $ | 11.54 | | | $ | 11.10 | | | $ | 10.00 | |
| | | | | | | | | | | | | | | | | |
| Increase From Operations: | | | | | | | | | | | | | | | | |
| Net investment income (a) | | | 0.07 | | | | 0.13 | | | | 0.10 | | | | 0.06 | |
| Net gain (loss) from securities (both realized and unrealized) | | | (1.22 | ) | | | 1.53 | | | | 0.42 | | | | 1.04 | |
| Total from operations | | | (1.15 | ) | | | 1.66 | | | | 0.52 | | | | 1.10 | |
| | | | | | | | | | | | | | | | | |
| Distributions to shareholders from: | | | | | | | | | | | | | | | | |
| Net investment income | | | (0.06 | ) | | | (0.08 | ) | | | (0.07 | ) | | | — | |
| Net realized gains | | | (0.14 | ) | | | (0.36 | ) | | | (0.01 | ) | | | — | |
| Total distributions | | | (0.20 | ) | | | (0.44 | ) | | | (0.08 | ) | | | — | |
| | | | | | | | | | | | | | | | | |
| Net Asset Value, End of Period | | $ | 11.41 | | | $ | 12.76 | | | $ | 11.54 | | | $ | 11.10 | |
| | | | | | | | | | | | | | | | | |
| Total Return (b) | | | (9.19 | )% (d) | | | 15.12 | % | | | 4.76 | % | | | 11.00 | % (d) |
| | | | | | | | | | | | | | | | | |
| Ratios/Supplemental Data | | | | | | | | | | | | | | | | |
| Net assets, end of period (in 000’s) | | $ | 14,119 | | | $ | 11,903 | | | $ | 1,035 | | | $ | 616 | |
| Ratio of expenses to average net assets: | | | | | | | | | | | | | | | | |
| before reimbursement | | | 1.73 | % (c) | | | 3.18 | % | | | 10.14 | % | | | 12.96 | % (c) |
| net of reimbursement | | | 0.95 | % (c) | | | 0.95 | % | | | 0.95 | % | | | 0.95 | % (c) |
| Ratio of net investment income (loss) to average net assets | | | 1.18 | % (c) | | | 1.09 | % | | | 0.90 | % | | | 0.83 | % (c) |
| Portfolio turnover rate | | | 24 | % (d) | | | 22 | % | | | 26 | % | | | 21 | % (d) |
| | | | | | | | | | | | | | | | | |
| * | Class I commenced operations on February 27, 2017. |
| (a) | Per share amounts are calculated using the average shares method, which more appropriately presents the per share data for the year. |
| (b) | Total returns are historical in nature and assume changes in share price, reinvestment of dividends and capital gains distributions, if any. Had the Adviser not absorbed a portion of fund expenses, the total return would have been lower. |
The accompanying notes are an integral part of these financial statements.
| Copeland Trust |
| NOTES TO FINANCIAL STATEMENTS (Unaudited) |
| May 31, 2020 |
Copeland Risk Managed Dividend Growth Fund (the “Domestic Fund”), Copeland International Risk Managed Dividend Growth Fund (the “International Fund”), and Copeland SMID Cap Dividend Growth Fund (the “SMID Fund”) are diversified series of Copeland Trust (the “Trust”). The Trust is registered under the Investment Company Act of 1940, as amended (the “1940 Act”) as an open-end management investment company. The Trust was organized as a statutory trust on September 10, 2010, under the laws of the State of Delaware.
The Domestic and International Funds currently offer Class A, Class C and Class I shares. The SMID Fund currently offers Class A and Class I shares. The Domestic Fund’s Class A shares commenced operations on December 28, 2010, Class C shares commenced operations on January 5, 2012 and Class I shares commenced operations on March 1, 2013. The International Fund’s Class A, Class C and Class I shares commenced operations on December 17, 2012. The SMID Fund’s Class I shares commenced operations on February 27, 2017 and Class A shares commenced operations on February 11, 2019. Class A shares are offered at net asset value plus a maximum sales charge of 5.75%. Purchases of $1,000,000 or more may be subject to a maximum contingent deferred sales charge of 1.00% on shares redeemed within 18 months. Class C and Class I shares are offered at net asset value. Each class represents an interest in the same assets of the Funds and classes are identical except for differences in their sales charge structures and ongoing service and distribution charges. All classes of shares have equal voting privileges except that each class has exclusive voting rights with respect to its service and/or distribution plans. The Funds’ income, expenses (other than class specific distribution fees) and realized and unrealized gains and losses are allocated proportionately each day based upon the relative net assets of each class.
| 2. | SUMMARY OF SIGNIFICANT ACCOUNTING POLICIES |
The following is a summary of significant accounting policies followed by the Funds in preparation of their financial statements. These policies are in conformity with accounting principles generally accepted in the United States of America (“GAAP”). The preparation of financial statements requires management to make estimates and assumptions that affect the reported amounts of assets and liabilities and disclosure of contingent assets and liabilities at the date of the financial statements and the reported amounts of income and expenses for the period. Actual results could differ from those estimates. The Funds are investment companies and accordingly follow the investment company accounting and reporting guidance of the Financial Accounting Standards Board (FASB) Accounting Standard Codification Topic 946 “Financial Services – Investment Companies” including FASB Accounting Standard Update ASU 2013-08.
SECURITY VALUATION
The Funds’ securities are valued at the last sale price on the exchange in which such securities are primarily traded, as of the close of business on the day the securities are being valued. In the absence of a sale on the primary exchange, such securities shall be valued at the last mean on the primary exchange. NASDAQ traded securities are valued using the NASDAQ Official Closing Price (“NOCP”). Investments valued in currencies other than the U.S. dollar are converted to U.S. dollars using exchange rates obtained from pricing services. Short-term investments that mature in 60 days or less may be valued at amortized cost. Investments in open-end investment companies are valued at net asset value.
If market quotations are not readily available, securities will be valued at their fair market value as determined in good faith by the adviser in accordance with procedures approved by the Trust’s Board of Trustees (the “Board”) and evaluated by the Board as to the reliability of the fair value method used. The procedures consider, among others, the following factors to determine a security’s fair value: the nature and pricing history, if any, of the security; whether any dealer quotations for the security are available; and possible valuation methodologies that could be used to determine the fair value of the security.
The Funds utilize various methods to measure the fair value of their investments on a recurring basis. GAAP establishes a hierarchy that prioritizes inputs to valuation methods.
| Copeland Trust |
| NOTES TO FINANCIAL STATEMENTS (Unaudited) (Continued) |
| May 31, 2020 |
The three levels of input are:
Level 1 – Unadjusted quoted prices in active markets for identical assets and liabilities that the Funds have the ability to access.
Level 2 – Observable inputs other than quoted prices included in Level 1 that are observable for the asset or liability, either directly or indirectly. These inputs may include quoted prices for the identical instrument on an inactive market, prices for similar instruments, interest rates, prepayment speeds, credit risk, yield curves, default rates and similar data.
Level 3 – Unobservable inputs for the asset or liability, to the extent relevant observable inputs are not available, representing the Funds’ own assumptions about the assumptions a market participant would use in valuing the asset or liability, and would be based on the best information available.
The availability of observable inputs can vary from security to security and is affected by a wide variety of factors, including, for example, the type of security, whether the security is new and not yet established in the marketplace, the liquidity of markets, and other characteristics particular to the security. To the extent that valuation is based on models or inputs that are less observable or unobservable in the market, the determination of fair value requires more judgment. Accordingly, the degree of judgment exercised in determining fair value is greatest for instruments categorized in Level 3.
The inputs used to measure fair value may fall into different levels of the fair value hierarchy. In such cases, for disclosure purposes, the level in the fair value hierarchy within which the fair value measurement falls in its entirety, is determined based on the lowest level input that is significant to the fair value measurement in its entirety.
The inputs or methodology used for valuing securities are not necessarily an indication of the risk associated with investing in those securities. The following tables summarize the inputs used as of May 31, 2020 for the Funds’ assets measured at fair value:
| Copeland Risk Managed Dividend Growth Fund |
| | | | | | | | | | | | | |
| Assets | | Level 1 | | | Level 2 | | | Level 3 | | | Total | |
| Common Stock* | | $ | 43,468,689 | | | $ | — | | | $ | — | | | $ | 43,468,689 | |
| U.S Government Obligations | | | — | | | | 34,378,858 | | | | — | | | $ | 34,378,858 | |
| Total | | $ | 43,468,689 | | | $ | 34,378,858 | | | $ | — | | | $ | 77,847,547 | |
| Copeland Trust |
| NOTES TO FINANCIAL STATEMENTS (Unaudited) (Continued) |
| May 31, 2020 |
| Copeland International Risk Managed Dividend Growth Fund | |
| | | | | | | | | | | | | |
| Assets | | Level 1 | | | Level 2 | | | Level 3 | | | Total | |
| Aerospace/Defense | | $ | — | | | $ | 48,750 | | | $ | — | | | $ | 48,750 | |
| Apparel | | | — | | | | 46,933 | | | | — | | | $ | 46,933 | |
| Banks | | | 57,734 | | | | 226,949 | | | | — | | | $ | 284,683 | |
| Beverages | | | — | | | | 63,601 | | | | — | | | $ | 63,601 | |
| Chemicals | | | — | | | | 264,568 | | | | — | | | $ | 264,568 | |
| Commercial Services | | | — | | | | 271,884 | | | | — | | | $ | 271,884 | |
| Computers | | | — | | | | 205,930 | | | | — | | | $ | 205,930 | |
| Cosmetics/Personal Care | | | — | | | | 124,899 | | | | — | | | $ | 124,899 | |
| Diversified Financial Services | | | — | | | | 60,049 | | | | — | | | $ | 60,049 | |
| Electric | | | 71,795 | | | | — | | | | — | | | $ | 71,795 | |
| Electronics | | | — | | | | 61,620 | | | | — | | | $ | 61,620 | |
| Food | | | — | | | | 147,670 | | | | — | | | $ | 147,670 | |
| Gas | | | — | | | | 52,538 | | | | — | | | $ | 52,538 | |
| Hand/Machine Tools | | | — | | | | 56,709 | | | | — | | | $ | 56,709 | |
| Healthcare Products | | | — | | | | 145,943 | | | | — | | | $ | 145,943 | |
| Healthcare Services | | | — | | | | 62,299 | | | | — | | | $ | 62,299 | |
| Insurance | | | — | | | | 217,143 | | | | — | | | $ | 217,143 | |
| Internet | | | — | | | | 81,239 | | | | — | | | $ | 81,239 | |
| Machinery-Diversified | | | — | | | | 121,793 | | | | — | | | $ | 121,793 | |
| Media | | | 78,095 | | | | 54,383 | | | | — | | | $ | 132,478 | |
| Oil&Gas | | | — | | | | 83,804 | | | | — | | | $ | 83,804 | |
| Packaging & Containers | | | — | | | | 50,024 | | | | — | | | $ | 50,024 | |
| Pharmaceuticals | | | — | | | | 299,410 | | | | — | | | $ | 299,410 | |
| Pipelines | | | 51,350 | | | | — | | | | — | | | $ | 51,350 | |
| Real Estate | | | — | | | | 202,223 | | | | — | | | $ | 202,223 | |
| Retail | | | 53,665 | | | | 136,014 | | | | — | | | $ | 189,679 | |
| Semiconductors | | | 47,186 | | | | — | | | | — | | | $ | 47,186 | |
| Software | | | — | | | | 219,581 | | | | — | | | $ | 219,581 | |
| Storage Warhousing | | | — | | | | 56,879 | | | | — | | | $ | 56,879 | |
| Telecommunications | | | — | | | | 67,204 | | | | — | | | $ | 67,204 | |
| Transportation | | | 76,624 | | | | 31,390 | | | | — | | | $ | 108,014 | |
| Water | | | — | | | | 63,043 | | | | — | | | $ | 63,043 | |
| U.S Government Obligations | | | — | | | | 2,859,302 | | | | — | | | $ | 2,859,302 | |
| Total | | $ | 436,449 | | | $ | 6,383,774 | | | $ | — | | | $ | 6,820,223 | |
| Copeland SMID Cap Dividend Growth Fund |
| | | | | | | | | | | | | |
| Assets | | Level 1 | | | Level 2 | | | Level 3 | | | Total | |
| Common Stock* | | $ | 13,665,701 | | | $ | — | | | $ | — | | | $ | 13,665,701 | |
| Total | | $ | 13,665,701 | | | $ | — | | | $ | — | | | $ | 13,665,701 | |
The Funds did not hold any Level 3 securities during the period.
| * | Please refer to the Portfolio of Investments for Industry Classification. |
Securities in which the International Fund invests may be traded in markets that close before 4:00 p.m. Eastern Time (“ET”). In order to capture the developments that occur between the close of the foreign markets and 4:00 p.m. ET, the International Fund utilizes
| Copeland Trust |
| NOTES TO FINANCIAL STATEMENTS (Unaudited) (Continued) |
| May 31, 2020 |
fair value prices as provided by an independent pricing vendor on a daily basis for those securities traded on a foreign exchange. The assets valued at fair value are reflected as Level 2 assets in the table above.
SECURITY TRANSACTIONS AND INVESTMENT INCOME
Investment security transactions are accounted for on a trade date basis. Cost is determined and gains and losses are based upon the specific identification method for both financial statement and federal income tax purposes. Dividend income is recorded on the ex-dividend date and interest income is recorded on the accrual basis. Purchase discounts and premiums on securities are accreted and amortized over the life of the respective securities.
FEDERAL INCOME TAXES
The Funds intend to continue to comply with the requirements of Subchapter M of the Internal Revenue Code applicable to regulated investment companies and will distribute all of their taxable income, if any, to shareholders. Accordingly, no provision for Federal income taxes is required in the financial statements.
The Funds recognize the tax benefits of uncertain tax positions only where the position is “more likely than not” to be sustained assuming examination by tax authorities. Management has analyzed the Funds’ tax positions, and has concluded that no liability for unrecognized tax benefits should be recorded related to uncertain tax positions related to the open tax years (2017-2019) or expected to be taken in the Funds’ 2020 tax returns. The Funds identify their major tax jurisdictions as U.S. Federal and foreign jurisdictions where the Funds may make significant investments; however, the Funds are not aware of any tax positions for which it is reasonably possible that the total amounts of unrecognized tax benefits will change materially in the next twelve months.
FOREIGN CURRENCY
The accounting records of the Funds are maintained in U.S. dollars. Investment securities and other assets and liabilities denominated in a foreign currency, and income receipts and expense payments are translated into U.S. dollars using the prevailing exchange rate at the London market close. Purchases and sales of securities are translated into U.S. dollars at the contractual currency rates established at the approximate time of the trade. Net realized gains and losses on foreign currency transactions represent net gains and losses from currency realized between the trade and settlement dates on securities transactions and the difference between income accrued versus income received. The effects of changes in foreign currency exchange rates on investments in securities are included with the net realized and unrealized gain or loss on investment securities.
FORWARD CURRENCY CONTRACTS
As foreign securities are purchased, the Funds generally enter into forward currency exchange contracts in order to eliminate ongoing foreign currency exchange rate risks. As foreign securities are sold, the foreign currency proceeds are typically repatriated into US dollars. Any realized gains and losses between trade date and settlement date from contract transactions are included as a component of net realized gains (losses) from foreign currency transactions in the Statements of Operations. The Funds did not hold any forward currency contracts as of May 31, 2020.
CONCENTRATION OF RISK
Investing in securities of foreign issuers and currency transactions may involve certain considerations and risks not typically associated with investments in the United States. These risks include revaluation of currencies, adverse fluctuations in foreign currency values and possible adverse political, social and economic developments, including those particular to a specific industry, country or region. These conditions could cause the securities and their markets to be less liquid and prices more volatile than those of comparable U.S. companies and U.S. government securities.
DISTRIBUTIONS TO SHAREHOLDERS
Distributions from investment income, if any, are declared and paid annually and are recorded on the ex-dividend date. The Funds will declare and pay net realized capital gains, if any, annually. The character of income and gains to be distributed is determined in accordance with income tax regulations, which may differ from GAAP. These “book/tax” differences are considered either temporary (i.e., deferred losses, capital loss carry forwards) or permanent in nature. To the extent these differences are permanent in nature, such amounts are reclassified within the composition of net assets based on their federal tax-basis treatment; temporary differences do not require classification.
| Copeland Trust |
| NOTES TO FINANCIAL STATEMENTS (Unaudited) (Continued) |
| May 31, 2020 |
EXPENSES
Expenses of the Trust that are directly identifiable to a specific Fund are charged to that Fund. Expenses, which are not readily identifiable to a specific Fund, are allocated in such a manner as deemed equitable, taking into consideration the nature and type of expense and the relative sizes of the Funds in the Trust.
INDEMNIFICATION
The Trust indemnifies their officers and trustees for certain liabilities that may arise from the performance of their duties to the Trust. Additionally, in the normal course of business, the Funds enter into contracts that contain a variety of representations and warranties and which provide general indemnities. The Funds’ maximum exposure under these arrangements is unknown, as this would involve future claims that may be made against the Funds that have not yet occurred. However, based on experience, the Funds expect the risk of loss due to these warranties and indemnities to be remote.
| 3. | INVESTMENT ADVISORY AGREEMENT AND TRANSACTIONS WITH RELATED PARTIES |
ADVISORY FEE
Subject to the authority of the Board, the adviser is responsible for management of the Funds’ investment portfolios. Pursuant to the Management Agreement (the “Management Agreement”), investment advisory services are provided to the Funds by Copeland Capital Management, LLC (the “Adviser”). Under the terms of the Management Agreement, the Adviser receives monthly fees calculated at an annual rate of 1.00%, 1.10% and 0.75% for the Domestic Fund, the International Fund and SMID Fund respectively, of the average daily net assets of each Fund. For the six months ended May 31, 2020, the Adviser earned advisory fees of $511,500, $68,160 and $48,161 for the Domestic Fund, International Fund, and SMID Fund, respectively, before the effect of the Expense Limitation Agreement.
The Adviser, pursuant to an Expense Limitation Agreement (the “Agreement”) has contractually agreed to reduce its fees and/or absorb expenses of each Fund, at least until March 31, 2021, to ensure that Net Annual Operating Expenses (excluding any front-end or contingent deferred loads, brokerage fees and commissions, acquired fund fees and expenses, borrowing costs such as interest and dividend expense on securities sold short, taxes and extraordinary expenses such as litigation) will not exceed 1.45%, 2.20% and 1.30% of the Domestic Fund’s average daily net assets for Class A, Class C and Class I shares, respectively, 1.60%, 2.35% and 1.45% of the International Fund’s average daily net assets for Class A, Class C and Class I shares, respectively, and 1.20% and 0.95% of the SMID Fund’s average daily net assets for Class A and Class I, respectively, subject to possible recoupment from the Fund in future years on a rolling three year basis (within the three years after the fees have been deferred or reimbursed) if such recoupment can be achieved without exceeding the lesser of the expense limitation in effect at the time of the deferral and at the time of the repayment. For the six months ended May 31, 2020, the Adviser waived fees/reimbursed expenses of $234,666, $51,928 and $50,640 for the Domestic Fund, International Fund and SMID Fund, respectively.
The expenses subject to recapture for the Domestic Fund, the International Fund and the SMID Fund will expire on November 30 of the years indicated below:
| Copeland Risk Managed Dividend Growth Fund |
| |
| 2020 | | 2021 | | 2022 | | Total |
| $600,610 | | $420,780 | | $403,205 | | $1,424,595 |
| | | | | | | |
| Copeland International Risk Managed Dividend Growth Fund |
| |
| 2020 | | 2021 | | 2022 | | Total |
| $173,637 | | $173,709 | | $133,745 | | $481,091 |
| | | | | | | |
| Copeland SMID Cap Dividend Growth Fund |
| |
| 2020 | | 2021 | | 2022 | | Total |
| $48,465 | | $77,534 | | $97,581 | | $223,580 |
| Copeland Trust |
| NOTES TO FINANCIAL STATEMENTS (Unaudited) (Continued) |
| May 31, 2020 |
DISTRIBUTOR
The Board has adopted Distribution Plans and Agreements for each Fund (collectively the “Plan”) pursuant to Rule 12b-1 under the 1940 Act. The Plan provides that a monthly service and/or distribution fee is calculated by each Fund at an annual rate of 0.25% and 1.00% (of which up to 0.75% is a distribution fee and up to 0.25% is a service fee) of the average daily net assets attributable to Class A shares and Class C shares, respectively and is paid to Northern Lights Distributors, LLC (the “Distributor” or “NLD”), to provide compensation for ongoing distribution-related activities or services and/or maintenance of the Funds’ shareholder accounts, not otherwise required to be provided by the Adviser. The Plan is a compensation plan, which means that compensation is provided regardless of 12b-1 expenses incurred. For the six months ended May 31, 2020, the 12b-1 fees accrued amounted to $35,757 and $105,805 for the Domestic Fund, $1,810 and $5,621 for the International Fund for Class A and Class C shares, respectively. The 12b-1 fees accrued for the SMID Cap Dividend Growth Fund Class A shares were $51.
The Board has adopted non-Rule 12b-1 shareholder service plans (collectively, the “Shareholder Service Plan”) for the Class I shares of each Fund. The Shareholder Service Plan permits the Funds to pay brokers, financial intermediaries and others an annual fee of 0.10% of each Fund’s average daily net assets attributable to the Class I shares for shareholder support and/or administrative services, not otherwise provided by the Trust’s transfer agent. For the six months ended May 31, 2020, the Domestic Fund accrued $21,013, the International Fund accrued $3,670 and the SMID Cap Dividend Growth Fund accrued $1,812 in fees associated with the Shareholder Service Plan. The Funds’ Class A and Class C shares may also pay broker-dealers or other financial intermediaries for shareholder support services and/or administrative services based on the aggregate net asset value of the Class A and Class C shares, as applicable, owned of record or beneficially by the broker-dealers’ or financial intermediaries’ customers.
The Distributor acts as the Funds’ principal underwriter in a continuous public offering of the Funds’ shares. For the six months ended May 31, 2020, the Distributor received $885 in underwriting commissions for sales of Class A shares of the Domestic Fund, of which $143 was retained by the principal underwriter or other affiliated broker-dealers, $103 in underwriting commissions for sales of Class A shares of the International Fund of which $15 was retained by the principal underwriter or other affiliated broker-dealers and $568 in underwriting commissions for sales of Class A shares of the SMID Cap Dividend Growth Fund of which $83 was retained by the principal underwriter or other affiliated broker-dealers.
In addition, certain affiliates of the Distributor provide services to the Funds as follows:
GEMINI FUND SERVICES, LLC (“GFS”)
GFS, an affiliate of the Distributor, provides administration, fund accounting, and transfer agent services to the Trust. Pursuant to separate servicing agreements with GFS, the Fund pays GFS fees for providing administration, fund accounting, and transfer agency services to the Fund. These fees are disclosed in the Statement of Operations. An officer of the Fund is also an officer of GFS, and is not paid any fees directly by the Fund for servicing in such capacity.
BLU GIANT, LLC (“Blu Giant”)
Blu Giant, an affiliate of GFS and the Distributor, provides EDGAR conversion and filing services as well as print management services for the Funds on an ad-hoc basis. For the provision of these services, Blu Giant receives customary fees from the Funds.
CHIEF COMPLIANCE OFFICER
The Adviser is providing a Chief Compliance Officer to the Trust as well as related compliance services. The Trust reimburses the Adviser for an allocable portion of the chief Compliance Officer’s salary.
TRUSTEES
Each Trustee who is not affiliated with the Trust or Adviser receives (i) a base annual retainer of $30,000, (ii) $17,000 for attendance at four regularly scheduled Board meetings, (iii) $2,000 for attendance at each regularly scheduled Audit Committee meeting, (iv) $750 and $2,500 per each additional special telephonic or in person meeting, respectively, and (v) reimbursement for any reasonable expenses incurred attending the meetings. For carrying out his additional responsibilities, the independent Chairman of the Board receives an additional $11,000 per year. The foregoing compensation is paid in quarterly payments.
| Copeland Trust |
| NOTES TO FINANCIAL STATEMENTS (Unaudited) (Continued) |
| May 31, 2020 |
The “interested persons” who serve as Trustees of the Trust receive no compensation for their services as Trustees. None of the executive officers receive compensation from the Trust except for the CCO, a portion of whose salary is paid by the Trust for compliance services.
| 4. | INVESTMENT TRANSACTIONS |
The cost of purchases and the proceeds from sales of investments, other than short-term investments, for the six months ended May 31, 2020 were as follows:
| Fund | | Purchases | | | Sale Proceeds | |
| Risk Managed Dividend Growth Fund | | $ | 112,280,707 | | | $ | 149,514,829 | |
| International Risk Managed Dividend Growth Fund | | | 11,693,314 | | | | 18,255,012 | |
| SMID Cap Dividend Growth Fund | | | 6,393,000 | | | | 2,901,716 | |
| 5. | AGGREGATE UNREALIZED APPRECIATION AND DEPRECIATION – TAX BASIS |
The identified cost of investments in securities owned by the Funds for federal income tax purposes, and their respective gross unrealized appreciation and depreciation at May 31, 2020, were as follows:
| | | | | | Gross | | | Gross | | | Net Unrealized | |
| | | | | | Unrealized | | | Unrealized | | | Appreciation | |
| Fund | | Tax Cost | | | Appreciation | | | Depreciation | | | (Depreciation) | |
| Risk Managed Dividend Growth Fund | | $ | 76,501,252 | | | $ | 3,944,528 | | | $ | (2,598,233 | ) | | $ | 1,346,295 | |
| International Risk Managed Dividend Growth Fund | | | 6,900,793 | | | | 278,370 | | | | (358,940 | ) | | | (80,570 | ) |
| SMID Cap Dividend Growth Fund | | | 13,325,491 | | | | 1,215,623 | | | | (875,413 | ) | | | 340,210 | |
| 6. | DISTRIBUTIONS TO SHAREHOLDERS AND TAX COMPONENTS OF CAPITAL |
The tax character of fund distributions paid for the years ended November 30, 2019 and November 30, 2018 was as follows:
| For the year ended November 30, 2019: | |
| | | Ordinary | | | Long-Term | | | Return of | | | | |
| | | Income | | | Capital Gains | | | Capital | | | Total | |
| Risk Managed Dividend Growth Fund | | $ | 358,371 | | | $ | 11,811,791 | | | $ | — | | | $ | 12,170,162 | |
| International Risk Managed Dividend Growth Fund | | | — | | | | — | | | | — | | | | — | |
| SMID Cap Dividend Growth Fund | | | 11,638 | | | | 27,976 | | | | — | | | | 39,614 | |
| | | | | | | | | | | | | | | | | |
| For the year ended November 30, 2018: | |
| | | Ordinary | | | Long-Term | | | Return of | | | | |
| | | Income | | | Capital Gains | | | Capital | | | Total | |
| Risk Managed Dividend Growth Fund | | $ | 7,347,976 | | | $ | 373,723 | | | $ | — | | | $ | 7,721,699 | |
| International Risk Managed Dividend Growth Fund | | | 111,528 | | | | — | | | | 130,210 | | | | 241,738 | |
| SMID Cap Dividend Growth Fund | | | 4,608 | | | | 39 | | | | — | | | | 4,647 | |
Tax equalization allows a Fund to treat as distribution that portion of redemption proceeds representing a redeeming shareholder’s portion of undistributed taxable and net capital gains. The Copeland Risk Managed Dividend Growth Fund utilized equalization in the amount of $3,109,307 which resulted in a difference between tax distributions and book distributions as disclosed on the Statement of Changes in Net Assets for the period ended November 30, 2019. Net investment income and net realized gains (losses), as disclosed on the Statements of Operations and net assets were not affected by these reclassifications.
| Copeland Trust |
| NOTES TO FINANCIAL STATEMENTS (Unaudited) (Continued) |
| May 31, 2020 |
As of November 30, 2019, the components of accumulated earnings/(deficit) on a tax basis were as follows:
| | | Ordinary | | | Long-Term | | | and | | | Carry | | | Book/Tax | | | Appreciation/ | | | Accumulated | |
| | | Income | | | Capital Gains | | | Late Year Loss | | | Forwards | | | Differences | | | (Depreciation) | | | Earnings/(Deficits) | |
| Risk Managed Dividend Growth Fund | | $ | 1,745,139 | | | $ | 20,608,663 | | | $ | — | | | $ | — | | | $ | — | | | $ | 10,707,778 | | | $ | 33,061,580 | |
| International Risk Managed Dividend Growth Fund | | | 37,072 | | | | — | | | | — | | | | (1,778,554 | ) | | | — | | | | 1,365,892 | | | | (375,590 | ) |
| SMID Cap Dividend Growth Fund | | | 94,468 | | | | 75,741 | | | | — | | | | — | | | | — | | | | 714,490 | | | | 884,699 | |
The difference between book basis and tax basis undistributed net investment income/(loss), accumulated net realized gain/(loss), and unrealized appreciation/(depreciation) from investments is primarily attributable to the tax deferral of losses on wash sales, and adjustments for partnerships, and C-Corporation return of capital distributions.
At November 30, 2019, the Funds had capital loss carry forwards for federal income tax purposes available to offset future capital gains as follows:
| | | Non-Expiring | |
| | | Short-Term | | | Long-Term | | | Total | |
| Risk Managed Dividend Growth Fund | | $ | — | | | $ | — | | | $ | — | |
| International Risk Managed Dividend Growth Fund | | | 1,557,357 | | | | 221,197 | | | | 1,778,554 | |
| SMID Cap Dividend Growth Fund | | | — | | | | — | | | | — | |
Permanent book and tax differences, primarily attributable to the book/tax basis treatment of Fund distributions, resulted in reclassification for the year ended November 30, 2019 as follows:
| | | Paid | | | | |
| | | In | | | Accumulated | |
| | | Capital | | | Earnings (Losses) | |
| Risk Managed Dividend Growth Fund | | $ | 3,109,307 | | | $ | (3,109,307 | ) |
| International Risk Managed Dividend Growth Fund | | | — | | | | — | |
| SMID Cap Dividend Growth Fund | | | — | | | | — | |
The Funds may assess a short-term redemption fee of 1.00% of the total redemption amount if shareholders sell their shares after holding them for less than 30 days or if shares are redeemed for failure to maintain the Funds’ minimum account balance requirement. The redemption fee is paid directly to the Funds. For six months ended May 31, 2020, the Domestic Fund assessed $3, $4, and $1,529 in redemption fees for Class A, Class C and Class I shares, respectively and the International Fund assessed $16 in redemption fees for Class A and $2 in Redemption fees for Class I. The SMID Fund assessed $2 and $452 in redemption fees for Class A and Class I shares, respectively.
Subsequent events after the date of the Statement of Assets and Liabilities have been evaluated through the date the financial statements were issued. Management has determined that no events or transactions occurred requiring adjustment or disclosure in the financial statements.
| Copeland Trust |
| DISCLOSURE OF FUND EXPENSES (Unaudited) |
| May 31, 2020 |
As a shareholder of the Copeland Risk Managed Dividend Growth Fund, Copeland International Risk Managed Dividend Growth Fund, and the Copeland SMID Cap Dividend Growth Fund, you incur two types of costs (1) transaction costs, including sales charges (loads) on purchase payments and sales (for Class A shares only) and redemption fees; and (2) ongoing costs, including management fees, distribution and/or service (12b-1 fees for Class A and C shares only) fees, shareholder servicing fees and other Fund expenses. This example is intended to help you understand your ongoing costs (in dollars) of investing in the Funds and to compare these costs with the ongoing costs of investing in other mutual funds. Please note, the expenses shown in the tables are meant to highlight ongoing costs only and do not reflect any transactional costs. This example is based on an investment of $1,000 invested for the period of time as indicated in the table below.
Actual Expenses: The first line of the table provides information about actual account values and actual expenses. You may use the information in this line, together with the amount you invested, to estimate the expenses that you paid over the period. Simply divide your account value by $1,000 (for example, an $8,600 account value divided by $1,000 = 8.6), then multiply the result by the number in the first line under the heading entitled “Expenses Paid During the Period” to estimate the expenses you paid on your account during the period.
Hypothetical Examples for Comparison Purposes: The second line of the table below provides information about hypothetical account values and hypothetical expenses based on the Funds’ actual expense ratio and an assumed rate of return of 5% per year before expenses, which is not the Funds’ actual return. The hypothetical account values and expenses may not be used to estimate the actual ending account balance or expenses you paid for the period. You may use this information to compare the ongoing costs of investing in the Funds and other funds. To do so, compare this 5% hypothetical example with the 5% hypothetical examples that appear in the shareholder reports of the other funds.
Please note that the expenses shown in the table are meant to highlight your ongoing costs only and do not reflect any transactional costs, such as sales charges (loads) or redemption fees which may be applicable to your account. Therefore, the second line of the table is useful in comparing ongoing costs only, and will not help you determine the relative total costs of owning different funds. In addition, if these transactional costs were included, your costs would have been higher.
| | | | | | | | | |
| | | | | | | | | Expenses Paid |
| | | Beginning | | Ending | | | | During the |
| | | Account | | Account | | | | Period |
| | | Value | | Value | | Annualized | | (12/1/19 to |
| | | (12/1/19) | | (5/31/20) | | Expense Ratio | | 5/31/20) |
| Actual (a) | | | | | | | | |
| Copeland Risk Managed Dividend Growth Fund | | | | | | | | |
| Class A | | $1,000.00 | | $898.70 | | 1.45% | | $6.86 |
| Class C | | $1,000.00 | | $895.60 | | 2.19% | | $10.40 |
| Class I | | $1,000.00 | | $899.60 | | 1.30% | | $6.16 |
| Copeland International Risk Managed Dividend Growth Fund | | | | | | | | |
| Class A | | $1,000.00 | | $875.40 | | 1.60% | | $7.48 |
| Class C | | $1,000.00 | | $872.80 | | 2.34% | | $10.97 |
| Class I | | $1,000.00 | | $876.30 | | 1.45% | | $6.78 |
| Copeland SMID Cap Dividend Growth Fund | | | | | | | | |
| Class A | | $1,000.00 | | $911.00 | | 1.20% | | $5.72 |
| Class I | | $1,000.00 | | $912.10 | | 0.95% | | $4.53 |
| Hypothetical (a) | | | | | | | | |
| (5% return before expenses) | | | | | | | | |
| Copeland Risk Managed Dividend Growth Fund | | | | | | | | |
| Class A | | $1,000.00 | | $1,017.77 | | 1.45% | | $7.29 |
| Class C | | $1,000.00 | | $1,014.03 | | 2.19% | | $11.05 |
| Class I | | $1,000.00 | | $1,018.52 | | 1.30% | | $6.54 |
| Copeland International Risk Managed Dividend Growth Fund | | | | | | | | |
| Class A | | $1,000.00 | | $1,017.02 | | 1.60% | | $8.05 |
| Class C | | $1,000.00 | | $1,013.28 | | 2.34% | | $11.80 |
| Class I | | $1,000.00 | | $1,017.77 | | 1.45% | | $7.29 |
| Copeland SMID Cap Dividend Growth Fund | | | | | | | | |
| Class A | | $1,000.00 | | $1,019.02 | | 1.20% | | $6.04 |
| Class I | | $1,000.00 | | $1,020.26 | | 0.95% | | $4.78 |
| (a) | Expenses are equal to the average account value over the period, multiplied by the Fund’s annualized expense ratio, multiplied by the number of days in the six month period ended May 31, 2020 (183) divided by the number of days in the fiscal year (366). |
Considerations Regarding the Management Agreement
On May 13, 2020 the Board of Trustees of Copeland Trust the (“Trust”), including all of Trustees who are not interested persons under the Investment Company Act of 1940, as amended (the “Independent Trustees”), considered the continuance of the Management Agreement between the Trust, on behalf of the Copeland Risk Managed Dividend Growth Fund (the “Domestic Fund”), Copeland International Risk Managed Dividend Growth Fund (the “International Fund”), Copeland SMID Cap Dividend Growth Fund (the “SMID Cap Fund”) and Copeland Capital Management, LLC (“Copeland”). The Board reviewed and considered, among other items: (1) a memorandum from independent counsel setting forth the Trustees’ fiduciary duties, responsibilities and the factors the Trustees should consider in their evaluation of the Management Agreement; and (2) a report and presentation by Copeland that described, among other things: (a) the nature, extent and quality of the services provided by Copeland to each Fund and the experience and qualifications of the personnel providing those services; (b) its organizational structure, financial information, level of insurance coverage, Form ADV and SOC1 report; (c) its investment process and the strategy of each Fund; (d) its types of clients and assets under management;(e) its brokerage, soft dollar commission and trade allocation policies, including the types of research and services obtained in connection with soft dollar commissions; (f) the investment performance of each Fund as compared to its applicable benchmark index, Copeland’s other similarly managed accounts, if any, and relevant peer group; (g) its advisory fee arrangement with the Domestic Fund as compared to its relevant peer group and Copeland’s other similarly managed accounts; (h) its advisory fee arrangement with the International Fund as compared to its relevant peer group; (i) its advisory fee arrangement with the SMID Cap Fund as compared to its relevant peer group and Copeland’s other similarly managed accounts; (j) the contractual fee and expense waiver arrangement with each Fund; (k) its compliance program to monitor and review investment decisions and to prevent and detect violations of each Fund’s investment policies and limitations, as well as federal securities laws and conflicts of interest assessments, its business continuity and disaster recovery plan and information security system; (l) the costs of the services provided and the profits realized by Copeland from its relationships with each Fund; and (m) the extent to which economies of scale are relevant as each Fund grows, and whether the fee levels reflect these economies of scale to the benefit of shareholders. The Trustees discussed the written materials and Copeland’s oral presentation, together with information provided to the Trustees over the course of the year. In their deliberations, the Trustees did not identify any single piece of information that was all-important or controlling.
The Trustees, including all of the Independent Trustees, reached the following conclusions, among others, regarding Copeland and the Management Agreement. As to the nature, extent and quality of the services provided by Copeland to each Fund, its financial condition and the experience and qualifications of the portfolio managers, the Trustees determined that Copeland has the capabilities, resources and personnel necessary to manage each Fund and that they were satisfied with the quality of the services provided by Copeland in advising each Fund.
As to the costs of the services provided and the profits realized by Copeland, as discussed at the meeting, the Trustees concluded that they were satisfied that Copeland’s level of profitability from its relationships with the Domestic Fund seemed reasonable. The Trustees concluded that the negative profitability with respect to each of the International Fund and SMID Cap Fund was not a concern given each Fund’s relatively small asset base and Copeland’s overall financial strength. The Trustees also concluded that the benefits derived by Copeland from managing each Fund, including how it uses soft dollars, and the way in which it conducts portfolio transactions and selects brokers, seemed reasonable.
The Board also considered the management fees and expenses of each Domestic and International Funds’ Class A shares and the management fees and expenses of the SMID Cap Fund’s Class I shares. The Board concluded that, based on the information discussed at the meeting, each Fund’s management fee and expenses, taking into account Copeland’s agreement to waive fees and reimburse expenses to limit the expenses of each Fund, were reasonable as compared to the fees and expenses of comparable funds and, with respect to the Domestic Fund and the SMID Cap Fund, Copeland’s similarly managed accounts.
The Board also considered the investment performance of each Fund against its applicable benchmark index, peer group and with respect to the Domestic Fund and SMID Cap Fund, similarly managed accounts. Based on
this information, the Trustees concluded that the performance of each Fund and comparable strategy, as applicable, for the periods shown is generally mixed (performance for certain periods was higher than the comparative performance information, and in other cases it was lower).
As to economies of scale, the Trustees noted that the Management Agreement does not contain breakpoints that reduce the fee rate as assets grow. The Trustees considered the current asset levels of each Fund and Copeland’s agreement to waive fees and reimburse expenses as a means to limit each Fund’s expenses and concluded that, at this time, the absence of breakpoints was reasonable.
Based upon the Trustees’ deliberations and evaluation of the information described above, the Trustees, and separately by all of the Independent Trustees, determined that the terms of the Management Agreement were reasonable and fair to each Fund and its shareholders, and voted to renew the Management Agreement with respect to the each Fund.
| PRIVACY notice |
| |
| FACTS | WHAT DOES COPELAND TRUST DO WITH YOUR PERSONAL INFORMATION? |
| | |
| Why? | Financial companies choose how they share your personal information. Federal law gives consumers the right to limit some but not all sharing. Federal law also requires us to tell you how we collect, share, and protect your personal information. Please read this notice carefully to understand what we do. |
| | |
| What? | The types of personal information we collect and share depend on the product or service you have with us. This information can include: ■ Social Security number ■ Purchase History ■ Assets ■ Account Balances ■ Retirement Assets ■ Account Transactions ■ Transaction History ■ Wire Transfer Instructions ■ Checking Account Information When you are no longer our customer, we continue to share your information as described in this notice. |
| | |
| How? | All financial companies need to share customers’ personal information to run their everyday business. In the section below, we list the reasons financial companies can share their customers’ personal information; the reasons Copeland Trust chooses to share; and whether you can limit this sharing. |
| | | |
| Reasons we can share your personal information: | Does Copeland
Trust share? | Can you limit this sharing? |
For our everyday business purposes – such as to process your transactions, maintain your account(s), respond to court orders and legal investigations, or report to credit bureaus | Yes | No |
For our marketing purposes – to offer our products and services to you | No | We don’t share |
| For joint marketing with other financial companies | No | We don’t share |
For our affiliates’ everyday business purposes – information about your transactions and experiences | No | We don’t share |
For our affiliates’ everyday business purposes – information about your creditworthiness | No | We don’t share |
| For nonaffiliates to market to you | No | We don’t share |
| Questions? | Call 1-888-9-COPELAND (1-888-926-7352) |
| Who we are: |
| Who is providing this notice? | Copeland Trust |
| What we do: |
| How does Copeland Trust protect my personal information? | To protect your personal information from unauthorized access and use, we use security measures that comply with federal law. These measures include computer safeguards and secured files and buildings. Our service providers are held accountable for adhering to strict policies and procedures to prevent any misuse of your nonpublic personal information. |
| How does Copeland Trust collect my personal information? | We collect your personal information, for example, when you ■ Open an account ■ Provide account information ■ Give us your contact information ■ Make deposits or withdrawals from your account ■ Make a wire transfer ■ Tell us where to send the money ■ Tells us who receives the money ■ Show your government-issued ID ■ Show your driver’s license We also collect your personal information from other companies. |
| Why can’t I limit all sharing? | Federal law gives you the right to limit only ■ Sharing for affiliates’ everyday business purposes – information about your creditworthiness ■ Affiliates from using your information to market to you ■ Sharing for nonaffiliates to market to you State laws and individual companies may give you additional rights to limit sharing. |
| Definitions: |
| Affiliates | Companies related by common ownership or control. They can be financial and nonfinancial companies. ■ Copeland Trust does not share with our affiliates. |
| Nonaffiliates | Companies not related by common ownership or control. They can be financial and nonfinancial companies
■ Copeland Trust does not share with nonaffiliates so they can market to you. |
| Joint marketing | A formal agreement between nonaffiliated financial companies that together market financial products or services to you.
■ Copeland Trust does not jointly market. |
| Investment Adviser |
| Copeland Capital Management, LLC |
| 161 Washington Street, Suite 1325 |
| Conshohocken, PA 19428 |
| |
| Distributor |
| Northern Lights Distributors, LLC |
| 4221 North 203rd Street, Suite 100 |
| Elkhorn, NE 68022 |
| |
| Legal Counsel |
| Faegre Drinker Biddle & Reath, LLP |
| One Logan Square, Suite 2000 |
| Philadelphia, PA 19103 |
| |
| Independent Registered Public Accounting Firm |
| Tait, Weller & Baker LLP |
| Two Liberty Place |
| 50 South 16th Street, Suite 2900 |
| Philadelphia, PA 19102 |
| |
| Transfer Agent |
| Gemini Fund Services, LLC |
| 4221 North 203rd Street, Suite 100 |
| Elkhorn, NE 68022 |
| |
| Administrator |
| Gemini Fund Services, LLC |
| 80 Arkay Drive Suite 110 |
| Hauppauge, NY 11788 |
| |
| Custodian |
| The Northern Trust Company |
| 50 South LaSalle Street |
| Chicago, Il 60603 |
| |
| |
How to Obtain Proxy Voting Information
Information regarding how the Funds vote proxies relating to portfolio securities for the 12 month period ended June 30 as well as a description of the policies and procedures that the Funds used to determine how to vote proxies is available without charge, upon request, by calling 1-888-9-COPELAND or by referring to the Securities and Exchange Commission’s (“SEC”) website at http://www.sec.gov.
How to Obtain 1st and 3rd Fiscal Quarter Portfolio Holdings
The Funds file their complete schedule of portfolio holdings with the SEC for the first and third quarters of each fiscal year on Form N-Q. Form N-Q is available on the SEC’s website at http://www.sec.gov and may be reviewed and copied at the SEC’s Public Reference Room in Washington, DC (1-800-SEC-0330). The information on Form N-Q is available without charge, upon request, by calling 1-888-9-COPELAND. Form N-Q has been rescinded. Disclosure of the Funds’ complete holdings will be required to be made monthly on Form N-PORT, with every third month made available to the public by the SEC 60 days after the end of the Funds’ fiscal quarter.
Item 2. Code of Ethics. Not required for semi-annual reports.
Item 3. Audit Committee Financial Expert. Not required for semi-annual reports.
Item 4. Principal Accountant Fees and Services. Not required for semi-annual reports.
Item 5. Audit Committee of Listed Companies. Not applicable to open-end investment companies.
Item 6. Schedule of Investments.
| (a) | Schedule of investments in securities of unaffiliated issuers is included under Item 1. |
Item 7. Disclosure of Proxy Voting Policies and Procedures for Closed-End Funds. Not applicable to open-end investment companies.
Item 8. Portfolio Managers of Closed-End Funds. Not applicable to open-end investment companies.
Item 9. Purchases of Equity Securities by Closed-End Funds. Not applicable to open-end investment companies.
Item 10. Submission of Matters to a Vote of Security Holders. None
Item 11. Controls and Procedures.
(a) Based on an evaluation of the Registrant’s disclosure controls and procedures (as defined in rule 30a-3(c) under the Investment Company Act of 1940) as of the filing date of this report, Registrant’s principal executive officer and principal financial officer found such disclosure controls and procedures to be effective.
(b) There were no significant changes in the Registrant’s internal control over financial reporting that occurred during the Registrant’s last fiscal half-year that have materially affected, or are reasonably likely to materially affect, the Registrant’s internal control over financial reporting.
Item 12. Disclosure of Securities Lending Activities for Closed-End Management Investment Companies. Not applicable to open-end investment companies
Item 13. Exhibits.
(a)(1) Not applicable.
(a)(2) Certification required by Section 302 of the Sarbanes-Oxley Act of 2002 is filed herewith.
(a)(3) Not applicable for open-end investment companies.
(b) Certification required by Section 906 of the Sarbanes-Oxley Act of 2002 is filed herewith.
SIGNATURE
Pursuant to the requirements of the Securities Exchange Act of 1934 and the Investment Company Act of 1940, the Registrant has duly caused this report to be signed on its behalf by the undersigned, thereunto duly authorized.
Copeland Trust
By: /s/ Mark W. Giovanniello
Mark W. Giovanniello, Principal Executive Officer
Date 8/10/2020
Pursuant to the requirements of the Securities Exchange Act of 1934 and the Investment Company Act of 1940, this report has been signed below by the following persons on behalf of the Registrant and in the capacities and on the dates indicated.
By: /s/ Mark W. Giovanniello
Mark W. Giovanniello, Principal Executive Officer
Date 8/10/2020
By: /s/ Steven J. Adams
Steven J. Adams, Treasurer and Principal Financial Officer
Date 8/10/2020