united states
securities and exchange commission
washington, d.c. 20549
form n-csr
certified shareholder report of registered management
investment companies
Investment Company Act file number 811-22483
Copeland Trust
(Exact name of Registrant as specified in charter)
Eight Tower Bridge, 161 Washington St., Suite #1325 Conshohocken, PA 19428
(Address of principal executive offices) (Zip code)
Ultimus Fund Solutions, LLC, 80 Arkay Drive Suite 10, Hauppauge, NY 11788
(Name and address of agent for service)
Registrant's telephone number, including area code: (631) 470-2619
Date of fiscal year end: 11/30
Date of reporting period: 5/31/23
Item 1. Reports to Stockholders.
| | | |
| | | |
| | | |
| | Copeland | |
| | Dividend Growth Fund | |
| | Class A Shares: CDGRX | |
| | Class C Shares: CDCRX | |
| | Class I Shares: CDIVX | |
| | | |
| | Copeland | |
| | Smid Cap Dividend Growth Fund | |
| | Class A Shares: CSDGX | |
| | Class I Shares: CSMDX | |
| | | |
| | Copeland | |
| | International Small Cap Fund | |
| | Class A Shares: CISAX | |
| | Class I Shares: CSIIX | |
| | | |
| | | |
| | | |
| | | |
| | | |
| | | |
| | Semi-Annual Report | |
| | May 31, 2023 | |
| | | |
| | | |
| | | |
| | | |
| | | |
| | | |
| | | |
| | | |
| | | |
| | | |
| | Investor Information: 1-888-9-COPELAND | |
| | | |
| | This report and the financial statements contained herein are submitted for the general information of shareholders and are not authorized for distribution to prospective investors unless preceded or accompanied by an effective prospectus. Nothing herein contained is to be considered an offer of sale or solicitation of an offer to buy shares of the Funds. Such offering is made only by prospectus, which includes details as to offering price and other material information. | |
| | | |
| | Distributed by Northern Lights Distributors, LLC | |
| | Member FINRA | |
| | | |
Copeland Dividend Growth Fund
Semi-Annual Report
May 31, 2023
Dear Fellow Shareholders:
Copeland Capital Management is pleased to review the performance of the Dividend Growth Fund from December 1, 2022 through May 31, 2023. Unless otherwise stated herein, all data and statistics that follow are as of May 31, 2023.
During the six-month period, the Fund fell 2.2%, lagging the 3.3% advance registered by the S&P 500 Index. As the period unfolded, market advances were led by a handful of mega-cap technology stocks while the lion’s share of equities showed little or no gains. To wit, the NASDAQ Composite Index rose 13.3% during the period while the S&P 500 Equal Weight Index fell 5.3%. The bifurcated market environment was fostered by investor belief that technology shares are best positioned to grow earnings amidst a broader softening in corporate profitability. The recent frenzy surrounding artificial intelligence added fuel to the rally. Amidst the current backdrop, we are pleased that the Fund return has outpaced that of the S&P 500 Equal Weight Index.
Our stock selection in the Health Care sector of the market bolstered Fund returns while those in the Information Technology sector, despite rising over 14% on average, were a drag. Broadcom (AVGO, 2.2% of holdings at period end) was the top performing holding, advancing over 48% during the period. The semiconductor and software provider has a long history of successfully acquiring and integrating a wide range of technology companies. Additions immediately undergo cost-cutting measures that boost profitability and underlying cash flows. A broad suite of product offerings allows for cross selling to their customer base. Dividends and cash flow per share have advanced at a 12% and 19% rate, respectively, over the past three years. Further advances in 2023 are expected. Reflective of our strong relative performance in the Health Care sector, West Pharmaceutical (WST, 1.3% of holdings at period end) rose 43% during the period. The company provides medical supplies to the pharmaceutical, biotechnology, and generic drug industries. A broad customer base insulates West from the fortunes of any particular buyer, providing a strong underpinning for the toolmaker. Regulatory oversight of the medical manufacturing process discourages customer switching and provides a wide economic moat.
On the downside, Fund holding Truist Financial (TFC, 0.0% of holdings at period end) was a poor performer in the Fund, dipping roughly 38.2% during the period. The Charlotte, NC based regional bank came under pressure amidst a broader crisis in the banking sector. The failures of Silicon Valley Bank and Signature Bank, in March 2023, represent the second and third largest bankruptcies in U.S. history. Unrealized bond losses, incurred as the U.S. Federal Reserve (the “Fed”) sharply lifted interest rates, precipitated liquidity concerns which led depositors to flee the banks in question. While we do not believe that Truist will suffer a similar fate, we elected to exit the shares out of an abundance of caution and the likelihood that liquidity concerns will linger for some time. Chemical manufacturer Albemarle (ALB, 1.4% of holdings at period end) was also a laggard, falling 20.0% during the period. The company is the world’s largest producer of lithium for use in electric vehicle batteries and other applications. Lithium prices rose as high as $75,000 per ton in 2022, bolstered by anticipated demand for electric vehicle batteries. Slowing demand to start 2023 pushed prices down substantially, putting pressure on Albemarle shares. We anticipate that lithium prices will regain their footing as the year progresses and demand
growth outstrips supply. Growth could average 20% per year as electric vehicle adoption continues to expand and the company invests to expand production capacity.
The narrow market leadership of large technology stocks and the weakness felt among some cyclical stocks in the first half of 2023, reflects the economic pressures that are currently developing due to the impact of sharply higher interest rates implemented this year. Despite this, inflation remains stubbornly high, with the most recent Core Consumer Price Index reading rising 5.3% in May versus the prior year. This elevated reading, relative to the 2% rate targeted by the Fed, may induce further rate hikes in the months ahead. In fact, a combination of historic fiscal stimulus passed in recent years coupled with a rebound in the housing sector and accelerating investment in AI are all helping to forestall the widely forecast recession, making the Fed’s next moves all the more difficult to predict.
Amidst this challenging backdrop, we find the strong business models and market positions afforded by dividend growth securities to be of particular appeal. Those companies able to grow earnings, cash flows and dividends amidst the various headwinds and tailwinds described above will be the focus of our portfolio selection, aiding the Fund’s attempt to deliver strong risk adjusted returns.
Thank you for the confidence you have placed in Copeland and for your investment in the Copeland Dividend Growth Fund.
The views in this report are those of the Funds’ management. This report contains certain forward - looking statements about factors that may affect the performance of the Funds in the future. These statements are based on the Funds’ management’s predictions and expectations concerning certain future events such as the performance of the economy as a whole and of specific industry sectors. Management believes these forward- looking statements are reasonable, although they are inherently uncertain and difficult to predict. The views and opinions expressed in this letter are subject to change and may not be relied upon for investment advice. No forecasts can be guaranteed. The Fund holdings discussed herein are for informational purposes only and should not be perceived as investment recommendations by Copeland Capital Management. Holdings are subject to change, may not represent current holdings and are subject to risk. Performance data quoted here represents past performance. Past performance is no guarantee of future results. The return quoted reflects fee waivers and expense reimbursements in effect and would have been lower in their absence. Current performance may be lower or higher than the performance quoted above. The risks of investing in the Copeland Funds vary from fund to fund; to see the risks of investing in an individual fund, please refer to that fund’s latest prospectus.
You cannot invest directly in any index. Index returns do not include a deduction for fees or expenses. The S&P 500® Index is a market-capitalization-weighted index of the stocks of 500 leading companies in major industries of the U.S. economy. The Nasdaq Composite is a stock market index that includes almost all stocks listed on the Nasdaq stock exchange. The S&P 500® Equal Weight Index (EWI) is the equal-weight version of the widely-used S&P 500. The index includes the same constituents as the capitalization weighted S&P 500, but each company in the S&P 500 EWI is allocated a fixed weight - or 0.2% of the index total at each quarterly rebalance.
1788-NLD-07122023
| Copeland SMID Cap Dividend Growth Fund |
| Semi-Annual Report |
| May 31, 2023 |
Dear Fellow Shareholders:
Copeland Capital Management is pleased to review the performance of the Copeland SMID Cap Dividend Growth Fund from December 1, 2022 through May 31, 2023. Unless otherwise stated herein, all data and statistics that follow are as of May 31, 2023.
During the six-month period, the Fund returned -1.4%, beating the -5.7% decline in the Russell 2500 Index. The period began with great volatility; however that was substantially mitigated as the market stabilized towards the end of May. A decline in December to end calendar 2022 was followed by a double-digit gain in January, only to be upset by the banking turmoil that dominated fears in the latter part of the first quarter of 2023. The benchmarks ultimately bottomed out late in March. Though the crisis led to the demise of a handful of poorly managed banks that suffered from a flight of deposits, the vast majority survived, even as their stocks finished the period sharply lower. Investors’ attention soon shifted from this pessimism to excitement as a frenzy surrounding artificial intelligence (AI) added fuel to a Technology sector rally. Large capitalization equities were benefited most from the higher weight of Technology in the S&P 500 Index, leading to outperformance relative to smaller stocks. Amidst the shifting moods, our dividend growth stocks outperformed the indices on the downside and participated fully in the rebounds, thereby aiding the performance outcome for the period.
The Fund benefited substantially from the decline among Financials stocks, as higher quality lenders demonstrated their resilience by raising their dividend at an average rate of 9% during the period. In fact, Bank OZK (OZK, 1.4% of holdings at period end), extending its streak of 51 sequential quarterly hikes, raised its dividend twice, resulting in 13% growth year over year. Our Healthcare stocks also aided performance, as Covid-19 fears faded and labor shortages among nurses abated. Lemaitre Vascular (LMAT, 1.8%) saw demand for its vascular implants and devices accelerate as medical procedures rebounded, leading to better operating leverage on its expanding sales force, boosting profit expectations and the stock. The company’s 12% dividend increase was its 13th consecutive year of delivering double-digit growth. The Fund’s top performing stocks were dominated by Technology holdings, which rebounded from a tough 2022 when the highest growth stocks fell out of favor. Notably, Universal Display Corporation (OLED, 1.6% of holdings at period end), the leading supplier of technology patents and materials to the OLED display market, raised its dividend for the sixth year in a row, this time by a healthy 17%. The company was aided by the rebound in sentiment towards electronics suppliers, amid signs of growing penetration of OLED displays into the TV and tablet markets.
Fund performance was held back in the Consumer Discretionary sector, where Domino’s Pizza (DPZ, 1.2% of holdings at period end) and Advanced Auto Parts (AAP, 0.0% of holdings at period end) lagged the rebounding sentiment towards the space, despite fears of a developing recession. DPZ suffered from high labor costs and the return of patrons to dining in restaurants, after having widely favored delivery during the pandemic. We expect the tough comparisons to pass in coming quarters and their take-out and delivery services to become an increasingly attractive, low-cost option as pressures on the consumer intensify. AAP failed to capitalize on the recovery in driving activity and the aging of America’s car fleet, which has led to greater demand for auto parts repair services. The Fund sold the stock as management failed to deliver an increase in the dividend this spring, reflecting its poor execution and deterioration in
cash flows. Finally, TTEC Holdings (TTEC, 0.8% of holdings at period end) lagged the enthusiasm for Technology sector stocks as the call center outsourcing operator needs to prove to the market that it can meet the challenge of a rapidly changing technological and economic environment. The attention paid to AI was a headwind in the period, as the technology is both a risk and an opportunity for the company to deliver the most relevant and efficient customer experiences.
The narrow market leadership of large technology stocks, and weakness felt among some cyclical stocks in the first half of 2023, reflects the economic pressures that are currently developing due to the impact of sharply higher interest rates implemented this year. Despite this, inflation remains stubbornly high, with the most recent Core Consumer Price Index reading rising 5.3% in May versus the prior year. This elevated reading, relative to the 2% rate targeted by the U.S. Federal Reserve (the “Fed”), may induce further rate hikes in the months ahead. In fact, a combination of historic fiscal stimulus passed in recent years coupled with a rebound in the housing sector and accelerating investment in AI are all helping to forestall the widely forecast recession, making the Fed’s next moves all that more difficult to predict.
Amidst this challenging backdrop, we find the strong business models and market positions afforded by dividend growth securities to be of particular appeal. Those companies able to grow earnings, cash flows and dividends amidst the various headwinds and tailwinds described above will be the focus of our portfolio selection, aiding the Fund’s attempt to deliver strong risk adjusted returns.
Thank you for the confidence you have placed in Copeland and for your investment in the Copeland SMID Cap Dividend Growth Fund.
The views in this report are those of the Funds’ management. This report contains certain forward - looking statements about factors that may affect the performance of the Funds in the future. These statements are based on the Funds’ management’s predictions and expectations concerning certain future events such as the performance of the economy as a whole and of specific industry sectors. Management believes these forward- looking statements are reasonable, although they are inherently uncertain and difficult to predict. The views and opinions expressed in this letter are subject to change and may not be relied upon for investment advice. No forecasts can be guaranteed. The Fund holdings discussed herein are for informational purposes only and should not be perceived as investment recommendations by Copeland Capital Management. Holdings are subject to change, may not represent current holdings and are subject to risk. Performance data quoted here represents past performance. Past performance is no guarantee of future results. The return quoted reflects fee waivers and expense reimbursements in effect and would have been lower in their absence. Current performance may be lower or higher than the performance quoted above. The risks of investing in the Copeland Funds vary from fund to fund; to see the risks of investing in an individual fund, please refer to that fund’s latest prospectus.
You cannot invest directly in any index. Index returns do not include a deduction for fees or expenses. The Russell 2500 Index is comprised of the bottom 2500 companies in the Russell 3000 Index. The Russell 3000 Index measures the performance of the 3000 largest U.S. companies based on total market capitalization, which represents approximately 98% of the investable U.S. equity market. The S&P 500® Index is a market-capitalization-weighted index of the stocks of 500 leading companies in major industries of the U.S. economy.
1788-NLD-07122023
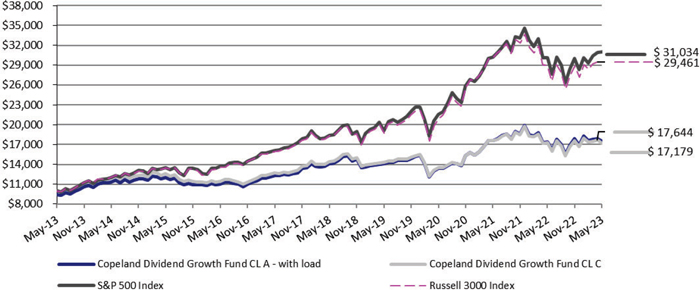
| Copeland Dividend Growth Fund |
| Portfolio Review (Unaudited) |
| May 31, 2013 through May 31, 2023 |
Performance of a $10,000 Investment (as of May 31, 2023)
| Average Annualized | | | | |
| Total Returns as of | | | | |
| May 31, 2023 | Six Months | One Year | Five Year | Ten Year |
| Copeland Dividend Growth Fund: | | | | |
| Class A | | | | |
| Without sales charge | (2.23)% | 0.17% | 4.40% | 6.36% |
| With sales charge + | (7.84)% | (5.56)% | 3.18% | 5.73% |
| Class C | (2.57)% | (0.62)% | 3.63% | 5.56% |
| Class I | (2.17)% | 0.27% | 4.56% | 6.53% |
| S&P 500 Index | 3.33% | 2.92% | 11.01% | 11.99% |
| Russell 3000 Index | 2.38% | 2.03% | 10.07% | 11.45% |
| + | Adjusted for initial maximum sales charge of 5.75%. |
The S&P 500 Index is an unmanaged market capitalization-weighted index which is comprised of 500 of the largest U.S. domiciled companies and includes the reinvestment of all dividends. Investors cannot invest directly in an index or benchmark.
The Russell 3000 Index measures the performance of the largest 3000 U.S. companies representing approximately 98% of the investable U.S. equity market and includes the reinvestment of all dividends. Investors cannot invest directly in an index or benchmark.
Past performance is not predictive of future results. The investment return and principal value of an investment will fluctuate. An investor’s shares, when redeemed, may be worth more or less than the original cost. The performance and returns do not reflect the deduction of taxes that a shareholder may pay on Fund distributions or redemption of Fund shares. Total return is calculated assuming reinvestment of all dividends and distributions. Total returns would have been lower had the adviser not waived its fees and reimbursed a portion of the Fund’s expenses. For performance information current to the most recent month-end please call toll-free 1-888-9-COPELAND (1-888-926-7352). Additional information can be found by visiting our website, www.copelandfunds.com. The Fund’s gross annual operating expense ratio, as stated in the current prospectus, is 1.99%, 2.74%, and 1.76%, for Class A, Class C, and Class I shares, respectively, and its net annual operating expense ratio is 1.20%, 1.95%, and 1.05%, for Class A, Class C, and Class I shares, respectively. These ratios can fluctuate and may differ from the expense ratios disclosed in the Financial Highlights section of this report. The Fund’s investment adviser has contractually agreed to reduce its fees and/or absorb expenses of the Fund, until at least March 31, 2024, to ensure that total annual fund operating expenses after fee deferral and/or reimbursement (exclusive of any taxes, leverage interest, borrowing interest, brokerage commissions, expenses incurred in connection with any merger or reorganization, dividend expense on securities sold short, acquired fund fees and expenses or extraordinary expenses such as litigation) will not exceed 1.20%, 1.95% and 1.05% for Class A, Class C and Class I shares, respectively, subject to possible recoupment from the Fund in future years on a rolling three year basis (within the three years after the fees have been deferred or reimbursed) if such recoupment can be achieved without exceeding the lesser of the expense limitation in effect at the time of the deferral and at the time of the repayment.
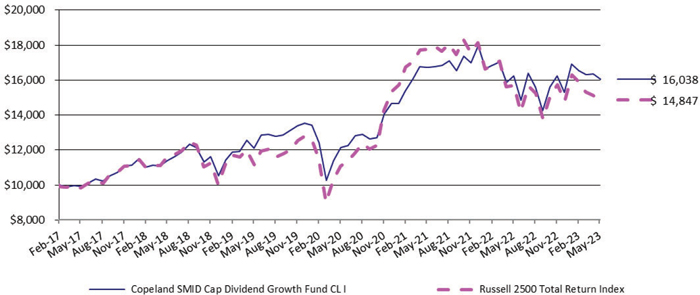
| Copeland SMID Cap Dividend Growth Fund |
| Portfolio Review (Unaudited) |
| February 27, 2017* through May 31, 2023 |
Performance of a $10,000 Investment (as of May 31, 2023)
| | | | | Since | Since |
| Total Returns as of | | | | Inception | Inception |
| May 31, 2023 | Six Months | One Year | Five Year | Class I * | Class A * |
| Copeland SMID Cap Dividend Growth Fund: | | | | | |
| Class I | (1.35)% | (1.14)% | 7.07% | 7.84% | — |
| Class A | | | | | |
| Without sales charge | (1.43)% | (1.36)% | — | — | 7.47% |
| With sales charge + | (7.08)% | (7.02)% | — | — | 5.99% |
| Russell 2500 Total Return Index | (5.71)% | (5.34)% | 4.97% | 6.52% | 6.49% |
| * | Class I shares commenced operations February 27, 2017. Class A commenced operations February 11, 2019 |
| + | Adjusted for initial maximum sales charge of 5.75%. |
The Russell 2500 Total Return Index is comprised of the smallest 2500 companies in the Russell 3000 Index. The Russell 3000 Index measures the performance of the 3,000 largest U.S. companies based on total market capitalization, which represents approximately 98% of the investable U.S. equity market. Investors cannot invest directly in an index or benchmark.
Past performance is not predictive of future results. The investment return and principal value of an investment will fluctuate. An investor’s shares, when redeemed, may be worth more or less than the original cost. The performance and returns do not reflect the deduction of taxes that a shareholder may pay on Fund distributions or redemption of Fund shares. Total return is calculated assuming reinvestment of all dividends and distributions. Total returns would have been lower had the adviser not waived its fees and reimbursed a portion of the Fund’s expenses. For performance information current to the most recent month-end please call toll-free 1-888-9-COPELAND (1-888-926-7352). Additional information can be found by visiting our website, www.copelandfunds.com. The Fund’s gross annual operating expense ratio, as stated in the current prospectus is 2.03% and 1.73% for Class A and Class I shares, respectively, and its net annual operating expense ratio is 1.20% and 0.95% for Class A and Class I shares, respectively. This ratio can fluctuate and may differ from the expense ratio disclosed in the Financial Highlights section of this report. The Fund’s adviser has contractually agreed to reduce its fees and/or absorb expenses of the Fund, until at least March 31, 2024, to ensure that total annual fund operating expenses after fee deferral and/or reimbursement (exclusive of any taxes, leverage interest, borrowing interest, brokerage commissions, expenses incurred in connection with any merger or reorganization, dividend expense on securities sold short, acquired fund fees and expenses or extraordinary expenses such as litigation) will not exceed 1.20% and 0.95% for Class A and Class I shares, respectively, subject to possible recoupment from the Fund in future years on a rolling three year basis (within the three years after the fees have been deferred or reimbursed) if such recoupment can be achieved without exceeding the lesser of the expense limitation in effect at the time of the deferral and at the time of the repayment.
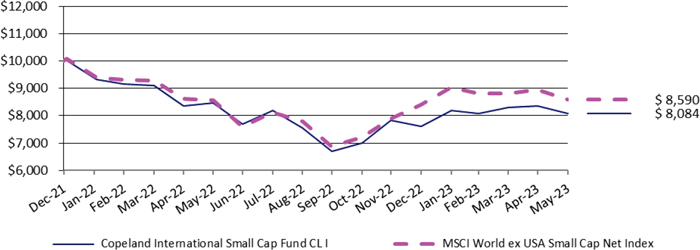
| Copeland International Small Cap Fund |
| Portfolio Review (Unaudited) |
| December 28, 2021* through May 31, 2023 |
Performance of a $10,000 Investment (as of May 31, 2023)
| Total Returns as of | | | Since |
| May 31, 2023 | Six Months | One Year | Inception* |
| Copeland International Small Cap Fund: | | | |
| Class I | 3.37% | (4.56)% | (13.90)% |
| Class A | | | |
| Without sales charge | 3.37% | (4.56)% | (13.90)% |
| With sales charge + | (2.61)% | (10.08)% | (17.41)% |
| MSCI World ex USA Small Cap Net Index | 8.86% | 0.22% | (12.97)% |
| * | The Fund commenced operations December 28, 2021. |
| + | Adjusted for initial maximum sales charge of 5.75%. |
The MSCI World ex USA Small Cap Net Index captures small cap representation across 22 of 23 Developed Markets (DM) countries (excluding the United States). With 2,555 constituents, the index covers approximately 14% of the free float-adjusted market capitalization in each country.
Past performance is not predictive of future results. The investment return and principal value of an investment will fluctuate. An investor’s shares, when redeemed, may be worth more or less than the original cost. The performance and returns do not reflect the deduction of taxes that a shareholder may pay on Fund distributions or redemption of Fund shares. Total return is calculated assuming reinvestment of all dividends and distributions. Total returns would have been lower had the adviser not waived its fees and reimbursed a portion of the Fund’s expenses. For performance information current to the most recent month-end please call toll-free 1-888-9-COPELAND (1-888-926-7352). Additional information can be found by visiting our website, www.copelandfunds.com. The Fund’s gross annual operating expense ratio, as stated in the current prospectus is 34.90% and 28.11% for Class A and Class I shares, respectively, and its net annual operating expense ratio is 1.23% and 0.98% for Class A and Class I shares, respectively. This ratio can fluctuate and may differ from the expense ratio disclosed in the Financial Highlights section of this report. The Fund’s adviser has contractually agreed to reduce its fees and/or absorb expenses of the Fund, until at least March 31, 2024, to ensure that total annual fund operating expenses after fee deferral and/or reimbursement (exclusive of any taxes, leverage interest, borrowing interest, brokerage commissions, expenses incurred in connection with any merger or reorganization, dividend expense on securities sold short, acquired fund fees and expenses or extraordinary expenses such as litigation) will not exceed 1.23% and 0.98% for Class A and Class I shares, respectively, subject to possible recoupment from the Fund in future years on a rolling three year basis (within the three years after the fees have been deferred or reimbursed) if such recoupment can be achieved without exceeding the lesser of the expense limitation in effect at the time of the deferral and at the time of the repayment.
| COPELAND DIVIDEND GROWTH FUND |
| SCHEDULE OF INVESTMENTS (Unaudited) |
May 31, 2023 |
| Shares | | | | | Fair Value | |
| | | | | COMMON STOCKS — 99.7% | | | | |
| | | | | APPAREL & TEXTILE PRODUCTS - 0.9% | | | | |
| | 3,830 | | | NIKE, Inc., Class B | | $ | 403,146 | |
| | | | | | | | | |
| | | | | ASSET MANAGEMENT - 5.5% | | | | |
| | 2,246 | | | Ameriprise Financial, Inc. | | | 670,363 | |
| | 963 | | | BlackRock, Inc. | | | 633,221 | |
| | 13,179 | | | Brookfield Infrastructure Corporation, Class A | | | 607,552 | |
| | 8,151 | | | Hamilton Lane, Inc., Class A | | | 553,534 | |
| | | | | | | | 2,464,670 | |
| | | | | BEVERAGES - 1.4% | | | | |
| | 2,653 | | | Constellation Brands, Inc., Class A | | | 644,599 | |
| | | | | | | | | |
| | | | | BIOTECH & PHARMA - 1.6% | | | | |
| | 4,258 | | | Zoetis, Inc. | | | 694,097 | |
| | | | | | | | | |
| | | | | CABLE & SATELLITE - 1.1% | | | | |
| | 770 | | | Cable One, Inc. | | | 471,109 | |
| | | | | | | | | |
| | | | | CHEMICALS - 4.1% | | | | |
| | 2,332 | | | Air Products and Chemicals, Inc. | | | 627,635 | |
| | 3,188 | | | Albemarle Corporation | | | 616,974 | |
| | 2,589 | | | Sherwin-Williams Company (The) | | | 589,722 | |
| | | | | | | | 1,834,331 | |
| | | | | COMMERCIAL SUPPORT SERVICES - 2.9% | | | | |
| | 5,177 | | | Insperity, Inc. | | | 573,197 | |
| | 5,092 | | | Waste Connections, Inc. | | | 695,822 | |
| | | | | | | | 1,269,019 | |
| | | | | CONSTRUCTION MATERIALS - 1.2% | | | | |
| | 2,460 | | | Carlisle Companies, Inc. | | | 522,602 | |
| | | | | | | | | |
| | | | | DATA CENTER REIT - 1.3% | | | | |
| | 792 | | | Equinix, Inc. | | | 590,476 | |
| COPELAND DIVIDEND GROWTH FUND | |
| SCHEDULE OF INVESTMENTS (Unaudited) (Continued) | |
| May 31, 2023 | |
| Shares | | | | | Fair Value | |
| | | | | COMMON STOCKS — 99.7% (Continued) | | | | |
| | | | | ELECTRIC UTILITIES - 1.5% | | | | |
| | 9,242 | | | NextEra Energy, Inc. | | $ | 678,917 | |
| | | | | | | | | |
| | | | | ELECTRICAL EQUIPMENT - 2.6% | | | | |
| | 7,253 | | | Amphenol Corporation, Class A | | | 547,239 | |
| | 7,574 | | | Otis Worldwide Corporation | | | 602,209 | |
| | | | | | | | 1,149,448 | |
| | | | | ENGINEERING & CONSTRUCTION - 1.3% | | | | |
| | 4,258 | | | Tetra Tech, Inc. | | | 585,347 | |
| | | | | | | | | |
| | | | | FOOD - 1.4% | | | | |
| | 37,333 | | | Utz Brands, Inc. | | | 614,128 | |
| | | | | | | | | |
| | | | | HEALTH CARE FACILITIES & SERVICES - 6.7% | | | | |
| | 12,195 | | | Encompass Health Corporation | | | 756,334 | |
| | 8,322 | | | Ensign Group, Inc. (The) | | | 737,412 | |
| | 1,840 | | | UnitedHealth Group, Inc. | | | 896,522 | |
| | 5,926 | | | US Physical Therapy, Inc. | | | 605,341 | |
| | | | | | | | 2,995,609 | |
| | | | | HOUSEHOLD PRODUCTS - 1.6% | | | | |
| | 5,712 | | | Inter Parfums, Inc. | | | 717,427 | |
| | | | | | | | | |
| | | | | INSTITUTIONAL FINANCIAL SERVICES - 1.4% | | | | |
| | 7,766 | | | Morgan Stanley | | | 634,948 | |
| | | | | | | | | |
| | | | | INSURANCE - 1.3% | | | | |
| | 5,306 | | | Allstate Corporation (The) | | | 575,436 | |
| | | | | | | | | |
| | | | | LEISURE FACILITIES & SERVICES - 4.1% | | | | |
| | 5,434 | | | Churchill Downs, Inc. | | | 738,046 | |
| | 1,904 | | | Domino’s Pizza, Inc. | | | 551,874 | |
| | 5,905 | | | Starbucks Corporation | | | 576,564 | |
| | | | | | | | 1,866,484 | |
| | | | | | | | | |
The accompanying notes are an intergral part of these financial statements.
| COPELAND DIVIDEND GROWTH FUND |
| SCHEDULE OF INVESTMENTS (Unaudited) (Continued) |
| May 31, 2023 |
| Shares | | | | | Fair Value | |
| | | | | COMMON STOCKS — 99.7% (Continued) | | | | |
| | | | | LEISURE PRODUCTS - 1.3% | | | | |
| | 7,574 | | | Brunswick Corporation | | $ | 571,837 | |
| | | | | | | | | |
| | | | | MACHINERY - 1.0% | | | | |
| | 2,075 | | | Nordson Corporation | | | 452,205 | |
| | | | | | | | | |
| | | | | MEDICAL EQUIPMENT & DEVICES - 5.6% | | | | |
| | 2,567 | | | Danaher Corporation | | | 589,435 | |
| | 3,102 | | | ResMed, Inc. | | | 653,871 | |
| | 3,402 | | | STERIS plc | | | 680,297 | |
| | 1,754 | | | West Pharmaceutical Services, Inc. | | | 586,941 | |
| | | | | | | | 2,510,544 | |
| | | | | OFFICE REIT - 0.9% | | | | |
| | 3,701 | | | Alexandria Real Estate Equities, Inc. | | | 419,915 | |
| | | | | | | | | |
| | | | | OIL & GAS PRODUCERS - 5.0% | | | | |
| | 6,461 | | | Diamondback Energy, Inc. | | | 821,516 | |
| | 21,780 | | | Northern Oil and Gas, Inc. | | | 651,440 | |
| | 3,723 | | | Pioneer Natural Resources Company | | | 742,515 | |
| | | | | | | | 2,215,471 | |
| | | | | PUBLISHING & BROADCASTING - 1.2% | | | | |
| | 3,808 | | | Nexstar Media Group, Inc. | | | 574,703 | |
| | | | | | | | | |
| | | | | REAL ESTATE SERVICES - 1.3% | | | | |
| | 37,483 | | | eXp World Holdings, Inc. | | | 576,863 | |
| | | | | | | | | |
| | | | | RESIDENTIAL REIT - 1.2% | | | | |
| | 8,237 | | | Equity LifeStyle Properties, Inc. | | | 520,331 | |
| | | | | | | | | |
| | | | | RETAIL - CONSUMER STAPLES - 4.4% | | | | |
| | 3,231 | | | Casey’s General Stores, Inc. | | | 729,076 | |
| | 1,198 | | | Costco Wholesale Corporation | | | 612,849 | |
| | 3,102 | | | Dollar General Corporation | | | 623,781 | |
| | | | | | | | 1,965,706 | |
The accompanying notes are an intergral part of these financial statements.
| COPELAND DIVIDEND GROWTH FUND |
| SCHEDULE OF INVESTMENTS (Unaudited) (Continued) |
| May 31, 2023 |
| Shares | | | | | Fair Value | |
| | | | | COMMON STOCKS — 99.7% (Continued) | | | | |
| | | | | RETAIL - DISCRETIONARY - 2.3% | | | | |
| | 1,626 | | | Home Depot, Inc. (The) | | $ | 460,890 | |
| | 5,306 | | | Ross Stores, Inc. | | | 549,807 | |
| | | | | | | | 1,010,697 | |
| | | | | SEMICONDUCTORS - 7.2% | | | | |
| | 1,241 | | | Broadcom, Inc. | | | 1,002,678 | |
| | 1,369 | | | Monolithic Power Systems, Inc. | | | 670,687 | |
| | 9,371 | | | Power Integrations, Inc. | | | 809,654 | |
| | 4,899 | | | Universal Display Corporation | | | 721,770 | |
| | | | | | | | 3,204,789 | |
| | | | | SOFTWARE - 3.3% | | | | |
| | 1,498 | | | Intuit, Inc. | | | 627,842 | |
| | 2,567 | | | Microsoft Corporation | | | 842,977 | |
| | | | | | | | 1,470,819 | |
| | | | | SPECIALTY FINANCE - 2.7% | | | | |
| | 15,832 | | | Air Lease Corporation | | | 601,933 | |
| | 5,712 | | | Discover Financial Services | | | 586,851 | |
| | | | | | | | 1,188,784 | |
| | | | | TECHNOLOGY HARDWARE - 4.1% | | | | |
| | 5,477 | | | Apple, Inc. | | | 970,798 | |
| | 3,081 | | | Motorola Solutions, Inc. | | | 868,596 | |
| | | | | | | | 1,839,394 | |
| | | | | TECHNOLOGY SERVICES - 14.2% | | | | |
| | 2,139 | | | Accenture PLC, Class A | | | 654,363 | |
| | 7,638 | | | Booz Allen Hamilton Holding Corporation | | | 768,230 | |
| | 3,765 | | | Broadridge Financial Solutions, Inc. | | | 552,401 | |
| | 4,086 | | | CDW Corporation | | | 701,525 | |
| | 1,155 | | | FactSet Research Systems, Inc. | | | 444,548 | |
| | 4,172 | | | Jack Henry & Associates, Inc. | | | 637,857 | |
| | 1,540 | | | MSCI, Inc. | | | 724,616 | |
| | 9,114 | | | TransUnion | | | 656,026 | |
| | 2,460 | | | Verisk Analytics, Inc. | | | 539,011 | |
| | 3,252 | | | Visa, Inc., Class A | | | 718,790 | |
| | | | | | | | 6,397,367 | |
The accompanying notes are an intergral part of these financial statements.
| COPELAND DIVIDEND GROWTH FUND |
| SCHEDULE OF INVESTMENTS (Unaudited) (Continued) |
| May 31, 2023 |
| Shares | | | | | Fair Value | |
| | | | | COMMON STOCKS — 99.7% (Continued) | | | | |
| | | | | TRANSPORTATION & LOGISTICS - 0.9% | | | | |
| | 2,503 | | | JB Hunt Transport Services, Inc. | | $ | 417,926 | |
| | | | | | | | | |
| | | | | WHOLESALE - DISCRETIONARY - 1.2% | | | | |
| | 1,690 | | | Pool Corporation | | | 534,429 | |
| | | | | | | | | |
| | | | | TOTAL COMMON STOCKS (Cost $38,103,636) | | | 44,583,573 | |
| | | | | | | | | |
| | | | | TOTAL INVESTMENTS - 99.7% (Cost $38,103,636) | | $ | 44,583,573 | |
| | | | | OTHER ASSETS IN EXCESS OF LIABILITIES - 0.3% | | | 133,211 | |
| | | | | NET ASSETS - 100.0% | | $ | 44,716,784 | |
| MSCI | - Morgan Stanley Capital International |
| PLC | - Public Limited Company |
| REIT | - Real Estate Investment Trust |
| Porfolio Composition as of May 31, 2023 (Unaudited) |
| Sector * | | Percent of Net Assets | |
| Technology | | | 29.2 | % |
| Health Care | | | 14.0 | % |
| Financials | | | 11.0 | % |
| Consumer Discretionary | | | 9.9 | % |
| Consumer Staples | | | 8.9 | % |
| Industrials | | | 8.8 | % |
| Materials | | | 5.3 | % |
| Energy | | | 5.0 | % |
| Real Estate | | | 4.8 | % |
| Communications | | | 2.4 | % |
| Utilities | | | 1.5 | % |
| Liabilities in Excess of Other Assets | | | (0.8 | )% |
| Net Assets | | | 100.0 | % |
| * | No industry represents more than 25% of the Fund’s assets. |
The accompanying notes are an intergral part of these financial statements.
| COPELAND SMID CAP DIVIDEND GROWTH FUND |
| SCHEDULE OF INVESTMENTS (Unaudited) |
| May 31, 2023 |
| Shares | | | | | Fair Value | |
| | | | | COMMON STOCKS — 95.5% | | | | |
| | | | | ASSET MANAGEMENT - 5.0% | | | | |
| | 18,914 | | | Brookfield Infrastructure Corporation, Class A | | $ | 871,935 | |
| | 10,433 | | | Cohen & Steers, Inc. | | | 567,660 | |
| | 11,054 | | | Hamilton Lane, Inc., Class A | | | 750,677 | |
| | 40,101 | | | Kennedy-Wilson Holdings, Inc. | | | 618,758 | |
| | | | | | | | 2,809,030 | |
| | | | | BANKING - 4.1% | | | | |
| | 22,755 | | | Bank OZK | | | 786,868 | |
| | 39,077 | | | Home BancShares, Inc. | | | 838,983 | |
| | 11,009 | | | Prosperity Bancshares, Inc. | | | 629,495 | |
| | | | | | | | 2,255,346 | |
| | | | | BIOTECH & PHARMA - 1.2% | | | | |
| | 20,899 | | | Perrigo Company plc | | | 667,932 | |
| | | | | | | | | |
| | | | | CABLE & SATELLITE - 1.3% | | | | |
| | 1,152 | | | Cable One, Inc. | | | 704,828 | |
| | | | | | | | | |
| | | | | CHEMICALS - 2.2% | | | | |
| | 33,700 | | | Element Solutions, Inc. | | | 604,241 | |
| | 3,296 | | | Quaker Houghton | | | 625,613 | |
| | | | | | | | 1,229,854 | |
| | | | | COMMERCIAL SUPPORT SERVICES - 6.0% | | | | |
| | 18,210 | | | ABM Industries, Inc. | | | 804,154 | |
| | 27,875 | | | GFL Environmental, Inc. | | | 1,007,403 | |
| | 7,393 | | | Insperity, Inc. | | | 818,553 | |
| | 3,840 | | | UniFirst Corporation | | | 657,062 | |
| | | | | | | | 3,287,172 | |
| | | | | CONSTRUCTION MATERIALS - 1.2% | | | | |
| | 3,168 | | | Carlisle Companies, Inc. | | | 673,010 | |
| | | | | | | | | |
| | | | | ELECTRICAL EQUIPMENT - 4.2% | | | | |
| | 11,809 | | | BWX Technologies, Inc. | | | 712,319 | |
| | 14,658 | | | Cognex Corporation | | | 805,605 | |
| | 3,136 | | | Littelfuse, Inc. | | | 802,941 | |
| | | | | | | | 2,320,865 | |
The accompanying notes are an intergral part of these financial statements.
| COPELAND SMID CAP DIVIDEND GROWTH FUND |
| SCHEDULE OF INVESTMENTS (Unaudited) (Continued) |
| May 31, 2023 |
| Shares | | | | | Fair Value | |
| | | | | COMMON STOCKS — 95.5% (Continued) | | | | |
| | | | | ENGINEERING & CONSTRUCTION - 1.5% | | | | |
| | 5,953 | | | Tetra Tech, Inc. | | $ | 818,359 | |
| | | | | | | | | |
| | | | | FORESTRY, PAPER & WOOD PRODUCTS - 0.8% | | | | |
| | 5,505 | | | UFP Industries, Inc. | | | 429,941 | |
| | | | | | | | | |
| | | | | GAS & WATER UTILITIES - 1.3% | | | | |
| | 5,569 | | | Chesapeake Utilities Corporation | | | 711,161 | |
| | | | | | | | | |
| | | | | HEALTH CARE FACILITIES & SERVICES - 8.2% | | | | |
| | 1,504 | | | Chemed Corporation | | | 802,790 | |
| | 15,394 | | | Encompass Health Corporation | | | 954,736 | |
| | 11,713 | | | Ensign Group, Inc. (The) | | | 1,037,889 | |
| | 5,729 | | | Quest Diagnostics, Inc. | | | 759,952 | |
| | 9,185 | | | US Physical Therapy, Inc. | | | 938,248 | |
| | | | | | | | 4,493,615 | |
| | | | | HOUSEHOLD PRODUCTS - 1.7% | | | | |
| | 7,393 | | | Inter Parfums, Inc. | | | 928,561 | |
| | | | | | | | | |
| | | | | INDUSTRIAL REIT - 1.4% | | | | |
| | 12,129 | | | Terreno Realty Corporation | | | 743,871 | |
| | | | | | | | | |
| | | | | INSURANCE - 2.5% | | | | |
| | 6,401 | | | Globe Life, Inc. | | | 660,455 | |
| | 2,272 | | | Kinsale Capital Group, Inc. | | | 688,371 | |
| | | | | | | | 1,348,826 | |
| | | | | INTERNET MEDIA & SERVICES - 1.3% | | | | |
| | 14,274 | | | Shutterstock, Inc. | | | 710,417 | |
| | | | | | | | | |
| | | | | LEISURE FACILITIES & SERVICES - 6.3% | | | | |
| | 7,681 | | | Churchill Downs, Inc. | | | 1,043,233 | |
| | 2,272 | | | Domino’s Pizza, Inc. | | | 658,539 | |
| | 19,522 | | | Travel + Leisure Company | | | 711,967 | |
| | 5,089 | | | Wingstop, Inc. | | | 1,014,543 | |
| | | | | | | | 3,428,282 | |
The accompanying notes are an intergral part of these financial statements.
| COPELAND SMID CAP DIVIDEND GROWTH FUND |
| SCHEDULE OF INVESTMENTS (Unaudited) (Continued) |
| May 31, 2023 |
| Shares | | | | | Fair Value | |
| | | | | COMMON STOCKS — 95.5% (Continued) | | | | |
| | | | | LEISURE PRODUCTS - 1.5% | | | | |
| | 11,169 | | | Brunswick Corporation | | $ | 843,260 | |
| | | | | | | | | |
| | | | | MACHINERY - 3.3% | | | | |
| | 3,584 | | | Nordson Corporation | | | 781,061 | |
| | 7,521 | | | Standex International Corporation | | | 1,024,285 | |
| | | | | | | | 1,805,346 | |
| | | | | MEDICAL EQUIPMENT & DEVICES - 3.5% | | | | |
| | 15,778 | | | LeMaitre Vascular, Inc. | | | 991,489 | |
| | 4,705 | | | STERIS plc | | | 940,859 | |
| | | | | | | | 1,932,348 | |
| | | | | OIL & GAS PRODUCERS - 5.7% | | | | |
| | 6,305 | | | Chord Energy Corporation | | | 901,867 | |
| | 9,505 | | | Civitas Resources, Inc. | | | 634,934 | |
| | 15,682 | | | Matador Resources Company | | | 689,538 | |
| | 30,596 | | | Northern Oil and Gas, Inc. | | | 915,126 | |
| | | | | | | | 3,141,465 | |
| | | | | PUBLISHING & BROADCASTING - 1.3% | | | | |
| | 4,673 | | | Nexstar Media Group, Inc. | | | 705,249 | |
| | | | | | | | | |
| | | | | REAL ESTATE SERVICES - 1.4% | | | | |
| | 50,374 | | | eXp World Holdings, Inc. | | | 775,256 | |
| | | | | | | | | |
| | | | | RESIDENTIAL REIT - 1.2% | | | | |
| | 16,322 | | | NexPoint Residential Trust, Inc. | | | 669,855 | |
| | | | | | | | | |
| | | | | RETAIL - CONSUMER STAPLES - 1.6% | | | | |
| | 3,840 | | | Casey’s General Stores, Inc. | | | 866,496 | |
| | | | | | | | | |
| | | | | RETAIL - DISCRETIONARY - 1.1% | | | | |
| | 14,562 | | | Monro, Inc. | | | 602,430 | |
| | | | | | | | | |
| | | | | SEMICONDUCTORS - 6.6% | | | | |
| | 8,759 | | | Entegris, Inc. | | | 921,884 | |
| | 16,770 | | | Kulicke & Soffa Industries, Inc. | | | 886,798 | |
The accompanying notes are an intergral part of these financial statements.
| COPELAND SMID CAP DIVIDEND GROWTH FUND |
| SCHEDULE OF INVESTMENTS (Unaudited) (Continued) |
| May 31, 2023 |
| Shares | | | | | Fair Value | |
| | | | | COMMON STOCKS — 95.5% (Continued) | | | | |
| | | | | SEMICONDUCTORS - 6.6% (Continued) | | | | |
| | 10,529 | | | Power Integrations, Inc. | | $ | 909,706 | |
| | 6,081 | | | Universal Display Corporation | | | 895,914 | |
| | | | | | | | 3,614,302 | |
| | | | | SPECIALTY FINANCE - 1.4% | | | | |
| | 19,490 | | | Air Lease Corporation | | | 741,010 | |
| | | | | | | | | |
| | | | | STEEL - 1.9% | | | | |
| | 4,353 | | | Reliance Steel & Aluminum Company | | | 1,021,562 | |
| | | | | | | | | |
| | | | | TECHNOLOGY SERVICES - 9.3% | | | | |
| | 9,025 | | | Booz Allen Hamilton Holding Corporation | | | 907,734 | |
| | 5,569 | | | Broadridge Financial Solutions, Inc. | | | 817,083 | |
| | 1,920 | | | FactSet Research Systems, Inc. | | | 738,989 | |
| | 5,185 | | | Jack Henry & Associates, Inc. | | | 792,735 | |
| | 3,168 | | | Morningstar, Inc. | | | 648,490 | |
| | 10,145 | | | TransUnion | | | 730,237 | |
| | 14,210 | | | TTEC Holdings, Inc. | | | 450,741 | |
| | | | | | | | 5,086,009 | |
| | | | | TELECOMMUNICATIONS - 1.3% | | | | |
| | 12,225 | | | Cogent Communications Holdings, Inc. | | | 752,082 | |
| | | | | | | | | |
| | | | | TRANSPORTATION & LOGISTICS - 1.6% | | | | |
| | 4,993 | | | Landstar System, Inc. | | | 875,672 | |
| | | | | | | | | |
| | | | | TRANSPORTATION EQUIPMENT - 1.3% | | | | |
| | 15,170 | | | Allison Transmission Holdings, Inc. | | | 717,541 | |
| | | | | | | | | |
| | | | | WHOLESALE - DISCRETIONARY - 1.3% | | | | |
| | 2,208 | | | Pool Corporation | | | 698,237 | |
The accompanying notes are an intergral part of these financial statements.
| COPELAND SMID CAP DIVIDEND GROWTH FUND |
| SCHEDULE OF INVESTMENTS (Unaudited) (Continued) |
| May 31, 2023 |
| Shares | | | | | Fair Value | |
| | | | | COMMON STOCKS — 95.5% (Continued) | | | | |
| | | | | WHOLESALE - DISCRETIONARY - 1.3% (Continued) | | | | |
| | | | | | | | | |
| | | | | TOTAL COMMON STOCKS (Cost $50,718,093) | | $ | 52,409,190 | |
| | | | | | | | | |
| | | | | TOTAL INVESTMENTS - 95.5% (Cost $50,718,093) | | $ | 52,409,190 | |
| | | | | OTHER ASSETS IN EXCESS OF LIABILITIES - 4.5% | | | 2,512,111 | |
| | | | | NET ASSETS - 100.0% | | $ | 54,921,301 | |
| PLC | - Public Limited Company |
| REIT | - Real Estate Investment Trust |
| Porfolio Composition as of May 31, 2023 (Unaudited) |
| Sector | | Percent of Net Assets | |
| Industrials | | | 17.9 | % |
| Technology | | | 15.8 | % |
| Financials | | | 13.0 | % |
| Health Care | | | 12.9 | % |
| Consumer Discretionary | | | 10.2 | % |
| Materials | | | 6.1 | % |
| Energy | | | 5.7 | % |
| Communications | | | 5.2 | % |
| Real Estate | | | 4.0 | % |
| Consumer Staples | | | 3.3 | % |
| Utilities | | | 1.3 | % |
| Other Assets in Excess of Liabilities | | | 4.6 | % |
| Net Assets | | | 100.0 | % |
The accompanying notes are an intergral part of these financial statements.
| COPELAND INTERNATIONAL SMALL CAP FUND |
| SCHEDULE OF INVESTMENTS (Unaudited) |
| May 31, 2023 |
| Shares | | | | | Fair Value | |
| | | | | COMMON STOCKS — 98.0% | | | | |
| | | | | Australia - 3.4% | | | | |
| | 533 | | | Lifestyle Communities Ltd. | | $ | 5,200 | |
| | 2,543 | | | Steadfast Group Ltd. | | | 9,802 | |
| | | | | | | | 15,002 | |
| | | | | Belgium - 2.8% | | | | |
| | 236 | | | Azelis Group N.V.(a) | | | 5,790 | |
| | 82 | | | Montea N.V. | | | 6,665 | |
| | | | | | | | 12,455 | |
| | | | | Canada - 11.6% | | | | |
| | 142 | | | Brookfield Infrastructure Corporation | | | 6,554 | |
| | 168 | | | Canadian Apartment Properties REIT | | | 6,069 | |
| | 414 | | | Freehold Royalties Ltd. | | | 4,269 | |
| | 531 | | | InterRent Real Estate Investment Trust | | | 5,136 | |
| | 152 | | | Stella-Jones, Inc. | | | 6,725 | |
| | 60 | | | TMX Group Ltd. | | | 6,530 | |
| | 79 | | | Toromont Industries Ltd. | | | 6,110 | |
| | 114 | | | Tourmaline Oil Corporation | | | 4,766 | |
| | 682 | | | Whitecap Resources, Inc. | | | 4,667 | |
| | | | | | | | 50,826 | |
| | | | | Cayman Islands - 2.2% | | | | |
| | 10,983 | | | Bosideng International Holdings Ltd. | | | 4,560 | |
| | 6,995 | | | Fu Shou Yuan International Group Ltd.(a) | | | 5,102 | |
| | | | | | | | 9,662 | |
| | | | | Denmark - 1.8% | | | | |
| | 187 | | | Sydbank A/S(a) | | | 7,837 | |
| | | | | | | | | |
| | | | | France - 2.6% | | | | |
| | 76 | | | ARGAN S.A. | | | 5,696 | |
| | 19 | | | Virbac S.A. | | | 5,801 | |
| | | | | | | | 11,497 | |
| | | | | Germany - 3.5% | | | | |
| | 195 | | | AIXTRON S.E. | | | 6,063 | |
| | 297 | | | Hensoldt A.G. | | | 9,476 | |
| | | | | | | | 15,539 | |
The accompanying notes are an intergral part of these financial statements.
| COPELAND INTERNATIONAL SMALL CAP FUND |
| SCHEDULE OF INVESTMENTS (Unaudited) (Continued) |
| May 31, 2023 |
| Shares | | | | | Fair Value | |
| | | | | COMMON STOCKS — 98.0% (Continued) | | | | |
| | | | | Greece - 2.2% | | | | |
| | 552 | | | OPAP S.A.(a) | | $ | 9,424 | |
| | | | | | | | | |
| | | | | Israel - 0.7% | | | | |
| | 2,312 | | | Bezeq The Israeli Telecommunication Corp Ltd.(a) | | | 2,893 | |
| | | | | | | | | |
| | | | | Italy - 6.2% | | | | |
| | 110 | | | Interpump Group SpA | | | 5,936 | |
| | 3,722 | | | Iren SpA | | | 7,440 | |
| | 158 | | | Recordati Industria Chimica e Farmaceutica SpA | | | 6,890 | |
| | 253 | | | Stevanato Group SpA | | | 6,808 | |
| | | | | | | | 27,074 | |
| | | | | Japan - 28.9% | | | | |
| | 258 | | | Asics Corporation | | | 6,891 | |
| | 201 | | | BayCurrent Consulting, Inc.(a) | | | 7,346 | |
| | 907 | | | Chiba Bank Ltd. (The)(a) | | | 5,658 | |
| | 50 | | | Cosmos Pharmaceutical Corporation | | | 4,750 | |
| | 660 | | | Elan Corporation | | | 4,096 | |
| | 99 | | | Fujimi, Inc. | | | 6,353 | |
| | 249 | | | FULLCAST Holdings Company Ltd. | | | 3,961 | |
| | 106 | | | Hamamatsu Photonics KK | | | 5,387 | |
| | 223 | | | Information Services International-Dentsu Ltd. | | | 8,043 | |
| | 437 | | | Internet Initiative Japan, Inc. | | | 8,599 | |
| | 298 | | | JCU Corporation | | | 7,389 | |
| | 1,406 | | | Mitsubishi UFJ Lease & Finance Company Ltd. | | | 7,626 | |
| | 253 | | | Nakanishi, Inc. | | | 5,332 | |
| | 355 | | | Nippon Gas Company Ltd. | | | 4,919 | |
| | 113 | | | Nissan Chemical Corporation | | | 4,901 | |
| | 222 | | | Rohto Pharmaceutical Company Ltd. | | | 4,729 | |
| | 266 | | | Shoei Company Ltd. | | | 4,971 | |
| | 227 | | | Strike Company Ltd.(a) | | | 5,613 | |
| | 163 | | | Taiyo Yuden Company Ltd. | | | 5,060 | |
| | 247 | | | Takeuchi Manufacturing Company Ltd. | | | 6,623 | |
| | 784 | | | Zeon Corporation | | | 8,106 | |
| | | | | | | | 126,353 | |
The accompanying notes are an intergral part of these financial statements.
| COPELAND INTERNATIONAL SMALL CAP FUND |
| SCHEDULE OF INVESTMENTS (Unaudited) (Continued) |
| May 31, 2023 |
| Shares | | | | | Fair Value | |
| | | | | COMMON STOCKS — 98.0% (Continued) | | | | |
| | | | | Netherlands - 1.2% | | | | |
| | 81 | | | Euronext N.V. | | $ | 5,404 | |
| | | | | | | | | |
| | | | | Norway - 1.6% | | | | |
| | 171 | | | Kongsberg Gruppen ASA | | | 6,852 | |
| | | | | | | | | |
| | | | | Spain - 1.2% | | | | |
| | 81 | | | Viscofan S.A. | | | 5,409 | |
| | | | | | | | | |
| | | | | Sweden - 3.5% | | | | |
| | 523 | | | Bravida Holding A.B.(a) | | | 5,118 | |
| | 424 | | | Hufvudstaden A.B.(a) | | | 5,081 | |
| | 265 | | | Sagax A.B. | | | 5,244 | |
| | | | | | | | 15,443 | |
| | | | | Switzerland - 3.2% | | | | |
| | 94 | | | Logitech International S.A. | | | 6,012 | |
| | 291 | | | SIG Combibloc Group A.G. | | | 7,957 | |
| | | | | | | | 13,969 | |
| | | | | United Kingdom - 16.4% | | | | |
| | 1,572 | | | Advanced Medical Solutions Group plc | | | 4,385 | |
| | 1,171 | | | Bytes Technology Group plc | | | 7,423 | |
| | 1,509 | | | Chemring Group plc | | | 4,791 | |
| | 172 | | | Diploma plc(a) | | | 6,493 | |
| | 285 | | | Halma PLC(a) | | | 8,552 | |
| | 1,005 | | | Pets at Home Group PLC | | | 4,704 | |
| | 407 | | | RS GROUP plc | | | 4,031 | |
| | 1,421 | | | RWS Holdings plc | | | 4,021 | |
| | 850 | | | Treatt plc | | | 7,366 | |
| | 648 | | | UNITE Group PLC (The) | | | 7,228 | |
| | 334 | | | WH Smith plc | | | 6,531 | |
| | 506 | | | YouGov plc | | | 6,287 | |
| | | | | | | | 71,812 | |
| | | | | United States - 5.0% | | | | |
| | 142 | | | Air Lease Corporation | | | 5,399 | |
| | 94 | | | Inter Parfums, Inc. | | | 11,806 | |
The accompanying notes are an intergral part of these financial statements.
| COPELAND INTERNATIONAL SMALL CAP FUND |
| SCHEDULE OF INVESTMENTS (Unaudited) (Continued) |
| May 31, 2023 |
| Shares | | | | | Fair Value | |
| | | | | COMMON STOCKS — 98.0% (Continued) | | | | |
| | | | | United States - 5.0% (Continued) | | | | |
| | 32 | | | Universal Display Corporation | | $ | 4,716 | |
| | | | | | | | 21,921 | |
| | | | | | | | | |
| | | | | TOTAL COMMON STOCKS (Cost $437,106) | | | 429,372 | |
| | | | | | | | | |
| Shares | | | | | Fair Value | |
| | | | | EXCHANGE-TRADED FUNDS — 1.8% | | | | |
| | | | | United States - 1.8% | | | | |
| | 139 | | | iShares MSCI EAFE Small-Cap ETF, EQUITY | | | 8,088 | |
| | | | | | | | | |
| | | | | TOTAL EXCHANGE-TRADED FUNDS (Cost $8,095) | | | 8,088 | |
| | | | | | | | | |
| | | | | TOTAL INVESTMENTS - 99.8% (Cost $445,201) | | $ | 437,460 | |
| | | | | OTHER ASSETS IN EXCESS OF LIABILITIES - 0.2% | | | 698 | |
| | | | | NET ASSETS - 100.0% | | $ | 438,158 | |
| EAFE | - Europe, Australasia and Far East |
| ETF | - Exchange-Traded Fund |
| MSCI | - Morgan Stanley Capital International |
| PLC | - Public Limited Company |
| REIT | - Real Estate Investment Trust |
| (a) | The value of this security has been determined in good faith under policies of the Board of Trustees. |
The accompanying notes are an intergral part of these financial statements.
| COPELAND INTERNATIONAL SMALL CAP FUND |
| SCHEDULE OF INVESTMENTS (Unaudited) (Continued) |
| May 31, 2023 |
| Porfolio Composition * as of May 31, 2023 (Unaudited) |
| Country | | | |
| Japan | | | 28.9 | % |
| United Kingdom | | | 16.4 | % |
| Canada | | | 11.6 | % |
| Italy | | | 6.2 | % |
| United States | | | 5.0 | % |
| Germany | | | 3.5 | % |
| Sweden | | | 3.5 | % |
| Australia | | | 3.4 | % |
| Switzerland | | | 3.2 | % |
| Belgium | | | 2.8 | % |
| Other Countries | | | 13.7 | % |
| Exchange-Traded Fund | | | 1.8 | % |
| Total | | | 100.0 | % |
| * | Based on total value of investments as of May 31, 2023. |
Percentage may differ from Schedule of Investments which are based on Fund net assets.
The accompanying notes are an intergral part of these financial statements.
| Copeland Trust |
| STATEMENTS OF ASSETS AND LIABILITIES (Unaudited) |
| May 31, 2023 |
| | | | | | Copeland SMID | | | Copeland | |
| | | Copeland Dividend | | | Cap Dividend | | | International | |
| | | Growth Fund | | | Growth Fund | | | Small Cap Fund | |
| Assets: | | | | | | | | | | | | |
| Investments, at Cost | | $ | 38,103,636 | | | $ | 50,718,093 | | | $ | 445,201 | |
| Investments in Securities, at Market Value | | $ | 44,583,573 | | | $ | 52,409,190 | | | $ | 437,460 | |
| Cash | | | 11,709 | | | | 2,732,174 | | | | 4,600 | |
| Foreign Cash (Cost $0, $0, $14) | | | — | | | | — | | | | 109 | |
| Dividends and Interest Receivable | | | 62,267 | | | | 70,801 | | | | 1,140 | |
| Receivable for Securities Sold | | | — | | | | 384,394 | | | | — | |
| Receivable for Fund Shares Sold | | | — | | | | 54,649 | | | | — | |
| Prepaid Expenses and Other Assets | | | 93,020 | | | | 45,211 | | | | 7,473 | |
| Total Assets | | | 44,762,977 | | | | 55,696,419 | | | | 464,407 | |
| | | | | | | | | | | | | |
| Liabilities: | | | | | | | | | | | | |
| Payable for Securities Purchased | | | — | | | | 736,925 | | | | — | |
| Payable for Fund Shares Redeemed | | | 15,544 | | | | 2,170 | | | | — | |
| Payable to Investment Adviser | | | — | | | | — | | | | 1,969 | |
| Accrued Audit Fees | | | 9,895 | | | | 8,812 | | | | 11,822 | |
| Accrued Distribution Fees | | | 11,169 | | | | 353 | | | | — | |
| Payable to Related Parties | | | 7,838 | | | | 7,840 | | | | 8,129 | |
| Other Accrued Expenses | | | 1,747 | | | | 19,018 | | | | 4,329 | |
| Total Liabilities | | | 46,193 | | | | 775,118 | | | | 26,249 | |
| | | | | | | | | | | | | |
| Net Assets | | $ | 44,716,784 | | | $ | 54,921,301 | | | $ | 438,158 | |
| | | | | | | | | | | | | |
| Composition of Net Assets: | | | | | | | | | | | | |
| At May 31, 2023, Net Assets consisted of: | | | | | | | | | | | | |
| Paid-in-Capital | | $ | 38,426,970 | | | $ | 54,586,963 | | | $ | 523,515 | |
| Accumulated Earnings/(Deficit) | | | 6,289,814 | | | | 334,338 | | | | (85,357 | ) |
| Net Assets | | $ | 44,716,784 | | | $ | 54,921,301 | | | $ | 438,158 | |
| | | | | | | | | | | | | |
| Class A Shares: | | | | | | | | | | | | |
| Net Assets | | $ | 13,906,700 | | | $ | 1,652,814 | | | $ | 8 | |
| | | | | | | | | | | | | |
| Shares Outstanding (no par value; unlimited number of shares authorized) | | | 1,216,742 | | | | 123,178 | | | | 1 | |
| | | | | | | | | | | | | |
| Net Asset Value and Redemption Price Per Share* | | $ | 11.43 | | | $ | 13.42 | | | $ | 7.86 | + |
| Offering Price Per Share (NAV/$0.9425) Includes a Maximum Sales Charge of 5.75% | | $ | 12.13 | | | $ | 14.24 | | | $ | 8.34 | |
| | | | | | | | | | | | | |
| Class C Shares: | | | | | | | | | | | | |
| Net Assets | | $ | 9,472,414 | | | | — | | | | — | |
| | | | | | | | | | | | | |
| Shares Outstanding (no par value; unlimited number of shares authorized) | | | 883,775 | | | | — | | | | — | |
| | | | | | | | | | | | | |
| Net Asset Value, Offering Price and Redemption Price Per Share* | | $ | 10.72 | | | | — | | | | — | |
| | | | | | | | | | | | | |
| Class I Shares: | | | | | | | | | | | | |
| Net Assets | | $ | 21,337,670 | | | $ | 53,268,487 | | | $ | 438,150 | |
| | | | | | | | | | | | | |
| Shares Outstanding (no par value; unlimited number of shares authorized) | | | 1,894,622 | | | | 3,945,490 | | | | 55,738 | |
| | | | | | | | | | | | | |
| Net Asset Value, Offering Price and Redemption Price Per Share* | | $ | 11.26 | | | $ | 13.50 | | | $ | 7.86 | |
| * | The Funds charge a 1.00% fee on shares redeemed less than 30 days after purchase or if shares held less than 30 days are redeemed for failure to maintain a balance that meets the minimum requirements listed in the Funds’ Prospectus. |
| + | NAV may not recalculate due to rounding. |
The accompanying notes are an integral part of these financial statements.
| Copeland Trust |
| STATEMENTS OF OPERATIONS (Unaudited) |
| For the Six Month Ended May 31, 2023 |
| | | | | | Copeland SMID | | | Copeland | |
| | | Copeland Dividend | | | Cap Dividend | | | International | |
| | | Growth Fund | | | Growth Fund | | | Small Cap Fund | |
| Investment Income: | | | | | | | | | | | | |
| Dividend Income | | $ | 419,397 | | | $ | 549,389 | | | $ | 5,523 | |
| Interest Income | | | — | | | | — | | | | 192 | |
| Less: Foreign Taxes Withholding | | | (3,155 | ) | | | (5,101 | ) | | | (1,197 | ) |
| Total Investment Income | | | 416,242 | | | | 544,288 | | | | 4,518 | |
| | | | | | | | | | | | | |
| Expenses: | | | | | | | | | | | | |
| Investment Advisory Fees | | | 178,608 | | | | 190,355 | | | | 1,523 | |
| Distribution Fees - Class C | | | 49,440 | | | | — | | | | — | |
| Distribution Fees - Class A | | | 18,043 | | | | 2,079 | | | | — | |
| Chief Compliance Officer Fees | | | 48,181 | | | | 51,423 | | | | 292 | |
| Trustees’ Fees | | | 25,438 | | | | 37,686 | | | | 478 | |
| Administration Fees | | | 22,685 | | | | 27,868 | | | | 13,020 | |
| Registration & Filing Fees | | | 17,502 | | | | 19,725 | | | | 201 | |
| Legal Fees | | | 19,102 | | | | 33,104 | | | | 223 | |
| Fund Accounting Fees | | | 15,511 | | | | 18,785 | | | | 16,389 | |
| Audit Fees | | | 10,203 | | | | 9,152 | | | | 5 ,822 | |
| Insurance Expense | | | 8,481 | | | | 6,564 | | | | 18 | |
| Custody Fees | | | 8,060 | | | | 16,608 | | | | 4,427 | |
| Transfer Agent Fees | | | 5,590 | | | | 22,698 | | | | 258 | |
| Shareholder Service Fees - Class I | | | 4,308 | | | | 12,528 | | | | — | |
| Non-Rule 12b-1 Shareholder Service Fees | | | 4,130 | | | | 332 | | | | — | |
| Printing Expense | | | 2,140 | | | | 5,038 | | | | 242 | |
| Miscellaneous Expenses | | | — | | | | — | | | | 439 | |
| Total Expenses | | | 437,422 | | | | 453,945 | | | | 43,332 | |
| Less: Fees Waived by Adviser | | | (132,268 | ) | | | (190,355 | ) | | | (1,523 | ) |
| Less: Other Expenses Reimbursed by Adviser | | | — | | | | (20,236 | ) | | | (39,893 | ) |
| Net Expenses | | | 305,154 | | | | 243,354 | | | | 1,916 | |
| Net Investment Income | | | 111,088 | | | | 300,934 | | | | 2,602 | |
| | | | | | | | | | | | | |
| Net Realized and Unrealized Gain (Loss) on Investments and Foreign Currency Transactions: | | | | | | | | | | | | |
| Net Realized Gain (Loss) on: | | | | | | | | | | | | |
| Securities | | | 1,778,976 | | | | (13,536 | ) | | | (7,454 | ) |
| Foreign Currency Transactions | | | — | | | | — | | | | 83 | |
| | | | 1,778,976 | | | | (13,536 | ) | | | (7,371 | ) |
| | | | | | | | | | | | | |
| Net Change in Unrealized Appreciation (Depreciation) on: | | | | | | | | | | | | |
| Securities | | | (3,034,581 | ) | | | (1,170,220 | ) | | | 15,382 | |
| Foreign Currency Transactions | | | — | | | | — | | | | (64 | ) |
| | | | (3,034,581 | ) | | | (1,170,220 | ) | | | 15,318 | |
| Net Realized and Unrealized Gain (Loss) on Investments and Foreign Currency Transactions: | | | (1,255,605 | ) | | | (1,183,756 | ) | | | 7,947 | |
| | | | | | | | | | | | | |
| Net Increase (Decrease) in Net Assets Resulting From Operations | | $ | (1,144,517 | ) | | $ | (882,822 | ) | | $ | 10,549 | |
The accompanying notes are an integral part of these financial statements.
| Copeland Dividend Growth Fund |
| STATEMENTS OF CHANGES IN NET ASSETS |
| | | For the | | | For the | |
| | | Six Months Ended | | | Year Ended | |
| | | May 31, 2023 | | | November 30, 2022 | |
| | | (Unaudited) | | | | |
| Operations: | | | | | | | | |
| Net Investment Income | | $ | 111,088 | | | $ | 349,457 | |
| Net Realized Gain on Investments | | | 1,778,976 | | | | 906,824 | |
| Net Change in Unrealized Depreciation on investments | | | (3,034,581 | ) | | | (4,047,251 | ) |
| Net Decrease in Net Assets Resulting From Operations | | | (1,144,517 | ) | | | (2,790,970 | ) |
| | | | | | | | | |
| Distributions to Shareholders From: | | | | | | | | |
| Total Distributions Paid | | | | | | | | |
| Class A | | | (944,442 | ) | | | (2,057,408 | ) |
| Class C | | | (619,122 | ) | | | (1,592,846 | ) |
| Class I | | | (1,662,393 | ) | | | (3,889,176 | ) |
| Total Distributions to Shareholders | | | (3,225,957 | ) | | | (7,539,430 | ) |
| | | | | | | | | |
| Beneficial Interest Transactions: | | | | | | | | |
| Class A | | | | | | | | |
| Proceeds from Shares Issued | | | 118,016 | | | | 925,192 | |
| Distributions Reinvested | | | 888,358 | | | | 1,889,194 | |
| Cost of Shares Redeemed | | | (1,264,115 | ) | | | (2,772,802 | ) |
| Total Class A Shares | | | (257,741 | ) | | | 41,584 | |
| Class C | | | | | | | | |
| Proceeds from Shares Issued | | | 8,571 | | | | 16,948 | |
| Distributions Reinvested | | | 612,576 | | | | 1,568,802 | |
| Cost of Shares Redeemed | | | (839,598 | ) | | | (2,288,082 | ) |
| Redemption Fees | | | — | | | | 4 | |
| Total Class C Shares | | | (218,451 | ) | | | (702,328 | ) |
| Class I | | | | | | | | |
| Proceeds from Shares Issued | | | 191,648 | | | | 73,412 | |
| Distributions Reinvested | | | 1,631,212 | | | | 3,820,604 | |
| Cost of Shares Redeemed | | | (3,748,175 | ) | | | (6,614,708 | ) |
| Redemption Fees | | | 45 | | | | — | |
| Total Class I Shares | | | (1,925,270 | ) | | | (2,720,692 | ) |
| Total Beneficial Interest Transactions | | | (2,401,462 | ) | | | (3,381,436 | ) |
| | | | | | | | | |
| Decrease in Net Assets | | | (6,771,936 | ) | | | (13,711,836 | ) |
| | | | | | | | | |
| Net Assets: | | | | | | | | |
| Beginning of Period | | | 51,488,720 | | | | 65,200,556 | |
| End of Period | | $ | 44,716,784 | | | $ | 51,488,720 | |
| | | | | | | | | |
| Share Activity: | | | | | | | | |
| Class A | | | | | | | | |
| Shares Issued | | | 10,568 | | | | 73,444 | |
| Distributions Reinvested | | | 78,269 | | | | 139,424 | |
| Shares Redeemed | | | (108,472 | ) | | | (224,571 | ) |
| Total Activity Class A Shares | | | (19,635 | ) | | | (11,703 | ) |
| Class C | | | | | | | | |
| Shares Issued | | | 807 | | | | 1,472 | |
| Distributions Reinvested | | | 57,357 | | | | 122,563 | |
| Shares Redeemed | | | (78,365 | ) | | | (196,711 | ) |
| Total Activity Class C Shares | | | (20,201 | ) | | | (72,676 | ) |
| Class I | | | | | | | | |
| Shares Issued | | | 17,037 | | | | 5,974 | |
| Distributions Reinvested | | | 146,035 | | | | 285,759 | |
| Shares Redeemed | | | (331,521 | ) | | | (544,731 | ) |
| Total Activity Class I Shares | | | (168,449 | ) | | | (252,998 | ) |
The accompanying notes are an integral part of these financial statements.
| Copeland SMID Cap Dividend Growth Fund |
| STATEMENTS OF CHANGES IN NET ASSETS |
| | | For the | | | For the | |
| | | Six Months Ended | | | Year Ended | |
| | | May 31, 2023 | | | November 30, 2022 | |
| | | (Unaudited) | | | | |
| Operations: | | | | | | | | |
| Net Investment Income | | $ | 300,934 | | | $ | 558,873 | |
| Net Realized Loss on Investments | | | (13,536 | ) | | | (309,069 | ) |
| Net Change in Unrealized Depreciation on Investments | | | (1,170,220 | ) | | | (2,066,348 | ) |
| Net Decrease in Net Assets Resulting From Operations | | | (882,822 | ) | | | (1,816,544 | ) |
| | | | | | | | | |
| Distributions to Shareholders From: | | | | | | | | |
| Total Distributions Paid | | | | | | | | |
| Class A | | | (61,549 | ) | | | (13,327 | ) |
| Class I | | | (1,752,207 | ) | | | (2,360,113 | ) |
| Total Distributions to Shareholders | | | (1,813,756 | ) | | | (2,373,440 | ) |
| | | | | | | | | |
| Beneficial Interest Transactions: | | | | | | | | |
| Class A | | | | | | | | |
| Proceeds from Shares Issued | | | 249,743 | | | | 1,543,686 | |
| Distributions Reinvested | | | 57,815 | | | | 13,327 | |
| Cost of Shares Redeemed | | | (242,989 | ) | | | (127,520 | ) |
| Redemption Fees | | | 25 | | | | 19 | |
| Total Class A Shares | | | 64,594 | | | | 1,429,512 | |
| Class I | | | | | | | | |
| Proceeds from Shares Issued | | | 14,892,936 | | | | 21,843,716 | |
| Distributions Reinvested | | | 1,660,663 | | | | 2,131,974 | |
| Cost of Shares Redeemed | | | (8,277,665 | ) | | | (7,747,664 | ) |
| Redemption Fees | | | 767 | | | | 1,656 | |
| Total Class I Shares | | | 8,276,701 | | | | 16,229,682 | |
| | | | | | | | | |
| Total Beneficial Interest Transactions | | | 8,341,295 | | | | 17,659,194 | |
| | | | | | | | | |
| Increase in Net Assets | | | 5,644,717 | | | | 13,469,210 | |
| | | | | | | | | |
| Net Assets: | | | | | | | | |
| Beginning of Period | | | 49,276,584 | | | | 35,807,374 | |
| End of Period | | $ | 54,921,301 | | | $ | 49,276,584 | |
| | | | | | | | | |
| Share Activity: | | | | | | | | |
| Class A | | | | | | | | |
| Shares Issued | | | 18,449 | | | | 113,959 | |
| Distributions Reinvested | | | 4,423 | | | | 869 | |
| Shares Redeemed | | | (18,011 | ) | | | (9,561 | ) |
| Total Activity Class A Shares | | | 4,861 | | | | 105,267 | |
| Class I | | | | | | | | |
| Shares Issued | | | 1,088,764 | | | | 1,540,114 | |
| Distributions Reinvested | | | 126,479 | | | | 138,530 | |
| Shares Redeemed | | | (615,082 | ) | | | (575,776 | ) |
| Total Activity Class I Shares | | | 600,161 | | | | 1,102,868 | |
The accompanying notes are an integral part of these financial statements.
| Copeland International Small Cap Fund |
| STATEMENT OF CHANGES IN NET ASSETS |
| | | For the | | | For the | |
| | | Six Months Ended | | | Period Ended | |
| | | May 31, 2023 | | | November 30, 2022 * | |
| | | (Unaudited) | | | | |
| Operations: | | | | | | | | |
| Net Investment Income | | $ | 2,602 | | | $ | 6,270 | |
| Net Realized Loss on Investments and Foreign Currency Transactions | | | (7,371 | ) | | | (70,567 | ) |
| Net Change in Unrealized Appreciation (Depreciation) on Investments and Foreign Currency Transactions | | | 15,318 | | | | (23,093 | ) |
| Net Increase (Decrease) in Net Assets Resulting From Operations | | | 10,549 | | | | (87,390 | ) |
| | | | | | | | | |
| Distributions to Shareholders From: | | | | | | | | |
| Total Distributions Paid | | | | | | | | |
| Class I | | | (8,524 | ) | | | — | |
| Total Distributions to Shareholders | | | (8,524 | ) | | | — | |
| | | | | | | | | |
| Beneficial Interest Transactions: | | | | | | | | |
| Class A | | | | | | | | |
| Proceeds from Shares Issued | | | — | | | | 10 | |
| Total Class A Shares | | | — | | | | 10 | |
| Class I | | | | | | | | |
| Proceeds from Shares Issued | | | 114,999 | | | | 399,990 | |
| Distributions Reinvested | | | 8,524 | | | | — | |
| Cost of Shares Redeemed | | | — | | | | — | |
| Redemption Fees | | | — | | | | — | |
| Total Class I Shares | | | 123,523 | | | | 399,990 | |
| Total Beneficial Interest Transactions | | | 123,523 | | | | 400,000 | |
| | | | | | | | | |
| Increase in Net Assets | | | 125,548 | | | | 312,610 | |
| | | | | | | | | |
| Net Assets: | | | | | | | | |
| Beginning of Period | | | 312,610 | | | | — | |
| End of Period | | $ | 438,158 | | | $ | 312,610 | |
| | | | | | | | | |
| Share Activity: | | | | | | | | |
| Class A | | | | | | | | |
| Shares Issued | | | — | | | | 1 | |
| Total Activity Class A Shares | | | — | | | | 1 | |
| Class I | | | | | | | | |
| Shares Issued | | | 14,601 | | | | 39,999 | |
| Distributions Reinvested | | | 1,138 | | | | — | |
| Total Activity Class I Shares | | | 15,739 | | | | 39,999 | |
| * | Fund commenced operations on December 28, 2021. |
The accompanying notes are an integral part of these financial statements.
| Copeland Dividend Growth Fund |
| FINANCIAL HIGHLIGHTS |
Certain information in the table below reflects financial results for one share of beneficial interest outstanding throughout each year/period presented.
| | | Class A | |
| | | Six Months | | | Year | | | Year | | | Year | | | Year | | | Year | |
| | | Ended | | | Ended | | | Ended | | | Ended | | | Ended | | | Ended | |
| | | May 31, 2023 | | | November 30, 2022 | | | November 30, 2021 | | | November 30, 2020 | | | November 30, 2019 | | | November 30, 2018 | |
| | | (Unaudited) | | | | | | | | | | | | | | | | |
| | | | | | | | | | | | | | | | | | | | | | | | | |
| Net Asset Value, Beginning of Year/Period | | $ | 12.49 | | | $ | 14.59 | | | $ | 11.99 | | | $ | 14.25 | | | $ | 15.18 | | | $ | 14.38 | |
| | | | | | | | | | | | | | | | | | | | | | | | | |
| Increase (Decrease) From Operations: | | | | | | | | | | | | | | | | | | | | | | | | |
| Net investment income (a) | | | 0.03 | | | | 0.09 | | | | 0.04 | | | | 0.01 | | | | 0.10 | | | | 0.04 | |
| Net gain (loss) from securities (both realized and unrealized) | | | (0.31 | ) | | | (0.53 | ) | | | 2.56 | | | | (0.48 | ) | | | 0.05 | | | | 1.38 | |
| Other capital changes | | | — | | | | — | | | | — | | | | 0.73 | (d) | | | — | | | | — | |
| Total from operations | | | (0.28 | ) | | | (0.44 | ) | | | 2.60 | | | | 0.26 | | | | 0.15 | | | | 1.42 | |
| | | | | | | | | | | | | | | | | | | | | | | | | |
| Distributions to shareholders from: | | | | | | | | | | | | | | | | | | | | | | | | |
| Net investment income | | | (0.09 | ) | | | (0.02 | ) | | | — | | | | (0.09 | ) | | | (0.01 | ) | | | (0.03 | ) |
| Net realized gains | | | (0.69 | ) | | | (1.64 | ) | | | — | | | | (2.43 | ) | | | (1.07 | ) | | | (0.59 | ) |
| Total distributions | | | (0.78 | ) | | | (1.66 | ) | | | — | | | | (2.52 | ) | | | (1.08 | ) | | | (0.62 | ) |
| | | | | | | | | | | | | | | | | | | | | | | | | |
| Redemption fees (b) | | | 0.00 | | | | 0.00 | | | | 0.00 | | | | 0.00 | | | | 0.00 | | | | 0.00 | |
| | | | | | | | | | | | | | | | | | | | | | | | | |
| Net Asset Value, End of Year/Period | | $ | 11.43 | | | $ | 12.49 | | | $ | 14.59 | | | $ | 11.99 | | | $ | 14.25 | | | $ | 15.18 | |
| | | | | | | | | | | | | | | | | | | | | | | | | |
| Total Return (c) | | | (2.23 | )% (f) | | | (3.91 | )% | | | 21.68 | % | | | 2.24 | % | | | 1.32 | % | | | 10.33 | % |
| | | | | | | | | | | | | | | | | | | | | | | | | |
| Ratios/Supplemental Data | | | | | | | | | | | | | | | | | | | | | | | | |
| Net assets, end of year/period (in 000’s) | | $ | 13,907 | | | $ | 15,441 | | | $ | 18,212 | | | $ | 18,800 | | | $ | 36,870 | | | $ | 52,779 | |
| Ratio of expenses to average net assets: | | | | | | | | | | | | | | | | | | | | | | | | |
| before reimbursement | | | 1.79 | % (e) | | | 1.99 | % | | | 1.93 | % | | | 2.13 | % | | | 1.74 | % | | | 1.71 | % |
| net of reimbursement | | | 1.20 | % (e) | | | 1.20 | % | | | 1.20 | % | | | 1.44 | % | | | 1.45 | % | | | 1.45 | % |
| Ratio of net investment income to average net asset | | | 0.55 | % (e) | | | 0.72 | % | | | 0.29 | % | | | 0.10 | % | | | 0.70 | % | | | 0.28 | % |
| Portfolio turnover rate | | | 19 | % (f) | | | 40 | % | | | 34 | % | | | 170 | % | | | 244 | % | | | 30 | % |
| (a) | Per share amounts are calculated using the average shares method, which more appropriately presents the per share data for the year/period. |
| (b) | Less than $0.01 per share. |
| (c) | Total returns are historical in nature and assume changes in share price, reinvestment of dividends and capital gains distributions, if any. Had the Adviser not absorbed a portion of fund expenses, the total return would have been lower. Sales loads are not reflected in total return. |
| (d) | As required by SEC standard per share data calculation methodology, this represents a balancing figure derived from the other amounts in the financial highlights tables that captures all other changes affecting net asset value per share. |
The accompanying notes are an integral part of these financial statements.
| Copeland Dividend Growth Fund |
| FINANCIAL HIGHLIGHTS |
Certain information in the table below reflects financial results for one share of beneficial interest outstanding throughout each year/period presented.
| | | Class C | |
| | | Six Months | | | Year | | | Year | | | Year | | | Year | | | Year | |
| | | Ended | | | Ended | | | Ended | | | Ended | | | Ended | | | Ended | |
| | | May 31, 2023 | | | November 30, 2022 | | | November 30, 2021 | | | November 30, 2020 | | | November 30, 2019 | | | November 30, 2018 | |
| | | (Unaudited) | | | | | | | | | | | | | | | | |
| | | | | | | | | | | | | | | | | | | | | | | | | |
| Net Asset Value, Beginning of Year/Period | | $ | 11.71 | | | $ | 13.85 | | | $ | 11.47 | | | $ | 13.73 | | | $ | 14.76 | | | $ | 14.06 | |
| | | | | | | | | | | | | | | | | | | | | | | | | |
| Increase (Decrease) From Operations: | | | | | | | | | | | | | | | | | | | | | | | | |
| Net investment loss (a) | | | (0.01 | ) | | | (0.01 | ) | | | (0.06 | ) | | | (0.07 | ) | | | (0.01 | ) | | | (0.07 | ) |
| Net gain (loss) from securities (both realized and unrealized) | | | (0.29 | ) | | | (0.49 | ) | | | 2.44 | | | | (0.30 | ) | | | 0.05 | | | | 1.36 | |
| Other capital changes | | | — | | | | — | | | | — | | | | 0.54 | (d) | | | — | | | | — | |
| Total from operations | | | (0.30 | ) | | | (0.50 | ) | | | 2.38 | | | | 0.17 | | | | 0.04 | | | | 1.29 | |
| | | | | | | | | | | | | | | | | | | | | | | | | |
| Distributions to shareholders from: | | | | | | | | | | | | | | | | | | | | | | | | |
| Net investment income | | | — | | | | — | | | | — | | | | — | | | | — | | | | — | |
| Net realized gains | | | (0.69 | ) | | | (1.64 | ) | | | — | | | | (2.43 | ) | | | (1.07 | ) | | | (0.59 | ) |
| Total distributions | | | (0.69 | ) | | | (1.64 | ) | | | — | | | | (2.43 | ) | | | (1.07 | ) | | | (0.59 | ) |
| | | | | | | | | | | | | | | | | | | | | | | | | |
| Redemption fees (b) | | | 0.00 | | | | 0.00 | | | | 0.00 | | | | 0.00 | | | | 0.00 | | | | 0.00 | |
| | | | | | | | | | | | | | | | | | | | | | | | | |
| Net Asset Value, End of Year/Period | | $ | 10.72 | | | $ | 11.71 | | | $ | 13.85 | | | $ | 11.47 | | | $ | 13.73 | | | $ | 14.76 | |
| | | | | | | | | | | | | | | | | | | | | | | | | |
| Total Return (c) | | | (2.57 | )% (f) | | | (4.63 | )% | | | 20.75 | % | | | 1.51 | % | | | 0.54 | % | | | 9.55 | % |
| | | | | | | | | | | | | | | | | | | | | | | | | |
| Ratios/Supplemental Data | | | | | | | | | | | | | | | | | | | | | | | | |
| Net assets, end of year/period (in 000’s) | | $ | 9,472 | | | $ | 10,586 | | | $ | 13,530 | | | $ | 15,401 | | | $ | 25,271 | | | $ | 32,597 | |
| Ratio of expenses to average net assets: | | | | | | | | | | | | | | | | | | | | | | | | |
| before reimbursement | | | 2.54 | % (e) | | | 2.74 | % | | | 2.69 | % | | | 2.88 | % | | | 2.49 | % | | | 2.45 | % |
| net of reimbursement | | | 1.95 | % (e) | | | 1.95 | % | | | 1.95 | % | | | 2.19 | % | | | 0.20 | % | | | 2.20 | % |
| Ratio of net investment loss to average net assets | | | (0.20 | )% (e) | | | (0.04 | )% | | | (0.46 | )% | | | (0.67 | )% | | | (0.05 | )% | | | (0.46 | )% |
| Portfolio turnover rate | | | 19 | % (f) | | | 40 | % | | | 34 | % | | | 170 | % | | | 244 | % | | | 30 | % |
| (a) | Per share amounts are calculated using the average shares method, which more appropriately presents the per share data for the year/period. |
| (b) | Less than $0.01 per share. |
| (c) | Total returns are historical in nature and assume changes in share price, reinvestment of dividends and capital gains distributions, if any. Had the Adviser not absorbed a portion of fund expenses, the total return would have been lower. |
| (d) | As required by SEC standard per share data calculation methodology, this represents a balancing figure derived from the other amounts in the financial highlights tables that captures all other changes affecting net asset value per share. |
The accompanying notes are an integral part of these financial statements.
| Copeland Dividend Growth Fund |
| FINANCIAL HIGHLIGHTS |
Certain information in the table below reflects financial results for one share of beneficial interest outstanding throughout each year/period presented.
| | | Class I | |
| | | Six Months | | | Year | | | Year | | | Year | | | Year | | | Year | |
| | | Ended | | | Ended | | | Ended | | | Ended | | | Ended | | | Ended | |
| | | May 31, 2023 | | | November 30, 2022 | | | November 30, 2021 | | | November 30, 2020 | | | November 30, 2019 | | | November 30, 2018 | |
| | | (Unaudited) | | | | | | | | | | | | | | | | |
| | | | | | | | | | | | | | | | | | | | | | | | | |
| Net Asset Value, Beginning of Year/Period | | $ | 12.34 | | | $ | 14.45 | | | $ | 11.85 | | | $ | 14.12 | | | $ | 15.08 | | | $ | 14.30 | |
| | | | | | | | | | | | | | | | | | | | | | | | | |
| Increase (Decrease) From Operations: | | | | | | | | | | | | | | | | | | | | | | | | |
| Net investment income (a) | | | 0.04 | | | | 0.10 | | | | 0.06 | | | | 0.03 | | | | 0.11 | | | | 0.07 | |
| Net gain (loss) from securities (both realized and unrealized) | | | (0.31 | ) | | | (0.52 | ) | | | 2.54 | | | | (0.38 | ) | | | 0.06 | | | | 1.37 | |
| Other capital changes | | | — | | | | — | | | | — | | | | 0.63 | (d) | | | — | | | | — | |
| Total from operations | | | (0.27 | ) | | | (0.42 | ) | | | 2.60 | | | | 0.28 | | | | 0.17 | | | | 1.44 | |
| | | | | | | | | | | | | | | | | | | | | | | | | |
| Distributions to shareholders from: | | | | | | | | | | | | | | | | | | | | | | | | |
| Net investment income | | | (0.12 | ) | | | (0.05 | ) | | | — | | | | (0.12 | ) | | | (0.06 | ) | | | (0.07 | ) |
| Net realized gains | | | (0.69 | ) | | | (1.64 | ) | | | — | | | | (2.43 | ) | | | (1.07 | ) | | | (0.59 | ) |
| Total distributions | | | (0.81 | ) | | | (1.69 | ) | | | — | | | | (2.55 | ) | | | (1.13 | ) | | | (0.66 | ) |
| | | | | | | | | | | | | | | | | | | | | | | | | |
| Redemption fees (b) | | | 0.00 | | | | 0.00 | | | | 0.00 | | | | 0.00 | | | | 0.00 | | | | 0.00 | |
| | | | | | | | | | | | | | | | | | | | | | | | | |
| Net Asset Value, End of Year/Period | | $ | 11.26 | | | $ | 12.34 | | | $ | 14.45 | | | $ | 11.85 | | | $ | 14.12 | | | $ | 15.08 | |
| | | | | | | | | | | | | | | | | | | | | | | | | |
| Total Return (c) | | | (2.17 | )% (f) | | | (3.82 | )% | | | 21.94 | % | | | 2.40 | % | | | 1.43 | % | | | 10.56 | % |
| | | | | | | | | | | | | | | | | | | | | | | | | |
| Ratios/Supplemental Data | | | | | | | | | | | | | | | | | | | | | | | | |
| Net assets, end of year/period (in 000’s) | | $ | 21,338 | | | $ | 25,461 | | | $ | 33,459 | | | $ | 36,164 | | | $ | 66,649 | | | $ | 81,516 | |
| Ratio of expenses to average net assets: | | | | | | | | | | | | | | | | | | | | | | | | |
| before reimbursement | | | 1.57 | % (e) | | | 1.76 | % | | | 1.75 | % | | | 1.98 | % | | | 1.58 | % | | | 1.53 | % |
| net of reimbursement | | | 1.05 | % (e) | | | 1.05 | % | | | 1.05 | % | | | 1.29 | % | | | 1.30 | % | | | 1.30 | % |
| Ratio of net investment income to average net asset | | | 0.70 | % (e) | | | 0.85 | % | | | 0.44 | % | | | 0.23 | % | | | 0.85 | % | | | 0.45 | % |
| Portfolio turnover rate | | | 19 | % (f) | | | 40 | % | | | 34 | % | | | 170 | % | | | 244 | % | | | 30 | % |
| (a) | Per share amounts are calculated using the average shares method, which more appropriately presents the per share data for the year/period. |
| (b) | Less than $0.01 per share. |
| (c) | Total returns are historical in nature and assume changes in share price, reinvestment of dividends and capital gains distributions, if any. Had the Adviser not absorbed a portion of fund expenses, the total return would have been lower. |
| (d) | As required by SEC standard per share data calculation methodology, this represents a balancing figure derived from the other amounts in the financial highlights tables that captures all other changes affecting net asset value per share. |
The accompanying notes are an integral part of these financial statements.
| Copeland SMID Cap Dividend Growth Fund |
| FINANCIAL HIGHLIGHTS |
Certain information in the table below reflects financial results for one share of beneficial interest outstanding throughout the year/period presented.
| | | Class A | |
| | | Six Months | | | Year | | | Year | | | Year | | | Period | |
| | | Ended | | | Ended | | | Ended | | | Ended | | | Ended | |
| | | May 31, 2023 | | | November 30, 2022 | | | November 30, 2021 | | | November 30, 2020 | | | November 30, 2019 * | |
| | | (Unaudited) | | | | | | | | | | | | | |
| | | | | | | | | | | | | | | | | | | | | |
| Net Asset Value, Beginning of Year/Period | | $ | 14.15 | | | $ | 15.80 | | | $ | 13.14 | | | $ | 12.73 | | | $ | 11.10 | |
| | | | | | | | | | | | | | | | | | | | | |
| Increase (Decrease) From Operations: | | | | | | | | | | | | | | | | | | | | |
| Net investment income (a) | | | 0.06 | | | | 0.13 | | | | 0.06 | | | | 0.10 | | | | 0.10 | |
| Net gain (loss) from securities (both realized and unrealized) | | | (0.28 | ) | | | (0.77 | ) | | | 2.63 | | | | 0.50 | | | | 1.53 | |
| Total from operations | | | (0.22 | ) | | | (0.64 | ) | | | 2.69 | | | | 0.60 | | | | 1.63 | |
| | | | | | | | | | | | | | | | | | | | | |
| Distributions to shareholders from: | | | | | | | | | | | | | | | | | | | | |
| Net investment income | | | (0.17 | ) | | | (0.04 | ) | | | (0.03 | ) | | | (0.05 | ) | | | — | |
| Net realized gains | | | (0.34 | ) | | | (0.97 | ) | | | — | | | | (0.14 | ) | | | — | |
| Total distributions | | | (0.51 | ) | | | (1.01 | ) | | | (0.03 | ) | | | (0.19 | ) | | | — | |
| | | | | | | | | | | | | | | | | | | | | |
| Redemption fees (b) | | | 0.00 | | | | 0.00 | | | | 0.00 | | | | 0.00 | | | | 0.00 | |
| | | | | | | | | | | | | | | | | | | | | |
| Net Asset Value, End of Year/Period | | $ | 13.42 | | | $ | 14.15 | | | $ | 15.80 | | | $ | 13.14 | | | $ | 12.73 | |
| | | | | | | | | | | | | | | | | | | | | |
| Total Return (c) | | | (1.43 | )% (e) | | | (4.50 | )% | | | 20.55 | % | | | 4.73 | % | | | 14.68 | % (e) |
| | | | | | | | | | | | | | | | | | | | | |
| Ratios/Supplemental Data | | | | | | | | | | | | | | | | | | | | |
| Net assets, end of year/period (in 000’s) | | $ | 1,653 | | | $ | 1,674 | | | $ | 206 | | | $ | 108 | | | $ | 34 | |
| Ratio of expenses to average net assets: | | | | | | | | | | | | | | | | | | | | |
| before reimbursement | | | 1.98 | % (d) | | | 2.03 | % | | | 2.10 | % | | | 2.72 | % | | | 3.04 | % (d) |
| net of reimbursement | | | 1.20 | % (d) | | | 1.20 | % | | | 1.20 | % | | | 1.20 | % | | | 1.20 | % (d) |
| Ratio of net investment income to average net assets | | | 0.93 | % (d) | | | 0.96 | % | | | 0.42 | % | | | 0.87 | % | | | 0.82 | % (d) |
| Portfolio turnover rate | | | 23 | % (e) | | | 40 | % | | | 35 | % | | | 49 | % | | | 22 | % (e) |
| * | Class A commenced operations on February 11, 2019. |
| (a) | Per share amounts are calculated using the average shares method, which more appropriately presents the per share data for the period/year. |
| (b) | Less than $0.01 per share. |
| (c) | Total returns are historical in nature and assume changes in share price, reinvestment of dividends and capital gains distributions, if any. Had the Adviser not absorbed a portion of fund expenses, the total return would have been lower. Sales loads are not reflected in total return. |
The accompanying notes are an integral part of these financial statements.
| Copeland SMID Cap Dividend Growth Fund |
| FINANCIAL HIGHLIGHTS |
Certain information in the table below reflects financial results for one share of beneficial interest outstanding throughout each year/period presented.
| | | Class I | |
| | | Six Months | | | Year | | | Year | | | Year | | | Year | | | Year | |
| | | Ended | | | Ended | | | Ended | | | Ended | | | Ended | | | Ended | |
| | | May 31, 2023 | | | November 30, 2022 | | | November 30, 2021 | | | November 30, 2020 | | | November 30, 2019 | | | November 30, 2018 | |
| | | (Unaudited) | | | | | | | | | | | | | | | | |
| | | | | | | | | | | | | | | | | | | | | | | | | |
| Net Asset Value, Beginning of Year/Period | | $ | 14.23 | | | $ | 15.88 | | | $ | 13.19 | | | $ | 12.76 | | | $ | 11.54 | | | $ | 11.10 | |
| | | | | | | | | | | | | | | | | | | | | | | | | |
| Increase (Decrease) From Operations: | | | | | | | | | | | | | | | | | | | | | | | | |
| Net investment income (a) | | | 0.08 | | | | 0.19 | | | | 0.10 | | | | 0.13 | | | | 0.13 | | | | 0.10 | |
| Net gain (loss) from securities (both realized and unrealized) | | | (0.29 | ) | | | (0.80 | ) | | | 2.65 | | | | 0.50 | | | | 1.53 | | | | 0.42 | |
| Total from operations | | | (0.21 | ) | | | (0.61 | ) | | | 2.75 | | | | 0.63 | | | | 1.66 | | | | 0.52 | |
| | | | | | | | | | | | | | | | | | | | | | | | | |
| Distributions to shareholders from: | | | | | | | | | | | | | | | | | | | | | | | | |
| Net investment income | | | (0.18 | ) | | | (0.07 | ) | | | (0.06 | ) | | | (0.06 | ) | | | (0.08 | ) | | | (0.07 | ) |
| Net realized gains | | | (0.34 | ) | | | (0.97 | ) | | | — | | | | (0.14 | ) | | | (0.36 | ) | | | (0.01 | ) |
| Total distributions | | | (0.52 | ) | | | (1.04 | ) | | | (0.06 | ) | | | (0.20 | ) | | | (0.44 | ) | | | (0.08 | ) |
| | | | | | | | | | | | | | | | | | | | | | | | | |
| Redemption fees (b) | | | 0.00 | | | | 0.00 | | | | 0.00 | | | | 0.00 | | | | 0.00 | | | | 0.00 | |
| | | | | | | | | | | | | | | | | | | | | | | | | |
| Net Asset Value, End of Year/Period | | $ | 13.50 | | | $ | 14.23 | | | $ | 15.88 | | | $ | 13.19 | | | $ | 12.76 | | | $ | 11.54 | |
| | | | | | | | | | | | | | | | | | | | | | | | | |
| Total Return (c) | | | (1.35 | )% (e) | | | (4.31 | )% | | | 20.89 | % | | | 4.98 | % | | | 15.12 | % | | | 4.76 | % |
| | | | | | | | | | | | | | | | | | | | | | | | | |
| Ratios/Supplemental Data | | | | | | | | | | | | | | | | | | | | | | | | |
| Net assets, end of year/period (in 000’s) | | $ | 53,268 | | | $ | 47,602 | | | $ | 35,601 | | | $ | 22,056 | | | $ | 11,903 | | | $ | 1,035 | |
| Ratio of expenses to average net assets: | | | | | | | | | | | | | | | | | | | | | | | | |
| before reimbursement | | | 1.78 | % (d) | | | 1.73 | % | | | 1.87 | % | | | 2.47 | % | | | 3.18 | % | | | 10.14 | % |
| net of reimbursement | | | 0.95 | % (d) | | | 0.95 | % | | | 0.95 | % | | | 0.95 | % | | | 0.95 | % | | | 0.95 | % |
| Ratio of net investment income to average net asset | | | 1.19 | % (d) | | | 1.34 | % | | | 0.67 | % | | | 1.06 | % | | | 1.09 | % | | | 0.90 | % |
| Portfolio turnover rate | | | 23 | % (e) | | | 40 | % | | | 35 | % | | | 49 | % | | | 22 | % | | | 26 | % |
| (a) | Per share amounts are calculated using the average shares method, which more appropriately presents the per share data for the period/year. |
| (b) | Less than $0.01 per share. |
| (c) | Total returns are historical in nature and assume changes in share price, reinvestment of dividends and capital gains distributions, if any. Had the Adviser not absorbed a portion of fund expenses, the total return would have been lower. |
The accompanying notes are an integral part of these financial statements.
| Copeland International Small Cap Fund |
| FINANCIAL HIGHLIGHTS |
Certain information in the table below reflects financial results for one share of beneficial interest outstanding throughout the period presented.
| | | Class A | |
| | | Six Months | | | Period | |
| | | Ended | | | Ended | |
| | | May 31, 2023 | | | November 30, 2022 * | |
| | | (Unaudited) | | | | |
| | | | | | | | | |
| Net Asset Value, Beginning of Period | | $ | 7.82 | | | $ | 10.00 | |
| | | | | | | | | |
| Increase From Operations: | | | | | | | | |
| Net investment income (a) | | | — | | | | 0.10 | |
| Net gain (loss) from securities (both realized and unrealized) | | | 0.25 | | | | (2.28 | ) |
| Total from operations | | | 0.25 | | | | (2.18 | ) |
| | | | | | | | | |
| Distributions to shareholders from: | | | | | | | | |
| Net investment income | | | (0.21 | ) | | | — | |
| Total distributions | | | (0.21 | ) | | | — | |
| | | | | | | | | |
| Net Asset Value, End of Period | | $ | 7.86 | | | $ | 7.82 | |
| | | | | | | | | |
| Total Return (b) | | | 3.37 | % (c) | | | (21.80 | )% (c) |
| | | | | | | | | |
| Ratios/Supplemental Data | | | | | | | | |
| Net assets, end of period , actual (not truncated) | | $ | 8 | | | $ | 8 | |
| Ratio of expenses to average net assets: | | | | | | | | |
| before reimbursement | | | 16.61 | % (d) | | | 34.90 | % (d) |
| net of reimbursement | | | 1.24 | % (d) | | | 1.19 | % (d) |
| Ratio of net investment income to average net assets | | | 0.58 | % (d) | | | 1.32 | % (d) |
| Portfolio turnover rate | | | 29 | % (c) | | | 82 | % (c) |
| * | Class A commenced operations on December 28, 2021. |
| (a) | Per share amounts are calculated using the average shares method, which more appropriately presents the per share data for the period. |
| (b) | Total returns are historical in nature and assume changes in share price, reinvestment of dividends and capital gains distributions, if any. Had the Adviser not absorbed a portion of fund expenses, the total return would have been lower. Sales loads are not reflected in total return. |
The accompanying notes are an integral part of these financial statements.
| Copeland International Small Cap Fund |
| FINANCIAL HIGHLIGHTS |
Certain information in the table below reflects financial results for one share of beneficial interest outstanding throughout the period presented.
| | | Class I | |
| | | Six Months | | | Period | |
| | | Ended | | | Ended | |
| | | May 31, 2023 | | | November 30, 2022 * | |
| | | (Unaudited) | | | | |
| | | | | | | | | |
| Net Asset Value, Beginning of Period | | $ | 7.82 | | | $ | 10.00 | |
| | | | | | | | | |
| Increase From Operations: | | | | | | | | |
| Net investment income (a) | | | 0.05 | | | | 0.16 | |
| Net gain (loss) from securities (both realized and unrealized) | | | 0.20 | | | | (2.34 | ) |
| Total from operations | | | 0.25 | | | | (2.18 | ) |
| | | | | | | | | |
| Distributions to shareholders from: | | | | | | | | |
| Net investment income | | | (0.21 | ) | | | — | |
| Total distributions | | | (0.21 | ) | | | — | |
| | | | | | | | | |
| Net Asset Value, End of Period | | $ | 7.86 | | | $ | 7.82 | |
| | | | | | | | | |
| Total Return (b) | | | 3.37 | % (c) | | | (21.80 | )% (c) |
| | | | | | | | | |
| Ratios/Supplemental Data | | | | | | | | |
| Net assets, end of period (in 000’s) | | $ | 438 | | | $ | 313 | |
| Ratio of expenses to average net assets: | | | | | | | | |
| before reimbursement | | | 22.15 | % (d) | | | 28.11 | % (d) |
| net of reimbursement | | | 0.98 | % (d) | | | 0.98 | % (d) |
| Ratio of net investment income to average net assets | | | 1.33 | % (d) | | | 2.07 | % (d) |
| Portfolio turnover rate | | | 29 | % (c) | | | 82 | % (c) |
| * | Class I commenced operations on December 28, 2021. |
| (a) | Per share amounts are calculated using the average shares method, which more appropriately presents the per share data for the period. |
| (b) | Total returns are historical in nature and assume changes in share price, reinvestment of dividends and capital gains distributions, if any. Had the Adviser not absorbed a portion of fund expenses, the total return would have been lower. |
The accompanying notes are an integral part of these financial statements.
| Copeland Trust |
| NOTES TO FINANCIAL STATEMENTS (Unaudited) |
| May 31, 2023 |
Copeland Dividend Growth Fund (the “Dividend Growth Fund”), formerly, the Copeland Risk Managed Dividend Growth Fund, Copeland SMID Cap Dividend Growth Fund (the “SMID Fund”), and Copeland International Small Cap Fund (the “International Fund”) are diversified series of Copeland Trust (the “Trust”). The Trust is registered under the Investment Company Act of 1940, as amended (the “1940 Act”) as an open-end management investment company. The Trust was organized as a statutory trust on September 10, 2010, under the laws of the State of Delaware.
The Dividend Growth Fund currently offers Class A, Class C and Class I shares. The SMID Fund and International Fund currently offer Class A and Class I shares. The Dividend Growth Fund’s Class A shares commenced operations on December 28, 2010, Class C shares commenced operations on January 5, 2012 and Class I shares commenced operations on March 1, 2013. The SMID Fund’s Class I shares commenced operations on February 27, 2017 and Class A shares commenced operations on February 11, 2019. The International Fund’s Class A and Class I shares commenced operations on December 28, 2021. Class A shares of each Fund are offered at net asset value plus a maximum sales charge of 5.75%. Purchases of $1,000,000 or more may be subject to a maximum contingent deferred sales charge of 1.00% on shares redeemed within 18 months. Class C and Class I shares are offered at net asset value. Each class represents an interest in the same assets of the applicable Fund and classes are identical except for differences in their sales charge structures and ongoing service and distribution charges. All classes of shares have equal voting privileges except that each class has exclusive voting rights with respect to its service and/or distribution plans. The Funds’ income, expenses (other than class specific distribution fees) and realized and unrealized gains and losses are allocated proportionately each day based upon the relative net assets of each class.
| 2. | SUMMARY OF SIGNIFICANT ACCOUNTING POLICIES |
The following is a summary of significant accounting policies followed by the Funds in preparation of their financial statements. These policies are in conformity with accounting principles generally accepted in the United States of America (“GAAP”). The preparation of financial statements requires management to make estimates and assumptions that affect the reported amounts of assets and liabilities and disclosure of contingent assets and liabilities at the date of the financial statements and the reported amounts of income and expenses for the period. Actual results could differ from those estimates. The Funds are investment companies and accordingly follow the investment company accounting and reporting guidance of the Financial Accounting Standards Board (FASB) Accounting Standard Codification Topic 946 “Financial Services – Investment Companies” including FASB Accounting Standard Update ASU 2013-08.
SECURITY VALUATION
Effective September 8, 2022, and pursuant to the requirements of the 1940 Act and Rule 2a-5 thereunder (the “Rule”), the Board of Trustees (the “Board”) has designated the Trust’s investment adviser, Copeland Capital Management, LLC (“Copeland”) as the Valuation Designee for the Funds pursuant to the Rule. The Valuation Designee has the responsibility for the fair value determination with respect to all Fund investments that do not have readily available market quotations or quotations that are no longer reliable. Copeland has appointed a Pricing Committee (the “Committee”) and has established a Valuation and Pricing Policy to implement the Rule and the Funds’ Valuation and Pricing Policy (together the “Policy”). Prior to September 8, 2022, fair-value determinations were performed in accordance with the Trust’s Fair Value Procedures established by the Funds’ Board of Trustees and were implemented through a Fair Value Committee designated by the Board. The valuation of investments with readily available market quotations has been delegated by the Board to the Funds’ administrator.
When valuing portfolio securities, a Fund values securities listed on a securities exchange, market or automated quotation system for which quotations are readily available (other than securities traded on National Association of Securities Dealers Automated Quotations (NASDAQ) or as otherwise noted below) at the last quoted sale price on an exchange or market (foreign or domestic) on which the securities are traded or, if there is no such reported sale, at the most recent quoted bid price. A Fund values securities traded on NASDAQ at the NASDAQ Official Closing Price. The prices of foreign securities are reported in local currency and converted to U.S. dollars using currency exchange rates. If a security’s price cannot be obtained, as noted above, a Fund will value the securities using a bid price from at least one independent broker.
| Copeland Trust |
| NOTES TO FINANCIAL STATEMENTS (Continued)(Unaudited) |
| May 31, 2023 |
Prices for most securities held by a Fund are provided daily by third-party independent pricing agents. Copeland reasonably believes that prices provided by independent pricing agents are reliable. However, there can be no assurance that such pricing service’s prices will be reliable. Copeland will continuously monitor the reliability of prices obtained from any pricing service and shall promptly notify the Funds’ administrator if it believes that a particular pricing service is no longer a reliable source of prices. The Funds’ administrator, in turn, will notify Copeland, as Valuation Designee, if the Funds’ administrator reasonably believes that a particular pricing service is no longer a reliable source for prices.
The Valuation Designee must monitor for circumstances that may necessitate that a security be valued using Fair Value Procedures which can include: (i) the security’s trading has been halted or suspended, (ii) the security has been de-listed from a national exchange, (iii) the security’s primary trading market is temporarily closed at a time when under normal conditions it would be open, (iv) the security has not been traded for an extended period of time, (v) the security’s primary pricing source is not able or willing to provide a price, (vi) trading of the security is subject to local government-imposed restrictions; or (vii) a significant event (as defined below) has occurred. When a security is valued in accordance with the Fair Value Procedures, the Valuation Designee will determine the value after taking into consideration relevant information reasonably available to the Valuation Designee. Examples of factors the Valuation Designee may consider include: (i) the type of security or asset, (ii) the last trade price, (iii) evaluation of the forces that influence the market in which the security is purchased and sold, (iv) the liquidity of the security, (v) the size of the holding in a Fund or (vi) any other appropriate information.
The Valuation Designee is responsible for selecting and applying, in a consistent manner, the appropriate methodologies for determining and calculating the fair value of holdings of the Funds, including specifying the key inputs and assumptions specific to each asset class or holding.
The determination of a security’s fair value price often involves the consideration of a number of subjective factors and is therefore subject to the unavoidable risk that the value assigned to a security may be higher or lower than the security’s value would be if a reliable market quotation for the security was readily available.
The International Small Cap Fund use a third-party fair valuation vendor. The vendor provides a fair value for foreign securities held by the Fund based on certain factors and methodologies (involving, generally, tracking valuation correlations between the U.S. market and each non-U.S. security). Values from the vendor are applied in the event that there is a movement in the U.S. market that exceeds a specific threshold that has been established by the Committee.
For securities that principally trade on a foreign market or exchange, a significant gap in time can exist between the time of a particular security’s last trade and the time at which a Fund calculates its NAV. The closing prices of such securities may no longer reflect their market value at the time a Fund calculates NAV if an event that could materially affect the value of those securities (a “Significant Event”), including substantial fluctuations in domestic or foreign markets or occurrences not tied directly to the securities markets, such as natural disasters, armed conflicts or significant governmental actions, has occurred between the time of the security’s last close and the time that a Fund calculates NAV. A Fund may invest in securities that are primarily listed on foreign exchanges that trade on weekends or other days when the Fund does not price its shares. As a result, the NAV of the Fund’s shares may change on days when shareholders will not be able to purchase or redeem Fund shares.
A Significant Event may relate to a single issuer or to an entire market sector. If Copeland becomes aware of a Significant Event that has occurred with respect to a security or group of securities after the closing of the exchange or market on which the security or securities principally trade, but before the time at which a Fund calculates NAV, it may request that a Committee meeting be called. In addition, with respect to certain securities, the Funds’ administrator performs price comparisons and price movement review (among other processes), to monitor the pricing data supplied by various sources. Any identified discrepancies are researched and subject to the procedures described above.
The Funds utilize various methods to measure the fair value of their investments on a recurring basis. GAAP establishes a hierarchy that prioritizes inputs to valuation methods.
| Copeland Trust |
| NOTES TO FINANCIAL STATEMENTS (Continued)(Unaudited) |
| May 31, 2023 |
The three levels of input are:
Level 1 – Unadjusted quoted prices in active markets for identical assets and liabilities that the Funds have the ability to access.
Level 2 – Observable inputs other than quoted prices included in Level 1 that are observable for the asset or liability, either directly or indirectly. These inputs may include quoted prices for the identical instrument on an inactive market, prices for similar instruments, interest rates, prepayment speeds, credit risk, yield curves, default rates and similar data.
Level 3 – Unobservable inputs for the asset or liability, to the extent relevant observable inputs are not available, representing the Funds’ own assumptions about the assumptions a market participant would use in valuing the asset or liability, and would be based on the best information available.
The availability of observable inputs can vary from security to security and is affected by a wide variety of factors, including, for example, the type of security, whether the security is new and not yet established in the marketplace, the liquidity of markets, and other characteristics particular to the security. To the extent that valuation is based on models or inputs that are less observable or unobservable in the market, the determination of fair value requires more judgment. Accordingly, the degree of judgment exercised in determining fair value is greatest for instruments categorized in Level 3.
The inputs used to measure fair value may fall into different levels of the fair value hierarchy. In such cases, for disclosure purposes, the level in the fair value hierarchy within which the fair value measurement falls in its entirety, is determined based on the lowest level input that is significant to the fair value measurement in its entirety.
The inputs or methodology used for valuing securities are not necessarily an indication of the risk associated with investing in those securities. The following tables summarize the inputs used as of May 31, 2023 for the Funds’ assets measured at fair value:
| Copeland Dividend Growth Fund | |
| | |
| Assets | | Level 1 | | | Level 2 | | | Level 3 | | | Total | |
| Common Stocks* | | $ | 44,583,573 | | | $ | — | | | $ | — | | | $ | 44,583,573 | |
| Total | | $ | 44,583,573 | | | $ | — | | | $ | — | | | $ | 44,583,573 | |
| | | | | | | | | | | | | | | | | |
| Copeland SMID Cap Dividend Growth Fund | |
| | |
| Assets | | Level 1 | | | Level 2 | | | Level 3 | | | Total | |
| Common Stocks* | | $ | 52,409,190 | | | $ | — | | | $ | — | | | $ | 52,409,190 | |
| Total | | $ | 52,409,190 | | | $ | — | | | $ | — | | | $ | 52,409,190 | |
| Copeland Trust |
| NOTES TO FINANCIAL STATEMENTS (Continued)(Unaudited) |
| May 31, 2023 |
| Copeland International Small Cap Fund | |
| | | | | | | | | | | | | |
| Assets | | Level 1 | | | Level 2 | | | Level 3 | | | Total | |
| Common Stocks* | | | | | | | | | | | | | | | | |
| Advertising & Marketing | | $ | — | | | $ | 6,287 | | | $ | — | | | $ | 6,287 | |
| Aerospace & Defense | | | — | | | | 4,791 | | | | — | | | | 4,791 | |
| Apparel & Textile Products | | | — | | | | 11,451 | | | | — | | | | 11,451 | |
| Automotive | | | — | | | | 4,971 | | | | — | | | | 4,971 | |
| Banking | | | — | | | | 13,495 | | | | — | | | | 13,495 | |
| Biotech & Pharma | | | — | | | | 17,420 | | | | — | | | | 17,420 | |
| Chemicals | | | — | | | | 33,552 | | | | — | | | | 33,552 | |
| Commercial Support Services | | | — | | | | 7,982 | | | | — | | | | 7,982 | |
| Construction Materials | | | — | | | | 6,353 | | | | — | | | | 6,353 | |
| Consumer Services | | | — | | | | 5,102 | | | | — | | | | 5,102 | |
| Containers & Packaging | | | — | | | | 13,367 | | | | — | | | | 13,367 | |
| Electric Utilities | | | — | | | | 7,440 | | | | — | | | | 7,440 | |
| Electrical Equipment | | | — | | | | 8,552 | | | | — | | | | 8,552 | |
| Engineering & Construction | | | — | | | | 5,118 | | | | — | | | | 5,118 | |
| Forestry, Paper & Wood Product | | | 6,724 | | | | — | | | | — | | | | 6,724 | |
| Gas & Water Utilities | | | — | | | | 11,473 | | | | — | | | | 11,473 | |
| Health Care Facilities & Services | | | — | | | | 4,096 | | | | — | | | | 4,096 | |
| Home Construction | | | — | | | | 5,200 | | | | — | | | | 5,200 | |
| Household Products | | | 11,806 | | | | — | | | | — | | | | 11,806 | |
| Industrial Intermediate Products | | | — | | | | 6,493 | | | | — | | | | 6,493 | |
| Industrial Support Services | | | — | | | | 10,141 | | | | — | | | | 10,141 | |
| Institutional Financial Services | | | — | | | | 17,547 | | | | — | | | | 17,547 | |
| Insurance | | | — | | | | 9,801 | | | | — | | | | 9,801 | |
| Leisure Facilities & Services | | | — | | | | 9,424 | | | | — | | | | 9,424 | |
| Machinery | | | — | | | | 19,411 | | | | — | | | | 19,411 | |
| Medical Equipment & Devices | | | 6,808 | | | | 9,717 | | | | — | | | | 16,525 | |
| Oil & Gas Producers | | | 13,701 | | | | — | | | | — | | | | 13,701 | |
| Real Estate Owners & Developer | | | — | | | | 5,244 | | | | — | | | | 5,244 | |
| Real Estate Services | | | — | | | | 5,081 | | | | — | | | | 5,081 | |
| Real Estate Investment Trust | | | — | | | | 30,795 | | | | — | | | | 30,795 | |
| Retail - Consumer Staples | | | — | | | | 4,750 | | | | — | | | | 4,750 | |
| Retail - Discretionary | | | — | | | | 11,236 | | | | — | | | | 11,236 | |
| Semiconductors | | | 4,715 | | | | 20,926 | | | | — | | | | 25,641 | |
| Software | | | — | | | | 8,043 | | | | — | | | | 8,043 | |
| Specialty Finance | | | — | | | | 13,025 | | | | — | | | | 13,025 | |
| Technology Hardware | | | — | | | | 11,072 | | | | — | | | | 11,072 | |
| Technology Services | | | — | | | | 23,369 | | | | — | | | | 23,369 | |
| Telecommunications | | | — | | | | 2,893 | | | | — | | | | 2,893 | |
| Exchange Traded Fund | | | 8,088 | | | | — | | | | — | | | | 8,088 | |
| Total | | $ | 51,842 | | | $ | 385,618 | | | $ | — | | | $ | 437,460 | |
The Funds did not hold any Level 3 securities during the period.
| * | Please refer to the Portfolio of Investments for Industry/Country Classification. |
| Copeland Trust |
| NOTES TO FINANCIAL STATEMENTS (Continued)(Unaudited) |
| May 31, 2023 |
SECURITY TRANSACTIONS AND INVESTMENT INCOME
Investment security transactions are accounted for on a trade date basis. Cost is determined and gains and losses are based upon the specific identification method for both financial statement and federal income tax purposes. Dividend income is recorded on the ex-dividend date and interest income is recorded on the accrual basis. Purchase discounts and premiums on securities are accreted and amortized over the life of the respective securities.
FEDERAL INCOME TAXES
The Funds intend to continue to comply with the requirements of Subchapter M of the Internal Revenue Code applicable to regulated investment companies and will distribute all of their taxable income, if any, to shareholders. Accordingly, no provision for Federal income taxes is required in the financial statements.
The Funds recognize the tax benefits of uncertain tax positions only where the position is “more likely than not” to be sustained assuming examination by tax authorities. Management has analyzed the Funds’ tax positions and has concluded that no liability for unrecognized tax benefits should be recorded related to uncertain tax positions related to the open tax years or expected to be taken in the Funds’ November 30, 2023 tax returns. The Funds identify their major tax jurisdictions as U.S. Federal and foreign jurisdictions where the Funds may make investments; however, the Funds are not aware of any tax positions for which it is reasonably possible that the total amounts of unrecognized tax benefits will change materially in the next twelve months.
DIVIDEND-PAYING STOCK RISK
The Funds’ emphasis on dividend-paying stocks could cause a Fund to underperform similar funds that invest without consideration of a company’s track record of paying dividends. Stocks of companies with a history of paying dividends may not participate in a broad market advance to the same degree as most other stocks, and a sharp rise in interest rates or economic downturn could cause a company to unexpectedly reduce or eliminate its dividend. If the amount a company pays out as a dividend exceeds its earnings and profits, the excess will be treated as a return of capital and the Fund’s tax basis in the stock will be reduced. A reduction in the Fund’s tax basis in such stock will increase the amount of gain (or decrease the amount of loss) recognized by the Fund on a subsequent sale of the stock.
MARKET RISK
Overall securities market risks may affect the value of individual securities in which the Fund invests. Factors such as foreign and domestic economic growth and market conditions, interest rate levels, and political events affect the securities markets.
REIT RISK
An equity REIT’s performance depends on the types and locations of the rental properties it owns and on how well it manages those properties. Real estate values rise and fall in response to a variety of factors, including local, regional and national economic conditions, changes in interest rates and property taxes.
SMALL AND MEDIUM CAPITALIZATION RISK
The value of a small or medium capitalization company securities may be subject to more abrupt or erratic market movements than those of larger, more established companies or the market averages in general.
FOREIGN INVESTING RISK
The International Fund invests significantly in foreign securities. Investments in foreign countries are subject to country-specific risks such as political, diplomatic, regional conflicts, terrorism, war, social and economic instability and policies that have the effect of decreasing the value of foreign securities. Foreign investments may experience greater volatility than U.S. investments. Currency hedging transactions may not perfectly offset the Fund’s foreign currency exposure and entail additional trading commissions and fees.
FOREIGN CURRENCY
The accounting records of the Funds are maintained in U.S. dollars. Investment securities and other assets and liabilities denominated in a foreign currency, and income receipts and expense payments, if any, are translated into U.S. dollars using the prevailing exchange rate at the London market close. Purchases and sales of securities are translated into U.S. dollars at the contractual currency rates established at the approximate time of the trade. Net realized gains and losses on foreign currency
| Copeland Trust |
| NOTES TO FINANCIAL STATEMENTS (Continued)(Unaudited) |
| May 31, 2023 |
transactions represent net gains and losses from currency realized between the trade and settlement dates on securities transactions and the difference between income accrued versus income received. The effects of changes in foreign currency exchange rates on investments in securities are included with the net realized and unrealized gain or loss on investment securities.
FORWARD CURRENCY CONTRACTS
If foreign securities are purchased, the Funds generally enter into forward currency exchange contracts in order to eliminate ongoing foreign currency exchange rate risks. If foreign securities are sold, the foreign currency proceeds are typically repatriated into US dollars. Any realized gains and losses between trade date and settlement date from contract transactions are included as a component of net realized gains (losses) from foreign currency transactions in the Statements of Operations. The Funds did not hold any forward currency contracts as of May 31, 2023.
CONCENTRATION OF RISK
Investing in securities of foreign issuers and currency transactions may involve certain considerations and risks not typically associated with investments in the United States. These risks include revaluation of currencies, adverse fluctuations in foreign currency values and possible adverse political, social and economic developments, including those particular to a specific industry, country or region. These conditions could cause the securities and their markets to be less liquid and prices more volatile than those of comparable U.S. companies and U.S. government securities.
DISTRIBUTIONS TO SHAREHOLDERS
Distributions from investment income, if any, are declared and paid annually and are recorded on the ex-dividend date. The Funds will declare and pay net realized capital gains, if any, annually. The character of income and gains to be distributed is determined in accordance with income tax regulations, which may differ from GAAP. These “book/tax” differences are considered either temporary (i.e., deferred losses, capital loss carry forwards) or permanent in nature. To the extent these differences are permanent in nature, such amounts are reclassified within the composition of net assets based on their federal tax-basis treatment; temporary differences do not require classification.
EXPENSES
Expenses of the Trust that are directly identifiable to a specific Fund are charged to that Fund. Expenses, which are not readily identifiable to a specific Fund, are allocated in such a manner as deemed equitable, taking into consideration the nature and type of expense and the relative sizes of the Funds in the Trust.
INDEMNIFICATION
The Trust indemnifies their officers and trustees for certain liabilities that may arise from the performance of their duties to the Trust. Additionally, in the normal course of business, the Funds enter into contracts that contain a variety of representations and warranties and which provide general indemnities. The Funds’ maximum exposure under these arrangements is unknown, as this would involve future claims that may be made against the Funds that have not yet occurred. However, based on experience, the Funds expect the risk of loss due to these warranties and indemnities to be remote.
| 3. | INVESTMENT ADVISORY AGREEMENT AND TRANSACTIONS WITH RELATED PARTIES |
ADVISORY FEE
Subject to the authority of the Board, the adviser is responsible for management of the Funds’ investment portfolios. Pursuant to the Management Agreement (the “Management Agreement”), investment advisory services are provided to the Funds by Copeland Capital Management, LLC (the “Adviser”). Under the terms of the Management Agreement, the Adviser receives monthly fees calculated at an annual rate of 0.75% for each of the Dividend Growth Fund and SMID Fund and 0.78% for the International Fund, based on the average daily net assets of the respective Fund. For the six months ended May 31, 2023, the Adviser earned advisory fees of $178,608, $190,355, and $1,523 for the Dividend Growth Fund, SMID Fund, and International Fund, respectively, before the effect of the Expense Limitation Agreement.
The Adviser, pursuant to an Expense Limitation Agreement (the “Agreement”) has contractually agreed to reduce its fees and/or absorb expenses of each Fund, at least until March 31, 2024 to ensure that Net Annual Operating Expenses (excluding any front-end or contingent deferred loads, brokerage fees and commissions, acquired fund fees and expenses, borrowing costs such as interest
| Copeland Trust |
| NOTES TO FINANCIAL STATEMENTS (Continued)(Unaudited) |
| May 31, 2023 |
and dividend expense on securities sold short, taxes and extraordinary expenses such as litigation) will not exceed 1.20%, 1.95% and 1.05% of the Dividend Growth Fund’s average daily net assets for Class A, Class C and Class I shares, respectively, 1.20% and 0.95% of the SMID Fund’s average daily net assets for Class A and Class I, respectively, and 1.23% and 0.98% of the International Fund’s average daily net assets for Class A and Class I, respectively, subject to possible recoupment from the Fund in future years on a rolling three year basis (within the three years after the fees have been deferred or reimbursed) if such recoupment can be achieved without exceeding the lesser of the expense limitation in effect at the time of the deferral and at the time of the repayment. For the six months ended May 31, 2023, the Adviser waived fees/reimbursed expenses of $132,268, $210,591, and $41,416 for the Dividend Growth Fund, SMID Fund, and International Fund, respectively.
The expenses subject to recapture for the Dividend Growth Fund, SMID Fund and International Small Cap Fund will expire on November 30 of the years indicated below:
| Copeland Dividend Growth Fund | |
| | |
| 2023 | | | 2024 | | | 2025 | | | Total | |
| $ | 610,939 | | | $ | 487,174 | | | $ | 417,980 | | | $ | 1,516,093 | |
| | | | | | | | | | | | | | | |
| Copeland SMID Cap Dividend Growth Fund | |
| | |
| 2023 | | | 2024 | | | 2025 | | | Total | |
| $ | 223,713 | | | $ | 288,151 | | | $ | 325,820 | | | $ | 837,684 | |
| | | | | | | | | | | | | | | |
| Copeland International Small Cap Fund | |
| | |
| 2023 | | | 2024 | | | 2025 | | | Total | |
| $ | 0 | | | $ | 0 | | | $ | 81,999 | | | $ | 81,999 | |
DISTRIBUTOR
The Board has adopted Distribution Plans and Agreements for each Fund (collectively the “Plan”) pursuant to Rule 12b-1 under the 1940 Act. The Plan provides that a monthly service and/or distribution fee is calculated by each Fund at an annual rate of 0.25% and 1.00% (of which up to 0.75% is a distribution fee and up to 0.25% is a service fee) of the average daily net assets attributable to Class A shares and Class C shares, respectively and is paid to Northern Lights Distributors, LLC (the “Distributor” or “NLD”), to provide compensation for ongoing distribution-related activities or services and/or maintenance of the Funds’ shareholder accounts, not otherwise required to be provided by the Adviser. The Plan is a compensation plan, which means that compensation is provided regardless of 12b-1 expenses incurred. For the six months ended May 31, 2023, the 12b-1 fees accrued amounted to $18,043 and $49,440 for the Dividend Growth Fund for Class A and Class C shares, respectively. The 12b-1 fees accrued for the SMID Cap Dividend Growth Fund Class A shares were $2,079. The International Fund did not accrue any 12b-1 fees for the period.
The Distributor acts as the Funds’ principal underwriter in a continuous public offering of the Funds’ shares. For the six months ended May 31, 2023, the Distributor received $230 in underwriting commissions for sales of Class A shares of the Dividend Growth Fund, of which $30 was retained by the principal underwriter or other affiliated broker-dealers and $793 in underwriting commissions for sales of Class A shares of the SMID Cap Dividend Growth Fund of which $104 was retained by the principal underwriter or other affiliated broker-dealers. No underwriting commissions were generated by Class A Shares of the International Fund during the six months ended May 31, 2023.
In addition, certain affiliates of the Distributor provide services to the Funds as follows:
ULTIMUS FUND SOLUTIONS, LLC (“UFS”)
UFS, an affiliate of the Distributor, provides administration, fund accounting, and transfer agent services to the Trust. Pursuant to separate servicing agreements with UFS, the Trust pays UFS fees for providing administration, fund accounting, and transfer agency services to the Funds. These fees are disclosed in the Statement of Operations. An officer of the Trust is also an officer of UFS and is not paid any fees directly by the Funds for servicing in such capacity.
BLU GIANT, LLC (“Blu Giant”)
Blu Giant, an affiliate of UFS and the Distributor, provides EDGAR conversion and filing services as well as print management services for the Funds on an ad-hoc basis. For the provision of these services, Blu Giant receives customary fees from the Funds.
| Copeland Trust |
| NOTES TO FINANCIAL STATEMENTS (Continued)(Unaudited) |
| May 31, 2023 |
SHAREHOLDER SERVICES
The Board has adopted non-Rule 12b-1 shareholder service plans (collectively, the “Shareholder Service Plan”) for the Class I shares of each Fund. The Shareholder Service Plan permits the Funds to pay brokers, financial intermediaries and others an annual fee of 0.10% of each Fund’s average daily net assets attributable to the Class I shares for shareholder support and/or administrative services, not otherwise provided by the Trust’s transfer agent. The fees incurred by the Funds for these services are included as Shareholder Service Fees – Class I in the Statement of Operations. For the six months ended May 31, 2023, the Dividend Growth Fund accrued $4,308 and the SMID Cap Dividend Growth Fund accrued $12,528 in fees associated with the Shareholder Service Plan. The International Fund did not accrue any Shareholder Service Fees for its Class I shares during the period. The Funds’ Class A and Class C shares may also pay broker-dealers or other financial intermediaries for shareholder support services and/or administrative services based on the aggregate net asset value of the Class A and Class C shares, as applicable, owned of record or beneficially by the broker-dealers’ or financial intermediaries’ customers. The fees incurred by the Funds for these services are included as Non-Rule 12b-1 Shareholder Services Fees - Class A and Class C in the Statement of Operations.
CHIEF COMPLIANCE OFFICER
The Adviser is providing a Chief Compliance Officer to the Trust as well as related compliance services. The Trust reimburses the Adviser for an allocable portion of the Chief Compliance Officer’s salary.
TRUSTEES
Effective February 1, 2021, as compensation for services rendered to the Trust, each Trustee of the Trust who is not affiliated with the Trust or the Adviser receives: (1) an annual base retainer of $22,000; (2) $12,000 for attendance at four regularly scheduled Board meetings per year; (3) $1,500 for attendance at each regularly scheduled Audit Committee meeting; (4) $750 and $2,500 for each additional special telephonic or special in person meeting, respectively; and (5) the independent Chairman of the Board receives an additional $9,000 per year for carrying out his additional responsibilities. The foregoing compensation is paid in quarterly payments.
The “interested persons” (as defined in the 1940 Act) who serve as Trustees of the Trust receive no compensation for their services as Trustees. None of the executive officers receive compensation from the Trust except for the CCO, a portion of whose salary is paid by the Trust for compliance services.
| 4. | INVESTMENT TRANSACTIONS |
The cost of purchases and the proceeds from sales of investments, other than short-term investments, for the six months ended May 31, 2023 were as follows:
| Fund | | Purchases | | | Sale Proceeds | |
| Dividend Growth Fund | | $ | 9,249,707 | | | $ | 14,557,479 | |
| SMID Cap Dividend Growth Fund | | | 16,849,849 | | | | 11,353,792 | |
| International Small Cap Fund | | | 206,962 | | | | 116,916 | |
| 5. | AGGREGATE UNREALIZED APPRECIATION AND DEPRECIATION – TAX BASIS |
The identified cost of investments in securities owned by the Funds for federal income tax purposes, and their respective gross unrealized appreciation and depreciation at May 31, 2023, were as follows:
| | | | | | Gross | | | Gross | | | Net Unrealized | |
| | | | | | Unrealized | | | Unrealized | | | Appreciation/ | |
| Fund | | Tax Cost | | | Appreciation | | | Depreciation | | | (Depreciation) | |
| Dividend Growth Fund | | $ | 38,503,209 | | | $ | 7,587,005 | | | $ | (1,506,641 | ) | | $ | 6,080,364 | |
| SMID Cap Dividend Growth Fund | | | 50,929,474 | | | | 4,000,595 | | | | (2,520,879 | ) | | | 1,479,716 | |
| International Small Cap Fund | | | 446,443 | | | | 30,699 | | | | (39,682 | ) | | | (8,983 | ) |
| Copeland Trust |
| NOTES TO FINANCIAL STATEMENTS (Continued)(Unaudited) |
| May 31, 2023 |
| 6. | DISTRIBUTIONS TO SHAREHOLDERS AND TAX COMPONENTS OF CAPITAL |
The tax character of fund distributions paid for the periods ended November 30, 2022 and November 30, 2021 was as follows:
| For the year ended November 30, 2022 | |
| | | Ordinary | | | Long-Term | | | | |
| Portfolio | | Income | | | Capital Gains | | | Total | |
| Dividend Growth Fund | | $ | 1,729,801 | | | $ | 5,809,629 | | | $ | 7,539,430 | |
| SMID Cap Dividend Growth Fund | | | 621,556 | | | | 1,751,884 | | | | 2,373,440 | |
| International Small Cap Fund | | | — | | | | — | | | | — | |
| | | | | | | | | | | | | |
| For the year ended November 30, 2021 | |
| | | Ordinary | | | Long-Term | | | | |
| Portfolio | | Income | | | Capital Gains | | | Total | |
| Dividend Growth Fund | | $ | — | | | $ | — | | | $ | — | |
| SMID Cap Dividend Growth Fund | | | 95,889 | | | | — | | | | 95,889 | |
| International Small Cap Fund | | | — | | | | — | | | | — | |
As of November 30, 2022, the components of accumulated earnings/(deficit) on a tax basis were as follows:
| | | Undistributed | | | Undistributed | | | Undistributed | | | Post October Loss | | | Capital Loss | | �� | Other | | | Unrealized | | | Total | |
| | | Ordinary | | | Ordinary | | | Long-Term | | | and | | | Carry | | | Book/Tax | | | Appreciation/ | | | Accumulated | |
| Portfolio | | Tax-Exempt Income | | | Income | | | Capital Gains | | | Late Year Loss | | | Forwards | | | Differences | | | (Depreciation) | | | Earnings/(Deficits) | |
| Dividend Growth Fund | | $ | — | | | $ | 314,488 | | | $ | 2,869,741 | | | $ | (1,638,886 | ) | | $ | — | | | $ | — | | | $ | 9,114,945 | | | $ | 10,660,288 | |
| SMID Cap Dividend Growth Fund | | | — | | | | 557,645 | | | | 1,171,218 | | | | (1,347,883 | ) | | | — | | | | — | | | | 2,649,936 | | | | 3,030,916 | |
| International Small Cap Fund | | | — | | | | 8,272 | | | | — | | | | (1,678 | ) | | | (69,641 | ) | | | — | | | | (24,335 | ) | | | (87,382 | ) |
The difference between book basis and tax basis undistributed net investment income, accumulated net realized gains, and unrealized appreciation from investments is primarily attributable to the tax deferral of losses on wash sales, mark-to-market on passive foreign investment companies and C-Corporation return of capital distributions.
Capital losses incurred after October 31 within the fiscal year are deemed to arise on the first business day of the following fiscal year for tax purposes. The following Funds incurred and elected to defer such capital losses as follows:
| | | Post October | |
| Portfolio | | Losses | |
| Dividend Growth Fund | | $ | 1,638,886 | |
| SMID Cap Dividend Growth Fund | | | 1,347,883 | |
| International Small Cap Fund | | | 1,678 | |
At November 30, 2022, the Funds utilized capital loss carry forwards for federal income tax purposes as follows:
| Portfolio | | Short-Term | | | Long-Term | | | Total | | | CLCF Utilized | |
| Dividend Growth Fund | | $ | — | | | $ | — | | | $ | — | | | $ | — | |
| SMID Cap Dividend Growth Fund | | | — | | | | — | | | | — | | | | — | |
| International Small Cap Fund | | | 69,641 | | | | — | | | | 69,641 | | | | — | |
| Copeland Trust |
| NOTES TO FINANCIAL STATEMENTS (Continued)(Unaudited) |
| May 31, 2023 |
Permanent book and tax differences, primarily attributable to the book/tax basis treatment of non-deductible expenses and adjustments for prior year tax returns, resulted in reclassifications for the Funds for the fiscal year ended November 30, 2022 as follows:
| | | Paid | | | | |
| | | In | | | Accumulated | |
| Portfolio | | Capital | | | Earnings (Losses) | |
| Dividend Growth Fund | | $ | — | | | $ | — | |
| SMID Cap Dividend Growth Fund | | | 15,121 | | | | (15,121 | ) |
| International Small Cap Fund | | | (8 | ) | | | 8 | |
The Funds may assess a short-term redemption fee of 1.00% of the total redemption amount if shareholders sell their shares after holding them for less than 30 days or if shares are redeemed for failure to maintain the Funds’ minimum account balance requirement. The redemption fee is paid directly to the Funds. For the six months ended May 31, 2023, the Dividend Growth Fund assessed $0, $0, and $45 in redemption fees for Class A, Class C and Class I shares, respectively. The SMID Fund assessed $25 and $767 in redemption fees for Class A and Class I shares, respectively. The International Fund did not assess redemption fees for Class A or Class I shares.
Subsequent events after the date of the Statement of Assets and Liabilities have been evaluated through the date the financial statements were issued. Management has determined that no events or transactions occurred requiring adjustment or disclosure in the financial statements.
| Copeland Trust |
| DISCLOSURE OF FUND EXPENSES (Unaudited) |
| May 31, 2023 |
As a shareholder of the Copeland Dividend Growth Fund and the Copeland SMID Cap Dividend Growth Fund, you incur two types of costs (1) transaction costs, including sales charges (loads) on purchase payments and sales (for Class A shares only) and redemption fees; and (2) ongoing costs, including management fees, distribution and/or service (12b-1 fees for Class A and C shares only) fees, shareholder servicing fees and other Fund expenses. This example is intended to help you understand your ongoing costs (in dollars) of investing in the Funds and to compare these costs with the ongoing costs of investing in other mutual funds. Please note, the expenses shown in the tables are meant to highlight ongoing costs only and do not reflect any transactional costs. This example is based on an investment of $1,000 invested for the period of time as indicated in the table below.
Actual Expenses: The first line of the table provides information about actual account values and actual expenses. You may use the information in this line, together with the amount you invested, to estimate the expenses that you paid over the period. Simply divide your account value by $1,000 (for example, an $8,600 account value divided by $1,000 = 8.6), then multiply the result by the number in the first line under the heading entitled “Expenses Paid During the Period” to estimate the expenses you paid on your account during the period.
Hypothetical Examples for Comparison Purposes: The second line of the table below provides information about hypothetical account values and hypothetical expenses based on the Funds’ actual expense ratio and an assumed rate of return of 5% per year before expenses, which is not the Funds’ actual return. The hypothetical account values and expenses may not be used to estimate the actual ending account balance or expenses you paid for the period. You may use this information to compare the ongoing costs of investing in the Funds and other funds. To do so, compare this 5% hypothetical example with the 5% hypothetical examples that appear in the shareholder reports of the other funds.
Please note that the expenses shown in the table are meant to highlight your ongoing costs only and do not reflect any transactional costs, such as sales charges (loads) or redemption fees which may be applicable to your account. Therefore, the second line of the table is useful in comparing ongoing costs only, and will not help you determine the relative total costs of owning different funds. In addition, if these transactional costs were included, your costs would have been higher.
| | | Beginning | | | Ending | | | | | Expenses Paid | |
| | | Account Value | | | Account Value | | | Annualized | | During the Period | |
| | | 12/1/2022 | | | 5/31/2023 | | | Expense Ratio | | 12/1/2022 - 5/31/2023 | |
| Actual (a) | | | | | | | | | | | | | | |
| Copeland Dividend Growth Fund | | | | | | | | | | | | | | |
| Class A | | $ | 1,000.00 | | | $ | 977.70 | | | 1.20% | | $ | 5.92 | |
| Class C | | $ | 1,000.00 | | | $ | 974.30 | | | 1.95% | | $ | 9.60 | |
| Class I | | $ | 1,000.00 | | | $ | 978.30 | | | 1.05% | | $ | 5.18 | |
| Copeland SMID Cap Dividend Growth Fund | | | | | | | | | | | | | | |
| Class A | | $ | 1,000.00 | | | $ | 985.70 | | | 1.20% | | $ | 5.94 | |
| Class I | | $ | 1,000.00 | | | $ | 986.50 | | | 0.95% | | $ | 4.71 | |
| Copeland International Small Cap Fund | | | | | | | | | | | | | | |
| Class A | | $ | 1,000.00 | | | $ | 1,033.70 | | | 1.19% | | $ | 6.29 | |
| Class I | | $ | 1,000.00 | | | $ | 1,033.70 | | | 0.98% | | $ | 4.97 | |
| Hypothetical (a) | | | | | | | | | | | | | | |
| (5% return before expenses) | | | | | | | | | | | | | | |
| Copeland Dividend Growth Fund | | | | | | | | | | | | | | |
| Class A | | $ | 1,000.00 | | | $ | 1,018.95 | | | 1.20% | | $ | 6.00 | |
| Class C | | $ | 1,000.00 | | | $ | 1,015.21 | | | 1.95% | | $ | 9.80 | |
| Class I | | $ | 1,000.00 | | | $ | 1,019.70 | | | 1.05% | | $ | 5.29 | |
| Copeland SMID Cap Dividend Growth Fund | | | | | | | | | | | | | | |
| Class A | | $ | 1,000.00 | | | $ | 1,018.95 | | | 1.20% | | $ | 6.04 | |
| Class I | | $ | 1,000.00 | | | $ | 1,020.19 | | | 0.95% | | $ | 4.78 | |
| Copeland International Small Cap Fund | | | | | | | | | | | | | | |
| Class A | | $ | 1,000.00 | | | $ | 1,018.75 | | | 1.19% | | $ | 6.24 | |
| Class I | | $ | 1,000.00 | | | $ | 1,020.04 | | | 0.98% | | $ | 4.94 | |
| (a) | Expenses are equal to the average account value over the period, multiplied by the Fund’s annualized expense ratio, multiplied by the number of days in the six month period ended May 31, 2023 (182) divided by the number of days in the fiscal year (365). |
| Copeland Trust |
| SUPPLEMENTAL INFORMATION (Unaudited) |
Considerations Regarding the Management Agreement
On May 17, 2023, the Board of Trustees (the “Board”) of Copeland Trust (the “Trust”), including all Trustees who are not interested persons under the Investment Company Act of 1940, as amended (the “Independent Trustees”), considered the renewal of the investment management agreement (the “Management Agreement”) between the Trust and Copeland Capital Management (“Copeland” or the “Adviser”) with respect to each Fund. The Independent Trustees met separately with independent counsel in advance of the meeting held on May 17, 2023 (the “Meeting”) to discuss the material provided by Copeland. The Board reviewed and considered, among other items: (1) a memorandum from independent counsel setting forth the Trustees’ fiduciary duties, responsibilities and the factors the Trustees should consider in their evaluation of the Management Agreement; and (2) a report and presentation by Copeland that described, among other things: (a) the nature, extent and quality of the services provided by Copeland to each Fund and the experience and qualifications of the personnel providing those services; (b) its organizational structure, financial information, level of insurance coverage, Form ADV and SOC 1 report; (c) its investment process and the strategy of each Fund; (d) its types of clients and assets under management; (e) its brokerage, soft dollar commission and trade allocation policies, including the types of research and services obtained in connection with soft dollar commissions; (f) the investment performance of each Fund as compared to its applicable benchmark index, Copeland’s other similarly managed accounts as applicable, and relevant peer group; (g) its advisory fee arrangement with each Fund as compared to its relevant peer group and Copeland’s other similarly managed accounts as applicable; (h) the contractual fee and expense waiver arrangement with each Fund; (i) its compliance program to monitor and review investment decisions and to prevent and detect violations of each Fund’s investment policies and limitations, as well as federal securities laws and conflicts of interest assessments, its business continuity and disaster recovery plan and information security system; (j) the costs of the services provided and the profits realized by Copeland from its relationships with each Fund; and (k) the extent to which economies of scale are relevant as each Fund grows, and whether the fee levels reflect these economies of scale to the benefit of shareholders. The Trustees discussed the Adviser’s written materials and oral presentation on the Management Agreement, together with information provided to the Trustees over the course of the year. During the executive session, the Board discussed, among other things, the performance of the Funds, expenses, fee levels and waivers, and the Adviser’s profitability and financial strength. In their deliberations, the Trustees did not identify any single factor as determinative or controlling, and different Board members may have given different weight to different individual factors and related conclusions. After further discussion, the Board, including all of the Independent Trustees, concluded that: the Adviser had the capabilities, resources and personnel necessary to manage each Fund; and that based on the services that the Adviser provides to the Funds pursuant to the Management Agreement and the expenses incurred by it in the performance of such services, that the compensation payable to the Adviser with respect to each Fund is not unreasonable.
Among the factors considered, the Board examined the nature, extent and quality of services provided to each Fund under the Management Agreement, and the quality of the Adviser’s professional portfolio management teams. The Board considered, among other things, its on-going dealings with the Adviser, noting that the Adviser has consistently demonstrated its commitment to the interests of the Trust’s shareholders, communicated well with the Board and cooperated in
| Copeland Trust |
| SUPPLEMENTAL INFORMATION (Unaudited)(Continued) |
all respects with the Board’s requests for information. The Board considered the Trust’s CCO’s reports on the Adviser’s quarterly compliance certifications. The Board considered the experience and qualifications of each portfolio manager. Based on these considerations, the Trustees determined that the Adviser has the capabilities, resources and personnel necessary to manage each Fund and also concluded that they were satisfied with the quality of services provided by the Adviser in advising each Fund.
The Board considered the costs of the services provided and the profits realized by the Adviser, as discussed at the Meeting. The Trustees concluded that the negative profitability with respect to each Fund was not a concern given the relatively small asset base of each Fund and the Adviser’s overall financial strength and the Funds’ importance to the Adviser’s overall business strategy. The Trustees also concluded that the benefits derived by Copeland from managing each Fund, including how it uses soft dollars, and the way in which it conducts portfolio transactions and selects brokers, seemed reasonable.
The Board also considered the management fees and expenses of each Fund. The Board concluded that, based on the information discussed at the Meeting, each Fund’s management fee and expenses, taking into account Copeland’s agreement to waive fees and reimburse expenses to limit the expenses of each Fund, were reasonable as compared to the fees and expenses of comparable funds, and Copeland’s similarly managed accounts where applicable.
The Board also considered the investment performance of each Fund against its applicable benchmark index and peer group. The Board also took into account the portfolio managers’ discussion of each Fund’s performance and comparable strategy, including, where applicable, the reasons for each Fund’s over or under-performance as compared to its benchmark index and peer group, as well as performance, where applicable, compared to the Adviser’s separately-managed accounts. Based on this information, the Trustees concluded that the performance of each Fund for the periods shown was generally mixed (performance for certain periods was higher than the benchmark and comparative peer performance information, and in other cases it was lower).
As to economies of scale, the Trustees noted that the Management Agreement does not contain breakpoints that reduce the fee rates as assets grow. The Trustees considered the current asset levels of each Fund and Adviser’s agreement to waive fees and reimburse expenses as a means to limit each Fund’s expenses and concluded that, at this time, the absence of breakpoints was reasonable.
Based upon the Trustees’ deliberations and evaluation of the information described above, the Trustees, and separately by all of the Independent Trustees, determined that the terms of the Management Agreement were reasonable and fair to each Fund and its respective shareholders and voted to renew the Management Agreement with respect to each Fund.
| PRIVACY notice |
| |
| FACTS | WHAT DOES COPELAND TRUST DO WITH YOUR PERSONAL INFORMATION? |
| | |
| Why? | Financial companies choose how they share your personal information. Federal law gives consumers the right to limit some but not all sharing. Federal law also requires us to tell you how we collect, share, and protect your personal information. Please read this notice carefully to understand what we do. |
| | |
| What? | The types of personal information we collect and share depend on the product or service you have with us. This information can include: ■ Social Security number ■ Purchase History ■ Assets ■ Account Balances ■ Retirement Assets ■ Account Transactions ■ Transaction History ■ Wire Transfer Instructions ■ Checking Account Information When you are no longer our customer, we continue to share your information as described in this notice. |
| | |
| How? | All financial companies need to share customers’ personal information to run their everyday business. In the section below, we list the reasons financial companies can share their customers’ personal information; the reasons Copeland Trust chooses to share; and whether you can limit this sharing. |
| | | |
| Reasons we can share your personal information: | Does Copeland
Trust share? | Can you limit this sharing? |
For our everyday business purposes – such as to process your transactions, maintain your account(s), respond to court orders and legal investigations, or report to credit bureaus | Yes | No |
For our marketing purposes – to offer our products and services to you | No | We don’t share |
| For joint marketing with other financial companies | No | We don’t share |
For our affiliates’ everyday business purposes – information about your transactions and experiences | No | We don’t share |
For our affiliates’ everyday business purposes – information about your creditworthiness | No | We don’t share |
| For nonaffiliates to market to you | No | We don’t share |
| Questions? | Call 1-888-9-COPELAND (1-888-926-7352) |
| Who we are: |
| Who is providing this notice? | Copeland Trust |
| What we do: |
| How does Copeland Trust protect my personal information? | To protect your personal information from unauthorized access and use, we use security measures that comply with federal law. These measures include computer safeguards and secured files and buildings. Our service providers are held accountable for adhering to strict policies and procedures to prevent any misuse of your nonpublic personal information. |
| How does Copeland Trust collect my personal information? | We collect your personal information, for example, when you ■ Open an account ■ Provide account information ■ Give us your contact information ■ Make deposits or withdrawals from your account ■ Make a wire transfer ■ Tell us where to send the money ■ Tells us who receives the money ■ Show your government-issued ID ■ Show your driver’s license We also collect your personal information from other companies. |
| Why can’t I limit all sharing? | Federal law gives you the right to limit only ■ Sharing for affiliates’ everyday business purposes – information about your creditworthiness ■ Affiliates from using your information to market to you ■ Sharing for nonaffiliates to market to you State laws and individual companies may give you additional rights to limit sharing. |
| Definitions: |
| Affiliates | Companies related by common ownership or control. They can be financial and nonfinancial companies. ■ Copeland Trust does not share with our affiliates. |
| Nonaffiliates | Companies not related by common ownership or control. They can be financial and nonfinancial companies
■ Copeland Trust does not share with nonaffiliates so they can market to you. |
| Joint marketing | A formal agreement between nonaffiliated financial companies that together market financial products or services to you.
■ Copeland Trust does not jointly market. |
| Investment Adviser |
| Copeland Capital Management, LLC |
| 161 Washington Street, Suite 1325 |
| Conshohocken, PA 19428 |
| |
| Distributor |
| Northern Lights Distributors, LLC |
| 4221 North 203rd Street, Suite 100 |
| Elkhorn, NE 68022 |
| |
| Legal Counsel |
| Faegre Drinker Biddle & Reath, LLP |
| One Logan Square, Suite 2000 |
| Philadelphia, PA 19103 |
| |
| Independent Registered Public Accounting Firm |
| Tait, Weller & Baker LLP |
| Two Liberty Place |
| 50 South 16th Street, Suite 2900 |
| Philadelphia, PA 19102 |
| |
| Transfer Agent |
| Ultimus Fund Solutions, LLC |
| 4221 North 203rd Street, Suite 100 |
| Elkhorn, NE 68022 |
| |
| Administrator |
| Ultimus Fund Solutions, LLC |
| 4221 North 203rd Street, Suite 100 |
| Elkhorn, NE 68022 |
| |
| Custodian |
| The Northern Trust Company |
| 50 South LaSalle Street |
| Chicago, Il 60603 |
| |
How to Obtain Proxy Voting Information
Information regarding how the Funds vote proxies relating to portfolio securities for the 12 month period ended June 30 as well as a description of the policies and procedures that the Funds used to determine how to vote proxies is available without charge, upon request, by calling 1-888-9-COPELAND or by referring to the Securities and Exchange Commission’s (“SEC”) website at http://www.sec.gov.
How to Obtain 1st and 3rd Fiscal Quarter Portfolio Holdings
The Funds files their complete schedule of portfolio holdings with the SEC for the first and third quarters of each fiscal year on Form N-PORT. Form N-PORT is available on the SEC’s website at http://www.sec.gov and may be reviewed and copied at the SEC’s Public Reference Room in Washington, DC (1-800-SEC-0330). The information on Form N-PORT is available without charge, upon request, by calling 1-888-9-COPELAND.
COPELAND-SA23
Item 2. Code of Ethics. Not required for semi-annual reports.
Item 3. Audit Committee Financial Expert. Not required for semi-annual reports.
Item 4. Principal Accountant Fees and Services. Not required for semi-annual reports.
Item 5. Audit Committee of Listed Companies. Not applicable to open-end investment companies.
Item 6. Schedule of Investments.
| (a) | Schedule of investments in securities of unaffiliated issuers is included under Item 1. |
Item 7. Disclosure of Proxy Voting Policies and Procedures for Closed-End Funds. Not applicable to open-end investment companies.
Item 8. Portfolio Managers of Closed-End Funds. Not applicable to open-end investment companies.
Item 9. Purchases of Equity Securities by Closed-End Funds. Not applicable to open-end investment companies.
Item 10. Submission of Matters to a Vote of Security Holders. None
Item 11. Controls and Procedures.
(a) Based on an evaluation of the Registrant’s disclosure controls and procedures (as defined in rule 30a-3(c) under the Investment Company Act of 1940) as of the filing date of this report, Registrant’s principal executive officer and principal financial officer found such disclosure controls and procedures to be effective.
(b) There were no significant changes in the Registrant’s internal control over financial reporting that occurred during the Registrant’s last fiscal half-year that have materially affected, or are reasonably likely to materially affect, the Registrant’s internal control over financial reporting.
Item 12. Disclosure of Securities Lending Activities for Closed-End Management Investment Companies. Not applicable to open-end investment companies
Item 13. Exhibits.
(a)(1) Not applicable.
(a)(2) Certification required by Section 302 of the Sarbanes-Oxley Act of 2002 is filed herewith.
(a)(3) Not applicable for open-end investment companies.
(b) Certification required by Section 906 of the Sarbanes-Oxley Act of 2002 is filed herewith.
SIGNATURE
Pursuant to the requirements of the Securities Exchange Act of 1934 and the Investment Company Act of 1940, the Registrant has duly caused this report to be signed on its behalf by the undersigned, thereunto duly authorized.
Copeland Trust
By: /s/ Mark W. Giovanniello
Mark W. Giovanniello, Principal Executive Officer
Date 8/8/2023
Pursuant to the requirements of the Securities Exchange Act of 1934 and the Investment Company Act of 1940, this report has been signed below by the following persons on behalf of the Registrant and in the capacities and on the dates indicated.
By: /s/ Mark W. Giovanniello
Mark W. Giovanniello, Principal Executive Officer
Date 8/8/2023
By: /s/ Steven J. Adams
Steven J. Adams, Treasurer and Principal Financial Officer
Date 8/8/2023