united states
securities and exchange commission
washington, d.c. 20549
form n-csr
certified shareholder report of registered management
investment companies
| Investment Company Act file number | 811-22483 |
| Copeland Trust |
| (Exact name of registrant as specified in charter) |
| Eight Tower Bridge, 161 Washington St., Suite #1325 Conshohocken, PA 19428 |
| (Address of principal executive offices) | (Zip code) |
| Ultimus Fund Solutions, LLC, 80 Arkay Drive Suite 10, Hauppauge, NY 11788 |
| (Name and address of agent for service) |
| Registrant’s telephone number, including area code: | (631) 470-2619 | |
| Date of fiscal year end: | 11/30 | |
| | | |
| Date of reporting period: | 5/31/24 | |
Item 1. Reports to Stockholders.
Copeland SMID Cap Dividend Growth Fund
Semi-Annual Shareholder Report - May 31, 2024
This semi-annual shareholder report contains important information about Copeland SMID Cap Dividend Growth Fund for the period of December 1, 2023 to May 31, 2024. You can find additional information about the Fund at https://www.copelandfunds.com/copeland-funds/product-literature. You can also request this information by contacting us at 1-888-926-7352.
What were the Fund’s costs for the last six months?
(based on a hypothetical $10,000 investment)
| Class Name | Costs of a $10,000 investment | Costs paid as a percentage of a $10,000 investment |
|---|
Class IFootnote Reference* | $48 | 0.95%Footnote Reference** |
* During the period, fees were waived and/or expenses reimbursed pursuant to an agreement with the Fund's investment adviser, Copeland Capital Management, LLC. If the agreement is not extended in the future, expenses could be higher.
** Annualized.
How did the Fund perform during the reporting period?
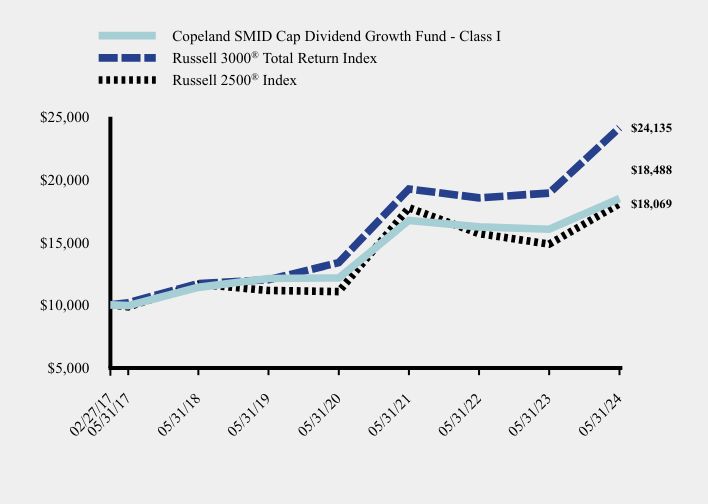
During the six-month period ended May 31, 2024, Class I shares of the Fund rose 10.7%, lagging the 15.0% advance registered by the Russell 2500 Index and 16.0% of the Russell 3000 Index. The equity market rally was aided by growing enthusiasm for technology stocks exposed to artificial intelligence (AI). The concentrated leadership of such stocks was noteworthy within both large and small capitalization benchmarks, while dividend growth securities unsurprisingly failed to keep pace with the frothy market environment. More broadly, the equity market continues to benefit from the dual tailwinds of strong economic data and softening inflation figures. At period end, U.S unemployment of 4.0% remained low relative to historical levels. Core CPI growth moderated to 3.4% in May, well below the 3.9% rate witnessed at period outset in December. While ongoing economic resilience has led the U.S. Federal Reserve to hold its target rate steady at a range of 5.25% to 5.50%, the prospects for rate cuts have improved as inflation moderated, aiding the enthusiasm for stocks. Stock selection in the Consumer Discretionary sector of the market bolstered Fund returns while those in the Information Technology sector were a headwind. Dick’s Sporting Goods (DKS, 2.1% of holdings) was a top performing holding as earnings beat expectations during the period. While concerns abound that consumers are moderating their spending in this category, the company is executing impressively as shown by growing market share, rising sales and margins maintained at a much higher level than were possible before the pandemic. Meanwhile, Concentrix Corporation (CNXC, 1.2%) retreated as investors assume the company will be harmed by the emergence of new technologies developed using AI. The company provides customer experience outsourcing, including call centers, which will be impacted by new technologies. However, we believe the recent slowdown in sales is temporary and that the company will remain a leader in offering tools to clients as they look to cut costs of customer interactions.
How has the Fund performed since inception?
Total Return Based on $10,000 Investment
| Copeland SMID Cap Dividend Growth Fund - Class I | Russell 3000® Total Return Index | Russell 2500® Index |
|---|
| 02/27/17 | $10,000 | $10,000 | $10,000 |
| 05/31/17 | $9,940 | $10,175 | $9,848 |
| 05/31/18 | $11,397 | $11,708 | $11,649 |
| 05/31/19 | $12,107 | $12,000 | $11,149 |
| 05/31/20 | $12,156 | $13,375 | $11,060 |
| 05/31/21 | $16,739 | $19,249 | $17,746 |
| 05/31/22 | $16,222 | $18,540 | $15,684 |
| 05/31/23 | $16,038 | $18,917 | $14,847 |
| 05/31/24 | $18,488 | $24,135 | $18,069 |
Average Annual* Total Returns
| 6 Months | 1 Year | 5 years | Since Inception (2/27/2017) |
|---|
| Copeland SMID Cap Dividend Growth Fund - Class I | 10.69% | 15.28% | 8.84% | 8.84% |
Russell 3000® Total Return Index | 15.99% | 27.58% | 15.00% | 12.91% |
Russell 2500® Index | 15.04% | 21.70% | 10.14% | 8.50% |
* Total returns for periods less than 1 year are not annualized.
The Fund's past performance is not a good predictor of how the Fund will perform in the future. The graph and table do not reflect the deduction of taxes that a shareholder would pay on fund distributions or redemption of fund shares.
- Net Assets$160,406,973
- Number of Portfolio Holdings71
- Advisory Fee (net of waivers)$218,160
- Portfolio Turnover9%
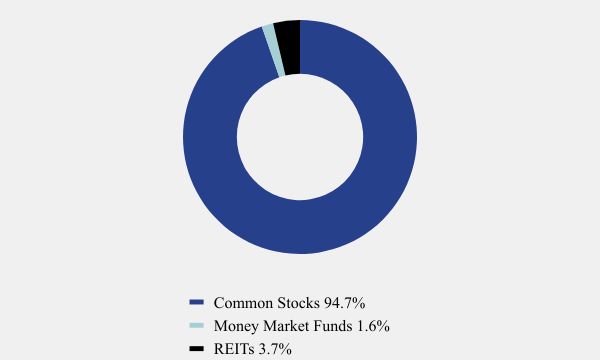
Asset Weighting (% of total investments)
| Value | Value |
|---|
| Common Stocks | 94.7% |
| Money Market Funds | 1.6% |
| REITs | 3.7% |
What did the Fund invest in?
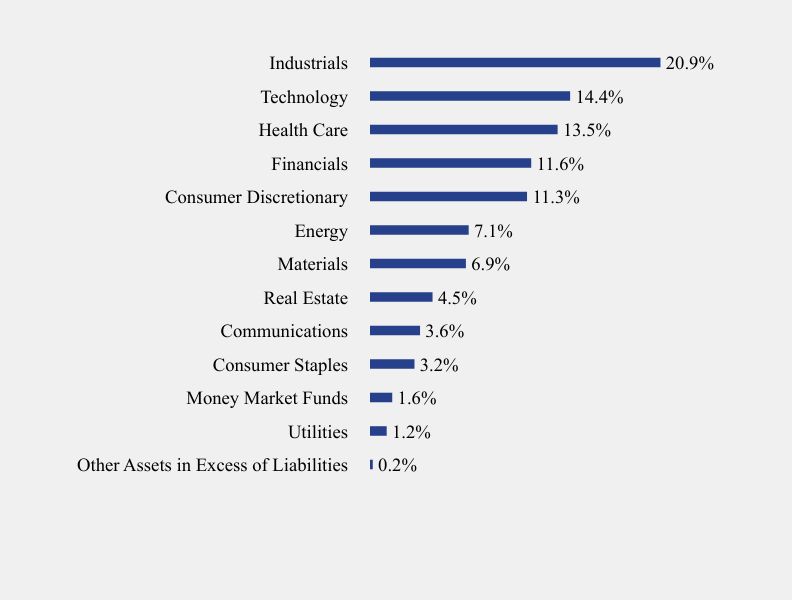
Sector Weighting (% of net assets)
| Value | Value |
|---|
| Other Assets in Excess of Liabilities | 0.2% |
| Utilities | 1.2% |
| Money Market Funds | 1.6% |
| Consumer Staples | 3.2% |
| Communications | 3.6% |
| Real Estate | 4.5% |
| Materials | 6.9% |
| Energy | 7.1% |
| Consumer Discretionary | 11.3% |
| Financials | 11.6% |
| Health Care | 13.5% |
| Technology | 14.4% |
| Industrials | 20.9% |
Top 10 Holdings (% of net assets)
| Holding Name | % of Net Assets |
| Ensign Group, Inc. (The) | 2.2% |
| Dick's Sporting Goods, Inc. | 2.1% |
| Encompass Health Corporation | 2.1% |
| Carlisle Companies, Inc. | 2.1% |
| Reliance, Inc. | 2.0% |
| Hamilton Lane, Inc., Class A | 2.0% |
| Casey's General Stores, Inc. | 2.0% |
| Tetra Tech, Inc. | 2.0% |
| LeMaitre Vascular, Inc. | 1.9% |
| Booz Allen Hamilton Holding Corporation | 1.9% |
No material changes occured during the six months ended May 31, 2024.
Where can I find additional information about the Fund?
This semi-annual shareholder report contains important information about Copeland SMID Cap Dividend Growth Fund for the period of December 1, 2023 to May 31, 2024. You can find additional information about the Fund at https://www.copelandfunds.com/copeland-funds/product-literature. You can also request this information by contacting us at 1-888-926-7352.
Copeland SMID Cap Dividend Growth Fund - Class I (CSMDX)
Semi-Annual Shareholder Report - May 31, 2024
Copeland SMID Cap Dividend Growth Fund
Semi-Annual Shareholder Report - May 31, 2024
This semi-annual shareholder report contains important information about Copeland SMID Cap Dividend Growth Fund for the period of December 1, 2023 to May 31, 2024. You can find additional information about the Fund at https://www.copelandfunds.com/copeland-funds/product-literature. You can also request this information by contacting us at 1-888-926-7352.
What were the Fund’s costs for the last six months?
(based on a hypothetical $10,000 investment)
| Class Name | Costs of a $10,000 investment | Costs paid as a percentage of a $10,000 investment |
|---|
Class AFootnote Reference* | $60 | 1.20%Footnote Reference** |
* During the period, fees were waived and/or expenses reimbursed pursuant to an agreement with the Fund's investment adviser, Copeland Capital Management, LLC. If the agreement is not extended in the future, expenses could be higher.
** Annualized.
How did the Fund perform during the reporting period?
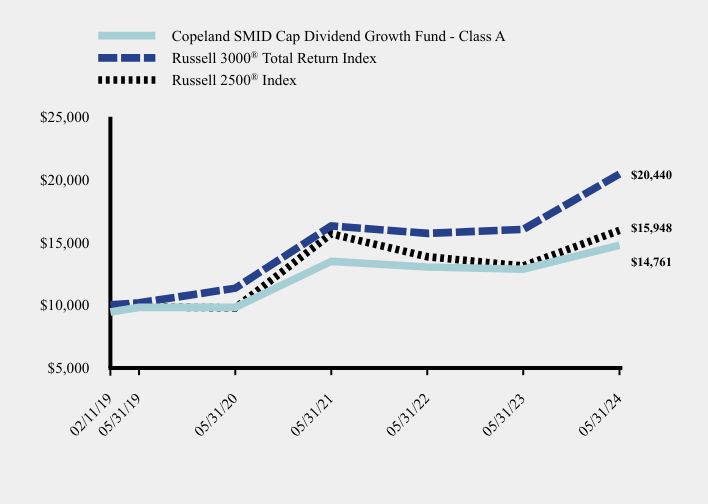
During the six-month period ended May 31, 2024, Class A shares of the Fund rose 10.6%, lagging the 15.0% advance registered by the Russell 2500 Index and 16.0% of the Russell 3000 Index. The equity market rally was aided by growing enthusiasm for technology stocks exposed to artificial intelligence (AI). The concentrated leadership of such stocks was noteworthy within both large and small capitalization benchmarks, while dividend growth securities unsurprisingly failed to keep pace with the frothy market environment. More broadly, the equity market continues to benefit from the dual tailwinds of strong economic data and softening inflation figures. At period end, U.S unemployment of 4.0% remained low relative to historical levels. Core CPI growth moderated to 3.4% in May, well below the 3.9% rate witnessed at period outset in December. While ongoing economic resilience has led the U.S. Federal Reserve to hold its target rate steady at a range of 5.25% to 5.50%, the prospects for rate cuts have improved as inflation moderated, aiding the enthusiasm for stocks. Stock selection in the Consumer Discretionary sector of the market bolstered Fund returns while those in the Information Technology sector were a headwind. Dick’s Sporting Goods (DKS, 2.1% of holdings) was a top performing holding as earnings beat expectations during the period. While concerns abound that consumers are moderating their spending in this category, the company is executing impressively as shown by growing market share, rising sales and margins maintained at a much higher level than were possible before the pandemic. Meanwhile, Concentrix Corporation (CNXC, 1.2%) retreated as investors assume the company will be harmed by the emergence of new technologies developed using AI. The company provides customer experience outsourcing, including call centers, which will be impacted by new technologies. However, we believe the recent slowdown in sales is temporary and that the company will remain a leader in offering tools to clients as they look to cut costs of customer interactions.
How has the Fund performed since inception?
Total Return Based on $10,000 Investment
| Copeland SMID Cap Dividend Growth Fund - Class A | Russell 3000® Total Return Index | Russell 2500® Index |
|---|
| 02/11/19 | $9,423 | $10,000 | $10,000 |
| 05/31/19 | $9,796 | $10,163 | $9,841 |
| 05/31/20 | $9,802 | $11,328 | $9,762 |
| 05/31/21 | $13,471 | $16,302 | $15,663 |
| 05/31/22 | $13,021 | $15,702 | $13,843 |
| 05/31/23 | $12,843 | $16,021 | $13,104 |
| 05/31/24 | $14,761 | $20,440 | $15,948 |
Average Annual* Total Returns
| 6 months | 1 Year | 5 Years | Since Inception (2/11/2019) |
|---|
| Copeland SMID Cap Dividend Growth Fund - Class A | | | | |
| Without Load | 10.57% | 14.94% | 8.55% | 8.84% |
| With Load | 4.22% | 8.32% | 7.27% | 7.63% |
Russell 3000® Total Return Index | 15.99% | 27.58% | 15.00% | 14.45% |
Russell 2500® Index | 15.04% | 21.70% | 10.14% | 9.21% |
* Total returns for periods less than 1 year are not annualized.
The Fund's past performance is not a good predictor of how the Fund will perform in the future. The graph and table do not reflect the deduction of taxes that a shareholder would pay on fund distributions or redemption of fund shares.
- Net Assets$160,406,973
- Number of Portfolio Holdings71
- Advisory Fee (net of waivers)$218,160
- Portfolio Turnover9%
Asset Weighting (% of total investments)
| Value | Value |
|---|
| Common Stocks | 94.7% |
| Money Market Funds | 1.6% |
| REITs | 3.7% |
What did the Fund invest in?
Sector Weighting (% of net assets)
| Value | Value |
|---|
| Other Assets in Excess of Liabilities | 0.2% |
| Utilities | 1.2% |
| Money Market Funds | 1.6% |
| Consumer Staples | 3.2% |
| Communications | 3.6% |
| Real Estate | 4.5% |
| Materials | 6.9% |
| Energy | 7.1% |
| Consumer Discretionary | 11.3% |
| Financials | 11.6% |
| Health Care | 13.5% |
| Technology | 14.4% |
| Industrials | 20.9% |
Top 10 Holdings (% of net assets)
| Holding Name | % of Net Assets |
| Ensign Group, Inc. (The) | 2.2% |
| Dick's Sporting Goods, Inc. | 2.1% |
| Encompass Health Corporation | 2.1% |
| Carlisle Companies, Inc. | 2.1% |
| Reliance, Inc. | 2.0% |
| Hamilton Lane, Inc., Class A | 2.0% |
| Casey's General Stores, Inc. | 2.0% |
| Tetra Tech, Inc. | 2.0% |
| LeMaitre Vascular, Inc. | 1.9% |
| Booz Allen Hamilton Holding Corporation | 1.9% |
No material changes occured during the six months ended May 31, 2024.
Where can I find additional information about the Fund?
This semi-annual shareholder report contains important information about Copeland SMID Cap Dividend Growth Fund for the period of December 1, 2023 to May 31, 2024. You can find additional information about the Fund at https://www.copelandfunds.com/copeland-funds/product-literature. You can also request this information by contacting us at 1-888-926-7352.
Copeland SMID Cap Dividend Growth Fund - Class A (CSDGX)
Semi-Annual Shareholder Report - May 31, 2024
Copeland Dividend Growth Fund
Semi-Annual Shareholder Report - May 31, 2024
This semi-annual shareholder report contains important information about Copeland Dividend Growth Fund for the period of December 1, 2023 to May 31, 2024. You can find additional information about the Fund at https://www.copelandfunds.com/copeland-funds/product-literature. You can also request this information by contacting us at 1-888-926-7352.
What were the Fund’s costs for the last six months?
(based on a hypothetical $10,000 investment)
| Class Name | Costs of a $10,000 investment | Costs paid as a percentage of a $10,000 investment |
|---|
Class AFootnote Reference* | $60 | 1.20%Footnote Reference** |
* During the period, fees were waived and/or expenses reimbursed pursuant to an agreement with the Fund's investment adviser, Copeland Capital Management, LLC. If the agreement is not extended in the future, expenses could be higher.
** Annualized.
How did the Fund perform during the reporting period?
During the six-month period ended May 31, 2024, Class A shares of the Fund rose 11.5%, lagging the 16.0% advance registered by the Russell 3000 Index and 16.4% of the S&P 500 Index. As the period unfolded, market advances were led by a handful of mega-cap technology stocks while dividend growth securities failed to keep pace with the frothy market environment. To wit, the NASDAQ Composite Index rose 18% during the period while the NASDAQ Dividend Achievers Index climbed a more muted 11.1%. Widespread optimism surrounding the financial boost that artificial intelligence will provide to technology behemoths propelled that segment of the market higher. More broadly, the equity market continues to benefit from the dual tailwinds of strong economic data and softening inflation figures. At period end, U.S. unemployment of 4.0% remained low relative to historical levels. Core CPI growth moderated to 3.4% in May, well below the 3.9% rate witnessed at period outset in December. Ongoing economic strength has allowed the U.S. Federal Reserve to hold its target rate steady at a range of 5.25% to 5.50% as the monetary strives to push inflation closer to its long-term target rate of two percent. Our stock selection in the Consumer Staples sector of the market bolstered Fund returns while those in the Information Technology sector, despite rising 14% on average, were a drag. Costco (COST, 2.1% of holdings) was a top performing holding, advancing over 40% during the period. The membership based, warehouse retailer has grown earnings by over 15% annually over the past five years, including those marred by the pandemic. A strategy of offering compelling values by focusing on a limited number of SKUs has driven consistent share gains at the retailer. On the downside, Fund holding Starbucks (SBUX, 0.0% of holdings) was the worst performer in the Fund, dipping roughly 26% during the period. In early May, the coffee behemoth posted weaker than expected quarterly results and lowered forward guidance. Comparable store sales in the company’s two largest markets, the U.S. and China, both contracted. The recent setback and a murky future under new CEO Laxman Narasimhan drove us to exit the shares in favor of more compelling opportunities.
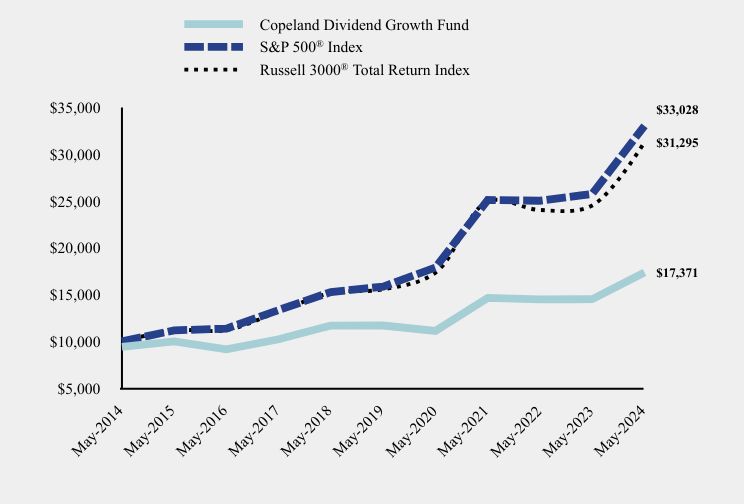
How has the Fund performed over the last ten years?
Total Return Based on $10,000 Investment
| Copeland Dividend Growth Fund | S&P 500® Index | Russell 3000® Total Return Index |
|---|
| May-2014 | $9,427 | $10,000 | $10,000 |
| May-2015 | $10,008 | $11,181 | $11,186 |
| May-2016 | $9,156 | $11,372 | $11,211 |
| May-2017 | $10,236 | $13,359 | $13,194 |
| May-2018 | $11,699 | $15,281 | $15,181 |
| May-2019 | $11,703 | $15,859 | $15,560 |
| May-2020 | $11,128 | $17,895 | $17,344 |
| May-2021 | $14,644 | $25,109 | $24,960 |
| May-2022 | $14,488 | $25,034 | $24,040 |
| May-2023 | $14,513 | $25,766 | $24,529 |
| May-2024 | $17,371 | $33,028 | $31,295 |
Average Annual* Total Returns
| 6 months | 1 Year | 5 Years | 10 Years |
|---|
| Copeland Dividend Growth Fund | | | | |
| Without Load | 11.50% | 19.69% | 8.22% | 6.30% |
| With Load | 5.08% | 12.79% | 6.94% | 5.68% |
S&P 500® Index | 16.35% | 28.19% | 15.80% | 12.69% |
Russell 3000® Total Return Index | 15.99% | 27.58% | 15.00% | 12.09% |
* Total returns for periods less than 1 year are not annualized.
The Fund's past performance is not a good predictor of how the Fund will perform in the future. The graph and table do not reflect the deduction of taxes that a shareholder would pay on fund distributions or redemption of fund shares.
- Net Assets$39,571,330
- Number of Portfolio Holdings69
- Advisory Fee (net of waivers)$0
- Portfolio Turnover21%
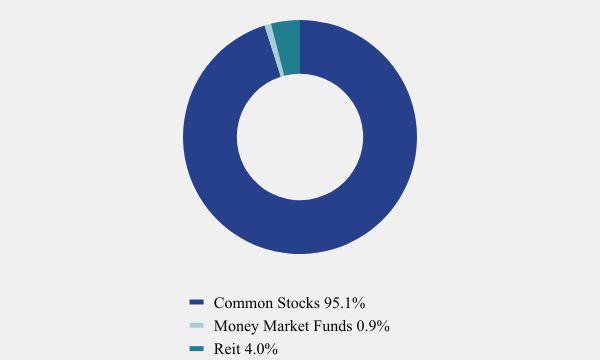
Asset Weighting (% of total investments)
| Value | Value |
|---|
| Common Stocks | 95.1% |
| Money Market Funds | 0.9% |
| Reit | 4.0% |
What did the Fund invest in?
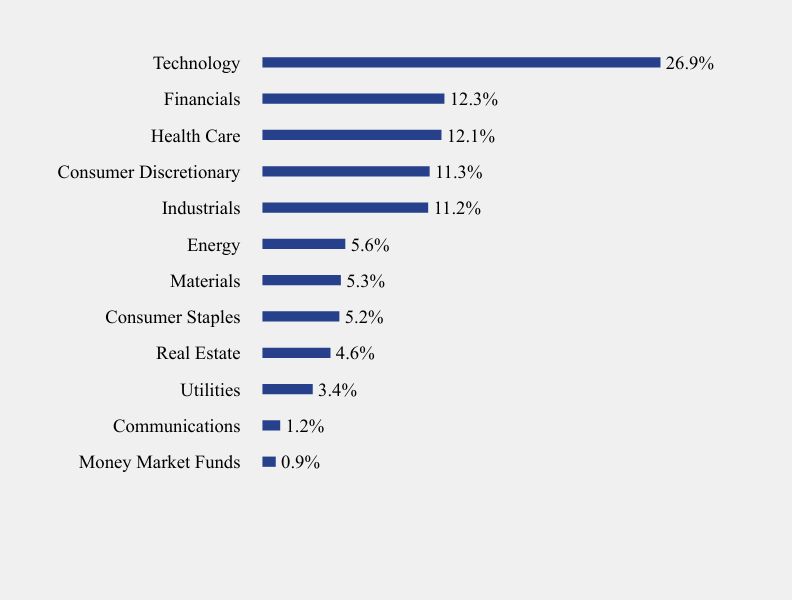
Sector Weighting (% of net assets)
| Value | Value |
|---|
| Money Market Funds | 0.9% |
| Communications | 1.2% |
| Utilities | 3.4% |
| Real Estate | 4.6% |
| Consumer Staples | 5.2% |
| Materials | 5.3% |
| Energy | 5.6% |
| Industrials | 11.2% |
| Consumer Discretionary | 11.3% |
| Health Care | 12.1% |
| Financials | 12.3% |
| Technology | 26.9% |
Top 10 Holdings (% of net assets)
| Holding Name | % of Net Assets |
| Costco Wholesale Corporation | 2.2% |
| NextEra Energy, Inc. | 2.1% |
| Motorola Solutions, Inc. | 2.1% |
| Microsoft Corporation | 1.9% |
| Apple, Inc. | 1.9% |
| Broadcom, Inc. | 1.9% |
| Ensign Group, Inc. (The) | 1.9% |
| Monolithic Power Systems, Inc. | 1.9% |
| Domino's Pizza, Inc. | 1.8% |
| Amphenol Corporation, Class A | 1.7% |
No material changes occured during the six months ended May 31, 2024.
Where can I find additional information about the Fund?
This semi-annual shareholder report contains important information about Copeland Dividend Growth Fund for the period of December 1, 2023 to May 31, 2024. You can find additional information about the Fund at https://www.copelandfunds.com/copeland-funds/product-literature. You can also request this information by contacting us at 1-888-926-7352.
Copeland Dividend Growth Fund - Class A (CDGRX )
Semi-Annual Shareholder Report - May 31, 2024
Copeland Dividend Growth Fund
Semi-Annual Shareholder Report - May 31, 2024
This semi-annual shareholder report contains important information about Copeland Dividend Growth Fund for the period of December 1, 2023 to May 31, 2024. You can find additional information about the Fund at https://www.copelandfunds.com/copeland-funds/product-literature. You can also request this information by contacting us at 1-888-926-7352.
What were the Fund’s costs for the last six months?
(based on a hypothetical $10,000 investment)
| Class Name | Costs of a $10,000 investment | Costs paid as a percentage of a $10,000 investment |
|---|
Class CFootnote Reference* | $98 | 1.95%Footnote Reference** |
* During the period, fees were waived and/or expenses reimbursed pursuant to an agreement with the Fund's investment adviser, Copeland Capital Management, LLC. If the agreement is not extended in the future, expenses could be higher.
** Annualized.
How did the Fund perform during the reporting period?
During the six-month period ended May 31, 2024, Class C shares of the Fund rose 11.1%, lagging the 16.0% advance registered by the Russell 3000 Index and 16.4% of the S&P 500 Index. As the period unfolded, market advances were led by a handful of mega-cap technology stocks while dividend growth securities failed to keep pace with the frothy market environment. To wit, the NASDAQ Composite Index rose 18% during the period while the NASDAQ Dividend Achievers Index climbed a more muted 11.1%. Widespread optimism surrounding the financial boost that artificial intelligence will provide to technology behemoths propelled that segment of the market higher. More broadly, the equity market continues to benefit from the dual tailwinds of strong economic data and softening inflation figures. At period end, U.S. unemployment of 4.0% remained low relative to historical levels. Core CPI growth moderated to 3.4% in May, well below the 3.9% rate witnessed at period outset in December. Ongoing economic strength has allowed the U.S. Federal Reserve to hold its target rate steady at a range of 5.25% to 5.50% as the monetary strives to push inflation closer to its long-term target rate of two percent. Our stock selection in the Consumer Staples sector of the market bolstered Fund returns while those in the Information Technology sector, despite rising 14% on average, were a drag. Costco (COST, 2.1% of holdings) was a top performing holding, advancing over 40% during the period. The membership based, warehouse retailer has grown earnings by over 15% annually over the past five years, including those marred by the pandemic. A strategy of offering compelling values by focusing on a limited number of SKUs has driven consistent share gains at the retailer. On the downside, Fund holding Starbucks (SBUX, 0.0% of holdings) was the worst performer in the Fund, dipping roughly 26% during the period. In early May, the coffee behemoth posted weaker than expected quarterly results and lowered forward guidance. Comparable store sales in the company’s two largest markets, the U.S. and China, both contracted. The recent setback and a murky future under new CEO Laxman Narasimhan drove us to exit the shares in favor of more compelling opportunities.
How has the Fund performed over the last ten years?
Total Return Based on $10,000 Investment
| Copeland Dividend Growth Fund | S&P 500® Index | Russell 3000® Total Return Index |
|---|
| May-2014 | $10,000 | $10,000 | $10,000 |
| May-2015 | $10,537 | $11,181 | $11,186 |
| May-2016 | $9,571 | $11,372 | $11,211 |
| May-2017 | $10,617 | $13,359 | $13,194 |
| May-2018 | $12,041 | $15,281 | $15,181 |
| May-2019 | $11,964 | $15,859 | $15,560 |
| May-2020 | $11,294 | $17,895 | $17,344 |
| May-2021 | $14,738 | $25,109 | $24,960 |
| May-2022 | $14,480 | $25,034 | $24,040 |
| May-2023 | $14,390 | $25,766 | $24,529 |
| May-2024 | $17,092 | $33,028 | $31,295 |
Average Annual* Total Returns
| 6 Months | 1 Year | 5 years | 10 Years |
|---|
| Copeland Dividend Growth Fund | 11.10% | 18.77% | 7.39% | 5.51% |
S&P 500® Index | 16.35% | 28.19% | 15.80% | 12.69% |
Russell 3000® Total Return Index | 15.99% | 27.58% | 15.00% | 12.09% |
* Total returns for periods less than 1 year are not annualized.
The Fund's past performance is not a good predictor of how the Fund will perform in the future. The graph and table do not reflect the deduction of taxes that a shareholder would pay on fund distributions or redemption of fund shares.
- Net Assets$39,571,330
- Number of Portfolio Holdings69
- Advisory Fee (net of waivers)$0
- Portfolio Turnover21%
Asset Weighting (% of total investments)
| Value | Value |
|---|
| Common Stocks | 95.1% |
| Money Market Funds | 0.9% |
| Reit | 4.0% |
What did the Fund invest in?
Sector Weighting (% of net assets)
| Value | Value |
|---|
| Money Market Funds | 0.9% |
| Communications | 1.2% |
| Utilities | 3.4% |
| Real Estate | 4.6% |
| Consumer Staples | 5.2% |
| Materials | 5.3% |
| Energy | 5.6% |
| Industrials | 11.2% |
| Consumer Discretionary | 11.3% |
| Health Care | 12.1% |
| Financials | 12.3% |
| Technology | 26.9% |
Top 10 Holdings (% of net assets)
| Holding Name | % of Net Assets |
| Costco Wholesale Corporation | 2.2% |
| NextEra Energy, Inc. | 2.1% |
| Motorola Solutions, Inc. | 2.1% |
| Microsoft Corporation | 1.9% |
| Apple, Inc. | 1.9% |
| Broadcom, Inc. | 1.9% |
| Ensign Group, Inc. (The) | 1.9% |
| Monolithic Power Systems, Inc. | 1.9% |
| Domino's Pizza, Inc. | 1.8% |
| Amphenol Corporation, Class A | 1.7% |
No material changes occured during the six months ended May 31, 2024.
Where can I find additional information about the Fund?
This semi-annual shareholder report contains important information about Copeland Dividend Growth Fund for the period of December 1, 2023 to May 31, 2024. You can find additional information about the Fund at https://www.copelandfunds.com/copeland-funds/product-literature. You can also request this information by contacting us at 1-888-926-7352.
Copeland Dividend Growth Fund - Class C (CDCRX )
Semi-Annual Shareholder Report - May 31, 2024
Copeland Dividend Growth Fund
Semi-Annual Shareholder Report - May 31, 2024
This semi-annual shareholder report contains important information about Copeland Dividend Growth Fund for the period of December 1, 2023 to May 31, 2024. You can find additional information about the Fund at https://www.copelandfunds.com/copeland-funds/product-literature. You can also request this information by contacting us at 1-888-926-7352.
What were the Fund’s costs for the last six months?
(based on a hypothetical $10,000 investment)
| Class Name | Costs of a $10,000 investment | Costs paid as a percentage of a $10,000 investment |
|---|
Class IFootnote Reference* | $53 | 1.05%Footnote Reference** |
* During the period, fees were waived and/or expenses reimbursed pursuant to an agreement with the Fund's investment adviser, Copeland Capital Management, LLC. If the agreement is not extended in the future, expenses could be higher.
** Annualized.
How did the Fund perform during the reporting period?
During the six-month period ended May 31, 2024, Class I shares of the Fund rose 11.6%, lagging the 16.0% advance registered by the Russell 3000 Index and 16.4% of the S&P 500 Index. As the period unfolded, market advances were led by a handful of mega-cap technology stocks while dividend growth securities failed to keep pace with the frothy market environment. To wit, the NASDAQ Composite Index rose 18% during the period while the NASDAQ Dividend Achievers Index climbed a more muted 11.1%. Widespread optimism surrounding the financial boost that artificial intelligence will provide to technology behemoths propelled that segment of the market higher. More broadly, the equity market continues to benefit from the dual tailwinds of strong economic data and softening inflation figures. At period end, U.S. unemployment of 4.0% remained low relative to historical levels. Core CPI growth moderated to 3.4% in May, well below the 3.9% rate witnessed at period outset in December. Ongoing economic strength has allowed the U.S. Federal Reserve to hold its target rate steady at a range of 5.25% to 5.50% as the monetary strives to push inflation closer to its long-term target rate of two percent. Our stock selection in the Consumer Staples sector of the market bolstered Fund returns while those in the Information Technology sector, despite rising 14% on average, were a drag. Costco (COST, 2.1% of holdings) was a top performing holding, advancing over 40% during the period. The membership based, warehouse retailer has grown earnings by over 15% annually over the past five years, including those marred by the pandemic. A strategy of offering compelling values by focusing on a limited number of SKUs has driven consistent share gains at the retailer. On the downside, Fund holding Starbucks (SBUX, 0.0% of holdings) was the worst performer in the Fund, dipping roughly 26% during the period. In early May, the coffee behemoth posted weaker than expected quarterly results and lowered forward guidance. Comparable store sales in the company’s two largest markets, the U.S. and China, both contracted. The recent setback and a murky future under new CEO Laxman Narasimhan drove us to exit the shares in favor of more compelling opportunities.
How has the Fund performed over the last ten years?
Total Return Based on $10,000 Investment
| Copeland Dividend Growth Fund | S&P 500® Index | Russell 3000® Total Return Index |
|---|
| May-2014 | $10,000 | $10,000 | $10,000 |
| May-2015 | $10,645 | $11,181 | $11,186 |
| May-2016 | $9,756 | $11,372 | $11,211 |
| May-2017 | $10,919 | $13,359 | $13,194 |
| May-2018 | $12,499 | $15,281 | $15,181 |
| May-2019 | $12,532 | $15,859 | $15,560 |
| May-2020 | $11,937 | $17,895 | $17,344 |
| May-2021 | $15,717 | $25,109 | $24,960 |
| May-2022 | $15,579 | $25,034 | $24,040 |
| May-2023 | $15,621 | $25,766 | $24,529 |
| May-2024 | $18,738 | $33,028 | $31,295 |
Average Annual* Total Returns
| 6 Months | 1 Year | 5 years | 10 Years |
|---|
| Copeland Dividend Growth Fund | 11.63% | 19.95% | 8.38% | 6.48% |
S&P 500® Index | 16.35% | 28.19% | 15.80% | 12.69% |
Russell 3000® Total Return Index | 15.99% | 27.58% | 15.00% | 12.09% |
* Total returns for periods less than 1 year are not annualized.
The Fund's past performance is not a good predictor of how the Fund will perform in the future. The graph and table do not reflect the deduction of taxes that a shareholder would pay on fund distributions or redemption of fund shares.
- Net Assets$39,571,330
- Number of Portfolio Holdings69
- Advisory Fee (net of waivers)$0
- Portfolio Turnover21%
Asset Weighting (% of total investments)
| Value | Value |
|---|
| Common Stocks | 95.1% |
| Money Market Funds | 0.9% |
| Reit | 4.0% |
What did the Fund invest in?
Sector Weighting (% of net assets)
| Value | Value |
|---|
| Money Market Funds | 0.9% |
| Communications | 1.2% |
| Utilities | 3.4% |
| Real Estate | 4.6% |
| Consumer Staples | 5.2% |
| Materials | 5.3% |
| Energy | 5.6% |
| Industrials | 11.2% |
| Consumer Discretionary | 11.3% |
| Health Care | 12.1% |
| Financials | 12.3% |
| Technology | 26.9% |
Top 10 Holdings (% of net assets)
| Holding Name | % of Net Assets |
| Costco Wholesale Corporation | 2.2% |
| NextEra Energy, Inc. | 2.1% |
| Motorola Solutions, Inc. | 2.1% |
| Microsoft Corporation | 1.9% |
| Apple, Inc. | 1.9% |
| Broadcom, Inc. | 1.9% |
| Ensign Group, Inc. (The) | 1.9% |
| Monolithic Power Systems, Inc. | 1.9% |
| Domino's Pizza, Inc. | 1.8% |
| Amphenol Corporation, Class A | 1.7% |
No material changes occured during the six months ended May 31, 2024.
Where can I find additional information about the Fund?
This semi-annual shareholder report contains important information about Copeland Dividend Growth Fund for the period of December 1, 2023 to May 31, 2024. You can find additional information about the Fund at https://www.copelandfunds.com/copeland-funds/product-literature. You can also request this information by contacting us at 1-888-926-7352.
Copeland Dividend Growth Fund - Class I (CDIVX )
Semi-Annual Shareholder Report - May 31, 2024
Copeland International Small Cap Fund
Semi-Annual Shareholder Report - May 31, 2024
This semi-annual shareholder report contains important information about Copeland International Small Cap Fund for the period of December 1, 2023 to May 31, 2024.You can find additional information about the Fund at https://www.copelandfunds.com/copeland-funds/product-literature. You can also request this information by contacting us at 1-888-926-7352.
What were the Fund’s costs for the last six months?
(based on a hypothetical $10,000 investment)
| Class Name | Costs of a $10,000 investment | Costs paid as a percentage of a $10,000 investment |
|---|
Class AFootnote Reference* | $59 | 1.19%Footnote Reference** |
* During the period, fees were waived and/or expenses reimbursed pursuant to an agreement with the Fund's investment adviser, Copeland Capital Management, LLC. If the agreement is not extended in the future, expenses could be higher.
** Annualized.
How did the Fund perform during the reporting period?
During the six-month period ended May 31, 2024, Class A shares of the Fund returned 3.5%, lagging the 10.5% advance registered by the MSCI World ex USA Small Cap Net Index and 12.6% of the MSCI World ex USA Net Index. The equity market was supported by the continued strength of global economies, moderating inflation and the growing enthusiasm for technology stocks exposed to artificial intelligence (AI). Dividend growth securities unsurprisingly failed to keep pace with the frothy market environment. Strengthening economies were reflected in the May Purchasing Managers Index (PMI), with the index improving in the Eurozone to 47.3% and in Japan to 50.4%. Meanwhile, inflation continued to moderate across developed economies as Core CPI growth softened to 2.9% in the Eurozone and to 2.6% in Japan in May. Particularly in Japan, lower quality, cheaper companies have performed well during the rally. With the support of moderating inflation, the European Central Bank (ECB) cut its main interest rate from 4% to 3.75%. The Swiss National Bank lowered its main policy rate by 0.25 percentage points to 1.5%. Japan was the exception where in efforts to keep yen from depreciating further and lower inflationary pressures, the Bank of Japan raised its key interest rate from -0.1% to range of 0%-0.1% ending its negative interest rate policy. Except for Japan, the prospects for further rate cuts have improved as inflation moderates, aiding the enthusiasm for stocks. Our stock selection in the Energy sector was a benefit relative to the benchmark while the largest headwind was in the Information Technology sector. Veren Inc. (VRN-CA, 1.3% of holdings) was a top performing energy holding as cash flow beat expectations, and the company continues to expand its drilling, reduce debt and return excess cash to shareholders. Their new assets in the oil rich Montney and Duvernay regions of Canada also provide them with a long growth runway. Meanwhile, Aixtron SE (AIXA-DE, 0.0% of holdings) retreated due to the slowdown in sales of electric vehicles which negatively impacted the sale of equipment for producing silicon carbide-based semiconductors. Apple’s cancellation of their plans to develop the Micro LED Apple Watch also contributed to the de-rating, which we expect to be temporary.
How has the Fund performed since inception?
Total Return Based on $10,000 Investment
| Copeland International Small Cap Fund - Class A | MSCI ACWI ex USA Index | MSCI WORLD ex USA Net (USD) |
|---|
| 12/28/21 | $9,425 | $10,000 | $10,000 |
| 05/31/22 | $7,983 | $8,954 | $8,990 |
| 05/31/23 | $7,619 | $8,828 | $9,128 |
| 05/31/24 | $7,882 | $10,306 | $10,815 |
Average Annual* Total Returns
| 6 months | 1 Year | Since Inception (12/28/2021) |
|---|
| Copeland International Small Cap Fund - Class A | | | |
| Without Load | 3.46% | 3.46% | |
| With Load | -2.50% | -2.50% | -9.36% |
| MSCI ACWI ex USA Index | 11.11% | 16.74% | 1.25% |
| MSCI WORLD ex USA Net (USD) | 12.56% | 18.48% | 3.29% |
* Total returns for periods less than 1 year are not annualized.
The Fund's past performance is not a good predictor of how the Fund will perform in the future. The graph and table do not reflect the deduction of taxes that a shareholder would pay on fund distributions or redemption of fund shares.
What did the Fund invest in?
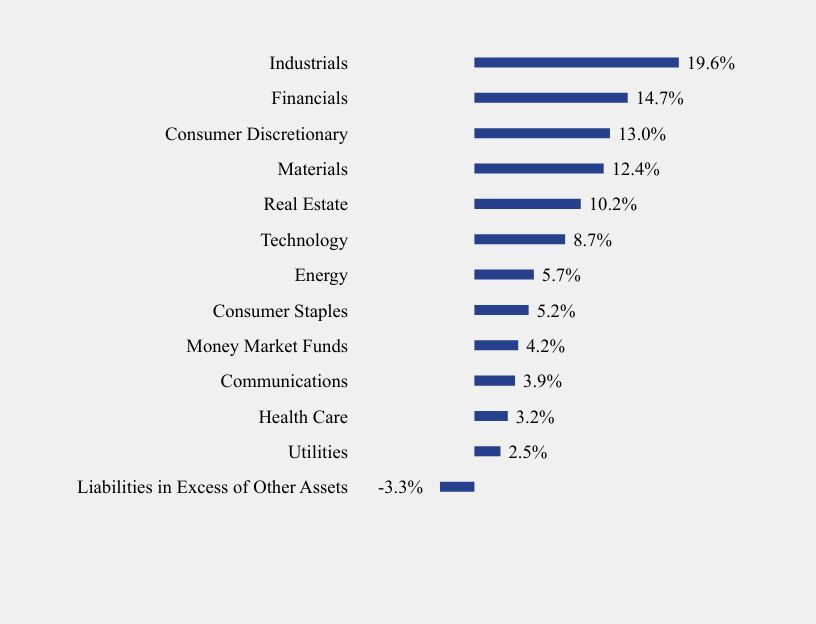
Sector Weighting (% of net assets)
| Value | Value |
|---|
| Liabilities in Excess of Other Assets | -3.3% |
| Utilities | 2.5% |
| Health Care | 3.2% |
| Communications | 3.9% |
| Money Market Funds | 4.2% |
| Consumer Staples | 5.2% |
| Energy | 5.7% |
| Technology | 8.7% |
| Real Estate | 10.2% |
| Materials | 12.4% |
| Consumer Discretionary | 13.0% |
| Financials | 14.7% |
| Industrials | 19.6% |
- Net Assets$532,288
- Number of Portfolio Holdings72
- Advisory Fee (net of waivers)$0
- Portfolio Turnover28%
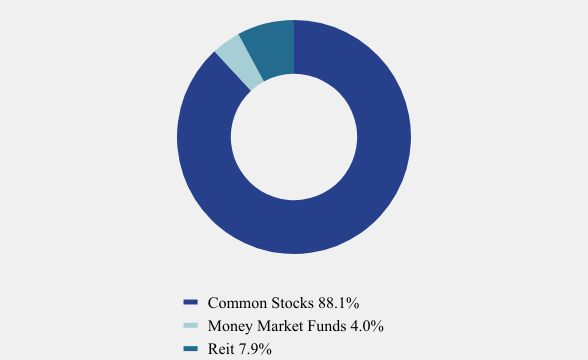
Asset Weighting (% of total investments)
| Value | Value |
|---|
| Common Stocks | 88.1% |
| Money Market Funds | 4.0% |
| Reit | 7.9% |
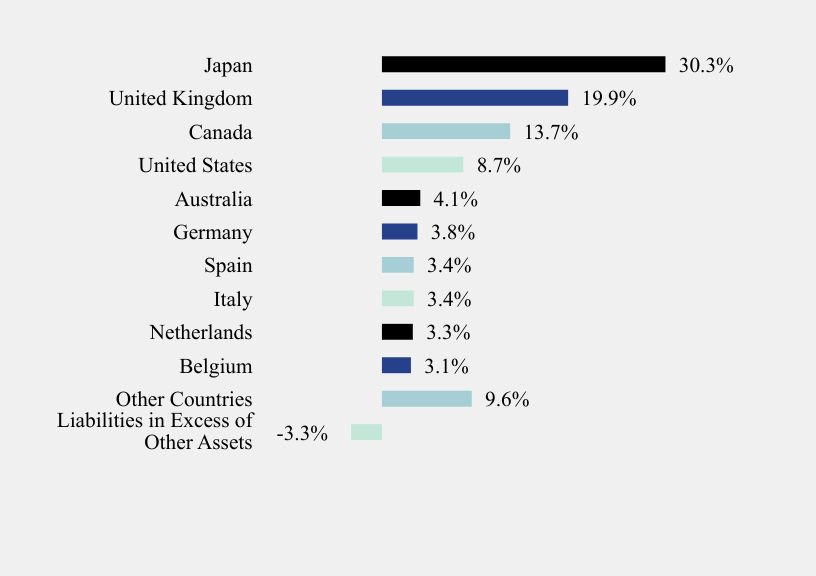
Country Weighting (% of net assets)
| Value | Value |
|---|
| Liabilities in Excess of Other Assets | -3.3% |
| Other Countries | 9.6% |
| Belgium | 3.1% |
| Netherlands | 3.3% |
| Italy | 3.4% |
| Spain | 3.4% |
| Germany | 3.8% |
| Australia | 4.1% |
| United States | 8.7% |
| Canada | 13.7% |
| United Kingdom | 19.9% |
| Japan | 30.3% |
Top 10 Holdings (% of net assets)
| Holding Name | % of Net Assets |
| Northern Institutional Treasury Portfolio | 4.2% |
| Chiba Bank Ltd. (The) | 2.4% |
| Asics Corporation | 2.3% |
| Air Lease Corporation | 2.1% |
| Diploma plc | 2.0% |
| Maruwa Company Ltd. | 2.0% |
| OPAP S.A. | 2.0% |
| JD Sports Fashion PLC | 1.9% |
| Recordati Industria Chimica e Farmaceutica SpA | 1.9% |
| TMX Group Ltd. | 1.8% |
No material changes occured during the six months ended May 31, 2024.
Where can I find additional information about the Fund?
This semi-annual shareholder report contains important information about Copeland International Small Cap Fund for the period of December 1, 2023 to May 31, 2024. You can find additional information about the Fund at https://www.copelandfunds.com/copeland-funds/product-literature. You can also request this information by contacting us at 1-888-926-7352.
Copeland International Small Cap Fund - Class A (CISAX)
Semi-Annual Shareholder Report - May 31, 2024
Copeland International Small Cap Fund
Semi-Annual Shareholder Report - May 31, 2024
This semi-annual shareholder report contains important information about Copeland International Small Cap Fund for the period of December 1, 2023 to May 31, 2024.You can find additional information about the Fund at https://www.copelandfunds.com/copeland-funds/product-literature. You can also request this information by contacting us at 1-888-926-7352.
What were the Fund’s costs for the last six months?
(based on a hypothetical $10,000 investment)
| Class Name | Costs of a $10,000 investment | Costs paid as a percentage of a $10,000 investment |
|---|
Class IFootnote Reference* | $49 | 0.98%Footnote Reference** |
* During the period, fees were waived and/or expenses reimbursed pursuant to an agreement with the Fund's investment adviser, Copeland Capital Management, LLC. If the agreement is not extended in the future, expenses could be higher.
** Annualized.
How did the Fund perform during the reporting period?
During the six-month period ended May 31, 2024, Class I shares of the Fund returned 3.5%, lagging the 10.5% advance registered by the MSCI World ex USA Small Cap Net Index and 12.6% of the MSCI World ex USA Net Index. The equity market was supported by the continued strength of global economies, moderating inflation and the growing enthusiasm for technology stocks exposed to artificial intelligence (AI). Dividend growth securities unsurprisingly failed to keep pace with the frothy market environment. Strengthening economies were reflected in the May Purchasing Managers Index (PMI), with the index iimproving in the Eurozone to 47.3% and in Japan to 50.4%. Meanwhile, inflation continued to moderate across developed economies as Core CPI growth softened to 2.9% in the Eurozone and to 2.6% in Japan in May. Particularly in Japan, lower quality, cheaper companies have performed well during the rally. With the support of moderating inflation, the European Central Bank (ECB) cut its main interest rate from 4% to 3.75%. The Swiss National Bank lowered its main policy rate by 0.25 percentage points to 1.5%. Japan was the exception where in efforts to keep yen from depreciating further and lower inflationary pressures, the Bank of Japan raised its key interest rate from -0.1% to range of 0%-0.1% ending its negative interest rate policy. Except for Japan, the prospects for further rate cuts have improved as inflation moderates, aiding the enthusiasm for stocks. Our stock selection in the Energy sector was a benefit relative to the benchmark while the largest headwind was in the Information Technology sector. Veren Inc. (VRN-CA, 1.3% of holdings) was a top performing energy holding as cash flow beat expectations, and the company continues to expand its drilling, reduce debt and return excess cash to shareholders. Their new assets in the oil rich Montney and Duvernay regions of Canada also provide them with a long growth runway. Meanwhile, Aixtron SE (AIXA-DE, 0.0% of holdings) retreated due to the slowdown in sales of electric vehicles which negatively impacted the sale of equipment for producing silicon carbide-based semiconductors. Apple’s cancellation of their plans to develop the Micro LED Apple Watch also contributed to the de-rating, which we expect to be temporary.
How has the Fund performed since inception?
Total Return Based on $10,000 Investment
| Copeland International Small Cap Fund - Class I | MSCI ACWI ex US Small Cap Net TR | MSCI WORLD ex USA Net (USD) |
|---|
| 12/28/21 | $10,000 | $10,000 | $10,000 |
| 05/31/22 | $8,470 | $8,745 | $8,990 |
| 05/31/23 | $8,084 | $8,343 | $9,128 |
| 05/31/24 | $8,363 | $9,705 | $10,815 |
Average Annual* Total Returns
| 6 Months | 1 Year | Since Inception (12/28/2021) |
|---|
| Copeland International Small Cap Fund - Class I | 3.46% | 3.46% | |
| MSCI ACWI ex US Small Cap Net TR | 10.48% | 16.32% | |
| MSCI WORLD ex USA Net (USD) | 12.56% | 18.48% | 3.29% |
* Total returns for periods less than 1 year are not annualized.
The Fund's past performance is not a good predictor of how the Fund will perform in the future. The graph and table do not reflect the deduction of taxes that a shareholder would pay on fund distributions or redemption of fund shares.
What did the Fund invest in?
Sector Weighting (% of net assets)
| Value | Value |
|---|
| Liabilities in Excess of Other Assets | -3.3% |
| Utilities | 2.5% |
| Health Care | 3.2% |
| Communications | 3.9% |
| Money Market Funds | 4.2% |
| Consumer Staples | 5.2% |
| Energy | 5.7% |
| Technology | 8.7% |
| Real Estate | 10.2% |
| Materials | 12.4% |
| Consumer Discretionary | 13.0% |
| Financials | 14.7% |
| Industrials | 19.6% |
- Net Assets$532,288
- Number of Portfolio Holdings72
- Advisory Fee (net of waivers)$0
- Portfolio Turnover28%
Asset Weighting (% of total investments)
| Value | Value |
|---|
| Common Stocks | 88.1% |
| Money Market Funds | 4.0% |
| Reit | 7.9% |
Country Weighting (% of net assets)
| Value | Value |
|---|
| Liabilities in Excess of Other Assets | -3.3% |
| Other Countries | 9.6% |
| Belgium | 3.1% |
| Netherlands | 3.3% |
| Italy | 3.4% |
| Spain | 3.4% |
| Germany | 3.8% |
| Australia | 4.1% |
| United States | 8.7% |
| Canada | 13.7% |
| United Kingdom | 19.9% |
| Japan | 30.3% |
Top 10 Holdings (% of net assets)
| Holding Name | % of Net Assets |
| Northern Institutional Treasury Portfolio | 4.2% |
| Chiba Bank Ltd. (The) | 2.4% |
| Asics Corporation | 2.3% |
| Air Lease Corporation | 2.1% |
| Diploma plc | 2.0% |
| Maruwa Company Ltd. | 2.0% |
| OPAP S.A. | 2.0% |
| JD Sports Fashion PLC | 1.9% |
| Recordati Industria Chimica e Farmaceutica SpA | 1.9% |
| TMX Group Ltd. | 1.8% |
No material changes occured during the six months ended May 31, 2024.
Where can I find additional information about the Fund?
This semi-annual shareholder report contains important information about Copeland International Small Cap Fund for the period of December 1, 2023 to May 31, 2024. You can find additional information about the Fund at https://www.copelandfunds.com/copeland-funds/product-literature. You can also request this information by contacting us at 1-888-926-7352.
Copeland International Small Cap Fund - Class I (CSIIX)
Semi-Annual Shareholder Report - May 31, 2024
Item 2. Code of Ethics.
Not applicable.
Item 3. Audit Committee Financial Expert.
Not applicable.
Item 4. Principal Accountant Fees and Services.
Not applicable.
Item 5. Audit Committee of Listed Registrants.
Not applicable to open-end investment companies.
Item 6. Investments.
The Registrant’s schedule of investments in unaffiliated issuers is included in the Financial Statements under Item 7 of this form.
Item 7. Financial Statements and Financial Highlights for Open-End Management Investment Companies.
| | | |
| | | |
| | | |
| | Copeland | |
| | Dividend Growth Fund | |
| | Class A Shares: CDGRX | |
| | Class C Shares: CDCRX | |
| | Class I Shares: CDIVX | |
| | | |
| | Copeland | |
| | SMID Cap Dividend Growth Fund | |
| | Class A Shares: CSDGX | |
| | Class I Shares: CSMDX | |
| | | |
| | Copeland | |
| | International Small Cap Fund | |
| | Class A Shares: CISAX | |
| | Class I Shares: CSIIX | |
| | | |
| | | |
| | | |
| | | |
| | | |
| | | |
| | Semi-Annual Report | |
| | May 31, 2024 | |
| | | |
| | | |
| | | |
| | | |
| | | |
| | | |
| | | |
| | | |
| | | |
| | | |
| | Investor Information: 1-888-9-COPELAND | |
| | | |
| | This report and the financial statements contained herein are submitted for the general information of shareholders and are not authorized for distribution to prospective investors unless preceded or accompanied by an effective prospectus. Nothing herein contained is to be considered an offer of sale or solicitation of an offer to buy shares of the Funds. Such offering is made only by prospectus, which includes details as to offering price and other material information. | |
| | | |
| | Distributed by Northern Lights Distributors, LLC | |
| | Member FINRA | |
| | | |
| COPELAND DIVIDEND GROWTH FUND |
| SCHEDULE OF INVESTMENTS (Unaudited) |
| May 31, 2024 |
| |
| Shares | | | | | Fair Value | |
| | | | | COMMON STOCKS — 99.1% | | | | |
| | | | | ASSET MANAGEMENT - 4.2% | | | | |
| | 1,275 | | | Ameriprise Financial, Inc. | | $ | 556,678 | |
| | 12,717 | | | Brookfield Asset Management Ltd. | | | 499,015 | |
| | 4,773 | | | Hamilton Lane, Inc., Class A | | | 598,963 | |
| | | | | | | | 1,654,656 | |
| | | | | BANKING - 1.3% | | | | |
| | 2,635 | | | JPMorgan Chase & Company | | | 533,930 | |
| | | | | | | | | |
| | | | | BEVERAGES - 1.5% | | | | |
| | 2,410 | | | Constellation Brands, Inc., Class A | | | 603,054 | |
| | | | | | | | | |
| | | | | BIOTECH & PHARMA - 3.1% | | | | |
| | 746 | | | Eli Lilly & Company | | | 611,974 | |
| | 3,716 | | | Zoetis, Inc. | | | 630,085 | |
| | | | | | | | 1,242,059 | |
| | | | | CHEMICALS - 2.5% | | | | |
| | 7,276 | | | Corteva, Inc. | | | 407,019 | |
| | 1,881 | | | Sherwin-Williams Company (The) | | | 571,448 | |
| | | | | | | | 978,467 | |
| | | | | COMMERCIAL SUPPORT SERVICES - 1.5% | | | | |
| | 3,700 | | | Waste Connections, Inc. | | | 607,984 | |
| | | | | | | | | |
| | | | | CONSTRUCTION MATERIALS - 1.6% | | | | |
| | 1,523 | | | Carlisle Companies, Inc. | | | 637,056 | |
| | | | | | | | | |
| | | | | DATA CENTER REIT - 1.4% | | | | |
| | 731 | | | Equinix, Inc. | | | 557,738 | |
| | | | | | | | | |
| | | | | ELECTRIC UTILITIES - 2.0% | | | | |
| | 10,214 | | | NextEra Energy, Inc. | | | 817,324 | |
| | | | | | | | | |
| | | | | ELECTRICAL EQUIPMENT - 4.9% | | | | |
| | 5,270 | | | Amphenol Corporation, Class A | | | 697,589 | |
| | 14,614 | | | Cognex Corporation | | | 665,229 | |
| | | | | | | | | |
The accompanying notes are an integral part of these financial statements.
| COPELAND DIVIDEND GROWTH FUND |
| SCHEDULE OF INVESTMENTS (Unaudited) (Continued) |
| May 31, 2024 |
| |
| Shares | | | | | Fair Value | |
| | | | | COMMON STOCKS — 99.1% (Continued) | | | | |
| | | | | ELECTRICAL EQUIPMENT - 4.9% (Continued) | | | | |
| | 5,504 | | | Otis Worldwide Corporation | | $ | 545,997 | |
| | | | | | | | 1,908,815 | |
| | | | | ENGINEERING & CONSTRUCTION - 1.5% | | | | |
| | 2,799 | | | Tetra Tech, Inc. | | | 586,363 | |
| | | | | | | | | |
| | | | | GAS & WATER UTILITIES - 1.4% | | | | |
| | 4,089 | | | American Water Works Company, Inc. | | | 534,719 | |
| | | | | | | | | |
| | | | | HEALTH CARE FACILITIES & SERVICES - 4.7% | | | | |
| | 6,047 | | | Ensign Group, Inc. (The) | | | 733,138 | |
| | 1,337 | | | UnitedHealth Group, Inc. | | | 662,310 | |
| | 4,399 | | | US Physical Therapy, Inc. | | | 451,205 | |
| | | | | | | | 1,846,653 | |
| | | | | INDUSTRIAL SUPPORT SERVICES - 1.1% | | | | |
| | 2,534 | | | WESCO International, Inc. | | | 454,828 | |
| | | | | | | | | |
| | | | | INSTITUTIONAL FINANCIAL SERVICES - 2.7% | | | | |
| | 5,644 | | | Morgan Stanley | | | 552,209 | |
| | 8,893 | | | Nasdaq, Inc. | | | 524,954 | |
| | | | | | | | 1,077,163 | |
| | | | | INSURANCE - 2.7% | | | | |
| | 3,218 | | | Allstate Corporation (The) | | | 539,079 | |
| | 1,384 | | | Kinsale Capital Group, Inc. | | | 530,930 | |
| | | | | | | | 1,070,009 | |
| | | | | LEISURE FACILITIES & SERVICES - 4.4% | | | | |
| | 3,948 | | | Churchill Downs, Inc. | | | 511,266 | |
| | 1,384 | | | Domino’s Pizza, Inc. | | | 703,875 | |
| | 2,197 | | | Marriott International, Inc., Class A | | | 507,880 | |
| | | | | | | | 1,723,021 | |
| | | | | LEISURE PRODUCTS - 1.1% | | | | |
| | 5,504 | | | Brunswick Corporation | | | 454,245 | |
| | | | | | | | | |
The accompanying notes are an integral part of these financial statements.
| COPELAND DIVIDEND GROWTH FUND |
| SCHEDULE OF INVESTMENTS (Unaudited) (Continued) |
| May 31, 2024 |
| |
| Shares | | | | | Fair Value | |
| | | | | COMMON STOCKS — 99.1% (Continued) | | | | |
| | | | | MACHINERY - 0.9% | | | | |
| | 1,508 | | | Nordson Corporation | | $ | 353,958 | |
| | | | | | | | | |
| | | | | MEDICAL EQUIPMENT & DEVICES - 4.3% | | | | |
| | 3,234 | | | ResMed, Inc. | | | 667,272 | |
| | 2,472 | | | STERIS plc | | | 550,959 | |
| | 1,508 | | | West Pharmaceutical Services, Inc. | | | 499,766 | |
| | | | | | | | 1,717,997 | |
| | | | | OFFICE REIT - 1.4% | | | | |
| | 4,711 | | | Alexandria Real Estate Equities, Inc. | | | 560,610 | |
| | | | | | | | | |
| | | | | OIL & GAS PRODUCERS - 4.3% | | | | |
| | 2,970 | | | Cheniere Energy, Inc. | | | 468,636 | |
| | 3,296 | | | Diamondback Energy, Inc. | | | 656,761 | |
| | 13,417 | | | Northern Oil and Gas, Inc. | | | 549,158 | |
| | | | | | | | 1,674,555 | |
| | | | | OIL & GAS SERVICES & EQUIPMENT - 1.3% | | | | |
| | 11,551 | | | Schlumberger Ltd. | | | 530,075 | |
| | | | | | | | | |
| | | | | PUBLISHING & BROADCASTING - 1.2% | | | | |
| | 2,845 | | | Nexstar Media Group, Inc. | | | 471,388 | |
| | | | | | | | | |
| | | | | REAL ESTATE SERVICES - 0.6% | | | | |
| | 20,040 | | | eXp World Holdings, Inc. | | | 224,648 | |
| | | | | | | | | |
| | | | | RESIDENTIAL REIT - 1.2% | | | | |
| | 7,524 | | | Equity LifeStyle Properties, Inc. | | | 472,281 | |
| | | | | | | | | |
| | | | | RETAIL - CONSUMER STAPLES - 3.7% | | | | |
| | 1,819 | | | Casey’s General Stores, Inc. | | | 603,508 | |
| | 1,042 | | | Costco Wholesale Corporation | | | 843,906 | |
| | | | | | | | 1,447,414 | |
| | | | | RETAIL - DISCRETIONARY - 4.5% | | | | |
| | 1,508 | | | Home Depot, Inc. (The) | | | 504,984 | |
| | 4,462 | | | Ross Stores, Inc. | | | 623,609 | |
| | | | | | | | | |
The accompanying notes are an integral part of these financial statements.
| COPELAND DIVIDEND GROWTH FUND |
| SCHEDULE OF INVESTMENTS (Unaudited) (Continued) |
| May 31, 2024 |
| |
| Shares | | | | | Fair Value | |
| | | | | COMMON STOCKS — 99.1% (Continued) | | | | |
| | | | | RETAIL - DISCRETIONARY - 4.5% (Continued) | | | | |
| | 2,208 | | | Tractor Supply Company | | $ | 629,920 | |
| | | | | | | | 1,758,513 | |
| | | | | SEMICONDUCTORS - 6.9% | | | | |
| | 575 | | | Broadcom, Inc. | | | 763,917 | |
| | 995 | | | Monolithic Power Systems, Inc. | | | 731,952 | |
| | 8,037 | | | Power Integrations, Inc. | | | 610,892 | |
| | 3,560 | | | Universal Display Corporation | | | 625,492 | |
| | | | | | | | 2,732,253 | |
| | | | | SOFTWARE - 3.5% | | | | |
| | 1,088 | | | Intuit, Inc. | | | 627,167 | |
| | 1,866 | | | Microsoft Corporation | | | 774,632 | |
| | | | | | | | 1,401,799 | |
| | | | | SPECIALTY FINANCE - 1.4% | | | | |
| | 11,504 | | | Air Lease Corporation | | | 548,051 | |
| | | | | | | | | |
| | | | | STEEL - 1.2% | | | | |
| | 1,617 | | | Reliance, Inc. | | | 486,361 | |
| | | | | | | | | |
| | | | | TECHNOLOGY HARDWARE - 4.0% | | | | |
| | 3,980 | | | Apple, Inc. | | | 765,155 | |
| | 2,239 | | | Motorola Solutions, Inc. | | | 817,033 | |
| | | | | | | | 1,582,188 | |
| | | | | TECHNOLOGY SERVICES - 12.5% | | | | |
| | 1,555 | | | Accenture PLC, Class A | | | 438,961 | |
| | 2,006 | | | Automatic Data Processing, Inc. | | | 491,310 | |
| | 4,228 | | | Booz Allen Hamilton Holding Corporation | | | 643,544 | |
| | 2,736 | | | Broadridge Financial Solutions, Inc. | | | 549,307 | |
| | 2,970 | | | CDW Corporation | | | 664,152 | |
| | 1,119 | | | FactSet Research Systems, Inc. | | | 452,367 | |
| | 3,032 | | | Jack Henry & Associates, Inc. | | | 499,310 | |
| | 1,119 | | | MSCI, Inc. | | | 554,106 | |
| | 2,363 | | | Visa, Inc., Class A | | | 643,823 | |
| | | | | | | | 4,936,880 | |
| | | | | | | | | |
The accompanying notes are an integral part of these financial statements.
| COPELAND DIVIDEND GROWTH FUND |
| SCHEDULE OF INVESTMENTS (Unaudited) (Continued) |
| May 31, 2024 |
| |
| Shares | | | | | Fair Value | |
| | | | | COMMON STOCKS — 99.1% (Continued) | | | | |
| | | | | TRANSPORTATION & LOGISTICS - 1.3% | | | | |
| | 3,187 | | | JB Hunt Transport Services, Inc. | | $ | 512,310 | |
| | | | | | | | | |
| | | | | WHOLESALE - DISCRETIONARY - 1.3% | | | | |
| | 1,461 | | | Pool Corporation | | | 531,147 | |
| | | | | | | | | |
| | | | | TOTAL COMMON STOCKS (Cost $29,142,843) | | | 39,230,512 | |
| | | | | | | | | |
| | | | | SHORT-TERM INVESTMENT — 0.9% | | | | |
| | | | | MONEY MARKET FUND - 0.9% | | | | |
| | 354,157 | | | Northern Institutional Treasury Portfolio, 5.15% (Cost $354,157)(a) | | | 354,157 | |
| | | | | | | | | |
| | | | | TOTAL INVESTMENTS - 100.0% (Cost $29,497,000) | | $ | 39,584,669 | |
| | | | | LIABILITIES IN EXCESS OF OTHER ASSETS - 0.0% | | | (13,339 | ) |
| | | | | NET ASSETS - 100.0% | | $ | 39,571,330 | |
| | | | | | | | | |
| LTD | - Limited Company |
| | |
| MSCI | - Morgan Stanley Capital International |
| | |
| PLC | - Public Limited Company |
| | |
| REIT | - Real Estate Investment Trust |
| | |
| (a) | Rate disclosed is the seven day effective yield as of May 31, 2024. |
The accompanying notes are an integral part of these financial statements.
| COPELAND SMID CAP DIVIDEND GROWTH FUND |
| SCHEDULE OF INVESTMENTS (Unaudited) |
| May 31, 2024 |
| |
| Shares | | | | | Fair Value | |
| | | | | COMMON STOCKS — 98.2% | | | | |
| | | | | AEROSPACE & DEFENSE - 2.5% | | | | |
| | 35,396 | | | Hexcel Corporation | | $ | 2,437,722 | |
| | 6,166 | | | Huntington Ingalls Industries, Inc. | | | 1,560,615 | |
| | | | | | | | 3,998,337 | |
| | | | | ASSET MANAGEMENT - 5.1% | | | | |
| | 65,586 | | | Brookfield Infrastructure Corporation, Class A | | | 2,259,438 | |
| | 37,077 | | | Cohen & Steers, Inc. | | | 2,606,142 | |
| | 25,466 | | | Hamilton Lane, Inc., Class A | | | 3,195,729 | |
| | | | | | | | 8,061,309 | |
| | | | | BANKING - 3.2% | | | | |
| | 17,152 | | | Bank OZK | | | 718,326 | |
| | 97,779 | | | Home BancShares, Inc. | | | 2,299,762 | |
| | 34,835 | | | Prosperity Bancshares, Inc. | | | 2,170,221 | |
| | | | | | | | 5,188,309 | |
| | | | | BIOTECH & PHARMA - 1.1% | | | | |
| | 62,864 | | | Perrigo Company plc | | | 1,730,646 | |
| | | | | | | | | |
| | | | | CHEMICALS - 1.4% | | | | |
| | 12,733 | | | Quaker Chemical Corporation | | | 2,309,130 | |
| | | | | | | | | |
| | | | | COMMERCIAL SUPPORT SERVICES - 3.3% | | | | |
| | 69,750 | | | GFL Environmental, Inc. | | | 2,195,033 | |
| | 16,096 | | | Insperity, Inc. | | | 1,524,613 | |
| | 9,610 | | | UniFirst Corporation | | | 1,524,146 | |
| | | | | | | | 5,243,792 | |
| | | | | CONSTRUCTION MATERIALS - 2.1% | | | | |
| | 7,928 | | | Carlisle Companies, Inc. | | | 3,316,202 | |
| | | | | | | | | |
| | | | | ELECTRICAL EQUIPMENT - 4.4% | | | | |
| | 19,940 | | | BWX Technologies, Inc. | | | 1,837,072 | |
| | 57,098 | | | Cognex Corporation | | | 2,599,101 | |
| | 7,848 | | | Littelfuse, Inc. | | | 2,013,797 | |
| | 15,962 | | | Sensata Technologies Holding plc | | | 659,550 | |
| | | | | | | | 7,109,520 | |
The accompanying notes are an integral part of these financial statements.
| COPELAND SMID CAP DIVIDEND GROWTH FUND |
| SCHEDULE OF INVESTMENTS (Unaudited) (Continued) |
| May 31, 2024 |
| |
| Shares | | | | | Fair Value | |
| | | | | COMMON STOCKS — 98.2% (Continued) | | | | |
| | | | | ENGINEERING & CONSTRUCTION - 1.9% | | | | |
| | 14,895 | | | Tetra Tech, Inc. | | $ | 3,120,354 | |
| | | | | | | | | |
| | | | | FORESTRY, PAPER & WOOD PRODUCTS - 1.4% | | | | |
| | 18,258 | | | UFP Industries, Inc. | | | 2,181,466 | |
| | | | | | | | | |
| | | | | GAS & WATER UTILITIES - 1.2% | | | | |
| | 16,817 | | | Chesapeake Utilities Corporation | | | 1,883,672 | |
| | | | | | | | | |
| | | | | HEALTH CARE FACILITIES & SERVICES - 8.4% | | | | |
| | 3,764 | | | Chemed Corporation | | | 2,086,649 | |
| | 38,519 | | | Encompass Health Corporation | | | 3,327,656 | |
| | 29,310 | | | Ensign Group, Inc. (The) | | | 3,553,545 | |
| | 14,334 | | | Quest Diagnostics, Inc. | | | 2,034,998 | |
| | 22,983 | | | US Physical Therapy, Inc. | | | 2,357,366 | |
| | | | | | | | 13,360,214 | |
| | | | | HOTEL REIT - 1.2% | | | | |
| | 19,139 | | | Ryman Hospitality Properties, Inc. | | | 2,010,934 | |
| | | | | | | | | |
| | | | | HOUSEHOLD PRODUCTS - 1.2% | | | | |
| | 16,016 | | | Inter Parfums, Inc. | | | 1,918,396 | |
| | | | | | | | | |
| | | | | INDUSTRIAL INTERMEDIATE PROD - 1.6% | | | | |
| | 10,250 | | | Valmont Industries, Inc. | | | 2,576,850 | |
| | | | | | | | | |
| | | | | INDUSTRIAL REIT - 1.3% | | | | |
| | 35,476 | | | Terreno Realty Corporation | | | 2,007,232 | |
| | | | | | | | | |
| | | | | INDUSTRIAL SUPPORT SERVICES - 1.7% | | | | |
| | 15,376 | | | WESCO International, Inc. | | | 2,759,838 | |
| | | | | | | | | |
| | | | | INSURANCE - 1.6% | | | | |
| | 6,807 | | | Kinsale Capital Group, Inc. | | | 2,611,301 | |
| | | | | | | | | |
The accompanying notes are an integral part of these financial statements.
| COPELAND SMID CAP DIVIDEND GROWTH FUND |
| SCHEDULE OF INVESTMENTS (Unaudited) (Continued) |
| May 31, 2024 |
| |
| Shares | | | | | Fair Value | |
| | | | | COMMON STOCKS — 98.2% (Continued) | | | | |
| | | | | INTERNET MEDIA & SERVICES - 1.3% | | | | |
| | 49,730 | | | Shutterstock, Inc. | | $ | 2,020,530 | |
| | | | | | | | | |
| | | | | LEISURE FACILITIES & SERVICES - 6.5% | | | | |
| | 19,219 | | | Churchill Downs, Inc. | | | 2,488,861 | |
| | 5,686 | | | Domino’s Pizza, Inc. | | | 2,891,787 | |
| | 48,849 | | | Travel + Leisure Company | | | 2,146,425 | |
| | 7,688 | | | Wingstop, Inc. | | | 2,834,181 | |
| | | | | | | | 10,361,254 | |
| | | | | LEISURE PRODUCTS - 1.4% | | | | |
| | 27,948 | | | Brunswick Corporation | | | 2,306,548 | |
| | | | | | | | | |
| | | | | MACHINERY - 3.0% | | | | |
| | 8,969 | | | Nordson Corporation | | | 2,105,204 | |
| | 15,856 | | | Standex International Corporation | | | 2,667,137 | |
| | | | | | | | 4,772,341 | |
| | | | | MEDICAL EQUIPMENT & DEVICES - 4.1% | | | | |
| | 37,966 | | | LeMaitre Vascular, Inc. | | | 2,994,758 | |
| | 11,772 | | | STERIS plc | | | 2,623,743 | |
| | 50,531 | | | Stevanato Group SpA | | | 1,026,790 | |
| | | | | | | | 6,645,291 | |
| | | | | OIL & GAS PRODUCERS - 5.7% | | | | |
| | 11,291 | | | Chord Energy Corporation | | | 2,093,464 | |
| | 29,710 | | | Civitas Resources, Inc. | | | 2,185,468 | |
| | 39,240 | | | Matador Resources Company | | | 2,489,778 | |
| | 56,448 | | | Northern Oil and Gas, Inc. | | | 2,310,417 | |
| | | | | | | | 9,079,127 | |
| | | | | OIL & GAS SERVICES & EQUIPMENT - 1.4% | | | | |
| | 69,670 | | | ChampionX Corporation | | | 2,272,635 | |
| | | | | | | | | |
| | | | | PUBLISHING & BROADCASTING - 1.2% | | | | |
| | 11,452 | | | Nexstar Media Group, Inc. | | | 1,897,482 | |
| | | | | | | | | |
The accompanying notes are an integral part of these financial statements.
| COPELAND SMID CAP DIVIDEND GROWTH FUND |
| SCHEDULE OF INVESTMENTS (Unaudited) (Continued) |
| May 31, 2024 |
| |
| Shares | | | | | Fair Value | |
| | | | | COMMON STOCKS — 98.2% (Continued) | | | | |
| | | | | REAL ESTATE SERVICES - 0.9% | | | | |
| | 126,848 | | | eXp World Holdings, Inc. | | $ | 1,421,966 | |
| | | | | | | | | |
| | | | | RETAIL - CONSUMER STAPLES - 2.0% | | | | |
| | 9,610 | | | Casey’s General Stores, Inc. | | | 3,188,406 | |
| | | | | | | | | |
| | | | | RETAIL - DISCRETIONARY - 2.1% | | | | |
| | 15,055 | | | Dick’s Sporting Goods, Inc. | | | 3,427,120 | |
| | | | | | | | | |
| | | | | SELF-STORAGE REITS - 1.2% | | | | |
| | 44,044 | | | CubeSmart | | | 1,863,502 | |
| | | | | | | | | |
| | | | | SEMICONDUCTORS - 4.1% | | | | |
| | 41,962 | | | Kulicke & Soffa Industries, Inc. | | | 1,916,405 | |
| | 31,952 | | | Power Integrations, Inc. | | | 2,428,671 | |
| | 12,413 | | | Universal Display Corporation | | | 2,180,964 | |
| | | | | | | | 6,526,040 | |
| | | | | SOFTWARE - 1.4% | | | | |
| | 7,688 | | | Bentley Systems, Inc., Class B | | | 386,245 | |
| | 31,472 | | | Concentrix Corporation | | | 1,930,178 | |
| | | | | | | | 2,316,423 | |
| | | | | SPECIALTY FINANCE - 1.7% | | | | |
| | 56,457 | | | Air Lease Corporation | | | 2,689,611 | |
| | | | | | | | | |
| | | | | STEEL - 2.0% | | | | |
| | 10,891 | | | Reliance, Inc. | | | 3,275,795 | |
| | | | | | | | | |
| | | | | TECHNOLOGY SERVICES - 8.8% | | | | |
| | 19,540 | | | Booz Allen Hamilton Holding Corporation | | | 2,974,184 | |
| | 13,934 | | | Broadridge Financial Solutions, Inc. | | | 2,797,529 | |
| | 4,805 | | | FactSet Research Systems, Inc. | | | 1,942,469 | |
| | 12,973 | | | Jack Henry & Associates, Inc. | | | 2,136,394 | |
| | 7,928 | | | Morningstar, Inc. | | | 2,285,246 | |
| | 29,870 | | | TransUnion | | | 2,148,250 | |
| | | | | | | | 14,284,072 | |
The accompanying notes are an integral part of these financial statements.
| COPELAND SMID CAP DIVIDEND GROWTH FUND |
| SCHEDULE OF INVESTMENTS (Unaudited) (Continued) |
| May 31, 2024 |
| |
| Shares | | | | | Fair Value | |
| | | | | COMMON STOCKS — 98.2% (Continued) | | | | |
| | | | | TELECOMMUNICATIONS - 1.1% | | | | |
| | 30,591 | | | Cogent Communications Holdings, Inc. | | $ | 1,811,599 | |
| | | | | | | | | |
| | | | | TRANSPORTATION & LOGISTICS - 1.4% | | | | |
| | 12,493 | | | Landstar System, Inc. | | | 2,274,101 | |
| | | | | | | | | |
| | | | | TRANSPORTATION EQUIPMENT - 1.0% | | | | |
| | 21,302 | | | Allison Transmission Holdings, Inc. | | | 1,614,905 | |
| | | | | | | | | |
| | | | | WHOLESALE - DISCRETIONARY - 1.3% | | | | |
| | 5,526 | | | Pool Corporation | | | 2,008,976 | |
| | | | | | | | | |
| | | | | TOTAL COMMON STOCKS (Cost $148,012,379) | | | 157,445,226 | |
| | | | | | | | | |
| | | | | SHORT-TERM INVESTMENT — 1.6% | | | | |
| | | | | MONEY MARKET FUND - 1.6% | | | | |
| | 2,572,848 | | | Northern Institutional Treasury Portfolio, 5.15% (Cost $2,572,848)(a) | | | 2,572,848 | |
| | | | | | | | | |
| | | | | TOTAL INVESTMENTS - 99.8% (Cost $150,585,227) | | $ | 160,018,074 | |
| | | | | OTHER ASSETS IN EXCESS OF LIABILITIES- 0.2% | | | 388,899 | |
| | | | | NET ASSETS - 100.0% | | $ | 160,406,973 | |
| | | | | | | | | |
| PLC | - Public Limited Company |
| | |
| REIT | - Real Estate Investment Trust |
| | |
| (a) | Rate disclosed is the seven day effective yield as of May 31, 2024. |
The accompanying notes are an integral part of these financial statements.
| COPELAND INTERNATIONAL SMALL CAP FUND |
| SCHEDULE OF INVESTMENTS (Unaudited) |
| May 31, 2024 |
| |
| Shares | | | | | Fair Value | |
| | | | | COMMON STOCKS — 99.1% | | | | |
| | | | | Australia - 4.2% | | | | |
| | 787 | | | Lifestyle Communities Ltd. | | $ | 6,540 | |
| | 1,938 | | | Steadfast Group Ltd. | | | 7,146 | |
| | 3,528 | | | Ventia Services Group Pty Ltd. | | | 8,471 | |
| | | | | | | | 22,157 | |
| | | | | Belgium - 3.0% | | | | |
| | 98 | | | Montea N.V. | | | 8,937 | |
| | 246 | | | Warehouses De Pauw CVA | | | 7,209 | |
| | | | | | | | 16,146 | |
| | | | | Canada - 13.7% | | | | |
| | 202 | | | Brookfield Infrastructure Corporation | | | 6,963 | |
| | 126 | | | Granite Real Estate Investment Trust | | | 6,234 | |
| | 814 | | | InterRent Real Estate Investment Trust | | | 7,145 | |
| | 402 | | | PrairieSky Royalty Ltd. | | | 8,175 | |
| | 128 | | | Stella-Jones, Inc. | | | 7,643 | |
| | 358 | | | TMX Group Ltd. | | | 9,611 | |
| | 60 | | | Toromont Industries Ltd. | | | 5,242 | |
| | 136 | | | Tourmaline Oil Corporation | | | 6,748 | |
| | 799 | | | Veren, Inc. | | | 6,955 | |
| | 1,053 | | | Whitecap Resources, Inc. | | | 8,246 | |
| | | | | | | | 72,962 | |
| | | | | Cayman Islands - 1.3% | | | | |
| | 12,249 | | | Bosideng International Holdings Ltd. | | | 7,088 | |
| | | | | | | | | |
| | | | | Denmark - 1.4% | | | | |
| | 143 | | | Sydbank A/S(a) | | | 7,621 | |
| | | | | | | | | |
| | | | | Germany - 3.8% | | | | |
| | 104 | | | Hensoldt AG | | | 4,239 | |
| | 145 | | | KION Group A.G.(a) | | | 6,858 | |
| | 124 | | | Scout24 A.G. | | | 9,327 | |
| | | | | | | | 20,424 | |
| | | | | Greece - 2.0% | | | | |
| | 662 | | | OPAP S.A. | | | 10,521 | |
| | | | | | | | | |
The accompanying notes are an integral part of these financial statements.
| COPELAND INTERNATIONAL SMALL CAP FUND |
| SCHEDULE OF INVESTMENTS (Unaudited) (Continued) |
| May 31, 2024 |
| |
| Shares | | | | | Fair Value | |
| | | | | COMMON STOCKS — 99.1% (Continued) | | | | |
| | | | | Italy - 3.4% | | | | |
| | 172 | | | Interpump Group SpA | | $ | 8,111 | |
| | 188 | | | Recordati Industria Chimica e Farmaceutica SpA | | | 9,921 | |
| | | | | | | | 18,032 | |
| | | | | Japan - 30.2% | | | | |
| | 219 | | | Asics Corporation | | | 12,165 | |
| | 1,310 | | | Chiba Bank Ltd. (The)(a) | | | 12,520 | |
| | 59 | | | Cosmos Pharmaceutical Corporation | | | 4,756 | |
| | 101 | | | Goldwin, Inc. | | | 5,279 | |
| | 125 | | | Hamamatsu Photonics KK | | | 3,696 | |
| | 215 | | | Information Services International-Dentsu Ltd. | | | 7,047 | |
| | 448 | | | Internet Initiative Japan, Inc. | | | 6,311 | |
| | 345 | | | JCU Corporation | | | 8,085 | |
| | 769 | | | Kotobuki Spirits Company Ltd. | | | 8,506 | |
| | 179 | | | Kurita Water Industries Ltd. | | | 7,675 | |
| | 47 | | | Maruwa Company Ltd. | | | 10,558 | |
| | 1,032 | | | Mitsubishi UFJ Lease & Finance Company Ltd. | | | 6,850 | |
| | 231 | | | Monogatari Corporation (The) | | | 5,083 | |
| | 270 | | | Nichias Corporation(a) | | | 8,187 | |
| | 417 | | | Nippon Gas Company Ltd.(a) | | | 6,364 | |
| | 132 | | | Nissan Chemical Corporation | | | 3,670 | |
| | 200 | | | Nomura Real Estate Holdings, Inc.(a) | | | 5,156 | |
| | 377 | | | Plus Alpha Consulting | | | 4,494 | |
| | 400 | | | Rohto Pharmaceutical Company Ltd. | | | 7,052 | |
| | 430 | | | SMS Company Ltd. | | | 5,331 | |
| | 264 | | | Strike Co., Ltd. | | | 7,105 | |
| | 160 | | | Takeuchi Manufacturing Company Ltd.(a) | | | 6,243 | |
| | 939 | | | Zeon Corporation | | | 8,715 | |
| | | | | | | | 160,848 | |
| | | | | Netherlands - 3.2% | | | | |
| | 90 | | | Euronext N.V.(a) | | | 8,860 | |
| | 345 | | | Technip Energies N.V. | | | 8,345 | |
| | | | | | | | 17,205 | |
| | | | | Norway - 2.5% | | | | |
| | 413 | | | Borregaard ASA | | | 7,570 | |
| | | | | | | | | |
The accompanying notes are an integral part of these financial statements.
| COPELAND INTERNATIONAL SMALL CAP FUND |
| SCHEDULE OF INVESTMENTS (Unaudited) (Continued) |
| May 31, 2024 |
| |
| Shares | | | | | Fair Value | |
| | | | | COMMON STOCKS — 99.1% (Continued) | | | | |
| | | | | Norway - 2.5% (Continued) | | | | |
| | 64 | | | Kongsberg Gruppen ASA | | $ | 5,503 | |
| | | | | | | | 13,073 | |
| | | | | Spain - 3.4% | | | | |
| | 70 | | | Vidrala S.A. | | | 8,555 | |
| | 145 | | | Viscofan S.A. | | | 9,501 | |
| | | | | | | | 18,056 | |
| | | | | Sweden - 1.1% | | | | |
| | 225 | | | Sagax AB | | | 5,939 | |
| | | | | | | | | |
| | | | | Switzerland - 1.4% | | | | |
| | 59 | | | VZ Holding A.G. | | | 7,327 | |
| | | | | | | | | |
| | | | | United Kingdom - 20.0% | | | | |
| | 1,083 | | | Bytes Technology Group plc | | | 7,757 | |
| | 1,637 | | | Chemring Group plc | | | 8,080 | |
| | 7,654 | | | Coats Group plc | | | 8,410 | |
| | 73 | | | Croda International PLC | | | 4,265 | |
| | 206 | | | Diploma plc | | | 10,800 | |
| | 335 | | | Halma PLC(a) | | | 9,591 | |
| | 730 | | | Hilton Food Group plc | | | 8,385 | |
| | 6,299 | | | JD Sports Fashion PLC(a) | | | 10,355 | |
| | 740 | | | RS GROUP plc | | | 6,708 | |
| | 746 | | | Safestore Holdings plc | | | 8,623 | |
| | 1,270 | | | Treatt plc | | | 8,129 | |
| | 416 | | | UNITE Group PLC (The) | | | 4,963 | |
| | 271 | | | WH Smith plc | | | 3,980 | |
| | 494 | | | YouGov plc | | | 6,205 | |
| | | | | | | | 106,251 | |
| | | | | United States - 4.5% | | | | |
| | 232 | | | Air Lease Corporation | | | 11,052 | |
| | 51 | | | Inter Parfums, Inc. | | | 6,109 | |
| | 38 | | | Universal Display Corporation | | | 6,677 | |
| | | | | | | | 23,838 | |
| | | | | | | | | |
The accompanying notes are an integral part of these financial statements.
| COPELAND INTERNATIONAL SMALL CAP FUND |
| SCHEDULE OF INVESTMENTS (Unaudited) (Continued) |
| May 31, 2024 |
| |
| Shares | | | | | Fair Value | |
| | | | | COMMON STOCKS — 99.1% (Continued) | | | | |
| | | | | United States - 4.5% (Continued) | | | | |
| | | | | | | | | |
| | | | | TOTAL COMMON STOCKS (Cost $507,850) | | $ | 527,488 | |
| | | | | | | | | |
| | | | | SHORT-TERM INVESTMENT — 4.2% | | | | |
| | | | | MONEY MARKET FUND - 4.2% | | | | |
| | 22,257 | | | Northern Institutional Treasury Portfolio, 5.15% (Cost $22,257)(b) | | | 22,257 | |
| | | | | | | | | |
| | | | | TOTAL INVESTMENTS - 103.3% (Cost $530,107) | | $ | 549,745 | |
| | | | | LIABILITIES IN EXCESS OF OTHER ASSETS - (3.3)% | | | (17,457 | ) |
| | | | | NET ASSETS - 100.0% | | $ | 532,288 | |
| | | | | | | | | |
| AG/A.G. | - Aktiengesellschaf |
| | |
| A/S | - Anonim Sirketi |
| | |
| ASA | - Advanced Subscription Agreement |
| | |
| CVA | - Company Voluntary Arrangement |
| | |
| LTD | - Limited Company |
| | |
| N.V. | - Naamioze Vennootschap |
| | |
| S.A. | - Société Anonyme |
| | |
| SpA | - Societa Per Azione |
| | |
| (a) | The value of this security has been determined in good faith under policies of the Board of Trustees. |
| (b) | Rate disclosed is the seven day effective yield as of May 31, 2024. |
The accompanying notes are an integral part of these financial statements.
| Copeland Trust |
| STATEMENTS OF ASSETS AND LIABILITIES (Unaudited) |
| May 31, 2024 |
| | | | | | Copeland SMID | | | Copeland | |
| | | Copeland Dividend | | | Cap Dividend | | | International | |
| | | Growth Fund | | | Growth Fund | | | Small Cap Fund | |
| Assets: | | | | | | | | | | | | |
| Investments, at Cost | | $ | 29,497,000 | | | $ | 150,585,227 | | | $ | 530,107 | |
| Investments in Securities, at Market Value | | $ | 39,584,669 | | | $ | 160,018,074 | | | $ | 549,745 | |
| Foreign Cash (Cost $0, $0, $332) | | | — | | | | — | | | | 332 | |
| Dividends and Interest Receivable | | | 47,014 | | | | 245,555 | | | | 2,289 | |
| Receivable for Securities Sold | | | — | | | | 119,484 | | | | — | |
| Due from Investment Adviser | | | 7,402 | | | | — | | | | 7,464 | |
| Receivable for Fund Shares Sold | | | — | | | | 151,807 | | | | — | |
| Prepaid Expenses and Other Assets | | | 54,934 | | | | 102,755 | | | | 573 | |
| Total Assets | | | 39,694,019 | | | | 160,637,675 | | | | 560,403 | |
| | | | | | | | | | | | | |
| Liabilities: | | | | | | | | | | | | |
| Payable for Securities Purchased | | | — | | | | 96,244 | | | | — | |
| Payable for Fund Shares Redeemed | | | 50,136 | | | | 58,305 | | | | — | |
| Payable to Investment Adviser | | | — | | | | 56,788 | | | | — | |
| Accrued Audit Fees | | | 9,969 | | | | 7,073 | | | | 7,837 | |
| Accrued Distribution Fees | | | 10,616 | | | | 518 | | | | — | |
| Payable to Related Parties | | | 17,583 | | | | 5,831 | | | | 9,835 | |
| Other Accrued Expenses | | | 34,385 | | | | 5,943 | | | | 10,443 | |
| Total Liabilities | | | 122,689 | | | | 230,702 | | | | 28,115 | |
| | | | | | | | | | | | | |
| Net Assets | | $ | 39,571,330 | | | $ | 160,406,973 | | | $ | 532,288 | |
| | | | | | | | | | | | | |
| Composition of Net Assets: | | | | | | | | | | | | |
| At May 31, 2024, Net Assets consisted of: | | | | | | | | | | | | |
| Paid-in-Capital | | $ | 27,227,938 | | | $ | 151,039,876 | | | $ | 613,800 | |
| Accumulated Earnings/(Deficit) | | | 12,343,392 | | | | 9,367,097 | | | | (81,512 | ) |
| Net Assets | | $ | 39,571,330 | | | $ | 160,406,973 | | | $ | 532,288 | |
| | | | | | | | | | | | | |
| Class A Shares: | | | | | | | | | | | | |
| Net Assets | | $ | 13,287,690 | | | $ | 2,068,760 | | | $ | 8 | |
| | | | | | | | | | | | | |
| Shares Outstanding (no par value; unlimited number of shares authorized) | | | 1,008,847 | | | | 135,041 | | | | 1 | |
| | | | | | | | | | | | | |
| Net Asset Value and Redemption Price Per Share* | | $ | 13.17 | | | $ | 15.32 | | | $ | 7.96 | + |
| Offering Price Per Share (NAV/$0.9425) Includes a Maximum Sales Charge of 5.75% | | $ | 13.97 | | | $ | 16.25 | | | $ | 8.45 | |
| | | | | | | | | | | | | |
| Class C Shares: | | | | | | | | | | | | |
| Net Assets | | $ | 9,123,182 | | | | | | | | | |
| | | | | | | | | | | | | |
| Shares Outstanding (no par value; unlimited number of shares authorized) | | | 744,605 | | | | | | | | | |
| | | | | | | | | | | | | |
| Net Asset Value, Offering Price and Redemption Price Per Share* | | $ | 12.25 | | | | | | | | | |
| | | | | | | | | | | | | |
| Class I Shares: | | | | | | | | | | | | |
| Net Assets | | $ | 17,160,458 | | | $ | 158,338,213 | | | $ | 532,280 | |
| | | | | | | | | | | | | |
| Shares Outstanding (no par value; unlimited number of shares authorized) | | | 1,323,517 | | | | 10,264,066 | | | | 66,874 | |
| | | | | | | | | | | | | |
| Net Asset Value, Offering Price and Redemption Price Per Share* | | $ | 12.97 | | | $ | 15.43 | | | $ | 7.96 | |
| * | The Funds charge a 1.00% fee on shares redeemed less than 30 days after purchase or if shares held less than 30 days are redeemed for failure to maintain a balance that meets the minimum requirements listed in the Funds’ Prospectus. |
| + | NAV may not recalculate due to rounding. |
The accompanying notes are an integral part of these financial statements.
| Copeland Trust |
| STATEMENTS OF OPERATIONS (Unaudited) |
| For the Six Months Ended May 31, 2024 |
| | | | | | Copeland SMID | | | Copeland | |
| | | Copeland Dividend | | | Cap Dividend | | | International | |
| | | Growth Fund | | | Growth Fund | | | Small Cap Fund | |
| Investment Income: | | | | | | | | | | | | |
| Dividend Income | | $ | 320,826 | | | $ | 1,084,634 | | | $ | 8,032 | |
| Interest Income | | | 4,612 | | | | 89,249 | | | | 673 | |
| Less: Foreign Taxes Withholding | | | (3,526 | ) | | | (10,135 | ) | | | (1,363 | ) |
| Total Investment Income | | | 321,912 | | | | 1,163,748 | | | | 7,342 | |
| | | | | | | | | | | | | |
| Expenses: | | | | | | | | | | | | |
| Investment Advisory Fees | | | 155,415 | | | | 440,618 | | | | 2,048 | |
| Distribution Fees - Class C | | | 46,574 | | | | — | | | | — | |
| Distribution Fees - Class A | | | 17,450 | | | | 2,488 | | | | — | |
| Registration & Filing Fees | | | 42,779 | | | | 21,105 | | | | 244 | |
| Chief Compliance Officer Fees | | | 30,902 | | | | 50,883 | | | | 619 | |
| Administration Fees | | | 29,628 | | | | 37,358 | | | | 16,702 | |
| Fund Accounting Fees | | | 28,824 | | | | 22,201 | | | | 16,513 | |
| Trustees’ Fees | | | 25,618 | | | | 41,878 | | | | 864 | |
| Transfer Agent Fees | | | 20,302 | | | | 30,188 | | | | 2,475 | |
| Custody Fees | | | 17,606 | | | | 25,521 | | | | 13,206 | |
| Legal Fees | | | 17,427 | | | | 29,333 | | | | 117 | |
| Printing Expense | | | 11,530 | | | | 8,500 | | | | 75 | |
| Audit Fees | | | 10,916 | | | | 7,848 | | | | 2,313 | |
| Shareholder Service Fees - Class I | | | 9,085 | | | | 57,754 | | | | — | |
| Non-Rule 12b-1 Shareholder Service Fees | | | 8,561 | | | | 1,791 | | | | — | |
| Insurance Expense | | | 2,027 | | | | 7,509 | | | | 54 | |
| Miscellaneous Expenses | | | 149 | | | | 440 | | | | 1,095 | |
| Total Expenses | | | 474,793 | | | | 785,415 | | | | 56,325 | |
| Less: Fees Waived by Adviser | | | (155,415 | ) | | | (222,458 | ) | | | (2,048 | ) |
| Less: Other Expenses Reimbursed by Adviser | | | (49,462 | ) | | | — | | | | (51,703 | ) |
| Net Expenses | | | 269,916 | | | | 562,957 | | | | 2,574 | |
| Net Investment Income | | | 51,996 | | | | 600,791 | | | | 4,768 | |
| | | | | | | | | | | | | |
| Net Realized and Unrealized Gain (Loss) on Investments and Foreign Currency Transactions: | | | | | | | | | | | | |
| Net Realized Gain (Loss) on: | | | | | | | | | | | | |
| Securities | | | 2,583,468 | | | | 1,160,156 | | | | (12,506 | ) |
| Foreign Currency Transactions | | | — | | | | — | | | | (23 | ) |
| | | | 2,583,468 | | | | 1,160,156 | | | | (12,529 | ) |
| | | | | | | | | | | | | |
| Net Change in Unrealized Appreciation (Depreciation) on: | | | | | | | | | | | | |
| Securities | | | 1,898,785 | | | | 5,951,833 | | | | 24,680 | |
| Foreign Currency Transactions | | | — | | | | — | | | | (51 | ) |
| | | | 1,898,785 | | | | 5,951,833 | | | | 24,629 | |
| | | | | | | | | | | | | |
| Net Realized and Unrealized Gain on Investments and Foreign Currency Transactions | | | 4,482,253 | | | | 7,111,989 | | | | 12,100 | |
| | | | | | | | | | | | | |
| Net Increase in Net Assets Resulting From Operations | | $ | 4,534,249 | | | $ | 7,712,780 | | | $ | 16,868 | |
The accompanying notes are an integral part of these financial statements.
| Copeland Dividend Growth Fund |
| STATEMENTS OF CHANGES IN NET ASSETS |
| | | For the | | | For the | |
| | | Six Months Ended | | | Year Ended | |
| | | May 31, 2024 | | | November 30, 2023 | |
| | | (Unaudited) | | | | |
| Operations: | | | | | | | | |
| Net Investment Income | | $ | 51,996 | | | $ | 177,402 | |
| Net Realized Gain on Investments | | | 2,583,468 | | | | 3,128,428 | |
| Net Change in Unrealized Appreciation (Depreciation) on investments | | | 1,898,785 | | | | (1,325,634 | ) |
| Net Increase (Decrease) in Net Assets Resulting From Operations | | | 4,534,249 | | | | 1,980,196 | |
| | | | | | | | | |
| Distributions to Shareholders From: | | | | | | | | |
| Total Distributions Paid | | | | | | | | |
| Class A | | | (517,901 | ) | | | (944,442 | ) |
| Class C | | | (346,225 | ) | | | (619,122 | ) |
| Class I | | | (741,258 | ) | | | (1,662,393 | ) |
| Total Distributions to Shareholders | | | (1,605,384 | ) | | | (3,225,957 | ) |
| | | | | | | | | |
| Beneficial Interest Transactions: | | | | | | | | |
| Class A | | | | | | | | |
| Proceeds from Shares Issued | | | 112,499 | | | | 330,424 | |
| Distributions Reinvested | | | 491,277 | | | | 888,358 | |
| Cost of Shares Redeemed | | | (2,007,122 | ) | | | (2,712,831 | ) |
| Total Class A Shares | | | (1,403,346 | ) | | | (1,494,049 | ) |
| Class C | | | | | | | | |
| Proceeds from Shares Issued | | | 7,444 | | | | 22,821 | |
| Distributions Reinvested | | | 343,161 | | | | 612,576 | |
| Cost of Shares Redeemed | | | (843,206 | ) | | | (1,971,518 | ) |
| Total Class C Shares | | | (492,601 | ) | | | (1,336,121 | ) |
| Class I | | | | | | | | |
| Proceeds from Shares Issued | | | 431,936 | | | | 606,406 | |
| Distributions Reinvested | | | 692,579 | | | | 1,631,212 | |
| Cost of Shares Redeemed | | | (3,636,741 | ) | | | (8,599,935 | ) |
| Redemption Fees | | | — | | | | 166 | |
| Total Class I Shares | | | (2,512,226 | ) | | | (6,362,151 | ) |
| Total Beneficial Interest Transactions | | | (4,408,173 | ) | | | (9,192,321 | ) |
| | | | | | | | | |
| Decrease in Net Assets | | | (1,479,308 | ) | | | (10,438,082 | ) |
| | | | | | | | | |
| Net Assets: | | | | | | | | |
| Beginning of Period | | | 41,050,638 | | | | 51,488,720 | |
| End of Period | | $ | 39,571,330 | | | $ | 41,050,638 | |
| | | | | | | | | |
| Share Activity: | | | | | | | | |
| Class A | | | | | | | | |
| Shares Issued | | | 8,813 | | | | 28,181 | |
| Distributions Reinvested | | | 40,872 | | | | 78,269 | |
| Shares Redeemed | | | (154,532 | ) | | | (229,133 | ) |
| Total Activity Class A Shares | | | (104,847 | ) | | | (122,683 | ) |
| Class C | | | | | | | | |
| Shares Issued | | | 616 | | | | 2,061 | |
| Distributions Reinvested | | | 30,585 | | | | 57,357 | |
| Shares Redeemed | | | (71,054 | ) | | | (178,936 | ) |
| Total Activity Class C Shares | | | (39,853 | ) | | | (119,518 | ) |
| Class I | | | | | | | | |
| Shares Issued | | | 34,383 | | | | 51,131 | |
| Distributions Reinvested | | | 58,594 | | | | 146,035 | |
| Shares Redeemed | | | (289,099 | ) | | | (740,598 | ) |
| Total Activity Class I Shares | | | (196,122 | ) | | | (543,432 | ) |
The accompanying notes are an integral part of these financial statements.
| Copeland SMID Cap Dividend Growth Fund |
| STATEMENTS OF CHANGES IN NET ASSETS |
| | | For the | | | For the | |
| | | Six Months Ended | | | Year Ended | |
| | | May 31, 2024 | | | November 30, 2023 | |
| Operations: | | | | | | | | |
| Net Investment Income | | $ | 600,791 | | | $ | 633,009 | |
| Net Realized Gain (Loss) on Investments | | | 1,160,156 | | | | (217,111 | ) |
| Net Change in Unrealized Appreciation on Investments | | | 5,951,833 | | | | 619,697 | |
| Net Increase in Net Assets Resulting From Operations | | | 7,712,780 | | | | 1,035,595 | |
| | | | | | | | | |
| Distributions to Shareholders From: | | | | | | | | |
| Total Distributions Paid | | | | | | | | |
| Class A | | | (11,826 | ) | | | (61,549 | ) |
| Class I | | | (586,612 | ) | | | (1,752,207 | ) |
| Total Distributions to Shareholders | | | (598,438 | ) | | | (1,813,756 | ) |
| | | | | | | | | |
| Beneficial Interest Transactions: | | | | | | | | |
| Class A | | | | | | | | |
| Proceeds from Shares Issued | | | 544,584 | | | | 711,357 | |
| Distributions Reinvested | | | 11,019 | | | | 57,815 | |
| Cost of Shares Redeemed | | | (339,250 | ) | | | (740,960 | ) |
| Redemption Fees | | | 26 | | | | 61 | |
| Total Class A Shares | | | 216,379 | | | | 28,273 | |
| Class I | | | | | | | | |
| Proceeds from Shares Issued | | | 97,415,339 | | | | 33,692,413 | |
| Distributions Reinvested | | | 525,476 | | | | 1,660,663 | |
| Cost of Shares Redeemed | | | (13,183,004 | ) | | | (15,564,594 | ) |
| Redemption Fees | | | 1,254 | | | | 2,009 | |
| Total Class I Shares | | | 84,759,065 | | | | 19,790,491 | |
| | | | | | | | | |
| Total Beneficial Interest Transactions | | | 84,975,444 | | | | 19,818,764 | |
| | | | | | | | | |
| Increase in Net Assets | | | 92,089,786 | | | | 19,040,603 | |
| | | | | | | | | |
| Net Assets: | | | | | | | | |
| Beginning of Period | | | 68,317,187 | | | | 49,276,584 | |
| End of Period | | $ | 160,406,973 | | | $ | 68,317,187 | |
| | | | | | | | | |
| Share Activity: | | | | | | | | |
| Class A | | | | | | | | |
| Shares Issued | | | 36,145 | | | | 51,450 | |
| Distributions Reinvested | | | 776 | | | | 4,423 | |
| Shares Redeemed | | | (22,273 | ) | | | (53,797 | ) |
| Total Activity Class A Shares | | | 14,648 | | | | 2,076 | |
| Class I | | | | | | | | |
| Shares Issued | | | 6,358,688 | | | | 2,403,369 | |
| Distributions Reinvested | | | 36,798 | | | | 126,479 | |
| Shares Redeemed | | | (872,130 | ) | | | (1,134,467 | ) |
| Total Activity Class I Shares | | | 5,523,356 | | | | 1,395,381 | |
The accompanying notes are an integral part of these financial statements.
| Copeland International Small Cap Fund |
| STATEMENTS OF CHANGES IN NET ASSETS |
| | | For the | | | For the | |
| | | Six Months Ended | | | Year Ended | |
| | | May 31, 2024 | | | November 30, 2023 | |
| | | (Unaudited) | | | | |
| Operations: | | | | | | | | |
| Net Investment Income | | $ | 4,768 | | | $ | 6,281 | |
| Net Realized Loss on Investments and Foreign Currency Transactions | | | (12,529 | ) | | | (16,258 | ) |
| Net Change in Unrealized Appreciation on Investments and Foreign Currency Transactions | | | 24,629 | | | | 18,061 | |
| Net Increase in Net Assets Resulting From Operations | | | 16,868 | | | | 8,084 | |
| | | | | | | | | |
| Distributions to Shareholders From: | | | | | | | | |
| Total Distributions Paid | | | | | | | | |
| Class A | | | — | * | | | — | |
| Class I | | | (10,558 | ) | | | (8,524 | ) |
| | | | (10,558 | ) | | | (8,524 | ) |
| | | | | | | | | |
| Total Distributions to Shareholders | | | (10,558 | ) | | | (8,524 | ) |
| | | | | | | | | |
| Beneficial Interest Transactions: | | | | | | | | |
| Class A | | | | | | | | |
| Proceeds from Shares Issued | | | — | | | | — | |
| Total Class A Shares | | | — | | | | — | |
| Class I | | | | | | | | |
| Proceeds from Shares Issued | | | 22,001 | | | | 172,725 | |
| Distributions Reinvested | | | 10,558 | | | | 8,524 | |
| Total Class I Shares | | | 32,559 | | | | 181,249 | |
| Total Beneficial Interest Transactions | | | 32,559 | | | | 181,249 | |
| | | | | | | | | |
| Increase in Net Assets | | | 38,869 | | | | 180,809 | |
| | | | | | | | | |
| Net Assets: | | | | | | | | |
| Beginning of Period | | | 493,419 | | | | 312,610 | |
| End of Period | | $ | 532,288 | | | $ | 493,419 | |
| | | | | | | | | |
| Share Activity: | | | | | | | | |
| Class A | | | | | | | | |
| Shares Issued | | | — | | | | — | |
| Total Activity Class A Shares | | | — | | | | — | |
| Class I | | | | | | | | |
| Shares Issued | | | 2,759 | | | | 21,617 | |
| Distributions Reinvested | | | 1,360 | | | | 1,138 | |
| Total Activity Class I Shares | | | 4,119 | | | | 22,755 | |
The accompanying notes are an integral part of these financial statements.
| Copeland Dividend Growth Fund |
| FINANCIAL HIGHLIGHTS |
Certain information in the table below reflects financial results for one share of beneficial interest outstanding throughout each period presented.
| | | Class A | |
| | | Six Months | | | Year | | | Year | | | Year | | | Year | | | Year | |
| | | Ended | | | Ended | | | Ended | | | Ended | | | Ended | | | Ended | |
| | | May 31, 2024 | | | November 30, 2023 | | | November 30, 2022 | | | November 30, 2021 | | | November 30, 2020 | | | November 30, 2019 | |
| | | (Unaudited) | | | | | | | | | | | | | | | | |
| Net Asset Value, Beginning of Period | | $ | 12.27 | | | $ | 12.49 | | | $ | 14.59 | | | $ | 11.99 | | | $ | 14.25 | | | $ | 15.18 | |
| Increase (Decrease) From Operations: | | | | | | | | | | | | | | | | | | | | | | | | |
| Net investment income (a) | | | 0.02 | | | | 0.06 | | | | 0.09 | | | | 0.04 | | | | 0.01 | | | | 0.10 | |
| Net gain (loss) from securities (both realized and unrealized) | | | 1.34 | | | | 0.50 | | | | (0.53 | ) | | | 2.56 | | | | (0.48 | ) | | | 0.05 | |
| Other capital changes | | | — | | | | — | | | | — | | | | — | | | | 0.73 | (d) | | | — | |
| Total from operations | | | 1.36 | | | | 0.56 | | | | (0.44 | ) | | | 2.60 | | | | 0.26 | | | | 0.15 | |
| Distributions to shareholders from: | | | | | | | | | | | | | | | | | | | | | | | | |
| Net investment income | | | (0.02 | ) | | | (0.09 | ) | | | (0.02 | ) | | | — | | | | (0.09 | ) | | | (0.01 | ) |
| Net realized gains | | | (0.44 | ) | | | (0.69 | ) | | | (1.64 | ) | | | — | | | | (2.43 | ) | | | (1.07 | ) |
| Total distributions | | | (0.46 | ) | | | (0.78 | ) | | | (1.66 | ) | | | — | | | | (2.52 | ) | | | (1.08 | ) |
| Redemption fees (b) | | | 0.00 | | | | 0.00 | | | | 0.00 | | | | 0.00 | | | | 0.00 | | | | 0.00 | |
| Net Asset Value, End of Period | | $ | 13.17 | | | $ | 12.27 | | | $ | 12.49 | | | $ | 14.59 | | | $ | 11.99 | | | $ | 14.25 | |
| Total Return (c) | | | 11.50 | % (f) | | | 4.95 | % | | | (3.91 | )% | | | 21.68 | % | | | 2.24 | % | | | 1.32 | % |
| Ratios/Supplemental Data | | | | | | | | | | | | | | | | | | | | | | | | |
| Net assets, end of period (in 000’s) | | $ | 13,288 | | | $ | 13,667 | | | $ | 15,441 | | | $ | 18,212 | | | $ | 18,800 | | | $ | 36,870 | |
| Ratio of expenses to average net assets: | | | | | | | | | | | | | | | | | | | | | | | | |
| before reimbursement | | | 2.19 | % (e) | | | 1.95 | % | | | 1.99 | % | | | 1.93 | % | | | 2.13 | % | | | 1.74 | % |
| net of reimbursement | | | 1.20 | % (e) | | | 1.20 | % | | | 1.20 | % | | | 1.20 | % | | | 1.44 | % | | | 1.45 | % |
| Ratio of net investment income to average net assets | | | 0.35 | % (e) | | | 0.47 | % | | | 0.72 | % | | | 0.29 | % | | | 0.10 | % | | | 0.70 | % |
| Portfolio turnover rate | | | 21 | % (f) | | | 35 | % | | | 40 | % | | | 34 | % | | | 170 | % | | | 244 | % |
| (a) | Per share amounts are calculated using the average shares method, which more appropriately presents the per share data for the year/period. |
| (b) | Less than $0.01 per share. |
| (c) | Total returns are historical in nature and assume changes in share price, reinvestment of dividends and capital gains distributions, if any. Had the Adviser not absorbed a portion of fund expenses, the total return would have been lower. Sales loads are not reflected in total return. |
| (d) | As required by SEC standard per share data calculation methodology, this represents a balancing figure derived from the other amounts in the financial highlights tables that captures all other changes affecting net asset value per share. |
The accompanying notes are an integral part of these financial statements.
| Copeland Dividend Growth Fund |
| FINANCIAL HIGHLIGHTS |
Certain information in the table below reflects financial results for one share of beneficial interest outstanding throughout each period presented.
| | | Class C | |
| | | Six Months | | | Year | | | Year | | | Year | | | Year | | | Year | |
| | | Ended | | | Ended | | | Ended | | | Ended | | | Ended | | | Ended | |
| | | May 31, 2024 | | | November 30, 2023 | | | November 30, 2022 | | | November 30, 2021 | | | November 30, 2020 | | | November 30, 2019 | |
| | | (Unaudited) | | | | | | | | | | | | | | | | |
| Net Asset Value, Beginning of Period | | $ | 11.46 | | | $ | 11.71 | | | $ | 13.85 | | | $ | 11.47 | | | $ | 13.73 | | | $ | 14.76 | |
| Increase (Decrease) From Operations: | | | | | | | | | | | | | | | | | | | | | | | | |
| Net investment loss (a) | | | (0.02 | ) | | | (0.03 | ) | | | (0.01 | ) | | | (0.06 | ) | | | (0.07 | ) | | | (0.01 | ) |
| Net gain (loss) from securities (both realized and unrealized) | | | 1.25 | | | | 0.47 | | | | (0.49 | ) | | | 2.44 | | | | (0.30 | ) | | | 0.05 | |
| Other capital changes | | | — | | | | — | | | | — | | | | — | | | | 0.54 | (d) | | | — | |
| Total from operations | | | 1.23 | | | | 0.44 | | | | (0.50 | ) | | | 2.38 | | | | 0.17 | | | | 0.04 | |
| Distributions to shareholders from: | | | | | | | | | | | | | | | | | | | | | | | | |
| Net investment income | | | — | | | | — | | | | — | | | | — | | | | — | | | | — | |
| Net realized gains | | | (0.44 | ) | | | (0.69 | ) | | | (1.64 | ) | | | — | | | | (2.43 | ) | | | (1.07 | ) |
| Total distributions | | | (0.44 | ) | | | (0.69 | ) | | | (1.64 | ) | | | — | | | | (2.43 | ) | | | (1.07 | ) |
| Redemption fees (b) | | | 0.00 | | | | 0.00 | | | | 0.00 | | | | 0.00 | | | | 0.00 | | | | 0.00 | |
| Net Asset Value, End of Period | | $ | 12.25 | | | $ | 11.46 | | | $ | 11.71 | | | $ | 13.85 | | | $ | 11.47 | | | $ | 13.73 | |
| Total Return (c) | | | 11.10 | % (f) | | | 4.15 | % | | | (4.63 | )% | | | 20.75 | % | | | 1.51 | % | | | 0.54 | % |
| Ratios/Supplemental Data | | | | | | | | | | | | | | | | | | | | | | | | |
| Net assets, end of period (in 000’s) | | $ | 9,123 | | | $ | 8,994 | | | $ | 10,586 | | | $ | 13,530 | | | $ | 15,401 | | | $ | 25,271 | |
| Ratio of expenses to average net assets: | | | | | | | | | | | | | | | | | | | | | | | | |
| before reimbursement | | | 2.94 | % (e) | | | 2.69 | % | | | 2.74 | % | | | 2.69 | % | | | 2.88 | % | | | 2.49 | % |
| net of reimbursement | | | 1.95 | % (e) | | | 1.95 | % | | | 1.95 | % | | | 1.95 | % | | | 2.19 | % | | | 2.20 | % |
| Ratio of net investment loss to average net assets | | | (0.40 | )% (e) | | | (0.27 | )% | | | (0.04 | )% | | | (0.46 | )% | | | (0.67 | )% | | | (0.05 | )% |
| Portfolio turnover rate | | | 21 | % (f) | | | 35 | % | | | 40 | % | | | 34 | % | | | 170 | % | | | 244 | % |
| (a) | Per share amounts are calculated using the average shares method, which more appropriately presents the per share data for the year/period. |
| (b) | Less than $0.01 per share. |
| (c) | Total returns are historical in nature and assume changes in share price, reinvestment of dividends and capital gains distributions, if any. Had the Adviser not absorbed a portion of fund expenses, the total return would have been lower. |
| (d) | As required by SEC standard per share data calculation methodology, this represents a balancing figure derived from the other amounts in the financial highlights tables that captures all other changes affecting net asset value per share. |
The accompanying notes are an integral part of these financial statements.
| Copeland Dividend Growth Fund |
| FINANCIAL HIGHLIGHTS |
Certain information in the table below reflects financial results for one share of beneficial interest outstanding throughout each period presented.
| | | Class I | |
| | | Six Months | | | Year | | | Year | | | Year | | | Year | | | Year | |
| | | Ended | | | Ended | | | Ended | | | Ended | | | Ended | | | Ended | |
| | | May 31, 2024 | | | November 30, 2023 | | | November 30, 2022 | | | November 30, 2021 | | | November 30, 2020 | | | November 30, 2019 | |
| | | (Unaudited) | | | | | | | | | | | | | | | | |
| Net Asset Value, Beginning of Period | | $ | 12.10 | | | $ | 12.34 | | | $ | 14.45 | | | $ | 11.85 | | | $ | 14.12 | | | $ | 15.08 | |
| Increase (Decrease) From Operations: | | | | | | | | | | | | | | | | | | | | | | | | |
| Net investment income (a) | | | 0.03 | | | | 0.07 | | | | 0.10 | | | | 0.06 | | | | 0.03 | | | | 0.11 | |
| Net gain (loss) from securities (both realized and unrealized) | | | 1.33 | | | | 0.50 | | | | (0.52 | ) | | | 2.54 | | | | (0.38 | ) | | | 0.06 | |
| Other capital changes | | | — | | | | — | | | | — | | | | — | | | | 0.63 | (d) | | | — | |
| Total from operations | | | 1.36 | | | | 0.57 | | | | (0.42 | ) | | | 2.60 | | | | 0.28 | | | | 0.17 | |
| Distributions to shareholders from: | | | | | | | | | | | | | | | | | | | | | | | | |
| Net investment income | | | (0.05 | ) | | | (0.12 | ) | | | (0.05 | ) | | | — | | | | (0.12 | ) | | | (0.06 | ) |
| Net realized gains | | | (0.44 | ) | | | (0.69 | ) | | | (1.64 | ) | | | — | | | | (2.43 | ) | | | (1.07 | ) |
| Total distributions | | | (0.49 | ) | | | (0.81 | ) | | | (1.69 | ) | | | — | | | | (2.55 | ) | | | (1.13 | ) |
| Redemption fees (b) | | | 0.00 | | | | 0.00 | | | | 0.00 | | | | 0.00 | | | | 0.00 | | | | 0.00 | |
| Net Asset Value, End of Period | | $ | 12.97 | | | $ | 12.10 | | | $ | 12.34 | | | $ | 14.45 | | | $ | 11.85 | | | $ | 14.12 | |
| Total Return (c) | | | 11.63 | % (f) | | | 5.13 | % | | | (3.82 | )% | | | 21.94 | % | | | 2.40 | % | | | 1.43 | % |
| Ratios/Supplemental Data | | | | | | | | | | | | | | | | | | | | | | | | |
| Net assets, end of period (in 000’s) | | $ | 17,160 | | | $ | 18,390 | | | $ | 25,461 | | | $ | 33,459 | | | $ | 36,164 | | | $ | 66,649 | |
| Ratio of expenses to average net assets: | | | | | | | | | | | | | | | | | | | | | | | | |
| before reimbursement | | | 2.04 | % (e) | | | 1.75 | % | | | 1.76 | % | | | 1.75 | % | | | 1.98 | % | | | 1.58 | % |
| net of reimbursement | | | 1.05 | % (e) | | | 1.05 | % | | | 1.05 | % | | | 1.05 | % | | | 1.29 | % | | | 1.30 | % |
| Ratio of net investment income to average net assets | | | 0.51 | % (e) | | | 0.62 | % | | | 0.85 | % | | | 0.44 | % | | | 0.23 | % | | | 0.85 | % |
| Portfolio turnover rate | | | 21 | % (f) | | | 35 | % | | | 40 | % | | | 34 | % | | | 170 | % | | | 244 | % |
| (a) | Per share amounts are calculated using the average shares method, which more appropriately presents the per share data for the year/period. |
| (b) | Less than $0.01 per share. |
| (c) | Total returns are historical in nature and assume changes in share price, reinvestment of dividends and capital gains distributions, if any. Had the Adviser not absorbed a portion of fund expenses, the total return would have been lower. |
| (d) | As required by SEC standard per share data calculation methodology, this represents a balancing figure derived from the other amounts in the financial highlights tables that captures all other changes affecting net asset value per share. |
The accompanying notes are an integral part of these financial statements.
| Copeland SMID Cap Dividend Growth Fund |
| FINANCIAL HIGHLIGHTS |
Certain information in the table below reflects financial results for one share of beneficial interest outstanding throughout the period presented.
| | | Class A | |
| | | Six Months | | | Year | | | Year | | | Year | | | Year | |
| | | Ended | | | Ended | | | Ended | | | Ended | | | Ended | |
| | | May 31, 2024 | | | November 30, 2023 | | | November 30, 2022 | | | November 30, 2021 | | | November 30, 2020 | |
| | | (Unaudited) | | | | | | | | | | | | | |
| Net Asset Value, Beginning of Period | | $ | 13.95 | | | $ | 14.15 | | | $ | 15.80 | | | $ | 13.14 | | | $ | 12.73 | |
| Increase (Decrease) From Operations: | | | | | | | | | | | | | | | | | | | | |
| Net investment income (a) | | | 0.05 | | | | 0.12 | | | | 0.13 | | | | 0.06 | | | | 0.10 | |
| Net gain (loss) from securities (both realized and unrealized) | | | 1.42 | | | | 0.19 | | | | (0.77 | ) | | | 2.63 | | | | 0.50 | |
| Total from operations | | | 1.47 | | | | 0.31 | | | | (0.64 | ) | | | 2.69 | | | | 0.60 | |
| Distributions to shareholders from: | | | | | | | | | | | | | | | | | | | | |
| Net investment income | | | (0.10 | ) | | | (0.17 | ) | | | (0.04 | ) | | | (0.03 | ) | | | (0.05 | ) |
| Net realized gains | | | — | | | | (0.34 | ) | | | (0.97 | ) | | | — | | | | (0.14 | ) |
| Total distributions | | | (0.10 | ) | | | (0.51 | ) | | | (1.01 | ) | | | (0.03 | ) | | | (0.19 | ) |
| Redemption fees (b) | | | 0.00 | | | | 0.00 | | | | 0.00 | | | | 0.00 | | | | 0.00 | |
| Net Asset Value, End of Period | | $ | 15.32 | | | $ | 13.95 | | | $ | 14.15 | | | $ | 15.80 | | | $ | 13.14 | |
| Total Return (c) | | | 10.57 | % (e) | | | 2.46 | % | | | (4.50 | )% | | | 20.55 | % | | | 4.73 | % (e) |
| Ratios/Supplemental Data | | | | | | | | | | | | | | | | | | | | |
| Net assets, end of period (in 000’s) | | $ | 2,069 | | | $ | 1,680 | | | $ | 1,674 | | | $ | 206 | | | $ | 108 | |
| Ratio of expenses to average net assets: | | | | | | | | | | | | | | | | | | | | |
| before reimbursement | | | 1.49 | % (d) | | | 1.81 | % | | | 2.03 | % | | | 2.10 | % | | | 2.72 | % (d) |
| net of reimbursement | | | 1.20 | % (d) | | | 1.20 | % | | | 1.20 | % | | | 1.20 | % | | | 1.20 | % (d) |
| Ratio of net investment income to average net assets | | | 0.71 | % (d) | | | 0.85 | % | | | 0.96 | % | | | 0.42 | % | | | 0.87 | % (d) |
| Portfolio turnover rate | | | 9 | % (e) | | | 28 | % | | | 40 | % | | | 35 | % | | | 49 | % (e) |
| * | Class A commenced operations on February 11, 2019. |
| (a) | Per share amounts are calculated using the average shares method, which more appropriately presents the per share data for the period/year. |
| (b) | Less than $0.01 per share. |
| (c) | Total returns are historical in nature and assume changes in share price, reinvestment of dividends and capital gains distributions, if any. Had the Adviser not absorbed a portion of fund expenses, the total return would have been lower. Sales loads are not reflected in total return. |
The accompanying notes are an integral part of these financial statements.
| Copeland SMID Cap Dividend Growth Fund |
| FINANCIAL HIGHLIGHTS |
Certain information in the table below reflects financial results for one share of beneficial interest outstanding throughout each period presented.
| | | Class I | |
| | | Six Months | | | Year | | | Year | | | Year | | | Year | | | Year | |
| | | Ended | | | Ended | | | Ended | | | Ended | | | Ended | | | Ended | |
| | | May 31, 2024 | | | November 30, 2023 | | | November 30, 2022 | | | November 30, 2021 | | | November 30, 2020 | | | November 30, 2019 | |
| | | (Unaudited) | | | | | | | | | | | | | | | | |
| Net Asset Value, Beginning of Period | | $ | 14.06 | | | $ | 14.23 | | | $ | 15.88 | | | $ | 13.19 | | | $ | 12.76 | | | $ | 11.54 | |
| Increase (Decrease) From Operations: | | | | | | | | | | | | | | | | | | | | | | | | |
| Net investment income (a) | | | 0.08 | | | | 0.15 | | | | 0.19 | | | | 0.10 | | | | 0.13 | | | | 0.13 | |
| Net gain (loss) from securities (both realized and unrealized) | | | 1.41 | | | | 0.20 | | | | (0.80 | ) | | | 2.65 | | | | 0.50 | | | | 1.53 | |
| Total from operations | | | 1.49 | | | | 0.35 | | | | (0.61 | ) | | | 2.75 | | | | 0.63 | | | | 1.66 | |
| Distributions to shareholders from: | | | | | | | | | | | | | | | | | | | | | | | | |
| Net investment income | | | (0.12 | ) | | | (0.18 | ) | | | (0.07 | ) | | | (0.06 | ) | | | (0.06 | ) | | | (0.08 | ) |
| Net realized gains | | | — | | | | (0.34 | ) | | | (0.97 | ) | | | — | | | | (0.14 | ) | | | (0.36 | ) |
| Total distributions | | | (0.12 | ) | | | (0.52 | ) | | | (1.04 | ) | | | (0.06 | ) | | | (0.20 | ) | | | (0.44 | ) |
| Redemption fees (b) | | | 0.00 | | | | 0.00 | | | | 0.00 | | | | 0.00 | | | | 0.00 | | | | 0.00 | |
| Net Asset Value, End of Period | | $ | 15.43 | | | $ | 14.06 | | | $ | 14.23 | | | $ | 15.88 | | | $ | 13.19 | | | $ | 12.76 | |
| Total Return (c) | | | 10.69 | % (e) | | | 2.75 | % | | | (4.31 | )% | | | 20.89 | % | | | 4.98 | % | | | 15.12 | % |
| Ratios/Supplemental Data | | | | | | | | | | | | | | | | | | | | | | | | |
| Net assets, end of period (in 000’s) | | $ | 158,338 | | | $ | 66,638 | | | $ | 47,602 | | | $ | 35,601 | | | $ | 22,056 | | | $ | 11,903 | |
| Ratio of expenses to average net assets: | | | | | | | | | | | | | | | | | | | | | | | | |
| before reimbursement | | | 1.33 | % (d) | | | 1.62 | % | | | 1.73 | % | | | 1.87 | % | | | 2.47 | % | | | 3.18 | % |
| net of reimbursement | | | 0.95 | % (d) | | | 0.95 | % | | | 0.95 | % | | | 0.95 | % | | | 0.95 | % | | | 0.95 | % |
| Ratio of net investment income to average net assets | | | 1.02 | % (d) | | | 1.11 | % | | | 1.34 | % | | | 0.67 | % | | | 1.06 | % | | | 1.09 | % |
| Portfolio turnover rate | | | 9 | % (e) | | | 28 | % | | | 40 | % | | | 35 | % | | | 49 | % | | | 22 | % |
| (a) | Per share amounts are calculated using the average shares method, which more appropriately presents the per share data for the period/year. |
| (b) | Less than $0.01 per share. |
| (c) | Total returns are historical in nature and assume changes in share price, reinvestment of dividends and capital gains distributions, if any. Had the Adviser not absorbed a portion of fund expenses, the total return would have been lower. |
The accompanying notes are an integral part of these financial statements.
| Copeland International Small Cap Fund |
| FINANCIAL HIGHLIGHTS |
Certain information in the table below reflects financial results for one share of beneficial interest outstanding throughout each period presented.
| | | Class A | |
| | | Six Months | | | Year | | | Period | |
| | | Ended | | | Ended | | | Ended | |
| | | May 31, 2024 | | | November 30, 2023 | | | November 30, 2022 * | |
| | | (Unaudited) | | | | | | | |
| Net Asset Value, Beginning of Period | | $ | 7.86 | | | $ | 7.82 | | | $ | 10.00 | |
| Increase From Operations: | | | | | | | | | | | | |
| Net investment income (a) | | | 0.04 | | | | 0.02 | | | | 0.10 | |
| Net gain (loss) from securities (both realized and unrealized) | | | 0.23 | | | | 0.23 | | | | (2.28 | ) |
| Total from operations | | | 0.27 | | | | 0.25 | | | | (2.18 | ) |
| Distributions to shareholders from: | | | | | | | | | | | | |
| Net investment income | | | (0.17 | ) | | | (0.21 | ) | | | — | |
| Total distributions | | | (0.17 | ) | | | (0.21 | ) | | | — | |
| Net Asset Value, End of Period | | $ | 7.96 | | | $ | 7.86 | | | $ | 7.82 | |
| Total Return (b) | | | 3.46 | % (c) | | | 3.37 | % | | | (21.80 | )% (c) |
| Ratios/Supplemental Data | | | | | | | | | | | | |
| Net assets, end of period, actual (not truncated) | | $ | 8 | | | $ | 8 | | | $ | 8 | |
| Ratio of expenses to average net assets: | | | | | | | | | | | | |
| before reimbursement | | | 19.74 | % (d) | | | 17.25 | % | | | 34.90 | % (d) |
| net of reimbursement | | | 1.23 | % (d) | | | 1.23 | % | | | 1.19 | % (d) |
| Ratio of net investment income to average net assets | | | 0.95 | % (d) | | | 0.25 | % | | | 1.32 | % (d) |
| Portfolio turnover rate | | | 28 | % (c) | | | 50 | % | | | 82 | % (c) |
| * | Class A commenced operations on December 28, 2021. |
| (a) | Per share amounts are calculated using the average shares method, which more appropriately presents the per share data for the period. |
| (b) | Total returns are historical in nature and assume changes in share price, reinvestment of dividends and capital gains distributions, if any. Had the Adviser not absorbed a portion of fund expenses, the total return would have been lower. Sales loads are not reflected in total return. |
The accompanying notes are an integral part of these financial statements.
| Copeland International Small Cap Fund |
| FINANCIAL HIGHLIGHTS |
Certain information in the table below reflects financial results for one share of beneficial interest outstanding throughout each period presented.
| | | Class I | |
| | | Six Months | | | Year | | | Period | |
| | | Ended | | | Ended | | | Ended | |
| | | May 31, 2024 | | | November 30, 2023 | | | November 30, 2022 * | |
| | | (Unaudited) | | | | | | | |
| Net Asset Value, Beginning of Period | | $ | 7.86 | | | $ | 7.82 | | | $ | 10.00 | |
| Increase From Operations: | | | | | | | | | | | | |
| Net investment income (a) | | | 0.07 | | | | 0.11 | | | | 0.16 | |
| Net gain (loss) from securities (both realized and unrealized) | | | 0.20 | | | | 0.14 | | | | (2.34 | ) |
| Total from operations | | | 0.27 | | | | 0.25 | | | | (2.18 | ) |
| Distributions to shareholders from: | | | | | | | | | | | | |
| Net investment income | | | (0.17 | ) | | | (0.21 | ) | | | — | |
| Total distributions | | | (0.17 | ) | | | (0.21 | ) | | | — | |
| Net Asset Value, End of Period | | $ | 7.96 | | | $ | 7.86 | | | $ | 7.82 | |
| Total Return (b) | | | 3.46 | % (c) | | | 3.37 | % | | | (21.80 | )% (c) |
| Ratios/Supplemental Data | | | | | | | | | | | | |
| Net assets, end of period (in 000’s) | | $ | 532 | | | $ | 493 | | | $ | 313 | |
| Ratio of expenses to average net assets: | | | | | | | | | | | | |
| before reimbursement | | | 21.39 | % (d) | | | 21.80 | % | | | 28.11 | % (d) |
| net of reimbursement | | | 0.98 | % (d) | | | 0.98 | % | | | 0.98 | % (d) |
| Ratio of net investment income to average net assets | | | 1.81 | % (d) | | | 1.44 | % | | | 2.07 | % (d) |
| Portfolio turnover rate | | | 28 | % (c) | | | 50 | % | | | 82 | % (c) |
| * | Class I commenced operations on December 28, 2021. |
| (a) | Per share amounts are calculated using the average shares method, which more appropriately presents the per share data for the period. |
| (b) | Total returns are historical in nature and assume changes in share price, reinvestment of dividends and capital gains distributions, if any. Had the Adviser not absorbed a portion of fund expenses, the total return would have been lower. |
The accompanying notes are an integral part of these financial statements.
| Copeland Trust |
| NOTES TO FINANCIAL STATEMENTS (Unaudited) |
| May 31, 2024 |
Copeland Dividend Growth Fund (the “Dividend Growth Fund”), formerly, the Copeland Risk Managed Dividend Growth Fund, Copeland SMID Cap Dividend Growth Fund (the “SMID Fund”), and Copeland International Small Cap Fund (the “International Fund”) are diversified series of Copeland Trust (the “Trust”). The Trust is registered under the Investment Company Act of 1940, as amended (the “1940 Act”) as an open-end management investment company. The Trust was organized as a statutory trust on September 10, 2010, under the laws of the State of Delaware.
The Dividend Growth Fund currently offers Class A, Class C and Class I shares. The SMID Fund and International Fund currently offer Class A and Class I shares. The Dividend Growth Fund’s Class A shares commenced operations on December 28, 2010, Class C shares commenced operations on January 5, 2012 and Class I shares commenced operations on March 1, 2013. The SMID Fund’s Class I shares commenced operations on February 27, 2017 and Class A shares commenced operations on February 11, 2019. The International Fund’s Class A and Class I shares commenced operations on December 28, 2021. Class A shares of each Fund are offered at net asset value plus a maximum sales charge of 5.75%. Purchases of $1,000,000 or more may be subject to a maximum contingent deferred sales charge of 1.00% on shares redeemed within 18 months. Class C and Class I shares are offered at net asset value. Each class represents an interest in the same assets of the applicable Fund and classes are identical except for differences in their sales charge structures and ongoing service and distribution charges. All classes of shares have equal voting privileges except that each class has exclusive voting rights with respect to its service and/or distribution plans. The Funds’ income, expenses (other than class specific distribution fees) and realized and unrealized gains and losses are allocated proportionately each day based upon the relative net assets of each class.
| 2. | SUMMARY OF SIGNIFICANT ACCOUNTING POLICIES |
The following is a summary of significant accounting policies followed by the Funds in preparation of their financial statements. These policies are in conformity with accounting principles generally accepted in the United States of America (“GAAP”). The preparation of financial statements requires management to make estimates and assumptions that affect the reported amounts of assets and liabilities and disclosure of contingent assets and liabilities at the date of the financial statements and the reported amounts of income and expenses for the period. Actual results could differ from those estimates. The Funds are investment companies and accordingly follow the investment company accounting and reporting guidance of the Financial Accounting Standards Board (FASB) Accounting Standard Codification Topic 946 “Financial Services – Investment Companies” including FASB Accounting Standard Update ASU 2013-08.
SECURITY VALUATION
Effective September 8, 2022, and pursuant to the requirements of the 1940 Act and Rule 2a -5 thereunder (the “Rule”), the Board of Trustees (the “Board”) has designated the Trust’s investment adviser, Copeland Capital Management, LLC (“Copeland”) as the Valuation Designee for the Funds pursuant to the Rule. The Valuation Designee has the responsibility for the fair value determination with respect to all Fund investments that do not have readily available market quotations or quotations that are no longer reliable. Copeland has appointed a Pricing Committee (the “Committee”) and has established a Valuation and Pricing Policy to implement the Rule and the Funds’ Valuation and Pricing Policy (together the “Policy”). Prior to September 8, 2022, fair-value determinations were performed in accordance with the Trust’s Fair Value Procedures established by the Funds’ Board of Trustees and were implemented through a Fair Value Committee designated by the Board. The valuation of investments with readily available market quotations has been delegated by the Board to the Funds’ administrator.
When valuing portfolio securities, a Fund values securities listed on a securities exchange, market or automated quotation system for which quotations are readily available (other than securities traded on National Association of Securities Dealers Automated Quotations (NASDAQ) or as otherwise noted below) at the last quoted sale price on an exchange or market (foreign or domestic) on which the securities are traded or, if there is no such reported sale, at the most recent quoted bid price. A Fund values securities traded on NASDAQ at the NASDAQ Official Closing Price. The prices of foreign securities are reported in local currency and converted to U.S. dollars using currency exchange rates. If a security’s price cannot be obtained, as noted above, a Fund will value the securities using a bid price from at least one independent broker.
| Copeland Trust |
| NOTES TO FINANCIAL STATEMENTS (Continued)(Unaudited) |
| May 31, 2024 |
Prices for most securities held by a Fund are provided daily by third-party independent pricing agents. Copeland reasonably believes that prices provided by independent pricing agents are reliable. However, there can be no assurance that such pricing service’s prices will be reliable. Copeland will continuously monitor the reliability of prices obtained from any pricing service and shall promptly notify the Funds’ administrator if it believes that a particular pricing service is no longer a reliable source of prices. The Funds’ administrator, in turn, will notify Copeland, as Valuation Designee, if the Funds’ administrator reasonably believes that a particular pricing service is no longer a reliable source for prices.
The Valuation Designee must monitor for circumstances that may necessitate that a security be valued using Fair Value Procedures which can include: (i) the security’s trading has been halted or suspended, (ii) the security has been de-listed from a national exchange, (iii) the security’s primary trading market is temporarily closed at a time when under normal conditions it would be open, (iv) the security has not been traded for an extended period of time, (v) the security’s primary pricing source is not able or willing to provide a price, (vi) trading of the security is subject to local government-imposed restrictions; or (vii) a significant event (as defined below) has occurred. When a security is valued in accordance with the Fair Value Procedures, the Valuation Designee will determine the value after taking into consideration relevant information reasonably available to the Valuation Designee. Examples of factors the Valuation Designee may consider include: (i) the type of security or asset, (ii) the last trade price, (iii) evaluation of the forces that influence the market in which the security is purchased and sold, (iv) the liquidity of the security, (v) the size of the holding in a Fund or (vi) any other appropriate information.
The Valuation Designee is responsible for selecting and applying, in a consistent manner, the appropriate methodologies for determining and calculating the fair value of holdings of the Funds, including specifying the key inputs and assumptions specific to each asset class or holding.
The determination of a security’s fair value price often involves the consideration of a number of subjective factors and is therefore subject to the unavoidable risk that the value assigned to a security may be higher or lower than the security’s value would be if a reliable market quotation for the security was readily available.
The International Small Cap Fund uses an independent third-party valuation vendor. The vendor provides a fair value for foreign securities held by the Fund based on certain factors and methodologies (involving, generally, tracking valuation correlations between the U.S. market and each non-U.S. security). Values from the vendor are applied in the event that there is a movement in the U.S. market that exceeds a specific threshold that has been established by the Committee.
For securities that principally trade on a foreign market or exchange, a significant gap in time can exist between the time of a particular security’s last trade and the time at which a Fund calculates its NAV. The closing prices of such securities may no longer reflect their market value at the time a Fund calculates NAV if an event that could materially affect the value of those securities (a “Significant Event”), including substantial fluctuations in domestic or foreign markets or occurrences not tied directly to the securities markets, such as natural disasters, armed conflicts or significant governmental actions, has occurred between the time of the security’s last close and the time that a Fund calculates NAV. A Fund may invest in securities that are primarily listed on foreign exchanges that trade on weekends or other days when the Fund does not price its shares. As a result, the NAV of the Fund’s shares may change on days when shareholders will not be able to purchase or redeem Fund shares.
A Significant Event may relate to a single issuer or to an entire market sector. If Copeland becomes aware of a Significant Event that has occurred with respect to a security or group of securities after the closing of the exchange or market on which the security or securities principally trade, but before the time at which a Fund calculates NAV, it may request that a Committee meeting be called. In addition, with respect to certain securities, the Funds’ administrator performs price comparisons and price movement review (among other processes), to monitor the pricing data supplied by various sources. Any identified discrepancies are researched and subject to the procedures described above.
The Funds utilize various methods to measure the fair value of their investments on a recurring basis. GAAP establishes a hierarchy that prioritizes inputs to valuation methods.
| Copeland Trust |
| NOTES TO FINANCIAL STATEMENTS (Continued)(Unaudited) |
| May 31, 2024 |
The three levels of input are:
Level 1 – Unadjusted quoted prices in active markets for identical assets and liabilities that the Funds have the ability to access.
Level 2 – Observable inputs other than quoted prices included in Level 1 that are observable for the asset or liability, either directly or indirectly. These inputs may include quoted prices for the identical instrument on an inactive market, prices for similar instruments, interest rates, prepayment speeds, credit risk, yield curves, default rates and similar data.
Level 3 – Unobservable inputs for the asset or liability, to the extent relevant observable inputs are not available, representing the Funds’ own assumptions about the assumptions a market participant would use in valuing the asset or liability, and would be based on the best information available.
The availability of observable inputs can vary from security to security and is affected by a wide variety of factors, including, for example, the type of security, whether the security is new and not yet established in the marketplace, the liquidity of markets, and other characteristics particular to the security. To the extent that valuation is based on models or inputs that are less observable or unobservable in the market, the determination of fair value requires more judgment. Accordingly, the degree of judgment exercised in determining fair value is greatest for instruments categorized in Level 3.
The inputs used to measure fair value may fall into different levels of the fair value hierarchy. In such cases, for disclosure purposes, the level in the fair value hierarchy within which the fair value measurement falls in its entirety, is determined based on the lowest level input that is significant to the fair value measurement in its entirety.
The inputs or methodology used for valuing securities are not necessarily an indication of the risk associated with investing in those securities. The following tables summarize the inputs used as of May 31, 2024 for the Funds’ assets measured at fair value:
| Copeland Dividend Growth Fund |
| |
| Assets | | Level 1 | | Level 2 | | Level 3 | | Total |
| Common Stocks* | | $ | 39,230,512 | | | $ | — | | | $ | — | | | $ | 39,230,512 | |
| Short-Term Investment | | | 354,157 | | | | — | | | | — | | | | 354,157 | |
| Total | | $ | 39,584,669 | | | $ | — | | | $ | — | | | $ | 39,584,669 | |
| | | | | | | | | | | | | | | | | |
| Copeland SMID Cap Dividend Growth Fund |
| |
| Assets | | Level 1 | | Level 2 | | Level 3 | | Total |
| Common Stocks* | | $ | 157,445,226 | | | $ | — | | | $ | — | | | $ | 157,445,226 | |
| Short-Term Investment | | | 2,572,848 | | | | — | | | | — | | | | 2,572,848 | |
| Total | | $ | 160,018,074 | | | $ | — | | | $ | — | | | $ | 160,018,074 | |
| Copeland Trust |
| NOTES TO FINANCIAL STATEMENTS (Continued)(Unaudited) |
| May 31, 2024 |
| Copeland International Small Cap Fund |
| Assets | | Level 1 | | | Level 2 | | | Level 3 | | | Total | |
| Common Stocks* | | | | | | | | | | | | | | | | |
| Advertising & Marketing | | $ | — | | | $ | 6,205 | | | $ | — | | | $ | 6,205 | |
| Aerospace & Defense | | | — | | | | 8,080 | | | | — | | | | 8,080 | |
| Apparel & Textile Products | | | — | | | | 32,942 | | | | — | | | | 32,942 | |
| Asset Management | | | — | | | | 7,327 | | | | — | | | | 7,327 | |
| Banking | | | — | | | | 20,141 | | | | — | | | | 20,141 | |
| Biotech & Pharma | | | — | | | | 16,973 | | | | — | | | | 16,973 | |
| Chemicals | | | — | | | | 40,432 | | | | — | | | | 40,432 | |
| Containers & Packaging | | | — | | | | 18,057 | | | | — | | | | 18,057 | |
| Electrical Equipment | | | — | | | | 9,591 | | | | — | | | | 9,591 | |
| Engineering & Construction | | | — | | | | 25,003 | | | | — | | | | 25,003 | |
| Food | | | — | | | | 8,506 | | | | — | | | | 8,506 | |
| Forestry, Paper & Wood Product | | | 7,643 | | | | — | | | | — | | | | 7,643 | |
| Gas & Water Utilities | | | 6,963 | | | | 6,364 | | | | — | | | | 13,327 | |
| Home Construction | | | — | | | | 6,540 | | | | — | | | | 6,540 | |
| Household Products | | | 6,109 | | | | — | | | | — | | | | 6,109 | |
| Industrial Intermediate Products | | | — | | | | 10,800 | | | | — | | | | 10,800 | |
| Industrial Support Services | | | 5,242 | | | | 6,708 | | | | — | | | | 11,950 | |
| Institutional Financial Services | | | 9,611 | | | | 15,965 | | | | — | | | | 25,576 | |
| Insurance | | | — | | | | 7,146 | | | | — | | | | 7,146 | |
| Internet Media & Services | | | — | | | | 14,657 | | | | — | | | | 14,657 | |
| Leisure Facilities & Services | | | — | | | | 15,604 | | | | — | | | | 15,604 | |
| Machinery | | | — | | | | 34,391 | | | | — | | | | 34,391 | |
| Oil & Gas Producers | | | 30,124 | | | | — | | | | — | | | | 30,124 | |
| Real Estate Owners & Developer | | | — | | | | 11,095 | | | | — | | | | 11,095 | |
| Real Estate Investment Trust | | | 13,379 | | | | 29,733 | | | | — | | | | 43,112 | |
| Retail - Consumer Staples | | | — | | | | 4,756 | | | | — | | | | 4,756 | |
| Retail - Discretionary | | | — | | | | 14,335 | | | | — | | | | 14,335 | |
| Semiconductors | | | 6,677 | | | | 7,935 | | | | — | | | | 14,612 | |
| Software | | | — | | | | 11,541 | | | | — | | | | 11,541 | |
| Specialty Finance | | | 11,052 | | | | 6,850 | | | | — | | | | 17,902 | |
| Technology Hardware | | | — | | | | 10,558 | | | | — | | | | 10,558 | |
| Technology Services | | | — | | | | 14,068 | | | | — | | | | 14,068 | |
| Wholesale - Consumer Staple | | | — | | | | 8,385 | | | | — | | | | 8,385 | |
| Short-Term Investment | | | 22,257 | | | | — | | | | — | | | | 22,257 | |
| Total | | $ | 119,057 | | | $ | 430,688 | | | $ | — | | | $ | 549,745 | |
The Funds did not hold any Level 3 securities during the period.
| * | Please refer to the Portfolio of Investments for Industry/Country Classification. |
| Copeland Trust |
| NOTES TO FINANCIAL STATEMENTS (Continued)(Unaudited) |
| May 31, 2024 |
SECURITY TRANSACTIONS AND INVESTMENT INCOME
Investment security transactions are accounted for on a trade date basis. Cost is determined and gains and losses are based upon the specific identification method for both financial statement and federal income tax purposes. Dividend income is recorded on the ex-dividend date and interest income is recorded on the accrual basis. Purchase discounts and premiums on securities are accreted and amortized over the life of the respective securities.
FEDERAL INCOME TAXES
The Funds intend to continue to comply with the requirements of Subchapter M of the Internal Revenue Code applicable to regulated investment companies and will distribute all of their taxable income, if any, to shareholders. Accordingly, no provision for Federal income taxes is required in the financial statements.
The Funds recognize the tax benefits of uncertain tax positions only where the position is “more likely than not” to be sustained assuming examination by tax authorities. Management has analyzed the Funds’ tax positions and has concluded that no liability for unrecognized tax benefits should be recorded related to uncertain tax positions related to the open tax years or expected to be taken in the Funds’ November 30, 2024 tax returns. The Funds identify their major tax jurisdictions as U.S. Federal and foreign jurisdictions where the Funds may make investments; however, the Funds are not aware of any tax positions for which it is reasonably possible that the total amounts of unrecognized tax benefits will change materially in the next twelve months.
DIVIDEND-PAYING STOCK RISK
The Funds’ emphasis on dividend-paying stocks could cause a Fund to underperform similar funds that invest without consideration of a company’s track record of paying dividends. Stocks of companies with a history of paying dividends may not participate in a broad market advance to the same degree as most other stocks, and a sharp rise in interest rates or economic downturn could cause a company to unexpectedly reduce or eliminate its dividend. If the amount a company pays out as a dividend exceeds its earnings and profits, the excess will be treated as a return of capital and the Fund’s tax basis in the stock will be reduced. A reduction in the Fund’s tax basis in such stock will increase the amount of gain (or decrease the amount of loss) recognized by the Fund on a subsequent sale of the stock.
MARKET RISK
Overall securities market risks may affect the value of individual securities in which the Fund invests. Factors such as foreign and domestic economic growth and market conditions, interest rate levels, and political events affect the securities markets.
REIT RISK
An equity REIT’s performance depends on the types and locations of the rental properties it owns and on how well it manages those properties. Real estate values rise and fall in response to a variety of factors, including local, regional and national economic conditions, changes in interest rates and property taxes.
SMALL AND MEDIUM CAPITALIZATION RISK
The value of a small or medium capitalization company securities may be subject to more abrupt or erratic market movements than those of larger, more established companies or the market averages in general.
FOREIGN INVESTING RISK
The International Fund invests significantly in foreign securities. Investments in foreign countries are subject to country -specific risks such as political, diplomatic, regional conflicts, terrorism, war, social and economic instability and policies that have the effect of decreasing the value of foreign securities. Foreign investments may experience greater volatility than U.S. investments. Currency hedging transactions may not perfectly offset the Fund’s foreign currency exposure and entail additional trading commissions and fees.
FOREIGN CURRENCY
The accounting records of the Funds are maintained in U.S. dollars. Investment securities and other assets and liabilities denominated in a foreign currency, and income receipts and expense payments, if any, are translated into U.S. dollars using the prevailing exchange rate at the London market close. Purchases and sales of securities are translated into U.S. dollars at the contractual currency rates established at the approximate time of the trade. Net realized gains and losses on foreign currency
| Copeland Trust |
| NOTES TO FINANCIAL STATEMENTS (Continued)(Unaudited) |
| May 31, 2024 |
transactions represent net gains and losses from currency realized between the trade and settlement dates on securities transactions and the difference between income accrued versus income received. The effects of changes in foreign currency exchange rates on investments in securities are included with the net realized and unrealized gain or loss on investment securities.
FORWARD CURRENCY CONTRACTS
If foreign securities are purchased, the Funds generally enter into forward currency exchange contracts in order to eliminate ongoing foreign currency exchange rate risks. If foreign securities are sold, the foreign currency proceeds are typically repatriated into US dollars. Any realized gains and losses between trade date and settlement date from contract transactions are included as a component of net realized gains (losses) from foreign currency transactions in the Statements of Operations. The Funds did not hold any forward currency contracts as of May 31, 2024.
CONCENTRATION OF RISK
Investing in securities of foreign issuers and currency transactions may involve certain considerations and risks not typically associated with investments in the United States. These risks include revaluation of currencies, adverse fluctuations in foreign currency values and possible adverse political, social and economic developments, including those particular to a specific industry, country or region. These conditions could cause the securities and their markets to be less liquid and prices more volatile than those of comparable U.S. companies and U.S. government securities.
DISTRIBUTIONS TO SHAREHOLDERS
Distributions from investment income, if any, are declared and paid annually and are recorded on the ex-dividend date. The Funds will declare and pay net realized capital gains, if any, annually. The character of income and gains to be distributed is determined in accordance with income tax regulations, which may differ from GAAP. These “book/tax” differences are considered either temporary (i.e., deferred losses, capital loss carry forwards) or permanent in nature. To the extent these differences are permanent in nature, such amounts are reclassified within the composition of net assets based on their federal tax-basis treatment; temporary differences do not require classification.
EXPENSES
Expenses of the Trust that are directly identifiable to a specific Fund are charged to that Fund. Expenses, which are not readily identifiable to a specific Fund, are allocated in such a manner as deemed equitable, taking into consideration the nature and type of expense and the relative sizes of the Funds in the Trust.
INDEMNIFICATION
The Trust indemnifies their officers and trustees for certain liabilities that may arise from the performance of their duties to the Trust. Additionally, in the normal course of business, the Funds enter into contracts that contain a variety of representations and warranties and which provide general indemnities. The Funds’ maximum exposure under these arrangements is unknown, as this would involve future claims that may be made against the Funds that have not yet occurred. However, based on experience, the Funds expect the risk of loss due to these warranties and indemnities to be remote.
| 3. | INVESTMENT ADVISORY AGREEMENT AND TRANSACTIONS WITH RELATED PARTIES |
ADVISORY FEE
Subject to the authority of the Board, the adviser is responsible for management of the Funds’ investment portfolios. Pursuant to the Management Agreement (the “Management Agreement”), investment advisory services are provided to the Funds by Copeland Capital Management, LLC (the “Adviser”). Under the terms of the Management Agreement, the Adviser receives monthly fees calculated at an annual rate of 0.75% for each of the Dividend Growth Fund and SMID Fund and 0.78% for the International Fund, based on the average daily net assets of the respective Fund. For the six months ended May 31, 2024, the Adviser earned advisory fees of $155,415, $440,618, and $2,048 for the Dividend Growth Fund, SMID Fund, and International Fund, respectively, before the effect of the Expense Limitation Agreement.
The Adviser, pursuant to an Expense Limitation Agreement (the “Agreement”) has contractually agreed to reduce its fees and/or absorb expenses of each Fund, at least until March 31, 2025 to ensure that Net Annual Operating Expenses (excluding any front-end or contingent deferred loads, brokerage fees and commissions, acquired fund fees and expenses, borrowing costs such as interest
| Copeland Trust |
| NOTES TO FINANCIAL STATEMENTS (Continued)(Unaudited) |
| May 31, 2024 |
and dividend expense on securities sold short, taxes and extraordinary expenses such as litigation) will not exceed 1.20%, 1.95% and 1.05% of the Dividend Growth Fund’s average daily net assets for Class A, Class C and Class I shares, respectively, 1.20% and 0.95% of the SMID Fund’s average daily net assets for Class A and Class I, respectively, and 1.23% and 0.98% of the International Fund’s average daily net assets for Class A and Class I, respectively, subject to possible recoupment from the Fund in future years on a rolling three year basis (within the three years after the fees have been deferred or reimbursed) if such recoupment can be achieved without exceeding the lesser of the expense limitation in effect at the time of the deferral and at the time of the repayment. For the six months ended May 31, 2024, the Adviser waived $155,415, $222,458 and $2,048 in investment advisory fees for the Dividend Growth Fund, SMID Fund and International Fund, respectively. During the period, the Adviser reimbursed additional amounts of $49,462 for the Dividend Growth Fund and $51,703 for the International Fund.
The expenses subject to recapture for the Dividend Growth Fund, SMID Fund and International Small Cap Fund will expire on November 30 of the years indicated below:
| Copeland Dividend Growth Fund |
| 2024 | | 2025 | | 2026 | | Total |
| $487,174 | | $417,980 | | $332,494 | | $1,237,648 |
| | | | | | | |
| Copeland SMID Cap Dividend Growth Fund |
| 2024 | | 2025 | | 2026 | | Total |
| $288,151 | | $325,820 | | $386,832 | | $1,000,803 |
| | | | | | | |
| Copeland International Small Cap Fund |
| 2024 | | 2025 | | 2026 | | Total |
| $0 | | $81,999 | | $90,986 | | $172,985 |
DISTRIBUTOR
The Board has adopted Distribution Plans and Agreements for each Fund (collectively the “Plan”) pursuant to Rule 12b-1 under the 1940 Act. The Plan provides that a monthly service and/or distribution fee is calculated by each Fund at an annual rate of 0.25% and 1.00% (of which up to 0.75% is a distribution fee and up to 0.25% is a service fee) of the average daily net assets attributable to Class A shares and Class C shares, respectively and is paid to Northern Lights Distributors, LLC (the “Distributor” or “NLD”), to provide compensation for ongoing distribution-related activities or services and/or maintenance of the Funds’ shareholder accounts, not otherwise required to be provided by the Adviser. The Plan is a compensation plan, which means that compensation is provided regardless of 12b-1 expenses incurred. For the six months ended May 31, 2024, the 12b-1 fees accrued amounted to $17,450 and $46,574 for the Dividend Growth Fund for Class A and Class C shares, respectively. The 12b-1 fees accrued for the SMID Cap Dividend Growth Fund Class A shares were $2,488. The International Fund did not accrue any 12b-1 fees for the period.
The Distributor acts as the Funds’ principal underwriter in a continuous public offering of the Funds’ shares. For the six months ended May 31, 2024, the Distributor received $144 in underwriting commissions for sales of Class A shares of the Dividend Growth Fund, of which $19 was retained by the principal underwriter or other affiliated broker-dealers and $4,369 in underwriting commissions for sales of Class A shares of the SMID Cap Dividend Growth Fund of which $554 was retained by the principal underwriter or other affiliated broker-dealers. No underwriting commissions were generated by Class A Shares of the International Fund during the six months ended May 31, 2024.
In addition, certain affiliates of the Distributor provide services to the Funds as follows:
ULTIMUS FUND SOLUTIONS, LLC (“UFS”)
UFS, an affiliate of the Distributor, provides administration, fund accounting, and transfer agent services to the Trust. Pursuant to separate servicing agreements with UFS, the Trust pays UFS fees for providing administration, fund accounting, and transfer agency services to the Funds. These fees are disclosed in the Statement of Operations. An officer of the Trust is also an officer of UFS and is not paid any fees directly by the Funds for servicing in such capacity.
BLU GIANT, LLC (“Blu Giant”)
Blu Giant, an affiliate of UFS and the Distributor, provides EDGAR conversion and filing services as well as print management services for the Funds on an ad-hoc basis. For the provision of these services, Blu Giant receives customary fees from the Funds.
| Copeland Trust |
| NOTES TO FINANCIAL STATEMENTS (Continued)(Unaudited) |
| May 31, 2024 |
SHAREHOLDER SERVICES
The Board has adopted non-Rule 12b-1 shareholder service plans (collectively, the “Shareholder Service Plan”) for the Class I shares of each Fund. The Shareholder Service Plan permits the Funds to pay brokers, financial intermediaries and others an annual fee of 0.10% of each Fund’s average daily net assets attributable to the Class I shares for shareholder support and/or administrative services, not otherwise provided by the Trust’s transfer agent. The fees incurred by the Funds for these services are included as Shareholder Service Fees – Class I in the Statement of Operations. For the six months ended May 31, 2024, the Dividend Growth Fund accrued $9,085 and the SMID Cap Dividend Growth Fund accrued $57,754 in fees associated with the Shareholder Service Plan. The International Fund did not accrue any Shareholder Service Fees for its Class I shares during the period. The Funds’ Class A and Class C shares may also pay broker-dealers or other financial intermediaries for shareholder support services and/or administrative services based on the aggregate net asset value of the Class A and Class C shares, as applicable, owned of record or beneficially by the broker-dealers’ or financial intermediaries’ customers. The fees incurred by the Funds for these services are included as Non-Rule 12b-1 Shareholder Services Fees - Class A and Class C in the Statement of Operations.
CHIEF COMPLIANCE OFFICER
The Adviser is providing a Chief Compliance Officer to the Trust as well as related compliance services. The Trust reimburses the Adviser for an allocable portion of the Chief Compliance Officer’s salary.
TRUSTEES
Effective January 1, 2024, as compensation for services rendered to the Trust, each Trustee of the Trust who is not affiliated with the Trust or the Adviser receives: (1) an annual base retainer of $32,000; (2) $12,000 for attendance at four regularly scheduled Board meetings per year; (3) $2,000 for attendance at each regularly scheduled Audit Committee meeting; (4) $ 750 and $2,500 for each additional special telephonic or special in person meeting, respectively; and (5) the independent Chairman of the Board receives an additional $10,000 per year for carrying out his additional responsibilities. The foregoing compensation is paid in quarterly payments.
The “interested persons” (as defined in the 1940 Act) who serve as Trustees of the Trust receive no compensation for their services as Trustees. None of the executive officers receive compensation from the Trust except for the CCO, a portion of whose salary is paid by the Trust for compliance services.
| 4. | INVESTMENT TRANSACTIONS |
The cost of purchases and the proceeds from sales of investments, other than short-term investments, for the six months ended May 31, 2024 were as follows:
| Fund | | Purchases | | | Sale Proceeds | |
| Dividend Growth Fund | | $ | 8,448,245 | | | $ | 14,379,027 | |
| SMID Cap Dividend Growth Fund | | | 94,255,036 | | | | 10,910,041 | |
| International Small Cap Fund | | | 178,196 | | | | 151,691 | |
| 5. | AGGREGATE UNREALIZED APPRECIATION AND DEPRECIATION – TAX BASIS |
The identified cost of investments in securities owned by the Funds for federal income tax purposes, and their respective gross unrealized appreciation and depreciation at May 31, 2024, were as follows:
| | | | | | Gross | | | Gross | | | | |
| | | | | | Unrealized | | | Unrealized | | | Net Unrealized | |
| Fund | | Tax Cost | | | Appreciation | | | Depreciation | | | Appreciation | |
| Dividend Growth Fund | | $ | 29,856,000 | | | $ | 10,405,953 | | | $ | (677,284 | ) | | $ | 9,728,669 | |
| SMID Cap Dividend Growth Fund | | | 150,840,156 | | | | 14,017,284 | | | | (4,839,366 | ) | | | 9,177,918 | |
| International Small Cap Fund | | | 532,180 | | | | 56,965 | | | | (39,400 | ) | | | 17,565 | |
| Copeland Trust |
| NOTES TO FINANCIAL STATEMENTS (Continued)(Unaudited) |
| May 31, 2024 |
| 6. | DISTRIBUTIONS TO SHAREHOLDERS AND TAX COMPONENTS OF CAPITAL |
The tax character of fund distributions paid for the periods ended November 30, 2023 and November 30, 2022 was as follows:
| For the year ended November 30, 2023 | | | | | | | | | | | | | | | |
| | | Ordinary | | | Long-Term | | | Return | | | Tax-Exempt | | | | |
| Portfolio | | Income | | | Capital Gains | | | of Capital | | | Income | | | Total | |
| Dividend Growth Fund | | $ | 352,061 | | | $ | 2,873,896 | | | $ | — | | | $ | — | | | $ | 3,225,957 | |
| SMID Cap Dividend Growth Fund | | | 636,945 | | | | 1,176,811 | | | | — | | | | — | | | | 1,813,756 | |
| International Small Cap Fund | | | 8,524 | | | | — | | | | — | | | | — | | | | 8,524 | |
| | | | | | | | | | | | | | | | | | | | | |
| For the year ended November 30, 2022 | | | | | | | | | | | | | | | |
| | | Ordinary | | | Long-Term | | | Return | | | Tax-Exempt | | | | |
| Portfolio | | Income | | | Capital Gains | | | of Capital | | | Income | | | Total | |
| Dividend Growth Fund | | $ | 1,729,801 | | | $ | 5,809,629 | | | $ | — | | | $ | — | | | $ | 7,539,430 | |
| SMID Cap Dividend Growth Fund | | | 621,556 | | | | 1,751,884 | | | | — | | | | — | | | | 2,373,440 | |
| International Small Cap Fund | | | — | | | | — | | | | — | | | | — | | | | — | |
As of November 30, 2023, the components of accumulated earnings/(deficit) on a tax basis were as follows:
| | | Undistributed | | | Undistributed | | | Undistributed | | | Post October Loss | | | Capital Loss | | | Other | | | Unrealized | | | Total | |
| | | Ordinary | | | Ordinary | | | Long-Term | | | and | | | Carry | | | Book/Tax | | | Appreciation/ | | | Accumulated | |
| Portfolio | | Tax-Exempt Income | | | Income | | | Capital Gains | | | Late Year Loss | | | Forwards | | | Differences | | | (Depreciation) | | | Earnings/(Deficits) | |
| Dividend Growth Fund | | $ | — | | | $ | 99,065 | | | $ | 1,486,578 | | | $ | — | | | $ | — | | | $ | — | | | $ | 7,828,884 | | | $ | 9,414,527 | |
| SMID Cap Dividend Growth Fund | | | — | | | | 488,540 | | | | — | | | | — | | | | (1,461,870 | ) | | | — | | | | 3,226,085 | | | | 2,252,755 | |
| International Small Cap Fund | | | — | | | | 9,533 | | | | — | | | | — | | | | (90,250 | ) | | | — | | | | (7,105 | ) | | | (87,822 | ) |
The difference between book basis and tax basis undistributed net investment income, accumulated net realized gains, and unrealized appreciation from investments is primarily attributable to the tax deferral of losses on wash sales, mark-to-market on passive foreign investment companies and C-Corporation return of capital distributions. The unrealized appreciation in the table above includes unrealized foreign currency gains of $10 for the International Small Cap Fund.
Capital losses incurred after October 31 within the fiscal year are deemed to arise on the first business day of the following fiscal year for tax purposes. The Funds did not have any Post-October loss deferrals.
At November 30, 2023, the Funds had capital loss carry forwards for federal income tax purposes as follows:
| Portfolio | | Short-Term | | | Long-Term | | | Total | | | CLCF Utilized | |
| Dividend Growth Fund | | $ | — | | | $ | — | | | $ | — | | | $ | — | |
| SMID Cap Dividend Growth Fund | | | 1,461,870 | | | | — | | | | 1,461,870 | | | | — | |
| International Small Cap Fund | | | 77,616 | | | | 12,634 | | | | 90,250 | | | | — | |
| 7. | FOREIGN TAX CREDIT (UNAUDITED) |
The International Small Cap Fund intends to elect to pass through to shareholders the income tax credit for taxes paid to foreign countries. Foreign source income and foreign tax expense per outstanding share as of fiscal period ended November 30, 2023, were as follows:
| For the fiscal period ended | | | | | | |
| 11/30/2023 | | Foreign Taxes Paid | | | Foreign Source Income | |
| International Small Cap Fund | | $ | 0.02 | | | $ | 0.18 | |
| Copeland Trust |
| NOTES TO FINANCIAL STATEMENTS (Continued)(Unaudited) |
| May 31, 2024 |
The Funds may assess a short-term redemption fee of 1.00% of the total redemption amount if shareholders sell their shares after holding them for less than 30 days or if shares are redeemed for failure to maintain the Funds’ minimum account balance requirement. The redemption fee is paid directly to the Funds. For the six months ended May 31, 2024, the Dividend Growth Fund assessed $0, $0, and $0 in redemption fees for Class A, Class C and Class I shares, respectively. The SMID Fund assessed $26 and $1,254 in redemption fees for Class A and Class I shares, respectively. The International Fund did not assess redemption fees for Class A or Class I shares.
Subsequent events after the date of the Statement of Assets and Liabilities have been evaluated through the date the financial statements were issued. Management has determined that no events or transactions occurred requiring adjustment or disclosure in the financial statements.
| Copeland Trust |
| SUPPLEMENTAL INFORMATION (Unaudited) |
Considerations Regarding the Management Agreement
On May 15, 2024, the Board of Trustees (the “Board”) of Copeland Trust (the “Trust”), including all Trustees who are not interested persons under the Investment Company Act of 1940, as amended (the “Independent Trustees”), considered the renewal of the investment management agreement (the “Management Agreement”) between the Trust and Copeland Capital Management (“Copeland” or the “Adviser”) with respect to each Fund. The Independent Trustees met separately with independent counsel in advance of the meeting held on May 15, 2024 (the “Meeting”) to discuss the material provided by Copeland. The Board reviewed and considered, among other items: (1) a memorandum from independent counsel setting forth the Trustees’ fiduciary duties, responsibilities and the factors the Trustees should consider in their evaluation of the Management Agreement; and (2) a report and presentation by Copeland that described, among other things: (a) the nature, extent and quality of the services provided by Copeland to each Fund and the experience and qualifications of the personnel providing those services; (b) its organizational structure, financial information, level of insurance coverage, Form ADV and SOC 1 report; (c) its investment process and the strategy of each Fund; (d) its types of clients and assets under management; (e) its brokerage, soft dollar commission and trade allocation policies, including the types of research and services obtained in connection with soft dollar commissions; (f) the investment performance of each Fund as compared to its applicable benchmark index, Copeland’s other similarly managed accounts as applicable, and relevant peer group; (g) its advisory fee arrangement with each Fund as compared to its relevant peer group and Copeland’s other similarly managed accounts as applicable; (h) the contractual fee and expense waiver arrangement with each Fund; (i) its compliance program to monitor and review investment decisions and to prevent and detect violations of each Fund’s investment policies and limitations, as well as federal securities laws and conflicts of interest assessments, its business continuity and disaster recovery plan and information security system; (j) the costs of the services provided and the profits realized by Copeland from its relationships with each Fund; and (k) the extent to which economies of scale are relevant as each Fund grows, and whether the fee levels reflect these economies of scale to the benefit of shareholders. The Trustees discussed Copeland’s written materials and oral presentation on the Management Agreement, together with information Copeland had provided to the Trustees over the course of the year. During the executive session, the Board members discussed, among other things, the performance of the Funds, expenses, fee levels and waivers, and the Adviser’s profitability and financial strength. In their deliberations, the Trustees did not identify any single factor as determinative or controlling, and different Board members may have given different weight to different individual factors and related conclusions. After further discussion, the Board, including all of the Independent Trustees, concluded that: the Adviser had the capabilities, resources and personnel necessary to manage each Fund; and that, based on the services that the Adviser provides to the Funds pursuant to the Management Agreement and the expenses incurred by it in the performance of such services, the compensation payable to the Adviser with respect to each Fund is not unreasonable.
Among the factors considered, the Board examined the nature, extent and quality of services provided to each Fund under the Management Agreement, and the quality of Copeland’s professional portfolio management teams. The Board considered, among other things, its on-going dealings with the Adviser, noting that the Adviser has consistently demonstrated its commitment to the interests of the Trust’s shareholders, provided reasonable communication to the Board and
| Copeland Trust |
| SUPPLEMENTAL INFORMATION (Unaudited)(Continued |
cooperated in all respects with the Board’s requests for information. The Board considered the Trust’s Chief Compliance Officer’s reports on the Adviser’s quarterly compliance certifications. The Board considered the experience and qualifications of each portfolio manager of the Funds. Based on these considerations, the Trustees determined that the Adviser has the capabilities, resources and personnel necessary to manage each Fund and also concluded that they were satisfied with the quality of services provided by Copeland in advising each Fund.
The Board considered the costs of the services provided and the profits realized by the Adviser, as discussed at the Meeting. The Trustees reviewed the relative profitability of each Fund, noting that, while the Funds currently have relatively small asset bases, the Adviser’s overall financial strength and the Funds’ importance to the Adviser’s overall business strategy indicated Copeland’s intent to support the Funds’ continued growth. The Trustees also considered Copeland’s representation that the Funds were an important aspect of the Adviser’s long-term business plan. The Trustees also concluded that the benefits derived by Copeland from managing each Fund, including how it uses soft dollars, and the way in which it conducts portfolio transactions and selects brokers, seemed reasonable.
The Board also considered the management fees and expenses of each Fund. The Board concluded that, based on the information discussed at the Meeting, each Fund’s management fee and expenses, taking into account Copeland’s agreement to continue to waive fees and reimburse expenses to limit the expenses of each Fund, were reasonable as compared to the fees and expenses of comparable funds, and Copeland’s similarly managed accounts where applicable.
The Board also considered the investment performance of each Fund against its applicable benchmark index and peer group. The Board also took into account the portfolio managers’ discussion of each Fund’s performance and comparable strategy, including, where applicable, the reasons for each Fund’s relative performance as compared to its benchmark index and peer group, as well as performance, where applicable, compared to the Adviser’s separately-managed accounts. Based on this information, the Trustees concluded that the performance of the Copeland Dividend Growth Fund and Copeland SMID Cap Dividend Growth Fund for the periods shown was generally mixed (performance for certain periods was higher than the benchmark and comparative peer performance information, and in other cases it was lower), and that the performance for the Copeland International Small Cap Fund since its inception in December 2021 generally trailed that of the benchmark and comparative peer funds.
As to economies of scale, the Trustees noted that the Management Agreement does not contain breakpoints that reduce the fee rates as assets grow. The Trustees considered the current asset levels of each Fund and Copeland’s agreement to waive fees and reimburse expenses as a means to limit each Fund’s expenses and concluded that, at the time of the Meeting, the absence of breakpoints was reasonable.
Based upon the Trustees’ deliberations and evaluation of the information described above, the Trustees, and separately all of the Independent Trustees, determined that the terms of the Management Agreement were reasonable and fair to each Fund and its respective shareholders and voted to renew the Management Agreement with respect to each Fund.
| PRIVACY notice |
| |
| FACTS | WHAT DOES COPELAND TRUST DO WITH YOUR PERSONAL INFORMATION? |
| | |
| Why? | Financial companies choose how they share your personal information. Federal law gives consumers the right to limit some but not all sharing. Federal law also requires us to tell you how we collect, share, and protect your personal information. Please read this notice carefully to understand what we do. |
| | |
| What? | The types of personal information we collect and share depend on the product or service you have with us. This information can include: ■ Social Security number ■ Purchase History ■ Assets ■ Account Balances ■ Retirement Assets ■ Account Transactions ■ Transaction History ■ Wire Transfer Instructions ■ Checking Account Information When you are no longer our customer, we continue to share your information as described in this notice. |
| | |
| How? | All financial companies need to share customers’ personal information to run their everyday business. In the section below, we list the reasons financial companies can share their customers’ personal information; the reasons Copeland Trust chooses to share; and whether you can limit this sharing. |
| | | |
| Reasons we can share your personal information: | Does Copeland
Trust share? | Can you limit this sharing? |
For our everyday business purposes – such as to process your transactions, maintain your account(s), respond to court orders and legal investigations, or report to credit bureaus | Yes | No |
For our marketing purposes – to offer our products and services to you | No | We don’t share |
| For joint marketing with other financial companies | No | We don’t share |
For our affiliates’ everyday business purposes – information about your transactions and experiences | No | We don’t share |
For our affiliates’ everyday business purposes – information about your creditworthiness | No | We don’t share |
| For nonaffiliates to market to you | No | We don’t share |
| Questions? | Call 1-888-9-COPELAND (1-888-926-7352) |
| Who we are: |
| Who is providing this notice? | Copeland Trust |
| What we do: |
| How does Copeland Trust protect my personal information? | To protect your personal information from unauthorized access and use, we use security measures that comply with federal law. These measures include computer safeguards and secured files and buildings. Our service providers are held accountable for adhering to strict policies and procedures to prevent any misuse of your nonpublic personal information. |
| How does Copeland Trust collect my personal information? | We collect your personal information, for example, when you ■ Open an account ■ Provide account information ■ Give us your contact information ■ Make deposits or withdrawals from your account ■ Make a wire transfer ■ Tell us where to send the money ■ Tells us who receives the money ■ Show your government-issued ID ■ Show your driver’s license We also collect your personal information from other companies. |
| Why can’t I limit all sharing? | Federal law gives you the right to limit only ■ Sharing for affiliates’ everyday business purposes – information about your creditworthiness ■ Affiliates from using your information to market to you ■ Sharing for nonaffiliates to market to you State laws and individual companies may give you additional rights to limit sharing. |
| Definitions: |
| Affiliates | Companies related by common ownership or control. They can be financial and nonfinancial companies. ■ Copeland Trust does not share with our affiliates. |
| Nonaffiliates | Companies not related by common ownership or control. They can be financial and nonfinancial companies
■ Copeland Trust does not share with nonaffiliates so they can market to you. |
| Joint marketing | A formal agreement between nonaffiliated financial companies that together market financial products or services to you.
■ Copeland Trust does not jointly market. |
| Investment Adviser |
| Copeland Capital Management, LLC |
| 161 Washington Street, Suite 1325 |
| Conshohocken, PA 19428 |
| |
| Distributor |
| Northern Lights Distributors, LLC |
| 4221 North 203rd Street, Suite 100 |
| Elkhorn, NE 68022 |
| |
| Legal Counsel |
| Faegre Drinker Biddle & Reath, LLP |
| One Logan Square, Suite 2000 |
| Philadelphia, PA 19103 |
| |
| Independent Registered Public Accounting Firm |
| Tait, Weller & Baker LLP |
| Two Liberty Place |
| 50 South 16th Street, Suite 2900 |
| Philadelphia, PA 19102 |
| |
| Transfer Agent |
| Ultimus Fund Solutions, LLC |
| 4221 North 203rd Street, Suite 100 |
| Elkhorn, NE 68022 |
| |
| Administrator |
| Ultimus Fund Solutions, LLC |
| 4221 North 203rd Street, Suite 100 |
| Elkhorn, NE 68022 |
| |
| Custodian |
| The Northern Trust Company |
| 50 South LaSalle Street |
| Chicago, Il 60603 |
| |
How to Obtain Proxy Voting Information
Information regarding how the Funds vote proxies relating to portfolio securities for the 12 month period ended June 30 as well as a description of the policies and procedures that the Funds used to determine how to vote proxies is available without charge, upon request, by calling 1-888-9-COPELAND or by referring to the Securities and Exchange Commission’s (“SEC”) website at http://www.sec.gov.
How to Obtain 1st and 3rd Fiscal Quarter Portfolio Holdings
The Funds files their complete schedule of portfolio holdings with the SEC for the first and third quarters of each fiscal year on Form N-PORT. Form N-PORT is available on the SEC’s website at http://www.sec.gov and may be reviewed and copied at the SEC’s Public Reference Room in Washington, DC (1-800-SEC-0330). The information on Form N-PORT is available without charge, upon request, by calling 1-888-9-COPELAND.
COPELAND-SA24
Item 8. Changes in and Disagreements with Accountants for Open-End Management Investment Companies.
Not applicable
Item 9. Proxy Disclosures for Open-End Management Investment Companies.
Not applicable
Item 10. Remuneration Paid to Directors, Officers, and Others of Open-End Management Investment Companies.
Included under Item 7 of this Form
Item 11. Statement Regarding Basis for Approval of Investment Advisory Contract.
Included under Item 7 of this Form
Item 12. Disclosure of Proxy Voting Policies and Procedures for Closed-End Management Investment Companies.
Not applicable
Item 13. Portfolio Managers of Closed-End Management Investment Companies.
Not applicable
Item 14. Purchases of Equity Securities by Closed-End Management Investment Company and Affiliated Purchasers.
Not applicable
Item 15. Submission of Matters to a Vote of Security Holders.
None
Item 16. Controls and Procedures
(a) The registrant’s Principal Executive Officer and Principal Financial Officer have concluded that the registrant’s disclosure controls and procedures (as defined in Rule 30a-3(c) under the Act) are effective in design and operation and are sufficient to form the basis of the certifications required by Rule 30a-(2) under the Act, based on their evaluation of these disclosure controls and procedures as of a date within 90 days of this report on Form N-CSR.
(b) There were no changes in the registrant’s internal control over financial reporting (as defined in Rule 30a-3(d) under the Act) during the period covered by this report that have materially affected, or are reasonably likely to materially affect, the registrant’s internal control over financial reporting.
Item 17. Disclosure of Securities Lending Activities for Closed-End Management Investment Companies.
Not applicable
Item 18. Recovery of Erroneously Awarded Compensation.
Item 19. Exhibits.
(a)(1) Code of Ethics for Principal Executive and Senior Financial Officers. Exhibit 99.CODE
(a)(2) A separate certification for each principal executive officer and principal financial officer of the registrant as required by Rule 30a-2(a) under the Act (17 CFR 270.30a-2(a)): Attached hereto. Exhibit 99. CERT
(a)(3) Not applicable
(a)(4) Not applicable
(b) Certifications required by Rule 30a-2(b) under the Act (17 CFR 270.30a-2(b)): Attached hereto Exhibit 99.906CERT
SIGNATURES
Pursuant to the requirements of the Securities Exchange Act of 1934 and the Investment Company Act of 1940, the registrant has duly caused this report to be signed on its behalf by the undersigned, thereunto duly authorized.
Registrant: Copeland Trust
| By | /s/ Mark W. Giovanniello | |
| Mark W. Giovanniello | |
| Principal Executive Officer/President |
| Date: 08/08/2024 | |
| | | |
| Pursuant to the requirements of the Securities Exchange Act of 1934 and the Investment Company Act of 1940, this report has been signed below by the following persons on behalf of the registrant and in the capacities and on the dates indicated. |
| | |
| By | /s/ Mark W. Giovanniello | |
| Mark W. Giovanniello | |
| Principal Executive Officer/President |
| Date: 08/08/2024 |
| | |
| By | /s/ Steven J. Adams | |
| Steven J. Adams | |
| Principal Financial Officer/Treasurer |
| Date: 08/08/2024 | |